UNITED STATES
SECURITIES AND EXCHANGE COMMISSION
Washington, D.C. 20549
FORM 10-K
(Mark One)
xANNUAL REPORT PURSUANT TO SECTION 13 OR 15 (d) OF THE SECURITIES | x | ANNUAL REPORT PURSUANT TO SECTION 13 OR 15 (d) OF THE SECURITIES EXCHANGE ACT OF 1934 |
EXCHANGE ACT OF 1934
For the fiscal year ended December 31, 2010 | For the fiscal year ended December 31, 2011 |
OR
o¨ TRANSITION REPORT PURSUANT TO SECTION 13 OR 15(d) OF THE
SECURITIES EXCHANGE ACT OF 1934
For the transition period from ____________ to ____________
Commission file number 001-09148
THE BRINK’S COMPANY
(Exact name of registrant as specified in its charter)
| | Virginia | | 54-1317776 | |
| | (State or other jurisdiction of | | (I.R.S. Employer | |
| | incorporation or organization) | | Identification No.) | |
| | | | | |
| | P.O. Box 18100, | | | |
| | 1801 Bayberry Court | | | |
| | Richmond, Virginia | | 23226-8100 | |
| | (Address of principal executive offices) | | (Zip Code) | |
| | | | | |
| | Registrant’s telephone number, including area code | | (804) 289-9600 | |
| | | | | |
| | Securities registered pursuant to Section 12(b) of the Act: | | | |
| | | | Name of each exchange on | |
| | Title of each class | | which registered | |
| | The Brink’s Company Common Stock, Par Value $1 | | New York Stock Exchange | |
| | | | | |
| | Securities registered pursuant to Section 12(g) of the Act: None | | | |
Indicate by check mark if the registrant is a well-known seasoned issuer, as defined in Rule 405 of the Securities Act.
Yesx No o¨
Indicate by check mark if the registrant is not required to file reports pursuant to Section 13 or Section 15(d) of the Act.
Yeso¨ No x
Indicate by check mark whether the registrant: (1) has filed all reports required to be filed by Section 13 or 15(d) of the Securities Exchange Act of 1934 during the preceding 12 months (or for such shorter period that the registrant was required to file such reports), and (2) has been subject to such filing requirements for the past 90 days.
Yesx No o¨
Indicate by check mark whether the registrant has submitted electronically and posted on its corporate Web site, if any, every Interactive Data File required to be submitted and posted pursuant to Rule 405 of Regulation S-T (§ 232.405 of this chapter) during the preceding 12 months (or for such shorter period that the registrant was required to submit and post such files). Yes x No o¨
Indicate by check mark if disclosure of delinquent filers pursuant to Item 405 of Regulation S-K is not contained herein, and will not be contained, to the best of registrant’s knowledge, in definitive proxy or information statements incorporated by reference in Part III of this Form 10-K or any amendment to this Form 10-K. x⌧
Indicate by check mark whether the registrant is a large accelerated filer, an accelerated filer, a non-accelerated filer or a smaller reporting company. See definition of “large accelerated filer,” “accelerated filer” and “smaller reporting company” in Rule 12b-2 of the Exchange Act.
Large accelerated filerx Accelerated filero¨ Non-accelerated filero¨ Smaller reporting company o¨
Indicate by check mark whether the registrant is a shell company (as defined in Rule 12b-2 of the Exchange Act).
Yeso¨ No x
As of February 21, 2011,2012, there were issued and outstanding 46,540,41546,873,022 shares of common stock. The aggregate market value of shares of common stock held by non-affiliates as of June 30, 2010,2011, was $906,581,912.$1,383,834,551.
Documents incorporated by reference: Part III incorporates information by reference from portions of the Registrant’s definitive 20112012 Proxy Statement to be filed pursuant to Regulation 14A.
THE BRINK’S COMPANY
FORM 10-K
FOR THE YEAR ENDED DECEMBER 31, 20102011
TABLE OF CONTENTS
PART I
| | | Page |
| Item 1. | Business | 21 |
| Item 1A. | Risk Factors | 109 |
| Item 1B. | Unresolved Staff Comments | 1514 |
| Item 2. | Properties | 1514 |
| Item 3. | Legal Proceedings | 15 |
| Item 4. | [Removed and Reserved]Mine Safety Disclosures | 15 |
| | | |
| | Executive Officers of the Registrant | 16 |
| | | |
| | PART II | |
| | | |
| Item 5. | Market for Registrant’s Common Equity, Related Stockholder Matters and Issuer | |
| | Purchases of Equity Securities | 17 |
| Item 6. | Selected Financial Data | 19 |
| Item 7. | Management’s Discussion and Analysis of Financial Condition and Results of Operations | 20 |
| Item 7A. | Quantitative and Qualitative Disclosures About Market Risk | 6768 |
| Item 8. | Financial Statements and Supplementary Data | 6970 |
| Item 9. | Changes in and Disagreements with Accountants on Accounting and Financial Disclosure | 119117 |
| Item 9A. | Controls and Procedures | 119117 |
| Item 9B. | Other Information | 119117 |
| | | |
| | PART III | |
| | | |
| Item 10. | Directors, Executive Officers and Corporate Governance | 120118 |
| Item 11. | Executive Compensation | 120118 |
| Item 12. | Security Ownership of Certain Beneficial Owners and Management and Related Stockholder Matters | 120118 |
| Item 13. | Certain Relationships and Related Transactions, and Director Independence | 120118 |
| Item 14. | Principal Accountant Fees and Services | 120118 |
| | | |
| | PART IV | |
| | | |
| Item 15. | Exhibits and Financial Statement Schedules | 121119 |
Based in Richmond, Virginia, The Brink’s Company is a premier provider of secure logistics and security solutions, including the transportation of valuables, cash logistics and other security-related services to banks and financial institutions, retailers, government agencies, mints, jewelers and other commercial operations around the world. Other services provided are armored transportation, automated teller machine (“ATM”) replenishment and servicing; network infrastructure services; secure global transportation of valuables (“Global Services”); guarding services (including airport security or “Aviation Security"); currency deposit processing and cash management services. Cash management services include cash logistics services (“Cash Logistics”),; deploying and servicing safes and safe control device sdevices (e.g. our patented CompuSafe® service),; coin sorting and wrapping, integrated check and cash processing services (“Virtual Vault Services”), and; providing bill payment acceptance and processing services to utility companies and other billers (“Payment Services”); and guarding services (including airport security or “Aviation Security”). The Brink’s Company, along with its subsidiaries, is referred to as “we,” “our,” “Brink’s,” or “the Company” throughout this Form 10-K.
Brink’s brand and reputation spansspan across the globe. Our international network serves customers in more than 100 countries and employs approximately 71,000 people. Our operations include approximately 1,100 facilities and 12,80012,900 vehicles. Our globally recognized brand, global infrastructure, expertise, longevity and heritage are important competitive advantages. Over the past several years, we have changed from a conglomerate (with operations in the U.S. monitored home security, heavy-weight freight transportation, coal and other natural resource industries) into a company focused solely on the security industry.
Our operating segments consist of four geographies: Latin America; Europe, Middle East, and Africa (“EMEA”); Latin America; Asia Pacific; and North America, which are aggregated into two reportable segments: International and North America. Financial information related to our two reportable segments (International and North America) and non-segment income and expenses areis included in the consolidated financial statements on pages 69–118.70–116.
A significant portion of our business is conducted internationally, with 76%81% of our $3$3.9 billion in revenues earned outside the United States. In the fourth quarter of 2010, we completed an acquisition in Mexico and another in Canada. We expect that these operations will generate approximately $450 to 500 million in revenues in 2011. Financial results are reported in U.S. dollars and are affected by fluctuations in the relative value of foreign currencies. Our business is also subject to other risks customarily associated with operating in foreign countries including changing labor and economic conditions, political instability, restrictions on repatriation of earnings and capital, as well as nationalization, expropriation and other forms of restrictive government actions. The future ef fectseffects of these risks cannot be predicted. Additional information about risks associated with our foreign operations is provided on pages 11, 439, 45 and 68.69.
We have significant liabilities associated with our retirement plans, a portion of which has been funded. See pages 51–5353–56 and 57–6159–63 for more information on these liabilities. Additional risk factors are described on pages 10–14.9–12.
Available Information and Corporate Governance Documents
The following items are available free of charge on our website (www.brinks.com) as soon as reasonably possible after filing or furnishing them with the Securities and Exchange Commission (the “SEC”):
| · | Annual reports on Form 10-K |
| · | Quarterly reports on Form 10-Q |
| · | Current reports on Form 8-K, and amendments to those reports |
In addition, the following documents are also available free of charge on our website:
| · | Corporate governance policies |
| · | Business Code of Ethics |
| · | The charters of the following committees of our Board of Directors (the “Board”): Audit and Ethics, Compensation and Benefits, and Corporate Governance and Nominating |
Printed versions of these items will be mailed free of charge to shareholders upon request. Such requests can be made by contacting the Corporate Secretary at 1801 Bayberry Court, P. O. Box 18100, Richmond, Virginia 23226-8100.
General
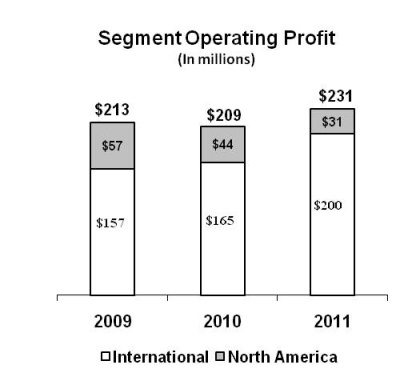
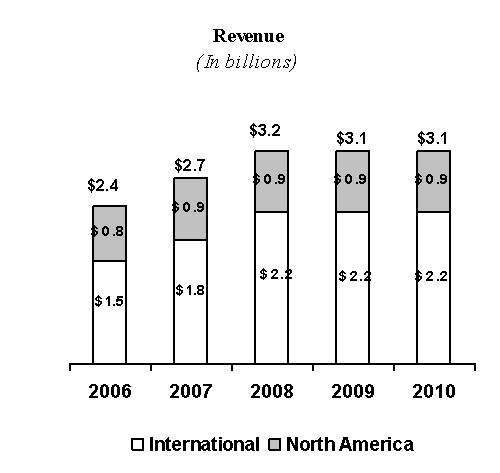
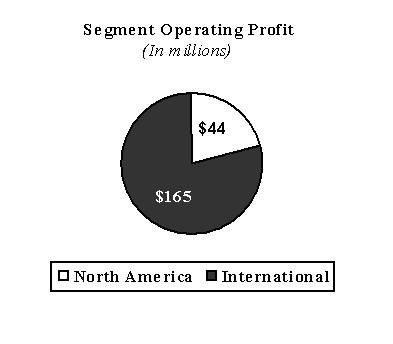
Our 20102011 segment operating profit was $209$231 million on revenues of $3.1$3.9 billion, resulting in a segment operating profit margin of 6.7%5.9%.
GAAP
Non-GAAP*
| | Amounts may not add due*Reconciliation to rounding.GAAP results is found on page 42 |
Amounts may not add due to rounding.
Brink’s operations are located around the world with the majority of our revenues (71%(75%) and segment operating profits (79%(86%) are earned outside of North America.

Brink’s serves customers in over 100 countries. We have ownership interests in operations in approximately 50 countries and have agency relationships with other companies in other countries to complete our global network. Brink’s ownership interests in subsidiaries and affiliated companies ranged from 36% to 100% at December 31, 2010.2011. In some instances, local laws limit the extent of Brink’s ownership interest.
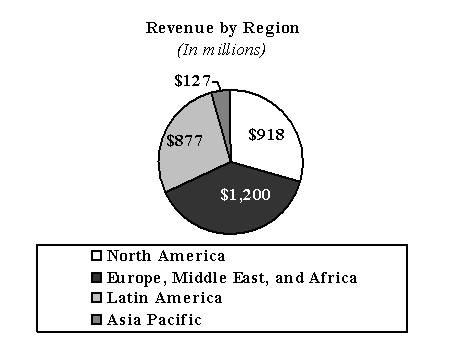
International operations hashave three regions: Latin America; Europe, Middle East and Africa (“EMEA”); Latin America and Asia Pacific. On a combined basis, international operations generated 20102011 revenues of $2.2$2.9 billion (71%(75% of total) and segment operating profit of $165$200 million (79% of total).
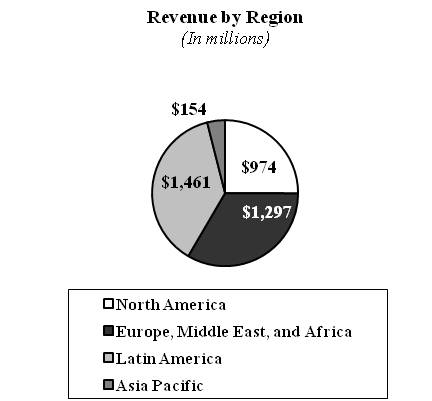
Brink’s EMEA generated $1.2 billion in revenues in 2010 or (38% of Brink’s total 2010 revenues) and operates 261 branches in 24 countries. Its largest operations are in France, the Netherlands and Germany. In 2010, France accounted for $533 million or 44% of EMEA revenues (17%(86% of total).
Brink’s Latin America generated $877 million$1.5 billion in revenues in 2010 (28%2011 (38%) and operates 388275 branches in nine12 countries. Its largest operations are in Mexico, Brazil, Venezuela and Colombia. Mexico had $415 million or 28% of Latin American revenues (11% of total) in 2011. Brazil accounted for $303$387 million or 35%26% of Latin American revenues (10% of total) in 2010.2011. Venezuela accounted for $186$269 million or 21%18% of Latin American revenues (6%(7% of total) in 2010. Mexico had $52 million of2011.
Brink’s EMEA generated $1.3 billion in revenues in 2011 (33% of Brink’s total 2011 revenues) and operates 262 branches in 26 countries. Its largest operations are in France, Germany and the last two monthsNetherlands. In 2011, France accounted for $567 million or 44% of 2010.EMEA revenues (15% of total).
Brink’s Asia-Pacific generated $127$154 million in revenues in 20102011 (4%) and operates 106110 branches in nineten countries.
North American operations include 181147 branches in the U.S. and 5359 branches in Canada. North American operations generated 20102011 revenues of $918$974 million (29%(25% of total) and segment operating profit of $44$31 million (21%(14% of total). We have included our newly acquired Mexican operations with our International – Latin America region.
The largest eightnine Brink’s operations (U.S., France, Mexico, Brazil, Venezuela, Canada, Colombia, Germany and the Netherlands, Colombia, Canada and Germany)Netherlands) accounted for $2.3$3.0 billion or 74%77% of total 20102011 revenues.
| (In millions) | | 2010 | | | % total | | | % change | | | 2009 | | | % total | | | % change | | | 2008 | | | % total | | | % change | |
| | | | | | | | | | | | | | | | | | | | | | | | | | | | |
| Revenues by region: | | | | | | | | | | | | | | | | | | | | | | | | | | | |
| | | | | | | | | | | | | | | | | | | | | | | | | | | | |
EMEA: | | | | | | | | | | | | | | | | | | | | | | | | | | | |
France | | $ | 533 | | | | 17 | | | | (13 | ) | | $ | 615 | | | | 20 | | | | (12 | ) | | $ | 698 | | | | 22 | | | | 11 | |
Other | | | 667 | | | | 21 | | | | 4 | | | | 642 | | | | 20 | | | | (3 | ) | | | 661 | | | | 21 | | | | 18 | |
Total | | | 1,200 | | | | 38 | | | | (5 | ) | | | 1,257 | | | | 40 | | | | (7 | ) | | | 1,359 | | | | 43 | | | | 14 | |
| | | | | | | | | | | | | | | | | | | | | | | | | | | | | | | | | | | | | |
Latin America: | | | | | | | | | | | | | | | | | | | | | | | | | | | | | | | | | | | | |
Brazil | | | 303 | | | | 10 | | | | 17 | | | | 258 | | | | 8 | | | | 33 | | | | 194 | | | | 6 | | | | 20 | |
Venezuela | | | 186 | | | | 6 | | | | (51 | ) | | | 376 | | | | 12 | | | | 7 | | | | 351 | | | | 11 | | | | 56 | |
Other | | | 388 | | | | 12 | | | | 44 | | | | 271 | | | | 9 | | | | 6 | | | | 256 | | | | 8 | | | | 23 | |
Total | | | 877 | | | | 28 | | | | (3 | ) | | | 905 | | | | 29 | | | | 13 | | | | 801 | | | | 25 | | | | 35 | |
| | | | | | | | | | | | | | | | | | | | | | | | | | | | | | | | | | | | | |
Asia Pacific | | | 127 | | | | 4 | | | | 61 | | | | 79 | | | | 2 | | | | 10 | | | | 72 | | | | 2 | | | | 15 | |
| Total International | | | 2,204 | | | | 71 | | | | (2 | ) | | | 2,241 | | | | 71 | | | | - | | | | 2,232 | | | | 70 | | | | 21 | |
| | | | | | | | | | | | | | | | | | | | | | | | | | | | | | | | | | | | | |
North America | | | 918 | | | | 29 | | | | 3 | | | | 894 | | | | 29 | | | | (4 | ) | | | 932 | | | | 30 | | | | 5 | |
| | | | | | | | | | | | | | | | | | | | | | | | | | | | | | | | | | | | | |
| Total Revenues | | $ | 3,122 | | | | 100 | | | | - | | | $ | 3,135 | | | | 100 | | | | (1 | ) | | $ | 3,164 | | | | 100 | | | | 16 | |
| Amounts may not add due to rounding. |
| | (In millions) | | 2011 | | % total | | % change | | | 2010 | | % total | | % change | | | 2009 | | % total | | % change | |
| | | | | | | | | | | | | | | | | | | | | | | | | | |
| | Revenues by region: | | | | | | | | | | | | | | | | | | | | | |
| | | | | | | | | | | | | | | | | | | | | | | | | | |
| | | Latin America: | | | | | | | | | | | | | | | | | | | | | |
| | | | Mexico | $ | 415.2 | | 11 | | fav | | $ | 51.7 | | 2 | | - | | $ | - | | - | | - | |
| | | | Brazil | | 386.8 | | 10 | | 28 | | | 303.3 | | 10 | | 18 | | | 257.6 | | 8 | | 33 | |
| | | | Venezuela | | 269.2 | | 7 | | 45 | | | 185.9 | | 6 | | (51) | | | 376.1 | | 12 | | 7 | |
| | | | Other | | 389.5 | | 10 | | 16 | | | 336.5 | | 11 | | 24 | | | 271.0 | | 9 | | 6 | |
| | | | | Total | | 1,460.7 | | 38 | | 66 | | | 877.4 | | 28 | | (3) | | | 904.7 | | 29 | | 13 | |
| | | | | | | | | | | | | | | | | | | | | | | | | | |
| | | EMEA | | | | | | | | | | | | | | | | | | | | | |
| | | | France | | 567.2 | | 15 | | 6 | | | 533.0 | | 17 | | (13) | | | 615.2 | | 20 | | (12) | |
| | | | Other | | 729.7 | | 19 | | 9 | | | 666.8 | | 21 | | 4 | | | 642.3 | | 20 | | (3) | |
| | | | | Total | | 1,296.9 | | 33 | | 8 | | | 1,199.8 | | 38 | | (5) | | | 1,257.5 | | 40 | | (7) | |
| | | | | | | | | | | | | | | | | | | | | | | | | | |
| | | Asia Pacific | | 153.7 | | 4 | | 22 | | | 126.5 | | 4 | | 61 | | | 78.7 | | 2 | | 10 | |
| | Total International | | 2,911.3 | | 75 | | 32 | | | 2,203.7 | | 71 | | (2) | | | 2,240.9 | | 71 | | - | |
| | | | | | | | | | | | | | | | | | | | | | | | | |
| | | North America | | 974.2 | | 25 | | 6 | | | 917.8 | | 29 | | 3 | | | 894.1 | | 29 | | (4) | |
| | | | | | | | | | | | | | | | | | | | | | | | | | |
| | Total Revenues | $ | 3,885.5 | | 100 | | 24 | | $ | 3,121.5 | | 100 | | - | | $ | 3,135.0 | | 100 | | (1) | |
| | Amounts may not add due to rounding. |
Geographic financial information related to revenues and long-lived assets is included in the consolidated financial statements on page 86.
Services
Our primary services include:
| · | Cash-in-transit (“CIT”) – armored vehicle transportation |
| · | Automated teller machine (“ATM”) – replenishment and servicing, network infrastructure services |
| · | Global Services – transportation of valuables globally |
| · | Cash Logistics – supply chain management of cash |
| · | Payment Services – consumers pay utility and other bills at payment locations |
| · | Guarding Services – including airport security |
Brink’s typically provides customized services under separate contracts designed to meet the distinct needs of customers. Contracts usually cover an initial term of at least one year and range up to five years, depending on the service. The contracts generally remain in effect after the initial term until canceled by either party.
Core Services (54% of total revenue in 2010)2011)
CIT and ATM Services are core services we provide to customers throughout the world. Core services generated approximately $1.7$2.1 billion of revenues in 2010.2011.
CIT – Serving customers since 1859, our success in CIT is driven by a combination of rigorous security practices, high-quality customer service, risk management and logistics expertise. CIT services generally include the secure transportation of:
| · | cash between businesses and financial institutions such as banks and credit unions, |
| · | cash, securities and other valuables between commercial banks, central banks and investment banking and brokerage firms, and |
| · | new currency, coins, bullion and precious metals for central banks and other customers. |
ATM Services – We manage nearly 94,00092,000 ATM units worldwide for banks and other cash dispensing operators. We provide cash replenishment, monitoring and forecasting capabilities, deposit pickup and processing services. Advanced online tools deliver consolidated electronic reports for simplified reconciliation. With our recent acquisition in Canada, we acquired the capability toWe assist financial institutions in managing the processes and infrastructure that are critical to the deployment of ATM networks and electronic payment networks.
High-value Services (35%(36% of total revenue in 2010)2011)
Our core services, combined with our brand and global infrastructure, provide a substantial platform from which we offer additional high-value services. High-value services generated approximately $1.1$1.4 billion of revenues in 2010.2011.
Global Services – Serving customers in more than 100 countries, Brink’s is a leading global provider of secure logistics for valuables including diamonds, jewelry, precious metals, securities, currency, high-tech devices, electronics and pharmaceuticals. The comprehensive suite of services provides packing, pickup, secure storage, inventory management, customs clearance, consolidation and secure transport and delivery through a combination of armored vehicles and secure air and sea transportation to leverage our extensive global network. Our specialized diamond and jewelry operations have offices in the major diamond and jewelry centers of the world.
Cash Logistics – Brink’s offers a fully integrated approach to managing the supply chain of cash, from point-of-sale through transport, vaulting, bank deposit and related credit. Cash Logistics services include:
| · | money processing and cash management services, |
| · | deploying and servicing “intelligent” safes and safe control devices, including our patented CompuSafeâ service, |
| · | integrated check and cash processing services (“Virtual Vault”), and |
Money processing services generally include counting, sorting and wrapping currency. Other currency management services include cashier balancing, counterfeit detection, account consolidation and electronic reporting. Retail and bank customers use Brink’s to count and reconcile coins and currency, prepare bank deposit information and replenish coins and currency in specific denominations.
Brink’s offers a variety of advanced technology applications, including online cash tracking, cash inventory management, check imaging for real-time deposit processing, and a variety of other web-based information tools that enable banks and other customers to reduce costs while improving service to their customers.
Brink’s CompuSafeâ service offers customers an integrated, closed-loop system for preventing theft and managing cash. We market CompuSafe services to a variety of cash-intensive customers such as convenience stores, gas stations, restaurants, retail chains and entertainment venues. Once the specialized safe is installed, the customer’s employees deposit currency into the safe’s cassettes, which can only be removed by Brink’s personnel. Upon removal, the cassettes are securely transported to a vault for processing where contents are verified and transferred for deposit. Our CompuSafe system features currency-recognition and counterfeit-detection technology, multi-lang uagemulti-language touch screens and an electronic interface between the point-of-sale, back-office systems and external banks. Our electronic reporting interface with external banks enables our CompuSafe Serviceservice customers to receive same-day credit on their cash balances, even if the cash remains on the customer’s premises.
Virtual Vault services combine CIT, Cash Logistics, vaulting and electronic reporting technologies to help banks expand into new markets while minimizing investment in vaults and branch facilities. In addition to secure storage, we process deposits, provide check imaging and reconciliation services, currency inventory management, ATM replenishment orders, and electronically transmit debits and credits.
We believe the quality and scope of our cash processing and information systems differentiate our Cash Logistics services from competitive offerings.
Payment Services – We provide bill payment acceptance and processing services to utility companies and other billers. Consumers can pay their bills at our payment locations or locations that we operate on behalf of billers and bank customers.
Commercial Security Systems – In certain markets in Asia-Pacific and Europe, we provide commercial security system services. The services include the design and installation of the security systems, including alarms, motion detectors, closed-circuit televisions, digital video recorders, access control systems including card and biometric readers, electronic locks, and optical turnstiles. Monitoring services may also be provided after systems have been installed.
Other Security Services (11%(10% of total revenue in 2010)2011)
Security and Guarding – We protect airports, offices, warehouses, stores, and public venues with electronic surveillance, access control, fire prevention and highly trained patrolling personnel.
Our guarding services are generally offered in European markets, including France, Germany, Luxembourg and Greece. A significant portion of this business involves long-term contracts related primarily to guarding services at airports and embassies. Generally, other guarding contracts are for a one-year period, the majority of which are extended. Our security officers are typically stationed at customer sites, and responsibilities include detecting and deterring specific security threats.
Growth Strategy
Our growth strategy is summarized below:
| · | Maximize profits in developed markets (primarily North America and Europe) |
| · | Accelerate productivity and cost control efforts. |
| · | Invest in higher-margin solutions; shift revenue mix to High-value servicesServices (primarily Cash Logistics and Global Services). |
| · | Invest in emerging markets by acquiring businesses that meet internal metrics for projected growth, profitability and return on investment. |
| · | Invest in adjacent security-related markets where we can create value for customers with our brand, security expertise, global infrastructure and other competitive advantages. Current examples include commercial security and payment processing. |
Industry and Competition
Brink’s competes with large multinational, regional and smaller companies throughout the world. Our largest multinational competitors are G4S plc (headquartered in the U.K.); Loomis AB, formerly a division of Securitas AB (Sweden); Prosegur, Compania de Seguridad, S.A. (Spain); and Garda World Security Corporation (Canada).
We believe the primary factors in attracting and retaining customers are security expertise, service quality, and price. Our competitive advantages include:
| · | reputation for a high level of service and security |
| · | risk management and logistics expertise |
| · | global infrastructure and customer base |
| · | proprietary cash processing and information systems |
| · | proven operational excellence |
| · | high-quality insurance coverage and general financial strength |
Our cost structure is generally competitive, although certain competitors may have lower costs due to a variety of factors, including lower wages, less costly employee benefits, or less stringent security and service standards.
Although we face competitive pricing pressure in many markets, we resist competing on price alone. We believe our high levels of service and security, as well as value added solutions differentiate us from competitors.
The availability of high-quality and reliable insurance coverage is an important factor in our ability to attract and retain customers and manage the risks inherent in our business. We purchase insurance coverage for losses in excess of what we consider to be prudent levels of self-insurance. Our insurance policies cover losses from most causes, with the exception of war, nuclear risk and certain other exclusions typical in such policies.
Insurance for security is provided by different groups of underwriters at negotiated rates and terms. Premiums fluctuate depending on market conditions. The security loss experience of Brink’s and, to a limited extent, other armored carriers affects our premium rates.
Revenues are generated from charges per service performed or based on the value of goods transported. As a result, revenues are affected by the level of economic activity in various markets as well as the volume of business for specific customers. CIT and ATM contracts usually cover an initial term of at least one year and in many cases one to three years, and generally remain in effect thereafter until canceled by either party. Contracts for Cash Logistics are typically longer. Costs are incurred when preparing to serve a new customer or to transition away from
an existing customer. Operating profit is generally stronger in the second half of the year, particularly in the fourth quarter, as economic activity is typically stronger during this period.
As part of the spin-off of our former monitored home security business, Brink’s Home Security Holdings, Inc. (“BHS”), we agreed to not compete with BHS in the United States, Canada and Puerto Rico with respect to certain activities related to BHS’s security system monitoring and surveillance business until October 31, 2013.
Service Mark and Patents
BRINKS is a registered service mark in the U.S. and certain foreign countries. The BRINKS mark, name and related marks are of material significance to our business. We own patents expiring in 2011 and 2012 for certain coin sorting and counting machines. We also own patents for safes, including our integrated CompuSafeâ service, which expire between 2015 and 2022. These patents provide us with important advantages; however, we are not dependent on the existence of these patents.
We have licensed the Brink’s name to a limited number of companies, including a distributor of security products (padlocks, door hardware, etc.) offered for sale to consumers through major retail chains.
Government Regulation
Government Regulation
Our U.S. operations are subject to regulation by the U.S. Department of Transportation with respect to safety of operations, equipment and financial responsibility. Intrastate operations in the U.S. are subject to state regulation. Our International operations are regulated to varying degrees by the countries in which we operate.
Employee Relations
At December 31, 2010,2011, our company had approximately 71,000 full-time and contract employees, including approximately 9,0008,000 employees in the United States (of whom approximately 1,000800 were classified as part-time employees) and approximately 62,00063,000 employees outside the United States. At December 31, 2010, 2011, Brink’s was a party to twelve collective bargaining agreements in North America with various local unions covering approximately 1,9002,000 employees. The agreements have various expiration dates from 20112012 to 2015. Outside of North America, approximately 57%56% of branch employees are members of labor or employee organizations. We believe our employee relations are satisfactory.
Acquisitions
We have grown in the last several years partially as a result of acquiring security-related businesses in various markets to meet our Growth Strategy objectives. Our largest recent acquisitions in the last two years were in Brazil and India in 2009 and Mexico and Canada in 2010 and Brazil and India in 2009.2010. In addition, we made some smaller but strategically important acquisitions. We did not make any significant acquisitions in emerging markets including Russia and China.2011. Below is a summary of our recent acquisitions. See note 6 to the consolidated financial statements for more information on these acquisitions.
Mexico. We acquired a controlling interest in Servicio Pan Americano de Proteccion, S.A. de C.V. (“SPP”), a CIT, ATM and money processing business, for $60 million in November 2010. We previously owned a 20.86% interest in SPP and we acquired an additional 78.89% of the outstanding shares. In compliance with Mexican law, the remaining 0.25% noncontrolling interest is held by a Mexican company. SPP is the largest secure logistics company in Mexico and this acquisition expands our operations in one of the world’s largest CIT markets. SPP has approximately $400 million in annual revenues with approximately 12,000 full-time and contract employees, 80 branches and 1,350 armored vehicles acros s its nationwide network of CIT, ATM and money processing operations.
Canada. We acquired Threshold Financial Technologies Inc. (“Threshold”) from Versent Corporation for $39 million in December 2010. Threshold is a leading provider of payments solutions in Canada, specializing in managed ATM and transaction processing services for financial institutions and retailers. Threshold’s annual revenue is approximately $48 million, about half of which is generated by providing outsourced ATM network administration and transaction processing solutions. The company, which employs approximately 125 people, also owns and operates a network of private-label ATMs in Canada.
2009
Brazil. We acquired two businesses, Sebival-Seguranca Bancaria Industrial e de Valores Ltda. and Setal Servicos Especializados, for $48 million in January 2009. The acquisitions expanded our CIT and payment processing operations into the mid-western region of Brazil.
India. We acquired additional shares of Brink’s Arya, a CIT and Global Services business, in September 2009, increasing our ownership from 40% to 78% for $22 million.
China. We acquired a majority stake in ICD Limited, a commercial security business in the Asia-Pacific region in September 2009. ICD designs, installs, maintains and manages commercial security systems with offices in Hong Kong, India, Singapore and Australia, and has approximately 200 employees.
2010
France. We acquired Est Valeurs S.A., a provider of CIT and cash services in Eastern France, in March 2010. Est Valeurs employs approximately 100 people and had 2009 revenue of $13 million.
Russia. We acquired a majority stake in a Russian cash processing business in April 2010 that complements a Russian CIT business that was acquired in January 2009. With principal operations in Moscow and approximately 500 employees, the combined operations offer a full range of CIT, ATM, money processing and Global Services operations for domestic and international markets.
China. We acquired a majority stake in ICD Limited, a commercial security business in the Asia-Pacific region in September 2009. ICD designs, installs, maintains and manages commercial security systems with offices in Hong Kong, India, Singapore and Australia, and has approximately 200 employees.
Panama. We acquired the remaining outstanding shares in an armored transportation operation in Panama in February 2009. We previously owned 49% of the company.
Jordan.Mexico. We acquired a majority stakecontrolling interest in Servicio Pan Americano de Proteccion, S.A. de C.V. (“SPP”), a Jordan CIT, ATM and Global Servicesmoney processing business, for $60 million in February 2011.November 2010. We previously owned a 20.86% interest in SPP and we acquired an additional 78.89% of the outstanding shares. In compliance with Mexican law, the remaining 0.25% noncontrolling interest is held by a 45% ownership interest. The Jordanian operations employ approximately 90 people.Mexican trust. SPP is the
largest secure logistics company in Mexico and this acquisition expands our operations in one of the world’s largest CIT markets. SPP has approximately $400 million in annual revenues with approximately 12,000 full-time and contract employees, 80 branches and 1,350 armored vehicles across its nationwide network of CIT, ATM and money processing operations.
Canada. We acquired Threshold Financial Technologies Inc. (“Threshold”) from Versent Corporation for $39 million in December 2010. Threshold is a leading provider of payments solutions in Canada, specializing in managed ATM and transaction processing services for financial institutions and retailers. Threshold’s annual revenue is approximately $48 million, about half of which is generated by providing outsourced ATM network administration and transaction processing solutions. The company, which employs approximately 125 people, also owns and operates a network of private-label ATMs in Canada.
2011
There were no significant acquisitions in 2011.
2012
France. We acquired Kheops, SAS, a provider of logistics software and related services, for approximately $17 million in January 2012. This acquisition gives us proprietary control of software used primarily in our cash-in-transit and money processing operations in France.
DISCONTINUED OPERATIONS
Brink’s Home Security Holdings, Inc.
On October 31, 2008, we completed the 100% spin-off of Brink’s Home Security Holdings, Inc. (“BHS”). BHS offered monitored security services in North America primarily for owner-occupied, single-family residences. To a lesser extent, BHS offered security services for commercial and multi-family properties. BHS typically installed and owned the on-site security systems and charged fees to monitor and service the systems.
As part of the spin-off, we agreed not to compete with BHS in the United States, Canada and Puerto Rico with respect to certain activities related to BHS’s security system monitoring and surveillance business until October 31, 2013.
In connection with the spin-off, we entered into certain agreements with BHS to define responsibility for obligations arising before and after the spin-off, including obligations relating to liabilities of the businesses, employees, taxes and intellectual property. We entered into a Brand Licensing Agreement with BHS. Under the agreement, BHS licensed the rights to use certain trademarks, including trademarks that contain the word “Brink’s” in the United States, Canada and Puerto Rico. In exchange for these rights, BHS agreed to pay a royalty fee equal to 1.25% of its net revenues during the period after the spin-off until the expiration date of the agreement. This royalty income is recorded in continuing operations within other operating income and expense.
On June 28, 2010, we amended our Brand Licensing Agreement with the successor by merger to BHS. The amended agreement (i) fixed a termination date of August 15, 2010, for the Brand Licensing Agreement and established a fixed royalty amount of $2.8 million for the period beginning April 1, 2010, and ending on the termination date, and (ii) provided the successor with the right to extend the termination date to August 27, 2010, for an additional payment of $0.3 million. During the third quarter, the successor exercised its right to extend the termination date. The royalty income related to the amended agreement was recognized ratably from April 1, 2010, through the termination date.
Former Coal BusinessBusinesses
We have significant liabilities related to benefit plans that pay medical costs for retirees of our former coal operations. A portion of these liabilities havehas been funded. We expect to have ongoing expenses within continuing operations and future cash outflow for these liabilities. See notes 3 and 17 to the consolidated financial statements for more information.
We operate in highly competitive industries.
We compete in industries that are subject to significant competition and pricing pressures in most markets. Because we believe we have competitive advantages such as brand name recognition and a reputation for a high level of service and security, we resist competing on price alone. However, continued pricing pressure from competitors or failure to achieve pricing based on the competitive advantages identified above could affect our customer base or pricing structure and have an adverse effect on our business, financial condition, results of operations and cash flows. In addition, given the highly competitive nature of our industries, it is important to develop new solutions and product and service offerings to help retain and expand our customer base. Failure to develop, sell and execute new solutions and offerings in a timely and efficient manner could also negatively affect our ability to retain our existing customer base or pricing structure and have an adverse effect on our business, financial condition, results of operations and cash flows.
Decreased use of cash could have a negative impact on our business.
The proliferation of payment options other than cash, including credit cards, debit cards, stored-value cards, mobile payments and on-line purchase activity, could result in a reduced need for cash in the marketplace and a decline in the need for physical bank branches and retail stores. To mitigate this risk, we are developing new lines of business, but there is a risk that these initiatives may not offset the risks associated with our traditional cash-based business.
We have significant operations outside the United States.
We currently serve customers in more than 100 countries, including approximately 50 countries where we operate subsidiaries. Eighty-one percent (81%) of our revenue in 2011 came from operations outside the U.S. We expect revenue outside the U.S. to continue to represent a significant portion of total revenue. Business operations outside the U.S. are subject to political, economic and other risks inherent in operating in foreign countries, such as:
| · | the difficulty of enforcing agreements, collecting receivables and protecting assets through foreign legal systems; |
| · | trade protection measures and import or export licensing requirements; |
| · | difficulty in staffing and managing widespread operations; |
| · | required compliance with a variety of foreign laws and regulations; |
| · | enforcement of our global compliance program in foreign countries with a variety of laws, cultures and customs; |
| · | varying permitting and licensing requirements in different jurisdictions; |
| · | foreign ownership laws; |
| · | changes in the general political and economic conditions in the countries where we operate, particularly in emerging markets; |
| · | threat of nationalization and expropriation; |
| · | higher costs and risks of doing business in a number of foreign jurisdictions; |
| · | laws or other requirements and restrictions associated with organized labor; |
| · | limitations on the repatriation of earnings; |
| · | fluctuations in equity, revenues and profits due to changes in foreign currency exchange rates, including measures taken by governments to devalue official currency exchange rates; |
| · | inflation levels exceeding that of the U.S; and |
| · | inability to collect for services provided to government entities which have become illiquid or have difficulty paying their debts. |
We are exposed to certain risks when we operate in countries that have high levels of inflation, including the risk that:
| · | the rate of price increases for services will not keep pace with the cost of inflation; |
| · | adverse economic conditions may discourage business growth which could affect demand for our services; |
| · | the devaluation of the currency may exceed the rate of inflation and reported U.S. dollar revenues and profits may decline; and |
| · | these countries may be deemed “highly inflationary” for U.S. generally accepted accounting principles (“GAAP”) purposes. |
We manage these risks by monitoring current and anticipated political and economic developments, monitoring adherence to our global compliance program and adjusting operations as appropriate. Changes in the political or economic environments of the countries in which we operate could have a material adverse effect on our business, financial condition, results of operations and cash flows.
Our growth strategy may not be successful.
One element of our growth strategy is to extend our brand, strengthen our brand portfolio and expand our geographic reach through active programs of selective acquisitions. While we may identify numerous acquisition opportunities, our due diligence examinations and positions that we may take with respect to appropriate valuations and other transaction terms and conditions may hinder our ability to successfully complete acquisitions to achieve our strategic goals. In addition, acquisitions present risks of failing to achieve efficient and effective integration, strategic objectives and anticipated revenue improvements and cost savings. There can be no assurance that:
| · | we will be able to acquire attractive businesses on favorable terms, |
| · | all future acquisitions will be accretive to earnings, or |
| · | future acquisitions will be rapidly and efficiently integrated into existing operations. |
We have significant retirement obligations. Poor investment performance of retirement plan holdings could unfavorably affect our liquidity and results of operations.
We have substantial pension and retiree medical obligations, a portion of which have been funded. The amount of these obligations is significantly affected by factors that are not in our control, including interest rates used to determine the present value of future payment streams, investment returns, medical inflation rates, participation rates and changes in laws and regulations. Our liabilities for these plans increased significantly in 2008 primarily as a result of a decline in value of plan investments. To improve the funded status of The Brink’s Company Pension-Retirement Plan, we made a voluntary $150 million cash and stock contribution in 2009. The funded status of the plan was approximately 71% as of December 31, 2011. Based on actuarial assumptions at the end of 2011, we expect that we will be required to make contributions totaling $228 million to The Brink’s Company Pension-Retirement Plan over a six-year period ending in 2017. This could adversely affect our liquidity and our ability to use our resources to make acquisitions and to otherwise grow our business. The net periodic costs of our retirement plans in 2010 and 2011 were adversely affected by the investment losses sustained in 2008, and although plan investments have partially recovered in the last two years, we anticipate that expenses in future years will continue to be affected as the unrecognized losses are recognized into earnings. If these investments have additional losses, our future cash requirements and costs for these plans will be further adversely affected.
Earnings of our Venezuelan operations may not be transferred to non-Venezuelan subsidiaries for the foreseeable future, which will restrict our ability to use these earnings and cash flows for general corporate purposes such as reducing our debt.
Under a June 2010 law in Venezuela, exchanging local currency for U.S. dollars requires the approval of the government’s central bank. Approved transactions may not exceed $350,000 per legal entity per month. We believe the law will limit the repatriation of cash from Venezuela for the foreseeable future, and as a result, will reduce the amount of cash in the future that could be used for general corporate purposes, including reducing our debt. At December 31, 2011, our Venezuelan subsidiaries held $1.3 million of cash and short-term investments denominated in U.S. dollars and $8.9 million of cash denominated in bolivar fuertes.
Our earnings and cash flow could be materially affected by increased losses of customer valuables.
We purchase insurance coverage for losses of customer valuables for amounts in excess of what we consider prudent deductibles and/or retentions. Insurance is provided by different groups of underwriters at negotiated rates and terms. Coverage is available to us in major insurance markets, although premiums charged are subject to fluctuations depending on market conditions. Our loss experience and that of other armored carriers affects premium rates charged to us. We are self-insured for losses below our coverage limits and recognize expense up to these limits for actual losses. Our insurance policies cover losses from most causes, with the exception of war, nuclear risk and various other exclusions typical for such policies. The availability of high-quality and reliable insurance coverage is an important factor in order for us to obtain and retain customers and to manage the risks of our business. If our losses increase, or if we are unable to obtain adequate insurance coverage at reasonable rates, our financial condition, results of operations and cash flows could be materially and adversely affected.
We have risks associated with confidential individual information.
In the normal course of business, we collect, process and retain sensitive and confidential information about individuals. Despite the security measures we have in place, our facilities and systems, and those of third-party service providers, could be vulnerable to security breaches, acts of vandalism, computer viruses, misplaced or lost data, programming or human errors or other similar events. Any security breach involving the misappropriation, loss or other unauthorized disclosure of confidential information, whether by us or by third-party service providers, could damage our reputation, expose us to the risks of litigation and liability, disrupt our business or otherwise have a material adverse effect on our business, financial condition, results of operations and cash flows.
ITEM 1A. RISK FACTORSNegative publicity to our name or brand could lead to a loss of revenue or profitability.
We are in the security business and our success and longevity are based to a large extent on our reputation for trust and integrity. Our reputation or brand, particularly the trust placed in us by our customers, could be negatively impacted in the event of perceived or actual breaches in our ability to conduct our business ethically, securely and responsibly. Any damage to our brand could have a material adverse effect on our business, financial condition, results of operations and cash flows.
Failures of our IT system could have a material adverse effect on our business.
We are exposedheavily dependent on our information technology (IT) infrastructure. Significant problems with our infrastructure, such as telephone or IT system failure, computer viruses or other third-party tampering with IT systems, or failure to risk in the operation ofdevelop new technology platforms to support new initiatives and product and service offerings, could halt or delay our businesses. Some of these risks are commonability to all companies doingservice our customers, hinder our ability to conduct and expand our business in the industries in whichand require significant remediation costs. In addition, we operatecontinue to evaluate and some are uniqueimplement upgrades to our business. In addition, thereIT systems. We are aware of inherent risks associated with investing inreplacing these systems, including accurately capturing data and system disruptions, and believe we are taking appropriate action to mitigate these risks through testing, training, and staging implementation. However, there can be no assurances that we will successfully launch these systems as planned or that they will occur without disruptions to our common stock. These risk factors should be considered carefully when evaluating the companyoperations. Any of these events could have a material adverse effect on our business, financial condition, results of operations and its businesses.cash flows.
We may not realize the expected benefits of strategic acquisitions because of integration difficulties and other challenges, which may adversely affect our financial condition, results of operations or cash flows.
Our ability to realize the anticipated benefits from recent acquisitions will depend, in part, on successfully integrating each business with our company as well as improving operating performance and profitability through our management efforts and capital investments. The risks to a successful integration and improvement of operating performance and profitability include, among others, failure to implement our business plan, unanticipated issues in integrating operations with ours, unanticipated changes in laws and regulations, labor unrest resulting from union operations, regulatory, environmental and permitting issues, the effect on our internal controls and compliance with the regulatory requirements under the Sarbanes-Oxley Act of 2002, and difficulties in fully identifying and evaluating potential liabilities, risks and operating issues. The occurrence of any of these events may adversely affect our expected benefits of the recent acquisitions and may have a material adverse effect on our financial condition, results of operations or cash flows.
The inability to access capital or significant increases in the cost of capital could adversely affect our business.
Our ability to obtain adequate and cost-effective financing depends on our credit ratings as well as the liquidity of financial markets. A negative change in our ratings outlook or any downgrade in our current investment-grade credit ratings by our rating agencies could adversely affect our cost and/or access to sources of liquidity and capital. Additionally, such a downgrade could increase the costs of borrowing under available credit lines. Disruptions in the capital and credit markets could adversely affect our ability to access short-term and long-term capital. Our access to funds under short-term credit facilities is dependent on the ability of the participating banks to meet their funding commitments. Those banks may not be able to meet their funding commitments if they experience shortages of capital and liquidity. Longer disruptio ns in the capital and credit markets as a result of uncertainty, changing or increased regulation, reduced alternatives, or failures of significant financial institutions could adversely affect our access to capital needed for our business.
We have significant retirement obligations. Poor investment performance of retirement plan holdings could unfavorably affect our liquidity and results of operations.
We have substantial pension and retiree medical obligations, a portion of which have been funded. The amount of these obligations is significantly affected by factors that are not in our control, including interest rates used to determine the present value of future payment streams, investment returns, medical inflation rates, participation rates and changes in laws and regulations. Our liabilities for these plans increased significantly in 2008 primarily as a result of a decline in value of plan investments. To improve the funded status of The Brink’s Company Pension-Retirement Plan, we made a voluntary $150 million cash and stock contribution in 2009. The funded status of the plan was approximately 80% as of December 31, 2010. Based on actuarial assumptions at the end of 2010, we expect that we will be required to make contributions totaling $136 million to The Brink’s Company Pension-Retirement Plan over a five-year period ending in 2016. This could adversely affect our liquidity and our ability to use our resources to make acquisitions and to otherwise grow our business. The net periodic costs of our retirement plans in 2009 and 2010 were adversely affected by the investment losses sustained in 2008, and although plan investments have partially recovered in the last two years, we anticipate that expenses in future years will continue to be affected as the unrecognized losses are recognized into earnings. If these investments have additional losses, our future cash requirements and costs for these plans will be further adversely affected.
We have significant operations outside the United States.
We currently serve customers in more than 100 countries, including approximately 50 countries where we operate subsidiaries. Seventy-six percent (76%) of our revenue in 2010 came from operations outside the U.S. We expect revenue outside the U.S. to continue to represent a significant portion of total revenue. Business operations outside the U.S. are subject to political, economic and other risks inherent in operating in foreign countries, such as:
· | the difficulty of enforcing agreements, collecting receivables and protecting assets through foreign legal systems; |
· | trade protection measures and import or export licensing requirements; |
· | difficulty in staffing and managing widespread operations; |
· | required compliance with a variety of foreign laws and regulations; |
· | varying permitting and licensing requirements in different jurisdictions; |
· | foreign ownership laws; |
· | changes in the general political and economic conditions in the countries where we operate, particularly in emerging markets; |
· | threat of nationalization and expropriation; |
· | higher costs and risks of doing business in a number of foreign jurisdictions; |
· | laws or other requirements and restrictions associated with organized labor; |
· | limitations on the repatriation of earnings; |
· | fluctuations in equity, revenues and profits due to changes in foreign currency exchange rates, including measures taken by governments to devalue official currency exchange rates; and |
· | inflation levels exceeding that of the U.S. |
We are exposed to certain risks when we operate in countries that have high levels of inflation, including the risk that:
· | the rate of price increases for services will not keep pace with the cost of inflation; |
· | adverse economic conditions may discourage business growth which could affect demand for our services; |
· | the devaluation of the currency may exceed the rate of inflation and reported U.S. dollar revenues and profits may decline; and |
· | these countries may be deemed “highly inflationary” for U.S. generally accepted accounting principles (“GAAP”) purposes. |
We try to manage these risks by monitoring current and anticipated political and economic developments and adjusting operations as appropriate. Changes in the political or economic environments of the countries in which we operate could have a material adverse effect on our business, financial condition, results of operations and cash flows.
Restructuring charges may be required in the future.
There is a possibility we will take restructuring actions in one or more of our markets in the future to reduce expenses if a major customer is lost, if recurring operating losses continue, or if one of the risks described above in connection with our foreign operations materializes. These actions could result in significant restructuring charges at these subsidiaries, including recognizing impairment charges to write down assets, and recording accruals for employee severance and operating leases. These charges, if required, could significantly and materially affect results of operations and cash flows.
Earnings of our Venezuelan operations may not be repatriated for the foreseeable future, which will restrict our ability to use these earnings and cash flows for general corporate purposes such as reducing our U.S. debt.
Under a June 2010 law in Venezuela, exchanging local currency for U.S. dollars requires the approval of the government’s central bank. Approved transactions may not exceed $350,000 per legal entity per month. We believe the law will limit the repatriation of cash from Venezuela for the foreseeable future, and as a result, will reduce the amount of cash in the future that could be used for general corporate purposes, including reducing our U.S. debt. At December 31, 2010, our Venezuelan subsidiaries held $3.3 million of cash and short-term investments denominated in U.S. dollars and $18.2 million of cash denominated in bolivar fuertes.
We operate in highly competitive industries.
We compete in industries that are subject to significant competition and pricing pressures in most markets. Because we believe we have competitive advantages such as brand name recognition and a reputation for a high level of service and security, we resist competing on price alone. However, continued pricing pressure could affect our customer base or pricing structure and have an adverse effect on our business, financial condition, results of operations and cash flows.
Our earnings and cash flow could be materially affected by increased losses of customer valuables.
We purchase insurance coverage for losses of customer valuables for amounts in excess of what we consider prudent deductibles and/or retentions. Insurance is provided by different groups of underwriters at negotiated rates and terms. Coverage is available to us in major insurance markets, although premiums charged are subject to fluctuations depending on market conditions. Our loss experience and that of other armored carriers affects premium rates charged to us. We are self-insured for losses below our coverage limits and recognize expense up to these limits for actual losses. Our insurance policies cover losses from most causes, with the exception of war, nuclear risk and various other exclusions typical for such policies. The availability of high-quality and reliable ins urance coverage is an important factor in order for us to obtain and retain customers and to manage the risks of our business. If our losses increase, or if we are unable to obtain adequate insurance coverage at reasonable rates, our financial condition, results of operations and cash flows could be materially and adversely affected.
We have risks associated with confidential individual information.
In the normal course of business, we collect, process and retain sensitive and confidential information about individuals. Despite the security measures we have in place, our facilities and systems, and those of third-party service providers, could be vulnerable to security breaches, acts of vandalism, computer viruses, misplaced or lost data, programming or human errors or other similar events. Any security breach involving the misappropriation, loss or other unauthorized disclosure of confidential information, whether by us or by third-party service providers, could damage our reputation, expose us to the risks of litigation and liability, disrupt our business or otherwise have a material adverse effect on our business, financial condition, results of operations and cash flows.
We operate in regulated industries.
Our U.S. operations are subject to regulation by the U.S. Department of Transportation with respect to safety of operations and equipment and financial responsibility. Intrastate operations in the U.S. are subject to regulation by state regulatory authorities and interprovincial operations in Canada are subject to regulation by Canadian and provincial regulatory authorities. Our international operations are regulated to varying degrees by the countries in which we operate. Many countries have permit requirements for security services and prohibit foreign companies from providing different types of security services.
Changes in laws or regulations could require a change in the way we operate, which could increase costs or otherwise disrupt operations. In addition, failure to comply with any applicable laws or regulations could result in substantial fines or revocation of our operating permits and licenses. If laws and regulations were to change or we failed to comply, our business, financial condition, results of operations and cash flows could be materially and adversely affected.
FailuresOur inability to access capital or significant increases in our cost of capital could adversely affect our IT system could have a material adverse effectbusiness.
Our ability to obtain adequate and cost-effective financing depends on our business.credit ratings as well as the liquidity of financial markets. A negative change in our ratings outlook or any downgrade in our current investment-grade credit ratings by the rating agencies could adversely affect our cost and/or access to sources of liquidity and capital. Additionally, such a downgrade could increase the costs of borrowing under available
11
We are heavily dependent on our information technology (IT) infrastructure. Significant problems with our infrastructure, such as telephone or IT system failure, computer viruses or other third-party tampering with IT systems,
credit lines. Disruptions in the capital and credit markets could halt or delayadversely affect our ability to serviceaccess short-term and long-term capital. Our access to funds under short-term credit facilities is dependent on the ability of the participating banks to meet their funding commitments. Those banks may not be able to meet their funding commitments if they experience shortages of capital and liquidity. Longer disruptions in the capital and credit markets as a result of uncertainty, changing or increased regulation, reduced alternatives, or failures of significant financial institutions could adversely affect our customers, hinderaccess to capital needed for our ability to conduct our business and require significant remediation costs. In addition, we continue to evaluate and implement upgrades to our IT systems. We are aware of inherent risks associated with replacing these systems, including accurately capturing data and system disruptions, and believe we are taking appropriate action to mitigate these risks through testing, training, and staging implementation. However, there can be no assurances that we will successfully launch these systems as planned or tha t they will occur without disruptions to our operations. Any of these events could have a material adverse effect on our business, financial condition, results of operations and cash flows.business.
We have retained obligations from the sale of BAX Global.
In January 2006 we sold BAX Global. We retained some of the obligations related to these operations, primarily for taxes owed prior to the date of sale and for any amounts paid related to one pending litigation matter for which we paid $11.5 million in 2010. In addition, we provided indemnification customary for these sorts of transactions. Future unfavorable developments related to these matters could require us to record additional expenses or make cash payments in excess of recorded liabilities. The occurrence of these events could have a material adverse affect on our financial condition, results of operations and cash flows.
We are subject to covenants for our credit facilities.facilities and for our unsecured notes.
We haveOur credit facilities withas well as our unsecured notes are subject to financial covenants, including a limit on the ratio of debt to earnings before interest, taxes, depreciation, and amortization, limits on the ability to pledge assets, limits on the total amount of indebtedness we can incur, limits on the use of proceeds of asset sales and minimum coverage of interest costs. Although we believe none of these covenants are presently restrictive to operations, the ability to meet the financial covenants can be affected by changes in our results of operations or financial condition. We cannot provide assurance that we will meet these covenants. A breach of any of these covenants could result in a default under existing credit facilities. Upon the occurrence of an event of default under any of our credit facilities, the lenders could c ausecause amounts outstanding to be immediately payable and terminate all commitments to extend further credit. The occurrence of these events would have a significant effect on our liquidity and cash flows.
Our growth strategy may not be successful.
One element of our growth strategy is to extend our brand, strengthen our brand portfolio and expand our geographic reach through active programs of selective acquisitions. While we may identify numerous acquisition opportunities, our due diligence examinations and positions that we may take with respect to appropriate valuations and other transaction terms and conditions may hinder our ability to successfully complete acquisitions to achieve our strategic goals. In addition, acquisitions present risks of failing to achieve efficient and effective integration, strategic objectives and anticipated revenue improvements and cost savings. There can be no assurance that:
· | we will be able to acquire attractive businesses on favorable terms, |
· | all future acquisitions will be accretive to earnings, or |
· | future acquisitions will be rapidly and efficiently integrated into existing operations. |
Our effective income tax rate could change.
We serve customers in more than 100 countries, including approximately 50 countries where we operate subsidiaries, all of which have different income tax laws and associated income tax rates. Our effective income tax rate can be significantly affected by changes in the mix of pretax earnings by country and the related income tax rates in those countries. In addition, our effective income tax rate is significantly affected by the ability to realize deferred tax assets, including those associated with net operating losses. Changes in income tax laws, income apportionment, or estimates of the ability to realize deferred tax assets, could significantly affect our effective income tax rate, financial position and results of operations.
We have certain environmental and other exposures related to our former coal operations.
We may incur future environmental and other liabilities that are presently unknown in connection with our former coal operations, which could materially and adversely affect our financial condition, results of operations and cash flows.
We may be exposed to certain regulatory and financial risks related to climate change.
Growing concerns about climate change may result in the imposition of additional environmental regulations to which we are subject. Some form of federal regulation may be forthcoming with respect to greenhouse gas emissions (including carbon dioxide) and/or "cap and trade" legislation. The outcome of this legislation may result in new regulation, additional charges to fund energy efficiency activities or other regulatory actions. Compliance with these actions could result in the creation of additional costs to us, including, among other things, increased fuel prices or additional taxes or emission allowances. We may not be able to recover the cost of compliance with new or more stringent environmental laws and regulations from our customers, which could adversely affect our business. Furthermore, the potential effe ctseffects of climate change and related regulation on our customers are highly uncertain and may adversely affect our operations.
Forward-Looking Statements
This document contains both historical and forward-looking information. Words such as “anticipates,” “estimates,” “expects,” “projects,” “intends,” “plans,” “believes,” “may,” “should” and similar expressions may identify forward-looking information. Forward-looking information in this document includes, but is not limited to, statements regarding expected revenue growthfuture performance of The Brink’s Company and earnings,its global operations, including organic revenue growth and segment operating profit margin in 2011,2012, the pursuit of growth through acquisitions in developed, emerging and adjacent markets, employee relations, liabilities, expenses and cash outflows related to former operations, including benefit plansthe percentage of total revenues from outside the United States, future contributions to pay retiree medical costs,our Pension-Retirement Plan, the repatriation of cash from our Venezuelan operations, the outcome of pending litigation including litigation in Belgium, and the anticipated financial effect of the disposition of these matters, the pursuit of higher margin business opportunities, investments in information technology, profit growth in Mexico and Latin America, improved margins in North America and Europe, growth of our Cash Logistics services,Global Services business, the acquisition of new vehicles in the United States with capital leases, expected non-segment income and expenses, 2012 projected interest expense, the realization of deferred tax assets, our anticipated
effective tax rate for 20112012 and our tax position, the reinvestment of earnings on operations outside the U.S., 2011 projected interest expense, capital expenditures,United States, net income attributable to noncontrolling interests, projected currency impact on revenue, capital expenditures, capital leases and depreciation and amortization, the funding of our acquisition strategy and pension obligations, the trend of capital expenditures exceeding depreciation and amortization, the ability to meet liquidity needs, future payment of bonds issued by the Peninsula Ports Authority of Virginia, the abilityregistration and issuance of shares of common stock to meet liquidity needs,satisfy pension contribution requirements, estimated contractual obligations for the next five years and beyond, projected contributions, expenses and payouts for the U.S. retirement plans and the non-U.S. pension plans and the expected long-term rate of return and funded status of the primary U.S. pension plan, expected liability for and future contributions to the UMWA pla ns,plans, liability for black lung obligations, the effectprojected impact of accounting rule changes,a new excise tax on the UMWA plans, our ability to obtain U.S. dollars to operate our business in Venezuela at the SITME rate, the repatriationeffect of cash from our Venezuelan operations,accounting rule changes, the deductibilityperformance of goodwill,counterparties to hedging agreements, the recognition of unrecognized tax positions, future amortizations into net periodic pension cost, the recognitiondeductibility of unrecognized tax positions, the purchase of additional shares of Brink’s Arya,goodwill, projected minimum repayments of long-term debt, the replacement of operating leases, future minimum lease payments, and minimum future lease payments.the recognition of costs related to stock option grants. Forward-looking information in this document is subject to known and unknown risks, uncertainties, and contingencies, which could cause actual results, performance or achievements to differ materially from those that are anticipated.
These risks, uncertainties and contingencies, many of which are beyond our control, include, but are not limited to the timing of the recovery from the global economic slowdown and its impact on our business opportunities, the recentcontinuing market volatility and itscommodity price fluctuations and their impact on the demand for our services, our ability to maintain or improve volumes at favorable pricing levels and increase cost efficiencies in the implementationUnited States, our ability to continue profit growth in Mexico and the rest of Latin America, the effect of current macro-economic uncertainty on our operations in Europe, investments in information technology and High-valuevalue-added services and cost reduction efforts and their impact on revenue and profit growth, the strength of the U.S. dollar relative to foreign currencies and foreign currency exchange rates, the implementation of high-value solutions, the ability to identify and execute further cost and operational improvements and efficiencies in our core businesses, our ability to integrate successfully recently acquired companies and improve their operating profit margins, the willingness of our customers to absorb fuel surcharges and other future price increases, the actions of competitors, regulatoryour ability to identify acquisitions and other strategic opportunities in emerging markets, security threats worldwide, labor issues, in manyincluding the possibility of our global operations and security threats worldwide,work stoppages, the impact of turnaround actions responding to current conditions in Eur ope,Europe and our productivity and cost control efforts in that region, the stability of the Venezuelan economy and changes in Venezuelan policy regarding exchange rates, fluctuations in value of the Venezuelan bolivar fuerte, our ability to obtain necessary information technology and other services at favorable pricing levels from third party service providers, variations in costs or expenses and performance delays of any public or private sector supplier, service provider or customer, our ability to obtain appropriate insurance coverage, positions taken by insurers with respect to claims made and the financial condition of insurers, safety and security performance, our loss experience, changes in insurance costs, the outcome of pending and future claims and litigation, including claims in Belgium relating to our former CIT business in that country, risks customarily associated with operating in foreign countries including changing labor and economic conditions, currency devaluations, safety and security issues, political instability, restrictions on repatriation of earnings and capital, nationalization, expropriation and other forms of restrictive government actions, costs associated with the purchase and i mplementationimplementation of cash processing and security equipment, employee and environmental liabilities in connection with our former coal operations, black lung claims incidence, the impact of the Patient Protection and Affordable Care Act on black lung liability and operations, changes to estimated liabilities and assets in actuarial assumptions due to payments made, investment returns, interest rates and annual actuarial revaluations, the funding requirements, accounting treatment, investment performance and costs and expenses of our retirement plans, the VEBA and other employee benefits, projections regarding the number of participants in and beneficiaries of our employee and retiree benefit plans, mandatory or voluntary retirement plan and VEBA contributions, the number of dependents of mine workers for whom benefits are provided, actual retirement experience of the former coal operation’s employees, actual medical and legal expenses relating to benefits, changes in inflation rates (including medical inflation) and inter estinterest rates, changes in mortality and morbidity assumptions, discovery of new facts relating to civil suits, the addition of claims or changes in relief sought by adverse parties, our cash, debt and tax position and growth needs, our demand for capital and the availability and cost of such capital, the nature of our hedging relationships, changes in employee obligations, overall domestic and international economic, political, social and business conditions, capital markets performance, the strength of the U.S. dollar relative to foreign currencies and foreign currency exchange rates, access to the capital and credit markets, changes in estimates and assumptions underlying our critical accounting policies, as more fully described in the section “Application of Critical Accounting Policies” but including the likelihood that net deferred tax assets will be realized, discount rates, expectations of future performance and anticipated return on assets, the timing of deductibility of expenses and inflatio n,inflation, the promulgation and adoption of new accounting standards and interpretations, including ASU 2009-13 and ASU 2009-14, seasonality, pricing and other competitive industry factors, labor relations, new government regulations and
interpretations of existing regulations, legislative initiatives, judicial decisions, issuances of permits, variations in costs or expenses and the ability of counterparties to perform. The information included in this document is representative only as of the date of this document, and The Brink’s Company undertakes no obligation to update any information contained in this document.
ITEM 1B. UNRESOLVED STAFF COMMENTS
Not applicable.
We have property and equipment in locations throughout the world. Branch facilities generally have office space to support operations, a vault to securely process and store valuables and a garage to house armored vehicles and serve as a vehicle terminal. Many branches have additional space to repair and maintain vehicles. In addition to these branches, we operate approximately 200 leased kiosks in Latin America related to our payment services business.
We own or lease armored vehicles, panel trucks and other vehicles that are primarily service vehicles. Our armored vehicles are of bullet-resistant construction and are specially designed and equipped to provide security for the crew and cargo.
The following table discloses leased and owned facilities and vehicles for Brink’s most significant operations as of December 31, 2010.2011.
| | | Facilities | | | Vehicles | |
| Region | | Leased | | | Owned | | | Total | | | Leased | | | Owned | | | Total | |
| | | | | | | | | | | | | | | | | | | |
| U. S. | | | 172 | | | | 25 | | | | 197 | | | | 2,089 | | | | 240 | | | | 2,329 | |
| Canada | | | 47 | | | | 12 | | | | 59 | | | | 506 | | | | 50 | | | | 556 | |
| North America | | | 219 | | | | 37 | | | | 256 | | | | 2,595 | | | | 290 | | | | 2,885 | |
| | | | | | | | | | | | | | | | | | | | | | | | | |
| EMEA | | | 241 | | | | 41 | | | | 282 | | | | 718 | | | | 3,008 | | | | 3,726 | |
| Latin America | | | 339 | | | | 96 | | | | 435 | | | | 451 | | | | 5,134 | | | | 5,585 | |
| Asia Pacific | | | 109 | | | | - | | | | 109 | | | | 2 | | | | 552 | | | | 554 | |
| International | | | 689 | | | | 137 | | | | 826 | | | | 1,171 | | | | 8,694 | | | | 9,865 | |
| | | | | | | | | | | | | | | | | | | | | | | | | |
| Total | | | 908 | | | | 174 | | | | 1,082 | | | | 3,766 | | | | 8,984 | | | | 12,750 | |
| | | | Facilities | Vehicles | |
| | Region | | Leased | | Owned | | Total | | | Leased | | Owned | | Total | |
| | | | | | | | | | | | | | | | | | | | | | | |
| | U.S. | | 148 | | | 28 | | | 176 | | | | 2,018 | | | 224 | | | 2,242 | | |
| | Canada | | 47 | | | 12 | | | 59 | | | | 504 | | | 52 | | | 556 | | |
| | | North America | | 195 | | | 40 | | | 235 | | | | 2,522 | | | 276 | | | 2,798 | | |
| | | | | | | | | | | | | | | | | | | | | | | |
| | Latin America | | 351 | | | 106 | | | 457 | | | | 554 | | | 5,249 | | | 5,803 | | |
| | EMEA | | 238 | | | 44 | | | 282 | | | | 786 | | | 2,961 | | | 3,747 | | |
| | Asia Pacific | | 113 | | | - | | | 113 | | | | 2 | | | 590 | | | 592 | | |
| | | International | | 702 | | | 150 | | | 852 | | | | 1,342 | | | 8,800 | | | 10,142 | | |
| | | | | | | | | | | | | | | | | | | | | | | |
| | Total | | 897 | | | 190 | | | 1,087 | | | | 3,864 | | | 9,076 | | | 12,940 | | |
During 2010,As of December 31, 2011, we installedhad approximately 2,00014,800 units net of dispositions, for our CompuSafe® service. This is a 19% increase in theservice installed base since the endworldwide, of 2009. Our installed basewhich approximately 13,400 units were located in the U.S. now stands at approximately 12,300 units. In 2010,2011, revenues from our CompuSafe® service represented approximately 8% of North America’s revenues.
ITEM 3. LEGAL PROCEEDINGS
Our former cash-in-transit operation in Belgium (Brink’s Belgium) filed for bankruptcy in November 2010, after a restructuring plan was rejected by local union employees, and was placed in bankruptcy on February 2, 2011. On December 7, 2010, the court-appointed provisional administrators of Brink’s Belgium filed a claim in the Commercial Court of Brussels for €20 million against Brink’s Security International, Inc. (“BSI”), a subsidiary of Brink’s and the majority shareholder of Brink’s Belgium. The claim allegesalleged that BSI has a binding obligation to support the operations and liabilities of Brink’s Belgium based on a letter of future financial support issued in connection with the statutory audit of Brink’s Belgium’s 2009 accounts.
In June 2011, BSI entered into a settlement agreement related to this claim. Under the terms of the settlement agreement, BSI agreed to contribute, upon the satisfaction of certain conditions, €7 million toward social payments to former Brink’s Belgium employees in exchange for the bankruptcy receivers requesting withdrawal of the pending litigation and agreeing not to file additional claims. The conditions of the settlement agreement included a release from liability by affected employees, the Belgian tax authority and the Belgian social security authority. After these conditions were satisfied, the settlement was finalized in September 2011 and the request to withdraw the litigation is pending before the court. We do not believe tha t this claim has merit, and we are pursuingrecorded a vigorous defense to contest this action. We believe that it is reasonably possible that we will incur a losspretax charge of up to €20€7 million (equivalent to $26.5 million at December 31, 2010) if we lose in the court proceeding, but it is also reasonably possible that we will prevail in the court resulting in no loss. We do not believe that any loss withinsecond quarter of 2011 (approximately $10 million) related to this range is probable and have not accrued for this matter. The ultimate resolution of this matter is unknown and the estimated liability may change in the future. We do not believe that the ultimate disposition of this matter will have a material adverse effect on our liquidity, financial position or results of operations.claim.
In addition, we are involved in various other lawsuits and claims in the ordinary course of business. We are not able to estimate the range of losses for some of these matters. We have recorded accruals for losses that are considered probable and reasonably estimable. We do not believe that the ultimate disposition of any of these matters will have a material adverse effect on our liquidity, financial position or results of operations.
ITEM 4. [REMOVED AND RESERVED]MINE SAFETY DISCLOSURES
Not applicable.
Executive Officers of the Registrant
The following is a list as of February 20, 2011,2012, of the names and ages of the executive and other officers of Brink’s indicating the principal positions and offices held by each. There are no family relationships among any of the officers named.
| Name | Age | | Positions and Offices Held | Held Since |
| Executive Officers: | | | | |
| Michael T. Dan | 60 | | President, Chief Executive Officer and Chairman of the Board | 1998 |
| Joseph W. Dziedzic | 42 | | Vice President and Chief Financial Officer | 2009 |
| Frank T. Lennon | 69 | | Vice President and Chief Administrative Officer | 2005 |
| McAlister C. Marshall, II | 41 | | Vice President and General Counsel | 2008 |
| Matthew A. P. Schumacher | 52 | | Controller | 2001 |
| | | | | |
| Other Officers: | | | | |
| Jonathan A. Leon | 44 | | Treasurer | 2008 |
| Lisa M. Landry | 45 | | Vice President - Tax | 2009 |
| Michael J. McCullough | 40 | | Secretary | 2009 |
| Arthur E. Wheatley | 68 | | Vice President – Risk Management and Insurance | 1988 |
| | Name | Age | | Positions and Offices Held | | Held Since | | |
| | Executive Officers: | | | | | | | |
| | Thomas C. Schievelbein | 58 | | Interim President and Chief Executive Officer | | 2011 | | |
| | Joseph W. Dziedzic | 43 | | Vice President and Chief Financial Officer | | 2009 | | |
| | Frank T. Lennon | 70 | | Vice President and Chief Administrative Officer | | 2005 | | |
| | McAlister C. Marshall, II | 42 | | Vice President and General Counsel | | 2008 | | |
| | Ronald F. Rokosz | 66 | | Vice President – International | | 2011 | | |
| | Matthew A. P. Schumacher | 53 | | Controller | | 2001 | | |
| | | | | | | | | |
| | Other Officers: | | | | | | | |
| | Jonathan A. Leon | 45 | | Treasurer | | 2008 | | |
| | Lisa M. Landry | 46 | | Vice President - Tax | | 2009 | | |
| | Michael J. McCullough | 41 | | Secretary | | 2009 | | |
| | Arthur E. Wheatley | 69 | | Vice President – Risk Management and Insurance | | 1988 | | |
Executive and other officers of Brink’s are elected annually and serve at the pleasure of the Board.
Mr. Dan was electedSchievelbein is the interim President Chief Executive Officer and Director of Brink’s in February 1998 and was elected Chairman of the Board effective January 1, 1999. He also serves as Chief Executive Officer of Brink’s, Incorporated, a position hethe Company and has held that position since July 1993. From August 1992December 2011, prior to July 1993which he served as the interim Executive Chairman of the Company from November 2011 to December 2011. He has also served as a director of the Company since March 2009. He is the retired President of Northrop Grumman Newport News, a subsidiary of the Northrop Grumman Corporation, a global defense company, and has been a business consultant since November 2004. Mr. Schievelbein served as President of North American operationsNorthrop Grumman Newport News from November 2001 until his retirement in November 2004. Mr. Schievelbein currently also serves as a director of Brink’s, IncorporatedHuntington Ingalls Industries, Inc., McDermott International, Inc. and as Executive Vice President of Brink’s, Incorporated from 1985 to 1992.New York Life Insurance Company.
Mr. Dziedzic is the Vice President and Chief Financial Officer of Brink’s.the Company. Mr. Dziedzic was hired onin May 25, 2009 and appointed to this position onin August 1, 2009. Before joining Brink’s, Mr. Dziedzic was Chief Financial Officer for GE Aviation Services, a producer, seller and servicer of jet engines, turboprop and turbo shaft engines and related replacement parts, from March 2006 to May 2009. Prior to this position, Mr. Dziedzic was Manager-Global Financial Planning & Analysis for GE Energy, a provider of products and services related to energy production, distribution and management, from January 2003 to February 2006.
Mr. Lennon was appointed Vice President and Chief Administrative Officer in 2005. Prior to this position, he was the Vice President, Human Resources and Administration of Brink’s from 1990 through 2005.
Mr. Marshall was appointed Vice President and General Counsel of Brink’sthe Company in September 2008 and also held the office of Secretary from September 2008 to July 2009. Prior to joining Brink’s, Mr. Marshall was the Vice President, General Counsel and Secretary at Tredegar Corporation, a manufacturer of plastic films and aluminum extrusions, from October 2006 to September 2008. Prior to this position, Mr. Marshall was the Assistant General Counsel and Secretary for Brink’s from July 2006 to September 2006. Prior to this position, Mr. Marshall was the Assistant General Counsel and Director-Corporate Governance and Compliance for Brink’s from July 2004 to July 2006. Prior to this position, Mr. Marshall was the Assistant General Counsel for Brink’s from July 2000 to July 2004.
Messrs. Lennon, Schumacher and Wheatley have served in their present positions for more than the past five years.
Ms. LandryMr. Rokosz was appointed Vice President-TaxPresident-International of the Company in November 2011. He also serves as Executive Vice President and Chief Operating Officer of Brink’s, on July 10,Incorporated, a position he has held since January 2009. Prior to this position, Ms. LandryMr. Rokosz was Director of Taxes and Chief Tax CounselPresident, Brink’s International of Brink’s, Incorporated from DecemberOctober 2006 to JulyJanuary 2009. Prior to this position, Ms. Landry had held various tax management positions from March 1998 to December 2006.
Mr. Leon is the Treasurer of Brink’s.Company’s Treasurer. Mr. Leon was hired in June 2008 and appointed to this position in July 2008. Before joining Brink’s, Mr. Leon was the Assistant Treasurer for Universal Corporation, a leaf tobacco merchant and processor, from January 2007 to June 2008. Prior to this position, Mr. Leon was the Assistant Treasurer for Brink’sthe Company from July 2005 to January 2007.
Ms. Landry was appointed Vice President-Tax of the Company in July 2009. Prior to this position, Mr. Leon had held various financial management positions withMs. Landry was Director of Taxes and Chief Tax Counsel of Brink’s from February 1998December 2006 to July 2005.2009.
Mr. McCullough was appointed Secretary of Brink’sthe Company on July 10, 2009. Prior to this position, Mr. McCullough was Assistant General Counsel and Director of Corporate Governance and Compliance of Brink’s from October 2006 to July 2009, and served as Assistant Secretary from July 2007 to July 2009. Prior to this position, Mr. McCullough had held various internal counsel positions with Brink’s from July 2003 to October 2006.
ITEM 5. MARKET FOR REGISTRANT’S COMMON EQUITY, RELATED STOCKHOLDER MATTERS AND ISSUER PURCHASES OF EQUITY SECURITIES
Our common stock trades on the New York Stock Exchange under the symbol “BCO.” As of February 17, 2011,2012, there were 1,8961,859 shareholders of record of common stock.
The dividends declared and the high and low prices of our common stock for each full quarterly period within the last two years are as follows:
| | | 2010 Quarters | | | 2009 Quarters | |
| | | 1st | | | 2nd | | | 3rd | | | 4th | | | 1st | | | 2nd | | | 3rd | | | 4th | |
| | | | | | | | | | | | | | | | | | | | | | | | | |
| Dividends declared per common share | | $ | 0.1000 | | | | 0.1000 | | | | 0.1000 | | | | 0.1000 | | | $ | 0.1000 | | | | 0.1000 | | | | 0.1000 | | | | 0.1000 | |
| Stock prices: | | | | | | | | | | | | | | | | | | | | | | | | | | | | | | | | |
High | | $ | 28.93 | | | | 29.59 | | | | 23.75 | | | | 27.42 | | | $ | 32.36 | | | | 31.28 | | | | 30.66 | | | | 26.89 | |
Low | | | 23.37 | | | | 19.00 | | | | 18.30 | | | | 22.55 | | | | 20.73 | | | | 25.79 | | | | 25.00 | | | | 22.23 | |
| | | | | 2011 Quarters | | 2010 Quarters | |
| | | | 1 st | | 2 nd | | 3 rd | 4 th | | | 1 st | | 2 nd | | 3 rd | 4 th | |
| | | | | | | | | | | | | | | | | | | |
| | Dividends declared per common share | $ | 0.1000 | | 0.1000 | | 0.1000 | 0.1000 | | $ | 0.1000 | | 0.1000 | | 0.1000 | 0.1000 | |
| | Stock prices: | | | | | | | | | | | | | | | | |
| | | High | $ | 33.24 | | 34.46 | | 31.91 | 31.37 | | $ | 28.93 | | 29.59 | | 23.75 | 27.42 | |
| | | Low | | 26.24 | | 26.75 | | 21.71 | 21.53 | | | 23.37 | | 19.00 | | 18.30 | 22.55 | |
See note 16 to the consolidated financial statements for a description of limitations of our ability to pay dividends in the future.
The following graph compares the cumulative 5-year total return provided to shareholders onof The Brink’s Company’s common stock compared to the cumulative total returns of the S&P Midcap 400 index and the S&P Midcap 400 Commercial Services & Supplies Index. The graph tracks the performance of a $100 investment in our common stock and in each index from December 31, 2005,2006, through December 31, 2010.2011. The performance of theThe Brink’s Company’s common stock assumes that the shareholder reinvested all dividends received during the period and reinvested the proceeds of a hypothetical sale of shares received from the spin-off of our former monitored security business on October 31, 2008. The graphs presented in the Form 10-Ks for 2009 and 2010 incorrectly overstated the company’s cumulative total returns for the years after 2007 for the spin-off. The graphs correctly assumed a reinvestment of the hypothetical sale of shares received in the spin-off, but incorrectly assumed a proportionate retroactive decline in all of the stock prices in the period before the October 31, 2008 spin-off. The graph below corrects this error.

*$100 invested on 12/31/06 in stock or index, including reinvestment of dividends.
Fiscal year ending December 31.
Copyright© 2012 S&P, a division of The McGraw-Hill Companies Inc. All rights reserved.
Source –Source: Zacks Investment Research, Data Group, Inc.
Comparison of Five-Year Cumulative Total Return Among
Brink’s Common Stock, the S&P MidCap 400 Index and
the S&P Midcap 400 Commercial Services & Supplies Index (1)
| | | Years Ended December 31, |
| | | 2005 | 2006 | 2007 | 2008 | 2009 | 2010 |
| | | | | | | | |
| The Brink's Company | $ | 100.00 | 133.94 | 125.89 | 177.49 | 163.11 | 183.27 |
| S&P Midcap 400 Index | | 100.00 | 110.32 | 119.12 | 75.96 | 104.36 | 132.16 |
| S&P Midcap 400 Commercial Services & Supplies Index | $ | 100.00 | 118.13 | 135.34 | 92.16 | 110.37 | 136.57 |
| Copyright © 2011, Standard & Poor's, a division of The McGraw-Hill Companies, Inc. All rights reserved. |
| | | | Years Ended December 31, | |
| | | | 2006 | | 2007 | | 2008 | | 2009 | | 2010 | | 2011 | |
| | | | | | | | | | | | | | | |
| | The Brink's Company | $ | 100.00 | | 93.98 | | 76.63 | | 70.42 | | 79.13 | | 80.27 | |
| | S&P Midcap 400 Index | | 100.00 | | 107.97 | | 68.84 | | 94.57 | | 119.77 | | 117.68 | |
| | S&P Midcap 400 Commercial Services & Supplies Index | | 100.00 | | 102.12 | | 76.09 | | 91.59 | | 111.71 | | 121.63 | |
| | Copyright © 2011, Standard & Poor's, a division of The McGraw-Hill Companies, Inc. All rights reserved. | |
| (1) | For the line designated as “The Brink’s Company” the graph depicts the cumulative return on $100 invested in The Brink’s Company’s common stock. For the S&P Midcap 400 Index and the S&P Midcap 400 Commercial Services & Supplies Index, cumulative returns are measured on an annual basis for the periods from December 31, 2005,2006, through December 31, 2010,2011, with the value of each index set to $100 on December 31, 2005.2006. Total return assumes reinvestment of dividends and the reinvestment of proceeds from the sale of the shares received related to the spin-off of our former monitored security business on October 31, 2008. We chose the S&P Midcap 400 Index and the S&P Midcap 400 Commercial Services & Supplies Index because we are included in these indices, which broadly measure the performance of mid-size companies in the United States market. |
ITEM 6. SELECTED FINANCIAL DATA
Five Years in Review
| (In millions, except per share amounts) | | 2010 | | | 2009 | | | 2008 | | | 2007 | | | 2006 | | | 2011 | | | 2010 | | | 2009 | | | 2008 | | | 2007 | |
| | | | | | | | | | | | | | | | | | | | | | | | | | | | | | | |
| Revenues and Income | | | | | | | | | | | | | | | | | | | | | | | | | | | | | | |
| | | | | | | | | | | | | | | | | | | | | | | | | | | | | | | |
| Revenues | | $ | 3,121.5 | | | | 3,135.0 | | | | 3,163.5 | | | | 2,734.6 | | | | 2,354.3 | | | $ | 3,885.5 | | | | 3,121.5 | | | | 3,135.0 | | | | 3,163.5 | | | | 2,734.6 | |
| | | | | | | | | | | | | | | | | | | | | | | | | | | | | | | | | | | | | | | | | |
| Segment operating profit | | $ | 208.9 | | | | 213.4 | | | | 271.9 | | | | 223.3 | | | | 184.1 | | | $ | 231.1 | | | | 208.9 | | | | 213.4 | | | | 271.9 | | | | 223.3 | |
| Non-segment income (expense) | | | (62.6 | ) | | | (46.6 | ) | | | (43.4 | ) | | | (62.3 | ) | | | (73.4 | ) | | | (59.8 | ) | | | (62.6 | ) | | | (46.6 | ) | | | (43.4 | ) | | | (62.3 | ) |
| Operating profit | | $ | 146.3 | | | | 166.8 | | | | 228.5 | | | | 161.0 | | | | 110.7 | | | $ | 171.3 | | | | 146.3 | | | | 166.8 | | | | 228.5 | | | | 161.0 | |
| | | | | | | | | | | | | | | | | | | | | | | | | | | | | | | | | | | | | | | | | |
| Income attributable to Brink’s: | | | | | | | | | | | | | | | | | | | | | | | | | | | | | | | | | | | | | | | | |
| Income from continuing operations | | | 56.8 | | | | 195.7 | | | | 131.8 | | | | 78.4 | | | | 53.1 | | | | 73.0 | | | | 56.8 | | | | 195.7 | | | | 131.8 | | | | 78.4 | |
| Income from discontinued operations (a) | | | 0.3 | | | | 4.5 | | | | 51.5 | | | | 58.9 | | | | 534.1 | | | | 1.5 | | | | 0.3 | | | | 4.5 | | | | 51.5 | | | | 58.9 | |
| Net income attributable to Brink’s | | $ | 57.1 | | | | 200.2 | | | | 183.3 | | | | 137.3 | | | | 587.2 | | | $ | 74.5 | | | | 57.1 | | | | 200.2 | | | | 183.3 | | | | 137.3 | |
| | | | | | | | | | | | | | | | | | | | | | |
| Financial Position | | | | | | | | | | | | | | | | | | | | | |
| | | | | | | | | | | | | | | | | | | | | | | | | | | | | | | | | | | | | | | | |
| | | | | | | | | | | | | | | | | | | | | | | | | | | | | | | | | | | | | | | | | |
| Property and equipment, net | | $ | 698.9 | | | | 549.5 | | | | 534.0 | | | | 1,118.4 | | | | 981.9 | | | $ | 749.2 | | | | 698.9 | | | | 549.5 | | | | 534.0 | | | | 1,118.4 | |
| Total assets | | | 2,270.5 | | | | 1,879.8 | | | | 1,815.8 | | | | 2,394.3 | | | | 2,188.0 | | | | 2,406.2 | | | | 2,270.5 | | | | 1,879.8 | | | | 1,815.8 | | | | 2,394.3 | |
| Long-term debt, less current maturities | | | 323.7 | | | | 172.3 | | | | 173.0 | | | | 89.2 | | | | 126.3 | | | | 335.3 | | | | 323.7 | | | | 172.3 | | | | 173.0 | | | | 89.2 | |
| Brink’s shareholders’ equity | | | 516.2 | | | | 534.9 | | | | 214.0 | | | | 1,046.3 | | | | 753.8 | | | | 408.0 | | | | 516.2 | | | | 534.9 | | | | 214.0 | | | | 1,046.3 | |
| | | | | | | | | | | | | | | | | | | | | | | | | | | | | | | | | | | | | | | | | |
| Supplemental Information | | | | | | | | | | | | | | | | | | | | | | | | | | | | | | | | | | | | | | | | |
| | | | | | | | | | | | | | | | | | | | | | | | | | | | | | | | | | | | | | | | | |
| Depreciation and amortization | | $ | 136.6 | | | | 135.1 | | | | 122.3 | | | | 110.0 | | | | 93.0 | | | $ | 162.4 | | | | 136.6 | | | | 135.1 | | | | 122.3 | | | | 110.0 | |
| Capital expenditures | | | 148.8 | | | | 170.6 | | | | 165.3 | | | | 141.8 | | | | 113.8 | | | | 196.2 | | | | 148.8 | | | | 170.6 | | | | 165.3 | | | | 141.8 | |
| | | | | | | | | | | | | | | | | | | | | | | | | | | | | | | | | | | | | | | | | |
| Earnings per share attributable to Brink’s common shareholders | | | | | | | | | | | | | | | | | | | | | | | | | | | | | | | | | | | | | | | | |
| | | | | | | | | | | | | | | | | | | | | | | | | | | | | | | | | | | | | | | | | |
| Basic: | | | | | | | | | | | | | | | | | | | | | | | | | | | | | | | | | | | | | | | | |
Continuing operations | | $ | 1.18 | | | | 4.14 | | | | 2.85 | | | | 1.68 | | | | 1.06 | | | $ | 1.52 | | | | 1.18 | | | | 4.14 | | | | 2.85 | | | | 1.68 | |
Discontinued operations (a) | | | 0.01 | | | | 0.10 | | | | 1.11 | | | | 1.27 | | | | 10.69 | | | | 0.03 | | | | 0.01 | | | | 0.10 | | | | 1.11 | | | | 1.27 | |
Net income | | $ | 1.18 | | | | 4.23 | | | | 3.96 | | | | 2.95 | | | | 11.75 | | | $ | 1.56 | | | | 1.18 | | | | 4.23 | | | | 3.96 | | | | 2.95 | |
| | | | | | | | | | | | | | | | | | | | | | | | | | | | | | | | | | | | | | | | | |
| Diluted: | | | | | | | | | | | | | | | | | | | | | | | | | | | | | | | | | | | | | | | | |
Continuing operations | | $ | 1.17 | | | | 4.11 | | | | 2.82 | | | | 1.67 | | | | 1.05 | | | $ | 1.52 | | | | 1.17 | | | | 4.11 | | | | 2.82 | | | | 1.67 | |
Discontinued operations (a) | | | 0.01 | | | | 0.10 | | | | 1.10 | | | | 1.25 | | | | 10.58 | | | | 0.03 | | | | 0.01 | | | | 0.10 | | | | 1.10 | | | | 1.25 | |
Net income | | $ | 1.18 | | | | 4.21 | | | | 3.93 | | | | 2.92 | | | | 11.64 | | | $ | 1.55 | | | | 1.18 | | | | 4.21 | | | | 3.93 | | | | 2.92 | |
| | | | | | | | | | | | | | | | | | | | | | | | | | | | | | | | | | | | | | | | | |
| Cash dividends | | $ | 0.4000 | | | | 0.4000 | | | | 0.4000 | | | | 0.3625 | | | | 0.2125 | | | $ | 0.4000 | | | | 0.4000 | | | | 0.4000 | | | | 0.4000 | | | | 0.3625 | |
| | | | | | | | | | | | | | | | | | | | | | | | | | | | | | | | | | | | | | | | | |
| Weighted-average Shares | | | | | | | | | | | | | | | | | | | | | | | | | | | | | | | | | | | | | | | | |
| | | | | | | | | | | | | | | | | | | | | | | | | | | | | | | | | | | | | | | | | |
| Basic | | | 48.2 | | | | 47.2 | | | | 46.3 | | | | 46.5 | | | | 50.0 | | | | 47.8 | | | | 48.2 | | | | 47.2 | | | | 46.3 | | | | 46.5 | |
| Diluted | | | 48.4 | | | | 47.5 | | | | 46.7 | | | | 47.0 | | | | 50.5 | | | | 48.1 | | | | 48.4 | | | | 47.5 | | | | 46.7 | | | | 47.0 | |
| (a) | Income from discontinued operations reflects the operations and gains and losses, if any, on disposal of our former home security and air freight businesses. Expenses related to postretirementretirement obligations are recorded as a component of continuing operations after the respective disposal dates. Adjustments to contingent liabilities are recorded within discontinued operations. |
ITEM 7. MANAGEMENT’S DISCUSSION AND ANALYSIS OF FINANCIAL CONDITION AND RESULTS OF OPERATIONS
THE BRINK’S COMPANY
MANAGEMENT’S DISCUSSION AND ANALYSIS OF
FINANCIAL CONDITION AND RESULTS OF OPERATIONS
FOR THE YEAR ENDED DECEMBER 31, 20102011
| | TABLE OF CONTENTS | |
| | | |
| | | Page |
| OPERATIONS | 21 |
| | | |
| RESULTS OF OPERATIONS | |
| | Consolidated Review | 2425 |
| | Segment Operating Results | 2728 |
| | Non-segment Income (Expense) | 3435 |
| | Other Operating Income (Expense) | 3536 |
| | Nonoperating Income (Expense)and Expense | 3637 |
| | Income Taxes | 3738 |
| | Noncontrolling Interests | 3839 |
| | Income from Discontinued Operations | 3940 |
| | Summary of Selected Results and Outlook | 4041 |
| | Non-GAAP Results – Reconciled to Amounts Reported under GAAP | 4142 |
| | Foreign Operations | 4345 |
| | | |
| LIQUIDITY AND CAPITAL RESOURCES | |
| | Overview | 44 |
| Summary Cash Flow Information | 4446 |
| | Operating Activities | 4546 |
| | Investing Activities | 4648 |
| | Financing Activities | 4749 |
| | Capitalization | 4849 |
| | Off Balance Sheet Arrangements | 5052 |
| | Contractual Obligations | 5153 |
| | Contingent Matters | 5456 |
| | | |
| APPLICATION OF CRITICAL ACCOUNTING POLICIES | |
| | Deferred Tax Asset Valuation Allowance | 5557 |
| | Goodwill, Other Intangible Assets and Property and Equipment Valuations | 5658 |
| | Retirement and Postemployment Benefit Obligations | 5759 |
| | Foreign Currency Translation | 6264 |
| | | |
| RECENT ACCOUNTING PRONOUNCEMENTS | 6466 |
The Brink’s Company offers transportation and logistics management services for cash and valuables throughout the world. These services include:
| · | armored car transportation, which is also knownwe refer to as cash in transit (“CIT”) |
| · | automated teller machine (“ATM”) - replenishment and servicing, network infrastructure services |
| · | arranging secure transportation of valuables over long distances and around the world (“Global Services”) |
· | security and guarding services (including airport security) |
| · | currency deposit processing and cash management services. Cash management services include cash logistics services (“Cash Logistics”), deploying and servicing safes and safe control devices (e.g., our patented CompuSafe® service), coin sorting and wrapping, integrated check and cash processing services (“Virtual Vault Services”) |
| · | providing bill payment acceptance and processing services to utility companies and other billers (“Payment Services”) |
| · | security and guarding services (including airport security) |
Overview of ResultsExecutive Summary
Non-GAAP Financial Measures
We provide an analysis of our operations below on both a generally accepted accounting principleprinciples (“GAAP”) and non-GAAP basis. The purpose of the non-GAAP information is to report our financial information
| · | without certain income and expense items in 2008, 2009, 2010 and 2010,2011, |
| · | as if our results from Venezuela had been translated at the less-favorable parallel exchange rate in 2008 and 2009, and |
| · | after adjusting tax expense for certain items. |
The non-GAAP financial measures are intended to provide information to assist comparability and estimates of future performance. The adjustments are described in detail and are reconciled to our GAAP results on pages 41- 42.42–44.
2011 versus 2010
GAAP
Our revenues increased $764 million or 24% and our operating profit increased $25 million or 17% in 2011. Revenues increased due to our 2010 acquisitions in Mexico and Canada, organic growth in our International segment and favorable changes in currency exchange rates. Operating profit increased primarily due to the factors described below.
Our income from continuing operations in 2011 increased 29% compared to 2010 primarily due to:
| · | higher operating profit from: |
| · | the positive impact of changes in currency exchange rates ($14 million), |
| · | organic improvement in Latin America ($12 million), |
| · | 2011 net gains on acquisitions and asset dispositions ($10 million), |
| · | 2010 net losses related to an acquisition ($9 million), |
| · | lower losses from the 2010 exit ($6 million) and deconsolidation ($13 million) of the Belgium CIT business, and |
| · | the impact of our 2010 acquisition in Mexico, as well as |
| · | lower tax expense due to an income tax charge in 2010 related to U.S. healthcare legislation ($14 million). |
These positive factors more than offset:
| · | lower operating profit from: |
| · | lower profits in North America ($13 million), |
| · | a 2011 settlement loss related to the Belgium bankruptcy ($10 million), and |
| · | lower royalty income from our former home security business ($5 million), |
| · | increased borrowing costs ($9 million), |
| · | higher net income attributable to noncontrolling interests ($8 million). |
Segment results also reflected increased security costs across all regions.
Our earnings per share from continuing operations was $1.52, up from $1.17 in 2010.
Non-GAAP
Our revenues increased $764 million or 24% and our operating profit increased $18 million or 9% in 2011. Revenues increased due to our acquisitions in Mexico and Canada, organic growth in our International segment and favorable changes in currency exchange rates. Operating profit increased primarily due to the factors described below.
Our income from continuing operations in 2011 decreased 5% primarily due to:
| · | lower operating profit in North America ($9 million), |
| · | increased borrowing costs ($9 million), and |
| · | higher net income attributable to noncontrolling interests ($6 million). |
These negative factors more than offset higher operating profit from:
| · | organic improvement in Latin America ($13 million), |
| · | the positive impact of currency exchange rates ($10 million), |
| · | lower losses from the 2010 exit of the Belgium CIT business ($6 million), and |
| · | the impact of our 2010 acquisition in Mexico. |
Segment results also reflected increased security costs across all regions.
Our earnings per share from continuing operations was $1.90, down from $1.99 in 2010.
2010 versus 2009
GAAP Basis:
Our revenues were slightly lowerdecreased $14 million or less than 20091% and our operating profit declined $21 million or 12% in 2010. Our earnings per share from continuing operations was $1.17, down from $4.11 last year. Revenues were lower mainly due to the unfavorable impact of currency effectsexchange rates related primarily to a change in the way we translate our Venezuelan results to U.S. dollars. Revenues also declined due to exiting a French guarding business in 2009 and a CIT business in Belgium in 2010. Revenues were favorably affected in 2010 by organic growth in our International segment and incremental revenues from the acquisition of a CIT business in Mexico. Operating profit declined primarily due to the factors described below.
Our earningsincome from continuing operations in 2010 werewas lower than 2009 primarily because of a $118 million income tax valuation allowance reversal in 2009, lower profits in Ven ezuela as a result of a change in the way we translate those results, a $14 million gain in 2009 related to an acquisition in India, a $14 million income tax charge in 2010 related to U.S. healthcare legislation, $13 million of losses recognized related to the exit of the CIT business in Belgium, and a $9 million net loss related to the 2010 Mexican acquisition. Profits in North America were due to:
| · | an income tax valuation allowance reversal in 2009 ($118 million), |
| · | lower operating profit from: |
| · | an unfavorable currency effect ($44 million), related primarily to the reporting of 2010 results from Venezuela at a less favorable exchange rate, |
| · | a gain in 2009 related to an acquisition in India ($14 million), |
| · | losses recognized related to the exit of the CIT business in Belgium ($13 million), |
| · | lower profits in North America ($13 million), |
| · | a net loss related to the 2010 Mexican acquisition ($9 million), and |
| · | lower gains on sales of assets ($8 million), as well as |
| · | an income tax charge in 2010 related to U.S. healthcare legislation ($14 million). |
These negative factors more than 2009 on price and volume pressure. Our earnings in 2010 were favorably affected by offset:
| · | higher operating profit from |
| · | organic improvements in Latin America ($50 million) and |
| · | organic improvements in Europe ($25 million), as well as |
| · | a non-cash income tax benefit related to an income tax settlement ($7 million). |
Segment results also reflected improved Global Services performance around the world,and lower safety and security losses and higher profitscosts in Europe.all regions.
Our earnings per share from continuing operations was $1.17, down from $4.11 in 2009.
Non-GAAP Basis:
Our revenues increased $224 million or 8% and our operating profit increased $47$50 million or 39%36% in 2010. Our earnings per share from continuing operations was $1.71, up from $1.16 last year. Revenues increased mainly due to improved performance on an organic basis in our International segment, reflecting higher inflation-based prices. Revenues were also helpedprice increases in Latin America fromAmerica. Revenues also increased due to the acquisition of a Mexican CIT business in Mexico, partially offset by exiting a French guarding business in France during 2009 and a CIT business in Belgium induring 2010. Operating profit increased due to the factors described below.
Our earningsincome from continuing operations in 2010 were favorably affected by improved Global Services performance around the world, lower safety and security losses,was higher profits in Europe, and organic improvements in Latin America. Profits in North America were lo wer than 2009 on price and volume pressure.
2009 versus 2008
GAAP basis: Our revenues and operating profit declined in 2009. Our segment margin declined in an environment that was extremely difficult for customers in the banking, retail, and diamond and jewelry sectors. The operating profit decline was primarily due to a highly profitable monetary conversion project in Venezuela in 2008, a $23 million repatriation charge and higher retirement expenses, partially offset by a $14 million gain on an acquisition in India. The $23 million repatriation charge was the result of our decision to repatriate 76 million bolivar fuertes from our Venezuelan operations at the parallel market rate. In addition, acquired businesses helped revenues and operating profit in 2009.from:
| · | higher profits in Europe ($27 million), and |
| · | organic improvement in Latin America ($18 million). |
Non-GAAP basis: Our revenues and
These positive factors were offset by lower operating profit declined in 2009. RevenuesNorth America.
Segment results also reflected improved Global Services performance and lower security costs in 2009 decreased primarily due to unfavorable changes in currency exchange rates, partially offset by the net positive effect of businesses acquired and disposed in 2009. The operating profit declineall regions.
Our earnings per share from continuing operations was primarily due to a highly profitable monetary conversion project in Venezuela in 2008 and higher severance and restructuring costs$1.99, up from $1.40 in 2009.
Outlook for 20112012
GAAP
Our organic revenue growth rate for 20112012 is expected to be in the mid-to-high single-digit range. After factoring in $450 million of acquisition-related revenue from Mexico5% to 8% range, and Canada at approximately break-even margin rates, our 2011operating segment operating profit margin is expected to be onin the high end6.5% to 7.0% range. Our International organic revenue growth rate for 2012 is expected to be in the 7% to 10% range, and our International segment margin is expected to be in the 7.0% to 8.0% range. Our North America organic revenue growth rate for 2012 is expected to be flat, and our North America segment margin is expected to be in the 3.6% to 4.6% range.
Non-GAAP
Our outlook for non-GAAP revenues is the same as our outlook for GAAP revenues.
Our operating segment margin is expected to be in the 6.5% to 7.0% range. Our International segment margin is expected to be in the 7.0% to 8.0% range and our North America segment margin is expected to be in the 4.5% to 5.5% range.
During 2012, we intend to pursue higher margin business opportunities and continue to invest in information technology. We expect continued profit growth in Mexico and the rest of a range between 6.5%Latin America during 2012. We expect North America and 7.0%.Europe to improve margins in 2012, and we expect our Global Services growth to continue across all regions. See page 4041 for a summary of our 20112012 Outlook.
Definition of Organic Growth
Organic growth represents the change in revenues or operating profit between the current and prior period, excluding the effect of the following items: acquisitions and dispositions, changes in currency effectsexchange rates (as described on page 27),28) and the 2010 remeasurement of net monetary assets in Venezuela under highly inflationary accounting.
Business and Strategy Overview
We have four geographic operating segments: Europe, Middle East, and Africa (“EMEA”); Latin America; Asia Pacific; and North America, which are aggregated into two reportable segments: International and North America. Our North America segment includes operations in the U.S. and Canada. Our newly acquired Mexican operation is included in our Latin American operating segment.
We believe that Brink’s has significant competitive advantages including:
| · | reputation for a high level of service and security |
| · | risk management and logistics expertise |
| · | global infrastructure and customer base |
| · | proprietary cash processing and information systems |
| · | proven operational excellence |
| · | high-quality insurance coverage and general financial strength |
We focus our time and resources on service quality, protecting and strengthening our brand, and addressing our risks. We are a premium provider of services in most of the markets we serve. Our marketing and sales efforts are enhanced by the “Brink’s” brand, so we seek to protect and build its value. Since our services focus on handling, transporting, protecting, and managing valuables, we strive to understand and manage risk. Overlaying our approach is an understanding that we must be disciplined and patient enough to charge prices that reflect the value provided, the risk assumed and the need for an adequate return for our investors.
Business environments around the world change constantly. We must adapt to changes in competitive landscapes, regional economies and each customer’s level of business. We balance underlying business risk and the effects of changing demand on the utilization of our resources. As a result, we operate largely on a decentralized basis so local management can react quickly to changes in the business environment.
We measure financial performance on a long-term basis. The key financial measures are:
| · | Revenue and earnings growth |
These and similar measures are critical components of our incentive compensation plans and performance evaluations.
Because of our emphasis on managing risks while providing a high level of service, we focus our marketing and selling efforts on customers who appreciate the value and breadth of our services, information and risk management capabilities, and financial strength.
In order to earn an adequate return on capital, we focus on the effective and efficient use of resources as well as appropriate pricing levels. We attempt to maximize the amount of business that flows through our branches, vehicles and systems in order to obtain the lowest costs possible without compromising safety, security or service. Due to our higher investment in people and processes, we generally charge higher prices than competitors that do not provide the same level of service and risk management.
The industries we serve have been consolidating. As a result, the demands and expectations of customers in these industries have grown. Customers are increasingly seeking suppliers, such as Brink’s, with broad geographic solutions, sophisticated outsourcing capabilities and financial strength.
Operating results may vary from period to period. Since revenues are generated from charges per service performed or based on the value of goods transported, they can be affected by both the level of economic activity and the volume of business for specific customers. As contracts generally run for one or more years, costs are incurred to prepare to serve, or to transition away, from a customer. We also periodically incur costs to reduce operations when volumes decline, including costs to reduce the number of employees and close or consolidate branch and administrative facilities. In addition, safety and security costs can vary depending on performance, cost of insurance coverage, and changes in crime rates (i.e., attacks and robberies).
Cash Logistics is a fully integrated solution that proactively manages the supply chain of cash from point-of-sale through bank deposit. The process includes cashier balancing and reporting, deposit processing and consolidation, and electronic information exchange (including “same-day” credit capabilities). Retail customers use Brink’s Cash Logistics services to count and reconcile coins and currency in a secure environment, to prepare bank deposit information, and to replenish customer coins and currency in proper denominations.
Because Cash Logistics involves a higher level of service and more complex activities, customers are charged higher prices, which result in higher margins. The ability to offer Cash Logistics to customers differentiates Brink’s from many of its competitors. Management is focused on continuing to grow Cash Logistics revenue.
Brink’s revenues and related operating profit are generally higher in the second half of the year, particularly in the fourth quarter, because of generally increased economic activity associated with the holiday season.
Former Operations
On October 31, 2008, we completed the tax-free spin-off of Brink’s Home Security Holdings, Inc. (“BHS”), a former monitored security business in North America. We have reported the earnings and cash flows of these operations within discontinued operations for all periods presented.
Businesses
We have significant liabilities associated with our former coal operations, primarily related to retirement plans, which are partially funded by plan trusts. These trusts sustained significant market losses during the second half of 2008.
Information about our liabilities related to former operations is contained in the following sections of this report:
| · | Non-segment Income (Expense) on page 3435 |
| · | Liquidity and Capital Resources – Contractual Obligations – on page 5153 |
| · | Application of Critical Accounting Policies – on page 5557 |
| · | Notes 3 and 17 to the consolidated financial statements, which begin on page 87 |
| | | GAAP | | | % Change | | | Non-GAAP | | | % Change | |
| Years Ended December 31, | | 2010 | | | 2009 | | | 2008 | | | 2010 | | | 2009 | | | 2010 | | | 2009 | | | 2008 | | | 2010 | | | 2009 | |
| (In millions, except per share amounts) | | | | | | | | | | | | | | | | | | | | | | | | | | | | | | |
| | | | | | | | | | | | | | | | | | | | | | | | | | | | | | | |
| Revenues | | $ | 3,122 | | | | 3,135 | | | | 3,164 | | | | - | | | | (1 | ) | | $ | 3,122 | | | | 2,897 | | | | 2,990 | | | | 8 | | | | (3 | ) |
Segment operating profit (a) | | | 209 | | | | 213 | | | | 272 | | | | (2 | ) | | | (22 | ) | | | 226 | | | | 175 | | | | 223 | | | | 29 | | | | (22 | ) |
Non-segment expense | | | (63 | ) | | | (47 | ) | | | (43 | ) | | | 34 | | | | 7 | | | | (59 | ) | | | (55 | ) | | | (58 | ) | | | 6 | | | | (4 | ) |
Operating profit | | | 146 | | | | 167 | | | | 229 | | | | (12 | ) | | | (27 | ) | | | 167 | | | | 120 | | | | 166 | | | | 39 | | | | (28 | ) |
| Income from continuing operations (b) | | | 57 | | | | 196 | | | | 132 | | | | (71 | ) | | | 48 | | | | 83 | | | | 55 | | | | 98 | | | | 51 | | | | (44 | ) |
| Diluted EPS from continuing operations (b) | | | 1.17 | | | | 4.11 | | | | 2.82 | | | | (72 | ) | | | 46 | | | | 1.71 | | | | 1.16 | | | | 2.10 | | | | 47 | | | | (45 | ) |
| | | | | | | | | | | | | | | | | | | | | | | | | |
| | | | | GAAP | | % Change | | | Non-GAAP (c) | | % Change | |
| | Years Ended December 31, | | 2011 | | 2010 | | 2009 | | 2011 | | 2010 | | | 2011 | | 2010 | | 2009 | | 2011 | | 2010 | |
| | (In millions, except per share amounts) | | | | | | | | | | | | | | | | | | | | | | |
| | | | | | | | | | | | | | | | | | | | | | | | | |
| | Revenues | $ | 3,885.5 | | 3,121.5 | | 3,135.0 | | 24 | | - | | $ | 3,885.5 | | 3,121.5 | | 2,897.1 | | 24 | | 8 | |
| | | Segment operating profit (a) | | 231.1 | | 208.9 | | 213.4 | | 11 | | (2) | | | 246.5 | | 224.5 | | 172.9 | | 10 | | 30 | |
| | | Non-segment expense | | (59.8) | | (62.6) | | (46.6) | | (4) | | 34 | | | (40.6) | | (36.2) | | (34.7) | | 12 | | 4 | |
| | | Operating profit | | 171.3 | | 146.3 | | 166.8 | | 17 | | (12) | | | 205.9 | | 188.3 | | 138.2 | | 9 | | 36 | |
| | Income from continuing operations (b) | | 73.0 | | 56.8 | | 195.7 | | 29 | | (71) | | | 91.6 | | 96.4 | | 66.7 | | (5) | | 45 | |
| | Diluted EPS from continuing operations (b) | | 1.52 | | 1.17 | | 4.11 | | 30 | | (72) | | | 1.90 | | 1.99 | | 1.40 | | (5) | | 42 | |
Amounts may not add due to rounding.
| (a) | Segment operating profit is a non-GAAP measure when presented in any context other than prescribed by Accounting Standards Codification Topic 280, Segment Reporting. The tables on pages 4128 and 4231 reconcile the measurement to operating profit, a GAAP measure. Disclosure of total segment operating profit enables investors to assess the total operating performance of Brink’s excluding non-segment income and expense. Forward-looking estimates related to total segment operating profit and non-segment income (expense) for 20112012 are provided on page 40.41. |
| (b) | Amounts reported in this table are attributable to the shareholders of Brink’s and exclude earnings related to noncontrolling interests. |
| (c) | Non-GAAP earnings information is contained on pages 42 –44, including reconciliation to amounts reported under GAAP. |
Summary Reconciliation of Non-GAAP EPS
| | | | | | | | | | |
| Years Ended December 31, | | 2010 | | | 2009 | | | 2008 | |
| | | | | | | | | | |
| GAAP EPS | | $ | 1.17 | | | | 4.11 | | | | 2.82 | |
Exclude certain large deferred tax adjustments | | | 0.29 | | | | (2.48 | ) | | | - | |
Exclude Venezuela related items | | | 0.04 | | | | 0.04 | | | | (0.54 | ) |
Exclude acquisition and disposition-related items | | | 0.22 | | | | (0.52 | ) | | | (0.18 | ) |
| Non-GAAP EPS | | $ | 1.71 | | | | 1.16 | | | | 2.10 | |
| | Years Ended December 31, | | 2011 | | 2010 | | 2009 | |
| | | | | | | | | | | | | |
| | GAAP EPS | $ | 1.52 | | | 1.17 | | | 4.11 | | |
| | | Excludes U.S. retirement plan expenses | | 0.37 | | | 0.28 | | | 0.25 | | |
| | | Exclude costs related to former CEO retirement | | 0.05 | | | - | | | - | | |
| | | Exclude Belgium exit charges | | 0.13 | | | 0.16 | | | - | | |
| | | Exclude gains on asset sales, acquisitions and dispositions | | (0.20) | | | 0.12 | | | (0.43) | | |
| | | Exclude Venezuela related items | | - | | | - | | | 0.04 | | |
| | | U.S. healthcare legislation charge | | - | | | 0.29 | | | - | | |
| | | Exclude U.S. tax valuation allowance release | | - | | | - | | | (2.48) | | |
| | | Other | | 0.03 | | | (0.02) | | | (0.09) | | |
| | Non-GAAP EPS | $ | 1.90 | | | 1.99 | | | 1.40 | | |
Amounts may not add due to rounding. Non-GAAP results are reconciled in more detail to the applicable GAAP results on pages 41-42.42–44.
Revenues
Revenues in 2011 increased $764 million or 24% due to:
| · | our 2010 acquisitions in Mexico and Canada ($414 million), |
| · | organic growth in our International segment ($262 million), and |
| · | favorable exchange rate variances ($114 million); |
partially offset by the exit of unprofitable CIT business in Belgium ($30 million). See page 23 for our definition of “organic.”
Revenues increased 8% on an organic basis due mainly to higher average selling prices (including the effects of inflation in several Latin American countries).
Revenues in 2010 decreased $14 million or less than 1% primarily due to to:
| · | unfavorable changes in currency exchange rates ($273 million) related primarily to the reporting of 2010 results from Venezuela at a less favorable exchange rate. Revenues also were affected by the sale of guarding operations in France in 2009 ($48 million) and the exit of unprofitable CIT business in Belgium ($8 million), related primarily to the reporting of 2010 results from Venezuela at a less favorable exchange rate, |
| · | the sale of guarding operations in France in 2009 ($48 million), and |
| · | the exit of an unprofitable CIT business in Belgium ($8 million); |
partially offset by organic growth ($228 million) and the positive effect of businesses acquired in 2010 and 2009 ($88 million). See page 2223 for our definition of “organic.”
Revenues increased 7% on an organic basis due mainly to higher average selling prices (including the effects of inflationinflation-based price increases in several Latin American countries).
2009 versus 2008
Revenues in 2009 decreased 1% primarily due to unfavorable changes in currency exchange rates ($146 million), mostly offset by the net positive effect of businesses acquired in 2009, net of dispositions ($97 million) and organic growth.
Revenues increased 1% on an organic basis due mainly to higher average selling prices (including the effects of inflation in several Latin American countries), mostly offset by lower volumes in Global Services operations and the loss of guarding contracts in France.
Non-GAAP
2011 versus 2010
The analysis of non-GAAP revenues is the same as the analysis of GAAP revenues.
2010 versus 2009
Revenues in 2010 increased 8% primarily due to organic growth ($157 million) and revenues from businesses acquired in 2010 and 2009 ($88 million).
Revenues increased 5% on an organic basis due mainly to higher average selling prices (including the effects of inflationinflation-based price increases in several Latin American countries).
2009 versus 2008
Revenues in 2009 decreased 3% primarily due to unfavorable changes in currency exchange rates ($194 million), partially offset by the net positive effect of businesses acquired and disposed in 2009 ($97 million).
Revenues remained flat on an organic basis compared to 2008. Higher average selling prices (including the effects of inflation in several Latin American countries), were mostly offset by lower volumes in Global Services operations and the loss of guarding contracts in France.
Operating Profit
GAAP
2011 versus 2010
Operating profit increased 17% due mainly to:
| · | the positive impact of changes in currency exchange rates ($14 million), |
| · | organic improvement in Latin America ($12 million), |
| · | 2011 net gains on acquisitions and asset dispositions ($10 million), |
| · | 2010 net losses related to acquisitions ($9 million), |
| · | lower losses from the 2010 exit ($6 million) and deconsolidation ($13 million) of the Belgium CIT business, and |
| · | the impact of our 2010 acquisition in Mexico; |
partially offset by lower profits in North America ($13 million), a settlement loss related to the Belgium bankruptcy ($10 million), and lower royalties from our former home security business ($5 million).
Results were also affected by increased security costs in all regions.
2010 versus 2009
Operating profit decreased 12% due mainly to:
| · | an unfavorable currency effect ($44 million), related primarily to the reporting of 2010 results from Venezuela at a less favorable exchange rate, |
| · | expensesa $14 million gain in 2009 related to an acquisition in India, |
| · | losses recognized related to the exit of exiting an unprofitablethe CIT business in Belgium ($13 million), |
| · | lower profits in North America ($13 million), |
| · | a net loss related to a 2010 acquisition in Mexico ($9 million), and |
| · | higher non-segment expenses;lower gains related to asset sales ($8 million); |
partially offset by growth on an organic basis in our International segment.
2009 versus 2008
Operating profit decreased 27% due mainly to
· | the inclusion in 2008 results of profits from the monetary conversion project in Venezuela that was completed in 2008, |
· | a $12 million increase in restructuring and severance costs, primarily in Europe, |
· | $6 million in accounting corrections in Belgium, and |
· | higher non-segment expenses. |
Non-GAAP
2010 versus 2009
Operating profit increased 39%. The operating profit increase in the International segment more than offset the decline in North America. Results were also affected by price and volume pressure across most of our global markets.markets and lower security costs in all regions.
2009Non-GAAP
2011 versus 20082010
Operating profit decreased 28%increased 9% due mainly due toto:
| · | the inclusionorganic improvement in 2008 results of profits from the monetary conversion project in Venezuela that was completed in 2008,Latin America ($13 million), |
| · | a $12 million increase in restructuring and severance costs, primarily in Europe,positive impact of currency exchange rates ($10 million), |
| · | the exit from the Belgium CIT business ($6 million), and |
| · | $6 millionthe impact of our 2010 acquisition in accounting corrections in Belgium;Mexico. |
These positive factors more than offset lower profits in North America ($9 million).
Results were also affected by increased security costs in all regions.
2010 versus 2009
Operating profit increased 36% due mainly to growth on an organic basis in our International segment ($49 million), partially offset by lower non-segment expenses.profits in North America ($12 million).
Results were also affected by price and volume pressure across most of our global markets and lower security costs in all regions.
Income from continuing operations and Netnet income, and related per share amounts
(attributable to Brink’s)
GAAP
2011 versus 2010
Income from continuing operations and net income (and related per share amounts) was higher in 2011 compared to 2010. The above described positive factors affecting operating profit, as well as lower tax expense due to a $14 million income tax charge in 2010 related to U.S. healthcare legislation, were partially offset by increased borrowing costs ($9 million) and higher income attributable to noncontrolling interests ($8 million).
2010 versus 2009
Income from continuing operations and net income (and related per share amounts) was lower in 2010 compared to 2009. In addition to the above described factors affecting operating profit, income from continuing operations attributable to Brink’s and earnings per share decreased primarily due to a $118 million income tax valuation allowance reversal in 2009 and a $14 million income tax charge in 2010 related to U.S. healthcare legislation. These factors were partially offset by a $7 million non-cash income tax benefit related to an income tax settlement.
2009Non-GAAP
2011 versus 20082010
Income from continuing operations and net income (and related per share amounts) was higherlower in 20092011 compared to 20082010 primarily as a result of a release of a deferredincreased borrowing costs ($9 million), higher income attributable to noncontrolling interests ($6 million) and an increase in the non-GAAP tax valuation allowance, asrate which more fullythan offset higher operating profit described on page 55, partially offset by lower operating profits.above.
Non-GAAP
2010 versus 2009
Income from continuing operations and net income (and related per share amounts) was higher in 2010 compared to 2009 primarily as a result of better performance of our International segment.
2009 versus 2008
Income from continuing operations and net income (and related per share amounts) was lower in 2009 compared to 2008 primarily as a result of lowerthe higher operating profits.
profit described above.
Segment Operating Results
Segment Review
20102011 versus 20092010
GAAP
| | | | | | Organic | | | Acquisitions / | | | Currency | | | | | | % Change | |
| (In millions) | | 2009 | | | Change | | | Dispositions (b) | | | (c) | | | 2010 | | | Total | | | Organic | |
| Revenues: | | | | | | | | | | | | | | | | | | | | | |
EMEA | | $ | 1,258 | | | | 33 | | | | (45 | ) | | | (46 | ) | | | 1,200 | | | | (5 | ) | | | 3 | |
Latin America | | | 905 | | | | 171 | | | | 52 | | | | (250 | ) | | | 877 | | | | (3 | ) | | | 19 | |
Asia Pacific | | | 79 | | | | 18 | | | | 25 | | | | 5 | | | | 127 | | | | 61 | | | | 23 | |
International | | | 2,241 | | | | 222 | | | | 32 | | | | (290 | ) | | | 2,204 | | | | (2 | ) | | | 10 | |
North America | | | 894 | | | | 7 | | | | - | | | | 17 | | | | 918 | | | | 3 | | | | 1 | |
Total | | $ | 3,135 | | | | 228 | | | | 32 | | | | (273 | ) | | | 3,122 | | | | - | | | | 7 | |
| | | | | | | | | | | | | | | | | | | | | | | | | | | | | |
| Operating profit: | | | | | | | | | | | | | | | | | | | | | | | | | | | | |
International | | $ | 157 | | | | 80 | | | | (4 | ) | | | (68 | ) | | | 165 | | | | 5 | | | | 51 | |
North America | | | 57 | | | | (13 | ) | | | - | | | | 1 | | | | 44 | | | | (22 | ) | | | (24 | ) |
Segment operating profit | | | 213 | | | | 67 | | | | (4 | ) | | | (67 | ) | | | 209 | | | | (2 | ) | | | 31 | |
Non-segment (a) | | | (47 | ) | | | (15 | ) | | | (24 | ) | | | 23 | | | | (63 | ) | | | 34 | | | | 32 | |
Total | | $ | 167 | | | | 52 | | | | (28 | ) | | | (44 | ) | | | 146 | | | | (12 | ) | | | 31 | |
| | | | | | | | | | | | | | | | | | | | | | | | | | | | | |
| Segment operating margin: | | | | | | | | | | | | | | | | | | | | | | | | | | | | |
International | | | 7.0 | % | | | | | | | | | | | | | | | 7.5 | % | | | | | | | | |
North America | | | 6.3 | % | | | | | | | | | | | | | | | 4.8 | % | | | | | | | | |
Segment operating margin | | | 6.8 | % | | | | | | | | | | | | | | | 6.7 | % | | | | | | | | |
| | GAAP | | | | | | | | | | | | | | | | |
| | | | | | | | Organic | | Acquisitions / | | Currency | | | | % Change | |
| | (In millions) | | | 2010 | | Change | | Dispositions (b) | | (c) | | 2011 | | Total | | Organic | |
| | Revenues: | | | | | | | | | | | | | | | | |
| | | International: | | | | | | | | | | | | | | | | |
| | | | Latin America | | $ | 877.4 | | 181.9 | | 363.8 | | 37.6 | | 1,460.7 | | 66 | | 21 | |
| | | | EMEA | | | 1,199.8 | | 58.9 | | (24.5) | | 62.7 | | 1,296.9 | | 8 | | 5 | |
| | | | Asia Pacific | | | 126.5 | | 21.5 | | - | | 5.7 | | 153.7 | | 22 | | 17 | |
| | | | | International | | | 2,203.7 | | 262.3 | | 339.3 | | 106.0 | | 2,911.3 | | 32 | | 12 | |
| | | | | North America | | | 917.8 | | 0.2 | | 48.5 | | 7.7 | | 974.2 | | 6 | | - | |
| | | | | | Total | | $ | 3,121.5 | | 262.5 | | 387.8 | | 113.7 | | 3,885.5 | | 24 | | 8 | |
| | | | | | | | | | | | | | | | | | | | | | |
| | Operating profit: | | | | | | | | | | | | | | | | |
| | | International | | $ | 164.8 | | 10.1 | | 11.8 | | 13.0 | | 199.7 | | 21 | | 6 | |
| | | North America | | | 44.1 | | (14.5) | | 1.3 | | 0.5 | | 31.4 | | (29) | | (33) | |
| | | | Segment operating profit | | | 208.9 | | (4.4) | | 13.1 | | 13.5 | | 231.1 | | 11 | | (2) | |
| | | | Non-segment (a) | | | (62.6) | | (15.0) | | 17.8 | | - | | (59.8) | | (4) | | 24 | |
| | | | | | Total | | $ | 146.3 | | (19.4) | | 30.9 | | 13.5 | | 171.3 | | 17 | | (13) | |
| | | | | | | | | | | | | | | | | | | | | | |
| | Segment operating margin: | | | | | | | | | | | | | | | | |
| | | International | | | 7.5% | | | | | | | | 6.9% | | | | | |
| | | North America | | | 4.8% | | | | | | | | 3.2% | | | | | |
| | | | | | Segment operating margin | | | 6.7% | | | | | | | | 5.9% | | | | | |
Non-GAAP
| | | | | | Organic | | | Acquisitions / | | | Currency | | | | | | % Change | |
| (In millions) | | 2009 | | | Change | | | Dispositions (b) | | | (c) | | | 2010 | | | Total | | | Organic | |
| Revenues: | | | | | | | | | | | | | | | | | | | | | |
EMEA | | $ | 1,258 | | | | 33 | | | | (45 | ) | | | (46 | ) | | | 1,200 | | | | (5 | ) | | | 3 | |
Latin America | | | 667 | | | | 100 | | | | 52 | | | | 59 | | | | 877 | | | | 32 | | | | 15 | |
Asia Pacific | | | 79 | | | | 18 | | | | 25 | | | | 5 | | | | 127 | | | | 61 | | | | 23 | |
International | | | 2,003 | | | | 150 | | | | 32 | | | | 19 | | | | 2,204 | | | | 10 | | | | 8 | |
North America | | | 894 | | | | 7 | | | | - | | | | 17 | | | | 918 | | | | 3 | | | | 1 | |
Total | | $ | 2,897 | | | | 157 | | | | 32 | | | | 36 | | | | 3,122 | | | | 8 | | | | 5 | |
| | | | | | | | | | | | | | | | | | | | | | | | | | | | | |
| Operating profit: | | | | | | | | | | | | | | | | | | | | | | | | | | | | |
International | | $ | 118 | | | | 49 | | | | 9 | | | | 6 | | | | 181 | | | | 53 | | | | 41 | |
North America | | | 57 | | | | (13 | ) | | | - | | | | 1 | | | | 44 | | | | (22 | ) | | | (24 | ) |
Segment operating profit | | | 175 | | | | 35 | | | | 9 | | | | 7 | | | | 226 | | | | 29 | | | | 20 | |
Non-segment (a) | | | (55 | ) | | | (4 | ) | | | - | | | | - | | | | (59 | ) | | | 6 | | | | 6 | |
Total | | $ | 120 | | | | 32 | | | | 9 | | | | 7 | | | | 167 | | | | 39 | | | | 26 | |
| | | | | | | | | | | | | | | | | | | | | | | | | | | | | |
| Segment operating margin: | | | | | | | | | | | | | | | | | | | | | | | | | | | | |
International | | | 5.9 | % | | | | | | | | | | | | | | | 8.2 | % | | | | | | | | |
North America | | | 6.3 | % | | | | | | | | | | | | | | | 4.8 | % | | | | | | | | |
Segment operating margin | | | 6.0 | % | | | | | | | | | | | | | | | 7.2 | % | | | | | | | | |
| | Non-GAAP | | | | | | | | | | | | | | | | |
| | | | | | | | Organic | | Acquisitions / | | Currency | | | | % Change | |
| | (In millions) | | | 2010 | | Change | | Dispositions (b) | | (c) | | 2011 | | Total | | Organic | |
| | Revenues: | | | | | | | | | | | | | | | | |
| | | International: | | | | | | | | | | | | | | | | |
| | | | Latin America | | $ | 877.4 | | 181.9 | | 363.8 | | 37.6 | | 1,460.7 | | 66 | | 21 | |
| | | | EMEA | | | 1,199.8 | | 58.9 | | (24.5) | | 62.7 | | 1,296.9 | | 8 | | 5 | |
| | | | Asia Pacific | | | 126.5 | | 21.5 | | - | | 5.7 | | 153.7 | | 22 | | 17 | |
| | | | | International | | | 2,203.7 | | 262.3 | | 339.3 | | 106.0 | | 2,911.3 | | 32 | | 12 | |
| | | | | North America | | | 917.8 | | 0.2 | | 48.5 | | 7.7 | | 974.2 | | 6 | | - | |
| | | | | | Total | | $ | 3,121.5 | | 262.5 | | 387.8 | | 113.7 | | 3,885.5 | | 24 | | 8 | |
| | | | | | | | | | | | | | | | | | | | | | |
| | Operating profit: | | | | | | | | | | | | | | | | |
| | | International | | $ | 181.4 | | 10.5 | | 10.2 | | 9.8 | | 211.9 | | 17 | | 6 | |
| | | North America | | | 43.1 | | (10.3) | | 1.3 | | 0.5 | | 34.6 | | (20) | | (24) | |
| | | | Segment operating profit | | | 224.5 | | 0.2 | | 11.5 | | 10.3 | | 246.5 | | 10 | | - | |
| | | | Non-segment (a) | | | (36.2) | | (4.4) | | - | | - | | (40.6) | | 12 | | 12 | |
| | | | | | Total | | $ | 188.3 | | (4.2) | | 11.5 | | 10.3 | | 205.9 | | 9 | | (2) | |
| | | | | | | | | | | | | | | | | | | | | | |
| | Segment operating margin: | | | | | | | | | | | | | | | | |
| | | International | | | 8.2% | | | | | | | | 7.3% | | | | | |
| | | North America | | | 4.7% | | | | | | | | 3.6% | | | | | |
| | | | | | Segment operating margin | | | 7.2% | | | | | | | | 6.3% | | | | | |
| | Amounts may not add due to rounding. |
| | (a) | Includes income and expense not allocated to segments (see page 3435 for details). |
| | (b) | Includes operating results and gains/losses on acquisitions, sales and exit of businesses. |
| (c) | Revenue and Segment Operating Profit: The “Currency” amount in the table is the summation of the monthly currency changes, plus (minus) the U.S. dollar amount of remeasurement currency gains (losses) of bolivar fuerte-denominated net monetary assets recorded under highly inflationary accounting rules in 2010 related to the Venezuelan operations. The monthly currency change is equal to the Revenue or Operating Profit for the month in local currency, on a country-by-country basis, multiplied by the difference in rates used to translate the current period amounts to U.S. dollars versus the translation rates used in the year-ago month. The functional currency in Venezuela was the bolivar fuerte in 2009, and becameis the U.S. dollar in 2010 under highly inflationary accounting rules. Remeasurement gains and loss eslosses under these rules in 2010 are recorded in U.S. dollars but these gains and losses are not recorded in local currency. Local currency Revenue and Operating Profit in 2010 used in the calculation of monthly currency change for Venezuela have been derived from the U.S. dollar results of the Venezuelan operations under U.S. GAAP (excluding remeasurement gains and losses) using current period currency exchange rates. |
| Non-Segment Operating Profit: The “Currency” amount in the table is the 2009 losses incurred in Venezuela related to increases in cash held in U.S. dollars by Venezuela subsidiaries (see page 42 for details).
|
Segment Review
2011 versus 2010
Total Segment Operating Profit
GAAP
Segment operating profit increased 11% as the positive impact of changes in currency exchange rates in our International segment, organic improvement in Latin America, lower losses from the exit and deconsolidation of the Belgium CIT business and the impact of our 2010 acquisition in Mexico were partially offset by lower profits in North America, a settlement loss in Belgium and increased security costs.
Non-GAAP
Segment operating profit increased 10% as the positive impact of changes in currency exchange rates in our International segment, organic improvement in Latin America, lower losses from the CIT business in Belgium and the impact of our 2010 acquisition in Mexico were partially offset by increased security costs and lower profits in North America.
International Segment
Total International
GAAP
Revenues in 2011 for our International segment were 32% higher ($708 million) than 2010 as:
| · | revenues in Latin America were 66% higher ($583 million), including the positive effect of the Mexico acquisition, |
| · | revenues in EMEA were 8% higher ($97 million), and |
| · | revenues in Asia Pacific were 22% higher ($27 million). |
Operating profit in our International segment was 21% higher ($35 million) as all regions increased despite higher security costs.
Non-GAAP
The analysis of International non-GAAP revenues is the same as the analysis of International GAAP revenues.
Operating profit in our International segment was 17% higher ($31 million) as all regions increased despite higher security costs.
Latin America
GAAP
Revenue in Latin America increased 66% ($583 million) due to:
| · | incremental revenues from our acquisition in Mexico ($364 million), |
| · | organic revenue growth ($182 million), and |
| · | the favorable effect of currency exchange rates ($38 million). |
The 21% revenue growth on an organic basis ($182 million) was due to inflation-based price increases across the region.
Operating profit increased $26 million due to organic profit growth ($12 million) primarily in Argentina, Venezuela, Chile and Colombia, and the favorable effect of currency exchange rates ($10 million). Profit growth also occurred from our 2010 acquisition in Mexico.
Non-GAAP
The analysis of Latin America non-GAAP revenues is the same as the analysis of Latin America GAAP revenues.
Operating profit increased $24 million due primarily to organic growth in Argentina, Venezuela, Chile and Colombia ($13 million) and the favorable effect of currency exchange rates ($7 million). Profit growth also occurred from our 2010 acquisition in Mexico.
EMEA
GAAP
EMEA revenues increased by 8% ($97 million) due mainly to:
| · | the favorable effect of currency exchange rates ($63 million) and |
| · | organic growth ($59 million); |
partially offset by revenue lost due to the exit of Belgium CIT business in late 2010 ($30 million).
Revenue increased on an organic basis by 5% driven by the continued growth of Global Services, as well as improvements in Germany, France, Greece and emerging markets.
EMEA operating profit increased $8 million due mainly to:
| · | a 2010 loss on the deconsolidation of the Belgium CIT business ($13 million), |
| · | lower losses from the 2010 exit of the Belgium CIT business ($6 million), |
| · | the favorable effect of currency exchange rates ($3 million), |
| · | profits from a special project in Germany, and |
| · | improvements in Global Services and emerging markets. |
The operating profit improvements were partially offset by:
| · | a 2011 settlement loss related to the Belgium bankruptcy ($10 million), |
| · | increased security costs, and |
| · | impairment charges in Germany and Russia ($4 million). |
Non-GAAP
The analysis of EMEA non-GAAP revenues is the same as the analysis of EMEA GAAP revenues.
EMEA operating profit increased $5 million driven by:
| · | lower losses from the exit of Belgium CIT business ($6 million), |
| · | the favorable effect of currency exchange rates ($3 million), |
| · | profits from a special project in Germany, and |
| · | improvements in Global Services and emerging markets. |
The operating profit improvements were partially offset by:
| · | increased security costs, and |
| · | impairment charges in Germany and Russia ($4 million). |
Asia-Pacific
Revenue in Asia Pacific increased 22% ($27 million) primarily due to Global Services’ performance during the year, reflecting increased commodities volumes, as well as the favorable effect of currency exchange rates ($6 million).
Operating profit increased $2 million driven by organic growth ($1 million).
North American Segment
GAAP
Revenues in North America increased 6% ($56 million) primarily due to our 2010 acquisition in Canada ($51 million) and the favorable effect of currency exchange rates ($8 million). Revenue remained flat on an organic basis due to continued CIT volume and pricing pressures. Underlying this flat trend has been a decline in CIT volumes and pricing, partially offset by increased revenue from our CompuSafe® Service and fuel surcharges.
Operating profit declined $13 million or 29% mainly due to CIT volume and pricing pressure as well as increased security costs.
Non-GAAP
The analysis of North America non-GAAP revenues is the same as the analysis of North America GAAP revenues.
Operating profit declined $9 million or 20% mainly due to CIT volume and pricing pressure as well as increased security costs.
Segment Review
2010 versus 2009
| | | | | | | | | | | | | | | | | | |
| | GAAP | | | | | | | | | | | | | | | | |
| | | | | | | | Organic | | Acquisitions / | | Currency | | | | % Change | |
| | (In millions) | | | 2009 | | Change | | Dispositions (b) | | (c) | | 2010 | | Total | | Organic | |
| | Revenues: | | | | | | | | | | | | | | | | |
| | | International: | | | | | | | | | | | | | | | | |
| | | | Latin America | | $ | 904.7 | | 170.7 | | 51.7 | | (249.7) | | 877.4 | | (3) | | 19 | |
| | | | EMEA | | | 1,257.5 | | 32.9 | | (44.6) | | (46.0) | | 1,199.8 | | (5) | | 3 | |
| | | | Asia Pacific | | | 78.7 | | 17.8 | | 24.6 | | 5.4 | | 126.5 | | 61 | | 23 | |
| | | | | International | | | 2,240.9 | | 221.4 | | 31.7 | | (290.3) | | 2,203.7 | | (2) | | 10 | |
| | | | | North America | | | 894.1 | | 6.5 | | - | | 17.2 | | 917.8 | | 3 | | 1 | |
| | | | | | Total | | $ | 3,135.0 | | 227.9 | | 31.7 | | (273.1) | | 3,121.5 | | - | | 7 | |
| | | | | | | | | | | | | | | | | | | | | | |
| | Operating profit: | | | | | | | | | | | | | | | | |
| | | International | | $ | 156.8 | | 80.1 | | (4.3) | | (67.8) | | 164.8 | | 5 | | 51 | |
| | | North America | | | 56.6 | | (13.4) | | - | | 0.9 | | 44.1 | | (22) | | (24) | |
| | | | Segment operating profit | | | 213.4 | | 66.7 | | (4.3) | | (66.9) | | 208.9 | | (2) | | 31 | |
| | | | Non-segment (a) | | | (46.6) | | (15.0) | | (23.5) | | 22.5 | | (62.6) | | 34 | | 32 | |
| | | | | | Total | | $ | 166.8 | | 51.7 | | (27.8) | | (44.4) | | 146.3 | | (12) | | 31 | |
| | | | | | | | | | | | | | | | | | | | | | |
| | Segment operating margin: | | | | | | | | | | | | | | | | |
| | | International | | | 7.0% | | | | | | | | 7.5% | | | | | |
| | | North America | | | 6.3% | | | | | | | | 4.8% | | | | | |
| | | | | | Segment operating margin | | | 6.8% | | | | | | | | 6.7% | | | | | |
| | | | | | | | | | | | | | | | | | |
| | | | | | | | | | | | | | | | | | | | | | |
| | Non-GAAP | | | | | | | | | | | | | | | | |
| | | | | | | | | | | | | | | | | |
| | (In millions) | | | | | | | | | | | | | | | | |
| | Revenues: | | | | | | | | | | | | | | | | |
| | | International: | | | | | | | | | | | | | | | | |
| | | | Latin America | | $ | 666.8 | | 99.6 | | 51.7 | | 59.3 | | 877.4 | | 32 | | 15 | |
| | | | EMEA | | | 1,257.5 | | 32.9 | | (44.6) | | (46.0) | | 1,199.8 | | (5) | | 3 | |
| | | | Asia Pacific | | | 78.7 | | 17.8 | | 24.6 | | 5.4 | | 126.5 | | 61 | | 23 | |
| | | | | International | | | 2,003.0 | | 150.3 | | 31.7 | | 18.7 | | 2,203.7 | | 10 | | 8 | |
| | | | | North America | | | 894.1 | | 6.5 | | - | | 17.2 | | 917.8 | | 3 | | 1 | |
| | | | | | Total | | $ | 2,897.1 | | 156.8 | | 31.7 | | 35.9 | | 3,121.5 | | 8 | | 5 | |
| | | | | | | | | | | | | | | | | | | | | | |
| | Operating profit: | | | | | | | | | | | | | | | | |
| | | International | | $ | 118.3 | | 48.5 | | 9.1 | | 5.5 | | 181.4 | | 53 | | 41 | |
| | | North America | | | 54.6 | | (12.4) | | - | | 0.9 | | 43.1 | | (21) | | (23) | |
| | | | Segment operating profit | | | 172.9 | | 36.1 | | 9.1 | | 6.4 | | 224.5 | | 30 | | 21 | |
| | | | Non-segment (a) | | | (34.7) | | (1.5) | | - | | - | | (36.2) | | 4 | | 4 | |
| | | | | | Total | | $ | 138.2 | | 34.6 | | 9.1 | | 6.4 | | 188.3 | | 36 | | 25 | |
| | | | | | | | | | | | | | | | | | | | | | |
| | Segment operating margin: | | | | | | | | | | | | | | | | |
| | | International | | | 5.9% | | | | | | | | 8.2% | | | | | |
| | | North America | | | 6.1% | | | | | | | | 4.7% | | | | | |
| | | | | | Segment operating margin | | | 6.0% | | | | | | | | 7.2% | | | | | |
| Amounts may not add due to rounding. |
See page 28 for footnotes.
Segment Review
2010 versus 2009
Total Segment Operating Profit
GAAP
Segment operating profit decreased 2% as the unfavorable impact of currency effectexchange rates in our International segment, lower profits in North America and losses recognized on the exit of unprofitable CIT business in Belgium were mostly offset by organic growth.
Non-GAAP
Segment operating profit increased 29%30% as growth on an organic basis in the International segment and the net positive effect from acquisitions and dispositions was partially offset by a decline on an organic basislower profits in North America.
International Segment
Total International
GAAP
Revenues in 2010 for our internationalInternational segment were 2% lower ($37 million) than 2009 as:
| · | revenues in EMEA were 5% lower ($58 million), and |
| · | revenues in Latin America were 3% lower ($27 million); |
partially offset by 61% ($48 million) higher revenues in Asia Pacific.
Operating profit in our internationalInternational segment was 5% higher ($8 million) as better results in EMEA and Asia Pacific were mostly offset by lower profits in Latin America.
Non-GAAP
Revenues in 2010 for our internationalInternational segment were 10% higher ($201 million) than 2009 as:
| · | revenues in Latin America were 32% higher ($211 million), including the positive effect of businesses acquired in 2010, and |
| · | revenues in Asia Pacific were 61% higher ($48 million), including the positive effect of businesses acquired in 2009; |
partially offset by 5% lower ($58 million) revenues in EMEA.
Operating profit in our internationalInternational segment was 53% higher as all regions showed improvement.increased.
Latin America
GAAP
Revenue in Latin America decreased 3% ($28 million), as the unfavorable effect of currency exchange rates ($250 million) more than offset the incremental revenues from our acquisition in Mexico ($52 million) and growth on an organic basis.
The 19% revenue growth on an organic basis ($171 million) was due to inflation-based price increases across the region.
Operating profit decreased $13 million due primarily to the unfavorable effect of currency exchange rates ($65 million), partially offset by organic growth throughout the region and lower security costs.
Non-GAAP
Revenue in Latin America increased 32% ($210 million) due to incremental revenues from our acquisition in Mexico ($52 million), inflation-based price increases and the favorable effect of currency exchange rates ($59 million) primarily in Venezuela, Brazil and Colombia.
The inflation-based price increases were also the primary reason for the organic revenue increase of 15%.
Operating profit increased $29 million due primarily to organic growth and lower security costs.
EMEA
GAAP
EMEA revenues decreased by 5% ($58 million) due mainly to:
| · | negative currency translation ($46 million), |
| · | loss of revenue resulting from the sale of certain guarding operations in France in 2009 ($48 million), |
| · | loss of guarding contracts in France ($9 million), and |
| · | loss of revenue resulting from fourth quarter 2010 exit of CIT business in Belgium ($8 million); |
partially offset by organic revenue growth.
Revenue improved on an organic basis by 3% driven by the 2010 rebound of Global Services, as well as improvementsincreases in Germany and emerging markets.
EMEA operating profit increased in total ($14 million) as well as on an organic basis ($25 million) driven by:
| · | lower severance ($7 million), |
| · | 2009 included accounting corrections in Belgium ($6 million), |
| · | characterization of a French business tax as an income tax ($6 million), |
| · | improved safety andlower security performance,costs, |
| · | the sale of guarding operations in France, |
| · | improved results in Global Services, |
| · | lower losses resulting from the exit of unprofitable CIT business in Belgium, and |
| · | lower software impairment charges. |
The operating profit improvements were partially offset by $13 million of charges related to the exit of our CIT business in Belgium (write-off of our carrying value of the investment and advances to the subsidiary) as well as higher costs to support our expansion and growth in emerging markets.
Non-GAAP
The analysis of EMEA non-GAAP revenues is the same as the analysis of EMEA GAAP revenues.
EMEA operating profit increased in total ($27 million) as well as on an organic basis ($25 million) driven by:
| · | lower severance ($7 million), |
| · | 2009 included accounting corrections in Belgium ($6 million), |
| · | characterization of a French business tax as an income tax ($6 million), |
| · | improved safety and security performance, |
| · | the sale of guarding operations in France, |
| · | improved results in Global Services, |
| · | lower losses from the exit of unprofitable CIT business in Belgium, and |
| · | and lower software impairment charges; |
partially offset by higher costs to support our expansion and growth in emerging markets.
Deconsolidation of Brink’s Belgium
Our cash-in-transit subsidiary in Belgium (Brink’s Belgium) filed for bankruptcy in November 2010 after a restructuring plan was rejected by local union employees. We deconsolidated the subsidiary in November 2010, when the court-appointed trustee assumed control of the subsidiary, as we no longer controlcontrolled or provideprovided funding for the subsidiary. See a more detailed discussion in the Contingent Matters section on page 54.56.
A summary of the revenues and operating losses for Brink’s Belgium in the threetwo years ending December 31, 2010, is as follows:
| | | | | | | | | | |
| (In millions) | | 2010 | | | 2009 (b) | | | 2008 | |
| | | | | | | | | | |
| Revenues | | $ | 35.2 | | | | 51.3 | | | | 50.1 | |
| Operating loss (a) | | | 7.6 | | | | 9.4 | | | | 0.4 | |
| | (In millions) | | 2010 | | 2009 | (b) | |
| | | | | | | | | |
| | Revenues | $ | 35.2 | | | 51.3 | | |
| | Operating loss (a) | | 7.6 | | | 9.4 | | |
| (a) | Operating loss includes severance charges of $2 million in 2010 and $2 million in 2009. |
| (b) | Operating loss includes accounting corrections of $6 million, which relate to prior periods. |
Latin America
GAAP
Revenue in Latin America decreased 3% ($28 million), as unfavorable currency translation ($250 million) more than offset the incremental revenues from our acquisition in Mexico ($52 million) and growth on an organic basis.
The 19% revenue growth on an organic basis ($171 million) was due to inflation-based price increases across the region.
Operating profit decreased $13 million due primarily to unfavorable currency items ($65 million), partially offset by organic volume growth throughout the region and improved safety and security performance.
Non-GAAP
Revenue in Latin America increased 32% ($210 million) due to incremental revenues from our acquisition in Mexico ($52 million), inflation-based price increases and a favorable currency effect ($59 million) primarily in Venezuela, Brazil and Colombia.
The inflation-based price increases were also the primary reason for the organic revenue increase of 15%.
Operating profit increased $29 million due primarily to organic growth and improved safety and security performance.
Asia-Pacific
Revenue in Asia Pacific increased 61% ($48 million) primarily due to Global Services’ strong finish of the year, reflecting increased commodities volumes along with some improvements in the diamond and jewelry business, as well as third-quarter 2009 acquisitions in India ($16 million) and China ($9 million).
Operating profit increased $7 million driven by organic growth ($5 million) and the 2009 acquisitions ($2 million).
North American Segment
GAAP
Revenues in North America increased 3% ($24 million) on favorable currency rates in Canada ($17 million). Revenue increased slightly (1% or $7 million) on an organic basis despite continued CIT volume and pricing pressures.
Operating profit declined $13 million or 22% mainly due to CIT volume and pricing pressure, partially offset by improved safety andlower security performancecosts and Global Services improvement.
Non-GAAP
The analysis of North America non-GAAP revenues is the same as the analysis of North America GAAP revenues.
Operating profit declined $12 million or 21% mainly due to CIT volume and pricing pressure, partially offset by lower security costs and Global Services improvement.
Armored Vehicle Leases
Since March 2009, we have acquired armored vehicles in the U.S. either by purchasing or by leasing under agreements that we have accounted for as capital leases. We currently expect to continue acquiring new vehicles in the U.S. with capital leases. The cost of vehicles under capital lease is recognized as depreciation and interest expense. Because of the shift in the way we acquire vehicles in the U.S, our depreciation and interest related to the U.S. fleet is higher and our rental expense is lower compared to earlier periods and we expect this trend to continue.
Segment Review
2009 versus 2008
GAAP
| | | | | | Organic | | | Acquisitions / | | | Currency | | | | | | % Change | |
| (In millions) | | 2008 | | | Change | | | Dispositions | | | (b) | | | 2009 | | | Total | | | Organic | |
| Revenues: | | | | | | | | | | | | | | | | | | | | | |
EMEA | | $ | 1,359 | | | | (22 | ) | | | 3 | | | | (83 | ) | | | 1,258 | | | | (7 | ) | | | (2 | ) |
Latin America | | | 801 | | | | 75 | | | | 80 | | | | (51 | ) | | | 905 | | | | 13 | | | | 9 | |
Asia Pacific | | | 72 | | | | (4 | ) | | | 12 | | | | (1 | ) | | | 79 | | | | 10 | | | | (5 | ) |
International | | | 2,231 | | | | 49 | | | | 95 | | | | (135 | ) | | | 2,241 | | | | - | | | | 2 | |
North America | | | 932 | | | | (28 | ) | | | 2 | | | | (11 | ) | | | 894 | | | | (4 | ) | | | (3 | ) |
Total | | $ | 3,164 | | | | 21 | | | | 97 | | | | (146 | ) | | | 3,135 | | | | (1 | ) | | | 1 | |
| | | | | | | | | | | | | | | | | | | | | | | | | | | | | |
| Operating profit: | | | | | | | | | | | | | | | | | | | | | | | | | | | | |
International | | $ | 215 | | | | (60 | ) | | | 9 | | | | (8 | ) | | | 157 | | | | (27 | ) | | | (28 | ) |
North America | | | 57 | | | | - | | | | - | | | | - | | | | 57 | | | | (1 | ) | | | - | |
Segment operating profit | | | 272 | | | | (60 | ) | | | 9 | | | | (8 | ) | | | 213 | | | | (22 | ) | | | (22 | ) |
Non-segment (a) | | | (43 | ) | | | (3 | ) | | | - | | | | - | | | | (47 | ) | | | 7 | | | | 7 | |
Total | | $ | 229 | | | | (63 | ) | | | 9 | | | | (8 | ) | | | 167 | | | | (27 | ) | | | (27 | ) |
| | | | | | | | | | | | | | | | | | | | | | | | | | | | | |
| Segment operating margin: | | | | | | | | | | | | | | | | | | | | | | | | | | | | |
International | | | 9.6 | % | | | | | | | | | | | | | | | 7.0 | % | | | | | | | | |
North America | | | 6.1 | % | | | | | | | | | | | | | | | 6.3 | % | | | | | | | | |
Segment operating margin | | | 8.6 | % | | | | | | | | | | | | | | | 6.8 | % | | | | | | | | |
Non-GAAP
| | | | | | Organic | | | Acquisitions / | | | Currency | | | | | | % Change | |
| (In millions) | | 2008 | | | Change | | | Dispositions | | | (b) | | | 2009 | | | Total | | | Organic | |
| Revenues: | | | | | | | | | | | | | | | | | | | | | |
EMEA | | $ | 1,359 | | | | (22 | ) | | | 3 | | | | (83 | ) | | | 1,258 | | | | (7 | ) | | | (2 | ) |
Latin America | | | 627 | | | | 58 | | | | 80 | | | | (99 | ) | | | 667 | | | | 6 | | | | 9 | |
Asia Pacific | | | 72 | | | | (4 | ) | | | 12 | | | | (1 | ) | | | 79 | | | | 10 | | | | (5 | ) |
International | | | 2,058 | | | | 32 | | | | 95 | | | | (183 | ) | | | 2,003 | | | | (3 | ) | | | 2 | |
North America | | | 932 | | | | (28 | ) | | | 2 | | | | (11 | ) | | | 894 | | | | (4 | ) | | | (3 | ) |
Total | | $ | 2,990 | | | | 4 | | | | 97 | | | | (194 | ) | | | 2,897 | | | | (3 | ) | | | - | |
| | | | | | | | | | | | | | | | | | | | | | | | | | | | | |
| Operating profit: | | | | | | | | | | | | | | | | | | | | | | | | | | | | |
International | | $ | 166 | | | | (46 | ) | | | 9 | | | | (11 | ) | | | 118 | | | | (29 | ) | | | (27 | ) |
North America | | | 57 | | | | - | | | | - | | | | - | | | | 57 | | | | (1 | ) | | | - | |
Segment operating profit | | | 223 | | | | (46 | ) | | | 9 | | | | (12 | ) | | | 175 | | | | (22 | ) | | | (20 | ) |
Non-segment (a) | | | (58 | ) | | | 2 | | | | - | | | | - | | | | (55 | ) | | | (4 | ) | | | (4 | ) |
Total | | $ | 166 | | | | (43 | ) | | | 9 | | | | (12 | ) | | | 120 | | | | (28 | ) | | | (26 | ) |
| | | | | | | | | | | | | | | | | | | | | | | | | | | | | |
| Segment operating margin: | | | | | | | | | | | | | | | | | | | | | | | | | | | | |
International | | | 8.1 | % | | | | | | | | | | | | | | | 5.9 | % | | | | | | | | |
North America | | | 6.1 | % | | | | | | | | | | | | | | | 6.3 | % | | | | | | | | |
Segment operating margin | | | 7.5 | % | | | | | | | | | | | | | | | 6.0 | % | | | | | | | | |
See page 27 for footnotes.
Segment Review
2009 versus 2008
Total Segment Operating Profit
GAAP
Segment operating profit decreased 22% in total and on an organic basis due mainly to
· | the inclusion in 2008 results of profits from the monetary conversion project in Venezuela that was completed in 2008, |
· | a $12 million increase in restructuring and severance costs, primarily in Europe, and |
· | $6 million in accounting corrections in Belgium. |
Non-GAAP
Segment operating profit decreased 22%, and 20% on an organic basis, mainly due to
· | the inclusion in 2008 results of profits from the monetary conversion project in Venezuela that was completed in 2008, |
· | a $12 million increase in restructuring and severance costs, primarily in Europe, and |
· | $6 million in accounting corrections in Belgium. |
International Segment
Total International
GAAP
Revenues in 2009 for our international segment were even with 2008 as
· | revenues in EMEA were 7% lower, |
· | revenues in Latin America were 13% higher, and |
· | revenues in Asia Pacific were 10% higher. |
Operating profit in our international segment was 27% lower than 2008 as we earned lower profits in EMEA and Latin America.
Non-GAAP
Revenues in 2009 for our international segment were 3% lower than 2008 as
· | revenues in EMEA were 7% lower, |
· | revenues in Latin America were 6% higher, and |
· | revenues in Asia Pacific were 10% higher. |
Operating profit in our international segment was 29% lower than 2008 as we earned lower profits in EMEA and Latin America.
EMEA
EMEA revenues were down 7% due mainly to
· | unfavorable currency ($83 million), |
· | a loss of guarding contracts in France ($34 million) and |
· | a sale of certain guarding operations in France ($5 million). |
EMEA revenues were down 2% on an organic basis due to
· | the loss of guarding contracts in France ($34 million), and |
· | continued pricing and volume pressure throughout region. |
EMEA operating profit was down 65% due primarily to
· | higher severance costs (up $10 million) related to contract losses and turnaround efforts, |
· | accounting corrections in Belgium ($6 million), and |
· | Global Services being down across the region on weak diamond and jewelry demand. |
Latin America
GAAP
Revenue in Latin America increased 13% on
· | inflation-based price increases, and |
· | an acquisition in Brazil ($74 million). |
Revenue increased 9% on an organic basis on higher CIT volume throughout the region including inflation-based price increases.
Operating profit decreased 13% as 2008 included results from highly profitable monetary conversion project in Venezuela, and higher foreign currency transaction losses in Venezuela ($8 million) were partially offset by profit increased as a result of the Brazil acquisition ($10 million).
Non-GAAP
Revenue in Latin America increased 6% on
· | inflation-based price increases, and |
· | an acquisition in Brazil ($74 million). |
Revenue increased 9% on an organic basis on higher CIT volume throughout the region including inflation-based price increases.
Operating profit decreased 9% as 2008 included results from highly profitable monetary conversion project in Venezuela, partially offset by profit increased as a result of the Brazil acquisition ($10 million).
Asia-Pacific
Revenue in Asia Pacific increased 10% due mainly to third-quarter acquisitions in India ($8 million) and China ($4 million).
Revenues on an organic basis and operating profit were down due to lower diamond and jewelry demand.
North American Segment
Revenues in North America were down 4% on lower volume in CIT and Global Services, partially offset by higher selling prices. Operating profit in North America was flat with 2009 with revenue declines offset by cost reductions.
Non-segment Income (Expense) (a)
| GAAP | | Years Ended December 31, | | | % change | |
| (In millions) | | 2010 | | | 2009 | | | 2008 | | | 2010 | | | 2009 | |
| | | | | | | | | | | | | | | | |
| Corporate and former operations: | | | | | | | | | | | | | | | |
| General and administrative | | $ | (38.6 | ) | | | (36.7 | ) | | | (48.8 | ) | | | 5 | | | | (25 | ) |
| Strategic reviews and proxy matters | | | - | | | | - | | | | (4.8 | ) | | | - | | | | (100 | ) |
| Retirement costs (primarily former operations) | | | (22.7 | ) | | | (20.7 | ) | | | 2.7 | | | | 10 | | | NM | |
| Subtotal | | | (61.3 | ) | | | (57.4 | ) | | | (50.9 | ) | | | 7 | | | | 13 | |
| | | | | | | | | | | | | | | | | | | | | |
| Other amounts not allocated to segments: | | | | | | | | | | | | | | | | | | | | |
| Gains (losses) related to business acquisitions: | | | | | | | | | | | | | | | | | | | | |
Bargain purchase of Mexican CIT business | | | 5.1 | | | | - | | | | - | | | NM | | | | - | |
Remeasurement of previously held ownership interests to fair value | | | (13.7 | ) | | | 14.9 | | | | - | | | NM | | | NM | |
| Royalty income: | | | | | | | | | | | | | | | | | | | | |
| Brand licensing fees from BHS | | | 4.9 | | | | 6.8 | | | | 1.1 | | | | (28 | ) | | fav | |
| Other | | | 2.1 | | | | 1.8 | | | | 1.7 | | | | 17 | | | | 6 | |
| Currency exchange transaction gains (losses) | | | - | | | | (22.3 | ) | | | (8.4 | ) | | | (100 | ) | | | 165 | |
| Gains on sale of property and other assets | | | 0.3 | | | | 9.6 | | | | 13.1 | | | | (97 | ) | | | (27 | ) |
| Subtotal | | | (1.3 | ) | | | 10.8 | | | | 7.5 | | | NM | | | | 44 | |
| | | | | | | | | | | | | | | | | | | | | |
| Non-segment income (expense) | | $ | (62.6 | ) | | | (46.6 | ) | | | (43.4 | ) | | | 34 | | | | 7 | |
| | GAAP | | Years Ended December 31, | | % change |
| | (In millions) | | 2011 | | 2010 | | 2009 | | | 2011 | | 2010 | |
| | | | | | | | | | | | | | | | | |
| | Corporate and former operations: | | | | | | | | | | | | |
| | | General and administrative | $ | (46.6) | | (38.6) | | (36.7) | | | 21 | | 5 | |
| | | Retirement costs (primarily former operations) | | (24.8) | | (22.7) | | (20.7) | | | 9 | | 10 | |
| | | | | Subtotal | | (71.4) | | (61.3) | | (57.4) | | | 16 | | 7 | |
| | | | | | | | | | | | | | | |
| | | | | | | | | | | | | | | | | |
| | | | | | | | | | | | | | | | | |
| | Other amounts not allocated to segments: | | | | | | | | | | | | |
| | | Royalty income: | | | | | | | | | | | | |
| | | | Brand licensing fees from BHS | | - | | 4.9 | | 6.8 | | | (100) | | (28) | |
| | | | Other | | 1.7 | | 2.1 | | 1.8 | | | (19) | | 17 | |
| | | Business acquisitions and dispositions: | | | | | | | | | | | | |
| | | | Remeasurement of previously held ownership interests to fair value | | 0.4 | | (13.7) | | 14.9 | | | NM | | NM | |
| | | | Bargain purchase of Mexican CIT business | | 2.1 | | 5.1 | | - | | | (59) | | fav | |
| | | | Gains on sale of U.S. Document Destruction business | | 6.7 | | - | | - | | | fav | | - | |
| | | Currency exchange transaction gains (losses) | | - | | - | | (22.3) | | | - | | (100) | |
| | | Gains on sale of property and other assets | | 0.7 | | 0.3 | | 9.6 | | | fav | | (97) | |
| | | | | Subtotal | | 11.6 | | (1.3) | | 10.8 | | | NM | | NM | |
| | | | | | | | | | | | | | | | | |
| | Non-segment income (expense) | $ | (59.8) | | (62.6) | | (46.6) | | | (4) | | 34 | |
| (a) | Includes corporate, former operations and other amounts not allocated to segment results. |
Non-segment expenses in 2011 were $3 million or 4% lower than 2010, mainly due to favorable factors including:
| · | the 2010 net loss related to the Mexico acquisition ($9 million), |
| · | the 2011 gain on the sale of the U.S. Document Destruction business ($7 million), and |
| · | the 2011 adjustment to the bargain purchase gain on the Mexico acquisition ($2 million); |
partially offset by unfavorable factors including:
| · | higher general and administrative costs ($8 million) in 2011, including $4 million related to the retirement of the former CEO, |
| · | lower royalty income from our former home security business ($5 million), and |
| · | higher retirement costs ($2 million). |
Non-segment expenses in 2010 were $16 million or 34% higher than 2009, mainly due to unfavorable factors including:
| · | a 2010 net loss recognized related to the Mexico acquisition ($9 million), and |
| · | the 2009 included a $15 million gain from business acquisitions in India and Panama ($15 million), and |
| · | lower 2010 gains on the sale of property and other assets ($9 million); |
partially offset by
· | higher favorable factors such as the 2009 currency exchange transaction losses ($22 million), including a $23 million charge related to repatriating dividends from Venezuela. |
Non-segment expenses in 2009 were $3 million or 7% higher than 2008, mainly due to
· | higher retirement expenses ($23 million), |
· | higher currency exchange transaction losses ($14 million), including a $23 million charge related to repatriating dividends from Venezuela, and |
· | lower gains on asset sales ($4 million); |
mostly offset by
· | lower general and administrative expense ($12 million), including lower bonus accruals ($6 million), |
· | a gain on an acquisition in India ($14 million), |
· | higher royalty income ($6 million), and |
· | costs in 2008 for strategic reviews and proxy matters ($5 million). |
Outlook for 20112012
We believeestimate that non-segment expenses on a GAAP basis will remainbe approximately $63$89 million in 2011.2012. See page 4041 for a summary of our 20112012 Outlook.
| Non-GAAP | | Years Ended December 31, | | | % change | |
| (In millions) | | 2010 | | | 2009 | | | 2008 | | | 2010 | | | 2009 | |
| | | | | | | | | | | | | | | | |
| Corporate and former operations: | | | | | | | | | | | | | | | |
| General and administrative | | $ | (38.6 | ) | | | (36.7 | ) | | | (48.8 | ) | | | 5 | | | | (25 | ) |
| Strategic reviews and proxy matters | | | - | | | | - | | | | (4.8 | ) | | | - | | | | (100 | ) |
| Retirement costs (primarily former operations) | | | (22.7 | ) | | | (20.7 | ) | | | 2.7 | | | | 10 | | | NM | |
| Subtotal | | | (61.3 | ) | | | (57.4 | ) | | | (50.9 | ) | | | 7 | | | | 13 | |
| | | | | | | | | | | | | | | | | | | | | |
| Other amounts not allocated to segments: | | | | | | | | | | | | | | | | | | | | |
| Royalty income | | | 2.1 | | | | 1.8 | | | | 1.7 | | | | 17 | | | | 6 | |
| Currency exchange transaction gains (losses) | | | - | | | | 0.2 | | | | (8.4 | ) | | | (100 | ) | | NM | |
| Gains on sale of property and other assets | | | 0.3 | | | | - | | | | - | | | NM | | | | - | |
| Subtotal | | | 2.4 | | | | 2.0 | | | | (6.7 | ) | | | 20 | | | NM | |
| | | | | | | | | | | | | | | | | | | | | |
| Non-segment income (expense) | | $ | (58.9 | ) | | | (55.4 | ) | | | (57.6 | ) | | | 6 | | | | (4 | ) |
| | Non-GAAP | | Years Ended December 31, | % change |
| | (In millions) | | 2011 | | 2010 | | 2009 | | | 2011 | | 2010 | |
| | | | | | | | | | | | | | | | | |
| | Corporate general and administrative | $ | (42.5) | | (38.6) | | (36.7) | | | 10 | | 5 | |
| | Other amounts not allocated to segments: | | | | | | | | | | | | |
| | | Royalty income: | | 1.7 | | 2.1 | | 1.8 | | | (19) | | 17 | |
| | | Currency exchange transaction gains (losses) | | - | | - | | 0.2 | | | - | | (100) | |
| | | Gains on sale of property and other assets | | 0.2 | | 0.3 | | - | | | (33) | | fav | |
| | Non-segment income (expense) | $ | (40.6) | | (36.2) | | (34.7) | | | 12 | | 4 | |
Non-segment expenses on a non-GAAP basis in 2011 were $4 million or 12% higher than 2010, mainly due to increased general and administrative costs ($4 million).
Non-segment expenses on a non-GAAP basis in 2010 were $4$2 million or 6%4% higher than 2009 mainly due to higher retirement costs ($2 million) and general and administrative expenses ($2 million).
Non-segmentOutlook for 2012
We estimate that non-segment expenses on a non-GAAP basis will be approximately $41 million in 2009 were $2 million or 4% lower than 2008, mainly due to
· | lower general and administrative expense ($12 million), including lower bonus accruals ($6 million), |
· | lower foreign exchange losses ($9 million), and |
· | costs in 2008 for strategic reviews and proxy matters ($5 million); |
partially offset by higher retirement expenses ($23 million).
2012. See page 41 for a summary of our 2012 Outlook.
Other Operating Income (Expense)
Other operating income (expense) includes segment and non-segment other operating income and expense.
| | | Years Ended December 31, | | | % change | |
| (In millions) | | 2010 | | | 2009 | | | 2008 | | | 2010 | | | 2009 | |
| | | | | | | | | | | | | | | | |
| Gains (losses) related to business acquisitions: | | | | | | | | | | | | | | | |
Bargain purchase of Mexican CIT business | | $ | 5.1 | | | | - | | | | - | | | NM | | | | - | |
Remeasurement of previously held ownership interests to fair value | | | (13.7 | ) | | | 14.9 | | | | - | | | NM | | | NM | |
| Deconsolidation of Brink’s Belgium and write-down to fair value | | | (13.4 | ) | | | - | | | | - | | | NM | | | | - | |
| Currency exchange transaction gains (losses) | | | (4.0 | ) | | | (41.4 | ) | | | (18.1 | ) | | | (90 | ) | | | 129 | |
| Royalty income | | | 7.6 | | | | 8.6 | | | | 2.8 | | | | (12 | ) | | fav | |
| Gains on sales of property and other assets | | | 1.2 | | | | 9.4 | | | | 13.1 | | | | (87 | ) | | | (28 | ) |
| Share in earnings of equity affiliates | | | 3.9 | | | | 4.5 | | | | 5.0 | | | | (13 | ) | | | (10 | ) |
| Impairment losses | | | (0.7 | ) | | | (2.7 | ) | | | (1.9 | ) | | | (74 | ) | | | 42 | |
| Other | | | 4.5 | | | | 3.2 | | | | 3.7 | | | | 41 | | | | (14 | ) |
| Other operating income (expense) | | $ | (9.5 | ) | | | (3.5 | ) | | | 4.6 | | | | 171 | | | NM | |
| | | | | Years Ended December 31, | | | % change | |
| | (In millions) | | 2011 | | 2010 | | 2009 | | | 2011 | | 2010 | |
| | | | | | | | | | | | | | | |
| | Share in earnings of equity affiliates | $ | 4.8 | | 3.9 | | 4.5 | | | 23 | | (13) | |
| | Royalty income (a) | | 1.7 | | 7.6 | | 8.6 | | | (78) | | (12) | |
| | Gains (losses) on sale of property and other assets | | 1.2 | | 1.2 | | 9.4 | | | - | | (87) | |
| | Impairment losses | | (4.7) | | (0.7) | | (2.7) | | | unfav | | (74) | |
| | Business acquisitions and dispositions: | | | | | | | | | | | | |
| | | Gain on sale of U.S. Document Destruction business | | 6.7 | | - | | - | | | fav | | - | |
| | | Bargain purchase of Mexican CIT business | | 2.1 | | 5.1 | | - | | | (59) | | fav | |
| | | Remeasurement of previously held ownership interest to fair value | | 0.4 | | (13.7) | | 14.9 | | | fav | | NM | |
| | | Deconsolidation of Brink’s Belgium and write-down to fair value | | - | | (13.4) | | - | | | (100) | | unfav | |
| | | Settlement loss related to Belgium bankruptcy | | (10.1) | | - | | - | | | unfav | | - | |
| | Foreign currency items: | | | | | | | | | | | | |
| | | Transaction losses | | (4.2) | | (4.0) | | (41.4) | | | 5 | | (90) | |
| | | Hedge gains | | 2.2 | | - | | - | | | fav | | - | |
| | Other | | 3.1 | | 4.5 | | 3.2 | | | (31) | | 41 | |
| | | Other operating income (expense) | $ | 3.2 | | (9.5) | | (3.5) | | | NM | | unfav | |
| | (a) Includes royalty income in 2010 and 2009 from our former home-security business. |
2011 versus 2010
Other operating income increased in 2011 primarily as a result of favorable factors including:
| · | gains related to business acquisitions in 2011 ($3 million) versus net losses on acquisitions in 2010 ($9 million), |
| · | a charge related to the deconsolidation of the Belgium CIT business in 2010 ($13 million), and |
| · | a gain on the sale of the U.S. Document Destruction business in 2011 ($7 million); |
partially offset by unfavorable factors including:
| · | a settlement loss in 2011 related to the Belgium bankruptcy ($10 million), |
| · | lower third-party royalty income ($6 million) as 2010 included royalties from our former home security business ($5 million), and |
| · | increased impairment charges ($4 million). |
2010 versus 2009
Other operating expense increased in 2010 primarily as a result of unfavorable factors including:
| · | $9 million ofa net lossesloss related to business acquisitions in 2010 acquisitions as compared to $15 million in($9 million) versus gains related to business acquisitions in 2009 ($15 million), |
| · | a $13 million charge related to the deconsolidation of Brink’sthe Belgium CIT business ($13 million), and |
| · | lower gains on sales of property and other assets ($8 million); |
partially offset by favorable factors such as higher 2009 currency exchange transaction losses of $37 million,($37 million), including a $23 million charge related to repatriating dividends from Venezuela.Venezuela ($23 million).
2009 versus 2008
Other operating income (expense) was worse in 2009 primarily as a result of
· | higher foreign currency transaction losses, including the $23 million loss from repatriating 76 million bolivar fuertes held in Venezuela at the parallel exchange rate; |
· | lower gains on asset sales of $4 million; |
partially offset by
· | gains that total $15 million primarily related to the acquisition of a controlling interest in India; and |
· | royalty income from the licensing agreement with BHS was $6 million higher. |
Nonoperating Income and Expense
Interest Expense
| | | Years Ended December 31, | | | % change | |
| (In millions) | | 2010 | | | 2009 | | | 2008 | | | 2010 | | | 2009 | |
| | | | | | | | | | | | | | | | |
| Interest expense | | $ | 14.8 | | | | 11.3 | | | | 12.0 | | | | 31 | | | | (6 | ) |
| | | | Years Ended December 31, | | | % change | |
| | (In millions) | | 2011 | 2010 | 2009 | | | 2011 | | 2010 | |
| | | | | | | | | | | | | | | | | |
| | Interest expense | $ | 24.0 | | 14.8 | | 11.3 | | | | 62 | | | 31 | | |
Interest expense was higher in 2011 as a result of higher interest rates from the January 2011 issuance of $100 million in unsecured private placement notes and increased borrowings due to 2010 acquisitions.
We renegotiated our $400 million revolving credit facility in July 2010. As expected, our interestInterest expense was higher in 2010 as a result of higher interest rate spreads above LIBOR and other costs related to the new facility. Interest expense was also higher due to higher average borrowings on our revolving credit facility resulting from repurchases of our common stock and acquisitions.
Interest expense in 2009 decreased mainly due to lower average interest rates.
Outlook for 20112012
We expect our interest expense to be $20-24$23 million to $26 million in 2011, up from $152012 versus $24 million in 2010 because of:
· | higher average debt outstanding due to: |
· | acquisitions in Mexico and Canada late in 2010; |
· | financing capital investments (including capital leases); and |
· | 2010 share repurchases; |
· | higher average interest rates due to: |
· | the 2010 refinancing of the Revolving Facility at a higher interest rate; |
· | the January 2011 issuance of $100 million in unsecured private placement notes at interest rates that are higher than recent average rates; and |
· | expected increases in the Revolving Facility LIBOR index rates. |
2011. See page 41 for a summary of our 2012 Outlook.
The higher interest rates and other costs of borrowings under a new credit facility are further discussed in Liquidity and Capital Resources – Capitalization – Debt.
Interest and Other Income
| | | Years Ended December 31, | | | % change | |
| (In millions) | | 2010 | | | 2009 | | | 2008 | | | 2010 | | | 2009 | |
| | | | | | | | | | | | | | | | |
| Interest income | | $ | 4.1 | | | | 10.8 | | | | 15.0 | | | | (62 | ) | | | (28 | ) |
| Other-than-temporary impairment of available-for-sale securities | | | - | | | | - | | | | (7.1 | ) | | | - | | | | (100 | ) |
| Gain on available-for-sale securities | | | 3.8 | | | | - | | | | 0.9 | | | NM | | | | (100 | ) |
| Other, net | | | 0.2 | | | | - | | | | (0.7 | ) | | NM | | | | (100 | ) |
| Total | | $ | 8.1 | | | | 10.8 | | | | 8.1 | | | | (25 | ) | | | 33 | |
| | | | Years Ended December 31, | | | | % change | | |
| | (In millions) | | 2011 | | 2010 | | 2009 | | | 2011 | | 2010 | |
| | | | | | | | | | | | | | | | | | | |
| | Interest income | $ | 5.9 | | | 4.1 | | | 10.8 | | | | 44 | | | (62) | | |
| | Gain on available-for-sale securities | | 4.4 | | | 3.8 | | | - | | | | 16 | | | fav | | |
| | Other | | (1.2) | | | 0.2 | | | - | | | | unfav | | | fav | | |
| | Total | $ | 9.1 | | | 8.1 | | | 10.8 | | | | 12 | | | (25) | | |
Interest and other income (expense) was slightly higher in 2011 primarily due to $2 million of higher interest income. We also recognized $4.4 million in gains on available-for-sale securities in 2011.
Interest income was lower in 2010 primarily due to lower average levels of cash and cash equivalents in Venezuela resulting from repatriationsdividends of cash in the fourth quarter 2009 and first half 2010 as well as overall lower interest rates in 2010. Interest income also decreased due to translating Venezuelan operations using a weaker exchange rate in 2010 compared to 2009. We recognized a $4.0 million gain in 2010 on the conversion of certain available-for-sale securities. The conversion resulted from an exchange of the securities we held for shares of equity securities in two other publicly held companies and a small amount of cash. The shares received in the conversion were sold in January 2011 and we recognized another $1.8 million gain in the first quarter of 2011.
In 2009, interest income decreased due to lower interest rates and lower average levels of cash and cash equivalents in certain countries. Our results in 2008 included a $7.1 million other-than-temporary impairment loss on available-for-sale securities.
Summary Rate Reconciliation – GAAP
| | | Years Ended December 31, | |
| (In percentages) | | 2010 | | | 2009 | | | 2008 | |
| | | | | | | | | | |
| U.S. federal tax rate | | | 35.0 | % | | | 35.0 | % | | | 35.0 | % |
| Increases (reductions) in taxes due to: | | | | | | | | | | | | |
Adjustments to valuation allowances | | | 10.5 | | | | (68.2 | ) | | | (6.1 | ) |
Foreign income taxes | | | (7.4 | ) | | | (3.5 | ) | | | (5.8 | ) |
Medicare subsidy for retirement plans | | | 9.8 | | | | (0.9 | ) | | | (0.8 | ) |
Nontaxable acquisition (gain) loss | | | 2.1 | | | | (2.9 | ) | | | - | |
Nondeductible repatriation charge | | | - | | | | 4.7 | | | | - | |
| Other | | | (2.0 | ) | | | (0.9 | ) | | | 1.3 | |
| Income tax rate on continuing operations | | | 48.0 | % | | | (36.7 | %) | | | 23.6 | % |
| | Summary Rate Reconciliation – GAAP | | | | | | | | | | |
| | | | Years Ended December 31, |
| | (In percentages) | | 2011 | | 2010 | | 2009 | |
| | | | | | | | | | | | | |
| | U.S. federal tax rate | | 35.0 | % | | 35.0 | % | | 35.0 | % | |
| | Increases (reductions) in taxes due to: | | | | | | | | | | |
| | | Adjustments to valuation allowances | | (0.8) | | | 10.5 | | | (68.2) | | |
| | | Foreign income taxes | | 2.1 | | | (7.4) | | | (3.5) | | |
| | | Medicare subsidy for retirement plans | | - | | | 9.8 | | | (0.9) | | |
| | | Nontaxable acquisition (gains) losses | | (0.5) | | | 2.1 | | | (2.9) | | |
| | | Nondeductible repatriation charge | | - | | | - | | | 4.7 | | |
| | | French business tax | | 2.8 | | | 2.8 | | | - | | |
| | | Other | | (0.6) | | | (4.8) | | | (0.9) | | |
| | Income tax rate on continuing operations | | 38.0 | % | | 48.0 | % | | (36.7) | % | |
Summary Rate Reconciliation – Non-GAAP (a)
| | | Years Ended December 31, | |
| (In percentages) | | 2010 | | | 2009 | | | 2008 | |
| | | | | | | | | | |
| U.S. federal tax rate | | | 35.0 | % | | | 35.0 | % | | | 35.0 | % |
| Increases (reductions) in taxes due to: | | | | | | | | | | | | |
Adjustments to valuation allowances | | | 7.1 | | | | 3.4 | | | | (7.8 | ) |
Tax settlement | | | (4.5 | ) | | | - | | | | - | |
French business tax | | | 2.5 | | | | - | | | | - | |
| Other | | | (4.1 | ) | | | (1.7 | ) | | | (2.4 | ) |
| Income tax rate on Non-GAAP continuing operations | | | 36.0 | % | | | 36.7 | % | | | 24.8 | % |
(a) | See pages 41-42 for a reconciliation of non-GAAP results to GAAP. |
| | Summary Rate Reconciliation – Non-GAAP (a) | | | | | | | | | | |
| | | | Years Ended December 31, |
| | (In percentages) | | 2011 | | 2010 | | 2009 | |
| | | | | | | | | | | | | |
| | U.S. federal tax rate | | 35.0 | % | | 35.0 | % | | 35.0 | % | |
| | Increases (reductions) in taxes due to: | | | | | | | | | | |
| | | Adjustments to valuation allowances | | (0.7) | | | 7.1 | | | 3.4 | | |
| | | Tax settlement | | - | | | (4.5) | | | - | | |
| | | French business tax | | 2.4 | | | 2.5 | | | - | | |
| | | Other | | 1.9 | | | (4.1) | | | (1.7) | | |
| | Income tax rate on Non-GAAP continuing operations | | 38.6 | % | | 36.0 | % | | 36.7 | % | |
| | (a) | See pages 42–44 for a reconciliation of non-GAAP results to GAAP. |
Overview
Our effective tax rate has varied in the past three years from the statutory U.S. federal rate due to various factors, including:including
| · | changes in judgment about the need for valuation allowances |
| · | changes in the geographical mix of earnings |
| · | a nondeductible Venezuela repatriation charge |
| · | nontaxable acquisition gains and losses |
| · | changes in laws in the U.S. and France |
| · | timing of benefit recognition for uncertain tax positions |
We establish or reverse valuation allowances for deferred tax assets depending on all available information including historical and expected future operating performance of our subsidiaries. Changes in judgment about the future realization of deferred tax assets can result in significant adjustments to the valuation allowances. Based on our historical and future expected taxable earnings, we believe it is more likely than not that we will realize the benefit of the deferred tax assets, net of valuation allowances.
Outlook
The effective income tax rate for 20112012 is expected to be between 36%37% and 39%40%. Our effective tax rate may fluctuate materially from these estimates due to changes in forecasted permanent book-tax differences,the amount of income or expense that is permanently excluded from tax returns, income or deductions on tax returns permanently excluded from book earnings, changes in the expected geographical mix of earnings, changes in current or deferred taxes due to legislative changes, changes in valuation allowances or accruals for contingencies and other factors. See page 41 for a summary of our 2012 Outlook.
Continuing Operations
2011 Compared to U.S. Statutory Rate
The effective income tax rate on continuing operations in 2011 was higher than the 35% U.S. statutory tax rate largely due to a $6.2 million increase in our valuation allowance position as a result of our assessment of historical and future taxable income and the characterization of a $4.4 million French business tax as an income tax, partially offset by a $3.4 million net income tax benefit related to a repatriation of cash to the U.S.
2010 Compared to U.S. Statutory Rate
The effective income tax rate on continuing operations in 2010 was higher than the 35% U.S. statutory tax rate largely due to a $13.7 million reduction in deferred tax assets as a result of U.S. healthcare legislation enacted in 2010, and $13.5a $7.4 million in higher taxes related to non-U.S. tax jurisdictions, partially offset by a $7.0 million non-cash income tax benefit related to a tax settlement. Non-U.S. taxes were higher than 35% primarily due to an increase in our valuation allowance position as a result of our assessment of historical and future taxable income, the characterization of a $3.9 million French business tax as an
income tax based upon legislative changes effective January 1, 2010, and a$3.0 million nondeductible loss on the Mexico acquisition.acquisition, partially offset by a $7.0 million non-cash income tax benefit relate to a tax settlement.
2009 Compared to U.S. Statutory Rate
The effective income tax rate on continuing operations in 2009 was lower than the 35% U.S. statutory tax rate due to $117.8 million in lower tax expense primarily resulting from the reversal of a U.S. valuation allowance and $4.9 million in lower taxes due to the nontaxable India gain, partially offset by $7.9 million in higher taxes due to the nondeductible Venezuela repatriation charge. (See Application of Critical Accounting Policies—Deferred Tax Asset Valuation Allowance on page 5557 for an explanation of a description of our accounting policy, assumptions used and a sensitivity analysis).
2008 Compared to U.S. Statutory Rate
The effective income tax rate on continuing operations in 2008 was lower than the 35% U.S. statutory tax rate due to a net $13.6 million decrease in our valuation allowance position in U.S. and non-U.S. jurisdictions as a result of our assessment of historical and future taxable income in these jurisdictions. In addition, there was a $13.0 million decrease in the non-U.S. tax provision, primarily due to the geographical mix of earnings in the foreign jurisdictions.
Other
As of December 31, 2010,2011, we have not recorded U.S. federal deferred income taxes on approximately $410$318 million of undistributed earnings of foreign subsidiaries and equity affiliates in accordance with Accounting Principles Board Opinion 23, Accounting for Income Taxes – Special Areas, as amended. We expect that these earnings will be permanently reinvested in operations outside the U.S. It is not practical to compute the estimated deferred tax liability on these earnings.
| | | Years Ended December 31, | | | % change | |
| (In millions) | | 2010 | | | 2009 | | | 2008 | | | 2010 | | | 2009 | |
| | | | | | | | | | | | | | | | |
| Net income attributable to noncontrolling interests | | $ | 15.7 | | | | 31.7 | | | | 39.8 | | | | (50 | ) | | | (20 | ) |
| | | | Years Ended December 31, | | | % change | | |
| | (In millions) | | 2011 | | 2010 | | 2009 | | | 2011 | | 2010 | |
| | | | | | | | | | | | | | | | | | | |
| | Net income attributable to noncontrolling interests | $ | 24.0 | | | 15.7 | | | 31.7 | | | | 53 | | | (50) | | |
The increase in net income attributable to noncontrolling interests in 2011 was primarily due to an increase in net income of our Venezuelan, Chilean and Colombian subsidiaries.
The decrease in net income attributable to noncontrolling interests in 2010 was primarily due to a decrease in the earnings of our Venezuelan subsidiaries as a result of reporting 2010 results at a less favorable exchange rate.
The decrease in net income attributable to noncontrolling interests in 2009 was primarily due to a decrease in the earnings of our Venezuelan operations driven mainly by the absence of the highly profitable 2008 currency conversion project.
Outlook for 2011. 2012.
We expect net income attributable to noncontrolling interests on a GAAP and non-GAAP basis to be $20-24$24 million to $28 million in 2011, up from $162012 as compared to $24 million reflectingon a GAAP basis and $23 million on a non-GAAP basis in 2011. Our 2012 outlook reflects expected increased earnings from non-wholly owned subsidiaries, including Venezuela. See page 41 for a summary of our 2012 Outlook.
Income from Discontinued Operations
| | | Years Ended December 31, | |
| (In millions) | | 2010 | | | 2009 | | | 2008 | |
| | | | | | | | | | |
| Brink’s Home Security Holdings, Inc. (“BHS”): | | | | | | | | | |
Income from operations before tax (a) | | $ | - | | | | - | | | | 105.4 | |
Expense associated with the spin-off | | | - | | | | - | | | | (13.0 | ) |
| | | | | | | | | | | | | |
| Adjustments to contingencies of former operations: | | | | | | | | | | | | |
Gain from FBLET refunds | | | - | | | | 19.7 | | | | - | |
BAX Global indemnification | | | 1.7 | | | | (13.2 | ) | | | - | |
Insurance recoveries related to BAX Global indemnification | | | 1.6 | | | | - | | | | - | |
Workers’ compensation | | | (7.2 | ) | | | (1.5 | ) | | | (1.0 | ) |
Other | | | 0.8 | | | | 1.8 | | | | 5.9 | |
| Income (loss) from discontinued operations before income taxes | | | (3.1 | ) | | | 6.8 | | | | 97.3 | |
| Provision (credit) for income taxes | | | (3.4 | ) | | | 2.3 | | | | 45.8 | |
| Income from discontinued operations, net of tax | | $ | 0.3 | | | | 4.5 | | | | 51.5 | |
(a) | Revenues of BHS were $442.4 million in 2008 (partial year). |
| | | | | Years Ended December 31, | |
| | (In millions) | | 2011 | | 2010 | | 2009 | |
| | | | | | | | | | | | | |
| | Adjustments to contingencies of former operations: | | | | | | | | | | |
| | | Gain from FBLET refunds | $ | 4.2 | | | - | | | 19.7 | | |
| | | BAX Global indemnification | | - | | | 1.7 | | | (13.2) | | |
| | | Insurance recoveries related to BAX Global indemnification | | 1.2 | | | 1.6 | | | - | | |
| | | Workers’ compensation | | (1.4) | | | (7.2) | | | (1.5) | | |
| | | Other | | (1.8) | | | 0.8 | | | 1.8 | | |
| | Income (loss) from discontinued operations before income taxes | | 2.2 | | | (3.1) | | | 6.8 | | |
| | Provision (credit) for income taxes | | 0.7 | | | (3.4) | | | 2.3 | | |
| | Income from discontinued operations, net of tax | $ | 1.5 | | | 0.3 | | | 4.5 | | |
Federal Black Lung Excise Tax (“FBLET”) refunds
The Energy Improvement and Extension Act of 2008 enabled taxpayers to file claims for FBLET refunds for periods prior to those open under the statute of limitations previously applicable statute of limitations.to us. In 2009, we received $23.9 million of FBLET refunds and recognized the majority of these refunds as a pre-taxpretax gain of $19.7 million.million in 2009. In the second quarter of 2011, the statute of limitations expired and we recognized a pretax gain of $4.2 million for the remaining portion of the refund.
BAX Global
BAX Global, a former business unit, had been defending a claim related to the apparent diversion by a third party of goods being transported for a customer. On April 23, 2010, the Dutch Supreme Court denied the final appeal of BAX Global, letting stand the lower court ruling that BAX Global is liable for this claim. We had contractually indemnified the purchaser of BAX Global for this contingency. We recognized €9 million ($13.2 million) related to this matter in discontinued operations in 2009, and made an $11.5 million payment in 2010 in satisfaction of the judgment. judgment, and reversed $1.7 million of expense in 2010. We have insurance coverage applicable to this matter and we have collected $1.6 millionrecovered a portion of the loss from insurance companies in 2010.
BHS Spin-off
On October 31, 2008, we distributed all of our interest in BHS to our shareholders of record as of the close of business on October 21, 2008, in a tax-free distribution. We distributed one share of BHS common stock for every share of our common stock outstanding. We contributed $50($1.2 million in cash to BHS at the time of the spin-off. We also forgave all the existing intercompany debt owed by BHS to us as of the distribution date.
BHS offered monitored security services in North America primarily for owner-occupied, single-family residences. To a lesser extent, BHS offered security services for commercial2011 and multi-family properties. BHS typically installed and owned the on-site security systems and charged fees to monitor and service the systems.
In connection with the spin-off, we entered into a Tax Matters Agreement with BHS which provided a basis for the preparation and filing of tax returns for pre-spin and post-spin operations of BHS in 2008. As authorized by the Tax Matters Agreement, we made certain elections related to BHS’ operations for our U.S. federal and state 2008 consolidated tax returns in 2009. These elections have the effect of decreasing the net deferred tax assets allocated to BHS at the time of the spin-off. As a result, we increased the amount of our current income tax receivable during 2009 by $26.8 million, with an offsetting increase in retained earnings to adjust the amount of the spin-off distribution.
After the spin-off, we reclassified BHS’ results of operations, including previously reported results and non-segment income (expense) directly related to the spin-off, within discontinued operations.
Interest Expense
Interest expense included in discontinued operations was $0.3$1.6 million in 2008. Interest expense recorded in discontinued operations includes only interest on third-party borrowings made directly by BHS.2010).
Summary of Selected Results and Outlook
2011 Revenue: Mid-to-high single-digit percentage organic growth over 2010
2011 Segment Margin: High end of 6.5% to 7.0% (includes effect of 2010 acquisitions)
| | | GAAP | | | Non-GAAP | |
| | | Full-Year 2010 | | | Full-Year 2011 Estimate | | | Full-Year 2010 | | | Full-Year 2011 Estimate | |
| | | | | | | | | | | | | |
| Non-Segment: | | | | | | | | | | | | |
General and administrative | | $ | 39 | | | | 40 | | | $ | 39 | | | | 40 | |
Retirement plans | | | 23 | | | | 25 | | | | 23 | | | | 25 | |
Royalty income (a) | | | (7 | ) | | | (2 | ) | | | (2 | ) | | | (2 | ) |
Acquisition loss (b) | | | 9 | | | | - | | | | - | | | | - | |
Other | | | - | | | | - | | | | - | | | | - | |
Non-Segment | | $ | 63 | | | | 63 | | | $ | 59 | | | | 63 | |
| | | | | | | | | | | | | | | | | |
| Effective income tax rate | | | 48 | % | | | 36% – 39 | % | | | 36 | % | | | 36% – 39 | % |
| | | | | | | | | | | | | | | | | |
| Interest Expense | | $ | 15 | | | | 20 – 24 | | | $ | 15 | | | | 20 – 24 | |
| | | | | | | | | | | | | | | | | |
| Net income attributable to | | | | | | | | | | | | | | | | |
| noncontrolling interests | | $ | 16 | | | | 20 – 24 | | | $ | 17 | | | | 20 – 24 | |
| | | | | | | | | | | | | | | | | |
| Property and equipment acquired during the year | | | | | | | | | | | | | | | | |
Capital expenditures (c) | | $ | 149 | | | | 190 – 200 | | | $ | 149 | | | | 190 – 200 | |
Capital leases | | | 34 | | | | 30 – 40 | | | | 34 | | | | 30 – 40 | |
Total | | | 183 | | | | 220 – 240 | | | | 183 | | | | 220 – 240 | |
| | | | | | | | | | | | | | | | | |
| Depreciation and amortization | | | 137 | | | | 160 – 170 | | | | 137 | | | | 160 – 170 | |
Amounts may not add due to rounding.
| | | | | | GAAP | | | | Non-GAAP |
| (In millions) | | | Full-Year | | Full-Year 2012 | | | | Full-Year | | Full-Year 2012 |
| | | | | | 2011 | | Estimate | | | | 2011 | | Estimate |
| | | | | | | | | | | | | | |
| | | | | | | | | | | | | | |
| Organic revenue growth | | | | | | | | | | | |
| | International | | | 12 % | | 7% – 10% | | | | 12 % | | 7% – 10% |
| | North America | | | - | | - | | | | - | | - |
| | | Total | | | 8 % | | 5% – 8% | | | | 8 % | | 5% – 8% |
| | | | | | | | | | | | | | |
| Currency impact on revenue | | | | | | | | | | | |
| | International | | | 5 % | | (4)% – (6)% | | | | 5 % | | (4)% – (6)% |
| | North America | | | 1 % | | - | | | | 1 % | | - |
| | | Total | | | 4 % | | (3)% – (5)% | | | | 4 % | | (3)% – (5)% |
| | | | | | | | | | | | | | |
| Segment margin | | | | | | | | | | | |
| | International | | | 6.9 % | | 7.0% – 8.0% | | | | 7.3 % | | 7.0% – 8.0% |
| | North America (a) | | | 3.2 % | | 3.6% – 4.6% | | | | 3.6 % | | 4.5% – 5.5% |
| | | Total | | | 5.9 % | | 6.5% – 7.0% | | | | 6.3 % | | 6.5% – 7.0% |
| | | | | | | | | | | | | | |
| Non-segment expense: | | | | | | | | | | | |
| | General and administrative | | $ | 43 | | 43 | | | $ | 43 | | 43 |
| | Retirement plans | | | 25 | | 47 | | | | - | | - |
| | Royalty income | | | (2) | | (2) | | | | (2) | | (2) |
| | CEO retirement costs (b) | | | 4 | | - | | | | - | | - |
| | Gains on acquisitions and asset dispositions (c) | | | (10) | | - | | | | - | | - |
| | | Non-segment Expense | | $ | 60 | | 89 | | | $ | 41 | | 41 |
| | | | | | | | | | | | | | |
| Effective income tax rate | | | 38 % | | 37% – 40% | | | | 39 % | | 37% – 40% |
| | | | | | | | | | | | | | |
| Interest expense | | $ | 24 | | 23 – 26 | | | $ | 24 | | 23 – 26 |
| | | | | | | | | | | | | | |
| Net income attributable to | | | | | | | | | | | |
| | noncontrolling interests | | $ | 24 | | 24 – 28 | | | $ | 23 | | 24 – 28 |
| | | | | | | | | | | | | | |
| Fixed assets acquired: | | | | | | | | | | | |
| | Capital expenditures | | $ | 196 | | 210 – 220 | | | $ | 196 | | 210 – 220 |
| | Capital leases (d) | | | 43 | | 30 – 40 | | | | 43 | | 30 – 40 |
| | | Total | | $ | 239 | | 240 – 260 | | | $ | 239 | | 240 – 260 |
| | | | | | | | | | | | | | |
| Depreciation and amortization | | $ | 162 | | 175– 190 | | | $ | 162 | | 175– 190 |
| | | | | | | | | | | | | | |
| Amounts may not add due to rounding. | | | | | | | | | | |
| (a) | Non-GAAP reflectsThe non-GAAP full-year 2012 estimate of North America Segment margin excludes $9 million of expense related to U.S. retirement plans that have been frozen, which amount has been included as an expense in the elimination of royalties from former home security unit in 2010.2012 GAAP margin estimate. |
| (b) | Amount is the net of $14 million remeasurement loss on our previously held noncontrolling interest in SPP and a $5 million bargain purchase gainTo eliminate costs related to the acquisitionretirement of a controlling interest in SPP.the former CEO. |
| (c) | The 2011 estimate includes $30 millionTo eliminate gain recognized on the sale of the U.S. document destruction business ($6.7 million), gains related to Mexico acquisition.acquisition of controlling interest in subsidiaries that were previously accounted for as equity or cost method investments ($2.5 million), and gains on sales of former operating assets ($0.5 million). |
| (d) | Includes capital leases for newly acquired assets only. Sales leaseback transactions that occurred during 2011 of $18 million for assets that were originally purchased and included as capital expenditures have been excluded from “Fixed assets acquired -- capital leases.” |
For more information about our outlook, see:
| · | page 2223 for organic revenue growth, |
| · | page 2223 for segment operating margin, |
| · | page 3435 non-segment expenses, |
| · | page 3738 for effective income tax rate, |
| · | page 3637 for interest expense, |
| · | page 3839 for net income attributable to noncontrolling interests, |
| · | page 4648 for property and equipment acquired during the year, and |
| · | page 4648 for depreciation and amortization. |
Non-GAAP Results – Reconciled to Amounts Reported under GAAP
Non-GAAP results described in this filing are financial measures that are not required by, or presented in accordance with generally accepted accounting principles (“GAAP”).GAAP.
Purpose of Non-GAAP Information
The purpose of the non-GAAP information is to report our financial information
| · | without certain income and expense items described below in 2008, 2009, 2010 and 2010,2011, |
| · | as if our results from Venezuela had been translated at the less-favorable parallel exchange rate in 2008 and 2009, and |
| · | after adjusting tax expense for items described below. |
The non-GAAP information provides information to assist comparability and estimates of future performance. Brink’s believesWe believe these measures are helpful in assessing operations and estimating future results and enable period-to-period comparability of financial performance. Non-GAAP results should not be considered as an alternative to revenue, income or earnings per share amounts determined in accordance with GAAP and should be read in conjunction with their GAAP counterparts.
| | | GAAP Basis | | | Re-measure Venezuelan Net Monetary Assets (a) | | | Royalty from BHS (b) | | | Exit Belgium CIT Business (c) | | | Mexico Acquisition (d) | | | Non-Segment Asset Sales (e) | | | Adjust Income Tax Rate (f) | | | Non-GAAP Basis | |
| | | | | | | | | | | | | | | | | | | | | | | | | |
| | | Full Year 2010 | |
| Operating profit: | | | | | | | | | | | | | | | | | | | | | | | | |
International | | $ | 164.8 | | | | 3.2 | | | | - | | | | 13.4 | | | | - | | | | - | | | | - | | | | 181.4 | |
North America | | | 44.1 | | | | - | | | | - | | | | - | | | | - | | | | - | | | | - | | | | 44.1 | |
Segment operating profit | | | 208.9 | | | | 3.2 | | | | - | | | | 13.4 | | | | - | | | | - | | | | - | | | | 225.5 | |
Non-segment | | | (62.6 | ) | | | - | | | | (4.9 | ) | | | - | | | | 8.6 | | | | - | | | | - | | | | (58.9 | ) |
Operating profit | | $ | 146.3 | | | | 3.2 | | | | (4.9 | ) | | | 13.4 | | | | 8.6 | | | | - | | | | - | | | | 166.6 | |
| | | | | | | | | | | | | | | | | | | | | | | | | | | | | | | | | |
| Amounts attributable to Brink’s: | | | | | | | | | | | | | | | | | | | | | | | | | | | | | | | | |
| Income from cont. ops. | | $ | 56.8 | | | | 2.0 | | | | (3.0 | ) | | | 7.8 | | | | 8.6 | | | | (3.0 | ) | | | 13.7 | | | | 82.9 | |
| Diluted EPS – cont. ops. | | | 1.17 | | | | 0.04 | | | | (0.06 | ) | | | 0.16 | | | | 0.18 | | | | (0.06 | ) | | | 0.29 | | | | 1.71 | |
| | (In millions, except for per share amounts) | GAAP Basis | | Gains on Acquisitions and Asset Dispositions (a) | | Belgium Settlement Charge (b) | | Mexico Employee Benefit Settlement Loss (c) | | CEO Retirement Costs (d) | | U.S. Retirement Plans (e) | | Adjust Income Tax Rate (f) | | Non-GAAP Basis | |
| | | | | | |
| | | | | | | | | | | | | | | | | | | | | |
| | | | | Full Year 2011 |
| | | | | | | | | | | | | | | | | | | | | |
| | Operating profit: | | | | | | | | | | | | | | | | | |
| | | International | $ | 199.7 | | - | | 10.1 | | 2.1 | | - | | - | | - | | 211.9 | |
| | | North America | | 31.4 | | - | | - | | - | | - | | 3.2 | | - | | 34.6 | |
| | | | Segment operating profit | | 231.1 | | - | | 10.1 | | 2.1 | | - | | 3.2 | | - | | 246.5 | |
| | | Non-segment | | (59.8) | | (9.7) | | - | | - | | 4.1 | | 24.8 | | - | | (40.6) | |
| | | | | $ | 171.3 | | (9.7) | | 10.1 | | 2.1 | | 4.1 | | 28.0 | | - | | 205.9 | |
| | | | | | | | | | | | | | | | | | | | | |
| | Amounts attributable to Brink’s: | | | | | | | | | | | | | | | | | |
| | Income from continuing operations | $ | 73.0 | | (9.6) | | 6.4 | | 1.5 | | 2.6 | | 17.7 | | - | | 91.6 | |
| | Diluted EPS – continuing operations | | 1.52 | | (0.20) | | 0.13 | | 0.03 | | 0.05 | | 0.37 | | - | | 1.90 | |
Amounts may not add due to rounding.
| (a) | To eliminate gain recognized on the sale of the U.S. Document Destruction business, gains on available-for-sale equity and debt securities, gains related to the acquisition of controlling interest in subsidiaries that were previously accounted for as equity or cost method investments, and gains on sales of former operating assets, as follows: |
| | | | | Full Year 2011 | |
| | | (In millions, except per share amounts) | | Operating Profit | | EPS | |
| | | | | | | | | | |
| | | Sale of U.S. Document Destruction business | $ | (6.7) | | | (0.09) | | |
| | | Gains on available-for-sale equity and debt securities | | - | | | (0.05) | | |
| | | Acquisition of controlling interests | | (2.5) | | | (0.05) | | |
| | | Sale of former operating assets | | (0.5) | | | (0.01) | | |
| | | | $ | (9.7) | | | (0.20) | | |
| (b) | To eliminate settlement charge related to exit of Belgium cash-in-transit business. |
| (c) | To eliminate employee benefit settlement loss related to Mexico. Portions of Brink’s Mexican subsidiaries’ accrued employee termination benefit were paid in the second and third quarters of 2011. The employee termination benefit is accounted for under FASB ASC Topic 715, Compensation – Retirement Benefits. Accordingly, the severance payments resulted in settlement losses. |
| (d) | To eliminate the costs related to the retirement of the former CEO. |
| (e) | To eliminate expenses related to U.S. retirement liabilities. |
| (f) | To adjust effective income tax rate to be equal to the full-year non-GAAP effective income tax rate. The non-GAAP effective tax rate for 2011 is 38.6%. |
| | Non-GAAP Results – Reconciled to Amounts Reported Under GAAP (Continued) |
| | | | | | GAAP Basis | | Remeasure Venezuelan Net Monetary Assets (a) | | Royalty (b) | | Exit Belgium CIT business (c) | | Mexico Acquisition (d) | | Non-Segment Asset Sales (e) | | U.S. Retirement Plans (f) | U.S. Healthcare Legislation Tax Charge (g) | | | Adjust Income Tax Rate (h) | | Non-GAAP Basis | |
| | | | | | | | | | | | | | | | | | | | | | | | | |
| | | | | Full Year 2010 |
| | Operating profit: | | | | | | | | | | | | | | | | | | | | | |
| | | International | $ | 164.8 | | 3.2 | | - | | 13.4 | | - | | - | | - | - | | | - | | 181.4 | |
| | | North America | | 44.1 | | - | | - | | - | | - | | - | | (1.0) | - | | | - | | 43.1 | |
| | | | Segment operating profit | | 208.9 | | 3.2 | | - | | 13.4 | | - | | - | | (1.0) | - | | | - | | 224.5 | |
| | | Non-segment | | (62.6) | | - | | (4.9) | | - | | 8.6 | | - | | 22.7 | - | | | - | | (36.2) | |
| | | | Operating profit | $ | 146.3 | | 3.2 | | (4.9) | | 13.4 | | 8.6 | | - | | 21.7 | - | | | - | | 188.3 | |
| | | | | | | | | | | | | | | | | | | | | | | | | |
| | Amounts attributable to Brink’s: | | | | | | | | | | | | | | | | | | | | | |
| | Income from continuing operations | $ | 56.8 | | 2.0 | | (3.0) | | 7.8 | | 8.6 | | (3.0) | | 13.5 | 13.7 | | | - | | 96.4 | |
| | Diluted EPS – continuing operations | | 1.17 | | 0.04 | | (0.06) | | 0.16 | | 0.18 | | (0.06) | | 0.28 | 0.29 | | | - | | 1.99 | |
Amounts may not add due to rounding.
| (a) | To reverse remeasurement gains and losses in Venezuela. For accounting purposes, Venezuela is considered a highly inflationary economy. Under U.S. GAAP, subsidiaries that operate in Venezuela record gains and losses in earnings for the remeasurement of bolivar fuerte-denominated net monetary assets. |
| (b) | To eliminate royalty income from Brink’s Home Security.former home security business. |
| (c) | To eliminate loss on exit of Belgium cash-in-transit (CIT) business. |
| (d) | To eliminate a bargain purchase gainloss recognized related to the acquisition of a controlling interest in Mexico and a loss from the remeasurement of a previously held noncontrolling interest which wassubsidiary previously accounted for as a cost-method investment.cost method investment and bargain purchase gain in Mexico. |
| (e) | To eliminate gain on exchange of marketable equity securities. |
| (f) | The full-year 2010 non-GAAP tax expense excludesTo eliminate expenses related to U.S. retirement liabilities. |
| (g) | To eliminate $13.7 million of tax expense related to the reversal of a deferred tax asset as a result of U.S. healthcare legislation as well aslegislation. |
| (h) | To adjust the effective income tax effect ofrate to be equal to the other pretax non-GAAP adjustments. The full-year non-GAAP effective income tax rate. The non-GAAP effective tax rate for 2010 was 36%36.2%. |
Non-GAAP Results – Reconciled
| | Non-GAAP Results – Reconciled to Amounts Reported Under GAAP (Continued) |
| | | | | | GAAP Basis | | Change to Parallel Rate (a) | | Venezuelan Currency Losses (b) | | Acquisition Gain (c) | | Royalty (d) | | Non-Segment Asset Sales (e) | | U.S. Retirement Plans (f) | | Adjust Income Tax Rate (g) | | Non-GAAP Basis | |
| | | | | | | | | | | | | | | | | | | | | | | |
| | | | | Full Year 2009 |
| | Revenues: | | | | | | | | | | | | | | | | | | | |
| | | Latin America | $ | 904.7 | | (237.9) | | - | | - | | - | | - | | - | | - | | 666.8 | |
| | | EMEA | | 1,257.5 | | - | | - | | - | | - | | - | | - | | - | | 1,257.5 | |
| | | Asia Pacific | | 78.7 | | - | | - | | - | | - | | - | | - | | - | | 78.7 | |
| | | | International | | 2,240.9 | | (237.9) | | - | | - | | - | | - | | - | | - | | 2,003.0 | |
| | | North America | | 894.1 | | - | | - | | - | | - | | - | | - | | - | | 894.1 | |
| | | | Revenues: | $ | 3,135.0 | | (237.9) | | - | | - | | - | | - | | - | | - | | 2,897.1 | |
| | Operating profit: | | | | | | | | | | | | | | | | | | | |
| | | International | $ | 156.8 | | (43.0) | | 4.5 | | - | | - | | - | | - | | - | | 118.3 | |
| | | North America | | 56.6 | | - | | - | | - | | - | | - | | (2.0) | | - | | 54.6 | |
| | | | Segment operating profit | | 213.4 | | (43.0) | | 4.5 | | - | | - | | - | | (2.0) | | - | | 172.9 | |
| | | Non-segment | | (46.6) | | - | | 22.5 | | (14.9) | | (6.8) | | (9.6) | | 20.7 | | - | | (34.7) | |
| | | | Operating profit | $ | 166.8 | | (43.0) | | 27.0 | | (14.9) | | (6.8) | | (9.6) | | 18.7 | | - | | 138.2 | |
| | | | | | | | | | | | | | | | | | | | | | | |
| | Amounts attributable to Brink’s: | | | | | | | | | | | | | | | | | | | |
| | Income from continuing operations | $ | 195.7 | | (23.2) | | 25.2 | | (14.9) | | (4.3) | | (5.9) | | 11.7 | | (117.6) | | 66.7 | |
| | Diluted EPS – continuing operations | | 4.11 | | (0.49) | | 0.53 | | (0.31) | | (0.09) | | (0.12) | | 0.25 | | (2.48) | | 1.40 | |
Amounts may not add due to Amounts Reported Under GAAP (Continued)rounding.
| | | GAAP Basis | | | Change to Parallel Rate (a) | | | Venezuelan Currency Losses (b) | | | Acquisition Gain (c) | | | Royalty from BHS (d) | | | Non-Segment Asset Sales (e) | | | Adjust Income Tax Rate (f) | | | Non-GAAP Basis | |
| | | Full Year 2009 | |
| Revenues: | | | | | | | | | | | | | | | | | | | | | | | | |
EMEA | | $ | 1,257.5 | | | | - | | | | - | | | | - | | | | - | | | | - | | | | - | | | | 1,257.5 | |
Latin America | | | 904.7 | | | | (237.9 | ) | | | - | | | | - | | | | - | | | | - | | | | - | | | | 666.8 | |
Asia Pacific | | | 78.7 | | | | - | | | | - | | | | - | | | | - | | | | - | | | | - | | | | 78.7 | |
International | | | 2,240.9 | | | | (237.9 | ) | | | - | | | | - | | | | - | | | | - | | | | - | | | | 2,003.0 | |
North America | | | 894.1 | | | | - | | | | - | | | | - | | | | - | | | | - | | | | - | | | | 894.1 | |
Revenues | | $ | 3,135.0 | | | | (237.9 | ) | | | - | | | | - | | | | - | | | | - | | | | - | | | | 2,897.1 | |
| Operating profit: | | | | | | | | | | | | | | | | | | | | | | | | | | | | | | | | |
International | | $ | 156.8 | | | | (43.0 | ) | | | 4.5 | | | | - | | | | - | | | | - | | | | - | | | | 118.3 | |
North America | | | 56.6 | | | | - | | | | - | | | | - | | | | - | | | | - | | | | - | | | | 56.6 | |
Segment operating profit | | | 213.4 | | | | (43.0 | ) | | | 4.5 | | | | - | | | | - | | | | - | | | | - | | | | 174.9 | |
Non-segment | | | (46.6 | ) | | | - | | | | 22.5 | | | | (14.9 | ) | | | (6.8 | ) | | | (9.6 | ) | | | - | | | | (55.4 | ) |
Operating profit | | $ | 166.8 | | | | (43.0 | ) | | | 27.0 | | | | (14.9 | ) | | | (6.8 | ) | | | (9.6 | ) | | | - | | | | 119.5 | |
| Amounts attributable to Brink’s: | | | | | | | | | | | | | | | | | | | | | | | | | | | | | |
| Income - continuing operations | | $ | 195.7 | | | | (23.2 | ) | | | 25.2 | | | | (14.9 | ) | | | (4.3 | ) | | | (5.9 | ) | | | (117.6 | ) | | | 55.0 | |
| Diluted EPS – cont. ops. | | | 4.11 | | | | (0.49 | ) | | | 0.53 | | | | (0.31 | ) | | | (0.09 | ) | | | (0.12 | ) | | | (2.48 | ) | | | 1.16 | |
| | | Full Year 2008 | |
| Revenues: | | | | | | | | | | | | | | | | | | | | | | | | | | | | | | | | |
EMEA | | $ | 1,358.9 | | | | - | | | | - | | | | - | | | | - | | | | - | | | | - | | | | 1,358.9 | |
Latin America | | | 800.6 | | | | (173.4 | ) | | | - | | | | - | | | | - | | | | - | | | | - | | | | 627.2 | |
Asia Pacific | | | 71.8 | | | | - | | | | - | | | | - | | | | - | | | | - | | | | - | | | | 71.8 | |
International | | | 2,231.3 | | | | (173.4 | ) | | | - | | | | - | | | | - | | | | - | | | | - | | | | 2,057.9 | |
North America | | | 932.2 | | | | - | | | | - | | | | - | | | | - | | | | - | | | | - | | | | 932.2 | |
Revenues | | $ | 3,163.5 | | | | (173.4 | ) | | | - | | | | - | | | | - | | | | - | | | | - | | | | 2,990.1 | |
| Operating profit: | | | | | | | | | | | | | | | | | | | | | | | | | | | | | | | | |
International | | $ | 215.0 | | | | (48.8 | ) | | | - | | | | - | | | | - | | | | - | | | | - | | | | 166.2 | |
North America | | | 56.9 | | | | - | | | | - | | | | - | | | | - | | | | - | | | | - | | | | 56.9 | |
Segment operating profit | | | 271.9 | | | | (48.8 | ) | | | - | | | | - | | | | - | | | | - | | | | - | | | | 223.1 | |
Non-segment | | | (43.4 | ) | | | - | | | | - | | | | - | | | | (1.1 | ) | | | (13.1 | ) | | | - | | | | (57.6 | ) |
Operating profit | | $ | 228.5 | | | | (48.8 | ) | | | - | | | | - | | | | (1.1 | ) | | | (13.1 | ) | | | - | | | | 165.5 | |
| Amounts attributable to Brink’s: | | | | | | | | | | | | | | | | | | | | | | | | | | | | | |
| Income - continuing operations | | $ | 131.8 | | | | (25.1 | ) | | | - | | | | - | | | | (0.7 | ) | | | (8.1 | ) | | | - | | | | 97.9 | |
| Diluted EPS – cont. ops. | | | 2.82 | | | | (0.53 | ) | | | - | | | | - | | | | (0.01 | ) | | | (0.17 | ) | | | - | | | | 2.10 | |
| (a) | To reduce revenues and segment operating income to reflect the 2009 and 2008 results of Venezuelan subsidiaries had they been translated using the parallel currency exchange rate in effect at the time. The average parallel exchange rate used for the non-GAAP full-year earnings was 6.06.00 bolivar fuertes to the U.S. dollar, compared to an average rate of 2.22.21 bolivar fuertes to the U.S. dollar that was used for the GAAP financial statements. The official rate of 2.15 bolivar fuertes to the U.S. dollar was used for translation of Venezuela for most of 2009 until the parallel rate was adopted during December. The use of the weaker rate to translate 20092009’s non-GAAP revenues and earnings of the Venezuelan subsidiaries decreased each measure by 63%. |
| (b) | To eliminate currency losses incurred in Venezuela related to increases in cash held in U.S. dollars by Venezuelan subsidiaries. These losses would not have been incurred had the operations been translated at the parallel rate. |
| (c) | To eliminate gains/losses recognized related to acquisitions of controlling interests in subsidiaries that were previously accounted for as equity method investments. |
| (d) | To eliminate royalty income from Brink’s Home Security.former home security business. |
| (e) | To eliminate certain2009 non-segment gains on sales of assets.property and other assets and 2010 exchange of marketable equity securities. |
| (f) | To eliminate expenses related to U.S. retirement liabilities. |
| (g) | The full-year 2009 non-GAAP effective income tax rate is equal to the 2009 GAAP effective income tax rate revised to excludeexpense excludes $118 million of income tax benefits that were recorded under GAAP in 2009 related to athe reduction in the amount of valuation allowance needed for U.S. deferred tax assets as a result of improved investments in retirement plans and improved credit markets.markets as well as the tax effect of the other pretax non-GAAP adjustments. The full-year non-GAAP effective income tax rate for 2009 was 36.8%. |
We currently serve customers in more than 100 countries, including approximately 50 countries where we operate subsidiaries.
We are subject to risks customarily associated with doing business in foreign countries, including labor and economic conditions, political instability, controls on repatriation of earnings and capital, nationalization, expropriation and other forms of restrictive action by local governments. Changes in the political or economic environments in the countries in which we operate could have a material adverse effect on our business, financial condition and results of operations. The future effects, if any, of these risks cannot be predicted.are unknown.
Our international operations conduct a majority of their business in local currencies. Because our financial results are reported in U.S. dollars, they are affected by changes in the value of various local currencies in relation to the U.S. dollar. Brink’s Venezuela is subject to local laws and regulatory interpretations that determine the exchange rate at which repatriating dividends may be converted. See Application of Critical Accounting Policies—Foreign Currency Translation on page 6264 for a description of our accounting methods and assumptions used to include our Venezuelan operation in our consolidated financial statements, and a description of the accounting for subsidiaries operating in highly inflationary economies.
Changes in exchange rates may also affect transactions which are denominated in currencies other than the functional currency. From time to time, we use foreign currency forward and swap contracts to hedge transactional risks associated with foreign currencies, as discussed in Item 7A on page 67.68. At December 31, 2010, no material2011, the notional value of our outstanding foreign currency forward contracts were outstanding.
was $72.8 million with average contract maturities of less than 1 month. The foreign currency contracts primarily offset exposures in the Mexican peso and the euro. These contracts are not designated as hedges for accounting purposes, and accordingly, changes in their fair value are recorded immediately in earnings. We recognized gains of $1.0 million on our foreign currency contracts in 2011. At December 31, 2011, the fair value of these outstanding contracts was an asset of $0.4 million which was included in prepaid and other on the consolidated balance sheet.
LIQUIDITY AND CAPITAL RESOURCES
Over the last three years, we have used cash generated from our continuing operations to
| · | invest in the infrastructure of our business (new facilities, cash sorting and other equipment for our cash logistics operations, armored trucks, CompuSafe® units, and customer-facing and back-office information technology) ($485516 million), |
| · | acquire businesses ($187178 million) including $101 million in 2010, primarily in Mexico and Canada, and $75 million in BRIC (Brazil, Russia, India and China) countries in 2009, |
| · | repurchase shares of our stock ($97 million), |
· | make voluntary contributions to our primary U.S. pension plan ($92 million)million in 2009), and |
| · | pay dividends ($56 million)., and |
| · | repurchase shares of our common stock ($41 million) |
In addition, we contributed $50 millionWe entered into a new master lease agreement in late 2009 to our home security business prior tofinance the spin offacquisition of new armored vehicles in the business to our shareholders in 2008.U.S. Vehicles acquired under the 2009 lease agreement have been accounted for as capital leases. Vehicles acquired under the previous master lease agreement were accounted for as operating leases.
Outlook
| · | We continue to consider acquisition opportunities in the secure transportation and cash logistics industry and in adjacent security markets. We may use our cash from operations and borrowings to fund the purchase of these acquisitions. |
| · | We may be requiredexpect our capital expenditures in 2012 to contribute cashincrease from the amounts spent in 2011 as we continue to invest in armored vehicles, facilities and technology. We expect capital expenditures to decrease in North America, and increase in our U.S. pension plans in the future, and the amount of contributions may exceed the amount of cash provided by our U.S. subsidiaries. We may choose to borrow cash in the U.S. rather than pay incremental taxes that we would owe upon repatriation.International segment. |
| · | We began translating cash flows from our Venezuelan operations at a less favorable rate late in 2009. As a result, our cash flow amounts reported for these operations in 2010 and the future will be lower than priorrequired to make contributions of $32 million to our primary U.S. pension plan in 2012. Based on current assumptions, we expect to make additional contributions totalling $197 million during the next five years. We intend to contribute company stock for some or all of the required 2012 contribution and we may choose to contribute company stock for future required contributions. |
Summary Cash Flow Information
| | | Years Ended December 31, | | | $ change | |
| (In millions) | | 2010 | | | 2009 | | | 2008 | | | 2010 | | | 2009 | |
| | | | | | | | | | | | | | | | |
| Cash flows from operating activities | | | | | | | | | | | | | | | |
Continuing operations: | | | | | | | | | | | | | | | |
Before contributions to U.S. pension plan and change in customer obligations and income tax payments | | $ | 272.2 | | | | 276.7 | | | | 323.6 | | | $ | (4.5 | ) | | | (46.9 | ) |
Payment of income taxes | | | (65.5 | ) | | | (12.6 | ) | | | (69.2 | ) | | | (52.9 | ) | | | 56.6 | |
Increase in customer obligations | | | 38.5 | | | | - | | | | - | | | | 38.5 | | | | - | |
Contributions to primary U.S. pension plan | | | - | | | | (92.4 | ) | | | - | | | | 92.4 | | | | (92.4 | ) |
Subtotal | | | 245.2 | | | | 171.7 | | | | 254.4 | | | | 73.5 | | | | (82.7 | ) |
Discontinued operations | | | (9.9 | ) | | | 23.5 | | | | 172.7 | | | | (33.4 | ) | | | (149.2 | ) |
Operating activities | | | 235.3 | | | | 195.2 | | | | 427.1 | | | | 40.1 | | | | (231.9 | ) |
| | | | | | | | | | | | | | | | | | | | | |
| Cash flows from investing activities | | | | | | | | | | | | | | | | | | | | |
Capital expenditures | | | (148.8 | ) | | | (170.6 | ) | | | (165.3 | ) | | | 21.8 | | | | (5.3 | ) |
Acquisitions | | | (100.7 | ) | | | (74.6 | ) | | | (11.7 | ) | | | (26.1 | ) | | | (62.9 | ) |
Cash held by BHS at the spin-off date | | | - | | | | - | | | | (50.0 | ) | | | - | | | | 50.0 | |
Other | | | (5.9 | ) | | | 4.1 | | | | 17.9 | | | | (10.0 | ) | | | (13.8 | ) |
Discontinued operations | | | - | | | | - | | | | (150.8 | ) | | | - | | | | 150.8 | |
Investing activities | | | (255.4 | ) | | | (241.1 | ) | | | (359.9 | ) | | | (14.3 | ) | | | 118.8 | |
| | | | | | | | | | | | | | | | | | | | | |
| Cash flows before financing activities | | $ | (20.1 | ) | | | (45.9 | ) | | | 67.2 | | | $ | 25.8 | | | | (113.1 | ) |
Operating| | | | | | Years Ended December 31, | | $ change |
| | (In millions) | | 2011 | 2010 | 2009 | | | 2011 | | 2010 | |
| | | | | | | | | | | | | | |
| | Cash flows from operating activities | | | | | | | | | | |
| | | Non-GAAP basis | $ | 257.3 | 206.7 | 245.6 | | $ | 50.6 | | (38.9) | |
| | | (Decrease) increase in certain customer obligations (a) | | (11.7) | 38.5 | - | | | (50.2) | | 38.5 | |
| | | Contribution to primary U.S. pension plan, net of current tax benefit (b) | | - | - | (73.9) | | | - | | 73.9 | |
| | | Discontinued operations (c) | | 1.4 | (9.9) | 23.5 | | | 11.3 | | (33.4) | |
| | | | GAAP basis | $ | 247.0 | 235.3 | 195.2 | | $ | 11.7 | | 40.1 | |
| (a) | To eliminate the change in the balance of customer obligations related to cash received and processed in certain of our secure cash logistics operations. The title to this cash transfers to us for a short period of time. The cash is generally credited to customers’ accounts the following day and we do not consider it as available for general corporate purposes in the management of our liquidity and capital resources. |
| (b) | To eliminate the net-of-tax cash contributions to the primary U.S. pension plan in 2009 ($92.4 million cash contribution, net of the related $18.5 million current tax benefit). |
| (c) | To eliminate cash flows related to our discontinued operations. |
Non-GAAP cash flows from operating activities are supplemental financial measures that are not required by, or presented in accordance with GAAP. The purpose of the non-GAAP cash flows from operating activities is to report financial information excluding the impact of cash received and processed in certain of our secure cash logistics operations, without cash flows from discontinued operations and excluding the 2009 cash contributions to the primary U.S. pension plan, net of related current tax benefits. Brink’s believes these measures are helpful in assessing cash flows from operations, enable period-to-period comparability and are useful in predicting future operating cash flows. Non-GAAP cash flows from operating activities should not be considered as an alternative to cash flows from operating activities determined in accordance with GAAP and should be read in conjunction with our consolidated statements of cash flows.
2011 versus 2010
On a GAAP basis, operating cash flows increased by $11.7 million in 2011 compared to 2010 as a result of a $0.4 million increase in cash flows from continuing operations and an $11.3 million decrease in cash used by discontinued operations. Cash flows from discontinued operations improved because the prior year period included $11.5 million in cash outflow for a legal claim associated with BAX Global, a former business unit. Cash from continuing operations increased $0.4 million due to higher operating profit and an increase in cash flows from working capital, partially offset by a $50.2 million decrease in cash flows due to change in customer obligations for cash held by logistics and a $10 million legal settlement payment related to the exit of our Belgium CIT business and an increase in interest payments. The amount of cash generated by operating profit was higher than the increase in operating profit primarily because noncash depreciation and amortization expenses were higher in 2011 compared to 2010 driven by fixed assets acquired in 2010 and the Mexican acquisition in November 2010.
On a Non-GAAP basis, cash flows from operating activities increased by $50.6 million. The increase in cash flows was primarily due to higher operating profit and an increase in cash flows from working capital, partially offset by a $10 million legal settlement payment related to the exit of our Belgium CIT business and an increase in interest payments. The amount of cash generated by operating profit was higher than the increase in operating profit primarily because noncash depreciation and amortization expenses were higher in 2011 compared to 2010 driven by new fixed asset acquisitions in the second half of 2010 and the Mexican acquisition in November 2010.
Mr. Michael Dan, former president and CEO, retired in December 2011 and was paid $5.2 million as provided for under his succession agreement. Mr. Dan is also owed an $11.6 million pension benefit payment in 2012, of which $10.1 million was paid in January 2012. These pension benefits have been funded by assets in an existing grantor trust. He will also receive in 2012 a distribution of company stock for his accumulated deferred compensation, net of minimum tax withholding.
2010 versus 2009
On a GAAP basis, operating cash flows increased by $40.1 million in 2010 compared to 2009 as a result of a $73.5 million increase in cash flowflows from continuing operations, offset by a $33.4 million decrease in cash flow from discontinued operations.
Operating cash flows from continuing operations were higher in 2010 mainly due to a $92.4 million cash contribution made in 2009 to our U.S. pension plan. Our operating cash flows in 2009 also included $43 million of income tax refunds, much of which were primarily the result of tax deductions associated with the U.S. pension cash contribution and $57.6 million of Brink’s common stock that was also contributed to the plan. In certain cash logistics operations, title to the cash we receive and process transfers to us for a short period of time but is then generally credited to customers’ accounts the following day. We do not consider this cash as available for general corporate purposes. The increase in amounts owed to customers for these cash processing operations contributed $38.5 million to t hethe increase in operating cash flows.
Excluding the effect of the pension contribution, income tax payments and the increase in customer obligations, operating cash flows declined by $4.5 million in 2010 compared to 2009. The decrease was primarily due to an increase in the use of cash flows for working capital needs.
The decrease in cash flows provided by discontinued operations resulted from the receipt of $23.7 million Federal Black Lung Excise Tax cash refunds in 2009 compared to an $11.5 million 2010 payment for a legal claim associated with BAX Global, a former business unit. We have insurance coverage applicable to this matter and collected $1.6 million from insurance companies in the third quarter of 2010. We believe that we will recover the BAX Global-related legal claim payment less amounts paid by the insurance providers to litigate the matter.
Operating cash flows decreased by $231.9 million in 2009 asOn a Non-GAAP basis, cash flows from both our continuing and discontinued operations were lowerdeclined by $38.9 million in 2010 compared to 2008.2009. The decrease in operating cash flows from continuing operations was mainlyprimarily due to the third-quarter 2009 contribution to our primary U.S. pension plan,effects of which $92.4 million was made in cash. While not affecting our cash flow, we also contributed $57.6 million in Brink’s stock to our pension, for a total contribution of $150 million to the plan. The pension contribution cash outflow was partially offset byreceiving $43 million in income tax refunds much of which were primarily the result of tax deductions associated with the cash and stock contribution to the pension plan. Lower operating profit in 2009 also had a negative effect on cash flows from operatio ns although we used lessas well as an increase in the use of cash for working capital needs.
The decreaseneeds in operating cash flows related to discontinued operations was primarily due to BHS’ cash flows in 2008 exceeding FBLET cash refunds, the primary source of operating cash flows from discontinued operations in 2009.2010.
| | | | | | Years Ended December 31, | | $ change |
| | (In millions) | | 2011 | 2010 | 2009 | | | 2011 | | 2010 | |
| | | | | | | | | | | | | | |
| | Cash flows from investing activities | | | | | | | | | | |
| | | Capital expenditures | $ | (196.2) | (148.8) | (170.6) | | $ | (47.4) | | 21.8 | |
| | | Acquisitions | | (3.0) | (100.7) | (74.6) | | | 97.7 | | (26.1) | |
| | | Other | | 27.4 | (5.9) | 4.1 | | | 33.3 | | (10.0) | |
| | | | Investing activities | $ | (171.8) | (255.4) | (241.1) | | $ | 83.6 | | (14.3) | |
The cash used by investing activities in 2011 was lower than 2010 as a result of $100.7 million of cash used in 2010 to purchase new businesses, primarily operations in Mexico and Canada, offset by higher capital expenditures in 2011, as described below. In addition, we had higher proceeds from the sale of investments and other property in 2012.
Cash flows from investing activities decreased by $14.3 million in 2010 primarily due to a $26.1 million increase in cash used to acquire businesses, partially offset by a $21.8 million decrease in capital expenditures as a result of an increase in the use of capital leases to acquire armored vehicles and CompuSafe® units in North America.
Cash flows from investing activities used $118.8 million less cash in 2009 versus 2008 primarily due to the spin-off of BHS in 2008. BHS used $150.8 million in 2008 primarily for the installation of home security equipment for customers, and we contributed $50 million to BHS at the date of the spin-off. Our continuing operations used more cash for investing activities in 2009 compared to 2008 for business acquisitions and higher capital expenditures, partially offset by proceeds from the sale of assets.
Capital expenditures and depreciation and amortization are as follows:
| | | Outlook | | | Years Ended December 31, | | | $ change | |
| (In millions) | | 2011 | | | 2010 | | | 2009 | | | 2008 | | | 2010 | | | 2009 | |
| | | | | | | | | | | | | | | | | | | |
| Property and Equipment Acquired during the year | | | | | | | | | | | | | | | | | | |
| | | | | | | | | | | | | | | | | | | |
| Capital expenditures: | | | | | | | | | | | | | | | | | | |
International | | $ | (a | ) | | | 110.7 | | | | 103.1 | | | | 112.7 | | | $ | 7.6 | | | | (9.6 | ) |
North America | | (a) | | | | 38.1 | | | | 67.5 | | | | 52.6 | | | | (29.4 | ) | | | 14.9 | |
| Capital expenditures | | $ | 190-200 | | | | 148.8 | | | | 170.6 | | | | 165.3 | | | $ | (21.8 | ) | | | 5.3 | |
| | | | | | | | | | | | | | | | | | | | | | | | | |
Capital leases (b): | | | | | | | | | | | | | | | | | | | | | | | | |
International | | $ | (a | ) | | | 4.1 | | | | 13.4 | | | | 8.0 | | | $ | (9.3 | ) | | | 5.4 | |
North America | | (a) | | | | 29.8 | | | | - | | | | - | | | | 29.8 | | | | - | |
| Capital leases | | $ | 30-40 | | | | 33.9 | | | | 13.4 | | | | 8.0 | | | $ | 20.5 | | | | 5.4 | |
| | | | | | | | | | | | | | | | | | | | | | | | | |
| Total: | | | | | | | | | | | | | | | | | | | | | | | | |
International | | $ | (a | ) | | | 114.8 | | | | 116.5 | | | | 120.7 | | | $ | (1.7 | ) | | | (4.2 | ) |
North America | | (a) | | | | 67.9 | | | | 67.5 | | | | 52.6 | | | | 0.4 | | | | 14.9 | |
| Total | | $ | 220-240 | | | | 182.7 | | | | 184.0 | | | | 173.3 | | | $ | (1.3 | ) | | | 10.7 | |
| | | Outlook | | | Years Ended December 31, | | | $ change | |
| (In millions) | | 2011 | | | 2010 | | | 2009 | | | 2008 | | | 2010 | | | 2009 | |
| | | | | | | | | | | | | | | | | | | |
| Depreciation and amortization | | | | | | | | | | | | | | | | | | |
| | | | | | | | | | | | | | | | | | | |
| Depreciation and amortization: | | | | | | | | | | | | | | | | | | |
International | | $ | (a | ) | | | 92.6 | | | | 97.5 | | | | 90.5 | | | $ | (4.9 | ) | | | 7.0 | |
North America | | (a) | | | | 44.0 | | | | 37.6 | | | | 31.8 | | | | 6.4 | | | | 5.8 | |
| Depreciation and amortization | | $ | 160-170 | | | | 136.6 | | | | 135.1 | | | | 122.3 | | | $ | 1.5 | | | | 12.8 | |
| | | | | | | | | | | | | | | | | | | | | |
| | | | | | Outlook | | Years Ended December 31, | | | $ change | |
| | (In millions) | | 2012 | | 2011 | 2010 | 2009 | | | 2011 | | 2010 | |
| | | | | | | | | | | | | | | | | | | | | |
| | Property and Equipment Acquired during the year | | | | | | | | | | | | | | | | | |
| | | | | | | | | | | | | | | | | | | | | |
| | Capital expenditures: | | | | | | | | | | | | | | | | | |
| | | International | $ | (a) | | 144.8 | | 110.7 | | 103.1 | | | $ | 34.1 | | | 7.6 | | |
| | | North America | | (a) | | 51.4 | | 38.1 | | 67.5 | | | | 13.3 | | | (29.4) | | |
| | | | Capital expenditures | $ | 210 – 220 | | 196.2 | | 148.8 | | 170.6 | | | $ | 47.4 | | | (21.8) | | |
| | | | | | | | | | | | | | | | | | | | | |
| | Capital leases (b): | | | | | | | | | | | | | | | | | |
| | | International | $ | (a) | | 7.6 | | 4.1 | | 13.4 | | | $ | 3.5 | | | (9.3) | | |
| | | North America | | (a) | | 35.4 | | 29.8 | | - | | | | 5.6 | | | 29.8 | | |
| | | | Capital leases | $ | 30 – 40 | | 43.0 | | 33.9 | | 13.4 | | | $ | 9.1 | | | 20.5 | | |
| | | | | | | | | | | | | | | | | | | | | |
| | Total: | | | | | | | | | | | | | | | | | |
| | | International | $ | (a) | | 152.4 | | 114.8 | | 116.5 | | | $ | 37.6 | | | (1.7) | | |
| | | North America | | (a) | | 86.8 | | 67.9 | | 67.5 | | | | 18.9 | | | 0.4 | | |
| | | | Total | $ | 240 – 260 | | 239.2 | | 182.7 | | 184.0 | | | $ | 56.5 | | | (1.3) | | |
| | | | | | | | | | | | | | | | | | | | | |
| | Depreciation and amortization | | | | | | | | | | | | | | | | | |
| | | | | | | | | | | | | | | | | | | | | |
| | | International | $ | (a) | | 105.8 | | 92.6 | | 97.5 | | | $ | 13.2 | | | (4.9) | | |
| | | North America | | (a) | | 56.6 | | 44.0 | | 37.6 | | | | 12.6 | | | 6.4 | | |
| | | | Depreciation and amortization | $ | 175 – 190 | | 162.4 | | 136.6 | | 135.1 | | | $ | 25.8 | | | 1.5 | | |
| (b) | Represents the amount of property and equipment acquired using capital leases. Since the assets are acquired without using cash, the amounts are not included in the consolidated cash flow statement. Amounts are provided here to assist in the comparison of assets acquired in the current year versus prior years. |
Capital expenditures in 2011 were primarily for information technology, armored vehicles and new cash processing and security equipment. Capital expenditures in 2011 increased when compared to 2010 primarily due to an increase in our International segment. The increase in our International segment is largely due to capital expenditures in Mexico.
Capital expenditures in 2010 were primarily for new cash processing and security equipment, armored vehicles, information technology and CompuSafe® units. Capital expenditures in 2010 decreased mainly due to lower expenditures in our North America segment. The decrease in our North America segment was mainly due to fewer purchases ofan increase in leasing armored vehicles and CompuSafe® units, as we leased rather than purchased those assets.units.
Capital expenditures in 2009 were slightly higher than the same period of 2008.
· | Capital expenditures in 2009 were primarily for new cash processing and security equipment, armored vehicles, and information technology. |
· | Higher capital expenditures in our North America segment were partially offset by a decrease in our International segment. |
· | The increase in our North America segment was mainly due to higher expenditures for armored vehicles, as we elected to buy rather than lease these vehicles, as well as increased spending on CompuSafe® units. |
· | The decrease in Brink’s International capital expenditures from the prior-year period was due to lower spending overall, as well as the changes in currency exchange rates. |
Capital expenditures have exceeded depreciation and amortization in the last several years and this trend is expected to continue in the next several years as a result of growth in the infrastructure of our operations, including new branch facilities and leasehold improvements, growth in technology investments, and investment in the safety and security of our operations.
Summary of Financing Activities
| | | Years Ended December 31, | |
| (In millions) | | 2010 | | | 2009 | | | 2008 | |
| | | | | | | | | | |
| Cash provided (used) by financing activities | | | | | | | | | |
| Borrowings and repayments: | | | | | | | | | |
Short-term debt | | $ | 27.1 | | | | (0.9 | ) | | | (4.4 | ) |
Long-term revolving credit facilities | | | 121.2 | | | | (10.1 | ) | | | 93.5 | |
Other long-term debt | | | (15.9 | ) | | | (11.3 | ) | | | (12.6 | ) |
| Debt financing costs | | | (2.5 | ) | | | - | | | | - | |
| Cash proceeds from sale-leaseback | | | 1.2 | | | | 13.6 | | | | - | |
| Repurchase shares of common stock of Brink’s | | | (33.7 | ) | | | (6.9 | ) | | | (56.6 | ) |
| Dividends attributable to: | | | | | | | | | | | | |
Shareholders of Brink’s | | | (18.9 | ) | | | (18.4 | ) | | | (18.2 | ) |
Noncontrolling interests in subsidiaries | | | (18.4 | ) | | | (13.7 | ) | | | (12.4 | ) |
| Proceeds and tax benefits related to stock compensation and other | | | (0.1 | ) | | | 1.1 | | | | 11.1 | |
Cash flows from financing activities | | $ | 60.0 | | | | (46.6 | ) | | | 0.4 | |
| | | | | | Years Ended December 31, | |
| | (In millions) | | 2011 | | | 2010 | | | 2009 | |
| | | | | | | | | | | | | | |
| | Cash provided (used) by financing activities | | | | | | | | | | |
| | Borrowings and repayments: | | | | | | | | | | |
| | | Short-term debt | $ | (7.6) | | | 27.1 | | | (0.9) | | |
| | | Long-term revolving credit facilities | | (113.9) | | | 121.2 | | | (10.1) | | |
| | | Issuance of private placement notes | | 100.0 | | | - | | | - | | |
| | | Other long-term debt | | (32.2) | | | (15.9) | | | (11.3) | | |
| | | | Borrowings (repayments) | | (53.7) | | | 132.4 | | | (22.3) | | |
| | | | | | | | | | | | | | |
| | Debt financing costs | | (0.6) | | | (2.5) | | | - | | |
| | Repurchase shares of common stock of Brink's | | - | | | (33.7) | | | (6.9) | | |
| | Cash proceeds from sale-leaseback transactions | | 17.6 | | | 1.2 | | | 13.6 | | |
| | Dividends attributable to: | | | | | | | | | | |
| | | Shareholders of Brink’s | | (18.7) | | | (18.9) | | | (18.4) | | |
| | | Noncontrolling interests in subsidiaries | | (16.1) | | | (18.4) | | | (13.7) | | |
| | Proceeds and tax benefits related to stock compensation and other | | 4.3 | | | (0.1) | | | 1.1 | | |
| | Cash flows from financing activities | $ | (67.2) | | | 60.0 | | | (46.6) | | |
Debt repayments
In 2010,2011, our net borrowingsrepayments were $132.4$53.7 million as compared to net repaymentsborrowings of $132.4 million in 2009 of $22.3 million.2010. The increased borrowingschange resulted primarily from fundingborrowings in 2010 to fund business acquisitions and repurchasing sharesthe repurchase of common stock. In 2011, on a net basis, we repaid a portion of our common stock.debt as cash flows from operating activities exceeded the net cash used by our investing activities.
Share purchases
In 2010, we purchased 1,682,845 shares of our common stock for $33.7 million at an average price of $20.03 per share. In 2009, we purchased 234,456 shares of our common stock at an average cost of $26.20 per share. We also used $0.8 million in early 2009 to settle share purchases initiated in December 2008. In 2011, we did not purchase any shares of our common stock.
Our operating liquidity needs are typically financed by cash from operations, short-term debt and the Revolving Facility, described below.
In 2010, Venezuela began limiting conversions of bolivar fuertes to U.S. dollars to $350,000 per legal entity per month. As a result, we do not anticipate repatriation of cash from our Venezuelan operations for the foreseeable future. This may limit our ability to use funds earned in Venezuela for general corporate purposes, including reducing our U.S. debt. At December 31, 2010, our Venezuelan subsidiaries held $3.3 million of cash and short-term investments denominated in U.S. dollars and $18.2 million of cash denominated in bolivar fuertes.
Dividends
We paid dividends of $0.10 per share in each of the four quarters of 2010.last 12 quarters. Future dividends are dependent on our earnings, financial condition, shareholders’ equity levels, our cash flow and business requirements, as determined by the board of directors.
We use a combination of debt, leases and equity to capitalize our operations.
As of December 31, 2010,2011, debt as a percentage of capitalization (defined as total debt and shareholders’ equity) was 40%45% compared to 25%40% at December 31, 2009.2010. The increase resulted from higher debta reduction in equity compared to the end of $193.6 million which increased2010 primarily from the fundingas a result of business acquisitions and share repurchases and the increased use of capital leases to acquire armored vehicles and CompuSafe® units.actuarial losses caused by lower discount rates for retirement plans exceeding net income during 2011.
Summary of Debt, Equity and Other Liquidity Information
| | | Amount available | | | | | | | |
| | | under credit facilities | | | Outstanding Balance | | | | |
| | | December 31, | | | December 31, | | | | |
| (In millions) | | 2010 | | | 2010 | | | 2009 | | | $ change (a) | |
| | | | | | | | | | | | | |
| Debt: | | | | | | | | | | | | |
Multi-currency revolving facilities | | $ | 22.2 | | | $ | 11.0 | | | | 6.5 | | | $ | 4.5 | |
Revolving Facility | | | 182.8 | | | | 217.2 | | | | 98.0 | | | | 119.2 | |
Letter of Credit Facilities | | | 84.2 | | | | - | | | | - | | | | - | |
2010 Credit Facility | | | 20.0 | | | | - | | | | - | | | | - | |
Dominion Terminal Associates bonds | | | - | | | | 43.2 | | | | 43.2 | | | | - | |
Capital leases | | | - | | | | 64.2 | | | | 32.8 | | | | 31.4 | |
Other | | | - | | | | 53.6 | | | | 15.1 | | | | 38.5 | |
Debt | | $ | 309.2 | | | $ | 389.2 | | | | 195.6 | | | $ | 193.6 | |
| | | | | | | | | | | | | | | | | |
| Total equity | | | | | | $ | 583.1 | | | | 595.8 | | | $ | (12.7 | ) |
| | | | | | Amount available | | | | | | | | | | |
| | | | | | under credit facilities | | Outstanding Balance | | | | |
| | | | | | December 31, | | December 31, | | | | |
| | (In millions) | | 2011 | | 2011 | | 2010 | | | $ change (a) |
| | Debt: | | | | | | | | | | | | | |
| | | Multi-currency revolving facilities | $ | 37.2 | | $ | 9.8 | | | 11.0 | | | $ | (1.2) | |
| | | Revolving Facility | | 290.0 | | | 110.0 | | | 217.2 | | | | (107.2) | |
| | | Letter of Credit Facilities | | 24.8 | | | - | | | - | | | | - | |
| | | 2010 Credit Facility | | 20.0 | | | - | | | - | | | | - | |
| | | Private Placement Notes | | - | | | 100.0 | | | - | | | | 100.0 | |
| | | Dominion Terminal Associates bonds | | - | | | 43.2 | | | 43.2 | | | | - | |
| | | Capital leases | | - | | | 95.4 | | | 64.2 | | | | 31.2 | |
| | | Other | | - | | | 31.0 | | | 53.6 | | | | (22.6) | |
| | | | Debt | $ | 372.0 | | $ | 389.4 | | | 389.2 | | | $ | 0.2 | |
| | | | | | | | | | | | | | | | | |
| | Total equity | | | | $ | 482.4 | | | 583.1 | | | $ | (100.7) | |
| (a) | In addition to cash borrowings and repayments, the change in the debt balance also includes changes in currency exchange rates and new capital lease agreements. |
Net Debt and Reconciliation to GAAP Measures
| | | December 31, | | | | |
| (In millions) | | 2010 | | | 2009 | | | $ change | |
| Debt: | | | | | | | | | |
| Short-term | | $ | 36.5 | | | | 7.2 | | | $ | 29.3 | |
| Long-term | | | 352.7 | | | | 188.4 | | | | 164.3 | |
Total Debt | | $ | 389.2 | | | | 195.6 | | | $ | 193.6 | |
| | | | | | | | | | | | | |
Cash and cash equivalents | | $ | 183.0 | | | | 143.0 | | | $ | 40.0 | |
Less amounts held by cash logistics operations (a) | | | (38.5 | ) | | | - | | | | (38.5 | ) |
Amount available for general corporate purposes | | $ | 144.5 | | | | 143.0 | | | $ | 1.5 | |
| | | | | | | | | | | | | |
| Net Debt | | $ | 244.7 | | | | 52.6 | | | $ | 192.1 | |
| | | | | | | | | | | | | | | |
| | | | | | | December 31, | | | | |
| | (In millions) | | 2011 | | 2010 | | | $ change |
| | | | | | | | | | | | | | | |
| | Debt: | | | | | | | | | | |
| | | Short-term | $ | 25.4 | | | 36.5 | | | $ | (11.1) | |
| | | Long-term | | 364.0 | | | 352.7 | | | | 11.3 | |
| | | | Total Debt | | 389.4 | | | 389.2 | | | | 0.2 | |
| | | | | | | | | | | | | |
| | | Cash and cash equivalents | | 182.9 | | | 183.0 | | | | (0.1) | |
| | | Less amounts held by cash logistics operations (a) | | (25.1) | | | (38.5) | | | | 13.4 | |
| | | | Cash available for general corporate purposes | | 157.8 | | | 144.5 | | | | 13.3 | |
| | | | | | | | | | | | | | | |
| | Net Debt | $ | 231.6 | | | 244.7 | | | $ | (13.1) | |
| (a) | Title to cash received and processed in certain of our secure cash logistics operations transfers to us for a short period of time. The cash is generally credited to customers’ accounts the following day and we do not consider it as available for general corporate purposes in the management of our liquidity and capital resources and in our computation of Net Debt. |
Net Debt is a supplemental non-GAAP financial measure that is not required by, or presented in accordance with GAAP. We use Net Debt as a measure of our financial leverage. We believe that investors also may find Net Debt to be helpful in evaluating our financial leverage. Net Debt should not be considered as an alternative to Debt determined in accordance with GAAP and should be reviewed in conjunction with our consolidated balance sheets. Set forth above is a reconciliation of Net Debt, a non-GAAP financial measure, to Debt, which is the most directly comparable financial measure calculated and reported in accordance with GAAP, as of December 31, 2010,2011, and December 31, 2009. At December 31, 2010,2010. Net Debt was $251 million excluding cash and debt in Venezuelan operations.operations was $242 million at December 31, 2011, and $251 million at December 31, 2010.
Net Debt (Cash) position changed primarily duedebt was slightly lower at the end of 2011 compared to 2010 as a result of cash flows from operating activities exceeding cash flow from investing activities.
Liquidity Needs
Our operating liquidity needs are typically financed by cash from operations, short-term debt and the decrease inRevolving Facility (our debt facilities are described below). We have certain limitations and considerations related to the cash and borrowing capacity that are reported in our consolidated financial statements. Based on our current cash equivalents balance. Itemson hand, amounts available under our credit facilities and current projections of cash flows from operations, we believe that affected cash
and cash equivalents during 2010 were:we will be able to meet our liquidity needs for more than the next twelve months.
· | Acquisitions net of cash acquired ($101 million), and |
· | Share repurchases ($34 million) |
Limitations on dividends from foreign subsidiaries. A significant portion of our operations are outside the U.S. which may make it difficult to repatriate cash for use in the U.S. See Item 1A., Risk Factors, for more information on the risks associated with having businesses outside the U.S.
Incremental taxes. We have approximately $126 million of cash held by subsidiaries that we consider to be permanently invested and for which we do not expect to repatriate to the U.S. If we decided to repatriate this cash to the U.S., we may have to accrue and pay additional income taxes. Given the number of foreign operations and the complexities of the tax law, it is not practical to estimate the potential tax liability, but the amount of taxes owed could be material depending on how and when the repatriation occurred. 48
Venezuela. In 2010, Venezuela began limiting conversions of bolivar fuertes to U.S. dollars to $350,000 per legal entity per month. As a result, we do not anticipate repatriation of cash from our Venezuelan operations to the U.S. for the foreseeable future. This may limit our ability to use funds earned in Venezuela for general corporate purposes, including reducing our debt. At December 31, 2011, our Venezuelan subsidiaries held $1.3 million of cash and short-term investments denominated in U.S. dollars and $8.9 million of cash denominated in bolivar fuertes.
Pension contributions. We intend to contribute company stock to satisfy some or all of the $31.5 million in contributions that are required for 2012 instead of using cash. We may also use company stock in the future to satisfy future contributions. The contributions after 2012 total $197 million based on current assumptions.
Debt
We have an
On January 6, 2012, we amended our unsecured $400 million revolving bank credit facility (the “Revolving Facility”) with a syndicate. The amendment provides for an increase in the amount of banks.the Revolving Facility from $400 million to $480 million at more favorable pricing and extends the maturity date from July 2014 to January 2017. The Revolving Facility’s interest rate is based on LIBOR plus a margin, alternate base rate plus a margin, or competitive bid. The Revolving Facility allows the Companyus to borrow or issue letters of credit (or otherwise satisfy credit needs) on a revolving basis over a four-yearthe term ending in July 2014.of the facility. As of December 31, 2010, $182.82011, $290 million was available under the Revolving Facility. Amounts outstanding under the Revolving Facility as of December 31, 2010,2011, were denominated primarily in U.S. dollars and to a lesser extent in Canadian dollars.
The margin on LIBOR borrowings under the Revolving Facility, which can rangeranged from 1.225% to 2.325% depending on our credit rating, was 1.75% at December 31, 2010.2011. Under the amended Revolving Facility, the margin on LIBOR borrowings can range from 0.9% to 1.575% and was 1.20% at January 6, 2012. The margin on alternate base rate borrowings under the Revolving Facility can rangeranged from 0.225% to 1.325%. Under the amended Revolving Facility, the alternate base rate borrowings can range from 0.0% to 0.575%. We also pay an annual facility fee on the Revolving Facility based on our credit rating. The facility fee, which can rangeranged from 0.15% to 0.55%, was 0.375% at December 31, 2011. Under the end of 2010.amended Revolving Facility, the facility fee can range from 0.10% to 0.30% and was 0.175% at January 6, 2012.
We have twoOn January 24, 2011, we issued $100 million in unsecured notes through a private placement debt transaction (the “Notes”). The Notes comprise $50 million in series A notes with a fixed interest rate of 4.57% and $50 million in series B notes with a fixed interest rate of 5.20%. The Notes are due in January 2021 with principal payments under the series A notes to begin in January 2015. The proceeds of $100 million were utilized to pay down the Revolving Facility.
As of December 31, 2011, we had three unsecured multi-currency revolving bank credit facilities with a total of $60.0$70 million in available credit, of which approximately $22.2$37 million was available at December 31, 2010.available. A $40 million facility expires in December 2011 and a $20 million facility expires in December 2012.2012, another $20 million facility expires in May 2014 and a $30 million facility expires in October 2014. Interest on these facilities is based on LIBOR plus a margin. The margin ranges from 0.14%1.0% to 2.50%. We also have the ability to borrow from other banks, at the banks’ discretion, under short-term uncommitted agreements. Various foreign subsidiaries maintain other lines of credit and overdraft facilities with a number of banks.
We have two unsecured letter of credit facilities totaling $189$139 million, of which approximately $84.2$25 million was available at December 31, 2010.2011. A $135 million facility expires in July 2011 and a $54 million facility expires in December 2014.2014 and an $85 million facility expires in June 2015. The Revolving Facility and the multi-currency revolving credit facilities are also used for issuance of letters of credit and bank guarantees. On January 24, 2012, we entered into a $25 million unsecured letter of credit facility that will expire in December 2014.
We also have aan unsecured bilateral committed credit facility (the “2010 Credit Facility”) with a total of $20.0$20 million in available credit that expires in March 2011.2012. Interest on this facility is based on LIBOR plus a margin, which ranges from 2.0%1.75% to 2.5%2.25%. As of December 31, 2010, $20.02011, $20 million was available under the 2010 Credit Facility.
We expect to refinance facilities maturing in 2011.
The Revolving Facility, the two letter ofNotes, the three unsecured multi-currency revolving bank credit facilities, the two unsecured multi-currency revolving bankletter of credit facilities and the 2010 Credit Facility contain subsidiary guarantees and various financial and other covenants. The financial covenants, among other things, limit our total indebtedness, limit priority debt, limit asset sales, limit the use of proceeds from asset sales and provide for minimum coverage of interest costs. The credit agreements do not provide for the acceleration of payments should our credit rating be reduced. If we were not to comply with the terms of our various loancredit agreements, the repayment terms could be accelerated and the commitments could be withdrawn. An acceleration of the repayment terms under one agreement could trigger the acceleration of the repayment terms under the other loan agreements. In November 2010, we obtained appropriate waivers in connection with the bankruptcy of our Belgium subsidiary to ensure that we remain compliant with the terms of our facilities. We were in compliance with all financial covenants at December 31, 2010.2011.
We have $43.2$43 million of bonds issued by the Peninsula Ports Authority of Virginia recorded as debt on our balance sheet. Although we are not the primary obligor of the debt, we have guaranteed the debt and we believe that we will ultimately pay this obligation. The guarantee originated as part of a former interest in Dominion Terminal Associates, a deep water coal terminal. We continue to pay interest on the debt. The bonds bear a fixed interest rate of 6.0% and mature in 2033. The bonds may mature prior to 2033 upon the occurrence of specified events such as the determination that the bonds are taxable or if we fail to abide by the terms of the guarantee.
Based on our current cash on hand, amounts available under our credit facilities and current projections of cash flows from operations, we believe that we will be able to meet our liquidity needs for more than the next 12 months.
On January 24, 2011, we issued $100 million in unsecured notes through a private placement debt transaction (the “Notes”). The Notes are comprised of $50 million in series A notes with a fixed coupon rate of 4.57% and $50 million in series B notes with a fixed coupon rate of 5.20%. The Notes are due in January 2021 with principal payments under the series A notes to begin in January 2015. The proceeds of $100 million were utilized to pay down the Revolving Facility.
Equity
At December 31, 2010,2011, we had 100 million shares of common stock authorized and 46.446.9 million shares issued and outstanding.
Share Purchases
In September, 2007, our board2009, we purchased 234,456 shares of directors authorized the purchasecommon stock for $6.1 million at an average price of up to $100 million of our outstanding common shares. We$26.20 per share. In 2010, we purchased $100 million of1,682,845 shares of our common stock as follows:for $33.7 million at an average price of $20.03 per share. We did not purchase any common stock in 2011.
| We used $60.2 million to purchase 1,044,300 shares of common stock through the end of 2008 at an average price of $57.58 per share. |
· | In 2009, we used $6.1 million to purchase 234,456 shares of common stock at an average price of $26.20 per share. |
· | During 2010, we purchased 1,682,845 shares of our common stock for $33.7 million at an average price of $20.03 per share.
|
Dividends
We paid regular quarterly dividends on our common stock during the last three years. On January 20, 2011,19, 2012, the board declared a regular quarterly dividend of 10 cents per share payable on March 1, 2011.2012. Future dividends are dependent on the earnings, financial condition, shareholder equity levels, cash flow and business requirements, as determined by the board of directors.
Employee Benefits TrustShelf Registration of Common Stock
In September 2008, we terminated The Brink’s Company Employee Benefits Trust (the “Employee Benefits Trust”). Immediately priorWe intend to termination, the shares held by the trust were distributed to us and the shares were retired. The purpose of the Employee Benefits Trust (prior to termination) was to hold shares of our common stock to fund obligations under compensation and employee benefit programs that provided for the issuance of stock. After the termination of the trust, newly issued shares are used to satisfy these programs.
Through 2007, shares of common stock were voted by the trusteeregister $150 million in the same proportion as the shares of common stock voted by our employees participating in our 401(k) plan. Our 401(k) plan divested all shares of ournew common stock in January 2008. After the 401(k) plan divested2012. We intend to issue shares in 2012 to satisfy some or all shares of our common stock, shares of the trust were not votedrequired contributions to our primary U.S. pension plan. We may also issue shares in matters voted on by shareholders.the future to satisfy future contributions.
Preferred Stock
At December 31, 2010,2011, we had the authority to issue up to 2.0 million shares of preferred stock, par value $10 per share.
Off Balance Sheet Arrangements
We have operating leases that are described in the notes to the consolidated financial statements. See note 14 for operating leases that have residual value guarantees or other terms that cause the agreement to be considered a variable interest. We use operating leases to lower our cost of financings. We believe that operating leases are an important component of our capital structure.
The following table reflects our contractual obligations as of December 31, 2010.2011.
| | | Estimated Payments Due by Period | |
| | | | | | | | | | | | | | | | | | Later | | | | |
| (In millions) | | 2011 | | | 2012 | | | 2013 | | | 2014 | | | 2015 | | | Years | | | Total | |
| | | | | | | | | | | | | | | | | | | | | | |
| Contractual obligations: | | | | | | | | | | | | | | | | | | | | | |
Long-term debt obligations | | $ | 15.8 | | | | 6.0 | | | | 2.3 | | | | 218.4 | | | | 1.1 | | | | 44.9 | | | | 288.5 | |
Capital lease obligations | | | 13.2 | | | | 14.8 | | | | 10.3 | | | | 8.6 | | | | 7.6 | | | | 9.7 | | | | 64.2 | |
Operating lease obligations | | | 81.5 | | | | 68.9 | | | | 55.1 | | | | 38.3 | | | | 30.0 | | | | 62.3 | | | | 336.1 | |
Purchase obligations: | | | | | | | | | | | | | | | | | | | | | | | | | | | | |
Service contracts | | | 10.7 | | | | 2.0 | | | | 0.8 | | | | 0.8 | | | | 0.6 | | | | 0.1 | | | | 15.0 | |
Other | | | 2.5 | | | | - | | | | - | | | | - | | | | - | | | | - | | | | 2.5 | |
Other long-term liabilities reflected on the | | | | | | | | | | | | | | | | | | | | | | | | | | | | |
Company’s balance sheet under GAAP: | | | | | | | | | | | | | | | | | | | | | | | | | | | | |
Primary U.S. pension plan | | | - | | | | 35.8 | | | | 33.9 | | | | 30.1 | | | | 26.7 | | | | 9.0 | | | | 135.5 | |
Other retirement obligations: | | | | | | | | | | | | | | | | | | | | | | | | | | | | |
UMWA plans | | | - | | | | - | | | | - | | | | - | | | | - | | | | 331.0 | | | | 331.0 | |
Black lung and other plans | | | 7.8 | | | | 7.4 | | | | 7.1 | | | | 6.7 | | | | 6.4 | | | | 63.5 | | | | 98.9 | |
Workers compensation | | | | | | | | | | | | | | | | | | | | | | | | | | | | |
and other claims | | | 19.9 | | | | 15.1 | | | | 8.7 | | | | 5.2 | | | | 3.3 | | | | 22.8 | | | | 75.0 | |
Uncertain tax positions | | | 1.6 | | | | - | | | | - | | | | - | | | | - | | | | - | | | | 1.6 | |
Other | | | 0.9 | | | | 0.8 | | | | 0.8 | | | | 0.8 | | | | 0.8 | | | | 9.8 | | | | 13.9 | |
Total | | $ | 153.9 | | | | 150.8 | | | | 119.0 | | | | 308.9 | | | | 76.5 | | | | 553.1 | | | | 1,362.2 | |
| | | | | | | | Estimated Payments Due by Period |
| | | | | | | | | | | | | | | | | | Later | | | |
| | (In millions) | | 2012 | | 2013 | | 2014 | | 2015 | | 2016 | | Years | | Total | |
| | | | | | | | | | | | | | | | | | | | | |
| | Contractual obligations: | | | | | | | | | | | | | | | |
| | | Long-term debt obligations | $ | 7.1 | | 2.5 | | 97.7 | | 7.9 | | 7.9 | | 145.5 | | 268.6 | |
| | | Capital lease obligations | | 21.6 | | 18.3 | | 16.7 | | 14.9 | | 13.7 | | 10.2 | | 95.4 | |
| | | Operating lease obligations | | 80.3 | | 63.6 | | 50.2 | | 33.1 | | 20.5 | | 49.0 | | 296.7 | |
| | | Purchase obligations: | | | | | | | | | | | | | | | |
| | | | Service contracts | | 6.9 | | 1.4 | | 1.2 | | 0.6 | | 0.1 | | - | | 10.2 | |
| | | | Other | | 1.5 | | - | | - | | - | | - | | - | | 1.5 | |
| | | Other long-term liabilities reflected on the | | | | | | | | | | | | | | | |
| | | | Company’s balance sheet under GAAP: | | | | | | | | | | | | | | | |
| | | | | Primary U.S. pension plan | | 31.5 | | 41.5 | | 51.1 | | 47.0 | | 42.4 | | 14.9 | | 228.4 | |
| | | | | Other retirement obligations: | | | | | | | | | | | | | | | |
| | | | | | UMWA plans | | - | | - | | - | | - | | - | | 528.5 | | 528.5 | |
| | | | | | Black lung and other plans | | 7.2 | | 5.8 | | 5.5 | | 5.2 | | 5.0 | | 60.6 | | 89.3 | |
| | | | | Workers compensation | | | | | | | | | | | | | | | |
| | | | | | and other claims | | 27.0 | | 9.7 | | 6.1 | | 3.7 | | 3.3 | | 21.5 | | 71.3 | |
| | | | | Uncertain tax positions | | 3.3 | | - | | - | | - | | - | | - | | 3.3 | |
| | | | | Other | | 0.8 | | 0.8 | | 0.8 | | 0.8 | | 0.8 | | 8.6 | | 12.6 | |
| | Total | $ | 187.2 | | 143.6 | | 229.3 | | 113.2 | | 93.7 | | 838.8 | | 1,605.8 | |
U.S. Pension Plans
Pension benefits provided to eligible U.S. employees were frozen on December 31, 2005, and are not provided to employees hired after 2005 or to those covered by a collective bargaining agreement. There are approximately 21,00020,400 beneficiaries in the plans. In 2009, we contributed $150 million to the plans, which helped reduce the underfunded status of U.S. plans to $152 million at the end of 2009. Based on current assumptions we will begin annual contributions to the plan in 2012 which will continue for fivesix years, totaling $135.5$228.4 million. We intend to make the 2012 contribution at least in part through the use of shares of our common stock. We may also contribute shares in the future to satisfy future contributions.
UMWA Plans
Retirement benefits related to former coal operations include medical benefits provided by the Pittston Coal Group Companies Employee Benefit Plan for UMWA Represented Employees. There are approximately 4,6004,400 beneficiaries in the UMWA plans. The company does not expect to make additional contributions to these plans until 2029.2023.
Black Lung
Under the Federal Black Lung Benefits Act of 1972, Brink’s is responsible for paying lifetime black lung benefits to miners and their dependents for claims filed and approved after June 30, 1973. There are approximately 800 black lung beneficiaries.
Other
We also have a plan that provides retirement health care benefits to certain eligible salaried employees. Benefits under this plan are not indexed for inflation.
Risks Associated withAssumptions for U.S. Retirement Obligations
We have made various assumptions to estimate the amount of payments to be made in the future. The most significant assumptions include:
| · | Changing discount rates and other assumptions in effect at measurement dates (normally December 31) |
| · | Investment returns of plan assets |
| · | Addition of new participants (historically immaterial due to freezing of pension benefits and exit from coal business) |
The Contractual Obligations table above includesrepresents payments projected to be paid with our corporate funds and does not includerepresent payments projected to be made to beneficiaries with retirement plan assets.
Underfunded (Overfunded) Status of U.S. Retirement Plans| | Funded Status of U.S. Retirement Plans | |
| | | | | | | | | | | | | | | | |
| | | | | Actual | | Projected |
| | (In millions) | | 2011 | | 2012 | | 2013 | | 2014 | | 2015 | | 2016 | |
| | | | | | | | | | | | | | | | |
| | U.S. pension plans | | | | | | | | | | | | | |
| | Beginning funded status | $ | (191.7) | | (305.3) | | (248.5) | | (188.3) | | (114.9) | | (39.6) | |
| | Net periodic pension credit (a) | | 18.8 | | 16.4 | | 16.2 | | 22.3 | | 28.1 | | 33.3 | |
| | Payment from Brink’s | | - | | 31.5 | | 41.5 | | 51.1 | | 47.0 | | 42.4 | |
| | Benefit plan experience (loss) gain | | (133.1) | | (4.3) | | 0.1 | | (0.8) | | (0.6) | | 0.1 | |
| | Other | | 0.7 | | 13.2 | | 2.4 | | 0.8 | | 0.8 | | 0.8 | |
| | Ending funded status | $ | (305.3) | | (248.5) | | (188.3) | | (114.9) | | (39.6) | | 37.0 | |
| | | | | | | | | | | | | | | | |
| | UMWA plans | | | | | | | | | | | | | |
| | Beginning funded status | $ | (164.1) | | (261.6) | | (262.9) | | (264.9) | | (267.7) | | (271.5) | |
| | Net periodic postretirement credit (cost) (a) | | 1.5 | | (1.3) | | (2.0) | | (2.8) | | (3.8) | | (4.7) | |
| | Benefit plan experience loss | | (97.6) | | - | | - | | - | | - | | - | |
| | Other | | (1.4) | | - | | - | | - | | - | | - | |
| | Ending funded status | $ | (261.6) | | (262.9) | | (264.9) | | (267.7) | | (271.5) | | (276.2) | |
| | | | | | | | | | | | | | | | |
| | Black lung and other plans | | | | | | | | | | | | | |
| | Beginning funded status | $ | (62.2) | | (60.9) | | (56.1) | | (52.6) | | (49.2) | | (46.0) | |
| | Net periodic postretirement cost (a) | | (2.8) | | (2.4) | | (2.3) | | (2.1) | | (2.0) | | (1.9) | |
| | Payment from Brink’s | | 7.0 | | 7.2 | | 5.8 | | 5.5 | | 5.2 | | 5.0 | |
| | Benefit plan experience loss | | (2.9) | | - | | - | | - | | - | | - | |
| | Ending funded status | $ | (60.9) | | (56.1) | | (52.6) | | (49.2) | | (46.0) | | (42.9) | |
| | (a) | Excludes amounts reclassified from accumulated other comprehensive income. | |
| | | Actual | | | Projected | |
| (in millions) | | 2010 | | | 2011 | | | 2012 | | | 2013 | | | 2014 | | | 2015 | |
| | | | | | | | | | | | | | | | | | | |
| U.S. pension plans | | | | | | | | | | | | | | | | | | |
| Beginning underfunded balance | | $ | 152.3 | | | | 191.7 | | | | 177.0 | | | | 123.1 | | | | 65.4 | | | | 7.8 | |
| Net periodic pension credit (a) | | | (20.3 | ) | | | (18.9 | ) | | | (17.9 | ) | | | (19.2 | ) | | | (25.6 | ) | | | (30.8 | ) |
| Payment from Brink’s | | | - | | | | - | | | | (35.8 | ) | | | (33.9 | ) | | | (30.1 | ) | | | (26.7 | ) |
| Benefit plan experience (gain) loss | | | 60.5 | | | | 5.6 | | | | 1.8 | | | | (1.9 | ) | | | (0.3 | ) | | | (0.1 | ) |
| Other | | | (0.8 | ) | | | (1.4 | ) | | | (2.0 | ) | | | (2.7 | ) | | | (1.6 | ) | | | (1.5 | ) |
| Ending underfunded (overfunded) balance | | $ | 191.7 | | | | 177.0 | | | | 123.1 | | | | 65.4 | | | | 7.8 | | | | (51.3 | ) |
| | | | | | | | | | | | | | | | | | | | | | | | | |
| UMWA plans | | | | | | | | | | | | | | | | | | | | | | | | |
| Beginning underfunded balance | | $ | 157.5 | | | | 164.1 | | | | 162.8 | | | | 161.7 | | | | 161.0 | | | | 160.7 | |
| Net periodic postretirement cost (credit) (a) | | | 1.8 | | | | (1.3 | ) | | | (1.1 | ) | | | (0.7 | ) | | | (0.3 | ) | | | 0.2 | |
| Payment from Brink’s | | | - | | | | - | | | | - | | | | - | | | | - | | | | - | |
| Benefit plan experience loss | | | 4.5 | | | | - | | | | - | | | | - | | | | - | | | | - | |
| Other | | | 0.3 | | | | - | | | | - | | | | - | | | | - | | | | - | |
| Ending underfunded balance | | $ | 164.1 | | | | 162.8 | | | | 161.7 | | | | 161.0 | | | | 160.7 | | | | 160.9 | |
| | | | | | | | | | | | | | | | | | | | | | | | | |
| Black lung and other plans | | | | | | | | | | | | | | | | | | | | | | | | |
| Beginning underfunded balance | | $ | 47.1 | | | | 62.2 | | | | 57.2 | | | | 52.5 | | | | 47.9 | | | | 43.5 | |
| Net periodic postretirement cost (a) | | | 2.9 | | | | 2.8 | | | | 2.7 | | | | 2.5 | | | | 2.3 | | | | 2.2 | |
| Payment from Brink’s | | | (5.9 | ) | | | (7.8 | ) | | | (7.4 | ) | | | (7.1 | ) | | | (6.7 | ) | | | (6.4 | ) |
| Benefit plan experience gain | | | (1.3 | ) | | | - | | | | - | | | | - | | | | - | | | | - | |
| Health care reform remeasurement | | | 19.3 | | | | - | | | | - | | | | - | | | | - | | | | - | |
| Other | | | 0.1 | | | | - | | | | - | | | | - | | | | - | | | | - | |
| Ending unfunded balance | | $ | 62.2 | | | | 57.2 | | | | 52.5 | | | | 47.9 | | | | 43.5 | | | | 39.3 | |
(a) | Excludes amounts reclassified from accumulated other comprehensive income. |
Summary of Total Expenses Related to All U.S. Retirement Liabilities
This table summarizes actual and projected expense (income) related to U.S. retirement liabilities. Most expenses are allocated to non-segment results, with the balance allocated to North American operations. The market value of the investments used to pay benefits for our retirement plans significantly declined in 2008. Expenses related to our U.SU.S. pension plans are expected to increase over the next few years as market losses are amortized into earnings from other comprehensive income.
| | | Actual | | | Projected | |
| (in millions) | | 2010 | | | 2011 | | | 2012 | | | 2013 | | | 2014 | | | 2015 | |
| | | | | | | | | | | | | | | | | | | |
| U.S. pension plans | | $ | (0.8 | ) | | | 9.1 | | | | 12.5 | | | | 12.5 | | | | 0.6 | | | | (8.2 | ) |
| UMWA plans | | | 17.8 | | | | 13.4 | | | | 13.1 | | | | 12.9 | | | | 12.8 | | | | 12.7 | |
| Black lung and other plans | | | 4.7 | | | | 5.4 | | | | 5.4 | | | | 5.3 | | | | 5.2 | | | | 5.2 | |
Total | | $ | 21.7 | | | | 27.9 | | | | 31.0 | | | | 30.7 | | | | 18.6 | | | | 9.7 | |
| | | | | | | | | | | | | | | | | | | | | | | | | |
| Amounts allocated to: | | | | | | | | | | | | | | | | | | | | | | | | |
North American segment | | $ | (1.0 | ) | | | 3.0 | | | | 4.3 | | | | 4.4 | | | | (0.2 | ) | | | (3.6 | ) |
Non-segment | | | 22.7 | | | | 24.9 | | | | 26.7 | | | | 26.3 | | | | 18.8 | | | | 13.3 | |
| | | | | | | | | | | | | | | | | | | | | | | | | |
Total | | $ | 21.7 | | | | 27.9 | | | | 31.0 | | | | 30.7 | | | | 18.6 | | | | 9.7 | |
| | | | | | Actual | | Projected | |
| | (In millions) | | | 2011 | | 2012 | | 2013 | | 2014 | | 2015 | | 2016 | |
| | | | | | | | | | | | | | | | | |
| | U.S. pension plans | | $ | 9.4 | | 27.7 | | 25.1 | | 13.4 | | 4.1 | | (3.9) | |
| | UMWA plans | | | 13.2 | | 22.9 | | 22.6 | | 22.5 | | 22.5 | | 22.6 | |
| | Black lung and other plans | | | 5.4 | | 5.2 | | 5.0 | | 4.9 | | 4.7 | | 4.5 | |
| | | Total | | $ | 28.0 | | 55.8 | | 52.7 | | 40.8 | | 31.3 | | 23.2 | |
| | | | | | | | | | | | | | | | | |
| | Amounts allocated to: | | | | | | | | | | | | | | |
| | | North America segment | | $ | 3.2 | | 8.9 | | 9.5 | | 5.0 | | 1.4 | | (1.7) | |
| | | Non-segment | | | 24.8 | | 46.9 | | 43.2 | | 35.8 | | 29.9 | | 24.9 | |
| | | Total | | $ | 28.0 | | 55.8 | | 52.7 | | 40.8 | | 31.3 | | 23.2 | |
Summary of Total Payments from Brink’s to U.S. Plans and Payments from U.S. Plans to Participants
This table summarizes actual and estimated payments
· | from Brink’s to U.S. retirement plans, and |
· | from the plans to participants. |
| | | Actual | | | Projected | |
| (in millions) | | 2010 | | | 2011 | | | 2012 | | | 2013 | | | 2014 | | | 2015 | |
| | | | | | | | | | | | | | | | | | | |
| Payments from Brink’s to U.S. Plans | | | | | | | | | | | | | | | | | | |
| U.S. pension plans | | $ | - | | | | - | | | | 35.8 | | | | 33.9 | | | | 30.1 | | | | 26.7 | |
| UMWA plans | | | (0.3 | ) | | | - | | | | - | | | | - | | | | - | | | | - | |
| Black lung and other plans (a) | | | 5.9 | | | | 7.8 | | | | 7.4 | | | | 7.1 | | | | 6.7 | | | | 6.4 | |
Total | | $ | 5.6 | | | | 7.8 | | | | 43.2 | | | | 41.0 | | | | 36.8 | | | | 33.1 | |
| (a)These plans are not funded. | | | | | | | | | | | | | | | | | | | | | | | | |
| | | | | | | | | | | | | | | | | | | | | | | | | |
| Payments from U.S. Plans to participants | | | | | | | | | | | | | | | | | | | | | | | | |
| U.S. pension plans | | $ | 38.0 | | | | 41.1 | | | | 43.1 | | | | 45.2 | | | | 45.7 | | | | 47.1 | |
| UMWA plans | | | 38.1 | | | | 36.5 | | | | 36.9 | | | | 37.3 | | | | 36.9 | | | | 36.8 | |
| Black lung and other plans | | | 5.9 | | | | 7.8 | | | | 7.4 | | | | 7.1 | | | | 6.7 | | | | 6.4 | |
Total | | $ | 82.0 | | | | 85.4 | | | | 87.4 | | | | 89.6 | | | | 89.3 | | | | 90.3 | |
| | | | | | Actual | | Projected | |
| | (In millions) | | | 2011 | | 2012 | | 2013 | | 2014 | | 2015 | | 2016 | |
| | | | | | | | | | | | | | | | | |
| | | | | | | | | | | | | | | | | |
| | Payments from U.S. Plans to participants | | | | | | | | | | | | | | |
| | U.S. pension plans | | $ | 39.7 | | 55.6 | | 46.1 | | 46.0 | | 47.2 | | 48.7 | |
| | UMWA plans | | | 39.1 | | 36.9 | | 37.5 | | 37.4 | | 37.5 | | 36.9 | |
| | Black lung and other plans | | | 7.0 | | 7.2 | | 5.8 | | 5.5 | | 5.2 | | 5.0 | |
| | | Total | | $ | 85.8 | | 99.7 | | 89.4 | | 88.9 | | 89.9 | | 90.6 | |
Summary of Total Payments from Brink’s to U.S. Plans
This table summarizes actual and estimated payments from Brink’s to U.S. retirement plans.
| | | | Actual and Projected Payments to Plans from Brink's | | Actual and Projected Funded Status |
| | (In millions) | | Primary U.S. Pension Plan | | Other U.S. Pension Plan | | UMWA Plans | | Black Lung and Other Plans | | Total | | U.S. Pension Plans | | UMWA Plans | | Black Lung and Other Plans | | Total | |
| | | | | | | | | | | | | | | | | | | | | | | |
| | Actual payments | | | | | | | | | | | | | | | | | | | |
| | | 2008 | $ | - | | 1.9 | | - | | 7.1 | | 9.0 | | (329.2) | | (207.5) | | (48.6) | | (585.3) | |
| | | 2009 | | 150.0 | | 4.2 | | 0.5 | | 7.6 | | 162.3 | | (152.3) | | (157.5) | | (47.1) | | (356.9) | |
| | | 2010 | | - | | 0.8 | | - | | 5.9 | | 6.7 | | (191.7) | | (164.1) | | (62.2) | | (418.0) | |
| | | 2011 | | - | | 0.7 | | - | | 7.0 | | 7.7 | | (305.3) | | (261.6) | | (60.9) | | (627.8) | |
| | Projected payments | | | | | | | | | | | | | | | | | | | |
| | | 2012 | | 31.5 | | 13.2 | | - | | 7.2 | | 51.9 | | (248.5) | | (262.9) | | (56.1) | | (567.5) | |
| | | 2013 | | 41.5 | | 2.4 | | - | | 5.8 | | 49.7 | | (188.3) | | (264.9) | | (52.6) | | (505.8) | |
| | | 2014 | | 51.1 | | 0.8 | | - | | 5.5 | | 57.4 | | (114.9) | | (267.7) | | (49.2) | | (431.8) | |
| | | 2015 | | 47.0 | | 0.8 | | - | | 5.2 | | 53.0 | | (39.6) | | (271.5) | | (46.0) | | (357.1) | |
| | | 2016 | | 42.4 | | 0.8 | | - | | 5.0 | | 48.2 | | 37.0 | | (276.2) | | (42.9) | | (282.1) | |
| | | 2017 | | 14.7 | | 0.8 | | - | | 4.6 | | 20.1 | | 90.9 | | (282.0) | | (39.9) | | (231.0) | |
| | | 2018 | | 0.2 | | 0.8 | | - | | 4.4 | | 5.4 | | 133.6 | | (289.1) | | (36.8) | | (192.3) | |
| | | 2019 | | - | | 0.8 | | - | | 4.2 | | 5.0 | | 179.1 | | (297.5) | | (33.7) | | (152.1) | |
| | | 2020 | | - | | 1.4 | | - | | 3.9 | | 5.3 | | 228.6 | | (307.5) | | (30.7) | | (109.6) | |
| | | 2021 | | - | | 0.9 | | - | | 3.6 | | 4.5 | | 281.0 | | (319.0) | | (28.3) | | (66.3) | |
| | | 2022 | | - | | 0.7 | | - | | 3.4 | | 4.1 | | 337.0 | | (332.2) | | (25.5) | | (20.7) | |
| | | 2023 | | - | | 0.7 | | 26.4 | | 3.2 | | 30.3 | | 396.8 | | (320.0) | | (23.4) | | 53.4 | |
| | | 2024 | | - | | 0.7 | | 29.4 | | 3.0 | | 33.1 | | 460.8 | | (304.0) | | (21.3) | | 135.5 | |
| | | 2025 | | - | | 0.7 | | 28.4 | | 2.8 | | 31.9 | | 529.3 | | (288.4) | | (19.4) | | 221.5 | |
| | | 2026 | | - | | 0.7 | | 27.2 | | 2.6 | | 30.5 | | 602.4 | | (273.3) | | (17.6) | | 311.5 | |
| | | 2027 | | - | | 0.6 | | 26.3 | | 2.4 | | 29.3 | | 680.6 | | (258.4) | | (15.9) | | 406.3 | |
| | | 2028 | | - | | 0.6 | | 25.6 | | 2.2 | | 28.4 | | 764.3 | | (243.7) | | (14.3) | | 506.3 | |
| | | 2029 | | - | | 0.6 | | 24.8 | | 2.0 | | 27.4 | | 853.8 | | (229.1) | | (12.8) | | 611.9 | |
| | | 2030 | | - | | 0.5 | | 23.9 | | 1.8 | | 26.2 | | 949.6 | | (214.8) | | (11.5) | | 723.3 | |
| | | 2031 | | - | | 0.5 | | 23.1 | | 1.7 | | 25.3 | | (a) | | (a) | | (a) | | (a) | |
| | | 2032 | | - | | 0.5 | | 22.2 | | 1.5 | | 24.2 | | (a) | | (a) | | (a) | | (a) | |
| | | 2033 | | - | | 0.4 | | 21.2 | | 1.4 | | 23.0 | | (a) | | (a) | | (a) | | (a) | |
| | | 2034 | | - | | 0.4 | | 20.3 | | 1.3 | | 22.0 | | (a) | | (a) | | (a) | | (a) | |
| | | 2035 | | - | | 0.4 | | 19.4 | | 1.2 | | 21.0 | | (a) | | (a) | | (a) | | (a) | |
| | | 2036 | | - | | 0.4 | | 18.5 | | 1.1 | | 20.0 | | (a) | | (a) | | (a) | | (a) | |
| | | 2037 | | - | | 0.3 | | 17.6 | | 1.0 | | 18.9 | | (a) | | (a) | | (a) | | (a) | |
| | | 2038 | | - | | 0.3 | | 16.7 | | 0.9 | | 17.9 | | (a) | | (a) | | (a) | | (a) | |
| | | 2039 | | - | | 0.3 | | 15.8 | | 0.8 | | 16.9 | | (a) | | (a) | | (a) | | (a) | |
| | | 2040 | | - | | 0.2 | | 14.8 | | 0.7 | | 15.7 | | (a) | | (a) | | (a) | | (a) | |
| | | 2041 | | - | | 0.2 | | 13.8 | | 0.6 | | 14.6 | | (a) | | (a) | | (a) | | (a) | |
| | | 2042 | | - | | 0.2 | | 12.7 | | 0.6 | | 13.5 | | (a) | | (a) | | (a) | | (a) | |
| | | 2043 | | - | | 0.2 | | 11.8 | | 0.5 | | 12.5 | | (a) | | (a) | | (a) | | (a) | |
| | | 2044 | | - | | 0.2 | | 10.5 | | 0.4 | | 11.1 | | (a) | | (a) | | (a) | | (a) | |
| | | 2045 | | - | | 0.1 | | 9.6 | | 0.4 | | 10.1 | | (a) | | (a) | | (a) | | (a) | |
| | | 2046 | | - | | 0.1 | | 8.7 | | 0.3 | | 9.1 | | (a) | | (a) | | (a) | | (a) | |
| | | 2047 | | - | | 0.1 | | 7.8 | | 0.3 | | 8.2 | | (a) | | (a) | | (a) | | (a) | |
| | | 2048 | | - | | 0.1 | | 7.0 | | 0.3 | | 7.4 | | (a) | | (a) | | (a) | | (a) | |
| | | 2049 | | - | | 0.1 | | 6.2 | | 0.2 | | 6.5 | | (a) | | (a) | | (a) | | (a) | |
| | | 2050 | | - | | 0.1 | | 5.4 | | 0.2 | | 5.7 | | (a) | | (a) | | (a) | | (a) | |
| | | 2051 | | - | | 0.1 | | 4.8 | | 0.2 | | 5.1 | | (a) | | (a) | | (a) | | (a) | |
| | | 2052 | | - | | - | | 4.2 | | 0.2 | | 4.4 | | (a) | | (a) | | (a) | | (a) | |
| | | 2053 | | - | | - | | 3.6 | | 0.1 | | 3.7 | | (a) | | (a) | | (a) | | (a) | |
| | | 2054 | | - | | - | | 3.1 | | 0.1 | | 3.2 | | (a) | | (a) | | (a) | | (a) | |
| | | 2055 | | - | | - | | 2.7 | | 0.1 | | 2.8 | | (a) | | (a) | | (a) | | (a) | |
| | | 2056 | | - | | - | | 2.3 | | 0.1 | | 2.4 | | (a) | | (a) | | (a) | | (a) | |
| | | 2057 | | - | | - | | 2.0 | | 0.1 | | 2.1 | | (a) | | (a) | | (a) | | (a) | |
| | | 2058 | | - | | - | | 1.7 | | 0.1 | | 1.8 | | (a) | | (a) | | (a) | | (a) | |
| | | 2059 | | - | | - | | 1.4 | | 0.1 | | 1.5 | | (a) | | (a) | | (a) | | (a) | |
| | | 2060 and thereafter | | - | | - | | 7.6 | | - | | 7.6 | | (a) | | (a) | | (a) | | (a) | |
| | | | Total projected payments | $ | 228.4 | | 33.7 | | 528.5 | | 89.3 | | 879.9 | | | | | | | | | |
| | | | (a) Information not provided | |
The amounts in the tables above are based on a variety of estimates, including actuarial assumptions as of December 31, 2010.2011. The estimated amounts will change in the future to reflect payments made, investment returns, actuarial revaluations, and other changes in estimates. Actual amounts could differ materially from the estimated amounts.
| | | | | | | | | | | | | | |
| Discounted Cash Flows at Plan Discount Rates – Reconciled to Liability Amounts Reported under U.S. GAAP |
| | | | | | | | | | | | | | | |
| | | | December 31, 2011 |
| | (In millions) | | Primary U.S. pension plan (b) | | UMWA Plans (c) | | Other unfunded U.S. plans | | Total | |
| | | | | | | | | | | | | | | |
| | Funded status of U.S. retirement plans – GAAP | $ | 278.8 | | | 261.6 | | | 87.4 | | | 627.8 | |
| | Present value of projected earnings of plan assets (a) | | (81.6) | | | (57.1) | | | - | | | (138.7) | |
| | | Discounted cash flows at plan discount rates – Non-GAAP | $ | 197.2 | | | 204.5 | | | 87.4 | | | 489.1 | |
| | | | | | | | | | | | | | | |
| | | Plan discount rate | | 4.60% | | | 4.40% | | | | | | | |
| | | Expected return of assets | | 8.25% | | | 8.50% | | | | | | | |
| (a) | Under GAAP, the funded status of a benefit plan is reduced by the fair market value of plan assets at the balance sheet date, and the present value of the projected earnings on plan assets does not reduce the funded status at the balance sheet date. The non-GAAP measure presented above additionally reduces the funded status as computed under GAAP by the present value of projected earnings of plan assets using the expected return on asset assumptions of the respective plan. |
| (b) | For the primary U.S. pension plan, we are required by ERISA regulations to maintain minimum funding levels, and as a result, we estimate we will be required to make minimum required contributions from 2012 to 2017. We have estimated that we will achieve the required funded ratio after the 2017 contribution. |
| (c) | There are no minimum funding requirements for the UMWA plans because they are not covered by ERISA funding regulations. Using assumptions at the end of 2011, we project that the plan assets plus expected earnings on those investments will cover the benefit payments for these plans until 2023. We project that Brink’s will be required to contribute cash to the plan beginning in 2023 to pay beneficiaries. |
Discounted cash flows at plan discount rates are supplemental financial measures that are not required by, or presented in accordance with GAAP. The purpose of the discounted cash flows at plan discount rate is to present our retirement obligations after giving effect to the benefit of earning a return on plan assets. We believe this measure is helpful in assessing the present value of our future funding requirements in order to meet plan benefit obligations. Discounted cash flows at plan discount rates should not be considered as an alternative to the funded status of the U.S. retirement plans at December 31, 2011, as determined in accordance with GAAP and should be read in conjunction with our consolidated balance sheets.
Bankruptcy of Brink’s Belgium
Background.Our former cash-in-transit subsidiary in Belgium (Brink’s Belgium) filed for bankruptcy in November 2010 after a restructuring plan was rejected by local union employees and was placed into bankruptcy on February 2, 2011. We continue to operate our separate Global Services unit in Belgium, which provides secure transport of diamonds, jewelry,jewellery, precious metals, banknotes and other commodities.
Deconsolidation. Brink’s Belgium continued to provide cash-in-transit services for customers after the bankruptcy filing for approximately three months under the management of a court-appointed trustee. We no longer control or provide funding for the subsidiary. In accordance with FASB ASC Topic 810, Consolidation, we deconsolidated the subsidiary in November 2010, when the trustee assumed control of the subsidiary. We estimated that the fair value of our investment at the date of deconsolidation was zero. Our carrying value of the investment and advances to the subsidiary at the date of the deconsolidation was $11.7 million, which we wrote off as a result of the deconsolidation, resulting in a pretax l oss. We also have incurred approximately $1.7 million of other charges related to the bankruptcy of the subsidiary. The losses related to deconsolidation and other charges have been recorded in operating income (expense) in the consolidated statements of income.
Legal dispute. In December 2010, the court-appointed provisional administrators of Brink’s Belgium filed a claim for €20 million against a subsidiary of Brink’s. In June 2011, the Brink’s subsidiary entered into a settlement agreement related to this claim. Under the terms of the settlement agreement, the Brink’s subsidiary agreed to contribute, upon the satisfaction of certain conditions, €7 million toward social payments to former Brink’s Belgium employees in exchange for the bankruptcy receivers requesting withdrawal of the pending litigation and agreeing not to file additional claims. The conditions of the settlement agreement included a release from liability by affected employees, the Belgian tax authority and the Belgian social security authority. These conditions were satisfied and the settlement was finalized during the third quarter of 2011. We do not believe that this claim has merit, and we are pursuingrecorded a vigorous defense to contest this action. We believe that it is reasonably possible that we will incur a losspretax charge of up to €20€7 million (equivalent to $26.5 million at December 31, 2010) if we lose(approximately $10 million) in the court proceeding, but it is also reasonably possible that we will prevail in the court resulting in no loss. We do not believe that any loss withinsecond quarter of 2011 related to this range is probable and have not accrued for this matter. The ultimate resolution of this matter is unknown and the estimated liability may change in the f uture. We do not believe that the ultimate disposition of this matter will have a material adverse effect on our liquidity, financial position or results of operations.claim.
Other
We are involved in various other lawsuits and claims in the ordinary course of business. We are not able to estimate the range of losses for some of these matters. We have recorded accruals for losses that are considered probable and reasonably estimable. We do not believe that the ultimate disposition of any of these matters will have a material adverse effect on our liquidity, financial position or results of operations.
APPLICATION OF CRITICAL ACCOUNTING POLICIES
The application of accounting principles requires the use of assumptions, estimates and judgments. We make assumptions, estimates and judgments based on, among other things, knowledge of operations, markets, historical trends and likely future changes, similarly situated businesses and, when appropriate, the opinions of advisors with relevant knowledge and experience. Reported results could have been materially different had managementwe used a different set of assumptions, estimates and judgments.
Deferred Tax Asset Valuation Allowance
Deferred tax assets result primarily from net operating losses and the net tax effects of temporary differences between the carrying amount of assets and liabilities for financial statement and income tax purposes, as determined under enacted tax laws and rates.
Accounting Policies
We establish valuation allowances in accordance with FASB ASC Topic 740, Income Taxes, when we estimate it is not more likely than not that a deferred tax asset will be realized. We decide to record valuation allowances primarily based on an assessment of historical earnings and future taxable income that incorporates prudent, feasible tax-planning strategies. We assess deferred tax assets on an individual jurisdiction basis. Changes in tax statutes, the timing of deductibility of expenses or expectations for future performance could result in material adjustments to our valuation allowances, which would increase or decrease tax expense. Our valuation allowances are as follows.
Valuation Allowances
| | | December 31, | |
| (In millions) | | 2010 | | | 2009 | |
| | | | | | | |
| U.S. | | $ | 15.7 | | | | 9.8 | |
| Non-U.S. | | | 30.2 | | | | 35.6 | |
| Total | | $ | 45.9 | | | | 45.4 | |
| | | | | December 31, |
| | (In millions) | | 2011 | | 2010 | |
| | | | | | | | | | |
| | U.S. | $ | 8.2 | | | 15.7 | | |
| | Non-U.S. | | 35.7 | | | 30.2 | | |
| | | Total | $ | 43.9 | | | 45.9 | | |
Application of Accounting Policies
U.S. Deferred Tax Assets
ThereWe have $390 million of net deferred tax assets at December 31, 2011, and $354 million related to U.S. jurisdictions. We changed our judgment about the need for a deferred tax asset valuation allowance for foreign tax credit carryforwards in the U.S. as a result of tax planning strategies to repatriate non-U.S. earnings to enable us to utilize the credit carryfoward. As a result, we reversed $7.9 million of valuation allowances in 2011 that were originally recorded in 2010. Other than foreign tax credits, there were no significant changes to our deferred tax assets andU.S. valuation allowances in 2010.
Our deferred tax assets, before valuation allowances, decreased in 2009 as a result of an increase in retirement asset values from the equity market improvement and our contribution to the primary U.S. pension plan. The likelihood of realizing additional amounts of the remaining deferred tax assets improved due to improving market conditions, including credit markets. As a result, we revised our estimate of the amount of U.S. valuation allowances needed and reversed $117.8 million in income from continuing operations.2011.
We used various estimates and assumptions to evaluate the need for the valuation allowance in the U.S. These included
| · | projected revenues and operating income for our U.S. entities, |
| · | estimated required contributions to our U.S. retirement plans, and |
| · | interest rates on projected U.S. borrowings. |
Had we used different assumptions, we might have made different conclusions about the need for valuation allowances. For example, using different assumptions in 2011 and 2010 we might have concluded that we require a valuation allowance offsetting our U.S. deferred tax assets at the end of 2011 and 2010. Further, in 2009 we might have concluded that we should keep the valuation allowance offsetting our U.S. deferred tax asset, or we might have concluded that we should have reversed less than we did. In that case, our tax provision on income from continuing operations could have been up to $117.8 million higher in 2009.
Non-U.S. Deferred Tax Assets
We changed our judgment about the need for valuation allowances for deferred tax assets in certain non-U.S. jurisdictions as a result of improvements in operating results and an improved outlook about the future operating performance.performance in those jurisdictions. As a result, we reversed $0.3 million of valuation allowances in 2011 and $0.9 million of valuation allowances in 2010 and $2.0 million of valuation allowances in 2009 through continuing operations.
Goodwill, Other Intangible Assets and Property and Equipment Valuations
Accounting Policies
At December 31, 2010,2011, we had property and equipment of $698.9$749.2 million, goodwill of $244.3$231.4 million and other intangible assets of $83.2$63.8 million, net of accumulated depreciation and amortization. We review these assets for possible impairment using the guidance in FASB ASC Topic 350, Intangibles - Goodwill and Other, for goodwill and other intangible assets and FASB ASC Topic 360, Property, Plant and Equipment, for property and equipment. Our review for impairment requires the use of significant judgments about the future performance of our operating subsidiaries. Due to the many variables inherent in the estimates of the fair value of these assets, differences in assumptions could have a material effect on the impairment analyses.
Application of Accounting Policies
Goodwill
We review goodwill for impairment annually and whenever events or circumstances make it more likely than not that impairment may have occurred. Application of the goodwill impairment test requires judgment, including the identification of reporting units, assignment of assets and liabilities to reporting units, assignment of goodwill to reporting units, and determination of the fair value of each reporting unit. We estimateperform a qualitative assessment in order to determine whether it is more likely than not that the fair value of each reporting unit is less than its carrying amount. As part of this assessment, we review qualitative factors such as the amount of excess fair value from the most recent quantitative analysis, changes in the reporting unit carrying values, changes in market conditions as well as other factors specific to each reporting unit. If fair value is required to be determined for any reporting unit, we estimate the fair value using a discounted cash flow methodology. The fair value of each reporting unit is compared to its carrying value to determine if impairment is indicated.
For the 2011 assessment, we have determined that qualitative factors are present which indicate that the fair value of each reporting unit exceeds its carrying value. As a result, we have not updated our quantitative assessment of fair value for the reporting units. Due to a history of profitability and cash flow generation along with expectations for future cash flows, we have determined that the fair value of eachthe Latin America and Asia Pacific reporting units substantially exceeds carrying value. However, during our qualitative assessment, we noted factors that would indicate that the fair value of two of the reporting units, North America and EMEA, may no longer be substantially in excess of fair value. This decline is driven primarily by lower than previously anticipated performance in both of these reporting units. North America and EMEA have $20.1 million and $126.4 million in goodwill, respectively, as of December 31, 2011.
The qualitative assessment performed is inherently subjective, with a number of factors based on assumptions and judgments. Changes in assumptions and results due to economic conditions, industry factors and reporting unit substantially exceeds its carrying value.performance could result in different assessments of the fair value and could result in impairment charges in the future.
Indefinite-lived intangibles
We review indefinite-lived intangibles for impairment annually and whenever events or circumstances make it more likely than not that impairment may have occurred. An indefinite-lived intangible is also evaluated each reporting period to determine whether events and circumstances continue to support an indefinite useful life. The annual impairment test is performed by comparing the carrying value of the intangible to its estimated fair value. No impairment testing was performed during the year forWe have had no significant impairments of indefinite-lived intangibles acquired in the fourth quarter as no indicators of impairment existed in the short time from acquisition date to year end.last three years.
Other Intangible Assets and Property and Equipment
We review long-lived assets besides goodwill and other indefinite-lived intangibles for impairment whenever events or changes in circumstances indicate that the related carrying amounts may not be recoverable. For purposes of assessing impairment, assets are grouped at the lowest levels for which there are identifiable cash flows that are largely independent of the cash flows of other groups of assets. To determine whether impairment has occurred, we compare estimates of the future undiscounted net cash flows of groups of assets to their carrying value.
We have had no significant impairments of property and equipment in the last three years.
Retirement and Postemployment Benefit Obligations
We provide benefits through defined benefit pension plans and retiree medical benefit plans and under statutory requirements.
Accounting Policy
We account for pension and other retirement benefit obligations under FASB ASC Topic 715, Compensation – Retirement Benefits. We account for postemployment benefit obligations, including workers’ compensation obligations, under FASB ASC Topic 712, Compensation – Nonretirement Postemployment Benefits.
To account for these benefits, we make assumptions of expected return on assets, discount rates, inflation, demographic factors and changes in the laws and regulations covering the benefit obligations. Because of the inherent volatility of these items and because the obligations are significant, changes in the assumptions could have a material effect on our liabilities and expenses related to these benefits.
Our most significant retirement plans include our primary U.S. pension plan and the retiree medical plans of our former coal business that were collectively bargained with the United Mine Workers of America (the “UMWA”). The critical accounting estimates that determine the carrying values of liabilities and the resulting annual expense are discussed below.
Application of Accounting Policy
Discount Rate Assumptions for Plans Accounted under FASB ASC Topic 715
For plans accounted under FASB ASC Topic 715, we discount estimated future payments using discount rates based on market conditions at the end of the year. In general, our liability changes in an inverse relationship to interest rates. That is, the lower the discount rate, the higher the associated plan obligation.
We derive the discount rates used to measure the present value of our benefit obligations using the cash flow matching method. Under this method, we compare the plan’s projected payment obligations by year with the corresponding yields on the Mercer Yield Curve. Each year’s projected cash flows are then discounted back to their present value at the measurement date and an overall discount rate is determined. The overall discount rate is then rounded to the nearest tenth of a percentage point.
The discount rates for the primary U.S. pension plans,plan, UMWA retiree medical plans and Black Lung obligations were:
| | | Primary U.S. Plan | | | UMWA Plans | | | Black Lung | |
| | | 2010 | | | 2009 | | | 2008 | | | 2010 | | | 2009 | | | 2008 | | | 2010 | | | 2009 | | | 2008 | |
| | | | | | | | | | | | | | | | | | | | | | | | | | | | |
| Discount rate: | | | | | | | | | | | | | | | | | | | | | | | | | | | |
Retirement cost | | | 5.9 | % | | | 6.7 | % | | | 6.4 | % | | | 5.9 | % | | | 6.2 | % | | | 6.4 | % | | | 5.3 | % | | | 6.3 | % | | | 6.1 | % |
Benefit obligation at year end | | | 5.3 | % | | | 5.9 | % | | | 6.2 | % | | | 5.3 | % | | | 5.9 | % | | | 6.2 | % | | | 4.8 | % | | | 5.4 | % | | | 6.3 | % |
| | | | Primary U.S. Plan | | | UMWA Plans | | | Black Lung | |
| | | | 2011 | | 2010 | | 2009 | | | 2011 | | 2010 | | 2009 | | | 2011 | | 2010 | | 2009 | |
| | | | | | | | | | | | | | | | | | | | | | | |
| | Discount rate: | | | | | | | | | | | | | | | | | | | | |
| | | Retirement cost | 5.3 % | | 5.9 % | | 6.7 % | | | 5.3 % | | 5.9 % | | 6.2 % | | | 4.8 % | | 5.3 % | | 6.3 % | |
| | | Benefit obligation at year end | 4.6 % | | 5.3 % | | 5.9 % | | | 4.4 % | | 5.3 % | | 5.9 % | | | 4.2 % | | 4.8 % | | 5.4 % | |
Sensitivity Analysis
The discount rate we select at year end affects the valuations of plan obligations at year end and calculations of net periodic expenses for the following year.
The tables below compare hypothetical plan obligation valuations for our largest plans as of December 31, 2010,2011, actual expenses for 20102011 and projected expenses for 20112012 assuming we had used discount rates that were one percentage point lower or higher.
Plan Obligations at December 31, 20102011
| | | Hypothetical | | | Actual | | | Hypothetical | |
| (In millions) | | | 4.3 | % | | | 5.3 | % | | | 6.3 | % |
| | | | | | | | | | | | | |
| Primary U.S. pension plan | | $ | 998.4 | | | | 869.0 | | | | 764.6 | |
| UMWA plans | | | 524.9 | | | | 474.3 | | | | 431.7 | |
| | | | Hypothetical | | | | | Hypothetical | |
| | (In millions) | | 1% lower | | Actual | | 1% higher | |
| | | | | | | | | | | | |
| | Primary U.S. pension plan | $ | 1,111.6 | | | 964.2 | | | 845.8 | | |
| | UMWA plans | | 588.3 | | | 529.6 | | | 480.6 | | |
Actual 20102011 and Projected 20112012 Expense (Income)
| (In millions, except percentages) | | | | | Hypothetical sensitivity analysis for discount rate assumption | | | | | | Hypothetical sensitivity analysis for discount rate assumption | |
| | | Actual | | | 1% lower | | | 1% higher | | | Projected | | | 1% lower | | | 1% higher | |
| Years Ending December 31, | | 2010 | | | 2010 | | | 2010 | | | 2011 | | | 2011 | | | 2011 | |
| | | | | | | | | | | | | | | | | | | |
| Primary U.S. pension plan | | | | | | | | | | | | | | | | | | |
| Discount rate assumption | | | 5.9 | % | | | 4.9 | % | | | 6.9 | % | | | 5.3 | % | | | 4.3 | % | | | 6.3 | % |
| Retirement cost (credit) | | $ | (2.1 | ) | | | 9.5 | | | | (12.9 | ) | | $ | 7.7 | | | | 17.5 | | | | (0.7 | ) |
| | | | | | | | | | | | | | | | | | | | | | | | | |
| UMWA plans | | | | | | | | | | | | | | | | | | | | | | | | |
| Discount rate assumption | | | 5.9 | % | | | 4.9 | % | | | 6.9 | % | | | 5.3 | % | | | 4.3 | % | | | 6.3 | % |
| Retirement cost | | $ | 17.8 | | | | 19.1 | | | | 16.7 | | | $ | 13.4 | | | | 14.6 | | | | 12.4 | |
| | | | | | Hypothetical sensitivity analysis | | | | Hypothetical sensitivity analysis | |
| | (In millions, except percentages) | | | | for discount rate assumption | | | | for discount rate assumption | |
| | | | Actual | | 1% lower | | 1% higher | | | | Projected | | 1% lower | | 1% Higher | | |
| | Years Ending December 31, | | 2011 | | 2011 | | 2011 | | | | 2012 | | 2012 | | 2012 | | |
| | | | | | | | | | | | | | | | | | |
| | Primary U.S. pension plan | | | | | | | | | | | | | | | | |
| | Discount rate assumption | | 5.3 % | | 4.3 % | | 6.3 % | | | | 4.6 % | | 3.6 % | | 5.6 % | | |
| | Retirement cost (credit) | $ | 8.0 | | 19.0 | | (1.3) | | | $ | 22.5 | | 32.9 | | 13.6 | | |
| | | | | | | | | | | | | | | | | | |
| | UMWA plans | | | | | | | | | | | | | | | | |
| | Discount rate assumption | | 5.3 % | | 4.3 % | | 6.3 % | | | | 4.4 % | | 3.4 % | | 5.4 % | | |
| | Retirement cost | $ | 13.2 | | 14.3 | | 12.1 | | | $ | 22.9 | | 24.0 | | 21.8 | | |
Expected-Return-on-Assets Assumption for Plans Accounted under FASB ASC Topic 715
Our expected-return-on-assets assumption, which affects our net periodic benefit cost, reflects the long-term average rate of return we expect the plan assets to earn. We select the expected-return-on-assets assumption using advice from our investment advisor and actuary considering each plan’s asset allocation targets and expected overall investment manager performance and a review of the most recent long-term historical average compounded rates of return, as applicable. We selected 8.75%8.25% as the expected-return-on-assets assumption for our primary U.S. plan and 8.50% for our UMWA retiree medical plans as of December 31, 2010 and 2009.2011. We selected 8.75% for both plans as of December 31, 2010.
Over the last ten years, the annual returns of our primary U.S. pension plan have averaged, on a compounded basis, 4.4%5.5%, net of fees, while the 20-year and 25-year compounded annual return averaged 9.2%8.5%, and the 29-year compounded annual return averaged 10.3%12.1%.
Sensitivity Analysis
Effect of using different expected-rate-of-return assumptions. Our 20102011 and projected 20112012 expense would have been different if we had used different expected-rate-of-return assumptions. For every hypothetical change of one percentage point in the assumed long-term rate of return on plan assets (and holding other assumptions constant), our 20102011 and 20112012 expense would be as follows.
| (In millions, except percentages) | | | | | Hypothetical sensitivity analysis for expected-return-on asset assumption | | | | | | Hypothetical sensitivity analysis for expected-return-on asset assumption | |
| | | Actual | | | 1% lower | | | 1% higher | | | Projected | �� | | 1% lower | | | 1% higher | |
| Years Ending December 31, | | 2010 | | | 2010 | | | 2010 | | | 2011 | | | 2011 | | | 2011 | |
| | | | | | | | | | | | | | | | | | | |
| Expected-return-on-asset assumption | | | 8.8 | % | | | 7.8 | % | | | 9.8 | % | | | 8.8 | % | | | 7.8 | % | | | 9.8 | % |
| | | | | | | | | | | | | | | | | | | | | | | | | |
| Primary U.S. pension plan | | $ | (2.1 | ) | | | 5.6 | | | | (9.7 | ) | | $ | 7.7 | | | | 15.1 | | | | 0.3 | |
| UMWA plans | | | 17.8 | | | | 20.7 | | | | 14.9 | | | | 13.4 | | | | 16.3 | | | | 10.5 | |
| | | | | | Hypothetical sensitivity analysis | | | | Hypothetical sensitivity analysis | |
| | | | | | for expected-return-on asset | | | | for expected-return-on asset | |
| | (In millions, except percentages) | | | | assumption | | | | assumption | |
| | | | Actual | | 1% lower | | 1% higher | | | | Projected | | 1% lower | | 1% Higher | | |
| | Years Ending December 31, | | 2011 | | 2011 | | 2011 | | | | 2012 | | 2012 | | 2012 | | |
| | | | | | | | | | | | | | | | | | |
| | | | | | | | | | | | | | | | | | |
| | Expected-return-on-asset assumption | | | | | | | | | | | | | | | | |
| | Primary U.S. pension plan | | 8.75 % | | 7.75 % | | 9.75 % | | | | 8.25 % | | 7.25 % | | 9.25 % | | |
| | UMWA plans | | 8.75 % | | 7.75 % | | 9.75 % | | | | 8.50 % | | 7.50 % | | 9.50 % | | |
| | | | | | | | | | | | | | | | | | |
| | Primary U.S. pension plan | $ | 8.0 | | 15.5 | | 0.7 | | | $ | 22.5 | | 29.8 | | 15.2 | | |
| | UMWA plans | | 13.2 | | 16.1 | | 10.3 | | | | 22.9 | | 25.4 | | 20.4 | | |
Effect of improving or deteriorating actual future market returns. Our funded status at December 31, 2011,2012, and our 20122013 expense will be different from currently projected amounts if our projected 20112012 returns are better or worse than the 8.75% returnreturns we have assumed.assumed for each plan.
| (In millions, except percentages) | | | | | Hypothetical sensitivity analysis of 2011 asset return better or worse than expected | |
| | | | | | Better | | | Worse | |
| Years Ending December 31, | | Projected | | | return | | | return | |
| | | | | | | | | | |
| Return on investments in 2011 | | | 8.8 | % | | | 17.5 | % | | | 0 | % |
| | | | | | | | | | | | | |
| Funded Status at December 31, 2011 | | | | | | | | | | | | |
| Primary U.S. pension plan | | $ | (156 | ) | | | (97 | ) | | | (216 | ) |
| UMWA plans | | | (163 | ) | | | (137 | ) | | | (188 | ) |
| | | | | | | | | | | | | |
| 2012 Expense | | | | | | | | | | | | |
| Primary U.S. pension plan (a) | | $ | 11 | | | | 9 | | | | 14 | |
| UMWA plans | | | 13 | | | | 9 | | | | 17 | |
| | | | | | Hypothetical sensitivity analysis of 2012 asset return | |
| | (In millions, except percentages) | | | | | better or worse than expected | |
| | | | | | | Better | | Worse | | |
| | Years Ending December 31, | | Projected | | | return | | return | | |
| | | | | | | | | | | |
| | Return on investments in 2012 | | | | | | | | | |
| | Primary U.S. pension plan | | 8.25 % | | | 16.50 % | | - % | | |
| | UMWA plans | | 8.50 % | | | 17.00 % | | - % | | |
| | | | | | | | | | | |
| | Projected Funded Status at December 31, 2012 | | | | | | | | | |
| | Primary U.S. pension plan | $ | (234) | | | (178) | | (291) | | |
| | UMWA plans | | (263) | | | (242) | | (284) | | |
| | | | | | | | | | | |
| | 2013 Expense | | | | | | | | | |
| | Primary U.S. pension plan | $ | 24 | | | 21 | | 26 | | |
| | UMWA plans | | 23 | | | 19 | | 26 | | |
Effect of using fair market value of assets to determine expense. For our defined-benefit pension plans, we calculate expected investment returns by applying the expected long-term rate of return to the market-related value of plan assets. In addition, our plan asset actuarial gains and losses that are subject to amortization are based on the market-related value.
The market-related value of the plan assets is different from the actual or fair-market value of the assets. The actual or fair-market value is, at a point in time, the value of the assets that is available to make payments to pensioners and to cover any transaction costs. The market-related value recognizes changes in fair-value from the expected value on a straight-line basis over five years. This recognition method spreads the effects of year-over-year volatility in the financial markets over several years.
Our expenses related to our primary U.S. pension plan would have been different if our accounting policy were to use the fair market value of plan assets instead of the market-related value to recognize investment gains and losses.
| (In millions) | Based on market-related value of assets | Hypothetical (a) |
| | Actual | Projected | Projected | | | |
| Years Ending December 31, | 2010 | 2011 | 2012 | 2010 | 2011 | 2012 |
| | | | | | | |
| Expense (Income) | | | | | | |
| | | | | | | |
| Primary U.S. pension plan | $(2.1) | 7.7 | 11.2 | $24.0 | 17.5 | 11.3 |
| | (In millions) | | Based on market-related value of assets | | | Hypothetical (a) | |
| | | | Actual | | Projected | | Projected | | | | | | | | | | | |
| | Years Ending December 31, | | 2011 | | 2012 | | 2013 | | | 2011 | | 2012 | | 2013 | |
| | | | | | | | | | | | | | | | | | | | | | |
| | Expense (Income) | | | | | | | | | | | | | | | | | | | | |
| | | | | | | | | | | | | | | | | | | | | | |
| | Primary U.S. pension plan | $ | 8.0 | | | 22.5 | | | 24.2 | | | $ | 20.9 | | | 30.2 | | | 21.7 | | |
(a) Assumes that our accounting policy was to use the fair market value of assets instead of the market-related value of assets to determine our expense relatedto our primary U.S. pension plan.| (a) | Assumes that our accounting policy was to use the fair market value of assets instead of the market-related value of assets to determine our expense related to our primary U.S. pension plan. |
For our UMWA plans, we calculate expected investment returns by applying the expected long-term rate of return to the fair market value of the assets at the beginning of the year. This method is likely to cause the expected return on assets, which is recorded in earnings, to fluctuate more than had we used the accounting methodology of our defined-benefit pension plans.
Medical Inflation Assumption
We estimate the trend in health care cost inflation to predict future cash flows related to our retiree medical plans. Our assumption is based on recent plan experience and industry trends.
For the UMWA plans, our largest postretirement plans, we have assumed a medical inflation rate of 7% for 2011,2012, and we project this rate to decline to 5% by 2017.2018. The compound growthaverage annual medical inflation rate of per-capita health care costs of the UMWA plans has been 5.6%company over the last seven years.three years was 7.6%. If we had assumed that medical inflation rates were one percentage point higher in each future year, the plan obligation for these plans at December 31, 2010,2011, would have been approximately $52.5$60.1 million higher and the expense for 20102011 would have been $2.8$2.5 million higher. If we had assumed that the medical inflation rates were one percentage point lower, the plan obligation at December 31, 2010,2011, would have been approximately $44.7$51.1 million lower and the related 20102011 expenses would have been $2.4$2.1 million lower.
If we had projected medical inflation rates to ratably decline from 7% to 4.5% by 2027, instead of ratably decliningour projected decline to 5% by 2017 as we estimated,2018, the plan obligation for the UMWA retiree medical benefit plan would have been $30.5$25.5 million higher for 20102011 and our expense would be $3.7$3.0 million higher for 2011.2012.
In addition, the Patient Protection and Affordable Care Act could substantially change the health care and insurance industries in the United States,U.S., which could increase our costs.
Excise Tax on Administrators by Patient Protection and Affordable Care Act
A 40% excise tax will be imposed on high-cost health plans (“Cadillac plans”) beginning in 2018. The tax will apply to plan costs that exceed a certain threshold level for individuals and for families, which will be indexed to inflation. There will be higher limits for high-risk professions, among which is mining. Even though the tax is not assessed directly to an employer but rather to the benefits plan administrator, the cost is expected to be passed through to plan sponsors as higher premiums or higher claims administration fees, increasing the plan sponsor’s obligations. We project that this excise tax will impact our UMWA plans and have accordingly included a 4.2% increase (approximately $21.3 million) to our UMWA plans’ obligation. We are currently unable to reduce the benefit levels of our UMWA medical plans to avoid this excise tax because these benefit levels are required by the Coal Industry Retiree Health Benefit Act of 1992.
Black Lung
The Patient Protection and Affordable Care Act, which was enacted in March 2010, contains an amendment to the laws governing federal black lung benefits for coal miners. The amendment creates a presumption that benefits should be awarded to current or former coal miners that have accumulated 15 or more years of coal mine employment if they are able to prove that they have a disabling pulmonary disease. Previously, miners were required to demonstrate that their disabling pulmonary disease was caused by black lung disease, and not by some other cause such as smoking or old age. Under the new law,amendment, the burden of proof becomes the employer’s to establish that the disabling pulmonary disease is not black lung disease or that t hethe miner’s disease did not result from coal mine employment. Surviving spouses will no longer be required to proveWe expect that black lung disease caused the death of a miner to continue receiving benefits.
The new law will be used to assess claims that are currently being reviewed, unless the claim was filed before January 1, 2005. Miners who have been denied benefits in the past (either as a result of not being able to prove that they have a disabling pulmonary disease, or not being able to prove that their disease was black lung disease)amendment may reapply for benefits and these claims will be assessed using the new rules.
The amendment will likely increase the approval rates for coal miners applying to receive black lung benefits; therefore we expectbenefits, however, the number of participants receiving black lung benefits may increase over the next few years. rates have not been significantly affected to date.
We remeasured our black lung obligation as of March 31, 2010, to reflect an estimate of the increase in amounts to be paid to minersapproval rates as a result of the new law.amendment. The obligation increased $19.3 million as a result of the remeasurement, from $42.3 million before the remeasurement to $61.6 million.
Approval rates used in the remeasurement of the black lung obligation were increased to reflect an estimate of the effect of the new legislation. Approval rates are difficult to estimate since the effect of the change in the law has not yet been observed in practice. The liability could change in the future if the approval rates used in the estimates of the liabilities are either too high or too low. These estimated amounts will change in the future to reflect payments made, actuarial revaluations, and other changes in estimates. Actual amounts could differ materially from the currently estimated amounts.
Workers’ Compensation
Besides the effects of changes in medical costs, worker’s compensation costs are affected by the severity and types of injuries, changes in state and federal regulations and their application and the quality of programs which assist an employee’s return to work. Our liability for future payments for workers’ compensation claims is evaluated annually with the assistance of an actuary.
Numbers of Participants
The valuations of all of these benefit plans are affected by the life expectancy of the participants. Accordingly, we rely on actuarial information to predict the number and life expectancy of participants. We use the following mortality table for our major plans.
| Plan | Mortality table | |
| UMWA plans | RP-2000 Employee, AnnuitantSeparate, Healthy Blue Collar | |
| Black Lung | RP-2000 Combined Annuitant/Non-Annuitant Blue Collar | |
| Primary U.S. pension | RP-2000 Combined Active and Retiree, Healthy Blue Collar | |
The number of participants by major plan in the past five years is as follows:
| | | Number of participants | |
| Plan | | 2010 | | | 2009 | | | 2008 | | | 2007 | | | 2006 | |
| UMWA plans | | | 4,600 | | | | 4,700 | | | | 4,900 | | | | 5,000 | | | | 5,200 | |
| Black Lung | | | 800 | | | | 700 | | | | 700 | | | | 800 | | | | 800 | |
| U.S. pension | | | 21,000 | | | | 21,100 | | | | 21,500 | | | | 22,500 | | | | 24,800 | |
| The number of participants by major plan in the past five years is as follows: | | | | | |
| | | | | | | | | | | | | | | | | |
| | | Number of participants |
| | Plan | 2011 | | 2010 | | 2009 | | 2008 | | 2007 | |
| | UMWA plans | 4,400 | | | 4,600 | | | 4,700 | | | 4,900 | | | 5,000 | | |
| | Black Lung | 800 | | | 800 | | | 700 | | | 700 | | | 800 | | |
| | U.S. pension | 20,400 | | | 21,000 | | | 21,100 | | | 21,500 | | | 22,500 | | |
Since we are no longer operating in the coal industry, we anticipate that the number of participants in the UMWA retirement medical plan will decline over time due to mortality. Since the U.S. pension plan has been frozen, the number of its participants shouldwill also decline over time.
Foreign Currency Translation
The majority of our subsidiaries outside the U.S. conduct business in their local currencies. Our financials report results in U.S. dollars, which include the results of these subsidiaries.
Accounting Policy
Our accounting policy for foreign currency translation is different depending on whether the economy in which our foreign subsidiary operates has been designated as highly inflationary or not. Economies with a three-year cumulative inflation rate of more than 100% are considered as highly inflationary. At the end of 2009, we did not have any subsidiaries operating in highly inflationary economies. Effective January 1, 2010, we began accounting for our Venezuelan subsidiaries as operating in a highly inflationary economy.
Non-Highly Inflationary Economies
Assets and liabilities of foreign subsidiaries in non-highly inflationary economies are translated into U.S. dollars using rates of exchange at the balance sheet date. Translation adjustments are recorded in other comprehensive income (loss). Revenues and expenses are translated at rates of exchange in effect during the year. Transaction gains and losses are recorded in net income.
Highly Inflationary Economies
Foreign subsidiaries that operate in highly inflationary countries must use the reporting currency (the U.S. dollar) as the functional currency. Local-currency monetary assets and liabilities are remeasured into dollars each balance sheet date, with remeasurement adjustments and other transaction gains and losses recognized in earnings. Non-monetary assets and liabilities do not fluctuate with changes in local currency exchange rates to the dollar.
Application of Accounting Policy
Venezuelan operationsVenezuela
Our Venezuelan operations constitute a material portion of our overall consolidated operations, and accounted for $186$269 million or 6%7% of total Brink’s revenues in 2010.2011. Our operating margins in Venezuela have varied depending on the mix of business during any year and have been up to three times our overall international segment operating margin rate.
Venezuela currency exchange ratesBeginning January 1, 2010, we designated Venezuela’s economy as highly inflationary for accounting purposes, and we consolidated our Venezuelan results using our accounting policy for subsidiaries operating in highly inflationary economies.
Since 2003, the Venezuelan government has controlled the exchange of local currency into other currencies, including the U.S. dollar.
| · | From 2003 to the present the government has maintained an official exchange rate. The rate is available only for transactions that have been approved by the government’s currency control agency, known as CADIVI, or if the purpose of the conversion is to purchase goods or services that are on a list of approved items. The official rate was 2.15 bolivar fuertes to the dollar in 2008 and 2009. In January 2010, the official currency was devalued and split into two separate official rates, one for priority items such as food, and another rate for other imports and other purposes. The ability to exchange funds at either of these rates requires CADIVI’s approval, unless the purpose of the conversion iswas to purchase goods or services that arewere on lists of approved items. The new rates were 2.6 and 4.3 bolivar fuertes to the dollar. In January 2011, the government eliminated the 2.6 rate such that the official rate was at a single rate of 4.3 bolivar fuertes to the dollar. |
| · | In addition to the official rate, a parallel market exchange rate was available until a June 2010 law disallowed the use of the parallel rate. Prior to June 2010, the parallel rate could be used to convert local cash into dollars. The average parallel bolivar fuerte to dollar rate was 4.2 in 2008, 6.0 in 2009 and 6.9 in the first five months of 2010. |
· | The June 2010 law also introduced a new government-sanctioned process to convert local currency into dollars at a rate known as the SITME rate. The SITME exchange process requires each transaction be approved by the government’s central bank. On a daily basis, the central bank publishes ranges of prices at which it may approve transactions to purchase dollar-denominated bonds, resulting in an exchange rate range of 4.3 to 5.3 bolivar fuertes to the U.S. dollar. To date, approved transactions have been at the upper end of the range. Currency exchanges using the SITME rate may not exceed $350,000 per legal entity per month. |
Translating our Venezuelan operations in our consolidated results
2008 and 2009
Prior to December 21, 2009, we had requested CADIVI’s approval to allow our dividends be converted to dollars using the official rate. As a result, we used the official rate to translate our Venezuelan financial information. This is consistent with the guidance issued by the International Practices Task Force of the Center for Audit Quality (the “IPTF”) and U.S. GAAP. This guidance provides that, in the absence of unusual circumstances, the rate used for dividend remittances should be used to translate foreign financial statements.
In December 2009, we repatriated dividends generated by our Venezuelan operations that had been unpaid over the last several years using the parallel market exchange rate. We decided to repatriate our dividends using the parallel rate due to significant delays in receiving the needed government approval to repatriate dividends at the official rate. We began translating our financial statements for our Venezuelan operations using the parallel rate, effective December 21, 2009, the date of our decision, since we expected to pay future dividends using the parallel rate.
We recognized foreign currency translation losses in other comprehensive income (loss) in 2009 as a result of translating at the parallel rate instead of the official rate on December 21, 2009. Losses recorded were
· | $85 million attributable to Brink’s |
· | $54 million attributable to noncontrolling interests, and |
2010
Effective January 1, 2010, we began accounting for Venezuelan subsidiaries as operating in a highly inflationary economy. We remeasured our bolivar fuerte-denominated net monetary assets and translated our earnings and cash flows at each balance sheet date using the parallel rate inuntil June 9, 2010, until it was disallowed andwhen the Venezuelan government replaced the parallel rate with a new exchange process that requires each transaction be approved by the SITMEgovernment’s central bank (the “SITME” rate). On a daily basis, the central bank publishes ranges of prices at which it may approve transactions to purchase dollar-denominated bonds, resulting in an exchange rate in June 2010.range of 4.3 to 5.3 bolivar fuertes to the U.S. dollar. To date, approved transactions have been at the upper end of the range. To the extent our Venezuelan subsidiarieswe need to obtain U.S. dollars, we currently expect our Venezuelan subsidiaries’ U.S. dollar-denominated transactions to be settled at a SITME rate of 5.3 bolivar fuertes to the U.S. dollar. We alsohave used this rate to remeasure our local currency-denominatedbolivar fuerte-denominated monetary assets and liabilities into U.S. dollars at December 31, 2011, resulting in bolivar fuerte-denominated net monetary assets and translated our earnings and cash flows into U.S. dollars beginningat December 31, 2011, of $56.7 million. We did not recognize any remeasurement gains or losses in June 2010. We recognized a $3.2 million net remeasurement loss in 2010.2011 as the SITME rate did not change.
DespiteUnder the limitations on the amount of local currency whichSITME process, approved transactions may be converted to dollars under the current law, wenot exceed $350,000 per legal entity per month. We believe that we will be able to continue to obtain sufficient U.S. dollars to purchase imported supplies and fixed assets to operate our business in Venezuela. We believe the new law will limit the repatriation of cash invested in Venezuela for the foreseeable future.
The investment in our Venezuelan subsidiaries, and cash and other monetary assets held by these subsidiaries are as follows:
| | | December 31, | |
| (in millions) | | 2010 | | | 2009 | |
| | | | | | | |
| Equity-method investment in Venezuelan subsidiaries (a) | | $ | 50.6 | | | | 47.1 | |
| | | | | | | | | |
| Net monetary assets held by our Venezuelan subsidiaries | | | | | | | | |
| Cash and short-term investments denominated in U.S. dollars | | $ | 3.3 | | | | 3.9 | |
| | | | | | | | | |
| Net monetary assets denominated in bolivar fuertes: | | | | | | | | |
| Cash and cash equivalents | | $ | 18.2 | | | | 7.9 | |
| Accounts receivable, accounts payable and other, net | | | 12.8 | | | | 27.8 | |
| Total | | $ | 31.0 | | | | 35.7 | |
(a) The amount represents retained earnings net of currency translation adjustments of the business.
repatriation of cash invested in Venezuela will be limited in the future. We have also been successful at converting bolivar fuertes to U.S. dollars through other legal channels, at a rate not as favorable as the SITME rate.
At December 31, 2011, our Venezuelan subsidiaries held $1.3 million of cash and short-term investments denominated in U.S. dollars and $8.9 million of cash denominated in bolivar fuertes. On an equity-method basis, we had investments in our Venezuelan operations of $75.4 million at December 31, 2011.
RECENT ACCOUNTING PRONOUNCEMENTS
Recently Adopted Accounting Standards
We adopted Statement of Financial Accounting Standard (“SFAS”) 168, The FASB Accounting Standards Codification and the Hierarchy of Generally Accepted Accounting Principles – a replacement of FASB Statement No. 162, effective for our quarter ended September 30, 2009. SFAS 168 established the FASB Accounting Standards Codification (“Codification”) as the sole source of authoritative non-governmental accounting principles to be applied in the preparation of financial statements in conformity with generally accepted accounting principles in the U.S. (“GAAP”). Although SFAS 168 does not change GAAP, the adoption of SFAS 168 affected our financial statements since all future references to authoritative accounting literature are now in accordance with SFAS 168.
We adopted the accounting principles established by FSP FAS 132(R)-1, Employers’ Disclosures about Postretirement Benefit Plan Assets, which is now part of FASB ASC Topic 715, Compensation – Retirement Benefits, effective for us on December 31, 2009. This guidance requires enhanced disclosures about plan assets in an employer’s defined benefit pension or other postretirement plans in order to provide users of financial statements with an understanding of how investment allocation decisions are made, the major categories of plan assets, the inputs and valuation techniques used to measure the fair value of plan assets, and significant conce ntrations of risk within plan assets.
We adopted the accounting principles established by SFAS 141(R), Business Combinations, which is now part of FASB ASC Topic 805, Business Combinations, effective January 1, 2009. FASB ASC Topic 805 establishes requirements for an acquirer to record the assets acquired, liabilities assumed, and any related noncontrolling interests related to the acquisition of a controlled subsidiary, measured at fair value, as of the acquisition date. In 2008, we expensed all acquisition costs for transactions that were expected to close in 2009. In 2009 and 2010, we recognized gains and losses related to the acquisition of controlling interests in affiliates previously accounted for under the equity method or cost method – see note 6 to our consolidated financial statements. The adoption of this new guidance did not otherwise have an effect on our historical financial statements, but does affect the way we account for acquisitions after the effective date.
We adopted the accounting principles established by SFAS 160, Noncontrolling Interests in Consolidated Financial Statements an Amendment of ARB No. 51, which is now part of FASB ASC Topic 810, Consolidation, effective January 1, 2009. FASB ASC Topic 810 establishes new accounting and reporting standards for the noncontrolling interest, previously known as minority interest, in a subsidiary and for the deconsolidation of a subsidiary. This statement clarifies that a noncontrolling interest in a subsidiary is an ownership interest in the consolidated entity that should be reported as a separate component within equity in the consolidated financial statements. Additionally, consolidated net income is to be reported with separate disclosure of the amounts attributable to the parent and to the noncontrolling interests. Prior to the adoption of this new guidance, noncontrolling interests were deductions from income in arriving at net income. Under FASB ASC Topic 810, noncontrolling interests are a deduction from net income used to arrive at net income attributable to Brink’s.
We adopted the accounting principles established by SFAS 161, Disclosures about Derivative Instruments and Hedging Activities an Amendment of SFAS 133, which is now part of FASB ASC Topic 815, Derivatives and Hedging, effective January 1, 2009. FASB ASC Topic 815 requires enhanced disclosures about an entity's derivative and hedging activities. The adoption of this new guidance had no effect on our financial statements.
We adopted the accounting principles established by SFAS 165, Subsequent Events, which is now part of FASB ASC Topic 855, Subsequent Events, effective for our quarter ended June 30, 2009. FASB ASC Topic 855 establishes general standards of accounting and disclosure of events that occur after the balance sheet date but before financial statements are issued or are available to be issued. The adoption of this new guidance did not have a material effect on our financial statements.
We adopted the accounting principles established by FASB Staff Position ("FSP") EITF 03-6-1, Determining Whether Instruments Granted in Share-Based Payment Transactions Are Participating Securities, which is now part of FASB ASC Topic 260, Earnings per Share, effective January 1, 2009. FASB ASC Topic 260 affects entities that accrue cash dividends (whether paid or unpaid) on share-based payment awards during the award’s service period for dividends that are nonforfeitable. The adoption of this new guidance did not have a material effect on our financial statements.
We adopted the accounting principles established by FSP 157-2, Partial Deferral of the Effective Date of SFAS 157, which is now part of FASB ASC Topic 820, Fair Value Measurements and Disclosures, effective January 1, 2009. This guidance delayed the effective date of FASB ASC Topic 820 for all nonrecurring fair value measurements of nonfinancial assets and nonfinancial liabilities. The adoption of this guidance did not have a material effect on our results of operations or financial position.
We adopted the accounting principles established by FSP FAS 157-4, Determining Fair Value When the Volume and Level of Activity for the Asset or Liability Have Significantly Decreased and Identifying Transactions That Are Not Orderly, which is now part of FASB ASC Topic
820, Fair Value Measurements and Disclosures, effective for our quarter ended June 30, 2009. FASB ASC Topic 820 provides guidance for estimating fair value when the volume and level of activity for the asset or liability have significantly decreased. FASB ASC Topic 820 also provides guidance for identifying circumstances that indicate a transaction is not orderly and affirms that the objective of fair value measurement in a market for an asset that is not active is the price that would be received in an orderly (i.e., not distressed) transaction on the measurement date under current market conditions. If the market is determined to be not active, the entity must consider all available evidence in determining whether an observable transaction is orderly. The ado ption of this new guidance did not have a material effect on our results of operations or financial position.
We adopted the accounting principles established by FSP FAS 115-2 and FAS 124-2, Recognition and Presentation of Other-Than-Temporary Impairments, which is now part of FASB ASC Topic 320, Investments – Debt and Equity Securities, effective for our quarter ended June 30, 2009. FASB ASC Topic 320 provides guidance on the recognition of other-than-temporary impairments of investments in debt securities and provides new presentation and disclosure requirements for other-than-temporary impairments of investments in debt and equity securities. The adoption of this n ew guidance did not have a material effect on our financial statements.
We adopted the accounting principles established by FSP FAS 107-1 and APB 28-1, Interim Disclosures about Fair Value of Financial Instruments, which is now part of FASB ASC Topic 825, Financial Instruments, effective for our quarter ended June 30, 2009. FASB ASC Topic 825 requires disclosures about the fair value of financial instruments in interim reporting periods whereas, previously, the disclosures were required only in annual financial statements. The adoption of this new guidance resulted in the disclosure of the fair value of our significant fixed-rate long-term debt and our available-for-sale securities as of our inte rim reporting periods. This new guidance did not otherwise have an effect on our financial statements.
We adopted the accounting principles established by FSP FAS 141(R)-1, Accounting for Assets Acquired and Liabilities Assumed in a Business Combination that Arise from Contingencies, which is now part of FASB ASC Topic 805, Business Combinations, effective for our quarter ended June 30, 2009. This guidance is effective for each of our business combinations which were completed on or after January 1, 2009. FASB ASC Topic 805 provides that contingent assets acquired or liabilities assumed in a business combination be recorded at fair value if the acquisition-date fair value can be determined during the measurement period. & #160;If the acquisition-date fair value cannot be determined, such items would be recognized at the acquisition date if they meet the recognition requirements of FASB ASC Topic 450, Contingencies. In periods after the acquisition date, items not recognized as part of the acquisition but recognized subsequently would be reflected in that subsequent period’s income. The adoption of this new guidance did not have a material effect on our financial statements.
In August 2009, the FASB issued Accounting Standards Update (“ASU”) 2009-05, Measuring Liabilities at Fair Value, which was effective for us on October 1, 2009. This ASU clarifies the application of certain valuation techniques in circumstances in which a quoted price in an active market for the identical liability is not available. The adoption of this guidance did not have a material effect on our financial statements.
In September 2009, the FASB issued ASU 2009-12, Investments in Certain Entities That Calculate Net Asset Value per Share (or Its Equivalent), which was effective for our year ending December 31, 2009. ASU 2009-12 allows investors to use net asset value as a practical expedient to estimate the fair value of certain investments that do not have readily determinable fair values and sets forth disclosure requirements for these investments. The adoption of this ASU helped us in applying the enhanced disclosure requirements established by FSP FAS 132(R)-1. Otherwise, the adoption of this guidance did not have a material effect on our financial statements.
We adopted the accounting principles established by ASU 2009-16, Transfers and Servicing: Accounting for Transfers of Financial Assets, effective January 1, 2010. This ASU removes the concept of a qualifying special-purpose entity (QSPE)(“QSPE”) from SFAS 140, Accounting for Transfers and Servicing of Financial Assets and Extinguishment of Liabilities, and removes the exception from applying FASBFinancial Accounting Standards Board (“FASB”) Interpretation 46R, Consolidation of Variable Interest Entities. This statement also clarifies the requirements for isolation and limitations on portions of financial assets that are eligible for sale accounti ng.accounting. The adoption of this new guidance did not have a material effect on our financial statements.
We adopted the accounting principles established by ASU 2009-17, Consolidations: Improvements to Financial Reporting by Enterprises Involved with Variable Interest Entities, effective January 1, 2010. This ASU requires an ongoing reassessment and replaces the quantitative-based risks and rewards calculation for determining which reporting entity, if any, has a controlling financial interest in a variable interest entity (“VIE”) with a primarily qualitative analysis. The qualitative analysis is based on identifying the party that has both the power to direct the activities that most significantly affect the VIE’s economic performance (the “power criterion”) and the obligation to absorb losses from or the right to receive benefits of the VIE that could po tentiallypotentially be significant to the VIE (the “losses/benefit criterion”). The party that meets both these criteria is deemed to have a controlling financial interest. The party with the controlling financial interest is considered to be the primary beneficiary and as a result is required to consolidate the VIE. The adoption of this new guidance did not have a material effect on our financial statements.
In January 2010, the FASB issued ASU 2010-06, Improving Disclosures about Fair Value Measurements. ASU 2010-06 both expands and clarifies the disclosure requirements related to fair value measurements. Entities are required to disclose separately the amounts of significant
transfers in and out of Level 1 and Level 2 of the fair value valuation hierarchy and describe the reasons for the transfers. Additionally, entities are required to disclose information about purchases, sales, issuances, and settlements on a gross basis in the reconciliation of Level 3 fair-value measurements. The new guidance also clarifies existing fair-value measurement disclosure guidance about the level of disaggregation, inputs, and valuation techniques. We adopted the new disclosures effective January 1, 2010, except for the Level 3 rollforward disclosures. The Level 3 rollforward disclosures will be effective for us January 1, 2011. The adoption of the ASU did not have a material effect on our disclosures as weWe did not have any significant transfers in and out of Level 1 and Level 2 of the fair valu evalue valuation hierarchy during 2010. See note 9 for the required disclosures for a 2011 transfer of certain of our fixed-rate bonds from Level 1 to Level 2 in 2010.the fair valuation hierarchy. We adopted the Level 3 rollforward disclosures effective January 1, 2011. The adoption of the Level 3 disclosures did not have a material effect on our financial statements as the only Level 3 valuations were for investments held by our retirement plans. Since these valuations have been estimated using net asset value per share, we are not required to make the Level 3 rollforward disclosures required by ASU 2010-06.
We adopted the accounting principles established by ASU 2010-09, Subsequent Events: Amendments to Certain Recognition and Disclosure Requirements, effective January 1, 2010. Under this amended guidance, SEC filers are no longer required to disclose the date through which subsequent events have been evaluated in originally issued and revised financial statements.
In January 2010, the FASB issued ASU 2010-02, Accounting and Reporting for Decreases in Ownership of a Subsidiary—a Scope Clarification, which clarifies the scope of the decrease in ownership provisions of ASCAccounting Standards Codification (“ASC”) 810-10, Consolidation, and related guidance. The ASU clarified that the standard applies to a subsidiary or group of assets that is a business, a subsidiary that is a business that is transferred to an equity method investee or joint venture, or an exchange of a group of assets that constitutes a business for a noncontrolling interest in an entity (including an equity method investee or joint venture). The ASU also expands the disclosures required upon deconsolidation of a subsidiary to disclo sedisclose the valuation techniques used to measure the fair value of any retained investment in the former subsidiary, the nature of continuing involvement after the former subsidiary has been deconsolidated or derecognized and whether the transaction resulting in deconsolidation was with a related party or if the deconsolidated entity will become a related party. Finally, the ASU also requires that entities disclose valuation techniques used to measure the fair value of previously held equity interests prior to acquiring control in a business combination achieved in stages. We adopted this guidance effective January 1, 2010. See page 99 for disclosures regardingThe adoption of this new guidance did not have a material effect on our remeasurement of a previously held equity interest in SPP and page 117 for disclosures about our 2010 deconsolidation of Brink’s Belgium.financial statements.
In May 2010, the FASB issued ASU 2010-19, Foreign Currency Issues: Multiple Foreign Currency Exchange Rates, which codified an SEC Staff Announcement made at the March 18, 2010, Emerging Issues Task Force (“EITF”) meeting. The Staff Announcement provides the SEC staff’s view on certain exchange rates related to investments in Venezuela. The use of different rates for remeasurement and translation purposes causes Venezuelan reported balances for financial reporting purposes and the actual U.S. dollar denominated balances to be different. The SEC staff indicated that any differences between the amounts reported for financial reporting purposes and actual U.S. dollar denominated balances that may have existed prior to the application o fof the highly inflationary accounting requirements (January 1, 2010, for calendar year-end registrants including Brink’s) should be recognized in the income statement, unless the issuer can document that the difference was previously recognized as a cumulative translation adjustment, in which case the difference should be recognized as a currency translation adjustment. We adopted the guidance effective March, 31, 2010, and recognized these differences as a currency translation adjustment as of January 1, 2010, upon the adoption of highly inflationary accounting in Venezuela. See related disclosures above in Note 1 – Summary of Significant Accounting Policies – Foreign Currency Translation – Venezuela.1.
In December 2010, the FASB ratified EITF 10-G, Disclosure of Supplementary Pro Forma Information for Business Combinations. EITF 10-G affects public entities that have entered into material business combinations and requires that pro forma disclosures should reflect the assumption that the business combination had occurred as of the beginning of the prior annual period. It also requires a description of nonrecurring pro forma adjustments. EITF 10-G is effective and should be applied prospectively for business combinations completed during periods beginning after December 15, 2010, with early adoption permitted. We arewere required to adopt the new rule in 2011, but we haveearly adopted this standard for acquisitions occurring in 2010. See related disclosuresThe adoption of this guidance did not have a material effect on page 103.our financial statements.
Standards Not Yet Adopted
In October 2009,We adopted the FASB issuedaccounting principles established by ASU 2009-13, Multiple-Deliverable Revenue Arrangements, which will be effective for us on January 1, 2011. ASU 2009-13 establishes a selling price hierarchy for determining the selling price of a deliverable in a multiple-deliverable arrangement. In addition, the revised guidance requires additional disclosures about the methods and assumptions used to evaluate multiple-deliverable arrangements and to identify the significant deliverables within those arrangements. We are currently evaluating the potentialThe adoption of this guidance did not have a material effect of the amended guidance on our financial statements.
In October 2009,We adopted the FASB issuedaccounting principles established by ASU 2009-14, Certain Revenue Arrangements that Include Software Elements, which will be effective for us on January 1, 2011. ASU 2009-14 amends ASC Topic 985 to exclude from its scope tangible products that contain both software and non-software components that function together to deliver a product’s essential functionality. We are currently evaluating the potentialThe adoption of this guidance did not have a material effect of the amended guidance on our financial statements.
In September 2011, the FASB issued ASU 2011-08, Testing Goodwill for Impairment. Under the revised guidance, entities testing goodwill for impairment have the option of performing a qualitative assessment before calculating the fair value of the reporting unit (i.e., Step 1 of the goodwill impairment test). If entities determine, on the basis of qualitative factors, that it is more likely than not that the fair value of the reporting unit is less than the carrying amount, the two-step impairment test would be required. The ASU also requires that the same qualitative factors be considered when determining whether an interim test of goodwill impairment is necessary and for determining whether it is necessary to perform Step 2 for reporting units with zero or negative carrying amounts. The option to carry forward an entity’s detailed calculation of fair value of the reporting unit if certain conditions were met has been removed. Although the ASU is effective for fiscal years beginning after December 15, 2011, we adopted this guidance for the 2011 reporting year for our annual October 1 goodwill impairment test. The adoption of this guidance did not have a material effect on our financial statements.
Standards Not Yet Adopted
In May 2011, the FASB issued ASU 2011-04, Fair Value Measurement: Amendments to Achieve Common Fair Value Measurement and Disclosure Requirements in U.S. GAAP and IFRS, which became effective for us on January 1, 2012. ASU 2011-04 changes how fair value guidance is applied in certain circumstances and expands the disclosure requirements around fair value measurements. For entities with fair value measurements classified as Level 3, required disclosures include a quantitative disclosure of the unobservable inputs and assumptions used in the measurement, a description of the valuation processes in place, a narrative description of the sensitivity of the fair value to changes in unobservable inputs and interrelationships between those inputs, and quantitative disclosures about unobservable inputs used in fair value measurements other than those valuations that use net asset value as a practical expedient. The adoption of this guidance will not have a material effect on our financial statements but may increase the disclosures related to our Level 3 fair value measurements.
In June 2011, the FASB issued ASU 2011-05, Presentation of Comprehensive Income, which became effective for us on January 1, 2012. Under ASU 2011-05, an entity has the option to present the components of comprehensive income either in a single continuous statement of comprehensive income or in two separate but consecutive statements. The ASU does not change the items that must be reported as other comprehensive income. Whether presenting two separate statements or one continuous statement, the ASU required entities to present reclassifications from other comprehensive income in the statement reporting net income. In December 2011, however, the FASB deferred this requirement when it issued ASU 2011-12, Deferral of the Effective Date for Amendments to the Presentation of Reclassification of Items Out of Accumulated Other Comprehensive Income in Accounting Standards Update No. 2011-05, which has the same effective date as ASU 2011-05. Companies must continue to disclose reclassifications from other comprehensive income on the statement that reports other comprehensive income, or in the notes to the financial statements. We have determined that the standards will not affect our annual financial statements. However, we will be required to include a statement of comprehensive income in our quarterly financial statements beginning in 2012.
ITEM 7A. QUANTITATIVE AND QUALITATIVE DISCLOSURES ABOUT MARKET RISK
We currently serve customers in more than 100 countries, including approximately 50 countries where we operate subsidiaries. These operations expose us to a variety of market risks, including the effects of changes in interest rates, commodity prices and foreign currency exchange rates. These financial and commodity exposures are monitored and managed by us as an integral part of its overall risk management program.
We periodically use various derivative and non-derivative financial instruments, as discussed below, to hedge our interest rate, commodity prices and foreign currency exposures when appropriate. The risk that counterparties to these instruments may be unable to perform is minimized by limiting the counterparties used to major financial institutions with investment grade credit ratings. We do not expect to incur a loss from the failure of any counterparty to perform under the agreements. We do not use derivative financial instruments for purposes other than hedging underlying financial or commercial exposures.
The sensitivity analyses discussed below for the market risk exposures were based on the facts and circumstances in effect at December 31, 2010.2011. Actual results will be determined by a number of factors that are not under management’s control and could vary materially from those disclosed.
We use both fixed and floating rate debt and leases to finance our operations. Floating rate obligations, including our Revolving Facility, expose us to fluctuations in cash flows due to changes in the general level of interest rates. Fixed rate obligations, including our Dominion Terminal Associates debt and our unsecured notes, are subject to fluctuations in fair values as a result of changes in interest rates.
Based on the contractual interest rates on the floating rate debt at December 31, 2010,2011, a hypothetical 10% increase in rates would increase cash outflows by approximately $0.7$0.6 million over a twelve-month period. In other words, our weighted average interest rate on our floating rate instruments was 2.4%2.9% per annum at December 31, 2010.2011. If that average rate were to increase by 0.3 percentage points to 2.7%3.2%, the cash outflows associated with these instruments would increase by $0.7$0.6 million annually. The effect on the fair value ofvalues on our Dominion Terminal Associates (“DTA”) debt and on our unsecured notes for a hypothetical 10% decrease in the yield curve from year-end 20102011 levels would result in a $3.3 million increase for our DTA debt and a $2.8 million increase for our unsecured notes in the fair valuevalues of thisthe debt.
We have exposure to the effects of foreign currency exchange rate fluctuations on the results of all of our foreign operations. Our foreign operations generally use local currencies to conduct business but their results are reported in U.S. dollars.
Our business in Venezuela represents approximately 7% of our revenues. Currently, Venezuela operates in a highly inflationary economy and its currency is fixed to the U.S. dollar. However, there is a risk that the Venezuelan government will devalue the local currency in the future, which would reduce the value of our business and result in the recognition of a loss.
The investment in our Venezuelan subsidiaries, and cash and other monetary assets held by these subsidiaries are as follows:
| | | | | | December 31, | |
| | (In millions) | | 2011 | | 2010 | |
| | | | | | | | | | | |
| | Equity-method investment in Venezuelan subsidiaries (a) | $ | 75.4 | | | 50.6 | | |
| | | | | | | | | | | |
| | Net monetary assets held by our Venezuelan subsidiaries | | | | | | | |
| | Cash and short-term investments denominated in U.S. dollars | $ | 1.3 | | | 3.3 | | |
| | | | | | | | | | | |
| | Net monetary assets denominated in bolivar fuertes: | | | | | | | |
| | | Cash and cash equivalents | $ | 8.9 | | | 18.2 | | |
| | | Accounts receivable, accounts payable and other, net | | 47.8 | | | 12.8 | | |
| | | | Total | $ | 56.7 | | | 31.0 | | |
| | (a) | The amount represents retained earnings net of currency translation adjustments of the business. |
We are exposed periodically to the foreign currency rate fluctuations that affect transactions not denominated in the functional currency of domestic and foreign operations. To mitigate these exposures, we, from time to time, enter into foreign currency forward and swap contracts. At December 31, 2010, no material2011, the notional value of our outstanding foreign currency forward contracts were outstanding.was $72.8 million with average contract maturities of less than one month. The foreign currency contracts primarily offset exposures in the Mexican peso and the euro. We do not use derivative financial instruments to hedge investments in foreign subsidiaries since such investments are long-term in nature.
The effects of a hypothetical simultaneous 10% appreciation in the U.S. dollar from year-end 20102011 levels against all other currencies of countries in which we have continuing operations are as follows:
| | | Hypothetical Effects | |
| (In millions) | | Increase/ (decrease) | |
| | | | |
| Effect on Earnings: | | | |
| Translation of 2010 earnings into U.S. dollars | | $ | (10.9 | ) |
| Transaction gains (losses) | | | (1.7 | ) |
| Effect on Other Comprehensive Income (Loss): | | | | |
| Translation of net assets of foreign subsidiaries | | | (72.6 | ) |
| | | | Hypothetical Effects | |
| (In millions) | | Increase/ (decrease) | |
| | | | | | |
| Effect on Earnings | | | | |
| | Translation of 2011 earnings into U.S. dollars | $ | (13.5) | | |
| | Transaction gains (losses) | | 0.6 | | |
| Effect on Other Comprehensive Income (Loss): | | | | |
| | Translation of net assets of foreign subsidiaries | | (72.7) | | |
The hypothetical foreign currency effects above detail the consolidated effect attributable to Brink’s of a simultaneous change in the value of a large number of foreign currencies relative to the U. S. dollar. The foreign currency exposure effect related to a change in an individual currency could be significantly different.
Venezuela Designated as Highly Inflationary Economy in 2010
The economy in Venezuela has had significant inflation in the last several years. In December 2009, the three-year cumulative inflation rate exceeded 100%. As a result, beginning January 1, 2010, we designated Venezuela’s economy as highly inflationary for accounting purposes, and we consolidated our Venezuelan results using our accounting policy for subsidiaries operating in highly inflationary economies.
ITEM 8. FINANCIAL STATEMENTS AND SUPPLEMENTARY DATA
THE BRINK’S COMPANY
CONSOLIDATED FINANCIAL STATEMENTS
FOR THE YEAR ENDED DECEMBER 31, 20102011
TABLE OF CONTENTS
| | | Page |
| | | |
| MANAGEMENT’S ANNUAL REPORT ON INTERNAL CONTROL OVER FINANCIAL REPORTING | 7071 |
| | |
| REPORTS OF INDEPENDENT REGISTERED PUBLIC ACCOUNTING FIRM | 7172 |
| | | |
| CONSOLIDATED FINANCIAL STATEMENTS | |
| | Consolidated Balance Sheets | 7374 |
| | Consolidated Statements of Income | 7475 |
| | Consolidated Statements of Comprehensive Income (Loss) | 7576 |
| | Consolidated Statements of Shareholders’ Equity | 7677 |
| | Consolidated Statements of Cash Flows | 7778 |
| | | |
| NOTES TO CONSOLIDATED FINANCIAL STATEMENTS | |
| | Note 1 – Summary of Significant Accounting Policies | 7879 |
| | Note 2 – Segment Information | 85 |
| | Note 3 – Retirement Benefits | 87 |
| | Note 4 – Income Taxes | 96 |
| | Note 5 – Property and Equipment | 99 |
| | Note 6 – Acquisitions | 99 |
| | Note 7 – Goodwill and Other Intangible Assets | 104102 |
| | Note 8 – Other Assets | 106104 |
| | Note 9 – Fair Value of Financial Instruments | 106104 |
| | Note 10 – Accrued Liabilities | 107105 |
| | Note 11 – Other Liabilities | 107105 |
| | Note 12 – Long-Term Debt | 108106 |
| | Note 13 – Accounts Receivable | 110108 |
| | Note 14 – Operating Leases | 110108 |
| | Note 15 – Share-Based Compensation Plans | 111109 |
| | Note 16 – Capital Stock | 114112 |
| | Note 17 – Income from Discontinued Operations | 115113 |
| | Note 18 – Supplemental Cash Flow Information | 116114 |
| | Note 19 – Other Operating Income net(Expense) | 116114 |
| | Note 20 – Interest and Other Nonoperating Income (Expense), net | 116114 |
| | Note 21 – Other Commitments and Contingencies | 117115 |
| | Note 22 – Selected Quarterly Financial Data (unaudited) | 118116 |
MANAGEMENT’S ANNUAL REPORT ON INTERNAL CONTROL OVER FINANCIAL REPORTING
Management of the Company is responsible for establishing and maintaining adequate internal control over financial reporting as defined in Rule 13a-15(f) under the Securities Exchange Act of 1934. Our internal control over financial reporting is designed to provide reasonable assurance to our management and board of directors regarding the preparation and fair presentation of published financial statements.
Because of its inherent limitations, internal control over financial reporting may not prevent or detect misstatements. Therefore, even those systems determined to be effective can provide only reasonable assurance with respect to financial statement preparation and presentation.
Management assessed the effectiveness of our internal control over financial reporting as of December 31, 2010.2011. In making this assessment, management used the criteria set forth by the Committee of Sponsoring Organizations of the Treadway Commission (COSO) in “Internal Control – Integrated Framework.”
In reliance on guidance set forth in Question 3 of a “Frequently Asked Questions” interpretative release issued by the Staff of the SEC’s Office of the Chief Accountant and the Division of Corporation Finance in September 2004, as revised on September 24, 2007, regarding Securities Exchange Act Release No. 34-47986, Management’s Report on Internal Control Over Financial Reporting and Certification of Disclosure in Exchange Act Periodic Reports, management determined that it would exclude the business of Servicio Pan Americano de Proteccion, S.A. de C.V. (“SPP”), which was acquired on November 17, 2010, from the scope of the assessment of the effectiveness of our internal control over financial reporting. The reason for this exclusion is that we acquired SPP in November 2010 and it was not pra ctical for management to conduct an assessment of internal control over financial reporting in the period between the date the acquisition was completed and the date of management’s assessment. Accordingly, management excluded SPP from its assessment of internal control over financial reporting. SPP represents $220.5 million of total assets and $51.7 million of revenues for the year ended December 31, 2010, of our consolidated financial statements.
SPP will be included in management’s assessment of internal control over financial reporting for the fiscal year ending December 31, 2011.
Based on this assessment, our management believes that, as of December 31, 2010,2011, our internal control over financial reporting is effective based on the COSO criteria.
KPMG LLP, the independent registered public accounting firm which audits our consolidated financial statements, has issued an attestation report of our internal control over financial reporting. KPMG’s attestation report appears on page 71.72.
Report of Independent Registered Public Accounting Firm
The Board of Directors and Shareholders
The Brink’s Company:
We have audited The Brink’s Company’s (the Company) internal control over financial reporting as of December 31, 2010,2011, based on criteria established in Internal Control – Integrated Framework issued by the Committee of Sponsoring Organizations of the Treadway Commission (COSO). The Company’s management is responsible for maintaining effective internal control over financial reporting and for its assessment of the effectiveness of internal control over financial reporting, included in the accompanying Management’s Annual Report on Internal Control over Financial Reporting. Our responsibility is to express an opinion on the Company’s internal control over financial reporting based on our audit.
We conducted our audit in accordance with the standards of the Public Company Accounting Oversight Board (United States). Those standards require that we plan and perform the audit to obtain reasonable assurance about whether effective internal control over financial reporting was maintained in all material respects. Our audit included obtaining an understanding of internal control over financial reporting, assessing the risk that a material weakness exists, and testing and evaluating the design and operating effectiveness of internal control based on the assessed risk. Our audit also included performing such other procedures as we considered necessary in the circumstances. We believe that our audit provides a reasonable basis for our opinion.
A company’s internal control over financial reporting is a process designed to provide reasonable assurance regarding the reliability of financial reporting and the preparation of financial statements for external purposes in accordance with generally accepted accounting principles. A company’s internal control over financial reporting includes those policies and procedures that (1) pertain to the maintenance of records that, in reasonable detail, accurately and fairly reflect the transactions and dispositions of the assets of the company; (2) provide reasonable assurance that transactions are recorded as necessary to permit preparation of financial statements in accordance with generally accepted accounting principles, and that receipts and expenditures of the company are being made only in accordance with authoriza tionsauthorizations of management and directors of the company; and (3) provide reasonable assurance regarding prevention or timely detection of unauthorized acquisition, use, or disposition of the company’s assets that could have a material effect on the financial statements.
Because of its inherent limitations, internal control over financial reporting may not prevent or detect misstatements. Also, projections of any evaluation of effectiveness to future periods are subject to the risk that controls may become inadequate because of changes in conditions, or that the degree of compliance with the policies or procedures may deteriorate.
In our opinion, The Brink’s Company maintained, in all material respects, effective internal control over financial reporting as of December 31, 2010,2011, based on criteria established in Internal Control – Integrated Framework issued by the Committee of Sponsoring Organizations of the Treadway Commission.
The Brink’s Company acquired Servicio Pan Americano de Proteccion, S.A. de C.V. (“SPP”) on November 17, 2010, and management excluded from its assessment of the effectiveness of The Brink’s Company’s internal control over financial reporting as of December 31, 2010, SPP’s internal control over financial reporting associated with total assets of $220.5 million and total revenues of $51.7 million included in the consolidated financial statements of The Brink’s Company and subsidiaries as of and for the year ended December 31, 2010. Our audit of internal control over financial reporting of The Brink’s Company also excluded an evaluation of the internal control over financial reporting of SPP.
We also have audited, in accordance with the standards of the Public Company Accounting Oversight Board (United States), the consolidated balance sheets of The Brink’s Company and subsidiaries as of December 31, 20102011 and 2009,2010, and the related consolidated statements of income, comprehensive income (loss), shareholders’ equity, and cash flows for each of the years in the three-year period ended December 31, 2010,2011, and our report dated February 25, 201127, 2012 expressed an unqualified opinion on those consolidated financial statements.
/s/ KPMG LLP
Richmond, Virginia
February 25, 201127, 2012
Report of Independent Registered Public Accounting Firm
The Board of Directors and Shareholders
The Brink’s Company:
We have audited the accompanying consolidated balance sheets of The Brink’s Company and subsidiaries (the Company) as of December 31, 20102011 and 2009,2010, and the related consolidated statements of income, comprehensive income (loss), shareholders’ equity, and cash flows for each of the years in the three-year period ended December 31, 2010.2011. These consolidated financial statements are the responsibility of the Company’s management. Our responsibility is to express an opinion on these consolidated financial statements based on our audits.
We conducted our audits in accordance with the standards of the Public Company Accounting Oversight Board (United States). Those standards require that we plan and perform the audit to obtain reasonable assurance about whether the financial statements are free of material misstatement. An audit includes examining, on a test basis, evidence supporting the amounts and disclosures in the financial statements. An audit also includes assessing the accounting principles used and significant estimates made by management, as well as evaluating the overall financial statement presentation. We believe that our audits provide a reasonable basis for our opinion.
In our opinion, the consolidated financial statements referred to above present fairly, in all material respects, the financial position of The Brink’s Company and subsidiaries as of December 31, 20102011 and 2009,2010, and the results of their operations and their cash flows for each of the years in the three-year period ended December 31, 2010,2011, in conformity with U.S. generally accepted accounting principles.
As disclosed in note 1 to the consolidated financial statements, the Company adopted the provisions of Statement of Financial Accounting Standards No. 141(R), Business Combinations (included in FASB ASC Topic 805, Business Combinations), effective January 1, 2009.
We also have audited, in accordance with the standards of the Public Company Accounting Oversight Board (United States), The Brink’s Company’s internal control over financial reporting as of December 31, 2010,2011, based on criteria established in Internal Control – Integrated Framework issued by the Committee of Sponsoring Organizations of the Treadway Commission (COSO), and our report dated February 25, 201127, 2012 expressed an unqualified opinion on the effectiveness of the Company’s internal control over financial reporting. The Brink’s Company acquired Servicio Pan Americano de Proteccion, S.A. de C.V. (“SPP”) on November 17, 2010, and management excluded from its assessment of the effectiveness of The Brink’s Company’s intern al control over financial reporting as of December 31, 2010, SPP’s internal control over financial reporting associated with total assets of $220.5 million and total revenues of $51.7 million included in the consolidated financial statements of The Brink’s Company and subsidiaries as of and for the year ended December 31, 2010. Our audit of internal control over financial reporting of The Brink’s Company also excluded an evaluation of the internal control over financial reporting of SPP.
/s/ KPMG LLP
Richmond, Virginia
February 25, 201127, 2012
THE BRINK’S COMPANY
and subsidiaries
Consolidated Balance Sheets
| | | December 31, | |
| (In millions, except per share amounts) | | 2010 | | | 2009 | |
| | | | | | | |
| ASSETS | | | | | | |
| | | | | | | |
| Current assets: | | | | | | |
Cash and cash equivalents | | $ | 183.0 | | | | 143.0 | |
Accounts receivable (net of allowance: 2010 – $7.2; 2009 – $7.1) | | | 525.1 | | | | 427.6 | |
Prepaid expenses and other | | | 121.0 | | | | 81.0 | |
Deferred income taxes | | | 48.3 | | | | 38.5 | |
Total current assets | | | 877.4 | | | | 690.1 | |
| | | | | | | | | |
| Property and equipment, net | | | 698.9 | | | | 549.5 | |
| Goodwill | | | 244.3 | | | | 213.7 | |
| Other intangibles | | | 83.2 | | | | 69.4 | |
| Deferred income taxes | | | 276.0 | | | | 254.1 | |
| Other | | | 90.7 | | | | 103.0 | |
| | | | | | | | | |
Total assets | | $ | 2,270.5 | | | | 1,879.8 | |
| | | | | | | | | |
| LIABILITIES AND SHAREHOLDERS’ EQUITY | | | | | | | | |
| | | | | | | | | |
| Current liabilities: | | | | | | | | |
Short-term borrowings | | $ | 36.5 | | | | 7.2 | |
Current maturities of long-term debt | | | 29.0 | | | | 16.1 | |
Accounts payable | | | 141.5 | | | | 127.2 | |
Accrued liabilities | | | 469.0 | | | | 369.8 | |
Total current liabilities | | | 676.0 | | | | 520.3 | |
| | | | | | | | | |
| Long-term debt | | | 323.7 | | | | 172.3 | |
| Accrued pension costs | | | 266.8 | | | | 192.1 | |
| Retirement benefits other than pensions | | | 218.6 | | | | 198.3 | |
| Deferred income taxes | | | 30.6 | | | | 30.5 | |
| Other | | | 171.7 | | | | 170.5 | |
Total liabilities | | | 1,687.4 | | | | 1,284.0 | |
| | | | | | | | | |
| Commitments and contingent liabilities (notes 3, 4, 12, 14, 17 and 21) | | | | | | | | |
| | | | | | | | | |
| Equity: | | | | | | | | |
The Brink’s Company (“Brink’s”) shareholders’ equity: | | | | | | | | |
| Common stock, par value $1 per share: | | | | | | | | |
| Shares authorized: 100.0 | | | | | | | | |
Shares issued and outstanding: 2010 – 46.4; 2009 – 47.9 | | | 46.4 | | | | 47.9 | |
Capital in excess of par value | | | 542.6 | | | | 550.2 | |
Retained earnings | | | 537.5 | | | | 514.8 | |
Accumulated other comprehensive income (loss): | | | | | | | | |
Benefit plan adjustments | | | (550.7 | ) | | | (520.5 | ) |
Foreign currency translation | | | (64.0 | ) | | | (60.7 | ) |
Unrealized gains on available-for-sale securities | | | 4.4 | | | | 3.2 | |
Accumulated other comprehensive loss | | | (610.3 | ) | | | (578.0 | ) |
| | | | | | | | | |
Total Brink’s shareholders’ equity | | | 516.2 | | | | 534.9 | |
| | | | | | | | | |
Noncontrolling interests | | | 66.9 | | | | 60.9 | |
| | | | | | | | | |
Total equity | | | 583.1 | | | | 595.8 | |
| | | | | | | | | |
Total liabilities and shareholders’ equity | | $ | 2,270.5 | | | | 1,879.8 | |
See accompanying notes to consolidated financial statements.| | | December 31, | |
| (In millions, except per share amounts) | | 2011 | | | 2010 | |
| | | | | | | |
| ASSETS | | | | | | |
| | | | | | | |
| Current assets: | | | | | | |
| Cash and cash equivalents | | $ | 182.9 | | | | 183.0 | |
| Accounts receivable, (net of allowance: 2011 – $8.9; 2010 – $7.2) | | | 550.5 | | | | 525.1 | |
| Prepaid expenses and other | | | 134.1 | | | | 121.0 | |
| Deferred income taxes | | | 66.4 | | | | 48.3 | |
| Total current assets | | | 933.9 | | | | 877.4 | |
| | | | | | | | | |
| Property and equipment, net | | | 749.2 | | | | 698.9 | |
| Goodwill | | | 231.4 | | | | 244.3 | |
| Other intangibles | | | 63.8 | | | | 83.2 | |
| Deferred income taxes | | | 350.8 | | | | 276.0 | |
| Other | | | 77.1 | | | | 90.7 | |
| | | | | | | | | |
| Total assets | | $ | 2,406.2 | | | | 2,270.5 | |
| | | | | | | | | |
| | | | | | | | | |
| LIABILITIES AND EQUITY | | | | | | | | |
| | | | | | | | | |
| Current liabilities: | | | | | | | | |
| Short-term borrowings | | $ | 25.4 | | | | 36.5 | |
| Current maturities of long-term debt | | | 28.7 | | | | 29.0 | |
| Accounts payable | | | 159.5 | | | | 141.5 | |
| Accrued liabilities | | | 488.5 | | | | 469.0 | |
| Total current liabilities | | | 702.1 | | | | 676.0 | |
| | | | | | | | | |
| Long-term debt | | | 335.3 | | | | 323.7 | |
| Accrued pension costs | | | 369.6 | | | | 266.8 | |
| Retirement benefits other than pensions | | | 315.4 | | | | 218.6 | |
| Deferred income taxes | | | 23.0 | | | | 30.6 | |
| Other | | | 178.4 | | | | 171.7 | |
| Total liabilities | | | 1,923.8 | | | | 1,687.4 | |
| | | | | | | | | |
| Commitments and contingent liabilities (notes 3, 4, 12, 14, 17 and 21) | | | | | | | | |
| | | | | | | | | |
| Equity: | | | | | | | | |
| The Brink’s Company (“Brink’s”) shareholders: | | | | | | | | |
| Common stock, par value $1 per share: | | | | | | | | |
| Shares authorized: 100.0 | | | | | | | | |
| Shares issued and outstanding: 2011 – 46.9; 2010 – 46.4 | | | 46.9 | | | | 46.4 | |
| Capital in excess of par value | | | 559.5 | | | | 542.6 | |
| Retained earnings | | | 589.5 | | | | 537.5 | |
| Accumulated other comprehensive income (loss) | | | | | | | | |
| Benefit plan adjustments | | | (680.1 | ) | | | (550.7 | ) |
| Foreign currency translation | | | (110.7 | ) | | | (64.0 | ) |
| Unrealized gains on available-for-sale securities | | | 2.9 | | | | 4.4 | |
| Accumulated other comprehensive loss | | | (787.9 | ) | | | (610.3 | ) |
| | | | | | | | | |
| Brink’s shareholders | | | 408.0 | | | | 516.2 | |
| | | | | | | | | |
| Noncontrolling interests | | | 74.4 | | | | 66.9 | |
| | | | | | | | | |
| Total equity | | | 482.4 | | | | 583.1 | |
| | | | | | | | | |
| Total liabilities and equity | | $ | 2,406.2 | | | | 2,270.5 | |
| | | | | | | | | |
| See accompanying notes to consolidated financial statements. | |
THE BRINK’S COMPANY
Consolidated Statements of Income
| | | Years Ended December 31, | |
| (In millions, except per share amounts) | | 2010 | | | 2009 | | | 2008 | |
| | | | | | | | | | |
| Revenues | | $ | 3,121.5 | | | | 3,135.0 | | | | 3,163.5 | |
| | | | | | | | | | | | | |
| Costs and Expenses: | | | | | | | | | | | | |
| Cost of revenues | | | 2,536.4 | | | | 2,534.5 | | | | 2,505.1 | |
| Selling, general and administrative expenses | | | 429.3 | | | | 430.2 | | | | 434.5 | |
Total costs and expenses | | | 2,965.7 | | | | 2,964.7 | | | | 2,939.6 | |
| Other operating income (expense) | | | (9.5 | ) | | | (3.5 | ) | | | 4.6 | |
| | | | | | | | | | | | | |
Operating profit | | | 146.3 | | | | 166.8 | | | | 228.5 | |
| | | | | | | | | | | | | |
| Interest expense | | | (14.8 | ) | | | (11.3 | ) | | | (12.0 | ) |
| Interest and other income | | | 8.1 | | | | 10.8 | | | | 8.1 | |
Income from continuing operations before tax | | | 139.6 | | | | 166.3 | | | | 224.6 | |
| Provision for (benefit from) income taxes | | | 67.1 | | | | (61.1 | ) | | | 53.0 | |
| | | | | | | | | | | | | |
Income from continuing operations | | | 72.5 | | | | 227.4 | | | | 171.6 | |
| | | | | | | | | | | | | |
| Income from discontinued operations, net of tax | | | 0.3 | | | | 4.5 | | | | 51.5 | |
| | | | | | | | | | | | | |
Net income | | | 72.8 | | | | 231.9 | | | | 223.1 | |
Less net income attributable to noncontrolling interests | | | (15.7 | ) | | | (31.7 | ) | | | (39.8 | ) |
| | | | | | | | | | | | | |
Net income attributable to Brink’s | | $ | 57.1 | | | | 200.2 | | | | 183.3 | |
| | | | | | | | | | | | | |
| Amounts attributable to Brink’s: | | | | | | | | | | | | |
| Income from continuing operations | | $ | 56.8 | | | | 195.7 | | | | 131.8 | |
| Income from discontinued operations | | | 0.3 | | | | 4.5 | | | | 51.5 | |
| | | | | | | | | | | | | |
Net income attributable to Brink’s | | $ | 57.1 | | | | 200.2 | | | | 183.3 | |
| | | | | | | | | | | | | |
| Earnings per share attributable to Brink’s common shareholders: | | | | | | | | | | | | |
| Basic: | | | | | | | | | | | | |
Continuing operations | | $ | 1.18 | | | | 4.14 | | | | 2.85 | |
Discontinued operations | | | 0.01 | | | | 0.10 | | | | 1.11 | |
Net income | | | 1.18 | | | | 4.23 | | | | 3.96 | |
| | | | | | | | | | | | | |
| Diluted: | | | | | | | | | | | | |
Continuing operations | | $ | 1.17 | | | | 4.11 | | | | 2.82 | |
Discontinued operations | | | 0.01 | | | | 0.10 | | | | 1.10 | |
Net income | | | 1.18 | | | | 4.21 | | | | 3.93 | |
| | | | | | | | | | | | | |
| Weighted-average shares | | | | | | | | | | | | |
Basic | | | 48.2 | | | | 47.2 | | | | 46.3 | |
Diluted | | | 48.4 | | | | 47.5 | | | | 46.7 | |
See accompanying notes to consolidated financial statements.| | | Years Ended December 31, | |
| (In millions, except per share amounts) | | 2011 | | | 2010 | | | 2009 | |
| | | | | | | | | | |
| Revenues | | $ | 3,885.5 | | | | 3,121.5 | | | | 3,135.0 | |
| | | | | | | | | | | | | |
| Costs and expenses: | | | | | | | | | | | | |
| Cost of revenues | | | 3,174.3 | | | | 2,536.4 | | | | 2,534.5 | |
| Selling, general and administrative expenses | | | 543.1 | | | | 429.3 | | | | 430.2 | |
| Total costs and expenses | | | 3,717.4 | | | | 2,965.7 | | | | 2,964.7 | |
| Other operating income (expense) | | | 3.2 | | | | (9.5 | ) | | | (3.5 | ) |
| | | | | | | | | | | | | |
| Operating profit | | | 171.3 | | | | 146.3 | | | | 166.8 | |
| | | | | | | | | | | | | |
| Interest expense | | | (24.0 | ) | | | (14.8 | ) | | | (11.3 | ) |
| Interest and other income (expense) | | | 9.1 | | | | 8.1 | | | | 10.8 | |
| Income from continuing operations before tax | | | 156.4 | | | | 139.6 | | | | 166.3 | |
| Provision (benefit) for income taxes | | | 59.4 | | | | 67.1 | | | | (61.1 | ) |
| | | | | | | | | | | | | |
| Income from continuing operations | | | 97.0 | | | | 72.5 | | | | 227.4 | |
| | | | | | | | | | | | | |
| Income from discontinued operations, net of tax | | | 1.5 | | | | 0.3 | | | | 4.5 | |
| | | | | | | | | | | | | |
| Net income | | | 98.5 | | | | 72.8 | | | | 231.9 | |
| Less net income attributable to noncontrolling interests | | | (24.0 | ) | | | (15.7 | ) | | | (31.7 | ) |
| | | | | | | | | | | | | |
| Net income attributable to Brink’s | | $ | 74.5 | | | | 57.1 | | | | 200.2 | |
| | | | | | | | | | | | | |
| Income attributable to Brink’s: | | | | | | | | | | | | |
| Continuing operations | | $ | 73.0 | | | | 56.8 | | | | 195.7 | |
| Discontinued operations | | | 1.5 | | | | 0.3 | | | | 4.5 | |
| | | | | | | | | | | | | |
| Net income attributable to Brink’s | | $ | 74.5 | | | | 57.1 | | | | 200.2 | |
| | | | | | | | | | | | | |
| Earnings per share attributable to Brink’s common shareholders: | | | | | | | | | | | | |
| Basic: | | | | | | | | | | | | |
| Continuing operations | | $ | 1.52 | | | | 1.18 | | | | 4.14 | |
| Discontinued operations | | | 0.03 | | | | 0.01 | | | | 0.10 | |
| Net income | | | 1.56 | | | | 1.18 | | | | 4.23 | |
| | | | | | | | | | | | | |
| Diluted: | | | | | | | | | | | | |
| Continuing operations | | $ | 1.52 | | | | 1.17 | | | | 4.11 | |
| Discontinued operations | | | 0.03 | | | | 0.01 | | | | 0.10 | |
| Net income | | | 1.55 | | | | 1.18 | | | | 4.21 | |
| | | | | | | | | | | | | |
| Weighted-average shares | | | | | | | | | | | | |
| Basic | | | 47.8 | | | | 48.2 | | | | 47.2 | |
| Diluted | | | 48.1 | | | | 48.4 | | | | 47.5 | |
| | | | | | | | | | | | | |
| See accompanying notes to consolidated financial statements. | | | | | |
THE BRINK’S COMPANY
and subsidiaries
Consolidated Statements of Comprehensive Income (Loss)
| | | Years Ended December 31, | |
| (In millions) | | 2010 | | | 2009 | | | 2008 | |
| | | | | | | | | | |
| Net income | | $ | 72.8 | | | | 231.9 | | | | 223.1 | |
| | | | | | | | | | | | | |
| Other comprehensive income (loss): | | | | | | | | | | | | |
Benefit plan adjustments: | | | | | | | | | | | | |
Net experience gains (losses) arising during the year | | | (67.8 | ) | | | 68.2 | | | | (501.2 | ) |
Deferred profit sharing | | | (0.4 | ) | | | - | | | | - | |
Tax benefit (provision) related to net experience gains and losses arising during the year | | | 24.1 | | | | (0.3 | ) | | | 32.7 | |
Reclassification adjustment for amortization of prior net experience loss included in net income | | | 37.8 | | | | 28.2 | | | | 11.8 | |
Tax benefit related to reclassification adjustment | | | (13.5 | ) | | | (9.5 | ) | | | (0.7 | ) |
Prior service cost (credit) from plan amendment during the year | | | (19.3 | ) | | | - | | | | 3.1 | |
Tax benefit (provision) related to prior service cost (credit) from plan amendment during the year | | | 7.1 | | | | - | | | | (0.5 | ) |
Reclassification adjustment for amortization of prior service cost (credit) included in net income | | | 2.7 | | | | 1.2 | | | | (0.3 | ) |
Tax provision (benefit) related to reclassification adjustment | | | (0.9 | ) | | | (0.1 | ) | | | 0.6 | |
Benefit plan adjustments, net of tax | | | (30.2 | ) | | | 87.7 | | | | (454.5 | ) |
| | | | | | | | | | | | | |
Foreign currency: | | | | | | | | | | | | |
Translation adjustments arising during the year | | | 4.6 | | | | (92.4 | ) | | | (47.0 | ) |
Reclassification from available-for-sale securities | | | (0.6 | ) | | | - | | | | - | |
Tax benefit (provision) related to translation adjustments | | | (0.1 | ) | | | (0.7 | ) | | | 0.8 | |
Reclassification adjustment for deconsolidation of a former subsidiary | | | (2.0 | ) | | | - | | | | - | |
Foreign currency translation adjustments, net of tax | | | 1.9 | | | | (93.1 | ) | | | (46.2 | ) |
| | | | | | | | | | | | | |
Available-for-sale securities: | | | | | | | | | | | | |
Unrealized net gains (losses) on available-for-sale securities arising during the year | | | 5.4 | | | | 2.1 | | | | (7.2 | ) |
Reclassification to foreign currency | | | 0.6 | | | | - | | | | - | |
Tax benefit (provision) related to unrealized net gains and losses on available-for-sale securities | | | (1.7 | ) | | | - | | | | 2.6 | |
Reclassification adjustment for net (gains) losses realized in net income | | | (3.8 | ) | | | - | | | | 6.2 | |
Tax provision (benefit) related to reclassification adjustment | | | 1.1 | | | | - | | | | (2.2 | ) |
Unrealized net gains (losses) on available-for-sale securities, net of tax | | | 1.6 | | | | 2.1 | | | | (0.6 | ) |
Other comprehensive income (loss) | | | (26.7 | ) | | | (3.3 | ) | | | (501.3 | ) |
| | | | | | | | | | | | | |
Comprehensive income (loss) | | $ | 46.1 | | | | 228.6 | | | | (278.2 | ) |
| | | | | | | | | | | | | |
| Amounts attributable to Brink’s: | | | | | | | | | | | | |
Net income | | $ | 57.1 | | | | 200.2 | | | | 183.3 | |
Benefit plan adjustments | | | (30.2 | ) | | | 87.7 | | | | (454.5 | ) |
Foreign currency | | | (3.3 | ) | | | (40.3 | ) | | | (43.9 | ) |
Available-for-sale securities | | | 1.2 | | | | 2.6 | | | | (0.6 | ) |
Other comprehensive income (loss) | | | (32.3 | ) | | | 50.0 | | | | (499.0 | ) |
Comprehensive income (loss) attributable to Brink’s | | | 24.8 | | | | 250.2 | | | | (315.7 | ) |
| | | | | | | | | | | | | |
| Amounts attributable to noncontrolling interests: | | | | | | | | | | | | |
Net income | | | 15.7 | | | | 31.7 | | | | 39.8 | |
Foreign currency | | | 5.2 | | | | (52.8 | ) | | | (2.3 | ) |
Available-for-sale securities | | | 0.4 | | | | (0.5 | ) | | | - | |
Other comprehensive income (loss) | | | 5.6 | | | | (53.3 | ) | | | (2.3 | ) |
Comprehensive income (loss) attributable to noncontrolling interests | | | 21.3 | | | | (21.6 | ) | | | 37.5 | |
| | | | | | | | | | | | | |
Comprehensive income (loss) | | $ | 46.1 | | | | 228.6 | | | | (278.2 | ) |
See accompanying notes to consolidated financial statements.
| | | Years Ended December 31, | |
| (In millions) | | 2011 | | | 2010 | | | 2009 | |
| | | | | | | | | | |
| Net income | | $ | 98.5 | | | | 72.8 | | | | 231.9 | |
| | | | | | | | | | | | | |
| Other comprehensive income (loss): | | | | | | | | | | | | |
| Benefit plan adjustments: | | | | | | | | | | | | |
| Net experience gains (losses) arising during the year | | | (253.6 | ) | | | (67.8 | ) | | | 68.2 | |
| Deferred profit sharing | | | 0.4 | | | | (0.4 | ) | | | - | |
| Tax benefit (provision) related to net experience gains and losses arising during the year | | | 89.4 | | | | 24.1 | | | | (0.3 | ) |
| Reclassification adjustment for amortization of prior net experience loss included in net income | | | 48.5 | | | | 37.8 | | | | 28.2 | |
| Tax benefit related to reclassification adjustment | | | (16.5 | ) | | | (13.5 | ) | | | (9.5 | ) |
| Prior service cost (credit) from plan amendment during the year | | | - | | | | (19.3 | ) | | | - | |
| Tax benefit (provision) related to prior service cost (credit) from plan amendment during the year | | | - | | | | 7.1 | | | | - | |
| Reclassification adjustment for amortization of prior service cost (credit) included in net income | | | 3.5 | | | | 2.7 | | | | 1.2 | |
| Tax provision (benefit) related to reclassification adjustment | | | (1.1 | ) | | | (0.9 | ) | | | (0.1 | ) |
| Benefit plan adjustments, net of tax | | | (129.4 | ) | | | (30.2 | ) | | | 87.7 | |
| | | | | | | | | | | | | |
| Foreign currency: | | | | | | | | | | | | |
| Translation adjustments arising during the year | | | (50.5 | ) | | | 4.6 | | | | (92.4 | ) |
| Reclassification from available-for-sale securities | | | - | | | | (0.6 | ) | | | - | |
| Tax benefit (provision) related to translation adjustments | | | 1.7 | | | | (0.1 | ) | | | (0.7 | ) |
| Reclassification adjustment for deconsolidation of a former subsidiary | | | - | | | | (2.0 | ) | | | - | |
| Foreign currency translation adjustments, net of tax | | | (48.8 | ) | | | 1.9 | | | | (93.1 | ) |
| | | | | | | | | | | | | |
| Available-for-sale securities: | | | | | | | | | | | | |
| Unrealized net gains (losses) on available-for-sale securities arising during the year | | | 2.1 | | | | 5.4 | | | | 2.1 | |
| Reclassification to foreign currency | | | - | | | | 0.6 | | | | - | |
| Tax benefit (provision) related to unrealized net gains and losses on available-for-sale securities | | | - | | | | (1.7 | ) | | | - | |
| Reclassification adjustment for net (gains) losses realized in net income | | | (4.4 | ) | | | (3.8 | ) | | | - | |
| Tax provision (benefit) related to reclassification adjustment | | | 0.9 | | | | 1.1 | | | | - | |
| Unrealized net gains (losses) on available-for-sale securities, net of tax | | | (1.4 | ) | | | 1.6 | | | | 2.1 | |
| Other comprehensive income (loss) | | | (179.6 | ) | | | (26.7 | ) | | | (3.3 | ) |
| | | | | | | | | | | | | |
Other comprehensive income (loss) | | $ | (81.1 | ) | | | 46.1 | | | | 228.6 | |
| | | | | | | | | | | | | |
| Amounts attributable to Brink’s: | | | | | | | | | | | | |
| Net income | | $ | 74.5 | | | | 57.1 | | | | 200.2 | |
| Benefit plan adjustments | | | (129.4 | ) | | | (30.2 | ) | | | 87.7 | |
| Foreign currency | | | (46.7 | ) | | | (3.3 | ) | | | (40.3 | ) |
| Available-for-sale securities | | | (1.5 | ) | | | 1.2 | | | | 2.6 | |
| Other comprehensive income (loss) | | | (177.6 | ) | | | (32.3 | ) | | | 50.0 | |
Comprehensive income (loss) attributable to Brink’s | | | (103.1 | ) | | | 24.8 | | | | 250.2 | |
| | | | | | | | | | | | | |
| Amounts attributable to noncontrolling interests: | | | | | | | | | | | | |
| Net income | | | 24.0 | | | | 15.7 | | | | 31.7 | |
| Foreign currency | | | (2.1 | ) | | | 5.2 | | | | (52.8 | ) |
| Available-for-sale securities | | | 0.1 | | | | 0.4 | | | | (0.5 | ) |
| Other comprehensive income (loss) | | | (2.0 | ) | | | 5.6 | | | | (53.3 | ) |
Comprehensive income (loss) attributable to noncontrolling interests | | | 22.0 | | | | 21.3 | | | | (21.6 | ) |
| | | | | | | | | | | | | |
Comprehensive income (loss) | | $ | (81.1 | ) | | | 46.1 | | | | 228.6 | |
| | | | | | | | | | | | | |
| See accompanying notes to consolidated financial statements. | |
THE BRINK’S COMPANY
and subsidiaries
Consolidated Statements of Shareholders’ Equity
Years Ended December 31, 2011, 2010 2009 and 2008
| | | | | Capital in Excess | | Accumulated Other | | |
| | | | | | |
| | Shares | | Common | of Par | Retained | Comprehensive | Noncontrolling | |
| (In millions) | (a) | | Stock | Value | Earnings | Loss | Interests | Total |
| Balance as of December 31, 2007 | 48.4 | $ | 48.4 | 452.6 | 675.8 | (130.5) | 68.2 | 1,114.5 |
| Net income | - | | - | - | 183.3 | - | 39.8 | 223.1 |
| Other comprehensive loss | - | | - | - | - | (499.0) | (2.3) | (501.3) |
| Shares repurchased (see note 16) | (1.0) | | (1.0) | (9.8) | (45.7) | - | - | (56.5) |
| Termination of Employee Benefits Trust | (1.7) | | (1.7) | 1.7 | - | - | - | - |
| Dividends to: | | | | | | | | |
Brink’s common shareholders ($0.40 per share) | - | | - | - | (18.2) | - | - | (18.2) |
Noncontrolling interests | - | | - | - | - | - | (12.4) | (12.4) |
| Share-based compensation: | | | | | | | | |
Stock options and awards: | | | | | | | | |
Compensation expense | - | | - | 9.5 | - | - | - | 9.5 |
Consideration from exercise of stock options | 0.1 | | 0.1 | 18.5 | - | - | - | 18.6 |
| Excess tax benefit of stock compensation | - | | - | 13.3 | - | - | - | 13.3 |
Other share-based benefit programs | 0.1 | | 0.1 | 4.3 | (0.3) | - | - | 4.1 |
| Retire shares of common stock | (0.2) | | (0.2) | (3.8) | (16.0) | - | - | (20.0) |
| Spin-off of Brink’s Home Security Holdings, Inc | | | | | | | | |
(“BHS”) (see note 17) | - | | - | - | (468.9) | 1.5 | - | (467.4) |
| Purchases of subsidiary shares from | | | | | | | | |
noncontrolling interests | - | | - | - | - | - | (2.0) | (2.0) |
| Balance as of December 31, 2008 | 45.7 | | 45.7 | 486.3 | 310.0 | (628.0) | 91.3 | 305.3 |
| Net income | - | | - | - | 200.2 | - | 31.7 | 231.9 |
| Other comprehensive income (loss) | - | | - | - | - | 50.0 | (53.3) | (3.3) |
| Shares repurchased (see note 16) | (0.2) | | (0.2) | (2.5) | (3.4) | - | - | (6.1) |
| Shares contributed to pension plan (see note 16) | 2.3 | | 2.3 | 55.3 | - | - | - | 57.6 |
| Dividends to: | | | | | | | | |
Brink’s common shareholders ($0.40 per share) | - | | - | - | (18.4) | - | - | (18.4) |
Noncontrolling interests | - | | - | - | - | - | (13.7) | (13.7) |
| Share-based compensation: | | | | | | | | |
Stock options and awards: | | | | | | | | |
Compensation expense | - | | - | 6.6 | - | - | - | 6.6 |
Consideration from exercise of stock options | 0.1 | | 0.1 | 1.2 | - | - | - | 1.3 |
| Excess tax benefit of stock compensation | - | | - | 0.1 | - | - | - | 0.1 |
Other share-based benefit programs | - | | - | 3.2 | (0.4) | - | - | 2.8 |
| Adjustment to spin-off of BHS (see note 17) | - | | - | - | 26.8 | - | - | 26.8 |
| Acquisitions of new subsidiaries (see note 6) | - | | - | - | - | - | 4.9 | 4.9 |
| Balance as of December 31, 2009 | 47.9 | | 47.9 | 550.2 | 514.8 | (578.0) | 60.9 | 595.8 |
| Net income | - | | - | - | 57.1 | - | 15.7 | 72.8 |
| Other comprehensive income (loss) | - | | - | - | - | (32.3) | 5.6 | (26.7) |
| Shares repurchased (see note 16) | (1.7) | | (1.7) | (19.5) | (12.5) | - | - | (33.7) |
| Dividends to: | | | | | | | | |
Brink’s common shareholders ($0.40 per share) | - | | - | - | (18.9) | - | - | (18.9) |
Noncontrolling interests | - | | - | - | - | - | (18.4) | (18.4) |
| Share-based compensation: | | | | | | | | |
Stock options and awards: | | | | | | | | |
Compensation expense | - | | - | 6.2 | - | - | - | 6.2 |
Consideration from exercise of stock options | 0.4 | | 0.4 | 6.1 | - | - | - | 6.5 |
| Excess tax benefit of stock compensation | - | | - | 0.7 | - | - | - | 0.7 |
Other share-based benefit programs | (0.2) | | (0.2) | (1.1) | (3.0) | - | - | (4.3) |
| Acquisitions of new subsidiaries (see note 6) | - | | - | - | - | - | 3.1 | 3.1 |
| Balance as of December 31, 2010 | 46.4 | $ | 46.4 | 542.6 | 537.5 | (610.3) | 66.9 | 583.1 |
(a) | Includes 1.7 million shares at December 31, 2007, held by The Brink’s Company Employee Benefits Trust that were not allocated to participants. The trust was terminated in 2008 (see note 16). |
2009
See accompanying notes to consolidated financial statements.| | | | | | | | | | Capital | | | | Accumulated | | Attributable | | | |
| | | | | | | | | | in Excess | | | | Other | | to | | | |
| | | | | | | | Common | | of Par | | Retained | | Comprehensive | | Noncontrolling | | | |
| | (In millions) | Shares | | Stock | | Value | | Earnings | | Loss | | Interests | | Total | |
| | Balance as of December 31, 2008 | 45.7 | $ | 45.7 | | 486.3 | | 310.0 | | (628.0) | | 91.3 | | 305.3 | |
| | Net income | - | | - | | - | | 200.2 | | - | | 31.7 | | 231.9 | |
| | Other comprehensive income (loss) | - | | - | | - | | - | | 50.0 | | (53.3) | | (3.3) | |
| | Shares repurchased (see note 16) | (0.2) | | (0.2) | | (2.5) | | (3.4) | | - | | - | | (6.1) | |
| | Shares contributed to pension plan (see note 16) | 2.3 | | 2.3 | | 55.3 | | - | | - | | - | | 57.6 | |
| | Dividends to: | | | | | | | | | | | | | | |
| | | Brink’s common shareholders ($0.40 per share) | - | | - | | - | | (18.4) | | - | | - | | (18.4) | |
| | | Noncontrolling interests | - | | - | | - | | - | | - | | (13.7) | | (13.7) | |
| | Share-based compensation | | | | | | | | | | | | | | |
| | | Stock options and awards: | | | | | | | | | | | | | | |
| | | | Compensation expense | - | | - | | 6.6 | | - | | - | | - | | 6.6 | |
| | | | Consideration from exercise of stock options | 0.1 | | 0.1 | | 1.2 | | - | | - | | - | | 1.3 | |
| | | | Excess tax benefit of stock compensation | - | | - | | 0.1 | | - | | - | | - | | 0.1 | |
| | | Other share-based benefit programs | - | | - | | 3.2 | | (0.4) | | - | | - | | 2.8 | |
| | Adjustment to spin-off of BHS | - | | - | | - | | 26.8 | | - | | - | | 26.8 | |
| | Business acquisitions | - | | - | | - | | - | | - | | 4.9 | | 4.9 | |
| | Balance as of December 31, 2009 | 47.9 | | 47.9 | | 550.2 | | 514.8 | | (578.0) | | 60.9 | | 595.8 | |
| | Net income | - | | - | | - | | 57.1 | | - | | 15.7 | | 72.8 | |
| | Other comprehensive income (loss) | - | | - | | - | | - | | (32.3) | | 5.6 | | (26.7) | |
| | Shares repurchased (see note 16) | (1.7) | | (1.7) | | (19.5) | | (12.5) | | - | | - | | (33.7) | |
| | Dividends to: | | | | | | | | | | | | | | |
| | | Brink’s common shareholders ($0.40 per share) | - | | - | | - | | (18.9) | | - | | - | | (18.9) | |
| | | Noncontrolling interests | - | | - | | - | | - | | - | | (18.4) | | (18.4) | |
| | Share-based compensation | | | | | | | | | | | | | | |
| | | Stock options and awards: | | | | | | | | | | | | | | |
| | | | Compensation expense | - | | - | | 6.2 | | - | | - | | - | | 6.2 | |
| | | | Consideration from exercise of stock options | 0.4 | | 0.4 | | 6.1 | | - | | - | | - | | 6.5 | |
| | | | Excess tax benefit of stock compensation | - | | - | | 0.7 | | - | | - | | - | | 0.7 | |
| | | Other share-based benefit programs | (0.2) | | (0.2) | | (1.1) | | (3.0) | | - | | - | | (4.3) | |
| | Business acquisitions | - | | - | | - | | - | | - | | 3.1 | | 3.1 | |
| | Balance as of December 31, 2010 | 46.4 | | 46.4 | | 542.6 | | 537.5 | | (610.3) | | 66.9 | | 583.1 | |
| | Net income | - | | - | | - | | 74.5 | | - | | 24.0 | | 98.5 | |
| | Other comprehensive loss | - | | - | | - | | - | | (177.6) | | (2.0) | | (179.6) | |
| | Dividends to: | | | | | | | | | | | | | | |
| | | Brink’s common shareholders ($0.40 per share) | - | | - | | - | | (18.7) | | - | | - | | (18.7) | |
| | | Noncontrolling interests | - | | - | | - | | - | | - | | (16.1) | | (16.1) | |
| | Share-based compensation | | | | | | | | | | | | | | |
| | | Stock options and awards: | | | | | | | | | | | | | | |
| | | | Compensation expense | - | | - | | 6.2 | | - | | - | | - | | 6.2 | |
| | | | Consideration from exercise of stock options | 0.6 | | 0.6 | | 11.1 | | - | | - | | - | | 11.7 | |
| | | | Excess tax benefit of stock compensation | - | | - | | 1.1 | | - | | - | | - | | 1.1 | |
| | | Other share-based benefit programs | (0.1) | | (0.1) | | (1.5) | | (3.8) | | - | | - | | (5.4) | |
| | Business acquisitions | - | | - | | - | | - | | - | | 0.8 | | 0.8 | |
| | Capital contributions from noncontrolling interest | - | | - | | - | | - | | - | | 0.8 | | 0.8 | |
| | Balance as of December 31, 2011 | 46.9 | $ | 46.9 | | 559.5 | | 589.5 | | (787.9) | | 74.4 | | 482.4 | |
| | | | | | | | | | | | | | | | | | | |
| | See accompanying notes to consolidated financial statements. |
THE BRINK’S COMPANY
and subsidiaries
Consolidated Statements of Cash Flows
| | | Years Ended December 31, | |
| (In millions) | | 2010 | | | 2009 | | | 2008 | |
| | | | | | | | | | |
| Cash flows from operating activities: | | | | | | | | | |
| Net income | | $ | 72.8 | | | | 231.9 | | | | 223.1 | |
| Adjustments to reconcile net income to net cash provided by operating activities: | | | | | | | | | | | | |
Income from discontinued operations, net of tax | | | (0.3 | ) | | | (4.5 | ) | | | (51.5 | ) |
Depreciation and amortization | | | 136.6 | | | | 135.1 | | | | 122.3 | |
Stock compensation expense | | | 6.2 | | | | 6.6 | | | | 7.8 | |
Deferred income taxes | | | (2.3 | ) | | | (91.0 | ) | | | (20.0 | ) |
| Deconsolidation of Brink’s Belgium and write-down to fair value | | | 13.4 | | | | - | | | | - | |
| Gains and losses: | | | | | | | | | | | | |
| Sales of property and other assets | | | (1.2 | ) | | | (9.4 | ) | | | (13.1 | ) |
| Acquisitions of controlling interest of equity-method or cost-method investments | | | 13.7 | | | | (14.9 | ) | | | - | |
| Bargain purchase gain | | | (5.1 | ) | | | - | | | | - | |
Impairment charges: | | | | | | | | | | | | |
Available-for-sale securities | | | - | | | | - | | | | 7.1 | |
Long-lived assets | | | 0.7 | | | | 2.7 | | | | 1.9 | |
| Retirement benefit funding (more) less than expense: | | | | | | | | | | | | |
Pension | | | (4.2 | ) | | | (102.7 | ) | | | (12.2 | ) |
Other than pension | | | 16.6 | | | | 15.3 | | | | (5.1 | ) |
Other operating | | | 3.8 | | | | 4.3 | | | | 5.0 | |
Change in operating assets and liabilities, net of effects of acquisitions: | | | | | | | | | | | | |
Accounts receivable | | | (37.7 | ) | | | 8.9 | | | | (24.1 | ) |
Accounts payable, income taxes payable and accrued liabilities | | | 38.9 | | | | (16.4 | ) | | | 40.8 | |
Prepaid and other current assets | | | (14.4 | ) | | | 3.5 | | | | (21.8 | ) |
Other | | | 7.7 | | | | 2.3 | | | | (5.8 | ) |
Discontinued operations | | | (9.9 | ) | | | 23.5 | | | | 172.7 | |
Net cash provided by operating activities | | | 235.3 | | | | 195.2 | | | | 427.1 | |
| | | | | | | | | | | | | |
| Cash flows from investing activities: | | | | | | | | | | | | |
| Capital expenditures | | | (148.8 | ) | | | (170.6 | ) | | | (165.3 | ) |
| Acquisitions | | | (100.7 | ) | | | (74.6 | ) | | | (11.7 | ) |
| Available-for-sale securities: | | | | | | | | | | | | |
Purchases | | | (3.0 | ) | | | (11.1 | ) | | | (3.5 | ) |
Sales | | | 1.3 | | | | 4.7 | | | | 2.5 | |
| Cash proceeds from sale of property, equipment and investments | | | 4.9 | | | | 10.5 | | | | 16.9 | |
| Cash held by home security business at spin-off | | | - | | | | - | | | | (50.0 | ) |
| Other | | | (9.1 | ) | | | - | | | | 2.0 | |
| Discontinued operations | | | - | | | | - | | | | (150.8 | ) |
Net cash used by investing activities | | | (255.4 | ) | | | (241.1 | ) | | | (359.9 | ) |
| | | | | | | | | | | | | |
| Cash flows from financing activities: | | | | | | | | | | | | |
| Borrowings (repayments) of debt: | | | | | | | | | | | | |
| Short-term debt | | | 27.1 | | | | (0.9 | ) | | | (4.4 | ) |
| Long-term revolving credit facilities | | | 121.2 | | | | (10.1 | ) | | | 93.5 | |
| Other long-term debt: | | | | | | | | | | | | |
| Borrowings | | | 3.6 | | | | 0.6 | | | | - | |
| Repayments | | | (19.5 | ) | | | (11.9 | ) | | | (12.6 | ) |
| Cash proceeds from sale-leaseback transactions | | | 1.2 | | | | 13.6 | | | | - | |
| Debt financing costs | | | (2.5 | ) | | | - | | | | - | |
| Repurchase shares of common stock of Brink’s | | | (33.7 | ) | | | (6.9 | ) | | | (56.6 | ) |
| Dividends to: | | | | | | | | | | | | |
Shareholders of Brink’s | | | (18.9 | ) | | | (18.4 | ) | | | (18.2 | ) |
Noncontrolling interests in subsidiaries | | | (18.4 | ) | | | (13.7 | ) | | | (12.4 | ) |
| Proceeds from exercise of stock options | | | 1.3 | | | | 1.3 | | | | 16.2 | |
| Excess tax benefits associated with stock compensation | | | 0.6 | | | | 0.3 | | | | 12.5 | |
| Minimum tax withholdings associated with stock compensation | | | (1.8 | ) | | | (0.4 | ) | | | (17.6 | ) |
| Other | | | (0.2 | ) | | | (0.1 | ) | | | - | |
Net cash provided (used) by financing activities | | | 60.0 | | | | (46.6 | ) | | | 0.4 | |
| Effect of exchange rate changes on cash | | | 0.1 | | | | (15.4 | ) | | | (13.1 | ) |
| Cash and cash equivalents: | | | | | | | | | | | | |
Increase (decrease) | | | 40.0 | | | | (107.9 | ) | | | 54.5 | |
Balance at beginning of year | | | 143.0 | | | | 250.9 | | | | 196.4 | |
Balance at end of year | | $ | 183.0 | | | | 143.0 | | | | 250.9 | |
See accompanying notes to consolidated financial statements.| | | | | | | Years Ended December 31, |
| | (In millions) | | 2011 | | 2010 | | 2009 | |
| | | | | | | | | | | | | | | |
| | Cash flows from operating activities: | | | | | | | | | | |
| | Net income | $ | 98.5 | | | 72.8 | | | 231.9 | | |
| | Adjustments to reconcile net income to net cash provided by operating activities: | | | | | | | | | | |
| | | (Income) loss from discontinued operations, net of tax | | (1.5) | | | (0.3) | | | (4.5) | | |
| | | Depreciation and amortization | | 162.4 | | | 136.6 | | | 135.1 | | |
| | | Stock compensation expense | | 6.2 | | | 6.2 | | | 6.6 | | |
| | | Deferred income taxes | | (31.4) | | | (2.3) | | | (91.0) | | |
| | | Deconsolidation of Brink’s Belgium and write-down to fair value | | - | | | 13.4 | | | - | | |
| | | Gains and losses: | | | | | | | | | | |
| | | | Sales of available-for-sale securities | | (4.4) | | | (3.8) | | | - | | |
| | | | Sales of property and other assets | | (7.9) | | | (1.2) | | | (9.4) | | |
| | | | Acquisitions of controlling interests | | (0.4) | | | 13.7 | | | (14.9) | | |
| | | | Bargain purchase gain | | (2.1) | | | (5.1) | | | - | | |
| | | Impairment losses | | 4.7 | | | 0.7 | | | 2.7 | | |
| | | Retirement benefit funding (more) less than expense: | | | | | | | | | | |
| | | | Pension | | 4.6 | | | (4.2) | | | (102.7) | | |
| | | | Other than pension | | 11.6 | | | 16.6 | | | 15.3 | | |
| | | Other operating | | 10.8 | | | 7.6 | | | 4.3 | | |
| | | Changes in operating assets and liabilities, net of effects of acquisitions: | | | | | | | | | | |
| | | | Accounts receivable | | (50.9) | | | (37.7) | | | 8.9 | | |
| | | | Accounts payable, income taxes payable and accrued liabilities | | 49.4 | | | 38.9 | | | (16.4) | | |
| | | | Prepaid and other current assets | | (14.4) | | | (14.4) | | | 3.5 | | |
| | | | Other | | 10.4 | | | 7.7 | | | 2.3 | | |
| | | Discontinued operations | | 1.4 | | | (9.9) | | | 23.5 | | |
| | | | Net cash provided by operating activities | | 247.0 | | | 235.3 | | | 195.2 | | |
| | | | | | | | | | | | | | | |
| | Cash flows from investing activities: | | | | | | | | | | |
| | Capital expenditures | | (196.2) | | | (148.8) | | | (170.6) | | |
| | Acquisitions | | (3.0) | | | (100.7) | | | (74.6) | | |
| | Available-for-sale securities: | | | | | | | | | | |
| | | Purchases | | (0.5) | | | (3.0) | | | (11.1) | | |
| | | Sales | | 12.9 | | | 1.3 | | | 4.7 | | |
| | Cash proceeds from sale of property, equipment and investments | | 14.4 | | | 4.9 | | | 10.5 | | |
| | Other | | 0.6 | | | (9.1) | | | - | | |
| | | | Net cash used by investing activities | | (171.8) | | | (255.4) | | | (241.1) | | |
| | | | | | | | | | | | | | | |
| | Cash flows from financing activities: | | | | | | | | | | |
| | Borrowings (repayments) of debt: | | | | | | | | | | |
| | | Short-term debt | | (7.6) | | | 27.1 | | | (0.9) | | |
| | | Long-term revolving credit facilities | | (113.9) | | | 121.2 | | | (10.1) | | |
| | | Issuance of private placement notes | | 100.0 | | | - | | | - | | |
| | | Other long-term debt: | | | | | | | | | | |
| | | | Borrowings | | - | | | 3.6 | | | 0.6 | | |
| | | | Repayments | | (32.2) | | | (19.5) | | | (11.9) | | |
| | Cash proceeds from sale-leaseback transactions | | 17.6 | | | 1.2 | | | 13.6 | | |
| | Debt financing costs | | (0.6) | | | (2.5) | | | - | | |
| | Repurchase shares of common stock of Brink’s | | - | | | (33.7) | | | (6.9) | | |
| | Dividends to: | | | | | | | | | | |
| | | Shareholders of Brink’s | | (18.7) | | | (18.9) | | | (18.4) | | |
| | | Noncontrolling interests in subsidiaries | (16.1) | | | (18.4) | | | (13.7) | | |
| | Proceeds from exercise of stock options | | 5.9 | | | 1.3 | | | 1.3 | | |
| | Excess tax benefits associated with stock compensation | | 1.1 | | | 0.6 | | | 0.3 | | |
| | Minimum tax withholdings associated with stock compensation | | (2.7) | | | (1.8) | | | (0.4) | | |
| | Other | | - | | | (0.2) | | | (0.1) | | |
| | | | Net cash provided (used) by financing activities | | (67.2) | | | 60.0 | | | (46.6) | | |
| | Effect of exchange rate changes on cash | | (8.1) | | | 0.1 | | | (15.4) | | |
| | Cash and cash equivalents: | | | | | | | | | | |
| | | Increase (decrease) | | (0.1) | | | 40.0 | | | (107.9) | | |
| | | Balance at beginning of period | | 183.0 | | | 143.0 | | | 250.9 | | |
| | | | Balance at end of period | $ | 182.9 | | | 183.0 | | | 143.0 | | |
| | | | | | | | | | | | | | | |
| | See accompanying notes to consolidated financial statements |
THE BRINK’S COMPANY
and subsidiaries
NOTES TO CONSOLIDATED FINANCIAL STATEMENTS
Note 1 – Summary of Significant Accounting Policies
The Brink’s Company (along with its subsidiaries, “we,” “our,” “Brink’s” or the “Company”), based in Richmond, Virginia, is a leading provider of secure transportation, cash logistics and other security-related services to banks and financial institutions, retailers, government agencies, mints, jewelers and other commercial operations around the world. Brink’s is the oldest and largest secure transportation and cash logistics company in the U.S., and a market leader in many other countries.
Principles of Consolidation
The consolidated financial statements include the accounts of Brink’s and the subsidiaries it controls. Control is determined based on ownership rights or, when applicable, based on whether we are considered to be the primary beneficiary of a variable interest entity. Our interest in 20%- to 50%-owned companies that are not controlled are accounted for using the equity method (“equity affiliates”), unless we do not sufficiently influence the management of the investee. Other investments are accounted for as cost-method investments or as available-for-sale. All significant intercompany accounts and transactions have been eliminated in consolidation.
Accounting Adjustments
Accounting adjustments that correct earnings reported for previous years have been included in our 2011 earnings. The adjustments decreased income from continuing operations in 2011 by $7.8 million, after tax. Prior years’ financial results have not been restated because the amounts are not material. The adjustments did not affect earnings trends for the consolidated financial statements including our operating segments. Cash flows were not affected by these accounting corrections.
Revenue Recognition
Brink’s. Revenue is recognized when services related to armored car transportation, ATM servicing, cash logistics, coin sorting and wrapping and the secure transportation of valuables are performed. Customer contracts have prices that are fixed and determinable and we assess the customer’s ability to meet the contractual terms, including payment terms, before entering into contracts. Customer contracts generally are automatically extended after the initial contract period until either party terminates the agreement.
BHS (discontinued operation). Monitoring revenues were recognized monthly as services were provided pursuant to the terms of subscriber contracts, which had contract prices that were fixed and determinable. BHS assessed the subscriber’s ability to meet the contract terms, including payment terms, before entering into the contract. Generally, nonrefundable installation revenues and a portion of the related direct costs of acquiring new subscribers (primarily sales commissions) were deferred and recognized over an estimated 15 year subscriber relationship period. When an installation was identified for disconnection, any unamortized deferred revenues and deferred costs related to that installation were recognized at that time.
Taxes collected from customers. Taxes collected from customers and remitted to governmental authorities are not included in revenues in the consolidated statements of income.
Cash and Cash Equivalents Cash and cash equivalents include cash on hand, demand deposits and investments with original maturities of three months or less. As of December 31, 2010, cashCash and cash equivalents includes $38.5 related to cashamounts held by certain of our cash processing businesses. Customers’ cash that is processed in these secure cash logistics operationsbusinesses for customers which, under local regulations, the title transfers title to us for a short period of time. We record the customers’ cash as part of our cash and cash equivalents with a corresponding liability of the same amount. The cash is generally credited to customers’ accounts the following day and we do not consider it as available for general corporate purposes in the management of our liquidity and capital resources. We record a liability for the amounts owed to customers (see note 10).
Available-for-sale Securities
We have securities held as of December 31, 20102011 and 20092010 designated as available-for-sale securities for purposes of FASB ASC Topic 320, Investments – Debt and Equity SecuritiesSecurities. andThe securities are recorded in other noncurrentclassified as current assets in the consolidated balance sheets.if expected to be sold within a year. Unrealized gains and losses on available-for-sale securities are generally reported in accumulated other comprehensive income (loss) until realized. Realized gains and losses as well as declines in value judged to be other-than-temporary are reported in interest and other income.
Trade Accounts Receivable Trade accounts receivable are recorded at the invoiced amount and do not bear interest. The allowance for doubtful accounts is our best estimate of the amount of probable credit losses on our existing accounts receivable. We determine the allowance based on historical write-off experience. We review our allowance for doubtful accounts quarterly. Account balances are charged off against the allowance after all means of collection have been exhausted and the potential for recovery is considered remote.
Property and Equipment
Property and equipment are recorded at cost. Depreciation is calculated principally on the straight-line method based on the estimated useful lives of individual assets or classes of assets.
Leased property and equipment meeting capital lease criteria are capitalized at the lower of the present value of the related lease payments or the fair value of the leased asset at the inception of the lease. Amortization is calculated on the straight-line method based on the lease term.
Leasehold improvements are recorded at cost. Amortization is calculated principally on the straight-line method over the lesser of the estimated useful life of the leasehold improvement or lease term. Renewal periods are included in the lease term when the renewal is determined to be reasonably assured.
Part of the costs related to the development or purchase of internal-use software is capitalized and amortized over the estimated useful life of the software. Costs that are capitalized include external direct costs of materials and services to develop or obtain the software, and internal costs, including compensation and employee benefits for employees directly associated with a software development project.
| Estimated Useful Lives | Years | |
| Buildings | 16 to 25 | |
| Building leasehold improvements | 3 to 10 | |
| Vehicles | 3 to 10 | |
| Capitalized software | 3 to 5 | |
| Other machinery and equipment | 3 to 10 | |
Machinery and equipment leasehold improvements | 3 to 10 | |
Expenditures for routine maintenance and repairs on property and equipment are charged to expense. Major renewals, betterments and modifications are capitalized and amortizeddepreciated over the lesser of the remaining life of the asset or, if applicable, the lease term.
BHS (discontinued operation) retained ownership of most security systems installed at subscriber locations. Costs for those systems were capitalized and depreciated over the estimated lives of the assets. Costs capitalized as part of security systems included equipment and materials used in the installation process, direct labor required to install the equipment at subscriber sites, and other costs associated with the installation process. These other costs included the cost of vehicles used for installation purposes and the portion of telecommunication, facilities and administrative costs incurred primarily at BHS’ branches that were associated with the installation process. Direct labor and other costs represented approximately 70% of the amounts capitalized, while equipment and materials represented approxi mately 30% of amounts capitalized. In addition to regular straight-line depreciation expense each period, BHS charged to expense the carrying value of security systems estimated to be permanently disconnected based on each period’s actual disconnects and historical reconnection experience.
Goodwill and Other Intangible Assets Goodwill is recognized for the excess of the purchase price over the fair value of tangible and identifiable intangible net assets of businesses acquired. Intangible assets arising from business acquisitions include customer lists, customer relationships, covenants not to compete, trademarks and other identifiable intangibles. Intangible assets that are subject to amortization have, atAt December 31, 2010,2011, finite-lived intangible assets have remaining useful lives ranging from 1 to 15 years and are amortized based on the pattern in which the economic benefits are used or on a straight-line basis.
Impairment of Long-Lived Assets
Goodwill is not amortized but is tested at least annually for impairment at the reporting unit level, which is at the operating segment level or one level below an operating segment. Goodwill is assigned to one or more reporting units at the date of acquisition. Our reporting units are EMEA; Latin America; EMEA; Asia Pacific and North America. The goodwill impairment test is performed at October 1 of each year,year. We perform a qualitative assessment in order to determine whether it is more likely than not that the fair value of each reporting unit is less than its carrying amount. If we determine that it is more likely than not that the fair value of a reporting unit is less than its carrying value, we perform a two-step test.test for that reporting unit. The first step identifies whether there is potential impairment by comparing the fair value of a reporting unit to the carrying amount, including goodwill. If the fair value of a reporting unit is less than its carrying amount, the second step of the impairment test is required to measure the amount of any impairment loss. Indefinite-lived intangibles are also tested for impairment at least annually by c omparingcomparing the carrying value of indefinite-lived intangible asset to their estimated fair values. We base our estimates of fair value on projected future cash flows.
We completed goodwill impairment tests during each of the last three years with no impairment charges required. No impairment test was performed during the year forWe have had no significant impairments of indefinite-lived intangibles acquired in the fourth quarter as no indicators of impairment existed in the short time from acquisition date to year end.last three years.
Long-lived assets other than goodwill and other indefinite livedindefinite-lived intangibles are reviewed for impairment when events or changes in circumstances indicate the carrying value of an asset may not be recoverable.
For long-lived assets other than goodwill that are to be held and used in operations, an impairment is indicated when the estimated total undiscounted cash flow associated with the asset or group of assets is less than carrying value. If impairment exists, an adjustment is made to write the asset down to its fair value, and a loss is recorded as the difference between the carrying value and fair value.
We account for retirement benefit obligations under FASB ASC Topic 715, Compensation – Retirement Benefits. We derive the discount rates used to measure the present value of our benefit obligations using the cash flow matching method. Under this method, we compare the plan’s projected payment obligations by year with the corresponding yields on the Mercer Yield Curve. Each year’s projected cash flows are then discounted back to theira present value at the measurement date and an overall discount rate is determined. The overall discount rate is then rounded to the nearest tenth of a percentage point. We use a similar approach to select the discount rates for major non-U.S. plans. For other non-U.S. plans, discoun tdiscount rates are developed based on a bond index within the country of domicile.
We select the expected long-term rate of return assumption for our U.S. pension plan and retiree medical plans using advice from an investment advisor and an actuary. The selected rate considers plan asset allocation targets, expected overall investment manager performance and long-term historical average compounded rates of return.
Benefit plan experience gains and losses are recognized in other comprehensive income (loss). Accumulated net benefit plan experience gains and losses that exceed 10% of the greater of a plan’s benefit obligation or plan assets at the beginning of the year are amortized into earnings from other comprehensive income (loss) on a straight-line basis. The amortization period for pension plans is the average remaining
service period of employees expected to receive benefits under the plans. The amortization period for other retirement plans is primarily the average remaining life expectancy of inactive participants.
Income Taxes
Deferred tax assets and liabilities are recorded to recognize the expected future tax benefits or costs of events that have been, or will be, reported in different years for financial statement purposes than tax purposes. Deferred tax assets and liabilities are determined based on the difference between the financial statement and tax bases of assets and liabilities using enacted tax rates in effect for the year in which these items are expected to reverse. Management periodically reviews recordedWe recognize tax benefits related to uncertain tax positions if we believe it is more likely than not the benefit will be realized. We review our deferred tax assets to determine if it is more-likely-than-not that they will be realized. If management determineswe determine it is not more-likely-than-not that a deferred tax asset will be realized, an offsettingwe record a valuation allowance is recorded, reducing comprehensive income (loss) andto reverse the deferredpreviously recognized tax asset in that peri od.benefit.
Foreign Currency Translation Our consolidated financial statements are reported in U.S. dollars. Our foreign subsidiaries maintain their records primarily in the currency of the country in which they operate.
Our accounting policy for foreignThe method of translating local currency translation is different dependingfinancial information into U.S. dollars depends on whether the economy in which our foreign subsidiary operates has been designated as highly inflationary or not. Economies with a three-year cumulative inflation rate of more than 100% are considered as highly inflationary.
Assets and liabilities of foreign subsidiaries in non-highly inflationary economies are translated into U.S. dollars using rates of exchange at the balance sheet date. Translation adjustments are recorded in other comprehensive income (loss). Revenues and expenses are translated at rates of exchange in effect during the year. Transaction gains and losses are recorded in net income.
Foreign subsidiaries that operate in highly inflationary countries must use the reporting currency (the U.S. dollar)dollar as thetheir functional currency. Local-currency monetary assets and liabilities are remeasured into U.S. dollars using rates of exchange as of each balance sheet date, with remeasurement adjustments and other transaction gains and losses recognized in earnings. Non-monetary assets and liabilities do not fluctuate with changes in local currency exchange rates to the dollar.
Venezuela
Our Venezuelan operations accounted for $186$269 million or 6%7% of total Brink’s revenues in 2010.2011. Our operating margins in Venezuela have varied depending on the mix of business during any year and have been up to three times our overall international segment operating margin rate.
In December 2009, we repatriated dividends generated by our Venezuelan operations that had been unpaid over the last several years using the legal parallel market exchange rate. We decided to repatriate our dividends using the parallel rate due to significant delays in receiving the needed government approval to repatriate dividends at the official rate. We began translating our financial statements for our Venezuelan operations using the parallel rate, effective December 21, 2009, the date of our decision, since we expected to pay future dividends using the parallel rate. This is consistent with the guidance issued by the International Practices Task Force of the Center for Audit Quality (the “IPTF”) and U.S. GAAP. This guidance provides that, in the absence of unusual circumstances, the rate used for dividend remittances should be used to translate foreign financial statements.
In 2009, we recognized foreign currency translation losses because we changed to the parallel rate for purposes of translating our Venezuelan financial position. We recognized foreign currency translation losses in other comprehensive income (loss) in 2009 of
| · | $85 million attributable to Brink’s |
| · | $54 million attributable to noncontrolling interests, and |
The economy in Venezuela has had significant inflation in the last several years. In determining whether Venezuela is a highly inflationary economy, we previously used the consumer price index ("CPI") which is based on the inflation rates for the metropolitan area of Caracas, Venezuela. Beginning January 1, 2008, a national consumer price index ("NCPI") was developed for the entire country of Venezuela. However, because inflation data was not available to compute a cumulative three-year inflation rate for Venezuela using only NCPI, we used a blended NCPI and CPI rate to determine whether the three-year cumulative inflation rate had exceeded 100% at December 31, 2009.
At December 31, 2009, the blended three-year cumulative inflation rate was approximately 100.5%. As a result, beginning January 1, 2010, we designated Venezuela’s economy as highly inflationary for accounting purposes, and we consolidated our Venezuelan results using our accounting policy for subsidiaries operating in highly inflationary economies. We remeasured bolivar fuerte-denominated net monetary assets at each balance sheet date using the parallel rate until June 9, 2010, when the Venezuelan government replaced the parallel rate with a new exchange process that requires each transaction be approved by the government’s central bank (the “SITME” rate). On a daily basis, the
central bank publishes ranges of prices at which it may approve transactions to purchase dollar-denominated bonds, resulting in an exchange rate range of 4.3 to 5.3 bolivar fuertes to the U.S. dollar. To date, approved transactions have been at the upper end of the range. To the extent we need to obtain U.S. dollars, we currently expect our U.S. dollar-denominated transactions to be settled at a rate of 5.3 bolivar fuertes to the U.S. dollar. We have used this rate to remeasure our bolivar fuerte-denominated monetary assets and liabilities into U.S. dollars at December 31, 2010,2011, resulting in bolivar fuerte-denominated net monetary assets at December 31, 2010,2011, of $31.0$56.7 million. We recognized a $3.2 million netdid not recognize any remeasurement lossgains or losses as the SITME rate did not change in 2010.2011.
Under the new law,SITME process, approved transactions may not exceed $350,000 per legal entity per month. Despite the new law, weWe believe that we will be able to continue to obtain sufficient U.S. dollars to purchase imported supplies and fixed assets to operate our business in Venezuela. We believe the new law will limit the repatriation of cash invested in Venezuela forwill be limited in the foreseeable future. We have also been successful at converting bolivar fuertes to U.S. dollars through other legal channels, at a rate not as favorable as the SITME rate.
At December 31, 2010,2011, our Venezuelan subsidiaries held $3.3$1.3 million of cash and short-term investments denominated in U.S. dollars and $18.2$8.9 million of cash denominated in bolivar fuertes. On an equity-method basis, we had investments in our Venezuelan operations of $50.6$75.4 million at December 31, 2010. The amount includes retained earnings net of currency translation adjustments of the business.2011.
Concentration of Credit Risks
We routinely assess the financial strength of significant customers and this assessment, combined with the large number and geographic diversity of our customers, limits our concentration of risk with respect to accounts receivable. Financial instruments which potentially subject us to concentrations of credit risks are principally cash and cash equivalents and accounts receivables. Cash and cash equivalents are held by major financial institutions.
In accordance with U.S. generally accepted accounting principles (“GAAP”), our management haswe have made a number of estimates and assumptions relating to the reporting of assets and liabilities and the disclosure of contingent assets and liabilities to prepare these consolidated financial statements. Actual results could differ materially from those estimates. The most significant estimates used by management are related to goodwill, intangibles and other long-lived assets, pension and other retirement benefit assets and obligations, legal contingencies, deferred tax assets, purchase price allocations and foreign currency translation.
Fair-value estimates. We have various financial instruments included in our financial statements. Financial instruments are carried in our financial statements at either cost or fair value. We categorize how we estimate fair value of financial instruments and our retirement plan assets as follows:using the following hierarchy using the highest level possible:
| | Level 1: Quoted prices (unadjusted) in active markets that are accessible at the measurement date for identical assets and liabilities. Thefair value hierarchy gives the highest priority to Level 1 inputs. |
| | Level 2: Observable prices that are based on inputs not quoted on active markets, but are corroborated by market data. |
| | Level 3: Unobservable inputs are used when little or no market data is available. The fair value hierarchy gives the lowest priority to Level 3 inputs. |
New Accounting Standards
Recently Adopted Accounting Standards
We adopted Statement of Financial Accounting Standard (“SFAS”) 168, The FASB Accounting Standards Codification and the Hierarchy of Generally Accepted Accounting Principles – a replacement of FASB Statement No. 162, effective for our quarter ended September 30, 2009. SFAS 168 established the FASB Accounting Standards Codification (“Codification”) as the sole source of authoritative non-governmental accounting principles to be applied in the preparation of financial statements in conformity with GAAP. Although SFAS 168 does not change GAAP, the adoption of SFAS 168 affected our financial statements sinc e all future references to authoritative accounting literature are now in accordance with SFAS 168.
We adopted the accounting principles established by FSP FAS 132(R)-1, Employers’ Disclosures about Postretirement Benefit Plan Assets, which is now part of FASB ASC Topic 715, Compensation – Retirement Benefits, effective for us on December 31, 2009. This guidance requires enhanced disclosures about plan assets in an employer’s defined benefit pension or other postretirement plans in order to provide users of financial statements with an understanding of how investment allocation decisions are made, the major categories of plan assets, the inputs and valuation techniques used to measure the fair value of plan assets, and significant conce ntrations of risk within plan assets.
We adopted the accounting principles established by SFAS 141(R), Business Combinations, which is now part of FASB ASC Topic 805, Business Combinations, effective January 1, 2009. FASB ASC Topic 805 establishes requirements for an acquirer to record the assets acquired, liabilities assumed, and any related noncontrolling interests related to the acquisition of a controlled subsidiary, measured at fair value, as of the acquisition date. In 2008, we expensed all acquisition costs for transactions that were expected to close in 2009. In 2009 and 2010, we recognized gains and losses related to the acquisition of controlling interests in affiliates previously accounted for under the equity method or cost method – see note 6 to our consolidated financial statements. The adoption of this new guidance did not otherwise have an effect on our historical financial statements, but does affect the way we account for acquisitions after the effective date.
We adopted the accounting principles established by SFAS 160, Noncontrolling Interests in Consolidated Financial Statements an Amendment of ARB No. 51, which is now part of FASB ASC Topic 810, Consolidation, effective January 1, 2009. FASB ASC Topic 810 establishes new accounting and reporting standards for the noncontrolling interest, previously known as minority interest, in a subsidiary and for the deconsolidation of a subsidiary. This statement clarifies that a noncontrolling interest in a subsidiary is an ownership interest in the consolidated entity that should be reported as a separate component within equity in the consolidated financial statements. Additionally, consolidated net income is to be reported with separate disclosure of the amounts attributable to the parent and to the noncontrolling interests. Prior to the adoption of this new guidance, noncontrolling interests were deductions from income in arriving at net income. Under FASB ASC Topic 810, noncontrolling interests are a deduction from net income used to arrive at net income attributable to Brink’s.
We adopted the accounting principles established by SFAS 161, Disclosures about Derivative Instruments and Hedging Activities an Amendment of SFAS 133, which is now part of FASB ASC Topic 815, Derivatives and Hedging, effective January 1, 2009. FASB ASC Topic 815 requires enhanced disclosures about an entity's derivative and hedging activities. The adoption of this new guidance had no effect on our financial statements.
We adopted the accounting principles established by SFAS 165, Subsequent Events, which is now part of FASB ASC Topic 855, Subsequent Events, effective for our quarter ended June 30, 2009. FASB ASC Topic 855 establishes general standards of accounting and disclosure of events that occur after the balance sheet date but before financial statements are issued or are available to be issued. The adoption of this new guidance did not have a material effect on our financial statements.
We adopted the accounting principles established by FASB Staff Position ("FSP") EITF 03-6-1, Determining Whether Instruments Granted in Share-Based Payment Transactions Are Participating Securities, which is now part of FASB ASC Topic 260, Earnings per Share, effective January 1, 2009. FASB ASC Topic 260 affects entities that accrue cash dividends (whether paid or unpaid) on share-based payment awards during the award’s service period for dividends that are nonforfeitable. The adoption of this new guidance did not have a material effect on our financial statements.
We adopted the accounting principles established by FSP 157-2, Partial Deferral of the Effective Date of SFAS 157, which is now part of FASB ASC Topic 820, Fair Value Measurements and Disclosures, effective January 1, 2009. This guidance delayed the effective date of FASB ASC Topic 820 for all nonrecurring fair value measurements of nonfinancial assets and nonfinancial liabilities. The adoption of this guidance did not have a material effect on our results of operations or financial position.
We adopted the accounting principles established by FSP FAS 157-4, Determining Fair Value When the Volume and Level of Activity for the Asset or Liability Have Significantly Decreased and Identifying Transactions That Are Not Orderly, which is now part of FASB ASC Topic 820, Fair Value Measurements and Disclosures, effective for our quarter ended June 30, 2009. FASB ASC Topic 820 provides guidance for estimating fair value when the volume and level of activity for the asset or liability have significantly decreased. FASB ASC Topic 820 also
provides guidance for identifying circumstances that indicate a transaction is not orderly and affirms that the objective of fair value measurement in a market for an asset that is not active is the price that would be received in an orderly (i.e., not distressed) transaction on the measurement date under current market conditions. If the market is determined to be not active, the entity must consider all available evidence in determining whether an observable transaction is orderly. The adoption of this new guidance did not have a material effect on our results of operations or financial position.
We adopted the accounting principles established by FSP FAS 115-2 and FAS 124-2, Recognition and Presentation of Other-Than-Temporary Impairments, which is now part of FASB ASC Topic 320, Investments – Debt and Equity Securities, effective for our quarter ended June 30, 2009. FASB ASC Topic 320 provides guidance on the recognition of other-than-temporary impairments of investments in debt securities and provides new presentation and disclosure requirements for other-than-temporary impairments of investments in debt and equity securities. The adoption of this n ew guidance did not have a material effect on our financial statements.
We adopted the accounting principles established by FSP FAS 107-1 and APB 28-1, Interim Disclosures about Fair Value of Financial Instruments, which is now part of FASB ASC Topic 825, Financial Instruments, effective for our quarter ended June 30, 2009. FASB ASC Topic 825 requires disclosures about the fair value of financial instruments in interim reporting periods whereas, previously, the disclosures were required only in annual financial statements. The adoption of this new guidance resulted in the disclosure of the fair value of our significant fixed-rate long-term debt and our available-for-sale securities as of our inte rim reporting periods. This new guidance did not otherwise have an effect on our financial statements.
We adopted the accounting principles established by FSP FAS 141(R)-1, Accounting for Assets Acquired and Liabilities Assumed in a Business Combination that Arise from Contingencies, which is now part of FASB ASC Topic 805, Business Combinations, effective for our quarter ended June 30, 2009. This guidance is effective for each of our business combinations which were completed on or after January 1, 2009. FASB ASC Topic 805 provides that contingent assets acquired or liabilities assumed in a business combination be recorded at fair value if the acquisition-date fair value can be determined during the measurement period. & #160;If the acquisition-date fair value cannot be determined, such items would be recognized at the acquisition date if they meet the recognition requirements of FASB ASC Topic 450, Contingencies. In periods after the acquisition date, items not recognized as part of the acquisition but recognized subsequently would be reflected in that subsequent period’s income. The adoption of this new guidance did not have a material effect on our financial statements.
In August 2009, the FASB issued Accounting Standards Update (“ASU”) 2009-05, Measuring Liabilities at Fair Value, which was effective for us on October 1, 2009. This ASU clarifies the application of certain valuation techniques in circumstances in which a quoted price in an active market for the identical liability is not available. The adoption of this guidance did not have a material effect on our financial statements.
In September 2009, the FASB issued ASU 2009-12, Investments in Certain Entities That Calculate Net Asset Value per Share (or Its Equivalent), which was effective for our year ending December 31, 2009. ASU 2009-12 allows investors to use net asset value as a practical expedient to estimate the fair value of certain investments that do not have readily determinable fair values and sets forth disclosure requirements for these investments. The adoption of this ASU helped us in applying the enhanced disclosure requirements established by FSP FAS 132(R)-1. Otherwise, the adoption of this guidance did not have a material effect on our financial statements.
We adopted the accounting principles established by ASU 2009-16, Transfers and Servicing: Accounting for Transfers of Financial Assets, effective January 1, 2010. This ASU removes the concept of a qualifying special-purpose entity (QSPE)(“QSPE”) from SFAS 140, Accounting for Transfers and Servicing of Financial Assets and Extinguishment of Liabilities, and removes the exception from applying FASBFinancial Accounting Standards Board (“FASB”) Interpretation 46R, Consolidation of Variable Interest Entities. This statement also clarifies the requirements for isolation and limitations on portions of financial assets that are eligible for sale accounti ng.accounting. The adoption of this new guidance did not have a material effect on our financial statements.
We adopted the accounting principles established by ASU 2009-17, Consolidations: Improvements to Financial Reporting by Enterprises Involved with Variable Interest Entities, effective January 1, 2010. This ASU requires an ongoing reassessment and replaces the quantitative-based risks and rewards calculation for determining which reporting entity, if any, has a controlling financial interest in a variable interest entity (“VIE”) with a primarily qualitative analysis. The qualitative analysis is based on identifying the party that has both the power to direct the activities that most significantly affect the VIE’s economic performance (the “power criterion”) and the obligation to absorb losses from or the right to receive benefits of the VIE that could po tentiallypotentially be significant to the VIE (the “losses/benefit criterion”). The party that meets both these criteria is deemed to have a controlling financial interest. The party with the controlling financial interest is considered to be the primary beneficiary and as a result is required to consolidate the VIE. The adoption of this new guidance did not have a material effect on our financial statements.
In January 2010, the FASB issued ASU 2010-06, Improving Disclosures about Fair Value Measurements. ASU 2010-06 both expands and clarifies the disclosure requirements related to fair value measurements. Entities are required to disclose separately the amounts of significant transfers in and out of Level 1 and Level 2 of the fair value valuation hierarchy and describe the reasons for the transfers. Additionally,
entities are required to disclose information about purchases, sales, issuances, and settlements on a gross basis in the reconciliation of Level 3 fair-value measurements. The new guidance also clarifies existing fair-value measurement disclosure guidance about the level of disaggregation, inputs, and valuation techniques. We adopted the new disclosures effective January 1, 2010, except for the Level 3 rollforward disclosures. The Level 3 rollforward disclosures will be effective for us January 1, 2011. The adoption of the ASU did not have a material effect on our disclosures as weWe did not have any significant transfers in and out of Level 1 and Level 2 of the fair value valuation hierarchy during 2010. See note 9 for the required disclosures for a 2011 transfer of certain of our fixed-rate bonds from Level 1 to Level 2 in 2010.the fair valuation hierarchy. We adopted the Level 3 rollforward disclosures effective January 1, 2011. The adoption of the Level 3 disclosures did not have a material effect on our financial statements as the only Level 3 valuations were for investments held by our retirement plans. Since these valuations have been estimated using net asset value per share, we are not required to make the Level 3 rollforward disclosures required by ASU 2010-06.
We adopted the accounting principles established by ASU 2010-09, Subsequent Events: Amendments to Certain Recognition and Disclosure Requirements, effective January 1, 2010. Under this amended guidance, SEC filers are no longer required to disclose the date through which subsequent events have been evaluated in originally issued and revised financial statements.
In January 2010, the FASB issued ASU 2010-02, Accounting and Reporting for Decreases in Ownership of a Subsidiary—a Scope Clarification, which clarifies the scope of the decrease in ownership provisions of ASCAccounting Standards Codification (“ASC”) 810-10, Consolidation, and related guidance. The ASU clarified that the standard applies to a subsidiary or group of assets that is a business, a subsidiary that is a business that is transferred to an equity method investee or joint venture, or an exchange of a group of assets that constitutes a business for a noncontrolling interest in an entity (including an equity method investee or joint venture). The ASU also expands the disclosures required upon deconsolidation of a subsidiary to disclo sedisclose the valuation techniques used to measure the fair value of any retained investment in the former subsidiary, the nature of continuing involvement after the former subsidiary has been deconsolidated or derecognized and whether the transaction resulting in deconsolidation was with a related party or if the deconsolidated entity will become a related party. Finally, the ASU also requires that entities disclose valuation techniques used to measure the fair value of previously held equity interests prior to acquiring control in a business combination achieved in stages. We adopted this guidance effective January 1, 2010. See page 99 for disclosures regardingThe adoption of this new guidance did not have a material effect on our remeasurement of a previously held equity interest in SPP and page 117 for disclosures about our 2010 deconsolidation of Brink’s Belgium.financial statements.
In May 2010, the FASB issued ASU 2010-19, Foreign Currency Issues: Multiple Foreign Currency Exchange Rates, which codified an SEC Staff Announcement made at the March 18, 2010, Emerging Issues Task Force (“EITF”) meeting. The Staff Announcement provides the SEC staff’s view on certain exchange rates related to investments in Venezuela. The use of different rates for remeasurement and translation purposes causes Venezuelan reported balances for financial reporting purposes and the actual U.S. dollar denominated balances to be different. The SEC staff indicated that any differences between the amounts reported for financial reporting purposes and actual U.S. dollar denominated balances that may have existed prior to the application o fof the highly inflationary accounting requirements (January 1, 2010, for calendar year-end registrants including Brink’s) should be recognized in the income statement, unless the issuer can document that the difference was previously recognized as a cumulative translation adjustment, in which case the difference should be recognized as a currency translation adjustment. We adopted the guidance effective March, 31, 2010, and recognized these differences as a currency translation adjustment as of January 1, 2010, upon the adoption of highly inflationary accounting in Venezuela. See related disclosures above in Note 1 – Summary of Significant Accounting Policies – Foreign Currency Translation – Venezuela.1.
In December 2010, the FASB ratified EITF 10-G, Disclosure of Supplementary Pro Forma Information for Business Combinations. EITF 10-G affects public entities that have entered into material business combinations and requires that pro forma disclosures should reflect the assumption that the business combination had occurred as of the beginning of the prior annual period. It also requires a description of nonrecurring pro forma adjustments. EITF 10-G is effective and should be applied prospectively for business combinations completed during periods beginning after December 15, 2010, with early adoption permitted. We arewere required to adopt the new rule in 2011, but we haveearly adopted this standard for acquisitions occurring in 2010. See related disclosuresThe adoption of this guidance did not have a material effect on page 103.our financial statements.
Standards Not Yet Adopted
In October 2009,We adopted the FASB issuedaccounting principles established by ASU 2009-13, Multiple-Deliverable Revenue Arrangements, which will be effective for us on January 1, 2011. ASU 2009-13 establishes a selling price hierarchy for determining the selling price of a deliverable in a multiple-deliverable arrangement. In addition, the revised guidance requires additional disclosures about the methods and assumptions used to evaluate multiple-deliverable arrangements and to identify the significant deliverables within those arrangements. We are currently evaluating the potentialThe adoption of this guidance did not have a material effect of the amended guidance on our financial statements.
In October 2009,We adopted the FASB issuedaccounting principles established by ASU 2009-14, Certain Revenue Arrangements that Include Software Elements, which will be effective for us on January 1, 2011. ASU 2009-14 amends ASC Topic 985 to exclude from its scope tangible products that contain both software and non-software components that function together to deliver a product’s essential functionality. We are currently evaluating the potentialThe adoption of this guidance did not have a material effect of the amended guidance on our financial statements.
In September 2011, the FASB issued ASU 2011-08, Testing Goodwill for Impairment. Under the revised guidance, entities testing goodwill for impairment have the option of performing a qualitative assessment before calculating the fair value of the reporting unit (i.e., Step 1 of the goodwill impairment test). If entities determine, on the basis of qualitative factors, that it is more likely than not that the fair value of the reporting unit is less than the carrying amount, the two-step impairment test would be required. The ASU also requires that the same qualitative factors be considered when determining whether an interim test of goodwill impairment is necessary and for determining whether it is necessary to perform Step 2 for reporting units with zero or negative carrying amounts. The option to carry forward an entity’s detailed calculation of fair value of the reporting unit if certain conditions were met has been removed. Although the ASU is effective for fiscal years beginning after December 15, 2011, we adopted this guidance for the 2011 reporting year for our annual October 1 goodwill impairment test. The adoption of this guidance did not have a material effect on our financial statements.
Standards Not Yet Adopted
In May 2011, the FASB issued ASU 2011-04, Fair Value Measurement: Amendments to Achieve Common Fair Value Measurement and Disclosure Requirements in U.S. GAAP and IFRS, which became effective for us on January 1, 2012. ASU 2011-04 changes how fair value guidance is applied in certain circumstances and expands the disclosure requirements around fair value measurements. For entities with fair value measurements classified as Level 3, required disclosures include a quantitative disclosure of the unobservable inputs and assumptions used in the measurement, a description of the valuation processes in place, a narrative description of the sensitivity of the fair value to changes in unobservable inputs and interrelationships between those inputs, and quantitative disclosures about unobservable inputs used in fair value measurements other than those valuations that use net asset value as a practical expedient. The adoption of this guidance will not have a material effect on our financial statements but may increase the disclosures related to our Level 3 fair value measurements.
In June 2011, the FASB issued ASU 2011-05, Presentation of Comprehensive Income, which became effective for us on January 1, 2012. Under ASU 2011-05, an entity has the option to present the components of comprehensive income either in a single continuous statement of comprehensive income or in two separate but consecutive statements. The ASU does not change the items that must be reported as other comprehensive income. Whether presenting two separate statements or one continuous statement, the ASU required entities to present reclassifications from other comprehensive income in the statement reporting net income. In December 2011, however, the FASB deferred this requirement when it issued ASU 2011-12, Deferral of the Effective Date for Amendments to the Presentation of Reclassification of Items Out of Accumulated Other Comprehensive Income in Accounting Standards Update No. 2011-05, which has the same effective date as ASU 2011-05. Companies must continue to disclose reclassifications from other comprehensive income on the statement that reports other comprehensive income, or in the notes to the financial statements. We have determined that the standards will not affect our annual financial statements. However, we will be required to include a statement of comprehensive income in our quarterly financial statements beginning in 2012.
Note 2 – Segment Information
We identify our operating segments based on how resources are allocated and operating decisions are made. Management evaluates performance and allocates resources based on operating profit or loss, excluding corporate allocations. We have four geographic operating segments, and undernon-segment expenses. Under the aggregation criteria set forth in FASB ASC 280, Segment Reporting, we have four geographic operating segments, which are aggregated into two reportable segments: International and North America. We currently serve customers in more than 100 countries, including approximately 50 countries where we operate subsidiaries.
The primary services of the reportable segments include:
| · | Cash-in-transit (“CIT”) – armored vehicle transportation |
| · | Automated teller machine (“ATM”) – replenishment and servicing, network infrastructure services |
| · | Global Services – transportation of valuables globally |
| · | Cash Logistics – supply chain management of cash |
| · | Payment Services – consumers pay utility and other bills at payment locations |
| · | Guarding Services – including airport security |
We currently serve customers in more than 100 countries, including approximately 50 countries where we operate subsidiaries.
| | | Years Ended December 31, | |
| (In millions) | | 2011 | | | 2010 | | | 2009 | |
| | | | | | | | | | |
| Revenues by Business Segment | | | | | | | | | |
| International | | $ | 2,911.3 | | | | 2,203.7 | | | | 2,240.9 | |
| North America | | | 974.2 | | | | 917.8 | | | | 894.1 | |
| Total | | $ | 3,885.5 | | | | 3,121.5 | | | | 3,135.0 | |
| | | | | | | | | | | | | |
| | | | | | | | | | | | | |
| | | | | | | | | | | | | |
| Operating Profit by Business Segment | | | | | | | | | | | | |
| International | | $ | 199.7 | | | | 164.8 | | | | 156.8 | |
| North America | | | 31.4 | | | | 44.1 | | | | 56.6 | |
| Business segments | | | 231.1 | | | | 208.9 | | | | 213.4 | |
| Non-segment | | | (59.8 | ) | | | (62.6 | ) | | | (46.6 | ) |
| Total | | $ | 171.3 | | | | 146.3 | | | | 166.8 | |
| | | Revenues | | | Operating Profit (Loss) | |
| | | Years Ended December 31, | | | Years Ended December 31, | |
| (In millions) | | 2010 | | | 2009 | | | 2008 | | | 2010 | | | 2009 | | | 2008 | |
| | | | | | | | | | | | | | | | | | | |
| Business Segments | | | | | | | | | | | | | | | | | | |
| | | | | | | | | | | | | | | | | | | |
| International | | $ | 2,203.7 | | | | 2,240.9 | | | | 2,231.3 | | | $ | 164.8 | | | | 156.8 | | | | 215.0 | |
| North America | | | 917.8 | | | | 894.1 | | | | 932.2 | | | | 44.1 | | | | 56.6 | | | | 56.9 | |
Business segments | | | 3,121.5 | | | | 3,135.0 | | | | 3,163.5 | | | | 208.9 | | | | 213.4 | | | | 271.9 | |
| Non-segment | | | - | | | | - | | | | - | | | | (62.6 | ) | | | (46.6 | ) | | | (43.4 | ) |
| Total | | $ | 3,121.5 | | | | 3,135.0 | | | | 3,163.5 | | | $ | 146.3 | | | | 166.8 | | | | 228.5 | |
| Capital Expenditures by Business Segment | | | | | | | | | |
| International | | $ | 144.8 | | | | 110.7 | | | | 103.1 | |
| North America | | | 51.4 | | | | 38.1 | | | | 67.5 | |
| Total | | $ | 196.2 | | | | 148.8 | | | | 170.6 | |
| | | | | | | | | | | | | |
| | | | | | | | | | | | | |
| Depreciation and Amortization by Business Segment | | | | | | | | | | | | |
| Depreciation and amortization of property and equipment: | | | | | | | | | | | | |
| International | | $ | 96.9 | | | | 84.5 | | | | 88.5 | |
| North America | | | 54.6 | | | | 43.0 | | | | 36.6 | |
| Property and equipment | | | 151.5 | | | | 127.5 | | | | 125.1 | |
| Amortization of intangible assets: | | | | | | | | | | | | |
| International | | | 8.9 | | | | 8.1 | | | | 9.0 | |
| North America | | | 2.0 | | | | 1.0 | | | | 1.0 | |
| Total | | $ | 162.4 | | | | 136.6 | | | | 135.1 | |
| | | Capital Expenditures | | | Depreciation and Amortization | |
| | | Years Ended December 31, | | | Years Ended December 31, | |
| (In millions) | | 2010 | | | 2009 | | | 2008 | | | 2010 | | | 2009 | | | 2008 | |
| | | | | | | | | | | | | | | | | | | |
| Business Segments | | | | | | | | | | | | | | | | | | |
| | | | | | | | | | | | | | | | | | | |
| International | | $ | 110.7 | | | | 103.1 | | | | 112.7 | | | $ | 84.5 | | | | 88.5 | | | | 85.7 | |
| North America | | | 38.1 | | | | 67.5 | | | | 52.6 | | | | 43.0 | | | | 36.6 | | | | 31.0 | |
Property and equipment | | | 148.8 | | | | 170.6 | | | | 165.3 | | | | 127.5 | | | | 125.1 | | | | 116.7 | |
| Amortization of intangible assets: | | | | | | | | | | | | | | | | | | | | | | | | |
International | | | - | | | | - | | | | - | | | | 8.1 | | | | 9.0 | | | | 4.8 | |
North America | | | - | | | | - | | | | - | | | | 1.0 | | | | 1.0 | | | | 0.8 | |
| Total | | $ | 148.8 | | | | 170.6 | | | | 165.3 | | | $ | 136.6 | | | | 135.1 | | | | 122.3 | |
| | | Assets | |
| | | December 31, | |
| (In millions) | | 2010 | | | 2009 | | | 2008 | |
| | | | | | | | | | |
| Business Segments | | | | | | | | | |
| | | | | | | | | | |
| International | | $ | 1,531.7 | | | | 1,265.5 | | | | 1,289.1 | |
| North America | | | 426.8 | | | | 335.4 | | | | 341.9 | |
Business Segments | | | 1,958.5 | | | | 1,600.9 | | | | 1,631.0 | |
| Non-segment | | | 312.0 | | | | 278.9 | | | | 184.8 | |
| Total | | $ | 2,270.5 | | | | 1,879.8 | | | | 1,815.8 | |
| | | December 31, | |
| (In millions) | | 2011 | | | 2010 | | | 2009 | |
| | | | | | | | | | |
| Assets held by Business Segment | | | | | | | | | |
| International | | $ | 1,565.9 | | | | 1,531.7 | | | | 1,265.5 | |
| North America | | | 468.6 | | | | 426.8 | | | | 335.4 | |
| Business Segments | | | 2,034.5 | | | | 1,958.5 | | | | 1,600.9 | |
| Non-segment | | | 371.7 | | | | 312.0 | | | | 278.9 | |
| Total | | $ | 2,406.2 | | | | 2,270.5 | | | | 1,879.8 | |
| | | Long-Lived Assets (a) | | | Revenues | |
| | | December 31, | | | Years Ended December 31, | |
| (In millions) | | 2010 | | | 2009 | | | 2008 | | | 2010 | | | 2009 | | | 2008 | |
| | | | | | | | | | | | | | | | | | | |
| Geographic | | | | | | | | | | | | | | | | | | |
| | | | | | | | | | | | | | | | | | | |
| Non-U.S.: | | | | | | | | | | | | | | | | | | |
France | | $ | 159.9 | | | | 167.2 | | | | 167.0 | | | $ | 533.0 | | | | 615.2 | | | | 697.7 | |
Brazil | | | 99.8 | | | | 96.5 | | | | 29.0 | | | | 303.3 | | | | 257.6 | | | | 193.5 | |
Venezuela | | | 38.3 | | | | 33.2 | | | | 75.0 | | | | 185.9 | | | | 376.1 | | | | 350.9 | |
Other | | | 543.0 | | | | 372.8 | | | | 280.2 | | | | 1,355.8 | | | | 1,154.5 | | | | 1,158.8 | |
Subtotal | | | 841.0 | | | | 669.7 | | | | 551.2 | | | | 2,378.0 | | | | 2,403.4 | | | | 2,400.9 | |
| United States | | | 185.4 | | | | 162.9 | | | | 143.5 | | | | 743.5 | | | | 731.6 | | | | 762.6 | |
| Total | | $ | 1,026.4 | | | | 832.6 | | | | 694.7 | | | $ | 3,121.5 | | | | 3,135.0 | | | | 3,163.5 | |
| | | | | December 31, |
| | (In millions) | | 2011 | | 2010 | | 2009 |
| | | | | | | | | | | | |
| | Long-Lived Assets by Geographic Area (a) | | | | | | | | | |
| | Non-U.S.: | | | | | | | | | |
| | | France | $ | 149.9 | | | 159.9 | | | 167.2 | |
| | | Mexico | | 123.9 | | | 118.5 | | | - | |
| | | Brazil | | 100.9 | | | 99.8 | | | 96.5 | |
| | | Venezuela | | 43.5 | | | 38.3 | | | 33.2 | |
| | | Other | | 425.4 | | | 424.5 | | | 372.8 | |
| | | Subtotal | | 843.6 | | | 841.0 | | | 669.7 | |
| | United States | | 200.8 | | | 185.4 | | | 162.9 | |
| | Total | $ | 1,044.4 | | | 1,026.4 | | | 832.6 | |
| | (a) Long-lived assets include property and equipment, net; goodwill; and other intangible assets, net. |
| | | | | | | | | | | | |
| | | | | |
| | | | | Years Ended December 31, |
| | (In millions) | | 2011 | | 2010 | | 2009 | |
| | | | | | | | | | | | |
| | Revenues by Geographic Area (a) | | | | | | | | | |
| | Outside the U.S.: | | | | | | | | | |
| | | France | $ | 567.2 | | | 533.0 | | | 615.2 | |
| | | Mexico | | 415.2 | | | 51.7 | | | - | |
| | | Brazil | | 386.8 | | | 303.3 | | | 257.6 | |
| | | Venezuela | | 269.2 | | | 185.9 | | | 376.1 | |
| | | Other | | 1,513.6 | | | 1,304.1 | | | 1,154.5 | |
| | | Subtotal | | 3,152.0 | | | 2,378.0 | | | 2,403.4 | |
| | United States | | 733.5 | | | 743.5 | | | 731.6 | |
| | Total | $ | 3,885.5 | | | 3,121.5 | | | 3,135.0 | |
| (a) | Long-lived assets include property and equipment, net; goodwill; other intangible assets, net; and deferred charges.Revenues are recorded in the country where service is initiated or performed. No single customer represents more than 10% of total revenue. |
Revenues are recorded in the country where service is initiated or performed. No single customer represents more than 10% of total revenue.
| | | December 31, | | | December 31, | |
| (In millions) | | 2010 | | | 2009 | | | 2008 | | | 2011 | | | 2010 | | | 2009 | |
| | | | | | | | | | | | | | | | | | | |
| Net assets outside the U.S. | | | | | | | | | | | | | | | | | | |
| | | | | | | | | | | |
| Europe, Middle East and Africa | | $ | 271.2 | | | | 300.9 | | | | 365.0 | | |
| Latin America | | | 346.4 | | | | 261.1 | | | | 258.5 | | | $ | 376.9 | | | | 346.4 | | | | 261.1 | |
| Europe , Middle East and Africa | | | | 285.2 | | | | 271.2 | | | | 300.9 | |
| Asia Pacific | | | 94.8 | | | | 87.8 | | | | 26.6 | | | | 98.6 | | | | 94.8 | | | | 87.8 | |
| Other | | | 75.2 | | | | 34.8 | | | | 30.1 | | | | (68.3 | ) | | | 75.2 | | | | 34.8 | |
| Total | | $ | 787.6 | | | | 684.6 | | | | 680.2 | | | $ | 692.4 | | | | 787.6 | | | | 684.6 | |
| | | December 31, | |
| (In millions) | | 2010 | | | 2009 | | | 2008 | |
| | | | | | | | | | |
| Investments in unconsolidated equity affiliates | | | | | | | | | |
| | | | | | | | | | |
| International | | $ | 11.5 | | | | 10.2 | | | | 13.1 | |
| Total | | $ | 11.5 | | | | 10.2 | | | | 13.1 | |
| | | | | | | | | | | | | |
| Share of earnings of unconsolidated equity affiliates | | | | | | | | | | | | |
| | | | | | | | | | | | | |
| International | | $ | 3.9 | | | | 4.5 | | | | 4.7 | |
| Other | | | - | | | | - | | | | 0.3 | |
| Total | | $ | 3.9 | | | | 4.5 | | | | 5.0 | |
Undistributed earnings of equity affiliates included in consolidated retained earnings approximated $5.7 million at December 31, 2010, $5.3 million at December 31, 2009, and $8.1 million at December 31, 2008.
| (In millions) | | 2011 | | | 2010 | | | 2009 | |
| | | | | | | | | | |
| Information about Unconsolidated Equity Affiliates held by International Segment | | | | | | | | | |
| Carrying value of investments at year end | | $ | 12.8 | | | | 11.5 | | | | 10.2 | |
| Share of earnings included in Brink's consolidated earnings during the year | | | 4.8 | | | | 3.9 | | | | 4.5 | |
| Undistributed earnings at year end | | | 7.1 | | | | 5.7 | | | | 5.3 | |
Note 3 – Retirement Benefits
Defined-benefit Pension Plans
Summary
We have various defined-benefit pension plans covering eligible current and former employees. Benefits under most plans are based on salary and years of service. There are limits to the amount of benefits which can be paid to participants from a U.S. qualified pension plan. We maintain a nonqualified U.S. plan to pay benefits for those eligible current and former employees in the U.S. whose benefits exceed the regulatory limits.
| | Components of Net Periodic Pension Cost | |
| (In millions) | | U.S. Plans | | | Non-U.S. Plans | | | Total | |
| Years Ended December 31, | | 2010 | | | 2009 | | | 2008 | | | 2010 | | | 2009 | | | 2008 | | | 2010 | | | 2009 | | | 2008 | |
| | | | | | | | | | | | | | | | | | | | | | | | | | | | |
| Service cost | | $ | - | | | | - | | | | - | | | $ | 6.6 | | | | 6.1 | | | | 9.7 | | | $ | 6.6 | | | | 6.1 | | | | 9.7 | |
| Interest cost on PBO | | | 46.5 | | | | 47.7 | | | | 45.9 | | | | 13.4 | | | | 12.2 | | | | 12.8 | | | | 59.9 | | | | 59.9 | | | | 58.7 | |
| Return on assets - expected | | | (66.8 | ) | | | (61.2 | ) | | | (58.9 | ) | | | (10.6 | ) | | | (9.0 | ) | | | (11.6 | ) | | | (77.4 | ) | | | (70.2 | ) | | | (70.5 | ) |
| Amortization of losses | | | 19.5 | | | | 9.1 | | | | 1.6 | | | | 3.2 | | | | 3.5 | | | | 3.7 | | | | 22.7 | | | | 12.6 | | | | 5.3 | |
| Settlement loss | | | - | | | | 0.3 | | | | - | | | | 0.1 | | | | - | | | | - | | | | 0.1 | | | | 0.3 | | | | - | |
| Net pension cost (credit) | | $ | (0.8 | ) | | | (4.1 | ) | | | (11.4 | ) | | $ | 12.7 | | | | 12.8 | | | | 14.6 | | | $ | 11.9 | | | | 8.7 | | | | 3.2 | |
| | (In millions) | | U.S. Plans | | Non-U.S. Plans | | Total | |
| | Years Ended December 31, | | 2011 | 2010 | 2009 | | 2011 | 2010 | 2009 | | 2011 | 2010 | 2009 | |
| | | | | | | | | | | | | | | |
| | Service cost | $ | - | - | - | $ | 10.2 | 6.6 | 6.1 | $ | 10.2 | 6.6 | 6.1 | |
| | Interest cost on projected benefit obligation | | 46.2 | 46.5 | 47.7 | | 16.9 | 13.4 | 12.2 | | 63.1 | 59.9 | 59.9 | |
| | Return on assets – expected | | (65.0) | (66.8) | (61.2) | | (12.0) | (10.6) | (9.0) | | (77.0) | (77.4) | (70.2) | |
| | Amortization of losses | | 28.2 | 19.5 | 9.1 | | 4.3 | 3.2 | 3.5 | | 32.5 | 22.7 | 12.6 | |
| | Settlement loss | | - | - | 0.3 | | 2.2 | 0.1 | - | | 2.2 | 0.1 | 0.3 | |
| | Net periodic pension cost (credit) | $ | 9.4 | (0.8) | (4.1) | $ | 21.6 | 12.7 | 12.8 | $ | 31.0 | 11.9 | 8.7 | |
| | Obligations and Funded Status | |
Changes in the projected benefit obligation (“PBO”) and plan assets for our pension plans are as follows:
| (In millions) | | U.S. Plans | | | Non-U.S. Plans | | | Total | |
| Years Ended December 31, | | 2010 | | | 2009 | | | 2010 | | | 2009 | | | 2010 | | | 2009 | |
| | | | | | | | | | | | | | | | | | | |
| PBO at beginning of year | | $ | 810.5 | | | | 769.3 | | | | 223.4 | | | | 196.3 | | | | 1,033.9 | | | | 965.6 | |
| Service cost | | | - | | | | - | | | | 6.6 | | | | 6.1 | | | | 6.6 | | | | 6.1 | |
| Interest cost | | | 46.5 | | | | 47.7 | | | | 13.4 | | | | 12.2 | | | | 59.9 | | | | 59.9 | |
| Plan participant contributions | | | - | | | | - | | | | 2.9 | | | | 2.8 | | | | 2.9 | | | | 2.8 | |
| Plan settlements | | | - | | | | (3.5 | ) | | | (0.5 | ) | | | - | | | | (0.5 | ) | | | (3.5 | ) |
| Acquisition | | | - | | | | - | | | | 39.0 | | | | - | | | | 39.0 | | | | - | |
| Benefits paid | | | (38.0 | ) | | | (36.1 | ) | | | (8.8 | ) | | | (8.9 | ) | | | (46.8 | ) | | | (45.0 | ) |
| Actuarial (gains) losses | | | 71.1 | | | | 33.1 | | | | 15.7 | | | | (0.6 | ) | | | 86.8 | | | | 32.5 | |
| Foreign currency exchange effects | | | - | | | | - | | | | (2.1 | ) | | | 15.5 | | | | (2.1 | ) | | | 15.5 | |
| PBO at end of year | | $ | 890.1 | | | | 810.5 | | | | 289.6 | | | | 223.4 | | | | 1,179.7 | | | | 1,033.9 | |
| | | | | | | | | | | | | | | | | | | | | | | | | |
| Fair value of plan assets at beginning of year | | $ | 658.2 | | | | 440.1 | | | | 188.9 | | | | 147.9 | | | | 847.1 | | | | 588.0 | |
| Return on assets – actual | | | 77.4 | | | | 103.5 | | | | 22.2 | | | | 19.2 | | | | 99.6 | | | | 122.7 | |
| Plan participant contributions | | | - | | | | - | | | | 2.9 | | | | 2.8 | | | | 2.9 | | | | 2.8 | |
| Employer contributions: | | | | | | | | | | | | | | | | | | | | | | | | |
| Primary U.S. Plan (a) | | | - | | | | 150.0 | | | | - | | | | - | | | | - | | | | 150.0 | |
| Other plans | | | 0.8 | | | | 4.2 | | | | 15.3 | | | | 14.8 | | | | 16.1 | | | | 19.0 | |
| Plan settlements | | | - | | | | (3.5 | ) | | | (0.5 | ) | | | - | | | | (0.5 | ) | | | (3.5 | ) |
| Acquisition | | | - | | | | - | | | | 0.6 | | | | - | | | | 0.6 | | | | - | |
| Benefits paid | | | (38.0 | ) | | | (36.1 | ) | | | (8.8 | ) | | | (8.9 | ) | | | (46.8 | ) | | | (45.0 | ) |
| Foreign currency effects | | | - | | | | - | | | | (2.0 | ) | | | 13.1 | | | | (2.0 | ) | | | 13.1 | |
| Fair value of plan assets at end of year | | $ | 698.4 | | | | 658.2 | | | | 218.6 | | | | 188.9 | | | | 917.0 | | | | 847.1 | |
| | | | | | | | | | | | | | | | | | | | | | | | | |
| Funded status | | $ | (191.7 | ) | | | (152.3 | ) | | | (71.0 | ) | | | (34.5 | ) | | | (262.7 | ) | | | (186.8 | ) |
| | | | | | | | | | | | | | | | | | | | | | | | | |
| Included in: | | | | | | | | | | | | | | | | | | | | | | | | |
Noncurrent asset | | $ | - | | | | - | | | | (8.6 | ) | | | (8.2 | ) | | | (8.6 | ) | | | (8.2 | ) |
Current liability, included in accrued liabilities | | | 1.4 | | | | 1.7 | | | | 3.1 | | | | 1.2 | | | | 4.5 | | | | 2.9 | |
Noncurrent liability | | | 190.3 | | | | 150.6 | | | | 76.5 | | | | 41.5 | | | | 266.8 | | | | 192.1 | |
| Net pension liability | | $ | 191.7 | | | | 152.3 | | | | 71.0 | | | | 34.5 | | | | 262.7 | | | | 186.8 | |
(a) | Comprised of $92.4 million of cash and $57.6 million of shares of Brink’s common stock. |
| | (In millions) | | U.S. Plans | | Non-U.S. Plans | | Total | |
| | Years Ended December 31, | | 2011 | | 2010 | | 2011 | | 2010 | | 2011 | | 2010 | |
| | | | | | | | | | | | | | | | |
| | Benefit obligation at beginning of year | $ | 890.1 | | 810.5 | | 289.6 | | 223.4 | | 1,179.7 | | 1,033.9 | |
| | Service cost | | - | | - | | 10.2 | | 6.6 | | 10.2 | | 6.6 | |
| | Interest cost | | 46.2 | | 46.5 | | 16.9 | | 13.4 | | 63.1 | | 59.9 | |
| | Plan participant contributions | | - | | - | | 3.5 | | 2.9 | | 3.5 | | 2.9 | |
| | Plan settlements | | - | | - | | (2.8) | | (0.5) | | (2.8) | | (0.5) | |
| | Acquisition | | - | | - | | - | | 39.0 | | - | | 39.0 | |
| | Benefits paid | | (39.7) | | (38.0) | | (15.9) | | (8.8) | | (55.6) | | (46.8) | |
| | Actuarial (gains) losses | | 94.1 | | 71.1 | | 15.9 | | 15.7 | | 110.0 | | 86.8 | |
| | Foreign currency exchange effects | | - | | - | | (10.5) | | (2.1) | | (10.5) | | (2.1) | |
| | Benefit obligation at end of year | $ | 990.7 | | 890.1 | | 306.9 | | 289.6 | | 1,297.6 | | 1,179.7 | |
| | | | | | | | | | | | | | | | |
| | Fair value of plan assets at beginning of year | $ | 698.4 | | 658.2 | | 218.6 | | 188.9 | | 917.0 | | 847.1 | |
| | Return on assets – actual | | 26.0 | | 77.4 | | 7.9 | | 22.2 | | 33.9 | | 99.6 | |
| | Plan participant contributions | | - | | - | | 3.5 | | 2.9 | | 3.5 | | 2.9 | |
| | Employer contributions: | | 0.7 | | 0.8 | | 25.7 | | 15.3 | | 26.4 | | 16.1 | |
| | Plan settlements | | - | | - | | (2.8) | | (0.5) | | (2.8) | | (0.5) | |
| | Acquisition | | - | | - | | - | | 0.6 | | - | | 0.6 | |
| | Benefits paid | | (39.7) | | (38.0) | | (15.9) | | (8.8) | | (55.6) | | (46.8) | |
| | Foreign currency effects | | - | | - | | (6.5) | | (2.0) | | (6.5) | | (2.0) | |
| | Fair value of plan assets at end of year | $ | 685.4 | | 698.4 | | 230.5 | | 218.6 | | 915.9 | | 917.0 | |
| | | | | | | | | | | | | | | | |
| | | Funded status | $ | (305.3) | | (191.7) | | (76.4) | | (71.0) | | (381.7) | | (262.7) | |
| | | | | | | | | | | | | | | | |
| | Included in: | | | | | | | | | | | | | |
| | | Noncurrent asset | $ | - | | - | | (12.3) | | (8.6) | | (12.3) | | (8.6) | |
| | | Current liability, included in accrued liabilities | | 13.2 | | 1.4 | | 11.2 | | 3.1 | | 24.4 | | 4.5 | |
| | | Noncurrent liability | | 292.1 | | 190.3 | | 77.5 | | 76.5 | | 369.6 | | 266.8 | |
| | Net pension liability | $ | 305.3 | | 191.7 | | 76.4 | | 71.0 | | 381.7 | | 262.7 | |
Other Changes in Plan Assets and Benefit Recognized in Other Comprehensive Income
| (In millions) | | U.S. Plans | | | Non-U.S. Plans | | | Total | |
| Years Ended December 31, | | 2010 | | | 2009 | | | 2010 | | | 2009 | | | 2010 | | | 2009 | |
| | | | | | | | | | | | | | | | | | | |
| Benefit plan experience loss recognized in | | | | | | | | | | | | | | | | | | |
accumulated other comprehensive income (loss): | | | | | | | | | | | | | | | | | | |
Beginning of year | | $ | (367.4 | ) | | | (385.7 | ) | | | (17.4 | ) | | | (30.2 | ) | | | (384.8 | ) | | | (415.9 | ) |
Net experience gains (losses) arising during the year | | | (60.5 | ) | | | 9.2 | | | | (4.1 | ) | | | 10.8 | | | | (64.6 | ) | | | 20.0 | |
Reclassification adjustment for amortization of | | | | | | | | | | | | | | | | | | | | | | | | |
experience loss included in net income | | | 19.5 | | | | 9.1 | | | | 1.9 | | | | 2.0 | | | | 21.4 | | | | 11.1 | |
End of year | | $ | (408.4 | ) | | | (367.4 | ) | | | (19.6 | ) | | | (17.4 | ) | | | (428.0 | ) | | | (384.8 | ) |
| | | | | | | | | | | | | | | | | | | | | | | | | |
| Benefit plan prior service cost recognized in | | | | | | | | | | | | | | | | | | | | | | | | |
accumulated other comprehensive income (loss): | | | | | | | | | | | | | | | | | | | | | | | | |
Beginning of year | | $ | - | | | | - | | | | (8.9 | ) | | | (10.4 | ) | | | (8.9 | ) | | | (10.4 | ) |
Reclassification adjustment for amortization of | | | | | | | | | | | | | | | | | | | | | | | | |
prior service cost included in net income | | | - | | | | - | | | | 1.3 | | | | 1.5 | | | | 1.3 | | | | 1.5 | |
End of year | | $ | - | | | | - | | | | (7.6 | ) | | | (8.9 | ) | | | (7.6 | ) | | | (8.9 | ) |
| | (In millions) | | U.S. Plans | | Non-U.S. Plans | | Total | |
| | Years Ended December 31, | | 2011 | | 2010 | | 2011 | | 2010 | | 2011 | | 2010 | |
| | | | | | | | | | | | | | | | | | |
| | | | | | | | | | | | | | | | | | |
| | Benefit plan experience loss recognized in | | | | | | | | | | | | | |
| | | accumulated other comprehensive income (loss): | | | | | | | | | | | | | |
| | | | Beginning of year | $ | (408.4) | | (367.4) | | (19.6) | | (17.4) | | (428.0) | | (384.8) | |
| | | | Net experience gains (losses) arising during the year | | (133.1) | | (60.5) | | (20.0) | | (4.1) | | (153.1) | | (64.6) | |
| | | | Reclassification adjustment for amortization of | | | | | | | | | | | | | |
| | | | | experience losses included in net income | | 28.2 | | 19.5 | | 5.0 | | 1.9 | | 33.2 | | 21.4 | |
| | | | End of year | $ | (513.3) | | (408.4) | | (34.6) | | (19.6) | | (547.9) | | (428.0) | |
| | | | | | | | | | | | | | | | | | |
| | Benefit plan prior service (cost) credit recognized in | | | | | | | | | | | | | |
| | | accumulated other comprehensive income (loss): | | | | | | | | | | | | | |
| | | | Beginning of year | $ | - | | - | | (7.6) | | (8.9) | | (7.6) | | (8.9) | |
| | | | Reclassification adjustment for amortization of | | | | | | | | | | | | | |
| | | | | prior service credit included in net income | | - | | - | | 1.5 | | 1.3 | | 1.5 | | 1.3 | |
| | | | End of year | $ | - | | - | | (6.1) | | (7.6) | | (6.1) | | (7.6) | |
Approximately $30.9$44.6 million of experience loss and $1.5$1.4 million of prior service cost are expected to be amortized from accumulated other comprehensive income (loss) into net periodic pension cost during 2011.2012.
The net experience losses in 2011 were primarily due to the lower discount rate of the U.S. plans as well as the actual return on assets being lower than expected. The net experience losses in 2010 were primarily due to the lower discount rate of the U.S. plans, partially offset by the actual return on assets being higher than expected. The net experience gains in 2009 were primarily due to the actual return on assets being higher than expected partially offset by the lower discount rate of the U.S. plans.
| | Information Comparing Plan Assets to Plan Obligations |
Information comparing plan assets to plan obligations as of December 31, 20102011 and 20092010 are aggregated below. The ABOaccumulated benefit obligation (“ABO”) differs from the PBO in that the ABO is based on the benefit earned through the date noted. The PBO includes assumptions about future compensation levels for plans that have not been frozen.
| | | ABO Greater | | | Plan Assets | | | | |
| (In millions) | | Than Plan Assets | | | Greater Than ABO | | | Total | |
| December 31, | | 2010 | | | 2009 | | | 2010 | | | 2009 | | | 2010 | | | 2009 | |
| | | | | | | | | | | | | | | | | | | |
| PBO | | $ | 985.0 | | | | 867.5 | | | | 194.7 | | | | 166.4 | | | | 1,179.7 | | | | 1,033.9 | |
| ABO | | | 968.2 | | | | 862.5 | | | | 181.7 | | | | 156.2 | | | | 1,149.9 | | | | 1,018.7 | |
| Fair value of plan assets | | | 722.6 | | | | 678.9 | | | | 194.4 | | | | 168.2 | | | | 917.0 | | | | 847.1 | |
| | (In millions) | | U.S. Plans | | Non-U.S. Plans | | Total | |
| | December 31, | | 2011 | | 2010 | | 2011 | | 2010 | | 2011 | | 2010 | |
| | | | | | | | | | | | | | | | |
| | Pension plans with an accumulated benefit obligation in excess of plan assets: | | | | | | | | | | | | | |
| | | Fair value of plan assets | $ | 685.4 | | 698.4 | | 117.5 | | 24.1 | | 802.9 | | 722.5 | |
| | | Accumulated benefit obligation | | 990.7 | | 890.1 | | 179.8 | | 78.1 | | 1,170.5 | | 968.2 | |
| | | Projected benefit obligation | | 990.7 | | 890.1 | | 206.4 | | 95.0 | | 1,197.1 | | 985.1 | |
The ABO for our U.S. pension plans was $990.7 million in 2011 and $890.1 million in 2010. The ABO for our Non-U.S. pension plans was $278.8 million in 2011 and $259.8 million in 2010.
The weighted-average assumptions used in determining the net pension cost and benefit obligations for our pension plans were as follows:
| | | U.S. Plans | | | Non-U.S. Plans | |
| | | 2010 | | | 2009 | | | 2008 | | | 2010 | | | 2009 | | | 2008 | |
| | | | | | | | | | | | | | | | | | | |
| Discount rate: | | | | | | | | | | | | | | | | | | |
Pension cost | | | 5.9 | % | | | 6.6 | % | | | 6.4 | % | | | 6.2 | % | | | 6.2 | % | | | 5.5 | % |
Benefit obligation at year end | | | 5.3 | % | | | 5.9 | % | | | 6.2 | % | | | 5.8 | % | | | 6.2 | % | | | 6.2 | % |
| | | | | | | | | | | | | | | | | | | | | | | | | |
| Expected return on assets – Pension cost | | | 8.8 | % | | | 8.8 | % | | | 8.8 | % | | | 5.5 | % | | | 5.8 | % | | | 5.9 | % |
| | | | | | | | | | | | | | | | | | | | | | | | | |
| Average rate of increase in salaries (a): | | | | | | | | | | | | | | | | | | | | | | | | |
Pension cost | | | N/A | | | | N/A | | | | N/A | | | | 3.1 | % | | | 4.0 | % | | | 3.0 | % |
Benefit obligation at year end | | | N/A | | | | N/A | | | | N/A | | | | 3.3 | % | | | 3.1 | % | | | 4.0 | % |
| | | | U.S. Plans | | Non-U.S. Plans | |
| | | | 2011 | | 2010 | | 2009 | | 2011 | | 2010 | | 2009 | |
| | | | | | | | | | | | | | | |
| | Discount rate: | | | | | | | | | | | | |
| | | Pension cost | 5.3 % | | 5.9 % | | 6.6 % | | 5.8 % | | 6.2 % | | 6.2 % | |
| | | Benefit obligation at year end | 4.6 % | | 5.3 % | | 5.9 % | | 5.4 % | | 5.8 % | | 6.2 % | |
| | | | | | | | | | | | | | | |
| | Expected return on assets – pension cost | 8.75 % | | 8.75 % | | 8.75 % | | 5.16 % | | 5.54 % | | 5.78 % | |
| | | | | | | | | | | | | | | |
| | Average rate of increase in salaries (a): | | | | | | | | | | | | |
| | | Pension cost | N/A | | N/A | | N/A | | 3.3 % | | 3.1 % | | 4.0 % | |
| | | Benefit obligation at year end | N/A | | N/A | | N/A | | 3.2 % | | 3.3 % | | 3.1 % | |
| (a) | Salary scale assumptions are determined through historical experience and vary by age and industry. The U.S. plan benefits are frozen. Pension benefits will not increase due to future salary increases. |
The RP-2000 Combined Healthy Blue Collar mortality table and the RP-2000 Combined Healthy White Collar mortality table were used to estimate the expected lives of participants in the U.S. pension plans. Expected lives of participants in non-U.S. pension plans were estimated using mortality tables in the country of operation.
Cash Flows
Estimated Contributions from the Company into Plan Assets
Our policy is to fund at least the minimum actuarially determined amounts required by applicable regulations. Based on December 31, 2010, data, assumptions and funding regulations, we are not requiredWe expect to make a contributioncontribute $31.5 million to theour primary U.S. pension plan, for the fiscal year 2011.approximately $13.2 million to our nonqualified U.S. pension plan and $26.9 million to our non-U.S. pension plans in 2012.
On August 20, 2009, we made a voluntary $150 million contribution to our primary U.S. retirement plan to improve the funded status of the plan. The contribution was comprised of $92.4 million of cash and 2,260,738 newly issued shares of our common stock valued for purposes of the contribution at $25.48 per share, or $57.6 million in the aggregate. Because we considered the contribution to be a significant event for the plan, we remeasured our projected benefit obligation and plan assets related to our primary U.S. pension plan as of July 1, 2009. As part of the remeasurement we changed the discount rate from 6.2% to 6.8%.
At the time we made the voluntary $150 million contribution we changed the method of valuing assets for funding purposes from the fair-market-value basis to the asset-smoothing basis. We elected the asset-smoothing basis to reduce the volatility of future required contributions to the plan.
We expect to contribute approximately $1.4 million to our nonqualified U.S. pension plan and $14.2 million to our non-U.S. pension plans in 2011.
Estimated Future Benefit Payments from Plan Assets to Beneficiaries
Our projected benefit payments at December 31, 2010,2011, for each of the next five years and the aggregate five years thereafter are as follows:
| (In millions) | | U.S. Plans | | | Non-U.S. Plans | | | Total | |
| | | | | | | | | | |
| 2011 | | $ | 41.1 | | | | 10.7 | | | | 51.8 | |
| 2012 | | | 43.1 | | | | 11.7 | | | | 54.8 | |
| 2013 | | | 45.2 | | | | 12.4 | | | | 57.6 | |
| 2014 | | | 45.7 | | | | 13.5 | | | | 59.2 | |
| 2015 | | | 47.1 | | | | 14.0 | | | | 61.1 | |
| 2016 through 2020 | | | 266.9 | | | | 85.7 | | | | 352.6 | |
| Total | | $ | 489.1 | | | | 148.0 | | | | 637.1 | |
Multi-employer Pension Plans
We contribute to multi-employer pension plans in a few of our non-U.S. subsidiaries. Multi-employer pension expense for continuing operations was $2.3 million in 2010, $2.1 million in 2009 and $2.1 million in 2008.
Savings Plans
We sponsor various defined contribution plans to help eligible employees provide for retirement. We match 125% of up to 5% of our employees’ eligible contributions to our U.S. 401(k) plan. Participants were formerly allowed to invest in Brink’s common stock, but in January 2008, all Brink’s stock investments were reallocated to other investments. Our matching contribution expense is as follows:
| (In millions) | | | |
| Years Ended December 31, | | 2010 | | | 2009 | | | 2008 | |
| | | | | | | | | | |
| U.S. 401(k) | | $ | 16.3 | | | | 13.4 | | | | 11.7 | |
| Other Plans | | | 4.0 | | | | 3.4 | | | | 1.8 | |
| Total | | $ | 20.3 | | | | 16.8 | | | | 13.5 | |
| (In millions) | | U.S. Plans | | | Non-U.S. Plans | | | Total | |
| | | | | | | | | | |
| 2012 | | $ | 55.6 | | | | 18.7 | | | | 74.3 | |
| 2013 | | | 46.1 | | | | 11.1 | | | | 57.2 | |
| 2014 | | | 46.0 | | | | 12.8 | | | | 58.8 | |
| 2015 | | | 47.2 | | | | 12.0 | | | | 59.2 | |
| 2016 | | | 48.7 | | | | 13.4 | | | | 62.1 | |
| 2017 through 2021 | | $ | 272.7 | | | | 85.6 | | | | 358.3 | |
Retirement Benefits Other than Pensions
Summary
We provide retirement health care benefits for eligible current and former U.S. and Canadian employees, including former employees of our former U.S. coal operation. Retirement benefits related to our former coal operation include medical benefits provided by the Pittston Coal Group Companies Employee Benefit Plan for UMWA Represented Employees (the “UMWA plans”) as well as costs related to Black Lung obligations.
| | Components of Net Periodic Postretirement Cost |
The components of net periodic postretirement cost related to retirement benefits other than pensions were as follows:
| (In millions) | | UMWA plans | | | Black lung and other plans | | | Total | |
| Years Ended December 31, | | 2010 | | | 2009 | | | 2008 | | | 2010 | | | 2009 | | | 2008 | | | 2010 | | | 2009 | | | 2008 | |
| | | | | | | | | | | | | | | | | | | | | | | | | | | | |
| Service cost | | $ | - | | | | - | | | | - | | | $ | - | | | | - | | | | 0.1 | | | $ | - | | | | - | | | | 0.1 | |
| Interest cost on APBO | | | 27.1 | | | | 25.8 | | | | 31.3 | | | | 2.9 | | | | 2.8 | | | | 3.0 | | | | 30.0 | | | | 28.6 | | | | 34.3 | |
| Return on assets – expected | | | (25.3 | ) | | | (22.6 | ) | | | (38.6 | ) | | | - | | | | - | | | | - | | | | (25.3 | ) | | | (22.6 | ) | | | (38.6 | ) |
| Amortization of losses | | | 16.0 | | | | 16.7 | | | | 7.9 | | | | 1.8 | | | | 0.1 | | | | 0.3 | | | | 17.8 | | | | 16.8 | | | | 8.2 | |
| Curtailment gain (a) | | | - | | | | - | | | | - | | | | - | | | | - | | | | (2.0 | ) | | | - | | | | - | | | | (2.0 | ) |
| Net periodic postretirement cost | | $ | 17.8 | | | | 19.9 | | | | 0.6 | | | $ | 4.7 | | | | 2.9 | | | | 1.4 | | | $ | 22.5 | | | | 22.8 | | | | 2.0 | |
(a) In January 2008, Brink’s froze the Canadian retirement benefit plan.| | (In millions) | | UMWA plans | | Black lung and other plans | | Total | |
| | Years Ended December 31, | | 2011 | 2010 | 2009 | | 2011 | 2010 | 2009 | | 2011 | 2010 | 2009 | |
| | | | | | | | | | | | | | | |
| | Interest cost on APBO | $ | 24.0 | 27.1 | 25.8 | $ | 2.8 | 2.9 | 2.8 | $ | 26.8 | 30.0 | 28.6 | |
| | Return on assets – expected | | (25.5) | (25.3) | (22.6) | | - | - | - | | (25.5) | (25.3) | (22.6) | |
| | Amortization of losses | | 14.7 | 16.0 | 16.7 | | 2.6 | 1.8 | 0.1 | | 17.3 | 17.8 | 16.8 | |
| | Net periodic postretirement cost | $ | 13.2 | 17.8 | 19.9 | $ | 5.4 | 4.7 | 2.9 | $ | 18.6 | 22.5 | 22.8 | |
| Obligations and Funded Status |
Changes in the APBOaccumulated postretirement benefit obligation (“APBO’) and plan assets related to retirement health care benefits are as follows:
| (In millions) | | UMWA plans | | | Black lung and other plans | | | Total | |
| Years Ended December 31, | | 2010 | | | 2009 | | | 2010 | | | 2009 | | | 2010 | | | 2009 | |
| | | | | | | | | | | | | | | | | | | |
| APBO at beginning of year | | $ | 465.5 | | | | 483.6 | | | | 47.1 | | | | 48.6 | | | | 512.6 | | | | 532.2 | |
| Interest cost | | | 27.1 | | | | 25.8 | | | | 2.9 | | | | 2.8 | | | | 30.0 | | | | 28.6 | |
| Plan amendments | | | - | | | | - | | | | 19.3 | | | | - | | | | 19.3 | | | | - | |
| Benefits paid | | | (37.8 | ) | | | (39.6 | ) | | | (5.9 | ) | | | (7.6 | ) | | | (43.7 | ) | | | (47.2 | ) |
| Medicare subsidy received | | | 3.2 | | | | 3.2 | | | | - | | | | - | | | | 3.2 | | | | 3.2 | |
| Actuarial (gain) loss, net | | | 16.3 | | | | (7.5 | ) | | | (1.3 | ) | | | 4.5 | | | | 15.0 | | | | (3.0 | ) |
| Foreign currency exchange effects and other | | | - | | | | - | | | | 0.1 | | | | (1.2 | ) | | | 0.1 | | | | (1.2 | ) |
| APBO at end of year | | $ | 474.3 | | | | 465.5 | | | | 62.2 | | | | 47.1 | | | | 536.5 | | | | 512.6 | |
| | | | | | | | | | | | | | | | | | | | | | | | | |
| Fair value of plan assets at beginning of year | | $ | 308.0 | | | | 276.1 | | | | - | | | | - | | | | 308.0 | | | | 276.1 | |
| Employer contributions | | | - | | | | - | | | | 5.9 | | | | 7.6 | | | | 5.9 | | | | 7.6 | |
| Return on assets – actual | | | 37.1 | | | | 67.8 | | | | - | | | | - | | | | 37.1 | | | | 67.8 | |
| Benefits paid | | | (38.1 | ) | | | (39.1 | ) | | | (5.9 | ) | | | (7.6 | ) | | | (44.0 | ) | | | (46.7 | ) |
| Medicare subsidy received | | | 3.2 | | | | 3.2 | | | | - | | | | - | | | | 3.2 | | | | 3.2 | |
| Fair value of plan assets at end of year | | $ | 310.2 | | | | 308.0 | | | | - | | | | - | | | | 310.2 | | | | 308.0 | |
| | | | | | | | | | | | | | | | | | | | | | | | | |
| Funded status | | $ | (164.1 | ) | | | (157.5 | ) | | | (62.2 | ) | | | (47.1 | ) | | | (226.3 | ) | | | (204.6 | ) |
| | | | | | | | | | | | | | | | | | | | | | | | | |
| Included in: | | | | | | | | | | | | | | | | | | | | | | | | |
Current, included in accrued liabilities | | $ | - | | | | - | | | | 7.7 | | | | 6.3 | | | | 7.7 | | | | 6.3 | |
Noncurrent | | | 164.1 | | | | 157.5 | | | | 54.5 | | | | 40.8 | | | | 218.6 | | | | 198.3 | |
| Retirement benefits other than pension liability | | $ | 164.1 | | | | 157.5 | | | | 62.2 | | | | 47.1 | | | | 226.3 | | | | 204.6 | |
| | | | | | | | | Black lung and other | | | | | |
| | (In millions) | | UMWA plans | | Plans | | Total | |
| | Years Ended December 31, | | 2011 | | 2010 | | 2011 | | 2010 | | 2011 | | 2010 | |
| | | | | | | | | | | | | | | | |
| | APBO at beginning of year | $ | 474.3 | | 465.5 | | 62.2 | | 47.1 | | 536.5 | | 512.6 | |
| | Interest cost | | 24.0 | | 27.1 | | 2.8 | | 2.9 | | 26.8 | | 30.0 | |
| | Plan amendments | | - | | - | | - | | 19.3 | | - | | 19.3 | |
| | Benefits paid | | (39.1) | | (37.8) | | (7.0) | | (5.9) | | (46.1) | | (43.7) | |
| | Medicare subsidy received | | 3.4 | | 3.2 | | - | | - | | 3.4 | | 3.2 | |
| | Actuarial (gains) losses, net | | 67.0 | | 16.3 | | 2.9 | | (1.3) | | 69.9 | | 15.0 | |
| | Foreign currency exchange effects and other | | - | | - | | - | | 0.1 | | - | | 0.1 | |
| | APBO at end of year | $ | 529.6 | | 474.3 | | 60.9 | | 62.2 | | 590.5 | | 536.5 | |
| | | | | | | | | | | | | | | | |
| | Fair value of plan assets at beginning of year | $ | 310.2 | | 308.0 | | - | | - | | 310.2 | | 308.0 | |
| | Employer contributions: | | - | | - | | 7.0 | | 5.9 | | 7.0 | | 5.9 | |
| | Return on assets – actual | | (5.1) | | 37.1 | | - | | - | | (5.1) | | 37.1 | |
| | Benefits paid | | (40.5) | | (38.1) | | (7.0) | | (5.9) | | (47.5) | | (44.0) | |
| | Medicare subsidy received | | 3.4 | | 3.2 | | - | | - | | 3.4 | | 3.2 | |
| | Fair value of plan assets at end of year | $ | 268.0 | | 310.2 | | - | | - | | 268.0 | | 310.2 | |
| | | | | | | | | | | | | | | | |
| | Funded status | $ | (261.6) | | (164.1) | | (60.9) | | (62.2) | | (322.5) | | (226.3) | |
| | | | | | | | | | | | | | | | |
| | Included in: | | | | | | | | | | | | | |
| | | Current, included in accrued liabilities | $ | - | | - | | 7.1 | | 7.7 | | 7.1 | | 7.7 | |
| | | Noncurrent | | 261.6 | | 164.1 | | 53.8 | | 54.5 | | 315.4 | | 218.6 | |
| | Retirement benefits other than pension liability | $ | 261.6 | | 164.1 | | 60.9 | | 62.2 | | 322.5 | | 226.3 | |
Other Changes in Plan Assets and Benefit Recognized in Other Comprehensive Income
Changes in accumulated other comprehensive income (loss) of our retirement benefit plans other than pensions are as follows:
| (In millions) | | UMWA plans | | | Black lung and other plans | | | Total | |
| Years Ended December 31, | | 2010 | | | 2009 | | | 2010 | | | 2009 | | | 2010 | | | 2009 | |
| | | | | | | | | | | | | | | | | | | |
| Benefit plan experience gain (loss) recognized in | | | | | | | | | | | | | | | | | | |
accumulated other comprehensive income (loss): | | | | | | | | | | | | | | | | | | |
Beginning of year | | $ | (251.6 | ) | | | (321.0 | ) | | $ | (9.3 | ) | | | (5.2 | ) | | $ | (260.9 | ) | | | (326.2 | ) |
Net experience gains (losses) arising during the year | | | (4.5 | ) | | | 52.7 | | | | 1.3 | | | | (4.5 | ) | | | (3.2 | ) | | | 48.2 | |
Reclassification adjustment for amortization of | | | | | | | | | | | | | | | | | | | | | | | | |
experience losses included in net income | | | 16.0 | | | | 16.7 | | | | 0.4 | | | | 0.4 | | | | 16.4 | | | | 17.1 | |
End of year | | $ | (240.1 | ) | | | (251.6 | ) | | $ | (7.6 | ) | | | (9.3 | ) | | $ | (247.7 | ) | | | (260.9 | ) |
| | | | | | | | | | | | | | | | | | | | | | | | | |
| Benefit plan prior service (cost) credit recognized in | | | | | | | | | | | | | | | | | | | | | | | | |
accumulated other comprehensive income (loss): | | | | | | | | | | | | | | | | | | | | | | | | |
Beginning of year | | $ | - | | | | - | | | $ | 2.6 | | | | 2.9 | | | $ | 2.6 | | | | 2.9 | |
Prior service cost from plan amendments | | | | | | | | | | | | | | | | | | | | | | | | |
during the year | | | - | | | | - | | | | (19.3 | ) | | | - | | | | (19.3 | ) | | | - | |
Reclassification adjustment for amortization or curtailment | | | | | | | | | | | | | | | | | | | | | | | | |
recognition of prior service credit included in net income | | | - | | | | - | | | | 1.4 | | | | (0.3 | ) | | | 1.4 | | | | (0.3 | ) |
End of year | | $ | - | | | | - | | | $ | (15.3 | ) | | | 2.6 | | | $ | (15.3 | ) | | | 2.6 | |
| | | | | | | | | | | Black lung and other | | | | | |
| | (In millions) | | UMWA plans | | Plans | | Total | |
| | Years Ended December 31, | | 2011 | | 2010 | | 2011 | | 2010 | | 2011 | | 2010 | |
| | | | | | | | | | | | | | | | | | |
| | Benefit plan experience gain (loss) recognized in | | | | | | | | | | | | | |
| | | accumulated other comprehensive income (loss): | | | | | | | | | | | | | |
| | | | Beginning of year | $ | (240.1) | | (251.6) | | (7.6) | | (9.3) | | (247.7) | | (260.9) | |
| | | | Net experience gains (losses) arising during the year | | (97.6) | | (4.5) | | (2.9) | | 1.3 | | (100.5) | | (3.2) | |
| | | | Reclassification adjustment for amortization of | | | | | | | | | | | | | |
| | | | | experience losses included in net income | | 14.7 | | 16.0 | | 0.6 | | 0.4 | | 15.3 | | 16.4 | |
| | | | End of year | $ | (323.0) | | (240.1) | | (9.9) | | (7.6) | | (332.9) | | (247.7) | |
| | | | | | | | | | | | | | | | | | |
| | Benefit plan prior service cost recognized in | | | | | | | | | | | | | |
| | | accumulated other comprehensive income (loss): | | | | | | | | | | | | | |
| | | | Beginning of year | $ | - | | - | | (15.3) | | 2.6 | | (15.3) | | 2.6 | |
| | | | Prior service cost from plan amendments | | | | | | | | | | | | | |
| | | | | during the year | | - | | - | | - | | (19.3) | | - | | (19.3) | |
| | | | Reclassification adjustment for amortization or curtailment | | | | | | | | | | | | | |
| | | | | recognition of prior service credit included in net income | | - | | - | | 2.0 | | 1.4 | | 2.0 | | 1.4 | |
| | | | End of year | $ | - | | - | | (13.3) | | (15.3) | | (13.3) | | (15.3) | |
We estimate that $15.4$22.4 million of experience loss and $2$2.0 million of prior service cost will be amortized from accumulated other comprehensive income (loss) into net periodic postretirement cost during 2011.2012.
We recognized net experience losses in 2011 associated with the UMWA obligations primarily related to lower discount rate, an excise tax on high-cost health plans, and the return on assets being lower than expected. We recognized net experience losses in 2010 associated with the UMWA obligations primarily related to the lower discount rate and mortality losses, partially offset by the return on assets being higher than expected.
We recognized net experience gainsExcise Tax on Administrators by Patient Protection and Affordable Care Act
A 40% excise tax will be imposed on high-cost health plans (“Cadillac plans”) beginning in 2009 associated with2018. The tax will apply to plan costs that exceed a certain threshold level for individuals and for families, which will be indexed to inflation. There will be higher limits for high-risk professions, among which is mining. Even though the UMWA obligations primarily relatedtax is not assessed directly to an employer but rather to the return on assets beingbenefits plan administrator, the cost is expected to be passed through to plan sponsors as higher than expectedpremiums or higher claims administration fees, increasing the plan sponsor’s obligations. We project that this excise tax will impact our UMWA plans and renegotiatinghave accordingly included a contract at a discount for4.2% increase (approximately $21.3 million) to our UMWA plans’ obligation. We are currently unable to reduce the prescription drug coverage. The gains were partially offsetbenefit levels of our UMWA medical plans to avoid this excise tax because these benefit levels are required by losses primarily related to extending the time it takes to reach the ultimate health care cost rateCoal Industry Retiree Health Benefit Act of 5% from four to six years.1992.
The accumulated postretirement benefit obligation (“APBO”)APBO for each of the plans was determined using the unit credit method and an assumed discount rate as follows:
| | | 2010 | | | 2009 | | | 2008 | | | 2011 | | | 2010 | | | 2009 | |
| | | | | | | | | | | | | | | | | | | |
| Weighted-average discount rate: | | | | | | | | | | | | | | | | | | |
| Postretirement cost: | | | | | | | | | | | | | | | | | | |
| UMWA plans | | | 5.9 | % | | | 6.2 | % | | | 6.4 | % | | | 5.3 | % | | | 5.9 | % | | | 6.2 | % |
| Black lung | | | 5.3 | % | | | 6.3 | % | | | 6.1 | % | | | 4.8 | % | | | 5.3 | % | | | 6.3 | % |
| Weighted-average | | | 5.8 | % | | | 6.2 | % | | | 6.4 | % | | | 5.2 | % | | | 5.8 | % | | | 6.2 | % |
| Benefit obligation at year end: | | | | | | | | | | | | | | | | | | | | | | | | |
| UMWA plans | | | 5.3 | % | | | 5.9 | % | | | 6.2 | % | | | 4.4 | % | | | 5.3 | % | | | 5.9 | % |
| Black lung | | | 4.8 | % | | | 5.4 | % | | | 6.3 | % | | | 4.2 | % | | | 4.8 | % | | | 5.4 | % |
| Weighted-average | | | 5.2 | % | | | 5.9 | % | | | 6.2 | % | | | 4.4 | % | | | 5.2 | % | | | 5.9 | % |
| Expected return on assets | | | 8.8 | % | | | 8.8 | % | | | 8.8 | % | | | 8.75 | % | | | 8.75 | % | | | 8.75 | % |
The RP-2000 Employee, Annuitant,Separate, Healthy Blue Collar and Combined HealthyAnnuitant/Non-Annuitant Blue Collar mortality tables are primarily used to estimate expected lives of participants.
2010 Health Care Reform
The Patient Protection and Affordable Care Act, which was enacted in March 2010, contains an amendment to the laws governing federal black lung benefits for coal miners. The amendment creates a presumption that benefits should be awarded to current or former coal miners that have accumulated 15 or more years of coal mine employment if they are able to prove that they have a disabling pulmonary disease. Previously, miners were required to demonstrate that their disabling pulmonary disease was caused by black lung disease, and not by some other cause such as smoking or old age. Under the new law,amendment, the burden of proof becomes the employer’s to establish that the disabling pulmonary disease is not black lung disease or that the miner’s disease did not result from coal mine employment. Surviving spouses will no longer be required to proveWe expect that black lung disease caused the death of a miner to continue receiving benefits.
The new law will be used to assess claims that are currently being reviewed, unless the claim was filed before January 1, 2005. Miners who have been denied benefits in the past (either as a result of not being able to prove that they have a disabling pulmonary disease, or not being able to prove that their disease was black lung disease) may reapply for benefits and these claims will be assessed using the new rules. The amendment will likelymay increase the approval rates for coal miners applying to receive black lung benefits. benefits, however, the rates have not been significantly affected to date.
We remeasured our black lung obligation as of March 31, 2010, to reflect an estimate of the increase in amounts to be paid to minersapproval rates as a result of the new law.amendment. The obligation increased $19.3 million as a result of the remeasurement, from $42.3 million before the remeasurement to $61.6 million.
Approval rates used in the remeasurement of the black lung obligation were increased to reflect an estimate of the effect of the new legislation. The discount rate used at remeasurement was 5.3% (compared to 5.4% at December 31, 2009) and the health care cost trend rate was 5.0% (compared to 8.0% at December, 31, 2009). Approval rates are difficult to estimate since the effect of the change in the law has not yet been observed in practice. The liability could change in the future if the approval rates used in the estimates of the liabilities are either too high or too low. These estimated amounts will change in the future to reflect payments made, actuarial revaluations, and other changes in estimates. Actual amounts could differ materially from the currently estimated amounts.
Health Care Cost Trend Rates
For UMWA plans, the assumed health care cost trend rate used to compute the 20102011 APBO is 7.0% for 2011,2012, declining ratably to 5.0% in 20172018 and thereafter (in 2009: 7.5%2010: 7.0% for 20102011 declining ratably to 5.0% in 20162017 and thereafter). For the black lung obligation, the assumed health care cost trend rate used to compute the 20102011 APBO was 5.0%. Other plans in the U.S. provide for fixed-dollar value coverage for eligible participants and, accordingly, are not adjusted for inflation.
The table below shows the estimated effects of a one percentage-point change in the assumed health care cost trend rates for each future year.
| | | Effect of Change in Assumed Health Care Trend Rates | | | Effect of Change in Assumed Health Care Trend Rates | |
| (In millions) | | Increase 1% | | | Decrease 1% | | | Increase 1% | | | Decrease 1% | |
| | | | | | | | | | | | | |
| Higher (lower): | | | | | | | | | | | | |
Service and interest cost in 2010 | | $ | 2.8 | | | | (2.4 | ) | |
APBO at December 31, 2010 | | | 53.5 | | | | (45.7 | ) | |
| Service and interest cost in 2011 | | | $ | 2.5 | | | | (2.1 | ) |
| APBO at December 31, 2011 | | | | 60.1 | | | | (51.1 | ) |
The Medicare Prescription Drug, Improvement and Modernization Act of 2003 (the “Medicare Act”) provides for a prescription drug benefit under Medicare as well as a federal subsidy to sponsors of retiree health care benefit plans that provide a benefit that is at least actuarially equivalent to Medicare prescription drug benefits. Because of the broadness of coverage provided under our plan, we believe that the plan benefits are at least actuarially equivalent to the Medicare benefits. The estimated effect of the legislation has been recorded as a reduction to the APBO, as permitted by FSP 106-2, Accounting and Disclosure Requirements Related to the MedicarePrescription Drug, Improvement and Modernization Act of 2003, included in FASB ASC Topic 715, Compensation – Retirement Benefits. The estimated value of the projected federal subsidy assumes no changes in participation rates and assumes that the subsidy is received in the year after claims are paid. The estimated reduction in per capita claim costs for participants over 65 years old was 8.6%8.8%.
Our net periodic postretirement costs were approximately $4.5 million lower in 2011, $4.5 million lower in 2010 and $4.3 million lower in 2009 and $5.5 million lower in 2008 due to the Medicare Act as a result of lower interest cost and amortization of losses. The estimated net present value of the subsidy, reflected as a reduction to the APBO, was approximately $60.2 million at December 31, 2011, and $50.2 million at December 31, 2010, and $46.6 million at December 31, 2009.2010.
Cash Flows
Estimated Contributions from the Company to Plan Assets
Based on the funded status and assumptions at December 31, 2010,2011, we expect the Company to contribute cash to the plans to pay 20112012 beneficiary payments for black lung and other plans. We do not expect to contribute cash to our UMWA plans since these plans have sufficient amounts held in trust to pay for beneficiary payments for 2011.2012. Our UMWA plans are not covered by ERISA or other funding laws or regulations that require these plans to meet funding ratios.
Estimated Future Benefit Payments from Plan Assets to Beneficiaries
Our projected benefit payments at December 31, 2010,2011, for each of the next five years and the aggregate five years thereafter are as follows:
| | | Before Medicare Subsidy | | | | | | Medicare | | | Net Projected | | | Before Medicare Subsidy | | | | | | Medicare | | | Net Projected | |
| (In millions) | | UMWA plans | | | Black lung and other plans | | | Subtotal | | | Subsidy | | | Payments | | | UMWA plans | | | Black lung and other plans | | | Subtotal | | | Subsidy | | | Payments | |
| | | | | | | | | | | | | | | | | | | | | | | | | | | | | | | |
| 2011 | | $ | 39.6 | | | | 7.8 | | | | 47.4 | | | | (3.1 | ) | | | 44.3 | | |
| 2012 | | | 40.1 | | | | 7.4 | | | | 47.5 | | | | (3.2 | ) | | | 44.3 | | | $ | 40.2 | | | | 7.2 | | | | 47.4 | | | | (3.3 | ) | | | 44.1 | |
| 2013 | | | 40.6 | | | | 7.1 | | | | 47.7 | | | | (3.3 | ) | | | 44.4 | | | | 40.9 | | | | 5.8 | | | | 46.7 | | | | (3.4 | ) | | | 43.3 | |
| 2014 | | | 40.3 | | | | 6.7 | | | | 47.0 | | | | (3.4 | ) | | | 43.6 | | | | 40.9 | | | | 5.5 | | | | 46.4 | | | | (3.5 | ) | | | 42.9 | |
| 2015 | | | 40.2 | | | | 6.4 | | | | 46.6 | | | | (3.4 | ) | | | 43.2 | | | | 41.0 | | | | 5.2 | | | | 46.2 | | | | (3.5 | ) | | | 42.7 | |
| 2016 through 2020 | | | 189.9 | | | | 27.9 | | | | 217.8 | | | | (17.6 | ) | | | 200.2 | | |
| Total | | $ | 390.7 | | | | 63.3 | | | | 454.0 | | | | (34.0 | ) | | | 420.0 | | |
| 2016 | | | | 40.5 | | | | 5.0 | | | | 45.5 | | | | (3.6 | ) | | | 41.9 | |
| 2017 through 2021 | | | | 191.9 | | | | 20.7 | | | | 212.6 | | | | (18.3 | ) | | | 194.3 | |
Retirement Plan Assets
U.S. Plans
The fair values of the investments of our U.S. pension plans have been estimated using quoted prices in active markets for all investments other than the hedge fund of funds, which is estimated using the net asset value per share of the investments.
Except for the hedge fund of funds, which areis categorized as a Level 3 valuation, the fair values of all investments of our U.S. pension plans are based on Level 1 valuation inputs.
| | | December 31, 2010 | | | December 31, 2009 | |
| | | | | | % | | | % | | | | | | % | | | % | |
| | | Total Fair | | | Actual | | | Target | | | Total Fair | | | Actual | | | Target | |
| (In millions, except percentages) | | Value | | | Allocation | | | Allocation | | | Value | | | Allocation | | | Allocation | |
| | | | | | | | | | | | | | | | | | | |
| U.S. Pension Plans | | | | | | | | | | | | | | | | | | |
| Cash, cash equivalents and receivables | | $ | 0.1 | | | | - | | | | - | | | | 6.7 | | | | 1 | | | | - | |
| Equity securities: | | | | | | | | | | | | | | | | | | | | | | | | |
| The Brink’s Company common stock (a) | | | - | | | | - | | | | - | | | | 33.2 | | | | 5 | | | | - | |
| U.S. large-cap (b) | | | 210.7 | | | | 30 | | | | 30 | | | | 189.7 | | | | 29 | | | | 30 | |
| U.S. small/mid-cap (b) | | | 62.2 | | | | 9 | | | | 8 | | | | 51.6 | | | | 8 | | | | 8 | |
| International (b) | | | 85.9 | | | | 12 | | | | 12 | | | | 75.5 | | | | 11 | | | | 12 | |
| Fixed-income securities: | | | | | | | | | | | | | | | | | | | | | | | | |
| Long duration (c) | | | 156.4 | | | | 23 | | | | 23 | | | | 137.8 | | | | 21 | | | | 23 | |
| High yield (d) | | | 57.2 | | | | 8 | | | | 8 | | | | 51.5 | | | | 8 | | | | 8 | |
| Emerging markets (e) | | | 27.8 | | | | 4 | | | | 4 | | | | 24.9 | | | | 4 | | | | 4 | |
| Other types of investments: | | | | | | | | | | | | | | | | | | | | | | | | |
| Hedge fund of funds (f) | | | 98.1 | | | | 14 | | | | 15 | | | | 87.3 | | | | 13 | | | | 15 | |
| Total | | $ | 698.4 | | | | 100 | | | | 100 | | | | 658.2 | | | | 100 | | | | 100 | |
| | | | | | | | | | | | | | | | | | | | | | | | | |
| UMWA Plans | | | | | | | | | | | | | | | | | | | | | | | | |
| Equity securities: | | | | | | | | | | | | | | | | | | | | | | | | |
| U.S. large-cap (b) | | $ | 117.0 | | | | 38 | | | | 37 | | | | 115.7 | | | | 37 | | | | 37 | |
| U.S. small/mid-cap (b) | | | 28.4 | | | | 9 | | | | 9 | | | | 29.9 | | | | 10 | | | | 9 | |
| International (b) | | | 44.7 | | | | 15 | | | | 14 | | | | 48.6 | | | | 16 | | | | 14 | |
| Fixed-income securities: | | | | | | | | | | | | | | | | | | | | | | | | |
| Core fixed income (g) | | | 41.4 | | | | 13 | | | | 13 | | | | 34.7 | | | | 11 | | | | 13 | |
| High yield (d) | | | 25.6 | | | | 8 | | | | 8 | | | | 26.7 | | | | 9 | | | | 8 | |
| Emerging markets (e) | | | 12.7 | | | | 4 | | | | 4 | | | | 12.4 | | | | 4 | | | | 4 | |
| Other types of investments: | | | | | | | | | | | | | | | | | | | | | | | | |
| Hedge fund of funds (f) | | | 40.4 | | | | 13 | | | | 15 | | | | 40.0 | | | | 13 | | | | 15 | |
| Total | | $ | 310.2 | | | | 100 | | | | 100 | | | | 308.0 | | | | 100 | | | | 100 | |
| | | December 31, 2011 | | | December 31, 2010 | |
| | | | | | % | | | % | | | | | | % | | | % | |
| | | Total Fair | | | Actual | | | Target | | | Total Fair | | | Actual | | | Target | |
| (In millions, except percentages) | | Value | | | Allocation | | | Allocation | | | Value | | | Allocation | | | Allocation | |
| | | | | | | | | | | | | | | | | | | |
| U.S. Pension Plans | | | | | | | | | | | | | | | | | | |
| Cash, cash equivalents and receivables | | $ | 3.5 | | | | - | | | | - | | | | 0.1 | | | | - | | | | - | |
| Equity securities: | | | | | | | | | | | | | | | | | | | | | | | | |
| U.S. large-cap (a) | | | 209.9 | | | | 31 | | | | 30 | | | | 210.7 | | | | 30 | | | | 30 | |
| U.S. small/mid-cap (a) | | | 55.2 | | | | 8 | | | | 8 | | | | 62.2 | | | | 9 | | | | 8 | |
| International (a) | | | 79.8 | | | | 12 | | | | 12 | | | | 85.9 | | | | 12 | | | | 12 | |
| Fixed-income securities: | | | | | | | | | | | | | | | | | | | | | | | | |
| Long duration (b) | | | 158.0 | | | | 23 | | | | 23 | | | | 156.4 | | | | 23 | | | | 23 | |
| High yield (c) | | | 55.2 | | | | 8 | | | | 8 | | | | 57.2 | | | | 8 | | | | 8 | |
| Emerging markets (d) | | | 27.0 | | | | 4 | | | | 4 | | | | 27.8 | | | | 4 | | | | 4 | |
| Other types of investments: | | | | | | | | | | | | | | | | | | | | | | | | |
| Hedge fund of funds (e) | | | 96.8 | | | | 14 | | | | 15 | | | | 98.1 | | | | 14 | | | | 15 | |
| Total | | $ | 685.4 | | | | 100 | | | | 100 | | | | 698.4 | | | | 100 | | | | 100 | |
| | | | | | | | | | | | | | | | | | | | | | | | | |
| UMWA Plans | | | | | | | | | | | | | | | | | | | | | | | | |
| Equity securities: | | | | | | | | | | | | | | | | | | | | | | | | |
| U.S. large-cap (a) | | $ | 101.8 | | | | 38 | | | | 37 | | | | 117.0 | | | | 38 | | | | 37 | |
| U.S. small/mid-cap (a) | | | 23.5 | | | | 9 | | | | 9 | | | | 28.4 | | | | 9 | | | | 9 | |
| International (a) | | | 33.5 | | | | 13 | | | | 14 | | | | 44.7 | | | | 15 | | | | 14 | |
| Fixed-income securities: | | | | | | | | | | | | | | | | | | | | | | | | |
| Core fixed income (f) | | | - | | | | - | | | | - | | | | 41.4 | | | | 13 | | | | 13 | |
| High yield (c) | | | 22.6 | | | | 8 | | | | 8 | | | | 25.6 | | | | 8 | | | | 8 | |
| Emerging markets (d) | | | 11.2 | | | | 4 | | | | 4 | | | | 12.7 | | | | 4 | | | | 4 | |
| Multi asset real return (g) | | | 35.5 | | | | 13 | | | | 13 | | | | - | | | | - | | | | - | |
| Other types of investments: | | | | | | | | | | | | | | | | | | | | | | | | |
| Hedge fund of funds (e) | | | 39.9 | | | | 15 | | | | 15 | | | | 40.4 | | | | 13 | | | | 15 | |
| Total | | $ | 268.0 | | | | 100 | | | | 100 | | | | 310.2 | | | | 100 | | | | 100 | |
| (a) | An independent fiduciary made all investment decisions regarding these shares and, as a result, the investment is excluded from our target asset allocation. |
| (b) | These categories include actively managed mutual funds that track various indices such as the S&P 500 Index, the Russell 2500 Index and the MSCI All Country World Ex-U.S. Index. |
| (c)(b) | This category represents an actively managed mutual fund that seeks to duplicate the risk and return characteristics of a long-term fixed-income securities portfolio with an approximate duration of 10 to 13 years by using a long duration bond portfolio, including interest-rate swap agreements and Treasury futures contracts, for the purpose of managing the overall duration of this fund. |
| (d)(c) | This category represents an actively managed mutual fund that invests primarily in fixed-income securities rated below investment grade, including corporate bonds and debentures, convertible and preferred securities and zero-coupon obligations. The fund’s average weighted maturity may vary and will generally not exceed ten years. |
(e)(d) | This category represents an actively managed mutual fund that invests primarily in U.S.-dollar-denominated debt securities of government, government-related and corporate issuers in emerging market countries, as well as entities organized to restructure the outstanding debt of such issuers. |
| (f)(e) | This category represents an actively managed mutual fund that invests in different hedge-fund investments, with various strategies. The fund holds approximately 40 separate hedge-fund investments. Strategies included (1) long-short equity, (2) event-driven and distressed-debt, (3) global macro, (4) credit hedging, (5) multi-strategy, and (6) fixed-income arbitrage. Its investment objective is to seek to achieve an attractive risk-adjusted return with moderate volatility and moderate directional market exposure over a full market cycle. |
| (g)(f) | This category represents an actively managed mutual fund that invests in funds with investments in mortgage backed securities, corporate bonds and investment grade securities. The category seeks to provide returns and a risk profile of the Barclays Capital U.S. Aggregate Bond Index. |
| (g) | This category represents an actively managed mutual fund that invests primarily in fixed income and equity securities and commodity linked instruments. The category seeks total returns that exceed the rate of inflation over a full market cycle regardless of market conditions. |
Assets of our U.S. plans are invested with an objective of maximizing the total return, taking into consideration the liabilities of the plan, and minimizing the risks that could create the need for excessive contributions. Plan assets are invested primarily using actively managed accounts with asset allocation targets listed in the tables below. Our policy does not permit the purchase of Brink’s common stock if immediately after any such purchase the aggregate fair market value of the plan assets invested in Brink’s common stock exceeds 10% of the aggregate fair market value of the assets of the plan, except as permitted by an exemption under ERISA. The plans rebalance their assets on a monthly basis if actual allocations of assets are outside predetermined ranges. Among other facto rs,factors, the performance of asset groups and investment managers will affect the long-term rate of return.
All of the investments of our U.S. retirement plans can be redeemed daily, except for the hedge fund of funds, which can be redeemed quarterly, subject to any restrictions imposed by the underlying hedge funds.
Non-U.S. Plans
TheExcept for investments in our Netherlands pension plan, the fair values of the investments of our non-U.S. pension plans have been estimated using quoted prices in active markets and are therefore based on Level 1 valuation inputs. The fair values for the Netherlands plan investments have been estimated using the net asset value per share of the investments. Except for cashinvestments and cash equivalents (categorized as a Level 1 valuation) and an insignificant amount of Level 3 investments, the fair values of all other investments of our non-U.S. pension plans are based on Level 2 valuation inputs.
| | | December 31, 2010 | | | December 31, 2009 | | | December 31, 2011 | | | December 31, 2010 | |
| | | | | | % | | | % | | | | | | % | | | % | | | | | | % | | | % | | | | | | % | | | % | |
| | | Total Fair | | | Actual | | | Target | | | Total Fair | | | Actual | | | Target | | | Total Fair | | | Actual | | | Target | | | Total Fair | | | Actual | | | Target | |
| (In millions, except percentages) | | Value | | | Allocation | | | Allocation | | | Value | | | Allocation | | | Allocation | | | Value | | | Allocation | | | Allocation | | | Value | | | Allocation | | | Allocation | |
| | | | | | | | | | | | | | | | | | | | | | | | | | | | | | | | | | | | | |
| Non-U.S. Pension Plans | | | | | | | | | | | | | | | | | | | | | | | | | | | | | | | | | | | | |
| Cash and cash equivalents | | $ | 0.3 | | | | | | | | | | 0.5 | | | | - | | | | - | | | $ | 1.0 | | | | - | | | | - | | | | 0.3 | | | | - | | | | - | |
| Equity securities: | | | | | | | | | | | | | | | | | | | | | | | | | | | | | | | | | | | | | | | | | | | | | | |
| U.S. equity funds (a) | | | 28.1 | | | | | | | | | | 22.5 | | | | | | | | | | | | 21.8 | | | | | | | | | | | | 28.1 | | | | | | | | | |
| Canadian equity funds (a) | | | 28.2 | | | | | | | | | | 22.5 | | | | | | | | | | | | 26.5 | | | | | | | | | | | | 28.2 | | | | | | | | | |
| European equity funds (a) | | | 16.6 | | | | | | | | | | 14.9 | | | | | | | | | | | | 5.3 | | | | | | | | | | | | 16.6 | | | | | | | | | |
| Asia-pacific equity funds (a) | | | 3.0 | | | | | | | | | | 2.5 | | | | | | | | | | | | 1.1 | | | | | | | | | | | | 3.0 | | | | | | | | | |
| Emerging markets(a) | | | 5.7 | | | | | | | | | | 4.5 | | | | | | | | | | |
| Emerging markets (a) | | | | 3.2 | | | | | | | | | | | | 5.7 | | | | | | | | | |
| Other non-U.S. equity funds (a) | | | 11.7 | | | | | | | | | | 9.2 | | | | | | | | | | | | 28.7 | | | | | | | | | | | | 11.7 | | | | | | | | | |
| Total equity securities | | | 93.3 | | | | 43 | | | | 48 | | | | 76.1 | | | | 40 | | | | 47 | | | | 86.6 | | | | 38 | | | | 40 | | | | 93.3 | | | | 43 | | | | 48 | |
| Fixed-income securities: | | | | | | | | | | | | | | | | | | | | | | | | | | | | | | | | | | | | | | | | | | | | | | | | |
| Global credit (b) | | | 23.7 | | | | | | | | | | | | 22.7 | | | | | | | | | | | | 28.9 | | | | | | | | | | | | 23.7 | | | | | | | | | |
| Canadian fixed-income funds (c) | | | 17.5 | | | | | | | | | | | | 14.2 | | | | | | | | | | | | 17.9 | | | | | | | | | | | | 17.5 | | | | | | | | | |
| European fixed-income funds (d) | | | 3.7 | | | | | | | | | | | | 3.4 | | | | | | | | | | | | 5.9 | | | | | | | | | | | | 3.7 | | | | | | | | | |
| High-yield (e) | | | 8.2 | | | | | | | | | | | | 7.6 | | | | | | | | | | | | 9.9 | | | | | | | | | | | | 8.2 | | | | | | | | | |
| Emerging markets (f) | | | 4.5 | | | | | | | | | | | | 4.2 | | | | | | | | | | | | 5.5 | | | | | | | | | | | | 4.5 | | | | | | | | | |
| Long-duration (g) | | | 53.5 | | | | | | | | | | | | 48.4 | | | | | | | | | | | | 63.9 | | | | | | | | | | | | 53.5 | | | | | | | | | |
| Total fixed-income securities | | | 111.1 | | | | 52 | | | | 52 | | | | 100.5 | | | | 53 | | | | 53 | | | | 132.0 | | | | 57 | | | | 55 | | | | 111.1 | | | | 52 | | | | 52 | |
| Other types of investments: | | | | | | | | | | | | | | | | | | | | | | | | | | | | | | | | | | | | | | | | | | | | | | | | |
| Convertible securities (h) | | | 7.4 | | | | | | | | | | | | 6.3 | | | | | | | | | | | | 7.3 | | | | | | | | | | | | 7.4 | | | | | | | | | |
| Other | | | 6.5 | | | | | | | | | | | | 5.5 | | | | | | | | | | | | 3.6 | | | | | | | | | | | | 6.5 | | | | | | | | | |
| Total other types of investments | | | 13.9 | | | | 5 | | | | - | | | | 11.8 | | | | 7 | | | | - | | | | 10.9 | | | | 5 | | | | 5 | | | | 13.9 | | | | 5 | | | | - | |
| Total | | $ | 218.6 | | | | 100 | | | | 100 | | | | 188.9 | | | | 100 | | | | 100 | | | $ | 230.5 | | | | 100 | | | | 100 | | | | 218.6 | | | | 100 | | | | 100 | |
| (a) | These categories are comprised of equity index actively managed funds that track various indices such as S&P 500 Composite Total Return Index, Russell 1000 and 2000 Indices, MSCI Europe Ex-UK Index, S&P/TSX Total Return Index, MSCI EAFE Index and others. |
| (b) | This category represents investment-grade corporate bonds of U.S. and European issuers from diverse industries. |
| (c) | This category seeks to achieve a return that exceeds the Scotia Capital Markets Universe Bond Index. |
| (d) | This category is designed to generate income and exhibit volatility similar to that of the Sterling denominated bond market. This category primarily invests in investment grade or better securities. |
| (e) | This category consists of global high-yield bonds. This category invests in lower rated and unrated fixed income, floating rate and other debt securities issued by European and American companies. |
| (f) | This category consists of a diversified portfolio of listed and unlisted debt securities issued by governments, financial institutions, companies or other entities domiciled in emerging market countries. |
| (g) | This category is designed to achieve a return consistent with holding longer term debt instruments. This category invests in interest rate and inflation derivatives, government-issued bonds, real-return bonds, and futures contracts. |
| (h) | This category invests in convertible securities of global issuers from diverse industries. |
Asset allocation strategies for our non-U.S. plans are designed to accumulate a diversified portfolio among markets and asset classes in order to reduce market risk and increase the likelihood that pension assets are available to pay benefits as they are due. Assets of non-U.S. pension plans are invested primarily using actively managed accounts. The weighted-average asset allocation targets are listed in the table below,above, and reflect limitations on types of investments held and allocations among assets classes, as required by local regulation or market practice of the country where the assets are invested. Most of the investments of our non-U.S. retirement plans can be redeemed at least monthly, except for a portion of “Other” in the belowabove table, which can be redeemed quarterly or are in the pr ocessprocess of liquidation.
Changes in 20092010 and 20102011 of plan assets measured at fair value using significant unobservable inputs (Level 3) for our retirement plans are as follows:
| (In millions) | | U.S. Pension Plans | | | UMWA Plans | | | Non-U.S. Pension Plans | | | U.S. Pension Plans | | | UMWA Plans | | | Non-U.S. Pension Plans | |
| | | | | | | | | | | | | | | | | | | |
| Balance at December 31, 2008 | | $ | - | | | | - | | | | 3.3 | | |
| Balance at December 31, 2009 | | | $ | 87.3 | | | | 40.0 | | | | 1.5 | |
| Actual return on plan assets: | | | | | | | | | | | | | | | | | | | | | | | | |
| Relating to assets still held at the reporting date | | | 3.5 | | | | 1.8 | | | | (1.8 | ) | | | 1.3 | | | | 0.4 | | | | (0.4 | ) |
| Relating to assets sold during the period | | | - | | | | - | | | | - | | | | - | | | | - | | | | - | |
| Purchases, sales and settlements | | | 83.8 | | | | 38.2 | | | | - | | |
| Purchases, sales and settlements, net | | | | 9.5 | | | | - | | | | (0.3 | ) |
| Transfers in and/or out of Level 3 | | | - | | | | - | | | | - | | | | - | | | | - | | | | - | |
| Balance at December 31, 2009 | | | 87.3 | | | | 40.0 | | | | 1.5 | | |
| Balance at December 31, 2010 | | | | 98.1 | | | | 40.4 | | | | 0.8 | |
| | | | | | | | | | | | | | | | | | | | | | | | | |
| Actual return on plan assets: | | | | | | | | | | | | | | | | | | | | | | | | |
| Relating to assets still held at the reporting date | | | 1.3 | | | | 0.4 | | | | (0.4 | ) | | | (1.3 | ) | | | (0.5 | ) | | | - | |
| Relating to assets sold during the period | | | - | | | | - | | | | - | | | | - | | | | - | | | | (0.2 | ) |
| Purchases, sales and settlements | | | 9.5 | | | | - | | | | (0.3 | ) | |
| Purchases, sales and settlements, net | | | | - | | | | - | | | | - | |
| Transfers in and/or out of Level 3 | | | - | | | | - | | | | | | | | - | | | | - | | | | - | |
| Balance at December 31, 2010 | | $ | 98.1 | | | | 40.4 | | | | 0.8 | | |
| Balance at December 31, 2011 | | | $ | 96.8 | | | | 39.9 | | | | 0.6 | |
Multi-employer Pension Plans
We contribute to multi-employer pension plans in a few of our non-U.S. subsidiaries. Due to the improvement in the funded status of the plans, we do not have any multi-employer pension expense for continuing operations in 2011. Multi-employer pension expense was $2.3 million in 2010 and $2.1 million in 2009.
Savings Plans
We sponsor various defined contribution plans to help eligible employees provide for retirement. We record expense for amounts that we contribute on behalf of employees, usually in the form of matching contributions. Our expense related to these plans is as follows:
| (In millions) | | | | | | | | | |
| Years Ended December 31, | | 2011 | | | 2010 | | | 2009 | |
| | | | | | | | | | |
| U.S. 401(K) | | $ | 16.9 | | | | 16.3 | | | | 13.4 | |
| Other plans | | | 3.9 | | | | 4.0 | | | | 3.4 | |
| Total | | $ | 20.8 | | | | 20.3 | | | | 16.8 | |
| | | Years Ended December 31, | |
| (In millions) | | 2010 | | | 2009 | | | 2008 | |
| | | | | | | | | | |
| Income (loss) from continuing operations before income taxes | | | | | | | | | |
| | | | | | | | | | |
| U.S. | | $ | (2.0 | ) | | | 37.0 | | | | 25.8 | |
| Foreign | | | 141.6 | | | | 129.3 | | | | 198.8 | |
| Income from continuing operations before income taxes | | $ | 139.6 | | | | 166.3 | | | | 224.6 | |
| | | | | | | | | | | | | |
| Income tax expense (benefit) from continuing operations | | | | | | | | | | | | |
| | | | | | | | | | | | | |
| Current tax expense (benefit) | | | | | | | | | | | | |
| U.S. federal | | $ | 4.3 | | | | (29.1 | ) | | | 2.2 | |
| State | | | 0.2 | | | | (0.8 | ) | | | 1.6 | |
| Foreign | | | 64.9 | | | | 59.8 | | | | 69.2 | |
| Current tax expense | | | 69.4 | | | | 29.9 | | | | 73.0 | |
| | | | | | | | | | | | | |
| Deferred tax expense (benefit) | | | | | | | | | | | | |
| U.S. federal | | | (7.8 | ) | | | (72.3 | ) | | | 3.9 | |
| State | | | - | | | | (8.1 | ) | | | 4.6 | |
| Foreign | | | 5.5 | | | | (10.6 | ) | | | (28.5 | ) |
| Deferred tax benefit | | | (2.3 | ) | | | (91.0 | ) | | | (20.0 | ) |
| Income tax expense (benefit) of continuing operations | | $ | 67.1 | | | | (61.1 | ) | | | 53.0 | |
| | | Years Ended December 31, | |
| (In millions) | | 2011 | | | 2010 | | | 2009 | |
| | | | | | | | | | |
| Income (loss) from continuing operations before income taxes | | | | | | | | | |
| U.S. | | $ | (27.0 | ) | | | (2.0 | ) | | | 37.0 | |
| Foreign | | | 183.4 | | | | 141.6 | | | | 129.3 | |
| Income from continuing operations before income taxes | | $ | 156.4 | | | | 139.6 | | | | 166.3 | |
| Income tax expense (benefit) from continuing operations | | | | | | | | | |
| Current tax expense (benefit) | | | | | | | | | |
| U.S. federal | | $ | 3.0 | | | | 4.3 | | | | (29.1 | ) |
| State | | | (0.1 | ) | | | 0.2 | | | | (0.8 | ) |
| Foreign | | | 87.9 | | | | 64.9 | | | | 59.8 | |
| Current tax expense | | | 90.8 | | | | 69.4 | | | | 29.9 | |
| | | | | | | | | | | | | |
| Deferred tax expense (benefit) | | | | | | | | | | | | |
| U.S. federal | | | (21.3 | ) | | | (7.8 | ) | | | (72.3 | ) |
| State | | | (1.0 | ) | | | - | | | | (8.1 | ) |
| Foreign | | | (9.1 | ) | | | 5.5 | | | | (10.6 | ) |
| Deferred tax benefit | | | (31.4 | ) | | | (2.3 | ) | | | (91.0 | ) |
| Income tax expense (benefit) of continuing operations | | $ | 59.4 | | | | 67.1 | | | | (61.1 | ) |
| | | Years Ended December 31, | | | Years Ended December 31, | |
| (In millions) | | 2010 | | | 2009 | | | 2008 | | | 2011 | | | 2010 | | | 2009 | |
| | | | | | | | | | | | | | | | | | | |
| Comprehensive provision (benefit) for income taxes allocable to | | | | | | | | | | | | | | | | | | |
| | | | | | | | | | | |
| Continuing operations | | $ | 67.1 | | | | (61.1 | ) | | | 53.0 | | | $ | 59.4 | | | | 67.1 | | | | (61.1 | ) |
| Discontinued operations | | | (3.4 | ) | | | 2.3 | | | | 45.8 | | | | 0.7 | | | | (3.4 | ) | | | 2.3 | |
| Other comprehensive income (loss) | | | (16.1 | ) | | | 10.6 | | | | (33.3 | ) | | | (74.4 | ) | | | (16.1 | ) | | | 10.6 | |
| Shareholders’ equity | | | (0.7 | ) | | | (0.1 | ) | | | (13.3 | ) | |
| Equity | | | | (1.1 | ) | | | (0.7 | ) | | | (0.1 | ) |
| Comprehensive provision (benefit) for income taxes | | $ | 46.9 | | | | (48.3 | ) | | | 52.2 | | | $ | (15.4 | ) | | | 46.9 | | | | (48.3 | ) |
Rate Reconciliation
The following table reconciles the difference between the actual tax rate on continuing operations and the statutory U.S. federal income tax rate of 35%.
| | | Years Ended December 31, | | | Years Ended December 31, | |
| (In percentages) | | 2010 | | | 2009 | | | 2008 | | | 2011 | | | 2010 | | | 2009 | |
| | | | | | | | | | | | | | | | | | | |
| U.S. federal tax rate | | | 35.0 | % | | | 35.0 | % | | | 35.0 | % | | | 35.0 | % | | | 35.0 | % | | | 35.0 | % |
| Increases (reductions) in taxes due to: | | | | | | | | | | | | | | | | | | | | | | | | |
Adjustments to valuation allowances | | | 10.5 | | | | (68.2 | ) | | | (6.1 | ) | | | (0.8 | ) | | | 10.5 | | | | (68.2 | ) |
Foreign income taxes | | | (7.4 | ) | | | (3.5 | ) | | | (5.8 | ) | | | 2.1 | | | | (7.4 | ) | | | (3.5 | ) |
Medicare subsidy for retirement plans | | | 9.8 | | | | (0.9 | ) | | | (0.8 | ) | | | - | | | | 9.8 | | | | (0.9 | ) |
Tax settlement | | | (5.0 | ) | | | - | | | | - | | | | - | | | | (5.0 | ) | | | - | |
French business tax (a) | | | 2.8 | | | | - | | | | - | | | | 2.8 | | | | 2.8 | | | | - | |
Nontaxable acquisition-related (gains) losses | | | 2.1 | | | | (2.9 | ) | | | - | | | | (0.5 | ) | | | 2.1 | | | | (2.9 | ) |
Taxes on undistributed earnings of foreign affiliates | | | 1.1 | | | | (1.1 | ) | | | 1.5 | | | | 0.2 | | | | 1.1 | | | | (1.1 | ) |
State income taxes, net | | | (0.4 | ) | | | 0.2 | | | | (0.5 | ) | | | (0.7 | ) | | | (0.4 | ) | | | 0.2 | |
| Nondeductible repatriation charge | | | - | | | | 4.7 | | | | - | | | | - | | | | - | | | | 4.7 | |
Other | | | (0.5 | ) | | | - | | | | 0.3 | | | | (0.1 | ) | | | (0.5 | ) | | | - | |
| Actual income tax rate on continuing operations | | | 48.0 | % | | | (36.7 | )% | | | 23.6 | % | | | 38.0 | % | | | 48.0 | % | | | (36.7 | ) % |
| (a) | Effective January 1, 2010, a French business tax previously reported as a pre-taxpretax expense is reported as income tax expense due to the application of GAAP rulestax being changed from an asset-based tax to that tax regime after French legislative changes.an income-based tax. |
Components of Deferred Tax Assets and Liabilities
| | | December 31, | | | December 31, | |
| (In millions) | | 2010 | | | 2009 | | | 2011 | | | 2010 | |
| | | | | | | | | | | | | |
| Deferred tax assets | | | | | | | | | | | | |
| Retirement benefits other than pensions | | $ | 82.0 | | | | 81.9 | | | $ | 112.7 | | | | 82.0 | |
| Pension liabilities | | | 91.2 | | | | 70.2 | | | | 138.3 | | | | 91.2 | |
| Workers’ compensation and other claims | | | 33.2 | | | | 37.0 | | | | 42.8 | | | | 33.2 | |
| Property and equipment, net | | | 0.4 | | | | 1.4 | | | | 0.2 | | | | 0.4 | |
| Other assets and liabilities | | | 99.7 | | | | 70.0 | | | | 106.8 | | | | 99.7 | |
| Net operating loss carryforwards | | | 38.6 | | | | 47.3 | | | | 44.9 | | | | 38.6 | |
| Alternative minimum and other tax credits (a) | | | 46.8 | | | | 28.5 | | | | 37.7 | | | | 46.8 | |
| Subtotal | | | 391.9 | | | | 336.3 | | | | 483.4 | | | | 391.9 | |
| Valuation allowances | | | (45.9 | ) | | | (45.4 | ) | | | (43.9 | ) | | | (45.9 | ) |
| Total deferred tax assets | | | 346.0 | | | | 290.9 | | | | 439.5 | | | | 346.0 | |
| | | | | | | | | | | | | | | | | |
| Deferred tax liabilities | | | | | | | | | | | | | | | | |
| Property and equipment, net | | | 10.6 | | | | 6.0 | | | | 12.5 | | | | 10.6 | |
| Other assets and miscellaneous | | | 45.8 | | | | 24.4 | | | | 37.0 | | | | 45.8 | |
| Deferred tax liabilities | | | 56.4 | | | | 30.4 | | | | 49.5 | | | | 56.4 | |
| Net deferred tax asset | | $ | 289.6 | | | | 260.5 | | | $ | 390.0 | | | | 289.6 | |
| | | | | | | | | | | | | | | | | |
| Included in: | | | | | | | | | | | | | | | | |
Current assets | | $ | 48.3 | | | | 38.5 | | | $ | 66.4 | | | | 48.3 | |
Noncurrent assets | | | 276.0 | | | | 254.1 | | | | 350.8 | | | | 276.0 | |
Current liabilities, included in accrued liabilities | | | (4.1 | ) | | | (1.6 | ) | | | (4.2 | ) | | | (4.1 | ) |
Noncurrent liabilities | | | (30.6 | ) | | | (30.5 | ) | | | (23.0 | ) | | | (30.6 | ) |
| Net deferred tax asset | | $ | 289.6 | | | | 260.5 | | | $ | 390.0 | | | | 289.6 | |
| (a) | U.S. alternative minimum tax credits of $37.8$36.8 million have an unlimited carryforward period U.S. foreign tax credits of $8.6 million expire in 2021, and the remaining credits of $0.4$0.9 million have various carryforward periods. |
Valuation Allowances
Valuation allowances relate to deferred tax assets in various federal, state and non-U.S. jurisdictions. Based on our historical and expected future taxable earnings, and a consideration of available tax-planning strategies, management believeswe believe it is more likely than not that we will realize the benefit of the existing deferred tax assets, net of valuation allowances, at December 31, 2010.2011.
| | | Years Ended December 31, | | | Years Ended December 31, | |
| (In millions) | | 2010 | | | 2009 | | | 2008 | | | 2011 | | | 2010 | | | 2009 | |
| | | | | | | | | | | | | | | | | | | |
| Valuation allowances: | | | | | | | | | | | | | | | | | | |
Beginning of year | | $ | 45.4 | | | | 183.6 | | | | 56.0 | | | $ | 45.9 | | | | 45.4 | | | | 183.6 | |
Expiring tax credits | | | (0.6 | ) | | | (0.7 | ) | | | (0.7 | ) | | | (0.3 | ) | | | (0.6 | ) | | | (0.7 | ) |
Acquisitions and dispositions | | | (10.0 | ) | | | 0.3 | | | | (0.1 | ) | | | 0.3 | | | | (10.0 | ) | | | 0.3 | |
Changes in judgment about deferred tax assets (a) | | | (0.9 | ) | | | (119.8 | ) | | | (11.0 | ) | | | (8.2 | ) | | | (0.9 | ) | | | (119.8 | ) |
Other changes in deferred tax assets, charged to: | | | | | | | | | | | | | | | | | | | | | | | | |
Income from continuing operations | | | 14.9 | | | | 7.1 | | | | (2.2 | ) | | | 7.6 | | | | 14.9 | | | | 7.1 | |
Income from discontinued operations | | | (1.1 | ) | | | 1.7 | | | | - | | | | - | | | | (1.1 | ) | | | 1.7 | |
Other comprehensive income (loss) (b) | | | 0.1 | | | | (28.3 | ) | | | 148.2 | | | | - | | | | 0.1 | | | | (28.3 | ) |
Foreign currency exchange effects | | | (1.9 | ) | | | 1.5 | | | | (6.6 | ) | | | (1.4 | ) | | | (1.9 | ) | | | 1.5 | |
End of year | | $ | 45.9 | | | | 45.4 | | | | 183.6 | | | $ | 43.9 | | | | 45.9 | | | | 45.4 | |
| (a) | Changes in judgment about valuation allowances are based on a recognition threshold of “more-likely-than-not.”Amounts are based on beginning-of-year balances of deferred tax assets that could potentially be realized in future years. Amounts are recognized in income from continuing operations. In 2009, includes $117.8 million related to U.S. federal and state income taxes. |
| (b) | In 2008, includes $145.5 million related to U.S. retirement plans’ net experience losses incurred in 2008 that were not deemed to be more likely than not of being realized. In 2009, includes a $25.4 million reversal related to net experience gains of U.S. retirement plans recognized in 2009. |
Undistributed Foreign Earnings
As of December 31, 2010,2011, we have not recorded U.S. federal deferred income taxes on approximately $410$318 million of undistributed earnings of foreign subsidiaries and equity affiliates. It is expected that these earnings will be permanently reinvested in operations outside the U.S. It is not practical to compute the estimated deferred tax liability on these earnings.
Net Operating Losses
The gross amount of the net operating loss carryforwards as of December 31, 2010,2011, was $156.2$255.4 million. The tax benefit of net operating loss carryforwards, before valuation allowances, as of December 31, 2010,2011, was $38.6$44.9 million, and expires as follows:
| (In millions) | | | Federal | | | State | | | Foreign | | | Total | |
| | | | | | | | | | | | | | |
| Year of expiration: | | | | | | | | | | | | | |
| | 2011-2015 | | | $ | - | | | | 0.8 | | | | 6.1 | | | | 6.9 | |
| | 2016-2020 | | | | - | | | | 0.6 | | | | 1.6 | | | | 2.2 | |
2021 and thereafter | | | | - | | | | 7.9 | | | | 0.2 | | | | 8.1 | |
Unlimited | | | | - | | | | - | | | | 21.4 | | | | 21.4 | |
| | | | | $ | - | | | | 9.3 | | | | 29.3 | | | | 38.6 | |
| | (In millions) | Federal | | State | | Foreign | | Total | |
| | | | | | | | | | | | | | | | |
| | Years of expiration | | | | | | | | | | | | | |
| | | 2012-2016 | $ | - | | | 0.5 | | | 3.7 | | | 4.2 | | |
| | | 2017-2021 | | - | | | 0.1 | | | 6.8 | | | 6.9 | | |
| | | 2022 and thereafter | | - | | | 8.0 | | | 2.8 | | | 10.8 | | |
| | | Unlimited | | - | | | - | | | 23.0 | | | 23.0 | | |
| | | | $ | - | | | 8.6 | | | 36.3 | | | 44.9 | | |
Uncertain Tax Positions
A reconciliation of the beginning and ending amount of unrecognized tax benefits is as follows:
| | | Years Ended December 31, | | | Years Ended December 31, | |
| (In millions) | | 2010 | | | 2009 | | | 2008 | | | 2011 | | | 2010 | | | 2009 | |
| | | | | | | | | | | | | | | | | | | |
| Uncertain tax positions: | | | | | | | | | | | | | | | | | | |
Beginning of year | | $ | 19.0 | | | | 19.3 | | | | 25.5 | | | $ | 19.4 | | | | 19.0 | | | | 19.3 | |
Increases related to prior-year tax positions | | | 0.1 | | | | 1.0 | | | | 0.1 | | | | 0.8 | | | | 0.1 | | | | 1.0 | |
Decreases related to prior-year tax positions | | | (1.3 | ) | | | (1.0 | ) | | | (0.6 | ) | | | (1.6 | ) | | | (1.3 | ) | | | (1.0 | ) |
Increases related to current-year tax positions | | | 1.9 | | | | 1.3 | | | | 2.6 | | | | 1.3 | | | | 1.9 | | | | 1.3 | |
Settlements | | | (7.0 | ) | | | (0.4 | ) | | | (1.3 | ) | | | - | | | | (7.0 | ) | | | (0.4 | ) |
Effect of the expiration of statutes of limitation | | | (1.6 | ) | | | (1.2 | ) | | | (2.0 | ) | | | (1.2 | ) | | | (1.6 | ) | | | (1.2 | ) |
Increases (decreases) related to business combinations and dispositions | | | 8.3 | | | | - | | | | (5.0 | ) | | | (0.7 | ) | | | 8.3 | | | | - | |
| Foreign currency exchange effects | | | | (0.8 | ) | | | - | | | | - | |
End of year | | $ | 19.4 | | | | 19.0 | | | | 19.3 | | | $ | 17.2 | | | | 19.4 | | | | 19.0 | |
Included in the balance of unrecognized tax benefits at December 31, 2010,2011, are potential benefits of approximately $16.3$14.9 million that, if recognized, will reduce the effective tax rate on income from continuing operations. Also included in the balance of unrecognized tax benefits at December 31, 2010,2011, are benefits of approximately $1.1$0.8 million that, if recognized, will reduce the effective tax rate on income from discontinued operations.
We recognize accrued interest and penalties related to unrecognized tax benefits in income tax expense. Interest and penalties included in income tax expense amounted to $1.2 million in 2011, $1.1 million in 2010, and $0.9 million in both 2009 and 2008.2009. We had accrued penalties and interest of $5.9 million at December 31, 2011, and $4.5 million at December 31, 2010, and $2.8 million at December 31, 2009.2010.
We file income tax returns in the U.S. federal and various state and foreign jurisdictions. With a few exceptions, as of December 31, 2010,2011, we were no longer subject to U.S. federal, state and local, or non-U.S. income tax examinations by tax authorities for years before 2006.2008. Additionally, due to statute of limitations expirations and audit settlements, it is reasonably possible that approximately $1.6$3.3 million of currently remaining unrecognized tax positions each of which are individually insignificant, may be recognized by the end of 2011.
2012.
Note 5 – Property and Equipment
The following table presents our property and equipment that is classified as held and used:
| | | December 31, | | | December 31, | |
| (In millions) | | 2010 | | | 2009 | | |
| (In Millions) | | | 2011 | | | 2010 | |
| | | | | | | | | | | | | |
| Land | | $ | 76.1 | | | | 32.4 | | | $ | 69.5 | | | | 76.1 | |
| Buildings | | | 210.6 | | | | 178.9 | | | | 232.8 | | | | 210.6 | |
| Leasehold improvements | | | 196.4 | | | | 181.8 | | | | 203.7 | | | | 196.4 | |
| Vehicles | | | 347.0 | | | | 297.2 | | | | 389.5 | | | | 349.7 | |
| Capitalized software (a) | | | 116.3 | | | | 109.0 | | | | 147.8 | | | | 116.3 | |
| Other machinery and equipment | | | 583.0 | | | | 535.0 | | | | 628.3 | | | | 580.3 | |
| | | | 1,529.4 | | | | 1,334.3 | | | | 1,671.6 | | | | 1,529.4 | |
| Accumulated depreciation and amortization | | | (830.5 | ) | | | (784.8 | ) | | | (922.4 | ) | | | (830.5 | ) |
| Property and equipment, net | | $ | 698.9 | | | | 549.5 | | | $ | 749.2 | | | | 698.9 | |
(a) Amortization of capitalized software costs included in continuing operations was $12.8 million in 2010, $13.6 million in 2009 and $14.2 million in 2008.| (a) | Amortization of capitalized software costs included in continuing operations was $15.9 million in 2011, $12.8 million in 2010 and $13.6 million in 2009. |
We acquired security operations in various countries over the last three years. We accounted for the acquisitions as business combinations using the acquisition method. Under the acquisition method of accounting, assets acquired and liabilities assumed from these operations are recorded at fair value on the date of acquisition. The consolidated statements of income include the results of operations for each acquired entity from the date of acquisition.
Businesses acquired in 2012
We acquired Kheops, SAS, a provider of logistics software and related services, for approximately $17 million in January 2012. This acquisition gives us proprietary control of software used primarily in our cash-in-transit and money processing operations in France.
Businesses acquired in 2011
There were no significant acquisitions in 2011.
Businesses acquired in 2010
Servicio Pan Americano de Proteccion, S.A. de C.V.
Mexican Cash in Transit (“CIT”), ATM and money processing business
On November 17, 2010, we acquired a controlling interest in Servicio Pan Americano de Proteccion, S.A. de C.V. (“SPP”) for $59.8 million in cash. In 2011, this purchase price was reduced for final working capital adjustments to $58.7 million. We previously owned a 20.86% interest in SPP and we acquired an additional 78.89% of the outstanding shares through our existing Mexican ownership structure. In compliance with Mexican law, the remaining 0.25% noncontrolling interest is held by a third-party Mexican company.trust. SPP is the largest secure logistics company in Mexico and this acquisition expands our operations in one of the world’s largest CIT markets. SPP has approximately 12,000 full-time and contract employees, 80 branches and 1,350 armored vehicles across its nationwide network of CIT, ATM and money processing operations.
We recognized a loss of $13.7 million in 2010 on the conversion from the cost method of accounting to consolidation. The loss represents the difference between the fair value and the book value of our previously held 20.86% investment as of the acquisition date. The 2010 loss was included in other operating income of non-segment income (expense). The fair value of the previously held noncontrolling interest in SPP, a private entity, was estimated to be $9.7 million by applying a market approach. This fair value measurement is based on significant inputs that are not observable in the market and thus represents a Level 3 measurement as described in ASC 820 Fair Value Measurements and Disclosures, Section 820-10-35. Key assumptions include adjustments because of the lack of control and lack of mar ketabilitymarketability that market participants would consider when estimating the fair value of the noncontrolling interest in SPP. The lack of marketability discount was determined using a Black-Scholes put option model and the discount for lack of control was determined based on identified control premiums on recent comparable transactions.
We also recognized a $5.1 million bargain purchase gain in 2010 related to acquisition of the additional 78.89% ownership interest in SPP. In 2011, when we completed purchase accounting, we recognized an additional $2.1 million bargain purchase gain. The gain is equal to the difference between the fair value of the net assets acquired and the fair value of the purchase consideration (see table below). TheIn both 2010 and 2011, the gain was included in other operating income of non-segment income (expense).
During 2010, we provisionally estimated fair values for the assets purchased and liabilities assumed as of the date of the acquisition in the following table. The determination of estimated fair value required management to makeacquisition. We made significant estimates and assumptions.assumptions to estimate the fair values. The amounts reported arewere considered provisional as we arewere completing the valuations that arevaluation work required to allocate the purchase price, as a result,price. We finalized the allocation ofanalysis in 2011 and present the adjustments to the purchase price and the amount of the bargain purchase gain may change in the future.accounting adjustments below.
| | | Estimated Fair | |
| | | Value at | |
| (In millions) | | November 17, 2010 | |
| | | | |
| Fair value of purchase consideration | | | |
| | | | |
| Cash paid for 78.89% of shares | | $ | 59.8 | |
| Fair value of noncontrolling interest | | | 0.1 | |
| Fair value of previously held 20.86% noncontrolling interest | | | 9.7 | |
| Fair value of purchase consideration | | $ | 69.6 | |
| | | | | |
| Fair value of net assets acquired | | | | |
| | | | | |
| Cash | | $ | 12.2 | |
| Accounts receivable | | | 58.8 | |
| Other current assets | | | 12.3 | |
| Property and equipment, net | | | 106.4 | |
| Indefinite-lived intangible asset (trade name) | | | 12.1 | |
| Other noncurrent assets | | | 18.7 | |
| Current liabilities | | | (75.1 | ) |
| Noncurrent liabilities | | | (70.7 | ) |
| Fair value of net assets acquired | | $ | 74.7 | |
| | | Estimated Fair | | | Purchase | | | Revised Fair | |
| | | Value at | | | Price | | | Value as of | |
| (In millions) | | November 17, 2010 | | | Adjustments (a) | | | November 17, 2010 | |
| | | | | | | | | | |
| Fair value of purchase consideration | | | | | | | | | |
| Cash paid for 78.89% of shares | | $ | 59.8 | | | | (1.1 | ) | | | 58.7 | |
| Fair value of noncontrolling interest | | | 0.1 | | | | (0.1 | ) | | | - | |
| Fair value of previously held 20.86% noncontrolling interest | | | 9.7 | | | | - | | | | 9.7 | |
| Fair value of purchase consideration | | $ | 69.6 | | | | (1.2 | ) | | | 68.4 | |
| (a) | In accordance with the purchase agreement, the purchase price was adjusted subsequent to closing based on the working capital held as of the acquisition date. |
| | | Amounts Recognized as of | | | Measurement | | | Amounts Recognized as of | |
| | | Acquisition Date | | | Period | | | Acquisition Date | |
| (In millions) | | (Provisional) (a) | | | Adjustments (b) | | | (Final) | |
| | | | | | | | | | |
| Fair value of net assets acquired | | | | | | | | | |
| | | | | | | | | | |
| Cash | | $ | 12.2 | | | | (0.1 | ) | | | 12.1 | |
| Accounts receivable | | | 58.8 | | | | - | | | | 58.8 | |
| Other current assets | | | 12.3 | | | | (0.9 | ) | | | 11.4 | |
| Property and equipment, net | | | 106.4 | | | | - | | | | 106.4 | |
| Indefinite-lived intangible asset (trade name) | | | 12.1 | | | | - | | | | 12.1 | |
| Other noncurrent assets | | | 18.7 | | | | - | | | | 18.7 | |
| Current liabilities | | | (75.1 | ) | | | (0.8 | ) | | | (75.9 | ) |
| Noncurrent liabilities | | | (70.7 | ) | | | 2.7 | | | | (68.0 | ) |
| Fair value of net assets acquired | | | 74.7 | | | | 0.9 | | | | 75.6 | |
| Less: Fair value of purchase consideration | | | 69.6 | | | | (1.2 | ) | | | 68.4 | |
| Bargain purchase gain | | $ | 5.1 | | | | 2.1 | | | | 7.2 | |
| (a) | As previously reported in Brink’s 2010 Annual Report on Form 10-K. |
| (b) | These measurement period adjustments were recorded to reflect changes in the estimated fair value of the associated assets and liabilities and better reflect market participant assumptions about facts and circumstances existing as of the acquisition date. The measurement period adjustments did not result from events after the acquisition date. We have not recast the acquisition adjustments to the 2010 financial statements as we do not consider them material. |
Threshold
Canadian payment solutions provider
On December 23, 2010, we acquired Threshold Financial Technologies Inc. (“Threshold”) from Versent Corporation for $38.8 million. Based in Mississauga, Canada, Threshold is a leading provider of payments solutions, specializing in managed ATM and transaction processing services for financial institutions and retailers throughout Canada. Threshold’s annual revenue is approximately $48 million, about half of which is generated by providing outsourced ATM network administration and transaction processing solutions. The company, which employs approximately 125 people, also owns and operates a network of private-label ATMs in Canada.
We haveDuring 2010, we provisionally estimated fair values for the assets purchased and liabilities assumed as of the date of the acquisition in the following table. The determination of estimated fair value required management to makeacquisition. We made significant estimates and assumptions.assumptions to estimate the fair values. The amounts reported arewere considered provisional as we arewere completing the valuations that arevaluation work required to allocate the purchase price, as a result,price. We finalized the allocation ofanalysis in 2011 and present the adjustments to the purchase price and the amount of goodwill and intangibles may change in the future.accounting adjustments below.
| | | Estimated Fair | | | Amounts Recognized as of | | | Measurement | | | Amounts Recognized as of | |
| | | Value at | | | Acquisition Date | | | Period | | | Acquisition Date | |
| (In millions) | | December 23, 2010 | | | (Provisional) (a) | | | Adjustments (b) | | | (Final) | |
| | | | | |
| Fair value of net assets acquired | | | | |
| | | | | | | | | | | | | |
| Cash | | $ | 0.5 | | | $ | 0.5 | | | | - | | | | 0.5 | |
| Accounts receivable | | | 5.0 | | | | 5.0 | | | | - | | | | 5.0 | |
| Other current assets | | | 2.5 | | | | 2.5 | | | | - | | | | 2.5 | |
| Property and equipment, net | | | 10.6 | | | | 10.6 | | | | 5.8 | | | | 16.4 | |
| Intangible assets (b) | | | 16.3 | | |
| Goodwill (a) | | | 12.9 | | |
| Identifiable intangible assets | | | | 16.3 | | | | (5.1 | ) | | | 11.2 | |
| Goodwill (c) | | | | 12.9 | | | | 0.4 | | | | 13.3 | |
| Current liabilities | | | (4.2 | ) | | | (4.2 | ) | | | (0.8 | ) | | | (5.0 | ) |
| Noncurrent liabilities | | | (4.8 | ) | | | (4.8 | ) | | | (0.3 | ) | | | (5.1 | ) |
| Fair value of net assets acquired | | $ | 38.8 | | | $ | 38.8 | | | | - | | | | 38.8 | |
| (a) | As previously reported in Brink’s 2010 Annual Report on Form 10-K. |
| (b) | These measurement period adjustments were recorded to reflect changes in the estimated fair value of the associated assets and liabilities and better reflect market participant assumptions about facts and circumstances existing as of the acquisition date. The measurement period adjustments did not result from events after the acquisition date. We have not recast the acquisition adjustments to the 2010 financial statements as we do not consider them material. |
| (c) | Consists of intangible assets that do not qualify for separate recognition, combined with synergies expected from integrating Threshold’s operations into our existing Canadian operations. All of the goodwill has been assigned to the North America reporting unit and is not expected to be deductible for tax purposes. |
(b) | Intangible assets are primarily comprised of customer relationships and software. Final allocation will be determined once the valuation is complete. |
Other acquisitions in 2010
On March 1, 2010, we acquired Est Valeurs S.A., a provider of CIT and cash services in Eastern France. Est Valeurs employs approximately 100 people and had 2009 revenue of $13 million.
On April 22, 2010, we acquired a majority stake in a Russian cash processing business that complements the company’s existing Russian CIT business. With principal operations in Moscow and approximately 500 employees, the operations offer a full range of CIT, ATM, money processing and Global Services operations for domestic and international markets.
Businesses acquired in 2009
Sebival
Brazilian CIT and payment processing business
On January 8, 2009, we acquired 100% of the capital stock and voting interests in Sebival-Seguranca Bancaria Industrial e de Valores Ltda. and Setal Servicos Especializados, Tecnicos e Auxiliares Ltda. (“Sebival”) for $47.6 million in cash. Both of the businesses which comprise Sebival were controlled by the same owner and the acquisition expands our operations into the mid-western region of Brazil. Acquisition-related costs were $0.8 million and were included in selling, general and administrative expenses in our consolidated statement of income for the year ended December 31, 2008.
During 2009, we had provisionally estimated fair values for the assets purchased and liabilities assumed as of the date of the acquisition. The determination of estimated fair value required management to make significant estimates and assumptions. The amounts reported were considered provisional as we were completing the valuation work required to allocate the purchase price. As of December 31, 2010, we have completed the analysis and consider purchase accounting to be final and have recast previously presented information as if all adjustments to the purchase price allocation had occurred at the date of acquisition.
| | | Amounts Recognized as of | |
| (In millions) | | Acquisition Date (a) | |
| | | | |
| Accounts receivable | | $ | 6.3 | |
| Other current assets | | | 4.9 | |
| Property and equipment, net | | | 5.3 | |
| Identifiable intangible assets | | | 19.2 | |
| Goodwill (b) | | | 24.4 | |
| Other noncurrent assets | | | 1.1 | |
| Current liabilities | | | (11.1 | ) |
| Noncurrent liabilities | | | (2.5 | ) |
| Total net assets acquired | | $ | 47.6 | |
(a) | As previously reported in Brink’s 2009 Annual Report on Form 10-K. No measurement period adjustments were recorded in 2010 and the acquisition date balance sheet is considered final. |
(b) | Consists of intangible assets that do not qualify for separate recognition, combined with synergies expected from integrating Sebival’s operations into our existing Brazilian operations. All of the goodwill has been assigned to the Latin America reporting unit and is expected to be deductible for tax purposes. |
Brink’s Arya
Indian CIT and Global Services business
On September 1, 2009, we acquired additional shares of Brink’s Arya (“Arya”) increasing our ownership in Arya from 40% to 78%. Arya is a cash handling and secure logistics company based in Mumbai, India, and this acquisition expands our presence in one of the largest cash services markets in Asia. The consideration paid for the additional 38% interest was approximately $22.2 million. We recognized a gain of $13.9 million on the conversion from the equity method of accounting to consolidation. The gain represents the difference between the fair value and the book value of our previously held 40% investment as of the acquisition date and was included in other operating income of non-segment income (expense).
In connection with the acquisition of 38% of Arya’s shares, we also agreed to purchase the remaining 22% of the shares we do not currently hold for approximately $12.8 million. This purchase is subject to the satisfaction of certain conditions and closing is anticipated by September 1, 2011. We accounted for Arya as 100% owned and have included the fixed purchase price in liabilities in our December 31, 2010 consolidated balance sheet.
During 2009, we had provisionally estimated fair values for the assets purchased and liabilities assumed as of the date of the acquisition. The determination of estimated fair value required management to make significant estimates and assumptions. The amounts reported were considered provisional as we were completing the valuation work required to allocate the purchase price. As of December 31, 2010, we have completed the analysis and consider purchase accounting to be final and have recast previously presented information as if all adjustments to the purchase price allocation had occurred at the date of acquisition.
| | | Estimated Fair | |
| | | Value at | |
| (In millions) | | September 1, 2009 | |
| | | | |
| Fair value of purchase consideration | | | |
| | | | |
| Cash paid for 38% of shares | | $ | 22.2 | |
| Fair value of previously held 40% noncontrolling interest | | | 20.0 | |
| Liability to purchase remaining 22% of shares | | | 12.8 | |
| Fair value of purchase consideration | | $ | 55.0 | |
| | | Amounts Recognized as of | | | Measurement | | | Amounts Recognized as of | |
| | | Acquisition Date | | | Period | | | Acquisition Date | |
| (In millions) | | (Provisional)(a) | | | Adjustments | | | (Final) | |
| | | | | | | | | | |
| Accounts receivable | | $ | 3.2 | | | | - | | | | 3.2 | |
| Other current assets (b) | | | 10.1 | | | | (0.2 | ) | | | 9.9 | |
| Property and equipment, net (b) | | | 2.5 | | | | (0.6 | ) | | | 1.9 | |
| Identifiable intangible assets (b) | | | 26.6 | | | | (8.1 | ) | | | 18.5 | |
| Goodwill (c) | | | 23.9 | | | | 6.8 | | | | 30.7 | |
| Current liabilities (b) | | | (2.0 | ) | | | (1.3 | ) | | | (3.3 | ) |
| Noncurrent liabilities (b) | | | (9.3 | ) | | | 3.4 | | | | (5.9 | ) |
| Total net assets acquired | | $ | 55.0 | | | | - | | | | 55.0 | |
(a) | As previously reported in Brink’s 2009 Annual Report on Form 10-K. |
| (b) These measurement period adjustments were recorded to reflect changes in the estimated fair value of the associated assets and liabilities and better reflect market participant assumptions about facts and circumstances existing as of the acquisition date. The measurement period adjustments did not result from events after the acquisition date. We have not recast the acquisition adjustments to the 2009 financial statements as we do not consider them material. |
(c) | Consists of intangible assets that do not qualify for separate recognition along with expected benefits from combining Arya into Brink’s operations. All of the goodwill has been assigned to the Asia-Pacific reporting unit and is not expected to be deductible for tax purposes. |
Other acquisitions in 2009
On January 31, 2009, we acquired 80% ownership of a secure logistics company based in Moscow, Russia. The relatively small acquisition increased our presence in a region that has long-term growth potential.
On February 24, 2009, we acquired a controlling interest in a Panama armored transportation operation, which was previously 49% owned. We recognized a gain of $0.5 million related to the step-up in basis of our previous ownership in this company and a gain of $0.5 million related to the bargain purchase of the remaining 51% interest. The total pretax gain resulting from this transaction of $1.0 million was recognized in our consolidated statements of income in other operating income of non-segment income (expense).
On September 4, 2009, we acquired a majority stake in ICD Limited (“ICD”), a commercial security services business in the Asia-Pacific region. ICD designs, installs, maintains and manages commercial security systems. With principal operations in China, ICD also has offices in Hong Kong, India, Singapore and Australia and employs approximately 200 people.
Pro Forma disclosures
The pro forma consolidated results of Brink’s presented below reflect a hypothetical ownership as of January 1, 2009, of the more significant businesses we acquired during the last two years.
| (In millions) | | Revenue | | | Net income attributable to Brink’s | |
| | | | | | | |
| Actual results included in the Brinks’ consolidated 2010 results for businesses | | | | | | |
| acquired in 2010 from the date of acquisition (a) | | $ | 51.7 | | | | 1.0 | |
| | | | �� | | | | | |
| Pro forma results of Brink’s for the year ended December 31 (b) | | | | | | | | |
2010 | | $ | 3,569.9 | | | | 66.9 | |
2009 | | | 3,523.4 | | | | 193.8 | |
(a) | Includes the actual results of SPP and Threshold. We have excluded the remaining 2010 acquisitions as the revenue and net income amounts are not considered significant to the disclosure. |
(b) | Pro forma results assume the SPP and Threshold acquisitions occurred on January 1, 2009. Pro forma net income attributable to Brink’s does not include the gains and losses related to the SPP and Arya acquisitions. Pro forma results for 2009 include pro forma results for Sebival and Arya, which were acquired in 2009. |
Note 7 – Goodwill and Other Intangible Assets
Goodwill and other intangible assets resulted from acquiring businesses. The changes in the carrying amount of goodwill and other intangible assets by reportable segment for the years ended December 31, 20102011 and 20092010 are as follows:
| | | December 31, 2010 | | | December 31, 2011 | |
| | | Beginning | | | | | | Amortization | | | | | | | | | Ending | | | Beginning | | | Acquisitions/ | | | Amortization | | | | | | | | | Ending | |
| (In millions) | | Balance | | | Acquisitions | | | Expense | | | Adjustments | | | Currency | | | Balance | | | Balance | | | Dispositions | | | Expense | | | Adjustments | | | Currency | | | Balance | |
| | | | | | | | | | | | | | | | | | | | | | | | | | | | | | | | | | | | | |
| International: | | | | | | | | | | | | | | | | | | | | | | | | | | | | | | | | | | | | |
| Goodwill | | $ | 206.5 | | | | 14.3 | | | | - | | | | 7.1 | | | | (3.9 | ) | | | 224.0 | | | $ | 224.0 | | | | 1.8 | | | | - | | | | (1.3 | ) | | | (13.2 | ) | | | 211.3 | |
| Other intangibles: | | | | | | | | | | | | | | | | | | | | | | | | | | | | | | | | | | | | | | | | | | | | | | | | |
| Customer relationships | | | 61.9 | | | | 2.3 | | | | (7.0 | ) | | | (8.3 | ) | | | 0.7 | | | | 49.6 | | | | 49.6 | | | | 2.3 | | | | (7.6 | ) | | | - | | | | (4.1 | ) | | | 40.2 | |
| Indefinite-lived trade names | | | 2.1 | | | | 12.1 | | | | - | | | | (0.4 | ) | | | (0.1 | ) | | | 13.7 | | | | 13.7 | | | | - | | | | - | | | | 0.1 | | | | (1.7 | ) | | | 12.1 | |
| Definite-lived trade names | | | 1.6 | | | | - | | | | (0.7 | ) | | | (0.1 | ) | | | - | | | | 0.8 | | |
| Finite-lived trade names | | | | 0.8 | | | | - | | | | (0.5 | ) | | | - | | | | (0.1 | ) | | | 0.2 | |
| Other | | | 1.4 | | | | - | | | | (0.4 | ) | | | - | | | | - | | | | 1.0 | | | | 1.0 | | | | 0.7 | | | | (0.8 | ) | | | - | | | | (0.1 | ) | | | 0.8 | |
International other intangibles | | | 67.0 | | | | 14.4 | | | | (8.1 | ) | | | (8.8 | ) | | | 0.6 | | | | 65.1 | | | | 65.1 | | | | 3.0 | | | | (8.9 | ) | | | 0.1 | | | | (6.0 | ) | | | 53.3 | |
| | | | | | | | | | | | | | | | | | | | | | | | | | | | | | | | | | | | | | | | | | | | | | | | | |
| North America: | | | | | | | | | | | | | | | | | | | | | | | | | | | | | | | | | | | | | | | | | | | | | | | | |
| Goodwill | | | 7.2 | | | | 12.9 | | | | - | | | | - | | | | 0.2 | | | | 20.3 | | | | 20.3 | | | | (0.4 | ) | | | - | | | | 0.4 | | | | (0.2 | ) | | | 20.1 | |
| Other intangibles: | | | | | | | | | | | | | | | | | | | | | | | | | | | | | | | | | | | | | | | | | | | | | | | | |
| Customer relationships | | | 2.4 | | | | - | | | | (1.0 | ) | | | - | | | | - | | | | 1.4 | | | | 1.4 | | | | (0.2 | ) | | | (2.0 | ) | | | 9.6 | | | | 0.1 | | | | 8.9 | |
| Other – Threshold acquisition | | | - | | | | 16.3 | | | | - | | | | - | | | | 0.4 | | | | 16.7 | | |
| Finite-lived trade names | | | | - | | | | - | | | | - | | | | 1.6 | | | | - | | | | 1.6 | |
| Other - Threshold acquisition (a) | | | | 16.7 | | | | - | | | | - | | | | (16.3 | ) | | | (0.4 | ) | | | - | |
North America other intangibles | | | 2.4 | | | | 16.3 | | | | (1.0 | ) | | | - | | | | 0.4 | | | | 18.1 | | | | 18.1 | | | | (0.2 | ) | | | (2.0 | ) | | | (5.1 | ) | | | (0.3 | ) | | | 10.5 | |
| | | | | | | | | | | | | | | | | | | | | | | | | | | | | | | | | | | | | | | | | | | | | | | | | |
| Total goodwill | | | 213.7 | | | | 27.2 | | | | - | | | | 7.1 | | | | (3.7 | ) | | | 244.3 | | | | 244.3 | | | | 1.4 | | | | - | | | | (0.9 | ) | | | (13.4 | ) | | | 231.4 | |
| Total other intangibles | | $ | 69.4 | | | | 30.7 | | | | (9.1 | ) | | | (8.8 | ) | | | 1.0 | | | | 83.2 | | | $ | 83.2 | | | | 2.8 | | | | (10.9 | ) | | | (5.0 | ) | | | (6.3 | ) | | | 63.8 | |
| (a) | In 2010, an estimate for intangible assets was recorded in one category as the final purchase price allocation was not completed. In 2011, the final purchase price allocation was completed and the intangible asset amount was recorded to the appropriate asset category, which includes customer relationships and finite-lived trade names (Other Intangibles) and capitalized software (Property and Equipment). |
| | | December 31, 2009 | | | December 31, 2010 | |
| | | Beginning | | | | | | Amortization | | | | | | | | | Ending | | | Beginning | | | | | | Amortization | | | | | | | | | Ending | |
| (In millions) | | Balance | | | Acquisitions | | | Expense | | | Adjustments | | | Currency | | | Balance | | | Balance | | | Acquisitions | | | Expense | | | Adjustments | | | Currency | | | Balance | |
| | | | | | | | | | | | | | | | | | | | | | | | | | | | | | | | | | | | | |
| International: | | | | | | | | | | | | | | | | | | | | | | | | | | | | | | | | | | | | |
| Goodwill | | $ | 132.4 | | | | 58.2 | | | | - | | | | (0.2 | ) | | | 16.1 | | | | 206.5 | | | $ | 206.5 | | | | 14.3 | | | | - | | | | 7.1 | | | | (3.9 | ) | | | 224.0 | |
| Other intangibles: | | | | | | | | | | | | | | | | | | | | | | | | | | | | | | | | | | | | | | | | | | | | | | | | |
| Customer relationships | | | 16.5 | | | | 45.7 | | | | (8.0 | ) | | | - | | | | 7.7 | | | | 61.9 | | | | 61.9 | | | | 2.3 | | | | (7.0 | ) | | | (8.3 | ) | | | 0.7 | | | | 49.6 | |
| Indefinite-lived trade names | | | 0.5 | | | | 1.5 | | | | - | | | | - | | | | 0.1 | | | | 2.1 | | | | 2.1 | | | | 12.1 | | | | - | | | | (0.4 | ) | | | (0.1 | ) | | | 13.7 | |
| Definite-lived trade names | | | 0.1 | | | | 1.9 | | | | (0.6 | ) | | | - | | | | 0.2 | | | | 1.6 | | |
| Finite-lived trade names | | | | 1.6 | | | | - | | | | (0.7 | ) | | | (0.1 | ) | | | - | | | | 0.8 | |
| Other | | | 0.6 | | | | 0.9 | | | | (0.4 | ) | | | 0.2 | | | | 0.1 | | | | 1.4 | | | | 1.4 | | | | - | | | | (0.4 | ) | | | - | | | | - | | | | 1.0 | |
International other intangibles | | | 17.7 | | | | 50.0 | | | | (9.0 | ) | | | 0.2 | | | | 8.1 | | | | 67.0 | | | | 67.0 | | | | 14.4 | | | | (8.1 | ) | | | (8.8 | ) | | | 0.6 | | | | 65.1 | |
| | | | | | | | | | | | | | | | | | | | | | | | | | | | | | | | | | | | | | | | | | | | | | | | | |
| North America: | | | | | | | | | | | | | | | | | | | | | | | | | | | | | | | | | | | | | | | | | | | | | | | | |
| Goodwill | | | 7.2 | | | | - | | | | - | | | | - | | | | - | | | | 7.2 | | | | 7.2 | | | | 12.9 | | | | - | | | | - | | | | 0.2 | | | | 20.3 | |
| Other intangibles – customer relationships | | | 3.4 | | | | - | | | | (1.0 | ) | | | - | | | | - | | | | 2.4 | | |
| Other intangibles: | | | | | | | | | | | | | | | | | | | | | | | | | |
| Customer relationships | | | | 2.4 | | | | - | | | | (1.0 | ) | | | - | | | | - | | | | 1.4 | |
| Other – Threshold acquisition | | | | - | | | | 16.3 | | | | - | | | | - | | | | 0.4 | | | | 16.7 | |
| North America other intangibles | | | | 2.4 | | | | 16.3 | | | | (1.0 | ) | | | - | | | | 0.4 | | | | 18.1 | |
| | | | | | | | | | | | | | | | | | | | | | | | | | | | | | | | | | | | | | | | | | | | | | | | | |
| Total goodwill | | | 139.6 | | | | 58.2 | | | | - | | | | (0.2 | ) | | | 16.1 | | | | 213.7 | | | | 213.7 | | | | 27.2 | | | | - | | | | 7.1 | | | | (3.7 | ) | | | 244.3 | |
| Total other intangibles | | $ | 21.1 | | | | 50.0 | | | | (10.0 | ) | | | 0.2 | | | | 8.1 | | | | 69.4 | | | $ | 69.4 | | | | 30.7 | | | | (9.1 | ) | | | (8.8 | ) | | | 1.0 | | | | 83.2 | |
The following table summarizes our other intangible assets:
| | | | December 31, 2011 | | | December 31, 2010 | |
| | | December 31, 2010 | | | December 31, 2009 | | | Gross Carrying | | | Accumulated | | | Net Carrying | | | Gross Carrying | | | Accumulated | | | Net Carrying | |
| (In millions) | | Gross Carrying Amount | | | Accumulated Amortization | | | Net Carrying Amount | | | Gross Carrying Amount | | | Accumulated Amortization | | | Net Carrying Amount | | | Amount | | | Amortization | | | Amount | | | Amount | | | Amortization | | | Amount | |
| | | | | | | | | | | | | | | | | | | | | | | | | | | | | | | | | | | | | |
| International: | | | | | | | | | | | | | | | | | | | | | | | | | | | | | | | | | | | | |
| Customer relationships | | $ | 79.9 | | | | (30.3 | ) | | | 49.6 | | | $ | 85.9 | | | | (24.0 | ) | | | 61.9 | | | $ | 75.9 | | | | (35.7 | ) | | | 40.2 | | | $ | 79.9 | | | | (30.3 | ) | | | 49.6 | |
| Indefinite-lived trade names | | | 13.7 | | | | - | | | | 13.7 | | | | 2.1 | | | | - | | | | 2.1 | | | | 12.1 | | | | - | | | | 12.1 | | | | 13.7 | | | | - | | | | 13.7 | |
| Definite-lived trade names | | | 2.2 | | | | (1.4 | ) | | | 0.8 | | | | 2.3 | | | | (0.7 | ) | | | 1.6 | | |
| Finite-lived trade names | | | | 2.0 | | | | (1.8 | ) | | | 0.2 | | | | 2.2 | | | | (1.4 | ) | | | 0.8 | |
| Other | | | 3.3 | | | | (2.3 | ) | | | 1.0 | | | | 3.3 | | | | (1.9 | ) | | | 1.4 | | | | 3.6 | | | | (2.8 | ) | | | 0.8 | | | | 3.3 | | | | (2.3 | ) | | | 1.0 | |
| North America: | | | | | | | | | | | | | | | | | | | | | | | | | | | | | | | | | | | | | | | | | | | | | | | | |
| Customer relationships | | | 5.0 | | | | (3.6 | ) | | | 1.4 | | | | 5.0 | | | | (2.6 | ) | | | 2.4 | | | | 12.7 | | | | (3.8 | ) | | | 8.9 | | | | 5.0 | | | | (3.6 | ) | | | 1.4 | |
| Finite-lived trade names | | | | 1.6 | | | | - | | | | 1.6 | | | | - | | | | - | | | | - | |
| Other – Threshold Acquisition | | | 16.7 | | | | - | | | | 16.7 | | | | - | | | | - | | | | - | | | | - | | | | - | | | | - | | | | 16.7 | | | | - | | | | 16.7 | |
| Total | | $ | 120.8 | | | | (37.6 | ) | | | 83.2 | | | $ | 98.6 | | | | (29.2 | ) | | | 69.4 | | | $ | 107.9 | | | | (44.1 | ) | | | 63.8 | | | $ | 120.8 | | | | (37.6 | ) | | | 83.2 | |
Our estimated aggregate amortization expense for definite-livedfinite-lived intangibles recorded at December 31, 2010,2011, for each of the five succeeding years is as follows:
| (In millions) | | 2011 | | | 2012 | | | 2013 | | | 2014 | | | 2015 | |
| | | | | | | | | | | | | | | | |
| Amortization expense | | $ | 10.5 | | | | 8.6 | | | | 6.7 | | | | 5.8 | | | | 5.1 | |
| (In millions) | | 2012 | | | 2013 | | | 2014 | | | 2015 | | | 2016 | |
| | | | | | | | | | | | | | | | |
| Amortization expense | | $ | 8.7 | | | | 7.0 | | | | 6.2 | | | | 5.5 | | | | 4.9 | |
| | | December 31, | |
| (In millions) | | 2010 | | | 2009 | |
| | | | | | | |
| Available-for-sale securities (see note 9) | | $ | 29.6 | | | | 22.7 | |
| Investment in unconsolidated entities: | | | | | | | | |
Cost method | | | - | | | | 23.4 | |
Equity method | | | 11.5 | | | | 10.2 | |
| Other | | | 49.6 | | | | 46.7 | |
| Other assets | | $ | 90.7 | | | | 103.0 | |
| | | | | | | |
| | | December 31, |
| (In millions) | | 2011 | | 2010 |
| | | | | | | |
| Equity method investment in unconsolidated entities | | $ | 12.8 | | | | 11.5 | |
| Available-for-sale securities | | | 8.9 | | | | 29.6 | |
| Other | | | 55.4 | | | | 49.6 | |
| Other assets | | $ | 77.1 | | | | 90.7 | |
Note 9 – Fair Value of Financial Instruments
Investments in Available-for-sale Securities
We have available-for-sale securities that are carried at fair value in the financial statements.statements, some of which are classified as current assets. For these investments, fair value was estimated based on quoted prices categorized as a Level 1 valuation, except for non-U.S. debt securities. These securities have beenwere valued at December 31, 2010, using a discounted cash flow methodology using yields and discount rates based on management’sour best estimate of rates that would approximate those that a market participant would use. Due to the high level of judgment involved in this valuation, we have categorized these investments as Level 3.
| | | December 31, | |
| (In millions) | | 2010 | | | 2009 | |
| | | | | | | |
| Cost | | | | | | |
Mutual funds | | $ | 16.9 | | | | 15.0 | |
Non-U.S. debt securities | | | 3.6 | | | | 3.7 | |
Equity securities | | | 3.7 | | | | 0.2 | |
Total | | $ | 24.2 | | | | 18.9 | |
| | | | | | | | | |
| Gross Unrealized Gains | | | | | | | | |
Mutual funds | | $ | 3.4 | | | | 2.6 | |
Non-U.S. debt securities | | | - | | | | - | |
Equity securities | | | 2.2 | | | | 1.8 | |
Total | | $ | 5.6 | | | | 4.4 | |
| | | | | | | | | |
| Gross Unrealized Losses | | | | | | | | |
Mutual funds | | $ | - | | | | - | |
Non-U.S. debt securities | | | (0.2 | ) | | | (0.6 | ) |
Equity securities | | | - | | | | - | |
Total | | $ | (0.2 | ) | | | (0.6 | ) |
| | | | | | | | | |
| Fair Value | | | | | | | | |
Mutual funds | | $ | 20.3 | | | | 17.6 | |
Non-U.S. debt securities | | | 3.4 | | | | 3.1 | |
Equity securities | | | 5.9 | | | | 2.0 | |
Total | | $ | 29.6 | | | | 22.7 | |
| | | | | | | December 31, | |
| | (In millions) | | | 2011 | | 2010 | |
| | | | | | | | | | | | |
| | Cost | | | | | | | |
| | | Mutual funds | $ | 16.9 | | | 16.9 | | |
| | | Non-U.S. debt securities | | - | | | 3.6 | | |
| | | Equity securities | | - | | | 3.7 | | |
| | | | Total | | $ | 16.9 | | | 24.2 | | |
| | | | | | | | | | | | |
| | Gross Unrealized Gains | | | | | | | |
| | | Mutual funds | $ | 3.1 | | | 3.4 | | |
| | | Non-U.S. debt securities | | - | | | - | | |
| | | Equity securities | | - | | | 2.2 | | |
| | | | Total | | $ | 3.1 | | | 5.6 | | |
| | | | | | | | | | | | |
| | Gross Unrealized Losses | | | | | | | |
| | | Mutual funds | $ | - | | | - | | |
| | | Non-U.S. debt securities | | - | | | (0.2) | | |
| | | Equity securities | | - | | | - | | |
| | | | Total | | $ | - | | | (0.2) | | |
| | | | | | | | | | | | |
| | Fair Value | | | | | | | |
| | | Mutual funds | $ | 20.0 | | | 20.3 | | |
| | | Non-U.S. debt securities | | - | | | 3.4 | | |
| | | Equity securities | | - | | | 5.9 | | |
| | | | Total | | $ | 20.0 | | | 29.6 | | |
The table below presents a reconciliation for investments measured and recognized at fair value on a recurring basis using significant unobservable inputs (Level 3):
| | | December 31, | | | December 31, | |
| (In millions) | | 2010 | | | 2009 | | | 2011 | | | 2010 | | | 2009 | |
| | | | | | | | | | | | | | | | |
| Beginning balance | | $ | 3.1 | | | | - | | | $ | 3.4 | | | | 3.1 | | | | - | |
| Total realized and unrealized gains (losses) included in other comprehensive income (loss) | | | 0.3 | | | | (0.6 | ) | |
| Purchases, sales and settlements, net | | | - | | | | 3.7 | | |
| Total gain and (loss), realized and unrealized: | | | | | | | | | | | | | |
| Included in interest and other income | | | | 2.6 | | | | - | | | | - | |
| Included in other comprehensive income (loss) | | | | 0.3 | | | | 0.3 | | | | (0.6 | ) |
| Purchases | | | | - | | | | - | | | | 3.7 | |
| Sales | | | | (6.3 | ) | | | - | | | | - | |
| Ending balance | | $ | 3.4 | | �� | | 3.1 | | | $ | - | | | | 3.4 | | | | 3.1 | |
Fixed-Rate Debt
FairThe fair value estimatesestimate of our obligation related to the fixed-rate Dominion Terminal Associates (“DTA”) bonds areat December 31, 2010, is based on quoted prices. Theprices in an active market (a Level 1 valuation). During the third quarter of 2011, the market for these bonds was not active and we therefore transferred these bonds from Level 1 to Level 2. At December 31, 2011, the fair value and carryingestimate of these bonds is based on price information for these DTA bonds observed in a less-active market.
At December 31, 2011, the fair value estimate of our unsecured notes is based on the present value of our DTA bonds are as follows:future cash flows, discounted at rates for similar instruments at the valuation date.
| The fair value and carrying value of our DTA bonds and of our unsecured notes are as follows: | | The fair value and carrying value of our DTA bonds and of our unsecured notes are as follows: | |
| | | December 31, | | | December 31, | | | | | | | |
| | | 2010 | | | 2009 | | | December 31, | | | December 31, | |
| (In millions) | | Fair Value | | | Carrying Value | | | Fair Value | | | Carrying Value | | | 2011 | | | 2010 | |
| | | | | | | | | | | | | | | | | | | |
| DTA bonds | | $ | 42.9 | | | | 43.2 | | | | 42.7 | | | | 43.2 | | | | | | | |
| Carrying value | | | $ | 43.2 | | | | 43.2 | |
| Fair value | | | | 44.0 | | | | 42.9 | |
| | | | | | | | | | |
| Unsecured notes issued in a private placement | | | | | | | | | |
| Carrying value | | | | 100.0 | | | | - | |
| Fair value | | | | 106.4 | | | | - | |
Other Financial Instruments
Other financial instruments include cash and cash equivalents, short-term fixed rate deposits, accounts receivable, floating rate debt, accounts payable and accrued liabilities. The financial statement carrying amounts of these items approximate the fair value due to their short-term nature.
Note 10 – Accrued Liabilities
| | | December 31, | |
| (In millions) | | 2010 | | | 2009 | |
| | | | | | | |
| Payroll and other employee liabilities | | $ | 161.4 | | | | 135.0 | |
| Taxes, except income taxes | | | 92.8 | | | | 81.7 | |
| Amounts held by cash logistics operations (a) | | | 38.5 | | | | - | |
| Workers’ compensation and other claims | | | 19.9 | | | | 25.4 | |
| Income taxes payable | | | 17.2 | | | | 5.5 | |
| Retirement benefits (see note 3) | | | 12.2 | | | | 9.2 | |
| Other | | | 127.0 | | | | 113.0 | |
| Accrued liabilities | | $ | 469.0 | | | | 369.8 | |
| | | December 31, | |
| (In millions) | | 2011 | | | 2010 | |
| | | | | | | |
| Payroll and other employee liabilities | | $ | 156.4 | | | | 161.4 | |
| Taxes, except income taxes | | | 96.8 | | | | 92.8 | |
| Retirement benefits (see note 3) | | | 31.5 | | | | 12.2 | |
| Workers’ compensation and other claims | | | 27.0 | | | | 19.9 | |
| Amounts held by cash logistics operations (a) | | | 25.1 | | | | 38.5 | |
| Income taxes payable | | | 14.7 | | | | 17.2 | |
| Other | | | 137.0 | | | | 127.0 | |
| Accrued liabilities | | $ | 488.5 | | | | 469.0 | |
| (a) | Title to cash received and processed in certain of our secure cash logistics operations transfers to us for a short period of time. The cash is generally credited to customers’ accounts the following day. Thereforeday and we record a liability while the cash is in our possession. |
Note 11 – Other Liabilities
| | | December 31, | | | December 31, | |
| (In millions) | | 2010 | | | 2009 | | | 2011 | | | 2010 | |
| | | | | | | | | | | | | |
| Workers’ compensation and other claims | | $ | 55.1 | | | | 46.3 | | | $ | 44.3 | | | | 55.1 | |
| Noncurrent tax liability | | | 19.6 | | | | 12.2 | | | | 20.9 | | | | 19.6 | |
| Other | | | 97.0 | | | | 112.0 | | | | 113.2 | | | | 97.0 | |
| Other liabilities | | $ | 171.7 | | | | 170.5 | | | $ | 178.4 | | | | 171.7 | |
| | | December 31, | | | December 31, | |
| (In millions) | | 2010 | | | 2009 | | | 2011 | | | 2010 | |
| | | | | | | | | | | | | |
Bank credit facilities: | | | | | | | |
| Bank credit facilities: | | | | | | | |
Revolving Facility (year-end weighted average interest | | | | | | | | | | | | |
rate of 2.1% in 2010 and 0.6% in 2009) | | $ | 217.2 | | | | 98.0 | | |
| rate of 2.1% in 2011 and 2.1% in 2010) | | | $ | 110.0 | | | | 217.2 | |
| Private Placement Notes (Series A interest rate of 4.6%, Series B interest | | | | | | | | | |
| rate of 5.2%), due 2021 | | | | 100.0 | | | | - | |
Other non-U.S. dollar-denominated facilities (year-end weighted | | | | | | | | | | | | | | | | |
average interest rate of 5.7 % in 2010 and 4.4% in 2009) | | | 28.1 | | | | 14.4 | | |
| average interest rate of 6.9% in 2011 and 5.7% in 2010) | | | | 15.4 | | | | 28.1 | |
| Dominion Terminal Associates 6.0% bonds, due 2033 | | | 43.2 | | | | 43.2 | | | | 43.2 | | | | 43.2 | |
| Capital leases (average rates: 4.3% in 2010 and 5.3% in 2009) | | | 64.2 | | | | 32.8 | | |
| Capital leases (average rates: 4.3% in 2011 and 4.3% in 2010) | | | | 95.4 | | | | 64.2 | |
Total long-term debt | | $ | 352.7 | | | | 188.4 | | | $ | 364.0 | | | | 352.7 | |
| | | | | | | | | | | | | | | | | |
| Included in: | | | | | | | | | | | | | | | | |
Current liabilities | | $ | 29.0 | | | | 16.1 | | | $ | 28.7 | | | | 29.0 | |
Noncurrent liabilities | | | 323.7 | | | | 172.3 | | | | 335.3 | | | | 323.7 | |
Total long-term debt | | $ | 352.7 | | | | 188.4 | | | $ | 364.0 | | | | 352.7 | |
We have anOn January 6, 2012, we amended our unsecured $400 million revolving bank credit facility (the “Revolving Facility”) with a syndicate. The amendment provides for an increase in the amount of banks.the Revolving Facility from $400 million to $480 million at more favorable pricing and extends the maturity date from July 2014 to January 2017. The Revolving Facility’s interest rate is based on LIBOR plus a margin, alternate base rate plus a margin, or competitive bid. The Revolving Facility allows the Companyus to borrow or issue letters of credit (or otherwise satisfy credit needs) on a revolving basis over a four-yearthe term ending in July 2014.of the facility. As of December 31, 2010, $182.82011, $290 million was available under the Revolving Facility. Amounts outstanding under the Revolving Facility as of December 31, 2010,2011, were denominated primarily in U.S. dollars and to a lesser extent in Canadian dollars.
The margin on LIBOR borrowings under the Revolving Facility, which can rangeranged from 1.225% to 2.325% depending on our credit rating, was 1.75% at December 31, 2010.2011. Under the amended Revolving Facility, the margin on LIBOR borrowings can range from 0.9% to 1.575% and was 1.20% at January 6, 2012. The margin on alternate base rate borrowings under the Revolving Facility can rangeranged from 0.225% to 1.325%. Under the amended Revolving Facility, the alternate base rate borrowings can range from 0.0% to 0.575%. We also pay an annual facility fee on the Revolving Facility based on our credit rating. The facility fee, which can rangeranged from 0.15% to 0.55%, was 0.375% at December 31, 2011. Under the end of 2010.amended Revolving Facility, the facility fee can range from 0.10% to 0.30% and was 0.175% at January 6, 2012.
We have twoOn January 24, 2011, we issued $100 million in unsecured notes through a private placement debt transaction (the “Notes”). The Notes comprise $50 million in series A notes with a fixed interest rate of 4.57% and $50 million in series B notes with a fixed interest rate of 5.20%. The Notes are due in January 2021 with principal payments under the series A notes to begin in January 2015. The proceeds of $100 million were utilized to pay down the Revolving Facility.
As of December 31, 2011, we had three unsecured multi-currency revolving bank credit facilities with a total of $60.0$70 million in available credit, of which approximately $22.2$37 million was available at December 31, 2010.available. A $40 million facility expires in December 2011 and a $20 million facility expires in December 2012.2012, another $20 million facility expires in May 2014 and a $30 million facility expires in October 2014. Interest on these facilities is based on LIBOR plus a margin. The margin ranges from 0.14%1.0% to 2.50%. We also have the ability to borrow from other banks, at the banks’ discretion, under short-term uncommitted agreements. Various foreign subsidiaries maintain other lines of credit and overdraft facilities with a number of banks.
We have two unsecured letter of credit facilities totaling $189$139 million, of which approximately $84.2$25 million was available at December 31, 2010.2011. A $135 million facility expires in July 2011 and a $54 million facility expires in December 2014.2014 and an $85 million facility expires in June 2015. The Revolving Facility and the multi-currency revolving credit facilities are also used for issuance of letters of credit and bank guarantees. On January 24, 2012, we entered into a $25 million unsecured letter of credit facility that will expire in December 2014.
We also have aan unsecured bilateral committed credit facility (the “2010 Credit Facility”) with a total of $20 million in available credit that expires in March 2011.2012. Interest on this facility is based on LIBOR plus a margin, which ranges from 2.0%1.75% to 2.5%2.25%. As of December 31, 2010, $20.02011, $20 million was available under the 2010 Credit Facility.
Minimum repayments of long-term debt are as follows:
| Minimum repayments of long-term debt are as follows: | | Minimum repayments of long-term debt are as follows: | |
| | | | | | | | | | | |
| (In millions) | | Capital leases | | | Other long-term debt | | | Total | | | Capital leases | | | Other long-term debt | | | Total | |
| | | | | | | | | | | | | | | | | | | |
| 2011 | | $ | 13.2 | | | | 15.8 | | | | 29.0 | | |
| 2012 | | | 14.8 | | | | 6.0 | | | | 20.8 | | | $ | 21.6 | | | | 7.1 | | | | 28.7 | |
| 2013 | | | 10.3 | | | | 2.3 | | | | 12.6 | | | | 18.3 | | | | 2.5 | | | | 20.8 | |
| 2014 | | | 8.6 | | | | 218.4 | | | | 227.0 | | | | 16.7 | | | | 97.7 | | | | 114.4 | |
| 2015 | | | 7.6 | | | | 1.1 | | | | 8.7 | | | | 14.9 | | | | 7.9 | | | | 22.8 | |
| 2016 | | | | 13.7 | | | | 7.9 | | | | 21.6 | |
| Later years | | | 9.7 | | | | 44.9 | | | | 54.6 | | | | 10.2 | | | | 145.5 | | | | 155.7 | |
| Total | | $ | 64.2 | | | | 288.5 | | | | 352.7 | | | $ | 95.4 | | | | 268.6 | | | | 364.0 | |
The Revolving Facility, the two letter ofNotes, the three unsecured multi-currency revolving bank credit facilities, the two unsecured multi-currency revolving bankletter of credit facilities and the 2010 Credit Facility contain subsidiary guarantees and various financial and other covenants. The financial covenants, among other things, limit our total indebtedness, limit priority debt, limit asset sales, limit the use of proceeds from asset sales and provide for minimum coverage of interest costs. The credit agreements do not provide for the acceleration of payments should our credit rating be reduced. If we were not to comply with the terms of our various loancredit agreements, the repayment terms could be accelerated and the commitments could be withdrawn.
An acceleration of the repayment terms under one agreement could trigger the acceleration of the repayment terms under the other loan agreements. In November 2010, we obtained appropriate waivers in connection with the bankruptcy of our Belgian subsidiary to ensure that we remain compliant with the terms of our credit facilities. We were in compliance with all of these financial covenants at December 31, 2010.2011.
We have $43.2$43 million of bonds issued by the Peninsula Ports Authority of Virginia recorded as debt on our balance sheet. Although we are not the primary obligor of the debt, we have guaranteed the debt and we believe that we will ultimately pay this obligation. The guarantee originated as part of a former interest in Dominion Terminal Associates, a deep water coal terminal. We continue to pay interest on the debt. The bonds bear a fixed interest rate of 6.0% and mature in 2033. The bonds may mature prior to 2033 upon the occurrence of specified events such as the determination that the bonds are taxable or if we fail to abide by the terms of the guarantee.
At December 31, 2010,2011, we had undrawn letters of credit and guarantees totaling $140.0$140.2 million, including $104.8$114.2 million issued under the letter of credit facilities, $26.8$21.7 million issued under the multi-currency revolving bank credit facilities, and $8.4$4.3 million issued under other credit facilities. These letters of credit primarily support our obligations under various self-insurance programs and credit facilities.
Capital Leases
Property and equipment acquired under capital leases are included in property and equipment as follows:
| | | December 31, | | | December 31, | |
| (In millions) | | 2010 | | | 2009 | | | 2011 | | | 2010 | |
| | | | | | | | | | | | | |
| Asset class: | | | | | | | | | | | | |
Buildings | | $ | 8.8 | | | | 15.2 | | | $ | 6.0 | | | | 8.8 | |
Vehicles | | | 54.8 | | | | 37.4 | | | | 89.9 | | | | 54.8 | |
Machinery and equipment | | | 25.3 | | | | 11.4 | | | | 37.3 | | | | 25.3 | |
| | | | 88.9 | | | | 64.0 | | | | 133.2 | | | | 88.9 | |
Less: accumulated amortization | | | (21.7 | ) | | | (23.1 | ) | | | (30.0 | ) | | | (21.7 | ) |
Total | | $ | 67.2 | | | | 40.9 | | | $ | 103.2 | | | | 67.2 | |
Note 13 – Accounts Receivable
| | | December 31, | | | December 31, | |
| (In millions) | | 2010 | | | 2009 | | | 2011 | | | 2010 | |
| | | | | | | | | | | | | |
| Trade | | $ | 493.6 | | | | 390.9 | | | $ | 506.0 | | | | 493.6 | |
| Other | | | 38.7 | | | | 43.8 | | | | 53.4 | | | | 38.7 | |
| Total accounts receivable | | | 532.3 | | | | 434.7 | | | | 559.4 | | | | 532.3 | |
| Allowance for doubtful accounts | | | (7.2 | ) | | | (7.1 | ) | | | (8.9 | ) | | | (7.2 | ) |
| Accounts receivable, net | | $ | 525.1 | | | | 427.6 | | | $ | 550.5 | | | | 525.1 | |
| | | | | | Years Ended December 31, | |
| | (In millions) | | 2011 | | 2010 | | 2009 | |
| | | | | | | | | | | | | | |
| | Allowance for doubtful accounts: | | | | | | | | | | |
| | | Beginning of year | $ | 7.2 | | | 7.1 | | | 6.8 | | |
| | | Provision for uncollectible accounts receivable | | 4.0 | | | 0.5 | | | 1.2 | | |
| | | Write offs less recoveries | | (1.4) | | | (0.9) | | | (1.2) | | |
| | | Foreign currency exchange effects | | (0.9) | | | 0.5 | | | 0.3 | | |
| | | End of year | $ | 8.9 | | | 7.2 | | | 7.1 | | |
| | | Years Ended December 31, | |
| (In millions) | | 2010 | | | 2009 | | | 2008 | |
| | | | | | | | | | |
| Allowance for doubtful accounts: | | | | | | | | | |
Beginning of year | | $ | 7.1 | | | | 6.8 | | | | 10.8 | |
Provision for uncollectible accounts receivable: | | | | | | | | | | | | |
Continuing operations | | | 0.5 | | | | 1.2 | | | | 3.2 | |
Discontinued operations | | | - | | | | - | | | | 8.7 | |
Write offs less recoveries | | | (0.9 | ) | | | (1.2 | ) | | | (10.4 | ) |
Charge to other accounts | | | - | | | | - | | | | 0.4 | |
Spin-off of BHS (see note 17) | | | - | | | | - | | | | (4.5 | ) |
Foreign currency exchange effects | | | 0.5 | | | | 0.3 | | | | (1.4 | ) |
End of year | | $ | 7.2 | | | | 7.1 | | | | 6.8 | |
Note 14 – Operating Leases
We lease facilities, vehicles, computers and other equipment under long-term operating and capital leases with varying terms. Most of the operating leases contain renewal and/or purchase options. We expect that in the normal course of business, the majority of operating leases will be renewed or replaced by other leases.
As of December 31, 2010,2011, future minimum lease payments under noncancellable operating leases with initial or remaining lease terms in excess of one year are included below.
| (In millions) | | Facilities | | | Vehicles | | | Other | | | Total | | | Facilities | | | Vehicles | | | Other | | | Total | |
| | | | | | | | | | | | | | | | | | | | | | | | | |
| 2011 | | $ | 56.4 | | | | 19.7 | | | | 5.4 | | | | 81.5 | | |
| 2012 | | | 48.8 | | | | 15.8 | | | | 4.3 | | | | 68.9 | | | $ | 58.7 | | | | 17.5 | | | | 4.1 | | | | 80.3 | |
| 2013 | | | 40.9 | | | | 11.5 | | | | 2.7 | | | | 55.1 | | | | 48.1 | | | | 13.0 | | | | 2.5 | | | | 63.6 | |
| 2014 | | | 29.7 | | | | 7.2 | | | | 1.4 | | | | 38.3 | | | | 40.1 | | | | 8.6 | | | | 1.5 | | | | 50.2 | |
| 2015 | | | 25.2 | | | | 3.9 | | | | 0.9 | | | | 30.0 | | | | 28.1 | | | | 4.2 | | | | 0.8 | | | | 33.1 | |
| Later years | | | 60.1 | | | | 1.3 | | | | 0.9 | | | | 62.3 | | |
| 2016 | | | | 18.6 | | | | 1.4 | | | | 0.5 | | | | 20.5 | |
| Late years | | | | 48.4 | | | | 0.1 | | | | 0.5 | | | | 49.0 | |
| | | $ | 261.1 | | | | 59.4 | | | | 15.6 | | | | 336.1 | | | $ | 242.0 | | | | 44.8 | | | | 9.9 | | | | 296.7 | |
In North America, most vehicles that were added to the fleet prior to March 1, 2009, were obtained pursuant to operating leases that had residual value guarantees. Vehicles added to the fleet after March 1, 2009, were either purchased or were financed under capital lease.
Our maximum residual value guarantee under operating lease agreements was $39.5$27.6 million at December 31, 2010.2011. If we continue to renew the leases and pay the lease payments for the vehicles that have been included in the above table, this residual value guarantee will reduce to zero at the end of the final renewal period.
Net rent expense included in continuing operations amounted to $112.6 million in 2011, $104.7 million in 2010 and $101.4 million in 2009 and $97.2 million in 2008.2009.
Note 15 – Share-Based Compensation Plans
We have share-based compensation plans to retain employees and nonemployee directors and to more closely align their interests with those of our shareholders.
The 2005 Equity Incentive Plan (the “2005 Plan”) permits grants of stock options, restricted stock units, stock appreciation rights, performance stock and other share-based awards to employees. Only stock options and restricted stock units have been granted under the 2005 Plan to date.
We also provide share-based awards to directors through the Non-Employee Directors’ Equity Plan (the “Directors’ Plan”). In 2008, 2009 and 2010,To date, we have granted only deferred stock units under the Directors’ Plan. There are also outstanding stock options granted to directors under a prior plan, the Non-Employee Directors’ Stock Option Plan (the “Prior Directors’ Plan”).
There are 2.21.5 million shares underlying share-based plans that are authorized, but not yet granted.
General Terms
Options are granted at a price not less than the average quoted market price on the date of grant. Options granted to employees have a maximum term of six years. All grants of options and restricted stock units to employees under the 2005 Plan are subject to a minimum vesting period of one year and either vest ratably over three years from the date of grant or at the end of the third year. For those awards subject to a ratable vesting schedule, fair value is measured for each separately vesting portion of the award as if the award were comprised of three separate individual awards. Compensation expense related to options and restricted stock units is recognized from the grant date to the earlier of the retirement eligible date or the stated vesting date.date, and is classified as selling, general and administrative expenses in the consolidated statements of income.
In general, options continue to be exercisable following termination of employment for 90 days, if such options were exercisable at the time of termination. Upon termination of employment by reason of the employee’s retirement or permanent and total disability, options held by the employee remain outstanding and continue in accordance with their terms. In the event of the employee’s death while employed or after retirement or permanent and total disability, options held by the employee fully vest at the time of the employee’s death (or, if later, on the first anniversary of the grant date) and remain exercisable by the employee’s beneficiary or estate for three years following the employee’s death or their earlier expiration in accordance with their terms. If a change in control were to occur (as defined in the plan document), all outstanding options fully vest and become exercisable.
Restricted stock unit awards granted under the 2005 Plan have specific terms and conditions contained in award agreements entered into with employees. In general, restricted stock units are canceled following termination of employment. Upon termination of employment by reason of the employee’s retirement or permanent and total disability, restricted stock units held by the employee remain outstanding and continue in accordance with their terms. In the event of the employee’s death while employed or after retirement or permanent and total disability, any restrictions on restricted stock units held by the employee are removed at the time of the employee’s death (or, if later, on the first anniversary of the grant date). If a change in control were to occur, all restrictions on outstanding restricted stock units are removed, subject to limitations on distribution imposed by Internal Revenue Code Section 409A.
Under the Prior Directors’ Plan, options granted had a maximum term of ten years and vested in full at the end of six months. Under the Directors’ Plan, directors have been granted deferred stock units that entitle them (at the earlier of one year from the date of grant, upon termination of service from the board or upon a change on control) to receive an equivalent amount of CompanyBrink’s common stock six months after termination of service from the board. Compensation cost for deferred stock units is recognized in its entirety at the grant date.
Spin-Off of BHS (see note 17)
Upon completion of the BHS spin-off on October 31, 2008, 118,500 options that had been granted in the third quarter of 2008 to employees of BHS were canceled.
For employees remaining with Brink’s on October 31, 2008, the number of options and the exercise prices were adjusted to reflect the effect of the spin-off of BHS. For options granted in 2008, 420,104 options were adjusted to 771,867 options. Additionally, the exercise prices for these options were adjusted from $64.15 and $69.11 per share to $34.92 and $37.62 per share, respectively.
The table below summarizes the activity in all plans for options of our common stock.
| | | | | | | | | Weighed-Average | | | Aggregate | |
| | | Shares | | | Weighted- Average | | | Remaining Contractual | | | Intrinsic Value | |
| | | (in thousands) | | | Exercise Price Per Share | | | Term (in years) | | | (in millions) | |
| | | | | | | | | | | | | |
| Outstanding at December 31, 2007 | | | 2,246 | | | $ | 46.57 | | | | | | | |
| Granted | | | 541 | | | | 64.24 | | | | | | | |
| Exercised | | | (559 | ) | | | 33.34 | | | | | | | |
| Forfeited or expired | | | (35 | ) | | | 53.54 | | | | | | | |
| Cancelled awards (a) | | | (389 | ) | | | 58.32 | | | | | | | |
| Adjustment due to spin-off (a) | | | 1,518 | | | | - | | | | | | | |
| | | | | | | | | | | | | | | |
| Outstanding at December 31, 2008 | | | 3,322 | | | | 28.95 | | | | | | | |
| Granted | | | 289 | | | | 27.59 | | | | | | | |
| Exercised | | | (79 | ) | | | 16.50 | | | | | | | |
| Forfeited or expired | | | (97 | ) | | | 34.08 | | | | | | | |
| | | | | | | | | | | | | | | |
| Outstanding at December 31, 2009 | | | 3,435 | | | | 28.98 | | | | | | | |
| Granted | | | 367 | | | | 19.05 | | | | | | | |
| Exercised | | | (372 | ) | | | 17.50 | | | | | | | |
| Forfeited or expired | | | (75 | ) | | | 31.71 | | | | | | | |
| | | | | | | | | | | | | | | |
| Outstanding at December 31, 2010 | | | 3,355 | | | $ | 29.10 | | | | 2.9 | | | $ | 6.9 | |
| | | | | | | | | | | | | | | | | |
| Of the above, as of December 31, 2010: | | | | | | | | | | | | | | | | |
Exercisable | | | 2,577 | | | $ | 30.10 | | | | 2.3 | | | $ | 4.1 | |
Expected to vest in future periods (b) | | | 752 | | | $ | 25.77 | | | | 4.7 | | | $ | 2.7 | |
| | | | | | | | | | | Weighted-Average | | Aggregate | |
| | | | | Shares | | Weighted- Average | | Remaining Contractual | | Intrinsic Value | |
| | | | (in thousands) | | Exercise Price Per Share | | Term (in years) | | (in millions) | |
| | | | | | | | | | | | | | | | |
| | Outstanding at December 31, 2008 | | 3,322 | | $ | 28.95 | | | | | | | | |
| | Granted | | 289 | | | 27.59 | | | | | | | | |
| | Exercised | | (79) | | | 16.50 | | | | | | | | |
| | Forfeited or expired | | (97) | | | 34.08 | | | | | | | | |
| | | | | | | | | | | | | | | | |
| | Outstanding at December 31, 2009 | | 3,435 | | | 28.98 | | | | | | | | |
| | Granted | | 367 | | | 19.05 | | | | | | | | |
| | Exercised | | (372) | | | 17.50 | | | | | | | | |
| | Forfeited or expired | | (75) | | | 31.71 | | | | | | | | |
| | | | | | | | | | | | | | | |
| | Outstanding at December 31, 2010 | | 3,355 | | | 29.10 | | | | | | | | |
| | Granted | | 290 | | | 31.47 | | | | | | | | |
| | Exercised | | (562) | | | 20.66 | | | | | | | | |
| | Forfeited or expired | | (116) | | | 29.47 | | | | | | | | |
| | Outstanding at December 31, 2011 | | | | | | | | | | | | | |
| | | 2,967 | | $ | 30.92 | | | 2.5 | | $ | 3.0 | | |
| | | | | | | | | | | | | | | | |
| | Of the above, as of December 31, 2011: | | | | | | | | | | | | | |
| | | Exercisable | | 2,397 | | $ | 32.03 | | | 1.9 | | $ | 1.4 | | |
| | | Expected to vest in future periods (a) | | 555 | | $ | 26.18 | | | 4.8 | | $ | 1.6 | | |
| (a) | Related to BHS employees and directors. See note 17. |
(b) | The number of options expected to vest takes into account an estimate of expected forfeitures. |
The intrinsic value of a stock option is the difference between the market price of the shares underlying the option and the exercise price of the option. The market price at December 31, 2010,2011, was $26.88 per share. The total intrinsic value of options exercised was $5.6 million ($9.99 per share) in 2011, $2.9 million ($7.86 per share) in 2010, and $0.9 million ($11.62 per share) in 2009, and $19.7 million ($35.24 per share) in 2008.2009. The total fair value of options that vested during 2011 was $3.2 million, during 2010 was $5.1 million, for 2010,and during 2009 was $6.7 million for 2009 and $9.9 million for 2008.million.
There were 2.4 million shares of exercisable options with a weighted-average exercise price of $32.03 per share at December 31, 2011. There were 2.6 million shares of exercisable options with a weighted-average exercise price of $30.10 per share at December 31, 2010. There were2010, and 2.4 million shares of exercisable options with a weighted-average exercise price of $27.41 per share at December 31, 2009, and 1.8 million shares of exercisable options with a weighted-average exercise price of $24.52 per share at December 31, 2008.2009.
Method and Assumptions Used to Estimate Fair Value of Options
The fair value of each stock option grant is estimated at the time of grant using the Black-Scholes option-pricing model. TheFor those awards subject to a ratable vesting schedule, fair value is measured for each separately vesting portion of options that vest entirely at the end of a fixed period is estimated using a single option approach. The fair value of options that vest ratably overaward as if the vesting period is estimated using a multiple-option approach. Most of our options have a vesting periodaward were comprised of three years. If a different option-pricing model had been used, results may have been different.separate individual awards.
The fair value of options granted during the three years ended December 31, 2010,2011, was calculated using the following estimated weighted-average assumptions.
| Options Granted | | | |
| | | Years Ended December 31, | |
| | | 2010 | | | 2009 | | | 2008 | |
| | | | | | | | | | |
| Number of shares underlying options, in thousands | | | 367 | | | | 289 | | | | 541 | |
| Weighted-average exercise price per share | | $ | 19.05 | | | | 27.59 | | | | 64.24 | |
| | | | | | | | | | | | | |
| Assumptions used to estimate fair value: | | | | | | | | | | | | |
Expected dividend yield (a): | | | | | | | | | | | | |
Weighted-average | | | 2.1 | % | | | 1.4 | % | | | 0.6 | % |
Expected volatility (b): | | | | | | | | | | | | |
Weighted-average | | | 36 | % | | | 36 | % | | | 26 | % |
Range | | | 35%-39 | % | | | 35%-39 | % | | | 26%-27 | % |
Risk-free interest rate (c): | | | | | | | | | | | | |
Weighted-average | | | 1.4 | % | | | 1.8 | % | | | 2.8 | % |
Range | | | 0.6%-1.9 | % | | | 0.9%-2.4 | % | | | 2.0%-3.1 | % |
Expected term in years (d): | | | | | | | | | | | | |
Weighted-average | | | 3.8 | | | | 3.8 | | | | 3.6 | |
Range | | | 1.9-5.3 | | | | 1.9-5.3 | | | | 2.1-5.4 | |
| | | | | | | | | | | | | |
| Weighted-average fair value estimates at grant date: | | | | | | | | | | | | |
In millions | | $ | 1.7 | | | | 2.1 | | | | 7.8 | |
Fair value per share | | $ | 4.65 | | | | 7.24 | | | | 14.39 | |
| | | | | | Years Ended December 31, |
| | | | 2011 | | 2010 | | 2009 | |
| | | | | | | | | | | | | | | | | |
| | Number of shares underlying options, in thousands | | | | 290 | | | | 367 | | | | 289 | |
| | Weighted-average exercise price per share | $ | | | 31.47 | | | | 19.05 | | | | 27.59 | |
| | | | | | | | | | | | | | | | | |
| | Assumptions used to estimate fair value | | | | | | | | | | | | | |
| | | Expected dividend yield (a): | | | | | | | | | | | | | |
| | | | Weighted-average | | | | 1.3 % | | | | 2.1 % | | | | 1.4 % | |
| | | Expected volatility (b): | | | | | | | | | | | | | |
| | | | Weighted-average | | | | 36 % | | | | 36 % | | | | 36 % | |
| | | | Range | | 36 % | – | 37 % | | 35 % | – | 39 % | | 35 % | – | 39 % | |
| | | Risk-free interest rate (c): | | | | | | | | | | | | | |
| | | | Weighted-average | | | | 1.2 % | | | | 1.4 % | | | | 1.8 % | |
| | | | Range | | 0.5 % | – | 1.9 % | | 0.6 % | – | 1.9 % | | 0.9 % | – | 2.4 % | |
| | | Expected term in years (d): | | | | | | | | | | | | | |
| | | | Weighted-average | | | | 3.8 | | | | 3.8 | | | | 3.8 | |
| | | | Range | | 1.9 | – | 5.3 | | 1.9 | – | 5.3 | | 1.9 | – | 5.3 | |
| | | | | | | | | | | | | | | | | |
| | Weighted-average fair value estimates at grant date: | | | | | | | | | | | | | |
| | | In millions | $ | | | 2.4 | | | | 1.7 | | | | 2.1 | |
| | | Fair value per share | $ | | | 8.17 | | | | 4.65 | | | | 7.24 | |
| (a) | The expected dividend yield is the calculated yield on the Brink’s common stock at the time of the grant. |
| (b) | The expected volatility was estimated after reviewing the historical volatility of our stock using daily close prices. |
(c) The risk-free interest rate was based on yields on U.S. Treasury debt yields at the time of the grant.
| (d) | The expected term of the options was based on historical option exercise, data, option expiration and post-vesting cancellation behavior.behaviors. |
Nonvested Share Activity
| | | Number of shares | | | Weighted-Average | |
| | | 2005 | | | Directors’ | | | | | | Grant-Date | |
| (in thousands of shares, except per share amounts) | | Plan | | | Plan | | | Total | | | Fair Value (a) | |
| | | | | | | | | | | | | |
| Balance as of January 1, 2009 | | | 55.6 | | | | 15.3 | | | | 70.9 | | | $ | 36.27 | |
| Granted | | | 178.4 | | | | 22.7 | | | | 201.1 | | | | 26.90 | |
| Cancelled awards | | | (1.3 | ) | | | - | | | | (1.3 | ) | | | 26.80 | |
| Vested | | | (18.5 | ) | | | (15.3 | ) | | | (33.8 | ) | | | 35.71 | |
Balance as of December 31, 2009 | | | 214.2 | | | | 22.7 | | | | 236.9 | | | | 28.45 | |
| | | | | | | | | | | | | | | | | |
| Granted | | | 167.6 | | | | 29.1 | | | | 196.7 | | | | 19.24 | |
| Cancelled awards | | | (5.6 | ) | | | - | | | | (5.6 | ) | | | 22.52 | |
| Vested | | | (76.7 | ) | | | (22.7 | ) | | | (99.4 | ) | | | 29.12 | |
Balance as of December 31, 2010 | | | 299.5 | | | | 29.1 | | | | 328.6 | | | $ | 22.84 | |
| | Nonvested Share Activity | | | | | | | | | | | | | |
| | | | | Number of shares | | | Weighted-Average | |
| | | | 2005 | | Directors’ | | | | | Grant-Date | |
| | (in thousands of shares, except per share amounts) | | Plan | | Plan | | Total | | Fair Value (a) | |
| | | | | | | | | | | | | | | | |
| | Balance as of January 1, 2009 | | 55.6 | | | 15.3 | | | 70.9 | | $ | 36.27 | | |
| | Granted | | 178.4 | | | 22.7 | | | 201.1 | | | 26.90 | | |
| | Cancelled awards | | (1.3) | | | - | | | (1.3) | | | 26.80 | | |
| | Vested | | (18.5) | | | (15.3) | | | (33.8) | | | 35.71 | | |
| | | Balance as of December 31, 2009 | | 214.2 | | | 22.7 | | | 236.9 | | | 28.45 | | |
| | | | | | | | | | | | | | | | |
| | Granted | | 167.6 | | | 29.1 | | | 196.7 | | | 19.24 | | |
| | Cancelled awards | | (5.6) | | | - | | | (5.6) | | | 22.52 | | |
| | Vested | | (76.7) | | | (22.7) | | | (99.4) | | | 29.12 | | |
| | | Balance as of December 31, 2010 | | 299.5 | | | 29.1 | | | 328.6 | | | 22.84 | | |
| | | | | | | | | | | | | | | | |
| | Granted | | 143.7 | | | 15.8 | | | 159.5 | | | 30.43 | | |
| | Cancelled awards | | (16.5) | | | - | | | (16.5) | | | 23.65 | | |
| | Vested | | (127.1) | | | (29.1) | | | (156.2) | | | 24.13 | | |
| | | Balance as of December 31, 2011 | | 299.6 | | | 15.8 | | | 315.4 | | $ | 25.99 | | |
| (a) | Fair value is measured at the date of grant based on the average of the high and low per share quoted sales price of Brink’s common stock, adjusted for a discount on units that do not receive or accrue dividends. |
As of December 31, 2010, $3.02011, $0.9 million of total unrecognized compensation cost related to previously granted stock options and nonvested shares is expected to be recognized over a weighted-average period of 1.5 years.
Other Share-Based Compensation
We have a deferred compensation plan that allows participants to defer a portion of their compensation into common stock units. Units may be redeemed by employees for an equal number of shares of Brink’s common stock. Employee accounts held 947,878 units at December 31, 2011, and 869,745 units at December 31, 2010, and 787,719 units at December 31, 2009.2010.
We have a stock accumulation plan for our non-employee directors denominated in Brink’s common stock units. Directors’ accounts held 55,293 units at December 31, 2011, and 50,619 units at December 31, 2010, and 59,332 units at December 31, 2009.2010.
Common Stock
At December 31, 2010,2011, we had 100 million shares of common stock authorized and 46.446.9 million shares issued and outstanding.
Share Purchases
In September 2007, our board of directors authorized the purchase of up to $100 million of our outstanding common shares. We purchased $100and retired 234,456 shares of Brink’s common stock in 2009 for $6.1 million (average price of $26.20 per share) and 1,682,845 shares in 2010 for $33.7 million (average price of $20.03 per share). We did not purchase any shares of our common stock as follows:in 2011.
· | We used $60.2 million to purchase 1,044,300 shares of common stock through the end of 2008 at an average price of $57.58 per share. |
· | In 2009, we used $6.1 million to purchase 234,456 shares of common stock at an average price of $26.20 per share. |
· | During 2010, we purchased 1,682,845 shares of our common stock for $33.7 million at an average price of $20.03 per share. |
Shares Contributed to U.S. Pension Plan
On August 20, 2009, we made a voluntary $150 million contribution to our primary U.S. retirement plan. The contribution was comprised of $92.4 million of cash and 2,260,738 newly issued shares of our common stock valued for purposes of the contribution at $25.48 per share, or $57.6 million in the aggregate.
Dividends
We paid regular quarterly dividends on our common stock during the last three years. On January 20, 2011,19, 2012, the board declared a regular quarterly dividend of 10 cents per share payable on March 1, 2011.2012. Future dividends are dependent on the earnings, financial condition, shareholder equity levels, cash flow and business requirements, as determined by the board of directors.
Employee Benefits TrustShelf Registration of Common Stock
In September 2008, we terminated The Brink’s Company Employee Benefits Trust (the “Employee Benefits Trust”). Immediately priorWe intend to termination, the shares held by the trust were distributed to us and the shares were retired. The purpose of the Employee Benefits Trust (prior to termination) was to hold shares of our common stock to fund obligations under compensation and employee benefit programs that provided for the issuance of stock. After the termination of the trust, newly issued shares are used to satisfy these programs.
Through 2007, shares of common stock were voted by the trusteeregister $150 million in the same proportion as the shares of common stock voted by our employees participating in our 401(k) plan. Our 401(k) plan divested all shares of ournew common stock in January 2008. After the 401(k) plan divested2012. We intend to issue shares in 2012 to satisfy some or all shares of our common stock, shares of the trust were not votedrequired contributions to our primary U.S. pension plan. We may also issue shares in matters voted on by shareholders.the future to satisfy future contributions.
Preferred Stock
At December 31, 2010,2011, we had the authority to issue up to 2.0 million shares of preferred stock with a par value of $10 per share.
Shares Used to Calculate Earnings per Share
| | | Years Ended December 31, | | Years Ended December 31, |
| (In millions) | | 2010 | | | 2009 | | | 2008 | | 2011 | | 2010 | 2009 |
| | | | | | | | | | | | | | | |
| Weighted-average shares | | | | | | | | | | | | | | |
| | | | | | | | | | | | | | | |
| Basic (a) | | | 48.2 | | | | 47.2 | | | | 46.3 | | 47.8 | | | 48.2 | | 47.2 |
| Effect of dilutive stock awards | | | 0.2 | | | | 0.3 | | | | 0.4 | | 0.3 | | | 0.2 | | 0.3 |
Diluted | | | 48.4 | | | | 47.5 | | | | 46.7 | | 48.1 | | | 48.4 | | 47.5 |
| | | | | | | | | | | | | | | | | | |
| Antidilutive stock awards excluded from denominator | | | 2.2 | | | | 2.5 | | | | 0.7 | | 2.3 | | | 2.2 | | 2.5 |
| (a) | We have deferred compensation plans for directors and certain of our employees. Amounts owed to participants are denominated in common stock units. Each unit represents one share of common stock. The number of shares used to calculate basic earnings per share includes the weighted-average units credited to employees and directors under the deferred compensation plans. Additionally, non-participating restricted stock units are also included in the computation of basic weighted average shares when the requisite service period has been completed. Accordingly, included in basic and diluted shares areinclude weighted-average units of 1.1 million in 2011, 1.0 million in 2010 and 0.8 million in 2009 and 0.7 million in 2008.2009. |
Note 17 – Income from Discontinued Operations
| | | Years Ended December 31, | |
| (In millions) | | 2010 | | | 2009 | | | 2008 | |
| | | | | | | | | | |
| Brink’s Home Security Holdings, Inc. (“BHS”): | | | | | | | | | |
Income from operations before tax (a) | | $ | - | | | | - | | | | 105.4 | |
Expense associated with the spin-off | | | - | | | | - | | | | (13.0 | ) |
| | | | | | | | | | | | | |
| Adjustments to contingencies of former operations: | | | | | | | | | | | | |
Gain from FBLET refunds | | | - | | | | 19.7 | | | | - | |
BAX Global indemnification | | | 1.7 | | | | (13.2 | ) | | | - | |
Insurance recoveries related to BAX Global indemnification | | | 1.6 | | | | - | | | | - | |
Workers’ compensation | | | (7.2 | ) | | | (1.5 | ) | | | (1.0 | ) |
Other | | | 0.8 | | | | 1.8 | | | | 5.9 | |
| Income (loss) from discontinued operations before income taxes | | | (3.1 | ) | | | 6.8 | | | | 97.3 | |
| Provision (credit) for income taxes | | | (3.4 | ) | | | 2.3 | | | | 45.8 | |
| Income from discontinued operations, net of tax | | $ | 0.3 | | | | 4.5 | | | | 51.5 | |
(a) | Revenues of BHS were $442.4 million in 2008 (partial year). |
| | | Years Ended December 31, | |
| (In millions) | | 2011 | | | 2010 | | | 2009 | |
| | | | | | | | | | |
| Adjustments to contingencies of former operations: | | | | | | | | | |
| Gain from FBLET refunds | | $ | 4.2 | | | | - | | | | 19.7 | |
| BAX Global indemnification | | | - | | | | 1.7 | | | | (13.2 | ) |
| Insurance recoveries related to BAX Global indemnification | | | 1.2 | | | | 1.6 | | | | - | |
| Workers’ compensation | | | (1.4 | ) | | | (7.2 | ) | | | (1.5 | ) |
| Other | | | (1.8 | ) | | | 0.8 | | | | 1.8 | |
| Income (loss) from discontinued operations before income taxes | | | 2.2 | | | | (3.1 | ) | | | 6.8 | |
| Provision (credit) for income taxes | | | 0.7 | | | | (3.4 | ) | | | 2.3 | |
| Income from discontinued operations, net of tax | | $ | 1.5 | | | | 0.3 | | | | 4.5 | |
Federal Black Lung Excise Tax (“FBLET”) refunds
The Energy Improvement and Extension Act of 2008 enabled taxpayers to file claims for FBLET refunds for periods prior to those open under the statute of limitations previously applicable statute of limitations.to us. In 2009, we received $23.9 million of FBLET refunds and recognized the majority of these refunds as a pre-taxpretax gain of $19.7 million.million in 2009. In the second quarter of 2011, the statute of limitations expired and we recognized a pretax gain of $4.2 million for the remaining portion of the refund.
BAX Global
BAX Global, a former business unit, had been defending a claim related to the apparent diversion by a third party of goods being transported for a customer. On April 23, 2010, the Dutch Supreme Court denied the final appeal of BAX Global, letting stand the lower court ruling that BAX Global is liable for this claim. We had contractually indemnified the purchaser of BAX Global for this contingency. We recognized €9 million ($13.2 million) related to this matter in discontinued operations in 2009, and made an $11.5 million payment in 2010 in satisfaction of the judgment. judgment, and reversed $1.7 million of expense in 2010. We have insurance coverage applicable to this matter and we have collected $1.6 millionrecovered a portion of the loss from insurance companies in 2010.
BHS Spin-off
On October 31, 2008, we distributed all of our interest in BHS to our shareholders of record as of the close of business on October 21, 2008, in a tax-free distribution. We distributed one share of BHS common stock for every share of our common stock outstanding. We contributed $50($1.2 million in cash to BHS at the time of the spin-off. We also forgave all the existing intercompany debt owed by BHS to us as of the distribution date.
BHS offered monitored security services in North America primarily for owner-occupied, single-family residences. To a lesser extent, BHS offered security services for commercial2011 and multi-family properties. BHS typically installed and owned the on-site security systems and charged fees to monitor and service the systems.
In connection with the spin-off, we entered into a Tax Matters Agreement with BHS which provided a basis for the preparation and filing of tax returns for pre-spin and post-spin operations of BHS in 2008. As authorized by the Tax Matters Agreement, we made certain elections related to BHS’ operations for our U.S. federal and state 2008 consolidated tax returns in 2009. These elections have the effect of decreasing the net deferred tax assets allocated to BHS at the time of the spin-off. As a result, we increased the amount of our current income tax receivable during 2009 by $26.8 million, with an offsetting increase in retained earnings to adjust the amount of the spin-off distribution.
After the spin-off, we reclassified BHS’ results of operations, including previously reported results and non-segment income (expense) directly related to the spin-off, within discontinued operations.
Interest Expense
Interest expense included in discontinued operations was $0.3$1.6 million in 2008. Interest expense recorded in discontinued operations includes only interest on third-party borrowings made directly by BHS.2010).
Note 18 – Supplemental Cash Flow Information
| | | Years Ended December 31, | | | Years Ended December 31, | |
| (In millions) | | 2010 | | | 2009 | | | 2008 | | | 2011 | | | 2010 | | | 2009 | |
| | | | | | | | | | | | | | | | | | | |
| Cash paid for: | | | | | | | | | | | | | | | | | | |
Interest | | $ | 13.7 | | | | 10.3 | | | | 12.1 | | | $ | 22.3 | | | | 13.7 | | | | 10.3 | |
Income taxes, net | | | 65.5 | | | | 12.6 | | | | 69.2 | | | | 79.8 | | | | 65.5 | | | | 12.6 | |
We acquired propertyarmored vehicles, CompuSafe® units and other equipment under capital lease arrangements in each of the last three years ending December 31, 2010, including $43.0 million in 2011, $33.9 million in 2010 and $13.4 million in 2009 and $8.02009. Some of the assets acquired under these leases were part of sales-leaseback transactions of assets that were previously owned. Proceeds from sale of these assets were $17.6 million in 2008. Property and equipment acquired under capital leases2011, $1.2 million in 2010 was primarily armored vehicles and CompuSafe® equipment$13.6 million in North America.
In 2009, we financed a portion of our North American operating segment’s armored truck purchases through sale-leaseback transactions. Proceeds received from the sale-leaseback transactions totaled $13.6 million.2009. The trucks were sold at approximatelyproceeds approximated net book value on the dates of the transactions, and the resulting leases are being accounted for as capital leases.
On August 20, 2009, we issued 2,260,738 shares of our common stock as part of our voluntary contribution to our primary U.S. retirement plan. The value of our stock contribution was at $25.48 per share, or $57.6 million in the aggregate.related gains and losses on these transactions were not material.
Note 19 – Other Operating Income (Expense)
| | | Years Ended December 31, | | | Years Ended December 31, | |
| (In millions) | | 2010 | | | 2009 | | | 2008 | | | 2011 | | | 2010 | | | 2009 | |
| | | | | | | | | | | | | | | | | | | |
| Gains (losses) related to business acquisitions: | | | | | | | | | | |
| Share in earnings of equity affiliates | | | $ | 4.8 | | | | 3.9 | | | | 4.5 | |
| Royalty income | | | | 1.7 | | | | 7.6 | | | | 8.6 | |
| Gains (losses) on sale of property and other assets | | | | 1.2 | | | | 1.2 | | | | 9.4 | |
| Impairment losses | | | | (4.7 | ) | | | (0.7 | ) | | | (2.7 | ) |
| Business acquisitions and dispositions: | | | | | | | | | | | | | |
| Gain on sale of U.S. Document Destruction business | | | | 6.7 | | | | - | | | | - | |
Bargain purchase of Mexican CIT business | | $ | 5.1 | | | | - | | | | - | | | | 2.1 | | | | 5.1 | | | | - | |
Remeasurement of previously held ownership interests to fair value | | | (13.7 | ) | | | 14.9 | | | | - | | |
| Remeasurement of previously held ownership interest to fair value | | | | 0.4 | | | | (13.7 | ) | | | 14.9 | |
| Deconsolidation of Brink’s Belgium and write-down to fair value | | | (13.4 | ) | | | - | | | | - | | | | - | | | | (13.4 | ) | | | - | |
| Currency exchange transaction gains (losses) | | | (4.0 | ) | | | (41.4 | ) | | | (18.1 | ) | |
| Royalty income | | | 7.6 | | | | 8.6 | | | | 2.8 | | |
| Gains on sales of property and other assets | | | 1.2 | | | | 9.4 | | | | 13.1 | | |
| Share in earnings of equity affiliates | | | 3.9 | | | | 4.5 | | | | 5.0 | | |
| Impairment losses | | | (0.7 | ) | | | (2.7 | ) | | | (1.9 | ) | |
| Settlement loss related to Belgium bankruptcy | | | | (10.1 | ) | | | - | | | | - | |
| Foreign currency items: | | | | | | | | | | | | | |
| Transaction - gains (losses) | | | | (4.2 | ) | | | (4.0 | ) | | | (41.4 | ) |
| Hedge gains | | | | 2.2 | | | | - | | | | - | |
| Other | | | 4.5 | | | | 3.2 | | | | 3.7 | | | | 3.1 | | | | 4.5 | | | | 3.2 | |
| Other operating income (expense) | | $ | (9.5 | ) | | | (3.5 | ) | | | 4.6 | | | $ | 3.2 | | | | (9.5 | ) | | | (3.5 | ) |
Note 20 –20– Interest and Other Nonoperating Income (Expense)
| | | Years Ended December 31, | | | Years Ended December 31, | |
| (In millions) | | 2010 | | | 2009 | | | 2008 | | | 2011 | | | 2010 | | | 2009 | |
| | | | | | | | | | | | | | | | | | | |
| Interest income | | $ | 4.1 | | | | 10.8 | | | | 15.0 | | | $ | 5.9 | | | | 4.1 | | | | 10.8 | |
| Other-than-temporary impairment of available-for-sale securities | | | - | | | | - | | | | (7.1 | ) | |
| Gain on available-for-sale securities | | | 3.8 | | | | - | | | | 0.9 | | | | 4.4 | | | | 3.8 | | | | - | |
| Other, net | | | 0.2 | | | | - | | | | (0.7 | ) | |
| Other | | | | (1.2 | ) | | | 0.2 | | | | - | |
| Total | | $ | 8.1 | | | | 10.8 | | | | 8.1 | | | $ | 9.1 | | | | 8.1 | | | | 10.8 | |
We recognized $4.4 million in gains on the sale of debt securities ($2.6 million) and equity securities ($1.8 million) in 2011. We recognized a $4.0 million gain in 2010 on the conversion of certain available-for-sale marketable securities. The conversion resulted from an exchange of the securities we held for shares of equity securities in two other publicly held companies and a small amount of cash. The shares received in the conversion were sold in January 2011 and we recognized another $1.8 million gain in the first quarter of 2011.
In 2008, we recognized a $7.1 million other-than-temporary impairment loss on available-for-sale securities. We concluded the impairment of the securities was not temporary based on the length of time and the degree to which the fair value had been below the securities’ $26.3 million cost basis.
Note 21 – Other Commitments and Contingencies
Bankruptcy of Brink’s Belgium
Background.Our former cash-in-transit subsidiary in Belgium (Brink’s Belgium) filed for bankruptcy in November 2010 after a restructuring plan was rejected by local union employees and was placed into bankruptcy on February 2, 2011. We continue to operate our Global Services unit in Belgium, which provides secure transport of diamonds, jewelry,jewellery, precious metals, banknotes and other commodities.
Deconsolidation. Brink’s Belgium continued to provide cash-in-transit services for customers after the bankruptcy filing for approximately three months under the management of a court-appointed trustee. We no longer control or provide funding for the subsidiary. In accordance with FASB ASC Topic 810, Consolidation, we deconsolidated the subsidiary in November 2010, when the trustee assumed control of the subsidiary. We estimated that the fair value of our investment at the date of deconsolidation was zero. Our carrying value of the investment and advances to the subsidiary at the date of the deconsolidation was $11.7 million, which we wrote off as a result of the deconsolidation, resulting in a pretax l oss.loss. We also have incurred approximately $1.7 million of other charges related to the bankruptcy of the subsidiary. The losses related to deconsolidation and other charges have been recorded in Other Operating Income (Expense) in the consolidated statements of income.
A summary of the revenues and operating losses for Brink’s Belgium in the three years ending December 31, 2010, is as follows:
| | | | | | | | | | |
| (In millions) | | 2010 | | | 2009 (b) | | | 2008 | |
| | | | | | | | | | |
| Revenues | | $ | 35.2 | | | | 51.3 | | | | 50.1 | |
| Operating loss (a) | | | 7.6 | | | | 9.4 | | | | 0.4 | |
(a) | Operating loss includes severance charges of $2 million in 2010 and $2 million in 2009. |
(b) | Operating loss includes accounting corrections of $6 million, which relate to prior periods. |
Legal disputeDispute.. In December 2010, the court-appointed provisional administrators of Brink’s Belgium filed a claim for €20 million against a subsidiary of Brink’s. In June 2011, the Brink’s subsidiary entered into a settlement agreement related to this claim. Under the terms of the settlement agreement, the Brink’s subsidiary agreed to contribute, upon the satisfaction of certain conditions, €7 million toward social payments to former Brink’s Belgium employees in exchange for the bankruptcy receivers requesting withdrawal of the pending litigation and agreeing not to file additional claims. The conditions of the settlement agreement included a release from liability by affected employees, the Belgian tax authority and the Belgian social security authority. These conditions were satisfied and the settlement was finalized during the third quarter of 2011. We do not believe that this claim has merit, and we are pursuingrecorded a vigorous defense to contest this action. We believe that it is reasonably possible that we will incur a losspretax charge of up to €20€7 million (equivalent to $26.5 million at December 31, 2010) if we lose(approximately $10 million) in the court proceeding, but it is also reasonably possible that we will prevail in the court resulting in no loss. We do not believe that any loss withinsecond quarter of 2011 related to this range is probable and have not accrued for this matter. The ultimate resolution of this matter is unknown and the estimated liability may change in the f uture. We do not believe that the ultimate disposition of this matter will have a material adverse effect on our liquidity, financial position or results of operations.claim.
Other
We are involved in various other lawsuits and claims in the ordinary course of business. We are not able to estimate the range of losses for some of these matters. We have recorded accruals for losses that are considered probable and reasonably estimable. We do not believe that the ultimate disposition of any of these matters will have a material adverse effect on our liquidity, financial position or results of operations.
Purchase Obligations
At December 31, 2010,2011, we had noncancellable commitments for $17.5$11.7 million in equipment purchases, and information technology and other services.
Note 22 – Selected Quarterly Financial Data (unaudited)
| | | 2010 Quarters | | | 2009 Quarters | | | 2011 Quarters | | | 2010 Quarters | |
| (In millions, except per share amounts) | | 1st | | | 2nd | | | 3rd | | | 4th | | | 1st | | | 2nd | | | 3rd | | | 4th | | | 1 st | | | 2 nd | | | 3 rd | | | 4 th | | | 1 st | | | 2 nd | | | 3 rd | | | 4 th | |
| | | | | | | | | | | | | | | | | | | | | | | | | | | | | | | | | | | | | | | | | | | | | | | | | |
| Revenues | | $ | 735.4 | | | | 729.4 | | | | 776.1 | | | | 880.6 | | | $ | 732.5 | | | | 751.9 | | | | 801.8 | | | | 848.8 | | | $ | 913.3 | | | | 979.3 | | | | 995.8 | | | | 997.1 | | | $ | 735.4 | | | | 729.4 | | | | 776.1 | | | | 880.6 | |
| Segment operating profit | | | 34.9 | | | | 44.1 | | | | 58.0 | | | | 71.9 | | | | 52.4 | | | | 28.9 | | | | 61.7 | | | | 70.4 | | | | 52.0 | | | | 36.6 | | | | 70.1 | | | | 72.4 | | | | 34.9 | | | | 44.1 | | | | 58.0 | | | | 71.9 | |
| Operating profit | | | 23.8 | | | | 31.5 | | | | 44.1 | | | | 46.9 | | | | 41.7 | | | | 26.7 | | | | 60.9 | | | | 37.5 | | | | 37.0 | | | | 20.4 | | | | 62.5 | | | | 51.4 | | | | 23.8 | | | | 31.5 | | | | 44.1 | | | | 46.9 | |
| Amounts attributable to Brink’s: | | | | | | | | | | | | | | | | | | | | | | | | | | | | | | | | | | | | | | | | | | | | | | | | | | | | | | | | | | | | | | | | |
| Income (loss) from: | | | | | | | | | | | | | | | | | | | | | | | | | | | | | | | | | | | | | | | | | | | | | | | | | | | | | | | | | | | | | | | | |
Continuing operations | | $ | (4.8 | ) | | | 20.7 | | | | 21.7 | | | | 19.2 | | | $ | 22.2 | | | | 16.0 | | | | 33.4 | | | | 124.1 | | | $ | 18.9 | | | | 5.3 | | | | 31.5 | | | | 17.3 | | | $ | (4.8 | ) | | | 20.7 | | | | 21.7 | | | | 19.2 | |
Discontinued operations | | | (3.4 | ) | | | 0.8 | | | | 2.2 | | | | 0.7 | | | | 0.8 | | | | 4.3 | | | | 1.0 | | | | (1.6 | ) | | | 1.1 | | | | 2.6 | | | | (0.7 | ) | | | (1.5 | ) | | | (3.4 | ) | | | 0.8 | | | | 2.2 | | | | 0.7 | |
| Net income (loss) attributable to Brink’s | | $ | (8.2 | ) | | | 21.5 | | | | 23.9 | | | | 19.9 | | | $ | 23.0 | | | | 20.3 | | | | 34.4 | | | | 122.5 | | | $ | 20.0 | | | | 7.9 | | | | 30.8 | | | | 15.8 | | | $ | (8.2 | ) | | | 21.5 | | | | 23.9 | | | | 19.9 | |
| | | | | | | | | | | | | | | | | | | | | | | | | | | | | | | | | | | | | | | | | | | | | | | | | | | | | | | | | | | | | | | | | |
| Depreciation and amortization | | $ | 32.3 | | | | 32.9 | | | | 34.8 | | | | 36.6 | | | $ | 30.7 | | | | 32.8 | | | | 33.7 | | | | 37.9 | | | $ | 38.8 | | | | 41.2 | | | | 40.5 | | | | 41.9 | | | $ | 32.3 | | | | 32.9 | | | | 34.8 | | | | 36.6 | |
| Capital expenditures | | | 26.9 | | | | 34.3 | | | | 41.3 | | | | 46.3 | | | | 29.5 | | | | 45.0 | | | | 38.0 | | | | 58.1 | | | | 29.4 | | | | 42.2 | | | | 47.1 | | | | 77.5 | | | | 26.9 | | | | 34.3 | | | | 41.3 | | | | 46.3 | |
| | | | | | | | | | | | | | | | | | | | | | | | | | | | | | | | | | | | | | | | | | | | | | | | | | | | | | | | | | | | | | | | | |
| Earnings (loss) per share attributable to Brink’s | | | | | | | | | | | | | | | | | | | | | | | | | | | | | | | | | | | | | | | | | | | | | | | | | | | | | | | | | | | | | | | | |
| common shareholders: | | | | | | | | | | | | | | | | | | | | | | | | | | | | | | | | | | | | | | | | | | | | | | | | | | | | | | | | | | | | | | | | |
| Basic: | | | | | | | | | | | | | | | | | | | | | | | | | | | | | | | | | |
| Basic | | | | | | | | | | | | | | | | | | | | | | | | | | | | | | | | | |
Continuing operations | | $ | (0.10 | ) | | | 0.42 | | | | 0.45 | | | | 0.40 | | | $ | 0.48 | | | | 0.35 | | | | 0.70 | | | | 2.54 | | | $ | 0.40 | | | | 0.11 | | | | 0.66 | | | | 0.36 | | | $ | (0.10 | ) | | | 0.42 | | | | 0.45 | | | | 0.40 | |
Discontinued operations | | | (0.07 | ) | | | 0.02 | | | | 0.05 | | | | 0.02 | | | | 0.02 | | | | 0.09 | | | | 0.02 | | | | (0.03 | ) | | | 0.02 | | | | 0.05 | | | | (0.02 | ) | | | (0.03 | ) | | | (0.07 | ) | | | 0.02 | | | | 0.05 | | | | 0.02 | |
Net income | | $ | (0.17 | ) | | | 0.44 | | | | 0.50 | | | | 0.42 | | | $ | 0.50 | | | | 0.44 | | | | 0.72 | | | | 2.51 | | | $ | 0.42 | | | | 0.17 | | | | 0.64 | | | | 0.33 | | | $ | (0.17 | ) | | | 0.44 | | | | 0.50 | | | | 0.42 | |
| | | | | | | | | | | | | | | | | | | | | | | | | | | | | | | | | | | | | | | | | | | | | | | | | | | | | | | | | | | | | | | | | |
| Diluted: | | | | | | | | | | | | | | | | | | | | | | | | | | | | | | | | | |
| Diluted | | | | | | | | | | | | | | | | | | | | | | | | | | | | | | | | | |
Continuing operations | | $ | (0.10 | ) | | | 0.42 | | | | 0.45 | | | | 0.40 | | | $ | 0.48 | | | | 0.34 | | | | 0.70 | | | | 2.53 | | | $ | 0.39 | | | | 0.11 | | | | 0.66 | | | | 0.36 | | | $ | (0.10 | ) | | | 0.42 | | | | 0.45 | | | | 0.40 | �� |
Discontinued operations | | | (0.07 | ) | | | 0.02 | | | | 0.05 | | | | 0.02 | | | | 0.02 | | | | 0.09 | | | | 0.02 | | | | (0.03 | ) | | | 0.02 | | | | 0.05 | | | | (0.02 | ) | | | (0.03 | ) | | | (0.07 | ) | | | 0.02 | | | | 0.05 | | | | 0.02 | |
Net income | | $ | (0.17 | ) | | | 0.44 | | | | 0.50 | | | | 0.42 | | | $ | 0.49 | | | | 0.44 | | | | 0.72 | | | | 2.50 | | | $ | 0.41 | | | | 0.16 | | | | 0.64 | | | | 0.33 | | | $ | (0.17 | ) | | | 0.44 | | | | 0.50 | | | | 0.42 | |
Earnings per share amounts for each quarter are required to be computed independently. As a result, their sum may not equal the annual earnings per share.
2011
In the second quarter of 2011, we recognized a $10.1 million settlement charge related to our exit of the Belgium cash-in-transit business. In the third quarter of 2011, we recognized a $6.7 million pretax gain related to the sale of our U.S Document Destruction business. Fourth-quarter 2011 results include a $4.1 million pretax charge related to the retirement of our former CEO.
2010
In the first quarter of 2010, we recognized an income tax charge of $14$13.7 million related to U.S. healthcare legislation which was enacted in that quarter.
Fourth-quarter 2010 results included a $13$13.4 million charge related to the deconsolidation of our former subsidiary in Belgium. We also recognizedBelgium and a $9$8.6 million net loss on our acquisition of a controlling interest of SPPa cash-in-transit business in Mexico.
2009
In the second quarter of 2009, we recognized approximately $20 million in pretax gains from FBLET refunds which were partially offset by a $13 million charge for a contingent liability related to our former BAX operations. Both amounts were reported as part of discontinued operations.
Results in the third quarter of 2009 included a $14 million a gain related to the acquisition of controlling interests in an equity affiliate.
Fourth-quarter 2009 results included a $118 million tax benefit related to the release of the U.S. tax valuation allowance and a $23 million pretax loss from the repatriation of cash from our Venezuelan operations.
ITEM 9. CHANGES IN AND DISAGREEMENTS WITH ACCOUNTANTS ON ACCOUNTING AND FINANCIAL DISCLOSURE
Not applicable.
ITEM 9A. CONTROLS AND PROCEDURES
(a) Disclosure Controls and Procedures
Pursuant to Rule 13a-15(b) under the Securities Exchange Act of 1934, we carried out an evaluation, with the participation of our management, including our Chief Executive Officer and Vice President and Chief Financial Officer, of the effectiveness of our disclosure controls and procedures (as defined under Rule 13a-15(e) under the Securities Exchange Act of 1934) as of the end of the period covered by this report. Based upon that evaluation, our Chief Executive Officer and Vice President and Chief Financial Officer concluded that our disclosure controls and procedures are effective in ensuring that information required to be disclosed by us in the reports that we file or submit under the Securities Exchange Act of 1934, is recorded, processed, summarized and reported, within the time periods specified in the SEC’s rules and forms, and that such information is accumulated and communicated to our management, including our Chief Executive Officer and Vice President and Chief Financial Officer, as appropriate, to allow timely decisions regarding required disclosure.
(b) Internal Controls over Financial Reporting
See pages 7071 and 7172 for Management’s Annual Report on Internal Control over Financial Reporting and the Attestation Report of the Registered Public Accounting Firm.
(c) Changes in Internal Controls over Financial Reporting
On November 17, 2010, the Company completed the acquisition of Servicio Pan Americano de Proteccion, S.A. de C.V. (“SPP”). As permitted by the SEC under the current year acquisition scope exception, management's assessment of the effectiveness of the internal control over financial reporting excludes SPP. However, the completion of this acquisition has expanded the Company's internal control environment.
Other than as described above, thereThere has been no change in our internal control over financial reporting during the quarter ended December 31, 2010,2011, that has materially affected, or is reasonably likely to materially affect, our internal controls over financial reporting.
ITEM 9B. OTHER INFORMATION
Not applicable.
ITEM 10. DIRECTORS, EXECUTIVE OFFICERS AND CORPORATE GOVERNANCE
We have adopted a Business Code of Ethics that applies to all of the directors, officers and employees (including the Chief Executive Officer, Chief Financial Officer and Controller) and have posted the Business Code of Ethics on our website. We intend to satisfy the disclosure requirement under Item 5.05 of Form 8-K relating to amendments to or waivers from any provision of the Business Code of Ethics applicable to the Chief Executive Officer, Chief Financial Officer or Controller by posting this information on the website. The internet address is www.brinks.com.
Our Chief Executive Officer is required to make, and he has made, an annual certification to the New York Stock Exchange (“NYSE”) stating that he was not aware of any violation by us of the corporate governance listing standards of the NYSE. Our Chief Executive Officer made his annual certification to that effect to the NYSE as of June 3, 2010.May 19, 2011. In addition, we are filing, as exhibits to this Annual Report on Form 10-K, the certification of our principal executive officer and principal financial officer required under sections 906 and 302 of the Sarbanes-Oxley Act of 2002 to be filed with the Securities and Exchange Commission regarding the quality of our public disclosure.
The information regarding executive officers is included in this report following Item 4, under the caption “Executive Officers of the Registrant.” Other information required by Item 10 is incorporated by reference to our definitive proxy statement to be filed pursuant to Regulation 14A within 120 days after December 31, 2010.2011.
ITEM 11. EXECUTIVE COMPENSATION
The information required by Item 11 is incorporated by reference to our definitive proxy statement to be filed pursuant to Regulation 14A within 120 days after December 31, 2010.2011.
ITEM 12. SECURITY OWNERSHIP OF CERTAIN BENEFICIAL OWNERS AND MANAGEMENT AND RELATED STOCKHOLDER MATTERS
The information required by Item 12 is incorporated by reference to our definitive proxy statement to be filed pursuant to Regulation 14A within 120 days after December 31, 2010.2011.
ITEM 13. CERTAIN RELATIONSHIPS AND RELATED TRANSACTIONS, AND DIRECTOR INDEPENDENCE
The information required by Item 13 is incorporated by reference to our definitive proxy statement to be filed pursuant to Regulation 14A within 120 days after December 31, 2010.2011.
ITEM 14. PRINCIPAL ACCOUNTANT FEES AND SERVICES
The information required by Item 14 is incorporated by reference to our definitive proxy statement to be filed pursuant to Regulation 14A within 120 days after December 31, 2010.
2011.
ITEM 15. EXHIBITS AND FINANCIAL STATEMENT SCHEDULES
| (a) | 1. | All financial statements – see pages 6970 – 118.116. |
| | | |
| | 2. | Financial statement schedules – not applicable. |
| | | |
| | 3. | Exhibits – see exhibit index. |
| | | |
Undertaking
For the purposes of complying with the amendments to the rules governing Form S-8 (effective July 13, 1990) under the Securities Act of 1933, the undersigned Registrant hereby undertakes as follows, which undertaking shall be incorporated by reference into Registrant’s Registration Statements on Form S-8 Nos. 2-64258, 33-2039, 33-21393, 33-53565, 333-78631, 333-70758, 333-70772, and 333-146673. Insofar as indemnification for liabilities arising under the Securities Act of 1933 may be permitted to directors, officers and controlling persons of the Registrant pursuant to the foregoing provisions, or otherwise, the Registrant has been advised that in the opinion of the Securities and Exchange Commission such indemnification is against public policy as expressed in the Securities Act of 1933 and is, therefore, unenforceable .unenforceable. In the event that a claim for indemnification against liabilities (other than the payment by the Registrant of expenses incurred or paid by a director, officer or controlling person of the Registrant in the successful defense of any action, suit or proceeding) is asserted by such director, officer or controlling person in connection with the securities being registered, the Registrant will, unless in the opinion of its counsel the matter has been settled by controlling precedent, submit to a court of appropriate jurisdiction the question whether such indemnification by it is against public policy as expressed in the Act and will be governed by the final adjudication of such issue.
Signatures
Pursuant to the requirements of Section 13 or 15(d) of the Securities Exchange Act of 1934, the Registrant has duly caused this report to be signed on its behalf by the undersigned, thereunto duly authorized, on February 25, 2011.27, 2012.
| | | | The Brink’s Company |
| | | | (Registrant) |
| | | | |
| | | By | /s/ M. T. DanC. Schievelbein |
| | | | (Michael T. Dan,Thomas C. Schievelbein, |
| | | | Chairman,Interim President and |
| | | | Chief Executive Officer) |
Pursuant to the requirements of the Securities Exchange Act of 1934, this report has been signed below by the following persons on behalf of the Registrant and in the capacities indicated, on February 25, 2011.27, 2012.
| Signature | | Title |
| | |
/s/ M. T. Dan C. Schievelbein | | Director, Chairman of the Board,Interim President President and Chief Executive Officer
(Principal Executive Officer) |
Michael T. DanThomas C. Schievelbein | | |
/s/ J.W. Dziedzic | | Vice President and Chief Financial Officer (Principal Financial Officer) |
| Joseph W. Dziedzic | | |
| /s/ M. A. P. Schumacher | | Controller (Principal Accounting Officer) |
| Matthew A.P. Schumacher | | |
| | |
| * | | Director |
| Betty C. Alewine | | |
| | |
| * | | Director |
| Paul G. Boynton | | |
| | |
| * | | Director |
| Marc C. Breslawsky | | |
| | |
| * | | Director |
| Reginald D. Hedgebeth | | |
| |
| * | | Director |
| Michael J. Herling | | |
| | |
| * | | Director |
| Murray D. Martin | | |
| |
* | | Director |
Thomas C. Schievelbein | | |
| |
* | | Director |
Robert J. Strang | | |
| |
| * | | Director |
| Ronald L. Turner | | |
| | |
| * By: | | /s/ M. T. DanC. Schievelbein, |
| | | Michael T. Dan,Thomas C. Schievelbein, Attorney-in-Fact |
Exhibit Index
Each exhibit listed as a previously filed document is hereby incorporated by reference to such document.
Exhibit Number | Description |
| | |
| 2(i) | Shareholders’ Agreement, dated as of January 10, 1997, between Brink’s Security International, Inc., and Valores Tamanaco, C.A. Exhibit 10(w) to the Registrant’s Annual Report on Form 10-K for the year ended December 31, 1998. |
| | |
| 3(i) | (a) | Amended and Restated Articles of Incorporation of the Registrant. Exhibit 3(i) to the Registrant’s Current Report on Form 8-K filed November 20, 2007. |
| | | |
| (b) | Articles of Amendment to the Amended and Restated Articles of Incorporation of the Registrant. Exhibit 3(i) to the Registrant’s Current Report on Form 8-K filed May 10, 2011. |
| |
| 3(ii) | Amended and Restated Bylaws of the Registrant. Exhibit 3(ii) to the Registrant’s Amendment No. 1 to Current Report on Form 8-K filed November 15, 2010.21, 2011. |
| | |
| 10(a)* | Amended and Restated Key Employees Incentive Plan, as amended and restated as of November 16, 2007.May 6, 2011. Exhibit 10(a)10.1 to the Registrant’s AnnualCurrent Report on Form 10-K for the year ended December 31, 2007 (the “2007 Form 10-K”).8-K filed May 10, 2011. |
| | |
| 10(b)* | Key Employees’ Deferred Compensation Program, as amended and restated as of May 7, 2010. Exhibit B to the Proxy Statement for the Registrant’s 2010 Annual Meeting of Shareholders.February 3, 2012. |
| | |
| 10(c)* | (i) | Pension Equalization Plan as amended and restated, effective as of October 22, 2008. Exhibit 10.2 to the Registrant’s Quarterly Report on Form 10-Q for the quarter ended September 30, 2008 (the “Third Quarter 2008 Form 10-Q”). |
| | |
| | (ii) | Amended and Restated Trust Agreement, dated December 1, 1997, between the Registrant and Chase Manhattan Bank, as Trustee (the “Trust Agreement”). Exhibit 10(e)(ii) to the Registrant’s Annual Report on Form 10-K for the year ended December 31, 1997 (the “1997 Form 10-K”). |
| |
| (iii) | Amendment No. 1 toRabbi Trust Agreement, dated as of August 18, 1999.December 22, 2011, by and between the Registrant and Wells Fargo Bank, N.A., as Trustee. Exhibit 10(c)(iii) to the Registrant’s Annual Report on Form 10-K for the year ended December 31, 1999 (the “1999 Form 10-K”). |
| |
| (iv) | Amendment No. 2 to Trust Agreement, dated as of July 26, 2001. Exhibit 10(c)(iv) to the Registrant’s Annual Report on Form 10-K for the year ended December 31, 2002 (the “2002 Form 10-K”). |
| |
| (v) | Amendment No. 3 to Trust Agreement, dated as of September 18, 2002. Exhibit 10(c)(v) to the 2002 Form 10-K. |
| |
| (vi) | Amendment No. 4 to Trust Agreement, dated as of September 22, 2003. Exhibit 10.1 to the Registrant’s Quarterly Report on Form 10-Q for the quarter ended September 30, 2003 (the “Third Quarter 2003 Form 10-Q”). |
| |
| (vii) | Amendment No. 5 to Trust Agreement, dated as of September 20, 2004. Exhibit 10.1 to the Registrant’s Quarterly Report on Form 10-Q for the quarter ended September 30, 2004. |
| |
| (viii) | Amendment No. 6 to Trust Agreement, dated as of November 22, 2004. Exhibit 99.4 to the Registrant’s Current Report on Form 8-K filed November 22, 2004.December 29, 2011. |
| | |
| 10(d)* | Executive Salary Continuation Plan. Exhibit 10(e) to the Registrant’s Annual Report on Form 10-K for the year ended December 31, 1991 (the “1991 Form 10-K”). |
| | |
| 10(e)* | 2005 Equity Incentive Plan, as amended and restated as of February 19, 2010. Exhibit 10(f) to the Registrant’s Form 10-K for the year ended December 31, 2009 (the “2009 Form 10-K”). |
| | |
| 10(f)* | (i) | Form of Option Agreement for options granted before 2010 under 2005 Equity Incentive Plan. Exhibit 99 to the Registrant’s Current Report on Form 8-K filed July 13, 2005. |
| | | |
| | (ii) | Form of Option Agreement for options granted in 2010 under 2005 Equity Incentive Plan. Exhibit 10.2 to the Registrant’s Current Report on Form 8-K filed July 12, 2010. |
| | | |
| | (iii) | Terms and Conditions for options granted in 2011 under 2005 Equity Incentive Plan. Exhibit 10.1 to the Registrant’s Quarterly Report on Form 10-Q for the quarter ended June 30, 2011 (the “Second Quarter 2011 Form 10-Q”). |
| | |
| (iv) | Form of Restricted Stock Units Award Agreement for restricted stock units granted before 2010 under 2005 Equity Incentive Plan. Exhibit 10.1 to the Registrant’s Current Report on Form 8-K filed July 13, 2009. |
| | | |
| | (iv)(v) | Form of Restricted Stock Units Award Agreement for restricted stock units granted in 2010 under 2005 Equity Incentive Plan. Exhibit 10.1 to the Registrant’s Current Report on Form 8-K filed July 12, 2010. |
| | | |
| (vi) | Terms and Conditions for restricted stock units granted in 2011 under 2005 Equity Incentive Plan. Exhibit 10.2 to the Second Quarter 2011 Form 10-Q. |
| |
| 10(g)* | Management Performance Improvement Plan, as amended and restated as of February 19, 2010. Exhibit 10(h) to the 2009 Form 10-K. |
| | |
| 10(h)* | Change in Control Agreement dated as of February 25, 2010, between the Registrant and Frank T. Lennon. Exhibit 10.3 to the Registrant’s Current Report on Form 8-K filed February 25, 2010. |
| | |
| 10(i)* | (i) | Form of severance agreement between the Registrant and Frank T. Lennon. Exhibit 10(o)(ii) to the 1997Registrant’s Annual Report on Form 10-K.10-K for the year ended December 31, 1997. |
| | |
| | (ii) | Form of Amendment No. 1 to severance agreement. Exhibit 10(j)(ii) to the Registrant’s Annual reportReport on Form 10-K for the year ended December 31, 2008 (the “2008 Form 10-K”). |
| | |
| 10(j)* | (i) | Employment Agreement dated as of May 4, 1998, among the Registrant, Brink’s, Incorporated and Michael T. Dan. Exhibit 10(a) to the Registrant’s Quarterly Report on Form 10-Q for the quarter ended September 30, 1998 (the “Third Quarter 1998 Form 10-Q”).1998. |
| | |
| | (ii) | Amendment No. 1 to Employment Agreement among the Registrant, Brink’s, Incorporated and Michael T. Dan. Exhibit 10 to the Registrant’s Quarterly Report on Form 10-Q for the quarter ended June 30, 2002. |
| | |
| | (iii) | Amendment No. 2 to Employment Agreement among the Registrant, Brink’s, Incorporated and Michael T. Dan. Exhibit 10 to the Registrant’s Current Report on Form 8-K filed March 10, 2006. |
| | |
| | (iv) | Amendment No. 3 to Employment Agreement among the Registrant, Brink’s, Incorporated and Michael T. Dan. Exhibit 10(k)(iv) to the 2008 Form 10-K. |
| | | |
| | (v) | Amendment No. 4 to Employment Agreement among the Registrant, Brink’s, Incorporated and Michael T. Dan. Exhibit 10.1 to the Registrant’s Current Report on Form 8-K filed May 13, 2009. |
| | |
| 10(k)* | Succession Agreement, dated November 13, 2011, between the Registrant and Michael T. Dan. Exhibit 10.1 to the Registrant’s Current Report on Form 8-K filed November 14, 2011. |
| |
| 10(l)* | Change in Control Agreement dated as of February 25, 2010, between the Registrant and Michael T. Dan. Exhibit 10.1 to the Registrant’s Current Report on Form 8-K filed February 25, 2010. |
| | |
10(l)10(m)* | Change in Control Agreement dated as of February 25, 2010, between the Registrant and Joseph W. Dziedzic. Exhibit 10.2 to the Registrant’s Current Report on Form 8-K filed February 25, 2010. |
| | |
10(m)10(n)* | Change in Control Agreement dated as of February 25, 2010, between the Registrant and McAlister C. Marshall, II. Exhibit 10.4 to the Registrant’s Current Report on Form 8-K filed February 25, 2010. |
| | |
10(n)* | Restricted Stock Unit Award Agreement, dated as of September 15, 2008, between the Registrant and McAlister C. Marshall, II. Exhibit 10(q) to the 2008 Form 10-K. |
| |
10(o)* | Change in Control Agreement dated as of February 25, 2010, between the Registrant and Matthew A.P. Schumacher. Exhibit 10.5 to the Registrant’s Current Report on Form 8-K filed February 25, 2010. |
| |
10(p)* | Form of Indemnification Agreement entered into by the Registrant with its directors and officers. Exhibit 10(l) to the 1991 Form 10-K. |
| | |
10(q)* | (i) | Retirement Plan for Non-Employee Directors, as amended. Exhibit 10(g) to the Registrant’s Quarterly Report on Form 10-Q for the quarter ended September 30, 1994 (the “Third Quarter 1994 Form 10-Q”). |
| |
| (ii) | Form of letter agreement dated as of September 16, 1994, between the Registrant and its Non-Employee Directors pursuant to Retirement Plan for Non-Employee Directors. Exhibit 10(h) to the Third Quarter 1994 Form 10-Q. |
| |
10(r)10(p)* | Non-Employee Directors’ Stock Option Plan, as amended and restated as of July 8, 2005. Exhibit 10.2 to the Registrant’s Quarterly Report on Form 10-Q for the quarter ended June 30, 2005. |
| | |
10(s)10(q)* | Directors’ Stock Accumulation Plan, as amended and restated as of September 12, 2008. Exhibit 10.1 to the Third Quarter 2008 Form 10-Q. |
| | |
10(t)10(r)* | Non-Employee Directors’ Equity Plan. Annex B to the Proxy Statement for the Registrant’s 2008 Annual Meeting of Shareholders. |
| | |
10(u)10(s)* | (i) | Form of Award Agreement for deferred stock units granted in 2008 under the Non-Employee Directors’ Equity Plan. Exhibit 10.3 to the Registrant’s Quarterly Report on Form 10-Q for the quarter ended June 30, 2008 (the “Second Quarter 2008 Form 10-Q”).2008. |
| | | |
| | (ii) | Form of Award Agreement for deferred stock units granted in 2009, 2010 and 20102011 under the Non-Employee Directors Equity Plan. Exhibit 10.5 to the Registrant’s Quarterly Report on Form 10-Q for the quarter ended June 30, 2009 (the “Second Quarter 2009 Form 10-Q”). |
| | |
10(v)10(t)* | Plan for Deferral of Directors’ Fees, as amended and restated as of November 14, 2008. Exhibit 10(y) to the 2008 Form 10-K. |
| | |
10(w)10(u) | (i) | Trust Agreement for The Brink’s Company Employee Welfare Benefit Trust. Exhibit 10(t) to the 1999Registrant’s Annual Report on Form 10-K.10-K for the year ended December 31, 1999. |
| | |
| | (ii) | First Amendment of The Brink’s Company Employee Welfare Benefit Trust, dated as of November 1, 2001. Exhibit 10(t)(ii) to the to the Registrant’s Annual Report on Form 10-K for the year ended December 31, 2007 (the “2007 Form 10-K.10-K”). |
| | |
| | (iii) | Second Amendment of The Brink’s Company Employee Welfare Benefit Trust, dated as of September 30, 2003. Exhibit 10(t)(iii) to the 2007 Form 10-K. |
| | |
10(x)10(v) | (i) | $43,160,000 Bond Purchase Agreement, dated September 17, 2003, among the Peninsula Ports Authority of Virginia, Dominion Terminal Associates, Pittston Coal Terminal Corporation and the Registrant. Exhibit 10.1 to the Second Quarter 2009 Form 10-Q. |
| | |
| | (ii) | Loan Agreement between the Peninsula Ports Authority of Virginia and Dominion Terminal Associates, dated September 1, 2003. Exhibit 10.2(ii) to the ThirdRegistrant’s Quarterly Report on Form 10-Q for the quarter ended September 30, 2003 (the “Third Quarter 2003 Form 10-Q.10-Q”). |
| | |
| | (iii) | Indenture and Trust between the Peninsula Ports Authority of Virginia and Wachovia Bank, National Association (“Wachovia”), as trustee, dated September 1, 2003. Exhibit 10.2(iii) to the Third Quarter 2003 Form 10-Q. |
| | |
| | (iv) | Parent Company Guaranty Agreement, dated September 1, 2003, made by the Registrant for the benefit of Wachovia. Exhibit 10.2(iv) to the Third Quarter 2003 Form 10-Q. |
| | |
| | (v) | Continuing Disclosure Undertaking between the Registrant and Wachovia, dated September 24, 2003. Exhibit 10.2(v) to the Third Quarter 2003 Form 10-Q. |
| | |
| | (vi) | Coal Terminal Revenue Refunding Bond (Dominion Terminal Associates Project – Brink’s Issue) Series 2003. Exhibit 10.2(vi) to the Third Quarter 2003 Form 10-Q. |
| | |
10(y)10(w) | $135,000,00085,000,000 Amended and Restated Letter of Credit Agreement, dated as of July 23, 2008 with an effective date of August 13, 2008,June 17, 2011, among the Registrant, certain of the Registrant’s subsidiariesPittston Services Group Inc., Brink’s Holding Company, Brink’s, Incorporated, and ABN AMRO Bank N.V. (now The Royal Bank of Scotland N.V.) Exhibit 10.2 to Second Quarter 2009 Form 10-Q. |
| |
10(z) | (i) | Credit Agreement, dated July 13, 2005, among the Registrant, certain of its subsidiaries and ABN AMRO Bank N.V. (now The Royal Bank of Scotland N.V.) Exhibit 10.3 to Second Quarter 2009 Form 10-Q. |
| |
| (ii) | First Amendment to Credit Agreement, entered into as of December 22, 2006, by and among the Registrant, Brink’s, Incorporated and ABN AMRO Bank N.V. (now The Royal Bank of Scotland N.V.) Exhibit 10.210.1 to the Registrant’s Current Report on Form 8-K filed December 22, 2006.June 20, 2011. |
| | |
| 10(x) | (iii) | Second Amendment to$30,000,000 Amended and Restated Credit Agreement, entered intodated as of March 24, 2008, by andOctober 3, 2011, among the Registrant, Pittston Services Group Inc., Brink’s Holding Company, Brink’s, Incorporated, and ABN AMRO Bank N.V. (now The Royal Bank of Scotland N.V.) and RBS Securities Inc. Exhibit 10(cc)(iii)10.1 to the 2008Registrant’s Current Report on Form 10-K.8-K filed October 5, 2011. |
| | |
10(aa)10(y) | (i) | $400,000,000 Credit Agreement, dated as of July 16, 2010, among the Registrant, as Parent Borrower and as a Guarantor, the subsidiary borrowers referred to therein, as Subsidiary Borrowers, certain of Parent Borrower’s subsidiaries, as Guarantors, Wells Fargo Bank, National Association, as Administrative Agent, an Issuing Lender, Swingline Lender and a Revolving A Lender, Bank of Tokyo-Mitsubishi UFJ Trust Company and Societe Generale, as Co-Documentation Agents and Revolving A Lenders, Bank of America, N.A. and JPMorgan Chase Bank, N.A., as Co-Syndication Agents and Revolving A Lenders, and various other Revolving A Lenders and Revolving B Lenders named therein. Exhibit 10.1 to the Registrant’s Current Report on Form 8-K filed July 20, 2010. |
| | | |
10(bb) | (ii) | First Amendment to Credit Agreement, dated as of January 6, 2012, among the Registrant, as Parent Borrower and as a Guarantor, the subsidiary borrowers referred to therein, as Subsidiary Borrowers, certain of Parent Borrower’s subsidiaries, as Guarantors, Wells Fargo Bank, National Association, as Administrative Agent, and the various lenders named therein. Exhibit 10.1 to the Registrant’s Current Report on Form 8-K filed January 9, 2012. |
| |
| 10(z) | $54,000,000 Continuing Agreement for Standby Letters of Credit, dated as of December 10, 2010, between the Registrant and The Bank of Tokyo-Mitsubishi UFJ, Ltd., New York Branch. Exhibit 10.1 to the Registrant’s Current Report on Form 8-K filed December 13, 2010. |
| | |
10(cc)10(aa) | Note Purchase Agreement, dated as of January 24, 2011, among the Registrant, Pittston Services Group Inc., Brink’s Holding Company, Brink’s, Incorporated, and the purchasers party thereto. Exhibit 10.1 to the Registrant’s Current Report on Form 8-K filed January 26, 2011. |
| | |
10(dd)10(bb) | $25,000,000 Committed Letter of Credit Issuance and Reimbursement Agreement, dated as of January 24, 2012, by and between the Registrant and HSBC Bank USA, N.A. Exhibit 10.1 to the Registrant’s Current Report on Form 8-K filed January 26, 2012. |
| |
| 10(cc) | Stock Purchase Agreement, dated as of November 15, 2005, by and among BAX Holding Company, BAX Global Inc., The Brink’s Company and Deutsche Bahn AG. Exhibit 2.1 to the Registrant’s Current Report on Form 8-K filed November 16, 2005. |
| | |
10(ee)10(dd) | Separation and Distribution Agreement between the Registrant and Brink’s Home Security Holdings, Inc. dated as of October 31, 2008. Exhibit 10.1 to the Registrant’s Current Report on Form 8-K filed November 5, 2008. |
| | |
10(ff)10(ee) | Tax Matters Agreement between the Registrant and Brink’s Home Security Holdings, Inc. dated as of October 31, 2008. Exhibit 10.3 to the Registrant’s Current Report on Form 8-K filed November 5, 2008. |
| | |
10(gg)10(ff) | Non-Competition and Non-Solicitation Agreement between the Registrant and Brink’s Home Security Holdings, Inc. dated as of October 31, 2008. Exhibit 10.4 to the Registrant’s Current Report on Form 8-K filed November 5, 2008. |
| | |
10(hh)10(gg) | Employee Matters Agreement between the Registrant and Brink’s Home Security Holdings, Inc. dated as of October 31, 2008. Exhibit 10.5 to the Registrant’s Current Report on Form 8-K filed November 5, 2008. |
| | |
| 21 | Subsidiaries of the Registrant. |
| | |
| 23 | Consent of Independent Registered Public Accounting Firm. |
| | |
| 24 | Powers of Attorney. |
| | |
| 31 | Rule 13a-14(a)/15d-14(a) Certifications. |
| | |
| 32 | Section 1350 Certifications. |
| | |
| 99(a)* | Excerpt from Pension-Retirement Plan relating to preservation of assets of the Pension-Retirement Plan upon a change in control. Exhibit 99(a) to the 2008 Form 10-K. |
| | |
| 101 | Interactive Data File (Annual Report on Form 10-K, for the year ended December 31, 2010,2011, furnished in XBRL (eXtensible Business Reporting Language)). Attached as Exhibit 101 to this report are the following documents formatted in XBRL: (i) the Consolidated Balance Sheets at December 31, 2010,2011, and December 31, 2009,2010, (ii) the Consolidated Statements of Income for the years ended December 31, 2011, 2010 2009 and 2008,2009, (iii) the Consolidated Statements of Comprehensive Income (Loss) for the years ended December 31, 2011, 2010 2009 and 2008,2009, (iv) the Consolidated StatementStatements of Shareholders' Equity for the years ended December 31, 2011, 2010 and 2009, and 2008, (iv)(v) the Consolidated Statements of Cash Flows for the years ended December 31, 2011, 2010 and 2009, and 2008, and (iv)(vi) the Notes to Consolidated Financial Statements, tagged as blocks of text. Users of this data are advised pursuant to Rule 406T of Regulation S-T that this interactive data file is deemed not filed or part of a registrati onregistration statement or prospectus for purposes of sections 11 or 12 of the Securities Act of 1933, is deemed not filed for purposes of section 18 of the Securities and Exchange Act of 1934, and otherwise is not subject to liability under these sections. |
*Management contract or compensatory plan or arrangement.