THE BRINK’S COMPANY
FORM 10-K
FOR THE YEAR ENDED DECEMBER 31, 20132014
TABLE OF CONTENTS
PART I
| Page | ||
| Item 1. | Business | 1 |
| Item 1A. | Risk Factors | 7 |
| Item 1B. | Unresolved Staff Comments | |
| Item 2. | Properties | |
| Item 3. | Legal Proceedings | |
| Item 4. | Mine Safety Disclosures | |
| Executive Officers of the Registrant | ||
| PART II | ||
| Item 5. | Market for Registrant’s Common Equity, Related Stockholder Matters and Issuer | |
| Purchases of Equity Securities | ||
| Item 6. | Selected Financial Data | |
| Item 7. | Management’s Discussion and Analysis of Financial Condition and Results of Operations | |
| Item 7A. | Quantitative and Qualitative Disclosures About Market Risk | |
| Item 8. | Financial Statements and Supplementary Data | |
| Item 9. | Changes in and Disagreements with Accountants on Accounting and Financial Disclosure | |
| Item 9A. | Controls and Procedures | |
| Item 9B. | Other Information | |
| PART III | ||
| Item 10. | Directors, Executive Officers and Corporate Governance | |
| Item 11. | Executive Compensation | |
| Item 12. | Security Ownership of Certain Beneficial Owners and Management and Related Stockholder Matters | |
| Item 13. | Certain Relationships and Related Transactions, and Director Independence | |
| Item 14. | Principal Accountant Fees and Services | |
| PART IV | ||
| Item 15. | Exhibits and Financial Statement Schedules |
| PART I |
ITEM 1. BUSINESS
Overview
The Brink’s Company is a premier provider of secure logistics and security solutions, including cash-in-transit, ATM replenishment and maintenance, secure international transportation of valuables, and cash management services, to financial institutions, retailers, government agencies including(including central banks,banks), mints, jewelers and other commercial operations around the world. Our internationalglobal network serves customers in more than 100 countries and employsincludes ownership interest in 41 countries and agency relationships with companies in additional countries. We employ approximately 65,100 people. Our64,100 people and our operations include approximately 1,0001,100 facilities and 12,70012,300 vehicles. Brink’s was founded in 1859 and The Brink’s Company was first incorporated in 1930 under the laws of the State of Delaware (at that time, the Company was named The Pittston Company). It succeeded to the business of a Virginia corporation in 1986 and was renamed The Brink’s Company in 2003. Our headquarters are located in Richmond, Virginia. A significant portion of our business is conducted internationally, with 82% of our $3.9 billion in revenues earned outside the United States. The Brink’s Company, along with its subsidiaries, is referred to as “we,” “our,”, “us,” “Brink’s,” or “the Company” throughout this Form 10-K.
Brink’s operations are located throughout the world with the majority80% of our revenues (77%) and segment94% of operating profit (98%) earned outside of North America.
| (In millions) | 2014 | % total | % change | 2013 | % total | % change | 2012 | % total | % change | |||||||
| Revenues by segment: | ||||||||||||||||
| Largest 5 Markets: | ||||||||||||||||
| U.S. | $ | 727.8 | 20 | 3 | $ | 707.5 | 19 | - | $ | 706.7 | 20 | (4) | ||||
| France | 517.4 | 15 | - | 517.6 | 14 | 1 | 511.4 | 14 | (1) | |||||||
| Mexico | 388.2 | 11 | (8) | 423.9 | 11 | 7 | 395.0 | 11 | 2 | |||||||
| Brazil | 364.1 | 10 | 3 | 354.4 | 9 | (3) | 363.6 | 10 | 1 | |||||||
| Canada | 179.7 | 5 | (6) | 191.4 | 5 | 2 | 187.5 | 5 | (1) | |||||||
| Largest 5 Markets | 2,177.2 | 61 | (1) | 2,194.8 | 58 | 1 | 2,164.2 | 60 | (1) | |||||||
| Latin America | 592.4 | 17 | (31) | 854.2 | 23 | 15 | 744.4 | 21 | 17 | |||||||
| EMEA | 556.3 | 16 | 3 | 540.6 | 14 | 7 | 503.1 | 14 | (4) | |||||||
| Asia | 139.8 | 4 | 4 | 134.2 | 4 | 7 | 125.9 | 4 | - | |||||||
| Global Markets | 1,288.5 | 36 | (16) | 1,529.0 | 40 | 11 | 1,373.4 | 38 | 7 | |||||||
| Payment Services | 96.6 | 3 | 76 | 54.8 | 1 | 37 | 40.0 | 1 | (1) | |||||||
| Total Revenues | $ | 3,562.3 | 100 | (6) | $ | 3,778.6 | 100 | 6 | $ | 3,577.6 | 100 | 2 | ||||
| Amounts may not add due to rounding. | ||||||||||||||||
| (In millions) | 2013 | % total | % change | 2012 | % total | % change | 2011 | % total | % change | ||||||||||||||||
| Revenues by region: | |||||||||||||||||||||||||
| Latin America: | |||||||||||||||||||||||||
| Mexico | $ | 450.4 | 11 | 6 | $ | 424.0 | 11 | 2 | $ | 415.2 | 11 | fav | |||||||||||||
| Venezuela | 447.1 | 11 | 31 | 342.6 | 9 | 27 | 269.2 | 7 | 45 | ||||||||||||||||
| Brazil | 392.0 | 10 | 1 | 388.3 | 10 | - | 386.8 | 11 | 28 | ||||||||||||||||
| Other | 431.2 | 11 | 2 | 424.5 | 11 | 9 | 389.5 | 11 | 16 | ||||||||||||||||
| Total | 1,720.7 | 44 | 9 | 1,579.4 | 42 | 8 | 1,460.7 | 40 | 66 | ||||||||||||||||
| EMEA | |||||||||||||||||||||||||
| France | 542.5 | 14 | 1 | 535.5 | 14 | (2) | 545.2 | 15 | 7 | ||||||||||||||||
| Other | 635.8 | 16 | 8 | 590.4 | 16 | (1) | 597.8 | 16 | 16 | ||||||||||||||||
| Total | 1,178.3 | 30 | 5 | 1,125.9 | 30 | (1) | 1,143.0 | 31 | 12 | ||||||||||||||||
| North America | |||||||||||||||||||||||||
| U.S. | 707.5 | 18 | - | 706.7 | 19 | (4) | 733.5 | 20 | - | ||||||||||||||||
| Canada | 190.9 | 5 | 2 | 186.6 | 5 | (2) | 189.9 | 5 | 2 | ||||||||||||||||
| Total | 898.4 | 23 | 1 | 893.3 | 24 | (3) | 923.4 | 25 | 1 | ||||||||||||||||
| Asia Pacific | 144.8 | 4 | 6 | 136.4 | 4 | - | 135.8 | 4 | 27 | ||||||||||||||||
| Total Revenues | $ | 3,942.2 | 100 | 6 | $ | 3,735.0 | 100 | 2 | $ | 3,662.9 | 100 | 25 | |||||||||||||
| Amounts may not add due to rounding. | |||||||||||||||||||||||||
Geographic financial information related to revenues and long-lived assets is included in the consolidated financial statements on page 82.77.
1
Mission and Strategy
Our mission is to be the world’s leading provider of secure logistics services for cash and other valuables. Our goal is to achieve consistent growth in revenues, profits, cash flows and shareholder value. Our near-term focus is on maximizing operating efficiency to enhance profitability and competitive position. We believe this will enhance our ability to pursue growth opportunities.
Our primary strategy is to focus our efforts and investments on our five largest countries (U.S., France, Mexico, Brazil and Canada). Our greatest near-term opportunity is to execute profit turnarounds in the U.S. and Mexico, which together generated revenues of $1.1 billion in 2014.
Our cost and productivity initiatives are supplemented by efforts to expand the breadth of our supply chain services. As we achieve success in our large markets, we will integrate these services into smaller markets.
Growing Profits with Cost and Productivity Improvements
Achieving substantial improvements in operational efficiency is critical to enhancing our competitive position and pursuing future growth. Our efforts to improve operational efficiency include:
| · | consolidating organizational structure to streamline management and administrative expenses |
| · | centralizing support functions to reduce costs and enable country-level operating management to focus on customers and operations |
| · | using “Lean” principles to improve processes and reduce costs at the branch level |
| · | improving route logistics with IT-based productivity tools |
| · | leveraging global purchasing power to reduce costs for vehicles, equipment, maintenance, travel and other services |
Growing Revenues by Expanding Service Offerings
Collaborating with customers and providing new services will help us grow our business. We plan to expand our services across our customers’ entire cash and valuable supply chains and business processes. Improving our customers’ supply-chain efficiency reduces the total cost of the process, improves our value-added pricing and generates opportunities for customers to outsource more services to Brink’s. These opportunities include:
| · | integrated armored transportation and money processing services |
| · | full-service management of entire ATM networks |
| · | CompuSafe® service (“intelligent safes”) |
| · | new market opportunities for Global Services |
Transforming Culture: Accountability, Customer Focus and Trust (“ACT”)
As part of our ongoing cultural transformation, we continue to promote ACT and endeavor to ensure that our employees demonstrate these values and related behaviors. We will place leaders who consistently demonstrate ACT behaviors in our most critical roles.
2014 Reorganization and Restructuring
We announced a reorganization and restructuring of Brink’s global organization in the fourth quarter of 2014, followed by the announcement in February 2015 of an additional reduction in our global workforce. These actions accelerate the execution of our growth strategy by reducing costs and providing for a more streamlined and centralized organization. We believe these actions will save direct costs of approximately $45 to $50 million in 2015 compared to 2014, excluding severance, lease termination and pension settlement charges. Following is a summary of key actions in connection with the reorganization and restructuring:
| · | We reorganized the majority of Brink’s country operations under two business units: Largest 5 Markets (including U.S., France, Mexico, Brazil and Canada), and Global Markets (the 36 countries besides the Largest 5 Markets). Country operations typically provide Cash-in-Transit (“CIT”) Services, ATM Services, Cash Management Services and Global Services. Reporting lines within these two business units are supplemented by a matrixed centralized management of the Global Services operations. |
| · | We decided to maintain our centralized organization structure for the Payment Services business. |
| · | We centralized the reporting structure of our support functions, including IT, HR, finance, legal, procurement, security and project management. Under the new structure, field employees now report to the global functional leaders instead of the country or regional leaders. |
| · | We eliminated regional roles and structures in Europe, Middle East and Africa (“EMEA”) and Latin America and are planning to exit the regional office leased spaces in 2015. |
| · | We substantially completed a global workforce reduction of 1,700 positions, which accounts for $30 to $35 million of the projected 2015 savings. |
2
Beginning in 2014, as a result of the restructuring, we report financial results in the following nine operating segments:
| · | Each of the five countries within Largest 5 Markets (U.S., France, Mexico, Brazil and Canada) |
| · | Each of the three regions within Global Markets (Latin America, EMEA and Asia representing a total of 36 countries) |
| · | Payment Services |
Previously, the our reportable segments were: Latin America, EMEA, North America and Asia Pacific.
Financial information related to our segments and amounts not allocated to segments is included in the consolidated financial statements on pages 74–78.
Other Important Events and Transactions in 2014
In addition to the 2014 Reorganization and Restructuring, the following key events and transactions occurred in 2014.
U.S. retirement plans. We contributed $87 million to our primary U.S. pension plan in 2014 and do not expect to contribute additional amounts in the future. We also completed a buy-out of the pension benefits of 4,300 plan participants. After the buy-out, there are approximately 15,200 beneficiaries in the plan. The buy-out significantly reduced the plan assets and obligations and resulted in a settlement loss in the fourth quarter of 2014 of $56 million. We adopted new mortality tables to estimate the obligations of our U.S. retirement plans, which increased the obligations by approximately $90 million.
Venezuela. We adopted a new currency exchange rate in March 2014 to report our Venezuela operations. The new rate is 88% less favorable than the previous rate. Translating our Venezuelan operations at the new rate significantly reduces the portion of our consolidated results attributable to Venezuela.
Sale of Netherlands business. We sold our Netherlands operations in December 2014 after a major customer notified us we would lose their business in 2015. The business had $126 million in revenues in 2014.
Sale of ownership interest in Peru business. We sold a noncontrolling interest in a CIT business based in Peru during 2014.
Services
Core Services (55%52% of total revenues in 2013)2014)
CIT and ATM Services are core services we provide to customers throughout the world. We charge customers per service performed or based on the value of goods transported. As a result, revenues are affected by the level of economic activity in various markets as well as the volume of business for specific customers. Core services generated approximately $2.2$1.9 billion of revenues in 2013.2014.
CIT Services – Serving customers since 1859, our success in CIT is driven by a combination of rigorous security practices, high-quality customer service, risk management and logistics expertise. CIT Services generally include the secure transportation of:
| · | cash between businesses and financial institutions, such as banks and credit unions |
| · | cash, securities and other valuables between commercial banks, central banks and investment banking and brokerage firms |
| · | new currency, coins, bullion and precious metals for central banks and other customers |
ATM Services – We manage 91,000 ATMs worldwide. We provide customers who own and operate ATMs a variety of service options. We manage 88,800 ATMs worldwide.provide basic ATM management services using our secure transportation network, including cash replenishment and first and second line maintenance. We also provide comprehensive services for ATM management through our Brink's Integrated Managed Services (“Brink’s IMS”) offering. Brink's IMS’s offerings include cash replenishment, replenishment forecasting, cash optimization, ATM remote monitoring, service call dispatching, transaction processing, installation services, and first and second line maintenance.
High-Value Services (37%39% of total revenues in 2013)2014)
Our Core Services, combined with our brand and global infrastructure, provide a substantial platform from which we offer additional High-Value Services. High-Value Services generated approximately $1.5$1.4 billion of revenues in 2013.2014.
Global Services – Serving customers in more than 100 countries, Brink’s is a leading global provider of secure logistics, serving customers in over 100 countries. We provide customers with secure transportation services, picking up valuables from customer locations, packing them for valuables includingtransport, and managing customs clearance as the package enters a country. We also offer secure vault storage and inventory management of customer valuables. We use a combination of armored vehicles and secure air and sea transportation. Valuables transported by our Global Services business include diamonds, jewelry, precious metals, securities, currency, high-tech devices, electronics and pharmaceuticals. Our comprehensive suite of services includes packing, pickup, secure storage, inventory management, customs clearance, consolidation and secure transport and delivery through a combination of armored vehicles and secure air and sea transportation to leverage our extensive global network. Our specialized diamond and jewelry operations have offices in the world’s major diamond and jewelry centers.
Cash Management Services – We offer customized Cash Management Services based on customers’ unique needs. A customer may have simple requirements or may benefit from Brink’s offers a fully integrated approach to managing thetheir supply chain of cash,cash. Customers may elect to receive logistic support from point-of-sale through transport, vaulting, bank deposit and related credit. We believe the quality and scope of our money processing and information systems differentiate our Cash Management Services from competitive offerings. Cash Management Services include:
| · | money processing (e.g., counting, sorting, wrapping, checking condition of bills, etc.) and other cash management services |
| · | deploying and servicing “intelligent” safes and safe control devices, including our patented CompuSafe® service |
| · | integrated check and cash processing services (“Virtual Vault”) |
| · | check imaging services |
Brink’s offers a variety of advanced technology applications, including online cash tracking, cash inventory management, check imaging for real-time deposit processing, and a variety of other web-based tools that enable banks and other customers to reduce costs while improving service to their customers.
Brink’s CompuSafe® Service. Brink’s CompuSafe service offers customers an integrated, closed-loop system for preventing theft and managing cash. We market CompuSafe services to a variety of cash-intensive customers, such as convenience stores, gas stations, restaurants, retail chains and entertainment venues. Once the specialized safe is installed, the customer’s employees deposit currency into the safe’s cassettes, which can only be removed by Brink’s personnel. Upon removal, the cassettes are securely transported to a vault for processing where contents are verified and transferred for deposit. Our CompuSafe service features currency-recognition and counterfeit-detection technology, multi-language touch screens and an electronic interface between the point-of-sale, back-office systems and external banks. Our electronic reporting interface with external banks enables customers to receive same-day credit on their cash balances, even if the cash remains on the customer’s premises.
Virtual Vault. Virtual Vault services combine CIT Services, Cash Management Services, vaulting and electronic reporting technologies to help banks expand into new markets while minimizing investment in vaults and branch facilities. In addition to providing secure storage, we process deposits, provide check imaging and reconciliation services, perform currency inventory management, process ATM replenishment orders and electronically transmit banking transactions.
Payment Services – We provide convenient payment services, including bill payment processing, mobile phone top-up, and Brink’s Money™ prepaid cards, and the Brink’s Checkout service.cards.
Latin America. Bill payment processing services include bill payment acceptance and processing services on behalf of utility companies and other billers. Consumers can pay bills, top-up prepaid mobile phones and manage accounts at Brink’s payment locations orretail agent locations that we operate on behalf of utility companies and banks.banks as well as a small number of leased payment locations. This service is offered at over 20,00025,000 locations in Brazil, Mexico, Colombia and Panama.
United States. We offer Brink’s Money™ general purpose reloadable prepaid cards and payroll cards to consumers and employers. Our general purpose reloadable cards are sold to consumers through our direct-to-consumer marketing efforts while our payroll cards are sold to employers so that they canwho use them to pay their employees electronically. Brink’s Money™ cards can be used at stores, restaurants and online retailers, and provide access to cash at ATM’s worldwide, and are more efficient than traditional paper paychecks.ATMs worldwide. This product is targeted to the millions of unbanked and under-banked Americans looking for alternative financial products.
Commercial Security Systems –We provide commercial security system services in designated markets in Europe. Our security system design and installation services include alarms, motion detectors, closed-circuit televisions, digital video recorders, and access control systems, including card and biometric readers, electronic locks, and turnstiles. Monitoring services may also be provided after systems have been installed.
Other Security Services (8%9% of total revenues in 2013)2014)
We offer security and guarding services in France, Luxembourg, Greece, Germany, Brazil and Germany.Ireland. A portion of this business involves long-term contracts related primarily to security services at airports and embassies. Generally, guarding contracts are for a one-year period, and the majority of contracts are extended.
Industry and Competition
Brink’s competes with large multinational, regional and smaller companies throughout the world. Our largest multinational competitors are G4S plc (U.K.); Loomis AB (Sweden); Prosegur, Compania de Seguridad, S.A. (Spain); and Garda World Security Corporation (Canada).
We believe the primary factors in attracting and retaining customers are security expertise, service quality, and price. Our competitive advantages include:
| · | brand name recognition |
| · | reputation for a high level of service and security |
| · | risk management and logistics expertise |
| · |
| global infrastructure and customer base |
| · | proprietary cash processing |
| · | proven operational excellence |
| · | high-quality insurance coverage and financial strength |
Although we face competitive pricing pressure in many markets, we resist competing on price alone. We believe our high levels of service and security, as well as value-added solutions differentiate us from competitors.
Insurance Coverage
The availability of high-quality and reliable insurance coverage is an important factor in our ability to attract and retain customers and manage the risks inherent in our business. We purchase insurance coverage for losses in excess of what we consider to be prudent levels of self-insurance. Our insurance policies cover losses from most causes, with the exception of war, nuclear risk and certain other exclusions typical in such policies.
Insurance for security is provided by different groups of underwriters at negotiated rates and terms. Premiums fluctuate depending on market conditions. The security loss experience of Brink’s and, to a limited extent, other armored carriers affects our premium rates.
Service Mark and Patents
BRINKS is a registered service mark in the U.S. and certain foreign countries. The BRINKS mark, name and related marks are of material significance to our business. We own patents for safes and related services, including our integrated CompuSafe® service, which expire between 2015 and 2027.2028. These patents provide us with important advantages; however, we are not dependent on the existence of these patents.
We have licensed the Brink’s name to a limited number of companies, including a distributor of security products (padlocks, door hardware, etc.) offered for sale to consumers through major retail chains.
Government Regulation
Our U.S. operations are subject to regulation by the U.S. Department of Transportation with respect to safety of operations, equipment and financial responsibility. Intrastate operations in the U.S. are subject to state regulation. Operations outside of the United States are regulated to varying degrees by the countries in which we operate.
5
Employee Relations
At December 31, 2013,2014, our company had approximately 65,10064,100 full-time and contract employees, including approximately 7,6007,800 employees in the United States (of whom approximately 950750 were classified as part-time employees) and approximately 57,50056,300 employees outside the United States. At December 31, 20132014, Brink’s was a party to twelve collective bargaining agreements in North America with various local unions covering approximately 1,700 employees. The agreements have various expiration dates from 20142015 to 2020.2019. Outside of North America, approximately 58%59% of employees are represented by trade union organizations. We believe our employee relations are satisfactory.
Discontinued Operations
Below is a summary of the significant businesses we disposed in the last three years. See note 1819 to the consolidated financial statements for more information on these dispositions. The results of these operations, except for the sale of the noncontrolling interest, have been excluded from continuing operations and are reported as discontinued operations for the current and prior periods. We continue to operate our Global Services business in eachmost of these countries.
Cash-in-transit operations sold or shut down:
| · | Poland (sold in March 2013) |
| · | Turkey (shut down in June 2013) |
| · | Hungary (sold in September 2013) |
| · | Germany (sold in December 2013) |
| · | Australia (sold in October 2014) |
| · | Puerto Rico (shut down in November 2014) |
| · | Netherlands (sold in December 2014) |
Guarding operations sold:
| · | Morocco (December 2012) |
| · | France (January 2013) |
| · | Germany (July 2013) |
Other operations sold:
| · | We sold Threshold Financial Technologies, Inc. in Canada in November 2013. Threshold operated private-label ATM network and payment processing businesses. Brink’s continues to own and operate Brink’s Integrated Managed Services for ATM customers. |
| · | We sold ICD Limited and other affiliated subsidiaries in November 2013. ICD had operations in China and other locations in Asia. ICD designed and installed security systems for commercial customers. |
Available Information and Corporate Governance Documents
The following items are available free of charge on our website (www.brinks.com) as soon as reasonably possible after filing or furnishing them with the Securities and Exchange Commission (the “SEC”):
| · | Annual reports on Form 10-K |
| · | Quarterly reports on Form 10-Q |
| · | Current reports on Form 8-K, and amendments to those reports |
The following documents are also available free of charge on our website:
| · | Corporate |
| · |
| · | The charters of the following committees of our Board of Directors (the “Board”): Audit and Ethics, Compensation and Benefits, and Corporate Governance and Nominating |
Printed versions of these items will be mailed free of charge to shareholders upon request. Such requests can be made by contacting the Corporate Secretary at 1801 Bayberry Court, P. O. Box 18100, Richmond, Virginia 23226-8100.
6
ITEM 1A. RISK FACTORS
We operate in highly competitive industries.
We compete in industries that are subject to significant competition and pricing pressures in most markets. In addition, our business model requires significant fixed costs associated with offering many of our services including costs to operate a fleet of armored vehicles and a network of secure branches. Because we believe we have competitive advantages such as brand name recognition and a reputation for a high level of service and security, we resist competing on price alone. However, continued pricing pressure from competitors or failure to achieve pricing based on the competitive advantages identified above could result in lost volume of business and have an adverse effect on our business, financial condition, results of operations and cash flows. In addition, given the highly competitive nature of our industries, it is important to develop new solutions and product and service offerings to help retain and expand our customer base. Failure to develop, sell and execute new solutions and offerings in a timely and efficient manner could also negatively affect our ability to retain our existing customer base or pricing structure and have an adverse effect on our business, financial condition, results of operations and cash flows.
Decreased use of cash could have a negative impact on our business.
The proliferation of payment options other than cash, including credit cards, debit cards, stored-value cards, mobile payments and on-line purchase activity, could result in a reduced need for cash in the marketplace and a decline in the need for physical bank branches and retail stores. To mitigate this risk, we are developing new lines of business and investing in adjacent security-related markets, but there is a risk that these initiatives may not offset the risks associated with our traditional cash-based business and that our business, financial condition, results of operations and cash flows could be negatively impacted.
Our growth strategy may not be successful.
One element of our growth strategy is to expand our offerings to customers. We may not be successful in designing or marketing additional products and services to customers. In addition we may fail to achieve our strategic objectives and anticipated operating profit improvements, which would adversely affect our results of operations and cash flows.
We have significant operations outside the United States.
We currently serve customers in more than 100 countries, including 4341 countries where we operate subsidiaries. Eighty-twoEighty percent (82%(80%) of our revenuerevenues in 20132014 came from operations outside the U.S. We expect revenuerevenues outside the U.S. to continue to represent a significant portion of total revenue.revenues. Business operations outside the U.S. are subject to political, economic and other risks inherent in operating in foreign countries, such as:
| · | the difficulty of enforcing agreements, collecting receivables and protecting assets through foreign legal systems; |
| · | trade protection measures and import or export licensing requirements; |
| · | difficulty in staffing and managing widespread operations; |
| · | required compliance with a variety of foreign laws and regulations; |
| · | enforcement of our global compliance program in foreign countries with a variety of laws, cultures and customs; |
| · | varying permitting and licensing requirements in different jurisdictions; |
| · | foreign ownership laws; |
| · | changes in the general political and economic conditions in the countries where we operate, particularly in emerging markets; |
| · | threat of nationalization and expropriation; |
| · |
| higher costs and risks of doing business in a number of foreign jurisdictions; |
| · | laws or other requirements and restrictions associated with organized labor; |
| · | limitations on the repatriation of earnings; |
| · | fluctuations in equity, revenues and profits due to changes in foreign currency exchange rates, including measures taken by governments to devalue official currency exchange rates; |
| · | inflation levels exceeding that of the U.S; and |
| · | inability to collect for services provided to government entities. |
7
We are exposed to certain risks when we operate in countries that have high levels of inflation, including the risk that:
| · | the rate of price increases for services will not keep pace with the cost of inflation; |
| · | adverse economic conditions may discourage business growth which could affect demand for our services; |
| · | the devaluation of the currency may exceed the rate of inflation and reported U.S. dollar revenues and profits may decline; and |
| · | these countries may be deemed “highly inflationary” for U.S. generally accepted accounting principles (“GAAP”) purposes. |
We manage these risks by monitoring current and anticipated political and economic developments, monitoring adherence to our global compliance program and adjusting operations as appropriate. Changes in the political or economic environments of the countries in which we operate could have a material adverse effect on our business, financial condition, results of operations and cash flows.
We may be unable to achieve, or may be delayed in achieving, our costinitiatives to drive efficiency and control initiatives.costs.
We have launched a number of cost control initiatives, including the 2014 Reorganization and Restructuring described on page 2, to improve operating efficiencies and reduce operating costs. Although we have achieved annual cost savings associated with these initiatives, we may be unable to sustain the cost savings that we have achieved. In addition, if we are unable to achieve, or have any unexpected delays in achieving, additional cost savings, our results of operations and cash flow may be adversely affected. Even if we meet our goals as a result of these initiatives, we may not receive the expected financial benefits of these initiatives.
We may not be successful in pursuing strategic investments or acquisitions or realize the expected benefits of strategic acquisitionsthose transactions because of integration difficulties and other challenges, which may adversely affect our financial condition, results of operations or cash flows.challenges.
While we may identify opportunities for investments to support our growth strategy, as well as acquisition and divestiture opportunities, our due diligence examinations and positions that we may take with respect to appropriate valuations for acquisitions and divestitures and other transaction terms and conditions may hinder our ability to successfully complete business transactions to achieve our strategic goals. Our ability to realize the anticipated benefits from recent acquisitions will depend, in part, on successfully integrating each business with our company as well as improving operating performance and profitability through our management efforts and capital investments. The risks to a successful integration and improvement of operating performance and profitability include, among others, failure to implement our business plan, unanticipated issues in integrating operations with ours, unanticipated changes in laws and regulations, labor unrest resulting from union
operations, regulatory, environmental and permitting issues, the effect on our internal controls and compliance with the regulatory requirements under the Sarbanes-Oxley Act of 2002, and difficulties in fully identifying and evaluating potential liabilities, risks and operating issues. The occurrence of any of these events may adversely affect our expected benefits of the recentany acquisitions and may have a material adverse effect on our financial condition, results of operations or cash flows.
We have significant deferred tax assets in the United States that may not be realized.
Deferred tax assets are future tax deductions that result primarily from net operating losses and the net tax effects of temporary differences between the carrying amount of assets and liabilities for financial statement and income tax purposes. We have $242$287 million of U.S. deferred tax assets recorded at the end of 20132014 primarily related to our retirement plan obligations. These future tax deductions may not be realized if our expectations oftax rules change or if projected future margin improvements of our U.S. business are not attained.taxable income is insufficient. Consequently, not realizing our U.S. deferred tax assets may significantly and materially affect our financial condition, results of operations and cash flows.
8
We have significant retirement obligations. Poor investment performance of retirement plan holdings and / or lower interest rates used to discount the obligations could unfavorably affect our liquidity and results of operations.
We have substantial pension and retiree medical obligations, a portion of which have been funded. The amount of these obligations is significantly affected by factors that are not in our control, including interest rates used to determine the present value of future payment streams, investment returns, medical inflation rates, participation rates and changes in laws and regulations. The funded status of the primary U.S. pension plan was approximately 88% as of December 31, 2013.2014. Based on actuarial assumptions at the end of 2013,2014, we do not expect that we will be required to make any contributions totaling $110 million toin the plan over the next five years. Thisfuture. A change in assumptions could result in funding obligations that could adversely affect our liquidity and our ability to use our resources to make acquisitions and to otherwise grow our business.
We have $589$721 million of actuarial losses recorded in accumulated other comprehensive income (loss) at the end of 2013.2014. These losses relate to changes in actuarial assumptions that have increased the net liability for benefit plans. These losses have not been recognized in earnings. These losses will be recognized in earnings in future periods to the extent they are not offset by future actuarial gains. Our projections of future cash requirements and expenses for these plans could be adversely affected if our retirement plans have additional actuarial losses.
Our earnings and cash flow could be materially affected by increased losses of customer valuables.
We purchase insurance coverage for losses of customer valuables for amounts in excess of what we consider prudent deductibles and/or retentions. Insurance is provided by different groups of underwriters at negotiated rates and terms. Coverage is available to us in major insurance markets, although premiums charged are subject to fluctuations depending on market conditions. Our loss experience and that of other companies in our industry affects premium rates. We are not insured for losses below our coverage limits and recognize expense up to these limits for actual losses. Our insurance policies cover losses from most causes, with the exception of war, nuclear risk and various other exclusions typical for such policies. The availability of high-quality and reliable insurance coverage is an important factor in obtaining and retaining customers and managing the risks of our business. If our losses increase, or if we are unable to obtain adequate insurance coverage at reasonable rates, our financial condition, results of operations and cash flows could be materially and adversely affected.
The Venezuelan government recently announced a new currency exchange process, known locally as “SIMADI.” The new process is expected to replace the existing SICAD II exchange process. We currently use the SICAD II rate to measure our Venezuelan operations for our financial statements. We have not yet concluded whether the new rate will be used for our financial statements. We expect the exchange rate under the proposed exchange will be much less favorable than current rates, which could adversely affect our reported results for our Venezuelan operations in future years.
The new SIMADI currency exchange is expected to exchange Venezuelan bolivars to U.S. dollars at rates significantly less favorable than the current SICAD II exchange rates. The SICAD II rates have approximated 50 bolivars to the U.S. dollar since its inception in March 2014. At December 31, 2014, we held $12.6 million of cash and cash equivalents and $10.9 million other net monetary assets denominated in bolivars based on the official exchange rate we use to remeasure our Venezuelan operations. The SIMADI rate has ranged from 170 to 174 bolivars to the dollar between February 12 and February 26. Had we used a rate of 170, our revenues in 2014 would have declined by $183 million and our operating profit before items not allocated to segments would have declined by $39 million. Had a rate of 170 been in effect at December 31, 2014, we would have recognized additional currency losses to write down our net monetary assets of $16 million.
Currency restrictions in Venezuela limit our ability to use earnings and cash flows outside of Venezuela and may negatively affect ongoing operations in Venezuela.
Because most of our past requests to convert bolivars to dollars have not been approved and certain past processes to obtain dollars are no longer available, we do not expect to be able to repatriate cash from Venezuela for the foreseeable future. Therefore, we do not expect to be able to use cash held in Venezuela for any purpose outside of that country, including reducing our U.S. debt, funding growth or business acquisitions or returning cash to shareholders.
We believe that currency exchange restrictions in Venezuela may disrupt the operation of our business in Venezuela because we may be unable to pay for goods and services that are required to be paid in dollars. This could reduce our ability to provide services to our customers in Venezuela, or could increase the cost of delivering the services, which would negatively affect our earnings and cash flows, and could result in a loss of control, deconsolidation, shutdown or loss of the business in Venezuela.
9
Currency restrictions in Argentina may require us to use more expensive methods to repatriate earnings.
The Argentinean government has, from time-to-time, imposed limits on the exchange of local pesos into U.S. dollars. As a result, we have elected in the past and may elect in the future to repatriate cash from Argentina using alternative legal methods, which may result in less favorable exchange rates. At December 31, 2014, our Argentinean operations held $6.6 million in Argentinean pesos.
We have risks associated with confidential individual information.
In the normal course of business, we collect, process and retain sensitive and confidential information, including information about individuals. Despite the security measures we have in place, our facilities and systems, and those of third-party service providers and business partners, could be vulnerable to security breaches (including cybersecurity breaches), acts of vandalism, computer viruses, misplaced or lost data, programming or human errors or other similar events. Any security breach involving the misappropriation, loss or other unauthorized disclosure of confidential information, whether by us or by third-party service providers, could damage our reputation, expose us to the risks of litigation and liability, disrupt our business or otherwise have a material adverse effect on our business, financial condition, results of operations and cash flows.
Negative publicity to our name or brand could lead to a loss of revenuerevenues or profitability.
We are in the security business and our success and longevity are based to a large extent on our reputation for trust and integrity. Our reputation or brand, particularly the trust placed in us by our customers, could be negatively impacted in the event of perceived or actual breaches in our ability to conduct our business ethically, securely and responsibly. Any damage to our brand could have a material adverse effect on our business, financial condition, results of operations and cash flows.
Failures of our IT system could have a material adverse effect on our business.
We are heavily dependent on our information technology (IT) infrastructure. Significant problems with our infrastructure, such as telephone or IT system failure, cybersecurity breaches, or failure to develop new technology platforms to support new initiatives and product and service offerings, could halt or delay our ability to service our customers, hinder our ability to conduct and expand our business and require significant remediation costs. In addition, we continue to evaluate and implement upgrades to our IT systems. We are aware of inherent risks associated with replacing these systems, including accurately capturing data and system disruptions, and believe we are taking appropriate action to mitigate these risks through testing, training, and staging implementation. However, there can be no assurances that we will successfully launch these systems as planned or that they will occur without disruptions to our operations. Any of these events could have a material adverse effect on our business, financial condition, results of operations and cash flows.
We operate in regulated industries.
Our U.S. operations are subject to regulation by the U.S. Department of Transportation with respect to safety of operations and equipment and financial responsibility. Intrastate operations in the U.S. are subject to regulation by state regulatory authorities and interprovincial operations in Canada are subject to regulation by Canadian and provincial regulatory authorities. Our international operations are regulated to varying degrees by the countries in which we operate. Many countries have permit requirements for security services and prohibit foreign companies from providing different types of security services.
Changes in laws or regulations could require a change in the way we operate, which could increase costs or otherwise disrupt operations. In addition, failure to comply with any applicable laws or regulations could result in substantial fines or revocation of our operating permits and licenses. If laws and regulations were to change or we failed to comply, our business, financial condition, results of operations and cash flows could be materially and adversely affected.
10
Our inability to access capital or significant increases in our cost of capital could adversely affect our business.
Our ability to obtain adequate and cost-effective financing depends on our credit ratings as well as the liquidity of financial markets. A negative change in our ratings outlook or any downgrade in our current investment-grade credit ratings by the rating agencies could adversely affect our cost and/or access to sources of liquidity and capital. Additionally, such a downgrade could increase the costs of borrowing under available credit lines. Disruptions in the capital and credit markets could adversely affect our ability to access short-term and long-term capital. Our access to funds under short-term credit facilities is dependent on the ability of the participating banks to meet their funding commitments. Those banks may not be able to meet their funding commitments if they experience shortages of capital and liquidity. Longer disruptions in the capital and credit markets as a result of uncertainty, changing or increased regulation, reduced alternatives, or failures of significant financial institutions could adversely affect our access to capital needed for our business.
We have retained obligations from the sale of BAX Global.
Our credit facilities as well as our unsecured notes are subject to financial covenants, including a limit on the ratio of debt to earnings before interest, taxes, depreciation, and amortization, limits on the ability to pledge assets, limits on the total amount of indebtedness we can incur, limits on the use of proceeds of asset sales and minimum coverage of interest costs. Although we believe none of these covenants are presently restrictive to operations, the ability to meet the financial covenants can be affected by changes in our results of operations or financial condition. We cannot provide assurance that we will meet these covenants. A breach of any of these covenants could result in a default under existing credit facilities. Upon the occurrence of an event of default under any of our credit facilities, the lenders could cause amounts
outstanding to be immediately payable and terminate all commitments to extend further credit. The occurrence of these events would have a significant effect on our liquidity and cash flows.
Our effective income tax rate could change.
We serve customersoperate subsidiaries in more than 10041 countries, including 43 countries where we operate subsidiaries, all of which have different income tax laws and associated income tax rates. Our effective income tax rate can be significantly affected by changes in the mix of pretax earnings by country and the related income tax rates in those countries. In addition, our effective income tax rate is significantly affected by the ability to realize deferred tax assets, including those associated with net operating losses. Changes in income tax laws, income apportionment, or estimates of the ability to realize deferred tax assets, could significantly affect our effective income tax rate, financial position and results of operations. We are subject to the regular examination of our income tax returns by various tax authorities. We regularly assess the likelihood of adverse outcomes resulting from these examinations to determine the adequacy of our provision for taxes. There can be no assurance that the outcomes from these examinations will not have a material adverse effect on our business.
11
We have certain environmental and other exposures related to our former coal operations.
We may incur future environmental and other liabilities in connection with our former coal operations, which could materially and adversely affect our financial condition, results of operations and cash flows.
We may be exposed to certain regulatory and financial risks related to climate change.
Growing concerns about climate change may result in the imposition of additional environmental regulations to which we are subject. Some form of federal regulation may be forthcoming with respect to greenhouse gas emissions (including carbon dioxide) and/or "cap and trade" legislation. The outcome of this legislation may result in new regulation, additional charges to fund energy efficiency activities or other regulatory actions. Compliance with these actions could result in the creation of additional costs to us, including, among other things, increased fuel prices or additional taxes or emission allowances. We may not be able to recover the cost of compliance with new or more stringent environmental laws and regulations from our customers, which could adversely affect our business. Furthermore, the potential effects of climate change and related regulation on our customers are highly uncertain and may adversely affect our operations.
Forward-Looking Statements
This document contains both historical and forward-looking information. Words such as “anticipates,” “assumes,” “estimates,” “expects,” “projects,” “predicts,” “intends,” “plans,” “potential,” “believes,” “may,” “should” and similar expressions may identify forward-looking information. Forward-looking information in this document includes, but is not limited to, statements regarding future performance of The Brink’s Company and its global operations, including anticipated savings and other impacts of our 2014 Reorganization and Restructuring and additional; 2015 workforce reductions, revenues, organic revenue growth and segment operating profit margin, in 2014,income from continuing operations, non-operating income or expense and earnings per share; 2016 revenues, operating profit margin and earnings per share, the repatriation of cash from our Venezuelan and Argentinean operations, the anticipated financial effect of pending litigation, revenue and depreciation, profit growth and expected margins in the Company’s operating segments, the acquisition of new vehicles in the United States with capital leases, interest expense and rental expense related to the U.S. fleet, expected non-segment income and expenses, 2014 projected interest expense and interest and other income, the realization of deferred tax assets, our anticipated effective tax rate for 20142015 and our tax position, the reinvestment of earnings on operations outside the United States, net income (loss) attributable to noncontrolling interests, expected earnings in Venezuela, projected currency impact on revenue,revenues, capital expenditures, capital leases and depreciation and amortization, the funding of future acquisitions and pension obligations, the ability to meet liquidity needs, future payment of bonds issued by the Peninsula Ports Authority of Virginia, expenses and payouts for the U.S. retirement plans and the non-U.S. pension plans and the expected long-term rate of return and funded status of the primary U.S. pension plan, expected liability for and future contributions to the UMWA plans, liability for black lung obligations, the projected impact of future excise tax on the UMWA plans, our ability to obtain U.S. dollars to operate our business in Venezuela, future devaluation in Venezuela, the effect of accounting rule changes, the performance of counterparties to hedging agreements, the recognition of unrecognized tax positions, expected future amortizations into net periodic pensionpayments under contractual obligations, and post-retirement cost, the deductibility of goodwill, projected minimum repayments of long-term debt, the replacementfuture use of operating leases, future minimum lease payments, and the recognition of costs related to equity awards.leases. Forward-looking information in this document is subject to known and unknown risks, uncertainties, and contingencies, which are difficult to quantify and which could cause actual results, performance or achievements to differ materially from those that are anticipated.
These risks, uncertainties and contingencies, many of which are beyond our control, include, but are not limited to:
| · | our ability to improve profitability in our largest five markets; |
| · | our ability to identify and execute further cost and operational improvements and efficiencies in our core businesses; |
| · | continuing market volatility and commodity price fluctuations and their impact on the demand for our services; |
| · | our ability to maintain or improve volumes at favorable pricing levels and increase cost and productivity efficiencies, particularly in the United States and |
| · | investments in information technology and |
| · | our ability to develop and implement solutions for our customers and gain market acceptance of those solutions; |
| · | our ability to maintain an effective IT infrastructure and safeguard confidential information; |
| · | risks customarily associated with operating in foreign countries including changing labor and economic conditions, currency restrictions and devaluations, safety and security issues, political instability, restrictions on repatriation of earnings and capital, nationalization, expropriation and other forms of restrictive government actions; |
| · | the strength of the U.S. dollar relative to foreign currencies and foreign currency exchange rates; |
| · | the stability of the Venezuelan economy, changes in Venezuelan policy regarding foreign-owned businesses; |
| · | regulatory and labor issues in many of our global operations, including negotiations with organized labor and the possibility of work stoppages; |
| · | our ability to integrate successfully recently acquired companies and improve their operating profit margins; |
| · | costs related to dispositions and market exits; |
| · | our ability to identify evaluate and pursue acquisitions and other strategic |
| · | the willingness of our customers to absorb fuel surcharges and other future price increases; |
| · | our ability to obtain necessary information technology and other services at favorable pricing levels from third party service providers; |
| · | variations in costs or expenses and performance delays of any public or private sector supplier, service provider or customer; |
| · | our ability to obtain appropriate insurance coverage, positions taken by insurers with respect to claims made and the financial condition of insurers, safety and security performance, our loss experience, and changes in insurance costs; |
| · | security threats worldwide and losses of customer valuables; |
| · | costs associated with the purchase and implementation of cash processing and security equipment; |
| · | employee and environmental liabilities in connection with our former coal operations, including black lung claims incidence; |
| · | the impact of the Patient Protection and Affordable Care Act on black lung liability and the Company's ongoing operations; |
| · | changes to estimated liabilities and assets in actuarial assumptions due to payments made, investment returns, interest rates and annual actuarial revaluations, the funding requirements, accounting treatment, investment performance and costs and expenses of our pension plans, the VEBA and other employee benefits, mandatory or voluntary pension plan contributions; |
| · | the nature of our hedging relationships; |
| · | changes in estimates and assumptions underlying our critical accounting policies; |
| · | our ability to realize deferred tax assets; |
| · | the outcome of pending and future claims, litigation, and administrative proceedings; |
| · | public perception of the |
| · | access to the capital and credit markets; |
13
| · | seasonality, pricing and other competitive industry factors; and |
| · | the promulgation and adoption of new accounting standards and interpretations, new government regulations and |
The information included in this document is representative only as of the date of this document, and The Brink’s Company undertakes no obligation to update any information contained in this document.
ITEM 1B. UNRESOLVED STAFF COMMENTS
Not applicable.
ITEM 2. PROPERTIES
We have property and equipment in locations throughout the world. Branch facilities generally have office space to support operations, a vault to securely process and store valuables and a garage to house armored vehicles and serve as a vehicle terminal. Many branches have additional space to repair and maintain vehicles.
We own or lease armored vehicles, panel trucks and other vehicles that are primarily service vehicles. Our armored vehicles are of bullet-resistant construction and are specially designed and equipped to provide security for the crew and cargo.
The following table discloses leased and owned facilities and vehicles for Brink’s most significant operations as of December 31, 2013.2014.
| Facilities | Vehicles | ||||||||||||||
| Region | Leased | Owned | Total | Leased | Owned | Total | |||||||||
| U.S. | 131 | 26 | 157 | 1,920 | 183 | 2,103 | |||||||||
| Canada | 38 | 14 | 52 | 480 | 14 | 494 | |||||||||
| Latin America | 373 | 121 | 494 | 593 | 5,701 | 6,294 | |||||||||
| EMEA | 210 | 37 | 247 | 580 | 2,556 | 3,136 | |||||||||
| Asia Pacific | 97 | - | 97 | 6 | 638 | 644 | |||||||||
| Total | 849 | 198 | 1,047 | 3,579 | 9,092 | 12,671 | |||||||||
| Facilities | Vehicles | |||||||||||||||||||||||
| Leased | Owned | Total | Leased | Owned | Total | |||||||||||||||||||
| Largest 5 Markets | ||||||||||||||||||||||||
| U.S. | 128 | 25 | 153 | 1,919 | 179 | 2,098 | ||||||||||||||||||
| France | 84 | 34 | 118 | 870 | 568 | 1,438 | ||||||||||||||||||
| Mexico | 161 | 67 | 228 | 91 | 2,551 | 2,642 | ||||||||||||||||||
| Brazil | 59 | 4 | 63 | 441 | 774 | 1,215 | ||||||||||||||||||
| Canada | 37 | 14 | 51 | 464 | 11 | 475 | ||||||||||||||||||
| Global Markets | ||||||||||||||||||||||||
| Latin America | 159 | 55 | 214 | - | 2,255 | 2,255 | ||||||||||||||||||
| EMEA | 114 | 3 | 117 | 437 | 1,024 | 1,461 | ||||||||||||||||||
| Asia | 101 | - | 101 | 7 | 652 | 659 | ||||||||||||||||||
| Payment Services | 34 | - | 34 | 85 | 7 | 92 | ||||||||||||||||||
| Total | 877 | 202 | 1,079 | 4,314 | 8,021 | 12,335 | ||||||||||||||||||
As of December 31, 2013,2014, we had approximately 19,10020,400 units for our CompuSafe® service installed worldwide, of which approximately 15,40016,100 units were located in the U.S.
ITEM 3. LEGAL PROCEEDINGS
For a discussion of legal proceedings, see note 2223 to the consolidated financial statements, “Other Commitments and Contingencies,” in Part II, Item 8 of this 10-K.
ITEM 4. MINE SAFETY DISCLOSURES
Not applicable.
Executive Officers of the Registrant
The following is a list as of February 21, 2014,27, 2015, of the names and ages of the executive officers of The Company indicating the principal positions and offices held by each. There are no family relationships among any of the officers named.
| Name | Age | Positions and Offices Held | Held Since | |||||
| Thomas C. Schievelbein | 60 | Chairman, President and Chief Executive Officer | 2012 | |||||
| Joseph W. Dziedzic | 45 | Vice President and Chief Financial Officer | 2009 | |||||
| McAlister C. Marshall, II | 44 | Vice President and General Counsel | 2008 | |||||
| Darren M. McCue | 40 | Vice President and Chief Commercial Strategy Officer | 2013 | |||||
| Matthew A. P. Schumacher | 55 | Controller | 2001 | |||||
| Holly R. Tyson | 42 | Vice President and Chief Human Resources Officer | 2012 | |||||
| Patricia A. Watson | 47 | Vice President and Chief Information Officer | 2013 |
| Name | Age | Positions and Offices Held | Held Since | ||||||
| Thomas C. Schievelbein | 61 | Chairman, President and Chief Executive Officer | 2012 | ||||||
| Joseph W. Dziedzic | 46 | Executive Vice President and Chief Financial Officer | 2009 | ||||||
| Michael F. Beech | 53 | Executive Vice President, Strategy and Focus Markets | 2014 | ||||||
| McAlister C. Marshall, II | 45 | Vice President and General Counsel | 2008 | ||||||
| Matthew A. P. Schumacher | 56 | Vice President and Controller | 2001 | ||||||
| Holly R. Tyson | 43 | Vice President and Chief Human Resources Officer | 2012 | ||||||
| Patricia A. Watson | 48 | Vice President and Chief Information Officer | 2013 | ||||||
| Amit Zukerman | 43 | Executive Vice President, Global Operations | 2014 | ||||||
Executive and other officers of the Company are elected annually and serve at the pleasure of the Board.
Mr. Schievelbein is the Chairman, President and Chief Executive Officer of the Company and has held that position since June 2012, prior to which he served as the interim President and Chief Executive Officer of the Company from December 2011 to June 2012 and the interim Executive Chairman of the Company from November 2011 to December 2011. He has also served as a director of the Company since March 2009. He was President of Northrop Grumman Newport News, a subsidiary of the Northrop Grumman Corporation, a global defense company, from November 2001 until November 2004, and was a business consultant from November 2004 to November 2011. Mr. Schievelbein currently also serves as a director of Huntington Ingalls Industries, Inc. and New York Life Insurance Company.
Mr. Dziedzic is thewas appointed Executive Vice President of the Company in December 2014 and has served as Chief Financial Officer since 2009. From August 2009 to December 2014, Mr. Dziedzic served as Vice President of the Company. Mr. Dziedzic was hired in May 2009 and appointed to this position in August 2009. Before joining the Company, Mr. Dziedzic was Chief Financial Officer at GE Aviation Services,currently serves as a producer, seller and servicerdirector of jet engines, turboprop and turbo shaft engines and related replacement parts, from March 2006 to May 2009.Greatbatch, Inc.
Mr. Marshall was appointed Vice President and General Counsel of the Company in September 2008. He also previously held the office of Secretary from September 2008 to July 2009 and from June 2012 to November 2013.
Mr. McCue is the Vice President and Chief Commercial Strategy Officer of the Company. Mr. McCue joined the Company andBeech was appointed to this position in February 2013. Before joining the Company, Mr. McCue was Executive Vice President, of Strategy and Business DevelopmentFocus Markets of the Company in December 2014. He served as President, Europe, Middle East and Africa for Consumer Financial Solutions at Aetna Inc.the Company’s operating subsidiary, Brink’s, Incorporated, from 2011 to 2013. He also servedDecember 2014; as President, Asia Pacific from 2011 to 2012; and as Vice President, Global Security from 2009 to 2011.
Mr. Zukerman was appointed as the Company’s Executive Vice President, of StrategyGlobal Operations and Product DevelopmentBrink’s Global Services in December 2014. He served as President, Brink’s Global Services and Asia Pacific for PayFlex Systems USA, Inc.the Company’s operating subsidiary, Brink’s, Incorporated, from 2007 until the company was acquired by Aetna in 2011. 2012 to December 2014 and as President, Brink’s Global Services from 2008 to 2012.
Mr. Schumacher has served as Vice President and Controller of the Company since August 2014 and was appointed Controller in his present position for more than the past five years.July 2001.
Ms. Tyson is thewas appointed Vice President and Chief Human Resources Officer of the Company. Ms. Tyson was hired in August 2012 and appointed to this positionCompany in September 2012. Before joining the Company, Ms. Tyson was with Bristol-Myers Squibb Company, a global biopharmaceutical company, where she was Vice President U.S. Pharmaceuticals Human Resources from 2010 to 2012, and Executive Director World Wide Pharmaceuticals Talent & U.S. Pharmaceutical Sales Learning from 2009 to 2010, Senior Director Human Resources & U.S. Pharmaceuticals Sales Learning from 2008 to 2009.2010.
Ms. Watson iswas appointed Vice President and Chief Information Officer of the Company. Ms. Watson joined the Company in January 2013 and was appointed to this position in February 2013. Prior to joining the Company, Ms. Watson was Senior Technology Executive with Bank of America’s Treasury, Credit and Payments division from 2007 to 2012.
PART II |
ITEM 5. MARKET FOR REGISTRANT’S COMMON EQUITY, RELATED STOCKHOLDER MATTERS AND ISSUER PURCHASES OF EQUITY SECURITIES
Our common stock trades on the New York Stock Exchange under the symbol “BCO.” As of February 18, 2014,19, 2015, there were 1,6411,561 shareholders of record of common stock.
The dividends declared and the high and low prices of our common stock for each full quarterly period within the last two years are as follows:
| 2013 Quarters | 2012 Quarters | |||||||||||||||||
1st | 2nd | 3rd | 4th | 1st | 2nd | 3rd | 4th | |||||||||||
| Dividends declared per common share | $ | 0.1000 | 0.1000 | 0.1000 | 0.1000 | $ | 0.1000 | 0.1000 | 0.1000 | 0.1000 | ||||||||
| Stock prices: | ||||||||||||||||||
| High | $ | 30.75 | 28.36 | 28.76 | 34.76 | $ | 29.64 | 26.73 | 25.82 | 29.87 | ||||||||
| Low | 25.90 | 24.07 | 25.41 | 26.58 | 23.39 | 20.91 | 21.70 | 24.67 | ||||||||||
| 2014 Quarters | 2013 Quarters | |||||||||||||||||||||||||||||||
1st | 2nd | 3rd | 4th | 1st | 2nd | 3rd | 4th | |||||||||||||||||||||||||
| Dividends declared per common share | $ | 0.1000 | 0.1000 | 0.1000 | 0.1000 | $ | 0.1000 | 0.1000 | 0.1000 | 0.1000 | ||||||||||||||||||||||
| Stock prices: | ||||||||||||||||||||||||||||||||
| High | $ | 35.73 | 30.56 | 28.80 | 24.71 | $ | 30.75 | 28.36 | 28.76 | 34.76 | ||||||||||||||||||||||
| Low | 27.59 | 24.25 | 23.85 | 19.15 | 25.90 | 24.07 | 25.41 | 26.58 | ||||||||||||||||||||||||
See note 1718 to the consolidated financial statements for a description of limitations of our ability to pay dividends in the future.
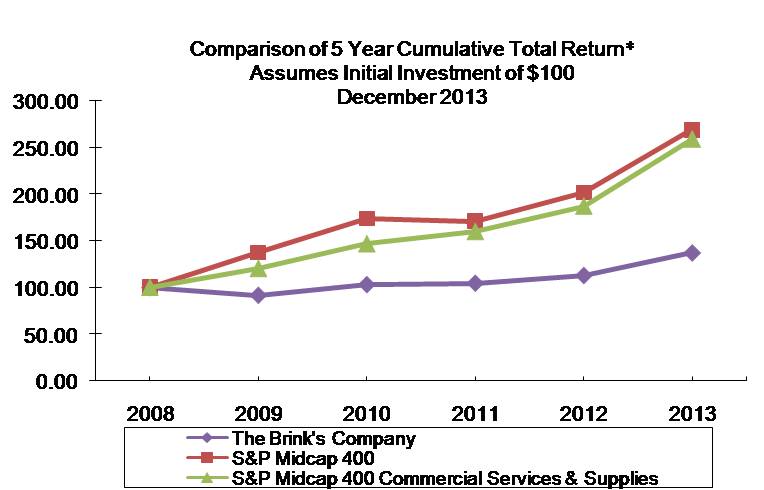
The following graph compares the cumulative 5-year total return provided to shareholders of The Brink’s Company’s common stock compared to the cumulative total returns of the Russell 2000 Index and Russell 3000 Commercial Services Index, as well as the S&P Midcap 400 index and the S&P Midcap 400 Commercial Services & Supplies Index.index. The graph tracks the performance of a $100 investment in our common stock and in each index from December 31, 2008,2009, through December 31, 2013.2014. The performance of The Brink’s Company’s common stock assumes that the shareholder reinvested all dividends received during the period.
Fiscal year ending December 31.
Source: Zacks Investment Research, Inc.
Comparison of Five-Year Cumulative Total Return Among
| Years Ended December 31, | ||||||||||||||
| 2008 | 2009 | 2010 | 2011 | 2012 | 2013 | |||||||||
| The Brink's Company | $ | 100.00 | 91.90 | 103.26 | 104.75 | 112.95 | 137.04 | |||||||
| S&P Midcap 400 Index | 100.00 | 137.38 | 173.98 | 170.96 | 201.53 | 269.04 | ||||||||
| S&P Midcap 400 Commercial Services & Supplies Index | 100.00 | 120.33 | 146.78 | 159.85 | 187.08 | 258.89 | ||||||||
Copyright© 2014, Standard & Poor's, a division of The McGraw-Hill Companies, Inc. All rights reserved. | ||||||||||||||
| Years Ended December 31, | ||||||||||||||||||||||||
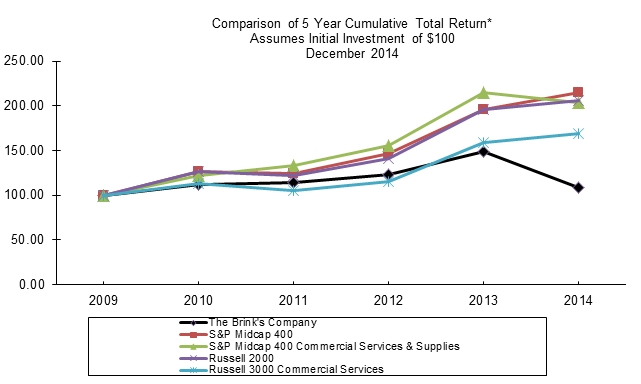
| 2009 | 2010 | 2011 | 2012 | 2013 | 2014 | |||||||||||||||||||
| The Brink's Company | $ | 100.00 | 112.36 | 113.99 | 122.92 | 149.12 | 108.25 | |||||||||||||||||
| S&P Midcap 400 Index | 100.00 | 126.64 | 124.45 | 146.70 | 195.84 | 214.97 | ||||||||||||||||||
| S&P Midcap 400 Commercial Services & Supplies Index | 100.00 | 121.98 | 132.85 | 155.47 | 215.15 | 203.74 | ||||||||||||||||||
| Russell 2000 Index | 100.00 | 126.81 | 121.52 | 141.42 | 196.32 | 205.93 | ||||||||||||||||||
| Russell 3000 Commercial Services Index | 100.00 | 112.75 | 105.14 | 115.03 | 158.91 | 169.25 | ||||||||||||||||||
| (a) | For the line designated as “The Brink’s Company” the graph depicts the cumulative return on $100 invested in The Brink’s Company’s common |
| GAAP Basis | |||||||||||||
| (In millions, except for per share amounts) | 2013 | 2012 | 2011 | 2010 | 2009 | ||||||||
| Revenues and Operating Profit | |||||||||||||
| Revenues | $ | 3,942.2 | 3,735.0 | 3,662.9 | 2,925.3 | 2,959.3 | |||||||
| Segment operating profit | $ | 252.8 | 263.9 | 262.3 | 244.6 | 237.3 | |||||||
| Non-segment income (expense) | (81.1) | (88.9) | (59.8) | (62.6) | (46.6) | ||||||||
| Operating profit | $ | 171.7 | 175.0 | 202.5 | 182.0 | 190.7 | |||||||
| Income attributable to Brink’s: | |||||||||||||
| Income from continuing operations | 71.9 | 111.2 | 100.3 | 87.1 | 220.1 | ||||||||
Loss income from discontinued operations(a) | (15.1) | (22.3) | (25.8) | (30.0) | (19.9) | ||||||||
| Net income attributable to Brink’s | $ | 56.8 | 88.9 | 74.5 | 57.1 | 200.2 | |||||||
| Financial Position | |||||||||||||
| Property and equipment, net | $ | 758.7 | 793.8 | 749.2 | 698.9 | 549.5 | |||||||
| Total assets | 2,498.0 | 2,553.9 | 2,406.2 | 2,270.5 | 1,879.8 | ||||||||
| Long-term debt, less current maturities | 330.5 | 335.6 | 335.3 | 323.7 | 172.3 | ||||||||
| Brink’s shareholders’ equity | 693.9 | 501.8 | 408.0 | 516.2 | 534.9 | ||||||||
| Supplemental Information | |||||||||||||
| Depreciation and amortization | $ | 173.6 | 155.7 | 148.1 | 123.9 | 122.3 | |||||||
| Capital expenditures | 177.7 | 177.9 | 183.7 | 135.7 | 160.4 | ||||||||
| Earnings per share attributable to Brink’s common shareholders | |||||||||||||
| Basic: | |||||||||||||
| Continuing operations | $ | 1.48 | 2.30 | 2.10 | 1.81 | 4.65 | |||||||
Discontinued operations(a) | (0.31) | (0.46) | (0.54) | (0.62) | (0.42) | ||||||||
| Net income | $ | 1.17 | 1.84 | 1.56 | 1.18 | 4.23 | |||||||
| Diluted: | |||||||||||||
| Continuing operations | $ | 1.47 | 2.29 | 2.09 | 1.80 | 4.63 | |||||||
Discontinued operations(a) | (0.31) | (0.46) | (0.54) | (0.62) | (0.42) | ||||||||
| Net income | $ | 1.16 | 1.83 | 1.55 | 1.18 | 4.21 | |||||||
| Cash dividends | $ | 0.4000 | 0.4000 | 0.4000 | 0.4000 | 0.4000 | |||||||
| Weighted-average Shares | |||||||||||||
| Basic | 48.7 | 48.4 | 47.8 | 48.2 | 47.2 | ||||||||
| Diluted | 49.0 | 48.6 | 48.1 | 48.4 | 47.5 | ||||||||
| Non-GAAP Basis* | ||||||||||||
| (In millions, except for per share amounts) | 2013 | 2012 | 2011 | 2010 | 2009 | |||||||
| Revenues | $ | 3,942.2 | 3,735.0 | 3,662.9 | 2,925.3 | 2,721.4 | ||||||
| Segment operating profit | $ | 283.4 | 268.1 | 267.6 | 246.8 | 196.8 | ||||||
| Non-segment income (expense) | (42.6) | (42.3) | (40.6) | (36.2) | (34.7) | |||||||
| Operating profit | $ | 240.8 | 225.8 | 227.0 | 210.6 | 162.1 | ||||||
| Amounts attributable to Brink’s: | ||||||||||||
| Income from continuing operations | 115.9 | 112.7 | 112.5 | 118.9 | 91.1 | |||||||
| Diluted EPS – continuing operations | $ | 2.37 | 2.32 | 2.34 | 2.46 | 1.92 | ||||||
| *Reconciliations to GAAP results are found beginning on page 40. | ||||||||||||
18
ITEM 6. SELECTED FINANCIAL DATA
Five Years in Review
| GAAP Basis | ||||||||||||||||||||
| (In millions, except for per share amounts) | 2014 | 2013 | 2012 | 2011 | 2010 | |||||||||||||||
| Revenues | $ | 3,562.3 | 3,778.6 | 3,577.6 | 3,515.4 | 2,810.7 | ||||||||||||||
| Operating profit (loss) | (27.5 | ) | 163.2 | 162.2 | 199.7 | 175.2 | ||||||||||||||
| Income (loss) attributable to Brink’s | ||||||||||||||||||||
| Continuing operations | $ | (54.8 | ) | 66.0 | 102.3 | 98.7 | 82.9 | |||||||||||||
| Discontinued operations | (29.1 | ) | (9.2 | ) | (13.4 | ) | (24.2 | ) | (25.8 | ) | ||||||||||
| Net income (loss) attributable to Brink’s | $ | (83.9 | ) | 56.8 | 88.9 | 74.5 | 57.1 | |||||||||||||
| Financial Position | ||||||||||||||||||||
| Property and equipment, net | $ | 669.5 | 758.7 | 793.8 | 749.2 | 698.9 | ||||||||||||||
| Total assets | 2,192.2 | 2,498.0 | 2,553.9 | 2,406.2 | 2,270.5 | |||||||||||||||
| Long-term debt, less current maturities | 373.3 | 330.5 | 335.6 | 335.3 | 323.7 | |||||||||||||||
| Brink’s shareholders’ equity | 434.0 | 693.9 | 501.8 | 408.0 | 516.2 | |||||||||||||||
| Supplemental Information | ||||||||||||||||||||
| Depreciation and amortization | $ | 161.9 | 165.8 | 148.4 | 140.0 | 116.6 | ||||||||||||||
| Capital expenditures | 136.1 | 172.9 | 170.9 | 176.0 | 128.4 | |||||||||||||||
| Earnings (loss) per share attributable to Brink’s common shareholders | ||||||||||||||||||||
| Basic: | ||||||||||||||||||||
| Continuing operations | $ | (1.12 | ) | 1.36 | 2.12 | 2.06 | 1.72 | |||||||||||||
| Discontinued operations | (0.59 | ) | (0.19 | ) | (0.28 | ) | (0.51 | ) | (0.54 | ) | ||||||||||
| Net income (loss) | $ | (1.71 | ) | 1.17 | 1.84 | 1.56 | 1.18 | |||||||||||||
| Diluted: | ||||||||||||||||||||
| Continuing operations | $ | (1.12 | ) | 1.35 | 2.11 | 2.05 | 1.71 | |||||||||||||
| Discontinued operations | (0.59 | ) | (0.19 | ) | (0.28 | ) | (0.50 | ) | (0.53 | ) | ||||||||||
| Net income (loss) | $ | (1.71 | ) | 1.16 | 1.83 | 1.55 | 1.18 | |||||||||||||
| Cash dividends | $ | 0.40 | 0.40 | 0.40 | 0.40 | 0.40 | ||||||||||||||
| Weighted-average Shares | ||||||||||||||||||||
| Basic | 49.0 | 48.7 | 48.4 | 47.8 | 48.2 | |||||||||||||||
| Diluted | 49.0 | 49.0 | 48.6 | 48.1 | 48.4 | |||||||||||||||
| Non-GAAP Basis* | ||||||||||||||||||||
| (In millions, except for per share amounts) | 2014 | 2013 | 2012 | 2011 | 2010 | |||||||||||||||
| Revenues | $ | 3,562.3 | 3,778.6 | 3,577.6 | 3,515.4 | 2,810.7 | ||||||||||||||
| Operating profit | 169.0 | 227.3 | 207.0 | 219.9 | 197.6 | |||||||||||||||
| Amounts attributable to Brink’s | ||||||||||||||||||||
| Income from continuing operations | $ | 73.2 | 104.5 | 97.8 | 106.4 | 109.5 | ||||||||||||||
| Diluted EPS – continuing operations | $ | 1.49 | 2.13 | 2.01 | 2.21 | 2.26 | ||||||||||||||
| *Reconciliations to GAAP results are found beginning on page 36. | ||||||||||||||||||||
19
ITEM 7. MANAGEMENT’S DISCUSSION AND ANALYSIS OF FINANCIAL CONDITION AND RESULTS OF OPERATIONS
THE BRINK’S COMPANY
MANAGEMENT’S DISCUSSION AND ANALYSIS OF
FINANCIAL CONDITION AND RESULTS OF OPERATIONS
FOR THE YEAR ENDED DECEMBER 31, 20132014
TABLE OF CONTENTS
| Page | ||
| OPERATIONS | ||
| RESULTS OF OPERATIONS | ||
| 23 | ||
| Analysis of Results: 2014 versus 2013 | 25 | |
| Analysis of Results: 2013 versus 2012 | 27 | |
| Other Operating Income and Expense | ||
| Nonoperating Income and Expense | ||
| Income Taxes | ||
| Noncontrolling Interests | ||
| Loss from Discontinued Operations | ||
| Non-GAAP Results | ||
| Foreign Operations | ||
| LIQUIDITY AND CAPITAL RESOURCES | ||
| Overview | ||
| Operating Activities | ||
| Investing Activities | ||
| Financing Activities | ||
| Effect of Exchange Rate Changes on Cash and Cash Equivalents | 42 | |
| Capitalization | ||
| Off Balance Sheet Arrangements | ||
| Contractual Obligations | ||
| Contingent Matters | ||
| APPLICATION OF CRITICAL ACCOUNTING POLICIES | ||
| Deferred Tax Asset Valuation Allowance | ||
| Goodwill, Other Intangible Assets and Property and Equipment Valuations | ||
| Retirement and Postemployment Benefit Obligations | ||
| Foreign Currency Translation | ||
| 56 | ||
OPERATIONS
The Brink’s Company offers transportation and logistics management services for cash and valuables throughout the world. These services include:
| · | Cash-in-Transit (“CIT”) Services – armored vehicle transportation of valuables |
| · | ATM Services – replenishing and maintaining customers’ automated teller machines; providing network infrastructure services |
| · | Global Services* – secure international transportation of valuables |
| · | Cash Management Services* |
| o | Currency and coin counting and sorting; deposit preparation and reconciliations; other cash management services |
| o | Safe and safe control device installation and servicing (including our patented CompuSafe® service) |
| o | Check and cash processing services for banking customers (“Virtual Vault Services”) |
| o | Check imaging services for banking customers |
| · | Payment Services* – bill payment and processing services on behalf of utility companies and other billers at any of our Brink’s or Brink’s – operated payment locations in Latin |
| · |
* We consider these to be High-Value Services as described in more detail on page 3.
We provide an analysis of our operations below on both a generally accepted accounting principles (“GAAP”) and non-GAAP basis. The purpose of the non-GAAP information is to report our financial information as follows:have nine operating segments:
| · |
| · |
| · | Payment Services |
We believe that Brink’s has significant competitive advantages including:
| · | brand name recognition |
| · | reputation for a high level of service and security |
| · | risk management and logistics expertise |
| · | value-based solutions expertise |
| · | global infrastructure and customer base |
| · | proprietary cash processing and information systems |
| · | proven operational excellence |
| · | high-quality insurance coverage and general financial strength |
We focus our time and resources on service quality, protecting and strengthening our brand, and addressing our risks. Our marketing and sales efforts are enhanced by the “Brink’s” brand, so we seek to protect and build its value. Because our services focus on handling, transporting, protecting and managing valuables, we strive to understand and manage risk. Overlaying our approach is an understanding that we must be disciplined and patient enough to charge prices that reflect the value provided, the risk assumed and the need for an adequate return for our investors.
In order to earn an adequate return on capital, we focus on the effective and efficient use of resources as well as appropriatein addition to our pricing levels.discipline. We attempt to maximize the amount of business that flows through our branches, vehicles and systems in order to obtain the lowest costs possible without compromising safety, security or service.
Operating results may vary from period to period. Because revenues are generated from charges per service performed or based on the value of goods transported, they can be affected by both the level of economic activity and the volume of business for specific customers. As contracts generally run for one or more years, costs are incurred to prepare to serve, or to transition away, from a customer. We also periodically incur costs to reducechange the scale of our operations when volumes decline, includingincrease or decrease. Incremental costs incurred usually relate to reduceincreasing or decreasing the number of employees and closeincreasing or consolidate branch anddecreasing branches or administrative facilities. In addition, security costs can vary depending on performance, the cost of insurance coverage, and changes in crime rates (i.e., attacks and robberies).
Brink’s revenues and related operating profit are generally higher in the second half of the year, particularly in the fourth quarter, due to generally increased economic activity associated with the holiday season.
RESULTS OF OPERATIONS
Non-GAAP Financial Measures We provide an analysis of our operations below on both a generally accepted accounting principles (“GAAP”) and non-GAAP basis. The purpose of the non-GAAP information is to report our operating profit, income from continuing operation and earnings per share without certain income and expense items and to reflect a constant tax rate for quarterly results equal to the full-year non-GAAP tax rate. We also provide “Adjusted Non-GAAP” information which provides financial information for 2013 and the first quarter of 2014 had our financial statements been prepared using an exchange rate of 50 bolivars per dollar for our Venezuelan operations, which we believe provides financial information on a basis more consistent with the rates we used in the last nine months of 2014 to report our Venezuelan operations. The non-GAAP financial measures are intended to provide information to assist comparability and estimates of future performance. The Non-GAAP adjustments used to reconcile our GAAP results are described in detail on page 36.
Definition of Organic Growth Organic growth represents the change in revenues or operating profit between the current and prior period, excluding the effect of: acquisitions and dispositions, changes in currency exchange rates (as described on page 25) and the accounting effects of reporting Venezuela under highly inflationary accounting.
| GAAP | % Change | Non-GAAP(c) | % Change | |||||||||||||||||||||
| Years Ended December 31, | 2013 | 2012 | 2011 | 2013 | 2012 | 2013 | 2012 | 2011 | 2013 | 2012 | ||||||||||||||
| (In millions, except for per share amounts) | ||||||||||||||||||||||||
| Revenues | $ | 3,942.2 | 3,735.0 | 3,662.9 | 6 | 2 | $ | 3,942.2 | 3,735.0 | 3,662.9 | 6 | 2 | ||||||||||||
Segment operating profit(a) | 252.8 | 263.9 | 262.3 | (4) | 1 | 283.4 | 268.1 | 267.6 | 6 | - | ||||||||||||||
| Non-segment expense | (81.1) | (88.9) | (59.8) | (9) | 49 | (42.6) | (42.3) | (40.6) | 1 | 4 | ||||||||||||||
| Operating profit | 171.7 | 175.0 | 202.5 | (2) | (14) | 240.8 | 225.8 | 227.0 | 7 | (1) | ||||||||||||||
Income from continuing operations(b) | 71.9 | 111.2 | 100.3 | (35) | 11 | 115.9 | 112.7 | 112.5 | 3 | - | ||||||||||||||
Diluted EPS from continuing operations(b) | 1.47 | 2.29 | 2.09 | (36) | 10 | 2.37 | 2.32 | 2.34 | 2 | (1) | ||||||||||||||
Executive Summary: 2014 versus 2013
| Years Ended December 31, | 2013 | 2012 | 2011 | ||||||
| GAAP Diluted EPS | $ | 1.47 | 2.29 | 2.09 | |||||
| Exclude Venezuela net monetary asset remeasurement losses | 0.17 | - | - | ||||||
| Excludes U.S. retirement plan expenses | 0.65 | 0.70 | 0.37 | ||||||
| Exclude employee benefit settlement, severance losses, CEO retirement costs and other | 0.04 | 0.06 | 0.08 | ||||||
| Exclude gains and losses on acquisitions and asset dispositions | 0.04 | (0.29) | (0.20) | ||||||
| Exclude tax benefit from change in retiree health care funding strategy | - | (0.43) | - | ||||||
| Non-GAAP Diluted EPS | $ | 2.37 | 2.32 | 2.34 | |||||
Revenues
Revenues in 2013 increased $207.2decreased $216.3 million or 6%. Revenues decreased primarily due to unfavorable changes in currency exchange rates, partially offset by organic growth in Latin America, Payment Services, Brazil, EMEA and the U.S.
Earnings (GAAP basis) Operating profit decreased $190.7 million primarily due to the negative impact of changes in currency exchange rates, costs associated with the recently announced restructuring plan ($21.8 million), higher U.S. pension costs ($20.2 million) and an organic profit decrease in Mexico, partially offset by the gain on sale of our noncontrolling equity interest in a CIT business in Peru ($44.3 million) and organic profit improvement in Latin America and the U.S. Income from continuing operations attributable to Brink’s shareholders in 2014 decreased $120.8 million to a loss of $54.8 million primarily due to the operating profit decrease mentioned above, partially offset by the corresponding lower income attributable to noncontrolling interests ($55.2 million) and lower tax expense ($12.6 million). Earnings per share from continuing operations was negative $1.12, down from $1.35 in 2013.
Earnings (Non-GAAP basis) Operating profit decreased $58.3 million in 2014 primarily due to the negative impact of changes in currency exchange rates and an organic profit decrease in Mexico, partially offset by organic growth in Latin America and the U.S. Income from continuing operations attributable to Brink’s shareholders in 2014 decreased 30% primarily due to the operating profit decrease mentioned above, partially offset by the corresponding lower tax expense ($13.0 million) and lower income attributable to noncontrolling interests ($11.9 million). Earnings per share from continuing operations was $1.49, down from $2.13 in 2013.
Executive Summary: 2013 versus 2012
Revenues Revenues increased $201.0 million or 6% primarily due to organic growth in our Latin America, ($261.7 million), EMEA ($25.5 million), Asia Pacific ($15.3 million) and North America ($11.0 million) segments,Brazil, partially offset by unfavorable changes in currency exchange rates ($121.9 million).rates.
Mexico, partially offset by the negative impact of changes in currency exchange rates, an increase in corporate items, including security costs and expenses related to the implementation of a new finance shared service center and an organic growthprofit decrease in our Latin America and Asia-Pacific segments and lower non-segment expenses ($7.8 million).
Income from continuing operations attributable to Brink’s shareholders in 2013 decreased 35% compared to 2012 primarily due to higher tax expense ($24.926.3 million) mainly resulting from a $21.1 million tax benefit related to a change in retiree healthcare funding strategy in 2012, lower interest and other non-operating income ($5.65.5 million), and higher income attributable to noncontrolling interests ($3.5 million), in addition to the operating profit decrease mentioned previously.
. Earnings per share from continuing operations was $1.47,$1.35, down from $2.29$2.11 in 2012.
Earnings (Non-GAAP basis) Operating profit increased $20.3 million in 2012 increased 11% compared to 20112013 primarily due to lower tax expense ($36.9 million) mainly resulting from a $21.1 million tax benefit related to a changeorganic growth in retiree healthcare funding strategyLatin America and lower income attributable to noncontrolling interests ($3.2 million),Mexico, partially offset by an increase in corporate items, including security costs and expenses related to the operating profitshared service center, an organic decrease mentioned above.
the U.S. and the negative impact of changes in currency exchange rates. Income from continuing operations attributable to Brink’s shareholders in 2013 increased 3%7% primarily due to the operating profit increase mentioned above, and lower tax expense ($3.5 million), partially offset by higher income attributable to noncontrolling interests ($10.110.6 million).
Earnings per share from continuing operations was $2.37,$2.13, up from $2.32$2.01 in 2012.
22
Outlook
Outlook for 2015
Our organic revenue growth rate for 2015 compared to our 2014 Adjusted Non-GAAP results is expected to be approximately 6% or $200 million, and our estimate of the negative impact of changes in currency exchange rates on revenues is approximately 7% or $250 million. Our operating profit margin on a Non-GAAP basis is expected to be in the range of 5.1% to 5.6%.
| 2014 | 2015 | |||||||||||
| 2014 | Adjusted | Non-GAAP | ||||||||||
| GAAP | Non-GAAP(a) | Outlook(a) | % Change | |||||||||
| Revenues | $ | 3,562 | 3,449 | 3,400 | ||||||||
| Operating profit (loss) | (28) | 140 | 173 – 190 | |||||||||
| Nonoperating income (expense) | (22) | (22) | (21) | |||||||||
| Provision for income taxes | (37) | (50) | (64) – (71) | |||||||||
| Noncontrolling interests | 31 | (10) | (11) | |||||||||
| Income (loss) from continuing operations attributable to Brink's | (55) | 59 | 77 – 87 | |||||||||
| EPS from continuing operations attributable to Brink's | $ | (1.12) | 1.20 | 1.55 – 1.75 | ||||||||
| Key Metrics | ||||||||||||
| Revenues Change | ||||||||||||
| Organic | 200 | 6% | ||||||||||
| Currency | (250) | (7%) | ||||||||||
| Total | (50) | (1%) | ||||||||||
| Operating profit margin | (0.8%) | 4.1% | 5.1% – 5.6% | |||||||||
| Effective income tax rate | (74.9%) | 42.1% | 42.0% | |||||||||
| Fixed assets acquired | ||||||||||||
| Capital expenditures | $ | 136 | 145 – 155 | |||||||||
Capital leases(b) | 12 | 15 | ||||||||||
| Total | $ | 148 | 160 – 170 | |||||||||
| Depreciation and amortization | $ | 162 | 160 | |||||||||
Amounts may not add due to rounding
| · | $2.00 to $2.40 earnings per share |
| · | Revenues of $3.6 billion |
| · | Operating profit margin of 6.7% |
| · | U.S. operating profit margin of 6% |
| · | Mexico operating profit margin of 10% |
| (a) | See pages 36 and 37 for information about reconciliations to GAAP. |
| (b) | Includes capital leases for newly acquired assets only. |
23
Analysis of Results: 2014 versus 20112013
Consolidated Results
| Years Ended December 31, | 2014 | 2013 | % Change | |||||||||
| (In millions, except for per share amounts) | ||||||||||||
| GAAP | ||||||||||||
| Revenues | $ | 3,562.3 | 3,778.6 | (6 | ) | |||||||
| Operating profit (loss) | (27.5 | ) | 163.2 | unfav | ||||||||
Income (loss) from continuing operations(a) | (54.8 | ) | 66.0 | unfav | ||||||||
Diluted EPS from continuing operations(a) | $ | (1.12 | ) | 1.35 | unfav | |||||||
Non-GAAP(b) | ||||||||||||
| Revenues | $ | 3,562.3 | 3,778.6 | (6 | ) | |||||||
| Operating profit | 169.0 | 227.3 | (26 | ) | ||||||||
Income from continuing operations(a) | 73.2 | 104.5 | (30 | ) | ||||||||
Diluted EPS from continuing operations(a) | $ | 1.49 | 2.13 | (30 | ) | |||||||
| (a) | Amounts reported in this table are attributable to the shareholders of Brink’s and exclude earnings related to noncontrolling interests. |
| (b) | Non-GAAP results are reconciled to the applicable GAAP results on pages 36–37. |
Analysis of Consolidated Results: 2014 versus 2013 (GAAP basis)
Consolidated Revenues Revenues decreased $216.3 million or 6% due to unfavorable changes in currency exchange rates ($740.3 million), partially offset by organic growth in Latin America ($396.8 million), Payment Services ($49.4 million), Brazil ($43.2 million), EMEA ($22.9 million) and the U.S. ($20.3 million). A significant portion of the reduction in revenues from currency exchange rates relates to an 88% devaluation of the Venezuelan bolivar in March 2014. The U.S. dollar also strengthened in the second half of 2014 against the euro and most currencies in Latin America including the Brazilian real and Mexican peso. Revenues increased 14% on an organic basis due mainly to higher average selling prices (including the effects of inflation in several Latin American countries). See page 22 for our definition of “organic.”
Consolidated Costs and Expenses Cost of revenues decreased 4% to $2,948.2 million as higher labor costs from inflation-based wage increases were more than offset by changes in currency rates, including devaluation in Venezuela. Selling, general and administrative costs increased 3% to $560.6 million due primarily to higher labor costs, partially offset by changes in currency exchange rate, including devaluation in Venezuela.
Consolidated Operating Profit (Loss) Operating profit decreased $190.7 million due mainly to:
| · | the negative impact of changes in currency exchange rates ($206.6), including a $121.6 million charge related to the remeasurement of net monetary assets as a result of the 88% devaluation of Venezuela currency (compared to a $13.4 million charge for a 16% devaluation in 2013) and lower translated U.S. dollar operating profit in Venezuela due to the 2014 devalulation, |
| · | costs associated with the recently announced restructuring plan ($21.8 million), |
| · | higher U.S. pension costs ($20.2 million) and |
| · | an organic profit decrease in Mexico ($16.6 million) |
partially offset by the gain on sale of our noncontrolling equity interest in a CIT business in Peru ($44.3 million) and organic profit improvement in Latin America ($28.5 million) and the U.S. ($10.0 million).
Consolidated Income (Loss) from Continuing Operations Attributable to Brink’s and Related Per Share Amounts Income from continuing operations attributable to Brink’s shareholders in 2012 was flat versus 2011 as2014 decreased $120.8 million to a loss of $54.8 million primarily due to the operating profit decrease mentioned above, partially offset by the corresponding lower income attributable to noncontrolling interests ($4.155.2 million) was offset by higherand lower tax expense ($3.012.6 million) and the operating profit decrease mentioned above.
. Earnings per share from continuing operations was $2.32,negative $1.12, down from $2.34$1.35 in 2011.2013.
Analysis of Consolidated Results: 2014 versus 2013 (Non-GAAP basis)
Consolidated Revenues The analysis of Non-GAAP revenues is the same as the analysis of GAAP revenues.
Consolidated Operating Profit Operating profit decreased $58.3 million in 2014 primarily due to the negative impact of changes in currency exchange rates ($82.2 million) and an organic profit decrease in Mexico ($16.6 million), partially offset by organic growth in Latin America ($28.5 million) and the U.S. ($10.0 million).
Consolidated Income from Continuing Operations Attributable to Brink’s and Related Per Share Amounts Income from continuing operations attributable to Brink’s shareholders in 2014 decreased 30% primarily due to the operating profit decrease mentioned above, partially offset by the corresponding lower tax expense ($13.0 million) and lower income attributable to noncontrolling interests ($11.9 million). Earnings per share from continuing operations was $1.49, down from $2.13 in 2013.
| GAAP | |||||||||||||||||||
| Acquisitions / | |||||||||||||||||||
| Organic | Dispositions | Currency | % Change | ||||||||||||||||
| (In millions) | 2012 | Change | (a) | (b) | 2013 | Total | Organic | ||||||||||||
| Revenues: | |||||||||||||||||||
| Latin America | $ | 1,579.4 | 261.7 | 15.6 | (136.0) | 1,720.7 | 9 | 17 | |||||||||||
| EMEA | 1,125.9 | 25.5 | - | 26.9 | 1,178.3 | 5 | 2 | ||||||||||||
| North America | 893.3 | 11.0 | - | (5.9) | 898.4 | 1 | 1 | ||||||||||||
| Asia Pacific | 136.4 | 15.3 | - | (6.9) | 144.8 | 6 | 11 | ||||||||||||
| Total | $ | 3,735.0 | 313.5 | 15.6 | (121.9) | 3,942.2 | 6 | 8 | |||||||||||
| Operating profit: | |||||||||||||||||||
| Latin America | $ | 135.1 | 50.6 | 1.8 | (37.6) | 149.9 | 11 | 37 | |||||||||||
| EMEA | 88.1 | (8.8) | - | 2.2 | 81.5 | (7) | (10) | ||||||||||||
| North America | 31.9 | (26.8) | - | (0.4) | 4.7 | (85) | (84) | ||||||||||||
| Asia Pacific | 8.8 | 8.2 | - | (0.3) | 16.7 | 90 | 93 | ||||||||||||
| Segment operating profit | 263.9 | 23.2 | 1.8 | (36.1) | 252.8 | (4) | 9 | ||||||||||||
| Non-segment | (88.9) | 5.8 | 2.0 | - | (81.1) | (9) | (7) | ||||||||||||
| Total | $ | 175.0 | 29.0 | 3.8 | (36.1) | 171.7 | (2) | 17 | |||||||||||
| Segment operating margin: | |||||||||||||||||||
| Latin America | 8.6% | 8.7% | |||||||||||||||||
| EMEA | 7.8% | 6.9% | |||||||||||||||||
| North America | 3.6% | 0.5% | |||||||||||||||||
| Asia Pacific | 6.5% | 11.5% | |||||||||||||||||
| Segment operating margin | 7.1% | 6.4% | |||||||||||||||||
| Non-GAAP | |||||||||||||||||||
| Acquisitions / | |||||||||||||||||||
| Organic | Dispositions | Currency | % Change | ||||||||||||||||
| (In millions) | 2012 | Change | (a) | (b) | 2013 | Total | Organic | ||||||||||||
| Revenues: | |||||||||||||||||||
| Latin America | $ | 1,579.4 | 261.7 | 15.6 | (136.0) | 1,720.7 | 9 | 17 | |||||||||||
| EMEA | 1,125.9 | 25.5 | - | 26.9 | 1,178.3 | 5 | 2 | ||||||||||||
| North America | 893.3 | 11.0 | - | (5.9) | 898.4 | 1 | 1 | ||||||||||||
| Asia Pacific | 136.4 | 15.3 | - | (6.9) | 144.8 | 6 | 11 | ||||||||||||
| Total | $ | 3,735.0 | 313.5 | 15.6 | (121.9) | 3,942.2 | 6 | 8 | |||||||||||
| Operating profit: | |||||||||||||||||||
| Latin America | $ | 130.1 | 60.3 | 1.8 | (24.2) | 168.0 | 29 | 46 | |||||||||||
| EMEA | 88.5 | (9.2) | - | 2.2 | 81.5 | (8) | (10) | ||||||||||||
| North America | 40.7 | (24.0) | - | (0.4) | 16.3 | (60) | (59) | ||||||||||||
| Asia Pacific | 8.8 | 9.1 | - | (0.3) | 17.6 | 100 | fav | ||||||||||||
| Segment operating profit | 268.1 | 36.2 | 1.8 | (22.7) | 283.4 | 6 | 14 | ||||||||||||
| Non-segment | (42.3) | (0.3) | - | - | (42.6) | 1 | 1 | ||||||||||||
| Total | $ | 225.8 | 35.9 | 1.8 | (22.7) | 240.8 | 7 | 16 | |||||||||||
| Segment operating margin: | |||||||||||||||||||
| Latin America | 8.2% | 9.8% | |||||||||||||||||
| EMEA | 7.9% | 6.9% | |||||||||||||||||
| North America | 4.6% | 1.8% | |||||||||||||||||
| Asia Pacific | 6.5% | 12.2% | |||||||||||||||||
| Segment operating margin | 7.2% | 7.2% | |||||||||||||||||
| Organic | Acquisitions / | Currency | % Change | |||||||||||||||||||||||||
| (In millions) | 2013 | Change | Dispositions (a) | (b) | 2014 | Total | Organic | |||||||||||||||||||||
| Revenues: | ||||||||||||||||||||||||||||
| U.S. | $ | 707.5 | 20.3 | - | - | 727.8 | 3 | 3 | ||||||||||||||||||||
| France | 517.6 | (0.1 | ) | - | (0.1 | ) | 517.4 | - | - | |||||||||||||||||||
| Mexico | 423.9 | (19.0 | ) | - | (16.7 | ) | 388.2 | (8 | ) | (4 | ) | |||||||||||||||||
| Brazil | 354.4 | 43.2 | - | (33.5 | ) | 364.1 | 3 | 12 | ||||||||||||||||||||
| Canada | 191.4 | 1.4 | - | (13.1 | ) | 179.7 | (6 | ) | 1 | |||||||||||||||||||
| Largest 5 Markets | 2,194.8 | 45.8 | - | (63.4 | ) | 2,177.2 | (1 | ) | 2 | |||||||||||||||||||
| Latin America | 854.2 | 396.8 | - | (658.6 | ) | 592.4 | (31 | ) | 46 | |||||||||||||||||||
| EMEA | 540.6 | 22.9 | - | (7.2 | ) | 556.3 | 3 | 4 | ||||||||||||||||||||
| Asia | 134.2 | 9.1 | - | (3.5 | ) | 139.8 | 4 | 7 | ||||||||||||||||||||
| Global Markets | 1,529.0 | 428.8 | - | (669.3 | ) | 1,288.5 | (16 | ) | 28 | |||||||||||||||||||
| Payment Services | 54.8 | 49.4 | - | (7.6 | ) | 96.6 | 76 | 90 | ||||||||||||||||||||
| Total | $ | 3,778.6 | 524.0 | - | (740.3 | ) | 3,562.3 | (6 | ) | 14 | ||||||||||||||||||
| Operating profit: | ||||||||||||||||||||||||||||
| U.S. | $ | 12.8 | 10.0 | - | - | 22.8 | 78 | 78 | ||||||||||||||||||||
| France | 44.5 | (4.6 | ) | - | (0.5 | ) | 39.4 | (11 | ) | (10 | ) | |||||||||||||||||
| Mexico | 26.9 | (16.6 | ) | - | (0.7 | ) | 9.6 | (64 | ) | (62 | ) | |||||||||||||||||
| Brazil | 41.1 | (3.0 | ) | - | (3.9 | ) | 34.2 | (17 | ) | (7 | ) | |||||||||||||||||
| Canada | 10.5 | 3.3 | - | (1.0 | ) | 12.8 | 22 | 31 | ||||||||||||||||||||
| Largest 5 Markets | 135.8 | (10.9 | ) | - | (6.1 | ) | 118.8 | (13 | ) | (8 | ) | |||||||||||||||||
| Latin America | 136.2 | 28.5 | - | (74.1 | ) | 90.6 | (33 | ) | 21 | |||||||||||||||||||
| EMEA | 47.0 | 6.6 | - | (1.1 | ) | 52.5 | 12 | 14 | ||||||||||||||||||||
| Asia | 21.0 | 2.4 | - | (0.3 | ) | 23.1 | 10 | 11 | ||||||||||||||||||||
| Global Markets | 204.2 | 37.5 | - | (75.5 | ) | 166.2 | (19 | ) | 18 | |||||||||||||||||||
| Payment Services | 1.0 | (5.3 | ) | - | (0.6 | ) | (4.9 | ) | unfav | unfav | ||||||||||||||||||
Corporate items(c) | (113.7 | ) | 2.6 | - | - | (111.1 | ) | (2 | ) | (2 | ) | |||||||||||||||||
| Operating profit - non-GAAP | 227.3 | 23.9 | - | (82.2 | ) | 169.0 | (26 | ) | 11 | |||||||||||||||||||
Other items not allocated to segments(d) | (64.1 | ) | (51.6 | ) | 43.6 | (124.4 | ) | (196.5 | ) | unfav | 80 | |||||||||||||||||
| Operating profit (loss) - GAAP | $ | 163.2 | (27.7 | ) | 43.6 | (206.6 | ) | (27.5 | ) | unfav | (17 | ) | ||||||||||||||||
| Amounts may not add due to rounding. |
| (a) | Includes operating results and gains/losses on acquisitions, sales and exits of businesses. The 2014 divestiture of an equity interest in a business in Peru is included in “Other items not allocated to segments”. |
| (b) | The “Currency” amount in the GAAP table is the |
| (c) | Corporate items are not |
| (d) | See page 30 for more information. |
Analysis of Segment ReviewResults: 2014 versus 2013
Largest 5 Markets
U.S. Revenues increased 3% ($20.3 million) due to organic revenue growth as a result of volume increases. Operating profit increased 78% ($10.0 million) due to cost efficiency measures and changes to the structure of employee benefits.
France Revenues were flat both overall as well as on an organic basis, driven by low growth in volumes offset by unfavorable pricing. Operating profit decreased 11% ($5.1 million) due to higher costs, including investments to transform the business, and the unfavorable pricing mentioned above.
Mexico Revenues decreased 8% ($35.7 million) due to a 4% organic decrease ($19.0 million) on the loss of a major customer, as well as unfavorable currency impact ($16.7 million). Operating profit decreased 64% ($17.3 million) due to the decline in revenues and increased insurance costs, partially offset by cost reduction efforts.
Brazil Revenues increased 3% ($9.7 million) primarily due to 12% organic growth ($43.2 million) resulting from price increases and growth in CompuSafe, partially offset by the negative impact of currency exchange rates ($33.5 million). Operating profit decreased 17% ($6.9 million) driven by unfavorable currency ($3.9 million) and lower organic profits resulting from favorable non-income tax settlements in 2013, partially offset by organic growth.
Canada Revenues decreased 6% ($11.7 million) primarily due to the negative impact of currency exchange rates ($13.1 million), partially offset by organic growth ($1.4 million). Operating profit increased 22% ($2.3 million) driven by lower pension costs, partially offset by negative currency ($1.0).
Global Markets
Latin America Revenues decreased 31% ($261.8 million) primarily due to the negative impact of currency exchange rates ($658.6 million) partially offset by organic growth of 46% ($396.8 million) driven by inflation-based revenue increases in Venezuela and Argentina. Operating profit decreased 33% ($45.6 million) driven by unfavorable currency impact ($74.1 million) and lower organic results in Colombia and Chile, partially offset by improved organic results in Venezuela and Argentina.
EMEA Revenues increased 3% ($15.7 million) primarily due to organic growth ($22.9 million) partially offset by unfavorable changes in exchange rates ($7.2 million). Organic growth was driven by better volume and pricing in Germany and increased volumes in Russia. Operating profit increased 12% ($5.5 million) due to higher revenues in Germany and Russia.
Asia Revenues increased 4% ($5.6 million) due mainly to organic growth across the region partially offset by unfavorable currency impact ($3.5 million). Operating profit increased 10% ($2.1 million) primarily due to the revenue growth.
Payment Services
Payment Services Revenues increased 76% ($41.8 million) primarily due to organic growth in Brazil. Operating profit decreased $5.9 million driven by marketing expenditures to increase cardholders in the U.S. Payments business.
26
Analysis of Results: 2013 versus 2012
| Years Ended December 31, | 2013 | 2012 | % Change | |||||||||
| (In millions, except for per share amounts) | ||||||||||||
| GAAP | ||||||||||||
| Revenues | $ | 3,778.6 | 3,577.6 | 6 | ||||||||
| Operating profit | 163.2 | 162.2 | 1 | |||||||||
Income from continuing operations(a) | 66.0 | 102.3 | (35 | ) | ||||||||
Diluted EPS from continuing operations(a) | $ | 1.35 | 2.11 | (36 | ) | |||||||
Non-GAAP(b) | ||||||||||||
| Revenues | $ | 3,778.6 | 3,577.6 | 6 | ||||||||
| Operating profit | 227.3 | 207.0 | 10 | |||||||||
Income from continuing operations(a) | 104.5 | 97.8 | 7 | |||||||||
Diluted EPS from continuing operations(a) | $ | 2.13 | 2.01 | 6 | ||||||||
| (a) | Amounts reported in this table are attributable to the shareholders of Brink’s and exclude earnings related to noncontrolling interests. |
| (b) | Non-GAAP results are reconciled to the applicable GAAP results on pages 36–37. |
Analysis of Consolidated Results: 2013 versus 2012 (GAAP basis)
Consolidated Revenues Revenues increased $201.0 million or 6% primarily due to organic growth in Latin America ($210.5 million), EMEA ($29.9 million) and Brazil ($28.6 million), partially offset by unfavorable changes in currency exchange rates ($117.7 million). Revenues increased 8% on an organic basis due mainly to:to higher average selling prices (including the effects of inflation in several Latin American countries). See page 22 for our definition of “organic.”
Consolidated Costs and Expenses Cost of revenues increased 6% to $3,059.2 million driven by higher labor costs from inflation-based wage increases. Selling, general and administrative costs increased 3% to $546.8 million due primarily to higher labor costs.
Consolidated Operating Profit (Loss) Operating profit increased 1% due mainly to organic growth in Latin America ($64.0 million) and Mexico ($8.5 million), partially offset by:
| · |
| · | an organic decrease in |
| · | the $18.7 million loss related to the February 2013 robbery in Brussels, Belgium, and |
| · | an increase in expenses related to the |
Consolidated Income from Continuing Operations Attributable to Brink’s and Related Per Share Amounts Income from continuing operations attributable to Brink’s shareholders in our Latin America2013 decreased 35% compared to 2012 primarily due to higher tax expense ($26.3 million) mainly resulting from a $21.1 million tax benefit related to a change in retiree healthcare funding strategy in 2012, lower interest and Asia-Pacific segments.other non-operating income ($5.5 million), and higher income attributable to noncontrolling interests ($3.5 million). Earnings per share from continuing operations was $1.35, down from $2.11 in 2012.
Analysis of Consolidated Results: 2013 versus 2012 (Non-GAAP basis)
Consolidated Revenues The analysis of Non-GAAP revenues is the same as the analysis of GAAP revenues.
| · | the negative impact of changes in currency exchange rates ($21.1 million), |
| · | an organic decrease in |
| · | the $18.7 million loss related to the February 2013 robbery in Brussels, |
| · |
27
Revenues and organic growth ($25.5 million).Operating Profit by Segment: 2013 versus 2012
| Acquisitions / | ||||||||||||||||||||||||||||
| Organic | Dispositions | Currency | % Change | |||||||||||||||||||||||||
| (In millions) | 2012 | Change | (a) | (b) | 2013 | Total | Organic | |||||||||||||||||||||
| Revenues: | ||||||||||||||||||||||||||||
| U.S. | $ | 706.7 | 0.8 | - | - | 707.5 | - | - | ||||||||||||||||||||
| France | 511.4 | (10.5 | ) | - | 16.7 | 517.6 | 1 | (2 | ) | |||||||||||||||||||
| Mexico | 395.0 | 15.5 | - | 13.4 | 423.9 | 7 | 4 | |||||||||||||||||||||
| Brazil | 363.6 | 28.6 | - | (37.8 | ) | 354.4 | (3 | ) | 8 | |||||||||||||||||||
| Canada | 187.5 | 9.8 | - | (5.9 | ) | 191.4 | 2 | 5 | ||||||||||||||||||||
| Largest 5 Markets | 2,164.2 | 44.2 | - | (13.6 | ) | 2,194.8 | 1 | 2 | ||||||||||||||||||||
| Latin America | 744.4 | 210.5 | 1.7 | (102.4 | ) | 854.2 | 15 | 28 | ||||||||||||||||||||
| EMEA | 503.1 | 29.9 | - | 7.6 | 540.6 | 7 | 6 | |||||||||||||||||||||
| Asia | 125.9 | 13.3 | - | (5.0 | ) | 134.2 | 7 | 11 | ||||||||||||||||||||
| Global Markets | 1,373.4 | 253.7 | 1.7 | (99.8 | ) | 1,529.0 | 11 | 18 | ||||||||||||||||||||
| Payment Services | 40.0 | 5.2 | 13.9 | (4.3 | ) | 54.8 | 37 | 13 | ||||||||||||||||||||
| Total | $ | 3,577.6 | 303.1 | 15.6 | (117.7 | ) | 3,778.6 | 6 | 8 | |||||||||||||||||||
| Operating profit: | ||||||||||||||||||||||||||||
| U.S. | $ | 32.0 | (19.2 | ) | - | - | 12.8 | (60 | ) | (60 | ) | |||||||||||||||||
| France | 39.7 | 3.1 | - | 1.7 | 44.5 | 12 | 8 | |||||||||||||||||||||
| Mexico | 17.7 | 8.5 | - | 0.7 | 26.9 | 52 | 48 | |||||||||||||||||||||
| Brazil | 39.9 | 6.1 | - | (4.9 | ) | 41.1 | 3 | 15 | ||||||||||||||||||||
| Canada | 9.3 | 1.6 | - | (0.4 | ) | 10.5 | 13 | 17 | ||||||||||||||||||||
| Largest 5 Markets | 138.6 | 0.1 | - | (2.9 | ) | 135.8 | (2 | ) | - | |||||||||||||||||||
| Latin America | 90.0 | 64.0 | 0.3 | (18.1 | ) | 136.2 | 51 | 71 | ||||||||||||||||||||
| EMEA | 45.3 | 1.2 | - | 0.5 | 47.0 | 4 | 3 | |||||||||||||||||||||
| Asia | 14.8 | 6.5 | - | (0.3 | ) | 21.0 | 42 | 44 | ||||||||||||||||||||
| Global Markets | 150.1 | 71.7 | 0.3 | (17.9 | ) | 204.2 | 36 | 48 | ||||||||||||||||||||
| Payment Services | 1.2 | (1.4 | ) | 1.5 | (0.3 | ) | 1.0 | (17 | ) | unfav | ||||||||||||||||||
Corporate items(c) | (82.9 | ) | (30.8 | ) | - | - | (113.7 | ) | 37 | 37 | ||||||||||||||||||
| Operating profit - non-GAAP | 207.0 | 39.6 | 1.8 | (21.1 | ) | 227.3 | 10 | 19 | ||||||||||||||||||||
Other items not allocated to segments(d) | (44.8 | ) | 4.1 | (8.7 | ) | (14.7 | ) | (64.1 | ) | (43 | ) | (9 | ) | |||||||||||||||
| Operating profit - GAAP | $ | 162.2 | 43.7 | (6.9 | ) | (35.8 | ) | 163.2 | 1 | 27 | ||||||||||||||||||
Amounts may not add due to rounding.
See page 25 for footnotes.
28
Analysis of Segment Results: 2013 versus 2012
Largest 5 Markets
France Revenues increased by 1% ($6.2 million) due to favorable effect of currency exchange rates ($16.7 million), partially offset by an organic decrease ($10.5 million). Revenues decreased on an organic basis by 2% driven by higher volumes in Ireland, Switzerland and Russia, partially offset by a 2012 commercial settlement in the Netherlands and lower volumes in France due to a customer loss.
Mexico Revenues increased 7% ($28.9 million) due to a 4% organic increase ($15.5 million) due to growth in volumes. Operating profit increased 52% ($9.2 million) on volume growth and productivity initiatives.
Brazil Revenues decreased 3% ($9.2 million) primarily due to the same as the analysis of EMEA GAAP revenues.
CanadaRevenues in North America increased 1%2% ($5.1 million) due to a 1% organic increase ($11.0 million) as growth in Canada was offset by CIT volume and price pressure in the U.S. and unfavorable currency impact ($5.9 million) in Canada.
Operating profit increased 90%13% ($7.91.2 million) driven byprimarily as a result of organic increases in Hong Kong and Singapore, as well as lower regional overhead.revenue growth.
Global Markets
| GAAP | |||||||||||||||||||
| Acquisitions / | |||||||||||||||||||
| Organic | Dispositions | Currency | % Change | ||||||||||||||||
| (In millions) | 2011 | Change | (a) | (b) | 2012 | Total | Organic | ||||||||||||
| Revenues: | |||||||||||||||||||
| Latin America | $ | 1,460.7 | 215.4 | 1.5 | (98.2) | 1,579.4 | 8 | 15 | |||||||||||
| EMEA | 1,143.0 | 69.9 | 0.3 | (87.3) | 1,125.9 | (1) | 6 | ||||||||||||
| North America | 923.4 | (25.5) | (2.6) | (2.0) | 893.3 | (3) | (3) | ||||||||||||
| Asia Pacific | 135.8 | 5.4 | - | (4.8) | 136.4 | - | 4 | ||||||||||||
| Total | $ | 3,662.9 | 265.2 | (0.8) | (192.3) | 3,735.0 | 2 | 7 | |||||||||||
| Operating profit: | |||||||||||||||||||
| Latin America | $ | 143.5 | 0.1 | (0.3) | (8.2) | 135.1 | (6) | - | |||||||||||
| EMEA | 73.4 | 21.7 | (0.4) | (6.6) | 88.1 | 20 | 30 | ||||||||||||
| North America | 30.3 | 1.5 | 0.2 | (0.1) | 31.9 | 5 | 5 | ||||||||||||
| Asia Pacific | 15.1 | (6.0) | - | (0.3) | 8.8 | (42) | (40) | ||||||||||||
| Segment operating profit | 262.3 | 17.3 | (0.5) | (15.2) | 263.9 | 1 | 7 | ||||||||||||
| Non-segment | (59.8) | (20.7) | (8.4) | - | (88.9) | 49 | 35 | ||||||||||||
| Total | $ | 202.5 | (3.4) | (8.9) | (15.2) | 175.0 | (14) | (2) | |||||||||||
| Segment operating margin: | |||||||||||||||||||
| Latin America | 9.8% | 8.6% | |||||||||||||||||
| EMEA | 6.4% | 7.8% | |||||||||||||||||
| North America | 3.3% | 3.6% | |||||||||||||||||
| Asia Pacific | 11.1% | 6.5% | |||||||||||||||||
| Segment operating margin | 7.2% | 7.1% | |||||||||||||||||
| Non-GAAP | |||||||||||||||||||
| Acquisitions / | |||||||||||||||||||
| Organic | Dispositions | Currency | % Change | ||||||||||||||||
| (In millions) | 2011 | Change | (a) | (b) | 2012 | Total | Organic | ||||||||||||
| Revenues: | |||||||||||||||||||
| Latin America | $ | 1,460.7 | 215.4 | 1.5 | (98.2) | 1,579.4 | 8 | 15 | |||||||||||
| EMEA | 1,143.0 | 69.9 | 0.3 | (87.3) | 1,125.9 | (1) | 6 | ||||||||||||
| North America | 923.4 | (25.5) | (2.6) | (2.0) | 893.3 | (3) | (3) | ||||||||||||
| Asia Pacific | 135.8 | 5.4 | - | (4.8) | 136.4 | - | 4 | ||||||||||||
| Total | $ | 3,662.9 | 265.2 | (0.8) | (192.3) | 3,735.0 | 2 | 7 | |||||||||||
| Operating profit: | |||||||||||||||||||
| Latin America | $ | 145.6 | (8.0) | 0.7 | (8.2) | 130.1 | (11) | (5) | |||||||||||
| EMEA | 73.4 | 21.7 | - | (6.6) | 88.5 | 21 | 30 | ||||||||||||
| North America | 33.5 | 7.1 | 0.2 | (0.1) | 40.7 | 21 | 21 | ||||||||||||
| Asia Pacific | 15.1 | (6.0) | - | (0.3) | 8.8 | (42) | (40) | ||||||||||||
| Segment operating profit | 267.6 | 14.8 | 0.9 | (15.2) | 268.1 | - | 6 | ||||||||||||
| Non-segment | (40.6) | (1.7) | - | - | (42.3) | 4 | 4 | ||||||||||||
| Total | $ | 227.0 | 13.1 | 0.9 | (15.2) | 225.8 | (1) | 6 | |||||||||||
| Segment operating margin: | |||||||||||||||||||
| Latin America | 10.0% | 8.2% | |||||||||||||||||
| EMEA | 6.4% | 7.9% | |||||||||||||||||
| North America | 3.6% | 4.6% | |||||||||||||||||
| Asia Pacific | 11.1% | 6.5% | |||||||||||||||||
| Segment operating margin | 7.3% | 7.2% | |||||||||||||||||
partially offset by the negative impact of currency exchange rates ($6.6102.4 million).
driven by higher profits in Venezuela, organic growth in Argentina, including 2012 write-offs of Argentinean government receivables ($4.1 million), and organic growth in Chile, partially offset by the negative impact of currency exchange rates ($6.6 million).
EMEA Revenues increased 7% ($37.5 million) primarily due to organic growth from higher volumes in Ireland, Switzerland and Russia. Operating profit increased 4% ($1.7 million) driven by $1.6 millionorganic increases in Russia, Switzerland and Luxembourg partially offset by organic decreases in Germany, Morocco and Greece.
Asia Revenues increased 7% ($8.3 million) due mainly to organic growth across the region partially offset by unfavorable currency impact ($5.0 million). Operating profit increased 42% ($6.2 million) driven by organic increases in Hong Kong and Singapore.
Payment Services
Payment Services Revenues increased 37% ($14.8 million) primarily due to organic improvementan acquisition in Brazil ($13.9 million). Operating profit was down organically due to investment in the U.S. as a result of cost reductions despite lower CIT demand and continued pricing pressure,payments business offset by increased U.S. retirement charges ($5.6 million).
| GAAP | Years Ended December 31, | % change | ||||||||||||
| (In millions) | 2013 | 2012 | 2011 | 2013 | 2012 | |||||||||
| General and administrative | $ | (44.5) | (44.4) | (46.6) | - | (5) | ||||||||
| Retirement costs (primarily former operations) | (41.3) | (47.4) | (24.8) | (13) | 91 | |||||||||
| Gains on business acquisitions and dispositions | 2.8 | 0.8 | 9.2 | fav | (91) | |||||||||
| Royalty income | 1.9 | 2.1 | 1.7 | (10) | 24 | |||||||||
| Gains on sale of property and other assets | - | - | 0.7 | - | (100) | |||||||||
| Non-segment income (expense) | $ | (81.1) | (88.9) | (59.8) | (9) | 49 | ||||||||
| Years Ended December 31, | % change | |||||||||||||||||||
| (In millions) | 2014 | 2013 | 2012 | 2014 | 2013 | |||||||||||||||
| General, administrative and other expenses | $ | (108.8 | ) | (116.4 | ) | (87.4 | ) | (7 | ) | 33 | ||||||||||
| Reconciliation of segment policies to GAAP | (2.3 | ) | 2.7 | 4.5 | unfav | (40 | ) | |||||||||||||
| Corporate items | $ | (111.1 | ) | (113.7 | ) | (82.9 | ) | (2 | ) | 37 | ||||||||||
Corporate items in 20132014 were $7.8$2.6 million lower than 2012, mainly due to:
| Non-GAAP | Years Ended December 31, | % change | ||||||||||||
| (In millions) | 2013 | 2012 | 2011 | 2013 | 2012 | |||||||||
| General and administrative | $ | (44.5) | (44.4) | (42.5) | - | 4 | ||||||||
| Royalty income | 1.9 | 2.1 | 1.7 | (10) | 24 | |||||||||
| Gains on sale of property and other assets | - | - | 0.2 | - | (100) | |||||||||
| Non-segment income (expense) | $ | (42.6) | (42.3) | (40.6) | 1 | 4 | ||||||||
Other Items Not Allocated to Segments
| Years Ended December 31, | % change | |||||||||||||||||||
| (In millions) | 2014 | 2013 | 2012 | 2014 | 2013 | |||||||||||||||
| FX devaluation in Venezuela | $ | (142.7 | ) | (14.6 | ) | - | unfav | unfav | ||||||||||||
| U.S. retirement plans | (73.1 | ) | (52.9 | ) | (56.2 | ) | 38 | (6 | ) | |||||||||||
| 2014 Reorganization and Restructuring | (21.8 | ) | - | - | unfav | - | ||||||||||||||
| Acquisitions and dispositions | 49.4 | 5.8 | 14.6 | fav | (60 | ) | ||||||||||||||
| Mexican settlement losses | (5.9 | ) | (2.4 | ) | (3.2 | ) | unfav | (25 | ) | |||||||||||
| Share-based compensation adj. | (2.4 | ) | - | - | unfav | - | ||||||||||||||
| Total | $ | (196.5 | ) | (64.1 | ) | (44.8 | ) | unfav | 43 | |||||||||||
See note 2 on page 75 to the consolidated financial statements for 2014explanations of each of the other items not allocated to segments.
2014 versus 2013
Other items not allocated to segments was a non-GAAP basis will be approximately $45 millionhigher expense in 2014 up slightlycompared to 2013 primarily due to higher losses from 2013.devaluations in Venezuela, accruals for severance expenses related to the 2014 Reorganization and Restructuring, and higher expenses related to U.S. retirement plans, partially offset by higher gains from acquisitions and dispositions (principally, the sale of an investment in a CIT business operating in Peru).
2013 versus 2012
Other items not allocated to segments was a higher expense in 2013 compared to 2012 primarily due to losses from devaluations in Venezuela in 2013 and lower gains from acquisitions and dispositions.
2015 Outlook
We will likely recognize additional transaction losses related to our net monetary assets held in Venezuela. See page 3959, ITEM 7A. Quantitative and Qualitative Disclosures about Market – Foreign Currency Risks, for the estimated effects of potential currency devaluations in Venezuela. See page 47 for a summary5-year projection of expenses based on current assumptions for our significant U.S. retirement plans. We are not able to estimate the amount of settlement expenses of our 2014 Outlook.Mexican subsidiaries.
Other Operating Income (Expense)and Expense
Other operating income (expense)and expense includes amounts included in segment and non-segment other operatingas well as income and expense.expense not allocated to segments.
| Years Ended December 31, | % change | |||||||||||||
| (In millions) | 2013 | 2012 | 2011 | 2013 | 2012 | |||||||||
| Share in earnings of equity affiliates | $ | 6.7 | 6.0 | 4.8 | 12 | 25 | ||||||||
| Gains on business acquisitions and dispositions | 2.8 | 0.8 | 9.2 | fav | (91) | |||||||||
| Royalty income | 1.9 | 2.1 | 1.7 | (10) | 24 | |||||||||
| Gains on sale of property and other assets | 2.4 | 7.6 | 1.2 | (68) | fav | |||||||||
| Impairment losses | (2.9) | (2.4) | (2.4) | 21 | - | |||||||||
| Foreign currency items: | ||||||||||||||
| Transaction losses | (20.2) | (4.2) | (3.7) | unfav | 14 | |||||||||
| Hedge gains (losses) | (0.4) | 0.2 | 2.2 | unfav | (91) | |||||||||
| Other | 0.3 | 0.9 | 5.0 | (67) | (82) | |||||||||
| Other operating income (expense) | $ | (9.4) | 11.0 | 18.0 | unfav | (39) | ||||||||
| Years Ended December 31, | % change | |||||||||||||||||||
| (In millions) | 2014 | 2013 | 2012 | 2014 | 2013 | |||||||||||||||
| Foreign currency items: | ||||||||||||||||||||
| Transaction losses | $ | (130.8 | ) | (20.2 | ) | (4.0 | ) | unfav | unfav | |||||||||||
| Hedge gains (losses) | 1.4 | (0.4 | ) | 0.2 | fav | unfav | ||||||||||||||
| Gains on sale of property and other assets | 44.9 | 2.4 | 7.6 | fav | (68 | ) | ||||||||||||||
| Impairment losses | (3.3 | ) | (2.9 | ) | (2.4 | ) | 14 | 21 | ||||||||||||
| Share in earnings of equity affiliates | 4.3 | 6.7 | 6.0 | (36 | ) | 12 | ||||||||||||||
| Royalty income | 1.5 | 1.9 | 2.1 | (21 | ) | (10 | ) | |||||||||||||
| Gains on business acquisitions and dispositions | - | 2.8 | 0.8 | (100 | ) | fav | ||||||||||||||
| Other | 1.0 | 0.3 | 0.9 | fav | (67 | ) | ||||||||||||||
| Other operating income and expense | $ | (81.0 | ) | (9.4 | ) | 11.2 | unfav | unfav | ||||||||||||
2014 versus 2013
Other operating expense increased in 2014 primarily as a result of a remeasurement of net monetary assets in Venezuela due to the adoption of the government’s SICAD II currency exchange process partially offset by a $44.3 million gain on the sale of an equity interest in a CIT business in Peru. See note 1 to the consolidated financial statements for a description of the change in currency exchange processes and rates in Venezuela.
2013 versus 2012
Other operating income decreased to a loss in 2013 primarily as a result of unfavorable factors including:
| · | $ |
| · | a $7.2 million gain on sale of real estate in Venezuela in 2012 |
partially offset by
| · | $1.7 million in gains from favorable purchase price adjustments primarily related to a January 2013 purchase of |
| · | a $1.1 million gain related to favorable purchase price adjustment for the 2010 Mexico acquisition. |
Nonoperating Income and Expense
Interest Expense
| Years Ended December 31, | % change | |||||||||||||||||||
| (In millions) | 2014 | 2013 | 2012 | 2014 | 2013 | |||||||||||||||
| Interest expense | $ | 23.4 | 25.1 | 23.1 | (7 | ) | 9 | |||||||||||||
| Years Ended December 31, | % change | ||||||||||||
| (In millions) | 2013 | 2012 | 2011 | 2013 | 2012 | ||||||||
| Interest expense | $ | 25.1 | 23.1 | 23.1 | 9 | - | |||||||
Interest expense was slightly lower in 2014 compared to 2013 due to lower weighted average interest rates, partially offset by higher average borrowings.
Interest expense was slightly higher in 2013 compared to 2012 due to an increase in average borrowings in the current year.
Interest and Other Income
| Years Ended December 31, | % change | ||||||||
| (In millions) | 2014 | 2013 | 2012 | 2014 | 2013 | ||||
| Interest income | $ | 3.0 | 2.7 | 4.6 | 11 | (41) | |||
| Gain on available-for-sale securities | 0.4 | 0.4 | 2.9 | - | (86) | ||||
| Foreign currency hedge losses | (1.0) | (1.0) | - | - | unfav | ||||
| Other | (0.5) | (0.6) | (0.5) | (17) | 20 | ||||
| Interest and other income (expense) | $ | 1.9 | 1.5 | 7.0 | 27 | (79) | |||
| Years Ended December 31, | % change | |||||||||||||
| (In millions) | 2013 | 2012 | 2011 | 2013 | 2012 | |||||||||
| Interest income | $ | 2.7 | 4.8 | 5.7 | (44) | (16) | ||||||||
| Gain on available-for-sale securities | 0.4 | 2.9 | 4.4 | (86) | (34) | |||||||||
| Foreign currency hedge losses | (1.0) | - | - | unfav | - | |||||||||
| Other | (0.5) | (0.5) | (1.2) | - | (58) | |||||||||
| Interest and other income (expense) | $ | 1.6 | 7.2 | 8.9 | (78) | (19) | ||||||||
Interest and other income (expense) was lower in 2013 compared to 2012 primarily due to:
| · | a $2.5 million decrease in gain on available-for-sale securities as we realized gains in 2012 on security sales to fund pension payments to former executives |
| · | a |
| · | $1.0 million in foreign currency hedge losses in 2013 related to a cross currency swap contract. |
Outlook for 20142015 (GAAP and Non-GAAP)
We expect our interest and other income to be $1 million to $2nonoperating expense of $21 million in 20142015 versus $2$22 million in 2013. 2014.
See page 3923 for a summary of our 2014 outlook.2015 outlook and page 37 for information about reconciliation to GAAP.
Income Taxes
| Summary Rate Reconciliation – GAAP | ||||||||||||
| (In percentages) | 2014 | 2013 | 2012 | |||||||||
| U.S. federal tax rate | 35.0 | % | 35.0 | % | 35.0 | % | ||||||
| Increases (reductions) in taxes due to: | ||||||||||||
| Venezuela devaluation | (86.4 | ) | - | - | ||||||||
| Adjustments to valuation allowances | (16.9 | ) | 4.2 | 1.1 | ||||||||
| Foreign income taxes | (0.7 | ) | (6.7 | ) | (1.8 | ) | ||||||
| Medicare subsidy for retirement plans | - | (1.1 | ) | (15.6 | ) | |||||||
| French business tax | (9.1 | ) | 3.2 | 3.0 | ||||||||
| Taxes on undistributed earnings of foreign affiliates | (3.7 | ) | (0.1 | ) | (2.4 | ) | ||||||
| State income taxes, net | 5.2 | (0.1 | ) | (0.1 | ) | |||||||
| Change in judgment about uncertain tax positions in Mexico | - | - | (5.1 | ) | ||||||||
| Other | 1.7 | 0.9 | 1.6 | |||||||||
| Income tax rate on continuing operations | (74.9 | ) % | 35.3 | % | 15.7 | % | ||||||
| (In percentages) | 2013 | 2012 | 2011 | ||||||||
| U.S. federal tax rate | 35.0 | % | 35.0 | % | 35.0 | % | |||||
| Increases (reductions) in taxes due to: | |||||||||||
| Adjustments to valuation allowances | 4.0 | 1.2 | (2.9) | ||||||||
| Foreign income taxes | (6.5) | (2.2) | 0.3 | ||||||||
| Medicare subsidy for retirement plans | (1.1) | (14.4) | - | ||||||||
| Nontaxable acquisition (gains) losses | - | - | (0.4) | ||||||||
| French business tax | 3.0 | 2.7 | 2.4 | ||||||||
| Change in judgment about uncertain tax positions in Mexico | - | (4.7) | - | ||||||||
| Other | 0.7 | (0.6) | (0.4) | ||||||||
| Income tax rate on continuing operations | 35.1 | % | 17.0 | % | 34.0 | % | |||||
Summary Rate Reconciliation – Non-GAAP(a)
| (In percentages) | 2013 | 2012 | 2011 | ||||||||
| U.S. federal tax rate | 35.0 | % | 35.0 | % | 35.0 | % | |||||
| Increases (reductions) in taxes due to: | |||||||||||
| Adjustments to valuation allowances | 1.5 | 0.9 | (2.6) | ||||||||
| French business tax | 2.0 | 2.1 | 2.1 | ||||||||
| Other | (5.2) | (1.4) | 0.5 | ||||||||
| Income tax rate on Non-GAAP continuing operations | 33.3 | % | 36.6 | % | 35.0 | % | |||||
| (a) | See pages 40–46 for a reconciliation of non-GAAP results to GAAP. | ||||||||||
| (In percentages) | 2014 | 2013 | 2012 | ||||||||||
| U.S. federal tax rate | 35.0 | % | 35.0 | % | 35.0 | % | |||||||
| Increases (reductions) in taxes due to: | |||||||||||||
| Adjustments to valuation allowances | 5.6 | 1.6 | 0.8 | ||||||||||
| French business tax | 3.0 | 2.2 | 2.3 | ||||||||||
| Other | (5.1 | ) | (4.6 | ) | - | ||||||||
| Income tax rate on Non-GAAP continuing operations | 38.5 | % | 34.2 | % | 38.1 | % | |||||||
| (a) | See pages 36–37 for a reconciliation of non-GAAP results to GAAP. | ||||||||||||
Overview
Our effective tax rate has varied in the past three years from the statutory U.S. federal rate due to various factors, including
| · | changes in judgment about the need for valuation allowances |
| · | changes in the geographical mix of earnings |
| · | nontaxable acquisition gains and losses |
| · | changes in laws in the U.S., France and Mexico |
| · | changes in the foreign currency rate used to measure Venezuela’s tax results |
| · | timing of benefit recognition for uncertain tax positions |
| · | state income taxes |
We establish or reverse valuation allowances for deferred tax assets depending on all available information including historical and expected future operating performance of our subsidiaries. Changes in judgment about the future realization of deferred tax assets can result in significant adjustments to the valuation allowances. Based on our historical and future expected taxable earnings, we believe it is more likely than not that we will realize the benefit of the deferred tax assets, net of valuation allowances.
Continuing Operations
2014 Compared to U.S. Statutory Rate
The effective income tax rate on continuing operations in 2014 was lower than the 35% U.S. statutory tax rate (negative 75%) primarily due to a significant Venezuela currency remeasurement loss, which was largely non-deductible. Excluding the remeasurement loss, the effective income tax rate was higher than the 35% U.S. statutory tax rate due to $9.9 million of tax expense from cross border payments and $4.4 million of tax expense due to the characterization of a French business tax as an income tax, mostly offset by a $4.6 million tax benefit due to the jurisdictional mix of earnings including the favorable Venezuela permanent inflation adjustment.
33
2013 Compared to U.S. Statutory Rate
The effective income tax rate on continuing operations in 2013 approximated the 35% U.S. statutory tax rate due to $6.1 million of tax expense from cross border payments and $4.4 million of tax expense due to the characterization of a French business tax as an income tax, mostly offset by a $8.7$8.4 million tax benefit due to the jurisdictional mix of earnings including the favorable Venezuela permanent inflation adjustment.
2012 Compared to U.S. Statutory Rate
The effective income tax rate on continuing operations in 2012 was lower than the 35% U.S. statutory tax rate largely due to a $21.1 million non-cash tax benefit related to a change in retiree healthcare funding strategy and a $7.5 million tax benefit related to a change in judgment on uncertain tax positions, partially offset by $5.2$5.7 million of tax expense due to the jurisdictional mix of earnings and the characterization of a French business tax as an income tax.
Outlook for 20142015
On a GAAP and Non GAAPNon-GAAP basis, the effective income tax rate for 20142015 is expected to be between 33% and 37%42%. Our effective tax rate may fluctuate materially from these estimatesthis due to changes in permanent book-tax differences, changes in the expected geographical mix of earnings, changes in current or deferred taxes due to legislative changes, changes in valuation allowances or accruals for contingencies and other factors. See page 3923 for a summary of our 2014 Outlook.2015 outlook and pages 36–37 for information about reconciliations to GAAP.
Other
As of December 31, 2013,2014, we have not recorded U.S. federal deferred income taxes on approximately $259$78 million of undistributed earnings of foreign subsidiaries and equity affiliates in accordance with FASB ASC Topic 740, Income Taxes.Taxes. We expect that these earnings will be permanently reinvested in operations outside the U.S. It is not practical to computedetermine the estimated deferredincome tax liability on these earnings.that might be incurred if all such income was remitted to the U.S. due to the inherent complexities associated with any hypothetical calculation, which would be dependent upon the exact form of repatriation.
Noncontrolling Interests
| Years Ended December 31, | % change | ||||||||||||
| (In millions) | 2013 | 2012 | 2011 | 2013 | 2012 | ||||||||
| Net income attributable to noncontrolling interests | $ | 24.3 | 20.8 | 24.0 | 17 | (13) | |||||||
| Years Ended December 31, | % change | ||||||||||||||||
| (In millions) | 2014 | 2013 | 2012 | 2014 | 2013 | ||||||||||||
| Net income (loss) attributable to noncontrolling interests | $ | (30.9 | ) | 24.3 | 20.8 | unfav | 17 | ||||||||||
The net loss attributable to noncontrolling interests in 2014 was primarily due to currency losses of our Venezuelan subsidiary. We recognized $121.6 million of currency exchange losses as a result of the March 2014 currency devaluation in Venezuela from the remeasurement of net monetary assets. We also recognized $21.1 million of incremental expense related to nonmonetary assets in 2014 because of the devaluation. Nonmonetary assets were not remeasured to a lower basis when the currency devalued. Instead, under highly inflationary accounting rules, these assets retained their higher historical bases, with the excess recognized in earnings as the asset is consumed. The after-tax effect of these currency-related losses attributable to noncontrolling interests was $47.8 million in 2014.
The increase in net income attributable to noncontrolling interests in 2013 was primarily due to an increase in net income of our Venezuelan subsidiaries.
Outlook for 2014
2015
We expect net income attributable to noncontrolling interests on a non-GAAP basis in 20142015 to be $26 million to $30$11 million as compared to $29a net loss attributable to noncontrolling interests of $31 million in 2013.2014 ($18 million on a Non-GAAP basis and $10 million on an Adjusted Non-GAAP basis in 2014). Our 20142015 outlook reflects an expected decrease in earnings from our Venezuelan subsidiaries. See page 3923 for a summary of our 2014 Outlook.2015 outlook and page 37 for information about reconciliations to GAAP.
Loss from Discontinued Operations
| Years Ended December 31, | |||||||||
| (In millions) | 2013 | 2012 | 2011 | ||||||
Loss from operations(a)(b) | $ | (26.0) | (22.5) | (21.8) | |||||
Gain (loss) on sales(a) | 16.3 | (0.3) | - | ||||||
| Settlement loss related to Belgium bankruptcy | - | - | (10.1) | ||||||
Adjustments to contingencies of former operations(c): | |||||||||
| Workers’ compensation | (1.7) | (0.2) | (1.4) | ||||||
| Gain from Federal Black Lung Excise Tax refunds | - | - | 4.2 | ||||||
| Other | 1.0 | (0.3) | (0.6) | ||||||
| Loss from discontinued operations before income taxes | (10.4) | (23.3) | (29.7) | ||||||
| Provision (benefit) for income taxes | 4.7 | (1.0) | (3.9) | ||||||
| Loss from discontinued operations, net of tax | $ | (15.1) | (22.3) | (25.8) | |||||
| Years Ended December 31, | ||||||||||||
| (In millions) | 2014 | 2013 | 2012 | |||||||||
Loss from operations(a)(b) | $ | (13.3 | ) | (17.4 | ) | (9.5 | ) | |||||
| Gain (loss) on sales | (18.9 | ) | 16.3 | (0.3 | ) | |||||||
Adjustments to contingencies of former operations(c): | ||||||||||||
| Workers' compensation | (4.4 | ) | (1.7 | ) | (0.2 | ) | ||||||
Insurance recoveries related to BAX Global indemnification(d) | 9.5 | - | - | |||||||||
| Other | (1.6 | ) | 1.0 | (0.3 | ) | |||||||
| Loss from discontinued operations before income taxes | (28.7 | ) | (1.8 | ) | (10.3 | ) | ||||||
| Provision for income taxes | 0.4 | 7.4 | 3.1 | |||||||||
| Loss from discontinued operations, net of tax | $ | (29.1 | ) | (9.2 | ) | (13.4 | ) | |||||
| (b) | The loss from operations in 2014 included $15.6 million in non-cash severance and impairment charges related to the Netherlands cash-in-transit operations. The loss from operations in 2013 |
| (c) | Primarily |
| (d) | BAX Global had been defending a claim related to the apparent diversion by a third party of goods being transported for a customer. In 2010, the Dutch Supreme Court denied the final appeal of BAX Global, letting stand the lower court ruling that BAX Global was liable for this claim. We had contractually indemnified the purchaser of BAX Global for this contingency. Through 2010, we had recognized $11.5 million of expense related to the payment made in satisfaction of the judgment. In 2014, we recovered $9.5 million from insurance companies related to this matter. |
Cash-in-transit operations sold or shut down:
| · | Poland (sold in March 2013) |
| · | Turkey (shut down in June 2013) |
| · | Hungary (sold in September 2013) |
| · | Germany (sold in December 2013) |
| · | Australia (sold in October 2014) |
| · | Puerto Rico (shut down in November 2014) |
| · | Netherlands (sold in December 2014) |
Guarding operations sold:
| · | Morocco (December 2012) |
| · | France (January 2013) |
| · | Germany (July 2013) |
Other operations sold:
| · | We sold Threshold Financial Technologies, Inc. in Canada in November 2013. Threshold operated private-label ATM network and payment processing businesses. Brink’s continues to own and operate Brink’s Integrated Managed Services for ATM customers. |
| · | We sold ICD Limited and other affiliated subsidiaries in November 2013. ICD |
| December 31, | ||||||||
| (In millions) | 2013 | 2012 | 2011 | |||||
| EMEA | $ | 77.6 | 136.9 | 153.9 | ||||
| North America | 41.2 | 52.1 | 50.8 | |||||
| Asia Pacific | 23.6 | 22.5 | 17.9 | |||||
| Total | $ | 142.4 | 211.5 | 222.6 | ||||
| GAAP | Non-GAAP | ||||||||||||
| (In millions) | Full-Year | Full-Year 2014 | Full-Year | Full-Year 2014 | |||||||||
| 2013 | Estimate | 2013 | Estimate | ||||||||||
| Organic revenue growth | |||||||||||||
| Latin America | 17% | 12% – 14% | 17% | 12% – 14% | |||||||||
| EMEA | 2% | 0% – 2% | 2% | 0% – 2% | |||||||||
| North America | 1% | 0% – 2% | 1% | 0% – 2% | |||||||||
| Asia Pacific | 11% | 5% – 7% | 11% | 5% – 7% | |||||||||
| Total | 8% | 5% – 8% | 8% | 5% – 8% | |||||||||
| Currency impact on revenue | |||||||||||||
| Latin America | (9)% | (6)% – (8)% | (9)% | (6)% – (8)% | |||||||||
| EMEA | 2% | (1)% – (3)% | 2% | (1)% – (3)% | |||||||||
| North America | (1)% | flat | (1)% | flat | |||||||||
| Asia Pacific | (5)% | (1)% – (3)% | (5)% | (1)% – (3)% | |||||||||
| Total | (3)% | (3)% – (5)% | (3)% | (3)% – (5)% | |||||||||
| Segment margin | |||||||||||||
Latin America(a) | 8.7% | 7.5% – 9.5% | 9.8% | 7.5% – 9.5% | |||||||||
| EMEA | 6.9% | 6.0% – 8.0% | 6.9% | 6.0% – 8.0% | |||||||||
North America(b) | 0.5% | 1.5% – 2.5% | 1.8% | 2.5% – 3.5% | |||||||||
| Asia Pacific | 11.5% | 9.5% – 11.5% | 12.2% | 9.5% – 11.5% | |||||||||
| Total | 6.4% | ~6.8% | 7.2% | ~7% | |||||||||
| Non-segment expense: | |||||||||||||
| General and administrative | $ | 45 | 47 | $ | 45 | 47 | |||||||
Retirement plans(b) | 41 | 19 | - | - | |||||||||
Acquisition gains(c) | (3) | - | - | - | |||||||||
| Royalty income | (2) | (2) | (2) | (2) | |||||||||
| Non-segment expense | $ | 81 | 64 | $ | 43 | 45 | |||||||
Effective income tax rate(a) | 35% | 33% – 37% | 33% | 33% – 37% | |||||||||
| Interest expense | $ | 25 | 27 – 29 | $ | 25 | 27 – 29 | |||||||
| Interest and other income (expense) | 2 | 1 – 2 | 2 | 1 – 2 | |||||||||
| Net income attributable to | |||||||||||||
noncontrolling interests(a) | $ | 24 | 26 – 30 | $ | 29 | 26 – 30 | |||||||
| Fixed assets acquired: | |||||||||||||
| Capital expenditures | $ | 178 | 185 – 195 | $ | 178 | 185 – 195 | |||||||
Capital leases(d) | 5 | 15 | 5 | 15 | |||||||||
| Total | $ | 183 | 200 – 210 | $ | 183 | 200 – 210 | |||||||
| Depreciation and amortization | $ | 174 | 185 – 190 | $ | 174 | 185– 190 | |||||||
| · |
Non-GAAP Results – Reconciled to Amounts Reported under GAAP
Non-GAAP results described in this filing are financial measures that are not required by or presented in accordance with GAAP.
U.S. generally accepted accounting principles (“GAAP”). The purpose of the non-GAAP informationNon-GAAP results is to report our financial information excluding certain income and expenses. Amounts reported for prior periods have been updated in this report to present information consistently for all periods presented.
Adjusted Non-GAAP results report historical financial information assuming that our Venezuelan operations have been remeasured using a rate of 50 bolivars to the U.S. dollar.
The non-GAAPconsolidated Non-GAAP outlook amounts for 2015 and 2016 are not reconciled to GAAP because we are unable to quantify certain amounts that would be required to be included in the GAAP measures without unreasonable effort.
The Non-GAAP information provides information to assist comparability and estimates of future performance. We believeBrink’s believes these measures are helpful in assessing the performance of our ongoing operations and estimating future results and enablingenable period-to-period comparability of financial performance. The valuation impact of our legacy liabilities and related cash outflows can be assessed on a basis that is separate and distinct fromIn addition, Brink’s believes the measures will help investors assess the ongoing operations. Non-GAAP results should not be considered as an alternative to revenue,revenues, income or earnings per share amounts determined in accordance with GAAP and should be read in conjunction with their GAAP counterparts.
| (In millions, except for per share amounts) | GAAP Basis | Gains and Losses on Acquisitions and Dispositions (a) | Net Monetary Asset Remeasurement Losses in Venezuela (b) | Employee Benefit Settlement Losses (c) | U.S. Retirement Plans (d) | Adjust Income Tax Rate (e) | Non-GAAP Basis | |||||||||||
| First Quarter 2013 | ||||||||||||||||||
| Revenues: | ||||||||||||||||||
| Latin America | $ | 412.9 | - | - | - | - | - | 412.9 | ||||||||||
| EMEA | 277.8 | - | - | - | - | - | 277.8 | |||||||||||
| North America | 223.2 | - | - | - | - | - | 223.2 | |||||||||||
| Asia Pacific | 36.6 | - | - | - | - | - | 36.6 | |||||||||||
| Revenues | $ | 950.5 | - | - | - | - | - | 950.5 | ||||||||||
| Operating profit: | ||||||||||||||||||
| Latin America | $ | 23.4 | - | 13.4 | 0.3 | - | - | 37.1 | ||||||||||
| EMEA | 8.6 | - | - | - | - | - | 8.6 | |||||||||||
| North America | (2.0) | - | - | - | 2.9 | - | 0.9 | |||||||||||
| Asia Pacific | 4.3 | - | - | - | - | - | 4.3 | |||||||||||
| Segment operating profit | 34.3 | - | 13.4 | 0.3 | 2.9 | - | 50.9 | |||||||||||
| Non-segment | (17.0) | (1.1) | - | - | 10.5 | - | (7.6) | |||||||||||
| Operating profit | $ | 17.3 | (1.1) | 13.4 | 0.3 | 13.4 | - | 43.3 | ||||||||||
| Amounts attributable to Brink’s: | ||||||||||||||||||
| Income from continuing operations | $ | 2.9 | (1.1) | 8.4 | 0.2 | 8.2 | 0.1 | 18.7 | ||||||||||
| Diluted EPS – continuing operations | 0.06 | (0.02) | 0.17 | - | 0.17 | - | 0.38 | |||||||||||
| Non-GAAP Results – Reconciled to Amounts Reported Under GAAP (Continued) | ||||||||||||||||||
| (In millions, except for per share amounts) | GAAP Basis | Gains and Losses on Acquisitions and Dispositions (a) | Net Monetary Asset Remeasurement Losses in Venezuela (b) | Employee Benefit Settlement Losses (c) | U.S. Retirement Plans (d) | Adjust Income Tax Rate (e) | Non-GAAP Basis | |||||||||||
| Second Quarter 2013 | ||||||||||||||||||
| Revenues: | ||||||||||||||||||
| Latin America | $ | 413.6 | - | - | - | - | - | 413.6 | ||||||||||
| EMEA | 293.4 | - | - | - | - | - | 293.4 | |||||||||||
| North America | 226.3 | - | - | - | - | - | 226.3 | |||||||||||
| Asia Pacific | 36.6 | - | - | - | - | - | 36.6 | |||||||||||
| Revenues | $ | 969.9 | - | - | - | - | - | 969.9 | ||||||||||
| Operating profit: | ||||||||||||||||||
| Latin America | $ | 24.4 | - | - | 0.5 | - | - | 24.9 | ||||||||||
| EMEA | 18.7 | - | - | - | - | - | 18.7 | |||||||||||
| North America | 6.3 | - | - | - | 2.9 | - | 9.2 | |||||||||||
| Asia Pacific | 5.0 | - | - | - | - | - | 5.0 | |||||||||||
| Segment operating profit | 54.4 | - | - | 0.5 | 2.9 | - | 57.8 | |||||||||||
| Non-segment | (21.6) | - | - | - | 10.2 | - | (11.4) | |||||||||||
| Operating profit | $ | 32.8 | - | - | 0.5 | 13.1 | - | 46.4 | ||||||||||
| Amounts attributable to Brink’s: | ||||||||||||||||||
| Income from continuing operations | $ | 13.2 | - | - | 0.4 | 7.7 | 1.5 | 22.8 | ||||||||||
| Diluted EPS – continuing operations | 0.27 | - | - | 0.01 | 0.16 | 0.03 | 0.47 | |||||||||||
| Third Quarter 2013 | ||||||||||||||||||
| Revenues: | ||||||||||||||||||
| Latin America | $ | 423.8 | - | - | - | - | - | 423.8 | ||||||||||
| EMEA | 301.2 | - | - | - | - | - | 301.2 | |||||||||||
| North America | 222.5 | - | - | - | - | - | 222.5 | |||||||||||
| Asia Pacific | 34.9 | - | - | - | - | - | 34.9 | |||||||||||
| Revenues | $ | 982.4 | - | - | - | - | - | 982.4 | ||||||||||
| Operating profit: | ||||||||||||||||||
| Latin America | $ | 42.8 | - | - | 0.8 | - | - | 43.6 | ||||||||||
| EMEA | 32.1 | - | - | - | - | - | 32.1 | |||||||||||
| North America | 0.2 | - | - | - | 2.9 | - | 3.1 | |||||||||||
| Asia Pacific | 4.8 | - | - | - | - | - | 4.8 | |||||||||||
| Segment operating profit | 79.9 | - | - | 0.8 | 2.9 | - | 83.6 | |||||||||||
| Non-segment | (20.7) | (0.9) | - | - | 10.3 | - | (11.3) | |||||||||||
| Operating profit | $ | 59.2 | (0.9) | - | 0.8 | 13.2 | - | 72.3 | ||||||||||
| Amounts attributable to Brink’s: | ||||||||||||||||||
| Income from continuing operations | $ | 29.8 | (0.9) | - | 0.6 | 7.7 | (1.8) | 35.4 | ||||||||||
| Diluted EPS – continuing operations | 0.61 | (0.02) | - | 0.01 | 0.16 | (0.04) | 0.72 | |||||||||||
| Non-GAAP Results – Reconciled to Amounts Reported Under GAAP (Continued) | ||||||||||||||||||
| (In millions, except for per share amounts) | GAAP Basis | Gains and Losses on Acquisitions and Dispositions (a) | Net Monetary Asset Remeasurement Losses in Venezuela (b) | Employee Benefit Settlement Losses (c) | U.S. Retirement Plans (d) | Adjust Income Tax Rate (e) | Non-GAAP Basis | |||||||||||
| Fourth Quarter 2013 | ||||||||||||||||||
| Revenues: | ||||||||||||||||||
| Latin America | $ | 470.4 | - | - | - | - | - | 470.4 | ||||||||||
| EMEA | 305.9 | - | - | - | - | - | 305.9 | |||||||||||
| North America | 226.4 | - | - | - | - | - | 226.4 | |||||||||||
| Asia Pacific | 36.7 | - | - | - | - | - | 36.7 | |||||||||||
| Revenues | $ | 1,039.4 | - | - | - | - | - | 1,039.4 | ||||||||||
| Operating profit: | ||||||||||||||||||
| Latin America | $ | 59.3 | 2.2 | - | 0.9 | - | - | 62.4 | ||||||||||
| EMEA | 22.1 | - | - | - | - | - | 22.1 | |||||||||||
| North America | 0.2 | - | - | - | 2.9 | - | 3.1 | |||||||||||
| Asia Pacific | 2.6 | 0.9 | - | - | - | - | 3.5 | |||||||||||
| Segment operating profit | 84.2 | 3.1 | - | 0.9 | 2.9 | - | 91.1 | |||||||||||
| Non-segment | (21.8) | (0.8) | - | - | 10.3 | - | (12.3) | |||||||||||
| Operating profit | $ | 62.4 | 2.3 | - | 0.9 | 13.2 | - | 78.8 | ||||||||||
| Amounts attributable to Brink’s: | ||||||||||||||||||
| Income from continuing operations | $ | 26.0 | 4.0 | - | 0.6 | 8.2 | 0.2 | 39.0 | ||||||||||
| Diluted EPS – continuing operations | 0.53 | 0.08 | - | 0.01 | 0.17 | - | 0.79 | |||||||||||
| Full Year 2013 | ||||||||||||||||||
| Revenues: | ||||||||||||||||||
| Latin America | $ | 1,720.7 | - | - | - | - | - | 1,720.7 | ||||||||||
| EMEA | 1,178.3 | - | - | - | - | - | 1,178.3 | |||||||||||
| North America | 898.4 | - | - | - | - | - | 898.4 | |||||||||||
| Asia Pacific | 144.8 | - | - | - | - | - | 144.8 | |||||||||||
| Revenues | $ | 3,942.2 | - | - | - | - | - | 3,942.2 | ||||||||||
| Operating profit: | ||||||||||||||||||
| Latin America | $ | 149.9 | 2.2 | 13.4 | 2.5 | - | - | 168.0 | ||||||||||
| EMEA | 81.5 | - | - | - | - | - | 81.5 | |||||||||||
| North America | 4.7 | - | - | - | 11.6 | - | 16.3 | |||||||||||
| Asia Pacific | 16.7 | 0.9 | - | - | - | - | 17.6 | |||||||||||
| Segment operating profit | 252.8 | 3.1 | 13.4 | 2.5 | 11.6 | - | 283.4 | |||||||||||
| Non-segment | (81.1) | (2.8) | - | - | 41.3 | - | (42.6) | |||||||||||
| Operating profit | $ | 171.7 | 0.3 | 13.4 | 2.5 | 52.9 | - | 240.8 | ||||||||||
| Amounts attributable to Brink’s: | ||||||||||||||||||
| Income from continuing operations | $ | 71.9 | 2.0 | 8.4 | 1.8 | 31.8 | - | 115.9 | ||||||||||
| Diluted EPS – continuing operations | 1.47 | 0.04 | 0.17 | 0.04 | 0.65 | - | 2.37 | |||||||||||
| 2014 | 2013 | |||||||||||||||
| Pre-tax | Tax | Effective tax rate | Pre-tax | Tax | Effective tax rate | |||||||||||
Effective Income Tax Rate(a) | ||||||||||||||||
| Adjusted Non-GAAP | $ | 118.6 | 49.9 | 42.1% | $ | 135.3 | 56.8 | 42.0% | ||||||||
Effect of Venezuela at 50 VEF/USD(b) | 28.9 | 6.8 | (3.6%) | 68.4 | 12.9 | (7.8%) | ||||||||||
| Non-GAAP | 147.5 | 56.7 | 38.5% | 203.7 | 69.7 | 34.2% | ||||||||||
Other items not allocated to segments(c) | (196.5) | (20.0) | (113.4%) | (64.1) | (20.4) | 1.1% | ||||||||||
| GAAP | $ | (49.0) | 36.7 | (74.9%) | $ | 139.6 | 49.3 | 35.3% | ||||||||
2012(d) | ||||||||||||||||
| Pre-tax | Tax | Effective tax rate | ||||||||||||||
Effective Income Tax Rate(a) | ||||||||||||||||
| Non-GAAP | 188.5 | 71.8 | 38.1% | |||||||||||||
Other items not allocated to segments(c) | (42.4) | (48.8) | (22.4%) | |||||||||||||
| GAAP | $ | 146.1 | 23.0 | 15.7% | ||||||||||||
Amounts may not add due to rounding.
| (a) |
| (b) |
| (c) | See “Other Items Not Allocated To |
| (d) |
Adjusted Non-GAAP and Non-GAAP reconciled to GAAP
| Years Ended December 31, | ||||||||||||
| (In millions) | 2014 | 2013 | 2012(d) | |||||||||
| Revenues: | ||||||||||||
| Adjusted Non-GAAP | $ | 3,449.2 | 3,387.1 | N/A | ||||||||
Effect of Venezuela at 50 VEF/USD(b) | 113.1 | 391.5 | N/A | |||||||||
| Non-GAAP and GAAP | $ | 3,562.3 | 3,778.6 | 3,577.6 | ||||||||
| Operating profit (loss): | ||||||||||||
| Adjusted Non-GAAP | $ | 140.1 | 158.4 | N/A | ||||||||
Effect of Venezuela at 50 VEF/USD(b) | 28.9 | 68.9 | N/A | |||||||||
| Non-GAAP | 169.0 | 227.3 | 207.0 | |||||||||
Other items not allocated to segments(c) | (196.5 | ) | (64.1 | ) | (44.8 | ) | ||||||
| GAAP | $ | (27.5 | ) | 163.2 | 162.2 | |||||||
| Provision for income taxes: | ||||||||||||
| Adjusted Non-GAAP | $ | 49.9 | 56.8 | N/A | ||||||||
Effect of Venezuela at 50 VEF/USD(b) | 6.8 | 12.9 | N/A | |||||||||
| Non-GAAP | 56.7 | 69.7 | 71.8 | |||||||||
Other items not allocated to segments(c) | (20.0 | ) | (20.4 | ) | (48.8 | ) | ||||||
| GAAP | $ | 36.7 | 49.3 | 23.0 | ||||||||
| Net income (loss) attributable to noncontrolling interests: | ||||||||||||
| Adjusted Non-GAAP | $ | 10.0 | 10.2 | N/A | ||||||||
Effect of Venezuela at 50 VEF/USD(b) | 7.6 | 19.3 | N/A | |||||||||
| Non-GAAP | 17.6 | 29.5 | 18.9 | |||||||||
Other items not allocated to segments(c) | (48.5 | ) | (5.2 | ) | 1.9 | |||||||
| GAAP | $ | (30.9 | ) | 24.3 | 20.8 | |||||||
| Income (loss) from continuing operations attributable to Brink's: | ||||||||||||
| Adjusted Non-GAAP | $ | 58.7 | 68.3 | N/A | ||||||||
Effect of Venezuela at 50 VEF/USD(b) | 14.5 | 36.2 | N/A | |||||||||
| Non-GAAP | 73.2 | 104.5 | 97.8 | |||||||||
Other items not allocated to segments(c) | (128.0 | ) | (38.5 | ) | 4.5 | |||||||
| GAAP | $ | (54.8 | ) | 66.0 | 102.3 | |||||||
| Diluted EPS | ||||||||||||
| Adjusted Non-GAAP | $ | 1.20 | 1.40 | N/A | ||||||||
Effect of Venezuela at 50 VEF/USD(b) | 0.30 | 0.74 | N/A | |||||||||
| Non-GAAP | 1.49 | 2.13 | 2.01 | |||||||||
Other items not allocated to segments(c) | (2.61 | ) | (0.78 | ) | 0.10 | |||||||
| GAAP | $ | (1.12 | ) | 1.35 | 2.11 | |||||||
| Adjusted Non-GAAP margin | 4.1 | % | 4.7 | % | N/A | |||||||
| Non-GAAP Results – Reconciled to Amounts Reported Under GAAP (Continued) | ||||||||||||||||
| (In millions, except for per share amounts) | GAAP Basis | Gains and Losses on Acquisitions and Dispositions (a) | Employee Benefit Settlement and Severance Losses (b) | U.S. Retirement Plans (c) | Tax Benefit on Change in Health Care Funding Strategy (d) | Non-GAAP Basis | ||||||||||
| Full Year 2012 | ||||||||||||||||
| Revenues: | ||||||||||||||||
| Latin America | $ | 1,579.4 | - | - | - | - | 1,579.4 | |||||||||
| EMEA | 1,125.9 | - | - | - | - | 1,125.9 | ||||||||||
| North America | 893.3 | - | - | - | - | 893.3 | ||||||||||
| Asia Pacific | 136.4 | - | - | - | - | 136.4 | ||||||||||
| Revenues | $ | 3,735.0 | - | - | - | - | 3,735.0 | |||||||||
| Operating profit: | ||||||||||||||||
| Latin America | $ | 135.1 | (8.9) | 3.9 | - | 130.1 | ||||||||||
| EMEA | 88.1 | 0.4 | - | - | 88.5 | |||||||||||
| North America | 31.9 | - | - | 8.8 | - | 40.7 | ||||||||||
| Asia Pacific | 8.8 | - | - | - | - | 8.8 | ||||||||||
| Segment operating profit | 263.9 | (8.5) | 3.9 | 8.8 | - | 268.1 | ||||||||||
| Non-segment | (88.9) | (0.8) | - | 47.4 | - | (42.3) | ||||||||||
| Operating profit | $ | 175.0 | (9.3) | 3.9 | 56.2 | - | 225.8 | |||||||||
| Amounts attributable to Brink’s: | ||||||||||||||||
| Income from continuing operations | $ | 111.2 | (14.0) | 2.8 | 33.8 | (21.1) | 112.7 | |||||||||
| Diluted EPS – continuing operations | 2.29 | (0.29) | 0.06 | 0.70 | (0.43) | 2.32 | ||||||||||
Amounts may not add due to rounding.
| Non-GAAP Results – Reconciled to Amounts Reported Under GAAP (Continued) | ||||||||||||||||
| (In millions, except for per share amounts) | GAAP Basis | Gains and Losses on Acquisitions and Dispositions (a) | Employee Benefit Settlement Losses (b) | CEO Retirement Costs (c) | U.S. Retirement Plans (d) | Non-GAAP Basis | ||||||||||
| Full Year 2011 | ||||||||||||||||
| Revenues: | ||||||||||||||||
| Latin America | $ | 1,460.7 | - | - | - | - | 1,460.7 | |||||||||
| EMEA | 1,143.0 | - | - | - | - | 1,143.0 | ||||||||||
| North America | 923.4 | - | - | - | - | 923.4 | ||||||||||
| Asia Pacific | 135.8 | - | - | - | - | 135.8 | ||||||||||
| Revenues | $ | 3,662.9 | - | - | - | - | 3,662.9 | |||||||||
| Operating profit: | ||||||||||||||||
| Latin America | $ | 143.5 | - | 2.1 | - | - | 145.6 | |||||||||
| EMEA | 73.4 | - | - | - | - | 73.4 | ||||||||||
| North America | 30.3 | - | - | - | 3.2 | 33.5 | ||||||||||
| Asia Pacific | 15.1 | - | - | - | - | 15.1 | ||||||||||
| Segment operating profit | 262.3 | - | 2.1 | - | 3.2 | 267.6 | ||||||||||
| Non-segment | (59.8) | (9.7) | - | 4.1 | 24.8 | (40.6) | ||||||||||
| Operating profit | $ | 202.5 | (9.7) | 2.1 | 4.1 | 28.0 | 227.0 | |||||||||
| Amounts attributable to Brink’s: | ||||||||||||||||
| Income from continuing operations | $ | 100.3 | (9.6) | 1.5 | 2.6 | 17.7 | 112.5 | |||||||||
| Diluted EPS – continuing operations | 2.09 | (0.20) | 0.03 | 0.05 | 0.37 | 2.34 | ||||||||||
| Full Year 2011 | ||||||||
| (In millions, except for per share amounts) | Operating Profit | EPS | ||||||
| Sale of U.S. Document Destruction business | $ | (6.7) | (0.09) | |||||
| Gains on available-for-sale equity and debt securities | - | (0.05) | ||||||
| Acquisition of controlling interests | (2.5) | (0.05) | ||||||
| Sale of former operating assets | (0.5) | (0.01) | ||||||
| $ | (9.7) | (0.20) | ||||||
| Non-GAAP Results – Reconciled to Amounts Reported Under GAAP (Continued) | ||||||||||||||||||
| (In millions, except for per share amounts) | GAAP Basis | Gains and Losses on Acquisitions and Dispositions (a) | Royalty (b) | Remeasure Venezuelan Net Monetary Assets (c) | U.S. Retirement Plans (d) | U.S. Healthcare Legislation Tax Charge (e) | Non-GAAP Basis | |||||||||||
| Full Year 2010 | ||||||||||||||||||
| Revenues: | ||||||||||||||||||
| Latin America | $ | 877.4 | - | - | - | - | - | 877.4 | ||||||||||
| EMEA | 1,022.9 | - | - | - | - | - | 1,022.9 | |||||||||||
| North America | 917.8 | - | - | - | - | - | 917.8 | |||||||||||
| Asia Pacific | 107.2 | - | - | - | - | - | 107.2 | |||||||||||
| Revenues | $ | 2,925.3 | - | - | - | - | - | 2,925.3 | ||||||||||
| Operating profit: | ||||||||||||||||||
| Latin America | $ | 118.0 | - | - | 3.2 | - | - | 121.2 | ||||||||||
| EMEA | 68.0 | - | - | - | - | - | 68.0 | |||||||||||
| North America | 44.1 | - | - | - | (1.0) | - | 43.1 | |||||||||||
| Asia Pacific | 14.5 | - | - | - | - | - | 14.5 | |||||||||||
| Segment operating profit | 244.6 | - | - | 3.2 | (1.0) | - | 246.8 | |||||||||||
| Non-segment | (62.6) | 8.6 | (4.9) | - | 22.7 | - | (36.2) | |||||||||||
| Operating profit | $ | 182.0 | 8.6 | (4.9) | 3.2 | 21.7 | - | 210.6 | ||||||||||
| Amounts attributable to Brink’s: | ||||||||||||||||||
| Income from continuing operations | $ | 87.1 | 5.6 | (3.0) | 2.0 | 13.5 | 13.7 | 118.9 | ||||||||||
| Diluted EPS – continuing operations | 1.80 | 0.12 | (0.06) | 0.04 | 0.28 | 0.29 | 2.46 | |||||||||||
| Non-GAAP Results – Reconciled to Amounts Reported Under GAAP (Continued) | ||||||||||||||||||||
| (In millions, except for per share amounts) | GAAP Basis | Gains and Losses on Acquisitions and Dispositions (a) | Change to Parallel Rate (b) | Venezuelan Currency Losses (c) | Royalty (d) | U.S. Retirement Plans (e) | Adjust Income Tax rate (f) | Non-GAAP Basis | ||||||||||||
| Full Year 2009 | ||||||||||||||||||||
| Revenues: | ||||||||||||||||||||
| Latin America | $ | 904.7 | - | (237.9) | - | - | - | - | 666.8 | |||||||||||
| EMEA | 1,085.4 | - | - | - | - | - | - | 1,085.4 | ||||||||||||
| North America | 894.1 | - | - | - | - | - | - | 894.1 | ||||||||||||
| Asia Pacific | 75.1 | - | - | - | - | - | - | 75.1 | ||||||||||||
| Revenues | $ | 2,959.3 | - | (237.9) | - | - | - | - | 2,721.4 | |||||||||||
| Operating profit: | ||||||||||||||||||||
| Latin America | $ | 130.8 | - | (43.0) | 4.5 | - | - | - | 92.3 | |||||||||||
| EMEA | 43.0 | - | - | - | - | - | - | 43.0 | ||||||||||||
| North America | 56.6 | - | - | - | - | (2.0) | - | 54.6 | ||||||||||||
| Asia Pacific | 6.9 | - | - | - | - | - | - | 6.9 | ||||||||||||
| Segment operating profit | 237.3 | - | (43.0) | 4.5 | - | (2.0) | - | 196.8 | ||||||||||||
| Non-segment | (46.6) | (24.5) | - | 22.5 | (6.8) | 20.7 | - | (34.7) | ||||||||||||
| Operating profit | $ | 190.7 | (24.5) | (43.0) | 27.0 | (6.8) | 18.7 | - | 162.1 | |||||||||||
| Amounts attributable to Brink’s: | ||||||||||||||||||||
| Income from continuing operations | $ | 220.1 | (20.8) | (23.2) | 25.2 | (4.3) | 11.7 | (117.6) | 91.1 | |||||||||||
| Diluted EPS – continuing operations | 4.63 | (0.43) | (0.49) | 0.53 | (0.09) | 0.25 | (2.48) | 1.92 | ||||||||||||
Foreign Operations
We currently serve customers in more than 100 countries, including 4341 countries where we operate subsidiaries.
We are subject to risks customarily associated with doing business in foreign countries, including labor and economic conditions, political instability, controls on repatriation of earnings and capital, nationalization, expropriation and other forms of restrictive action by local governments. Changes in the political or economic environments in the countries in which we operate could have a material adverse effect on our business, financial condition and results of operations. The future effects, if any, of these risks are unknown.
Our international operations conduct a majority of their business in local currencies. Because our financial results are reported in U.S. dollars, they are affected by changes in the value of various local currencies in relation to the U.S. dollar. Recent strengthening of the U.S. dollar has reduced our reported dollar revenues and operating profit, which may continue in 2015. Brink’s Venezuela is subject to local laws and regulatory interpretations that determine the exchange rate at which repatriating dividends may be converted and Brink’s Argentina may in the future be subject to similar restrictions. See Application of Critical Accounting Policies—Foreign Currency Translation on page 65pages 56-57 for a description of our accounting methods and assumptions used to include our Venezuelan operation in our consolidated financial statements, and a description of the accounting for subsidiaries operating in highly inflationary economies.
Changes in exchange rates may also affect transactions which are denominated in currencies other than the functional currency. From time to time, we use foreign currency forward and swap contracts to hedge transactional risks associated with foreign currencies, as discussed in Item 7A on page 67.59. At December 31, 2013,2014, the notional value of our shorter term outstanding foreign currency contracts was $46.1$43.0 million with average contract maturities of approximately 1 month. These shorter term foreign currency contracts primarily offset exposures in the Mexican peso and the euro. Additionally, these shorter term contracts are not designated as hedges for accounting purposes, and accordingly, changes in their fair value are recorded immediately in earnings. We recognized lossesgains of $0.4$1.4 million on these foreign currency contracts in 2013.2014. At December 31, 2013,2014, the fair value of these outstanding foreign currency contracts was not significant.
We also have a longer term cross currency swap contract to hedge exposure in Brazilian real which is designated as a cash flow hedge for accounting purposes. At December 31, 2013,2014, the notional value of this longer term contract was $21.2$20.8 million with a weighted average maturity of 2.51.6 years. We recognized net gains of $2.3$0.9 million on this contract, of which gains of $3.3$1.9 million were included in other operating income (expense) to offset transaction losses of $3.3$1.9 million and expenses of $1.0 million were included in interest and other income (expense) in 2013.2014. At December 31, 20132014 the fair value of the longer term cross currency swap contract was $3.7$5.5 million, of which $4.7$1.1 million is included in prepaid expenses and other and $4.4 million is included in other assets and $1.0 million is included in accrued liabilities on the consolidated balance sheet.
LIQUIDITY AND CAPITAL RESOURCES
Overview
Over the last three years, we have used cash generated from our continuing operations, proceeds from sales of investments and borrowings to
| · | invest in the infrastructure of our business (new facilities, cash sorting and other equipment for our Cash Management Services operations, armored trucks, CompuSafe® units, and |
| · | contribute funds to a U.S. pension plan ($114 million), |
| · | acquire businesses and noncontrolling interests in subsidiaries ($ |
| · | pay dividends to Brink’s shareholders ($ |
Cash flows from operating activities decreased in both 2014 and 2013 compared to the prior year. We entered intohad lower operating profit and higher pension payments in 2014 compared to 2013. Changes in working capital and cash owed to customers unfavorably affected cash flows from operating activities in 2013 compared to 2012. Cash used for investing activities declined in both 2014 and 2013 compared to the prior year as proceeds from the sale of businesses reduced the net investing outflows in both years. We also reduced our capital expenditures significantly in 2014. Cash decreased $129.9 million in 2014 as a new master lease agreement in late 2009 to finance the acquisitionresult of new armored vehiclesa change in the exchange rate we used to translate local currency cash into U.S. Vehicles acquired underdollars, primarily due to an 88% devaluation in Venezuela in March as well as a strengthening of the 2009 lease agreement have been accounted for as capital leases. Vehicles acquired underU.S. dollar late in the previous master lease agreement were accounted for as operating leases.year, particularly against currencies in Russia and Latin America.
Outlook
| · | We expect our capital expenditures (excluding assets acquired using capital leases) in |
| · |
| · | We |
Operating Activities
| Years Ended December 31, | $ change | ||||||||||||
| (In millions) | 2013 | 2012 | 2011 | 2013 | 2012 | ||||||||
| Cash flows from operating activities | |||||||||||||
| Non-GAAP basis | $ | 205.9 | 239.7 | 262.1 | $ | (33.8) | (22.4) | ||||||
Increase (decrease) in certain customer obligations(a) | (9.8) | 15.7 | (11.7) | (25.5) | 27.4 | ||||||||
Discontinued operations(b) | 5.4 | (4.9) | (3.4) | 10.3 | (1.5) | ||||||||
| GAAP basis | $ | 201.5 | 250.5 | 247.0 | $ | (49.0) | 3.5 | ||||||
| Years Ended December 31, | $ change | |||||||||||||||||||
| (In millions) | 2014 | 2013 | 2012 | 2014 | 2013 | |||||||||||||||
| Cash flows from operating activities | ||||||||||||||||||||
| Non-GAAP basis (before pension contribution) | $ | 207.6 | 207.2 | 229.1 | $ | 0.4 | (21.9 | ) | ||||||||||||
| Contributions to primary U.S. pension plan | (87.2 | ) | (13.0 | ) | (13.4 | ) | (74.2 | ) | 0.4 | |||||||||||
| Non-GAAP basis (reduced by pension contribution) | 120.4 | 194.2 | 215.7 | (73.8 | ) | (21.5 | ) | |||||||||||||
Increase (decrease) in certain customer obligations(a) | 15.4 | (9.7 | ) | 13.9 | 25.1 | (23.6 | ) | |||||||||||||
Discontinued operations(b) | 5.5 | 17.0 | 20.9 | (11.5 | ) | (3.9 | ) | |||||||||||||
| GAAP basis | $ | 141.3 | 201.5 | 250.5 | $ | (60.2 | ) | (49.0 | ) | |||||||||||
| (a) | To eliminate the change in the balance of customer obligations related to cash received and processed in certain of our secure Cash Management Services operations. The title to this cash transfers to us for a short period of time. The cash is generally credited to customers’ accounts the following day and we do not consider it as available for general corporate purposes in the management of our liquidity and capital resources. |
| (b) | To eliminate cash flows related to our discontinued operations. |
39
2014 versus 2013
GAAP
Operating cash flows decreased by $60.2 million in 2014 compared to 2013. The decrease was primarily due to higher cash contributions to our primary U.S. pension plan ($74.2 million) and lower operating profit. Cash from operating profit in 2014 was also lower partially because of lower profits in U.S. dollars terms from our Venezuelan operations due to an 88% currency devaluation in the first quarter of the year. These decreases in operating cash flows were partially offset by increases in cash provided from changes in working capital, including the timing of security loss payments and insurance recoveries, changes in customer obligations of certain of our secure Cash Management Services operations (cash held for customers increased by $15.4 million in 2014 compared to a decrease of $9.7 million 2013) and lower amounts paid for income taxes.
Non-GAAP (reduced by pension contributions)
Cash flows from operating activities decreased by $73.8 million in 2014 as compared to 2013. The decrease was primarily due to higher cash contributions to our primary U.S. pension plan and lower operating profit partially due to currency effects on our operations in Venezuela. These decreases in operating cash flows were partially offset by increases in cash provided from changes in working capital, including the timing of security loss payments and insurance recoveries, and lower amounts paid for income taxes.
Non-GAAP (before pension contributions)
Cash flows from operating activities increased by $0.4 million in 2014 as compared to 2013. The increase was primarily due to cash provided from changes in working capital, including the timing of security loss payments and insurance recoveries, and lower amounts paid for income taxes, partially offset by lower operating profit impacted by the currency effects in Venezuela.
2013 versus 2012
GAAP
Operating cash flows decreased by $49.0 million in 2013 compared to the same period in 2012. The decrease was primarily due to a $25.5$23.6 million decrease in cash held for customerscustomer obligations in certain of our secure Cash Management Services operations (cash held for customers decreased by $9.7 million in 2013 compared to an increase of $13.9 million in 2012), $19.3 million in proceeds from the sale of value-added tax receivables in Venezuela in 2012, an increase in cash used to fund working capital needs, and lower income from continuing operations, partially offset by $11.6 million cashin pension benefits paid to our former CEO in 2012 and a $10.3 million increase2012. The payment of pension benefits was funded by the sale of assets in operating cash flow from discontinued operations.an existing grantor trust, the proceeds of which are reported in investing activities.
Non-GAAP (before and after pension contribution)
Cash flows from operating activities decreased from 2012 by $33.8 million.$21.9 million ($21.5 million including pension contributions). This decrease was primarily due to $19.3 million in proceeds from the sale of value-added tax receivables in Venezuela in 2012, lower income from continuing operations and changes in working capital, partially offset by $11.6 million in cash paid to our former CEO in 2012.
Investing Activities
| Years Ended December 31, | $ change | ||||||||||||||
| (In millions) | 2013 | 2012 | 2011 | 2013 | 2012 | ||||||||||
| Cash flows from investing activities | |||||||||||||||
| Capital expenditures | $ | (177.7) | (177.9) | (183.7) | $ | 0.2 | 5.8 | ||||||||
| Acquisitions | (18.1) | (17.2) | (3.0) | (0.9) | (14.2) | ||||||||||
| Proceeds from the sale of available-for-sale securities and other investments | 9.9 | 15.4 | 12.9 | (5.5) | 2.5 | ||||||||||
| Proceeds from the sale of property and equipment | 5.9 | 12.5 | 13.9 | (6.6) | (1.4) | ||||||||||
| Redemption of cash-surrender value of life insurance policies | - | 6.2 | - | (6.2) | 6.2 | ||||||||||
| Other | (0.5) | 4.9 | 0.1 | (5.4) | 4.8 | ||||||||||
| Discontinued operations | 57.5 | (11.2) | (12.0) | 68.7 | 0.8 | ||||||||||
| Investing activities | $ | (123.0) | (167.3) | (171.8) | $ | 44.3 | 4.5 | ||||||||
| Years Ended December 31, | $ change | |||||||||||||||||||
| (In millions) | 2014 | 2013 | 2012 | 2014 | 2013 | |||||||||||||||
| Cash flows from investing activities | ||||||||||||||||||||
| Capital expenditures | $ | (136.1 | ) | (172.9 | ) | (170.9 | ) | $ | 36.8 | (2.0 | ) | |||||||||
| Acquisitions | (4.6 | ) | (18.1 | ) | (17.2 | ) | 13.5 | (0.9 | ) | |||||||||||
| Sales of available-for-sale securities | 0.9 | 9.9 | 15.4 | (9.0 | ) | (5.5 | ) | |||||||||||||
| Sales of other investments and property | 62.7 | 5.9 | 12.5 | 56.8 | (6.6 | ) | ||||||||||||||
| Redemption of cash-surrender value of life insurance policies | - | - | 6.2 | - | (6.2 | ) | ||||||||||||||
| Other | (3.6 | ) | (0.5 | ) | 4.9 | (3.1 | ) | (5.4 | ) | |||||||||||
| Discontinued operations | (13.3 | ) | 52.7 | (18.2 | ) | (66.0 | ) | 70.9 | ||||||||||||
| Investing activities | $ | (94.0 | ) | (123.0 | ) | (167.3 | ) | $ | 29.0 | 44.3 | ||||||||||
Cash used by investing activities decreased by $44.3$29.0 million in 20132014 versus 20122013. The decrease was primarily due to proceeds of $59.6 million received on the sale of an equity interest in a CIT business in Peru and a decrease in capital expenditures of $36.8 million primarily related to information technology and other equipment, partially offset by cash proceeds from the sale of discontinued operations during 2013, including Threshold Financial Technologies Inc. ($43.8 million net proceeds), ICD Limited ($30.2 million net proceeds), less the amount paid to the buyer of our German CIT operations ($13.2 million net cash paid to purchaser).
40
Cash used by investing activities decreased by $44.3 million in 2013 versus 2012 primarily due to proceeds from the sale of operations. Cash flows from investing activities were otherwise lower than 2012 due to a $6.6 million decrease in proceeds from the sale of property and equipment, $6.2 million in proceeds from the redemption of life insurance policies in 2012 and a $5.5 million decrease in proceeds from the sale of available-for-sale securities and other investments.securities.
Capital expenditures and depreciation and amortization were as follows:
| Outlook | Years Ended December 31, | $ change | |||||||||||||||
| (In millions) | 2014 | 2013 | 2012 | 2011 | 2013 | 2012 | |||||||||||
| Property and Equipment Acquired during the year | |||||||||||||||||
| Capital expenditures: | |||||||||||||||||
| Latin America | $ | (a) | 88.7 | 83.8 | 85.0 | $ | 4.9 | (1.2) | |||||||||
| EMEA | (a) | 33.9 | 40.1 | 47.3 | (6.2) | (7.2) | |||||||||||
| North America | (a) | 52.1 | 48.2 | 44.2 | 3.9 | 4.0 | |||||||||||
| Asia Pacific | (a) | 3.0 | 5.8 | 7.2 | (2.8) | (1.4) | |||||||||||
| Capital expenditures | $ | 185 - 195 | 177.7 | 177.9 | 183.7 | $ | (0.2) | (5.8) | |||||||||
Capital leases(b): | |||||||||||||||||
| Latin America | $ | (a) | 0.9 | 2.7 | 7.4 | $ | (1.8) | (4.7) | |||||||||
| EMEA | (a) | - | - | 0.1 | - | (0.1) | |||||||||||
| North America | (a) | 4.6 | 15.4 | 35.4 | (10.8) | (20.0) | |||||||||||
| Asia Pacific | (a) | - | - | 0.1 | - | (0.1) | |||||||||||
| Capital leases | $ | 15 | 5.5 | 18.1 | 43.0 | $ | (12.6) | (24.9) | |||||||||
| Total: | |||||||||||||||||
| Latin America | $ | (a) | 89.6 | 86.5 | 92.4 | $ | 3.1 | (5.9) | |||||||||
| EMEA | (a) | 33.9 | 40.1 | 47.4 | (6.2) | (7.3) | |||||||||||
| North America | (a) | 56.7 | 63.6 | 79.6 | (6.9) | (16.0) | |||||||||||
| Asia Pacific | (a) | 3.0 | 5.8 | 7.3 | (2.8) | (1.5) | |||||||||||
| Total | $ | 200 - 210 | 183.2 | 196.0 | 226.7 | $ | (12.8) | (30.7) | |||||||||
| Depreciation and amortization | |||||||||||||||||
| Latin America | $ | (a) | 60.8 | 50.7 | 45.3 | $ | 10.1 | 5.4 | |||||||||
| EMEA | (a) | 48.8 | 43.7 | 47.0 | 5.1 | (3.3) | |||||||||||
| North America | (a) | 58.2 | 55.4 | 50.8 | 2.8 | 4.6 | |||||||||||
| Asia Pacific | (a) | 5.8 | 5.9 | 5.0 | (0.1) | 0.9 | |||||||||||
| Depreciation and amortization | $ | 185 – 190 | 173.6 | 155.7 | 148.1 | $ | 17.9 | 7.6 | |||||||||
| Outlook | Years Ended December 31, | $ change | ||||||||||||||||||||||
| (In millions) | 2015 | 2014 | 2013 | 2012 | 2014 | 2013 | ||||||||||||||||||
| Property and Equipment Acquired during the year | ||||||||||||||||||||||||
| Capital expenditures: | ||||||||||||||||||||||||
| Largest 5 Markets | $ | (a | ) | 83.4 | 103.5 | 103.7 | $ | (20.1 | ) | (0.2 | ) | |||||||||||||
| Global Markets | (a) | 35.2 | 38.1 | 51.5 | (2.9 | ) | (13.4 | ) | ||||||||||||||||
| Payment Services | (a) | 0.8 | 1.5 | 1.8 | (0.7 | ) | (0.3 | ) | ||||||||||||||||
| Corporate items | (a) | 16.7 | 29.8 | 13.9 | (13.1 | ) | 15.9 | |||||||||||||||||
| Capital expenditures | $ | 145 - 155 | 136.1 | 172.9 | 170.9 | $ | (36.8 | ) | 2.0 | |||||||||||||||
Capital leases(b): | ||||||||||||||||||||||||
| Largest 5 Markets | $ | (a | ) | 10.6 | 5.4 | 18.1 | $ | 5.2 | (12.7 | ) | ||||||||||||||
| Global Markets | (a) | 0.3 | - | 0.1 | 0.3 | (0.1 | ) | |||||||||||||||||
| Payment Services | (a) | 1.2 | - | - | 1.2 | - | ||||||||||||||||||
| Corporate items | (a) | - | - | - | - | - | ||||||||||||||||||
| Capital leases | $ | 15 | 12.1 | 5.4 | 18.2 | $ | 6.7 | (12.8 | ) | |||||||||||||||
| Total: | ||||||||||||||||||||||||
| Largest 5 Markets | $ | (a | ) | 94.0 | 108.9 | 121.8 | $ | (14.9 | ) | (12.9 | ) | |||||||||||||
| Global Markets | (a) | 35.5 | 38.1 | 51.6 | (2.6 | ) | (13.5 | ) | ||||||||||||||||
| Payment Services | (a) | 2.0 | 1.5 | 1.8 | 0.5 | (0.3 | ) | |||||||||||||||||
| Corporate items | (a) | 16.7 | 29.8 | 13.9 | (13.1 | ) | 15.9 | |||||||||||||||||
| Total | $ | 160 - 170 | 148.2 | 178.3 | 189.1 | $ | (30.1 | ) | (10.8 | ) | ||||||||||||||
| Depreciation and amortization | ||||||||||||||||||||||||
| Largest 5 Markets | $ | (a | ) | 107.7 | 110.0 | 100.9 | $ | (2.3 | ) | 9.1 | ||||||||||||||
| Global Markets | (a) | 41.0 | 45.7 | 41.0 | (4.7 | ) | 4.7 | |||||||||||||||||
| Payment Services | (a) | 3.7 | 3.7 | 2.0 | - | 1.7 | ||||||||||||||||||
| Corporate items | (a) | 9.5 | 6.4 | 4.5 | 3.1 | 1.9 | ||||||||||||||||||
| Depreciation and amortization | $ | 160 | 161.9 | 165.8 | 148.4 | $ | (3.9 | ) | 17.4 | |||||||||||||||
| (a) | Not provided. |
| (b) | Represents the amount of property and equipment acquired using capital leases. Because the assets are acquired without using cash, the acquisitions are not reflected in the consolidated cash flow statement. Amounts are provided here to assist in the comparison of assets acquired in the current year versus prior years. Sale leaseback transactions are excluded from “Capital leases” in this table. |
We continue to focus on maximizing asset utilization and maintenance of capital expenditures which has enabled us to reducewe have reduced our annual spend to a level more in line with depreciation. Our reinvestment ratio, which we define as the annual amount of capital expendituresproperty and equipment acquired during the year divided by the annual amount of depreciation, and amortization, was 0.9 in 2014, 1.1 in 2013, and 1.3 in 2012,2012.
Capital expenditures in 2014 for our operating units were primarily for investments in information technology, machinery and 1.6equipment and armored vehicles. Capital expenditures in 2011.2014 were $36.8 million lower compared to 2013. Total property and equipment acquired in 2014 was $30.1 million lower than the prior year. Total property and equipment acquired during 2015 is expected to be $160 million to $170 million.
Capital expenditures in 2013 for our operating units were primarily for new cash processing and security equipment, armored vehicles and information technology. Capital expenditures in 2013 were relatively flat when compared to the same period in 2012, however total property and equipment acquired in 2013 was $12.8$10.8 million lower than the prior year. Total property and equipment acquired during 2014 is expected to be $200 million to $210 million.
Financing Activities
Summary of Financing Activities
| Years Ended December 31, | ||||||||||||
| (In millions) | 2014 | 2013 | 2012 | |||||||||
| Cash provided (used) by financing activities | ||||||||||||
| Borrowings and repayments: | ||||||||||||
| Short-term debt | $ | (7.8 | ) | 60.5 | 3.3 | |||||||
| Long-term revolving credit facilities | 115.0 | 13.8 | (4.5 | ) | ||||||||
| Other long-term debt | (73.5 | ) | (23.5 | ) | (20.0 | ) | ||||||
| Borrowings (repayments) | 33.7 | 50.8 | (21.2 | ) | ||||||||
| Dividends attributable to: | ||||||||||||
| Shareholders of Brink’s | (19.4 | ) | (19.2 | ) | (19.0 | ) | ||||||
| Noncontrolling interests in subsidiaries | (8.6 | ) | (6.0 | ) | (13.0 | ) | ||||||
| Acquisition-related financing activities: | ||||||||||||
| Acquisition of noncontrolling interests in subsidiaries | - | (18.5 | ) | (9.4 | ) | |||||||
| Payment of acquisition-related obligation | - | (12.8 | ) | - | ||||||||
| Other | (2.4 | ) | 2.2 | (5.2 | ) | |||||||
| Discontinued operations | - | (2.5 | ) | (0.2 | ) | |||||||
| Cash flows from financing activities | $ | 3.3 | (6.0 | ) | (68.0 | ) | ||||||
| Years Ended December 31, | ||||||||||
| (In millions) | 2013 | 2012 | 2011 | |||||||
| Cash provided (used) by financing activities | ||||||||||
| Borrowings and repayments: | ||||||||||
| Short-term debt | $ | 60.5 | 3.3 | (7.2) | ||||||
| Long-term revolving credit facilities | 13.8 | (4.5) | (107.0) | |||||||
| Issuance of private placement notes | - | - | 100.0 | |||||||
| Other long-term debt | (23.5) | (20.0) | (29.3) | |||||||
| Borrowings (repayments) | 50.8 | (21.2) | (43.5) | |||||||
| Debt financing costs | (0.1) | (1.5) | (0.6) | |||||||
| Cash proceeds from sale-leaseback transactions | - | - | 17.6 | |||||||
| Dividends attributable to: | ||||||||||
| Shareholders of Brink’s | (19.2) | (19.0) | (18.7) | |||||||
| Noncontrolling interests in subsidiaries | (6.0) | (13.0) | (16.1) | |||||||
| Acquisition of noncontrolling interests in subsidiaries | (18.5) | (9.4) | - | |||||||
| Payment of acquisition-related obligation | (12.8) | - | - | |||||||
| Other | 2.3 | (3.7) | 4.3 | |||||||
| Discontinued operations | (2.5) | (0.2) | (10.2) | |||||||
| Cash flows from financing activities | $ | (6.0) | (68.0) | (67.2) | ||||||
2014 versus 2013
2013 versus 2012
Cash used by financing activities decreased by $62.0 million in 2013 versus 2012 as we increased short-term debt and borrowed from our revolving credit facilities. The increase in net borrowings was partially offset by an increase in payments related to acquisitionsacquisition-related financing activities ($21.9 million) in 2013. In 2012 and 2011, we repaid a portion of our debt as cash flows from operating activities exceeded the net cash used by our investing activities..
Dividends
We paid dividends to Brink’s shareholders of $0.10 per share in each of the last 12 quarters. Future dividends are dependent on our earnings, financial condition, shareholders’ equity levels, our cash flow and business requirements, as determined by the board of directors.
Effect of Exchange Rate Changes on Cash and Cash Equivalents
Changes in currency exchange rates reduced the amount of cash and cash equivalents by $129.9 million during 2014, compared to a reduction of $18.7 million in 2013 and an increase of $3.6 million in 2012. Approximately $93 million of the 2014 reduction was due to a currency devaluation in Venezuela that occurred in the first quarter. See note 1 to the consolidated financial statements for more information. The rest of the change related to the strengthening of the U.S. dollar against many of the currencies in the countries where we operate, particularly in Russia and Latin America.
42
Capitalization
We use a combination of debt, leases and equity to capitalize our operations.
As of December 31, 2013,2014, debt as a percentage of capitalization (defined as total debt and equity) was 36%50% compared to 40%36% at December 31, 2012.2013. The decrease resulted mainly fromratio increased in 2014 because our equity decreased and our debt increased. Our equity in 2014 were negatively affected by a higher equity balance comparedcurrency devaluation in Venezuela and lower discount rates and new mortality tables used to estimate the endvalue of 2013. Equityour retirement obligations at year end. Our debt increased primarily as a result of a decrease in the accumulated other comprehensive loss relatedbecause we borrowed to retirement benefit plans in 2013.
fund contributions to our primary U.S. pension plan.
Summary of Debt, Equity and Other Liquidity Information
| Amount available | ||||||||||||||||
| under credit facilities | Outstanding balance | |||||||||||||||
| December 31, | December 31, | |||||||||||||||
| (In millions) | 2013 | 2013 | 2012 | $ change(a) | ||||||||||||
| Debt: | ||||||||||||||||
| Revolving Facility | $ | 359.4 | $ | 120.6 | 107.2 | $ | 13.4 | |||||||||
| Private Placement Notes | - | 100.0 | 100.0 | - | ||||||||||||
| Capital leases | - | 76.4 | 91.3 | (14.9) | ||||||||||||
| Dominion Terminal Associates bonds | - | 43.2 | 43.2 | - | ||||||||||||
| Multi-currency revolving facilities | 46.1 | 6.2 | 10.2 | (4.0) | ||||||||||||
| 2012 Credit Facility | 13.5 | 11.0 | 3.8 | 7.2 | ||||||||||||
| Letter of Credit Facilities | 70.0 | - | - | - | ||||||||||||
| Other | - | 78.6 | 33.6 | 45.0 | ||||||||||||
| Debt | $ | 489.0 | $ | 436.0 | 389.3 | $ | 46.7 | |||||||||
| Total equity | $ | 779.5 | 576.8 | $ | 202.7 | |||||||||||
| Amount available | ||||||||||||||||
| under credit facilities | Outstanding balance | |||||||||||||||
| December 31, | December 31, | |||||||||||||||
| (In millions) | 2014 | 2014 | 2013 | $ change(a) | ||||||||||||
| Debt: | ||||||||||||||||
| Revolving Facility | $ | 247.0 | $ | 233.0 | 120.6 | $ | 112.4 | |||||||||
| Private Placement Notes | - | 100.0 | 100.0 | - | ||||||||||||
| Capital leases | - | 64.9 | 76.4 | (11.5 | ) | |||||||||||
Dominion Terminal Associates bonds(b) | - | - | 43.2 | (43.2 | ) | |||||||||||
| Multi-currency revolving facilities | 20.0 | 5.7 | 6.2 | (0.5 | ) | |||||||||||
| 2012 Credit Facility | 24.5 | - | 11.0 | (11.0 | ) | |||||||||||
| Letter of Credit Facilities | 72.0 | - | - | - | ||||||||||||
| Other | - | 63.2 | 78.6 | (15.4 | ) | |||||||||||
| Debt | $ | 363.5 | $ | 466.8 | 436.0 | $ | 30.8 | |||||||||
| Total equity | $ | 473.8 | 779.5 | $ | (305.7 | ) | ||||||||||
| (a) | In addition to cash borrowings and repayments, the change in the debt balance also includes changes in currency exchange rates. |
| (b) | Redeemed in 2014. |
Reconciliation of Net Debt to U.S. GAAP Measures
| December 31, | |||||||||||||
| (In millions) | 2013 | 2012 | $ change | ||||||||||
| Debt: | |||||||||||||
| Short-term debt | $ | 80.9 | 26.7 | $ | 54.2 | ||||||||
| Long-term debt | 355.1 | 362.6 | (7.5) | ||||||||||
| Total Debt | 436.0 | 389.3 | 46.7 | ||||||||||
| Less: | |||||||||||||
| Cash and cash equivalents | 255.5 | 201.7 | 53.8 | ||||||||||
Amounts held by Cash Management Services operations(a) | (31.3) | (44.0) | 12.7 | ||||||||||
| Cash and cash equivalents available for general corporate purposes | 224.2 | 157.7 | 66.5 | ||||||||||
| Net Debt | $ | 211.8 | 231.6 | $ | (19.8) | ||||||||
| December 31, | ||||||||||||
| (In millions) | 2014 | 2013 | $ change | |||||||||
| Debt: | ||||||||||||
| Short-term debt | $ | 59.4 | 80.9 | $ | (21.5 | ) | ||||||
| Long-term debt | 407.4 | 355.1 | 52.3 | |||||||||
| Total Debt | 466.8 | 436.0 | 30.8 | |||||||||
| Less: | ||||||||||||
| Cash and cash equivalents | 176.2 | 255.5 | (79.3 | ) | ||||||||
Amounts held by Cash Management Services operations(a) | (28.0 | ) | (31.3 | ) | 3.3 | |||||||
| Cash and cash equivalents available for general corporate purposes | 148.2 | 224.2 | (76.0 | ) | ||||||||
| Net Debt | $ | 318.6 | 211.8 | $ | 106.8 | |||||||
| (a) | Title to cash received and processed in certain of our secure Cash Management Services operations transfers to us for a short period of time. The cash is generally credited to customers’ accounts the following day and we do not consider it as available for general corporate purposes in the management of our liquidity and capital resources and in our computation of Net Debt. |
Net Debt is a supplemental non-GAAP financial measure that is not required by, or presented in accordance with GAAP. We use Net Debt as a measure of our financial leverage. We believe that investors also may find Net Debt to be helpful in evaluating our financial leverage. Net Debt should not be considered as an alternative to Debt determined in accordance with GAAP and should be reviewed in conjunction with our consolidated balance sheets. Set forth above is a reconciliation of Net Debt, a non-GAAP financial measure, to Debt, which is the most directly comparable financial measure calculated and reported in accordance with GAAP, as of December 31, 2013,2014, and December 31, 2012.2013. Net Debt excluding cash and debt in Venezuelan operations was $332 million at December 31, 2014, and $306 million at December 31, 2013, and $280 million at December 31, 2012.2013.
Net Debt at the end of 2013 decreased2014 increased by $20$107 million compared to Net Debt at the end of 20122013 primarily due to positive operating cash flows exceeding cash used for capital expenditures, business acquisitions and for the payment of dividends. A significant portionadoption of the improvement in Net Debt related to cash generationless favorable SICAD II rate in Venezuela, (see Liquidity Needs below). Net Debt withoutwhich reduced the U.S. dollar value of bolivars held in Venezuela, increased $26and borrowings used to fund $87 million becauseof cash flows from operations excluding Venezuela did not exceed cash used for capital expenditures, business acquisitions and for the payment of dividends (each excluding Venezuela).contributions to our primary U.S. pension plan in 2014.
Liquidity Needs
Our operating liquidity needs are typically financed by cash from operations, short-term debt and the Revolving Facility (our debt facilities are described below). We have certain limitations and considerations related to the cash and borrowing capacity that are reported in our consolidated financial statements. Based on our current cash on hand, amounts available under our credit facilities and current projections of cash flows from operations, we believe that we will be able to meet our liquidity needs for more than the next twelve months.
Limitations on dividends from foreign subsidiaries. A significant portion of our operations are outside the U.S. which may make it difficult to repatriate additional cash for use in the U.S. See Item 1A., Risk Factors, for more information on the risks associated with having businesses outside the U.S.
Incremental taxes. Of the $256$176 million of cash and cash equivalents at December 31, 2013, approximately $2262014, $145 million is held by subsidiaries that we consider to be permanently invested and for which we do not expect to repatriate to the U.S. If we decidedwere to decide to repatriate this cash to the U.S., we may have to accrue and pay additional income taxes. Given the number of foreign operations and the complexities of the tax law, it is not practical to estimate the potential tax liability, but the amount of taxes owed could be material depending on how and when the repatriation occurred.
Argentina. We have $6.6 million in cash held in Argentinean pesos at December 31, 2014. The Argentinean government has, from time-to-time, imposed limits on the exchange of local pesos into U.S. dollars. As a result, we have elected in the past and may elect in the future to repatriate cash from Argentina using alternative legal methods, which may result in less favorable exchange rates. We have $10.9 million in cash held in Argentinean pesos at December 31, 2013.
Debt
We have a $480million unsecured revolving bank credit facility (the “Revolving Facility”) that matures in January 2017. The Revolving Facility’s interest rate is based on LIBOR plus a margin, alternate base rate plus a margin, or competitive bid. The Revolving Facility allows us to borrow or issue letters of credit (or otherwise satisfy credit needs) on a revolving basis over the term of the facility.As of December 31, 2013, $3592014, $247 million was available under the Revolving Facility. Amounts outstanding under the Revolving Facility as of December 31, 2013,2014, were denominated primarily in U.S. dollars and to a lesser extent in euros.
The margin on LIBOR borrowings under the Revolving Facility, which can range from 0.9% to 1.575% depending on our credit rating, was 1.40% at December 31, 2013.2014. The margin on alternate base rate borrowings under the Revolving Facility can range from 0.0% to 0.575%. We also pay an annual facility fee on the Revolving Facility based on our credit rating. The facility fee can range from 0.10% to 0.30 %0.30% and was 0.225% at December 31, 2013.2014.
We have $100 million in unsecured notes through a private placement debt transaction (the “Notes”). The Notes comprise $50 million in series A notes with a fixed interest rate of 4.57% and $50 million in series B notes with a fixed interest rate of 5.20%. The Notes are due in January 2021 with principal payments under the series A notes to beginbeginning in January 2015.
We have a $24 million unsecured committed credit facility that expires in April 2014.2016. Interest on this facility is based on LIBOR plus a margin, which ranges from 1.20% to 1.575%. As of December 31, 2013, $142014, $24 million was available under the facility.
44
We have three unsecured letter of credit facilities totaling $179 million, of which approximately $70$72 million was available at December 31, 2013. A $54 million facility expires in December 2016, an2014. An $85 million facility expires in June 2015, and a $40 million facility expires in
December 2015.2015, and a $54 million facility expires in December 2016. The Revolving Facility and the multi-currency revolving credit facilities are also used for issuance of letters of credit and bank guarantees.
The Revolving Facility, the Notes, the unsecured multi-currency revolving bank credit facilities, the unsecured committed credit facility and the letter of credit facilities contain subsidiary guarantees and various financial and other covenants. The financial covenants, among other things, limit our total indebtedness, limit priority debt, limit asset sales, limit the use of proceeds from asset sales and provide for minimum coverage of interest costs. The credit agreements do not provide for the acceleration of payments should our credit rating be reduced. If we were not to comply with the terms of our various credit agreements, the repayment terms could be accelerated and the commitments could be withdrawn. An acceleration of the repayment terms under one agreement could trigger the acceleration of the repayment terms under the other loan agreements. We were in compliance with all financial covenants at December 31, 2013.2014.
We have $43redeemed $43.2 million of bonds issued by the Peninsula Ports Authority of Virginia recorded as debt on our balance sheet.at par in the third quarter of 2014. The amount paid, including accrued and unpaid interest, was $44.3 million. Although we arewere not the primary obligor of the debt, we haverecorded the obligation as debt because we had guaranteed the debt and we believe that we will ultimately pay this obligation.its payment. The guarantee originated as part of a former interest in Dominion Terminal Associates, a deep water coal terminal. We continueterminal related to pay interest on the debt. The bonds bear a fixed interest rate of 6.0% and mature in 2033. The bonds may mature prior to 2033 upon the occurrence of specified events such as the determination that the bonds are taxable or if we fail to abide by the terms of the guarantee.our former coal business.
Equity
Common Stock
At December 31, 2013,2014, we had 100 million shares of common stock authorized and 48.448.6 million shares issued and outstanding.
On February 28, 2012, we filed a shelf registration statement under Form S-3ASR with the SEC for $150 million of our common stock. Under this shelf registration, we arewere able to issue up to $150 million of new common stock. The shelf registration expired on February 28, 2015.
On March 6, 2012, we issued 361,446 shares of our common stock and contributed the shares to our primary U.S. pension plan. Sales of these shares by the pension plan are covered under our shelf registration statement. The common stock was valued for purposes of the contribution at $24.90 per share, or $9 million in the aggregate, which reflected a 2.4% discount from the $25.51 per share closing share price of our common stock on March 5, 2012.
Preferred Stock
At December 31, 2013,2014, we had the authority to issue up to 2.0 million shares of preferred stock, par value $10 per share.
Off Balance Sheet Arrangements
We have operating leases that are described in the notes to the consolidated financial statements. We use operating leases to lower our cost of financings. We believe that operating leases are an important component of our capital structure.
Contractual Obligations
The following table reflects our contractual obligations as of December 31, 2013.2014.
| Estimated Payments Due by Period | ||||||||||||||||||||
| Later | ||||||||||||||||||||
| (In millions) | 2014 | 2015 | 2016 | 2017 | 2018 | Years | Total | |||||||||||||
| Contractual obligations: | ||||||||||||||||||||
| Long-term debt obligations | $ | 4.1 | 13.7 | 9.1 | 129.7 | 7.1 | 115.0 | 278.7 | ||||||||||||
| Capital lease obligations | 20.5 | 20.7 | 13.7 | 10.4 | 6.4 | 4.7 | 76.4 | |||||||||||||
| Operating lease obligations | 81.5 | 65.3 | 48.7 | 22.0 | 15.9 | 43.0 | 276.4 | |||||||||||||
| Purchase obligations | 14.4 | 2.3 | 1.4 | 1.3 | 1.3 | - | 20.7 | |||||||||||||
| Other long-term liabilities reflected on the | ||||||||||||||||||||
| Company’s balance sheet under GAAP: | ||||||||||||||||||||
| Primary U.S. pension plan | 25.9 | 28.9 | 31.6 | 18.7 | 4.4 | - | 109.5 | |||||||||||||
| Other retirement obligations: | ||||||||||||||||||||
| UMWA plans | - | - | - | - | - | 238.5 | 238.5 | |||||||||||||
| Black lung and other plans | 5.7 | 5.3 | 5.1 | 4.8 | 4.5 | 52.9 | 78.3 | |||||||||||||
| Workers compensation and other claims | 24.3 | 8.9 | 5.6 | 3.5 | 3.7 | 20.4 | 66.4 | |||||||||||||
| Uncertain tax positions | 1.7 | - | - | - | - | - | 1.7 | |||||||||||||
| Other | 0.8 | 0.8 | 0.8 | 0.8 | 0.8 | 10.4 | 14.4 | |||||||||||||
| Total | $ | 178.9 | 145.9 | 116.0 | 191.2 | 44.1 | 484.9 | 1,161.0 | ||||||||||||
| Estimated Payments Due by Period | ||||||||||||||||||||||||||||
| Later | ||||||||||||||||||||||||||||
| (In millions) | 2015 | 2016 | 2017 | 2018 | 2019 | Years | Total | |||||||||||||||||||||
| Contractual obligations: | ||||||||||||||||||||||||||||
| Long-term debt obligations | $ | 12.8 | 8.9 | 240.6 | 7.1 | 7.1 | 66.0 | 342.5 | ||||||||||||||||||||
| Capital lease obligations | 21.3 | 17.3 | 9.7 | 7.1 | 4.5 | 5.0 | 64.9 | |||||||||||||||||||||
| Operating lease obligations | 67.4 | 52.2 | 39.9 | 25.8 | 19.2 | 45.5 | 250.0 | |||||||||||||||||||||
| Purchase obligations | 5.3 | 2.3 | 2.1 | 0.8 | 0.7 | - | 11.2 | |||||||||||||||||||||
| Other long-term liabilities reflected on the | ||||||||||||||||||||||||||||
| Company’s balance sheet under GAAP: | ||||||||||||||||||||||||||||
| Retirement obligations: | ||||||||||||||||||||||||||||
| UMWA plans | - | - | - | - | - | 339.1 | 339.1 | |||||||||||||||||||||
| Black lung and other plans | 6.9 | 6.4 | 6.1 | 5.7 | 6.0 | 73.1 | 104.2 | |||||||||||||||||||||
| Workers compensation and other claims | 22.5 | 11.2 | 6.7 | 4.5 | 3.9 | 21.3 | 70.1 | |||||||||||||||||||||
| Uncertain tax positions | 0.7 | - | - | - | - | - | 0.7 | |||||||||||||||||||||
| Other | 0.8 | 0.8 | 0.8 | 0.8 | 0.8 | 9.3 | 13.3 | |||||||||||||||||||||
| Total | $ | 137.7 | 99.1 | 305.9 | 51.8 | 42.2 | 559.3 | 1,196.0 | ||||||||||||||||||||
U.S. Pension Plans
pension plans. Pension benefits provided to eligible U.S. employees were frozen on December 31, 2005, and benefits are not provided to employees hired after 2005 or to those covered by a collective bargaining agreement. There are approximately 19,800 beneficiaries in the plans. We made cash contributions totaling $13.0$87.2 million to the primary U.S. pension plan in 2013.
2014. Based on current assumptions, including the provisions of this legislation, we do not expect to make any additional contributions totaling $109.5 million from 2014 to 2018.in the future.
UMWA plans. Retirement benefits related to former coal operations include medical benefits provided by the Pittston Coal Group Companies Employee Benefit Plan for UMWA Represented Employees. There are approximately 4,1003,900 beneficiaries in the UMWA plans. The company does not expect to make additional contributions to these plans until 20332032, based on actuarial assumptions.
Black Lung
Lung. Under the Federal Black Lung Benefits Act of 1972, Brink’s is responsible for paying lifetime black lung benefits to miners and their dependents for claims filed and approved after June 30, 1973. There are approximately 710700 black lung beneficiaries.
Other.We have a plan that provides retirement healthcare benefits to certain eligible salaried employees. Benefits under this plan are not indexed for inflation.
Assumptions for U.S. Retirement Obligations
We have made various assumptions to estimate the amount of payments to be made in the future. The most significant assumptions include:
| · | Changing discount rates and other assumptions in effect at measurement dates (normally December 31) |
| · | Investment returns of plan assets |
| · | Addition of new participants (historically immaterial due to freezing of pension benefits and exit from coal business) |
| · | Mortality rates |
| · | Change in laws |
The Contractual Obligations table above represents payments projected to be paid with our corporate funds and does not represent payments projected to be made to beneficiaries with retirement plan assets.
| Funded Status of U.S. Retirement Plans | |||||||||||||||
| Actual | Projected | ||||||||||||||
| (In millions) | 2013 | 2014 | 2015 | 2016 | 2017 | 2018 | |||||||||
| U.S. pension plans | |||||||||||||||
| Beginning funded status | $ | (275.0) | (123.1) | (77.8) | (25.8) | 33.1 | 83.1 | ||||||||
Net periodic pension credit(a) | 14.7 | 16.1 | 20.5 | 25.0 | 30.2 | 33.7 | |||||||||
| Payment from Brink’s: | |||||||||||||||
| Primary U.S. pension plan | 13.0 | 25.9 | 28.9 | 31.6 | 18.7 | 4.4 | |||||||||
| Other U.S. pension plan | 1.1 | 0.8 | 0.8 | 0.8 | 0.8 | 0.8 | |||||||||
| Benefit plan experience gain | 123.1 | 2.5 | 1.8 | 1.5 | 0.3 | - | |||||||||
| Ending funded status | $ | (123.1) | (77.8) | (25.8) | 33.1 | 83.1 | 122.0 | ||||||||
| UMWA plans | |||||||||||||||
| Beginning funded status | $ | (256.6) | (142.1) | (139.3) | (136.6) | (134.2) | (132.1) | ||||||||
Net periodic postretirement credit(a) | 1.1 | 2.8 | 2.7 | 2.4 | 2.1 | 1.8 | |||||||||
| Prior service credit | 55.7 | - | - | - | - | - | |||||||||
| Benefit plan experience gain | 56.7 | - | - | - | - | - | |||||||||
| Other | 1.0 | - | - | - | - | - | |||||||||
| Ending funded status | $ | (142.1) | (139.3) | (136.6) | (134.2) | (132.1) | (130.3) | ||||||||
| Black lung and other plans | |||||||||||||||
| Beginning funded status | $ | (48.8) | (44.3) | (41.3) | (38.5) | (35.8) | (33.3) | ||||||||
Net periodic postretirement cost(a) | (1.7) | (1.9) | (1.7) | (1.6) | (1.5) | (1.4) | |||||||||
| Payment from Brink’s | 6.9 | 4.9 | 4.5 | 4.3 | 4.0 | 3.7 | |||||||||
| Other | (0.7) | - | - | - | - | - | |||||||||
| Ending funded status | $ | (44.3) | (41.3) | (38.5) | (35.8) | (33.3) | (31.0) | ||||||||
Funded Status of U.S. Retirement Plans | ||||||||||||||||||||||||
| Actual | Projected | |||||||||||||||||||||||
| (In millions) | 2014 | 2015 | 2016 | 2017 | 2018 | 2019 | ||||||||||||||||||
| U.S. pension plans | ||||||||||||||||||||||||
| Beginning funded status | $ | (123.1 | ) | (117.8 | ) | (98.3 | ) | (77.9 | ) | (56.7 | ) | (32.2 | ) | |||||||||||
Net periodic pension credit(a) | 18.6 | 18.5 | 20.3 | 22.4 | 24.3 | 25.9 | ||||||||||||||||||
| Payment from Brink’s: | ||||||||||||||||||||||||
| Primary U.S. pension plan | 87.2 | - | - | - | - | - | ||||||||||||||||||
| Other U.S. pension plan | 0.6 | 0.6 | 0.6 | 0.6 | 0.6 | 1.3 | ||||||||||||||||||
| Benefit plan experience gain (loss) | (101.1 | ) | 0.4 | (0.5 | ) | (1.8 | ) | (0.4 | ) | - | ||||||||||||||
| Ending funded status | $ | (117.8 | ) | (98.3 | ) | (77.9 | ) | (56.7 | ) | (32.2 | ) | (5.0 | ) | |||||||||||
| UMWA plans | ||||||||||||||||||||||||
| Beginning funded status | $ | (142.1 | ) | (197.2 | ) | (194.5 | ) | (192.1 | ) | (190.1 | ) | (188.5 | ) | |||||||||||
Net periodic postretirement credit(a) | 4.3 | 2.7 | 2.4 | 2.0 | 1.6 | 1.1 | ||||||||||||||||||
| Benefit plan experience gain (loss) | (58.6 | ) | - | - | - | - | - | |||||||||||||||||
| Other | (0.8 | ) | - | - | - | - | - | |||||||||||||||||
| Ending funded status | $ | (197.2 | ) | (194.5 | ) | (192.1 | ) | (190.1 | ) | (188.5 | ) | (187.4 | ) | |||||||||||
| Black lung and other plans | ||||||||||||||||||||||||
| Beginning funded status | $ | (44.3 | ) | (58.3 | ) | (54.1 | ) | (50.3 | ) | (46.6 | ) | (43.2 | ) | |||||||||||
Net periodic postretirement cost(a) | (1.9 | ) | (2.1 | ) | (2.0 | ) | (1.8 | ) | (1.7 | ) | (1.6 | ) | ||||||||||||
| Payment from Brink’s | 7.3 | 6.3 | 5.8 | 5.5 | 5.1 | 4.7 | ||||||||||||||||||
| Benefit plan experience gain (loss) | (19.4 | ) | - | - | - | - | - | |||||||||||||||||
| Ending funded status | $ | (58.3 | ) | (54.1 | ) | (50.3 | ) | (46.6 | ) | (43.2 | ) | (40.1 | ) | |||||||||||
| (a) | Excludes amounts reclassified from accumulated other comprehensive income (loss). |
Summary of Total Expenses Related to All U.S. Retirement Liabilities
This table summarizes actual and projected expense (income) related to U.S. retirement liabilities. MostThese expenses are not allocated to non-segment results, with the balance allocated to North American segment operations.results.
| Actual | Projected | ||||||||||||||
| (In millions) | 2013 | 2014 | 2015 | 2016 | 2017 | 2018 | |||||||||
| U.S. pension plans | $ | 30.5 | 12.8 | 4.0 | (3.8) | (12.9) | (19.4) | ||||||||
| UMWA plans | 18.5 | 7.2 | 6.8 | 6.4 | 6.0 | 5.8 | |||||||||
| Black lung and other plans | 3.9 | 4.0 | 3.8 | 3.7 | 3.6 | 2.9 | |||||||||
| Total | $ | 52.9 | 24.0 | 14.6 | 6.3 | (3.3) | (10.7) | ||||||||
| Amounts allocated to: | |||||||||||||||
| North American segment | 11.6 | 4.6 | 1.2 | (1.8) | (5.3) | (7.8) | |||||||||
| Non-segment | 41.3 | 19.4 | 13.4 | 8.1 | 2.0 | (2.9) | |||||||||
| Total | $ | 52.9 | 24.0 | 14.6 | 6.3 | (3.3) | (10.7) | ||||||||
| Actual | Projected | |||||||||||||||||||||||
| (In millions) | 2014 | 2015 | 2016 | 2017 | 2018 | 2019 | ||||||||||||||||||
| U.S. pension plans | $ | 65.7 | 12.4 | 6.7 | 0.3 | (4.3 | ) | (8.1 | ) | |||||||||||||||
| UMWA plans | 3.4 | 9.6 | 9.2 | 8.9 | 8.6 | 8.5 | ||||||||||||||||||
| Black lung and other plans | 4.0 | 6.0 | 5.8 | 5.5 | 4.7 | 2.8 | ||||||||||||||||||
| Total | $ | 73.1 | 28.0 | 21.7 | 14.7 | 9.0 | 3.2 | |||||||||||||||||
Summary of Total Payments from U.S. Plans to Participants
This table summarizes actual and estimated payments from the plans to participants.
| Actual | Projected | ||||||||||||||
| (In millions) | 2013 | 2014 | 2015 | 2016 | 2017 | 2018 | |||||||||
| Payments from U.S. Plans to participants | |||||||||||||||
| U.S. pension plans | $ | 44.1 | 47.7 | 48.9 | 50.0 | 51.5 | 53.1 | ||||||||
| UMWA plans | 31.1 | 31.5 | 31.9 | 31.5 | 31.3 | 32.9 | |||||||||
| Black lung and other plans | 6.9 | 4.9 | 4.5 | 4.3 | 4.0 | 3.7 | |||||||||
| Total | $ | 82.1 | 84.1 | 85.3 | 85.8 | 86.8 | 89.7 | ||||||||
| Actual | Projected | |||||||||||||||||||||||
| (In millions) | 2014 | 2015 | 2016 | 2017 | 2018 | 2019 | ||||||||||||||||||
| Payments from U.S. Plans to participants | ||||||||||||||||||||||||
| U.S. pension plans | $ | 193.9 | 47.0 | 47.3 | 48.0 | 48.6 | 49.6 | |||||||||||||||||
| UMWA plans | 33.9 | 30.4 | 30.2 | 30.3 | 32.2 | 31.7 | ||||||||||||||||||
| Black lung and other plans | 7.3 | 6.3 | 5.8 | 5.5 | 5.1 | 4.7 | ||||||||||||||||||
| Total | $ | 235.1 | 83.7 | 83.3 | 83.8 | 85.9 | 86.0 | |||||||||||||||||
Summary of Total Payments from Brink’s to U.S. Plans
This table summarizes actual and estimated payments from Brink’s to U.S. retirement plans.
| Projected Payments to Plans from Brink's | Projected Funded Status | |||||||||||||||||||||
| (In millions) | Primary U.S. Pension Plan | Other U.S. Pension Plan | UMWA Plans | Black Lung and Other Plans | Total | Primary U.S. Pension Plan | UMWA Plans | Black Lung and Other Plans | Total | |||||||||||||
| Projected payments | ||||||||||||||||||||||
| 2014 | 25.9 | 0.8 | - | 4.9 | 31.6 | (67.6) | (139.3) | (51.5) | (258.4) | |||||||||||||
| 2015 | 28.9 | 0.8 | - | 4.5 | 34.2 | (16.0) | (136.6) | (48.3) | (200.9) | |||||||||||||
| 2016 | 31.6 | 0.8 | - | 4.3 | 36.7 | 42.6 | (134.2) | (45.3) | (136.9) | |||||||||||||
| 2017 | 18.7 | 0.8 | - | 4.0 | 23.5 | 92.2 | (132.1) | (42.4) | (82.3) | |||||||||||||
| 2018 | 4.4 | 0.8 | - | 3.7 | 8.9 | 130.7 | (130.3) | (39.7) | (39.3) | |||||||||||||
| 2019 | - | 1.4 | - | 3.5 | 4.9 | (a) | (128.9) | (36.4) | (a) | |||||||||||||
| 2020 | - | 0.8 | - | 3.2 | 4.0 | (a) | (128.0) | (33.8) | (a) | |||||||||||||
| 2021 | - | 0.6 | - | 3.0 | 3.6 | (a) | (127.4) | (31.4) | (a) | |||||||||||||
| 2022 | - | 0.6 | - | 2.8 | 3.4 | (a) | (127.4) | (29.2) | (a) | |||||||||||||
| 2023 | - | 0.6 | - | 2.6 | 3.2 | (a) | (127.9) | (27.1) | (a) | |||||||||||||
| 2024 | - | 0.6 | - | 2.5 | 3.1 | (a) | (128.9) | (25.2) | (a) | |||||||||||||
| 2025 | - | 0.5 | - | 2.3 | 2.8 | (a) | (130.4) | (23.5) | (a) | |||||||||||||
| 2026 | - | 0.5 | - | 2.1 | 2.6 | (a) | (132.5) | (21.9) | (a) | |||||||||||||
| 2027 | - | 0.5 | - | 2.0 | 2.5 | (a) | (135.1) | (20.3) | (a) | |||||||||||||
| 2028 | - | 0.4 | - | 1.8 | 2.2 | (a) | (138.5) | (18.9) | (a) | |||||||||||||
| 2029 | - | 0.4 | - | 1.7 | 2.1 | (a) | (142.5) | (17.6) | (a) | |||||||||||||
| 2030 | - | 0.4 | - | 1.4 | 1.8 | (a) | (147.3) | (16.4) | (a) | |||||||||||||
| 2031 | - | 0.3 | - | 1.3 | 1.6 | (a) | (132.9) | (15.4) | (a) | |||||||||||||
| 2032 | - | 0.3 | - | 1.2 | 1.5 | (a) | (a) | (a) | (a) | |||||||||||||
| 2033 | - | 0.3 | 6.0 | 1.2 | 7.5 | (a) | (a) | (a) | (a) | |||||||||||||
| 2034 | - | 0.3 | 18.2 | 1.0 | 19.5 | (a) | (a) | (a) | (a) | |||||||||||||
| 2035 | - | 0.3 | 17.5 | 1.0 | 18.8 | (a) | (a) | (a) | (a) | |||||||||||||
| 2036 | - | 0.2 | 16.7 | 0.9 | 17.8 | (a) | (a) | (a) | (a) | |||||||||||||
| 2037 | - | 0.2 | 15.9 | 0.7 | 16.8 | (a) | (a) | (a) | (a) | |||||||||||||
| 2038 | - | 0.2 | 15.2 | 0.7 | 16.1 | (a) | (a) | (a) | (a) | |||||||||||||
| 2039 | - | 0.2 | 14.4 | 0.6 | 15.2 | (a) | (a) | (a) | (a) | |||||||||||||
| 2040 | - | 0.2 | 13.6 | 0.5 | 14.3 | (a) | (a) | (a) | (a) | |||||||||||||
| 2041 | - | 0.2 | 12.7 | 0.5 | 13.4 | (a) | (a) | (a) | (a) | |||||||||||||
| 2042 | - | 0.1 | 11.7 | 0.4 | 12.2 | (a) | (a) | (a) | (a) | |||||||||||||
| 2043 | - | 0.1 | 10.9 | 0.4 | 11.4 | (a) | (a) | (a) | (a) | |||||||||||||
| 2044 | - | 0.1 | 9.8 | 0.3 | 10.2 | (a) | (a) | (a) | (a) | |||||||||||||
| 2045 | - | 0.1 | 8.9 | 0.3 | 9.3 | (a) | (a) | (a) | (a) | |||||||||||||
| 2046 | - | 0.1 | 8.1 | 0.3 | 8.5 | (a) | (a) | (a) | (a) | |||||||||||||
| 2047 | - | 0.1 | 7.3 | 0.2 | 7.6 | (a) | (a) | (a) | (a) | |||||||||||||
| 2048 | - | 0.1 | 6.6 | 0.2 | 6.9 | (a) | (a) | (a) | (a) | |||||||||||||
| 2049 | - | 0.1 | 5.9 | 0.2 | 6.2 | (a) | (a) | (a) | (a) | |||||||||||||
| 2050 | - | 0.1 | 5.2 | 0.2 | 5.5 | (a) | (a) | (a) | (a) | |||||||||||||
| 2051 | - | 0.1 | 4.6 | 0.1 | 4.8 | (a) | (a) | (a) | (a) | |||||||||||||
| 2052 | - | - | 4.0 | 0.1 | 4.1 | (a) | (a) | (a) | (a) | |||||||||||||
| 2053 | - | - | 3.5 | 0.1 | 3.6 | (a) | (a) | (a) | (a) | |||||||||||||
| 2054 | - | - | 3.1 | 0.1 | 3.2 | (a) | (a) | (a) | (a) | |||||||||||||
| 2055 | - | - | 2.7 | 0.1 | 2.8 | (a) | (a) | (a) | (a) | |||||||||||||
| 2056 | - | - | 2.3 | 0.1 | 2.4 | (a) | (a) | (a) | (a) | |||||||||||||
| 2057 | - | - | 2.0 | 0.1 | 2.1 | (a) | (a) | (a) | (a) | |||||||||||||
| 2058 | - | - | 1.7 | 0.1 | 1.8 | (a) | (a) | (a) | (a) | |||||||||||||
| 2059 | - | - | 1.5 | 0.1 | 1.6 | (a) | (a) | (a) | (a) | |||||||||||||
| 2060 | - | - | 1.3 | - | 1.3 | (a) | (a) | (a) | (a) | |||||||||||||
| 2061 and thereafter | - | - | 7.2 | - | 7.2 | (a) | (a) | (a) | (a) | |||||||||||||
| Total projected payments | $ | 109.5 | 15.0 | 238.5 | 63.3 | 426.3 | ||||||||||||||||
| Projected Payments to Plans from Brink's | ||||||||||||||||||||
| (In millions) | Primary U.S. Pension Plan | Other U.S. Pension Plan | UMWA Plans | Black Lung and Other Plans | Total | |||||||||||||||
| Projected payments | ||||||||||||||||||||
| 2015 | $ | - | 0.6 | - | 6.3 | 6.9 | ||||||||||||||
| 2016 | - | 0.6 | - | 5.8 | 6.4 | |||||||||||||||
| 2017 | - | 0.6 | - | 5.5 | 6.1 | |||||||||||||||
| 2018 | - | 0.6 | - | 5.1 | 5.7 | |||||||||||||||
| 2019 | - | 1.3 | - | 4.7 | 6.0 | |||||||||||||||
| 2020 | - | 0.6 | - | 4.4 | 5.0 | |||||||||||||||
| 2021 | - | 0.6 | - | 4.1 | 4.7 | |||||||||||||||
| 2022 | - | 0.6 | - | 3.8 | 4.4 | |||||||||||||||
| 2023 | - | 0.6 | - | 3.5 | 4.1 | |||||||||||||||
| 2024 | - | 0.6 | - | 3.2 | 3.8 | |||||||||||||||
| 2025 | - | 0.6 | - | 2.9 | 3.5 | |||||||||||||||
| 2026 | - | 0.6 | - | 2.7 | 3.3 | |||||||||||||||
| 2027 | - | 0.6 | - | 2.5 | 3.1 | |||||||||||||||
| 2028 | - | 0.6 | - | 2.3 | 2.9 | |||||||||||||||
| 2029 | - | 0.5 | - | 2.2 | 2.7 | |||||||||||||||
| 2030 | - | 0.5 | - | 2.0 | 2.5 | |||||||||||||||
| 2031 | - | 0.5 | - | 1.9 | 2.4 | |||||||||||||||
| 2032 | - | 0.5 | 20.7 | 1.8 | 23.0 | |||||||||||||||
| 2033 | - | 0.5 | 20.0 | 1.8 | 22.3 | |||||||||||||||
| 2034 | - | 0.4 | 19.5 | 1.6 | 21.5 | |||||||||||||||
| 2035 | - | 0.4 | 18.9 | 1.5 | 20.8 | |||||||||||||||
| 2036 | - | 0.4 | 18.3 | 1.3 | 20.0 | |||||||||||||||
| 2037 | - | 0.4 | 17.6 | 1.3 | 19.3 | |||||||||||||||
| 2038 | - | 0.3 | 17.0 | 1.2 | 18.5 | |||||||||||||||
| 2039 | - | 0.3 | 16.4 | 1.2 | 17.9 | |||||||||||||||
| 2040 | - | 0.3 | 15.8 | 1.1 | 17.2 | |||||||||||||||
| 2041 | - | 0.3 | 15.1 | 1.0 | 16.4 | |||||||||||||||
| 2042 | - | 0.2 | 14.2 | 0.9 | 15.3 | |||||||||||||||
| 2043 | - | 0.2 | 13.5 | 0.8 | 14.5 | |||||||||||||||
| 2044 | - | 0.2 | 12.5 | 0.8 | 13.5 | |||||||||||||||
| 2045 | - | 0.2 | 11.7 | 0.7 | 12.6 | |||||||||||||||
| 2046 | - | 0.2 | 10.9 | 0.6 | 11.7 | |||||||||||||||
| 2047 | - | 0.2 | 10.2 | 0.6 | 11.0 | |||||||||||||||
| 2048 | - | 0.2 | 9.4 | 0.6 | 10.2 | |||||||||||||||
| 2049 | - | 0.2 | 8.7 | 0.6 | 9.5 | |||||||||||||||
| 2050 | - | 0.1 | 7.9 | 0.5 | 8.5 | |||||||||||||||
| 2051 | - | 0.1 | 7.2 | 0.5 | 7.8 | |||||||||||||||
| 2052 | - | 0.1 | 6.5 | 0.5 | 7.1 | |||||||||||||||
| 2053 | - | 0.1 | 5.9 | 0.4 | 6.4 | |||||||||||||||
| 2054 | - | 0.1 | 5.2 | 0.4 | 5.7 | |||||||||||||||
| 2055 | - | 0.1 | 4.7 | 0.4 | 5.2 | |||||||||||||||
| 2056 | - | 0.1 | 4.1 | 0.3 | 4.5 | |||||||||||||||
| 2057 | - | 0.1 | 3.6 | 0.3 | 4.0 | |||||||||||||||
| 2058 | - | - | 3.2 | 0.2 | 3.4 | |||||||||||||||
| 2059 | - | - | 2.8 | 0.2 | 3.0 | |||||||||||||||
| 2060 | - | - | 2.4 | 0.2 | 2.6 | |||||||||||||||
| 2061 and thereafter | - | - | 15.2 | 1.2 | 16.4 | |||||||||||||||
| Total projected payments | $ | - | 16.8 | 339.1 | 87.4 | 443.3 | ||||||||||||||
The amounts in the tables above are based on a variety of estimates, including actuarial assumptions as of December 31, 2013.2014. The estimated amounts will change in the future to reflect payments made, investment returns, actuarial revaluations, and other changes in estimates. Actual amounts could differ materially from the estimated amounts.
| Discounted Cash Flows at Plan Discount Rates – Reconciled to Liability Amounts Reported under U.S. GAAP | ||||||||||||||
| December 31, 2013 | ||||||||||||||
| (In millions) | Primary U.S. Pension Plan(b) | UMWA Plans(c) | Other Unfunded U.S. Plans | Total | ||||||||||
| Funded status of U.S. retirement plans – GAAP | $ | 112.5 | 142.1 | 54.9 | 309.5 | |||||||||
Present value of projected earnings of plan assets(a) | (16.0) | (77.0) | - | (93.0) | ||||||||||
| Discounted cash flows at plan discount rates – Non-GAAP | $ | 96.5 | 65.1 | 54.9 | 216.5 | |||||||||
| Plan discount rate | 5.00% | 4.70% | ||||||||||||
| Expected return of assets | 8.00% | 8.25% | ||||||||||||
| Discounted Cash Flows at Plan Discount Rates – Reconciled to Liability Amounts Reported under U.S. GAAP | ||||||||||||||||
| December 31, 2014 | ||||||||||||||||
| (In millions) | Primary U.S. Pension Plan(b) | UMWA Plans(c) | Other Unfunded U.S. Plans | Total | ||||||||||||
| Funded status of U.S. retirement plans – GAAP | $ | 107.7 | 197.2 | 68.4 | 373.3 | |||||||||||
Present value of projected earnings of plan assets(a) | (107.7 | ) | (81.5 | ) | - | (189.2 | ) | |||||||||
| Discounted cash flows at plan discount rates – Non-GAAP | $ | - | 115.7 | 68.4 | 184.1 | |||||||||||
| Plan discount rate | 4.10 | % | 4.00 | % | ||||||||||||
| Expected return of assets | 7.50 | % | 8.25 | % | ||||||||||||
| (a) | Under GAAP, the funded status of a benefit plan is reduced by the fair market value of plan assets at the balance sheet date, and the present value of the projected earnings on plan assets does not reduce the funded status at the balance sheet date. The non-GAAP measure presented above additionally reduces the funded status as computed under GAAP by the present value of projected earnings of plan assets using the expected return on asset assumptions of the respective plan. |
| (b) | For the primary U.S. pension plan, we are required by ERISA regulations to maintain minimum funding |
| (c) | There are no minimum funding requirements for the UMWA plans because they are not covered by ERISA funding regulations. Using assumptions at the end of |
Discounted cash flows at plan discount rates are supplemental financial measures that are not required by, or presented in accordance with GAAP. The purpose of the discounted cash flows at plan discount raterates is to present our retirement obligations after giving effect to the benefit of earning a return on plan assets. We believe this measure is helpful in assessing the present value of future funding requirements of the company in order to meet plan benefit obligations. Discounted cash flows at plan discount rates should not be considered as an alternative to the funded status of the U.S. retirement plans at December 31, 2013,2014, as determined in accordance with GAAP and should be read in conjunction with our consolidated balance sheets.
Contingent Matters
On June 19, 2008, a lawsuit captioned Del Valle Gurria S.C. v. Servicio Pan Americano de Protección, S.A. de C.V. was filed with the Twenty-third Civil Judge in the Federal District in Mexico (the “Court”) against Servicio Pan American de Proteccion, S.A. de C.V. (SERPAPROSA), the Mexico subsidiary that we acquired in November 2010. The plaintiff claims it is owed legal fees and corresponding value-added tax (VAT), interest and expenses related to its legal representation of SERPAPROSA in connection with tax audits conducted tocovering the 1991, 1992 and 1994 fiscal years. On October 28, 2010, the Court issued a decision in favor of SERPAPROSA in part and the plaintiff in part, ordering SERPAPROSA to pay the plaintiff $0.4less than $1 million for its previous representation of SERPAPROSA. Between November 2010 and October 2013, the judgment was subject to multiple appeals by both parties to the Fifth Civil Court of Appeal of the Federal District in Mexico (the “Fifth Civil Court of Appeal”) and to the First Civil Collegiate Tribunal of the First Circuit in Mexico (the “First Civil Collegiate Tribunal”), and was remanded twice to the Court for determination of the fees to be paid to the plaintiff. On December 6, 2013, the Fifth Civil Court of Appeal issued a decision in favor of the plaintiff, modifying the lower court’s ruling and ordering SERPAPROSA to pay the plaintiff $7.4approximately $7 million plus VAT and interest for its previous representation of SERPAPROSA. SERPAPROSA filed a constitutional injunction on January 20, 2014 with the First Civil Collegiate Tribunal. The appeal was granted in favor of SERPAPROSA on September 17, 2014, ordering SERPAPROSA to pay approximately $2 million plus VAT and interest. The plaintiff filed an appeal on October 7, 2014, with the Mexico Supreme Court, which was rejected by the court on October 22, 2014. The plaintiff filed two subsequent actions appealing the Supreme Court’s October 22, 2014 decision, one before the First Appellate Court in Civil Matters of the First Circuit (the “Appellate Court”) and one with the Mexico Supreme Court. The action filed before the Appellate Court was rejected on February 16, 2015; the action filed with the Mexico Supreme Court is pending. The Company has accrued $3.1$2 million, reflecting the Company’s best estimate of exposure, although additional reasonably possible losses could be up to $10 million, based on currency exchange rates at December 31, 2013.2014. The ultimate resolution of this matter is unknown and the estimated liability may change in the future. The Company denies the allegations asserted by the plaintiff and is vigorously defending itself in this matter.
In addition, we are involved in various other lawsuits and claims in the ordinary course of business. We are not able to estimate the loss or range of losses for some of these matters. We have recorded accruals for losses that are considered probable and reasonably estimable. Except as otherwise noted, we do not believe that the ultimate disposition of any of the lawsuits currently pending against the Company should have a material adverse effect on our liquidity, financial position or results of operations.
APPLICATION OF CRITICAL ACCOUNTING POLICIES
The application of accounting principles requires the use of assumptions, estimates and judgments. We make assumptions, estimates and judgments based on, among other things, knowledge of operations, markets, historical trends and likely future changes, similarly situated businesses and, when appropriate, the opinions of advisors with relevant knowledge and experience. Reported results could have been materially different had we used a different set of assumptions, estimates and judgments.
Deferred Tax Asset Valuation Allowance
Deferred tax assets result primarily from net operating losses and the net tax effects of temporary differences between the carrying amount of assets and liabilities for financial statement and income tax purposes, as determined under enacted tax laws and rates.
Accounting PoliciesPolicy
We establish valuation allowances, in accordance with FASB ASC Topic 740, Income Taxes, when we estimate it is not more likely than not that a deferred tax asset will be realized. We decide to record valuation allowances primarily based on an assessment of historical earnings and future taxable income that incorporates prudent, feasible tax-planning strategies. We assess deferred tax assets on an individual jurisdiction basis. Changes in tax statutes, the timing of deductibility of expenses or expectations for future performance could result in material adjustments to our valuation allowances, which would increase or decrease tax expense. Our valuation allowances are as follows.
Valuation Allowances
| December 31, | |||||||
| (In millions) | 2013 | 2012 | |||||
| U.S. | $ | 16.7 | 8.2 | ||||
| Non-U.S. | 15.7 | 39.2 | |||||
| Total | $ | 32.4 | 47.4 | ||||
| December 31, | ||||||||
| (In millions) | 2014 | 2013 | ||||||
| U.S. | $ | 20.0 | 16.7 | |||||
| Non-U.S. | 20.1 | 15.7 | ||||||
| Total | $ | 40.1 | 32.4 | |||||
Application of Accounting PoliciesPolicy
U.S. Deferred Tax Assets
We have $303$349 million of net deferred tax assets at December 31, 2013,2014, of which $242$287 million related to U.S. jurisdictions. The net deferred tax asset in the U.S. reduced from $363 million in 2012 primarily due to lower accruals for pension and retiree medical obligations as a result of actuarial gains and the realization of some of the benefits as a result of taxable gains on the sale of businesses and implementation of the employer group waiver plan (“EGWP”). There were no significant changes to our U.S. valuation allowances in 2013.2013 or 2014.
We used various estimates and assumptions to evaluate the need for the valuation allowance in the U.S. These included
| · | projected revenues and operating income for our U.S. entities, |
| · | projected royalties and management fees paid to U.S. entities from subsidiaries outside the U.S., |
| · | estimated required contributions to our U.S. retirement plans, and |
| · | interest rates on projected U.S. borrowings. |
Non-U.S. Deferred Tax Assets
We changed our judgment about the need for valuation allowances for deferred tax assets in certain non-U.S. jurisdictions as a result of improvementschanges in operating results and an improvedthe outlook about the future operating performance in those jurisdictions. As a result, we set up $1.9 million of valuation allowances in 2014 and reversed $0.2 million of valuation allowances in 2013 and $0.9 million of valuation allowances in 2012 through continuing operations.
Goodwill, Other Intangible Assets and Property and Equipment Valuations
Accounting PoliciesPolicy
At December 31, 2013,2014, we had property and equipment of $758.7$669.5 million, goodwill of $240.2$215.7 million and other intangible assets of $46.3$39.8 million, net of accumulated depreciation and amortization. We review these assets for possible impairment using the guidance in FASB ASC Topic 350, Intangibles - Goodwill and Other, for goodwill and other intangible assets and FASB ASC Topic 360, Property, Plant and Equipment, for property and equipment. Our review for impairment requires the use of significant judgments about the future performance of our operating subsidiaries. Due to the many variables inherent in the estimates of the fair value of these assets, differences in assumptions could have a material effect on the impairment analyses.
Application of Accounting PoliciesPolicy
Goodwill
We review goodwill for impairment annually and whenever events or circumstances make it more likely than not that impairment may have occurred. We reorganized our management structure in the fourth quarter of 2014. As a result, we have new operating segments and reporting units. In addition to the annual test performed as of October 1, we performed an impairment test using the new reporting units in the fourth quarter of 2014.
Application of the goodwill impairment test requires judgment, including the identification of reporting units, assignment of assets and liabilities to reporting units, assignment of goodwill to reporting units, and determination of the fair value of each reporting unit.
Under U.S. GAAP, the annual impairment test may be either a quantitative test or a qualitative assessment. The qualitative assessment can be performed in order to determine whether facts and circumstances support a determination that reporting unit fair values are greater than their carrying values.
For 2013,both impairment tests performed in the fourth quarter of 2014, we elected to bypass the optional qualitative assessment and we performed a quantitative goodwill impairment test instead. We estimated the fair value of each reporting unit under each test using projections of cash flows and compared to its carrying value.
We completed the annual goodwill impairment test as of October 1, 2013, and concluded that the fair value of each reporting unit substantially exceeded its carrying value. With one exception, our goodwill impairment test based on the new reporting units resulting from the fourth-quarter restructuring also indicated that the fair value of each new reporting unit substantially exceeded its carrying value. For the Latin American Payment Services reporting unit, which has $1.4 million of goodwill at December 31, 2014, fair value exceeded carrying value by approximately 10%.
Finite-lived Intangible Assets and Property and Equipment
We review finite-lived intangible assets and property and equipment for impairment whenever events or changes in circumstances indicate that the related carrying amounts may not be recoverable. For purposes of assessing impairment, assets are grouped at the lowest levels for which there are identifiable cash flows that are largely independent of the cash flows of other groups of assets. To determine whether impairment has occurred, we compare estimates of the future undiscounted net cash flows of groups of assets to their carrying value.
Estimates of Future Cash Flows
We made significant assumptions when preparing financial projections of free cash flow used in our impairment analyses, including assumptions of future results of operations, capital requirements, income taxes, long-term growth rates for determining terminal value, and discount rates. Our resultsprojections assumed continued growth of our revenues and operating profit both in the U.S. and outside the U.S. Our conclusions regarding asset impairment may have been different if we had used different assumptions.
Retirement and Postemployment Benefit Obligations
We provide benefits through defined benefit pension plans and retiree medical benefit plans and under statutory requirements.
Accounting Policy
We account for pension and other retirement benefit obligations under FASB ASC Topic 715, Compensation – Retirement Benefits. We account for postemployment benefit obligations, including workers’ compensation obligations, under FASB ASC Topic 712, Compensation – Nonretirement Postemployment Benefits.
To account for these benefits, we make assumptions of expected return on assets, discount rates, inflation, demographic factors and changes in the laws and regulations covering the benefit obligations. Because of the inherent volatility of these items and because the obligations are significant, changes in the assumptions could have a material effect on our liabilities and expenses related to these benefits.
Our most significant retirement plans include our primary U.S. pension plan and the retiree medical plans of our former coal business that were collectively bargained with the United Mine Workers of America (the “UMWA”). The critical accounting estimates that determine the carrying values of liabilities and the resulting annual expense are discussed below.
Application of Accounting Policy
Discount Rate Assumptions
For plans accounted under FASB ASC Topic 715, we discount estimated future payments using discount rates based on market conditions at the end of the year. In general, our liability changes in an inverse relationship to interest rates. That is, the lower the discount rate, the higher the associated plan obligation.
U.S. Plans
For our largest retirement plans, including the primary U.S. pension and UMWA plans and Black Lungblack lung obligations, we derive the discount rates used to measure the present value of benefit obligations using the cash flow matching method. Under this method, we compare the plan’s projected payment obligations by year with the corresponding yields on a Mercer yield curve. Each year’s projected cash flows are then discounted back to their present value at the measurement date and an overall discount rate is determined. The overall discount rate is then rounded to the nearest tenth of a percentage point.
Non-U.S. Plans
We use the same cash flow matching method to derive the discount rates of our major non-U.S. retirement plans. Where the cash flow matching method is not possible, rates of local high-quality long termlong-term corporate bonds are used to estimate the discount rate.
The discount rates for the primary U.S. pension plan, UMWA retiree medical plans and Black Lungblack lung obligations were:
| Primary U.S. Plan | UMWA Plans | Black Lung | ||||||||||||||||||||
| 2013 | 2012 | 2011 | 2013 | 2012 | 2011 | 2013 | 2012 | 2011 | ||||||||||||||
| Discount rate: | ||||||||||||||||||||||
| Retirement cost | 4.2% | 4.6% | 5.3% | 3.9% | 4.4% | 5.3% | 3.5% | 4.2% | 4.8% | |||||||||||||
| Benefit obligation at year end | 5.0% | 4.2% | 4.6% | 4.7% | 3.9% | 4.4% | 4.4% | 3.5% | 4.2% | |||||||||||||
| Primary U.S. Plan | UMWA Plans | Black Lung | ||||||||||||||||||||||||||||||||||
| 2014 | 2013 | 2012 | 2014 | 2013 | 2012 | 2014 | 2013 | 2012 | ||||||||||||||||||||||||||||
| Discount rate: | ||||||||||||||||||||||||||||||||||||
| Retirement cost | 5.0 | % | 4.2 | % | 4.6 | % | 4.7 | % | 3.9 | % | 4.4 | % | 4.4 | % | 3.5 | % | 4.2 | % | ||||||||||||||||||
| Benefit obligation at year end | 4.1 | % | 5.0 | % | 4.2 | % | 4.0 | % | 4.7 | % | 3.9 | % | 3.7 | % | 4.4 | % | 3.5 | % | ||||||||||||||||||
52
Sensitivity Analysis
The discount rate we select at year end materially affects the valuations of plan obligations at year end and calculations of net periodic expenses for the following year.
The tables below compare hypothetical plan obligation valuations for our largest plans as of December 31, 2013,2014, actual expenses for 20132014 and projected expenses for 20142015 assuming we had used discount rates that were one percentage point lower or higher.
Plan Obligations at December 31, 20132014
| Hypothetical | Hypothetical | |||||||||
| (In millions) | 1% lower | Actual | 1% higher | |||||||
| Primary U.S. pension plan | $ | 1,020.1 | 894.0 | 792.0 | ||||||
| UMWA plans | 517.4 | 461.8 | 416.0 | |||||||
| Hypothetical | Hypothetical | ||||||||||
| (In millions) | 1% lower | Actual | 1% higher | ||||||||
| Primary U.S. pension plan | $ | 1,052.8 | 924.3 | 819.8 | |||||||
| UMWA plans | 473.3 | 426.5 | 387.3 | ||||||||
Actual 20132014 and Projected 20142015 Expense (Income)
| Hypothetical sensitivity analysis | Hypothetical sensitivity analysis | ||||||||||||||
| (In millions, except for percentages) | for discount rate assumption | for discount rate assumption | |||||||||||||
| Actual | 1% lower | 1% higher | Projected | 1% lower | 1% higher | ||||||||||
| Years Ending December 31, | 2013 | 2013 | 2013 | 2014 | 2014 | 2014 | |||||||||
| Primary U.S. pension plan | |||||||||||||||
| Discount rate assumption | 4.2% | 3.2% | 5.2% | 5.0% | 4.0% | 6.0% | |||||||||
| Retirement cost | $ | 29.7 | 38.6 | 21.9 | $ | 12.0 | 20.9 | 4.5 | |||||||
| UMWA plans | |||||||||||||||
| Discount rate assumption | 3.9% | 2.9% | 4.9% | 4.7% | 3.7% | 5.7% | |||||||||
| Retirement cost | $ | 18.5 | 20.0 | 17.1 | $ | 7.2 | 8.3 | 6.2 | |||||||
| Hypothetical sensitivity analysis | Hypothetical sensitivity analysis | |||||||||||||
| (In millions, except for percentages) | for discount rate assumption | for discount rate assumption | ||||||||||||
| Actual | 1% lower | 1% higher | Projected | 1% lower | 1% higher | |||||||||
| Years Ending December 31, | 2014 | 2014 | 2014 | 2015 | 2015 | 2015 | ||||||||
| Primary U.S. pension plan | ||||||||||||||
| Discount rate assumption | 5.0 % | 4.0 % | 6.0 % | 4.1 % | 3.1 % | 5.1 % | ||||||||
| Retirement cost | $ | 9.2 | 18.7 | 1.2 | $ | 11.7 | 19.3 | 5.2 | ||||||
| UMWA plans | ||||||||||||||
| Discount rate assumption | 4.7 % | 3.7 % | 5.7 % | 4.0 % | 3.0 % | 5.0 % | ||||||||
| Retirement cost | $ | 3.4 | 4.5 | 2.6 | $ | 9.6 | 10.8 | 8.6 | ||||||
Expected-Return-on-Assets Assumption
Our expected-return-on-assets assumption, which materially affects our net periodic benefit cost, reflects the long-term average rate of return we expect the plan assets to earn. We select the expected-return-on-assets assumption using advice from our investment advisor and actuary considering each plan’s asset allocation targets and expected overall investment manager performance and a review of the most recent long-term historical average compounded rates of return, as applicable. We selected 7.50% as the expected-return-on-assets assumption for our primary U.S. plan and 8.25% for our UMWA retiree medical plans as of December 31, 2014. We selected 8.00% as the expected-return-on-assets assumption for our primary U.S. plan and 8.25% for our UMWA retiree medical plans as of December 31, 2013 and 2012.2013.
Over the last twenty and twenty-five years, the annual returns of our primary U.S. pension plan have averaged, on a compounded basis, 8.2%8.7%, while the 25-year compounded annual return averaged 9.1%, and the 30-year compounded annual return averaged 9.7%9.9%.
Sensitivity Analysis
Effect of using different expected-rate-of-return assumptions. Our 20132014 and projected 20142015 expense would have been different if we had used different expected-rate-of-return assumptions. For every hypothetical change of one percentage point in the assumed long-term rate of return on plan assets (and holding other assumptions constant), our 20132014 and 20142015 expense would be as follows:
| Hypothetical sensitivity analysis | Hypothetical sensitivity analysis | ||||||||||||||
| for expected-return-on asset | for expected-return-on asset | ||||||||||||||
| (In millions, except for percentages) | assumption | assumption | |||||||||||||
| Actual | 1% lower | 1% higher | Projected | 1% lower | 1% higher | ||||||||||
| Years Ending December 31, | 2013 | 2013 | 2013 | 2014 | 2014 | 2014 | |||||||||
| Expected-return-on-asset assumption | |||||||||||||||
| Primary U.S. pension plan | 8.00% | 7.00% | 9.00% | 8.00% | 7.00% | 9.00% | |||||||||
| UMWA plans | 8.25% | 7.25% | 9.25% | 8.25% | 7.25% | 9.25% | |||||||||
| Primary U.S. pension plan | $ | 29.7 | 36.8 | 22.6 | $ | 12.0 | 19.7 | 4.3 | |||||||
| UMWA plans | 18.5 | 21.0 | 16.0 | 7.2 | 9.9 | 4.5 | |||||||||
| Hypothetical sensitivity analysis | Hypothetical sensitivity analysis | |||||||||||||
| for expected-return-on asset | for expected-return-on asset | |||||||||||||
| (In millions, except for percentages) | assumption | assumption | ||||||||||||
| Actual | 1% lower | 1% higher | Projected | 1% lower | 1% higher | |||||||||
| Years Ending December 31, | 2014 | 2014 | 2014 | 2015 | 2015 | 2015 | ||||||||
| Expected-return-on-asset assumption | ||||||||||||||
| Primary U.S. pension plan | 8.00 % | 7.00 % | 9.00 % | 7.50 % | 6.50 % | 8.50 % | ||||||||
| UMWA plans | 8.25 % | 7.25 % | 9.25 % | 8.25 % | 7.25 % | 9.25 % | ||||||||
| Primary U.S. pension plan | $ | 9.2 | 17.2 | 1.2 | $ | 11.7 | 19.0 | 4.4 | ||||||
| UMWA plans | 3.4 | 6.2 | 0.8 | 9.6 | 12.2 | 7.2 | ||||||||
Effect of improving or deteriorating actual future market returns. Our funded status at December 31, 2014,2015, and our 20152016 expense will be different from currently projected amounts if our projected 20142015 returns are better or worse than the returns we have assumed for each plan.
| Hypothetical sensitivity analysis of 2014 asset return | |||||||||
| (In millions, except for percentages) | better or worse than expected | ||||||||
| Better | Worse | ||||||||
| Years Ending December 31, | Projected | return | return | ||||||
| Return on investments in 2014 | |||||||||
| Primary U.S. pension plan | 8.00% | 16.00% | -% | ||||||
| UMWA plans | 8.25% | 16.50% | -% | ||||||
| Projected Funded Status at December 31, 2014 | |||||||||
| Primary U.S. pension plan | $ | (68) | (3) | (132) | |||||
| UMWA plans | (139) | (117) | (161) | ||||||
2015 Expense(a) | |||||||||
| Primary U.S. pension plan | $ | 3 | 1 | 6 | |||||
| UMWA plans | 7 | 3 | 10 | ||||||
| Hypothetical sensitivity analysis of 2015 asset return | ||||||||
| (In millions, except for percentages) | better or worse than expected | |||||||
| Better | Worse | |||||||
| Years Ending December 31, | Projected | return | return | |||||
| Return on investments in 2015 | ||||||||
| Primary U.S. pension plan | 7.50 % | 15.00 % | - % | |||||
| UMWA plans | 8.25 % | 16.50 % | - % | |||||
| Projected Funded Status at December 31, 2015 | ||||||||
| Primary U.S. pension plan | $ | (88) | (31) | (146) | ||||
| UMWA plans | (195) | (174) | (215) | |||||
2016 Expense(a) | ||||||||
| Primary U.S. pension plan | $ | 6 | 4 | 8 | ||||
| UMWA plans | 9 | 6 | 13 | |||||
| (a) | Actual future returns on investments will not affect our earnings until |
Effect of using fair market value of assets to determine expense. For our defined-benefit pension plans, we calculate expected investment returns by applying the expected long-term rate of return to the market-related value of plan assets. In addition, our plan asset actuarial gains and losses that are subject to amortization are based on the market-related value.
The market-related value of the plan assets is different from the actual or fair market value of the assets. The actual or fair market value is, at a point in time, the value of the assets that is available to make payments to pensioners and to cover any transaction costs. The market-related value recognizes changes in fair value from the expected value on a straight-line basis over five years. This recognition method spreads the effects of year-over-year volatility in the financial markets over several years.
Our expenses related to our primary U.S. pension plan would have been different if our accounting policy were to use the fair market value of plan assets instead of the market-related value to recognize investment gains and losses.
| (In millions) | Based on market-related value of assets | Hypothetical(a) | |||||||||||||
| Actual | Projected | Projected | |||||||||||||
| Years Ending December 31, | 2013 | 2014 | 2015 | 2013 | 2014 | 2015 | |||||||||
| Expense (Income) | |||||||||||||||
| Primary U.S. pension plan | $ | 29.7 | 12.0 | 3.4 | $ | 24.3 | 6.5 | 0.4 | |||||||
| (In millions) | Based on market-related value of assets | Hypothetical(a) | ||||||||||||||||||||||
| Actual | Projected | Projected | ||||||||||||||||||||||
| Years Ending December 31, | 2014 | 2015 | 2016 | 2014 | 2015 | 2016 | ||||||||||||||||||
| Primary U.S. pension plan expense (income) | $ | 9.2 | 11.7 | 6.2 | $ | 3.1 | 6.1 | 2.6 | ||||||||||||||||
| (a) | Assumes that our accounting policy was to use the fair market value of assets instead of the market-related value of assets to determine our expense related to our primary U.S. pension plan. |
For our UMWA plans, we calculate expected investment returns by applying the expected long-term rate of return to the fair market value of the assets at the beginning of the year. This method is likely to cause the expected return on assets, which is recorded in earnings, to fluctuate more than had we used the accounting methodology of our defined-benefit pension plans.
Medical Inflation Assumption
We estimate the trend in healthcare cost inflation to predict future cash flows related to our retiree medical plans. Our assumption is based on recent plan experience and industry trends.
For the UMWA plans, our largest postretirementretiree medical plans, we have assumed a medical inflation rate of 7% for 2014,2015, and we project this rate to decline to 5% in 20202021 and hold at 5% thereafter. Our medical inflation rate assumption (including the assumption that medical inflation rates will gradually decline over the next seven years and hold at 5%) is based on macroeconomic assumptions of gross domestic growth rates, the excess of national health expenditures over other goods and services, and population growth. The average annual medical inflation rate of the company over the last eightnine years was 5.7 %.5.2%.
If we had assumed that medical inflation rates were one percentage point higher in each future year, the plan obligation for these plans at December 31, 2013,2014, would have been approximately $43.6$56.5 million higher and the expense for 20132014 would have been $2.0$1.9 million higher. If we had assumed that the medical inflation rates were one percentage point lower, the plan obligation at December 31, 2013,2014, would have been approximately $37.2$47.5 million lower and the related 20132014 expenses would have been $1.7$1.6 million lower.
If we had projected medical inflation rates to decline from 7% to 4.5% by 2028, instead of our projected decline to 5% by 2020,2021, the plan obligation for the UMWA retiree medical benefit plan would have been $15.2$10.2 million higher for 20132014 and our expense would be $1.9$1.2 million higher for 2014.2015.
Excise Tax on Administrators by Patient Protection and Affordable Care Act
A 40% excise tax will be imposed on high-cost health plans (“Cadillac plans”) beginning in 2018. The tax will apply to plan costs that exceed a certain threshold level for individuals and for families, which will be indexed to inflation. There will be higher limits for high-risk professions, among which is mining. Even though the tax is not assessed directly to an employer but rather to the benefits plan administrator, the cost is expected to be passed through to plan sponsors as higher premiums or higher claims administration fees, increasing the plan sponsor’s obligations. We project that we will have to pay the benefits plan administrator this excise tax beginning in 2018, and our plan obligations at December 31, 2013,2014, include $22.9$24.8 million related to this tax. We are currently unable to reduce the benefit levels of our UMWA medical plans to avoid this excise tax because these benefit levels are required by the Coal Industry Retiree Health Benefit Act of 1992.
Workers’ Compensation
Besides the effects of changes in medical costs, worker’s compensation costs are affected by the severity and types of injuries, changes in state and federal regulations and their application and the quality of programs which assist an employee’s return to work. Our liability for future payments for workers’ compensation claims is evaluated annually with the assistance of an actuary.
Numbers of Participants
Mortality tables. The valuationsSociety of allActuaries issued new mortality base tables (“RP-2014”) and a longevity improvement scale (“MP-2014”) in October of 2014, superseding the tables developed in 2000. The new tables reflect that people in the U.S. are living significantly longer than estimated in the 2000 tables.
We adopted the Mercer modified RP-2014 base table and Mercer modified MP-2014 projection scale, with Blue Collar adjustments for the majority of our U.S. retirement plans, and with White Collar adjustments for our nonqualified U.S. pension plan as of December 31, 2014. The adoption of these tables significantly increased the estimated U.S. plans’ retirement obligations. The increases to our major U.S. plans were $45 million for the primary U.S. pension plan, $39 million for the UMWA retiree medical plans and $3 million for the black lung obligations. These increases were recognized as benefit plans are affectedplan experience losses arising during the year in accumulated other comprehensive income (loss).
As of December 31, 2013, we used the tables developed by the life expectancySociety of Actuaries in 2000 – the RP-2000 base table and the AA improvement scale, with similar Blue and White Collar adjustments.
Lump sum offer to participants in 2014. In August 2014, we offered approximately 9,000 terminated participants that had not yet retired the option of receiving the value of their pension benefit in a lump-sum payment, or as a reduced annuity that would begin earlier. The lump-sum elections were accepted by approximately 4,300 terminated participants resulting in payments by the plan of $149 million. This action will further reduce the premiums paid to the Pension Benefit Guaranty Corporation (“PBGC”) as a portion of the participants. Accordingly, we relypremiums is based on actuarial information to predict the number and life expectancy of participants.participants in the plan. We userecognized a settlement loss in the following mortality table for our major plans.fourth quarter of 2014 related to the lump-sum payment of $56 million.
55
| The number of participants by major plan in the past five years is as follows: | |||||||||||
| Number of participants | |||||||||||
| Plan | 2013 | 2012 | 2011 | 2010 | 2009 | ||||||
| UMWA plans | 4,100 | 4,300 | 4,400 | 4,600 | 4,700 | ||||||
| Black Lung | 710 | 780 | 800 | 800 | 700 | ||||||
| U.S. pension | 19,800 | 20,100 | 20,400 | 21,000 | 21,100 | ||||||
Number of participants. The number of participants by major plan in the past five years is as follows: | ||||||||||||||||||||
| Number of participants | ||||||||||||||||||||
| Plan | 2014 | 2013 | 2012 | 2011 | 2010 | |||||||||||||||
| UMWA plans | 3,900 | 4,100 | 4,300 | 4,400 | 4,600 | |||||||||||||||
| Black Lung | 700 | 710 | 780 | 800 | 800 | |||||||||||||||
| U.S. pension | 15,200 | 19,800 | 20,100 | 20,400 | 21,000 | |||||||||||||||
Because we are no longer operating in the coal industry, we anticipate that the number of participants in the UMWA retirement medical plan will decline over time due to mortality. Because the U.S. pension plan has been frozen, the number of its participants will also decline over time.
Other Changes in 2014 for the Primary U.S. Pension Plan. As part of a pension de-risking strategy and in an effort to reduce the administrative costs associated with the primary U.S. pension plan, we contributed $87.2 million to the plan in 2014, including $28.9 million in payments that were not due until 2015 and $31.6 million in payments that were not due until 2016. Accelerating the 2015 and 2016 contributions will reduce future PBGC premiums, an administrative cost of the plan.
Foreign Currency Translation
The majority of our subsidiaries outside the U.S. conduct business in their local currencies. Our financials reportfinancial results are reported in U.S. dollars, which include the results of these subsidiaries.
Accounting Policy
Our accounting policy for foreign currency translation is different depending on whether the economy in which our foreign subsidiary operates has been designated as highly inflationary. Economies with a three-year cumulative inflation rate of more than 100% are considered highly inflationary. Subsequent reductions in cumulative inflation rates below 100% do not change the method of translation unless the reduction is deemed to be other than temporary. Effective January 1, 2010, we began accounting for our Venezuelan subsidiaries as operating in a highly inflationary economy.
Non-Highly Inflationary Economies
Assets and liabilities of foreign subsidiaries in non-highly inflationary economies are translated into U.S. dollars using rates of exchange at the balance sheet date. Translation adjustments are recorded in other comprehensive income (loss). Revenues and expenses are translated at rates of exchange in effect during the year. Transaction gains and losses are recorded in net income.income (loss).
Highly Inflationary Economies
Foreign subsidiaries that operate in highly inflationary countries must use the reporting currency (the U.S. dollar) as the functional currency. Local-currency monetary assets and liabilities are remeasured into dollars each balance sheet date, with remeasurement adjustments and other transaction gains and losses recognized in earnings. Non-monetary assets and liabilities do not fluctuate with changes in local currency exchange rates to the dollar.
Application of Accounting Policy
Venezuela
Brink’s Venezuela accounted for $447$212 million or 11%6% of total Brink’s revenues and representedwas a significant component of 2014 total segment operating profit in 2013.before items not allocated to segments. At December 31, 2013,2014, we had investments in our Venezuelan operations of $125.3$59.6 million on an equity-method basis. At December 31, 2013,2014, we had bolivar denominated net monetary assets of $120.4$23.5 million, including $93.8$12.6 million of cash and cash equivalents denominated in bolivars.
The economy in Venezuela has had significant inflation in the last several years. We consolidate our Venezuelan results using our accounting policy for subsidiaries operating in highly inflationary economies.
The government devalued the official rate for essential services in February 2013 from 5.3 to 6.3 bolivars to the dollar. In January 2014,
Late in 2013, the government expanded an alternateadded another official exchange process, to obtain dollarsknown as SICAD, for travel and certain other purposes. Rates obtained bypurposes, made available at government discretion. The published rate for this process in 2014 ranged from 10 to 12 bolivars to the alternateU.S. dollar. Since the end of the first
56
quarter of 2013, we have only been able to obtain dollars once using the SICAD process. We do not know whether we will be able to access the SICAD process again in the future.
In March 2014, the government initiated another exchange mechanism known as SICAD II. Conversions under this mechanism were also subject to specific eligibility requirements. Transactions were reported to be 11.3in a range of 49 to 52 bolivars to U.S. dollars inthe dollar. Through December 2013.31, 2014, we received approval to obtain $1.2 million (weighted average exchange rate of 51) through the SICAD II mechanism.
As a result of thesethe restrictions on currency exchange, we have in the past been unable to obtain sufficient U.S. dollars to purchase certain imported supplies and fixed assets to fully operate our business in Venezuela, and as a result,Venezuela. Consequently, we have occasionally purchased more expensive, locally denominatedbolivar-denominated supplies and fixed assets. The restrictions alsoFurthermore, there is a risk that the SIMADI process will be discontinued or not accessible when needed in the future, which may prevent us from repatriating earnings and from being fully compensated for intercompany services.dividends or obtaining dollars to operate our Venezuelan operations.
Remeasurement rate during 2012. We used an official rate of 5.3 bolivars to the dollar to remeasure our bolivar-denominated monetary assets and liabilities into U.S. dollars and to translate our revenues and expenses.
Remeasurement rates during 2013. Through January 31, 2013, we used an official rate of 5.3 bolivars to the dollar to remeasure our bolivar denominatedbolivar-denominated monetary assets and liabilities into U.S. dollars and to translate our revenuerevenues and expenses. After the devaluation in February 2013, we began to use the 6.3 official exchange rate to remeasure bolivar denominated monetary assets and liabilities and to translate our revenuerevenues and expenses. As a result of the devaluation, weWe recognized a $13.4 million net remeasurement loss in 2013 when we changed from the 5.3 to 6.3 exchange rate. The after-tax effect of these losses attributable to noncontrolling interests was $4.7 million in 2013.
Remeasurement rates during 2014. Through March 23, 2014, we used the official rate of 6.3 bolivars to the dollar to remeasure our bolivar denominated monetary assets and liabilities into U.S. dollars and to translate our revenues and expenses. Effective March 24, 2014, we began to use the exchange rate published for the SICAD II process to remeasure bolivar denominated monetary assets and liabilities and to translate our revenues and expenses. We recognized a $121.6 million net remeasurement loss in 2014 when we changed from the official rate of 6.3 to the SICAD II exchange rate, which averaged approximately 50 since opening on March 24, 2014 until implementation of a new exchange process in February 2015 (SIMADI). Transaction gains and losses since March 31, 2014 have not been significant. At December 31, 2014, the rate was approximately 50. The after-tax effect of these losses attributable to noncontrolling interests was $39.7 million in 2014.
Remeasuring our Venezuelan results using the SICAD II rate has had the following effects on our reported results:
| · | Brink’s Venezuela has become a less-significant component of Brink’s consolidated revenues and operating profit. |
| · | Brink’s Venezuela’s profit margin percentage declined as the historical U.S. dollar nonmonetary assets were not remeasured to a lower U.S. dollar basis but instead retained a historical higher basis which was used for depreciation and other expense attribution. Our nonmonetary assets were $59.9 million at December 31, 2013, and $55.0 million at December 31, 2014. |
| · | Our investment in our Venezuelan operations on an equity-method basis has declined. Our investment was $125.3 million at December 31, 2013, and $59.6 million at December 31, 2014. |
| · | Our bolivar-denominated net monetary assets included in our consolidated balance sheets have declined. Our bolivar-denominated net monetary assets were $120.4 million (including $93.8 million of cash and cash equivalents) at December 31, 2013, and $23.5 million (including $12.6 million of cash and cash equivalents) at December 31, 2014. |
Remeasurement rates expected during 2015. We have not concluded how the elimination of the SICAD II exchange process will affect our remeasurement of our Venezuelan results in 2015. If we conclude the new SIMADI process is appropriate, our results will experience similar types of effects as we experienced when we adopted the SICAD II rate, as described above, however the magnitude is expected to be lower.
RECENT ACCOUNTING PRONOUNCEMENTS
In May 2014, the Financial Accounting Standards Board (“FASB”) issued a new standard related to revenue recognition, which requires an entity to recognize the amount of revenue to which it expects to be entitled for the transfer of promised goods or services to customers. The new standard will replace most of the existing revenue recognition standards in U.S. GAAP when it becomes effective on January 1, 2017. Early adoption is not permitted. The new standard can be applied retrospectively to each prior reporting period presented or retrospectively with the cumulative effect of the change recognized at the date of the initial application in retained earnings. We are assessing the potential impact of the new standard on financial reporting and have not yet selected a transition method.
ITEM 7A. QUANTITATIVE AND QUALITATIVE DISCLOSURES ABOUT MARKET RISK
We currently serve customers in more than 100 countries, including 4341 countries where we operate subsidiaries. These operations expose us to a variety of market risks, including the effects of changes in interest rates, commodity prices and foreign currency exchange rates. These financial and commodity exposures are monitored and managed by us as an integral part of itsour overall risk management program.
We periodically use various derivative and non-derivative financial instruments, as discussed below, to hedge our interest rate, commodity prices and foreign currency exposures when appropriate. The risk that counterparties to these instruments may be unable to perform is minimized by limiting the counterparties used to major financial institutions with investment grade credit ratings. We do not expect to incur a loss from the failure of any counterparty to perform under the agreements. We do not use derivative financial instruments for purposes other than hedging underlying financial or commercial exposures.
The sensitivity analyses discussed below for the market risk exposures were based on the facts and circumstances in effect at December 31, 2013.2014. Actual results will be determined by a number of factors that are not under management’s control and could vary materially from those disclosed.
Interest Rate Risk
We use both fixed and floating rate debt and leases to finance our operations. Floating rate obligations, including our Revolving Facility, expose us to fluctuations in cash flows due to changes in the general level of interest rates. Fixed rate obligations, including our Dominion Terminal Associates debt and our unsecured notes, are subject to fluctuations in fair values as a result of changes in interest rates.
Based on the contractual interest rates on the floating rate debt at December 31, 2013,2014, a hypothetical 10% increase in rates would increase cash outflows by approximately $0.7$0.9 million over a twelve-month period. In other words, our weighted average interest rate on our floating rate instruments was 2.7% per annum at December 31, 2013.2014. If that average rate were to increase by 0.3 percentage points to 3.0%, the cash outflows associated with these instruments would increase by $0.7$0.9 million annually. The effect on the fair values on our Dominion Terminal Associates (“DTA”) debt and on our unsecured notes for a hypothetical 10% decrease in the yield curve from year-end 20132014 levels would result in a $3.1 million increase for our DTA debt and a $2.1$1.7 million increase for our unsecured notes in the fair values of the debt.
Foreign Currency Risk
We have exposure to the effects of foreign currency exchange rate fluctuations on the results of all of our foreign operations. Our foreign operations generally use local currencies to conduct business but their results are reported in U.S. dollars.
We are also exposed periodically to the foreign currency rate fluctuations that affect transactions not denominated in the functional currency of domestic and foreign operations. To mitigate these exposures, we, from time to time, enter into foreign currency forward and swap contracts. At December 31, 2013,2014, the notional value of our shorter term outstanding foreign currency contracts was $46.1$43.0 million with average contract maturities of approximately one month. These shorter term foreign currency contracts primarily offset exposures in the Mexican peso and the euro. Additionally, these shorter term contracts are not designated as hedges for accounting purposes, and accordingly, changes in their fair value are recorded immediately in earnings. We also have a longer term cross currency swap contract to hedge exposure in the Brazilian real which is designated as a cash flow hedge for accounting purposes. At December 31, 2013,2014, the notional value of that longer term contract was $21.2$20.8 million with a weighted average maturity of 2.51.6 years. We do not use derivative financial instruments to hedge investments in foreign subsidiaries since such investments are long-term in nature.
The effects of a hypothetical simultaneous 10% appreciation in the U.S. dollar from the 20132014 levels against all other currencies of countries in which we have continuing operations are as follows:
| Hypothetical Effects | |||||||||||
| Increase/ (decrease) | |||||||||||
| (In millions) | Venezuela | Other countries | Total | ||||||||
| Effect on Earnings: | |||||||||||
| Translation of 2013 earnings into U.S. dollars | $ | (3.7) | (19.0) | (22.7) | |||||||
| Transaction gains (losses) | (13.5) | 1.0 | (12.5) | ||||||||
| Effect on Other Comprehensive Income (Loss): | |||||||||||
| Translation of net assets of foreign subsidiaries | - | (75.0) | (75.0) | ||||||||
| Hypothetical Effects | ||||||||||||
| Increase/ (decrease) | ||||||||||||
| (In millions) | Venezuela | Other countries | Total | |||||||||
| Effect on Earnings: | ||||||||||||
| Translation of 2014 earnings into U.S. dollars | $ | (1.9 | ) | (12.0 | ) | (13.9 | ) | |||||
| Transaction gains (losses) | (2.3 | ) | - | (2.3 | ) | |||||||
| Effect on Other Comprehensive Income (Loss): | ||||||||||||
| Translation of net assets of foreign subsidiaries | - | (63.4 | ) | (63.4 | ) | |||||||
The hypothetical foreign currency effects above detail the consolidated effect attributable to Brink’s of a simultaneous change in the value of a large number of foreign currencies relative to the U. S. dollar. The foreign currency exposure effect related to a change in an individual currency could be significantly different.
Venezuela
Brink’s Venezuela accounted for 11%$212 million or 6% of total Brink’s revenues and representedwas a significant component of 2014 total segment operating profit. Currently,profit before items not allocated to segments. Venezuela operates in a highly inflationary economy and its currency is fixedeconomy.
In February 2015, the government replaced the SICAD II process with a new process, known locally as SIMADI. The SIMADI rate has ranged from 170 to 174 bolivars to the U.S. dollar.dollar between February 12 and February 26. Had we used a rate of 170, our revenues in 2014 would have declined by $183 million and our operating profit before items not allocated to segments would have declined by $39 million. Had a rate of 170 been in effect at December 31, 2014, we would have recognized additional currency losses to write down our net monetary assets of $16 million.
The investment in our Venezuelan subsidiaries, and cash and other net monetary assets held by these subsidiaries are as follows:
| December 31, | ||||||||
| (In millions) | 2013 | 2012 | ||||||
Equity-method investment in Venezuelan subsidiaries(a) | $ | 125.3 | 90.0 | |||||
| Net monetary assets held by our Venezuelan subsidiaries | ||||||||
| Cash and short-term investments denominated in U.S. dollars | $ | 0.5 | 0.5 | |||||
| Net monetary assets denominated in bolivars: | ||||||||
| Cash and cash equivalents | $ | 93.8 | 47.9 | |||||
| Accounts receivable, accounts payable and other, net | 26.6 | 21.5 | ||||||
| Total | $ | 120.4 | 69.4 | |||||
| December 31, | ||||||||
| (In millions) | 2014 | 2013 | ||||||
Equity-method investment in Venezuelan subsidiaries(a) | $ | 59.6 | 125.3 | |||||
| Net monetary assets held by our Venezuelan subsidiaries | ||||||||
| Cash and short-term investments denominated in U.S. dollars | $ | 1.1 | 0.5 | |||||
| Net monetary assets denominated in bolivars: | ||||||||
| Cash and cash equivalents | $ | 12.6 | 93.8 | |||||
| Accounts receivable, accounts payable and other, net | 10.9 | 26.6 | ||||||
| Total | $ | 23.5 | 120.4 | |||||
| (a) | The amount represents retained earnings net of currency translation adjustments of the business. |
ITEM 8. FINANCIAL STATEMENTS AND SUPPLEMENTARY DATA
THE BRINK’S COMPANY
CONSOLIDATED FINANCIAL STATEMENTS
FOR THE YEAR ENDED DECEMBER 31, 20132014
TABLE OF CONTENTS
| Page | ||
| MANAGEMENT’S ANNUAL REPORT ON INTERNAL CONTROL OVER FINANCIAL REPORTING | ||
| REPORTS OF INDEPENDENT REGISTERED PUBLIC ACCOUNTING FIRM | ||
| CONSOLIDATED FINANCIAL STATEMENTS | ||
| Consolidated Balance Sheets | ||
| Consolidated Statements of Income (Loss) | ||
| Consolidated Statements of Comprehensive Income (Loss) | ||
| Consolidated Statements of Equity | ||
| Consolidated Statements of Cash Flows | ||
| NOTES TO CONSOLIDATED FINANCIAL STATEMENTS | ||
| Note 1 – Summary of Significant Accounting Policies | ||
| Note 2 – Segment Information | ||
| Note 3 – Retirement Benefits | ||
| Note 4 – Income Taxes | ||
| Note 5 – Property and Equipment | ||
| Note 6 – Acquisitions | ||
| Note 7 – Goodwill and Other Intangible Assets | ||
| Note 8 – Prepaid Expenses and Other | ||
| Note 9 – | ||
| Note 10 – | ||
| Note 11 – | ||
| Note 12 – | ||
| Note 13 – | ||
| Note 14 – | ||
| Note 15 – | ||
| Note 16 – | ||
| Note 17 – | ||
| Note 18 – | ||
| Note 19 – | ||
| Note 20 – | ||
| Note 21 – Other Operating Income (Expense) | 109 | |
| Note 22 – Interest and Other Nonoperating Income (Expense) | ||
| Note 23 – Other Commitments and Contingencies | 110 | |
| Note 24 – 2014 Reorganization and Restructuring | 110 | |
| Note 25 – Selected Quarterly Financial Data (unaudited) | ||
MANAGEMENT’S ANNUAL REPORT ON INTERNAL CONTROL OVER FINANCIAL REPORTING
Management of the Company is responsible for establishing and maintaining adequate internal control over financial reporting as defined in Rule 13a-15(f) under the Securities Exchange Act of 1934. Our internal control over financial reporting is designed to provide reasonable assurance to our management and board of directors regarding the preparation and fair presentation of published financial statements.
Because of its inherent limitations, internal control over financial reporting may not prevent or detect misstatements. Therefore, even those systems determined to be effective can provide only reasonable assurance with respect to financial statement preparation and presentation.
Management assessed the effectiveness of our internal control over financial reporting as of December 31, 2013.2014. In making this assessment, management used the criteria set forth by the Committee of Sponsoring Organizations of the Treadway Commission (COSO) in “Internal Control – Integrated Framework (1992).”
Based on this assessment, our management believes that, as of December 31, 2013,2014, our internal control over financial reporting is effective based on the COSO criteria.
KPMG LLP, the independent registered public accounting firm which audits our consolidated financial statements, has issued an attestation report of our internal control over financial reporting. KPMG’s attestation report appears on page 70.62.
In May 2013, COSO issued an updated framework which superseded the 1992 framework in December 2014. We intend to integrate the changes prescribed by the 2013 COSO Framework into management’s evaluation of the effectiveness of internal control over financial reporting during 2015.
Report of Independent Registered Public Accounting Firm
The Board of Directors and Stockholders
The Brink’s Company:
We have audited The Brink’s Company’s (the Company) internal control over financial reporting as of December 31, 2013,2014, based on criteria established in Internal Control – Integrated Framework (1992) issued by the Committee of Sponsoring Organizations of the Treadway Commission (COSO). The Company’s management is responsible for maintaining effective internal control over financial reporting and for its assessment of the effectiveness of internal control over financial reporting, included in the accompanying Management’s Annual Report on Internal Control over Financial Reporting. Our responsibility is to express an opinion on the Company’s internal control over financial reporting based on our audit.
We conducted our audit in accordance with the standards of the Public Company Accounting Oversight Board (United States). Those standards require that we plan and perform the audit to obtain reasonable assurance about whether effective internal control over financial reporting was maintained in all material respects. Our audit included obtaining an understanding of internal control over financial reporting, assessing the risk that a material weakness exists, and testing and evaluating the design and operating effectiveness of internal control based on the assessed risk. Our audit also included performing such other procedures as we considered necessary in the circumstances. We believe that our audit provides a reasonable basis for our opinion.
A company’s internal control over financial reporting is a process designed to provide reasonable assurance regarding the reliability of financial reporting and the preparation of financial statements for external purposes in accordance with generally accepted accounting principles. A company’s internal control over financial reporting includes those policies and procedures that (1) pertain to the maintenance of records that, in reasonable detail, accurately and fairly reflect the transactions and dispositions of the assets of the company; (2) provide reasonable assurance that transactions are recorded as necessary to permit preparation of financial statements in accordance with generally accepted accounting principles, and that receipts and expenditures of the company are being made only in accordance with authorizations of management and directors of the company; and (3) provide reasonable assurance regarding prevention or timely detection of unauthorized acquisition, use, or disposition of the company’s assets that could have a material effect on the financial statements.
Because of its inherent limitations, internal control over financial reporting may not prevent or detect misstatements. Also, projections of any evaluation of effectiveness to future periods are subject to the risk that controls may become inadequate because of changes in conditions, or that the degree of compliance with the policies or procedures may deteriorate.
In our opinion, The Brink’s Company maintained, in all material respects, effective internal control over financial reporting as of December 31, 2013,2014, based on criteria established in Internal Control – Integrated Framework (1992) issued by the Committee of Sponsoring Organizations of the Treadway Commission (COSO).
We also have audited, in accordance with the standards of the Public Company Accounting Oversight Board (United States), the consolidated balance sheets of The Brink’s Company and subsidiaries as of December 31, 20132014 and 2012,2013, and the related consolidated statements of income (loss), comprehensive income (loss), equity, and cash flows for each of the years in the three-year period ended December 31, 2013,2014, and our report dated February 27, 2014,March 5, 2015, expressed an unqualified opinion on those consolidated financial statements.
/s/ KPMG LLP
Richmond, Virginia
Report of Independent Registered Public Accounting Firm
The Board of Directors and Stockholders
The Brink’s Company:
We have audited the accompanying consolidated balance sheets of The Brink’s Company and subsidiaries as of December 31, 20132014 and 2012,2013, and the related consolidated statements of income (loss), comprehensive income (loss), equity, and cash flows for each of the years in the three-year period ended December 31, 2013.2014. These consolidated financial statements are the responsibility of the Company’s management. Our responsibility is to express an opinion on these consolidated financial statements based on our audits.
We conducted our audits in accordance with the standards of the Public Company Accounting Oversight Board (United States). Those standards require that we plan and perform the audit to obtain reasonable assurance about whether the financial statements are free of material misstatement. An audit includes examining, on a test basis, evidence supporting the amounts and disclosures in the financial statements. An audit also includes assessing the accounting principles used and significant estimates made by management, as well as evaluating the overall financial statement presentation. We believe that our audits provide a reasonable basis for our opinion.
In our opinion, the consolidated financial statements referred to above present fairly, in all material respects, the financial position of The Brink’s Company and subsidiaries as of December 31, 20132014 and 2012,2013, and the results of their operations and their cash flows for each of the years in the three-year period ended December 31, 2013,2014, in conformity with U.S. generally accepted accounting principles.
We also have audited, in accordance with the standards of the Public Company Accounting Oversight Board (United States), The Brink’s Company’s internal control over financial reporting as of December 31, 2013,2014, based on criteria established in Internal Control – Integrated Framework (1992) issued by the Committee of Sponsoring Organizations of the Treadway Commission (COSO), and our report dated February 27, 2014March 5, 2015 expressed an unqualified opinion on the effectiveness of the Company’s internal control over financial reporting.
/s/ KPMG LLP
Richmond, Virginia
THE BRINK’S COMPANY
and subsidiaries
Consolidated Balance Sheets
| December 31, | ||||||||
| (In millions, except for per share amounts) | 2014 | 2013 | ||||||
| ASSETS | ||||||||
| Current assets: | ||||||||
| Cash and cash equivalents | $ | 176.2 | 255.5 | |||||
| Accounts receivable (net of allowance: 2014 - $10.0; 2013 - $8.2) | 530.5 | 622.2 | ||||||
| Prepaid expenses and other | 129.0 | 153.0 | ||||||
| Deferred income taxes | 71.9 | 72.0 | ||||||
| Total current assets | 907.6 | 1,102.7 | ||||||
| Property and equipment, net | 669.5 | 758.7 | ||||||
| Goodwill | 215.7 | 240.2 | ||||||
| Other intangibles | 39.8 | 46.3 | ||||||
| Deferred income taxes | 289.5 | 251.7 | ||||||
| Other | 70.1 | 98.4 | ||||||
| Total assets | $ | 2,192.2 | 2,498.0 | |||||
| LIABILITIES AND EQUITY | ||||||||
| Current liabilities: | ||||||||
| Short-term borrowings | $ | 59.4 | 80.9 | |||||
| Current maturities of long-term debt | 34.1 | 24.6 | ||||||
| Accounts payable | 168.6 | 185.6 | ||||||
| Accrued liabilities | 466.3 | 507.5 | ||||||
| Total current liabilities | 728.4 | 798.6 | ||||||
| Long-term debt | 373.3 | 330.5 | ||||||
| Accrued pension costs | 219.0 | 214.8 | ||||||
| Retirement benefits other than pensions | 257.1 | 186.0 | ||||||
| Deferred income taxes | 10.8 | 18.0 | ||||||
| Other | 129.8 | 170.6 | ||||||
| Total liabilities | 1,718.4 | 1,718.5 | ||||||
| Commitments and contingent liabilities (notes 3, 4, 14, 16, 19 and 23) | ||||||||
| Equity: | ||||||||
| The Brink’s Company (“Brink’s”) shareholders: | ||||||||
| Common stock, par value $1 per share: | ||||||||
| Shares authorized: 100.0 | ||||||||
| Shares issued and outstanding: 2014 - 48.6; 2013 - 48.4 | 48.6 | 48.4 | ||||||
| Capital in excess of par value | 584.5 | 566.4 | ||||||
| Retained earnings | 592.9 | 696.4 | ||||||
| Accumulated other comprehensive income (loss): | ||||||||
| Benefit plan adjustments | (571.7 | ) | (478.0 | ) | ||||
| Foreign currency translation | (222.1 | ) | (141.5 | ) | ||||
| Unrealized gains on available-for-sale securities | 1.4 | 1.6 | ||||||
| Gains on cash flow hedges | 0.4 | 0.6 | ||||||
| Accumulated other comprehensive loss | (792.0 | ) | (617.3 | ) | ||||
| Brink’s shareholders | 434.0 | 693.9 | ||||||
| Noncontrolling interests | 39.8 | 85.6 | ||||||
| Total equity | 473.8 | 779.5 | ||||||
| Total liabilities and equity | $ | 2,192.2 | 2,498.0 | |||||
| See accompanying notes to consolidated financial statements. | ||||||||
| December 31, | ||||||||||
| (In millions, except for per share amounts) | 2013 | 2012 | ||||||||
| ASSETS | ||||||||||
| Current assets: | ||||||||||
| Cash and cash equivalents | $ | 255.5 | 201.7 | |||||||
| Accounts receivable (net of allowance: 2013 – $8.2; 2012 – $9.2) | 622.2 | 612.3 | ||||||||
| Prepaid expenses and other | 153.0 | 122.1 | ||||||||
| Deferred income taxes | 72.0 | 59.4 | ||||||||
| Total current assets | 1,102.7 | 995.5 | ||||||||
| Property and equipment, net | 758.7 | 793.8 | ||||||||
| Goodwill | 240.2 | 243.8 | ||||||||
| Other intangibles | 46.3 | 56.1 | ||||||||
| Deferred income taxes | 251.7 | 385.3 | ||||||||
| Other | 98.4 | 79.4 | ||||||||
| Total assets | $ | 2,498.0 | 2,553.9 | |||||||
| LIABILITIES AND EQUITY | ||||||||||
| Current liabilities: | ||||||||||
| Short-term borrowings | $ | 80.9 | 26.7 | |||||||
| Current maturities of long-term debt | 24.6 | 27.0 | ||||||||
| Accounts payable | 185.6 | 172.8 | ||||||||
| Accrued liabilities | 507.5 | 516.5 | ||||||||
| Total current liabilities | 798.6 | 743.0 | ||||||||
| Long-term debt | 330.5 | 335.6 | ||||||||
| Accrued pension costs | 214.8 | 397.8 | ||||||||
| Retirement benefits other than pensions | 186.0 | 304.6 | ||||||||
| Deferred income taxes | 18.0 | 18.7 | ||||||||
| Other | 170.6 | 177.4 | ||||||||
| Total liabilities | 1,718.5 | 1,977.1 | ||||||||
| Commitments and contingent liabilities (notes 3, 4, 13, 15, 18 and 22) | ||||||||||
| Equity: | ||||||||||
| The Brink’s Company (“Brink’s”) shareholders: | ||||||||||
| Common stock, par value $1 per share: | ||||||||||
| Shares authorized: 100.0 | ||||||||||
| Shares issued and outstanding: 2013 – 48.4; 2012 – 47.8 | 48.4 | 47.8 | ||||||||
| Capital in excess of par value | 566.4 | 568.3 | ||||||||
| Retained earnings | 696.4 | 659.1 | ||||||||
| Accumulated other comprehensive income (loss): | ||||||||||
| Benefit plan adjustments | (478.0) | (665.1) | ||||||||
| Foreign currency translation | (141.5) | (109.9) | ||||||||
| Unrealized gains on available-for-sale securities | 1.6 | 1.6 | ||||||||
| Gains on cash flow hedges | 0.6 | - | ||||||||
| Accumulated other comprehensive loss | (617.3) | (773.4) | ||||||||
| Brink’s shareholders | 693.9 | 501.8 | ||||||||
| Noncontrolling interests | 85.6 | 75.0 | ||||||||
| Total equity | 779.5 | 576.8 | ||||||||
| Total liabilities and equity | $ | 2,498.0 | 2,553.9 | |||||||
| See accompanying notes to consolidated financial statements. | ||||||||||
THE BRINK’S COMPANY
and subsidiaries
Consolidated Statements of Income (Loss)
| Years Ended December 31, | ||||||
| (In millions, except for per share amounts) | 2014 | 2013 | 2012 | |||
| Revenues | $ | 3,562.3 | 3,778.6 | 3,577.6 | ||
| Costs and expenses: | ||||||
| Cost of revenues | 2,948.2 | 3,059.2 | 2,894.2 | |||
| Selling, general and administrative expenses | 560.6 | 546.8 | 532.4 | |||
| Total costs and expenses | 3,508.8 | 3,606.0 | 3,426.6 | |||
| Other operating income (expense) | (81.0) | (9.4) | 11.2 | |||
| Operating profit (loss) | (27.5) | 163.2 | 162.2 | |||
| Interest expense | (23.4) | (25.1) | (23.1) | |||
| Interest and other income (expense) | 1.9 | 1.5 | 7.0 | |||
| Income (loss) from continuing operations before tax | (49.0) | 139.6 | 146.1 | |||
| Provision for income taxes | 36.7 | 49.3 | 23.0 | |||
| Income (loss) from continuing operations | (85.7) | 90.3 | 123.1 | |||
| Loss from discontinued operations, net of tax | (29.1) | (9.2) | (13.4) | |||
| Net income (loss) | (114.8) | 81.1 | 109.7 | |||
| Less net income (loss) attributable to noncontrolling interests | (30.9) | 24.3 | 20.8 | |||
| Net income (loss) attributable to Brink’s | $ | (83.9) | 56.8 | 88.9 | ||
| Amounts attributable to Brink’s: | ||||||
| Continuing operations | $ | (54.8) | 66.0 | 102.3 | ||
| Discontinued operations | (29.1) | (9.2) | (13.4) | |||
| Net income (loss) attributable to Brink’s | $ | (83.9) | 56.8 | 88.9 | ||
Earnings (loss) per share attributable to Brink’s common shareholders(a): | ||||||
| Basic: | ||||||
| Continuing operations | $ | (1.12) | 1.36 | 2.12 | ||
| Discontinued operations | (0.59) | (0.19) | (0.28) | |||
| Net income (loss) | (1.71) | 1.17 | 1.84 | |||
| Diluted: | ||||||
| Continuing operations | $ | (1.12) | 1.35 | 2.11 | ||
| Discontinued operations | (0.59) | (0.19) | (0.28) | |||
| Net income (loss) | (1.71) | 1.16 | 1.83 | |||
| Weighted-average shares | ||||||
| Basic | 49.0 | 48.7 | 48.4 | |||
| Diluted | 49.0 | 49.0 | 48.6 | |||
| (a) | Amounts may not add due to rounding. | |||||
| See accompanying notes to consolidated financial statements. | ||||||
| Years Ended December 31, | ||||||||||
| (In millions, except for per share amounts) | 2013 | 2012 | 2011 | |||||||
| Revenues | $ | 3,942.2 | 3,735.0 | 3,662.9 | ||||||
| Costs and expenses: | ||||||||||
| Cost of revenues | 3,197.1 | 3,024.3 | 2,966.0 | |||||||
| Selling, general and administrative expenses | 564.0 | 546.7 | 512.4 | |||||||
| Total costs and expenses | 3,761.1 | 3,571.0 | 3,478.4 | |||||||
| Other operating income (expense) | (9.4) | 11.0 | 18.0 | |||||||
| Operating profit | 171.7 | 175.0 | 202.5 | |||||||
| Interest expense | (25.1) | (23.1) | (23.1) | |||||||
| Interest and other income (expense) | 1.6 | 7.2 | 8.9 | |||||||
| Income from continuing operations before tax | 148.2 | 159.1 | 188.3 | |||||||
| Provision for income taxes | 52.0 | 27.1 | 64.0 | |||||||
| Income from continuing operations | 96.2 | 132.0 | 124.3 | |||||||
| Loss from discontinued operations, net of tax | (15.1) | (22.3) | (25.8) | |||||||
| Net income | 81.1 | 109.7 | 98.5 | |||||||
| Less net income attributable to noncontrolling interests | (24.3) | (20.8) | (24.0) | |||||||
| Net income attributable to Brink’s | $ | 56.8 | 88.9 | 74.5 | ||||||
| Amounts attributable to Brink’s: | ||||||||||
| Continuing operations | $ | 71.9 | 111.2 | 100.3 | ||||||
| Discontinued operations | (15.1) | (22.3) | (25.8) | |||||||
| Net income attributable to Brink’s | $ | 56.8 | 88.9 | 74.5 | ||||||
Earnings (loss) per share attributable to Brink’s common shareholders(a): | ||||||||||
| Basic: | ||||||||||
| Continuing operations | $ | 1.48 | 2.30 | 2.10 | ||||||
| Discontinued operations | (0.31) | (0.46) | (0.54) | |||||||
| Net income | 1.17 | 1.84 | 1.56 | |||||||
| Diluted: | ||||||||||
| Continuing operations | $ | 1.47 | 2.29 | 2.09 | ||||||
| Discontinued operations | (0.31) | (0.46) | (0.54) | |||||||
| Net income | 1.16 | 1.83 | 1.55 | |||||||
| Weighted-average shares | ||||||||||
| Basic | 48.7 | 48.4 | 47.8 | |||||||
| Diluted | 49.0 | 48.6 | 48.1 | |||||||
| (a) | Amounts may not add due to rounding. | |||||||||
| See accompanying notes to consolidated financial statements. | ||||||||||
THE BRINK’S COMPANY
and subsidiaries
Consolidated Statements of Comprehensive Income (Loss)
| Years Ended December 31, | ||||||||||||
| (In millions) | 2014 | 2013 | 2012 | |||||||||
| Net income (loss) | $ | (114.8 | ) | 81.1 | 109.7 | |||||||
| Benefit plan adjustments: | ||||||||||||
| Benefit plan experience gains (losses) | (134.3 | ) | 265.0 | 27.3 | ||||||||
| Benefit plan prior service (costs) credits | (2.9 | ) | 63.0 | (5.8 | ) | |||||||
| Deferred profit sharing | 0.3 | (0.3 | ) | 0.5 | ||||||||
| Total benefit plan adjustments | (136.9 | ) | 327.7 | 22.0 | ||||||||
| Foreign currency translation adjustments | (87.0 | ) | (32.8 | ) | 3.4 | |||||||
| Unrealized net gains (losses) on available-for-sale securities | (0.4 | ) | 0.1 | (2.1 | ) | |||||||
| Gains (loss) on cash flow hedges | (0.2 | ) | 0.6 | - | ||||||||
| Other comprehensive income (loss) before tax | (224.5 | ) | 295.6 | 23.3 | ||||||||
| Provision (benefit) for income taxes | (43.0 | ) | 141.0 | 9.3 | ||||||||
| Other comprehensive income (loss) | (181.5 | ) | 154.6 | 14.0 | ||||||||
| Comprehensive income (loss) | (296.3 | ) | 235.7 | 123.7 | ||||||||
| Less comprehensive income (loss) attributable to noncontrolling interests | (37.7 | ) | 22.5 | 20.3 | ||||||||
| Comprehensive income (loss) attributable to Brink’s | $ | (258.6 | ) | 213.2 | 103.4 | |||||||
| See accompanying notes to consolidated financial statements. | ||||||||||||
| Years Ended December 31, | |||||||||||
| (In millions) | 2013 | 2012 | 2011 | ||||||||
| Net income | $ | 81.1 | 109.7 | 98.5 | |||||||
| Benefit plan adjustments: | |||||||||||
| Benefit plan experience gains (losses) during the year | 265.0 | 27.3 | (205.1) | ||||||||
| Benefit plan prior service (costs) credits | 63.0 | (5.8) | 3.5 | ||||||||
| Deferred profit sharing | (0.3) | 0.5 | 0.4 | ||||||||
| Total benefit plan adjustments | 327.7 | 22.0 | (201.2) | ||||||||
| Foreign currency translation adjustments | (32.8) | 3.4 | (50.5) | ||||||||
| Unrealized net gains (losses) on available-for-sale securities | 0.1 | (2.1) | (2.3) | ||||||||
| Gains on cash flow hedges | 0.6 | - | - | ||||||||
| Other comprehensive income (loss) before tax | 295.6 | 23.3 | (254.0) | ||||||||
| Provision (benefit) for income taxes | 141.0 | 9.3 | (74.4) | ||||||||
| Other comprehensive income (loss) | 154.6 | 14.0 | (179.6) | ||||||||
| Comprehensive income (loss) | 235.7 | 123.7 | (81.1) | ||||||||
| Less comprehensive income (loss) attributable to noncontrolling interests | 22.5 | 20.3 | 22.0 | ||||||||
| Comprehensive income (loss) attributable to Brink’s | $ | 213.2 | 103.4 | (103.1) | |||||||
| See accompanying notes to consolidated financial statements. | |||||||||||
THE BRINK’S COMPANY
and subsidiaries
Consolidated Statements of Equity
Years Ended December 31, 2014, 2013 2012 and 20112012
| Capital | Accumulated | Attributable | ||||||||||||||||
| in Excess | Other | to | ||||||||||||||||
| Common | of Par | Retained | Comprehensive | Noncontrolling | ||||||||||||||
| (In millions) | Shares | Stock | Value | Earnings | Loss | Interests | Total | |||||||||||
| Balance as of December 31, 2010 | 46.4 | 46.4 | 542.6 | 537.5 | (610.3) | 66.9 | 583.1 | |||||||||||
| Net income | - | - | - | 74.5 | - | 24.0 | 98.5 | |||||||||||
| Other comprehensive loss | - | - | - | - | (177.6) | (2.0) | (179.6) | |||||||||||
| Dividends to: | ||||||||||||||||||
| Brink’s common shareholders ($0.40 per share) | - | - | - | (18.7) | - | - | (18.7) | |||||||||||
| Noncontrolling interests | - | - | - | - | - | (16.1) | (16.1) | |||||||||||
| Share-based compensation: | ||||||||||||||||||
| Stock options and awards: | ||||||||||||||||||
| Compensation expense | - | - | 6.2 | - | - | - | 6.2 | |||||||||||
| Consideration from exercise of stock options | 0.6 | 0.6 | 11.1 | - | - | - | 11.7 | |||||||||||
| Excess tax benefit of stock compensation | - | - | 1.1 | - | - | - | 1.1 | |||||||||||
| Other share-based benefit programs | (0.1) | (0.1) | (1.5) | (3.8) | - | - | (5.4) | |||||||||||
| Business acquisitions | - | - | - | - | - | 0.8 | 0.8 | |||||||||||
| Capital contributions from noncontrolling interest | - | - | - | - | - | 0.8 | 0.8 | |||||||||||
| Balance as of December 31, 2011 | 46.9 | 46.9 | 559.5 | 589.5 | (787.9) | 74.4 | 482.4 | |||||||||||
| Net income | - | - | - | 88.9 | - | 20.8 | 109.7 | |||||||||||
| Other comprehensive income (loss) | - | - | - | - | 14.5 | (0.5) | 14.0 | |||||||||||
| Shares contributed to pension plan (see note 17) | 0.4 | 0.4 | 8.6 | - | - | - | 9.0 | |||||||||||
| Dividends to: | ||||||||||||||||||
| Brink’s common shareholders ($0.40 per share) | - | - | - | (19.0) | - | - | (19.0) | |||||||||||
| Noncontrolling interests | - | - | - | - | - | (13.0) | (13.0) | |||||||||||
| Share-based compensation: | ||||||||||||||||||
| Stock options and awards: | ||||||||||||||||||
| Compensation expense | - | - | 8.0 | - | - | - | 8.0 | |||||||||||
| Consideration from exercise of stock options | - | - | 1.4 | - | - | - | 1.4 | |||||||||||
| Reduction in excess tax benefit of stock compensation | - | - | (2.7) | - | - | - | (2.7) | |||||||||||
| Other share-based benefit programs | 0.5 | 0.5 | (3.7) | (0.3) | - | - | (3.5) | |||||||||||
| Acquisitions of noncontrolling interests | - | - | (2.8) | - | - | (7.3) | (10.1) | |||||||||||
| Capital contributions from noncontrolling interest | - | - | - | - | - | 0.6 | 0.6 | |||||||||||
| Balance as of December 31, 2012 | 47.8 | 47.8 | 568.3 | 659.1 | (773.4) | 75.0 | 576.8 | |||||||||||
| Net income | - | - | - | 56.8 | - | 24.3 | 81.1 | |||||||||||
| Other comprehensive income (loss) ) | - | - | - | - | 156.4 | (1.8) | 154.6 | |||||||||||
| Dividends to: | ||||||||||||||||||
| Brink’s common shareholders ($0.40 per share) | - | - | - | (19.2) | - | - | (19.2) | |||||||||||
| Noncontrolling interests | - | - | - | - | - | (6.0) | (6.0) | |||||||||||
| Share-based compensation: | ||||||||||||||||||
| Stock options and awards: | ||||||||||||||||||
| Compensation expense | - | - | 9.9 | - | - | - | 9.9 | |||||||||||
| Consideration from exercise of stock options | 0.3 | 0.3 | 6.4 | - | - | - | 6.7 | |||||||||||
| Reduction in excess tax benefit of stock compensation | - | - | (2.8) | - | - | - | (2.8) | |||||||||||
| Other share-based benefit programs | 0.3 | 0.3 | (3.6) | (0.3) | - | - | (3.6) | |||||||||||
| Acquisitions of noncontrolling interests | - | - | (11.8) | - | (0.3) | (6.4) | (18.5) | |||||||||||
| Capital contributions from noncontrolling interest | - | - | - | - | - | 0.5 | 0.5 | |||||||||||
| Balance as of December 31, 2013 | 48.4 | $ | 48.4 | 566.4 | 696.4 | (617.3) | 85.6 | 779.5 | ||||||||||
| See accompanying notes to consolidated financial statements. | ||||||||||||||||||
| Capital | Accumulated | Attributable | |||||||||||||||
| in Excess | Other | to | |||||||||||||||
| Common | of Par | Retained | Comprehensive | Noncontrolling | |||||||||||||
| (In millions) | Shares | Stock | Value | Earnings | Loss | Interests | Total | ||||||||||
| Balance as of December 31, 2011 | 46.9 | 46.9 | 559.5 | 589.5 | (787.9) | 74.4 | 482.4 | ||||||||||
| Net income | - | - | - | 88.9 | - | 20.8 | 109.7 | ||||||||||
| Other comprehensive income (loss) | - | - | - | - | 14.5 | (0.5) | 14.0 | ||||||||||
| Shares contributed to pension plan (see note 18) | 0.4 | 0.4 | 8.6 | - | - | - | 9.0 | ||||||||||
| Dividends to: | |||||||||||||||||
| Brink’s common shareholders ($0.40 per share) | - | - | - | (19.0) | - | - | (19.0) | ||||||||||
| Noncontrolling interests | - | - | - | - | - | (13.0) | (13.0) | ||||||||||
| Share-based compensation: | |||||||||||||||||
| Stock options and awards: | |||||||||||||||||
| Compensation expense | - | - | 8.0 | - | - | - | 8.0 | ||||||||||
| Consideration from exercise of stock options | - | - | 1.4 | - | - | - | 1.4 | ||||||||||
| Reduction in excess tax benefit of stock compensation | - | - | (2.7) | - | - | - | (2.7) | ||||||||||
| Other share-based benefit programs | 0.5 | 0.5 | (3.7) | (0.3) | - | - | (3.5) | ||||||||||
| Acquisitions of noncontrolling interests | - | - | (2.8) | - | - | (7.3) | (10.1) | ||||||||||
| Capital contributions from noncontrolling interest | - | - | - | - | - | 0.6 | 0.6 | ||||||||||
| Balance as of December 31, 2012 | 47.8 | 47.8 | 568.3 | 659.1 | (773.4) | 75.0 | 576.8 | ||||||||||
| Net income | - | - | - | 56.8 | - | 24.3 | 81.1 | ||||||||||
| Other comprehensive income (loss) | - | - | - | - | 156.4 | (1.8) | 154.6 | ||||||||||
| Dividends to: | |||||||||||||||||
| Brink’s common shareholders ($0.40 per share) | - | - | - | (19.2) | - | - | (19.2) | ||||||||||
| Noncontrolling interests | - | - | - | - | - | (6.0) | (6.0) | ||||||||||
| Share-based compensation: | |||||||||||||||||
| Stock options and awards: | |||||||||||||||||
| Compensation expense | - | - | 9.9 | - | - | - | 9.9 | ||||||||||
| Consideration from exercise of stock options | 0.3 | 0.3 | 6.4 | - | - | - | 6.7 | ||||||||||
| Reduction in excess tax benefit of stock compensation | - | - | (2.8) | - | - | - | (2.8) | ||||||||||
| Other share-based benefit programs | 0.3 | 0.3 | (3.6) | (0.3) | - | - | (3.6) | ||||||||||
| Acquisitions of noncontrolling interests | - | - | (11.8) | - | (0.3) | (6.4) | (18.5) | ||||||||||
| Capital contributions from noncontrolling interest | - | - | - | - | - | 0.5 | 0.5 | ||||||||||
| Balance as of December 31, 2013 | 48.4 | 48.4 | 566.4 | 696.4 | (617.3) | 85.6 | 779.5 | ||||||||||
| Net loss | - | - | - | (83.9) | - | (30.9) | (114.8) | ||||||||||
| Other comprehensive loss | - | - | - | - | (174.7) | (6.8) | (181.5) | ||||||||||
| Dividends to: | |||||||||||||||||
| Brink’s common shareholders ($0.40 per share) | - | - | - | (19.4) | - | - | (19.4) | ||||||||||
| Noncontrolling interests | - | - | - | - | - | (8.6) | (8.6) | ||||||||||
| Share-based compensation: | |||||||||||||||||
| Stock options and awards: | |||||||||||||||||
| Compensation expense | - | - | 17.3 | - | - | - | 17.3 | ||||||||||
| Consideration from exercise of stock options | - | - | 0.4 | - | - | - | 0.4 | ||||||||||
| Reduction in excess tax benefit of stock compensation | - | - | (0.6) | - | - | - | (0.6) | ||||||||||
| Other share-based benefit programs | 0.2 | 0.2 | 1.0 | (0.2) | - | - | 1.0 | ||||||||||
| Capital contributions from noncontrolling interest | - | - | - | - | - | 0.5 | 0.5 | ||||||||||
| Balance as of December 31, 2014 | 48.6 | $ | 48.6 | 584.5 | 592.9 | (792.0) | 39.8 | 473.8 | |||||||||
| See accompanying notes to consolidated financial statements. | |||||||||||||||||
THE BRINK’S COMPANY
and subsidiaries
Consolidated Statements of Cash Flows
| Years Ended December 31, | ||||||||||||
| (In millions) | 2014 | 2013 | 2012 | |||||||||
| Cash flows from operating activities: | ||||||||||||
| Net income (loss) | $ | (114.8 | ) | 81.1 | 109.7 | |||||||
| Adjustments to reconcile net income (loss) to net cash provided by operating activities: | ||||||||||||
| Loss from discontinued operations, net of tax | 29.1 | 9.2 | 13.4 | |||||||||
| Depreciation and amortization | 161.9 | 165.8 | 148.4 | |||||||||
| Share-based compensation expense | 17.3 | 9.9 | 8.0 | |||||||||
| Deferred income taxes | (28.4 | ) | (34.6 | ) | (43.5 | ) | ||||||
| Gains and losses: | ||||||||||||
| Available-for-sale securities | (0.4 | ) | (0.4 | ) | (2.9 | ) | ||||||
| Property and other assets | (44.9 | ) | (2.4 | ) | (7.6 | ) | ||||||
| Business acquisitions and dispositions | - | (2.8 | ) | (0.8 | ) | |||||||
| Impairment losses | 3.3 | 2.9 | 2.4 | |||||||||
| Retirement benefit funding (more) less than expense: | ||||||||||||
| Pension | (23.6 | ) | 11.3 | (1.9 | ) | |||||||
| Other than pension | 1.5 | 15.0 | 22.3 | |||||||||
| Remeasurement losses due to Venezuela currency devaluations | 121.6 | 13.4 | - | |||||||||
| Other operating | 7.6 | 2.3 | 11.7 | |||||||||
| Changes in operating assets and liabilities, net of effects of acquisitions: | ||||||||||||
| Accounts receivable and income taxes receivable | (90.7 | ) | (69.7 | ) | (70.6 | ) | ||||||
| Accounts payable, income taxes payable and accrued liabilities | 105.5 | 23.6 | 15.7 | |||||||||
| Customer obligations | 15.4 | (9.7 | ) | 13.9 | ||||||||
| Prepaid and other current assets | (9.9 | ) | (19.4 | ) | 3.9 | |||||||
| Other | (14.7 | ) | (11.0 | ) | 7.5 | |||||||
| Discontinued operations | 5.5 | 17.0 | 20.9 | |||||||||
| Net cash provided by operating activities | 141.3 | 201.5 | 250.5 | |||||||||
| Cash flows from investing activities: | ||||||||||||
| Capital expenditures | (136.1 | ) | (172.9 | ) | (170.9 | ) | ||||||
| Acquisitions | (4.6 | ) | (18.1 | ) | (17.2 | ) | ||||||
| Sales of available-for-sale securities | 0.9 | 9.9 | 15.4 | |||||||||
| Sales of other investments and property | 62.7 | 5.9 | 12.5 | |||||||||
| Redemption of cash-surrender value of life insurance policies | - | - | 6.2 | |||||||||
| Other | (3.6 | ) | (0.5 | ) | 4.9 | |||||||
| Discontinued operations | (13.3 | ) | 52.7 | (18.2 | ) | |||||||
| Net cash used by investing activities | (94.0 | ) | (123.0 | ) | (167.3 | ) | ||||||
| Cash flows from financing activities: | ||||||||||||
| Borrowings (repayments) of debt: | ||||||||||||
| Short-term debt | (7.8 | ) | 60.5 | 3.3 | ||||||||
| Long-term revolving credit facilities | 115.0 | 13.8 | (4.5 | ) | ||||||||
| Other long-term debt: | ||||||||||||
| Borrowings | 7.5 | 3.8 | 9.7 | |||||||||
| Repayments | (81.0 | ) | (27.3 | ) | (29.7 | ) | ||||||
| Acquisition of a noncontrolling interest in a subsidiary | - | (18.5 | ) | (9.4 | ) | |||||||
| Payment of acquisition-related obligation | - | (12.8 | ) | - | ||||||||
| Dividends to: | ||||||||||||
| Shareholders of Brink’s | (19.4 | ) | (19.2 | ) | (19.0 | ) | ||||||
| Noncontrolling interests in subsidiaries | (8.6 | ) | (6.0 | ) | (13.0 | ) | ||||||
| Proceeds from exercise of stock options | 0.4 | 6.7 | 1.4 | |||||||||
| Minimum tax withholdings associated with share-based compensation | (1.2 | ) | (3.5 | ) | (5.6 | ) | ||||||
| Other | (1.6 | ) | (1.0 | ) | (1.0 | ) | ||||||
| Discontinued operations | - | (2.5 | ) | (0.2 | ) | |||||||
| Net cash used by financing activities | 3.3 | (6.0 | ) | (68.0 | ) | |||||||
| Effect of exchange rate changes on cash and cash equivalents | (129.9 | ) | (18.7 | ) | 3.6 | |||||||
| Cash and cash equivalents: | ||||||||||||
| Increase (decrease) | (79.3 | ) | 53.8 | 18.8 | ||||||||
| Balance at beginning of period | 255.5 | 201.7 | 182.9 | |||||||||
| Balance at end of period | $ | 176.2 | 255.5 | 201.7 | ||||||||
| See accompanying notes to consolidated financial statements. | ||||||||||||
| Years Ended December 31, | |||||||||||
| (In millions) | 2013 | 2012 | 2011 | ||||||||
| Cash flows from operating activities: | |||||||||||
| Net income | $ | 81.1 | 109.7 | 98.5 | |||||||
| Adjustments to reconcile net income to net cash provided by operating activities: | |||||||||||
| Loss from discontinued operations, net of tax | 15.1 | 22.3 | 25.8 | ||||||||
| Depreciation and amortization | 173.6 | 155.7 | 148.1 | ||||||||
| Share-based compensation expense | 9.9 | 8.0 | 6.2 | ||||||||
| Deferred income taxes | (34.6) | (43.4) | (30.7) | ||||||||
| Gains and losses: | |||||||||||
| Sales of available-for-sale securities | (0.4) | (2.9) | (4.4) | ||||||||
| Sales of property and other assets | (2.4) | (7.6) | (7.9) | ||||||||
| Business acquisitions and dispositions | (2.8) | (0.8) | (0.4) | ||||||||
| Bargain purchase gain | - | - | (2.1) | ||||||||
| Impairment losses | 2.9 | 2.4 | 2.4 | ||||||||
| Retirement benefit funding (more) less than expense: | |||||||||||
| Pension | 7.0 | (5.4) | 4.6 | ||||||||
| Other than pension | 15.0 | 22.3 | 11.6 | ||||||||
| Loss on Venezuela currency devaluation | 13.4 | - | - | ||||||||
| Other operating | 2.4 | 11.7 | 10.1 | ||||||||
| Changes in operating assets and liabilities, net of effects of acquisitions: | |||||||||||
| Accounts receivable | (73.3) | (71.8) | (53.0) | ||||||||
| Accounts payable, income taxes payable and accrued liabilities | 31.4 | 23.0 | 58.1 | ||||||||
| Customer obligations | (9.8) | 15.7 | (11.7) | ||||||||
| Prepaid and other current assets | (22.2) | 6.8 | (14.2) | ||||||||
| Other | (10.2) | 9.7 | 9.4 | ||||||||
| Discontinued operations | 5.4 | (4.9) | (3.4) | ||||||||
| Net cash provided by operating activities | 201.5 | 250.5 | 247.0 | ||||||||
| Cash flows from investing activities: | |||||||||||
| Capital expenditures | (177.7) | (177.9) | (183.7) | ||||||||
| Acquisitions | (18.1) | (17.2) | (3.0) | ||||||||
| Available-for-sale securities: | |||||||||||
| Purchases | - | - | (0.5) | ||||||||
| Sales | 9.9 | 15.4 | 12.9 | ||||||||
| Cash proceeds from sale of property and equipment | 5.9 | 12.5 | 13.9 | ||||||||
| Redemption of cash-surrender value of life insurance policies | - | 6.2 | - | ||||||||
| Other | (0.5) | 4.9 | 0.6 | ||||||||
| Discontinued operations | 57.5 | (11.2) | (12.0) | ||||||||
| Net cash used by investing activities | (123.0) | (167.3) | (171.8) | ||||||||
| Cash flows from financing activities: | |||||||||||
| Borrowings (repayments) of debt: | |||||||||||
| Short-term debt | 60.5 | 3.3 | (7.2) | ||||||||
| Long-term revolving credit facilities | 13.8 | (4.5) | (107.0) | ||||||||
| Issuance of private placement notes | - | - | 100.0 | ||||||||
| Other long-term debt: | |||||||||||
| Borrowings | 3.8 | 9.7 | - | ||||||||
| Repayments | (27.3) | (29.7) | (29.3) | ||||||||
| Cash proceeds from sale-leaseback transactions | - | - | 17.6 | ||||||||
| Acquisition of a noncontrolling interest in a subsidiary | (18.5) | (9.4) | - | ||||||||
| Payment of acquisition-related obligation | (12.8) | - | - | ||||||||
| Debt financing costs | (0.1) | (1.5) | (0.6) | ||||||||
| Dividends to: | |||||||||||
| Shareholders of Brink’s | (19.2) | (19.0) | (18.7) | ||||||||
| Noncontrolling interests in subsidiaries | (6.0) | (13.0) | (16.1) | ||||||||
| Proceeds from exercise of stock options | 6.7 | 1.4 | 5.9 | ||||||||
| Minimum tax withholdings associated with share-based compensation | (3.5) | (5.6) | (2.7) | ||||||||
| Other | (0.9) | 0.5 | 1.1 | ||||||||
| Discontinued operations | (2.5) | (0.2) | (10.2) | ||||||||
| Net cash used by financing activities | (6.0) | (68.0) | (67.2) | ||||||||
| Effect of exchange rate changes on cash and cash equivalents | (18.7) | 3.6 | (8.1) | ||||||||
| Cash and cash equivalents: | |||||||||||
| Increase (decrease) | 53.8 | 18.8 | (0.1) | ||||||||
| Balance at beginning of period | 201.7 | 182.9 | 183.0 | ||||||||
| Balance at end of period | $ | 255.5 | 201.7 | 182.9 | |||||||
| See accompanying notes to consolidated financial statements. | |||||||||||
THE BRINK’S COMPANY
and subsidiaries
Accounting AdjustmentsPolicy
Our accounting policy for foreign currency translation is different depending on whether the economy in which our foreign subsidiary operates has been designated as highly inflationary. Economies with a three-year cumulative inflation rate of more than 100% are considered highly inflationary. Subsequent reductions in cumulative inflation rates below 100% do not change the method of translation unless the reduction is deemed to be other than temporary.
Non-Highly Inflationary Economies
Assets and liabilities of foreign subsidiaries in non-highly inflationary economies are translated into U.S. dollars using rates of exchange at the balance sheet date. Translation adjustments are recorded in other comprehensive income (loss). Revenues and expenses are translated at rates of exchange in effect during the year. Transaction gains and losses are recorded in net income (loss).
Highly Inflationary Economies
Foreign subsidiaries that operate in highly inflationary countries must use the reporting currency (the U.S. dollar) as the functional currency. Local-currency monetary assets and liabilities are remeasured into dollars each balance sheet date, with remeasurement adjustments and other transaction gains and losses recognized in earnings. Non-monetary assets and liabilities do not fluctuate with changes in local currency exchange rates to the dollar.
Application of Accounting adjustments that correct earnings reportedPolicy
Venezuela
Brink’s Venezuela accounted for previous years have been included$212 million or 6% of total Brink’s revenues and was a significant component of 2014 total operating profit before items not allocated to segments. At December 31, 2014, we had investments in our 2011 earnings. The adjustments decreased income from continuingVenezuelan operations in 2011 by $7.8of $59.6 million after tax. Prior years’ financial results have not been restated because the amounts are not material. The adjustments did not affect earnings trends for the consolidated financial statementson an equity-method basis. At December 31, 2014, we had bolivar denominated net monetary assets of $23.5 million, including our operating segments. Cash flows were not affected by these accounting corrections.
The cash is generally credited to customers’ accounts the following day and we do not consider it as available for general corporate purposeseconomy in Venezuela has had significant inflation in the management oflast several years. We consolidate our liquidity and capital resources. We record a liabilityVenezuelan results using our accounting policy for the amounts owed to customers (see note 11).subsidiaries operating in highly inflationary economies.
The government devalued the official rate for essential services in February 2013 from 5.3 to 6.3 bolivars to the dollar.
Late in 2013, the government added another official exchange process, known as SICAD, for travel and certain other purposes, made available at government discretion. The published rate for this process in 2014 ranged from 10 to 12 bolivars to the invoiced amount and do not bear interest. The allowance for doubtful accounts is our best estimateU.S. dollar. Since the end of the amount of probable credit losses on our existing accounts receivable. We determine the allowance based on historical write-off experience. We review our allowance for doubtful accounts quarterly. Account balances are charged off against the allowance after all means of collection have been exhausted and the potential for recovery is considered remote.first
In February 2015, the government replaced the SICAD II process with a new process, known locally as SIMADI. The rates published in mid February 2015 ranged from 170 to 174 bolivars to the U.S. dollar.
As a result of the present value ofrestrictions on currency exchange, we have in the related lease paymentspast been unable to obtain sufficient U.S. dollars to purchase certain imported supplies and fixed assets to fully operate our business in Venezuela. Consequently, we have occasionally purchased more expensive, bolivar-denominated supplies and fixed assets. Furthermore, there is a risk that the SIMADI process will be discontinued or not accessible when needed in the fair value of the leased asset at the inception of the lease. Amortization is calculated on the straight-line method based on the lease term.future, which may prevent us from repatriating dividends or obtaining dollars to operate our Venezuelan operations.
Remeasurement rates during 2014. Through March 23, 2014, we used the official rate of 6.3 bolivars to the dollar to remeasure our bolivar denominated monetary assets and amortized overliabilities into U.S. dollars and to translate our revenues and expenses. Effective March 24, 2014, we began to use the estimated useful lifeexchange rate published for the SICAD II process to remeasure bolivar denominated monetary assets and liabilities and to translate our revenues and expenses. We recognized a $121.6 million net remeasurement loss in 2014 when we changed from the official rate of 6.3 to the software. Costs that are capitalized include external direct costsSICAD II exchange rate, which averaged approximately 50 since opening on March 24, 2014 until implementation of materialsa new exchange process in February 2015 (SIMADI). Transaction gains and serviceslosses since March 31, 2014 have not been significant. At December 31, 2014, the rate was approximately 50. The after-tax effect of these losses attributable to develop or obtainnoncontrolling interests was $39.7 million in 2014.
Remeasuring our Venezuelan results using the software, and internal costs, including compensation and employee benefits for employees directly associated with a software development project.
SICAD II rate has had the following effects on our reported results:
| · |
| · |
| · | Our investment in our Venezuelan operations on an equity-method basis has declined. Our investment was $125.3 million at December 31, 2013, and $59.6 million at December 31, 2014. |
| · | |||
| cash equivalents) at December 31, 2013, and $23.5 million (including $12.6 million of cash and cash equivalents) at December 31, 2014. |
RECENT ACCOUNTING PRONOUNCEMENTS
In May 2014, the Financial Accounting Standards Board (“FASB”) issued a new standard related to revenue recognition, which requires an entity to recognize the amount of revenue to which it expects to be entitled for the transfer of promised goods or services to customers. The new standard will replace most of the assetexisting revenue recognition standards in U.S. GAAP when it becomes effective on January 1, 2017. Early adoption is not permitted. The new standard can be applied retrospectively to each prior reporting period presented or if applicable,retrospectively with the lease term.
ITEM 7A. QUANTITATIVE AND QUALITATIVE DISCLOSURES ABOUT MARKET RISK
We account for retirement benefit obligations under FASB ASC Topic 715, Compensation – Retirement Benefits. For U.S.currently serve customers in more than 100 countries, including 41 countries where we operate subsidiaries. These operations expose us to a variety of market risks, including the effects of changes in interest rates, commodity prices and certain non-U.S. retirement plans, we derive the discount rates used to measure the present valueforeign currency exchange rates. These financial and commodity exposures are monitored and managed by us as an integral part of benefit obligations using the cash flow matching method. Under this method, we compare the plan’s projected payment obligations by year with the corresponding yields on a Mercer yield curve. Each year’s projected cash flows are then discounted back to their present value at the measurement date and anour overall discount rate is determined. The overall discount rate is then rounded to the nearest tenth of a percentage point. In non-U.S. locations where the cash flow matching method is not possible, rates of local high-quality long-term corporate bonds are used to select the discount rate. risk management program.
We periodically use various derivative and non-derivative financial instruments, as discussed below, to hedge our interest rate, commodity prices and foreign currency exposures when appropriate. The risk that counterparties to these instruments may be unable to perform is minimized by limiting the counterparties used Mercer’s Above-Mean Curve to determinemajor financial institutions with investment grade credit ratings. We do not expect to incur a loss from the discount ratesfailure of any counterparty to perform under the agreements. We do not use derivative financial instruments for purposes other than hedging underlying financial or commercial exposures.
The sensitivity analyses discussed below for the year-end benefit obligationmarket risk exposures were based on the facts and circumstances in both 2013effect at December 31, 2014. Actual results will be determined by a number of factors that are not under management’s control and 2012. We used the Regular Mercer Yield Curve in 2011 to determine the discount rates for the benefit obligation. could vary materially from those disclosed.
Interest Rate Risk
We selectuse both fixed and floating rate debt and leases to finance our operations. Floating rate obligations, including our Revolving Facility, expose us to fluctuations in cash flows due to changes in the expectedgeneral level of interest rates. Fixed rate obligations, including our unsecured notes, are subject to fluctuations in fair values as a result of changes in interest rates.
Based on the contractual interest rates on the floating rate debt at December 31, 2014, a hypothetical 10% increase in rates would increase cash outflows by approximately $0.9 million over a twelve-month period. In other words, our weighted average interest rate on our floating rate instruments was 2.7% per annum at December 31, 2014. If that average rate were to increase by 0.3 percentage points to 3.0%, the cash outflows associated with these instruments would increase by $0.9 million annually. The effect on the fair values on our unsecured notes for a hypothetical 10% decrease in the yield curve from year-end 2014 levels would result in a $1.7 million increase for our unsecured notes in the fair values of the debt.
58
Foreign Currency Risk
We have exposure to the effects of foreign currency exchange rate fluctuations on the results of all of our foreign operations. Our foreign operations generally use local currencies to conduct business but their results are reported in U.S. dollars.
We are also exposed periodically to the foreign currency rate fluctuations that affect transactions not denominated in the functional currency of domestic and foreign operations. To mitigate these exposures, we, from time to time, enter into foreign currency forward and swap contracts. At December 31, 2014, the notional value of our shorter term outstanding foreign currency contracts was $43.0 million with average contract maturities of approximately one month. These shorter term foreign currency contracts primarily offset exposures in the Mexican peso and the euro. Additionally, these shorter term contracts are not designated as hedges for accounting purposes, and accordingly, changes in their fair value are recorded immediately in earnings. We also have a longer term cross currency swap contract to hedge exposure in the Brazilian real which is designated as a cash flow hedge for accounting purposes. At December 31, 2014, the notional value of that longer term contract was $20.8 million with a weighted average maturity of 1.6 years. We do not use derivative financial instruments to hedge investments in foreign subsidiaries since such investments are long-term in nature.
The effects of a hypothetical simultaneous 10% appreciation in the U.S. dollar from the 2014 levels against all other currencies of countries in which we have continuing operations are as follows:
| Hypothetical Effects | ||||||||||||
| Increase/ (decrease) | ||||||||||||
| (In millions) | Venezuela | Other countries | Total | |||||||||
| Effect on Earnings: | ||||||||||||
| Translation of 2014 earnings into U.S. dollars | $ | (1.9 | ) | (12.0 | ) | (13.9 | ) | |||||
| Transaction gains (losses) | (2.3 | ) | - | (2.3 | ) | |||||||
| Effect on Other Comprehensive Income (Loss): | ||||||||||||
| Translation of net assets of foreign subsidiaries | - | (63.4 | ) | (63.4 | ) | |||||||
The hypothetical foreign currency effects above detail the consolidated effect attributable to Brink’s of a simultaneous change in the value of a large number of foreign currencies relative to the U. S. dollar. The foreign currency exposure effect related to a change in an individual currency could be significantly different.
Venezuela
Brink’s Venezuela accounted for $212 million or 6% of total Brink’s revenues and was a significant component of 2014 total operating profit before items not allocated to segments. Venezuela operates in a highly inflationary economy.
In February 2015, the government replaced the SICAD II process with a new process, known locally as SIMADI. The SIMADI rate has ranged from 170 to 174 bolivars to the dollar between February 12 and February 26. Had we used a rate of return assumption for170, our U.S. pension planrevenues in 2014 would have declined by $183 million and retiree medical plans using advice from anour operating profit before items not allocated to segments would have declined by $39 million. Had a rate of 170 been in effect at December 31, 2014, we would have recognized additional currency losses to write down our net monetary assets of $16 million.
The investment advisorin our Venezuelan subsidiaries, and an actuary. The selected rate considers plan asset allocation targets, expected overall investment manager performancecash and long-term historical average compounded rates of return.other net monetary assets held by these subsidiaries are as follows:
| December 31, | ||||||||
| (In millions) | 2014 | 2013 | ||||||
Equity-method investment in Venezuelan subsidiaries(a) | $ | 59.6 | 125.3 | |||||
| Net monetary assets held by our Venezuelan subsidiaries | ||||||||
| Cash and short-term investments denominated in U.S. dollars | $ | 1.1 | 0.5 | |||||
| Net monetary assets denominated in bolivars: | ||||||||
| Cash and cash equivalents | $ | 12.6 | 93.8 | |||||
| Accounts receivable, accounts payable and other, net | 10.9 | 26.6 | ||||||
| Total | $ | 23.5 | 120.4 | |||||
| (a) | The amount represents retained earnings net of currency translation adjustments of the business. |
59
ITEM 8. FINANCIAL STATEMENTS AND SUPPLEMENTARY DATA
THE BRINK’S COMPANY
CONSOLIDATED FINANCIAL STATEMENTS
FOR THE YEAR ENDED DECEMBER 31, 2014
TABLE OF CONTENTS
| Page | ||
| MANAGEMENT’S ANNUAL REPORT ON INTERNAL CONTROL OVER FINANCIAL REPORTING | 61 | |
| REPORTS OF INDEPENDENT REGISTERED PUBLIC ACCOUNTING FIRM | 62 | |
| CONSOLIDATED FINANCIAL STATEMENTS | ||
| Consolidated Balance Sheets | 64 | |
| Consolidated Statements of Income (Loss) | 65 | |
| Consolidated Statements of Comprehensive Income (Loss) | 66 | |
| Consolidated Statements of Equity | 67 | |
| Consolidated Statements of Cash Flows | 68 | |
| NOTES TO CONSOLIDATED FINANCIAL STATEMENTS | ||
| Note 1 – Summary of Significant Accounting Policies | 69 | |
| Note 2 – Segment Information | 74 | |
| Note 3 – Retirement Benefits | 79 | |
| Note 4 – Income Taxes | 88 | |
| Note 5 – Property and Equipment | 91 | |
| Note 6 – Acquisitions | 91 | |
| Note 7 – Goodwill and Other Intangible Assets | 92 | |
| Note 8 – Prepaid Expenses and Other | 93 | |
| Note 9 – Other Assets | 93 | |
| Note 10 – Accumulated Other Comprehensives Income (Loss) | 94 | |
| Note 11 – Fair Value of Financial Instruments | 96 | |
| Note 12 – Accrued Liabilities | 96 | |
| Note 13 – Other Liabilities | 97 | |
| Note 14 – Long-Term Debt | 97 | |
| Note 15 – Accounts Receivable | 99 | |
| Note 16 – Operating Leases | 99 | |
| Note 17 – Share-Based Compensation Plans | 100 | |
| Note 18 – Capital Stock | 106 | |
| Note 19 – Loss from Discontinued Operations | 107 | |
| Note 20 – Supplemental Cash Flow Information | 109 | |
| Note 21 – Other Operating Income (Expense) | 109 | |
| Note 22 – Interest and Other Nonoperating Income (Expense) | 109 | |
| Note 23 – Other Commitments and Contingencies | 110 | |
| Note 24 – 2014 Reorganization and Restructuring | 110 | |
| Note 25 – Selected Quarterly Financial Data (unaudited) | 111 | |
60
MANAGEMENT’S ANNUAL REPORT ON INTERNAL CONTROL OVER FINANCIAL REPORTING
Management of the greaterCompany is responsible for establishing and maintaining adequate internal control over financial reporting as defined in Rule 13a-15(f) under the Securities Exchange Act of a plan’s benefit obligation1934. Our internal control over financial reporting is designed to provide reasonable assurance to our management and board of directors regarding the preparation and fair presentation of published financial statements.
Because of its inherent limitations, internal control over financial reporting may not prevent or plan assets atdetect misstatements. Therefore, even those systems determined to be effective can provide only reasonable assurance with respect to financial statement preparation and presentation.
Management assessed the beginningeffectiveness of our internal control over financial reporting as of December 31, 2014. In making this assessment, management used the criteria set forth by the Committee of Sponsoring Organizations of the year are amortized into earnings from other comprehensive income (loss) on a straight-line basis. The amortization period for pension plans is the average remaining service period of employees expected to receive benefits under the plans. The amortization period for other retirement plans is primarily the average remaining life expectancy of inactive participants.Treadway Commission (COSO) in “Internal Control – Integrated Framework (1992).”
KPMG LLP, the independent registered public accounting firm which audits our consolidated financial statements, has issued an attestation report of our internal control over financial reporting. KPMG’s attestation report appears on page 62.
In May 2013, COSO issued an updated framework which superseded the 1992 framework in December 2014. We intend to integrate the changes prescribed by the 2013 COSO Framework into management’s evaluation of the effectiveness of internal control over financial reporting during 2015.
61
Report of Independent Registered Public Accounting Firm
The Board of Directors and Stockholders
The Brink’s Company:
We have audited The Brink’s Company’s (the Company) internal control over financial reporting as of December 31, 2014, based on criteria established in Internal Control – Integrated Framework (1992) issued by the Committee of Sponsoring Organizations of the Treadway Commission (COSO). The Company’s management is responsible for maintaining effective internal control over financial reporting and for its assessment of the effectiveness of internal control over financial reporting, included in the accompanying Management’s Annual Report on Internal Control over Financial Reporting. Our responsibility is to express an opinion on the Company’s internal control over financial reporting based on our audit.
We conducted our audit in accordance with the standards of the Public Company Accounting Oversight Board (United States). Those standards require that we plan and perform the audit to obtain reasonable assurance about whether effective internal control over financial reporting was maintained in all material respects. Our audit included obtaining an understanding of internal control over financial reporting, assessing the risk that a material weakness exists, and testing and evaluating the design and operating effectiveness of internal control based on the assessed risk. Our audit also included performing such other procedures as we considered necessary in the circumstances. We believe that our audit provides a reasonable basis for our opinion.
A company’s internal control over financial reporting is a process designed to provide reasonable assurance regarding the reliability of financial reporting and the preparation of financial statements for external purposes in accordance with generally accepted accounting principles. A company’s internal control over financial reporting includes those policies and procedures that (1) pertain to the maintenance of records that, in reasonable detail, accurately and fairly reflect the transactions and dispositions of the assets of the company; (2) provide reasonable assurance that transactions are recorded as necessary to permit preparation of financial statements in accordance with generally accepted accounting principles, and that receipts and expenditures of the company are being made only in accordance with authorizations of management and directors of the company; and (3) provide reasonable assurance regarding prevention or timely detection of unauthorized acquisition, use, or disposition of the company’s assets that could have a material effect on the financial statementstatements.
Because of its inherent limitations, internal control over financial reporting may not prevent or detect misstatements. Also, projections of any evaluation of effectiveness to future periods are subject to the risk that controls may become inadequate because of changes in conditions, or that the degree of compliance with the policies or procedures may deteriorate.
In our opinion, The Brink’s Company maintained, in all material respects, effective internal control over financial reporting as of December 31, 2014, based on criteria established in Internal Control – Integrated Framework (1992) issued by the Committee of Sponsoring Organizations of the Treadway Commission (COSO).
We also have audited, in accordance with the standards of the Public Company Accounting Oversight Board (United States), the consolidated balance sheets of The Brink’s Company and tax basessubsidiaries as of assetsDecember 31, 2014 and liabilities using enacted tax rates2013, and the related consolidated statements of income (loss), comprehensive income (loss), equity, and cash flows for each of the years in effect for the year in which these items are expected to reverse. We recognize tax benefits related to uncertain tax positions if we believe it is more likely than not the benefit will be realized. We reviewthree-year period ended December 31, 2014, and our deferred tax assets to determine if it is more-likely-than-not that they will be realized. If we determine it is not more-likely-than-not that a deferred tax asset will be realized, we record a valuation allowance to reverse the previously recognized tax benefit.report dated March 5, 2015, expressed an unqualified opinion on those consolidated financial statements.
/s/ KPMG LLP
Richmond, Virginia
March 5, 2015
62
Report of Independent Registered Public Accounting Firm
The Board of Directors and Stockholders
The Brink’s Company:
We have audited the accompanying consolidated balance sheets of The Brink’s Company and subsidiaries as of December 31, 2014 and 2013, and the related consolidated statements of income (loss), comprehensive income (loss), equity, and cash flows for each of the years in the three-year period ended December 31, 2014. These consolidated financial statements are the responsibility of the Company’s management. Our responsibility is to express an opinion on these consolidated financial statements based on our audits.
We conducted our audits in accordance with the standards of the Public Company Accounting Oversight Board (United States). Those standards require that we plan and perform the audit to obtain reasonable assurance about whether the financial statements are free of material misstatement. An audit includes examining, on a test basis, evidence supporting the amounts and disclosures in the financial statements. An audit also includes assessing the accounting principles used and significant estimates made by management, as well as evaluating the overall financial statement presentation. We believe that our audits provide a reasonable basis for our opinion.
In our opinion, the consolidated financial statements referred to above present fairly, in all material respects, the financial position of The Brink’s Company and subsidiaries as of December 31, 2014 and 2013, and the results of their operations and their cash flows for each of the years in the three-year period ended December 31, 2014, in conformity with U.S. generally accepted accounting principles.
We also have audited, in accordance with the standards of the Public Company Accounting Oversight Board (United States), The Brink’s Company’s internal control over financial reporting as of December 31, 2014, based on criteria established in Internal Control – Integrated Framework (1992) issued by the Committee of Sponsoring Organizations of the Treadway Commission (COSO), and our report dated March 5, 2015 expressed an unqualified opinion on the effectiveness of the Company’s internal control over financial reporting.
/s/ KPMG LLP
Richmond, Virginia
March 5, 2015
63
THE BRINK’S COMPANY
and subsidiaries
Consolidated Balance Sheets
| December 31, | ||||||||
| (In millions, except for per share amounts) | 2014 | 2013 | ||||||
| ASSETS | ||||||||
| Current assets: | ||||||||
| Cash and cash equivalents | $ | 176.2 | 255.5 | |||||
| Accounts receivable (net of allowance: 2014 - $10.0; 2013 - $8.2) | 530.5 | 622.2 | ||||||
| Prepaid expenses and other | 129.0 | 153.0 | ||||||
| Deferred income taxes | 71.9 | 72.0 | ||||||
| Total current assets | 907.6 | 1,102.7 | ||||||
| Property and equipment, net | 669.5 | 758.7 | ||||||
| Goodwill | 215.7 | 240.2 | ||||||
| Other intangibles | 39.8 | 46.3 | ||||||
| Deferred income taxes | 289.5 | 251.7 | ||||||
| Other | 70.1 | 98.4 | ||||||
| Total assets | $ | 2,192.2 | 2,498.0 | |||||
| LIABILITIES AND EQUITY | ||||||||
| Current liabilities: | ||||||||
| Short-term borrowings | $ | 59.4 | 80.9 | |||||
| Current maturities of long-term debt | 34.1 | 24.6 | ||||||
| Accounts payable | 168.6 | 185.6 | ||||||
| Accrued liabilities | 466.3 | 507.5 | ||||||
| Total current liabilities | 728.4 | 798.6 | ||||||
| Long-term debt | 373.3 | 330.5 | ||||||
| Accrued pension costs | 219.0 | 214.8 | ||||||
| Retirement benefits other than pensions | 257.1 | 186.0 | ||||||
| Deferred income taxes | 10.8 | 18.0 | ||||||
| Other | 129.8 | 170.6 | ||||||
| Total liabilities | 1,718.4 | 1,718.5 | ||||||
| Commitments and contingent liabilities (notes 3, 4, 14, 16, 19 and 23) | ||||||||
| Equity: | ||||||||
| The Brink’s Company (“Brink’s”) shareholders: | ||||||||
| Common stock, par value $1 per share: | ||||||||
| Shares authorized: 100.0 | ||||||||
| Shares issued and outstanding: 2014 - 48.6; 2013 - 48.4 | 48.6 | 48.4 | ||||||
| Capital in excess of par value | 584.5 | 566.4 | ||||||
| Retained earnings | 592.9 | 696.4 | ||||||
| Accumulated other comprehensive income (loss): | ||||||||
| Benefit plan adjustments | (571.7 | ) | (478.0 | ) | ||||
| Foreign currency translation | (222.1 | ) | (141.5 | ) | ||||
| Unrealized gains on available-for-sale securities | 1.4 | 1.6 | ||||||
| Gains on cash flow hedges | 0.4 | 0.6 | ||||||
| Accumulated other comprehensive loss | (792.0 | ) | (617.3 | ) | ||||
| Brink’s shareholders | 434.0 | 693.9 | ||||||
| Noncontrolling interests | 39.8 | 85.6 | ||||||
| Total equity | 473.8 | 779.5 | ||||||
| Total liabilities and equity | $ | 2,192.2 | 2,498.0 | |||||
| See accompanying notes to consolidated financial statements. | ||||||||
64
THE BRINK’S COMPANY
and subsidiaries
Consolidated Statements of Income (Loss)
| Years Ended December 31, | ||||||
| (In millions, except for per share amounts) | 2014 | 2013 | 2012 | |||
| Revenues | $ | 3,562.3 | 3,778.6 | 3,577.6 | ||
| Costs and expenses: | ||||||
| Cost of revenues | 2,948.2 | 3,059.2 | 2,894.2 | |||
| Selling, general and administrative expenses | 560.6 | 546.8 | 532.4 | |||
| Total costs and expenses | 3,508.8 | 3,606.0 | 3,426.6 | |||
| Other operating income (expense) | (81.0) | (9.4) | 11.2 | |||
| Operating profit (loss) | (27.5) | 163.2 | 162.2 | |||
| Interest expense | (23.4) | (25.1) | (23.1) | |||
| Interest and other income (expense) | 1.9 | 1.5 | 7.0 | |||
| Income (loss) from continuing operations before tax | (49.0) | 139.6 | 146.1 | |||
| Provision for income taxes | 36.7 | 49.3 | 23.0 | |||
| Income (loss) from continuing operations | (85.7) | 90.3 | 123.1 | |||
| Loss from discontinued operations, net of tax | (29.1) | (9.2) | (13.4) | |||
| Net income (loss) | (114.8) | 81.1 | 109.7 | |||
| Less net income (loss) attributable to noncontrolling interests | (30.9) | 24.3 | 20.8 | |||
| Net income (loss) attributable to Brink’s | $ | (83.9) | 56.8 | 88.9 | ||
| Amounts attributable to Brink’s: | ||||||
| Continuing operations | $ | (54.8) | 66.0 | 102.3 | ||
| Discontinued operations | (29.1) | (9.2) | (13.4) | |||
| Net income (loss) attributable to Brink’s | $ | (83.9) | 56.8 | 88.9 | ||
Earnings (loss) per share attributable to Brink’s common shareholders(a): | ||||||
| Basic: | ||||||
| Continuing operations | $ | (1.12) | 1.36 | 2.12 | ||
| Discontinued operations | (0.59) | (0.19) | (0.28) | |||
| Net income (loss) | (1.71) | 1.17 | 1.84 | |||
| Diluted: | ||||||
| Continuing operations | $ | (1.12) | 1.35 | 2.11 | ||
| Discontinued operations | (0.59) | (0.19) | (0.28) | |||
| Net income (loss) | (1.71) | 1.16 | 1.83 | |||
| Weighted-average shares | ||||||
| Basic | 49.0 | 48.7 | 48.4 | |||
| Diluted | 49.0 | 49.0 | 48.6 | |||
| (a) | Amounts may not add due to rounding. | |||||
| See accompanying notes to consolidated financial statements. | ||||||
65
THE BRINK’S COMPANY
and subsidiaries
Consolidated Statements of Comprehensive Income (Loss)
| Years Ended December 31, | ||||||||||||
| (In millions) | 2014 | 2013 | 2012 | |||||||||
| Net income (loss) | $ | (114.8 | ) | 81.1 | 109.7 | |||||||
| Benefit plan adjustments: | ||||||||||||
| Benefit plan experience gains (losses) | (134.3 | ) | 265.0 | 27.3 | ||||||||
| Benefit plan prior service (costs) credits | (2.9 | ) | 63.0 | (5.8 | ) | |||||||
| Deferred profit sharing | 0.3 | (0.3 | ) | 0.5 | ||||||||
| Total benefit plan adjustments | (136.9 | ) | 327.7 | 22.0 | ||||||||
| Foreign currency translation adjustments | (87.0 | ) | (32.8 | ) | 3.4 | |||||||
| Unrealized net gains (losses) on available-for-sale securities | (0.4 | ) | 0.1 | (2.1 | ) | |||||||
| Gains (loss) on cash flow hedges | (0.2 | ) | 0.6 | - | ||||||||
| Other comprehensive income (loss) before tax | (224.5 | ) | 295.6 | 23.3 | ||||||||
| Provision (benefit) for income taxes | (43.0 | ) | 141.0 | 9.3 | ||||||||
| Other comprehensive income (loss) | (181.5 | ) | 154.6 | 14.0 | ||||||||
| Comprehensive income (loss) | (296.3 | ) | 235.7 | 123.7 | ||||||||
| Less comprehensive income (loss) attributable to noncontrolling interests | (37.7 | ) | 22.5 | 20.3 | ||||||||
| Comprehensive income (loss) attributable to Brink’s | $ | (258.6 | ) | 213.2 | 103.4 | |||||||
| See accompanying notes to consolidated financial statements. | ||||||||||||
66
THE BRINK’S COMPANY
and subsidiaries
Consolidated Statements of Equity
Years Ended December 31, 2014, 2013 and 2012
| Capital | Accumulated | Attributable | |||||||||||||||
| in Excess | Other | to | |||||||||||||||
| Common | of Par | Retained | Comprehensive | Noncontrolling | |||||||||||||
| (In millions) | Shares | Stock | Value | Earnings | Loss | Interests | Total | ||||||||||
| Balance as of December 31, 2011 | 46.9 | 46.9 | 559.5 | 589.5 | (787.9) | 74.4 | 482.4 | ||||||||||
| Net income | - | - | - | 88.9 | - | 20.8 | 109.7 | ||||||||||
| Other comprehensive income (loss) | - | - | - | - | 14.5 | (0.5) | 14.0 | ||||||||||
| Shares contributed to pension plan (see note 18) | 0.4 | 0.4 | 8.6 | - | - | - | 9.0 | ||||||||||
| Dividends to: | |||||||||||||||||
| Brink’s common shareholders ($0.40 per share) | - | - | - | (19.0) | - | - | (19.0) | ||||||||||
| Noncontrolling interests | - | - | - | - | - | (13.0) | (13.0) | ||||||||||
| Share-based compensation: | |||||||||||||||||
| Stock options and awards: | |||||||||||||||||
| Compensation expense | - | - | 8.0 | - | - | - | 8.0 | ||||||||||
| Consideration from exercise of stock options | - | - | 1.4 | - | - | - | 1.4 | ||||||||||
| Reduction in excess tax benefit of stock compensation | - | - | (2.7) | - | - | - | (2.7) | ||||||||||
| Other share-based benefit programs | 0.5 | 0.5 | (3.7) | (0.3) | - | - | (3.5) | ||||||||||
| Acquisitions of noncontrolling interests | - | - | (2.8) | - | - | (7.3) | (10.1) | ||||||||||
| Capital contributions from noncontrolling interest | - | - | - | - | - | 0.6 | 0.6 | ||||||||||
| Balance as of December 31, 2012 | 47.8 | 47.8 | 568.3 | 659.1 | (773.4) | 75.0 | 576.8 | ||||||||||
| Net income | - | - | - | 56.8 | - | 24.3 | 81.1 | ||||||||||
| Other comprehensive income (loss) | - | - | - | - | 156.4 | (1.8) | 154.6 | ||||||||||
| Dividends to: | |||||||||||||||||
| Brink’s common shareholders ($0.40 per share) | - | - | - | (19.2) | - | - | (19.2) | ||||||||||
| Noncontrolling interests | - | - | - | - | - | (6.0) | (6.0) | ||||||||||
| Share-based compensation: | |||||||||||||||||
| Stock options and awards: | |||||||||||||||||
| Compensation expense | - | - | 9.9 | - | - | - | 9.9 | ||||||||||
| Consideration from exercise of stock options | 0.3 | 0.3 | 6.4 | - | - | - | 6.7 | ||||||||||
| Reduction in excess tax benefit of stock compensation | - | - | (2.8) | - | - | - | (2.8) | ||||||||||
| Other share-based benefit programs | 0.3 | 0.3 | (3.6) | (0.3) | - | - | (3.6) | ||||||||||
| Acquisitions of noncontrolling interests | - | - | (11.8) | - | (0.3) | (6.4) | (18.5) | ||||||||||
| Capital contributions from noncontrolling interest | - | - | - | - | - | 0.5 | 0.5 | ||||||||||
| Balance as of December 31, 2013 | 48.4 | 48.4 | 566.4 | 696.4 | (617.3) | 85.6 | 779.5 | ||||||||||
| Net loss | - | - | - | (83.9) | - | (30.9) | (114.8) | ||||||||||
| Other comprehensive loss | - | - | - | - | (174.7) | (6.8) | (181.5) | ||||||||||
| Dividends to: | |||||||||||||||||
| Brink’s common shareholders ($0.40 per share) | - | - | - | (19.4) | - | - | (19.4) | ||||||||||
| Noncontrolling interests | - | - | - | - | - | (8.6) | (8.6) | ||||||||||
| Share-based compensation: | |||||||||||||||||
| Stock options and awards: | |||||||||||||||||
| Compensation expense | - | - | 17.3 | - | - | - | 17.3 | ||||||||||
| Consideration from exercise of stock options | - | - | 0.4 | - | - | - | 0.4 | ||||||||||
| Reduction in excess tax benefit of stock compensation | - | - | (0.6) | - | - | - | (0.6) | ||||||||||
| Other share-based benefit programs | 0.2 | 0.2 | 1.0 | (0.2) | - | - | 1.0 | ||||||||||
| Capital contributions from noncontrolling interest | - | - | - | - | - | 0.5 | 0.5 | ||||||||||
| Balance as of December 31, 2014 | 48.6 | $ | 48.6 | 584.5 | 592.9 | (792.0) | 39.8 | 473.8 | |||||||||
| See accompanying notes to consolidated financial statements. | |||||||||||||||||
67
THE BRINK’S COMPANY
and subsidiaries
Consolidated Statements of Cash Flows
| Years Ended December 31, | ||||||||||||
| (In millions) | 2014 | 2013 | 2012 | |||||||||
| Cash flows from operating activities: | ||||||||||||
| Net income (loss) | $ | (114.8 | ) | 81.1 | 109.7 | |||||||
| Adjustments to reconcile net income (loss) to net cash provided by operating activities: | ||||||||||||
| Loss from discontinued operations, net of tax | 29.1 | 9.2 | 13.4 | |||||||||
| Depreciation and amortization | 161.9 | 165.8 | 148.4 | |||||||||
| Share-based compensation expense | 17.3 | 9.9 | 8.0 | |||||||||
| Deferred income taxes | (28.4 | ) | (34.6 | ) | (43.5 | ) | ||||||
| Gains and losses: | ||||||||||||
| Available-for-sale securities | (0.4 | ) | (0.4 | ) | (2.9 | ) | ||||||
| Property and other assets | (44.9 | ) | (2.4 | ) | (7.6 | ) | ||||||
| Business acquisitions and dispositions | - | (2.8 | ) | (0.8 | ) | |||||||
| Impairment losses | 3.3 | 2.9 | 2.4 | |||||||||
| Retirement benefit funding (more) less than expense: | ||||||||||||
| Pension | (23.6 | ) | 11.3 | (1.9 | ) | |||||||
| Other than pension | 1.5 | 15.0 | 22.3 | |||||||||
| Remeasurement losses due to Venezuela currency devaluations | 121.6 | 13.4 | - | |||||||||
| Other operating | 7.6 | 2.3 | 11.7 | |||||||||
| Changes in operating assets and liabilities, net of effects of acquisitions: | ||||||||||||
| Accounts receivable and income taxes receivable | (90.7 | ) | (69.7 | ) | (70.6 | ) | ||||||
| Accounts payable, income taxes payable and accrued liabilities | 105.5 | 23.6 | 15.7 | |||||||||
| Customer obligations | 15.4 | (9.7 | ) | 13.9 | ||||||||
| Prepaid and other current assets | (9.9 | ) | (19.4 | ) | 3.9 | |||||||
| Other | (14.7 | ) | (11.0 | ) | 7.5 | |||||||
| Discontinued operations | 5.5 | 17.0 | 20.9 | |||||||||
| Net cash provided by operating activities | 141.3 | 201.5 | 250.5 | |||||||||
| Cash flows from investing activities: | ||||||||||||
| Capital expenditures | (136.1 | ) | (172.9 | ) | (170.9 | ) | ||||||
| Acquisitions | (4.6 | ) | (18.1 | ) | (17.2 | ) | ||||||
| Sales of available-for-sale securities | 0.9 | 9.9 | 15.4 | |||||||||
| Sales of other investments and property | 62.7 | 5.9 | 12.5 | |||||||||
| Redemption of cash-surrender value of life insurance policies | - | - | 6.2 | |||||||||
| Other | (3.6 | ) | (0.5 | ) | 4.9 | |||||||
| Discontinued operations | (13.3 | ) | 52.7 | (18.2 | ) | |||||||
| Net cash used by investing activities | (94.0 | ) | (123.0 | ) | (167.3 | ) | ||||||
| Cash flows from financing activities: | ||||||||||||
| Borrowings (repayments) of debt: | ||||||||||||
| Short-term debt | (7.8 | ) | 60.5 | 3.3 | ||||||||
| Long-term revolving credit facilities | 115.0 | 13.8 | (4.5 | ) | ||||||||
| Other long-term debt: | ||||||||||||
| Borrowings | 7.5 | 3.8 | 9.7 | |||||||||
| Repayments | (81.0 | ) | (27.3 | ) | (29.7 | ) | ||||||
| Acquisition of a noncontrolling interest in a subsidiary | - | (18.5 | ) | (9.4 | ) | |||||||
| Payment of acquisition-related obligation | - | (12.8 | ) | - | ||||||||
| Dividends to: | ||||||||||||
| Shareholders of Brink’s | (19.4 | ) | (19.2 | ) | (19.0 | ) | ||||||
| Noncontrolling interests in subsidiaries | (8.6 | ) | (6.0 | ) | (13.0 | ) | ||||||
| Proceeds from exercise of stock options | 0.4 | 6.7 | 1.4 | |||||||||
| Minimum tax withholdings associated with share-based compensation | (1.2 | ) | (3.5 | ) | (5.6 | ) | ||||||
| Other | (1.6 | ) | (1.0 | ) | (1.0 | ) | ||||||
| Discontinued operations | - | (2.5 | ) | (0.2 | ) | |||||||
| Net cash used by financing activities | 3.3 | (6.0 | ) | (68.0 | ) | |||||||
| Effect of exchange rate changes on cash and cash equivalents | (129.9 | ) | (18.7 | ) | 3.6 | |||||||
| Cash and cash equivalents: | ||||||||||||
| Increase (decrease) | (79.3 | ) | 53.8 | 18.8 | ||||||||
| Balance at beginning of period | 255.5 | 201.7 | 182.9 | |||||||||
| Balance at end of period | $ | 176.2 | 255.5 | 201.7 | ||||||||
| See accompanying notes to consolidated financial statements. | ||||||||||||
68
THE BRINK’S COMPANY
and subsidiaries
Foreign Currency Translation
The majority of our subsidiaries outside the U.S. conduct business in their local currencies. Our financial results are reported in U.S. dollars, which include the results of these subsidiaries.
Accounting Policy
Our accounting policy for foreign currency translation is different depending on whether the economy in which our foreign subsidiary operates has been designated as highly inflationary. Economies with a three-year cumulative inflation rate of more than 100% are considered highly inflationary. Subsequent reductions in cumulative inflation rates below 100% do not change the method of translation unless the reduction is deemed to be other than temporary.
Non-Highly Inflationary Economies
Assets and liabilities of foreign subsidiaries in non-highly inflationary economies are translated into U.S. dollars using rates of exchange at the balance sheet date. Translation adjustments are recorded in other comprehensive income (loss). Revenues and expenses are translated at rates of exchange in effect during the year. Transaction gains and losses are recorded in net income (loss).
Highly Inflationary Economies
Foreign subsidiaries that operate in highly inflationary countries must use the reporting currency (the U.S. dollar) as the functional currency. Local-currency monetary assets and liabilities are remeasured into dollars each balance sheet date, with remeasurement adjustments and other transaction gains and losses recognized in earnings. Non-monetary assets and liabilities do not fluctuate with changes in local currency exchange rates to the dollar.
Application of Accounting Policy
Venezuela
Brink’s Venezuela accounted for $212 million or 6% of total Brink’s revenues and was a significant component of 2014 total operating profit before items not allocated to segments. At December 31, 2014, we had investments in our Venezuelan operations of $59.6 million on an equity-method basis. At December 31, 2014, we had bolivar denominated net monetary assets of $23.5 million, including $12.6 million of cash and cash equivalents denominated in bolivars.
The economy in Venezuela has had significant inflation in the last several years. We consolidate our Venezuelan results using our accounting policy for subsidiaries operating in highly inflationary economies.
During the period from 2003 through February 2015, the Venezuelan government controlled the exchange of local currency into other currencies, including the U.S. dollar. During this period, the Venezuelan government required that currency exchanges be made at official rates established by the government instead of allowing open markets to determine currency rates. Different official rates existed for different industries and purposes. The government did not approve all requests to convert bolivars to other currencies.
The government devalued the official rate for essential services in February 2013 from 5.3 to 6.3 bolivars to the dollar.
Late in 2013, the government added another official exchange process, known as SICAD, for travel and certain other purposes, made available at government discretion. The published rate for this process in 2014 ranged from 10 to 12 bolivars to the U.S. dollar. Since the end of the first
56
quarter of 2013, we have only been able to obtain dollars once using the SICAD process. We do not know whether we will be able to access the SICAD process again in the future.
In March 2014, the government initiated another exchange mechanism known as SICAD II. Conversions under this mechanism were also subject to specific eligibility requirements. Transactions were reported to be in a range of 49 to 52 bolivars to the dollar. Through December 31, 2014, we received approval to obtain $1.2 million (weighted average exchange rate of 51) through the SICAD II mechanism.
In February 2015, the government replaced the SICAD II process with a new process, known locally as SIMADI. The rates published in mid February 2015 ranged from 170 to 174 bolivars to the U.S. dollar.
As a result of the restrictions on currency exchange, we have in the past been unable to obtain sufficient U.S. dollars to purchase certain imported supplies and fixed assets to fully operate our business in Venezuela. Consequently, we have occasionally purchased more expensive, bolivar-denominated supplies and fixed assets. Furthermore, there is a risk that the SIMADI process will be discontinued or not accessible when needed in the future, which may prevent us from repatriating dividends or obtaining dollars to operate our Venezuelan operations.
Remeasurement rate during 2012. We used an official rate of 5.3 bolivars to the dollar to remeasure our bolivar-denominated monetary assets and liabilities into U.S. dollars and to translate our revenues and expenses.
Remeasurement rates during 2013. Through January 31, 2013, we used an official rate of 5.3 bolivars to the dollar to remeasure our bolivar-denominated monetary assets and liabilities into U.S. dollars and to translate our revenues and expenses. After the devaluation in February 2013, we began to use the 6.3 official exchange rate to remeasure bolivar denominated monetary assets and liabilities and to translate our revenues and expenses. We recognized a $13.4 million net remeasurement loss in 2013 when we changed from the 5.3 to 6.3 exchange rate. The after-tax effect of these losses attributable to noncontrolling interests was $4.7 million in 2013.
Remeasurement rates during 2014. Through March 23, 2014, we used the official rate of 6.3 bolivars to the dollar to remeasure our bolivar denominated monetary assets and liabilities into U.S. dollars and to translate our revenues and expenses. Effective March 24, 2014, we began to use the exchange rate published for the SICAD II process to remeasure bolivar denominated monetary assets and liabilities and to translate our revenues and expenses. We recognized a $121.6 million net remeasurement loss in 2014 when we changed from the official rate of 6.3 to the SICAD II exchange rate, which averaged approximately 50 since opening on March 24, 2014 until implementation of a new exchange process in February 2015 (SIMADI). Transaction gains and losses since March 31, 2014 have not been significant. At December 31, 2014, the rate was approximately 50. The after-tax effect of these losses attributable to noncontrolling interests was $39.7 million in 2014.
Remeasuring our Venezuelan results using the SICAD II rate has had the following effects on our reported results:
| · | Brink’s Venezuela has become a less-significant component of Brink’s consolidated revenues and operating profit. |
| · | Brink’s Venezuela’s profit margin percentage declined as the historical U.S. dollar nonmonetary assets were not remeasured to a lower U.S. dollar basis but instead retained a historical higher basis which was used for depreciation and other expense attribution. Our nonmonetary assets were $59.9 million at December 31, 2013, and $55.0 million at December 31, 2014. |
| · | Our investment in our Venezuelan operations on an equity-method basis has declined. Our investment was $125.3 million at December 31, 2013, and $59.6 million at December 31, 2014. |
| · | Our bolivar-denominated net monetary assets included in our consolidated balance sheets have declined. Our bolivar-denominated net monetary assets were $120.4 million (including $93.8 million of cash and cash equivalents) at December 31, 2013, and $23.5 million (including $12.6 million of cash and cash equivalents) at December 31, 2014. |
Remeasurement rates expected during 2015. We have not concluded how the elimination of the SICAD II exchange process will affect our remeasurement of our Venezuelan results in 2015. If we conclude the new SIMADI process is appropriate, our results will experience similar types of effects as we experienced when we adopted the SICAD II rate, as described above, however the magnitude is expected to be lower.
RECENT ACCOUNTING PRONOUNCEMENTS
In May 2014, the Financial Accounting Standards Board (“FASB”) issued a new standard related to revenue recognition, which requires an entity to recognize the amount of revenue to which it expects to be entitled for the transfer of promised goods or services to customers. The new standard will replace most of the existing revenue recognition standards in U.S. GAAP when it becomes effective on January 1, 2017. Early adoption is not permitted. The new standard can be applied retrospectively to each prior reporting period presented or retrospectively with the cumulative effect of the change recognized at the date of the initial application in retained earnings. We are assessing the potential impact of the new standard on financial reporting and have not yet selected a transition method.
57
ITEM 7A. QUANTITATIVE AND QUALITATIVE DISCLOSURES ABOUT MARKET RISK
We currently serve customers in more than 100 countries, including 41 countries where we operate subsidiaries. These operations expose us to a variety of market risks, including the effects of changes in interest rates, commodity prices and foreign currency exchange rates. These financial and commodity exposures are monitored and managed by us as an integral part of our overall risk management program.
We periodically use various derivative and non-derivative financial instruments, as discussed below, to hedge our interest rate, commodity prices and foreign currency exposures when appropriate. The risk that counterparties to these instruments may be unable to perform is minimized by limiting the counterparties used to major financial institutions with investment grade credit ratings. We do not expect to incur a loss from the failure of any counterparty to perform under the agreements. We do not use derivative financial instruments for purposes other than hedging underlying financial or commercial exposures.
The sensitivity analyses discussed below for the market risk exposures were based on the facts and circumstances in effect at December 31, 2014. Actual results will be determined by a number of factors that are not under management’s control and could vary materially from those disclosed.
Interest Rate Risk
We use both fixed and floating rate debt and leases to finance our operations. Floating rate obligations, including our Revolving Facility, expose us to fluctuations in cash flows due to changes in the general level of interest rates. Fixed rate obligations, including our unsecured notes, are subject to fluctuations in fair values as a result of changes in interest rates.
Based on the contractual interest rates on the floating rate debt at December 31, 2014, a hypothetical 10% increase in rates would increase cash outflows by approximately $0.9 million over a twelve-month period. In other words, our weighted average interest rate on our floating rate instruments was 2.7% per annum at December 31, 2014. If that average rate were to increase by 0.3 percentage points to 3.0%, the cash outflows associated with these instruments would increase by $0.9 million annually. The effect on the fair values on our unsecured notes for a hypothetical 10% decrease in the yield curve from year-end 2014 levels would result in a $1.7 million increase for our unsecured notes in the fair values of the debt.
58
Foreign Currency Risk
We have exposure to the effects of foreign currency exchange rate fluctuations on the results of all of our foreign operations. Our foreign operations generally use local currencies to conduct business but their results are reported in U.S. dollars.
We are also exposed periodically to the foreign currency rate fluctuations that affect transactions not denominated in the functional currency of domestic and foreign operations. To mitigate these exposures, we, from time to time, enter into foreign currency forward and swap contracts. At December 31, 2014, the notional value of our shorter term outstanding foreign currency contracts was $43.0 million with average contract maturities of approximately one month. These shorter term foreign currency contracts primarily offset exposures in the Mexican peso and the euro. Additionally, these shorter term contracts are not designated as hedges for accounting purposes, and accordingly, changes in their fair value are recorded immediately in earnings. We also have a longer term cross currency swap contract to hedge exposure in the Brazilian real which is designated as a cash flow hedge for accounting purposes. At December 31, 2014, the notional value of that longer term contract was $20.8 million with a weighted average maturity of 1.6 years. We do not use derivative financial instruments to hedge investments in foreign subsidiaries since such investments are long-term in nature.
The effects of a hypothetical simultaneous 10% appreciation in the U.S. dollar from the 2014 levels against all other currencies of countries in which we have continuing operations are as follows:
| Hypothetical Effects | ||||||||||||
| Increase/ (decrease) | ||||||||||||
| (In millions) | Venezuela | Other countries | Total | |||||||||
| Effect on Earnings: | ||||||||||||
| Translation of 2014 earnings into U.S. dollars | $ | (1.9 | ) | (12.0 | ) | (13.9 | ) | |||||
| Transaction gains (losses) | (2.3 | ) | - | (2.3 | ) | |||||||
| Effect on Other Comprehensive Income (Loss): | ||||||||||||
| Translation of net assets of foreign subsidiaries | - | (63.4 | ) | (63.4 | ) | |||||||
The hypothetical foreign currency effects above detail the consolidated effect attributable to Brink’s of a simultaneous change in the value of a large number of foreign currencies relative to the U. S. dollar. The foreign currency exposure effect related to a change in an individual currency could be significantly different.
Venezuela
Brink’s Venezuela accounted for $212 million or 6% of total Brink’s revenues and was a significant component of 2014 total operating profit before items not allocated to segments. Venezuela operates in a highly inflationary economy.
In February 2015, the government replaced the SICAD II process with a new process, known locally as SIMADI. The SIMADI rate has ranged from 170 to 174 bolivars to the dollar between February 12 and February 26. Had we used a rate of 170, our revenues in 2014 would have declined by $183 million and our operating profit before items not allocated to segments would have declined by $39 million. Had a rate of 170 been in effect at December 31, 2014, we would have recognized additional currency losses to write down our net monetary assets of $16 million.
The investment in our Venezuelan subsidiaries, and cash and other net monetary assets held by these subsidiaries are as follows:
| December 31, | ||||||||
| (In millions) | 2014 | 2013 | ||||||
Equity-method investment in Venezuelan subsidiaries(a) | $ | 59.6 | 125.3 | |||||
| Net monetary assets held by our Venezuelan subsidiaries | ||||||||
| Cash and short-term investments denominated in U.S. dollars | $ | 1.1 | 0.5 | |||||
| Net monetary assets denominated in bolivars: | ||||||||
| Cash and cash equivalents | $ | 12.6 | 93.8 | |||||
| Accounts receivable, accounts payable and other, net | 10.9 | 26.6 | ||||||
| Total | $ | 23.5 | 120.4 | |||||
| (a) | The amount represents retained earnings net of currency translation adjustments of the business. |
59
ITEM 8. FINANCIAL STATEMENTS AND SUPPLEMENTARY DATA
THE BRINK’S COMPANY
CONSOLIDATED FINANCIAL STATEMENTS
FOR THE YEAR ENDED DECEMBER 31, 2014
TABLE OF CONTENTS
| Page | ||
| MANAGEMENT’S ANNUAL REPORT ON INTERNAL CONTROL OVER FINANCIAL REPORTING | 61 | |
| REPORTS OF INDEPENDENT REGISTERED PUBLIC ACCOUNTING FIRM | 62 | |
| CONSOLIDATED FINANCIAL STATEMENTS | ||
| Consolidated Balance Sheets | 64 | |
| Consolidated Statements of Income (Loss) | 65 | |
| Consolidated Statements of Comprehensive Income (Loss) | 66 | |
| Consolidated Statements of Equity | 67 | |
| Consolidated Statements of Cash Flows | 68 | |
| NOTES TO CONSOLIDATED FINANCIAL STATEMENTS | ||
| Note 1 – Summary of Significant Accounting Policies | 69 | |
| Note 2 – Segment Information | 74 | |
| Note 3 – Retirement Benefits | 79 | |
| Note 4 – Income Taxes | 88 | |
| Note 5 – Property and Equipment | 91 | |
| Note 6 – Acquisitions | 91 | |
| Note 7 – Goodwill and Other Intangible Assets | 92 | |
| Note 8 – Prepaid Expenses and Other | 93 | |
| Note 9 – Other Assets | 93 | |
| Note 10 – Accumulated Other Comprehensives Income (Loss) | 94 | |
| Note 11 – Fair Value of Financial Instruments | 96 | |
| Note 12 – Accrued Liabilities | 96 | |
| Note 13 – Other Liabilities | 97 | |
| Note 14 – Long-Term Debt | 97 | |
| Note 15 – Accounts Receivable | 99 | |
| Note 16 – Operating Leases | 99 | |
| Note 17 – Share-Based Compensation Plans | 100 | |
| Note 18 – Capital Stock | 106 | |
| Note 19 – Loss from Discontinued Operations | 107 | |
| Note 20 – Supplemental Cash Flow Information | 109 | |
| Note 21 – Other Operating Income (Expense) | 109 | |
| Note 22 – Interest and Other Nonoperating Income (Expense) | 109 | |
| Note 23 – Other Commitments and Contingencies | 110 | |
| Note 24 – 2014 Reorganization and Restructuring | 110 | |
| Note 25 – Selected Quarterly Financial Data (unaudited) | 111 | |
60
MANAGEMENT’S ANNUAL REPORT ON INTERNAL CONTROL OVER FINANCIAL REPORTING
Management of the Company is responsible for establishing and maintaining adequate internal control over financial reporting as defined in Rule 13a-15(f) under the Securities Exchange Act of 1934. Our internal control over financial reporting is designed to provide reasonable assurance to our management and board of directors regarding the preparation and fair presentation of published financial statements.
Because of its inherent limitations, internal control over financial reporting may not prevent or detect misstatements. Therefore, even those systems determined to be effective can provide only reasonable assurance with respect to financial statement preparation and presentation.
Management assessed the effectiveness of our internal control over financial reporting as of December 31, 2014. In making this assessment, management used the criteria set forth by the Committee of Sponsoring Organizations of the Treadway Commission (COSO) in “Internal Control – Integrated Framework (1992).”
Based on this assessment, our management believes that, as of December 31, 2014, our internal control over financial reporting is effective based on the COSO criteria.
KPMG LLP, the independent registered public accounting firm which audits our consolidated financial statements, has issued an attestation report of our internal control over financial reporting. KPMG’s attestation report appears on page 62.
In May 2013, COSO issued an updated framework which superseded the 1992 framework in December 2014. We intend to integrate the changes prescribed by the 2013 COSO Framework into management’s evaluation of the effectiveness of internal control over financial reporting during 2015.
61
Report of Independent Registered Public Accounting Firm
The Board of Directors and Stockholders
The Brink’s Company:
We have audited The Brink’s Company’s (the Company) internal control over financial reporting as of December 31, 2014, based on criteria established in Internal Control – Integrated Framework (1992) issued by the Committee of Sponsoring Organizations of the Treadway Commission (COSO). The Company’s management is responsible for maintaining effective internal control over financial reporting and for its assessment of the effectiveness of internal control over financial reporting, included in the accompanying Management’s Annual Report on Internal Control over Financial Reporting. Our responsibility is to express an opinion on the Company’s internal control over financial reporting based on our audit.
We conducted our audit in accordance with the standards of the Public Company Accounting Oversight Board (United States). Those standards require that we plan and perform the audit to obtain reasonable assurance about whether effective internal control over financial reporting was maintained in all material respects. Our audit included obtaining an understanding of internal control over financial reporting, assessing the risk that a material weakness exists, and testing and evaluating the design and operating effectiveness of internal control based on the assessed risk. Our audit also included performing such other procedures as we considered necessary in the circumstances. We believe that our audit provides a reasonable basis for our opinion.
A company’s internal control over financial reporting is a process designed to provide reasonable assurance regarding the reliability of financial reporting and the preparation of financial statements for external purposes in accordance with generally accepted accounting principles. A company’s internal control over financial reporting includes those policies and procedures that (1) pertain to the maintenance of records that, in reasonable detail, accurately and fairly reflect the transactions and dispositions of the assets of the company; (2) provide reasonable assurance that transactions are recorded as necessary to permit preparation of financial statements in accordance with generally accepted accounting principles, and that receipts and expenditures of the company are being made only in accordance with authorizations of management and directors of the company; and (3) provide reasonable assurance regarding prevention or timely detection of unauthorized acquisition, use, or disposition of the company’s assets that could have a material effect on the financial statements.
Because of its inherent limitations, internal control over financial reporting may not prevent or detect misstatements. Also, projections of any evaluation of effectiveness to future periods are subject to the risk that controls may become inadequate because of changes in conditions, or that the degree of compliance with the policies or procedures may deteriorate.
In our opinion, The Brink’s Company maintained, in all material respects, effective internal control over financial reporting as of December 31, 2014, based on criteria established in Internal Control – Integrated Framework (1992) issued by the Committee of Sponsoring Organizations of the Treadway Commission (COSO).
We also have audited, in accordance with the standards of the Public Company Accounting Oversight Board (United States), the consolidated balance sheets of The Brink’s Company and subsidiaries as of December 31, 2014 and 2013, and the related consolidated statements of income (loss), comprehensive income (loss), equity, and cash flows for each of the years in the three-year period ended December 31, 2014, and our report dated March 5, 2015, expressed an unqualified opinion on those consolidated financial statements.
/s/ KPMG LLP
Richmond, Virginia
March 5, 2015
62
Report of Independent Registered Public Accounting Firm
The Board of Directors and Stockholders
The Brink’s Company:
We have audited the accompanying consolidated balance sheets of The Brink’s Company and subsidiaries as of December 31, 2014 and 2013, and the related consolidated statements of income (loss), comprehensive income (loss), equity, and cash flows for each of the years in the three-year period ended December 31, 2014. These consolidated financial statements are the responsibility of the Company’s management. Our responsibility is to express an opinion on these consolidated financial statements based on our audits.
We conducted our audits in accordance with the standards of the Public Company Accounting Oversight Board (United States). Those standards require that we plan and perform the audit to obtain reasonable assurance about whether the financial statements are free of material misstatement. An audit includes examining, on a test basis, evidence supporting the amounts and disclosures in the financial statements. An audit also includes assessing the accounting principles used and significant estimates made by management, as well as evaluating the overall financial statement presentation. We believe that our audits provide a reasonable basis for our opinion.
In our opinion, the consolidated financial statements referred to above present fairly, in all material respects, the financial position of The Brink’s Company and subsidiaries as of December 31, 2014 and 2013, and the results of their operations and their cash flows for each of the years in the three-year period ended December 31, 2014, in conformity with U.S. generally accepted accounting principles.
We also have audited, in accordance with the standards of the Public Company Accounting Oversight Board (United States), The Brink’s Company’s internal control over financial reporting as of December 31, 2014, based on criteria established in Internal Control – Integrated Framework (1992) issued by the Committee of Sponsoring Organizations of the Treadway Commission (COSO), and our report dated March 5, 2015 expressed an unqualified opinion on the effectiveness of the Company’s internal control over financial reporting.
/s/ KPMG LLP
Richmond, Virginia
March 5, 2015
63
THE BRINK’S COMPANY
and subsidiaries
Consolidated Balance Sheets
| December 31, | ||||||||
| (In millions, except for per share amounts) | 2014 | 2013 | ||||||
| ASSETS | ||||||||
| Current assets: | ||||||||
| Cash and cash equivalents | $ | 176.2 | 255.5 | |||||
| Accounts receivable (net of allowance: 2014 - $10.0; 2013 - $8.2) | 530.5 | 622.2 | ||||||
| Prepaid expenses and other | 129.0 | 153.0 | ||||||
| Deferred income taxes | 71.9 | 72.0 | ||||||
| Total current assets | 907.6 | 1,102.7 | ||||||
| Property and equipment, net | 669.5 | 758.7 | ||||||
| Goodwill | 215.7 | 240.2 | ||||||
| Other intangibles | 39.8 | 46.3 | ||||||
| Deferred income taxes | 289.5 | 251.7 | ||||||
| Other | 70.1 | 98.4 | ||||||
| Total assets | $ | 2,192.2 | 2,498.0 | |||||
| LIABILITIES AND EQUITY | ||||||||
| Current liabilities: | ||||||||
| Short-term borrowings | $ | 59.4 | 80.9 | |||||
| Current maturities of long-term debt | 34.1 | 24.6 | ||||||
| Accounts payable | 168.6 | 185.6 | ||||||
| Accrued liabilities | 466.3 | 507.5 | ||||||
| Total current liabilities | 728.4 | 798.6 | ||||||
| Long-term debt | 373.3 | 330.5 | ||||||
| Accrued pension costs | 219.0 | 214.8 | ||||||
| Retirement benefits other than pensions | 257.1 | 186.0 | ||||||
| Deferred income taxes | 10.8 | 18.0 | ||||||
| Other | 129.8 | 170.6 | ||||||
| Total liabilities | 1,718.4 | 1,718.5 | ||||||
| Commitments and contingent liabilities (notes 3, 4, 14, 16, 19 and 23) | ||||||||
| Equity: | ||||||||
| The Brink’s Company (“Brink’s”) shareholders: | ||||||||
| Common stock, par value $1 per share: | ||||||||
| Shares authorized: 100.0 | ||||||||
| Shares issued and outstanding: 2014 - 48.6; 2013 - 48.4 | 48.6 | 48.4 | ||||||
| Capital in excess of par value | 584.5 | 566.4 | ||||||
| Retained earnings | 592.9 | 696.4 | ||||||
| Accumulated other comprehensive income (loss): | ||||||||
| Benefit plan adjustments | (571.7 | ) | (478.0 | ) | ||||
| Foreign currency translation | (222.1 | ) | (141.5 | ) | ||||
| Unrealized gains on available-for-sale securities | 1.4 | 1.6 | ||||||
| Gains on cash flow hedges | 0.4 | 0.6 | ||||||
| Accumulated other comprehensive loss | (792.0 | ) | (617.3 | ) | ||||
| Brink’s shareholders | 434.0 | 693.9 | ||||||
| Noncontrolling interests | 39.8 | 85.6 | ||||||
| Total equity | 473.8 | 779.5 | ||||||
| Total liabilities and equity | $ | 2,192.2 | 2,498.0 | |||||
| See accompanying notes to consolidated financial statements. | ||||||||
64
THE BRINK’S COMPANY
and subsidiaries
Consolidated Statements of Income (Loss)
| Years Ended December 31, | ||||||
| (In millions, except for per share amounts) | 2014 | 2013 | 2012 | |||
| Revenues | $ | 3,562.3 | 3,778.6 | 3,577.6 | ||
| Costs and expenses: | ||||||
| Cost of revenues | 2,948.2 | 3,059.2 | 2,894.2 | |||
| Selling, general and administrative expenses | 560.6 | 546.8 | 532.4 | |||
| Total costs and expenses | 3,508.8 | 3,606.0 | 3,426.6 | |||
| Other operating income (expense) | (81.0) | (9.4) | 11.2 | |||
| Operating profit (loss) | (27.5) | 163.2 | 162.2 | |||
| Interest expense | (23.4) | (25.1) | (23.1) | |||
| Interest and other income (expense) | 1.9 | 1.5 | 7.0 | |||
| Income (loss) from continuing operations before tax | (49.0) | 139.6 | 146.1 | |||
| Provision for income taxes | 36.7 | 49.3 | 23.0 | |||
| Income (loss) from continuing operations | (85.7) | 90.3 | 123.1 | |||
| Loss from discontinued operations, net of tax | (29.1) | (9.2) | (13.4) | |||
| Net income (loss) | (114.8) | 81.1 | 109.7 | |||
| Less net income (loss) attributable to noncontrolling interests | (30.9) | 24.3 | 20.8 | |||
| Net income (loss) attributable to Brink’s | $ | (83.9) | 56.8 | 88.9 | ||
| Amounts attributable to Brink’s: | ||||||
| Continuing operations | $ | (54.8) | 66.0 | 102.3 | ||
| Discontinued operations | (29.1) | (9.2) | (13.4) | |||
| Net income (loss) attributable to Brink’s | $ | (83.9) | 56.8 | 88.9 | ||
Earnings (loss) per share attributable to Brink’s common shareholders(a): | ||||||
| Basic: | ||||||
| Continuing operations | $ | (1.12) | 1.36 | 2.12 | ||
| Discontinued operations | (0.59) | (0.19) | (0.28) | |||
| Net income (loss) | (1.71) | 1.17 | 1.84 | |||
| Diluted: | ||||||
| Continuing operations | $ | (1.12) | 1.35 | 2.11 | ||
| Discontinued operations | (0.59) | (0.19) | (0.28) | |||
| Net income (loss) | (1.71) | 1.16 | 1.83 | |||
| Weighted-average shares | ||||||
| Basic | 49.0 | 48.7 | 48.4 | |||
| Diluted | 49.0 | 49.0 | 48.6 | |||
| (a) | Amounts may not add due to rounding. | |||||
| See accompanying notes to consolidated financial statements. | ||||||
65
THE BRINK’S COMPANY
and subsidiaries
Consolidated Statements of Comprehensive Income (Loss)
| Years Ended December 31, | ||||||||||||
| (In millions) | 2014 | 2013 | 2012 | |||||||||
| Net income (loss) | $ | (114.8 | ) | 81.1 | 109.7 | |||||||
| Benefit plan adjustments: | ||||||||||||
| Benefit plan experience gains (losses) | (134.3 | ) | 265.0 | 27.3 | ||||||||
| Benefit plan prior service (costs) credits | (2.9 | ) | 63.0 | (5.8 | ) | |||||||
| Deferred profit sharing | 0.3 | (0.3 | ) | 0.5 | ||||||||
| Total benefit plan adjustments | (136.9 | ) | 327.7 | 22.0 | ||||||||
| Foreign currency translation adjustments | (87.0 | ) | (32.8 | ) | 3.4 | |||||||
| Unrealized net gains (losses) on available-for-sale securities | (0.4 | ) | 0.1 | (2.1 | ) | |||||||
| Gains (loss) on cash flow hedges | (0.2 | ) | 0.6 | - | ||||||||
| Other comprehensive income (loss) before tax | (224.5 | ) | 295.6 | 23.3 | ||||||||
| Provision (benefit) for income taxes | (43.0 | ) | 141.0 | 9.3 | ||||||||
| Other comprehensive income (loss) | (181.5 | ) | 154.6 | 14.0 | ||||||||
| Comprehensive income (loss) | (296.3 | ) | 235.7 | 123.7 | ||||||||
| Less comprehensive income (loss) attributable to noncontrolling interests | (37.7 | ) | 22.5 | 20.3 | ||||||||
| Comprehensive income (loss) attributable to Brink’s | $ | (258.6 | ) | 213.2 | 103.4 | |||||||
| See accompanying notes to consolidated financial statements. | ||||||||||||
66
THE BRINK’S COMPANY
and subsidiaries
Consolidated Statements of Equity
Years Ended December 31, 2014, 2013 and 2012
| Capital | Accumulated | Attributable | |||||||||||||||
| in Excess | Other | to | |||||||||||||||
| Common | of Par | Retained | Comprehensive | Noncontrolling | |||||||||||||
| (In millions) | Shares | Stock | Value | Earnings | Loss | Interests | Total | ||||||||||
| Balance as of December 31, 2011 | 46.9 | 46.9 | 559.5 | 589.5 | (787.9) | 74.4 | 482.4 | ||||||||||
| Net income | - | - | - | 88.9 | - | 20.8 | 109.7 | ||||||||||
| Other comprehensive income (loss) | - | - | - | - | 14.5 | (0.5) | 14.0 | ||||||||||
| Shares contributed to pension plan (see note 18) | 0.4 | 0.4 | 8.6 | - | - | - | 9.0 | ||||||||||
| Dividends to: | |||||||||||||||||
| Brink’s common shareholders ($0.40 per share) | - | - | - | (19.0) | - | - | (19.0) | ||||||||||
| Noncontrolling interests | - | - | - | - | - | (13.0) | (13.0) | ||||||||||
| Share-based compensation: | |||||||||||||||||
| Stock options and awards: | |||||||||||||||||
| Compensation expense | - | - | 8.0 | - | - | - | 8.0 | ||||||||||
| Consideration from exercise of stock options | - | - | 1.4 | - | - | - | 1.4 | ||||||||||
| Reduction in excess tax benefit of stock compensation | - | - | (2.7) | - | - | - | (2.7) | ||||||||||
| Other share-based benefit programs | 0.5 | 0.5 | (3.7) | (0.3) | - | - | (3.5) | ||||||||||
| Acquisitions of noncontrolling interests | - | - | (2.8) | - | - | (7.3) | (10.1) | ||||||||||
| Capital contributions from noncontrolling interest | - | - | - | - | - | 0.6 | 0.6 | ||||||||||
| Balance as of December 31, 2012 | 47.8 | 47.8 | 568.3 | 659.1 | (773.4) | 75.0 | 576.8 | ||||||||||
| Net income | - | - | - | 56.8 | - | 24.3 | 81.1 | ||||||||||
| Other comprehensive income (loss) | - | - | - | - | 156.4 | (1.8) | 154.6 | ||||||||||
| Dividends to: | |||||||||||||||||
| Brink’s common shareholders ($0.40 per share) | - | - | - | (19.2) | - | - | (19.2) | ||||||||||
| Noncontrolling interests | - | - | - | - | - | (6.0) | (6.0) | ||||||||||
| Share-based compensation: | |||||||||||||||||
| Stock options and awards: | |||||||||||||||||
| Compensation expense | - | - | 9.9 | - | - | - | 9.9 | ||||||||||
| Consideration from exercise of stock options | 0.3 | 0.3 | 6.4 | - | - | - | 6.7 | ||||||||||
| Reduction in excess tax benefit of stock compensation | - | - | (2.8) | - | - | - | (2.8) | ||||||||||
| Other share-based benefit programs | 0.3 | 0.3 | (3.6) | (0.3) | - | - | (3.6) | ||||||||||
| Acquisitions of noncontrolling interests | - | - | (11.8) | - | (0.3) | (6.4) | (18.5) | ||||||||||
| Capital contributions from noncontrolling interest | - | - | - | - | - | 0.5 | 0.5 | ||||||||||
| Balance as of December 31, 2013 | 48.4 | 48.4 | 566.4 | 696.4 | (617.3) | 85.6 | 779.5 | ||||||||||
| Net loss | - | - | - | (83.9) | - | (30.9) | (114.8) | ||||||||||
| Other comprehensive loss | - | - | - | - | (174.7) | (6.8) | (181.5) | ||||||||||
| Dividends to: | |||||||||||||||||
| Brink’s common shareholders ($0.40 per share) | - | - | - | (19.4) | - | - | (19.4) | ||||||||||
| Noncontrolling interests | - | - | - | - | - | (8.6) | (8.6) | ||||||||||
| Share-based compensation: | |||||||||||||||||
| Stock options and awards: | |||||||||||||||||
| Compensation expense | - | - | 17.3 | - | - | - | 17.3 | ||||||||||
| Consideration from exercise of stock options | - | - | 0.4 | - | - | - | 0.4 | ||||||||||
| Reduction in excess tax benefit of stock compensation | - | - | (0.6) | - | - | - | (0.6) | ||||||||||
| Other share-based benefit programs | 0.2 | 0.2 | 1.0 | (0.2) | - | - | 1.0 | ||||||||||
| Capital contributions from noncontrolling interest | - | - | - | - | - | 0.5 | 0.5 | ||||||||||
| Balance as of December 31, 2014 | 48.6 | $ | 48.6 | 584.5 | 592.9 | (792.0) | 39.8 | 473.8 | |||||||||
| See accompanying notes to consolidated financial statements. | |||||||||||||||||
67
THE BRINK’S COMPANY
and subsidiaries
Consolidated Statements of Cash Flows
| Years Ended December 31, | ||||||||||||
| (In millions) | 2014 | 2013 | 2012 | |||||||||
| Cash flows from operating activities: | ||||||||||||
| Net income (loss) | $ | (114.8 | ) | 81.1 | 109.7 | |||||||
| Adjustments to reconcile net income (loss) to net cash provided by operating activities: | ||||||||||||
| Loss from discontinued operations, net of tax | 29.1 | 9.2 | 13.4 | |||||||||
| Depreciation and amortization | 161.9 | 165.8 | 148.4 | |||||||||
| Share-based compensation expense | 17.3 | 9.9 | 8.0 | |||||||||
| Deferred income taxes | (28.4 | ) | (34.6 | ) | (43.5 | ) | ||||||
| Gains and losses: | ||||||||||||
| Available-for-sale securities | (0.4 | ) | (0.4 | ) | (2.9 | ) | ||||||
| Property and other assets | (44.9 | ) | (2.4 | ) | (7.6 | ) | ||||||
| Business acquisitions and dispositions | - | (2.8 | ) | (0.8 | ) | |||||||
| Impairment losses | 3.3 | 2.9 | 2.4 | |||||||||
| Retirement benefit funding (more) less than expense: | ||||||||||||
| Pension | (23.6 | ) | 11.3 | (1.9 | ) | |||||||
| Other than pension | 1.5 | 15.0 | 22.3 | |||||||||
| Remeasurement losses due to Venezuela currency devaluations | 121.6 | 13.4 | - | |||||||||
| Other operating | 7.6 | 2.3 | 11.7 | |||||||||
| Changes in operating assets and liabilities, net of effects of acquisitions: | ||||||||||||
| Accounts receivable and income taxes receivable | (90.7 | ) | (69.7 | ) | (70.6 | ) | ||||||
| Accounts payable, income taxes payable and accrued liabilities | 105.5 | 23.6 | 15.7 | |||||||||
| Customer obligations | 15.4 | (9.7 | ) | 13.9 | ||||||||
| Prepaid and other current assets | (9.9 | ) | (19.4 | ) | 3.9 | |||||||
| Other | (14.7 | ) | (11.0 | ) | 7.5 | |||||||
| Discontinued operations | 5.5 | 17.0 | 20.9 | |||||||||
| Net cash provided by operating activities | 141.3 | 201.5 | 250.5 | |||||||||
| Cash flows from investing activities: | ||||||||||||
| Capital expenditures | (136.1 | ) | (172.9 | ) | (170.9 | ) | ||||||
| Acquisitions | (4.6 | ) | (18.1 | ) | (17.2 | ) | ||||||
| Sales of available-for-sale securities | 0.9 | 9.9 | 15.4 | |||||||||
| Sales of other investments and property | 62.7 | 5.9 | 12.5 | |||||||||
| Redemption of cash-surrender value of life insurance policies | - | - | 6.2 | |||||||||
| Other | (3.6 | ) | (0.5 | ) | 4.9 | |||||||
| Discontinued operations | (13.3 | ) | 52.7 | (18.2 | ) | |||||||
| Net cash used by investing activities | (94.0 | ) | (123.0 | ) | (167.3 | ) | ||||||
| Cash flows from financing activities: | ||||||||||||
| Borrowings (repayments) of debt: | ||||||||||||
| Short-term debt | (7.8 | ) | 60.5 | 3.3 | ||||||||
| Long-term revolving credit facilities | 115.0 | 13.8 | (4.5 | ) | ||||||||
| Other long-term debt: | ||||||||||||
| Borrowings | 7.5 | 3.8 | 9.7 | |||||||||
| Repayments | (81.0 | ) | (27.3 | ) | (29.7 | ) | ||||||
| Acquisition of a noncontrolling interest in a subsidiary | - | (18.5 | ) | (9.4 | ) | |||||||
| Payment of acquisition-related obligation | - | (12.8 | ) | - | ||||||||
| Dividends to: | ||||||||||||
| Shareholders of Brink’s | (19.4 | ) | (19.2 | ) | (19.0 | ) | ||||||
| Noncontrolling interests in subsidiaries | (8.6 | ) | (6.0 | ) | (13.0 | ) | ||||||
| Proceeds from exercise of stock options | 0.4 | 6.7 | 1.4 | |||||||||
| Minimum tax withholdings associated with share-based compensation | (1.2 | ) | (3.5 | ) | (5.6 | ) | ||||||
| Other | (1.6 | ) | (1.0 | ) | (1.0 | ) | ||||||
| Discontinued operations | - | (2.5 | ) | (0.2 | ) | |||||||
| Net cash used by financing activities | 3.3 | (6.0 | ) | (68.0 | ) | |||||||
| Effect of exchange rate changes on cash and cash equivalents | (129.9 | ) | (18.7 | ) | 3.6 | |||||||
| Cash and cash equivalents: | ||||||||||||
| Increase (decrease) | (79.3 | ) | 53.8 | 18.8 | ||||||||
| Balance at beginning of period | 255.5 | 201.7 | 182.9 | |||||||||
| Balance at end of period | $ | 176.2 | 255.5 | 201.7 | ||||||||
| See accompanying notes to consolidated financial statements. | ||||||||||||
68
THE BRINK’S COMPANY
and subsidiaries
NOTES TO CONSOLIDATED FINANCIAL STATEMENTS
The Brink’s Company (along with its subsidiaries, “we,” “our,” “Brink’s” or the “Company”), based in Richmond, Virginia, is a leading provider of secure transportation, cash management services and other security-related services to banks and financial institutions, retailers, government agencies, mints, jewelers and other commercial operations around the world. Brink’s is the oldest and largest secure transportation and cash management services company in the U.S., and a market leader in many other countries.
The consolidated financial statements include the accounts of Brink’s and the subsidiaries it controls. Control is determined based on ownership rights or, when applicable, based on whether we are considered to be the primary beneficiary of a variable interest entity. Our interest in 20% to 50% owned companies that are not controlled are accounted for using the equity method (“equity affiliates”), unless we do not sufficiently influence the management of the investee. Other investments are accounted for as cost-method investments or as available-for-sale. All significant intercompany accounts and transactions have been eliminated in consolidation.
Revenue is recognized when services related to armored vehicle transportation, ATM services, cash management services, payment services, guarding and the secure international transportation of valuables are performed. Customer contracts have prices that are fixed and determinable and we assess the customer’s ability to meet the contractual terms, including payment terms, before entering into contracts. Customer contracts generally are automatically extended after the initial contract period until either party terminates the agreement. Taxes collected from customers and remitted to governmental authorities are not included in revenues in the consolidated statements of income (loss).
Cash and cash equivalents include cash on hand, demand deposits and investments with original maturities of three months or less. Cash and cash equivalents includes amounts held by certain of our secure cash management services operations for customers for which, under local regulations, the title transfers to us for a short period of time. The cash is generally credited to customers’ accounts the following day and we do not consider it as available for general corporate purposes in the management of our liquidity and capital resources. We record a liability for the amounts owed to customers (see note 12).
Trade accounts receivable are recorded at the invoiced amount and do not bear interest. The allowance for doubtful accounts is our best estimate of the amount of probable credit losses on our existing accounts receivable. We determine the allowance based on historical write-off experience. We review our allowance for doubtful accounts quarterly. Account balances are charged off against the allowance after all means of collection have been exhausted and the potential for recovery is considered remote.
Property and equipment are recorded at cost. Depreciation is calculated principally on the straight-line method based on the estimated useful lives of individual assets or classes of assets.
Leased property and equipment meeting capital lease criteria are capitalized at the lower of the present value of the related lease payments or the fair value of the leased asset at the inception of the lease. Amortization is calculated on the straight-line method based on the lease term.
Leasehold improvements are recorded at cost. Amortization is calculated principally on the straight-line method over the lesser of the estimated useful life of the leasehold improvement or lease term. Renewal periods are included in the lease term when the renewal is determined to be reasonably assured.
69
Part of the costs related to the development or purchase of internal-use software is capitalized and amortized over the estimated useful life of the software. Costs that are capitalized include external direct costs of materials and services to develop or obtain the software, and internal costs, including compensation and employee benefits for employees directly associated with a software development project.
| Estimated Useful Lives | Years |
| Buildings | 16 to 25 |
| Building leasehold improvements | 3 to 10 |
| Vehicles | 3 to 10 |
| Capitalized software | 3 to 5 |
| Other machinery and equipment | 3 to 10 |
Expenditures for routine maintenance and repairs on property and equipment are charged to expense. Major renewals, betterments and modifications are capitalized and depreciated over the lesser of the remaining life of the asset or, if applicable, the lease term.
Goodwill is recognized for the excess of the purchase price over the fair value of tangible and identifiable intangible net assets of businesses acquired. Intangible assets arising from business acquisitions include customer lists, customer relationships, covenants not to compete, trademarks and other identifiable intangibles. At December 31, 2014, finite-lived intangible assets have remaining useful lives ranging from 1 to 13 years and are amortized based on the pattern in which the economic benefits are used or on a straight-line basis.
Impairment of Long-Lived Assets
Goodwill is not amortized but is tested at least annually for impairment at the reporting unit level, which is at the operating segment level or one level below an operating segment. Goodwill is assigned to one or more reporting units at the date of acquisition. Prior to the restructuring of our global organization in the fourth quarter of 2014, our reporting units were Latin America, EMEA, North America and Asia Pacific. We performed our annual goodwill impairment test on these reporting units as of October 1, 2014.
After the 2014 restructuring, we now have ten reporting units which are comprised of:
| · | each of the five countries within Largest 5 Markets (U.S., France, Mexico, Brazil and Canada), |
| · | each of the three regions within Global Markets (Latin America, EMEA and Asia), |
| · | the Latin American Payment Services businesses, and |
| · | the U.S. Payment Services business |
We performed a goodwill impairment test on the new reporting units that had goodwill as of December 31, 2014.
For both goodwill impairment tests performed in the fourth quarter of 2014, we performed quantitative analyses to determine whether reporting unit fair values exceeded their carrying amounts. We based our estimates of fair value on projected future cash flows and completed these impairment tests, as well as the annual tests in the previous two years, with no impairment charges required.
Indefinite-lived intangibles are also tested for impairment at least annually by comparing their carrying values to their estimated fair values. We have had no significant impairments of indefinite-lived intangibles in the last three years.
Long-lived assets other than goodwill and other indefinite-lived intangibles are reviewed for impairment when events or changes in circumstances indicate the carrying value of an asset may not be recoverable.
For long-lived assets other than goodwill that are to be held and used in operations, an impairment is indicated when the estimated total undiscounted cash flow associated with the asset or group of assets is less than carrying value. If impairment exists, an adjustment is made to write the asset down to its fair value, and a loss is recorded as the difference between the carrying value and fair value.
70
We account for retirement benefit obligations under FASB ASC Topic 715, Compensation – Retirement Benefits. For U.S. and certain non-U.S. retirement plans, we derive the discount rates used to measure the present value of benefit obligations using the cash flow matching method. Under this method, we compare the plan’s projected payment obligations by year with the corresponding yields on a Mercer yield curve. Each year’s projected cash flows are then discounted back to their present value at the measurement date and an overall discount rate is determined. The overall discount rate is then rounded to the nearest tenth of a percentage point. In non-U.S. locations where the cash flow matching method is not possible, rates of local high-quality long-term corporate bonds are used to select the discount rate.
We used Mercer’s Above-Mean Curve to determine the discount rates for year-end benefit obligations.
We select the expected long-term rate of return assumption for our U.S. pension plan and retiree medical plans using advice from an investment advisor and an actuary. The selected rate considers plan asset allocation targets, expected overall investment manager performance and long-term historical average compounded rates of return.
Benefit plan experience gains and losses are recognized in other comprehensive income (loss). Accumulated net benefit plan experience gains and losses that exceed 10% of the greater of a plan’s benefit obligation or plan assets at the beginning of the year are amortized into earnings from other comprehensive income (loss) on a straight-line basis. The amortization period for pension plans is the average remaining service period of employees expected to receive benefits under the plans. The amortization period for other retirement plans is primarily the average remaining life expectancy of inactive participants.
Deferred tax assets and liabilities are recorded to recognize the expected future tax benefits or costs of events that have been, or will be, reported in different years for financial statement purposes than tax purposes. Deferred tax assets and liabilities are determined based on the difference between the financial statement and tax bases of assets and liabilities using enacted tax rates in effect for the year in which these items are expected to reverse. We recognize tax benefits related to uncertain tax positions if we believe it is more likely than not the benefit will be realized. We review our deferred tax assets to determine if it is more-likely-than-not that they will be realized. If we determine it is not more-likely-than-not that a deferred tax asset will be realized, we record a valuation allowance to reverse the previously recognized tax benefit.
Our consolidated financial statements are reported in U.S. dollars. Our foreign subsidiaries maintain their records primarily in the currency of the country in which they operate.
The method of translating local currency financial information into U.S. dollars depends on whether the economy in which our foreign subsidiary operates has been designated as highly inflationary or not. Economies with a three-year cumulative inflation rate of more than 100% are considered highly inflationary.
Assets and liabilities of foreign subsidiaries in non-highly inflationary economies are translated into U.S. dollars using rates of exchange at the balance sheet date. Translation adjustments are recorded in other comprehensive income (loss). Revenues and expenses are translated at rates of exchange in effect during the year. Transaction gains and losses are recorded in net income.income (loss).
Foreign subsidiaries that operate in highly inflationary countries use the U.S. dollar as their functional currency. Local currency monetary assets and liabilities are remeasured into U.S. dollars using rates of exchange as of each balance sheet date, with remeasurement adjustments and other transaction gains and losses recognized in earnings. Non-monetary assets and liabilities do not fluctuate with changes in local currency exchange rates to the dollar.
Venezuela
Brink’s Venezuela accounted for $447$212 million or 11%6% of total Brink’s revenues and represented a significant component of 2014 total segment operating profit in 2013.before items not allocated to segments. At December 31, 2013,2014, we had investments in our Venezuelan operations of $125.3$59.6 million on an equity-method basis. At December 31, 2013,2014, we had bolivar denominated net monetary assets of $120.4$23.5 million, including $93.8$12.6 million of cash and cash equivalents denominated in bolivars.
The economy in Venezuela has had significant inflation in the last several years. We consolidate our Venezuelan results using our accounting policy for subsidiaries operating in highly inflationary economies.
The government devalued the official rate for essential services in February 2013 from 5.3 to 6.3 bolivars to the dollar. In January 2014,
Late in 2013, the government expanded an alternateadded another official exchange process, to obtain dollarsknown as SICAD, for travel and certain other purposes. Rates obtained bypurposes, made available at government discretion. The published rate for this process in 2014 ranged from 10 to 12 bolivars to the alternateU.S. dollar. Since the end of the first quarter of 2013, we have only been able to obtain dollars once using the SICAD process. We do not know whether we will be able to access the SICAD process again in the future.
In March 2014, the government initiated another exchange mechanism known as SICAD II. Conversions under this mechanism were also subject to specific eligibility requirements. Transactions were reported to be 11.3in a range of 49 to 52 bolivars to U.S. dollars inthe dollar. Through December 2013.31, 2014, we received approval to obtain $1.2 million (weighted average exchange rate of 51) through the SICAD II mechanism.
As a result of thesethe restrictions on currency exchange, we have in the past been unable to obtain sufficient U.S. dollars to purchase certain imported supplies and fixed assets to fully operate our business in Venezuela, and as a result,Venezuela. Consequently, we have occasionally purchased more expensive, locally denominatedbolivar-denominated supplies and fixed assets. The restrictions alsoFurthermore, there is a risk that the new SIMADI process will be discontinued or not accessible when needed in the future, which may prevent us from repatriating earnings and from being fully compensated for intercompany services.dividends or obtaining dollars to operate our Venezuelan operations.
Remeasurement rate during 2012. We used an official rate of 5.3 bolivars to the dollar to remeasure our bolivar-denominated monetary assets and liabilities into U.S. dollars and to translate our revenues and expenses.
Remeasurement rates during 2013. Through January 31, 2013, we used an official rate of 5.3 bolivars to the dollar to remeasure our bolivar denominatedbolivar-denominated monetary assets and liabilities into U.S. dollars and to translate our revenuerevenues and expenses. After the devaluation in February 2013, we began to use the 6.3 official exchange rate to remeasure bolivar denominated monetary assets and liabilities and to translate our revenuerevenues and expenses. As a result of the devaluation, weWe recognized a $13.4 million net remeasurement loss in 2013 when we changed from the 5.3 to 6.3 exchange rate. The after-tax effect of these losses attributable to noncontrolling interests was $4.7 million in 2013.
Remeasurement rates during 2014. Through March 23, 2014, we used the official rate of 6.3 bolivars to the dollar to remeasure our bolivar denominated monetary assets and liabilities into U.S. dollars and to translate our revenues and expenses. Effective March 24, 2014, we began to use the exchange rate published for the SICAD II process to remeasure bolivar denominated monetary assets and liabilities and to translate our revenues and expenses. We recognized a $121.6 million net remeasurement loss in 2014 when we changed from the official rate of 6.3 to the SICAD II exchange rate, which averaged approximately 50 since opening on March 24, 2014 until implementation of a new exchange process in February 2015 (SIMADI). Transaction gains and losses since March 31, 2014 have not been significant. At December 31, 2014, the rate was approximately 50. The after-tax effect of these losses attributable to noncontrolling interests was $39.7 million in 2014.
72
Remeasuring our Venezuelan results using the SICAD II rate has had the following effects on our reported results:
| · | Brink’s Venezuela has become a less-significant component of Brink’s consolidated revenues and operating profit. |
| · | Brink’s Venezuela’s profit margin percentage declined as the historical U.S. dollar nonmonetary assets were not remeasured to a lower U.S. dollar basis but instead retained a historical higher basis which was used for depreciation and other expense attribution. Our nonmonetary assets were $59.9 million at December 31, 2013, and $55.0 million at December 31, 2014. |
| · | Our investment in our Venezuelan operations on an equity-method basis has declined. Our investment was $125.3 million at December 31, 2013, and $59.6 million at December 31, 2014. |
| · | Our bolivar-denominated net monetary assets included in our consolidated balance sheets have declined. Our bolivar-denominated net monetary assets were $120.4 million (including $93.8 million of cash and cash equivalents) at December 31, 2013, and $23.5 million (including $12.6 million of cash and cash equivalents) at December 31, 2014. |
We routinely assess the financial strength of significant customers and this assessment, combined with the large number and geographic diversity of our customers, limits our concentration of risk with respect to accounts receivable. Financial instruments which potentially subject us to concentrations of credit risks are principally cash and cash equivalents and accounts receivables. Cash and cash equivalents are held by major financial institutions.
In accordance with U.S. generally accepted accounting principles (“GAAP”), we have made a number of estimates and assumptions relating to the reporting of assets and liabilities and the disclosure of contingent assets and liabilities to prepare these consolidated financial statements. Actual results could differ materially from those estimates. The most significant estimates are related to goodwill, intangibles and other long-lived assets, pension and other retirement benefit assets and obligations, legal contingencies, deferred tax assets, purchase price allocations and foreign currency translation.
Fair-value estimates. We have various financial instruments included in our financial statements. Financial instruments are carried in our financial statements at either cost or fair value. We estimate fair value of assets using the following hierarchy using the highest level possible:
| Level 1: Quoted prices in active markets that are accessible at the measurement date for identical assets and liabilities. |
| Level 2: Observable prices that are based on inputs not quoted on active markets, but are corroborated by market data. |
| Level 3: Unobservable inputs are used when little or no market data is available. |
New Accounting Standard
In May 2014, the Financial Accounting Standards Board (“FASB”) issued a new standard related to revenue recognition, which requires an entity to recognize the amount of revenue to which it expects to be entitled for the transfer of promised goods or services to customers. The new standard will replace most of the existing revenue recognition standards in U.S. GAAP when it becomes effective on January 1, 2017. Early adoption is not permitted. The new standard can be applied retrospectively to each prior reporting period presented or retrospectively with the cumulative effect of the change recognized at the date of the initial application in retained earnings. We are assessing the potential impact of the new standard on financial reporting and have not yet selected a transition method.
We identify our operating segments based on how our chief operating decision maker (“CODM”) allocates resources, assesses performance and makes decisions. Our CODM is our President and Chief Executive Officer. Our CODM evaluates performance and allocates resources to each operating segment based on operating profit or loss, for the geographic components of Brink’s, excluding non-segment expenses.income and expenses not allocated to segments.
As a result of this reorganization, beginning in 2014, we report financial results in the following nine operating segments:
| · | Each of the five countries within Largest 5 Markets (U.S., France, Mexico, Brazil and Canada) |
| · | Each of the three regions within Global Markets (Latin America, EMEA and Asia) |
| · | Payment Services |
We currently serve customers in more than 100 countries, including 4341 countries where we operate subsidiaries.
The primary services of the reportable segments include:
| · |
| · | ATM Services – replenishing and maintaining customers’ automated teller machines; providing network infrastructure services |
| · | Global Services – secure international transportation of valuables |
| · | Cash Management Services |
| o |
| o | Safe and safe control device installation and servicing (including our patented CompuSafe® service) |
| o | Check and cash processing services for banking customers (“Virtual Vault Services”) |
| o | Check imaging services for banking customers |
| · | Payment Services – bill payment and processing services on behalf of utility companies and other billers at any of our Brink’s or Brink’s operated payment locations in Latin |
| · |
| Years Ended December 31, | |||||||||
| (In millions) | 2013 | 2012 | 2011 | ||||||
| Revenues by Business Segment | |||||||||
| Latin America | $ | 1,720.7 | 1,579.4 | 1,460.7 | |||||
| EMEA | 1,178.3 | 1,125.9 | 1,143.0 | ||||||
| North America | 898.4 | 893.3 | 923.4 | ||||||
| Asia Pacific | 144.8 | 136.4 | 135.8 | ||||||
| Total | $ | 3,942.2 | 3,735.0 | 3,662.9 | |||||
| Operating Profit by Business Segment | |||||||||
| Latin America | $ | 149.9 | 135.1 | 143.5 | |||||
| EMEA | 81.5 | 88.1 | 73.4 | ||||||
| North America | 4.7 | 31.9 | 30.3 | ||||||
| Asia Pacific | 16.7 | 8.8 | 15.1 | ||||||
| Business segments | 252.8 | 263.9 | 262.3 | ||||||
| Non-segment | (81.1) | (88.9) | (59.8) | ||||||
| Total | $ | 171.7 | 175.0 | 202.5 | |||||
| Years Ended December 31, | |||||||||
| (In millions) | 2013 | 2012 | 2011 | ||||||
| Capital Expenditures by Business Segment | |||||||||
| Latin America | $ | 88.7 | 83.8 | 85.0 | |||||
| EMEA | 33.9 | 40.1 | 47.3 | ||||||
| North America | 52.1 | 48.2 | 44.2 | ||||||
| Asia Pacific | 3.0 | 5.8 | 7.2 | ||||||
| Total | $ | 177.7 | 177.9 | 183.7 | |||||
| Depreciation and Amortization by Business Segment | |||||||||
| Depreciation and amortization of property and equipment: | |||||||||
| Latin America | 57.1 | 47.5 | 41.4 | ||||||
| EMEA | 47.2 | 41.1 | 44.1 | ||||||
| North America | 58.0 | 55.1 | 50.1 | ||||||
| Asia Pacific | 4.8 | 4.8 | 3.8 | ||||||
| Property and equipment | 167.1 | 148.5 | 139.4 | ||||||
| Amortization of intangible assets: | |||||||||
| Latin America | 3.7 | 3.2 | 3.9 | ||||||
| EMEA | 1.6 | 2.6 | 2.9 | ||||||
| North America | 0.2 | 0.3 | 0.7 | ||||||
| Asia Pacific | 1.0 | 1.1 | 1.2 | ||||||
| Total | $ | 173.6 | 155.7 | 148.1 | |||||
| Revenues | Operating Profit (Loss) | |||||||||||||||||||||||
| Years Ended December 31, | Years Ended December 31, | |||||||||||||||||||||||
| (In millions) | 2014 | 2013 | 2012 | 2014 | 2013 | 2012 | ||||||||||||||||||
| Reportable Segments: | ||||||||||||||||||||||||
| U.S. | $ | 727.8 | 707.5 | 706.7 | $ | 22.8 | 12.8 | 32.0 | ||||||||||||||||
| France | 517.4 | 517.6 | 511.4 | 39.4 | 44.5 | 39.7 | ||||||||||||||||||
| Mexico | 388.2 | 423.9 | 395.0 | 9.6 | 26.9 | 17.7 | ||||||||||||||||||
| Brazil | 364.1 | 354.4 | 363.6 | 34.2 | 41.1 | 39.9 | ||||||||||||||||||
| Canada | 179.7 | 191.4 | 187.5 | 12.8 | 10.5 | 9.3 | ||||||||||||||||||
| Largest 5 Markets | 2,177.2 | 2,194.8 | 2,164.2 | 118.8 | 135.8 | 138.6 | ||||||||||||||||||
| Latin America | 592.4 | 854.2 | 744.4 | 90.6 | 136.2 | 90.0 | ||||||||||||||||||
| EMEA | 556.3 | 540.6 | 503.1 | 52.5 | 47.0 | 45.3 | ||||||||||||||||||
| Asia | 139.8 | 134.2 | 125.9 | 23.1 | 21.0 | 14.8 | ||||||||||||||||||
| Global Markets | 1,288.5 | 1,529.0 | 1,373.4 | 166.2 | 204.2 | 150.1 | ||||||||||||||||||
| Payment Services | 96.6 | 54.8 | 40.0 | (4.9 | ) | 1.0 | 1.2 | |||||||||||||||||
| Total reportable segments | 3,562.3 | 3,778.6 | 3,577.6 | 280.1 | 341.0 | 289.9 | ||||||||||||||||||
| Reconciling Items: | ||||||||||||||||||||||||
| Corporate items: | ||||||||||||||||||||||||
| General, administrative and other expenses | - | - | - | (108.8 | ) | (116.4 | ) | (87.4 | ) | |||||||||||||||
| Reconciliation of segment policies to GAAP | - | - | - | (2.3 | ) | 2.7 | 4.5 | |||||||||||||||||
| Other items not allocated to segments: | ||||||||||||||||||||||||
| FX devaluation in Venezuela | - | - | - | (142.7 | ) | (14.6 | ) | - | ||||||||||||||||
| U.S. retirement plans (see note 3) | - | - | - | (73.1 | ) | (52.9 | ) | (56.2 | ) | |||||||||||||||
| 2014 Reorganization and Restructuring | - | - | - | (21.8 | ) | - | - | |||||||||||||||||
| Acquisitions and dispositions | - | - | - | 49.4 | 5.8 | 14.6 | ||||||||||||||||||
| Mexican settlement losses (see note 3) | - | - | - | (5.9 | ) | (2.4 | ) | (3.2 | ) | |||||||||||||||
| Share-based compensation adj. (see note 17) | - | - | - | (2.4 | ) | - | - | |||||||||||||||||
| Total | $ | 3,562.3 | 3,778.6 | 3,577.6 | $ | (27.5 | ) | 163.2 | 162.2 | |||||||||||||||
FX devaluation in Venezuela The rate we use to remeasure operations in Venezuela declined 16% in February 2013 (from 5.3 to 6.3 bolivars to the U.S. dollar) and 88% in March 2014 (from 6.3 to 50 bolivars to the U.S. dollar). Expenses related to remeasured net monetary assets were $121.6 million in 2014 and $13.4 million in 2013. In addition, nonmonetary assets were not remeasured to a lower basis when the currency devalued. Instead, under highly inflationary accounting rules, these assets retained their higher historical bases, which excess is recognized in earnings as the asset is consumed resulting in incremental expense until the excess bases are depleted. Higher expenses related to nonmonetary assets were $21.1 million in 2014 and $1.2 million in 2013. Expenses related to these Venezuelan devaluations have not been allocated to segment results.
| December 31, | |||||||||
| (In millions) | 2013 | 2012 | 2011 | ||||||
| Assets held by Business Segment | |||||||||
| Latin America | $ | 1,044.0 | 880.9 | 761.0 | |||||
| EMEA | 672.6 | 681.3 | 669.4 | ||||||
| North America | 426.6 | 480.5 | 468.6 | ||||||
| Asia Pacific | 108.1 | 146.3 | 135.5 | ||||||
| Business Segments | 2,251.3 | 2,189.0 | 2,034.5 | ||||||
| Non-segment | 246.7 | 364.9 | 371.7 | ||||||
| Total | $ | 2,498.0 | 2,553.9 | 2,406.2 | |||||
Long-Lived Assets by Geographic Area(a) | |||||||||
| Non-U.S.: | |||||||||
| France | $ | 161.8 | 163.5 | 149.9 | |||||
| Mexico | 148.1 | 145.3 | 123.9 | ||||||
| Venezuela | 47.7 | 46.7 | 43.5 | ||||||
| Brazil | 107.9 | 95.6 | 100.9 | ||||||
| Canada | 50.7 | 90.8 | 87.3 | ||||||
| Other | 335.0 | 348.8 | 338.1 | ||||||
| Subtotal | 851.2 | 890.7 | 843.6 | ||||||
| United States | 194.0 | 203.0 | 200.8 | ||||||
| Total | $ | 1,045.2 | 1,093.7 | 1,044.4 | |||||
| (a) Long-lived assets include property and equipment, net; goodwill; and other intangible assets, net. | |||||||||
| Years Ended December 31, | |||||||||
| (In millions) | 2013 | 2012 | 2011 | ||||||
Revenues by Geographic Area(a) | |||||||||
| Outside the U.S.: | |||||||||
| France | $ | 542.5 | 535.5 | 545.2 | |||||
| Mexico | 450.4 | 424.0 | 415.2 | ||||||
| Venezuela | 447.1 | 342.6 | 269.2 | ||||||
| Brazil | 392.0 | 388.3 | 386.8 | ||||||
| Canada | 190.9 | 186.6 | 189.9 | ||||||
| Other | 1,211.8 | 1,151.3 | 1,123.1 | ||||||
| Subtotal | 3,234.7 | 3,028.3 | 2,929.4 | ||||||
| United States | 707.5 | 706.7 | 733.5 | ||||||
| Total | $ | 3,942.2 | 3,735.0 | 3,662.9 | |||||
Acquisitions and dispositions Gains and losses related to acquisitions and dispositions that have not been allocated to segment results are described below:
| · | Brink’s sold an equity investment in a CIT business in Peru and recognized a $44.3 million gain in 2014. Other divestiture gains in 2014 were $0.6 million. Equity earnings related to our former investment in Peru recognized in prior periods ($3.8 million in 2014, $6.1 million in 2013 and $5.8 million in 2012). |
| · | Adjustments to the 2010 business acquisition gain for Mexico ($0.7 million favorable adjustment in 2014, $1.1 million in unfavorable adjustments in 2013 and a $2.1 million favorable adjustment in 2012). |
| · | Adjustments to the purchase price of the January 2013 acquisition of Rede Trel in Brazil ($1.7 million of favorable adjustments in 2013). |
| · | The $0.9 million impairment in 2013 of an intangible asset acquired in the 2009 India acquisition. |
| · | A 2012 gain on the sale of real estate in Venezuela ($7.2 million). |
| · | Unfavorable adjustments of $0.5 million recognized in 2012 related to various acquisitions and dispositions. |
75
| Years Ended December 31, | ||||||||||||
| (In millions) | 2014 | 2013 | 2012 | |||||||||
| Capital Expenditures by Business Segment | ||||||||||||
| U.S. | $ | 31.1 | 42.4 | 39.0 | ||||||||
| France | 17.9 | 13.8 | 15.8 | |||||||||
| Mexico | 13.3 | 24.5 | 27.4 | |||||||||
| Brazil | 14.7 | 13.2 | 12.4 | |||||||||
| Canada | 6.4 | 9.6 | 9.1 | |||||||||
| Largest 5 Markets | 83.4 | 103.5 | 103.7 | |||||||||
| Latin America | 22.4 | 26.8 | 37.3 | |||||||||
| EMEA | 9.2 | 8.9 | 9.8 | |||||||||
| Asia | 3.6 | 2.4 | 4.4 | |||||||||
| Global Markets | 35.2 | 38.1 | 51.5 | |||||||||
| Payment Services | 0.8 | 1.5 | 1.8 | |||||||||
| Segments | 119.4 | 143.1 | 157.0 | |||||||||
| Corporate items | 16.7 | 29.8 | 13.9 | |||||||||
| Total | $ | 136.1 | 172.9 | 170.9 | ||||||||
| Depreciation and Amortization by Business Segment | ||||||||||||
| Depreciation and amortization of property and equipment: | ||||||||||||
| U.S. | $ | 49.8 | 49.1 | 45.6 | ||||||||
| France | 19.3 | 22.1 | 20.6 | |||||||||
| Mexico | 19.6 | 19.2 | 14.3 | |||||||||
| Brazil | 8.8 | 9.0 | 8.7 | |||||||||
| Canada | 8.5 | 8.3 | 9.0 | |||||||||
| Largest 5 Markets | 106.0 | 107.7 | 98.2 | |||||||||
| Latin America | 21.9 | 22.5 | 21.1 | |||||||||
| EMEA | 13.6 | 16.9 | 12.5 | |||||||||
| Asia | 3.2 | 3.7 | 3.6 | |||||||||
| Global Markets | 38.7 | 43.1 | 37.2 | |||||||||
| Payment Services | 2.2 | 2.2 | 1.3 | |||||||||
| Segments | 146.9 | 153.0 | 136.7 | |||||||||
| Corporate items | 9.5 | 6.4 | 4.5 | |||||||||
| Depreciation and amortization of property and equipment | 156.4 | 159.4 | 141.2 | |||||||||
| Amortization of intangible assets: | ||||||||||||
| U.S. | - | 0.2 | 0.3 | |||||||||
| France | 0.3 | 0.4 | 0.3 | |||||||||
| Brazil | 1.4 | 1.7 | 2.1 | |||||||||
| Largest 5 Markets | 1.7 | 2.3 | 2.7 | |||||||||
| Latin America | 0.3 | 0.4 | 0.4 | |||||||||
| EMEA | 1.1 | 1.2 | 2.3 | |||||||||
| Asia | 0.9 | 1.0 | 1.1 | |||||||||
| Global Markets | 2.3 | 2.6 | 3.8 | |||||||||
| Payment Services | 1.5 | 1.5 | 0.7 | |||||||||
| Amortization of intangible assets | 5.5 | 6.4 | 7.2 | |||||||||
| Total | $ | 161.9 | 165.8 | 148.4 | ||||||||
76
| December 31, | ||||||||||||
| (In millions) | 2014 | 2013 | 2012 | |||||||||
| Assets held by Segment | ||||||||||||
| U.S. | $ | 327.4 | 330.0 | 345.2 | ||||||||
| France | 244.7 | 246.6 | 244.1 | |||||||||
| Mexico | 258.9 | 285.1 | 269.3 | |||||||||
| Brazil | 165.0 | 165.8 | 165.7 | |||||||||
| Canada | 92.3 | 96.5 | 120.4 | |||||||||
| Largest 5 Markets | 1,088.3 | 1,124.0 | 1,144.7 | |||||||||
| Latin America | 296.0 | 521.1 | 418.0 | |||||||||
| EMEA | 308.0 | 382.8 | 433.9 | |||||||||
| Asia | 109.2 | 115.1 | 148.3 | |||||||||
| Global Markets | 713.2 | 1,019.0 | 1,000.2 | |||||||||
| Payment Services | 63.7 | 72.0 | 27.9 | |||||||||
| Segments | 1,865.2 | 2,215.0 | 2,172.8 | |||||||||
| Corporate items | 327.0 | 283.0 | 381.1 | |||||||||
| Total | $ | 2,192.2 | 2,498.0 | 2,553.9 | ||||||||
Long-Lived Assets by Geographic Area(a) | ||||||||||||
| Non-U.S.: | ||||||||||||
| France | $ | 75.7 | 88.5 | 94.3 | ||||||||
| Mexico | 114.4 | 136.8 | 133.7 | |||||||||
| Brazil | 47.9 | 47.6 | 47.9 | |||||||||
| Canada | 47.9 | 50.7 | 68.4 | |||||||||
| Other | 175.5 | 216.3 | 240.0 | |||||||||
| Subtotal | 461.4 | 539.9 | 584.3 | |||||||||
| U.S. | 208.1 | 218.8 | 209.5 | |||||||||
| Total | $ | 669.5 | 758.7 | 793.8 | ||||||||
| (a) Long-lived assets include only property and equipment. | ||||||||||||
| Years Ended December 31, | ||||||||||||
| (In millions) | 2014 | 2013 | 2012 | |||||||||
Revenues by Geographic Area(a) | ||||||||||||
| Outside the U.S.: | ||||||||||||
| France | $ | 517.4 | 542.5 | 535.5 | ||||||||
| Mexico | 388.5 | 424.1 | 395.0 | |||||||||
| Brazil | 442.3 | 392.0 | 388.3 | |||||||||
| Canada | 179.7 | 191.4 | 187.5 | |||||||||
| Other | 1,305.8 | 1,521.1 | 1,364.6 | |||||||||
| Subtotal | 2,833.7 | 3,071.1 | 2,870.9 | |||||||||
| U.S. | 728.6 | 707.5 | 706.7 | |||||||||
| Total | $ | 3,562.3 | 3,778.6 | 3,577.6 | ||||||||
| December 31, | ||||||||
| (In millions) | 2013 | 2012 | 2011 | |||||
| Net assets outside the U.S. | ||||||||
| Latin America | $ | 479.4 | 438.2 | 376.9 | ||||
| EMEA | 291.4 | 272.1 | 283.4 | |||||
| Asia Pacific | 72.7 | 89.1 | 85.8 | |||||
| Canada | 69.3 | 43.2 | 56.8 | |||||
| Total | $ | 912.8 | 842.6 | 802.9 | ||||
| December 31, | ||||||||||||
| (In millions) | 2014 | 2013 | 2012 | |||||||||
| Net assets outside the U.S. | ||||||||||||
| France | $ | 96.3 | 110.8 | 79.2 | ||||||||
| Other EMEA countries | 146.1 | 180.6 | 192.9 | |||||||||
| Mexico | 88.4 | 101.2 | 131.5 | |||||||||
| Brazil | 111.1 | 105.2 | 103.1 | |||||||||
| Other Latin America countries | 182.4 | 273.0 | 203.6 | |||||||||
| Asian countries | 69.2 | 72.7 | 89.1 | |||||||||
| Canada | 53.4 | 69.3 | 43.2 | |||||||||
| Total | $ | 746.9 | 912.8 | 842.6 | ||||||||
| (In millions) | 2013 | 2012 | 2011 | ||||||
| Information about Unconsolidated Equity Affiliates held by segments: | |||||||||
| Carrying value of investments at year end | |||||||||
| Latin America | $ | 13.5 | 13.8 | 11.2 | |||||
| Asia Pacific | 2.3 | 1.8 | 1.6 | ||||||
| Total | $ | 15.8 | 15.6 | 12.8 | |||||
| Share of earnings included in Brink's consolidated earnings during the year | |||||||||
| Latin America | $ | 6.0 | 5.8 | 4.7 | |||||
| EMEA | - | - | (0.1) | ||||||
| Asia Pacific | 0.7 | 0.2 | 0.2 | ||||||
| Total | $ | 6.7 | 6.0 | 4.8 | |||||
| Undistributed earnings at year end | |||||||||
| Latin America | $ | 3.5 | 8.4 | 6.6 | |||||
| Asia Pacific | 0.8 | 0.4 | 0.5 | ||||||
| Total | $ | 4.3 | 8.8 | 7.1 | |||||
| (In millions) | 2014 | 2013 | 2012 | |||||||||
| Information about Unconsolidated Equity Affiliates held by Global Markets – Asia Segment: | ||||||||||||
| Carrying value of investments at December 31 | $ | 2.7 | 2.3 | 1.8 | ||||||||
| Undistributed earnings at December 31 | 1.1 | 0.8 | 0.4 | |||||||||
| Share of earnings included in Brink's consolidated earnings during the year | 0.5 | 0.7 | 0.2 | |||||||||
| Brink’s sold an equity investment in a CIT business in Peru in 2014. This investment is not allocated to segments. The carrying value was $13.5 million at December 31, 2013, and $13.8 million at December 31, 2012. The equity earnings from this investment were $3.8 million in 2014, $6.1 million in 2013 and $5.8 million in 2012. | ||||||||||||
Note 3 – Retirement Benefits
Defined-benefit Pension Plans
Summary
We have various defined-benefit pension plans covering eligible current and former employees. Benefits under most plans are based on salary and years of service. Pension benefits provided to eligible U.S. employees were frozen on December 31, 2005. There are limits to the amount of benefits which can be paid to participants from a U.S. qualified pension plan. We maintain a nonqualified U.S. plan to pay benefits for those eligible current and former employees in the U.S. whose benefits exceed the regulatory limits.
Components of Net Periodic Pension Cost
| (In millions) | U.S. Plans | Non-U.S. Plans | Total | |||||||||||||||||||||||||||||||||
| Years Ended December 31, | 2014 | 2013 | 2012 | 2014 | 2013 | 2012 | 2014 | 2013 | 2012 | |||||||||||||||||||||||||||
| Service cost | $ | - | - | - | $ | 12.5 | 15.0 | 11.1 | $ | 12.5 | 15.0 | 11.1 | ||||||||||||||||||||||||
| Interest cost on projected benefit obligation | 45.3 | 42.2 | 43.8 | 18.4 | 19.1 | 19.1 | 63.7 | 61.3 | 62.9 | |||||||||||||||||||||||||||
| Return on assets – expected | (63.9 | ) | (56.9 | ) | (60.0 | ) | (14.4 | ) | (12.9 | ) | (12.2 | ) | (78.3 | ) | (69.8 | ) | (72.2 | ) | ||||||||||||||||||
| Amortization of losses | 28.2 | 45.1 | 39.5 | 2.3 | 6.1 | 4.0 | 30.5 | 51.2 | 43.5 | |||||||||||||||||||||||||||
| Amortization of prior service cost | - | - | - | 1.0 | 0.8 | 2.0 | 1.0 | 0.8 | 2.0 | |||||||||||||||||||||||||||
Settlement loss (a) | 56.1 | 0.1 | 5.0 | 6.3 | 2.6 | 3.3 | 62.4 | 2.7 | 8.3 | |||||||||||||||||||||||||||
| Net periodic pension cost | $ | 65.7 | 30.5 | 28.3 | $ | 26.1 | 30.7 | 27.3 | $ | 91.8 | 61.2 | 55.6 | ||||||||||||||||||||||||
| Included in: | ||||||||||||||||||||||||||||||||||||
| Continuing operations | $ | 65.7 | 30.5 | 28.3 | $ | 24.4 | 28.7 | 25.2 | $ | 90.1 | 59.2 | 53.5 | ||||||||||||||||||||||||
| Discontinued operations | - | - | - | 1.7 | 2.0 | 2.1 | 1.7 | 2.0 | 2.1 | |||||||||||||||||||||||||||
| Net periodic pension cost | $ | 65.7 | 30.5 | 28.3 | $ | 26.1 | 30.7 | 27.3 | $ | 91.8 | 61.2 | 55.6 | ||||||||||||||||||||||||
| (In millions) | U.S. Plans | Non-U.S. Plans | Total | |||||||||||
| Years Ended December 31, | 2013 | 2012 | 2011 | 2013 | 2012 | 2011 | 2013 | 2012 | 2011 | |||||
| Service cost | $ | - | - | - | $ | 15.0 | 11.1 | 10.2 | $ | 15.0 | 11.1 | 10.2 | ||
| Interest cost on projected benefit obligation | 42.2 | 43.8 | 46.2 | 19.1 | 19.1 | 16.9 | 61.3 | 62.9 | 63.1 | |||||
| Return on assets – expected | (56.9) | (60.0) | (65.0) | (12.9) | (12.2) | (12.0) | (69.8) | (72.2) | (77.0) | |||||
| Amortization of losses | 45.1 | 39.5 | 28.2 | 6.1 | 4.0 | 2.8 | 51.2 | 43.5 | 31.0 | |||||
| Amortization of prior service cost | - | - | - | 0.8 | 2.0 | 1.5 | 0.8 | 2.0 | 1.5 | |||||
| Settlement loss | 0.1 | 5.0 | - | 2.6 | 3.3 | 2.2 | 2.7 | 8.3 | 2.2 | |||||
| Net periodic pension cost | $ | 30.5 | 28.3 | 9.4 | $ | 30.7 | 27.3 | 21.6 | $ | 61.2 | 55.6 | 31.0 | ||
Obligations and Funded Status
Changes in the projected benefit obligation (“PBO”) and plan assets for our pension plans are as follows:
| (In millions) | U.S. Plans | Non-U.S. Plans | Total | ||||||||||||
| Years Ended December 31, | 2013 | 2012 | 2013 | 2012 | 2013 | 2012 | |||||||||
| Benefit obligation at beginning of year | $ | 1,031.3 | 990.7 | 392.3 | 306.9 | 1,423.6 | 1,297.6 | ||||||||
| Service cost | - | - | 15.0 | 11.1 | 15.0 | 11.1 | |||||||||
| Interest cost | 42.2 | 43.8 | 19.1 | 19.1 | 61.3 | 62.9 | |||||||||
| Participant contributions | - | - | 3.8 | 3.5 | 3.8 | 3.5 | |||||||||
| Plan amendments | - | - | (4.9) | 11.7 | (4.9) | 11.7 | |||||||||
| Curtailments | - | - | (0.2) | (0.4) | (0.2) | (0.4) | |||||||||
| Settlements | (0.5) | (13.9) | (2.0) | (3.2) | (2.5) | (17.1) | |||||||||
| Benefits paid | (43.6) | (42.3) | (18.8) | (22.0) | (62.4) | (64.3) | |||||||||
| Actuarial (gains) losses | (94.5) | 53.0 | (8.0) | 54.9 | (102.5) | 107.9 | |||||||||
| Foreign currency exchange effects | - | - | (5.9) | 10.7 | (5.9) | 10.7 | |||||||||
| Benefit obligation at end of year | $ | 934.9 | 1,031.3 | 390.4 | 392.3 | 1,325.3 | 1,423.6 | ||||||||
| Fair value of plan assets at beginning of year | $ | 756.3 | 685.4 | 283.0 | 230.5 | 1,039.3 | 915.9 | ||||||||
| Return on assets – actual | 85.5 | 89.9 | 16.6 | 34.7 | 102.1 | 124.6 | |||||||||
| Participant contributions | - | - | 3.8 | 3.5 | 3.8 | 3.5 | |||||||||
| Employer contributions | 14.1 | 37.2 | 40.1 | 32.8 | 54.2 | 70.0 | |||||||||
| Settlements | (0.5) | (13.9) | (2.0) | (3.2) | (2.5) | (17.1) | |||||||||
| Benefits paid | (43.6) | (42.3) | (18.8) | (22.0) | (62.4) | (64.3) | |||||||||
| Foreign currency exchange effects | - | - | (0.7) | 6.7 | (0.7) | 6.7 | |||||||||
| Fair value of plan assets at end of year | $ | 811.8 | 756.3 | 322.0 | 283.0 | 1,133.8 | 1,039.3 | ||||||||
| Funded status | $ | (123.1) | (275.0) | (68.4) | (109.3) | (191.5) | (384.3) | ||||||||
| Included in: | |||||||||||||||
| Noncurrent asset | $ | - | - | (28.6) | (21.9) | (28.6) | (21.9) | ||||||||
| Current liability, included in accrued liabilities | 0.8 | 0.9 | 4.5 | 7.5 | 5.3 | 8.4 | |||||||||
| Noncurrent liability | 122.3 | 274.1 | 92.5 | 123.7 | 214.8 | 397.8 | |||||||||
| Net pension liability | $ | 123.1 | 275.0 | 68.4 | 109.3 | 191.5 | 384.3 | ||||||||
| (In millions) | U.S. Plans | Non-U.S. Plans | Total | |||||||||||||||||||||
| Years Ended December 31, | 2014 | 2013 | 2014 | 2013 | 2014 | 2013 | ||||||||||||||||||
| Benefit obligation at beginning of year | $ | 934.9 | 1,031.3 | 390.4 | 392.3 | 1,325.3 | 1,423.6 | |||||||||||||||||
| Service cost | - | - | 12.5 | 15.0 | 12.5 | 15.0 | ||||||||||||||||||
| Interest cost | 45.3 | 42.2 | 18.4 | 19.1 | 63.7 | 61.3 | ||||||||||||||||||
| Participant contributions | - | - | 4.2 | 3.8 | 4.2 | 3.8 | ||||||||||||||||||
| Plan amendments | - | - | (0.1 | ) | (4.9 | ) | (0.1 | ) | (4.9 | ) | ||||||||||||||
| Curtailments | - | - | (0.1 | ) | (0.2 | ) | (0.1 | ) | (0.2 | ) | ||||||||||||||
Settlements(a) | (149.0 | ) | (0.5 | ) | - | (2.0 | ) | (149.0 | ) | (2.5 | ) | |||||||||||||
| Benefits paid | (44.9 | ) | (43.6 | ) | (24.2 | ) | (18.8 | ) | (69.1 | ) | (62.4 | ) | ||||||||||||
| Sale of Brink’s Netherlands | - | - | (132.7 | ) | - | (132.7 | ) | - | ||||||||||||||||
| Actuarial (gains) losses | 117.8 | (94.5 | ) | 59.7 | (8.0 | ) | 177.5 | (102.5 | ) | |||||||||||||||
| Foreign currency exchange effects | - | - | (45.0 | ) | (5.9 | ) | (45.0 | ) | (5.9 | ) | ||||||||||||||
| Benefit obligation at end of year | $ | 904.1 | 934.9 | 283.1 | 390.4 | 1,187.2 | 1,325.3 | |||||||||||||||||
| Fair value of plan assets at beginning of year | $ | 811.8 | 756.3 | 322.0 | 283.0 | 1,133.8 | 1,039.3 | |||||||||||||||||
| Return on assets – actual | 80.6 | 85.5 | 23.8 | 16.6 | 104.4 | 102.1 | ||||||||||||||||||
| Participant contributions | - | - | 4.2 | 3.8 | 4.2 | 3.8 | ||||||||||||||||||
| Employer contributions | 87.8 | 14.1 | 31.0 | 40.1 | 118.8 | 54.2 | ||||||||||||||||||
Settlements(a) | (149.0 | ) | (0.5 | ) | - | (2.0 | ) | (149.0 | ) | (2.5 | ) | |||||||||||||
| Benefits paid | (44.9 | ) | (43.6 | ) | (24.2 | ) | (18.8 | ) | (69.1 | ) | (62.4 | ) | ||||||||||||
| Sale of Brink’s Netherlands | - | - | (157.2 | ) | - | (157.2 | ) | - | ||||||||||||||||
| Foreign currency exchange effects | - | - | (20.3 | ) | (0.7 | ) | (20.3 | ) | (0.7 | ) | ||||||||||||||
| Fair value of plan assets at end of year | $ | 786.3 | 811.8 | 179.3 | 322.0 | 965.6 | 1,133.8 | |||||||||||||||||
| Funded status | $ | (117.8 | ) | (123.1 | ) | (103.8 | ) | (68.4 | ) | (221.6 | ) | (191.5 | ) | |||||||||||
| Included in: | ||||||||||||||||||||||||
| Noncurrent asset | $ | - | - | - | (28.6 | ) | - | (28.6 | ) | |||||||||||||||
| Current liability, included in accrued liabilities | 0.6 | 0.8 | 2.0 | 4.5 | 2.6 | 5.3 | ||||||||||||||||||
| Noncurrent liability | 117.2 | 122.3 | 101.8 | 92.5 | 219.0 | 214.8 | ||||||||||||||||||
| Net pension liability | $ | 117.8 | 123.1 | 103.8 | 68.4 | 221.6 | 191.5 | |||||||||||||||||
| (a) |
Other Changes in Plan Assets and Benefit Recognized in Other Comprehensive Income (Loss)
| (In millions) | U.S. Plans | Non-U.S. Plans | Total | ||||||||||||||
| Years Ended December 31, | 2013 | 2012 | 2013 | 2012 | 2013 | 2012 | |||||||||||
| Benefit plan net experience losses recognized in | |||||||||||||||||
| accumulated other comprehensive income (loss): | |||||||||||||||||
| Beginning of year | $ | (491.9) | (513.3) | (59.7) | (34.6) | (551.6) | (547.9) | ||||||||||
| Net experience gains (losses) arising during the year | 123.1 | (23.1) | 11.7 | (32.4) | 134.8 | (55.5) | |||||||||||
| Reclassification adjustment for amortization of | |||||||||||||||||
| prior experience losses included in net income | 45.2 | 44.5 | 8.8 | 7.3 | 54.0 | 51.8 | |||||||||||
| End of year | $ | (323.6) | (491.9) | (39.2) | (59.7) | (362.8) | (551.6) | ||||||||||
| Benefit plan prior service cost recognized in | |||||||||||||||||
| accumulated other comprehensive income (loss): | |||||||||||||||||
| Beginning of year | $ | - | - | (15.8) | (6.1) | (15.8) | (6.1) | ||||||||||
| Prior service credit (cost) from plan amendments | |||||||||||||||||
| during the year | - | - | 4.9 | (11.7) | 4.9 | (11.7) | |||||||||||
| Reclassification adjustment for amortization of | |||||||||||||||||
| prior service cost included in net income | - | - | 0.7 | 2.0 | 0.7 | 2.0 | |||||||||||
| End of year | $ | - | - | (10.2) | (15.8) | (10.2) | (15.8) | ||||||||||
| (In millions) | U.S. Plans | Non-U.S. Plans | Total | |||||||||||||||||||||
| Years Ended December 31, | 2014 | 2013 | 2014 | 2013 | 2014 | 2013 | ||||||||||||||||||
| Benefit plan net experience losses recognized in | ||||||||||||||||||||||||
| accumulated other comprehensive income (loss): | ||||||||||||||||||||||||
| Beginning of year | $ | (323.6 | ) | (491.9 | ) | (39.2 | ) | (59.7 | ) | (362.8 | ) | (551.6 | ) | |||||||||||
| Net experience gains (losses) arising during the year | (101.1 | ) | 123.1 | (50.3 | ) | 11.7 | (151.4 | ) | 134.8 | |||||||||||||||
| Reclassification adjustment for amortization of | ||||||||||||||||||||||||
prior experience losses included in net income (loss)(a) | 84.3 | 45.2 | 3.8 | 8.8 | 88.1 | 54.0 | ||||||||||||||||||
| End of year | $ | (340.4 | ) | (323.6 | ) | (85.7 | ) | (39.2 | ) | (426.1 | ) | (362.8 | ) | |||||||||||
| Benefit plan prior service cost recognized in | ||||||||||||||||||||||||
| accumulated other comprehensive income (loss): | ||||||||||||||||||||||||
| Beginning of year | $ | - | - | (10.2 | ) | (15.8 | ) | (10.2 | ) | (15.8 | ) | |||||||||||||
| Prior service credit (cost) from plan amendments | ||||||||||||||||||||||||
| during the year | - | - | 0.1 | 4.9 | 0.1 | 4.9 | ||||||||||||||||||
| Reclassification adjustment for amortization of | ||||||||||||||||||||||||
prior service cost included in net income (loss)(a) | - | - | 0.8 | 0.7 | 0.8 | 0.7 | ||||||||||||||||||
| End of year | $ | - | - | (9.3 | ) | (10.2 | ) | (9.3 | ) | (10.2 | ) | |||||||||||||
Approximately $30.9$36.5 million of experience loss and $0.8$0.1 million of prior service cost are expected to be amortized from accumulated other comprehensive income (loss) into net periodic pension cost during 2014.2015.
The net experience losses in 2014 (the majority attributed to the U.S. plans) were primarily due to the lower discount rates at the end of the year compared to the prior year and the adoption of new mortality tables for U.S. plans, partially offset by a gain from a lump-sum buy-out (see “2014 Lump-sum Buy-out” below) and the actual return on assets being higher than expected. The net experience gains in 2013 (the majority attributed to the U.S. plans) were primarily due to the higher discount rates at the end of the year and the actual return on assets being higher than expected. The net experience losses in 2012 were primarily duecompared to the lower discount rate of the U.S. plans, partially offset byprior year and the actual return on assets being higher than expected.
Information Comparing Plan Assets to Plan Obligations
Information comparing plan assets to plan obligations as of December 31, 20132014 and 20122013 are aggregated below. The accumulated benefit obligation (“ABO”) differs from the PBO in that the ABO is based on the benefit earned through the date noted. The PBO includes assumptions about future compensation levels for plans that have not been frozen.
| (In millions) | U.S. Plans | Non-U.S. Plans | Total | ||||||||||||
| December 31, | 2013 | 2012 | 2013 | 2012 | 2013 | 2012 | |||||||||
| Pension plans with an accumulated benefit obligation in excess of plan assets: | |||||||||||||||
| Fair value of plan assets | $ | 811.8 | 756.3 | 38.1 | 137.2 | 849.9 | 893.5 | ||||||||
| Accumulated benefit obligation | 934.9 | 1,031.3 | 103.6 | 223.2 | 1,038.5 | 1,254.5 | |||||||||
| Projected benefit obligation | 934.9 | 1,031.3 | 135.1 | 268.4 | 1,070.0 | 1,299.7 | |||||||||
The total ABO for our U.S. pension plans was $904.1 million in 2014 and $934.9 million in 2013 and $1,031.3 million in 2012.2013. The total ABO for our Non-U.S. pension plans was $242.9 million in 2014 and $345.3 million in 20132013.
| (In millions) | U.S. Plans | Non-U.S. Plans | Total | |||||||||||||||||||||
| December 31, | 2014 | 2013 | 2014 | 2013 | 2014 | 2013 | ||||||||||||||||||
| Information for pension plans with an ABO in excess of plan assets: | ||||||||||||||||||||||||
| Fair value of plan assets | $ | 786.3 | 811.8 | 45.6 | 38.1 | 831.9 | 849.9 | |||||||||||||||||
| Accumulated benefit obligation | 904.1 | 934.9 | 111.9 | 103.6 | 1,016.0 | 1,038.5 | ||||||||||||||||||
| Projected benefit obligation | 904.1 | 934.9 | 137.0 | 135.1 | 1,041.1 | 1,070.0 | ||||||||||||||||||
2014 Lump-sum Buy-out
The primary U.S. pension plan made an offer to buy out certain plan participants’ pension benefits in 2014 and $345.1approximately 4,300 accepted. The pension plan settled the buy-out in the fourth quarter of 2014. After the settlement, there are approximately 15,200 beneficiaries in the plans. We recognized a $56.1 million settlement loss as a result of the buy-out. We also recognized a $40 million benefit plan experience gain arising during the year in 2012.accumulated other comprehensive income (loss) as the obligation released was more than the cash benefit payments from the plan assets.
Discount rates
The weighted-average assumptions used in determining the net pension cost and benefit obligations for our pension plans were as follows:
| U.S. Plans | Non-U.S. Plans | |||||||||||||
| 2013 | 2012 | 2011 | 2013 | 2012 | 2011 | |||||||||
| Discount rate: | ||||||||||||||
| Pension cost | 4.2% | 4.6% | 5.3% | 5.3% | 5.4% | 5.8% | ||||||||
| Benefit obligation at year end | 5.0% | 4.2% | 4.6% | 6.3% | 5.3% | 5.4% | ||||||||
| Expected return on assets – pension cost | 8.00% | 8.25% | 8.75% | 4.64% | 4.92% | 5.16% | ||||||||
Average rate of increase in salaries(a): | ||||||||||||||
| Pension cost | N/A | N/A | N/A | 3.8% | 3.2% | 3.3% | ||||||||
| Benefit obligation at year end | N/A | N/A | N/A | 3.9% | 3.8% | 3.2% | ||||||||
| U.S. Plans | Non-U.S. Plans | |||||||||||||||||||||||
| 2014 | 2013 | 2012 | 2014 | 2013 | 2012 | |||||||||||||||||||
| Discount rate: | ||||||||||||||||||||||||
| Pension cost | 5.0 | % | 4.2 | % | 4.6 | % | 6.3 | % | 5.3 | % | 5.4 | % | ||||||||||||
| Benefit obligation at year end | 4.1 | % | 5.0 | % | 4.2 | % | 5.1 | % | 6.3 | % | 5.3 | % | ||||||||||||
| Expected return on assets – pension cost | 8.00 | % | 8.00 | % | 8.25 | % | 5.83 | % | 4.64 | % | 4.92 | % | ||||||||||||
Average rate of increase in salaries(a): | ||||||||||||||||||||||||
| Pension cost | N/A | N/A | N/A | 3.9 | % | 3.8 | % | 3.2 | % | |||||||||||||||
| Benefit obligation at year end | N/A | N/A | N/A | 3.9 | % | 3.9 | % | 3.8 | % | |||||||||||||||
| (a) |
Adoption of New Mortality Tables for our U.S. Retirement Benefits
The RP-2000 Combined HealthySociety of Actuaries issued new mortality base tables (“RP-2014”) and a longevity improvement scale (“MP-2014”) in October of 2014, superseding the ones developed in 2000. The new tables reflect that people in the U.S. are living significantly longer than predicted in the 2000 tables.
We adopted the Mercer modified RP-2014 base table and Mercer modified MP-2014 projection scale, with Blue Collar mortalityadjustments for the majority of our U.S. retirement plans, and with White Collar adjustments for our nonqualified U.S. pension plan as of December 31, 2014. The adoption of these tables significantly increased the estimated U.S. plans’ retirement obligations. The increases to our major U.S. plans were $45 million for the primary U.S. pension plan, $39 million for the UMWA retiree medical plans and $3 million for the black lung obligations. These increases were recognized as benefit plan experience losses arising during the year in accumulated other comprehensive income (loss).
As of December 31, 2013, we used the tables developed by the Society of Actuaries in 2000 – the RP-2000 base table and the RP-2000 Combined HealthyAA improvement scale, with similar Blue and White Collar mortality table were used to estimate the expected lives of participants in the U.S. pension plans. Expected lives of participants in non-U.S. pension plans were estimated using mortality tables in the country of operation.adjustments.
Estimated Future Contributions from the Company into Plan Assets
Our policy is to fund at least the minimum actuarially determined amounts required by applicable regulations. In 2014, weWe do not expect to make contributions to our primary U.S. pension plan in 2015. We expect to contribute $27.3$13.5 million to our non-U.S. pension plans $25.9 million to our primary U.S. pension plan, and $0.8$0.6 million to our nonqualified U.S. pension plan.plan in 2015.
Estimated Future Benefit Payments from Plan Assets to Beneficiaries
Projected benefit payments of the plans in the next 10 years using assumptions in effect at December 31, 2013,2014, are as follows:
| (In millions) | U.S. Plans | Non-U.S. Plans | Total | |||||||
| 2014 | $ | 47.7 | 14.6 | 62.3 | ||||||
| 2015 | 48.9 | 13.7 | 62.6 | |||||||
| 2016 | 50.0 | 16.4 | 66.4 | |||||||
| 2017 | 51.5 | 19.1 | 70.6 | |||||||
| 2018 | 53.1 | 21.3 | 74.4 | |||||||
| 2019 through 2023 | $ | 287.3 | 168.8 | 456.1 | ||||||
| (In millions) | U.S. Plans | Non-U.S. Plans | Total | |||||||||
| 2015 | $ | 47.0 | 12.1 | 59.1 | ||||||||
| 2016 | 47.3 | 11.7 | 59.0 | |||||||||
| 2017 | 48.0 | 12.6 | 60.6 | |||||||||
| 2018 | 48.6 | 14.7 | 63.3 | |||||||||
| 2019 | 49.6 | 15.9 | 65.5 | |||||||||
| 2020 through 2024 | $ | 250.4 | 114.3 | 364.7 | ||||||||
Retirement Benefits Other than Pensions
Summary
We provide retirement healthcare benefits for eligible current and former U.S., Canadian, and Brazilian employees. Retirement benefits related to our former U.S. coal operation include medical benefits provided by the Pittston Coal Group Companies Employee Benefit Plan for UMWA Represented Employees (the “UMWA plans”) as well as costs related to Black Lungblack lung obligations.
Components of Net Periodic Postretirement Cost
The components of net periodic postretirement cost related to retirement benefits other than pensions were as follows:
| (In millions) | UMWA Plans | Black Lung and Other Plans | Total | |||||||||||
| Years Ended December 31, | 2013 | 2012 | 2011 | 2013 | 2012 | 2011 | 2013 | 2012 | 2011 | |||||
| Service cost | $ | - | - | - | $ | 0.3 | 0.6 | - | $ | 0.3 | 0.6 | - | ||
| Interest cost on APBO | 19.7 | 22.3 | 24.0 | 1.9 | 2.8 | 2.8 | 21.6 | 25.1 | 26.8 | |||||
| Return on assets – expected | (20.8) | (21.3) | (25.5) | - | - | - | (20.8) | (21.3) | (25.5) | |||||
| Amortization of losses | 19.6 | 21.0 | 14.7 | 0.7 | 1.5 | 0.6 | 20.3 | 22.5 | 15.3 | |||||
| Amortization of prior service cost | - | - | - | 1.7 | 2.0 | 2.0 | 1.7 | 2.0 | 2.0 | |||||
| Net periodic postretirement cost | $ | 18.5 | 22.0 | 13.2 | $ | 4.6 | 6.9 | 5.4 | $ | 23.1 | 28.9 | 18.6 | ||
| (In millions) | UMWA Plans | Black Lung and Other Plans(a) | Total | |||||||||||||||||||||||||||||||||
| Years Ended December 31, | 2014 | 2013 | 2012 | 2014 | 2013 | 2012 | 2014 | 2013 | 2012 | |||||||||||||||||||||||||||
| Service cost | $ | - | - | - | $ | 0.1 | 0.3 | 0.6 | $ | 0.1 | 0.3 | 0.6 | ||||||||||||||||||||||||
| Interest cost on APBO | 17.9 | 19.7 | 22.3 | 2.3 | 1.9 | 2.8 | 20.2 | 21.6 | 25.1 | |||||||||||||||||||||||||||
| Return on assets – expected | (22.2 | ) | (20.8 | ) | (21.3 | ) | - | - | - | (22.2 | ) | (20.8 | ) | (21.3 | ) | |||||||||||||||||||||
| Amortization of losses | 12.3 | 19.6 | 21.0 | 0.6 | 0.7 | 1.5 | 12.9 | 20.3 | 22.5 | |||||||||||||||||||||||||||
| Amortization of prior service cost (credit) | (4.6 | ) | - | - | 1.7 | 1.7 | 2.0 | (2.9 | ) | 1.7 | 2.0 | |||||||||||||||||||||||||
| Net periodic postretirement cost | $ | 3.4 | 18.5 | 22.0 | $ | 4.7 | 4.6 | 6.9 | $ | 8.1 | 23.1 | 28.9 | ||||||||||||||||||||||||
| (a) |
Obligations and Funded Status
Changes in the accumulated postretirement benefit obligation (“APBO’) and plan assets related to retirement healthcare benefits are as follows:
| (In millions) | UMWA Plans | Black Lung and Other Plans | Total | ||||||||||||
| Years Ended December 31, | 2013 | 2012 | 2013 | 2012 | 2013 | 2012 | |||||||||
| APBO at beginning of year | $ | 525.3 | 529.6 | 53.0 | 60.9 | 578.3 | 590.5 | ||||||||
| Service cost | - | - | 0.3 | 0.6 | 0.3 | 0.6 | |||||||||
| Interest cost | 19.7 | 22.3 | 1.9 | 2.8 | 21.6 | 25.1 | |||||||||
| Plan amendments | (55.7) | - | - | (1.9) | (55.7) | (1.9) | |||||||||
| Benefits paid | (34.2) | (35.7) | (7.1) | (6.6) | (41.3) | (42.3) | |||||||||
| Medicare subsidy received | 3.1 | 3.2 | - | - | 3.1 | 3.2 | |||||||||
| Actuarial (gains) losses, net | (31.7) | 5.9 | 0.8 | (2.2) | (30.9) | 3.7 | |||||||||
| Foreign currency exchange effects | - | - | - | (0.6) | - | (0.6) | |||||||||
| APBO at end of year | $ | 426.5 | 525.3 | 48.9 | 53.0 | 475.4 | 578.3 | ||||||||
| Fair value of plan assets at beginning of year | $ | 268.7 | 268.0 | - | - | 268.7 | 268.0 | ||||||||
| Employer contributions | 1.0 | - | 7.1 | 6.6 | 8.1 | 6.6 | |||||||||
| Return on assets – actual | 45.8 | 33.5 | - | - | 45.8 | 33.5 | |||||||||
| Benefits paid | (34.2) | (36.0) | (7.1) | (6.6) | (41.3) | (42.6) | |||||||||
| Medicare subsidy received | 3.1 | 3.2 | - | - | 3.1 | 3.2 | |||||||||
| Fair value of plan assets at end of year | $ | 284.4 | 268.7 | - | - | 284.4 | 268.7 | ||||||||
| Funded status | $ | (142.1) | (256.6) | (48.9) | (53.0) | (191.0) | (309.6) | ||||||||
| Included in: | |||||||||||||||
| Current, included in accrued liabilities | $ | - | - | 5.0 | 5.0 | 5.0 | 5.0 | ||||||||
| Noncurrent | 142.1 | 256.6 | 43.9 | 48.0 | 186.0 | 304.6 | |||||||||
| Retirement benefits other than pension liability | $ | 142.1 | 256.6 | 48.9 | 53.0 | 191.0 | 309.6 | ||||||||
| (In millions) | UMWA Plans | Black Lung and Other Plans | Total | |||||||||||||||||||||
| Years Ended December 31, | 2014 | 2013 | 2014 | 2013 | 2014 | 2013 | ||||||||||||||||||
| APBO at beginning of year | $ | 426.5 | 525.3 | 48.9 | 53.0 | 475.4 | 578.3 | |||||||||||||||||
| Service cost | - | - | 0.1 | 0.3 | 0.1 | 0.3 | ||||||||||||||||||
| Interest cost | 17.9 | 19.7 | 2.3 | 1.9 | 20.2 | 21.6 | ||||||||||||||||||
| Plan amendments | - | (55.7 | ) | - | - | - | (55.7 | ) | ||||||||||||||||
| Benefits paid | (34.5 | ) | (34.2 | ) | (7.4 | ) | (7.1 | ) | (41.9 | ) | (41.3 | ) | ||||||||||||
| Medicare subsidy received | 0.6 | 3.1 | - | - | 0.6 | 3.1 | ||||||||||||||||||
| Actuarial (gains) losses, net | 51.3 | (31.7 | ) | 23.2 | 0.8 | 74.5 | (30.9 | ) | ||||||||||||||||
| Foreign currency exchange effects | - | - | (0.9 | ) | - | (0.9 | ) | - | ||||||||||||||||
| APBO at end of year | $ | 461.8 | 426.5 | 66.2 | 48.9 | 528.0 | 475.4 | |||||||||||||||||
| Fair value of plan assets at beginning of year | $ | 284.4 | 268.7 | - | - | 284.4 | 268.7 | |||||||||||||||||
| Employer contributions | (0.8 | ) | 1.0 | 7.4 | 7.1 | 6.6 | 8.1 | |||||||||||||||||
| Return on assets – actual | 14.9 | 45.8 | - | - | 14.9 | 45.8 | ||||||||||||||||||
| Benefits paid | (34.5 | ) | (34.2 | ) | (7.4 | ) | (7.1 | ) | (41.9 | ) | (41.3 | ) | ||||||||||||
| Medicare subsidy received | 0.6 | 3.1 | - | - | 0.6 | 3.1 | ||||||||||||||||||
| Fair value of plan assets at end of year | $ | 264.6 | 284.4 | - | - | 264.6 | 284.4 | |||||||||||||||||
| Funded status | $ | (197.2 | ) | (142.1 | ) | (66.2 | ) | (48.9 | ) | (263.4 | ) | (191.0 | ) | |||||||||||
| Included in: | ||||||||||||||||||||||||
| Current, included in accrued liabilities | $ | - | - | 6.3 | 5.0 | 6.3 | 5.0 | |||||||||||||||||
| Noncurrent | 197.2 | 142.1 | 59.9 | 43.9 | 257.1 | 186.0 | ||||||||||||||||||
| Retirement benefits other than pension liability | $ | 197.2 | 142.1 | 66.2 | 48.9 | 263.4 | 191.0 | |||||||||||||||||
Other Changes in Plan Assets and Benefit Recognized in Other Comprehensive Income (Loss)
Changes in accumulated other comprehensive income (loss) of our retirement benefit plans other than pensions are as follows:
| Black Lung and Other | ||||||||||||||||||||||||
| (In millions) | UMWA Plans | Plans | Total | |||||||||||||||||||||
| Years Ended December 31, | 2014 | 2013 | 2014 | 2013 | 2014 | 2013 | ||||||||||||||||||
| Benefit plan net experience gain (loss) recognized in | ||||||||||||||||||||||||
| accumulated other comprehensive income (loss): | ||||||||||||||||||||||||
| Beginning of year | $ | (219.4 | ) | (295.7 | ) | (6.3 | ) | (6.2 | ) | (225.7 | ) | (301.9 | ) | |||||||||||
| Net experience gains (losses) arising during the year | (58.6 | ) | 56.7 | (23.2 | ) | (0.8 | ) | (81.8 | ) | 55.9 | ||||||||||||||
| Reclassification adjustment for amortization of | ||||||||||||||||||||||||
| prior experience losses included in net income (loss) | 12.4 | 19.6 | 0.5 | 0.7 | 12.9 | 20.3 | ||||||||||||||||||
| End of year | $ | (265.6 | ) | (219.4 | ) | (29.0 | ) | (6.3 | ) | (294.6 | ) | (225.7 | ) | |||||||||||
| Benefit plan prior service (cost) credit recognized in | ||||||||||||||||||||||||
| accumulated other comprehensive income (loss): | ||||||||||||||||||||||||
| Beginning of year | $ | 55.7 | - | (7.7 | ) | (9.4 | ) | 48.0 | (9.4 | ) | ||||||||||||||
| Prior service credit from plan amendments during the year | - | 55.7 | - | - | - | 55.7 | ||||||||||||||||||
| Reclassification adjustment for amortization or curtailment | ||||||||||||||||||||||||
| of prior service cost included in net income (loss) | (4.6 | ) | - | 1.7 | 1.7 | (2.9 | ) | 1.7 | ||||||||||||||||
| End of year | $ | 51.1 | 55.7 | (6.0 | ) | (7.7 | ) | 45.1 | 48.0 | |||||||||||||||
| (In millions) | UMWA Plans | Black Lung and Other Plans | Total | ||||||||||||||
| Years Ended December 31, | 2013 | 2012 | 2013 | 2012 | 2013 | 2012 | |||||||||||
| Benefit plan net experience gain (loss) recognized in | |||||||||||||||||
| accumulated other comprehensive income (loss): | |||||||||||||||||
| Beginning of year | $ | (295.7) | (323.0) | (6.2) | (9.9) | (301.9) | (332.9) | ||||||||||
| Net experience gains (losses) arising during the year | 56.7 | 6.3 | (0.8) | 2.2 | 55.9 | 8.5 | |||||||||||
| Reclassification adjustment for amortization of | |||||||||||||||||
| prior experience losses included in net income | 19.6 | 21.0 | 0.7 | 1.5 | 20.3 | 22.5 | |||||||||||
| End of year | $ | (219.4) | (295.7) | (6.3) | (6.2) | (225.7) | (301.9) | ||||||||||
| Benefit plan prior service (cost) credit recognized in | |||||||||||||||||
| accumulated other comprehensive income (loss): | |||||||||||||||||
| Beginning of year | $ | - | - | (9.4) | (13.3) | (9.4) | (13.3) | ||||||||||
| Prior service credit from plan amendments during the year | 55.7 | - | - | 1.9 | 55.7 | 1.9 | |||||||||||
| Reclassification adjustment for amortization or curtailment | |||||||||||||||||
| of prior service cost included in net income | - | - | 1.7 | 2.0 | 1.7 | 2.0 | |||||||||||
| End of year | $ | 55.7 | - | (7.7) | (9.4) | 48.0 | (9.4) | ||||||||||
We estimate that $15.2$19.8 million of experience loss and $2.9 million of prior service credit will be amortized from accumulated other comprehensive income (loss) into net periodic postretirement cost during 2014.
We recognized net experience losses in 2014 associated with the UMWA obligations primarily related to the adoption of new mortality tables, a lower discount rate, and return on assets being lower than expected. We recognized net experience losses in 2014 associated with the black lung and other plans primarily related to an increase in the estimated administrative costs to be incurred by the plans in the future, a lower discount rate and the adoption of new mortality tables.
We recognized a prior service credit in 2013 associated with UMWA obligations due to a plan amendment that changed the plan from a self-insured welfare benefit plan to an employer group waiver plan (“EGWP”), which reduced future expected net per capita claims costs. We recognized net experience gains in 2013 associated with the UMWA obligations primarily related to the higher discount rate, a return on assets being higher than expected and a decrease in the expected obligation related to the excise tax on high-cost health plans. The gain related to the excise tax on high-cost health plans reflects the benefit of lower per capita claims costs from the change to EGWP.
Assumptions
See Adoption of New Mortality Tables for our U.S. Retirement Benefits on page 81 for a description of the UMWA obligations primarily related to the return on assets being higher than expected, partially offset by the lower discount rate and an increase in the expected obligation related to the excise tax on high-cost health plans.mortality assumptions.
The APBO for each of the plans was determined using the unit credit method and an assumed discount rate as follows:
| 2013 | 2012 | 2011 | ||||||||||
| Weighted-average discount rate: | ||||||||||||
| Postretirement cost: | ||||||||||||
| UMWA plans | 3.9 | % | 4.4 | % | 5.3 | % | ||||||
| Black lung | 3.5 | % | 4.2 | % | 4.8 | % | ||||||
| Weighted-average | 3.9 | % | 4.4 | % | 5.2 | % | ||||||
| Benefit obligation at year end: | ||||||||||||
| UMWA plans | 4.7 | % | 3.9 | % | 4.4 | % | ||||||
| Black lung | 4.4 | % | 3.5 | % | 4.2 | % | ||||||
| Weighted-average | 4.7 | % | 3.9 | % | 4.4 | % | ||||||
| Expected return on assets | 8.25 | % | 8.50 | % | 8.75 | % | ||||||
| 2014 | 2013 | 2012 | ||||||||||
| Weighted-average discount rate: | ||||||||||||
| Postretirement cost: | ||||||||||||
| UMWA plans | 4.7 | % | 3.9 | % | 4.4 | % | ||||||
| Black lung | 4.4 | % | 3.5 | % | 4.2 | % | ||||||
| Weighted-average | 4.7 | % | 3.9 | % | 4.4 | % | ||||||
| Benefit obligation at year end: | ||||||||||||
| UMWA plans | 4.0 | % | 4.7 | % | 3.9 | % | ||||||
| Black lung | 3.7 | % | 4.4 | % | 3.5 | % | ||||||
| Weighted-average | 4.1 | % | 4.7 | % | 3.9 | % | ||||||
| Expected return on assets | 8.25 | % | 8.25 | % | 8.50 | % | ||||||
For UMWA plans, the assumed healthcare cost trend rate used to compute the 20132014 APBO is 7.0% for 2015, declining to 5.0% in 2021 and thereafter (in 2013: 7.0% for 2014 declining to 5.0% in 2020 and thereafter (in 2012: 7.0% for 2013 declining to 5.0% in 2019 and thereafter). For the black lung obligation, the assumed healthcare cost trend rate used to compute the 20132014 APBO was 5.0%. Other plans in the U.S. provide for fixed-dollar value coverage for eligible participants and, accordingly, are not adjusted for inflation.
83
For the Canadian plan, the assumed healthcare cost trend rate used to compute the 20132014 APBO is 7.0% for 2014,2015, declining to 5.0% in 2020.2021. For the Brazilian plan, the assumed healthcare cost trend rate used to compute the 20132014 APBO is 3.0%.
| Effect of Change in Assumed Healthcare Trend Rates | |||||||||
| (In millions) | Increase 1% | Decrease 1% | |||||||
| Higher (lower): | |||||||||
| Service and interest cost in 2013 | $ | 2.3 | (1.9) | ||||||
| APBO at December 31, 2013 | 45.4 | (38.6) | |||||||
| Effect of Change in Assumed Healthcare Trend Rates | ||||||||
| (In millions) | Increase 1% | Decrease 1% | ||||||
| Higher (lower): | ||||||||
| Service and interest cost in 2014 | $ | 2.1 | (1.8 | ) | ||||
| APBO at December 31, 2014 | 59.3 | (49.6 | ) | |||||
The Medicare Prescription Drug, Improvement and Modernization Act of 2003 (the “Medicare Act”) provides for a prescription drug benefit under Medicare as well as a federal subsidy to sponsors of retiree healthcare benefit plans that provide a benefit that is at least actuarially equivalent to Medicare prescription drug benefits. Because of the broadness of coverage provided under our UMWA plans, we believe that the plans benefits are at least actuarially equivalent to the Medicare benefits.
For the year ended December 31, 2013, we changed the way we provide healthcare benefits to our UMWA retirees whichwho are eligible for the Medicare Act subsidy reimbursement. We changed from a self-insured welfare benefit plan to an employer group waiver plan (“EGWP”). Under this new arrangement, a government approved health insurance provider will receive the Medicare Act subsidy reimbursement on our behalf and pass these savings to us. Additionally, by moving to an EGWP, we will be able to benefit from the mandatory 50% discount that pharmaceutical companies must provide for Medicare Act-eligible prescription drugs. The combined savings of the subsidy and the 50% discount are directly reflectedwere recognized in other comprehensive income (loss) in 2013 as prior service credit, reducing the UMWA APBO for the year ended December 31, 2013.APBO.
Excise Tax on Administrators by Patient Protection and Affordable Care Act of 2010
A 40% excise tax on third-party benefit plan administrators by the Patient Protection and Affordable Care Act will be imposed on high-cost health plans (“Cadillac plans”) beginning in 2018. We are currently unable to reduce the benefit levels of our UMWA medical plans to avoid this excise tax because these benefit levels are required by the Coal Industry Retiree Health Benefit Act of 1992. We have assumed that the cost of the excise tax paid by administrators will be passed through to us in the form of higher premiums or higher claims administration fees, increasing our obligations. We project that we will have to pay the benefits plan administrator this excise tax beginning in 2018, and our plan obligations at December 31, 2013,2014, include $22.9$24.8 million related to this tax ($31.022.9 million at December 31, 2012)2013).
Cash Flows
Estimated Contributions from the Company to Plan Assets
Based on the funded status and assumptions at December 31, 2013,2014, we expect the Company to contribute $5.0$6.3 million in cash to the plans to pay 20142015 beneficiary payments for black lung and other plans. We do not expect to contribute cash to our UMWA plans in 2015 since we believe these plans have sufficient amounts held in trust to pay for beneficiary payments for 2014.until 2032 based on actuarial assumptions. Our UMWA plans are not covered by ERISA or other funding laws or regulations that require these plans to meet funding ratios.
Projected benefit payments of the plans in the next 10 years using assumptions in effect at December 31, 2013,2014, are as follows:
| (In millions) | UMWA plans | Black lung and other plans | Total | |||||||
| 2014 | $ | 31.5 | 5.0 | 36.5 | ||||||
| 2015 | 31.9 | 4.7 | 36.6 | |||||||
| 2016 | 31.5 | 4.4 | 35.9 | |||||||
| 2017 | 31.3 | 4.1 | 35.4 | |||||||
| 2018 | 32.9 | 3.8 | 36.7 | |||||||
| 2019 through 2023 | 148.6 | 15.9 | 164.5 | |||||||
| (In millions) | UMWA Plans | Black Lung and Other Plans | Total | |||||||||
| 2015 | $ | 30.4 | 6.3 | 36.7 | ||||||||
| 2016 | 30.2 | 5.9 | 36.1 | |||||||||
| 2017 | 30.3 | 5.6 | 35.9 | |||||||||
| 2018 | 32.2 | 5.2 | 37.4 | |||||||||
| 2019 | 31.7 | 4.9 | 36.6 | |||||||||
| 2020 through 2024 | 143.6 | 20.0 | 163.6 | |||||||||
Retirement Plan Assets
U.S. Plans
| December 31, 2013 | December 31, 2012 | |||||||||||||||
| Fair | % | % | % | % | ||||||||||||
| Value | Total Fair | Actual | Target | Total Fair | Actual | Target | ||||||||||
| (In millions, except for percentages) | Level | Value | Allocation | Allocation | Value | Allocation | Allocation | |||||||||
| U.S. Pension Plans | ||||||||||||||||
| Cash, cash equivalents and receivables | $ | 3.8 | - | - | 3.5 | 1 | - | |||||||||
| Equity securities: | ||||||||||||||||
U.S. large-cap(a) | 1 | 132.1 | 16 | 16 | 227.3 | 30 | 30 | |||||||||
U.S. small/mid-cap(a) | 1 | 58.6 | 7 | 7 | 60.8 | 8 | 8 | |||||||||
International(a) | 1 | 114.4 | 14 | 14 | 94.1 | 12 | 12 | |||||||||
Emerging markets(b) | 1 | 31.7 | 4 | 4 | - | - | - | |||||||||
Dynamic asset allocation(c) | 1 | 50.2 | 6 | 6 | - | - | - | |||||||||
| Fixed-income securities: | ||||||||||||||||
Long duration(d) | 1 | 190.8 | 32 | 32 | 139.9 | 24 | 23 | |||||||||
Long duration(d) | 2 | 65.0 | 39.1 | |||||||||||||
High yield(e) | 1 | 24.5 | 3 | 3 | 61.9 | 8 | 8 | |||||||||
Emerging markets(f) | 1 | 23.2 | 3 | 3 | 30.4 | 4 | 4 | |||||||||
| Other types of investments: | ||||||||||||||||
Hedge fund of funds(g) | 2 | 37.3 | 5 | 5 | 99.3 | 13 | 15 | |||||||||
Core property(h) | 2 | 40.2 | 5 | �� | 5 | - | - | - | ||||||||
Structured credit(i) | 3 | 40.0 | 5 | 5 | - | - | - | |||||||||
| Total | $ | 811.8 | 100 | 100 | 756.3 | 100 | 100 | |||||||||
| UMWA Plans | ||||||||||||||||
| Equity securities: | ||||||||||||||||
U.S. large-cap(a) | 1 | $ | 107.0 | 38 | 37 | 97.2 | 36 | 37 | ||||||||
U.S. small/mid-cap(a) | 1 | 27.9 | 10 | 9 | 23.7 | 9 | 9 | |||||||||
International(a) | 1 | 41.8 | 15 | 14 | 39.3 | 15 | 14 | |||||||||
| Fixed-income securities: | ||||||||||||||||
High yield(e) | 1 | 24.1 | 8 | 8 | 23.1 | 9 | 8 | |||||||||
Emerging markets(f) | 1 | 10.9 | 4 | 4 | 11.7 | 4 | 4 | |||||||||
Multi asset real return(j) | 1 | 29.3 | 10 | 13 | 32.8 | 12 | 13 | |||||||||
| Other types of investments: | ||||||||||||||||
Hedge fund of funds(g) | 2 | 29.2 | 10 | 10 | 40.9 | 15 | 15 | |||||||||
Core property(h) | 2 | 14.2 | 5 | 5 | - | - | - | |||||||||
| Total | $ | 284.4 | 100 | 100 | 268.7 | 100 | 100 | |||||||||
| December 31, 2014 | December 31, 2013 | ||||||||||||||
| Fair | % | % | % | % | |||||||||||
| Value | Total Fair | Actual | Target | Total Fair | Actual | Target | |||||||||
| (In millions, except for percentages) | Level | Value | Allocation | Allocation | Value | Allocation | Allocation | ||||||||
| U.S. Pension Plans | |||||||||||||||
| Cash, cash equivalents and receivables | $ | 4.1 | 1 | - | 3.8 | - | - | ||||||||
| Equity securities: | |||||||||||||||
U.S. large-cap(a) | 1 | 93.1 | 12 | 12 | 132.1 | 16 | 16 | ||||||||
U.S. small/mid-cap(a) | 1 | 40.2 | 5 | 5 | 58.6 | 7 | 7 | ||||||||
International(a) | 1 | 72.6 | 9 | 10 | 114.4 | 14 | 14 | ||||||||
Emerging markets(b) | 1 | 13.8 | 2 | 2 | 31.7 | 4 | 4 | ||||||||
Dynamic asset allocation(c) | 1 | 33.7 | 4 | 4 | 50.2 | 6 | 6 | ||||||||
| Fixed-income securities: | |||||||||||||||
Long duration(d) | 1 | 277.6 | 47 | 48 | 190.8 | 32 | 32 | ||||||||
Long duration(d) | 2 | 95.7 | 65.0 | ||||||||||||
High yield(e) | 1 | 15.3 | 2 | 2 | 24.5 | 3 | 3 | ||||||||
Emerging markets(f) | 1 | 14.5 | 2 | 2 | 23.2 | 3 | 3 | ||||||||
| Other types of investments: | |||||||||||||||
Hedge fund of funds(g) | 2 | 37.9 | 5 | 5 | 37.3 | 5 | 5 | ||||||||
Core property(h) | 2 | 45.0 | 6 | 5 | 40.2 | 5 | 5 | ||||||||
Structured credit(i) | 3 | 42.8 | 5 | 5 | 40.0 | 5 | 5 | ||||||||
| Total | $ | 786.3 | 100 | 100 | 811.8 | 100 | 100 | ||||||||
| UMWA Plans | |||||||||||||||
| Equity securities: | |||||||||||||||
U.S. large-cap(a) | 1 | $ | 58.5 | 21 | 21 | 107.0 | 38 | 37 | |||||||
U.S. small/mid-cap(a) | 1 | 25.5 | 10 | 9 | 27.9 | 10 | 9 | ||||||||
International(a) | 1 | 49.3 | 19 | 18 | 41.8 | 15 | 14 | ||||||||
Emerging markets(b) | 1 | 10.7 | 4 | 4 | - | - | - | ||||||||
Dynamic asset allocation(c) | 1 | 20.0 | 8 | 7 | - | - | - | ||||||||
| Fixed-income securities: | |||||||||||||||
High yield(e) | 1 | 10.9 | 4 | 4 | 24.1 | 8 | 8 | ||||||||
Emerging markets(f) | 1 | 10.4 | 4 | 4 | 10.9 | 4 | 4 | ||||||||
Multi asset real return(j) | 1 | 21.6 | 8 | 8 | 29.3 | 10 | 13 | ||||||||
| Other types of investments: | |||||||||||||||
Hedge fund of funds(g) | 2 | 14.6 | 6 | 3 | 29.2 | 10 | 10 | ||||||||
Core property(h) | 2 | 28.8 | 11 | 10 | 14.2 | 5 | 5 | ||||||||
Structured credit(i) | 3 | 14.3 | 5 | 5 | - | - | - | ||||||||
U.S. Private Equity(k) | - | - | 7 | - | - | - | |||||||||
| Total | $ | 264.6 | 100 | 100 | 284.4 | 100 | 100 | ||||||||
| (a) |
| (b) | This category represents an actively managed mutual fund that invests primarily in equity securities of emerging market issuers. Emerging market countries are those countries that are characterized as developing or emerging by any of the World Bank, the United Nations, the International Finance Corporation, or the European Bank for Reconstruction and Development or included in an emerging markets index by a recognized index provider. |
| (c) | This category represents an actively managed mutual fund that seeks to generate total return over time by selecting investments from among a broad range of asset classes. The fund’s allocations among asset classes may be adjusted over short periods and can vary from multiple to a single asset class. |
| (d) | This category represents actively managed mutual funds that seeks to duplicate the risk and return characteristics of a long-term fixed-income securities portfolio with an approximate duration of 10 years and longer by using a long duration bond portfolio, including interest-rate swap agreements and Treasury futures contracts, and zero-coupon securities created by the U.S. Treasury, for the purpose of managing the overall duration of this fund. |
| (e) | This category represents an actively managed mutual fund that invests primarily in fixed-income securities rated below investment grade, including corporate bonds and debentures, convertible and preferred securities and zero-coupon obligations. The fund’s average weighted maturity may vary and will generally not exceed ten years. |
| (f) | This category represents an actively managed mutual fund that invests primarily in U.S.-dollar-denominated debt securities of government, government-related and corporate issuers in emerging market countries, as well as entities organized to restructure the outstanding debt of such issuers. |
| (g) | This category represents an actively managed mutual fund that invests in different hedge-fund |
| (h) | This category represents an actively managed mutual fund that seeks both current income and long-term capital appreciation through investing in underlying funds that acquire, manage, and dispose of commercial real estate properties. These properties are high-quality, low-leveraged, income-generating office, industrial, retail, and multi-family properties, generally fully-leased to creditworthy companies and governmental entities. |
| (i) | This category represents an actively managed mutual fund that invests primarily in a diversified portfolio comprised primarily of collateralized loan obligations and other structured credit investments backed primarily by bank loans. |
| (j) | This category represents an actively managed mutual fund that invests primarily in fixed income and equity securities and commodity linked instruments. The category seeks total returns that exceed the rate of inflation over a full market cycle regardless of market |
| (k) | This category will offer exposure to a diversified pool of global private assets fund investments. Further, the category will seek to shorten the duration of the typical private assets fund of funds through a dedicated focus on secondaries strategies (i.e. funds whose investment strategy is to purchase interests in other private market investments/funds as a way to provide the original investors liquidity prior to the end of those investments’/funds’ contracted end date), income-producing investment strategies (e.g. debt, real estate, and to a lesser extent, real assets), and underlying funds whose stated life is five to seven years, as opposed to the more typical 10-year life of private assets funds. |
Assets of our U.S. plans are invested with an objective of maximizing the total return, taking into consideration the liabilities of the plan, and minimizing the risks that could create the need for excessive contributions. Plan assets are invested primarily using actively managed accounts with asset allocation targets listed in the tables above. Our policy does not permit the purchase of Brink’s common stock if immediately after any such purchase the aggregate fair market value of the plan assets invested in Brink’s common stock exceeds 10% of the aggregate fair market value of the assets of the plan, except as permitted by an exemption under ERISA. The plans rebalance their assets on a quarterly basis if actual allocations of assets are outside predetermined ranges. Among other factors, the performance of asset groups and investment managers will affect the long-term rate of return.
Most of our investments of our U.S. retirement plans can be redeemed daily. The hedge-fund-of-funds, core-property and structured-credit investments can be redeemed quarterly with 65 days’ notice. The hedge-fund-of-funds investment had a two-year lockup provision that has expired and we transferred this investment from Level 3 to Level 2 in 2013. The pension plan acquired the structured-credit investment was acquired in 2013 and2013. The investment is subject to a two-year lockup provision which will expire in November 2015. The UMWA plans acquired the structured-credit investment in 2014. The investment is subject to a two-year lockup provision which will expire in May 2016. We categorized this investmentthese investments as Level 3. Beginning in 2013, a portion of the long-duration securities in our U.S. pension plan no longer have an active trading market in order to obtain quoted prices. As such, we transferred these investments from Level 1 to Level 2 in 2013.
Non-U.S. Plans
| December 31, 2013 | December 31, 2012 | |||||||||||||||
| % | % | % | % | |||||||||||||
| Total Fair | Actual | Target | Total Fair | Actual | Target | |||||||||||
| (In millions, except for percentages) | Value | Allocation | Allocation | Value | Allocation | Allocation | ||||||||||
| Non-U.S. Pension Plans | ||||||||||||||||
| Cash and cash equivalents | $ | 5.2 | 2 | - | 2.6 | 1 | - | |||||||||
| Equity securities: | ||||||||||||||||
U.S. equity funds(a) | 30.0 | 25.8 | ||||||||||||||
Canadian equity funds(a) | 38.3 | 31.7 | ||||||||||||||
European equity funds(a) | 8.9 | 7.4 | ||||||||||||||
Asia Pacific equity funds(a) | 1.7 | 1.3 | ||||||||||||||
Emerging markets(a) | 9.3 | 4.7 | ||||||||||||||
Other non-U.S. equity funds(a) | 38.8 | 37.3 | ||||||||||||||
| Total equity securities | 127.0 | 39 | 39 | 108.2 | 38 | 39 | ||||||||||
| Fixed-income securities: | ||||||||||||||||
Global credit(b) | 37.5 | 34.3 | ||||||||||||||
Canadian fixed-income funds(c) | 24.8 | 20.3 | ||||||||||||||
European fixed-income funds(d) | 11.0 | 10.2 | ||||||||||||||
High-yield(e) | 12.3 | 10.2 | ||||||||||||||
Emerging markets(f) | 6.9 | 5.8 | ||||||||||||||
Long-duration(g) | 79.4 | 76.1 | ||||||||||||||
| Total fixed-income securities | 171.9 | 53 | 55 | 156.9 | 55 | 56 | ||||||||||
| Other types of investments: | ||||||||||||||||
Convertible securities(h) | 12.0 | 10.1 | ||||||||||||||
Commodity derivatives(i) | 4.7 | 4.0 | ||||||||||||||
| Other | 1.2 | 1.2 | ||||||||||||||
| Total other types of investments | 17.9 | 6 | 6 | 15.3 | 6 | 5 | ||||||||||
| Total | $ | 322.0 | 100 | 100 | 283.0 | 100 | 100 | |||||||||
| December 31, 2014 | December 31, 2013 | ||||||||||||||
| % | % | % | % | ||||||||||||
| Total Fair | Actual | Target | Total Fair | Actual | Target | ||||||||||
| (In millions, except for percentages) | Value | Allocation | Allocation | Value | Allocation | Allocation | |||||||||
| Non-U.S. Pension Plans | |||||||||||||||
| Cash and cash equivalents | $ | 1.1 | - | - | 5.2 | 2 | - | ||||||||
| Equity securities: | |||||||||||||||
U.S. equity funds(a) | 31.6 | 30.0 | |||||||||||||
Canadian equity funds(a) | 39.6 | 38.3 | |||||||||||||
European equity funds(a) | 8.8 | 8.9 | |||||||||||||
Asia Pacific equity funds(a) | 1.7 | 1.7 | |||||||||||||
Emerging markets(a) | 3.5 | 9.3 | |||||||||||||
Other non-U.S. equity funds(a) | 20.4 | 38.8 | |||||||||||||
| Total equity securities | 105.6 | 59 | 65 | 127.0 | 39 | 39 | |||||||||
| Fixed-income securities: | |||||||||||||||
Global credit(b) | 0.3 | 37.5 | |||||||||||||
Canadian fixed-income funds(c) | 25.7 | 24.8 | |||||||||||||
European fixed-income funds(d) | 14.9 | 11.0 | |||||||||||||
High-yield(e) | 1.0 | 12.3 | |||||||||||||
Emerging markets(f) | 1.2 | 6.9 | |||||||||||||
Long-duration(g) | 27.9 | 79.4 | |||||||||||||
| Total fixed-income securities | 71.0 | 40 | 35 | 171.9 | 53 | 55 | |||||||||
| Other types of investments: | �� | ||||||||||||||
Convertible securities(h) | - | 12.0 | |||||||||||||
Commodity derivatives(i) | - | 4.7 | |||||||||||||
| Other | 1.6 | 1.2 | |||||||||||||
| Total other types of investments | 1.6 | 1 | - | 17.9 | 6 | 6 | |||||||||
| Total | $ | 179.3 | 100 | 100 | 322.0 | 100 | 100 | ||||||||
| (b) | This category represents investment-grade fixed income debt securities of European issuers from diverse industries. |
| (c) | This category seeks to achieve a return that exceeds the Scotia Capital Markets Universe Bond Index. |
| (d) | This category is designed to generate income and exhibit volatility similar to that of the Sterling denominated bond market. This category primarily invests in investment grade or better securities. |
| (e) | This category consists of global high-yield bonds. This category invests in lower rated and unrated fixed income, floating rate and other debt securities issued by European and American companies. |
| (f) | This category consists of a diversified portfolio of listed and unlisted debt securities issued by governments, financial institutions, companies or other entities domiciled in emerging market countries. |
| (g) | This category is designed to achieve a return consistent with holding longer term debt instruments. This category invests in interest rate and inflation derivatives, government-issued bonds, real-return bonds, and futures contracts. |
| (h) | This category invests in convertible securities of global issuers from diverse industries. |
| (i) | This category invests in commodities through financial derivatives of global issuers and short-dated government paper and cash components. |
Asset allocation strategies for our non-U.S. plans are designed to accumulate a diversified portfolio among markets and asset classes in order to reduce market risk and increase the likelihood that pension assets are available to pay benefits as they are due. Assets of non-U.S. pension plans are invested primarily using actively managed accounts. The weighted-average asset allocation targets are listed in the table above, and reflect limitations on types of investments held and allocations among assets classes, as required by local regulation or market practice of the country where the assets are invested. Most of the investments of our non-U.S. retirement plans can be redeemed at least monthly, except for a portion of “Other” in the above table, which can be redeemed quarterly.
Level 1 Investments. Fair values of investments totaling $177.9 million at December 31, 2014, and $167.9 million at December 31, 2013, of our non-U.S. pension plans have been estimated using quoted prices in active markets and are categorized as Level 1 valuation inputs.
Level 2 Investments. Fair values for investments of our non-U.S. pension plans totaling $1.4 million at December 31, 2014, and $154.1 million at December 31, 2013, have been estimated using the net asset value per share of the investments and are categorized as Level 2 valuation inputs.
The UK pension plan investment that was previously classified as Level 3 had a lockup provision that has expired and has therefore been transferred to Level 2 in 2013.
Changes in Plan Assets Classified as Level 3
Changes in plan assets measured at fair value using significant unobservable inputs (Level 3) for our retirement plans are as follows:
| (In millions) | U.S. Pension Plans | UMWA Plans | Non-U.S. Pension Plans | ||||||||||
| Balance at December 31, 2011 | $ | 96.8 | 39.9 | 0.6 | |||||||||
| Actual return on plan assets: | |||||||||||||
| Relating to assets still held at the reporting date | 2.5 | 1.0 | - | ||||||||||
| Relating to assets sold during the period | - | - | - | ||||||||||
| Purchases, sales and settlements | - | - | - | ||||||||||
| Transfers in and/or out of Level 3 | - | - | - | ||||||||||
| Balance at December 31, 2012 | 99.3 | 40.9 | 0.6 | ||||||||||
| Actual return on plan assets: | |||||||||||||
| Relating to assets still held at the reporting date | 0.4 | - | - | ||||||||||
| Relating to assets sold during the period | - | - | - | ||||||||||
| Purchases, sales and settlements | 39.6 | - | - | ||||||||||
Transfers out of Level 3(a) | (99.3) | (40.9) | (0.6) | ||||||||||
| Balance at December 31, 2013 | $ | 40.0 | - | - | |||||||||
| (In millions) | U.S. Pension Plans | UMWA Plans | Non-U.S. Pension Plans | |||||||||
| Balance at December 31, 2012 | $ | 99.3 | 40.9 | 0.6 | ||||||||
| Actual return on plan assets relating to assets still held at the reporting date | 0.4 | - | - | |||||||||
| Purchases, sales and settlements | 39.6 | - | - | |||||||||
Transfers out of Level 3(a) | (99.3) | (40.9) | (0.6) | |||||||||
| Balance at December 31, 2013 | 40.0 | - | - | |||||||||
| Actual return on plan assets relating to assets still held at the reporting date | 2.8 | 0.5 | - | |||||||||
| Purchases, sales and settlements | - | 13.8 | - | |||||||||
| Balance at December 31, 2014 | $ | 42.8 | 14.3 | - | ||||||||
Multi-employer Pension Plans
We contribute to multi-employer pension plans in a few of our non-U.S. subsidiaries. We recognized $0.2$0.1 million of multi-employer pension expense for continuing operations in 2014, $0.2 million in 2013 and $0.3 million in 2012. We did not recognize any multi-employer pension expense in 2011.
Savings Plans
We sponsor various defined contribution plans to help eligible employees provide for retirement. We record expense for amounts that we contribute on behalf of employees, usually in the form of matching contributions. Prior to December 31, 2011, weWe matched 125% of up to the first 5%4% of our employees’ eligible contributions to our U.S. 401(k) plan.plan made in the first quarter of 2012. In JanuaryApril 2012, we reduced the matching contribution to 100% of up to the first 4% of employee contributions. In April 2012, we further reduced the matching contribution to 100% on the first 1% of employee contributions. Our matching contribution expense is as follows:
| (In millions) | ||||||||
| Years Ended December 31, | 2013 | 2012 | 2011 | |||||
| U.S. 401(K) | $ | 2.6 | 4.6 | 16.9 | ||||
| Other plans | 2.9 | 2.5 | 3.9 | |||||
| Total | $ | 5.5 | 7.1 | 20.8 |
| (In millions) | ||||||||||||
| Years Ended December 31, | 2014 | 2013 | 2012 | |||||||||
| U.S. 401(K) | $ | 2.2 | 2.6 | 4.6 | ||||||||
| Other plans | 2.3 | 2.9 | 2.5 | |||||||||
| Total | $ | 4.5 | 5.5 | 7.1 | ||||||||
Note 4 – Income Taxes
| Years Ended December 31, | ||||||||
| (In millions) | 2013 | 2012 | 2011 | |||||
| Income (loss) from continuing operations before income taxes | ||||||||
| U.S. | $ | (51.8) | (19.6) | (16.0) | ||||
| Foreign | 200.0 | 178.7 | 204.3 | |||||
| Income from continuing operations before income taxes | $ | 148.2 | 159.1 | 188.3 | ||||
| Years Ended December 31, | ||||||||||||
| (In millions) | 2014 | 2013 | 2012 | |||||||||
| Income (loss) from continuing operations before income taxes | ||||||||||||
| U.S. | $ | (79.4 | ) | (58.1 | ) | (25.3 | ) | |||||
| Foreign | 30.4 | 197.7 | 171.4 | |||||||||
| Income (loss) from continuing operations before income taxes | $ | (49.0 | ) | 139.6 | 146.1 | |||||||
| Provision (benefit) for income taxes from continuing operations | ||||||||
| Current tax expense (benefit) | ||||||||
| U.S. federal | $ | 0.5 | (0.1) | 2.9 | ||||
| State | 1.5 | (0.3) | (0.1) | |||||
| Foreign | 84.6 | 70.9 | 91.9 | |||||
| Current tax expense | 86.6 | 70.5 | 94.7 | |||||
| Deferred tax expense (benefit) | ||||||||
| U.S. federal | (20.6) | (29.9) | (21.3) | |||||
| State | (1.9) | (1.4) | (0.9) | |||||
| Foreign | (12.1) | (12.1) | (8.5) | |||||
| Deferred tax benefit | (34.6) | (43.4) | (30.7) | |||||
| Provision (benefit) for income taxes of continuing operations | $ | 52.0 | 27.1 | 64.0 |
| Provision (benefit) for income taxes from continuing operations | ||||||||||||
| Current tax expense (benefit) | ||||||||||||
| U.S. federal | $ | (3.8 | ) | 0.5 | (2.0 | ) | ||||||
| State | (0.8 | ) | 1.5 | (0.3 | ) | |||||||
| Foreign | 69.7 | 81.9 | 68.8 | |||||||||
| Current tax expense | 65.1 | 83.9 | 66.5 | |||||||||
| Deferred tax expense (benefit) | ||||||||||||
| U.S. federal | (7.6 | ) | (20.6 | ) | (29.9 | ) | ||||||
| State | (1.9 | ) | (1.9 | ) | (1.4 | ) | ||||||
| Foreign | (18.9 | ) | (12.1 | ) | (12.2 | ) | ||||||
| Deferred tax benefit | (28.4 | ) | (34.6 | ) | (43.5 | ) | ||||||
| Provision (benefit) for income taxes of continuing operations | $ | 36.7 | 49.3 | 23.0 | ||||||||
| Years Ended December 31, | ||||||||
| (In millions) | 2013 | 2012 | 2011 | |||||
| Comprehensive provision (benefit) for income taxes allocable to | ||||||||
| Continuing operations | $ | 52.0 | 27.1 | 64.0 | ||||
| Discontinued operations | 4.7 | (1.0) | (3.9) | |||||
| Other comprehensive income (loss) | 141.0 | 9.3 | (74.4) | |||||
| Equity | 2.8 | 2.7 | (1.1) | |||||
| Comprehensive provision (benefit) for income taxes | $ | 200.5 | 38.1 | (15.4) | ||||
| Years Ended December 31, | ||||||||||||
| (In millions) | 2014 | 2013 | 2012 | |||||||||
| Comprehensive provision (benefit) for income taxes allocable to | ||||||||||||
| Continuing operations | $ | 36.7 | 49.3 | 23.0 | ||||||||
| Discontinued operations | 0.4 | 7.4 | 3.1 | |||||||||
| Other comprehensive income (loss) | (43.0 | ) | 141.0 | 9.3 | ||||||||
| Equity | 0.6 | 2.8 | 2.7 | |||||||||
| Comprehensive provision (benefit) for income taxes | $ | (5.3 | ) | 200.5 | 38.1 | |||||||
The following table reconciles the difference between the actual tax rate on continuing operations and the statutory U.S. federal income tax rate of 35%.
| Years Ended December 31, | |||||||||||
| (In percentages) | 2013 | 2012 | 2011 | ||||||||
| U.S. federal tax rate | 35.0 | % | 35.0 | % | 35.0 | % | |||||
| Increases (reductions) in taxes due to: | |||||||||||
| Adjustments to valuation allowances | 4.0 | 1.2 | (2.9) | ||||||||
| Foreign income taxes | (6.5) | (2.2) | 0.3 | ||||||||
| Medicare subsidy for retirement plans | (1.1) | (14.4) | - | ||||||||
| French business tax | 3.0 | 2.7 | 2.4 | ||||||||
| Nontaxable acquisition-related (gains) losses | - | - | (0.4) | ||||||||
| Taxes on undistributed earnings of foreign affiliates | (0.1) | (2.2) | 0.2 | ||||||||
| State income taxes, net | (0.1) | (0.1) | (0.5) | ||||||||
| Change in judgment about uncertain tax positions in Mexico | - | (4.7) | - | ||||||||
| Other | 0.9 | 1.7 | (0.1) | ||||||||
| Actual income tax rate on continuing operations | 35.1 | % | 17.0 | % | 34.0 | % | |||||
| Years Ended December 31, | ||||||||||||
| (In percentages) | 2014 | 2013 | 2012 | |||||||||
| U.S. federal tax rate | 35.0 | % | 35.0 | % | 35.0 | % | ||||||
| Increases (reductions) in taxes due to: | ||||||||||||
| Venezuela devaluation | (86.4 | ) | - | - | ||||||||
| Adjustments to valuation allowances | (16.9 | ) | 4.2 | 1.1 | ||||||||
| Foreign income taxes | (0.7 | ) | (6.7 | ) | (1.8 | ) | ||||||
| Medicare subsidy for retirement plans | - | (1.1 | ) | (15.6 | ) | |||||||
| French business tax | (9.1 | ) | 3.2 | 3.0 | ||||||||
| Taxes on undistributed earnings of foreign affiliates | (3.7 | ) | (0.1 | ) | (2.4 | ) | ||||||
| State income taxes, net | 5.2 | (0.1 | ) | (0.1 | ) | |||||||
| Change in judgment about uncertain tax positions in Mexico | - | - | (5.1 | ) | ||||||||
| Other | 1.7 | 0.9 | 1.6 | |||||||||
| Actual income tax rate on continuing operations | (74.9 | ) % | 35.3 | % | 15.7 | % | ||||||
Components of Deferred Tax Assets and Liabilities
| December 31, | |||||||
| (In millions) | 2013 | 2012 | |||||
| Deferred tax assets | |||||||
| Pension liabilities | $ | 70.0 | 136.4 | ||||
| Retirement benefits other than pensions | 60.7 | 127.2 | |||||
| Workers’ compensation and other claims | 35.1 | 38.3 | |||||
| Other assets and liabilities | 138.6 | 115.3 | |||||
| Net operating loss carryforwards | 26.8 | 63.5 | |||||
Alternative minimum and other tax credits(a) | 44.7 | 37.9 | |||||
| Subtotal | 375.9 | 518.6 | |||||
| Valuation allowances | (32.4) | (47.4) | |||||
| Total deferred tax assets | 343.5 | 471.2 | |||||
| Deferred tax liabilities | |||||||
| Property and equipment, net | 9.9 | 11.2 | |||||
| Other assets and miscellaneous | 31.0 | 37.4 | |||||
| Deferred tax liabilities | 40.9 | 48.6 | |||||
| Net deferred tax asset | $ | 302.6 | 422.6 | ||||
| Included in: | |||||||
| Current assets | $ | 72.0 | 59.4 | ||||
| Noncurrent assets | 251.7 | 385.3 | |||||
| Current liabilities, included in accrued liabilities | (3.1) | (3.4) | |||||
| Noncurrent liabilities | (18.0) | (18.7) | |||||
| Net deferred tax asset | $ | 302.6 | 422.6 | ||||
| December 31, | ||||||||
| (In millions) | 2014 | 2013 | ||||||
| Deferred tax assets | ||||||||
| Pension liabilities | $ | 74.2 | 70.0 | |||||
| Retirement benefits other than pensions | 77.8 | 60.7 | ||||||
| Workers’ compensation and other claims | 42.4 | 35.1 | ||||||
| Property and equipment, net | 4.1 | - | ||||||
| Other assets and liabilities | 135.2 | 138.6 | ||||||
| Net operating loss carryforwards | 47.4 | 26.8 | ||||||
Alternative minimum and other tax credits(a) | 46.7 | 44.7 | ||||||
| Subtotal | 427.8 | 375.9 | ||||||
| Valuation allowances | (40.1 | ) | (32.4 | ) | ||||
| Total deferred tax assets | 387.7 | 343.5 | ||||||
| Deferred tax liabilities | ||||||||
| Property and equipment, net | - | 9.9 | ||||||
| Other assets and miscellaneous | 38.9 | 31.0 | ||||||
| Deferred tax liabilities | 38.9 | 40.9 | ||||||
| Net deferred tax asset | $ | 348.8 | 302.6 | |||||
| Included in: | ||||||||
| Current assets | $ | 71.9 | 72.0 | |||||
| Noncurrent assets | 289.5 | 251.7 | ||||||
| Current liabilities, included in accrued liabilities | (1.8 | ) | (3.1 | ) | ||||
| Noncurrent liabilities | (10.8 | ) | (18.0 | ) | ||||
| Net deferred tax asset | $ | 348.8 | 302.6 | |||||
| U.S. alternative minimum tax credits of |
Valuation Allowances
Valuation allowances relate to deferred tax assets in various federal, state and non-U.S. jurisdictions. Based on our historical and expected future taxable earnings, and a consideration of available tax-planning strategies, we believe it is more likely than not that we will realize the benefit of the existing deferred tax assets, net of valuation allowances, at December 31, 2013.2014.
| Years Ended December 31, | ||||||||||
| (In millions) | 2013 | 2012 | 2011 | |||||||
| Valuation allowances: | ||||||||||
| Beginning of year | $ | 47.4 | 43.9 | 45.9 | ||||||
| Expiring tax credits | (1.8) | (0.8) | (0.3) | |||||||
| Acquisitions and dispositions | (32.7) | (0.9) | 0.3 | |||||||
Changes in judgment about deferred tax assets(a) | (0.2) | (1.0) | (8.2) | |||||||
| Other changes in deferred tax assets, charged to: | ||||||||||
| Income from continuing operations | 6.2 | 3.4 | 7.6 | |||||||
| Income from discontinued operations | 12.5 | 1.9 | - | |||||||
| Other comprehensive income (loss) | - | 0.1 | - | |||||||
| Foreign currency exchange effects | 1.0 | 0.8 | (1.4) | |||||||
| End of year | $ | 32.4 | 47.4 | 43.9 | ||||||
| Years Ended December 31, | ||||||||||||
| (In millions) | 2014 | 2013 | 2012 | |||||||||
| Valuation allowances: | ||||||||||||
| Beginning of year | $ | 32.4 | 47.4 | 43.9 | ||||||||
| Expiring tax credits | (0.5 | ) | (1.8 | ) | (0.8 | ) | ||||||
| Acquisitions and dispositions | (1.0 | ) | (32.7 | ) | (0.9 | ) | ||||||
Changes in judgment about deferred tax assets(a) | 1.9 | (0.2 | ) | (1.0 | ) | |||||||
| Other changes in deferred tax assets, charged to: | ||||||||||||
| Income from continuing operations | 6.3 | 6.1 | 3.0 | |||||||||
| Income from discontinued operations | 3.3 | 12.6 | 2.3 | |||||||||
| Other comprehensive income (loss) | 0.6 | - | 0.1 | |||||||||
| Foreign currency exchange effects | (2.9 | ) | 1.0 | 0.8 | ||||||||
| End of year | $ | 40.1 | 32.4 | 47.4 | ||||||||
| Changes in judgment about valuation allowances are based on a recognition threshold of “more-likely-than-not.”Amounts are based on beginning-of-year balances of deferred tax assets that could potentially be realized in future years. Amounts are recognized in income from continuing operations. |
Undistributed Foreign Earnings
As of December 31, 2013,2014, we have not recorded U.S. federal deferred income taxes on approximately $259$78 million of undistributed earnings of foreign subsidiaries and equity affiliates. It is expectedWe expect that these earnings will be permanently reinvested in operations outside the U.S. It is not practical to computedetermine the estimated deferredincome tax liability on these earnings.that might be incurred if all such income was remitted to the U.S. due to the inherent complexities associated with any hypothetical calculation, which would be dependent upon the exact form of repatriation.
Net Operating Losses
The gross amount of the net operating loss carryforwards as of December 31, 2013,2014, was $214.5$341.2 million. The tax benefit of net operating loss carryforwards, before valuation allowances, as of December 31, 2013,2014, was $26.8$47.4 million, and expires as follows:
| (In millions) | Federal | State | Foreign | Total | |||||||
| Years of expiration | |||||||||||
| 2014-2018 | $ | - | 0.3 | 3.9 | 4.2 | ||||||
| 2019-2023 | - | 0.2 | 5.3 | 5.5 | |||||||
| 2024 and thereafter | - | 10.3 | 0.4 | 10.7 | |||||||
| No expiration | - | - | 6.4 | 6.4 | |||||||
| $ | - | 10.8 | 16.0 | 26.8 | |||||||
| (In millions) | Federal | State | Foreign | Total | |||||||||||||||
| Years of expiration | |||||||||||||||||||
| 2015-2019 | $ | - | 0.2 | 4.1 | 4.3 | ||||||||||||||
| 2020-2024 | - | 0.4 | 10.3 | 10.7 | |||||||||||||||
| 2025 and thereafter | 12.3 | 11.9 | 2.3 | 26.5 | |||||||||||||||
| No expiration | - | - | 5.9 | 5.9 | |||||||||||||||
| $ | 12.3 | 12.5 | 22.6 | 47.4 | |||||||||||||||
A reconciliation of the beginning and ending amount of unrecognized tax benefits is as follows:
| Years Ended December 31, | ||||||||||||
| (In millions) | 2014 | 2013 | 2012 | |||||||||
| Uncertain tax positions: | ||||||||||||
| Beginning of year | $ | 10.8 | 11.8 | 17.2 | ||||||||
| Increases related to prior-year tax positions | 0.4 | 0.1 | 1.4 | |||||||||
| Decreases related to prior-year tax positions | - | - | (6.9 | ) | ||||||||
| Increases related to current-year tax positions | 1.1 | 2.3 | 1.6 | |||||||||
| Settlements | - | (0.7 | ) | (0.7 | ) | |||||||
| Effect of the expiration of statutes of limitation | (1.3 | ) | (3.4 | ) | (1.2 | ) | ||||||
| Decrease related to dispositions | (1.0 | ) | - | - | ||||||||
| Foreign currency exchange effects | (2.8 | ) | 0.7 | 0.4 | ||||||||
| End of year | $ | 7.2 | 10.8 | 11.8 | ||||||||
| Years Ended December 31, | |||||||||
| (In millions) | 2013 | 2012 | 2011 | ||||||
| Uncertain tax positions: | |||||||||
| Beginning of year | $ | 11.8 | 17.2 | 19.4 | |||||
| Increases related to prior-year tax positions | 0.1 | 1.4 | 0.8 | ||||||
| Decreases related to prior-year tax positions | - | (6.9) | (1.6) | ||||||
| Increases related to current-year tax positions | 2.3 | 1.6 | 1.3 | ||||||
| Settlements | (0.7) | (0.7) | - | ||||||
| Effect of the expiration of statutes of limitation | (3.4) | (1.2) | (1.2) | ||||||
| Increases (decreases) related to business combinations and dispositions | - | - | (0.7) | ||||||
| Foreign currency exchange effects | 0.7 | 0.4 | (0.8) | ||||||
| End of year | $ | 10.8 | 11.8 | 17.2 | |||||
Included in the balance of unrecognized tax benefits at December 31, 2013,2014, are potential benefits of approximately $9.7$6.3 million that, if recognized, will reduce the effective tax rate on income from continuing operations.
We recognize accrued interest and penalties related to unrecognized tax benefits in provision (benefit) for income taxes. InterestWe reverse interest and penalties accruals when a statute of limitation lapses or when we otherwise conclude the amounts should not be accrued. Net reversals included in provision (benefit) for income taxes amounted to ($1.1)were $0.6 million in 2014, $1.1 million in 2013, ($2.1)and $2.1 million in 2012, and $1.2 million in 2011.2012. We had accrued penalties and interest of $1.3 million at December 31, 2014, and $2.1 million at December 31, 2013, and $3.7 million at December 31, 2012.2013.
We file income tax returns in the U.S. federal and various state and foreign jurisdictions. With a few exceptions, as of December 31, 2013,2014, we were no longer subject to U.S. federal, state and local, or non-U.S. income tax examinations by tax authorities for years before 2010.2011. Additionally, due to statute of limitations expirations and audit settlements, it is reasonably possible that approximately $1.7$0.7 million of currently remaining unrecognized tax positions may be recognized by the end of 2014.2015.
Note 5 – Property and Equipment
The following table presents our property and equipment that is classified as held and used:
| December 31, | ||||||
| (In millions) | 2013 | 2012 | ||||
| Land | $ | 68.0 | 70.8 | |||
| Buildings | 258.0 | 247.6 | ||||
| Leasehold improvements | 215.6 | 217.5 | ||||
| Vehicles | 438.0 | 433.6 | ||||
Capitalized software(a) | 184.6 | 168.2 | ||||
| Other machinery and equipment | 692.5 | 682.3 | ||||
| 1,856.7 | 1,820.0 | |||||
| Accumulated depreciation and amortization | (1,098.0) | (1,026.2) | ||||
| Property and equipment, net | $ | 758.7 | 793.8 | |||
| December 31, | ||||||||
| (In millions) | 2014 | 2013 | ||||||
| Land | $ | 62.7 | 68.0 | |||||
| Buildings | 231.2 | 258.0 | ||||||
| Leasehold improvements | 199.8 | 215.6 | ||||||
| Vehicles | 401.6 | 438.0 | ||||||
Capitalized software(a) | 183.0 | 184.6 | ||||||
| Other machinery and equipment | 668.1 | 692.5 | ||||||
| 1,746.4 | 1,856.7 | |||||||
| Accumulated depreciation and amortization | (1,076.9 | ) | (1,098.0 | ) | ||||
| Property and equipment, net | $ | 669.5 | 758.7 | |||||
| (a) |
We account for acquisitions as business combinations using the acquisition method. Under the acquisition method of accounting, assets acquired and liabilities assumed from these operations are recorded at fair value on the date of acquisition. The consolidated statements of income include the results of operations for each acquired entity from the date of acquisition.
We acquired 100% of the capital stock of Brazil-based Rede Transacoes Eletronicas Ltda. (Rede Trel) on January 31, 2013. The purchase price was $27.7 million.million, including $1.8 million in estimated contingent consideration. On the acquisition date, Rede Trel had $10 million of cash and cash equivalents that it uses as working capital, resulting in a net cash outflow in our consolidated statement of cash flows of $16 million related to the acquisition. Rede Trel distributes electronic prepaid products, including mobile phone airtime, via a network of approximately 20,000 retail locations across Brazil. Rede Trel’s strong distribution network supplements Brink’s existing payments business, ePago, which has operations in Brazil, Mexico, Colombia and Panama.
We estimated fair values for the assets purchased and liabilities assumed as of the date of the acquisition. This valuation required management to make significant estimates and assumptions. We have completed the valuation work required to allocate the purchase price and our final estimates of the acquisition-date fair values of Rede Trel assets and liabilities are shown in the following table.
| Estimated Fair | ||||
| Value at | ||||
| (In millions) | January 31, 2013 | |||
| Fair value of purchase consideration | ||||
| Cash paid for 100% of shares | $ | 25.9 | ||
| Fair value of contingent consideration | 1.8 | |||
| Fair value of purchase consideration | $ | 27.7 | ||
| Fair value of net assets acquired | ||||
| Cash | $ | 10.0 | ||
| Accounts receivable | 7.8 | |||
| Other current assets | 19.9 | |||
| Property and equipment | 4.0 | |||
Intangible assets(a) | 11.8 | |||
Goodwill(b) | 14.0 | |||
| Current liabilities | (38.8 | ) | ||
| Noncurrent liabilities | (1.0 | ) | ||
| Fair value of net assets acquired | $ | 27.7 | ||
| (a) |
| (b) | Consists of intangible assets that do not qualify for separate recognition, combined with synergies expected from integrating Rede Trel's distribution network into our existing ePago business. All of the goodwill |
Note 7 – Goodwill and Other Intangible Assets
Goodwill
After the 2014 Reorganization and other intangible assets resultedRestructuring, we identified nine operating segments and ten reporting units. We reallocated goodwill from acquiring businesses. The following table summarizes our other intangible assets:
| December 31, 2013 | December 31, 2012 | |||||||||||||||||||
| Gross Carrying | Accumulated | Net Carrying | Gross Carrying | Accumulated | Net Carrying | |||||||||||||||
| (In millions) | Amount | Amortization | Amount | Amount | Amortization | Amount | ||||||||||||||
| Customer relationships: | ||||||||||||||||||||
| Latin America | $ | 23.8 | (12.6) | 11.2 | $ | 27.1 | (11.6) | 15.5 | ||||||||||||
| EMEA | 28.7 | (24.7) | 4.0 | 31.9 | (27.3) | 4.6 | ||||||||||||||
| North America | 3.0 | (3.0) | - | 12.9 | (5.4) | 7.5 | ||||||||||||||
| Asia Pacific | 13.6 | (3.2) | 10.4 | 17.1 | (3.3) | 13.8 | ||||||||||||||
| Indefinite-lived trade names: | ||||||||||||||||||||
| Latin America | 11.5 | - | 11.5 | 11.7 | - | 11.7 | ||||||||||||||
| EMEA | 0.3 | - | 0.3 | 0.3 | - | 0.3 | ||||||||||||||
| Asia Pacific | - | - | - | 1.0 | - | 1.0 | ||||||||||||||
| Finite-lived trade names: | ||||||||||||||||||||
| Latin America | 1.7 | (1.3) | 0.4 | 1.4 | (1.4) | - | ||||||||||||||
| EMEA | - | - | - | 0.1 | (0.1) | - | ||||||||||||||
| North America | - | - | - | 1.7 | (0.1) | 1.6 | ||||||||||||||
| Asia Pacific | - | - | - | 0.5 | (0.5) | - | ||||||||||||||
| Other contract-related assets: | ||||||||||||||||||||
| Latin America | 9.3 | (0.8) | 8.5 | - | - | - | ||||||||||||||
| Other: | ||||||||||||||||||||
| Latin America | 0.8 | (0.8) | - | 1.0 | (1.0) | - | ||||||||||||||
| EMEA | 1.2 | (1.2) | - | 1.4 | (1.3) | 0.1 | ||||||||||||||
| Asia Pacific | 0.9 | (0.9) | - | 1.0 | (1.0) | - | ||||||||||||||
| Total | $ | 94.8 | (48.5) | 46.3 | $ | 109.1 | (53.0) | 56.1 | ||||||||||||
previous reporting units to our new reporting units in the fourth quarter of 2014. The changes in the carrying amount of goodwill and other intangible assets by operating segment for the years ended December 31, 20132014 and 20122013 are as follows:
| December 31, 2013 | |||||||||||||||||||||
| Beginning | Acquisitions/ | Amortization | Ending | ||||||||||||||||||
| (In millions) | Balance | Dispositions | Expense(a) | Adjustments | Currency | Balance | |||||||||||||||
| Goodwill: | |||||||||||||||||||||
| Latin America | $ | 43.6 | 14.0 | - | - | (7.6) | 50.0 | ||||||||||||||
| EMEA | 142.1 | 1.8 | - | - | 4.1 | 148.0 | |||||||||||||||
| North America | 20.5 | (2.4) | - | - | (0.9) | 17.2 | |||||||||||||||
| Asia Pacific | 37.6 | (9.4) | - | - | (3.2) | 25.0 | |||||||||||||||
| Total goodwill | 243.8 | 4.0 | - | - | (7.6) | 240.2 | |||||||||||||||
| Other intangibles: | |||||||||||||||||||||
| Customer relationships | |||||||||||||||||||||
| Latin America | 15.5 | - | (2.7) | - | (1.6) | 11.2 | |||||||||||||||
| EMEA | 4.6 | 0.8 | (1.6) | - | 0.2 | 4.0 | |||||||||||||||
| North America | 7.5 | (5.9) | (1.3) | - | (0.3) | - | |||||||||||||||
| Asia Pacific | 13.8 | (1.0) | (1.0) | - | (1.4) | 10.4 | |||||||||||||||
| Indefinite-lived trade names | |||||||||||||||||||||
| Latin America | 11.7 | - | - | - | (0.2) | 11.5 | |||||||||||||||
| EMEA | 0.3 | - | - | - | - | 0.3 | |||||||||||||||
| Asia Pacific | 1.0 | - | - | (0.9) | (0.1) | - | |||||||||||||||
| Finite-lived trade names | |||||||||||||||||||||
| Latin America | - | 0.7 | (0.1) | - | (0.2) | 0.4 | |||||||||||||||
| North America | 1.6 | (1.4) | (0.1) | - | (0.1) | - | |||||||||||||||
| Other contract-related assets | |||||||||||||||||||||
| Latin America | - | 11.1 | (0.9) | - | (1.7) | 8.5 | |||||||||||||||
| Other | |||||||||||||||||||||
| EMEA | 0.1 | - | (0.1) | - | - | - | |||||||||||||||
| Total other intangibles | $ | 56.1 | 4.3 | (7.8) | (0.9) | (5.4) | 46.3 | ||||||||||||||
| December 31, 2014 | ||||||||||||||||||||
| Beginning | Acquisitions/ | Ending | ||||||||||||||||||
| (In millions) | Balance | Dispositions | Adjustments | Currency | Balance | |||||||||||||||
| Goodwill: | ||||||||||||||||||||
| Largest 5 Markets: | ||||||||||||||||||||
| U.S. | $ | 12.5 | - | - | - | 12.5 | ||||||||||||||
| France | 53.6 | - | - | (7.3 | ) | 46.3 | ||||||||||||||
| Mexico | 12.8 | - | - | (1.5 | ) | 11.3 | ||||||||||||||
| Brazil | 17.5 | - | - | (2.0 | ) | 15.5 | ||||||||||||||
| Canada | 4.7 | - | - | (0.9 | ) | 3.8 | ||||||||||||||
| Global Markets: | ||||||||||||||||||||
| Latin America | 18.1 | - | - | (2.1 | ) | 16.0 | ||||||||||||||
| EMEA | 94.4 | 3.5 | (0.2 | ) | (13.3 | ) | 84.4 | |||||||||||||
| Asia | 25.0 | - | - | (0.5 | ) | 24.5 | ||||||||||||||
| Payment Services | 1.6 | - | - | (0.2 | ) | 1.4 | ||||||||||||||
| Total Goodwill | $ | 240.2 | 3.5 | (0.2 | ) | (27.8 | ) | 215.7 | ||||||||||||
| December 31, 2013 | ||||||||||||||||||||
| Beginning | Acquisitions/ | Ending | ||||||||||||||||||
| (In millions) | Balance | Dispositions | Adjustments | Currency | Balance | |||||||||||||||
| Goodwill: | ||||||||||||||||||||
| Largest 5 Markets: | ||||||||||||||||||||
| U.S. | $ | 12.5 | - | - | - | 12.5 | ||||||||||||||
| France | 51.2 | 0.9 | - | 1.5 | 53.6 | |||||||||||||||
| Mexico | 11.5 | 3.2 | - | (1.9 | ) | 12.8 | ||||||||||||||
| Brazil | 15.8 | 4.4 | - | (2.7 | ) | 17.5 | ||||||||||||||
| Canada | 8.0 | (2.4 | ) | - | (0.9 | ) | 4.7 | |||||||||||||
| Global Markets: | ||||||||||||||||||||
| Latin America | 16.3 | 4.6 | - | (2.8 | ) | 18.1 | ||||||||||||||
| EMEA | 90.9 | 0.9 | - | 2.6 | 94.4 | |||||||||||||||
| Asia | 37.6 | (9.4 | ) | - | (3.2 | ) | 25.0 | |||||||||||||
| Payment Services | - | 1.8 | - | (0.2 | ) | 1.6 | ||||||||||||||
| Total Goodwill | $ | 243.8 | 4.0 | - | (7.6 | ) | 240.2 | |||||||||||||
| December 31, 2014 | December 31, 2013 | ||||||||||||||||||
| Gross Carrying | Accumulated | Net Carrying | Gross Carrying | Accumulated | Net Carrying | ||||||||||||||
| (In millions) | Amount | Amortization | Amount | Amount | Amortization | Amount | |||||||||||||
| Customer relationships | 64.7 | (43.4) | 21.3 | 69.1 | (43.5) | 25.6 | |||||||||||||
| Indefinite-lived trade names | 10.4 | - | 10.4 | 11.8 | - | 11.8 | |||||||||||||
| Finite-lived trade names | 1.6 | (1.3) | 0.3 | 1.7 | (1.3) | 0.4 | |||||||||||||
| Other contract-related assets | 8.3 | (1.5) | 6.8 | 9.3 | (0.8) | 8.5 | |||||||||||||
| Other | 4.0 | (3.0) | 1.0 | 2.9 | (2.9) | - | |||||||||||||
| Total | $ | 89.0 | (49.2) | 39.8 | $ | 94.8 | (48.5) | 46.3 | |||||||||||
| December 31, 2012 | |||||||||||||||||||||
| Beginning | Acquisitions/ | Amortization | Ending | ||||||||||||||||||
| (In millions) | Balance | Dispositions | Expense(a) | Adjustments | Currency | Balance | |||||||||||||||
| Goodwill: | |||||||||||||||||||||
| Latin America | $ | 46.7 | 0.2 | - | - | (3.3) | 43.6 | ||||||||||||||
| EMEA | 126.0 | 15.1 | - | (2.1) | 3.1 | 142.1 | |||||||||||||||
| North America | 20.1 | - | - | - | 0.4 | 20.5 | |||||||||||||||
| Asia Pacific | 38.6 | - | - | - | (1.0) | 37.6 | |||||||||||||||
| Total goodwill | 231.4 | 15.3 | - | (2.1) | (0.8) | 243.8 | |||||||||||||||
| Other intangibles: | |||||||||||||||||||||
| Customer relationships | |||||||||||||||||||||
| Latin America | 18.5 | 1.3 | (3.0) | - | (1.3) | 15.5 | |||||||||||||||
| EMEA | 6.4 | 1.0 | (2.7) | - | (0.1) | 4.6 | |||||||||||||||
| North America | 8.9 | - | (1.6) | - | 0.2 | 7.5 | |||||||||||||||
| Asia Pacific | 15.3 | - | (1.1) | - | (0.4) | 13.8 | |||||||||||||||
| Indefinite-lived trade names | |||||||||||||||||||||
| Latin America | 10.8 | - | - | - | 0.9 | 11.7 | |||||||||||||||
| EMEA | 0.3 | - | - | - | - | 0.3 | |||||||||||||||
| Asia Pacific | 1.0 | - | - | - | - | 1.0 | |||||||||||||||
| Finite-lived trade names | |||||||||||||||||||||
| Latin America | 0.1 | - | - | - | (0.1) | - | |||||||||||||||
| North America | 1.6 | - | (0.1) | - | 0.1 | 1.6 | |||||||||||||||
| Asia Pacific | 0.1 | - | (0.1) | - | - | - | |||||||||||||||
| Other | |||||||||||||||||||||
| Latin America | 0.2 | - | (0.2) | - | - | - | |||||||||||||||
| EMEA | 0.4 | (0.1) | (0.1) | - | (0.1) | 0.1 | |||||||||||||||
| Asia Pacific | 0.2 | - | (0.2) | - | - | - | |||||||||||||||
| Total other intangibles | $ | 63.8 | 2.2 | (9.1) | - | (0.8) | 56.1 | ||||||||||||||
Total amortization expense for our finite-lived intangible assets was $5.5 million in 2014. Our estimated aggregate amortization expense for finite-lived intangibles recorded at December 31, 2013,2014, for the next five years is as follows:
| (In millions) | 2014 | 2015 | 2016 | 2017 | 2018 | |||||||
| Amortization expense | $ | 5.3 | 4.7 | 4.1 | 3.5 | 3.0 |
| December 31, | ||||||
| (In millions) | 2013 | 2012 | ||||
| Prepaid pension assets | $ | 28.6 | 21.9 | |||
| Equity method investment in unconsolidated entities | 15.8 | 15.6 | ||||
| Available-for-sale securities | 4.5 | 5.3 | ||||
| Other | 49.5 | 36.6 | ||||
| Other assets | $ | 98.4 | 79.4 | |||
| (In millions) | 2015 | 2016 | 2017 | 2018 | 2019 | |||||||||||||||
| Amortization expense | $ | 4.7 | 4.2 | 3.6 | 3.2 | 2.8 | ||||||||||||||
Note 9–8 – Prepaid Expenses and Other
| December 31, | ||||||||
| (In millions) | 2014 | 2013 | ||||||
| Prepaid expenses | $ | 63.5 | 89.7 | |||||
| Mobile airtime inventory | 15.8 | 14.6 | ||||||
| Income tax receivable | 28.3 | 29.9 | ||||||
| Other | 21.4 | 18.8 | ||||||
| Prepaid expenses and other | $ | 129.0 | 153.0 | |||||
| December 31, | ||||||||
| (In millions) | 2014 | 2013 | ||||||
| Deposits | $ | 26.4 | 24.0 | |||||
| Income tax receivable | 15.9 | 8.9 | ||||||
| Cross currency swap contract | 4.4 | 4.7 | ||||||
| Prepaid pension assets | - | 28.6 | ||||||
| Equity method investment in unconsolidated entities | 2.7 | 15.8 | ||||||
| Available-for-sale securities | 3.7 | 4.5 | ||||||
| Other | 17.0 | 11.9 | ||||||
| Other assets | $ | 70.1 | 98.4 | |||||
93
Note 10– Accumulated Other Comprehensive Income (Loss)
The following tables provide the components of other comprehensive income (loss), including the amounts reclassified from accumulated other comprehensive income (loss) into earnings for 2013, 2012 and 2011:earnings:
| Amounts Arising During | Amounts Reclassified to | ||||||||||||
| the Current Period | Net Income (Loss) | ||||||||||||
| Total Other | |||||||||||||
| Income | Income | Comprehensive | |||||||||||
| (In millions) | Pretax | Tax | Pretax | Tax | Income (Loss) | ||||||||
| 2013 | |||||||||||||
| Amounts attributable to Brink's: | |||||||||||||
| Benefit plan adjustments | $ | 251.9 | (114.1) | 76.4 | (27.1) | 187.1 | |||||||
| Foreign currency translation adjustments | (30.9) | - | (0.5) | 0.1 | (31.3) | ||||||||
| Unrealized gains (losses) on available-for-sale securities | (0.3) | 0.1 | 0.4 | (0.2) | - | ||||||||
| Gains (losses) on cash flow hedges | 2.9 | - | (2.3) | - | 0.6 | ||||||||
| 223.6 | (114.0) | 74.0 | (27.2) | 156.4 | |||||||||
| Amounts attributable to noncontrolling interests: | |||||||||||||
| Benefit plan adjustments | (0.9) | 0.3 | 0.3 | (0.1) | (0.4) | ||||||||
| Foreign currency translation adjustments | (1.4) | - | - | - | (1.4) | ||||||||
| Unrealized gains (losses) on available-for-sale securities | - | - | - | - | - | ||||||||
| Gains (losses) on cash flow hedges | - | - | - | - | - | ||||||||
| (2.3) | 0.3 | 0.3 | (0.1) | (1.8) | |||||||||
| Total | |||||||||||||
Benefit plan adjustments(a) | 251.0 | (113.8) | 76.7 | (27.2) | 186.7 | ||||||||
Foreign currency translation adjustments(b) | (32.3) | - | (0.5) | 0.1 | (32.7) | ||||||||
Unrealized gains (losses) on available-for-sale securities(c) | (0.3) | 0.1 | 0.4 | (0.2) | - | ||||||||
Gains (losses) on cash flow hedges(d) | 2.9 | - | (2.3) | - | 0.6 | ||||||||
| $ | 221.3 | (113.7) | 74.3 | (27.3) | 154.6 | ||||||||
| 2012 | |||||||||||||
| Amounts attributable to Brink's: | |||||||||||||
| Benefit plan adjustments | $ | (53.4) | 17.3 | 78.3 | (27.2) | 15.0 | |||||||
| Foreign currency translation adjustments | 1.0 | (0.2) | - | - | 0.8 | ||||||||
| Unrealized gains (losses) on available-for-sale securities | 0.8 | (0.2) | (2.9) | 1.0 | (1.3) | ||||||||
| (51.6) | 16.9 | 75.4 | (26.2) | 14.5 | |||||||||
| Amounts attributable to noncontrolling interests: | |||||||||||||
| Benefit plan adjustments | (2.9) | - | - | - | (2.9) | ||||||||
| Foreign currency translation adjustments | 2.4 | - | - | - | 2.4 | ||||||||
| Unrealized gains (losses) on available-for-sale securities | - | - | - | - | - | ||||||||
| (0.5) | - | - | - | (0.5) | |||||||||
| Total | |||||||||||||
Benefit plan adjustments(a) | (56.3) | 17.3 | 78.3 | (27.2) | 12.1 | ||||||||
| Foreign currency translation adjustments | 3.4 | (0.2) | - | - | 3.2 | ||||||||
Unrealized gains (losses) on available-for-sale securities(c) | 0.8 | (0.2) | (2.9) | 1.0 | (1.3) | ||||||||
| $ | (52.1) | 16.9 | 75.4 | (26.2) | 14.0 | ||||||||
| Amounts Arising During | Amounts Reclassified to | |||||||||||||||||||
| the Current Period | Net Income (Loss) | |||||||||||||||||||
| Total Other | ||||||||||||||||||||
| Income | Income | Comprehensive | ||||||||||||||||||
| (In millions) | Pretax | Tax | Pretax | Tax | Income (Loss) | |||||||||||||||
| 2014 | ||||||||||||||||||||
| Amounts attributable to Brink's: | ||||||||||||||||||||
| Benefit plan adjustments | $ | (231.2 | ) | 78.1 | 95.3 | (35.9 | ) | (93.7 | ) | |||||||||||
| Foreign currency translation adjustments | (82.2 | ) | - | 1.3 | 0.3 | (80.6 | ) | |||||||||||||
| Unrealized gains (losses) on available-for-sale securities | 0.1 | - | (0.5 | ) | 0.2 | (0.2 | ) | |||||||||||||
| Gains (losses) on cash flow hedges | 0.7 | - | (0.9 | ) | - | (0.2 | ) | |||||||||||||
| (312.6 | ) | 78.1 | 95.2 | (35.4 | ) | (174.7 | ) | |||||||||||||
| �� | ||||||||||||||||||||
| Amounts attributable to noncontrolling interests: | ||||||||||||||||||||
| Benefit plan adjustments | (1.4 | ) | 0.4 | 0.4 | (0.1 | ) | (0.7 | ) | ||||||||||||
| Foreign currency translation adjustments | (6.1 | ) | - | - | - | (6.1 | ) | |||||||||||||
| Unrealized gains (losses) on available-for-sale securities | - | - | - | - | - | |||||||||||||||
| Gains (losses) on cash flow hedges | - | - | - | - | - | |||||||||||||||
| (7.5 | ) | 0.4 | 0.4 | (0.1 | ) | (6.8 | ) | |||||||||||||
| Total | ||||||||||||||||||||
Benefit plan adjustments(a),(b) | (232.6 | ) | 78.5 | 95.7 | (36.0 | ) | (94.4 | ) | ||||||||||||
Foreign currency translation adjustments(b) | (88.3 | ) | - | 1.3 | 0.3 | (86.7 | ) | |||||||||||||
Unrealized gains (losses) on available-for-sale securities(c) | 0.1 | - | (0.5 | ) | 0.2 | (0.2 | ) | |||||||||||||
Gains (losses) on cash flow hedges(d) | 0.7 | - | (0.9 | ) | - | (0.2 | ) | |||||||||||||
| $ | (320.1 | ) | 78.5 | 95.6 | (35.5 | ) | (181.5 | ) | ||||||||||||
| 2013 | ||||||||||||||||||||
| Amounts attributable to Brink's: | ||||||||||||||||||||
| Benefit plan adjustments | $ | 251.9 | (114.1 | ) | 76.4 | (27.1 | ) | 187.1 | ||||||||||||
| Foreign currency translation adjustments | (30.9 | ) | - | (0.5 | ) | 0.1 | (31.3 | ) | ||||||||||||
| Unrealized gains (losses) on available-for-sale securities | (0.3 | ) | 0.1 | 0.4 | (0.2 | ) | - | |||||||||||||
| Gains (losses) on cash flow hedges | 2.9 | - | (2.3 | ) | - | 0.6 | ||||||||||||||
| 223.6 | (114.0 | ) | 74.0 | (27.2 | ) | 156.4 | ||||||||||||||
| Amounts attributable to noncontrolling interests: | ||||||||||||||||||||
| Benefit plan adjustments | (0.9 | ) | 0.3 | 0.3 | (0.1 | ) | (0.4 | ) | ||||||||||||
| Foreign currency translation adjustments | (1.4 | ) | - | - | - | (1.4 | ) | |||||||||||||
| Unrealized gains (losses) on available-for-sale securities | - | - | - | - | - | |||||||||||||||
| Gains (losses) on cash flow hedges | - | - | - | - | - | |||||||||||||||
| (2.3 | ) | 0.3 | 0.3 | (0.1 | ) | (1.8 | ) | |||||||||||||
| Total | ||||||||||||||||||||
Benefit plan adjustments(a) | 251.0 | (113.8 | ) | 76.7 | (27.2 | ) | 186.7 | |||||||||||||
Foreign currency translation adjustments(b) | (32.3 | ) | - | (0.5 | ) | 0.1 | (32.7 | ) | ||||||||||||
Unrealized gains (losses) on available-for-sale securities(c) | (0.3 | ) | 0.1 | 0.4 | (0.2 | ) | - | |||||||||||||
Gains (losses) on cash flow hedges(d) | 2.9 | - | (2.3 | ) | - | 0.6 | ||||||||||||||
| $ | 221.3 | (113.7 | ) | 74.3 | (27.3 | ) | 154.6 | |||||||||||||
| Amounts Arising During | Amounts Reclassified to | ||||||||||||
| the Current Period | Net Income (Loss) | ||||||||||||
| Total Other | |||||||||||||
| Income | Income | Comprehensive | |||||||||||
| (In millions) | Pretax | Tax | Pretax | Tax | Income (Loss) | ||||||||
| 2011 | |||||||||||||
| Amounts attributable to Brink's: | |||||||||||||
| Benefit plan adjustments | $ | (253.2) | 89.4 | 52.0 | (17.6) | (129.4) | |||||||
| Foreign currency translation adjustments | (48.4) | 1.7 | - | - | (46.7) | ||||||||
| Unrealized gains (losses) on available-for-sale securities | 2.0 | - | (4.4) | 0.9 | (1.5) | ||||||||
| (299.6) | 91.1 | 47.6 | (16.7) | (177.6) | |||||||||
| Amounts attributable to noncontrolling interests: | |||||||||||||
| Benefit plan adjustments | - | - | - | - | - | ||||||||
| Foreign currency translation adjustments | (2.1) | - | - | - | (2.1) | ||||||||
| Unrealized gains (losses) on available-for-sale securities | 0.1 | - | - | - | 0.1 | ||||||||
| (2.0) | - | - | - | (2.0) | |||||||||
| Total | |||||||||||||
Benefit plan adjustments(a) | (253.2) | 89.4 | 52.0 | (17.6) | (129.4) | ||||||||
| Foreign currency translation adjustments | (50.5) | 1.7 | - | - | (48.8) | ||||||||
Unrealized gains (losses) on available-for-sale securities(c) | 2.1 | - | (4.4) | 0.9 | (1.4) | ||||||||
| $ | (301.6) | 91.1 | 47.6 | (16.7) | (179.6) | ||||||||
| Amounts Arising During | Amounts Reclassified to | |||||||||||||||||||
| the Current Period | Net Income (Loss) | |||||||||||||||||||
| Total Other | ||||||||||||||||||||
| Income | Income | Comprehensive | ||||||||||||||||||
| (In millions) | Pretax | Tax | Pretax | Tax | Income (Loss) | |||||||||||||||
| 2012 | ||||||||||||||||||||
| Amounts attributable to Brink's: | ||||||||||||||||||||
| Benefit plan adjustments | $ | (53.4 | ) | 17.3 | 78.3 | (27.2 | ) | 15.0 | ||||||||||||
| Foreign currency translation adjustments | 1.0 | (0.2 | ) | - | - | 0.8 | ||||||||||||||
| Unrealized gains (losses) on available-for-sale securities | 0.8 | (0.2 | ) | (2.9 | ) | 1.0 | (1.3 | ) | ||||||||||||
| (51.6 | ) | 16.9 | 75.4 | (26.2 | ) | 14.5 | ||||||||||||||
| Amounts attributable to noncontrolling interests: | ||||||||||||||||||||
| Benefit plan adjustments | (2.9 | ) | - | - | - | (2.9 | ) | |||||||||||||
| Foreign currency translation adjustments | 2.4 | - | - | - | 2.4 | |||||||||||||||
| Unrealized gains (losses) on available-for-sale securities | - | - | - | - | - | |||||||||||||||
| (0.5 | ) | - | - | - | (0.5 | ) | ||||||||||||||
| Total | ||||||||||||||||||||
Benefit plan adjustments(a) | (56.3 | ) | 17.3 | 78.3 | (27.2 | ) | 12.1 | |||||||||||||
| Foreign currency translation adjustments | 3.4 | (0.2 | ) | - | - | 3.2 | ||||||||||||||
Unrealized gains (losses) on available-for-sale securities(c) | 0.8 | (0.2 | ) | (2.9 | ) | 1.0 | (1.3 | ) | ||||||||||||
| $ | (52.1 | ) | 16.9 | 75.4 | (26.2 | ) | 14.0 | |||||||||||||
| The amortization of prior experience losses and prior service cost is part of total net periodic retirement benefit cost when reclassified to net |
| December 31, | ||||||||||
| (In millions) | 2013 | 2012 | 2011 | |||||||
| Total net periodic retirement benefit cost included in: | ||||||||||
| Cost of revenues | $ | 66.8 | 64.7 | 41.4 | ||||||
| Selling, general and administrative expenses | 17.5 | 19.8 | 8.2 | |||||||
| December 31, | ||||||||||||
| (In millions) | 2014 | 2013 | 2012 | |||||||||
| Total net periodic retirement benefit cost included in: | ||||||||||||
| Cost of revenues | $ | 68.0 | 66.8 | 64.7 | ||||||||
| Selling, general and administrative expenses | 29.5 | 17.5 | 19.8 | |||||||||
Pretax benefit plan adjustments of $8 million (including related deferred tax component) and foreign currency translation adjustments reclassified to the income statement in 2014 relate to the sale of CIT operations in the Netherlands. Reclassification of foreign currency translation amounts in 2013 relate to the sale of ICD Limited and its affiliates, as well as CIT operations in Hungary and Poland. The amounts are included in loss from discontinued operations in the income statement. |
| (c) | Gains and losses on sales of available-for-sale securities are reclassified from accumulated other comprehensive loss to the income statement when the gains or losses are realized. Pretax amounts are classified in the income statement as interest and other income (expense). |
| (d) | Pretax gains and losses on cash flow hedges are classified in the income statement as |
| · | other operating income (expense) ($ |
| · | interest and other income (expense) ($1.0 million losses in 2014 and 2013) |
| Benefit Plan Adjustments | Foreign Currency Translation Adjustments | Unrealized Gains (Losses) on Available-for-Sale Securities | Gains (Losses) on Cash Flow Hedges | Total | |||||||||
| (In millions) | |||||||||||||
| Balance as of December 31,2010 | $ | (550.7) | (64.0) | 4.4 | - | (610.3) | |||||||
| Other comprehensive income (loss) before reclassifications | (163.8) | (46.7) | 2.0 | - | (208.5) | ||||||||
| Amounts reclassified from accumulated other comprehensive loss | 34.4 | - | (3.5) | - | 30.9 | ||||||||
| Balance as of December 31, 2011 | (680.1) | (110.7) | 2.9 | - | (787.9) | ||||||||
| Other comprehensive income (loss) before reclassifications | (36.1) | 0.8 | 0.6 | - | (34.7) | ||||||||
| Amounts reclassified from accumulated other comprehensive loss | 51.1 | - | (1.9) | - | 49.2 | ||||||||
| Balance as of December 31, 2012 | (665.1) | (109.9) | 1.6 | - | (773.4) | ||||||||
| Other comprehensive income (loss) before reclassifications | 137.8 | (30.9) | (0.2) | 2.9 | 109.6 | ||||||||
| Amounts reclassified from accumulated other comprehensive loss | 49.3 | (0.4) | 0.2 | (2.3) | 46.8 | ||||||||
| Other comprehensive income (loss) attributable to Brink's | 187.1 | (31.3) | - | 0.6 | 156.4 | ||||||||
| Acquisitions of noncontrolling interests | - | (0.3) | - | - | (0.3) | ||||||||
| Balance as of December 31, 2013 | $ | (478.0) | (141.5) | 1.6 | 0.6 | (617.3) | |||||||
| Benefit Plan Adjustments | Foreign Currency Translation Adjustments | Unrealized Gains (Losses) on Available-for-Sale Securities | Gains (Losses) on Cash Flow Hedges | Total | ||||||||
| (In millions) | ||||||||||||
| Balance as of December 31, 2011 | $ | (680.1) | (110.7) | 2.9 | - | (787.9) | ||||||
| Other comprehensive income (loss) before reclassifications | (36.1) | 0.8 | 0.6 | - | (34.7) | |||||||
| Amounts reclassified from accumulated other comprehensive loss | 51.1 | - | (1.9) | - | 49.2 | |||||||
| Other comprehensive income (loss) attributable to Brink's | 15.0 | 0.8 | (1.3) | - | 14.5 | |||||||
| Balance as of December 31, 2012 | (665.1) | (109.9) | 1.6 | - | (773.4) | |||||||
| Other comprehensive income (loss) before reclassifications | 137.8 | (30.9) | (0.2) | 2.9 | 109.6 | |||||||
| Amounts reclassified from accumulated other comprehensive loss | 49.3 | (0.4) | 0.2 | (2.3) | 46.8 | |||||||
| Other comprehensive income (loss) attributable to Brink's | 187.1 | (31.3) | - | 0.6 | 156.4 | |||||||
| Acquisitions of noncontrolling interests | - | (0.3) | - | - | (0.3) | |||||||
| Balance as of December 31, 2013 | (478.0) | (141.5) | 1.6 | 0.6 | (617.3) | |||||||
| Other comprehensive income (loss) before reclassifications | (153.1) | (82.2) | 0.1 | 0.7 | (234.5) | |||||||
| Amounts reclassified from accumulated other comprehensive loss | 59.4 | 1.6 | (0.3) | (0.9) | 59.8 | |||||||
| Other comprehensive income (loss) attributable to Brink's | (93.7) | (80.6) | (0.2) | (0.2) | (174.7) | |||||||
| Balance as of December 31, 2014 | $ | (571.7) | (222.1) | 1.4 | 0.4 | (792.0) | ||||||
Note 1011 – Fair Value of Financial Instruments
Investments in Available-for-sale Securities
We have investments in mutual funds designated as available-for-sale securities that are carried at fair value in the financial statements. For these investments, fair value was estimated based on quoted prices categorized as a Level 1 valuation.
The fair value and carrying value of our fixed-rate debt are as follows:
| December 31, | |||||||
| (In millions) | 2013 | 2012 | |||||
| DTA bonds | |||||||
| Carrying value | $ | 43.2 | 43.2 | ||||
| Fair value | 42.8 | 43.4 | |||||
| Unsecured notes issued in a private placement | |||||||
| Carrying value | 100.0 | 100.0 | |||||
| Fair value | 105.8 | 110.5 | |||||
| December 31, | ||||||||
| (In millions) | 2014 | 2013 | ||||||
| Unsecured notes issued in a private placement | ||||||||
| Carrying value | $ | 100.0 | 100.0 | |||||
| Fair value | 105.6 | 105.8 | ||||||
DTA bonds(a) | ||||||||
| Carrying value | - | 43.2 | ||||||
| Fair value | - | 42.8 | ||||||
The fair value estimate of our unsecured private-placement notes is based on the present value of future cash flows, discounted at rates for similar instruments at the respective measurement dates, which we have categorized as a Level 3 valuation. The fair value estimate of our obligation related to the fixed-rate Dominion Terminal Associates (“DTA”) bonds at December 31, 2013, was based on price information observed in a less-active market, which we categorized as a Level 2 valuation.
There were no transfers in or out of any of the levels of the valuation hierarchy in 2013.2014.
Other Financial Instruments
Other financial instruments include cash and cash equivalents, short-term fixed rate deposits, accounts receivable, floating rate debt, accounts payable and accrued liabilities. The financial statement carrying amounts of these items approximate the fair value.
We have outstanding foreign currency forward and swap contracts to hedge transactional risks associated with foreign currencies. Our short term contracts have a weighted average maturity of approximately one month. In 2013, we additionally entered into a cross-currency swap to hedge against the change in value of a long-term intercompany loan denominated in a currency other than the lending subsidiary’s functional currency. The fair values of these currency contracts, including the cross-currency swap, are determined using Level 2 valuation techniques and are based on the present value of net future cash payments and receipts. Accordingly, the fair values will fluctuate based on changes in market interest rates and the respective foreign currency to U.S. dollar exchange rate. The fair values of our outstanding short-term foreign currency contracts at December 31, 2013,2014, were not significant. At December 31, 2013,2014, the fair value of the cross-currency swap was a netan asset of $3.7$5.5 million. There were no transfers in or out of any of the levels of the valuation hierarchy in 2013.2014.
| December 31, | ||||||
| (In millions) | 2013 | 2012 | ||||
| Payroll and other employee liabilities | $ | 172.8 | 168.9 | |||
| Taxes, except income taxes | 110.5 | 109.8 | ||||
Cash held by Cash Management Services operations(a) | 31.3 | 44.0 | ||||
| Workers’ compensation and other claims | 24.3 | 24.4 | ||||
| Retirement benefits (see note 3) | 10.3 | 13.4 | ||||
| Income taxes payable | 14.5 | 16.1 | ||||
| Other | 143.8 | 139.9 | ||||
| Accrued liabilities | $ | 507.5 | 516.5 | |||
| December 31, | ||||||||
| (In millions) | 2014 | 2013 | ||||||
| Payroll and other employee liabilities | $ | 138.8 | 172.8 | |||||
| Taxes, except income taxes | 96.3 | 110.5 | ||||||
Cash held by Cash Management Services operations(a) | 28.0 | 31.3 | ||||||
| Workers’ compensation and other claims | 22.5 | 24.3 | ||||||
| Retirement benefits (see note 3) | 8.9 | 10.3 | ||||||
| Income taxes payable | 11.9 | 14.5 | ||||||
| Other | 159.9 | 143.8 | ||||||
| Accrued liabilities | $ | 466.3 | 507.5 | |||||
| (a) |
Note 1213 – Other Liabilities
| December 31, | ||||||
| (In millions) | 2013 | 2012 | ||||
| Workers’ compensation and other claims | $ | 42.1 | 44.2 | |||
| Post-employment benefits | 42.0 | 40.2 | ||||
| Asset retirement and remediation obligations | 18.9 | 17.9 | ||||
| Employee-related liabilities | 14.0 | 17.1 | ||||
| Noncurrent tax liabilities | 10.2 | 11.6 | ||||
| Other | 43.4 | 46.4 | ||||
| Other liabilities | $ | 170.6 | 177.4 | |||
| December 31, | ||||||||
| (In millions) | 2014 | 2013 | ||||||
| Workers’ compensation and other claims | $ | 47.6 | 42.1 | |||||
| Post-employment benefits | 16.6 | 42.0 | ||||||
| Asset retirement and remediation obligations | 12.0 | 18.9 | ||||||
| Employee-related liabilities | 7.1 | 14.0 | ||||||
| Noncurrent tax liabilities | 6.4 | 10.2 | ||||||
| Other | 40.1 | 43.4 | ||||||
| Other liabilities | $ | 129.8 | 170.6 | |||||
| December 31, | ||||||||
| (In millions) | 2013 | 2012 | ||||||
| Bank credit facilities: | ||||||||
| Revolving Facility (year-end weighted average interest | ||||||||
| rate of 1.6% in 2013 and 1.5% in 2012) | $ | 120.6 | 107.2 | |||||
| Private Placement Notes (Series A interest rate of 4.6%, Series B interest | ||||||||
| rate of 5.2%), due 2021 | 100.0 | 100.0 | ||||||
| Other non-U.S. dollar-denominated facilities (year-end weighted | ||||||||
| average interest rate of 5.7% in 2013 and 7.7% in 2012) | 14.9 | 20.9 | ||||||
| Dominion Terminal Associates 6.0% bonds, due 2033 | 43.2 | 43.2 | ||||||
| Capital leases (average rates: 3.7% in 2013 and 4.2% in 2012) | 76.4 | 91.3 | ||||||
| Total long-term debt | $ | 355.1 | 362.6 | |||||
| Included in: | ||||||||
| Current liabilities | $ | 24.6 | 27.0 | |||||
| Noncurrent liabilities | 330.5 | 335.6 | ||||||
| Total long-term debt | $ | 355.1 | 362.6 | |||||
| December 31, | |||||
| (In millions) | 2014 | 2013 | |||
| Bank credit facilities: | |||||
| Revolving Facility (year-end weighted average interest | |||||
| rate of 1.6% in 2014 and 1.6% in 2013) | $ | 233.0 | 120.6 | ||
| Private Placement Notes (Series A interest rate of 4.6%, Series B interest | |||||
| rate of 5.2%), due 2021 | 100.0 | 100.0 | |||
| Other non-U.S. dollar-denominated facilities (year-end weighted | |||||
| average interest rate of 6.9% in 2014 and 5.7% in 2013) | 9.5 | 14.9 | |||
Dominion Terminal Associates 6.0% bonds(a) | - | 43.2 | |||
| Capital leases (average rates: 3.5% in 2014 and 3.7% in 2013) | 64.9 | 76.4 | |||
| Total long-term debt | $ | 407.4 | 355.1 | ||
| Included in: | |||||
| Current liabilities | $ | 34.1 | 24.6 | ||
| Noncurrent liabilities | 373.3 | 330.5 | |||
| Total long-term debt | $ | 407.4 | 355.1 | ||
| (a) | Redeemed in 2014. | ||||
We have a $480million unsecured revolving bank credit facility (the “Revolving Facility”) that matures in January 2017. The Revolving Facility’s interest rate is based on LIBOR plus a margin, alternate base rate plus a margin, or competitive bid. The Revolving Facility allows us to borrow or issue letters of credit (or otherwise satisfy credit needs) on a revolving basis over the term of the facility.As of December 31, 2013, $3592014, $247 million was available under the Revolving Facility. Amounts outstanding under the Revolving Facility as of December 31, 2013,2014, were denominated primarily in U.S. dollars and to a lesser extent in euros.
The margin on LIBOR borrowings under the Revolving Facility, which can range from 0.9% to 1.575% depending on our credit rating, was 1.40% at December 31, 2013.2014. The margin on alternate base rate borrowings under the Revolving Facility can range from 0.0% to 0.575%. We also pay an annual facility fee on the Revolving Facility based on our credit rating. The facility fee can range from 0.10% to 0.30 %0.30% and was 0.225% at December 31, 2013.2014.
We have $100 million in unsecured notes through a private placement debt transaction (the “Notes”). The Notes comprise $50 million in series A notes with a fixed interest rate of 4.57% and $50 million in series B notes with a fixed interest rate of 5.20%. The Notes are due in January 2021 with principal payments under the series A notes to beginbeginning in January 2015.
We have a $24 million unsecured committed credit facility that expires in April 2014.2016. Interest on this facility is based on LIBOR plus a margin, which ranges from 1.20% to 1.575%. As of December 31, 2013, $142014, $24 million was available under the facility.
97
We have three unsecured letter of credit facilities totaling $179 million, of which approximately $70$72 million was available at December 31, 2013. A $54 million facility expires in December 2016, an2014. An $85 million facility expires in June 2015, and a $40 million facility expires in December 2015.2015, and a $54 million facility expires in December 2016. The Revolving Facility and the multi-currency revolving credit facilities are also used for issuance of letters of credit and bank guarantees.
| Minimum repayments of long-term debt are as follows: | ||||||||||
| (In millions) | Capital leases | Other long-term debt | Total | |||||||
| 2014 | $ | 20.5 | 4.1 | 24.6 | ||||||
| 2015 | 20.7 | 13.7 | 34.4 | |||||||
| 2016 | 13.7 | 9.1 | 22.8 | |||||||
| 2017 | 10.4 | 129.7 | 140.1 | |||||||
| 2018 | 6.4 | 7.1 | 13.5 | |||||||
| Later years | 4.7 | 115.0 | 119.7 | |||||||
| Total | $ | 76.4 | 278.7 | 355.1 | ||||||
| Minimum repayments of long-term debt are as follows: | ||||||||||||
| (In millions) | Capital leases | Other long-term debt | Total | |||||||||
| 2015 | $ | 21.3 | 12.8 | 34.1 | ||||||||
| 2016 | 17.3 | 8.9 | 26.2 | |||||||||
| 2017 | 9.7 | 240.6 | 250.3 | |||||||||
| 2018 | 7.1 | 7.1 | 14.2 | |||||||||
| 2019 | 4.5 | 7.1 | 11.6 | |||||||||
| Later years | 5.0 | 66.0 | 71.0 | |||||||||
| Total | $ | 64.9 | 342.5 | 407.4 | ||||||||
The Revolving Facility, the Notes, the unsecured multi-currency revolving bank credit facilities, the unsecured committed credit facility and the letter of credit facilities contain subsidiary guarantees and various financial and other covenants. The financial covenants, among other things, limit our total indebtedness, limit priority debt, limit asset sales, limit the use of proceeds from asset sales and provide for minimum coverage of interest costs. The credit agreements do not provide for the acceleration of payments should our credit rating be reduced. If we were not to comply with the terms of our various credit agreements, the repayment terms could be accelerated and the commitments could be withdrawn. An acceleration of the repayment terms under one agreement could trigger the acceleration of the repayment terms under the other loan agreements. We were in compliance with all financial covenants at December 31, 2013.2014.
We have $43redeemed $43.2 million of bonds issued by the Peninsula Ports Authority of Virginia recorded as debt on our balance sheet.at par in the third quarter of 2014. The amount paid, including accrued and unpaid interest, was $44.3 million. Although we arewere not the primary obligor of the debt, we haverecorded the obligation as debt because we had guaranteed the debt and we believe that we will ultimately pay this obligation.its payment. The guarantee originated as part of a former interest in Dominion Terminal Associates, a deep water coal terminal. We continueterminal related to pay interest on the debt. The bonds bear a fixed interest rate of 6.0% and mature in 2033. The bonds may mature prior to 2033 upon the occurrence of specified events such as the determination that the bonds are taxable or if we fail to abide by the terms of the guarantee.our former coal business.
At December 31, 2013,2014, we had undrawn letters of credit and guarantees totaling $137.0$123.1 million, including $109.0$107.0 million issued under the letter of credit facilities, $21.0$14.3 million issued under the multi-currency revolving bank credit facilities, and $7.1$1.8 million issued under other credit facilities. These letters of credit primarily support our obligations under various self-insurance programs and credit facilities.
Property and equipment acquired under capital leases are included in property and equipment as follows:
| December 31, | |||||||
| (In millions) | 2013 | 2012 | |||||
| Asset class: | |||||||
| Buildings | $ | 2.6 | 4.9 | ||||
| Vehicles | 103.7 | 108.2 | |||||
| Machinery and equipment | 31.8 | 36.5 | |||||
| 138.1 | 149.6 | ||||||
| Less: accumulated amortization | (57.6) | (47.4) | |||||
| Total | $ | 80.5 | 102.2 | ||||
| December 31, | ||||||||
| (In millions) | 2014 | 2013 | ||||||
| Asset class: | ||||||||
| Buildings | $ | 2.3 | 2.6 | |||||
| Vehicles | 107.5 | 103.7 | ||||||
| Machinery and equipment | 31.5 | 31.8 | ||||||
| 141.3 | 138.1 | |||||||
| Less: accumulated amortization | (71.2 | ) | (57.6 | ) | ||||
| Total | $ | 70.1 | 80.5 | |||||
Note 1415 – Accounts Receivable
| December 31, | ||||||
| (In millions) | 2013 | 2012 | ||||
| Trade | $ | 595.2 | 590.7 | |||
| Other | 35.2 | 30.8 | ||||
| Total accounts receivable | 630.4 | 621.5 | ||||
| Allowance for doubtful accounts | (8.2) | (9.2) | ||||
| Accounts receivable, net | $ | 622.2 | 612.3 | |||
| December 31, | ||||||||
| (In millions) | 2014 | 2013 | ||||||
| Trade | $ | 516.3 | 595.2 | |||||
| Other | 24.2 | 35.2 | ||||||
| Total accounts receivable | 540.5 | 630.4 | ||||||
| Allowance for doubtful accounts | (10.0 | ) | (8.2 | ) | ||||
| Accounts receivable, net | $ | 530.5 | 622.2 | |||||
| Years Ended December 31, | ||||||||||
| (In millions) | 2013 | 2012 | 2011 | |||||||
| Allowance for doubtful accounts: | ||||||||||
| Beginning of year | $ | 9.2 | 8.9 | 7.2 | ||||||
| Provision for uncollectible accounts receivable: | ||||||||||
| Continuing operations | 4.1 | 1.7 | 3.0 | |||||||
| Discontinued operations | 0.1 | 1.0 | 1.0 | |||||||
| Write offs less recoveries | (3.9) | (1.0) | (1.4) | |||||||
| Foreign currency exchange effects | (1.3) | (1.4) | (0.9) | |||||||
| End of year | $ | 8.2 | 9.2 | 8.9 | ||||||
| Years Ended December 31, | ||||||||||||
| (In millions) | 2014 | 2013 | 2012 | |||||||||
| Allowance for doubtful accounts: | ||||||||||||
| Beginning of year | $ | 8.2 | 9.2 | 8.9 | ||||||||
| Provision for uncollectible accounts receivable: | ||||||||||||
| Continuing operations | 7.5 | 4.1 | 1.7 | |||||||||
| Discontinued operations | (0.5 | ) | 0.1 | 1.0 | ||||||||
| Write offs less recoveries | (2.6 | ) | (3.9 | ) | (1.0 | ) | ||||||
| Foreign currency exchange effects | (2.6 | ) | (1.3 | ) | (1.4 | ) | ||||||
| End of year | $ | 10.0 | 8.2 | 9.2 | ||||||||
We lease facilities, vehicles, computers and other equipment under long-term operating and capital leases with varying terms. Most of the operating leases contain renewal and/or purchase options. We expect that in the normal course of business, the majority of operating leases will be renewed or replaced by other leases.
As of December 31, 2013,2014, future minimum lease payments under noncancellable operating leases with initial or remaining lease terms in excess of one year are included below.
| (In millions) | Facilities | Vehicles | Other | Total | ||||||
| 2014 | $ | 55.0 | 13.4 | 13.1 | 81.5 | |||||
| 2015 | 42.3 | 8.2 | 14.8 | 65.3 | ||||||
| 2016 | 29.8 | 3.3 | 15.6 | 48.7 | ||||||
| 2017 | 21.4 | 0.5 | 0.1 | 22.0 | ||||||
| 2018 | 15.7 | 0.2 | - | 15.9 | ||||||
| Later years | 43.0 | - | - | 43.0 | ||||||
| $ | 207.2 | 25.6 | 43.6 | 276.4 |
| (In millions) | Facilities | Vehicles | Other | Total | ||||||||||||
| 2015 | $ | 44.3 | 8.3 | 14.8 | 67.4 | |||||||||||
| 2016 | 34.7 | 9.0 | 8.5 | 52.2 | ||||||||||||
| 2017 | 26.8 | 8.9 | 4.2 | 39.9 | ||||||||||||
| 2018 | 20.4 | 3.6 | 1.8 | 25.8 | ||||||||||||
| 2019 | 15.9 | 2.2 | 1.1 | 19.2 | ||||||||||||
| Later years | 45.0 | - | 0.5 | 45.5 | ||||||||||||
| $ | 187.1 | 32.0 | 30.9 | 250.0 | ||||||||||||
The cost related to theseoperating leases is recognized as rental expense in the consolidated statements of income. Since March 2009, we have acquired armored vehicles in the U.S. either by purchasing or by leasing under agreements that we have accounted for as capital leases. The cost of vehicles under capital lease is recognized as depreciation and interest expense.
Net rent expense included in continuing operations amounted to $106.8$101.7 million in 2014, $100.4 million in 2013 $97.1and $91.3 million in 2012 and $101.2 million in 2011.2012.
Note 1617 – Share-Based Compensation Plans
We have share-based compensation plans to retain employees and nonemployee directors and to more closely align their interests with those of our shareholders.
There are 3.53.7 million shares underlying share-based plans that are authorized, but not yet granted. Outstanding awards at December 31, 20132014, include performance share units, (“PSUs”), market share units, (“MSUs”), restricted stock units, (“RSUs”), deferred stock units (“DSUs”) and stock options.
Compensation expense is measured using the fair-value-based method.
For employee and director awards considered equity grants, compensation expense is recognized from the grant date to the earlier of the retirement-eligible date or the vesting date.
The grant date for accounting purposes may be different than the date the award is granted to the employee. To establish a grant date for accounting purposes, the employee and the employer must have a mutual understanding of the important terms and conditions of the award. For awards considered liabilities and for equity awards that have not had a grant date established because a mutual understanding does not exist, compensation cost is based on the change in the fair value of the instrument for each reporting period and the percentage of the requisite service that has been rendered.
Compensation expense related to deferred stock units granted to directors prior to 2014 was recognized in its entirety at the grant date. For deferred stock units granted to directors in 2014, compensation expense is recognized either in its entirety at the grant date or over a one year vesting period if the director elects to receive the units in shares after one year.
Compensation expenses are classified as selling, general and administrative expenses in the consolidated statements of income (loss). Compensation expenses for the last three years and the amount of unrecognized expense for awards outstanding at December 31, 2014, were as follows:
| Weighted- | |||||||||
| Unrecognized | average | ||||||||
| Expense for | No. of Years | ||||||||
| Compensation Expense | Nonvested | Unrecognized | |||||||
| Years Ended December 31, | Awards at | Expense to be | |||||||
| (in millions except years) | 2014 | 2013 | 2012 | Dec 31, 2014 | Recognized | ||||
| Performance Share Units | $ | 6.8 | 4.0 | - | $ | 5.6 | 1.8 | ||
| Market Share Units | 1.6 | 1.8 | - | 0.7 | 1.7 | ||||
| Restricted Stock Units | 6.0 | 3.1 | 5.4 | 3.6 | 1.5 | ||||
| Deferred Stock Units | 0.6 | 0.5 | 0.5 | 0.1 | 0.3 | ||||
| Stock Options | 2.3 | 0.5 | 2.1 | 0.1 | 0.6 | ||||
| Share-based payment expense | 17.3 | 9.9 | 8.0 | ||||||
| Income tax benefit | (5.6) | (3.4) | (2.7) | ||||||
| Share-based payment expense, net of tax | $ | 11.7 | 6.5 | 5.3 | |||||
100
Fair Value of Vested Awards
Fair Value of Shares Vested(a) | ||||||||||||
| Years Ended December 31, | ||||||||||||
| (in millions) | 2014 | 2013 | 2012 | |||||||||
| Restricted Stock Units | 4.1 | 4.1 | 4.4 | |||||||||
| Deferred Stock Units | 0.3 | - | - | |||||||||
| Stock Options | 0.1 | 2.0 | 0.6 | |||||||||
| Total | 4.5 | 6.1 | 5.0 | |||||||||
| (a) |
Recoupment Policy Change in 2014
For certain awards granted since 2010, we concluded in the second quarter of 2014 that the employee and employer did not have a mutual understanding related to the application of a compensation recoupment policy that was established in 2010. As a result, we concluded that the service inception date preceded the grant date for equity awards outstanding at that time. Our recoupment policy was revised in July 2014 and, as a result, we concluded that certain outstanding awards have grant dates that reflect the date of the revision of the policy on July 11, 2014. Approximately 130 employees who received share-based awards were affected by the change in policy. As a result, we recognized $4.2 million of expense during the second quarter of 2014 for the cumulative effect of this accounting error.
Restricted Stock Units (“RSUs”)
We granted RSUs to senior executives and select employees in the last three years. RSUs are paid out in shares of Brink’s stock when the awards vest. For RSUs granted during the last three years, the units generally vest ratably in three equal annual installments. We measure the fair value of RSU grants based on the price of Brink’s stock, adjusted for a discount for awards that do not receive or accrue dividends. The weighted-average fair value per share at issuance date was $27.91 in 2014, $26.17 in 2013 rewardand $22.19 in 2012. The weighted-average discount was approximately 3% in 2014, 2013 and 2012.
The following table summarizes RSU activity during 2014:
| Weighted- | ||||||||||||
| Fair Value | Average | |||||||||||
| Shares | at Issuance | Grant Date | ||||||||||
| (in thousands) | Date(a) | Fair Value(a) | ||||||||||
| Nonvested balance as of December 31, 2013 | 396.4 | $ | 24.58 | |||||||||
| Activity from January 1 to July 11, 2014: | ||||||||||||
| Granted | 136.7 | 29.97 | ||||||||||
| Cancelled | (5.6 | ) | 24.75 | |||||||||
| Vested | (142.8 | ) | 25.44 | |||||||||
| Nonvested balance as of July 11, 2014 | 384.7 | $ | 26.18 | $ | 26.47 | |||||||
| Activity from July 12 to December 31, 2014: | ||||||||||||
| Granted | 45.0 | 21.67 | ||||||||||
| Cancelled | (50.0 | ) | 26.37 | |||||||||
| Vested | (12.6 | ) | 26.93 | |||||||||
| Nonvested balance as of December 31, 2014 | 367.1 | $ | 25.87 | |||||||||
101
We granted PSUs to senior executives and select employees in 2014 and 2013. PSUs typically vest over three years and are paid out in shares of Brink’s stock. The number of shares paid out ranges from 0% to 200% of an employee’s award, depending on the achievement of pre-established financial goals over the performance period, (April 1, 2013, through December 31, 2015) and will begenerally three years. Shares are not paid out in shares of Brink’s common stock. Threshold, target and maximum levels ofif the financial goal performance were established, which correspond to payouts between 0% and 200%results do not meet a pre-established threshold level of target. In addition, theperformance.
The number of shares issued are subject to a +/- 25% multiplier that will be applied to the payout based onpaid out is also affected by Brink’s total shareholder return (“TSR”) relative to companies in the S&P 500 index. TSRtotal return of a pre-established stock index over the performance period. The number of shares paid out is increased by 25% if Brink’s total shareholder return is at or above the 75th percentile will result inof the applicationindex’s total return. The number of a +25% multiplier to PSU payouts while TSRshares paid out is reduced by 25% if Brink’s performance is at or below the 25th percentile will result in the applicationpercentile. The number of a -25% multiplier to PSU payouts. Thereshares is no multiplier applied to PSU payoutsnot adjusted if TSRBrink’s performance is between the 25th and 75th percentile.
The following table summarizes all PSU activity during 2014:
| Weighted- | ||||||||||||
| Fair Value | Average | |||||||||||
| Shares | at Issuance | Grant Date | ||||||||||
| (in thousands) | Date(a) | Fair Value(a) | ||||||||||
| Nonvested balance as of December 31, 2013 | 199.3 | $ | 26.22 | |||||||||
| Activity from January 1 to July 11, 2014: | ||||||||||||
| Granted | 187.8 | 30.67 | ||||||||||
| Cancelled | (2.7 | ) | 26.46 | |||||||||
| Nonvested balance as of July 11, 2014 | 384.4 | $ | 28.39 | $ | 24.06 | |||||||
| Activity from July 12 to December 31, 2014: | ||||||||||||
| Granted | 1.5 | 24.41 | ||||||||||
| Cancelled | (42.3 | ) | 24.02 | |||||||||
| Nonvested balance as of December 31, 2014 | 343.6 | $ | 24.06 | |||||||||
We measure the fair value of PSUs at the grant date using a Monte Carlo simulation model. The following table provides the terms and weighted average assumptions used in the valuation of the PSUs:
| Terms and Assumptions Used to Estimate Fair Value of PSUs | PSUs Granted in 2014 | PSUs Granted in 2013 | ||||||||||||||
| Date of Measurement | February 20, 2014(a) | July 11, 2014(b) | May 3, 2013(a) | July 11, 2014(b) | ||||||||||||
| Terms of awards: | ||||||||||||||||
| Performance period | Jan. 1, 2014 to | April 1, 2013 to | ||||||||||||||
| Dec. 31, 2016 | Dec. 31, 2015 | |||||||||||||||
| Beginning average price of Brink’s common stock | $ | 33.29 | 33.29 | 27.59 | 27.59 | |||||||||||
| Assumptions used to estimate fair value: | ||||||||||||||||
Expected dividend yield(c) | - | % | - | % | - | % | - | % | ||||||||
| Expected stock price volatility | 38 | % | 32 | % | 39 | % | 28 | % | ||||||||
| Risk-free interest rate | 0.7 | % | 0.7 | % | 0.3 | % | 0.3 | % | ||||||||
| Contractual term in years | 2.9 | 2.5 | 2.7 | 1.5 | ||||||||||||
| Weighted-average fair value estimate per share | $ | 30.71 | 24.39 | 26.22 | 23.68 | |||||||||||
| (a) | Represents the date awards were granted to employee. |
102
| (b) | Represents the date the recoupment policy was amended (see Recoupment Policy Change in 2014 above) and an additional goal was added (see 2014 Additional Performance Goal for the 2013 and 2014 PSU Grants above). The employees and employer are deemed to have a mutual understanding of the terms of the award at this date. |
| (c) | PSUs are not entitled to dividends during the performance period. |
Market Share Units (“MSUs”)
We granted MSUs to senior executives in 2014 and 2013. MSUs are paid out in shares of Brink’s common stock atwhen an award vests. MSUs reward the endachievement of the appreciation of Brink’s stock over the performance period (April 1, 2013, through December 31, 2015)(generally three years) at a rate of 00% to 150% of athe initial target number of shares awarded. The multiplier to the initial target number of MSUs awarded is calculated as the ratio of the price of Brink’s stock at the end of the performance period divided by the price of Brink’s stock at the beginning of the performance period. If the price of Brink’s common stock at the end of the performance period is less than 50% of the initial price, no payout for MSUs will occur.
| Terms and Assumptions Used to Estimate Fair Value of MSUs | MSUs Granted in 2014 | MSUs Granted in 2013 | ||||||||||||||
| Date of Measurement | February 20, 2014(a) | July 11, 2014(b) | May 3, 2013(a) | July 11, 2014(b) | ||||||||||||
| Terms of awards: | ||||||||||||||||
| Performance period | Jan. 1, 2014 to | April 1, 2013 to | ||||||||||||||
| Dec. 31, 2016 | Dec. 31, 2015 | |||||||||||||||
| Beginning average price of Brink’s common stock | $ | 33.29 | 33.29 | 27.59 | 27.59 | |||||||||||
| Assumptions used to estimate fair value: | ||||||||||||||||
Expected dividend yield(c) | 0 | % | 0 | % | 0 | % | 0 | % | ||||||||
| Expected stock price volatility | 38 | % | 32 | % | 39 | % | 28 | % | ||||||||
| Risk-free interest rate | 0.7 | % | 0.7 | % | 0.3 | % | 0.3 | % | ||||||||
| Contractual term in years | 2.9 | 2.5 | 2.7 | 1.5 | ||||||||||||
| Weighted-average fair value estimate per share | $ | 30.87 | 23.34 | 26.42 | 27.30 | |||||||||||
| (b) | Represents the date the recoupment policy was amended (see Recoupment Policy Change in 2014 above). The employees and employer are deemed to have a mutual understanding of the terms of the award at this date. |
| (c) | MSUs are not entitled to dividends during the performance period. |
The following table summarizes all MSU activity during 2014:
| Weighted- | ||||||||||||
| Fair Value | Average | |||||||||||
| Shares | at Issuance | Grant Date | ||||||||||
| (in thousands) | Date(a) | Fair Value(a) | ||||||||||
| Nonvested balance as of December 31, 2013 | 96.2 | $ | 26.42 | |||||||||
| Activity from January 1 to July 11, 2014: | ||||||||||||
| Granted | 82.9 | 30.87 | ||||||||||
| Nonvested balance as of July 11, 2014 | 179.1 | $ | 28.48 | $ | 25.47 | |||||||
| Activity from July 12 to December 31, 2014: | ||||||||||||
| Cancelled | (15.8 | ) | 25.47 | |||||||||
| Nonvested balance as of December 31, 2014 | 163.3 | $ | 25.47 | |||||||||
103
No stock options were granted will be paid out in 2014 and 2013. We granted stock options to select senior executives and select employees in 2012. When vested, the option entitles the holder to purchase a specified number of shares of Brink’s common stock when they vest, generally ratably in three equal annual installments.
The fair valuetable below summarizes the activity in all plans for options of RSUs and DSUs was measured at the date of grant based on the price of Brink’s common stock, adjusted for a discount on units that do not receive or accrue dividends.our stock.
| Assumptions Used to Estimate Fair Value of 2013 Grants of PSUs and MSUs | PSUs | MSUs | |||||
| Number of target shares, in thousands | 210 | 96 | |||||
| Assumptions used to estimate fair value | |||||||
Beginning average price of Brink’s common stock(a) | $ | 27.59 | 27.59 | ||||
Expected dividend yield for the TSR provision of PSU awards(b) | 0% | n/a | |||||
Expected dividend yield for PSUs and MSUs(c) | 0% | 0% | |||||
Expected volatility(d) | 39% | 39% | |||||
| Risk-free interest rate | 0.3% | 0.3% | |||||
Expected term in years(e) | 2.7 | 2.7 | |||||
Weighted-average fair value estimates at grant date(f): | |||||||
| In millions | $ | 5.5 | 2.5 | ||||
| Fair value per share | $ | 26.22 | 26.42 | ||||
| Weighted- | ||||||||||||
| Fair Value | Average | |||||||||||
| Shares | at Issuance | Grant Date | ||||||||||
(in thousands)(a) | Date | Fair Value(a) | ||||||||||
| Outstanding balance as of December 31, 2013 | 1,474.9 | $ | 7.68 | |||||||||
| Activity from January 1 to July 11, 2014: | ||||||||||||
| Cancelled | (593.3 | ) | 8.22 | |||||||||
| Exercised | (9.9 | ) | 5.69 | |||||||||
| Outstanding balance as of July 11, 2014 | 871.7 | $ | 7.33 | $ | 5.74 | |||||||
| Activity from July 12 to December 31, 2014: | ||||||||||||
| Cancelled | (18.5 | ) | 6.18 | |||||||||
| Exercised | (8.4 | ) | 7.77 | |||||||||
| Outstanding balance as of December 31, 2014 | 844.8 | $ | 5.83 | |||||||||
| Weighted-Average | Aggregate | |||||||||||||
| Shares | Weighted- Average | Remaining Contractual | Intrinsic Value (a) | |||||||||||
| (in thousands) | Exercise Price Per Share | Term (in years) | (in millions) | |||||||||||
| Outstanding at December 31, 2013 | 1,474.9 | $ | 29.58 | |||||||||||
| Exercised | (18.3) | 20.34 | ||||||||||||
| Cancelled | (611.8) | 34.96 | ||||||||||||
Outstanding at December 31, 2014(b) | ||||||||||||||
| 844.8 | $ | 25.88 | 2.5 | $ | 1.2 | |||||||||
| Of the above, as of December 31, 2014: | ||||||||||||||
| Exercisable | 726.7 | $ | 26.44 | 2.4 | $ | 1.0 | ||||||||
Expected to vest in future periods(c) | 117.6 | $ | 22.46 | 3.5 | $ | 0.2 | ||||||||
| (a) |
| (b) | There were 1.2 million shares of exercisable options with a weighted-average exercise price of $30.92 per share at December 31, 2013 and 2.0 million shares of exercisable options with a weighted-average exercise price of $32.15 per share at December 31, 2012. |
| (c) | The number of options expected to vest takes into account an estimate of expected forfeitures. |
104
The fair value of outstanding stock options granted during 2012 was estimated at the accounting grant date using the Black-Scholes option-pricing model. The fair value was calculated using the following estimated weighted-average assumptions:
| Stock Options Granted in | July 11, | ||||||||||
| Assumptions Used to Estimate Fair Value of Stock Options | 2012(a) | 2014(a) | |||||||||
| Weighted-average exercise price per share | $ | 22.55 | 22.52 | ||||||||
| Assumptions used to estimate fair value | |||||||||||
Weighted-average expected dividend yield(b): | 1.8 % | 1.5 % | |||||||||
Weighted-average expected volatility(c): | 40 % | 37 % | |||||||||
| Weighted-average risk-free interest rate: | 0.6 % | 0.9 % | |||||||||
Expected term in years(d): | |||||||||||
| Weighted-average | 4.3 | 2.5 | |||||||||
| Range | 3.3 | – | 5.3 | 2.4 | – | 2.8 | |||||
| Weighted-average fair value estimate per share | $ | 6.32 | 7.78 | ||||||||
| (b) | The expected dividend yield |
| (c) |
| The expected volatility was estimated after reviewing the historical volatility of our stock using daily close prices. |
| Assumptions Used to Estimate Fair Value of Grants of Stock Options | 2012 | 2011 | ||||||||||
| Number of shares underlying options, in thousands | 396 | 290 | ||||||||||
| Weighted-average exercise price per share | $ | 22.55 | 31.47 | |||||||||
| Assumptions used to estimate fair value | ||||||||||||
Expected dividend yield(a): | ||||||||||||
| Weighted-average | 1.8% | 1.3% | ||||||||||
Expected volatility(b): | ||||||||||||
| Weighted-average | 40% | 36% | ||||||||||
| Range | 39% | – | 40% | 36% | – | 37% | ||||||
| Risk-free interest rate: | ||||||||||||
| Weighted-average | 0.6% | 1.2% | ||||||||||
| Range | 0.4% | – | 0.9% | 0.5% | – | 1.9% | ||||||
Expected term in years(c): | ||||||||||||
| Weighted-average | 4.3 | 3.8 | ||||||||||
| Range | 3.3 | – | 5.3 | 1.9 | – | 5.3 | ||||||
| Weighted-average fair value estimates at grant date: | ||||||||||||
| In millions | $ | 2.5 | 2.4 | |||||||||
| Fair value per share | $ | 6.32 | 8.17 | |||||||||
| The expected term of the options was based on historical option exercise, expiration and post-vesting cancellation behaviors. |
We granted DSUs to our directors. DSUs are paid out in shares of Brink’s stock when the award vests.
We measure the fair value of DSUs at the grant date, based on the price of Brink’s stock.
The following tables below summarize thetable summarizes all DSU activity in all plans for PSUs, MSUs, RSUs and DSUs.during 2014:
Shares (in thousands) | Weighted-Average Grant-Date Fair Value | |||||||
| Nonvested balance as of December 31, 2013 | 19.2 | $ | 26.80 | |||||
| Granted | 28.3 | 24.70 | ||||||
| Vested | (19.2 | ) | 26.80 | |||||
| Nonvested balance as of December 31, 2014 | 28.3 | $ | 24.70 | |||||
| Nonvested Share Activity - MSUs and PSUs | ||||||||||||||
| Number of shares | Weighted-Average | |||||||||||||
| Grant-Date | ||||||||||||||
| (in thousands of shares, except for per share amounts) | PSUs | MSUs | Total | Fair Value | ||||||||||
| Balance as of December 31, 2012 | - | - | - | $ | - | |||||||||
| Granted | 210.4 | 96.2 | 306.6 | 26.28 | ||||||||||
| Cancelled awards | (11.1) | - | (11.1) | 26.22 | ||||||||||
| Balance as of December 31, 2013 | 199.3 | 96.2 | 295.5 | $ | 26.28 | |||||||||
| Nonvested Share Activity - RSUs and DSUs | ||||||||||||||
| Number of shares | Weighted-Average | |||||||||||||
| Grant-Date | ||||||||||||||
| (in thousands of shares, except for per share amounts) | RSUs | DSUs | Total | Fair Value | ||||||||||
| Balance as of December 31, 2010 | 299.5 | 29.1 | 328.6 | $ | 22.84 | |||||||||
| Granted | 143.7 | 15.8 | 159.5 | 30.43 | ||||||||||
| Cancelled awards | (16.5) | - | (16.5) | 23.65 | ||||||||||
| Vested | (127.1) | (29.1) | (156.2) | 24.13 | ||||||||||
| Balance as of December 31, 2011 | 299.6 | 15.8 | 315.4 | 25.99 | ||||||||||
| Granted | 321.0 | 23.0 | 344.0 | 22.21 | ||||||||||
| Cancelled awards | (21.3) | - | (21.3) | 24.53 | ||||||||||
| Vested | (191.4) | (15.8) | (207.2) | 25.68 | ||||||||||
| Balance as of December 31, 2012 | 407.9 | 23.0 | 430.9 | 23.19 | ||||||||||
| Granted | 206.6 | 19.2 | 225.8 | 26.22 | ||||||||||
| Cancelled awards | (66.9) | - | (66.9) | 24.16 | ||||||||||
| Vested | (151.2) | (23.0) | (174.2) | 23.19 | ||||||||||
| Balance as of December 31, 2013 | 396.4 | 19.2 | 415.6 | $ | 24.68 | |||||||||
| Weighted-Average | Aggregate | ||||||||||||||
| Shares | Weighted- Average | Remaining Contractual | Intrinsic Value | ||||||||||||
| (in thousands) | Exercise Price Per Share | Term (in years) | (in millions) | ||||||||||||
| Outstanding at December 31, 2010 | 3,355 | 29.10 | |||||||||||||
| Granted | 290 | 31.47 | |||||||||||||
| Exercised | (562) | 20.66 | |||||||||||||
| Forfeited or expired | (116) | 29.47 | |||||||||||||
| Outstanding at December 31, 2011 | 2,967 | 30.92 | |||||||||||||
| Granted | 396 | 22.55 | |||||||||||||
| Exercised | (71) | 19.04 | |||||||||||||
| Forfeited or expired | (680) | 29.92 | |||||||||||||
| Outstanding at December 31, 2012 | 2,612 | 30.23 | |||||||||||||
| Granted | - | - | |||||||||||||
| Exercised | (302) | 22.30 | |||||||||||||
| Forfeited or expired | (835) | 34.25 | |||||||||||||
| Outstanding at December 31, 2013 | |||||||||||||||
| 1,475 | $ | 29.58 | 2.3 | $ | 7.2 | ||||||||||
| Of the above, as of December 31, 2013: | |||||||||||||||
| Exercisable | 1,154 | $ | 30.92 | 1.7 | $ | 4.2 | |||||||||
Expected to vest in future periods(a) | 314 | $ | 24.81 | 4.3 | $ | 2.9 | |||||||||
Other Share-Based Compensation
We have a deferred compensation plan that allows participants to defer a portion of their compensation into common stock units. Units may be redeemed by employees for an equal number of shares of Brink’s common stock. Employee accounts held 292,221 units at December 31, 2014, and 222,227 units at December 31, 2013, and 421,846 units at December 31, 2012.2013.
We have a stock accumulation plan for our non-employee directors denominated in Brink’s common stock units. Directors’ accounts held 53,335 units at December 31, 2014, and 72,541 units at December 31, 2013, and 64,670 units at December 31, 2012.2013.
105
Note 1718 – Capital Stock
Common Stock
At December 31, 2013,2014, we had 100 million shares of common stock authorized and 48.448.6 million shares issued and outstanding.
Shares Contributed to U.S. Pension Plan
On March 6, 2012, we issued 361,446 shares of our common stock and contributed the shares to our primary U.S. pension plan. Sales of these shares by the plan arewere covered under our shelf registration statement. The common stock was valued for purposes of the contribution at $24.90 per share, or $9 million in the aggregate, which reflected a 2.4% discount from the $25.51 per share closing share price of our common stock on March 5, 2012.
Dividends
We paid regular quarterly dividends on our common stock during the last three years. On January 16, 2014,22, 2015, the board declared a regular quarterly dividend of 10 cents per share payable on March 3, 2014.2, 2015. The payment of future dividends is at the discretion of the board of directors and is dependent on our future earnings, financial condition, shareholder equity levels, cash flow, business requirements and other factors.
Shelf Registration of Common Stock
At December 31, 2014, $141.5 million was available under a shelf registration statement under Form S-3ASRfiled with the SEC for $150 million of our common stock. At December 31, 2013, $141.5 million remains available under thisin February 2012. The shelf registration.registration expired on February 28, 2015.
Preferred Stock
At December 31, 2013,2014, we had the authority to issue up to 2.0 million shares of preferred stock with a par value of $10 per share.
Shares Used to Calculate Earnings per Share
| Years Ended December 31, | |||||||
| (In millions) | 2013 | 2012 | 2011 | ||||
| Weighted-average shares | |||||||
Basic(a) | 48.7 | 48.4 | 47.8 | ||||
| Effect of dilutive stock awards | 0.3 | 0.2 | 0.3 | ||||
Diluted(a) | 49.0 | 48.6 | 48.1 | ||||
| Antidilutive stock awards excluded from denominator | 1.3 | 2.4 | 2.3 | ||||
| Years Ended December 31, | ||||||||||||
| (In millions) | 2014 | 2013 | 2012 | |||||||||
| Weighted-average shares | ||||||||||||
Basic(a) | 49.0 | 48.7 | 48.4 | |||||||||
| Effect of dilutive stock awards | - | 0.3 | 0.2 | |||||||||
Diluted(a) | 49.0 | 49.0 | 48.6 | |||||||||
| Antidilutive stock awards excluded from denominator | 1.7 | 1.3 | 2.4 | |||||||||
| We have deferred compensation plans for directors and certain of our employees. Amounts owed to participants are denominated in common stock units. Each unit represents one share of common stock. The number of shares used to calculate basic earnings per share includes the weighted-average units credited to employees and directors under the deferred compensation plans. Additionally, |
| Years Ended December 31, | |||||||||
| (In millions) | 2013 | 2012 | 2011 | ||||||
Loss from operations(a)(b) | $ | (26.0) | (22.5) | (21.8) | |||||
Gain (loss) on sales(a) | 16.3 | (0.3) | - | ||||||
| Settlement loss related to Belgium bankruptcy | - | - | (10.1) | ||||||
Adjustments to contingencies of former operations(c): | |||||||||
| Workers’ compensation | (1.7) | (0.2) | (1.4) | ||||||
| Gain from Federal Black Lung Excise Tax refunds | - | - | 4.2 | ||||||
| Other | 1.0 | (0.3) | (0.6) | ||||||
| Loss from discontinued operations before income taxes | (10.4) | (23.3) | (29.7) | ||||||
| Provision (benefit) for income taxes | 4.7 | (1.0) | (3.9) | ||||||
| Loss from discontinued operations, net of tax | $ | (15.1) | (22.3) | (25.8) | |||||
| Years Ended December 31, | ||||||||||||
| (In millions) | 2014 | 2013 | 2012 | |||||||||
Loss from operations(a)(b) | $ | (13.3 | ) | (17.4 | ) | (9.5 | ) | |||||
| Gain (loss) on sales | (18.9 | ) | 16.3 | (0.3 | ) | |||||||
Adjustments to contingencies of former operations(c): | ||||||||||||
| Workers' compensation | (4.4 | ) | (1.7 | ) | (0.2 | ) | ||||||
Insurance recoveries related to BAX Global indemnification(d) | 9.5 | - | - | |||||||||
| Other | (1.6 | ) | 1.0 | (0.3 | ) | |||||||
| Loss from discontinued operations before income taxes | (28.7 | ) | (1.8 | ) | (10.3 | ) | ||||||
| Provision for income taxes | 0.4 | 7.4 | 3.1 | |||||||||
| Loss from discontinued operations, net of tax | $ | (29.1 | ) | (9.2 | ) | (13.4 | ) | |||||
| (a) | Discontinued operations include gains and losses related to businesses that |
| (b) | The loss from operations in 2014 included $15.6 million in non-cash severance and impairment charges related to the Netherlands cash-in-transit operations. The loss from operations in 2013 |
| (c) | Primarily |
| (d) | BAX Global had been defending a claim related to the apparent diversion by a third party of goods being transported for a customer. In 2010, the Dutch Supreme Court denied the final appeal of BAX Global, letting stand the lower court ruling that BAX Global was liable for this claim. We had contractually indemnified the purchaser of BAX Global for this contingency. Through 2010, we had recognized $11.5 million of expense related to the payment made in satisfaction of the judgment. In 2014, we recovered $9.5 million from insurance companies related to this matter. |
Cash-in-transit operations sold or shut down:
| · | Poland (sold in March 2013) |
| · | Turkey (shut down in June 2013) |
| · | Hungary (sold in September 2013) |
| · | Germany (sold in December 2013) |
| · | Australia (sold in October 2014) |
| · | Puerto Rico (shut down in November 2014) |
| · | Netherlands (sold in December 2014) |
Guarding operations sold:
| · | Morocco (December 2012) |
| · | France (January 2013) |
| · | Germany (July 2013) |
Other operations sold:
| · | We sold Threshold Financial Technologies, Inc. in Canada in November 2013. Threshold operated private-label ATM network and payment processing businesses. Brink’s continues to own and operate Brink’s Integrated Managed Services for ATM customers. |
| · | We sold ICD Limited and other affiliated subsidiaries in November 2013. ICD |
| · | We sold a small Mexican parcel delivery business in 2015. |
107
The results of the above disposed operations have been excluded from continuing operations and are reported as discontinued operations for the current and prior periods. The table below shows revenues by businessoperating segment which have been reclassified to discontinued operations:
| December 31, | ||||||||
| (In millions) | 2013 | 2012 | 2011 | |||||
| EMEA | $ | 77.6 | 136.9 | 153.9 | ||||
| North America | 41.2 | 52.1 | 50.8 | |||||
| Asia Pacific | 23.6 | 22.5 | 17.9 | |||||
| Total | $ | 142.4 | 211.5 | 222.6 | ||||
| December 31, | ||||||||||||
| (In millions) | 2014 | 2013 | 2012 | |||||||||
| France | $ | - | - | 16.4 | ||||||||
| Mexico | 21.2 | 26.5 | 29.1 | |||||||||
| Canada | - | 41.2 | 52.1 | |||||||||
| Largest 5 Markets | 21.2 | 67.7 | 97.6 | |||||||||
| Latin America | 4.9 | 6.6 | 6.3 | |||||||||
| EMEA | 126.0 | 197.1 | 231.5 | |||||||||
| Asia | 7.6 | 34.6 | 33.5 | |||||||||
| Global Markets | 138.5 | 238.3 | 271.3 | |||||||||
| Total | $ | 159.7 | 306.0 | 368.9 | ||||||||
The table below shows revenues and lossesincome (loss) from operations before tax for the Netherlands cash-in-transit operations sold in 2014 and for the German cash-in-transit operation which wasoperations sold in 2013:
| Years Ended December 31, | |||||||||
| (In millions) | 2013 | 2012 | 2011 | ||||||
| German CIT Operation: | |||||||||
| Revenues | $ | 56.4 | 57.7 | 62.4 | |||||
| Losses from operations before tax | (24.3) | (10.0) | (11.1) | ||||||
| Years Ended December 31, | ||||||||||||
| (In millions) | 2014 | 2013 | 2012 | |||||||||
| Netherlands CIT operations: | ||||||||||||
| Revenues | $ | 126.0 | 119.5 | 111.0 | ||||||||
| Income (loss) from operations before tax | (2.0 | ) | 13.0 | 15.2 | ||||||||
| German CIT operations: | ||||||||||||
| Revenues | $ | - | 56.4 | 57.7 | ||||||||
| Loss from operations before tax | - | (24.3 | ) | (10.0 | ) | |||||||
108
Note 1920 – Supplemental Cash Flow Information
| Years Ended December 31, | |||||||||
| (In millions) | 2013 | 2012 | 2011 | ||||||
| Cash paid for: | |||||||||
| Interest | $ | 23.7 | 22.7 | 22.3 | |||||
| Income taxes, net | 92.7 | 89.3 | 79.8 | ||||||
| Years Ended December 31, | ||||||||||||
| (In millions) | 2014 | 2013 | 2012 | |||||||||
| Cash paid for: | ||||||||||||
| Interest | $ | 22.9 | 23.7 | 22.7 | ||||||||
| Income taxes, net | 68.6 | 92.7 | 89.3 | |||||||||
We acquired armored vehicles, CompuSafe® units and other equipment under capital lease arrangements in the last three years including $12.1 million in 2014, $5.5million in 2013 and $18.1million in 2012 and $43.0 million in 2011. Some of the assets acquired under these leases in 2011 were part of sales-leaseback transactions of assets that were previously owned. Proceeds from sale of these assets were $17.6 million in 2011. The proceeds approximated net book value on the dates of the transactions. Related gains and losses were not material.2012.
We contributed $9 million of Brink’s common stock to our primary U.S. pension plan in 2012.
| Years Ended December 31, | ||||||||||||
| (In millions) | 2014 | 2013 | 2012 | |||||||||
| Foreign currency items: | ||||||||||||
Transaction losses(a) | $ | (130.8 | ) | (20.2 | ) | (4.0 | ) | |||||
| Hedge gains (losses) | 1.4 | (0.4 | ) | 0.2 | ||||||||
Gains on sale of property and other assets(b) | 44.9 | 2.4 | 7.6 | |||||||||
| Impairment losses | (3.3 | ) | (2.9 | ) | (2.4 | ) | ||||||
| Share in earnings of equity affiliates | 4.3 | 6.7 | 6.0 | |||||||||
| Royalty income | 1.5 | 1.9 | 2.1 | |||||||||
| Gains on business acquisitions and dispositions | - | 2.8 | 0.8 | |||||||||
| Other | 1.0 | 0.3 | 0.9 | |||||||||
| Other operating income (expense) | $ | (81.0 | ) | (9.4 | ) | 11.2 | ||||||
| Years Ended December 31, | ||||||||||
| (In millions) | 2013 | 2012 | 2011 | |||||||
| Share in earnings of equity affiliates | $ | 6.7 | 6.0 | 4.8 | ||||||
| Gains on business acquisitions and dispositions | 2.8 | 0.8 | 9.2 | |||||||
| Royalty income | 1.9 | 2.1 | 1.7 | |||||||
| Gains on sale of property and other assets | 2.4 | 7.6 | 1.2 | |||||||
| Impairment losses | (2.9) | (2.4) | (2.4) | |||||||
| Foreign currency items: | ||||||||||
| Transaction losses | (20.2) | (4.2) | (3.7) | |||||||
| Hedge gains (losses) | (0.4) | 0.2 | 2.2 | |||||||
| Other | 0.3 | 0.9 | 5.0 | |||||||
| Other operating income (expense) | $ | (9.4) | 11.0 | 18.0 | ||||||
| (a) |
| (b) | Includes a $44.3 million gain on the sale of a noncontrolling interest in a Peruvian cash-in-transit business. |
Note 2122 – Interest and Other Nonoperating Income (Expense)
| Years Ended December 31, | ||||||||
| (In millions) | 2013 | 2012 | 2011 | |||||
| Interest income | $ | 2.7 | 4.8 | 5.7 | ||||
| Gain on available-for-sale securities | 0.4 | 2.9 | 4.4 | |||||
| Foreign currency hedge losses | (1.0) | - | - | |||||
| Other | (0.5) | (0.5) | (1.2) | |||||
| Total | $ | 1.6 | 7.2 | 8.9 | ||||
| Years Ended December 31, | ||||||||||||
| (In millions) | 2014 | 2013 | 2012 | |||||||||
| Interest income | $ | 3.0 | 2.7 | 4.6 | ||||||||
| Gain on available-for-sale securities | 0.4 | 0.4 | 2.9 | |||||||||
| Foreign currency hedge losses | (1.0 | ) | (1.0 | ) | - | |||||||
| Other | (0.5 | ) | (0.6 | ) | (0.5 | ) | ||||||
| Total | $ | 1.9 | 1.5 | 7.0 | ||||||||
Note 2223 – Other Commitments and Contingencies
On June 19, 2008, a lawsuit captioned Del Valle Gurria S.C. v. Servicio Pan Americano de Protección, S.A. de C.V. was filed with the Twenty-third Civil Judge in the Federal District in Mexico (the “Court”) against Servicio Pan American de Proteccion, S.A. de C.V. (SERPAPROSA), the Mexico subsidiary that we acquired in November 2010. The plaintiff claims it is owed legal fees and corresponding value-added tax (VAT), interest and expenses related to its legal representation of SERPAPROSA in connection with tax audits conducted tocovering the 1991, 1992 and 1994 fiscal years. On October 28, 2010, the Court issued a decision in favor of SERPAPROSA in part and the plaintiff in part, ordering SERPAPROSA to pay the plaintiff $0.4less than $1 million for its previous representation of SERPAPROSA. Between November 2010 and October 2013, the judgment was subject to multiple appeals by both parties to the Fifth Civil Court of Appeal of the Federal District in Mexico (the “Fifth Civil Court of Appeal”) and to the First Civil Collegiate Tribunal of the First Circuit in Mexico (the “First Civil Collegiate Tribunal”), and was remanded twice to the Court for determination of the fees to be paid to the plaintiff. On December 6, 2013, the Fifth Civil Court of Appeal issued a decision in favor of the plaintiff, modifying the lower court’s ruling and ordering SERPAPROSA to pay the plaintiff $7.4approximately $7 million plus VAT and interest for its previous representation of SERPAPROSA. SERPAPROSA filed a constitutional injunction on January 20, 2014 with the First Civil Collegiate Tribunal. The appeal was granted in favor of SERPAPROSA on September 17, 2014, ordering SERPAPROSA to pay approximately $2 million plus VAT and interest. The plaintiff filed an appeal on October 7, 2014, with the Mexico Supreme Court, which was rejected by the court on October 22, 2014. The plaintiff filed two subsequent actions appealing the Supreme Court’s October 22, 2014 decision, one before the First Appellate Court in Civil Matters of the First Circuit (the “Appellate Court”) and one with the Mexico Supreme Court. The action filed before the Appellate Court was rejected on February 16, 2015; the action filed with the Mexico Supreme Court is pending. The Company has accrued $3.1$2 million, reflecting the Company’s best estimate of exposure, although additional reasonably possible losses could be up to $10 million, based on currency exchange rates at December 31, 2013.2014. The ultimate resolution of this matter is unknown and the estimated liability may change in the future. The Company denies the allegations asserted by the plaintiff and is vigorously defending itself in this matter.
In addition, we are involved in various other lawsuits and claims in the ordinary course of business. We are not able to estimate the loss or range of losses for some of these matters. We have recorded accruals for losses that are considered probable and reasonably estimable. Except as otherwise noted, we do not believe that the ultimate disposition of any of the lawsuits currently pending against the Company should have a material adverse effect on our liquidity, financial position or results of operations.
At December 31, 2013,2014, we had noncancellable commitments for $20.7$11.2 million in equipment purchases, and information technology and other services.
In the fourth quarter of 2014, we announced a reorganization and restructuring of Brink’s global organization (“2014 Reorganization and Restructuring”) to accelerate the execution of our strategy by reducing costs and providing for a more streamlined and centralized organization. As part of this program, we expect to reduce our total workforce by approximately 1,700 positions. We believe the restructuring will save annual direct costs of approximately $45 to $50 million in 2015 compared to 2014, excluding severance, lease termination, accelerated depreciation and pension settlement charges. We recorded total pretax severance charges of $21.8 million in the fourth quarter of 2014 related to the 2014 Reorganization and Restructuring. The actions under this program are expected to be substantially completed by the end of 2015 with cumulative pretax charges estimated to be approximately $25 million, primarily severance costs.
The following table summarizes the costs incurred and payments made in our 2014 Reorganization and Restructuring accruals:
| (In millions) | Severance Costs | |||
| Balance as of January 1, 2014 | $ | - | ||
| Expenses | 21.8 | |||
| Payments | (0.3 | ) | ||
| Foreign currency exchange effects | (0.1 | ) | ||
| Balance as of December 31, 2014 | $ | 21.4 | ||
Note 2325 – Selected Quarterly Financial Data (unaudited)
| 2013 Quarters | 2012 Quarters | |||||||||||||||||||
| (In millions, except for per share amounts) | 1st | 2nd | 3rd | 4th | 1st | 2nd | 3rd | 4th | ||||||||||||
| Revenues | $ | 950.5 | 969.9 | 982.4 | 1,039.4 | $ | 917.1 | 914.6 | 926.2 | 977.1 | ||||||||||
| Segment operating profit | 34.3 | 54.4 | 79.9 | 84.2 | 73.1 | 52.1 | 67.0 | 71.7 | ||||||||||||
| Operating profit | 17.3 | 32.8 | 59.2 | 62.4 | 48.8 | 30.8 | 45.0 | 50.4 | ||||||||||||
| Amounts attributable to Brink’s: | ||||||||||||||||||||
| Income (loss) from: | ||||||||||||||||||||
| Continuing operations | $ | 2.9 | 13.2 | 29.8 | 26.0 | $ | 22.5 | 33.6 | 21.1 | 34.0 | ||||||||||
| Discontinued operations | (19.5) | (4.5) | (6.0) | 14.9 | (5.5) | (3.1) | (7.6) | (6.1) | ||||||||||||
| Net income (loss) attributable to Brink’s | $ | (16.6) | 8.7 | 23.8 | 40.9 | $ | 17.0 | 30.5 | 13.5 | 27.9 | ||||||||||
| Depreciation and amortization | $ | 42.1 | 42.2 | 42.3 | 47.0 | $ | 38.7 | 38.2 | 38.4 | 40.4 | ||||||||||
| Capital expenditures | 33.4 | 44.8 | 44.0 | 55.5 | 32.0 | 35.9 | 44.1 | 65.9 | ||||||||||||
| Earnings (loss) per share attributable to Brink’s common shareholders: | ||||||||||||||||||||
| Basic | ||||||||||||||||||||
| Continuing operations | $ | 0.06 | 0.27 | 0.61 | 0.53 | $ | 0.47 | 0.69 | 0.44 | 0.70 | ||||||||||
| Discontinued operations | (0.40) | (0.09) | (0.12) | 0.31 | (0.11) | (0.06) | (0.16) | (0.13) | ||||||||||||
| Net income | $ | (0.34) | 0.18 | 0.49 | 0.84 | $ | 0.35 | 0.63 | 0.28 | 0.58 | ||||||||||
| Diluted | ||||||||||||||||||||
| Continuing operations | $ | 0.06 | 0.27 | 0.61 | 0.53 | $ | 0.47 | 0.69 | 0.43 | 0.70 | ||||||||||
| Discontinued operations | (0.40) | (0.09) | (0.12) | 0.30 | (0.11) | (0.06) | (0.16) | (0.13) | ||||||||||||
| Net income | $ | (0.34) | 0.18 | 0.49 | 0.83 | $ | 0.35 | 0.63 | 0.28 | 0.57 | ||||||||||
| 2014 Quarters | 2013 Quarters | |||||||||||||||||||||||||||||||
| (In millions, except for per share amounts) | 1st | 2nd | 3rd | 4th | 1st | 2nd | 3rd | 4th | ||||||||||||||||||||||||
| Revenues | $ | 949.6 | 859.0 | 872.5 | 881.2 | $ | 910.3 | 929.0 | 942.1 | 997.2 | ||||||||||||||||||||||
| Operating profit | (73.7 | ) | 8.7 | 61.2 | (23.7 | ) | 15.2 | 31.7 | 56.9 | 59.4 | ||||||||||||||||||||||
| Amounts attributable to Brink’s: | ||||||||||||||||||||||||||||||||
| Income (loss) from: | ||||||||||||||||||||||||||||||||
| Continuing operations | $ | (59.0 | ) | 0.9 | 28.8 | (25.5 | ) | $ | 1.6 | 12.1 | 28.4 | 23.9 | ||||||||||||||||||||
| Discontinued operations | 0.5 | 0.7 | (8.6 | ) | (21.7 | ) | (18.2 | ) | (3.4 | ) | (4.6 | ) | 17.0 | |||||||||||||||||||
| Net income (loss) attributable to Brink’s | $ | (58.5 | ) | 1.6 | 20.2 | (47.2 | ) | $ | (16.6 | ) | 8.7 | 23.8 | 40.9 | |||||||||||||||||||
| Depreciation and amortization | $ | 41.9 | 40.9 | 39.7 | 39.4 | $ | 40.2 | 40.4 | 40.4 | 44.8 | ||||||||||||||||||||||
| Capital expenditures | 23.8 | 32.3 | 26.3 | 53.7 | 32.5 | 43.6 | 43.1 | 53.7 | ||||||||||||||||||||||||
| Earnings (loss) per share attributable to Brink’s common shareholders: | ||||||||||||||||||||||||||||||||
| Basic | ||||||||||||||||||||||||||||||||
| Continuing operations | $ | (1.21 | ) | 0.02 | 0.59 | (0.52 | ) | $ | 0.03 | 0.25 | 0.58 | 0.49 | ||||||||||||||||||||
| Discontinued operations | 0.01 | 0.01 | (0.17 | ) | (0.44 | ) | (0.37 | ) | (0.07 | ) | (0.09 | ) | 0.35 | |||||||||||||||||||
| Net income (loss) | $ | (1.20 | ) | 0.03 | 0.41 | (0.96 | ) | $ | (0.34 | ) | 0.18 | 0.49 | 0.84 | |||||||||||||||||||
| Diluted | ||||||||||||||||||||||||||||||||
| Continuing operations | $ | (1.21 | ) | 0.02 | 0.58 | (0.52 | ) | $ | 0.03 | 0.25 | 0.58 | 0.49 | ||||||||||||||||||||
| Discontinued operations | 0.01 | 0.01 | (0.17 | ) | (0.44 | ) | (0.37 | ) | (0.07 | ) | (0.09 | ) | 0.35 | |||||||||||||||||||
| Net income (loss) | $ | (1.20 | ) | 0.03 | 0.41 | (0.96 | ) | $ | (0.34 | ) | 0.18 | 0.49 | 0.83 | |||||||||||||||||||
Earnings per share. Earnings per share amounts for each quarter are required to be computed independently. As a result, their sum may not equal the annual earnings per share.
Discontinued operations. In early 2015, we sold a small Mexican parcel delivery business. In 2014, we completed the divestures of cash-in-transit operations in the Netherlands, Australia and Puerto Rico. In 2013, we completed the divestitures of cash-in-transit operations in Poland, Turkey, Hungary, and Germany as well as guarding operations in France and an aviation security services business in Germany. We also sold ICD Limited and its affiliates and Threshold Financial Technology Inc. in Canada in 2013. In 2012, we completed the divestiture of our guarding operations in Morocco.
The results of these operations have been excluded from continuing operations and are reported as discontinued operations for all periods.
Significant pretax items in a quarter. In the first quarter of 2014, we recognized a $121.9 million remeasurement loss related to our change in March 2014 from the official exchange rate in Venezuela to the SICAD II exchange rate mechanism in Venezuela. In the third quarter of 2014, we recognized a $44.3 million gain on the sale of a noncontrolling interest in a Peruvian cash-in-transit business. In the fourth quarter of 2014, we recognized a $56.1 million pension settlement charge related to a lump-sum buy-out offer and a $21.8 million severance charge related to the reorganization and restructuring of our global organization.
In the first quarter of 2013, we recognized a $13.4 million in foreign currency exchange lossesremeasurement loss related to athe February 2013 devaluation of the official exchange rate in Venezuela. In the same quarter, we also recognized an $18.7 million loss related to a theft in Belgium.
ITEM 9. CHANGES IN AND DISAGREEMENTS WITH ACCOUNTANTS ON ACCOUNTING AND FINANCIAL DISCLOSURE
Not applicable.
ITEM 9A. CONTROLS AND PROCEDURES
(a) Disclosure Controls and Procedures
Pursuant to Rule 13a-15(b) under the Securities Exchange Act of 1934, we carried out an evaluation, with the participation of our management, including our Chief Executive Officer and Executive Vice President and Chief Financial Officer, of the effectiveness of our disclosure controls and procedures (as defined under Rule 13a-15(e) under the Securities Exchange Act of 1934) as of the end of the period covered by this report. Based upon that evaluation, our Chief Executive Officer and Executive Vice President and Chief Financial Officer concluded that our disclosure controls and procedures are effective in ensuring that information required to be disclosed by us in the reports that we file or submit under the Securities Exchange Act of 1934, is recorded, processed, summarized and reported, within the time periods specified in the SEC’s rules and forms, and that such information is accumulated and communicated to our management, including our Chief Executive Officer and Executive Vice President and Chief Financial Officer, as appropriate, to allow timely decisions regarding required disclosure.
(b) Internal Controls over Financial Reporting
See pages 6961 and 7062 for Management’s Annual Report on Internal Control over Financial Reporting and the Attestation Report of the Registered Public Accounting Firm.
(c) Changes in Internal Controls over Financial Reporting
During the quarter ended December 31, 2014, we identified deficiencies in the general information and technology controls that affected the design and operating effectiveness of controls over the recording of revenues in the United States and Canada. We have determined that these deficiencies in our internal control over financial reporting constituted a material weakness and originated in periods prior to the fourth quarter of 2014.
As a result and as part of a remediation plan, we implemented new controls in the fourth quarter of 2014 that mitigated the effect of the identified deficiencies. The new controls validated revenues recognized by reconciling to source records and collections. We have determined that the actions taken to date have sufficiently improved the Company’s internal control over financial reporting such that as of December 31, 2014, there is not a reasonable possibility that a material misstatement of the Company’s annual or interim financial statements will not be prevented or detected on a timely basis. Based on the remediation of the deficiencies we concluded that our internal control over financial reporting was effective as of December 31, 2014.
Other than this change, there has been no change in our internal control over financial reporting during the quarter ended December 31, 2013,2014, that has materially affected, or is reasonably likely to materially affect, our internal controlscontrol over financial reporting.reporting
ITEM 9B. OTHER INFORMATION
Not applicable.
| PART III |
ITEM 10. DIRECTORS, EXECUTIVE OFFICERS AND CORPORATE GOVERNANCE
We have adopted a Business Code of Ethics that applies to all of the directors, officers and employees (including the Chief Executive Officer, Chief Financial Officer and Controller) and have posted the Business Code of Ethics on our website. We intend to satisfy the disclosure requirement under Item 5.05 of Form 8-K relating to amendments to or waivers from any provision of the Business Code of Ethics applicable to the Chief Executive Officer, Chief Financial Officer or Controller by posting this information on the website. The internet address is www.brinks.com.
Our Chief Executive Officer is required to make, and he has made, an annual certification to the New York Stock Exchange (“NYSE”) stating that he was not aware of any violation by us of the corporate governance listing standards of the NYSE. Our Chief Executive Officer made his annual certification to that effect to the NYSE as of May 28, 2013.12, 2014. In addition, we are filing, as exhibits to this Annual Report on Form 10-K, the certification of our principal executive officer and principal financial officer required under sections 906 and 302 of the Sarbanes-Oxley Act of 2002 to be filed with the Securities and Exchange Commission regarding the quality of our public disclosure.
The information regarding executive officers is included in this report following Item 4, under the caption “Executive Officers of the Registrant.” Other information required by Item 10 is incorporated by reference to our definitive proxy statement to be filed pursuant to Regulation 14A within 120 days after December 31, 2013.2014.
ITEM 11. EXECUTIVE COMPENSATION
The information required by Item 11 is incorporated by reference to our definitive proxy statement to be filed pursuant to Regulation 14A within 120 days after December 31, 2013.2014.
ITEM 12. SECURITY OWNERSHIP OF CERTAIN BENEFICIAL OWNERS AND MANAGEMENT AND RELATED STOCKHOLDER MATTERS
The information required by Item 12 is incorporated by reference to our definitive proxy statement to be filed pursuant to Regulation 14A within 120 days after December 31, 2013.2014.
ITEM 13. CERTAIN RELATIONSHIPS AND RELATED TRANSACTIONS, AND DIRECTOR INDEPENDENCE
The information required by Item 13 is incorporated by reference to our definitive proxy statement to be filed pursuant to Regulation 14A within 120 days after December 31, 2013.2014.
ITEM 14. PRINCIPAL ACCOUNTANT FEES AND SERVICES
The information required by Item 14 is incorporated by reference to our definitive proxy statement to be filed pursuant to Regulation 14A within 120 days after December 31, 2013.2014.
| PART IV |
ITEM 15. EXHIBITS AND FINANCIAL STATEMENT SCHEDULES
| (a) | 1. | All financial statements – see pages |
| 2. | Financial statement schedules – not applicable. | |
| 3. | Exhibits – see exhibit index. | |
Signatures
Pursuant to the requirements of Section 13 or 15(d) of the Securities Exchange Act of 1934, the Registrant has duly caused this report to be signed on its behalf by the undersigned, thereunto duly authorized, on February 27, 2014.March 5, 2015.
| The Brink’s Company | |||
| (Registrant) | |||
| /s/ Thomas. C. Schievelbein | |||
| Thomas C. Schievelbein, | |||
| (President and | |||
| Chief Executive Officer) |
Pursuant to the requirements of the Securities Exchange Act of 1934, this report has been signed below by the following persons on behalf of the Registrant and in the capacities indicated, on February 27, 2014.March 5, 2015.
| Signature | Title | |
| /s/ Thomas. C. Schievelbein | Director, President and Chief Executive Officer (Principal Executive Officer) | |
| Thomas C. Schievelbein | ||
| /s/ J.W. Dziedzic | Executive Vice President and Chief Financial Officer (Principal Financial Officer) | |
| Joseph W. Dziedzic | ||
| /s/ M. A. P. Schumacher | Vice President and Controller (Principal Accounting Officer) | |
| Matthew A.P. Schumacher | ||
| * | Director | |
| Betty C. Alewine | ||
| * | Director | |
| Paul G. Boynton | ||
| * | Director | |
| * | Director | |
| Reginald D. Hedgebeth | ||
| * | Director | |
| Michael J. Herling | ||
| * | Director | |
| Murray D. Martin | ||
| * | Director | |
| Ronald L. Turner |
| * By: | /s/ Thomas. C. Schievelbein, | |
| Thomas C. Schievelbein, Attorney-in-Fact |
Exhibit Index
Each exhibit listed as a previously filed document is hereby incorporated by reference to such document.
Exhibit Number | Description | |||
| 3(i) | (a) | Amended and Restated Articles of Incorporation of the Registrant. Exhibit 3(i) to the Registrant’s Current Report on Form 8-K filed November 20, 2007. | ||
| (b) | Articles of Amendment to the Amended and Restated Articles of Incorporation of the Registrant. Exhibit 3(i) to the Registrant’s Current Report on Form 8-K filed May 10, 2011. | |||
| 3(ii) | ||||
| 10(a)* | Amended and Restated Key Employees Incentive Plan, amended and restated as of May 6, 2011. Exhibit 10.1 to the Registrant’s Current Report on Form 8-K filed May 10, 2011. | |||
| 10(b)* | Key Employees’ Deferred Compensation Program, as amended and restated as of | |||
| 10(c)* | Pension Equalization Plan, as amended and restated as of July 23, 2012. Exhibit 10.1 to the Registrant’s Quarterly Report on Form 10-Q for the quarter ended June 30, 2012 (the “Second Quarter 2012 Form 10-Q”). | |||
| 10(d)* | Executive Salary Continuation Plan. Exhibit 10(e) to the Registrant’s Annual Report on Form 10-K for the year ended December 31, 1991 (the “1991 Form 10-K”). | |||
| 10(e)* | 2005 Equity Incentive Plan, as amended and restated as of February 19, 2010. Exhibit 10(f) to the Registrant’s Form 10-K for the year ended December 31, 2009 (the “2009 Form 10-K”). | |||
| 10(f)* | 2013 Equity Incentive Plan, effective as of February 22, 2013. Exhibit 10.1 to the Registrant’s Current Report on Form 8-K filed May 9, 2013. | |||
| 10(g)* | (i) | Form of Option Agreement for options granted before July 8, 2010 under 2005 Equity Incentive Plan. Exhibit 99 to the Registrant’s Current Report on Form 8-K filed July 13, 2005. | ||
| (ii) | Form of Option Agreement for options granted under 2005 Equity Incentive Plan, effective July 8, 2010. Exhibit 10.2 to the Registrant’s Current Report on Form 8-K filed July 12, 2010. | |||
| (iii) | Terms and Conditions for options granted under 2005 Equity Incentive Plan, effective July 7, 2011. Exhibit 10.1 to the Registrant’s Quarterly Report on Form 10-Q for the quarter ended June 30, 2011 (the “Second Quarter 2011 Form 10-Q”). | |||
| (iv) | Terms and Conditions for options granted under 2005 Equity Incentive Plan, effective July 11, 2012. Exhibit 10.3 to the Registrant’s Second Quarter 2012 Form 10-Q. | |||
| 10(h)* | (i) | |||
| Terms and Conditions for restricted stock units granted under 2005 Equity Incentive Plan, effective July 7, 2011. Exhibit 10.2 to the Second Quarter 2011 Form 10-Q. | |||
| Terms and Conditions for restricted stock units granted under 2005 Equity Incentive Plan, effective July 11, 2012. Exhibit 10.4 to the Second Quarter 2012 Form 10-Q. | |||
| Form of Restricted Stock Units Award Agreement, effective May 3, 2013. Exhibit 10.2 to the Registrant’s Current Report on Form 8-K filed May 9, 2013. | |||
| (iv) | Form of Restricted Stock Units Award Agreement, effective November 13, 2014. Exhibit 10.1 to the Registrant’s Current Report on Form 8-K filed February 25, 2015. | ||
| 10(i)* | (i) | Form of Market Share Units Award Agreement, effective May 3, 2013. Exhibit 10.3 to the Registrant’s Current Report on Form 8-K filed May 9, 2013. | |
116
| (ii) | Form of Market Share Units Award Agreement, effective November 13, 2014. Exhibit 10.2 to the Registrant’s Current Report on Form 8-K filed February 25, 2015. | |
| 10(j)* | (i) | Form of Performance Share Units Award Agreement, effective May 3, 2013. Exhibit 10.4 to the Registrant’s Current Report on Form 8-K filed May 9, 2013. |
| (ii) | Form of Performance Share Units Award Agreement, effective November 13, 2014. Exhibit 10.3 to the Registrant’s Current Report on Form 8-K filed February 25, 2015. | |
| 10(k)* | Management Performance Improvement Plan, as amended and restated as of February 19, 2010. Exhibit 10(h) to the 2009 Form 10-K. | |
| 10(l)* | Form of Change in Control Agreement. Exhibit | |
| 10(m)* | Stock Option Award Agreement, dated as of June 15, 2012, between the Registrant and Thomas C. Schievelbein. Exhibit 10.6 to the Registrant’s Second Quarter 2012 Form 10-Q. | |
| 10(n)* | Restricted Stock Unit Award Agreement, dated as of June 15, 2012, between the Registrant and Thomas C. Schievelbein. Exhibit 10.7 to the Registrant’s Second Quarter 2012 Form 10-Q. | |
| 10(o)* | Form of Indemnification Agreement entered into by the Registrant with its directors and officers. Exhibit 10(l) to the 1991 Form 10-K. | |
| 10(p)* | Non-Employee Directors’ Stock Option Plan, as amended and restated as of July 8, 2005. Exhibit 10.2 to the Registrant’s Quarterly Report on Form 10-Q for the quarter ended June 30, 2005. | |
| 10(q)* | ||
| Non-Employee Directors’ Equity Plan, as amended and restated as of July 12, 2012. Exhibit 10.9 to the Registrant’s Second Quarter 2012 Form 10-Q. | ||
| (i) | Form of Award Agreement for deferred stock units granted in 2008 under the Non-Employee Directors’ Equity Plan. Exhibit 10.3 to the Registrant’s Quarterly Report on Form 10-Q for the quarter ended June 30, 2008. | |
| (ii) | Form of Award Agreement for deferred stock units granted in 2009, 2010, 2011, 2012, 2013 and | |
| (iii) | Form of 2014 Award Agreement for deferred stock units to be distributed upon vesting the Non-Employee Directors’ Equity Plan. Exhibit 10.2 to the Registrant’s Quarterly Report on Form 10-Q for the quarter ended June 30, 2014 (the “Second Quarter | |
| Plan for Deferral of Directors’ Fees, as amended and restated as of | ||
| Amendment and Restatement of The Brink’s Company Employee Welfare Benefit Trust. Exhibit 10.1 to the Registrant’s Quarterly Report on Form 10-Q for the quarter ended September 30, 2013. | ||
| $85,000,000 Amended and Restated Letter of Credit Agreement, dated as of June 17, 2011, among the Registrant, Pittston Services Group Inc., Brink’s Holding Company, Brink’s, Incorporated, and The Royal Bank of Scotland N.V. Exhibit 10.1 to the Registrant’s Current Report on Form 8-K filed June 20, 2011. | ||
| (i) | $400,000,000 Credit Agreement, dated as of July 16, 2010, among the Registrant, as Parent Borrower and as a Guarantor, the subsidiary borrowers referred to therein, as Subsidiary Borrowers, certain of Parent Borrower’s subsidiaries, as Guarantors, Wells Fargo Bank, National Association, as Administrative Agent, an Issuing Lender, Swingline Lender and a Revolving A Lender, Bank of Tokyo-Mitsubishi UFJ Trust Company and Societe Generale, as Co-Documentation Agents and Revolving A Lenders, Bank of America, N.A. and JPMorgan Chase Bank, N.A., as Co-Syndication Agents and Revolving A Lenders, and various other Revolving A Lenders and Revolving B Lenders named therein. Exhibit 10.1 to the Registrant’s Current Report on Form 8-K filed July 20, 2010. | |
117
| (ii) | First Amendment to Credit Agreement, dated as of January 6, 2012, among the Registrant, as Parent Borrower and as a Guarantor, the subsidiary borrowers referred to therein, as Subsidiary Borrowers, certain of Parent Borrower’s subsidiaries, as Guarantors, Wells Fargo Bank, National Association, as Administrative Agent, and the various lenders named therein. Exhibit 10.1 to the Registrant’s Current Report on Form 8-K filed January 9, 2012. | |
| (iii) | Second Amendment to Credit Agreement, dated as of May 9, 2013, among The Brink’s Company, as Parent Borrower and as a Guarantor, the subsidiary borrowers referred to therein, as Subsidiary Borrowers, certain of Parent Borrower’s subsidiaries, as Guarantors, Wells Fargo Bank, National Association, as Administrative Agent, and the various lenders named therein. Exhibit 10.1 to the | |
| Note Purchase Agreement, dated as of January 24, 2011, among the Registrant, Pittston Services Group Inc., Brink’s Holding Company, Brink’s, Incorporated, and the purchasers party thereto. Exhibit 10.1 to the Registrant’s Current Report on Form 8-K filed January 26, 2011. | ||
| Stock Purchase Agreement, dated as of November 15, 2005, by and among BAX Holding Company, BAX Global Inc., The Brink’s Company and Deutsche Bahn AG. Exhibit 2.1 to the Registrant’s Current Report on Form 8-K filed November 16, 2005. | ||
| Separation and Distribution Agreement between the Registrant and Brink’s Home Security Holdings, Inc. dated as of October 31, 2008. Exhibit 10.1 to the Registrant’s Current Report on Form 8-K filed November 5, 2008. | ||
| Tax Matters Agreement between the Registrant and Brink’s Home Security Holdings, Inc. dated as of October 31, 2008. Exhibit 10.3 to the Registrant’s Current Report on Form 8-K filed November 5, 2008. | ||
| Employee Matters Agreement between the Registrant and Brink’s Home Security Holdings, Inc. dated as of October 31, 2008. Exhibit 10.5 to the Registrant’s Current Report on Form 8-K filed November 5, 2008. | ||
| 21 | Subsidiaries of the Registrant. | |
| 23 | Consent of Independent Registered Public Accounting Firm. | |
| 24 | Powers of Attorney. | |
| 31 | Rule 13a-14(a)/15d-14(a) Certifications. | |
| 32 | Section 1350 Certifications. | |
| 99(a)* | Excerpt from Pension-Retirement Plan relating to preservation of assets of the Pension-Retirement Plan upon a change in control. Exhibit 99(a) to the | |
| 101 | Interactive Data File (Annual Report on Form 10-K, for the year ended December 31, Attached as Exhibit 101 to this report are the following documents formatted in XBRL: (i) the Consolidated Balance Sheets at December 31, | |
*Management contract or compensatory plan or arrangement.