POWELL INDUSTRIES, INC.
TABLE OF CONTENTS
| Page | ||||||||
| Item 1. | ||||||||
| Item 1A. | ||||||||
| Item 1B. | ||||||||
| Item 2. | ||||||||
| Item 3. | ||||||||
| Item 4. | ||||||||
| Item 5. | ||||||||
| Item 6. | ||||||||
| Item 7. | ||||||||
| Item 7A. | ||||||||
| Item 8. | ||||||||
| Item 9. | ||||||||
| Item 9A. | ||||||||
| Item 9B. | ||||||||
| Item 10. | ||||||||
| Item 11. | ||||||||
| Item 12. | ||||||||
| Item 13. | ||||||||
| Item 14. | ||||||||
| Item 15. | ||||||||
| Item 16. | ||||||||
2
CAUTIONARY STATEMENT REGARDING FORWARD-LOOKING STATEMENTS;
RISK FACTORS
Unless otherwise indicated, all references to “we,” “us,” “our,” “Powell” or “the Company” include Powell Industries, Inc. and its consolidated subsidiaries.
Forward-Looking Statements
This Annual Report on Form 10-K (Annual Report) includes forward-looking statements based on our current expectations, which are subject to risks and uncertainties. Forward-looking statements include information concerning future results of operations and financial condition. Statements that contain words such as “believes,” “expects,” “anticipates,” “intends,” “estimates,” “continue,” “should,” “could,” “may,” “plan,” “project,” “predict,” “will” or similar expressions may be forward-looking statements. These forward-looking statements are subject to risks and uncertainties, and many factors could affect the future financial results and condition of the Company. Factors that may have a material effect on our revenues, expenses and operating results include, among other things, adverse business or market conditions, our ability to meet our customers’ scheduling requirements, our customers’ financial conditions and their ability to secure financing to support current and future projects, the availability and cost of materials from suppliers, availability of skilled labor force, adverse competitive developments and changes in customer requirements as well as those circumstances discussed under “Item“Part I, Item 1A. Risk Factors,” below. Accordingly, actual results may differ materially from those expressed or implied by the forward-looking statements contained in this Annual Report. Any forward-looking statements made by or on our behalf are made pursuant to the safe harbor provisions of the Private Securities Litigation Reform Act of 1995.
The forward-looking statements contained in this Annual Report are based on current assumptions that we will continue to develop, market, manufacture and ship products and provide services on a competitive and timely basis; that economic and competitive conditions in our markets will not change in a materially adverse way; that we will accurately identify and meet customer needs for products and services; that we will be able to hire and retain skilled laborers and key employees; that our products and capabilities will remain competitive; that the financial markets and banking systems will remain stable and availability of credit will continue; that risks related to shifts in customer demand are minimized and that there will be no material adverse change in the operations or business of the Company. Assumptions relating to these factors involve judgments that are based on available information, which may not be complete, and are subject to changes in many factors beyond the Company’s control that can materially affect results. Because of these and other factors that affect our operating results, past financial performance should not be considered an indicator of future performance, and investors should not use historical trends to anticipate results or trends in future periods.
3
PART I
Item 1. Business
Overview
Powell Industries, Inc. was incorporated in the state ofis a Delaware in 2004 as a successor to a Nevada company incorporated in 1968. The Nevada company was the successor to a companycorporation founded by William E. Powell in 1947,1947. We develop, design, manufacture and service custom-engineered equipment and systems which merged into(1) distribute, control and monitor the Company in 1977.flow of electrical energy and (2) provide protection to motors, transformers and other electrically powered equipment. We are headquartered in Houston, Texas, and our major subsidiaries, all of which are wholly owned, include: Powell Electrical Systems, Inc.; Powell (UK) Limited; Powell Canada, Inc.; and Powell Industries International, B.V.
Our website is powellind.com. We make available, free of charge on or through our website, copies of thisour Annual ReportReports on Form 10-K, and other reports,Quarterly Reports on Form 10-Q, Current Reports on Form 8-K, and amendments to those reports, filed or furnished pursuant to Section 13(a) or 15(d) of the Securities Exchange Act of 1934 as soon as is reasonably practicable after we electronically file such material with, or furnish it to, the Securities and Exchange Commission (SEC). Additionally, all of our reports filed with the SEC are available via their website at http://www.sec.gov, or may be readwww.sec.gov.
References to Fiscal 2021, Fiscal 2020 and copied at the SEC Public Reference Room at 100 F Street, NE, Washington, DC 20549.Fiscal 2019 used throughout this Annual Report relate to our fiscal years ended September 30, 2021, 2020 and 2019, respectively.
Our principal products include integrated power control room substations (PCRs®), custom-engineered modules, electrical houses (E-Houses), traditional and arc-resistant distribution switchgear and control gear, medium-voltage circuit breakers, monitoring and control communications systems, motor control centers, switches and bus duct systems. These products are designed for application voltages ranging from 480 volts to 38,000 volts and are used in oil and gas refining, onshore and offshore oil and gas production, petrochemical, liquefied natural gas (LNG) terminals, pipeline, terminal, mining and metals, light rail traction power, electric utility, pulp and paper and other heavy industrial markets. Our product scope includes designs tested to meet both U.S. and international standards, under both the American National Standards Institute (ANSI) and international standardsInternational Electrotechnical Commission (IEC). We assist customers by providing value-added services such as spare parts, field service inspection, installation, commissioning, modification and repair, retrofit and retrofill components for existing systems and replacement circuit breakers for switchgear that is obsolete or that is no longer produced by the original manufacturer. We seek to establish long-term relationships with the end users of our systems as well as the engineering, procurementdesign and construction (EPC)engineering firms contracted by those end users.
Products and services are principally sold directly to the end user or to an EPCengineering, procurement and construction (EPC) firm on behalf of the end user. Each project is specifically engineered and manufactured to meet the exact specifications and requirements of the individual customer. Powell’s expertise is in the design and engineering, manufacturing, project management and integration of the various systems into a single, custom-engineered deliverable. We market and sell our products and services, which are typically awarded in competitive bid situations, to a wide variety of customers and governmental agencies spanning across diverse markets and geographic regions. Contracts often represent large-scale and complex projects with an individual customer. By their nature, these projects are typically nonrecurring. Thus, multiple and/or continuous projects of similar magnitude with the same customer may vary. As such, theare not predictable. The timing of large project awards may cause material fluctuations in our revenues and gross profits.
Occasionally our contracts may operate under a consortium or teaming arrangement. Typically, we enter into these arrangements with reputable companies with which we have conducted business with previously. These arrangements are generally made to leverage competitive positioning or where scale and/or size dictates the use of such arrangement.
Due to the nature and timing of large projects, a significant percentage of our revenues in a given period may result from one specific contract or customer. Although we could be adversely impacted by a significantThe large domestic industrial project that was awarded in Fiscal 2020 accounted for approximately 20% of our consolidated revenues in Fiscal 2021 and represents approximately 25% of our consolidated backlog going into Fiscal 2022. We believe the reduction in business volume from a particular industry we do not believeor the loss of any specifica major customer wouldcould have a materialan adverse effect on our business. However, from
From time to time, an individual manufacturing facility may have significant volume from one particular customer whichthat would be material to that facility. If during that time the customer were to experience financial distress, a decline in business or circumstances that would otherwise necessitate a cancellation of a project with us, our revenue could be adversely impacted. No customer accounted for more than 10% of our consolidated revenues in Fiscal 2017, Fiscal 20162020 or Fiscal 2015. 2019.
4
Research and development activities are critical to Powell’s future and are focused on both the development of new products and services as well as enhancing current product offerings. Our expertise in vacuum circuit breaker engineering is internationally recognized, and we have a sustained commitment to incorporating continuous product improvements that will ensure operational safety and reliability across the markets we serve.
Markets
We strive to be the supplier of choice for custom-engineered system solutions and services to a variety of customers and markets. Our activities are predominantly in the oil and gas and the electric utility industries, but also include other markets where customers need to manage, monitor and control large amounts of electrical energy.energy through a complex network of electrical components and systems. The majority of our business is in support of capital investment projects that are highly complex and competitively bid. Our customized systems are designed to meet the specifications of our customers. Each system is designed, engineered and manufactured to the specific requirements of the particular application. We consider our engineering, project management, systems integration and technical support capabilities vital to the success of our business.
Specific to the oil and gas sector (excluding petrochemical), we serve the upstream, midstream and downstream end markets. Within the downstream segment, our primary customers typically are engaged in refining activities and/or leveraging natural gas feedstocks for the production of petrochemical or LNG products. We have developed strong relationships with our customers over the years and strive to maintain our position as a preferred service provider to solve our customers' complex electrical needs.
We believe that our products and services, integration capabilities, technical and project management strengths,acumen, application engineering expertise and specialty contracting experience, together with our responsivenessfinancial strength and flexibilityresponsiveness to the needs of our customers, and our financial strength, give us a sustainable competitive advantage in our markets. We compete with a small number of multinational competitors that sell to a broad industrial and geographic market, as well as smaller, regional competitors that typically have limited capabilities and scope of supply. Some of our competitors are significantly larger and have substantially greater global resources such as engineering, manufacturing and marketing. Our principal competitors include ABB, Eaton, General Electric Company, Schneider and Siemens. The competitive factors used during bid evaluation by our customers vary from project to project and may include technical support and application expertise, engineering and manufacturing capabilities, equipment rating, delivered value, scheduling and price. While projects are typically non-recurring, a significant portion of our business is from repeat customers and many times involves third-party EPC firms hired by the end user and with whichwhom we also have long, and established relationships. Ultimately, our competitive position is dependent upon our ability to provide quality custom-engineered products, services and systems on a timely basis at a competitive price.
Backlog
Backlog represents management's estimate of the dollar amount of revenue that we expect to realizeremaining unsatisfied performance obligation from work to be performed on our firm orders under uncompleted contracts and customer purchase orders, including approved change orders as well as new contractual agreements on which work has not begun. Our backlog will be recognized as revenue as we complete the remaining performance obligations. Our backlog does not include service and maintenance type contracts for which we have the rights to invoice as services are performed. Typically, our contracts may have an early termination for convenience clause at the discretion of our customers; however, most of these contracts typically provide for the reimbursement of our costs incurred and a reasonable margin in the event of such early termination. Our methodology for determining backlog may not be comparable to the methodology used by other companies. Orders included in our backlog are represented by customer purchase orders and contracts, which we believe to be firm.
Our backlog at September 30, 20172021 totaled $250.1$414.9 million compared to $291.4$476.8 million at September 30, 2016. Backlog declined primarily due to lower demand in our core oil, gas and petrochemical markets.2020. We anticipate that approximately $235.3$291.0 million of Fiscal 20172021 ending backlog will be fulfilled during our fiscal year ending September 30, 2018.2022. Backlog may not be indicative of future operating results as orders in our backlog may be cancelled or modified by our customers.customers and may not be indicative of continuing revenue performance over future fiscal quarters.
Raw Materials and Suppliers
The principal raw materials used in our operations include steel, copper and aluminum and various electrical components. Material costs represented 49% of revenues in Fiscal 2021 and 47% of revenues in both Fiscal 20172020 and Fiscal 2016 and 46% in Fiscal 2015.2019. Unanticipated changes in material requirements, market conditions and disruptions in suppliesthe supply chain or price increases could impact production costs and affect our consolidated results of operations.
5
Our supply base for certain key components and raw materials is limited. Changes in our design to accommodate similar components from other suppliers could be implemented to resolve a supply problem related to a sole-sourced component. In this circumstance, supply problems could result in delays in our ability to meet commitments to our customers. We believe that sources of supply for raw materials and components are generally sufficient, and we do not believe a temporary shortage of materials will cause any significant adverse impact in the future. While we are not dependent on any one supplier for the majority of our raw materials, we are highly dependent on our suppliers in order to meet commitments to our customers. During Fiscal 2021, as a result of the challenges created by global transportation issues, the COVID-19 pandemic and market volatility, we experienced minor supply disruptions and anticipate that supply disruptions and material shortages may continue. We continue to work with our key suppliers who have been impacted by these supply disruptions to ensure that we are able to meet our customer commitments. While we have not currently experienced significant or unusual issues in the purchase of key raw materials or components, inwe continue to monitor the past three fiscal years. availability (including transportation) and price of components and raw materials on a regular basis, as well as any potential impact on our operations.
Our business is subject to the effects of changing material prices. DuringWhile raw material costs have been relatively stable in the last three fiscalpast few years, during Fiscal 2021 we have begun to encounter availability constraints from key suppliers as well as cost increases driven by using alternate suppliers, increased commodity costs as well as higher logistics expense. While these availability challenges have not experienced significant price volatility for raw materials or component parts usedcurrently created execution challenges, we continue to monitor material availability closely. We cannot, however, provide assurance that we will continue to mitigate these material shortages, in the productionwhich case our results of our products.operations may be adversely affected. While the cost outlook for commodities used in the production of our products is not certain, we believe we can manage this volatility through contract pricing adjustments, with material-cost predictive estimating and by actively pursuing internal cost reduction efforts. We did not enter into any derivative contracts to hedge our exposure to commodity price changes in Fiscal 2017, 20162021, 2020 or 2015.2019.
At September 30, 2017,2021, we had 1,8411,892 full-time employees and 181 contract employees located primarily in the U.S., Canada and the U.K. Our employees are not represented by unions, and we believe that our relationship with our employees is good. Periodically, demand for qualified personnel increases in certain geographic areas due to increased construction or economic activity. We continue to monitor our demand for skilled and unskilled labor and provide training and competitive compensation packages in an effort to attract and retain skilled employees. Labor shortages or increased labor costs could impair our ability to maintain our business, meet customer commitments or grow our revenues, and may adversely impact our business and results of operations.
Three of our top human capital priorities are workplace safety, internal promotion and key employee retention. Powell emphasizes a culture of safety that runs throughout the Company. We establish annual goals and monthly operating metrics, which have resulted in a safety incident rate that is one-half the industry average across Powell. We believe that internal promotion and key employee retention are critical components to our long-term success. The average tenure of our employees is 11 years. Our annual Organizational Capabilities Review is focused on succession planning within our organization and is reviewed annually by our Board of Directors. We measure our success based on the percentage of internal promotions to key positions and our ability to attract and retain key employees.
Intellectual Property
While we are the holder ofhold various patents, trademarks, servicemarks, copyrights and licenses, we do not consider any individual intellectual property to be material to our consolidated business operations.
Seasonality
Our operations are not generally affected by seasonality. However, weather and natural phenomena can temporarily impact the performance of our operations. Furthermore, quarterly operating results may fluctuate in our first fiscal quarter due to the reduction in the number of workdays related to the number of holidays in that fiscal quarter.
Government Regulations
We are subject to various government regulations in the United States as well as various international locations where we operate. These regulations cover diverse areas including environmental compliance, import and export controls, economic sanctions, data and privacy protection, transfer pricing rules, anti-bribery, anti-trafficking and anti-trust provisions. Our policies mandate compliance with applicable laws and regulations administered by various state, federal and international agencies. We maintain various training programs to educate our employees on compliance with governmental regulations, as well as applied
6
legal and ethical practices in our everyday work. We do not believe that compliance with governmental regulations will have a material impact on our capital expenditures, results of operations or competitive position.
Item 1A. Risk Factors
Our business is subject to a variety of risks and uncertainties, including, but not limited to, the risks and uncertainties described below. If any of the following risks actually occur, our business,the business's financial condition, cash flows, liquidity and results of operations couldmay be negatively impacted, and we may not be able to achieve our quarterly, annual or long-range plans. Additional risks and uncertainties not known to us or not described below may also negatively impact our business and results of operations. This Annual Report also includes statements reflecting assumptions, expectations, projections, intentions or beliefs about future events that are intended as “forward-looking statements” under the Private Securities Litigation Reform Act of 1995 and should be read in conjunction with the discussion under “Forward-Looking Statements,” above.
Risk Factors Related to our Business and Industry
Our business is largely dependent on customers insubject to the oil and gascyclical nature of the end markets andthat we are adversely impacted by extended periods of low oil or gas prices, which decrease our customers’ spending, the demand for our products and services and the prices we are able to charge.serve. This has had, and may continue to have, an adverse effect on our future operating results.
Our industry is highly competitive.
Some of our competitors are significantly larger and have substantially greater global resources such as engineering, manufacturing and marketing resources.resources, and at various times, may be a customer or supplier on any given project. Competition in the industry depends on a number of factors, including the number of projects available, technical ability, production capacity, location and price.the ability to win projects we bid. Certain of our competitors may have lower cost structures and may, therefore, be able to provide their products or services at lower prices than we are able to provide.prices. Similarly, we cannot be certain that we will be able to maintain or enhance our competitive position within our industry, maintain our customer base at current levels, increase our customer base or continue to provide technologically superior products at a competitive price. New companies may enter the markets in which we compete, or industry consolidation may occur, further increasing competition in our markets. Our failure to compete effectively and secure projects we bid could adversely affect future revenues and have an adverse impact on our results of operations.
Technological innovations by competitors may make existing products and production methods obsolete.
All of the products that we manufacture and sell depend upon the best available technology for success in the marketplace. The industries in which we operate are characterized by intense competition and are highly sensitive to technological innovation and customer requirements. It is possible for competitors (both domestic and international) to develop products or production methods that will make current products or methods obsolete or at a minimum hasten their obsolescence; therefore, we cannot be certain that our competitors will not develop the expertise, experience and resources to provide products and services that are superior in both price and quality. Our future success will depend, in part, on our ability to anticipate and offer products that meet changing customer specifications.specifications as well as fund our research and development costs. Consumer demand for further automation is changing the markets we operate in. Failure to successfully develop new products, or to enhance existing products, could result in the loss of existing customers to competitors, the inability to attract new business or an overall reduction in our competitive position, any of which may adversely affect our business or results of operations.
7
Unforeseen difficulties with expansions, relocations, or consolidations of existing facilities could adversely affect our operations.
From time to time we may decide to enter new markets, build or lease additional facilities, expand our existing facilities, or relocate or consolidate one or more of our operations.operations or exit a facility we may own or lease. Increased costs and production delays arising from the staffing, relocation, sublease, expansion or consolidation of our facilities could adversely affect our business and results of operations.
Quality problems with our products could harm our reputation and erode our competitive position.
The success of our business depends upon the quality of our products and our relationships with customers. In the event that one of our products fails to meet our customers' standards or safety requirements or fails to operate effectively, our reputation could be harmed, which would adversely affect our marketing and sales efforts. We provide warranties to our customers for our products and the cost to satisfy customer warranty claims, which may include, among other things, costs for the repair or replacement of products, could adversely impact our business and results of operations.
Growth and product diversification through strategic acquisitions involves a number of risks.
Our strategy includes the pursuit of growth and product diversification through the acquisition of companies or assets and entering into joint ventures that will enable us to expand our geographic coverage and product and service offerings. We periodically review potential acquisitions; however, we may be unable to successfully implement this strategy. Acquisitions involve certain risks, including difficulties in the integration of operations and systems; failure to realize cost savings; the termination of relationships by key personnel and customers of the acquired company and a failure to add additional employees to handle the increased volume of business. Additionally, financial and accounting challenges and complexities in areas such as valuation, tax planning, treasury management and financial reporting from our acquisitions may impact our operating results. Due diligence may not be adequate or reveal all risks and challenges associated with our acquisitions. Companies that we acquire may not achieve revenues, profitability or cash flows that we expected, or that ultimately justify the investment. It is possible that impairment charges resulting from the overpayment for an acquisition may negatively impact our results of operations. Financing for acquisitions may require us to obtain additional equity or debt financing, which may not be available on attractive terms, if at all, or which may be restricted under the terms of our credit facilitiesfacility or other financing arrangements. Any failure to successfully complete or successfully integrate acquisitions could have a material adverse effect on our business and results of operations.
Our business requires skilled and unskilled labor, and we may be unable to attract and retain qualified employees.
Our ability to maintain our productivity at competitive levels may be limited by our ability to employ, compensate, train and retain personnel necessary to meet our requirements. We face competition for qualified personnel in our industry. We may experience shortages of qualified personnel such as engineers, project managers and select skilled trades. We cannot be certain that we will be able to maintain an adequate skilled or unskilled labor force or key technical personnel necessary to operate efficiently and to support our growth strategy and operations. We cannot be certain that our labor costs will not increase as a result of a shortage in the supply of skilled, unskilled and technical personnel or any governmental regulations. Labor shortages or increased labor costs could impair our ability to maintain our business, meet customer commitments or grow our revenues, and may adversely impact our business and results of operations.
We are exposed to risks relating to the use of subcontractors on some of our projects.
We hire subcontractors to perform work on some projects and sometimes depend on third-party suppliers to provide equipment and materials necessary to complete or ship our products. If our subcontractors do not perform as expected for any reason, we may experience delays in completing our projects or incur additional costs. In addition, we may have disputes with these independent subcontractors arising from, among other things, the quality and timeliness of the work they have performed. Any of these factors could adversely impact our business and results of operations.
8
Misconduct by our employees or subcontractors, or a failure to comply with laws or regulations, could harm our reputation, damage our relationships with customers and subject us to criminal and civil enforcement actions.
Misconduct, fraud, non-compliance with applicable laws and regulations, or other improper activities by one or more of our employees or subcontractors could have a significant negative impact on our business and reputation. While we take precautions to prevent and detect these activities, such precautions may not be effective and are subject to inherent limitations, including human error and fraud. Acts of misconduct, or our failure to comply with applicable laws or regulations, could subject us to fines and penalties, harm our reputation, damage our relationships with customers and could adversely impact our business and results of operations.
Unsatisfactory safety performance may subject us to penalties, negatively impact customer relationships, result in higher operating costs, and negatively impact employee morale and turnover.
We place great emphasis on workplace safety in our entire organization through various safety initiatives and training. We have both indoor and outdoor manufacturing facilities that are susceptible to numerous industrial safety risks that can lead to personal injury, loss of life, damage to property and equipment, as well as potential environmental damage. While we take every precaution to avoid incidents, we have experienced accidents in the past and may again in the future, which can negatively affect our safety record. A poor safety record can harm our reputation with existing and potential customers, jeopardize our relationship with employees, increase our insurance costs and could adversely impact our business and results of operations.
Catastrophic events, including natural disasters, health epidemics (including the COVID-19 pandemic), acts of war and terrorism, among others, could disrupt our business.
The occurrence of catastrophic events, ranging from natural disasters to health epidemics (including the COVID-19 pandemic), to acts of war and terrorism, among others, could disrupt or delay our ability to operate our business and complete projects for our customers and could potentially expose us to third-party liability claims. A significant portion of our operations are located near the Texas Gulf Coast. Our operations have been and are subject to the potential impacts of weather-related events such as hurricanes and flooding. Future weather events could cause significant damage to our property and equipment and adversely impact our operations. We may declare the existence of a force majeure event under our contracts in certain situations; however, a customer may dispute our force majeure claim, which may result in additional liabilities. Losses arising from such events may or may not be fully covered by our various insurance policies or may be subject to deductibles or exceed coverage limits. In addition, such events could result in temporary or long-term delays and/or cancellations of orders for raw materials from our suppliers that could impact our project execution. These situations or other disruptions are outside of our control and may adversely impact our business and results of operations.
The COVID-19 pandemic continues to create significant uncertainty and economic disruption across the world. It is difficult to predict the economic impact that the COVID-19 pandemic may continue to have on our business, results of operations and cash flows going forward. Certain of our customers have asked that we delay or cancel our manufacturing on their projects as their operations have been negatively impacted by this pandemic. These delays and cancellations may have a negative effect on the timing of revenue recognition and cash flow. We have experienced supply disruptions and anticipate these supply disruptions may continue. Any delays in the supply of material or labor could negatively impact our production schedule and delay the completion of certain projects. The extent to which the COVID-19 pandemic specifically will impact our business will depend on numerous factors that are hard to predict, some of which include: the duration, spread and severity of the pandemic; governmental actions in response to the pandemic; including travel restrictions and quarantine or related orders; any closures of our offices and facilities or those of our suppliers as a result of the pandemic, and how quickly and to what extent normal economic and operating conditions can resume. Any of these factors, as well as other related business impacts resulting from COVID-19, could contribute to the risks and uncertainties described in this Annual Report. As a result, the magnitude of the impact on our business, results of operations and cash flows is not currently known.
9
Risk Factors Related to our Financial Condition and Markets
Economic uncertainty and financial market conditions may impact our customer base, suppliers and backlog.
Various factors drive demand for our products and services, including the price and demand for oil and gas, capital expenditures, economic forecasts and financial markets. Unanticipated increases in raw material requirements or prices, the imposition of tariffs, and changes in supplier availability or supplier consolidation, could increase production costs and adversely affect profitability. Uncertainty regarding these factors could impact our customers and severely impact the demand for projects and orders for our products and services. Additionally, the loss of significant volume from one particular customer at one of our facilities could adversely impact the operating results of that facility. If one or more of our suppliers or subcontractors experiences difficulties that result in a reduction, delay or interruption in supply to us, or they fail to meet our manufacturing requirements, our business could be adversely impacted until we are able to secure alternative sources. Furthermore, our ability to maintain or expand our business would be limited in the future if we are unable to maintain or increase our bonding capacity or our bank credit facility on favorable terms or at all. Similarly, disruptions in the capital markets may also adversely impact our customer's ability to finance projects, which could result in contract cancellations or delays. These disruptions could lead to reduced demand for our products and services and could have an adverse impact on our business, financial condition and results of operations.
Our backlog is subject to unexpected adjustments, cancellations and scope reductions and, therefore, may not be a reliable indicator of our future earnings.
We have a backlog of uncompleted contracts. Backlog represents management's best estimate of the remaining performance obligation from work to be performed on uncompleted contracts, including new contractual agreements on which work has not begun. From time to time, projects are cancelled, delayed or modified due to customer, industry or macroeconomic conditions. While we may be reimbursed for certain costs, we may not have a contractual right to the total revenue reflected in our backlog. We may be unable to recover certain direct costs and cancelled projects may also result in additional unrecoverable costs due to the underutilization of our assets. Accordingly, the amounts recorded in backlog may not be a reliable indicator of our future operating results and may not be indicative of continuing revenue performance over future fiscal quarters.
Revenues recognized over time from our fixed-price contracts could result in volatility in our results of operations.
As discussed in “Management’s Discussion and Analysis of Financial Condition and Results of Operations — Critical Accounting Estimates” and in the Notes to Consolidated Financial Statements included elsewhere in this Annual Report, the majority of our revenues are recognized over time. Revenues are recognized as work is performed and costs are incurred. The revenue earned to date is calculated by multiplying the total contract price by the percentage of performance to date, which is based on total costs incurred to date compared to the total estimated costs at completion. The determination of the revenue recognized requires the use of estimates of costs to be incurred for the performance of the contract. The timing of the costs incurred may lead to fluctuations in revenue recognized on a quarterly and annual basis. The cost estimation process is based upon the professional knowledge and experience of our management teams, engineers, project managers and financial professionals. We bear the risk of cost overruns in most of our contracts, which may result in reduced profits. Contract losses are recognized in full when determined, and estimates of revenue and cost to complete are adjusted based on ongoing reviews of estimated contract performance. Previously recorded estimates of revenues and costs are adjusted as the project progresses and circumstances change. In certain circumstances, it is possible that such adjustments to costs and revenues could have an adverse impact on our results of operations.
Many of our contracts contain performance obligations that may subject us to penalties or additional liabilities.
Many of our customer contracts have schedule and performance obligation clauses that, if we fail to meet, could subject us to penalty provisions, liquidated damages or claims against the company or our outstanding letters of credit or performance bonds. In addition, some customer contracts stipulate protection against our gross negligence or willful misconduct. Each individual contract defines the conditions under which the customer may make a claim against us. It is possible that adjustments arising from such claims, or our failure to manage our contract risk, may not be covered by insurance and could have an adverse impact on our results of operations.
10
Fluctuations in the price and supply of materials used to manufacture our products may reduce our profits and could adversely impact our ability to meet commitments to our customers.
Our material costs represented 49% of our consolidated revenues for Fiscal 2021. Unanticipated increases in raw material requirements, rising prices due to overall inflationary pressure, the imposition of tariffs, changes in supplier availability, delays in transportation, or supplier consolidation could increase production costs and adversely affect profitability as fixed-price contracts may prohibit our ability to charge the customer for the increase in raw material prices. We purchase a wide variety of materials and component parts from various suppliers to manufacture our products, including steel, aluminum, copper and various components. Our supply base for certain key components and raw materials is limited and may come from a single supplier. If we are unable to obtain key components and raw materials from these suppliers, the key components and raw materials may not be readily available from other suppliers or available with acceptable terms. Our success depends on our ability to meet customer commitments and could be negatively impacted if a supplier experiences a disruption or discontinuance in their operations or we experience a delay in transportation of materials and components from our suppliers. The time and effort associated with the selection and qualification of a new supplier and changes in our design and testing to accommodate similar components from other suppliers could be significant. Additionally, we rely on certain competitors for key materials used in our products. This could negatively impact our ability to manufacture our products if the relationships change or become adversarial.
Obtaining surety bonds, letters of credit, bank guarantees, or other financial assurances, may be necessary for us to successfully bid on and obtain certain contracts.
We are often required to provide our customers security for the performance of their projects in the form of surety bonds, letters of credit or other financial assurances. Our continued ability to obtain surety bonds, letters of credit or other financial assurances will depend on our capitalization, working capital and financial performance. Our ability to issue letters of credit is dependent upon the availability of adequate credit issued by our banks and could be negatively impacted by our compliance with our financial covenants. Future compliance with such financial covenants may be affected by factors beyond our control, including general or industry-specific economic downturns. We are also dependent on the overall bonding capacity, pricing and terms available in the surety markets. As such, we cannot guarantee our ability to maintain a sufficient level of bonding capacity in the future. The restriction, reduction or termination of our surety bond agreements could limit our ability to bid on new opportunities and would require us to issue letters of credit under our bank facilities in lieu of surety bonds, thereby reducing availability under our credit facility, which could have an adverse impact on our business and results of operations.
Failure to remain in compliance with covenants or obtain waivers or amendments under our credit agreement could adversely impact our business.
Our credit agreement contains various financial covenants and restrictions, which are described in Note G of the Notes to Consolidated Financial Statements. Our ability to remain in compliance with such financial covenants and restrictions may be affected by factors beyond our control, including general or industry-specific economic downturns. If we fail to remain in compliance with such covenants and restrictions, absent an amendment or waiver, this could result in an event of default under the credit agreement. Among other things, the occurrence of an event of default could limit our ability to issue letters of credit, obtain additional financing or result in acceleration of outstanding amounts under the credit agreement or a termination of the agreement, any of which could have an adverse impact on our liquidity, business and results of operations.
We extend credit to customers in conjunction with our performance under fixed-price contracts which subjects us to potential credit risks.
We typically agree to allow our customers to defer payment on projects until certain milestones have been met or until the projects are substantially completed, and customers typically withhold some portion of amounts due to us as retainage. Our payment arrangements subject us to potential credit risk related to changes in business and economic factors affecting our customers, including material changes in our customers' revenues or cash flows. If we are unable to collect amounts owed to us, or retain amounts paid to us, our cash flows would be reduced, and we could experience losses if those amounts exceed current allowances. Any of these factors could adversely impact our business and results of operations.
11
A significant portion of our revenues may be concentrated among a small number of customers.
Due to the nature and timing of large projects, a significant percentage of our revenues in a given period may result from one specific contract or customer. During Fiscal 2021, approximately 20% of our consolidated revenues were generated from our large domestic industrial project that was awarded in Fiscal 2020. We believe the reduction in business volume from a particular industry or the loss of a major customer could have an adverse effect on our business. From time to time, an individual manufacturing facility may have significant volume from one particular customer that would be material to that facility. If during that time the customer were to experience financial distress, a decline in business or circumstances that would otherwise necessitate a cancellation of a project with us, our revenue could be adversely impacted.
We carry insurance against many potential liabilities, but our management of risk may leave us exposed to unidentified or unanticipated risks.
Although we maintain insurance policies with respect to our related exposures, including certain casualty, property, professional, business interruption, cyber security and self-insured medical and dental programs, these policies contain deductibles, self-insured retentions and limits of coverage. In addition, we may not be able to continue to obtain insurance at commercially reasonable rates, or at the policy limits we may require or may be faced with liabilities not covered by insurance, such as, but not limited to, environmental contamination or terrorist attacks. We estimate our liabilities for known claims and unpaid claims and expenses based on information available as well as projections for claims incurred but not reported. However, insurance liabilities, some of which are self-insured, are difficult to estimate due to various factors. If any of our insurance policies, coverage limits or programs are not effective in mitigating our risks, we may incur losses that are not covered by our insurance policies, that are subject to deductibles or that exceed our estimated accruals or our insurance policy limits, which could adversely impact our business and results of operations.
Our international operations expose us to risks that are different from, or possibly greater than, the risks we are exposed to domestically and may adversely affect our operations.
Revenues associated with projects located outside of the U.S., including revenues generated from our operations in the U.K. and Canada, accounted for approximately 25% of our consolidated revenues in Fiscal 2021. While our manufacturing facilities are located in developed countries with historically stable operating and fiscal environments, our business and results of operations could be adversely affected by a number of factors, including: political and economic instability; social unrest, acts of terrorism, force majeure, war or other armed conflict; inflation; changes in tax laws; the application of foreign labor regulations; currency fluctuations, devaluations and conversion restrictions and/or governmental activities that limit or disrupt markets, restrict payments or limit the movement of funds and trade restrictions or economic embargoes imposed by the U.S. or other countries. Additionally, the compliance with foreign and domestic import and export regulations and anti-corruption laws, such as the U.S. Foreign Corrupt Practices Act, General Data Protection Regulation, or similar laws of other jurisdictions outside the U.S., could adversely impact our ability to compete for contracts in such jurisdictions. Moreover, the violation of such laws or regulations, by us or our representatives, could result in severe penalties including monetary fines, criminal proceedings and suspension of export privileges.
Additionally, fluctuating foreign currency exchange rates may impact our financial results. The functional currency of our foreign operations is typically the currency of the country in which the foreign operation is located. Accordingly, our financial performance is subject to fluctuations due to changes in foreign currency exchange rates relative to the U.S. dollar.
Failures or weaknesses in our internal controls over financial reporting could adversely affect our ability to report on our financial condition and results of operations accurately and/or on a timely basis.
We are required to comply with Section 404 of the Sarbanes-Oxley Act of 2002, which requires, among other things, an assessment by our management of our internal control over financial reporting. Preparing our financial statements involves a number of complex processes, many of which are performed manually and are dependent upon individual data input or review. We are continually working to maintain and strengthen our internal controls over financial reporting, however, any system of controls has limitations, including the possibility of human error, the circumvention or overriding of controls and/or fraud. Our failure to maintain effective internal controls over financial reporting could adversely affect our ability to report our financial results on a timely and accurate basis, which could result in a loss of investor confidence in our financial reports or have an adverse impact on our business and results of operations.
12
A failure in our business systems or cyber security attacks on any of our facilities, or those of third parties, could adversely affect our business and our internal controls.
Our organization is dependent upon the proper functioning of our business systems that support our production, engineering, human resources, estimating, finance, and project management functions. If any of our financial, operational, or other data processing systems fail or have other significant shortcomings due to natural disaster, power loss, telecommunications failures, cyber security attacks or other similar events, our business or results of operations could be adversely affected. In addition, despite implementation of security measures, our business systems may be vulnerable to computer viruses, ransomware attacks, cyber-attacks, the accidental release of sensitive information and other unauthorized access. These failures of our business systems or security breaches could impact our customers, employees and reputation and result in a disruption to our operations or in legal claims or proceedings. A material network breach of our business systems could involve the theft of intellectual property, financial data, employee or customer data, which may be used by competitors. We rely on third-party systems which could also suffer operational system failure or cyber-attacks. Any of these occurrences may not be covered by insurance and could disrupt our business, result in potential liability or reputational damage or otherwise have an adverse effect on our business or results of operations.
Network security and internal control measures have been implemented to address these risks and disruptions to our business. However, our portfolio of hardware and software products, solutions and services and information contained within our enterprise information technology (IT) systems may be vulnerable to damage or disruption caused by circumstances beyond our control such as catastrophic events, cyber-attacks, other malicious activities from unauthorized third parties, power outages, natural disasters, computer system or network failures or computer viruses. Any significant disruption or failure could damage our reputation or have a material adverse effect on our business and our results of operations.
Risk Factors Related to our Common Stock
Our stock price could decline or fluctuate significantly due to unforeseen circumstances. These fluctuations may cause our stockholders to incur losses.
Our stock price could fluctuate or decline due to a variety of factors including, but not limited to, the risks factors described herein, the timing and cancellation of projects, changes in our estimated costs to complete projects, investors' opinions of the sectors and markets in which we operate or failure of our operating results to meet the expectations of securities analysts or investors, which could reduce investor confidence. These factors could adversely affect our business, and the trading price of our common stock could decline significantly.
There can be no assurance that we will declare or pay future dividends on our common stock.
Our Board of Directors has approved a regular quarterly dividend since Fiscal 2014. The declaration, amount and timing of future dividends are subject to capital availability and determinations by our Board of Directors that cash dividends are in the best interest of our stockholders and are in compliance with all respective laws and applicable agreements. Our ability to declare and pay dividends will depend upon, among other factors, our financial condition, results of operations, cash flows, current and anticipated expansion plans, requirements under Delaware law and other factors that our Board of Directors may deem relevant. A reduction in or elimination of our dividend payments could have a material negative effect on our stock price.
Risk Factors Related to Legal and Regulatory Matters
Our operations could be adversely impacted by the effects of government regulations.
We are subject to various government regulations in the United States as well as various international locations where we operate. These regulations cover several areas including environmental compliance, import and export controls, economic sanctions, data and privacy protection, transfer pricing rules, anti-bribery, anti-trafficking and anti-trust provisions. These laws and regulations are administered by various state, federal and international agencies. Changes in policy, laws or regulations, including those affecting oil and gas exploration and development activities or climate change matters and the resulting decisions by customers and other industry participants, could reduce demand for our products and services, which would have a negative impact on our operations. Various regulations have been implemented around the world related to safety and certification requirements applicable to oil and gas drilling and production activities, and we cannot predict whether operators will be able to satisfy these requirements. Further, we cannot predict future changes in any country in which we operate and how those changes may affect our ability to perform projects in those regions.
The Dodd-Frank Wall Street Reform and Consumer Protection Act requires disclosure of use of "conflict" minerals mined from the Democratic Republic of Congo and adjoining countries and our efforts to prevent the use of such minerals. In our industry,
13
conflict minerals are most commonly found in metals. As there may be only a limited number of suppliers offering "conflict-free" metals, we cannot be sure that we will be able to obtain necessary metals in sufficient quantities or at competitive prices. Also, we may face challenges with our customers and suppliers if we are unable to sufficiently verify that the metals used in our products are "conflict-free."
Changes in and compliance with environmental laws and regulations, including those regarding climate change, could adversely impact our financial results.
Private lawsuits or enforcement actions by federal, state, provincial or foreign regulatory agencies may materially increase our costs. Certain environmental laws may make us potentially liable for the remediation of contamination at or emanating from our properties or facilities. Although we seek to obtain indemnities against liabilities relating to historical contamination at the facilities we own or operate, we cannot provide any assurance that we will not incur liabilities relating to the remediation of potential contamination, including contamination we did not cause. These potential environmental liabilities may or may not be fully covered by our various insurance policies and may adversely affect our business and results operations.
Climate change regulations could require us or our customers to incur additional expenditures to either purchase new, or modify existing, equipment or processes. These laws and regulations may also increase our raw materials cost from our suppliers. The potential for future environmental, social and governance (ESG) and climate risk reporting requirements may result in additional costs to monitor, track and report sustainability measures. Additionally, increased attention to climate change, conservation measures, energy transition and consumer demand for alternatives to oil and gas could reduce the demand for oil and gas and have an adverse impact on demand for the products produced by our customers and therefore reduce demand for our products, which could adversely impact our business and results of operations.
Provisions of our charter documents or Delaware law could delay or prevent an acquisition of our company, even if the acquisition would be beneficial to our stockholders, and could make it more difficult to change management.
Because we are governed by Delaware law, we are subject to the provisions of Section 203 of the Delaware General Corporation Law. These provisions prohibit a publicly held Delaware corporation from engaging in a business combination with an interested stockholder, generally, a person who, together with its affiliates, owns, or within the last three years has owned, 15% of our voting stock, for a period of three years after the date of the transaction in which the person became an interested stockholder, unless the business combination is approved in a prescribed manner.
In addition, provisions of our Certificate of Incorporation and bylaws may discourage, delay or prevent a merger, acquisition or other change in control that stockholders might otherwise consider favorable, including transactions in which stockholders might otherwise receive a premium for their shares. These provisions may frustrate or prevent any attempt by our stockholders to replace or remove our current management by making it more difficult to replace or remove our boardBoard of directors.Directors.
Additional restrictions or economic disincentives on U.S. or international trade such as significant increases in tariffs on goods could adversely impact our business. Changes in U.S. or international social, political, regulatory and operating results,economic conditions or in laws and the trading price of our common stock could decline significantly.
Actual and potential claims, lawsuits and proceedings could ultimately reduce our profitability and liquidity and weaken our financial condition.
We could be named as a defendant in compliancelegal proceedings that claim damages in connection with covenants or obtain waivers or amendments underthe operation of our credit agreement could adversely impact our business.
Changes in tax laws and regulations may change our effective tax rate and could have a material effect on our financial results.
We are subject to income taxes in the U.S. and numerous foreign jurisdictions. A change in tax laws, deductions or credits, treaties or regulations, or their interpretation, in the countries in which we operate could result in a higher tax rate on our pre-tax income, which could have a material impact on our net income. We are regularly under audit by tax authorities, and our tax estimates and tax positions could be materially affected by many factors including the final outcome of tax audits and related litigation, the introduction of new tax accounting standards, legislation, regulations and related interpretations, our global mix of earnings, the extent to which deferred tax assets are realized and changes in uncertain tax positions. A significant increase in our statutory tax rates could have a material impact on our net income or loss and cash flow.
The departure of key personnel could disrupt our business.
We depend on the continued efforts of our executive officers, senior management and other key professionals. We cannot be certain that any individual will continue in such capacity for any particular period of time. The loss of key personnel, or the inability to hire and retain qualified employees, could negatively impact our ability to perform and manage our business.
15
Item 1B. Unresolved Staff Comments
None.
Item 2. Properties
We own our principal manufacturing and fabrication facilities and periodically lease smaller facilities throughout the U.S., Canada and the U.K. Our facilities are generally located in areas that are readily accessible to materials and labor pools and are maintained in good condition. These facilities are expected to meet our needs for the foreseeable future.
Our principal locations as of September 30, 2017,2021, are as follows:
| Location | Description | Acres | Approximate Square Footage | |||||||||||
| Houston, TX | Corporate office and manufacturing facility | 21.4 | 428,515 | |||||||||||
| Houston, TX | Office and manufacturing facility | 53.4 | 290,554 | |||||||||||
| Houston, TX | Office, fabrication facility and yard | 63.3 | 82,320 | |||||||||||
| North Canton, OH | Office and manufacturing facility | 8.0 | 115,200 | |||||||||||
| Northlake, IL | Office and manufacturing facility | 10.0 | 103,500 | |||||||||||
| Bradford, U.K. | Office and manufacturing facility | 7.9 | 129,200 | |||||||||||
| Acheson, Alberta, Canada | Office and manufacturing facility | 20.1 | 330,168 | |||||||||||
Item 3. Legal Proceedings
We are involved in various legal proceedings, claims and other disputes arising from our commercial operations, projects, employees and other matters which, in general, are subject to uncertainties and in which the outcomes are not predictable. These legal proceedings and claims may not be covered by our insurance policies or may exceed our policy limits. Although we can give no assurances about the resolution of pending claims, litigation or other disputes and the effect such outcomes may have on us, management believes that any ultimate liability resulting from the outcome of pending legalsuch proceedings, claims and other disputes, we doto the extent not believe that the ultimate conclusion of these disputes could materially affectotherwise provided or covered by insurance, will not have a material adverse effect on our consolidated financial position or results of operations cash flow and financial position.or liquidity.
Item 4. Mine Safety Disclosures
Not applicable.
16
PART II
Item 5. Market for Registrant’s Common Equity, Related Stockholder Matters and Issuer Purchases of Equity Securities
Our common stock trades on the NASDAQ Global Market (NASDAQ) under the symbol “POWL.” The following table sets forth, for the periods indicated, the high and low sales prices per share as reported on the NASDAQ for our common stock.
| High | Low | ||||||
| Fiscal 2016: | |||||||
| First Quarter | $ | 35.89 | $ | 25.99 | |||
| Second Quarter | 30.41 | 23.00 | |||||
| Third Quarter | 39.47 | 26.22 | |||||
| Fourth Quarter | 41.10 | 34.40 | |||||
| Fiscal 2017: | |||||||
| First Quarter | $ | 46.68 | $ | 34.81 | |||
| Second Quarter | 40.00 | 30.86 | |||||
| Third Quarter | 35.58 | 31.12 | |||||
| Fourth Quarter | 33.47 | 27.28 | |||||
As of December 1, 2017,6, 2021, the closing price of our common stock on the NASDAQ was $28.53$25.07 per share. As of December 1, 2017,6, 2021, there were 308250 stockholders of record of our common stock. All common stock held in street names areis recorded in the Company’s stock register as being held by one stockholder.
See “Part III, Item 12. Security Ownership of Certain Beneficial Owners and Management and Related Stockholder Matters” of this Annual Report for information regarding securities authorized for issuance under our equity compensation plans.
Dividend Policy
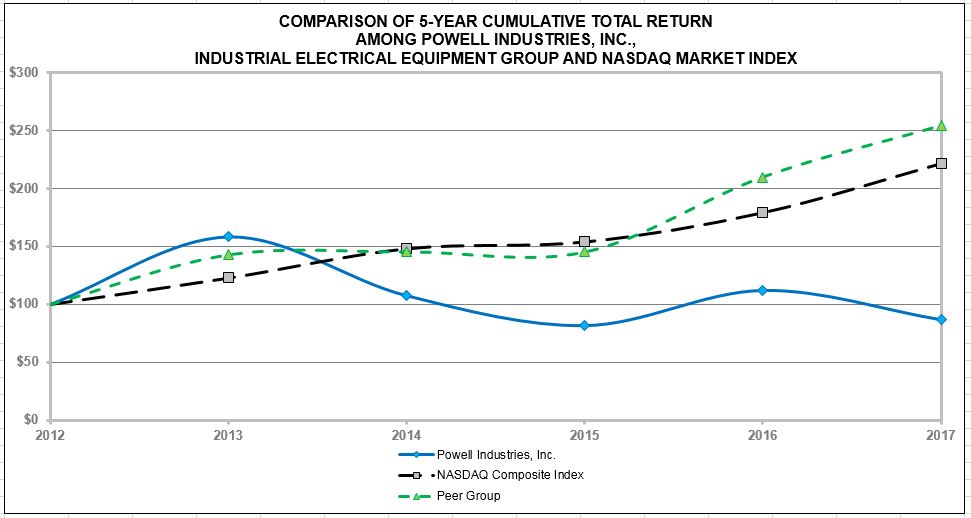
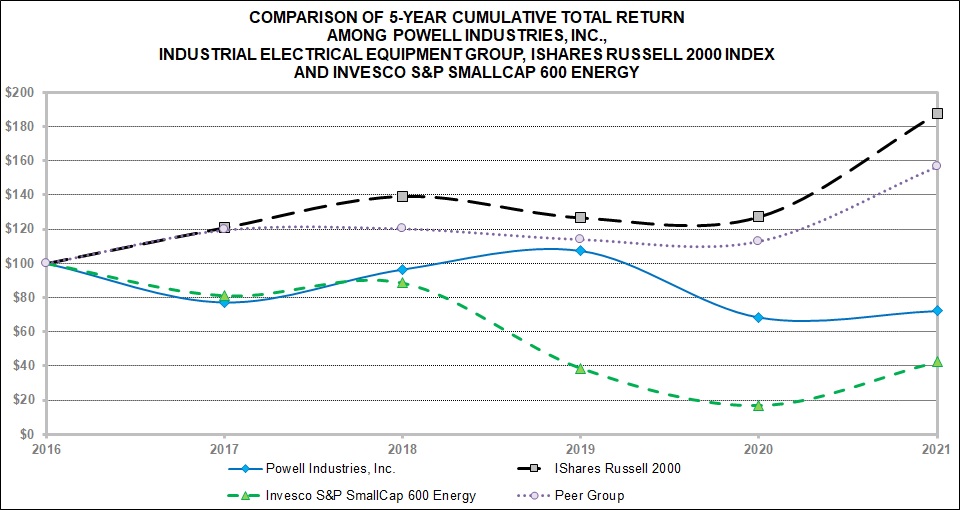
Performance Graph
The following Performance Graph and related information shall not be deemed “soliciting material” or to be “filed” with the SEC, nor shall such information be incorporated by reference into any future filing under the Securities Act of 1933 or Securities Exchange Act of 1934, each as amended, except to the extent that we specifically incorporate it by reference into such filing.
The following graph compares, for the period from October 1, 20122016 to September 30, 2017,2021, the cumulative stockholder return on our common stock with the cumulative total return on the NASDAQ Market IndexIShares Russell 2000, the Invesco S&P SmallCap 600 Energy, and the Industrial Electrical Equipment Group (a select group of peer companies – Altra Industrial Motion Corp.; Ameresco, Inc.; AZZ Inc.; Belden Inc.; Daktronics Inc.; Electro Scientific Industries, Inc.; EnerSys; Franklin Electric Co, Inc.; Littelfuse Inc.; LSI Industries Inc.; Preformed Line Products; A O Smith CorporationCorporation; Thermon Group Holdings and Woodward, Inc.). The comparison assumes that $100 was invested on October 1, 2012,2016, in our common stock, the NASDAQ Market IndexIShares Russell 2000, the Invesco S&P SmallCap 600 Energy, and the Industrial Electrical Equipment Group, and that all dividends were re-invested. The stock price performance reflected on the following graph is not necessarily indicative of future stock price performance.
17
Item 6. SelectedFinancial Data
The selected financial data shown below for the past five years was derived from our audited financial statements, adjusted for discontinuing operations. The historical results are not necessarily indicative of the operating results to be expected in the future. The selected financial data should be read in conjunction with “Part II, Item 7. Management’s Discussion and Analysis of Financial Condition and Results of Operations” and the consolidated financial statements and related notes included elsewhere in this Annual Report.
| Years ended September 30, | |||||||||||||||||||||||||||||
| 2021 | 2020 | 2019 | 2018 | 2017 | |||||||||||||||||||||||||
| Statement of Operations: | (In thousands, except per share data) | ||||||||||||||||||||||||||||
| Revenues | $ | 470,559 | $ | 518,499 | $ | 517,180 | $ | 448,716 | $ | 395,911 | |||||||||||||||||||
| Cost of goods sold | 395,496 | 423,924 | 430,204 | 383,361 | 345,142 | ||||||||||||||||||||||||
| Gross profit | 75,063 | 94,575 | 86,976 | 65,355 | 50,769 | ||||||||||||||||||||||||
| Selling, general and administrative expenses | 67,217 | 67,662 | 69,950 | 66,768 | 61,524 | ||||||||||||||||||||||||
| Research and development expenses | 6,670 | 6,265 | 6,327 | 6,717 | 6,906 | ||||||||||||||||||||||||
| Amortization of intangible assets | 157 | 177 | 177 | 205 | 355 | ||||||||||||||||||||||||
| Insurance proceeds | — | — | (950) | — | — | ||||||||||||||||||||||||
| Restructuring and other, net | — | 1,400 | 11 | 787 | 1,322 | ||||||||||||||||||||||||
| Operating income (loss) | 1,019 | 19,071 | 11,461 | (9,122) | (19,338) | ||||||||||||||||||||||||
| Other income | — | (506) | — | (747) | (2,029) | ||||||||||||||||||||||||
| Interest (income) expense, net | (73) | (753) | (873) | (676) | (390) | ||||||||||||||||||||||||
| Income (loss) before income taxes | 1,092 | 20,330 | 12,334 | (7,699) | (16,919) | ||||||||||||||||||||||||
Income tax provision (benefit) (1) | 461 | 3,670 | 2,444 | (547) | (7,433) | ||||||||||||||||||||||||
| Net income (loss) | $ | 631 | $ | 16,660 | $ | 9,890 | $ | (7,152) | $ | (9,486) | |||||||||||||||||||
| Earnings (loss) per share: | |||||||||||||||||||||||||||||
| Basic | $ | 0.05 | $ | 1.43 | $ | 0.85 | $ | (0.62) | $ | (0.83) | |||||||||||||||||||
| Diluted | $ | 0.05 | $ | 1.42 | $ | 0.85 | $ | (0.62) | $ | (0.83) | |||||||||||||||||||
| Years ended September 30, | |||||||||||||||||||
| 2017 | 2016 | 2015 | 2014 | 2013 | |||||||||||||||
| Statement of Operations: | (In thousands, except per share data) | ||||||||||||||||||
| Revenues | $ | 395,911 | $ | 565,243 | $ | 661,858 | $ | 647,814 | $ | 640,867 | |||||||||
| Cost of goods sold | 345,142 | 459,038 | 553,597 | 522,340 | 502,375 | ||||||||||||||
| Gross profit | 50,769 | 106,205 | 108,261 | 125,474 | 138,492 | ||||||||||||||
| Selling, general and administrative expenses | 61,524 | 74,924 | 76,801 | 87,756 | 79,707 | ||||||||||||||
| Research and development expenses | 6,906 | 6,731 | 6,980 | 7,608 | 7,615 | ||||||||||||||
| Amortization of intangible assets | 355 | 352 | 435 | 779 | 1,659 | ||||||||||||||
| Restructuring and separation expenses | 1,322 | 8,441 | 3,397 | — | 3,927 | ||||||||||||||
| Operating income | (19,338 | ) | 15,757 | 20,648 | 29,331 | 45,584 | |||||||||||||
| Gain on settlement | — | — | — | — | (1,709 | ) | |||||||||||||
| Other income | (2,029 | ) | (2,029 | ) | (2,402 | ) | (1,522 | ) | — | ||||||||||
| Interest expense (net) | (390 | ) | (7 | ) | 59 | 165 | 167 | ||||||||||||
| Income (loss) from continuing operations before income taxes | (16,919 | ) | 17,793 | 22,991 | 30,688 | 47,126 | |||||||||||||
| Income tax provision (benefit) (1) | (7,433 | ) | 2,283 | 13,552 | 11,068 | 7,387 | |||||||||||||
| Income (loss) from continuing operations | (9,486 | ) | 15,510 | 9,439 | 19,620 | 39,739 | |||||||||||||
| Income from discontinued operations, net of tax (2) | — | — | — | 9,604 | 2,337 | ||||||||||||||
| Net income (loss) | $ | (9,486 | ) | $ | 15,510 | $ | 9,439 | $ | 29,224 | $ | 42,076 | ||||||||
| Earnings (Loss) per share: | |||||||||||||||||||
| Continuing operations | $ | (0.83 | ) | $ | 1.36 | $ | 0.80 | $ | 1.63 | $ | 3.32 | ||||||||
| Discontinued operations | — | — | — | 0.80 | 0.20 | ||||||||||||||
| Basic earnings (loss) per share | $ | (0.83 | ) | $ | 1.36 | $ | 0.80 | $ | 2.43 | $ | 3.52 | ||||||||
| Continuing operations | $ | (0.83 | ) | $ | 1.36 | $ | 0.79 | $ | 1.62 | $ | 3.32 | ||||||||
| Discontinued operations | — | — | — | 0.80 | 0.19 | ||||||||||||||
| Diluted earnings (loss) per share | $ | (0.83 | ) | $ | 1.36 | $ | 0.79 | $ | 2.42 | $ | 3.51 | ||||||||
(1) For an explanation of the effective tax rate for the last three fiscal years, see Note HI of the Notes to Consolidated Financial Statements included elsewhere in this Annual Report.
| Years ended September 30, | |||||||||||||||||||||||||||||
| 2021 | 2020 | 2019 | 2018 | 2017 | |||||||||||||||||||||||||
| Balance Sheet Data: | (In thousands) | ||||||||||||||||||||||||||||
Cash, cash equivalents and short-term investments (1) | $ | 133,981 | $ | 178,921 | $ | 124,681 | $ | 49,754 | $ | 95,188 | |||||||||||||||||||
| Property, plant and equipment, net | 109,457 | 114,372 | 120,812 | 128,764 | 139,420 | ||||||||||||||||||||||||
| Total assets | 436,192 | 472,278 | 467,411 | 429,951 | 414,986 | ||||||||||||||||||||||||
| Long-term debt, including current maturities | 400 | 800 | 1,200 | 1,600 | 2,000 | ||||||||||||||||||||||||
| Total stockholders' equity | 301,223 | 306,626 | 299,153 | 301,644 | 321,296 | ||||||||||||||||||||||||
| Total liabilities and stockholders' equity | 436,192 | 472,278 | 467,411 | 429,951 | 414,986 | ||||||||||||||||||||||||
| Dividends paid on common stock | 12,142 | 12,066 | 11,998 | 11,916 | 11,875 | ||||||||||||||||||||||||
| Years ended September 30, | |||||||||||||||||||
| 2017 | 2016 | 2015 | 2014 | 2013 | |||||||||||||||
| Balance Sheet Data: | (In thousands) | ||||||||||||||||||
| Cash, cash equivalents and short-term investments (3) | $ | 95,188 | $ | 97,720 | $ | 43,569 | $ | 103,118 | $ | 107,411 | |||||||||
| Property, plant and equipment, net | 139,420 | 144,977 | 154,594 | 156,896 | 144,495 | ||||||||||||||
| Total assets | 414,986 | 462,516 | 468,824 | 541,443 | 530,903 | ||||||||||||||
| Long-term debt, including current maturities | 2,000 | 2,400 | 2,800 | 3,200 | 3,616 | ||||||||||||||
| Total stockholders' equity | 321,296 | 335,317 | 333,262 | 371,097 | 355,226 | ||||||||||||||
| Total liabilities and stockholders' equity | 414,986 | 462,516 | 468,824 | 541,443 | 530,903 | ||||||||||||||
| Dividends paid on common stock | 11,875 | 11,845 | 12,358 | 11,998 | — | ||||||||||||||
| Years ended September 30, | |||||||||||||||||||||||||||||
| 2021 | 2020 | 2019 | 2018 | 2017 | |||||||||||||||||||||||||
| Other Financial Data: | (In thousands) | ||||||||||||||||||||||||||||
| Backlog | $ | 414,918 | $ | 476,819 | $ | 419,012 | $ | 260,900 | $ | 250,123 | |||||||||||||||||||
| Bookings, net of cancellations and scope reductions | 403,860 | 576,782 | 676,051 | 458,884 | 355,064 | ||||||||||||||||||||||||
18
Item 7. Management’sDiscussionand Analysis of Financial Condition and Results of Operations
The following discussion and analysis of our financial condition and results of operations for the twelve months ended September 30, 2021 compared to the twelve months ended September 30, 2020 should be read in conjunction with the accompanying consolidated financial statements and related notes. We have elected to omit discussion on the earliest of the three years covered by the consolidated financial statements presented. Refer to Item 7. Management's Discussion and Analysis of Financial Condition and Results of Operations and Liquidity and Capital Resources located in our Form 10-K for the fiscal year ended September 30, 2020, filed on December 9, 2020, for reference to discussion of the fiscal year ended September 30, 2019, the earliest of the three fiscal years presented. Any forward-looking statements made by or on our behalf are made pursuant to the safe-harbor provisions of the Private Securities Litigation Reform Act of 1995. Readers are cautioned that such forward-looking statements involve risks and uncertainties, and the actual results may differ materially from those projected in the forward-looking statements. For a description of the risks and uncertainties, please see “Cautionary Statement Regarding Forward-Looking Statements; Risk Factors” and “Item“Part I, Item 1A. Risk Factors”Factors,” included elsewhere in this Annual Report.
Overview
We develop, design, manufacture and service custom-engineered equipment and systems for the distribution,which (1) distribute, control and monitoringmonitor the flow of electrical energy. Headquarteredenergy and (2) provide protection to motors, transformers and other electrically powered equipment. We are headquartered in Houston, Texas, weand serve the oil and gas refining,and petrochemical markets, which includes onshore and offshore oilproduction, LNG facilities and gas production,terminals, pipelines, refineries and petrochemical pipeline, terminal, miningplants. Additional markets include electric utility and metals, light rail traction power electric utility,as well as mining and metals, pulp and paper and other heavymunicipal, commercial and industrial markets. Revenues and costs are primarily related to custom engineered-to-order equipment and systems and are accounted for under percentage-of-completion accounting, which precludes us from providing detailed price and volume information. Our backlog includes various projects that typically take a number of months to produce.
The markets in which we participate are capital intensivecapital-intensive and cyclical in nature. Cyclicality is predominantly driven by customer demand, global economic conditions and anticipated environmental, safety or regulatory changes that affect the manner in which our customers proceed with capital investments. Our customers analyze various factors, including the demand and price for oil, gas and electrical energy, the overall economic and financial environment, governmental budgets, regulatory actions and environmental concerns. These factors influence the release of new capital projects by our customers, which are traditionally awarded in competitive bid situations. Scheduling of projects is matched to the customer requirements, and projects typically take a number of months to produce. Schedules may change during the course of any particular project, and our operating results can, therefore, be impacted by factors outside of our control.
Historically, the combination of a growing global economy, abundant sources of favorably priced natural gas feedstock, and an energy industry focus on transition to natural gas and cleaner-burning fuels drove an increase in capital investment opportunities, specifically across the oil, gas and petrochemical sectors. Some of these opportunities were for natural gas related projects targeting global demand for cleaner-burning fuels. Additionally, projects within the domestic petrochemical sector benefited from the low feedstock prices of natural gas. Specific to natural gas, the business was awarded a substantial contract in the second quarter of Fiscal 2020 that will support the integrated electrical distribution requirements for a large domestic industrial complex and should be substantially completed in Fiscal 2022. We began to experience reduced commercial activity in Fiscal 2020 driven in large part by the uncertainties across our industrial end markets in the U.S. resulting from the COVID-19 pandemic. Considering the long cycle nature of our business, these cyclical conditions may persist into Fiscal 2022.
19
Impact of the COVID-19 Pandemic and Oil and Gas Commodity Market Volatility on Powell
The COVID-19 pandemic continues to impact global energy markets. This pandemic has negatively impacted demand, which in turn has resulted in considerable volatility across global oil and gas commodity markets. Throughout the pandemic, the demand for our products and services as well as our operations have been negatively impacted, resulting from the associated reduction in oil and gas demand and volatility in commodity prices from late 2014 levels, manynoted above. As a result, some of our industrial customers are deferring or suspending their planned capital expenditures. Certain of our customers have reduced their capital budgets and cut costs, and in certain instances have delayed or cancelled projectsasked that we were pursuing. As a result,delay or cancel our revenuesmanufacturing on their projects as their operations have been negatively impacted by this pandemic and project backlog have declined,the reduced oil and maygas demand which has resulted in recognition of cancellation fees based on contract terms and the extent of our progress on the projects. We continue to decline, which may further negatively impactwork with our operations. key suppliers who have been impacted by this pandemic to ensure that we are able to meet our customer commitments.
In response to our reduced project backlog and the challenging market outlook in our core oil, gas and petrochemicallower demand across select end markets, we took steps in Fiscal 2016, and have taken additionaland will continue to take various actions in Fiscal 2017, to reduce costs. During Fiscal 2020, we reduced our overall cost structureglobal workforce and better alignreduced our costs with currentcapital and future production requirements.discretionary spending in response to business conditions. We continued to operate at these lower thresholds throughout Fiscal 2021 and are consistently monitoring macro-economic conditions as we head into Fiscal 2022.
As discussed further under the heading "Outlook" below, it is difficult to predict the economic impact that this pandemic, as well as reduced oil and gas demand and commodity price volatility, may have on our business, results of operations and cash flows going forward.
Results of Operations
Twelve Months Ended September 30, 20172021 Compared to Twelve Months Ended September 30, 20162020
Revenue and Gross Profit
Revenues decreased 30%by 9%, or $169.3$47.9 million, to $395.9$470.6 million in Fiscal 2017, compared to Fiscal 2016, primarily2021, due to the continueda decrease in orders as well as project delays and cancellations of potential projects associated with the global economic impact resulting from the COVID-19 pandemic and associated reduction in demand across our project backlog as we complete existing projects and continue to see lower demand from our customers in our core oil, gas and petrochemicalindustrial end markets. Domestic revenues decreased 31%by 12%, or $126.0$46.6 million, to $279.3 million and international revenues decreased 27%, or $43.4 million, to $116.6$351.5 million in Fiscal 2017, compared to Fiscal 2016. This reduction in geographic2021. International revenues year over year was primarily drivendecreased by the decline in our project backlog mentioned above. Revenues from commercial and industrial customers decreased 39%1%, or $164.9$1.4 million, to $254.2$119.1 million. Our international revenues include both revenues generated from our international facilities as well as revenues from export projects generated at our domestic facilities.
Revenue from our core oil and gas markets (excluding petrochemical) decreased by 4%, or $7.5 million, to $187.7 million while petrochemical revenue decreased by 53%, or $67.7 million, to $59.0 million in Fiscal 2017, compared to Fiscal 2016, primarily due to lower demand in our core oil, gas and petrochemical markets. Revenues2021 as noted above. Revenue from public and private utilities decreased 17%utility markets increased by 25%, or $17.5$22.4 million, to $84.4$111.2 million and traction market revenue increased by 39%, or $16.7 million, to $59.1 million in Fiscal 2017, compared to Fiscal 2016. Revenues2021. Revenue from municipal and transit projects increased 30%, or $13.1all other markets combined decreased by $11.8 million to $57.3$53.6 million in Fiscal 2017, compared2021.
The reduction in revenue led to Fiscal 2016 due to the timinga reduction in gross profit of certain projects.
revenue noted above.
Selling, General and Administrative Expenses
Selling, general and administrative expenses decreased 18%by 1%, or $13.4$0.4 million, to $61.5$67.2 million in Fiscal 2017, compared to Fiscal 2016, primarily2021, partially due to the cost reduction efforts we tookrestructuring action taken in Fiscal 2016 in response to our adverse market outlook2020 as well as lower incentive compensation expenses.travel-related costs. Selling, general and administrative expenses, as a percentage of revenues, increased to 16%14% in Fiscal 20172021, compared to 13% in Fiscal 2016,2020, primarily due to the reductiondecrease in revenue discussed above.revenues.
20
Restructuring and Separation ExpensesOther, Net
In Fiscal 2017, we incurred $1.3 million in separation and restructuring costs, compared to $8.4 million in Fiscal 2016. In Fiscal 2017, we continued to reduce our overall cost structure to better align our costs with current and future production requirements. The separation and restructuring costs incurred in Fiscal 2016 were dueresponse to the realignmentCOVID-19 pandemic, reductions in global oil and gas demand and volatility of our senior management team andcommodity prices, we implemented workforce reductions asacross the business. As a result, we recorded $1.4 million of our adverse market outlook and reduction in project backlog.separation costs during Fiscal 2020.
Other Income
Income Tax Provision
We recorded an income tax benefitprovision of $7.4$0.5 million in Fiscal 2017, compared to the income tax provision of $2.3 million we recorded2021, resulting in Fiscal 2016. The effective tax rate for Fiscal 2017 was 44% compared to an effective tax rate of 13% for42%, compared to an income tax provision of $3.7 million in Fiscal 2016.2020 at an effective tax rate of 18%. In both Fiscal 2021 and Fiscal 2020, the effective tax rate was negatively impacted by our inability to recognize a tax benefit related to losses incurred in various jurisdictions outside of the United States. The effective tax rates for both Fiscal 2017 and 2016 were favorablyrate was also negatively impacted by the lowervaluation allowances set up against our deferred tax rateassets in Fiscal 2021 and Fiscal 2020 related to Mexico in the U.K.,amount of $0.1 million and the relative amountsU.K. in the amount of income/loss recognized in various jurisdictions,$0.5 million. The estimated Research and Development Tax Credit (R&D Tax Credit) as well as the utilization of net operating loss carryforwards in Canada that arewere fully reserved with a valuation allowance. Additionally,allowance provided a tax benefit for Fiscal 2021 and Fiscal 2020. In Fiscal 2020, we reversed a reserve of $1.7 million resulting from a favorable settlement of an IRS audit and the effective tax rates for both Fiscal 2017 and 2016 were favorably impacted by discrete items recognized, primarily related to the Research and Development Tax Credit (R&D Tax Credit), in the amountsexpiration of $0.9 million and $0.8 million, respectively. See Note Hstatutes of the Notes to Consolidated Financial Statements. limitations.
Net Income
In Fiscal 2017,2021, we recorded a net lossincome of $9.5$0.6 million, or $0.83$0.05 per diluted share, a decrease fromcompared to net income of $15.5$16.7 million, or $1.36$1.42 per diluted share that we recorded in Fiscal 2016. The reduction in net income compared to the prior year was2020, primarily due to a decline in revenues and gross profit resulting from lower orders and project delays caused by the economic impact resulting from the COVID-19 pandemic and the associated reduction in global demand across our project backlog due to depressed market conditions and competitive pricing pressures, primarily in our core oil, gas and petrochemicalindustrial end markets.
Backlog
As of September 30, 2017, Payments Due by Period: | |||||||||||
| Long-Term Debt Obligations | Net Operating Lease Obligations | Total | |||||||||
| Less than 1 year | $ | 419 | $ | 1,890 | $ | 2,309 | |||||
| 1 to 3 years | 1,229 | 3,580 | 4,809 | ||||||||
| 3 to 5 years | 400 | 3,510 | 3,910 | ||||||||
| More than 5 years | — | 1,172 | 1,172 | ||||||||
| Total long-term contractual obligations | $ | 2,048 | $ | 10,152 | $ | 12,200 | |||||
As of September 30, 2017, Payments Due by Period: | Letters of Credit | ||
| Less than 1 year | $ | 17,143 | |
| 1 to 3 years | 7,739 | ||
| More than 3 years | 3,619 | ||
| Total long-term commercial obligations | $ | 28,501 | |
Outlook
A significant portion of our revenues havehas historically been from the oil, gas and petrochemical markets. Unfavorable oilOil and gas commodity price levels have caused,been unstable over the last several years, and we anticipate willour customers have in certain cases, delayed or cancelled some of their major capital investment projects. Beginning in late Fiscal 2018 through the first quarter of Fiscal 2020, our customers' decisions to invest in projects in our key oil and gas and petrochemical markets were influenced to some extent by relative stabilization of commodity prices and the increased global demand for cleaner-burning fuels during that period of time. We believe that this change in market sentiment during that period of time had a favorable impact on our orders and backlog entering Fiscal 2020. However, the uncertainty in oil prices and the global economic impacts from COVID-19 have had, and may continue to cause,have, a negative impact on our customersbusiness going forward, as discussed in more detail below. Specific to further delay their investments. The reductionthe energy industry focus on transitioning to natural gas and cleaner-burning fuels, the business was awarded a substantial contract in available projects acrossFiscal 2020 that will support the markets we serve has increased price pressures during this downward market cycle. This reductionintegrated electrical distribution requirements for a large domestic industrial complex and should be substantially completed in new business opportunities and increased market price pressures have impacted, and will continue to negatively impact, our backlog, revenues and operating results. It is difficult to predict the duration of the current depressed market cycle.
Fiscal 2022.
Our operating results have been, and we anticipate will continue to be, negativelyare impacted by factors such as the timing of new order awards, customer approval of final engineering and design specifications and delays in customer construction schedules, all of which havecontribute to short-term earnings variability and will continue to have, a negative impact on the timing of project execution. Our operating results also have been, and willmay continue to be, impacted by the timing and resolution of change orders, project close-out and resolution of potential contract claims and liquidated damages, all of which could improve or deteriorate gross margins during the period in which these items are resolved with our customers. These factors may result in periods of underutilization of our resources and facilities, andwhich may negatively impact our ability
21
to cover our fixed costs. If our core oil, gas and petrochemical markets remain depressed, or decline further, our project backlog and revenue couldWe will continue to declinemonitor potential labor shortages and negativelyincreased labor costs and the impact on our operations.
The strong commercial activity and subsequent orders in Fiscal 2018 and 2019 led to solid revenue and operating results for Fiscal 2020. We began to experience lower commercial activity in Fiscal 2020 driven in large part from the uncertainty resulting from the COVID-19 pandemic, as discussed in "Overview" above. Considering the long cycle nature of our business, these cyclical conditions may persist into Fiscal 2022. We will continue to monitor the variables that impact our operations. In responsemarkets while adjusting to the global conditions in order to maintain competitive costs and technological advantages in the markets that we serve.
The consequences of a prolonged economic decline could include, but are not limited to, a continued reduction in commercial and industrial activity. Accordingly, the Company cannot reasonably estimate the duration or severity of this pandemic, potential labor shortages, increased labor costs, or the extent to which these disruptions may materially impact our reduced project backlogbusiness, results of operations or cash flows. We will take prudent measures to maintain our strong liquidity and depressed market outlook, we took steps these past two fiscal yearscash position, which may include reducing our capital expenditures and research and development costs, as well as reducing or eliminating future dividend payments.
Liquidity and Capital Resources
As of September 30, 2021, current assets exceeded current liabilities by 2.5 times, and our debt to reduce our overall cost structuretotal capitalization was 0.13%.
Cash, cash equivalents and better align our costs with future production requirements. We continueshort-term investments decreased to assess our cost structure, operating performance and service offerings as$134.0 million at September 30, 2021, compared to $178.9 million at September 30, 2020. This decrease in cash was primarily driven by the oil, gas and petrochemical markets remain challenging and uncertain. During Fiscal 2018, additional actions may be necessary.
timing of contract billing milestones. We believe that our strong working capital position, cash available low debt position and borrowing capacityborrowings under our existing credit facility and available cash should be sufficient to finance future operating activities, capital improvements, research and development initiatives capital improvements and debt repayments for the foreseeable future.
We continuehave a credit agreement with Bank of America, N.A. (the "U.S. Revolver") which is a $75.0 million revolving credit facility available for both borrowings and letters of credit and expires September 27, 2024. On March 12, 2021, we entered into a first amendment to monitor the factors that drive our marketsU.S. Revolver which, among other things, amended certain terms related to the calculation of the consolidated leverage ratio from gross leverage to net leverage. As a result of the first amendment, up to $30 million may be deducted from the amount of letters of credit outstanding (not to be less than zero) when calculating the consolidated funded indebtedness which is a component of the consolidated net leverage ratio. Additionally, we have the option to cash collateralize all or a portion of the letters of credit outstanding, which would favorably impact the consolidated funded indebtedness calculation and will continuethe consolidated net leverage ratio.
As of September 30, 2021, there were no amounts borrowed under this facility, and letters of credit outstanding were $34.8 million. As of September 30, 2021, $40.2 million was available for the issuance of letters of credit and borrowing under the U.S. Revolver. Total long-term debt, including current maturities, totaled $0.4 million at September 30, 2021 related to striveoutstanding industrial development revenue bonds. We are required to maintain certain financial covenants, the most significant of which are a consolidated net leverage ratio less than 3.0 to 1.0 and a consolidated interest coverage ratio of greater than 3.0 to 1.0. Our most restrictive covenant, the consolidated net leverage ratio, is the ratio of earnings before interest, taxes, depreciation, amortization and stock-based compensation (EBITDAS) to funded indebtedness, which includes letters of credit. An increase in indebtedness or a decrease in EBITDAS could restrict our leadershipability to issue letters of credit or borrow under the U.S. Revolver. For further information regarding our debt, see Notes G and competitive advantageH of Notes to Consolidated Financial Statements.
Approximately $30.6 million of our cash, cash equivalents and short-term investments at September 30, 2021 was held outside of the U.S. for our international operations. It is our intention to indefinitely reinvest all current and future foreign earnings internationally in order to ensure sufficient working capital to support our international operations. In the event that we elect to repatriate some or all of the foreign earnings that were previously deemed to be indefinitely reinvested outside the U.S., we may incur additional tax expense upon such repatriation under current tax laws.
22
Operating Activities
Operating activities used net cash of $30.5 million in Fiscal 2021 and provided net cash of $72.4 million in Fiscal 2020. Cash flow from operations is primarily influenced by the timing of milestone payments from our customers, project volume and the payment terms with our suppliers. This decrease in operating cash flows was primarily due to the timing of contract billing milestones and cash used on our large industrial project discussed above.
Investing Activities
Investing activities used $2.5 million of cash during Fiscal 2021 compared to $17.5 million of cash used in Fiscal 2020. The decrease in cash used by investing activities in Fiscal 2021 was primarily due to a decrease in net purchases of short-term investments and a decrease in capital expenditures. Additionally, the proceeds received from a Company-owned life insurance policy related to a retired employee provided investing cash flow in Fiscal 2021.
Financing Activities
Net cash used in financing activities was $13.2 million in Fiscal 2021 and $13.1 million in Fiscal 2020, which primarily consisted of $12.1 million of dividends paid in each year.
Other Commercial Commitments
We are contingently liable for letters of credit and bank guarantees totaling $42.2 million as of September 30, 2021, with the following potential cash outflows in the marketsevent that we serve while aligningare unable to perform under our cost structures with market conditions.contracts (in thousands):
| Payments Due by Period: | Letters of Credit/Bank Guarantees | ||||
| Less than 1 year | $ | 16,504 | |||
| 1 to 3 years | 24,416 | ||||
| More than 3 years | 1,275 | ||||
| Total long-term commercial obligations | $ | 42,195 | |||
We also had surety bonds totaling $143.0 million that were outstanding at September 30, 2021. Surety bonds are primarily used to guarantee our contract performance to our customers.
Off-Balance Sheet Arrangements
We had no significant off-balance sheet arrangements during the periods presented.
Effects of Inflation
We are subject to inflation, which can cause increases in our costs of labor and raw materials, primarily copper, aluminum and steel. Fixed-price contracts can limit our ability to pass these increases to our customers, thus negatively impacting our earnings. The inflationInflation in commodity prices couldhas negatively impacted our financial results in Fiscal 2021. Additionally, inflation related to commodity and labor prices may potentially impact our operations in future years.
Critical Accounting Policies and Estimates
The preparation of consolidated financial statements in conformity with accounting principles generally accepted in the United States of AmericaU.S. requires management to make estimates and assumptions that affect the reported amounts of assets liabilities, revenues and expenses and theliabilities, disclosures of contingent assets and liabilities.liabilities known to exist at the date of the consolidated financial statements and the reported amounts of revenues and expenses during the reporting period. We baseevaluate our estimates on an ongoing basis, based on historical experience and on various other assumptions that are believed to be reasonable under the circumstances. ActualThere can be no assurance that actual results maywill not differ from thesethose estimates.
We believe the following accounting policies and estimates to be critical in the preparation and reporting of our consolidated financial statements.
Revenue Recognition
23
Our revenues are primarily generated from the engineering and manufacturing of customcustom-engineered products and systems under long-term fixed-price contracts thatunder which we agree to manufacture various products such as traditional and arc-resistant distribution switchgear and control gear, medium-voltage circuit breakers, monitoring and control communications systems, motor control centers, switches and bus duct systems. These products may lastbe sold separately as an engineered solution, but are typically integrated into custom-built enclosures which we also build. These enclosures are referred to as power control room substations (PCRs®), custom-engineered modules or electrical houses (E-Houses). Some contracts may also include the installation and the commissioning of these enclosures.
Revenue from one month to several years, dependingthese contracts is generally recognized over time utilizing the cost-to-cost method. Under the cost-to-cost method, the extent of progress towards completion is measured based on the contract. Revenues from long-term contracts are recognized on the percentage-of-completion methodratio of accounting.
Contract Estimates
Actual revenues and project costs associated with operationmay vary from previous estimates due to changes in a variety of equipment.factors. The cost estimation process is based upon the professional knowledge and experience of our engineers, project managers and financial professionals. Factors that are considered in estimating the work to be completed and ultimate contract recovery include the availability and productivity of labor, the nature and complexity of the work to be performed, the effect of change orders, the availability of materials, and the effect of any delays on our project performance and the recoverability of any claims. Changes inperformance. We periodically review our job performance, job conditions, estimated profitability and final contract settlements, including our estimate of liquidated damages, if any, may result intotal costs and make revisions to costs and income with their effects being recognized in the period in which the revisions are determined.probable and reasonably estimable. We bear the risk of cost overruns in most of our contracts, which may result in reduced profits. Whenever revisions of estimated contract costs and contract values indicate
that the contract costs will exceed estimated revenues, thus creating a loss, a provision for the total estimated loss is recorded in that period. See Note E of Notes to Consolidated Financial Statements for disclosures related to changes in contract estimates.
A performance obligation is a promise in a contract or with maintenance, repaira customer to transfer a distinct good or service. A contract’s transaction price is allocated to each distinct performance obligation and servicerecognized as revenue as the performance obligations are satisfied. To determine the proper revenue recognition for contracts, are recognized when thewe evaluate whether a contract should be accounted for as more than one performance obligation or, less commonly, whether two or more contracts should be combined and accounted for as one performance obligation. This evaluation of performance obligations requires significant judgment. The majority of our contracts have a single performance obligation where multiple engineered products and services are performed. Expenses relatedcombined into a single, custom-engineered solution. Our contracts include a standard one-year assurance warranty. Occasionally, we provide service-type warranties that will extend the warranty period. These extended warranties qualify as separate performance obligations, and revenue is deferred and recognized over the warranty period. If we determine during the evaluation of the contract that there are multiple performance obligations, we allocate the transaction price to these typeseach performance obligation using our best estimate of services are recognized as incurred.the standalone selling price of each distinct good or service in the contract.
It is common for our long-term contracts to contain variable consideration that can either increase or decrease the transaction price. Due to the nature of our contracts, estimating total cost and estimated earningsrevenue can be complex and subject to variability due to change orders, back charges, spare parts, early completion bonuses, customer allowances and liquidated damages. We estimate the amount of variable consideration based on the expected value method, which is the sum of probability-weighted amount, or the most likely amount method, which uses various factors including experience with similar transactions and assessment of our anticipated performance. Variable consideration is included in excess of billings on uncompleted contracts also include certain costs associated with unapproved change orders. These costs are included when change order approval is probable. Amounts are carried at the lower of cost or net realizable value. Revenue is recognizedtransaction price if legally enforceable and to the extent it is probable that a significant reversal of costs incurredcumulative revenue recognized will not occur once the uncertainty associated with the variable consideration is resolved.
Contract Modifications
Contracts may be modified for changes in contract specifications and requirements. We consider contract modifications to exist when recovery is probable. The amounts recorded involve the usemodification either creates new or changes the enforceable rights and obligations under the contract. Most of judgmentsour contract modifications are for goods and estimates; thus, actual recoverable amounts could differ from original assumptions.
24
modifications result in a cumulative catch-up adjustment to pay amounts due to us. This estimated allowance isrevenue based on historical experienceour measure of uncollected accounts,progress for the level of past due accounts, the overall level of outstanding accounts receivable, information about specific customers with respect to their inability to make payments and expectations of future conditions that could impact the collectability of accounts receivable. However, future changes in our customers’ operating performance and cash flows, or in general economic conditions, could have an impact on their ability to fully pay these amounts, which, among other things, could have a material adverse impact on our operating results.obligation.
Impairment of Long-Lived Assets
We review long-lived assets for impairment whenever events or changes in circumstances indicate that the carrying value may not be realizable. If an evaluation is required, the estimated future undiscounted cash flows associated with the asset are compared to the asset’s carrying amount to determine if recording an impairment of such asset is necessary. This requires us to make long-term forecasts of the future revenues and costs related to the assets subject to review. Forecasts require assumptions about demand for our products and future market conditions. Estimating future cash flows requires significant judgment, and our projections may vary from cash flows eventually realized. Future events and unanticipated changes to assumptions could require a provision for impairment in a future period. The effect of any impairment would be reflected in income (loss) from operations in the Consolidated Statements of Operations. In addition, we estimate the useful lives of our long-lived assets and other intangibles and periodically review these estimates to determine whether these lives are appropriate.
Accruals for Contingent Liabilities
From time to time, contingencies such as insurance-related claims, liquidated damages and legal claims arise in the normal course of business. Pursuant to applicable accounting standards, we must evaluate such contingencies to subjectively determine the likelihood that an asset has been impaired, or a liability has been incurred at the date of the financial statements, as well as evaluate whether the amount of the loss can be reasonably estimated. If the likelihood is determined to be probable, and it can be reasonably estimated, the estimated loss is recorded. The amounts we record for contingent liabilities require judgments regarding the amount of expenses that will ultimately be incurred. We use past experience and history, as well as the specific circumstances surrounding each contingent liability, including estimated legal costs, in evaluating the amount of liability that should be recorded. Actual results could differ from our estimates.
Warranty Costs
Projects may require, on occasion, warranty terms whichthat are longer than our standard terms due to the nature of the project. Extended warranty terms may be negotiated and included in our contracts. We use past experienceThe allocated revenue associated with the extended warranty is deferred and historical claims to determinerecorded as a contract liability and recognized as revenue over the estimated liability. Actual results could differ from our estimate.extended warranty period.
Accounting for Income Taxes
We account for income taxes under the asset and liability method, based on the income tax laws and rates in the countries in which operations are conducted, and income is earned. This approach requires the recognition of deferred tax assets and liabilities for the expected future tax consequences of temporary differences between the carrying amounts and the tax basis of assets and liabilities. Developing our provision for income taxes requires significant judgment and expertise in federal, international and state income
tax laws, regulations and strategies, including the determination of deferred tax assets and liabilities and, if necessary, any valuation allowances that may be required for deferred tax assets. In assessing the extent to which net deferred tax assets may be realized, we consider whether it is more likely than not that some portion or all of the net deferred tax assets may not be realized. The ultimate realization of net deferred tax assets is dependent on the generation of future taxable income during the periods in which those temporary differences become deductible. Due to the historical Canadian losses, and the losses that we projected at the time of determination, we were required under the more likely than not accounting standard to record a valuation allowance against the Canadian net deferred tax assets because we anticipated that we may not be able to realize the benefits of the net operating loss carryforwards and other deductible differences. Estimates may change as new events occur, estimates of future taxable income during the carryforward period are reduced or increased, additional information becomes available, or operating environments change, which may result in a full or partial reversal of the valuation allowance. We will continue to assess the adequacy of the valuation allowance on a quarterly basis. Our judgments and tax strategies are subject to audit by various taxing authorities.
The objectives of accounting for income taxes are to recognize the amount of taxes payable or refundable for the current year and deferred tax liabilities and assets for the future tax consequences of events that have been recognized in an entity’s financial statements or tax returns. We recognize the tax benefit from an uncertain tax position only if it is more likely than not that the tax position will be sustained on examination by the taxing authorities, based on the technical merits of the position. The tax benefits recognized in the financial statements from such a position should be measured based on the largest benefit that has a greater than 50% likelihood of being realized upon ultimate settlement. Accounting literature also provides guidance on
25
derecognition of income tax assets and liabilities, classification of current and deferred income tax assets and liabilities, accounting for interest and penalties associated with tax positions, and income tax disclosures. Judgment is required in assessing the future tax consequences of events that have been recognized in our financial statements or tax returns. Variations in the actual outcome of these future tax consequences could materially impact our financial statements.position and results of operations.
See Note HI of Notes to Consolidated Financial Statements for disclosures related to the valuation allowance recorded in relation to foreign deferred taxes.
Item 7A. Quantitative and Qualitative Disclosuresabout About Market Risk
We are exposed to certain market risks arising from transactions we have entered into in the normal course of business. These risks primarily relate to fluctuations in market conditions, commodity prices, foreign currency transactions and interest rates, foreign exchange rates and commodity prices.rates.
Market Risk
We are exposed to general market risk and its potential impact on accounts receivable or costs and estimated earnings in excess of billings on uncompleted contracts. The amounts recorded may be at risk if our customers’ ability to pay these obligations is negatively impacted by economic conditions. Our customers and their industries are typically engineering, procurement and construction firms,in the oil and gas refining,markets, including onshore and offshore oil and gas production, pipeline, refining and liquefied natural gas terminals, as well as petrochemical, pipeline, terminal, miningelectric utility and metals, light rail traction power, electric utility, pulppower. Occasionally, our customers may include an engineering, procurement and paper and other heavy industrial customers.construction (EPC) firm which may increase our market risk exposure based on the business climate of the EPC firm. We maintain ongoing discussions with customers regarding contract status with respect to payment status, change orders and billing terms in an effort to monitor collections of amounts billed.
Commodity Price Risk
We are subject to market risk from fluctuating market prices of certain raw materials used in our products. While such materials are typically available from numerous suppliers, commodity raw materials are subject to price fluctuations. We attempt to pass along such commodity price increases to our customers on a contract-by-contract basis to avoid a negative effect on profit margin. While we may do so in the future, we have not currently entered into any derivative contracts to hedge our exposure to commodity price risk. We continue to experience price volatility with some of our key raw materials and components. Fixed-price contracts may limit our ability to pass cost increases to our customers, thus negatively impacting our earnings. Fluctuations in commodity prices may have a material impact on our future earnings and cash flows.
Foreign Currency Transaction Risk
We have foreign operations that expose us to foreign currency exchange rate risk in the British Pound Sterling, the Canadian Dollar and to a lesser extent the Euro.Mexican Peso and the Euro, among others. Amounts invested in our foreign operations are translated into U.S. Dollars at the exchange rates in effect at the balance sheet date. The resulting translation adjustments are recorded as accumulated other comprehensive income (loss),loss, a component of stockholders’ equity in our consolidated balance sheets.Consolidated Balance Sheets. We believe the exposure to the effects that fluctuating foreign currencies have on our consolidated results of operations is limited because the foreign operations primarily invoice customers and collect obligationspayments in their respective local currencies or U.S. Dollars. Additionally, expenses associated with these transactions are generally contracted and paid for in the same local currencies. For Fiscal 2017,2021, our realized foreign exchange gains were $0.2loss was $0.4 million and areis included in selling, general and administrative expenses in the Consolidated Statements of Operations.
Our accumulated other comprehensive loss, which is included as a component of stockholders’ equity, was $18.8$20.4 million as of September 30, 2017,2021, a decrease from $23.8of $4.2 million atcompared to September 30, 2016.2020. This improvementdecrease in comprehensive loss was primarily a result of fluctuations in the currency exchange rates for the Canadian Dollar and British Pound Sterling as we remeasured the foreign operations of those divisions. During Fiscal 2017, the U.S. Dollar deteriorated relative to these foreign currencies and, as a result, our accumulated other comprehensive losses decreased.
We do not currentlytypically hedge our exposure to potential foreign currency translation adjustments.
26
Interest Rate Risk
If we decide to borrow under one of our credit facilities,U.S. Revolver, we will be subject to market risk resulting from changes in interest rates related to our floating rate bank credit facility. If we were to make such borrowings, a hypothetical 100 basis point increase in variable interest rates may result in a material impact to our financial statements. While we do not currently have any derivative contracts to hedge our exposure to interest rate risk, in the past we have entered and may in the future enter into such contracts. During each of the past three years,periods presented, we have not experienced a significant effect on our business due to changes in interest rates.
27
Item 8. Financial Statements and Supplementary Data
| Index to Consolidated Financial Statements | Page | |||||||
| Financial Statements: | ||||||||
28
Report of Independent Registered Public Accounting Firm
To the Board of Directors and Stockholders of Powell Industries, Inc.
We have audited the accompanying consolidated balance sheets of Powell Industries, Inc. and its subsidiaries (the “Company”) as of September 30, 2021 and 2020, and the related consolidated statements of operations, of comprehensive income, (loss), of stockholders’ equity and of cash flows present fairly, in all material respects, the financial position of Powell Industries, Inc. and its subsidiaries as of September 30, 2017 and 2016and the results of their operations and their cash flows for each of the three years in the period ended September 30, 20172021, including the related notes (collectively referred to as the “consolidated financial statements”). We also have audited the Company's internal control over financial reporting as of September 30, 2021, based on criteria established in Internal Control - Integrated Framework (2013) issued by the Committee of Sponsoring Organizations of the Treadway Commission (COSO).
In our opinion, the consolidated financial statements referred to above present fairly, in all material respects, the financial position of the Company as of September 30, 2021 and 2020, and the results of its operations and its cash flows for each of the three years in the period ended September 30, 2021 in conformity with accounting principles generally accepted in the United States of America. Also in our opinion, the Company maintained, in all material respects, effective internal control over financial reporting as of September 30, 2017,2021, based on criteria established inInternal Control - Integrated Framework (2013)issued by the Committee of Sponsoring Organizations ofCOSO.
Change in Accounting Principle
As discussed in Note B to the Treadway Commission (COSO). consolidated financial statements, the Company changed the manner in which it accounts for leases in the year ended September 30, 2020.
Basis for Opinions
The Company's management is responsible for these consolidated financial statements, for maintaining effective internal control over financial reporting, and for its assessment of the effectiveness of internal control over financial reporting, included in Management’s Report on Internal Control overOver Financial Reporting.Reporting appearing under Item 9A. Our responsibility is to express opinions on thesethe Company’s consolidated financial statements and on the Company's internal control over financial reporting based on our integrated audits. We are a public accounting firm registered with the Public Company Accounting Oversight Board (United States) (PCAOB) and are required to be independent with respect to the Company in accordance with the U.S. federal securities laws and the applicable rules and regulations of the Securities and Exchange Commission and the PCAOB.
We conducted our audits in accordance with the standards of the Public Company Accounting Oversight Board (United States).PCAOB. Those standards require that we plan and perform the audits to obtain reasonable assurance about whether the consolidated financial statements are free of material misstatement, whether due to error or fraud, and whether effective internal control over financial reporting was maintained in all material respects.
Our audits of the consolidated financial statements included performing procedures to assess the risks of material misstatement of the consolidated financial statements, whether due to error or fraud, and performing procedures that respond to those risks. Such procedures included examining, on a test basis, evidence supportingregarding the amounts and disclosures in the consolidated financial statements, assessingstatements. Our audits also included evaluating the accounting principles used and significant estimates made by management, andas well as evaluating the overall presentation of the consolidated financial statement presentation.statements. Our audit of internal control over financial reporting included
29
obtaining an understanding of internal control over financial reporting, assessing the risk that a material weakness exists, and testing and evaluating the design and operating effectiveness of internal control based on the assessed risk. Our audits also included performing such other procedures as we considered necessary in the circumstances. We believe that our audits provide a reasonable basis for our opinions.
Definition and Limitations of Internal Control over Financial Reporting
A company’s internal control over financial reporting is a process designed to provide reasonable assurance regarding the reliability of financial reporting and the preparation of financial statements for external purposes in accordance with generally accepted accounting principles. A company’s internal control over financial reporting includes those policies and procedures that (i) pertain to the maintenance of records that, in reasonable detail, accurately and fairly reflect the transactions and dispositions of the assets of the company; (ii) provide reasonable assurance that transactions are recorded as necessary to permit preparation of financial statements in accordance with generally accepted accounting principles, and that receipts and expenditures of the company are being made only in accordance with authorizations of management and directors of the company; and (iii) provide reasonable assurance regarding prevention or timely detection of unauthorized acquisition, use, or disposition of the company’s assets that could have a material effect on the financial statements.
Because of its inherent limitations, internal control over financial reporting may not prevent or detect misstatements. Also, projections of any evaluation of effectiveness to future periods are subject to the risk that controls may become inadequate because of changes in conditions, or that the degree of compliance with the policies or procedures may deteriorate.
Critical Audit Matters
The critical audit matter communicated below is a matter arising from the current period audit of the consolidated financial statements that was communicated or required to be communicated to the audit committee and that (i) relates to accounts or disclosures that are material to the consolidated financial statements and (ii) involved our especially challenging, subjective, or complex judgments. The communication of critical audit matters does not alter in any way our opinion on the consolidated financial statements, taken as a whole, and we are not, by communicating the critical audit matter below, providing a separate opinion on the critical audit matter or on the accounts or disclosures to which it relates.
Revenue Recognition – Long-term fixed priced contracts
As described in Notes B and E to the consolidated financial statements, the majority of the Company’s total revenue of $470.6 million for the year ended September 30, 2021 was generated from the manufacturing of custom-engineered products and systems under long-term fixed-price contracts. Revenue from these contracts is generally recognized over time utilizing the cost-to-cost method to measure the extent of progress toward the completion of the performance obligation and the recognition of revenue over time. Management believes that this method is the most accurate representation of performance, because it directly measures the value of the services transferred to the customer over time as costs are incurred on the contracts. Contract costs include all direct materials, labor, and indirect costs related to contract performance, which may include indirect labor, supplies, tools, repairs and depreciation costs. Under the cost-to-cost method, the extent of progress towards completion is measured based on the ratio of costs incurred to date to the total estimated costs at completion of the performance obligation. Due to the nature of the contracts, estimating total cost and revenue can be complex and subject to variability due to change orders, back charges, spare parts, early completion bonuses, customer
30
allowances and liquidated damages. Management estimates the amount of variable consideration based on the expected value method, which is the sum of the probability-weighted amount, or the most likely amount method which uses various factors including experience with similar transactions and assessment of anticipated performance.
The principal considerations for our determination that performing procedures relating to revenue recognized over time utilizing the cost to cost method is a critical audit matter are the significant judgment by management when determining the estimated total cost and revenue, which in turn led to a high degree of auditor judgment, subjectivity and effort in performing procedures and in evaluating management’s judgment about assumptions related to the estimates of costs to complete and liquidated damages.
Addressing the matter involved performing procedures and evaluating audit evidence in connection with forming our overall opinion on the consolidated financial statements. These procedures included testing the effectiveness of controls relating to the revenue recognition process, including controls over the determination of total estimated costs at completion of the performance obligation and determination of total contract price. The procedures also included, among others, evaluating and testing management’s process for determining the estimated total cost and revenue for a sample of contracts, which included (i) obtaining executed purchase orders and agreements, (ii) evaluating the appropriateness of the method to measure estimated total cost and revenue, (iii) testing the completeness and accuracy of the underlying data used by management, and (iv) evaluating the reasonableness of significant assumptions related to the total estimated costs at completion and liquidated damages used by management and considering the factors that can affect the accuracy of those estimates. Evaluating the reasonableness of significant assumptions related to estimated total cost involved assessing management’s ability to reasonably estimate total costs to complete and liquidated damages by testing management’s process to evaluate the remaining direct materials, labor, and indirect costs related to the performance obligation and evaluating the timely identification of circumstances which may warrant a modification to the total estimated costs or liquidated damages.
/s/ PricewaterhouseCoopers LLP
Houston, Texas
December 6, 2017
8, 2021
We have served as the Company’s auditor since 2004.
31
POWELL INDUSTRIES, INC. AND SUBSIDIARIES
CONSOLIDATED BALANCE SHEETS
(In thousands, except share and per share data)
| September 30, | |||||||||||
| 2021 | 2020 | ||||||||||
| ASSETS | |||||||||||
| Current Assets: | |||||||||||
| Cash and cash equivalents | $ | 114,314 | $ | 160,216 | |||||||
| Short-term investments | 19,667 | 18,705 | |||||||||
| Accounts receivable, less allowance for doubtful accounts of $333 and $510 | 78,304 | 69,957 | |||||||||
| Contract assets | 54,199 | 50,995 | |||||||||
| Inventories | 29,835 | 28,968 | |||||||||
| Income taxes receivable | 161 | 467 | |||||||||
| Prepaid expenses | 4,382 | 4,402 | |||||||||
| Other current assets | 1,599 | 1,948 | |||||||||
| Total Current Assets | 302,461 | 335,658 | |||||||||
| Property, plant and equipment, net | 109,457 | 114,372 | |||||||||
| Operating lease assets, net | 3,453 | 5,217 | |||||||||
| Goodwill and intangible assets, net | 1,003 | 1,161 | |||||||||
| Deferred income taxes | 4,639 | 3,644 | |||||||||
| Other assets | 15,179 | 12,226 | |||||||||
| Total Assets | $ | 436,192 | $ | 472,278 | |||||||
| LIABILITIES AND STOCKHOLDERS' EQUITY | |||||||||||
| Current Liabilities: | |||||||||||
| Current maturities of long-term debt | $ | 400 | $ | 400 | |||||||
| Accounts payable | 45,247 | 35,029 | |||||||||
| Contract liabilities | 42,433 | 79,445 | |||||||||
| Accrued compensation and benefits | 20,395 | 21,739 | |||||||||
| Accrued product warranty | 2,531 | 2,771 | |||||||||
| Current operating lease liabilities | 1,415 | 2,352 | |||||||||
| Income taxes payable | 1,076 | 1,861 | |||||||||
| Other current liabilities | 7,659 | 9,350 | |||||||||
| Total Current Liabilities | 121,156 | 152,947 | |||||||||
| Long-term debt, net of current maturities | — | 400 | |||||||||
| Deferred compensation (Note J) | 8,613 | 6,710 | |||||||||
| Long-term operating lease liabilities | 2,413 | 3,434 | |||||||||
| Other long-term liabilities | 2,787 | 2,161 | |||||||||
| Total Liabilities | 134,969 | 165,652 | |||||||||
| Commitments and Contingencies (Note H) | 0 | 0 | |||||||||
| Stockholders' Equity: | |||||||||||
| Preferred stock, par value $0.01; 5,000,000 shares authorized; none issued | — | — | |||||||||
| Common stock, par value $0.01; 30,000,000 shares authorized; 12,497,691 and 12,422,411 shares issued, respectively | 125 | 124 | |||||||||
| Additional paid-in capital | 63,948 | 61,998 | |||||||||
| Retained earnings | 282,505 | 294,016 | |||||||||
| Treasury stock, 806,018 shares at cost | (24,999) | (24,999) | |||||||||
| Accumulated other comprehensive loss | (20,356) | (24,513) | |||||||||
| Total Stockholders' Equity | 301,223 | 306,626 | |||||||||
| Total Liabilities and Stockholders' Equity | $ | 436,192 | $ | 472,278 | |||||||
| September 30, | |||||||
| 2017 | 2016 | ||||||
| ASSETS | |||||||
| Current Assets: | |||||||
| Cash and cash equivalents | $ | 68,359 | $ | 97,720 | |||
| Short-term investments | 26,829 | — | |||||
| Restricted cash | 15,104 | — | |||||
| Accounts receivable, less allowance for doubtful accounts of $179 and $811 | 53,852 | 101,048 | |||||
| Costs and estimated earnings in excess of billings on uncompleted contracts | 51,554 | 66,106 | |||||
| Inventories | 18,448 | 26,521 | |||||
| Income taxes receivable | 8,222 | 1,713 | |||||
| Deferred income taxes | 3,539 | 4,006 | |||||
| Prepaid expenses | 3,701 | 4,569 | |||||
| Other current assets | 463 | 2,457 | |||||
| Total Current Assets | 250,071 | 304,140 | |||||
| Property, plant and equipment, net | 139,420 | 144,977 | |||||
| Restricted cash | 9,747 | — | |||||
| Goodwill and intangible assets, net | 1,719 | 2,059 | |||||
| Other assets | 13,800 | 11,340 | |||||
| Deferred income taxes | 229 | — | |||||
| Total Assets | $ | 414,986 | $ | 462,516 | |||
| LIABILITIES AND STOCKHOLDERS' EQUITY | |||||||
| Current Liabilities: | |||||||
| Current maturities of long-term debt | $ | 400 | $ | 400 | |||
| Income taxes payable | 1,219 | 1,459 | |||||
| Accounts payable | 33,269 | 34,985 | |||||
| Accrued salaries, bonuses and commissions | 14,984 | 22,550 | |||||
| Billings in excess of costs and estimated earnings on uncompleted contracts | 26,166 | 43,974 | |||||
| Accrued product warranty | 3,174 | 4,639 | |||||
| Other accrued expenses | 5,860 | 8,212 | |||||
| Deferred credit ─ short term (Note E) | 507 | 2,029 | |||||
| Total Current Liabilities | 85,579 | 118,248 | |||||
| Long-term debt, net of current maturities | 1,600 | 2,000 | |||||
| Deferred compensation (Note I) | 5,314 | 4,840 | |||||
| Deferred income taxes | — | 138 | |||||
| Other long-term liabilities | 1,197 | 1,466 | |||||
| Deferred credit ─ long term (Note E) | — | 507 | |||||
| Total Liabilities | 93,690 | 127,199 | |||||
| Commitments and Contingencies (Note G) | |||||||
| Stockholders' Equity: | |||||||
| Preferred stock, par value $.01; 5,000,000 shares authorized; none issued | — | — | |||||
| Common stock, par value $.01; 30,000,000 shares authorized; 12,234,656 and 12,199,511 shares issued, respectively | 122 | 122 | |||||
| Additional paid-in capital | 54,329 | 52,003 | |||||
| Retained earnings | 310,598 | 331,959 | |||||
| Treasury stock, 806,018 shares at cost | (24,999 | ) | (24,999 | ) | |||
| Accumulated other comprehensive loss | (18,754 | ) | (23,768 | ) | |||
| Total Stockholders' Equity | 321,296 | 335,317 | |||||
| Total Liabilities and Stockholders' Equity | $ | 414,986 | $ | 462,516 | |||
The accompanying notes are an integral part of these consolidated financial statements.
32
POWELL INDUSTRIES, INC. AND SUBSIDIARIES
CONSOLIDATED STATEMENTS OF OPERATIONS
(In thousands, except per share data)
| Year Ended September 30, | Year Ended September 30, | |||||||||||||||||||||||||||
| 2017 | 2016 | 2015 | 2021 | 2020 | 2019 | |||||||||||||||||||||||
| Revenues | $ | 395,911 | $ | 565,243 | $ | 661,858 | Revenues | $ | 470,559 | $ | 518,499 | $ | 517,180 | |||||||||||||||
| Cost of goods sold | 345,142 | 459,038 | 553,597 | Cost of goods sold | 395,496 | 423,924 | 430,204 | |||||||||||||||||||||
| Gross profit | 50,769 | 106,205 | 108,261 | Gross profit | 75,063 | 94,575 | 86,976 | |||||||||||||||||||||
| Selling, general and administrative expenses | 61,524 | 74,924 | 76,801 | Selling, general and administrative expenses | 67,217 | 67,662 | 69,950 | |||||||||||||||||||||
| Research and development expenses | 6,906 | 6,731 | 6,980 | Research and development expenses | 6,670 | 6,265 | 6,327 | |||||||||||||||||||||
| Amortization of intangible assets | 355 | 352 | 435 | Amortization of intangible assets | 157 | 177 | 177 | |||||||||||||||||||||
| Restructuring and separation expenses | 1,322 | 8,441 | 3,397 | |||||||||||||||||||||||||
| Operating income (loss) | (19,338 | ) | 15,757 | 20,648 | ||||||||||||||||||||||||
| Insurance proceeds | Insurance proceeds | — | — | (950) | ||||||||||||||||||||||||
| Restructuring and other, net | Restructuring and other, net | — | 1,400 | 11 | ||||||||||||||||||||||||
| Operating income | Operating income | 1,019 | 19,071 | 11,461 | ||||||||||||||||||||||||
| Other income (See Note E) | (2,029 | ) | (2,029 | ) | (2,402 | ) | ||||||||||||||||||||||
| Other income | Other income | — | (506) | — | ||||||||||||||||||||||||
| Interest expense | 168 | 149 | 145 | Interest expense | 204 | 228 | 230 | |||||||||||||||||||||
| Interest income | (558 | ) | (156 | ) | (86 | ) | Interest income | (277) | (981) | (1,103) | ||||||||||||||||||
| Income (loss) before income taxes | (16,919 | ) | 17,793 | 22,991 | ||||||||||||||||||||||||
| Income tax provision (benefit) | (7,433 | ) | 2,283 | 13,552 | ||||||||||||||||||||||||
| Net income (loss) | $ | (9,486 | ) | $ | 15,510 | $ | 9,439 | |||||||||||||||||||||
| Income before income taxes | Income before income taxes | 1,092 | 20,330 | 12,334 | ||||||||||||||||||||||||
| Income tax provision | Income tax provision | 461 | 3,670 | 2,444 | ||||||||||||||||||||||||
| Net income | Net income | $ | 631 | $ | 16,660 | $ | 9,890 | |||||||||||||||||||||
| Earnings (loss) per share: | ||||||||||||||||||||||||||||
| Earnings per share: | Earnings per share: | |||||||||||||||||||||||||||
| Basic | $ | (0.83 | ) | $ | 1.36 | $ | 0.80 | Basic | $ | 0.05 | $ | 1.43 | $ | 0.85 | ||||||||||||||
| Diluted | $ | (0.83 | ) | $ | 1.36 | $ | 0.79 | Diluted | $ | 0.05 | $ | 1.42 | $ | 0.85 | ||||||||||||||
| Weighted average shares: | Weighted average shares: | |||||||||||||||||||||||||||
| Basic | 11,453 | 11,400 | 11,869 | Basic | 11,705 | 11,624 | 11,571 | |||||||||||||||||||||
| Diluted | 11,453 | 11,431 | 11,908 | Diluted | 11,789 | 11,693 | 11,634 | |||||||||||||||||||||
| Dividends per share | $ | 1.04 | $ | 1.04 | $ | 1.04 | Dividends per share | $ | 1.04 | $ | 1.04 | $ | 1.04 | |||||||||||||||