UNITED STATES
SECURITIES AND EXCHANGE COMMISSION
Washington, D.C. 20549
FORM 10-K
ANNUAL REPORT PURSUANT TO SECTION 13 OR 15(d)
OF THE SECURITIES EXCHANGE ACT OF 1934
For the fiscal year ended December 26, 202030, 2023
Commission File Number: 000-00981
PUBLIX SUPER MARKETS, INC.
(Exact name of Registrant as specified in its charter)
| | | | | | | | |
| Florida | | 59-0324412 |
| (State of incorporation) | | (I.R.S. Employer Identification No.) |
| 3300 Publix Corporate Parkway, Lakeland, Florida | | 33811 |
| (Address of principal executive offices) | | (Zip Code) |
(863) 688-1188
(Registrant’s telephone number, including area code)
Securities registered pursuant to Section 12(b) of the Act: None
Securities registered pursuant to Section 12(g) of the Act: Common Stock $1.00 Par Value
Indicate by check mark if the Registrant is a well-known seasoned issuer, as defined in Rule 405 of the Securities Act.
Yes No X
Indicate by check mark if the Registrant is not required to file reports pursuant to Section 13 or Section 15(d) of the Act.
Yes No X
Indicate by check mark whether the Registrant (1) has filed all reports required to be filed by Section 13 or 15(d) of the Securities Exchange Act of 1934 during the preceding 12 months and (2) has been subject to such filing requirements for the past 90 days. Yes X No
Indicate by check mark whether the Registrant has submitted electronically every Interactive Data File required to be submitted pursuant to Rule 405 of Regulation S-T during the preceding 12 months. Yes X No
Indicate by check mark whether the Registrant is a large accelerated filer, an accelerated filer, a non-accelerated filer, a smaller reporting company or an emerging growth company. See the definitions of “large accelerated filer,” “accelerated filer,” “smaller reporting company” and “emerging growth company” in Rule 12b-2 of the Exchange Act.
Large accelerated filer Accelerated filer Non-accelerated filer X
Smaller reporting company Emerging growth company
If an emerging growth company, indicate by check mark if the Registrant has elected not to use the extended transition period for complying with any new or revised financial accounting standards provided pursuant to Section 13(a) of the Exchange Act.
Indicate by check mark whether the Registrant has filed a report on and attestation to its management’s assessment of the effectiveness of its internal control over financial reporting under Section 404(b) of the Sarbanes-Oxley Act by the registered public accounting firm that prepared or issued its audit report.
If securities are registered pursuant to Section 12(b) of the Act, indicate by check mark whether the financial statements of the Registrant included in the filing reflect the correction of an error to previously issued financial statements.
Indicate by check mark whether any of those error corrections are restatements that required a recovery analysis of incentive-based compensation received by any of the Registrant’s executive officers during the relevant recovery period pursuant to Section 10D-1(b).
Indicate by check mark whether the Registrant is a shell company (as defined in Rule 12b-2 of the Act). Yes No X
The aggregate market value of the common stock held by non-affiliates of the Registrant was approximately $19,947,149,000$31,576,000,000 as of June 26, 2020,30, 2023, the last business day of the Registrant’s most recently completed second fiscal quarter.
The number of shares of the Registrant’s common stock outstanding as of February 2, 20216, 2024 was 689,647,000.3,289,000,000.
Documents Incorporated By Reference
The information required by Part III of this report, to the extent not set forth herein, is incorporated by reference from the Proxy Statement solicited for the 20212024 Annual Meeting of Stockholders to be held on April 13, 2021.16, 2024.
TABLE OF CONTENTS
| | | | | | | | | | | |
| | | |
| | | Page |
| | | |
| Item 1. | | | |
| Item 1A. | | | |
| Item 1B. | | | |
| Item 1C. | | | |
| Item 2. | | | |
| Item 3. | | | |
| Item 4. | | | |
| | | |
| | | |
| | | |
| Item 5. | | | |
| Item 6. | | | |
| Item 7. | | | |
| Item 7A. | | | |
| Item 8. | | | |
| Item 9. | | | |
| Item 9A. | | | |
| Item 9B. | | | |
| Item 9C. | | | |
| | | |
| | | |
| | | |
| Item 10. | | | |
| Item 11. | | | |
| Item 12. | | |
| Item 13. | | | |
| Item 14. | | | |
| | | |
| | | |
| | | |
| | | |
| Item 15. | | | |
| Item 16. | | | |
PART I
Item 1. Business
Publix Super Markets, Inc. and its wholly owned subsidiaries (Company) are in the business of operating retail food supermarkets in Florida, Georgia, Alabama, South Carolina, Tennessee, North Carolina Tennessee and Virginia. The Company opened its first supermarket in Kentucky in January 2024. The Company was founded in 1930 and later merged into another corporation that was originally incorporated in 1921. The Company has no other significant lines of business or industry segments.
Merchandising and manufacturing
The Company sells a variety of merchandise which includes grocery (including dairy, produce, floral, deli, bakery, meat and seafood), health and beauty care, general merchandise, pharmacy and other products and services. This merchandise includes nationally advertised and private label brands as well as unbranded products such as produce, meat and seafood. Private label items are produced in the Company’s dairy, bakery and deli manufacturing facilities or are manufactured for the Company by suppliers. The Company receives the food and nonfood products it sells from many sources. The Company believes its sources of supply for these products and the raw materials used in manufacturing are adequate for its needs and that it is not dependent upon a single supplier or relatively few suppliers. Merchandise is delivered to the supermarkets through Company distribution centers or directly from suppliers and is generally available in sufficient quantities to enable the Company to satisfy its customers. The cost of merchandise delivered to the supermarkets through the Company’s distribution centers is approximately 76%70% of the total product costs. The coronavirus pandemic has impactedSupply chain disruptions continue to impact the Company’s sources of supply product mix and the availability of certain products. However, the Company has generally been able to secure alternative sources of supply to serve the needs of its customers. The future impact of the coronavirus pandemicsupply chain disruptions on sources of supply product mix and customer demandthe availability of certain products is uncertain and difficult to predict.
Store operations
The Company operated 1,2641,360 supermarkets at the end of 2020,2023, compared with 1,2391,322 at the beginning of the year. In 2020, 392023, 45 supermarkets were opened (including nine13 replacement supermarkets) and 154120 supermarkets were remodeled. FourteenSeven supermarkets were closed during the period. The replacement supermarkets that opened in 20202023 replaced fourtwo supermarkets closed in 20202023 and five11 supermarkets closed in a previous period. Five supermarkets closed in 20202023 will be replaced on site in a subsequent period and five supermarkets will not be replaced.period. Net new supermarkets added 1.21.8 million square feet in 2020,2023, an increase of 2.1%3.0%. At the end of 2020,2023, the Company had 816859 supermarkets located in Florida, 191210 in Georgia, 7990 in Alabama, 6370 in South Carolina, 4957 in Tennessee, 54 in North Carolina 47 in Tennessee and 1920 in Virginia. Also, at the end of 2020,2023, the Company had 2026 supermarkets under construction in Florida, fourseven in Georgia, five in Alabama, three in Tennessee,Virginia, two in AlabamaTennessee, one in Kentucky, one in North Carolina and twoone in South Carolina.
Competition
The Company is engaged in the highly competitive retail food industry. The Company’s competitors include traditional supermarkets, such as national and regional supermarket chains and independent supermarkets, as well as nontraditional competitors, such as supercenters, membership warehouse clubs, mass merchandisers, dollar stores, drug stores, specialty food stores, restaurants, convenience stores and online retailers. The Company’s ability to attract and retain customers is based primarily on quality of goods and service, price, convenience, product mix and store location.
Working capital
The Company’s working capital at the end of 2020 consisted of $4,417.8 million in current assets and $4,366.8 million in current liabilities. Normal operating fluctuations in these balances can result in changes to cash flows from operating activities presented in the consolidated statements of cash flows that are not necessarily indicative of long-term operating trends. There are no unusual industry practices or requirements relating to working capital items.
Seasonality
The historical influx of winter residents to Florida and increased purchases of products during the traditional Thanksgiving, Christmas and Easter holidays typically result in seasonal sales increases from November to April of each year. However, the impact of the coronavirus pandemic on travel, tourism and consumer spending may affect the Company’s seasonal sales.
Human Capital Resourcescapital resources
Employee ownership
The Company is the largest employee-owned company in the U.S. with 227,000253,000 employees at the end of 2020.2023. The Company is dedicated to the dignity, value and employment security of its employees and recognizes they are its most important asset and primary competitive advantage. The Company considers its employee relations to be good.
Career development
The Company believes in promoting its employees from within and is committed to providing them with many opportunities for advancing their careers. Almost all of the Company’s employees in leadership positions began their Publix careers in entry level positions. Continuous on-the-job training plays an important role in helping employees develop the skills necessary to advance their careers. The Company also offers tuition reimbursement designed to encourage and assist eligible employees in continuing their education. Additionally, the Company invests in the development of its employees through training and leadership development programs to support their career advancement.
Community involvement
An important part of the Company’s culture is a commitment to community involvement. In 2015, the Company launched its Publix Serves community program. Through this program, employees volunteer with local nonprofit organizations focused on hunger alleviation and environmental sustainability. The Company holds two Publix Serves weeks annually. During each of the weeks in 2023, more than 7,500 employees volunteered their time at over 200 nonprofit organizations to support projects that helped alleviate hunger and protect and preserve our environment.
In 2009, the Company launched a perishable recovery program to provide nourishing meals for those in need and reduce food waste. The Company’s employees support this program’s efforts by gathering perishable products that are wholesome, but no longer salable, and donating them to food banks and other nonprofit organizations. Since the program launched, the Company has donated over 1.1 billion meals to food banks and other nonprofit organizations.
Additionally, the coronavirus pandemic and adverse economic conditions created an increased need for efforts focused on alleviating hunger. In 2020, the Company launched an initiative to purchase produce and milk from local farmers and deliver the products to food banks for those in need. In 2021, the Company extended this commitment by implementing its Feeding More Together program. Through this program, customer donations during register campaigns provide shelf-stable and perishable products for local food banks. In addition, the Company contributes $10 million each year to purchase produce from farmers and deliver it to the local food banks. As a result, the Company has donated more than 86 million pounds of produce as part of its initiative to support farmers and local food banks. The Company and its employees are also involved in many other community activities and programs in the areas it serves.
Intellectual property
The Company’s trademarks, trade names, copyrights and similar intellectual property are important to the success of the Company’s business. Numerous trademarks, including “Publix” and “Where Shopping is a Pleasure,” have been registered with the U.S. Patent and Trademark Office. Due to the importance of its intellectual property to its business, the Company actively defends and enforces its rights to such property.
Government regulation
The Company is subject to federal, state and local laws and regulations, including environmental laws and regulations that govern activities that may have adverse environmental effects and impose liabilities for the costs of contamination cleanup and damages arising from sites of past spills, disposals or other releases of hazardous materials. The Company may be held responsible for the remediation of environmental conditions regardless of whether the Company leases, subleases or owns the supermarkets or other facilities and regardless of whether such environmental conditions were created by the Company or a prior owner or tenant. In addition to environmental laws and regulations, the Company is subject to federal, state and local laws and regulations relating to, among other things, product labeling and safety, zoning, land use, workplace safety, public health, accessibility and restrictions on the sale of various products, including alcoholic beverages, tobacco and drugs. The Company is also subject to laws and regulations governing its relationship with employees, including minimum wage requirements, overtime, working conditions, disabled access and work permit requirements. Compliance with these laws and regulations had no material effect on capital expenditures, results of operations or the competitive position of the Company.
Company information
The Company’s Annual Reports on Form 10-K, Proxy Statements, Quarterly Reports on Form 10-Q, Current Reports on Form 8-K and any amendments to those reports may be obtained electronically, free of charge, through the Company’s website at corporate.publix.com/stock.
Item 1A. Risk Factors
In addition to the other information contained in this Annual Report on Form 10-K (Annual Report), the following risk factors should be considered carefully in evaluating the Company’s business. The Company’s financial condition and results of operations could be materially and adversely affected by any of these risks.
Industry and Economic Risks
Unfavorable impacts of the coronavirus pandemic or any future public health crisis on operations, customers, employees, suppliers and tenants could adversely affect the Company.
On March 13, 2020, the coronavirus pandemic was declared a national emergency. The coronavirus pandemic resulted in national, state and local authorities mandating or recommending isolation and other preventative measures for large portions of the population, including mandatory business restrictions and closures. These measures, which were necessary to slow the spread of the virus and protect lives, resulted in significant job losses and are expected to continue to have serious adverse impacts on domestic and foreign economies for an unknown length of time. The effects of economic stabilization efforts, including government payments to affected citizens and industries, remains uncertain.
The Company’s operations may be adversely impacted by the fear of exposure to or actual effects of the coronavirus. These impacts include:
•operating cost increases due to changes in customer demand, changes in supermarket processes or increased government regulation;
•delays in the timing of remodels and opening new supermarkets;
•reduced workforce due to illness, quarantine or government mandates impacting the Company’s supermarket, distribution, manufacturing and support operations;
•temporary supermarket closings or reduced hours of operation due to reduced workforce, enhanced cleaning processes, increased stocking or government mandates;
•supply chain risks from goods produced in areas of significant coronavirus outbreak or disruption from suppliers due to financial or operational difficulties;
•reduction in travel, tourism or consumer spending due to government recommendations or mandates, fear of exposure to the coronavirus or adverse economic conditions;
•changes in customer demand from discretionary or higher priced products to lower priced products; or
•uncertainty as to future operations of tenants in Company owned shopping centers due to adverse economic conditions.
The extent to which the coronavirus pandemic will continue to impact the Company will depend on future developments, which remain highly uncertain and difficult to predict, including the scope, severity and duration of the pandemic, the speed and effectiveness of the vaccine and treatment development and delivery, the direct and indirect economic effects of the pandemic and potential changes in consumer behavior, among others. The future impact of the coronavirus pandemic could adversely affect the Company’s financial condition and results of operations.operations could also be affected by additional factors that are not presently known to the Company or that the Company currently considers not to be material. This list should not be considered a complete list of all risks and uncertainties.
Industry and Economic Risks
Increased competition could adversely affect the Company.
The Company is engaged in the highly competitive retail food industry. The Company’s competitors include traditional supermarkets, such as national and regional supermarket chains and independent supermarkets, as well as nontraditional competitors, such as supercenters, membership warehouse clubs, mass merchandisers, dollar stores, drug stores, specialty food
stores, restaurants, convenience stores and online retailers. There has been a trend for traditional supermarkets to lose market share to nontraditional competitors. The Company’s ability to attract and retain customers is based primarily on quality of goods and service, price, convenience, product mix and store location. The Company believes it will face increased competition in the future from existing and potentially new competitors. The impact of pricing, purchasing, advertising or promotional decisions made by its competitors as well as competitor format innovation, and location additions and changes in service offerings could adversely affect the Company’s financial condition and results of operations.
Adverse economic and other conditions that impact consumer spending could adversely affect the Company.
The Company’s results of operations are sensitive to changes in general economic conditions that impact consumer spending. Adverse economic conditions, including inflation, high unemployment, home foreclosures and weakness in the housing market, declines in the stock market and the instability of the credit markets, could cause a reduction in consumer spending. Other conditions that could reduce consumer spending include increases in tax, interest and inflation rates,rates; increases in housing costs; increases in fuel and energy costs,costs; increases in health care costs,costs; the impact of natural disasters, public health crises, international conflicts or acts of terrorism,terrorism; and other factors. Reductions in the level of consumer spending could cause changes in customer demand from discretionary or higher priced products to lower priced products or shift spending to lower priced competitors, which could adversely affect the Company’s financial condition and results of operations.
Events beyond the Company’s control, such as natural disasters, public health crises, political crises or other catastrophic events could adversely affect the Company.
The Company’s operations, or those of its suppliers, could be negatively impacted by various events beyond the Company’s control, including natural disasters, such as hurricanes, tornadoes, floods, fires, earthquakes, extreme cold and heat events and other adverse weather conditions; public health crises, such as pandemics and epidemics; and political crises, such as attacks, war, unrest and other political instability. These events could disrupt the Company’s operations and supply chain or negatively impact consumer spending, which could adversely affect the Company’s financial condition and results of operations.
Business and Operational Risks
Increased operating costs could adversely affect the Company.
The Company’s operations tend to be more labor intensive than some of its competitors primarily due to the additional customer service offered in its supermarkets. Consequently, uncertain labor markets, mandated increases in the minimum wage or other benefits, increased wage rates by retailers and other labor market competitors, an increased proportion of full-time employees, increased costs of health care due to health insurance reform or other factors could result in increased labor costs and disproportionately impact the Company in comparison to some of its competitors. The inability to improve or manage operating costs, including labor, distribution, facilities or other non-product related costs, could adversely affect the Company’s financial condition and results of operations.
Risks associated with the Company’s suppliers could adversely affect the Company.
The Company’s operations are dependent on suppliers to obtain products, raw materials and services. Adverse conditions, such as natural disasters or public health crises, the financial stability of suppliers, suppliers’ ability to meet Company standards, labor supply issues experienced by suppliers, the availability or cost of products, raw materials and services, the availability or cost of transporting products and raw materials and other factors relating to suppliers are beyond the Company’s control. Such supply chain risks could impact the Company’s ability to obtain the products, raw materials and services necessary to serve the needs of its customers. Supply chain disruptions could also cause delays in the timing of remodels and opening of new supermarkets. Significant supply chain disruptions resulting from such supply chain risks could adversely affect the Company’s financial condition and results of operations.
Failure to execute the Company’s core strategies could adversely affect the Company.
The Company’s core strategies focus on customer service, product quality, shopping environment, competitive pricing and convenient locations.customer convenience. The Company has implemented several strategic business and technology initiatives as part of the execution of these core strategies. The Company believes these core strategies and related strategic initiatives differentiate it from its competition and present opportunities for sustained market share and financial growth. Failure to execute these core strategies, or failure to execute the core strategies in a cost effective manner, could adversely affect the Company’s financial condition and results of operations.
Failure to identify and obtain or retain suitable supermarket sites could adversely affect the Company.
The Company’s ability to obtain sites for new supermarkets is dependent on identifying and entering into lease or purchase agreements on commercially reasonable terms for properties that are suitable for its needs. If the Company fails to identify suitable sites and enter into lease or purchase agreements on a timely basis for any reason, including competition from other companies seeking similar sites, the Company’s growth could be adversely affected because it may be unable to open new supermarkets as anticipated. Similarly, the Company could be adversely affected if it is unableFailure to obtain new sites or retain existing sites for its existing leased supermarkets on commercially reasonable terms.terms could adversely affect the Company’s financial condition and results of operations.
Information Security and Technology Risks
Failure by the Company or the Company’s third party service providers to maintainprotect the privacyconfidential information within the Company’s sites, networks, systems, platforms and assets against cyber attacks, data breaches, other security of confidential customer and business information and the resulting unfavorable publicityincidents or loss could adversely affect the Company.
The Company receives, retains and transmits confidential information about its customers, employees and suppliers and entrusts certain of that information to third party service providers. The Company depends upon the secure transmission of confidential information, including customer payments, over external networks. Additionally,Like many businesses, despite the use of individually identifiable data byCompany’s efforts to defend against cybersecurity threats, the Company and its third party service providers iswill continue to be subject to federal, statecybersecurity threats, such as attempts to compromise and local laws and regulations.penetrate the Company’s information technology systems. Although the Company has continuously invested in its information technology systems and implemented policies and procedurespractices to protect its confidential information, there is no assurance that the Company will successfully anticipate, detect, prevent or defend against an intrusion into or compromise of the Company’s information technology systems or those of its third party service providers.
An intrusion into or compromise of the Company’s information technology systems, or those of its third party service providers, that results in customer, employee or supplier information being obtained by unauthorized persons could adversely affect the Company’s reputation with existing and potential customers, employees and others. Such an intrusion or compromise could require expending significant resources related to remediation, lead to legal proceedings and regulatory actions, result in a disruption of operations and adversely affect the Company’s financial condition and results of operations.
Additionally, the use of individually identifiable data by the Company and its third party service providers is subject to federal, state and local laws and regulations. Any compromise or breach of the Company’s information technology systems, or those of the Company’s third party service providers, could violate applicable privacy, data security and other laws and regulations.Disruptions in information technology systems could adversely affect the Company.
The Company is dependent on complex information technology systems to operate its business, enhance customer service, improve the efficiency of its supply chain and increase employee efficiency. Certain of these information technology systems are hosted by third party service providers. The Company’s information technology systems, as well as those of the Company’s third party service providers, are subject to damage or interruption from power outages, computer and telecommunication failures, computer viruses, cyber attacks or other malicious service disruptions, catastrophic events and user errors. Significant disruptions in the information technology systems of the Company or its third party service providers could impact the Company’s business operations and adversely affect the Company’s financial condition and results of operations.
Self-insuredSelf-Insured Claims and Product Liability Risks
Changes in the factors affecting self-insured claims could adversely affect the Company.
Claims related to health care, employee benefits, workers’ compensation, general liability, property, plant and equipment, fleet liability and directors and officers liability are generally self-insured. The Company uses third party insurance in certain instances to partially mitigate the risk related to these potential losses. While the Company estimates its exposure for these claims and establishes reserves for the estimated liabilities, the actual liabilities could be in excess of these reserves. In addition, the frequency or severity of claims, litigation trends, benefit level changes, or catastrophic events involving property, plant and equipment losses could adversely affect the Company’s financial condition and results of operations.
Product liability claims and lawsuits, product recalls and the resulting unfavorable publicity could adversely affect the Company.
The distribution and sale of grocery, drug and other products purchased from suppliers or manufactured by the Company entails an inherent risk of product liability claims and lawsuits, product recalls and the resulting adverse publicity. Such products may contain contaminants and may be inadvertently sold by the Company. These contaminants may, in certain cases, result in illness, injury or death if processing at the consumer level, if applicable, does not eliminate the contaminants. Sale of contaminated products, even if inadvertent, may be a violation of law and may lead to a product recall and/or an increased risk of exposure to product liability claims asserted against the Company. Some of the Company’s agreements with suppliers may not indemnify the Company from product liability and suppliers may not have sufficient resources or insurance to satisfy their obligations. The Company is subject from time to time to various lawsuits, claims and charges arising in the normal course of business. Litigation is inherently unpredictable. Any claims against the Company, whether meritorious or not, could result in costly litigation that could adversely affect the Company’s business. If a product liability claim is successful and the Company does not have contractual indemnification or insurance available, the claimsuch claims could have an adverse effect on the Company’s financial condition and results of operations. In addition, even if a product liability claim is not successful or is not fully pursued, the adverse publicity surrounding any assertion that the Company’s products caused illness or injury could have an adverse effect on the Company’s reputation with existing and potential customers and on the Company’s financial condition and results of operations.
Legal and Regulatory Risks
Unfavorable changes in, failure to comply with or increased costs of complying with environmental laws and regulations could adversely affect the Company.
The Company is subject to federal, state and local laws and regulations that govern activities that may have adverse environmental effects and impose liabilities for the costs of contamination cleanup and damages arising from sites of past spills, disposals or other releases of hazardous materials. Under current environmental laws and regulations, the Company may be held responsible for the remediation of environmental conditions regardless of whether the Company leases, subleases or owns the supermarkets or other facilities and regardless of whether such environmental conditions were created by the Company or a prior owner or tenant. Environmental conditions relating to prior, existing or future sites may result in substantial remediation costs, business interruption or adverse publicity which could adversely affect the Company’s financial condition and results of operations. In addition, the increased focus on climate change, waste management and other environmental issues may result in new environmental laws or regulations that could result in increased compliance costs to the Company, directly or indirectly through its suppliers, which could adversely affect the Company’s financial condition and results of operations.
Unfavorable changes in, failure to comply with or increased costs of complying with laws and regulations could adversely affect the Company.
In addition to environmental laws and regulations, the Company is subject to federal, state and local laws and regulations relating to, among other things, product labeling and safety, zoning, land use, workplace safety, public health, accessibility and restrictions on the sale of various products, including alcoholic beverages, tobacco and drugs. The Company is also subject to laws and regulations governing its relationship with employees, including minimum wage requirements, overtime, working conditions, disabled access and work permit requirements. Increased costs of complying with existing, new or changes in laws and regulations could adversely affect the Company’s financial condition and results of operations.
Unfavorable results of legal proceedings could adversely affect the Company.
The Company is subject from time to time to various lawsuits, claims and charges arising in the normal course of business, including employment, personal injury, commercial and other matters. Some lawsuits also contain class action allegations. Litigation is inherently unpredictable. Any claims against the Company, whether meritorious or not, could result in costly litigation that could adversely affect the Company’s business. The Company estimates its exposure to these legal proceedings and establishes reserves for the estimated liabilities. Assessing and predicting the outcome of these matters involves substantial uncertainties. Differences in actual outcomes, or changes in the Company’s assessment and predictions of the outcomes, could adversely affect the Company’s financial condition and results of operations.
Item 1B. Unresolved Staff Comments
NoneNot applicable
Item 1C. Cybersecurity
The Company’s information technology systems, as well as those of the Company’s third party service providers, are subject to cybersecurity threats. Significant cybersecurity threats, including intrusions into, compromises of or disruptions in the information technology systems of the Company or its third party service providers, could adversely affect the Company’s financial condition and results of operations. The Company maintains and updates its information technology systems to mitigate the risk of cybersecurity threats.
The Board of Directors and Audit Committee have oversight responsibility for the Company’s cybersecurity risks. While the Company’s employees play a key role in cybersecurity, the Company’s Chief Information Officer, General Counsel and other members of management have shared responsibility for assessing and managing the Company’s cybersecurity risks. The Company’s management has sufficient knowledge, experience and expertise for assessing and managing the Company’s cybersecurity risks. The Board of Directors and Audit Committee receive updates from management regarding cybersecurity risks, cybersecurity threats that could impact the Company and cybersecurity initiatives to enhance the Company’s cybersecurity practices. The Audit Committee also receives updates on the results of assessments and audits of the Company’s information technology systems and controls.
The Company has information technology security practices to protect its information technology systems and data and to monitor for potential cybersecurity threats. These practices are integrated into the Company’s risk management framework and include:
•cybersecurity controls embedded in the Company’s information technology systems;
•implementation of changes to address potential threats and vulnerabilities of the Company’s information technology systems;
•incident response program, including proactive simulations, to identify and manage cybersecurity threats, risks or incidents;
•participation in industry forums and collaboration with peers; and
•security awareness and data protection training for applicable employees.
Additionally, the Company assesses and manages cybersecurity threats associated with its third party service providers’ information technology systems that could compromise the Company’s information security or data. Identified cybersecurity threats are communicated to management for review, response and mitigation as appropriate.
The Company assesses cybersecurity risks and changes in the cyber environment and adjusts its practices as deemed appropriate. To date, risks from cybersecurity threats have not materially affected, or are not reasonably likely to materially affect, the Company’s business strategy, financial condition or results of operations. Refer to Item 1A. Risk Factors in this Annual Report for additional information on risks related to the Company’s business, including cybersecurity risks.
Item 2. Properties
At year end, the Company operated 59.664.1 million square feet of supermarket space. The Company’s supermarkets vary in size. Current supermarket prototypes range from 31,00032,000 to 55,00062,000 square feet. Supermarkets are often located in shopping centers where the Company is the anchor tenant. The majority of the Company’s supermarkets are leased. Initial lease terms are typically 20 years followed by five year renewal options. Both the building and land are owned at 361412 locations. The building is owned while the land is leased at 7978 other locations.
The Company supplies its supermarkets from nine10 primary distribution centers located in Lakeland, Miami, Jacksonville, Sarasota, Orlando, Deerfield Beach and Boynton Beach, Florida, Lawrenceville, Georgia, and McCalla, Alabama. A new distribution center is currently under construction inAlabama and Greensboro, North Carolina. The Company operates six manufacturing facilities, including three dairy plants located in Lakeland and Deerfield Beach, Florida and Lawrenceville, Georgia, two bakery plants located in Lakeland, Florida and Atlanta, Georgia and a deli plant located in Lakeland, Florida. The Company also operates two prepared foods facilities in Lakeland and Deerfield Beach, Florida.
The Company’s corporate offices, primary distribution centers and manufacturing facilities are owned with no outstanding debt. The Company’s properties are well maintained, in good operating condition and suitable for operating its business.
Item 3. Legal Proceedings
The Company is subject from time to time to various lawsuits, claims and charges arising in the normal course of business. The Company believes its recorded reserves are adequate in light of the probable and estimable liabilities. The estimated amount of reasonably possible losses for lawsuits, claims and charges, individually and in the aggregate, is considered to be immaterial. In the opinion of management, the ultimate resolution of these legal proceedings will not have a material adverse effect on the Company’s financial condition, results of operations or cash flows.
Item 4. Mine Safety Disclosures
Not applicable
PART II
Item 5. Market for the Registrant’s Common Equity, Related Stockholder Matters and Issuer Purchases of Equity Securities
(a)Market Information
The Company’s common stock is not traded on an established securities market. Substantially all transactions of the Company’s common stock have been among the Company, its employees, former employees, their families and the retirement plans established for the Company’s employees. Common stock is made available for sale by the Company only to its current employees and members of its Board of Directors through the Employee Stock Purchase Plan (ESPP) and Non-Employee Directors Stock Purchase Plan (Directors Plan) and to participants of the 401(k) Plan. In addition, common stock is provided to employees through the Employee Stock Ownership Plan (ESOP). The Company currently repurchases common stock subject to certain terms and conditions. The ESPP, Directors Plan, 401(k) Plan and ESOP each contain provisions prohibiting any transfer for value without the owner first offering the common stock to the Company. The Company serves as the registrar and stock transfer agent for its common stock.
Because there is no trading of the Company’s common stock on an established securities market, the market price of the Company’s common stock is determined by its Board of Directors. As part of the process to determine the market price, an independent valuation is obtained. The process includes comparing the Company’s financial results to those of comparable companies that are publicly traded (comparable publicly traded companies). The purpose of the process is to determine a value for the Company’s common stock that is comparable to the stock value of comparable publicly traded companies by considering both the results of the stock market and the relative financial results of comparable publicly traded companies.
TheFollowing are the market prices for the Company’s common stock for 20202023 and 2019 were as follows:2022:
| | 2020 | | 2019 |
| | 2023 | | | | 2023 | | | 2022 (1) |
| January - February | January - February | | $ | 47.10 | | | 42.70 | |
| March - April | March - April | | 48.90 | | | 42.85 | |
| March - April | |
| March - April | |
| May - July | |
| May - July | |
| May - July | May - July | | 50.10 | | | 44.75 | |
| August - October | August - October | | 54.35 | | | 44.10 | |
| August - October | |
| August - October | |
| November - December | November - December | | 57.95 | | | 47.10 | |
| November - December | |
| November - December | |
(b)Approximate Number of Equity Security Holders
As of February 2, 2021,6, 2024, the approximate number of holders of record of the Company’s common stock was 205,000.235,000.
(c)Dividends
The Company paidFollowing are the quarterly dividends per share paid by the Company on its common stock in 20202023 and 2019 as follows:2022:
| | Quarter | Quarter | | 2020 | | 2019 | Quarter | | 2023 | | | 2022 (1) |
| First | First | | $ | 0.30 | | | 0.26 | |
| Second | Second | | 0.32 | | | 0.30 | |
| Second | |
| Second | |
| Third | |
| Third | |
| Third | Third | | 0.32 | | | 0.30 | |
| Fourth | Fourth | | 0.32 | | | 0.30 | |
| $ | 1.26 | | | 1.16 | |
| Fourth | |
| Fourth | |
| | $ | |
| | $ | |
| | $ | |
Payment of dividends is within the discretion of the Board of Directors and depends on, among other factors, net earnings, capital requirements and the financial condition of the Company. However, the Company intends to continue to pay comparable dividends to stockholders in the future.
____________________________
(1)Retroactively adjusted to give effect to the 5-for-1 stock split in April 2022. For a more detailed description, refer to Note 1(m) Stock Split in the Notes to Consolidated Financial Statements.
(d)Purchases of Equity Securities by the Issuer
Issuer Purchases of Equity Securities
SharesFollowing are the shares of common stock repurchased by the Company during the three months ended December 26, 2020 were as follows30, 2023 (amounts are in thousands,millions, except per share amounts):
| | | | | | | | | | | | | | | | | | | | | | | | | | | | | | | | | | | | | | | | | |
| Period | | Total Number of Shares Purchased | | Average Price Paid per Share | | Total Number of Shares Purchased as Part of Publicly Announced Plans or Programs (1) | | Approximate Dollar Value of Shares That May Yet Be Purchased Under the Plans or Programs (1) |
| October 1 - November 4, 2023 | | | 8 | | | | | $ | 14.89 | | | | N/A | | N/A |
| November 5 - December 2, 2023 | | | 5 | | | | | | 15.10 | | | | N/A | | N/A |
| December 3 - December 30, 2023 | | | 4 | | | | | | 15.10 | | | | N/A | | N/A |
| Total | | | 17 | | | | | $ | 15.00 | | | | N/A | | N/A |
| | | | | | | | | | | | | | | | | | | | | | | | | | | | | | | | | | | | | | | | | |
| Period | | Total Number of Shares Purchased | | Average Price Paid per Share | | Total Number of Shares Purchased as Part of Publicly Announced Plans or Programs (1) | | Approximate Dollar Value of Shares That May Yet Be Purchased Under the Plans or Programs (1) |
| September 27 - October 31, 2020 | | | 903 | | | | | $ | 54.35 | | | | N/A | | N/A |
| November 1 - November 28, 2020 | | | 3,736 | | | | | | 57.95 | | | | N/A | | N/A |
| November 29 - December 26, 2020 | | | 1,443 | | | | | | 57.95 | | | | N/A | | N/A |
| Total | | | 6,082 | | | | | $ | 57.42 | | | | N/A | | N/A |
____________________________
(1)Common stock is made available for sale by the Company only to its current employees and members of its Board of Directors through the ESPP and Directors Plan and to participants of the 401(k) Plan. In addition, common stock is provided to employees through the ESOP. The Company currently repurchases common stock subject to certain terms and conditions. The ESPP, Directors Plan, 401(k) Plan and ESOP each contain provisions prohibiting any transfer for value without the owner first offering the common stock to the Company.
The Company’s common stock is not traded on an established securities market. The amount of common stock offered to the Company for repurchase is not within the control of the Company, but is at the discretion of the stockholders. The Company does not believe that these repurchases of its common stock are within the scope of a publicly announced plan or program (although the terms of the plans discussed above have been communicated to the participants). Thus, the Company does not believe that it has made any repurchases during the three months ended December 26, 202030, 2023 required to be disclosed in the last two columns of the table.
(e)Performance Graph
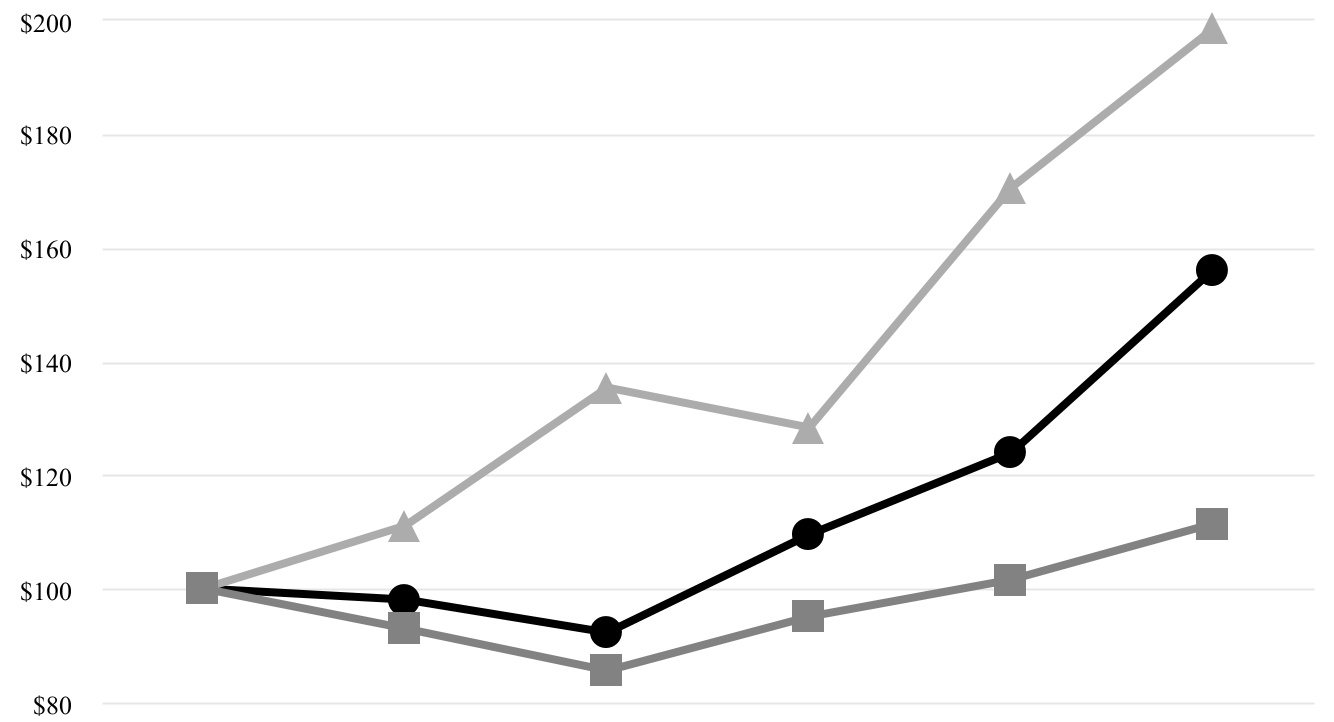
The following performance graph sets forth the Company’s cumulative total stockholder return during the five years ended December 26, 2020,30, 2023, compared to the cumulative total return on the S&P 500 Index and a custom Peer Group Index including retail food supermarket companies.(1) The Peer Group Index is weighted based on the various companies’ market capitalization. The comparison assumes $100 was invested at the end of 20152018 in the Company’s common stock and in each of the related indices and assumes reinvestment of dividends.
The Company’s common stock is valued as of the end of each fiscal quarter. After the end of a quarter, however, shares continue to be traded at the prior valuation until the new valuation is received. The cumulative total return for the companies represented in the S&P 500 Index and the custom Peer Group Index is based on those companies’ trading price as of the Company’s fiscal year end. The following performance graph is based on the Company’s trading price at fiscal year end based on its market price as of the prior fiscal quarter. For comparative purposes, a performance graph based on the Company’s fiscal year end valuation (market price as of March 1, 2021)2024) is provided in the 20212024 Proxy Statement. Past stock performance shown below is no guarantee of future performance.
Comparison of Five Year Cumulative Return Based Upon Fiscal Year End Trading Price
| | | | | | | | | | | | | | | | | | | | | | | | | | | | | | | | | | | | | | | | | |
| | 2015 | | 2016 | | 2017 | | 2018 | | 2019 | | 2020 | |
| Publix | $100.00 | | | 98.04 | | | 92.15 | | | 109.41 | | | 123.82 | | | 156.02 | | |
| S&P 500 | 100.00 | | | 111.07 | | | 135.32 | | | 128.28 | | | 170.57 | | | 198.54 | | |
| Peer Group (1) | 100.00 | | | 92.99 | | | 85.62 | | | 95.06 | | | 101.63 | | | 111.48 | | |
| | | | | | | | | | | | | | | | | | | | | | | | | | | | | | | | | | | | | | | | | |
| | 2018 | | 2019 | | 2020 | | 2021 | | 2022 | | 2023 | |
| Publix | $100.00 | | | 113.17 | | | 142.60 | | | 167.15 | | | 170.16 | | | 200.04 | | |
| S&P 500 | 100.00 | | | 132.97 | | | 154.78 | | | 200.35 | | | 165.49 | | | 209.00 | | |
| Peer Group (1) | 100.00 | | | 106.92 | | | 117.27 | | | 166.91 | | | 164.65 | | | 170.76 | | |
_______________________________________________________
(1)Companies included in the Peer Group are Ahold Delhaize, Albertsons, Kroger and Weis Markets. Albertsons is included in the Peer Group for 2021 ‑ 2023 due to its initial public offering in 2020.
Item 6. Selected Financial Data
| | | | | | | | | | | | | | | | | | | | | | | | | | | | | | | | | | | | | | | | | | | | | | | | | | | | | | | | | | | | | | |
| 2020 | | 2019 | | 2018 | | 2017 | | 2016 (1) | |
| (Amounts are in thousands, except per share amounts, ratios and number of supermarkets) | | | |
| Sales: | | | | | | | | | | | | | | | | | | | | |
| Sales | $ | 44,863,507 | | 38,116,402 | | | 36,093,907 | | | 34,558,286 | | | 33,999,921 | | |
| Percent change | 17.7 | % | | | 5.6 | % | | | | 4.4 | % | | | | 1.6 | % | | | | 5.1 | % | | | |
| Comparable store sales percent change | 16.0 | % | | | 3.6 | % | | | | 2.1 | % | | | | 1.7 | % | | | | 1.9 | % | | | |
| Earnings: | | | | | | | | | | | | | | | | | | | | |
Gross profit (2) | $ | 12,508,901 | | 10,375,933 | | | 9,782,516 | | | 9,428,569 | | | 9,265,616 | | |
| Earnings before income tax expense | $ | 5,036,655 | | 3,785,986 | | | 2,920,968 | | | 3,027,506 | | | 2,940,376 | | |
| Net earnings | $ | 3,971,838 | | 3,005,395 | | | 2,381,167 | | | 2,291,894 (3) | | 2,025,688 | | |
| Net earnings as a percent of sales | 8.9 | % | | | 7.9 | % | | | | 6.6 | % | | | | 6.6% (3) | | 6.0 | % | | | |
| Common stock: | | | | | | | | | | | | | | | | | | | | |
| Weighted average shares outstanding | 700,587 | | 713,535 | | | 726,407 | | | 753,483 | | | 769,267 | | |
| Earnings per share | $ | 5.67 | | 4.21 | | | 3.28 | | | 3.04 (3) | | 2.63 | | |
| Dividends per share | $ | 1.26 | | 1.16 | | | 1.01 | | | 0.9125 | | | 0.8675 | | |
| Financial data: | | | | | | | | | | | | | | | | | | | | |
| Capital expenditures | $ | 1,228,387 | | 1,141,118 | | | 1,350,089 | | | 1,429,059 | | | 1,443,827 | | |
| Working capital | $ | 50,952 | | 226,886 (4) | | 804,641 | | | 942,607 | | | 1,574,464 | | |
| Current ratio | 1.01 | | 1.06 (4) | | 1.27 | | | 1.30 | | | 1.53 | | |
| Total assets | $ | 28,094,077 | | 24,507,120 (4) | | 18,982,516 | | | 18,183,506 | | | 17,386,458 | | |
| Long-term obligations (including current portion) | $ | 3,365,955 | | 3,244,572 (4) | | 167,665 | | | 193,074 | | | 250,584 | | |
| Common stock related to ESOP | $ | 3,484,549 | | 3,259,230 | | | 3,134,999 | | | 3,053,138 | | | 3,068,097 | | |
| Total equity | $ | 19,285,864 | | 16,901,344 | | | 14,994,664 | | | 14,108,619 | | | 13,497,437 | | |
| Supermarkets | 1,264 | | 1,239 | | | 1,211 | | | 1,167 | | | 1,136 | | |
| | | | | | | | | | |
Non-GAAP Financial Measures: (5) | | | | | | | | | | |
| Net earnings excluding impact of fair value adjustment | $ | 3,689,204 | | 2,615,572 | | | 2,517,493 | | | N/A | | N/A | |
| Net earnings as a percent of sales excluding impact of fair value adjustment | 8.2 | % | | | 6.9 | % | | | | 7.0 | % | | | | N/A | | N/A | |
| Earnings per share excluding impact of fair value adjustment | $ | 5.27 | | 3.67 | | | 3.47 | | | N/A | | N/A | |
___________________________
(1)Fiscal year 2016 includes 53 weeks. All other years include 52 weeks.
(2)Gross profit represents sales less cost of merchandise sold as reported in the consolidated statements of earnings.
(3)During 2017, the Company recorded the remeasurement of deferred income taxes due to the Tax Cuts and Jobs Act of 2017 (Tax Act). Excluding the impact of the Tax Act, net earnings would have been $2,067,699,000 or $2.74 per share and 6.0% as a percent of sales.
(4)In 2019, the Company adopted the Accounting Standards Update requiring the lease rights and obligations arising from existing and new lease agreements be recognized as assets and liabilities on the balance sheet.
(5)In addition to reporting financial results in accordance with U.S. generally accepted accounting principles (GAAP), the Company presents net earnings and earnings per share excluding the impact of equity securities being measured at fair value with net unrealized gains and losses from changes in the fair value recognized in earnings (fair value adjustment). For a more detailed description of these measures, refer to Non-GAAP Financial Measures in Item 7, Management’s Discussion and Analysis of Financial Condition and Results of Operations.
Item 7. Management’s Discussion and Analysis of Financial Condition and Results of Operations
The objective of this section is to provide a summary of material information relevant to enhancing the stockholders’ understanding of the financial condition and results of operations of the Company. Following is an analysis of the financial condition and results of operations of the Company for 2023 and 2022 as compared with the previous years. This information should be read in conjunction with the Company’s consolidated financial statements and accompanying notes.
On April 1, 2022, the Company filed Articles of Amendment to its Restated Articles of Incorporation in order to effect a 5‑for‑1 stock split of the Company’s common stock, effective as of the close of business April 14, 2022. All applicable data, including share and per share amounts, have been retroactively adjusted to give effect to the stock split.
Overview
The Company is engaged in the retail food industry, operating supermarkets in Florida, Georgia, Alabama, South Carolina, Tennessee, North Carolina Tennessee and Virginia. The Company opened its first supermarket in Kentucky in January 2024. The Company has no other significant lines of business or industry segments. As of December 26, 2020,30, 2023, the Company operated 1,2641,360 supermarkets including 816 located859 in Florida, 191210 in Georgia, 7990 in Alabama, 6370 in South Carolina, 4957 in Tennessee, 54 in North Carolina 47 in Tennessee and 1920 in Virginia. In 2020, 392023, 45 supermarkets were opened (including nine13 replacement supermarkets) and 154120 supermarkets were remodeled. During 2020,2023, the Company opened 2123 supermarkets in Florida, five10 in Georgia, four in Alabama, three in North Carolina, four in Virginia, three in Alabama, onetwo in South Carolina, two in Tennessee and one in Tennessee. FourteenVirginia. Seven supermarkets were closed during the period. The replacement supermarkets that opened in 20202023 replaced fourtwo supermarkets closed in 20202023 and five11 supermarkets closed in a previous period. Five supermarkets closed in 20202023 will be replaced on site in a subsequent period and five supermarkets will not be replaced.period. In the normal course of operations, the Company replaces supermarkets and closes supermarkets that are not meeting performance expectations. The impact of future supermarket closings is not expected to be material.
The Company sells a variety of merchandise to generate revenues. This merchandise includes grocery (including dairy, produce, floral, deli, bakery, meat and seafood), health and beauty care, general merchandise, pharmacy and other products and services. Merchandise includes nationally advertised and private label brands as well as unbranded products such as produce, meat and seafood. The Company’s private label brands play an important role in its merchandising strategy.
Profit is earnedgenerated by selling merchandise at price levels that produce sales in excess of the cost of merchandise sold and operating and administrative expenses. The Company has generally been able to increase revenues and net earningsoperating profit from year to year. Further, the Company has been able to meet its cash requirements from internally generated funds without the need for debt financing. The Company’s year end cash and investment balances are impacted by its operating results as well as by capital expenditures, investment transactions, common stock repurchases and dividend payments.
Operating Environment
The Company is engaged in the highly competitive retail food industry. The Company’s competitors include traditional supermarkets, such as national and regional supermarket chains and independent supermarkets, as well as nontraditional competitors, such as supercenters, membership warehouse clubs, mass merchandisers, dollar stores, drug stores, specialty food stores, restaurants, convenience stores and online retailers. There has been a trend for traditional supermarkets to lose market share to nontraditional competitors. The Company’s ability to attract and retain customers is based primarily on quality of goods and service, price, convenience, product mix and store location. In addition, the Company competes with other companies for new retail sites. To meet the challenges of this highly competitive environment, the Company continues to focus on its core strategies, including customer service, product quality, shopping environment, competitive pricing and convenient locations.customer convenience. The Company has implemented several strategic business and technology initiatives as part of the execution of these core strategies. The Company believes these core strategies and related strategic initiatives differentiate it from its competition and present opportunities for sustained market share and financial growth.
Coronavirus Pandemic Impact
On March 13, 2020, the coronavirus pandemic was declared a national emergency. The coronavirus pandemic resulted in national, state and local authorities mandating or recommending isolation and other preventative measures for large portions of the population, including mandatory business restrictions and closures. These measures, which were necessary to slow the spread of the virus and protect lives, resulted in significant job losses and are expected to continue to have serious adverse impacts on domestic and foreign economies for an unknown length of time. The effects of economic stabilization efforts, including government payments to affected citizens and industries, remain uncertain.
The Company has been classified as an essential business in all locations in which it operates and has remained open to serve the needs of its customers. It remains a top priority of the Company to serve its customers in a way that protects the health and safety of its employees and customers. The Company estimates that its sales for 2020 increased approximately $4.6 billion due to the impact of the coronavirus pandemic. The Company incurred additional payroll related, transportation and other costs to meet the significant sales demand and protect the health and safety of its employees and customers. The profit on the incremental sales resulting from increased customer purchases of food and cleaning supplies more than offset the additional costs incurred. The future impact of the coronavirus pandemic is uncertain and difficult to predict.
Results of Operations
The Company’s fiscal year ends on the last Saturday in December. Fiscal years 2020, 20192023 and 20182021 include 52 weeks and fiscal year 2022 includes 53 weeks.
Sales
Sales for 20202023 were $44.9$57.1 billion as compared with $38.1$54.5 billion in 2019,2022, an increase of $6,747.1 million$2.6 billion or 17.7%4.7%. TheExcluding the effect of the additional week in 2022, sales for 2023 as compared with 2022 would have increased 6.7%. After excluding the effect of the additional week in 2022, the increase in sales for 20202023 as compared with 20192022 was primarily due to the impact of the coronavirus pandemic. The Company estimates that itsnew supermarket sales for 2020 increased approximately $4.6 billion or 12.1% due to the impact of the coronavirus pandemic. Comparableand a 4.2% increase in comparable store sales (supermarkets open for the same weeks in both periods, including replacement supermarkets). Comparable store sales for 20202023 increased 16.0% primarily due to the impact of the coronavirus pandemic.inflation on product costs. Sales for supermarkets that are replaced on site are classified as new supermarket sales since the replacement period for the supermarket is generally 912 to 1215 months.
Sales for 20192022 were $38.1$54.5 billion as compared with $36.1$48.0 billion in 2018,2021, an increase of $2,022.5 million$6.5 billion or 5.6%13.6%. The increase in sales for 20192022 as compared with 20182021 was primarily due to new supermarket sales, and a 3.6%9.9% increase in comparable store sales.sales and a 2.1% increase in sales from the additional week in 2022. Comparable store sales for 20192022 increased primarily due to increasedthe impact of inflation on product costs.
Gross profit
Gross profit (sales less cost of merchandise sold) as a percentage of sales was 27.9%26.3%, 27.2%26.8% and 27.1%27.4% in 2020, 20192023, 2022 and 2018,2021, respectively. Excluding the last-in, first-out (LIFO) reserve effect of $19.8$88 million, $39.9$147 million and $24.2$109 million in 2020, 20192023, 2022 and 2018,2021, respectively, gross profit as a percentage of sales would have been 27.9%26.4%, 27.3%27.0% and 27.2%27.7% in 2020, 20192023, 2022 and 2018,2021, respectively. After excluding the LIFO reserve effect, the increasedecrease in gross profit as a percentage of sales for 20202023 as compared with 20192022 was primarily due to reduced shrink and volume driven efficiencies related to the impact of inflation on product costs which was not passed on to customers, increased shrink and the coronavirus pandemic.relative sales growth of pharmacy products, partially offset by the decrease in distribution costs. After excluding the LIFO reserve effect, the decrease in gross profit as a percentage of sales for 20192022 as compared with 2018 remained relatively unchanged.2021 was primarily due to the impact of inflation on product costs which was not passed on to customers and increased shrink.
Operating and administrative expenses
Operating and administrative expenses as a percentage of sales were 19.7%19.2%, 20.6%18.8% and 20.3%19.6% in 2020, 20192023, 2022 and 2018,2021, respectively. The increase in operating and administrative expenses as a percentage of sales for 2023 as compared with 2022 was primarily due to increases in facility costs as a percentage of sales and payroll costs as a percentage of sales. The decrease in operating and administrative expenses as a percentage of sales for 20202022 as compared with 20192021 was primarily due to volume driven efficiencies related to the impactdecreases in payroll costs as a percentage of the coronavirus pandemic. The increase insales and facility costs as a percentage of sales. In addition, operating and administrative expenses as a percentage of sales for 2019 as compared with 2018 was primarily due to an increasebenefited from the impact of the incremental sales from the additional week in payroll costs as a percentage of sales.2022.
Operating profit
Operating profit as a percentage of sales was 8.9%7.8% in 20202023 and 7.6%8.7% in 20192022 and 2018.2021. The increasedecrease in operating profit as a percentage of sales for 20202023 as compared with 20192022 was primarily due to the increasedecrease in gross profit as a percentage of sales and the increase in operating and administrative expenses as a percentage of sales. Operating profit as a percentage of sales for 2022 as compared with 2021 remained relatively unchanged primarily due to the decrease in operating and administrative expenses as a percentage of sales and the incremental profit from the additional week in 2022, offset by the decrease in gross profit as a percentage of sales.
Investment income (loss)
Investment income for 2023 was $975.0$863 million $814.4as compared with investment loss for 2022 of $1.3 billion and investment income for 2021 of $1.3 billion. Excluding the impact of net unrealized gains and losses on equity securities, investment income would have been $513 million, $254 million and $56.7$230 million in 2020, 2019for 2023, 2022 and 2018,2021, respectively. Excluding the impact of net unrealized gains on equity securities in 2020 and 20192023 and net unrealized losses on equity securities in 2018,2022, the increase in investment income would have been $596.0 million, $291.7 millionfor 2023 as compared with 2022 was primarily due to net realized gains on investments in 2023 as compared with net realized losses on investments in 2022 and $239.5 million for 2020, 2019the increase in interest and 2018, respectively.dividend income. Excluding the impact of net unrealized gainslosses on equity securities the increase in investment income for 2020 as compared with 2019 was primarily due to an increase in net realized gains on investments. Excluding the impact of2022 and net unrealized gains on equity securities in 2019 and net unrealized losses on equity securities in 2018,2021, the increase in investment income for 20192022 as compared with 20182021 was primarily due to anthe increase in interest and dividend income.income, partially offset by net realized losses on investments in 2022 as compared with net realized gains on investments in 2021.
Income tax expense
The effective income tax rate was 21.1%20.1%, 18.6% and 20.6% in 2023, 2022 and 18.5% in 2020, 2019 and 2018,2021, respectively. The increase in the effective income tax rate for 20202023 as compared with 20192022 was primarily due to the decreased impact of permanent deductions and credits duerelative to the increase in earnings before income tax expense.expense, partially offset by the increase in investment related tax credits. The increasedecrease in the effective income tax rate for 20192022 as compared with 20182021 was primarily due to the increased impact of net unrealized gains on equity securitiespermanent deductions and credits relative to earnings before income tax expense, partially offset by the increase in 2019 compared with net unrealized losses on equity securities in 2018state income tax rates and athe decrease in investment related tax credits.
Net earnings
Net earnings were $3,971.8 million$4.3 billion or $5.67$1.31 per share, $3,005.4 million$2.9 billion or $4.21$0.86 per share and $2,381.2 million$4.4 billion or $3.28$1.28 per share in 2020, 20192023, 2022 and 2018,2021, respectively. Net earnings as a percentage of sales were 8.9%7.6%, 7.9%5.4% and 6.6%9.2% in 2020, 20192023, 2022 and 2018,2021, respectively. Excluding the impact of net unrealized gains and losses on equity securities, net earnings would have been $4.1billion or $1.23 per share and 7.2% as a percentage of sales for 2023, $4.0 billion or $1.20 per share and 7.4% as a percentage of sales for 2022 and $3.6 billion or $1.04 per share and 7.5% as a percentage of sales for 2021. Excluding the impact of net unrealized gains on equity securities in 2020 and 20192023 and net unrealized losses on equity securities in 2018, net earnings would have been $3,689.2 million or $5.27 per share and 8.2% as a percentage of sales for 2020, $2,615.6 million or $3.67 per share and 6.9% as a percentage of sales for 2019 and $2,517.5 million or $3.47 per share and 7.0% as a percentage of sales for 2018. Excluding2022, the impact of net unrealized gains on equity securities, the increasedecrease in net earnings as a percentage of sales for 20202023 as compared with 20192022 was primarily due to the impactdecrease in operating profit as a percentage of sales, partially offset by net realized gains on investments in 2023 as compared with net realized losses on investments in 2022 and the coronavirus pandemic.increase in interest and dividend income. Excluding the impact of net unrealized losses on equity securities in 2022 and net unrealized gains on equity securities in 2019 and net unrealized losses on equity securities in 2018,2021, net earnings as a percentage of sales for 20192022 as compared with 20182021 remained relatively unchanged.
Non-GAAP Financial Measures
In addition to reporting financial results for 2020, 20192023, 2022 and 20182021 in accordance with U.S. generally accepted accounting principles (GAAP), the Company presents net earnings and earnings per share excluding the impact of equity securities being measured at fair value with net unrealized gains and losses from changes in the fair value recognized in earnings (fair value adjustment). These measures are not in accordance with, or an alternative to, GAAP. The Company excludes the impact of the fair value adjustment since it is primarily due to temporary equity market fluctuations that do not reflect the Company’s operations. The Company believes this information is useful in providing period-to-period comparisons of the results of operations. Following is a reconciliation of net earnings to net earnings excluding the impact of the fair value adjustment for 2020, 20192023, 2022 and 2018:2021:
| | 2020 | 2019 | 2018 |
| (Amounts are in millions, except per share amounts) |
| 2023 | | | 2023 | 2022 | 2021 |
| (Amounts are in millions, except per share amounts) | | | (Amounts are in millions, except per share amounts) |
| Net earnings | Net earnings | | $ | 3,971.8 | | | 3,005.4 | | | 2,381.2 | | |
| Fair value adjustment, due to net unrealized (gain) loss, on equity securities held at end of year | Fair value adjustment, due to net unrealized (gain) loss, on equity securities held at end of year | | (554.6) | | | (472.5) | | | 107.5 | | |
| Net gain (loss) on sale of equity securities previously recognized through fair value adjustment | | 175.6 | | | (50.2) | | | 75.3 | | |
| Fair value adjustment, due to net unrealized (gain) loss, on equity securities held at end of year | |
| Fair value adjustment, due to net unrealized (gain) loss, on equity securities held at end of year | |
| Net gain on sale of equity securities previously recognized through fair value adjustment | |
| Net gain on sale of equity securities previously recognized through fair value adjustment | |
| Net gain on sale of equity securities previously recognized through fair value adjustment | |
Income tax expense (benefit) (1) | |
Income tax expense (benefit) (1) | |
Income tax expense (benefit) (1) | Income tax expense (benefit) (1) | | 96.4 | | | 132.9 | | | (46.5) | | |
| Net earnings excluding impact of fair value adjustment | Net earnings excluding impact of fair value adjustment | | $ | 3,689.2 | | | 2,615.6 | | | 2,517.5 | | |
| Net earnings excluding impact of fair value adjustment | |
| Net earnings excluding impact of fair value adjustment | |
| Weighted average shares outstanding | |
| Weighted average shares outstanding | |
| Weighted average shares outstanding | Weighted average shares outstanding | | 700.6 | | | 713.5 | | | 726.4 | | |
| Earnings per share excluding impact of fair value adjustment | Earnings per share excluding impact of fair value adjustment | | $ | 5.27 | | | 3.67 | | | 3.47 | | |
| Earnings per share excluding impact of fair value adjustment | |
| Earnings per share excluding impact of fair value adjustment | |
(1)Income tax expense (benefit) is based on the Company’s combined federal and state statutory income tax rates.
Liquidity and Capital Resources
Cash and cash equivalents, short-term investments and long-term investments totaled $11,961.7 million$14.6 billion as of December 26, 2020,30, 2023, as compared with $9,189.8 million$12.9 billion as of December 28, 2019.31, 2022. The increase was primarily due to increased sales as a resultthe decrease in common stock repurchases and the increase in the fair value of the coronavirus pandemic.investments.
Net cash provided by operating activities
Net cash provided by operating activities was $5,424.2 million, $4,024.4 million$5.6 billion, $5.5 billion and $3,631.9 million$5.4 billion in 2020, 20192023, 2022 and 2018,2021, respectively. The increase in net cash provided by operating activities for 20202023 as compared with 20192022 was primarily due to increased sales as a result of the coronavirus pandemic, the timing of paymentspurchases of inventories and collections for merchandisereceivables and the deferral of 2020 payroll tax payments under a coronavirus tax relief provision,increase in dividends and interest received, partially offset by the increase in income taxes paid. Income tax payments for 2022 were deferred to 2023 due to Hurricane Ian. Income tax payments for 2023 were deferred to 2024 due to Hurricane Idalia. The increase in net cash provided by operating activities for 20192022 as compared with 20182021 was primarily due to 2017 federalthe deferral in 2022 of income tax payments extended to 2018 due to Hurricane IrmaIan, partially offset by the payment in 2017.2022 of payroll taxes that were deferred under a coronavirus tax relief provision in 2020.
Net cash used in investing activities
Net cash used in investing activities was $3,428.5 million, $2,257.0 million$3.8 billion, $2.3 billion and $1,742.8 million$3.0 billion in 2020, 20192023, 2022 and 2018,2021, respectively. The primary use of net cash in investing activities for 20202023 was funding capital expenditures and net increases in investments. Capital expenditures for 20202023 totaled $1,228.4 million.$2.0 billion. These expenditures were incurred in connection with the opening of 3945 supermarkets (including nine13 replacement supermarkets) and the remodeling of 154120 supermarkets. Expenditures were also incurred for new supermarkets and remodels in progress, andconstruction or expansion of warehouses, new or enhanced information technology hardware and software.software and the acquisition or development of shopping centers in which the Company operates. In 2020,2023, the payment for investments, net of the proceeds from the sale and maturity of investments, was $2,210.4 million.$1.9 billion. The primary use of net cash in investing activities for 20192022 was funding capital expenditures and net increases in investments. Capital expenditures for 20192022 totaled $1,141.1 million.$1.8 billion. These expenditures were incurred in connection with the opening of 3540 supermarkets (including fiveeight replacement supermarkets) and the remodeling of 177117 supermarkets. Expenditures were also incurred for new supermarkets and remodels in progress, construction or expansion of warehouses and new or enhanced information technology hardware and software and the acquisition of shopping centers with the Company as the anchor tenant.software. In 2019,2022, the payment for investments, net of the proceeds from the sale and maturity of investments, was $1,124.5$549 million.
Net cash used in financing activities
Net cash used in financing activities was $2,085.7 million, $1,603.3 million$2.2 billion, $3.0 billion and $1,869.8 million$1.9 billion in 2020, 20192023, 2022 and 2018,2021, respectively. The primary use of net cash in financing activities was funding net common stock repurchases and dividend payments. Net common stock repurchases totaled $1,190.5$887 million, $776.6 million$1.8 billion and $1,097.9$874 million in 2020, 20192023, 2022 and 2018,2021, respectively. The Company currently repurchases common stock at the stockholders’ request in accordance with the terms of the ESPP, Directors Plan, 401(k) Plan and ESOP. The amount of common stock offered to the Company for repurchase is not within the control of the Company, but is at the discretion of the stockholders. The Company expects to continue to repurchase its common stock, as offered by its stockholders from time to time, at its then current value. However, with the exception of certain shares distributed from the ESOP, such purchases are not required and the Company retains the right to discontinue them at any time.
Dividends
The Company paid quarterly dividends on its common stock totaling $884.4 million$1.3 billion or $1.26$0.39 per share, $828.7 million$1.2 billion or $1.16$0.344 per share and $734.5$987 million or $1.01$0.286 per share in 2020, 20192023, 2022 and 2018,2021, respectively.
Capital expenditures projection
Capital expenditures for 20212024 are expected to be approximately $1,600 million,$2.5 billion, primarily related to new supermarkets, remodeling existing supermarkets, construction or expansion of warehouses, new or enhanced information technology hardware and software and the acquisition or development of shopping centers in which the Company operates. The shopping center acquisitions are financed with internally generated funds and assumed debt, if prepayment penalties for the debt are determined to be significant. This capital program is subject to continuing change and review.
Contractual obligations
The Company’s contractual obligations arising in the normal course of business primarily include operating and finance leases, lease related commitments, purchase obligations, self-insurance reserves and long-term debt. Lease related commitments include real estate taxes, insurance and maintenance related to operating and finance leases and commitments for lease agreements that have not yet commenced. Lease related commitments are typically due over the applicable lease term. Purchase obligations include agreements to purchase goods or services that are enforceable and legally binding on the Company and that specify all significant terms, including fixed or minimum quantities to be purchased, fixed, minimum or variable price provisions and the approximate timing of the transaction. Purchase obligations are typically due in one year or less.
Cash requirements
In 2021,2024, cash requirements for operations, capital expenditures, common stock repurchases and dividend payments are expected to be financed by internally generated funds or liquid assets. Based on the Company’s financial position, it is expected that short-term and long-term borrowings would be available to support the Company’s liquidity requirements, if needed.
Contractual Obligations
Following is a summary of contractual obligations as of December 26, 2020:
| | | | | | | | | | | | | | | | | | | | | | | | | | | | | | | | |
| | Payments Due by Period |
| | Total | | 2021 | | 2022- 2023 | | 2024- 2025 | | There-
after |
| | (Amounts are in thousands) |
| Contractual obligations: | | | | | | | | | | |
Operating leases (1) | | $ | 3,624,709 | | | 438,358 | | | 787,096 | | | 602,146 | | | 1,797,109 | |
Finance leases (1) | | 351,967 | | | 32,962 | | | 51,042 | | | 34,388 | | | 233,575 | |
Purchase obligations (2)(3)(4) | | 2,879,969 | | | 1,467,545 | | | 432,991 | | | 220,457 | | | 758,976 | |
| Other long-term liabilities: | | | | | | | | | | |
Self-insurance reserves (5) | | 397,081 | | | 161,223 | | | 113,649 | | | 45,502 | | | 76,707 | |
| Accrued postretirement benefit cost | | 137,786 | | | 6,430 | | | 13,374 | | | 13,970 | | | 104,012 | |
Long-term debt (6) | | 160,227 | | | 36,392 | | | 63,932 | | | 32,565 | | | 27,338 | |
| Other | | 43,454 | | | 27,291 | | | 757 | | | 652 | | | 14,754 | |
| Total | | $ | 7,595,193 | | | 2,170,201 | | | 1,462,841 | | | 949,680 | | | 3,012,471 | |
Off-Balance Sheet Arrangements
The Company is not a party to any off-balance sheet arrangements that have, or are reasonably likely to have, a current or future effect on the Company’s financial condition, results of operations or cash flows.
____________________________
(1)For a more detailed description of the operating and finance lease obligations, refer to Note 4 Leases in the Notes to Consolidated Financial Statements.
(2)Purchase obligations include agreements to purchase goods or services that are enforceable and legally binding on the Company and that specify all significant terms, including fixed or minimum quantities to be purchased, fixed, minimum or variable price provisions and the approximate timing of the transaction. Purchase obligations exclude agreements that are cancelable within 30 days without penalty.
(3)As of December 26, 2020, the Company had outstanding $9.1 million in trade letters of credit and $3.7 million in standby letters of credit to support certain of these purchase obligations.
(4)Purchase obligations include $1,019.4 million in real estate taxes, insurance and maintenance commitments related to operating and finance leases. The actual amounts to be paid may be variable and have been estimated based on current costs. Purchase obligations also include $359.5 million in lease agreements that have not yet commenced.
(5)As of December 26, 2020, the Company maintained restricted investments in the amount of $182.1 million primarily for the benefit of the Company’s insurance carrier related to self-insurance reserves.
(6)For a more detailed description of the long-term debt obligations, refer to Note 5 Consolidation of Joint Ventures and Long-Term Debt in the Notes to Consolidated Financial Statements.
Critical Accounting Estimates
The Company’s discussion and analysis of its financial condition and results of operations are based upon the Company’s consolidated financial statements, which have been prepared in accordance with GAAP. The preparation of these consolidated financial statements requires management to make estimates and assumptions that affect the reported amounts of assets and liabilities and disclosure of contingent assets and liabilities as of the date of the consolidated financial statements and the reported amounts of revenues and expenses during the reporting period. Actual results could differ from those estimates. The Company’s significant accounting policies are described in Note 1 in the Notes to Consolidated Financial Statements. The Company believes the following involves significant estimates and judgments in the preparation of its consolidated financial statements.
Self-Insurance ReservesSelf-insurance reserves
Self-insurance reserves are established for health care, workers’ compensation, general liability and fleet liability claims. These reserves are determined based on actual claims experience and an estimate of claims incurred but not reported including, where necessary, actuarial studies. The Company believes that the use of actuarial studies to determine self-insurance reserves represents a consistent method of measuring these subjective estimates. Actuarial projections of losses for general liability and workers’ compensation claims are discounted and subject to variability. The causes of variability include, but are not limited to, such factors as future interest and inflation rates, future economic conditions, claims experience, litigation trends and benefit level changes. Historically, there have not been significant changes in the factors and assumptions used in the valuation of the self-insurance reserves. However, significant changes in such factors and assumptions could materially impact the valuation of the self-insurance reserves.
Forward-Looking Statements
Certain information provided by the Company in this Annual Report may be forward-looking information as defined in Section 21E of the Securities Exchange Act of 1934 (Exchange Act). Forward-looking information includes statements about the future performance of the Company and is based on management’s assumptions and beliefs in light of the information currently available to them, including as it relates to the coronavirus pandemic.them. When used, the words “plan,” “estimate,” “project,” “intend,” “expect,” “believe,” “will” and other similar expressions, as they relate to the Company, are intended to identify such forward-looking statements. These forward-looking statements are subject to uncertainties and other factors that could cause actual results to differ materially from those statements including, but not limited to, the following: competitive practices and pricing in the food and drug industries generally and particularly in the Company’s principal markets; results of programs to increase sales, including private label sales; results of programs to control or reduce costs; changes in buying, pricing and promotional practices; changes in shrink management; supply chain disruptions; changes in the general economy, including thean economic downturn associated with the coronavirus pandemic;inflation, increased interest rates, international conflicts, acts of terrorism or other disruptions; changes in consumer spending; changes in population, employment and job growth in the Company’s principal markets; impacts of a public health crisis, geopolitical conditions or other significant catastrophic event, such as the coronavirus pandemic;events; impacts of cybersecurity threats, including an intrusion into, compromise of or disruption in the Company’s information technology systems; and other factors affecting the Company’s business within or beyond the Company’s control. These factors include changes in the rate ofinterest or inflation rates; changes in federal, state and local laws and regulations,regulations; adverse determinations with respect to litigation or other claims,claims; ability to recruit and retain employees, increases in operating costs including, but not limited to, labor costs, credit card fees and utility costs, particularly electric rates,employees; ability to construct new supermarkets or complete remodels as rapidly as plannedplanned; increases in product costs; and stability of product costs.increases in operating costs including, but not limited to, labor, fuel and energy costs, debit and credit card fees and pharmacy fees. Other factors and assumptions not identified above could also cause the actual results to differ materially from those set forth in the forward-looking statements. Except as may be required by applicable law, the Company assumes no obligation to publicly update these forward-looking statements.
Item 7A. Quantitative and Qualitative Disclosures About Market Risk
The Company does not utilize financial instruments for trading or other speculative purposes, nor does it utilize leveraged financial instruments.
Cash equivalents and short-term investments are subject to interest rate risk and credit risk. Most of the cash equivalents and short-term investments are held in money market investments and debt securities that mature in less than one year. Due to the quality of the short-term investments held, the Company does not expect the valuation of these investments to be significantly impacted by future market conditions.
Debt securities are subject to interest rate risk and credit risk. Debt securities held by the Company at year end primarily consisted of corporate state and municipalgovernment-sponsored agency bonds with high credit ratings; therefore, the Company believes the credit risk is low. The Company believes a 50 basis point increase in interest rates would result in an immaterial unrealized loss on its debt securities. Since the Company does not intend to sell its debt securities or will likely not be required to sell its debt securities prior to any anticipated recovery, such a hypothetical temporary unrealized loss would impact comprehensive earnings, but not earnings or cash flows.
Equity securities are subject to equity price risk that results from fluctuations in quoted market prices as of the balance sheet date. Market price fluctuations may result from perceived changes in the underlying economic characteristics of the issuer, the relative price of alternative investments and general market conditions. Due to equity securities being measured at fair value with net unrealized gains and losses from changes in the fair value recognized in earnings, fluctuations in quoted market prices for equity securities will impact earnings. A decrease of 10% in the value of the Company’s equity securities would result in an unrealized loss of approximately $210$270 million recognized in earnings, but would not impact cash flows.
Item 8. Financial Statements and Supplementary Data
| | | | | | | | |
Index to Consolidated Financial Statements and Schedule | | |
| Page |
| | |
| | |
| KPMG LLP (PCAOB ID: 185) | | |
| |
| Consolidated Financial Statements: | | |
| |
| | |
| |
| | |
| |
| | |
| |
| | |
| |
| | |
| |
| | |
| |
| The following consolidated financial statement schedule of the Company for the years ended
December 26, 2020, December 28, 2019 and December 29, 2018 is submitted herewith:
| |
| |
| | |
| |
| All other schedules are omitted as the required information is inapplicable or the information is
presented in the consolidated financial statements or related notes.
| |
Report of Independent Registered Public Accounting Firm
To the Stockholders and Board of Directors
Publix Super Markets, Inc.:
Opinion on the Consolidated Financial Statements
We have audited the accompanying consolidated balance sheets of Publix Super Markets, Inc. and subsidiaries (the Company) as of December 26, 202030, 2023 and December 28, 2019,31, 2022, the related consolidated statements of earnings, comprehensive earnings, cash flows and stockholders’ equity for each of the years in the three-year period ended December 26, 2020,30, 2023, and the related notes and the financial statement schedule listed in the accompanying index (collectively, the consolidated financial statements). In our opinion, the consolidated financial statements present fairly, in all material respects, the financial position of the Company as of December 26, 202030, 2023 and December 28, 2019,31, 2022, and the results of its operations and its cash flows for each of the years in the three-year period ended December 26, 2020,30, 2023, in conformity with U.S. generally accepted accounting principles.
Change in Accounting Principle
As discussed in Note 4(a) to the consolidated financial statements, the Company has changed its method of accounting for leases as of December 30, 2018 due to the adoption of Accounting Standards Codification Topic 842, Leases.
Basis for Opinion
These consolidated financial statements are the responsibility of the Company’s management. Our responsibility is to express an opinion on these consolidated financial statements based on our audits. We are a public accounting firm registered with the Public Company Accounting Oversight Board (United States) (PCAOB) and are required to be independent with respect to the Company in accordance with the U.S. federal securities laws and the applicable rules and regulations of the Securities and Exchange Commission and the PCAOB.
We conducted our audits in accordance with the standards of the PCAOB. Those standards require that we plan and perform the audit to obtain reasonable assurance about whether the consolidated financial statements are free of material misstatement, whether due to error or fraud. The Company is not required to have, nor were we engaged to perform, an audit of its internal control over financial reporting. As part of our audits, we are required to obtain an understanding of internal control over financial reporting but not for the purpose of expressing an opinion on the effectiveness of the Company’s internal control over financial reporting. Accordingly, we express no such opinion.
Our audits included performing procedures to assess the risks of material misstatement of the consolidated financial statements, whether due to error or fraud, and performing procedures that respond to those risks. Such procedures included examining, on a test basis, evidence regarding the amounts and disclosures in the consolidated financial statements. Our audits also included evaluating the accounting principles used and significant estimates made by management, as well as evaluating the overall presentation of the consolidated financial statements. We believe that our audits provide a reasonable basis for our opinion.
Critical Audit Matter
The critical audit matter communicated below is a matter arising from the current period audit of the consolidated financial statements that was communicated or required to be communicated to the audit committee and that: (1) relates to accounts or disclosures that are material to the consolidated financial statements and (2) involved our especially challenging, subjective, or complex judgments. The communication of a critical audit matter does not alter in any way our opinion on the consolidated financial statements, taken as a whole, and we are not, by communicating the critical audit matter below, providing a separate opinion on the critical audit matter or on the accounts or disclosures to which it relates.
Evaluation of self-insurance reserves
As discussed in Note 1(k) to the consolidated financial statements, the Company estimates its self-insurance reserves for workers’ compensation and general liability exposures by considering historical claims experience and actuarial analyses using actuarial assumptions and generally accepted actuarial methods. The self-insurance reserves balance as of December 26, 202030, 2023 of $397$526 million includes the self-insurance reserves related to workers’ compensation and general liability. The Company engages actuaries to estimate its workers’ compensation and general liability self-insurance reserves at least annually.
We identified the evaluation of the Company’s workers’ compensation and general liability self-insurance reserves as a critical audit matter because of the specialized skills necessary to evaluate the Company’s key assumption, the loss development factors,factor assumptions and the selection of the actuarial projections derived from various actuarial methods.
The following are the primary procedures we performed to address this critical audit matter. We evaluated the design of certain internal controls related to the workers’ compensation and general liability actuarial projections.self-insurance reserves. This included controls related to the loss development factorsfactor assumptions used to estimate the actuarial projections and the selection of the actuarial projections derived from various actuarial methods. We involved actuarial professionals with specialized skills and knowledge who assisted in:
•Assessing the actuarial modelsmethods used by the Company for consistency with generally accepted actuarial standards;
•Evaluating the Company’s ability to estimate self-insurance reserves by comparing its historical estimates with actual incurred losses; and
•Evaluating the key assumption, the loss development factors,factor assumptions and the actuarial projections by developing an independent expectation of the workers’ compensation and general liability self-insurance reserves and comparing them to the amounts recorded by the Company.
/s/ KPMG LLP
We have served as the Company’s auditor since 1961.
Tampa, Florida
March 1, 20212024
PUBLIX SUPER MARKETS, INC.
Consolidated Balance Sheets
December 26, 202030, 2023 and
December 28, 201931, 2022
| | 2020 | | 2019 | |
| | 2023 | |
| ASSETS | |
| ASSETS | |
| ASSETS | ASSETS | | (Amounts are in thousands) | |
| Current assets: | Current assets: | |
| Current assets: | |
| Current assets: | |
| Cash and cash equivalents | |
| Cash and cash equivalents | |
| Cash and cash equivalents | Cash and cash equivalents | | $ | 673,483 | | | 763,382 | | |
| Short-term investments | Short-term investments | | 682,965 | | | 438,105 | | |
| Short-term investments | |
| Short-term investments | |
| Trade receivables | |
| Trade receivables | |
| Trade receivables | Trade receivables | | 917,531 | | | 737,093 | | |
| Inventories | Inventories | | 2,033,792 | | | 1,913,310 | | |
| Inventories | |
| Inventories | |
| Prepaid expenses | |
| Prepaid expenses | |
| Prepaid expenses | Prepaid expenses | | 110,025 | | | 75,710 | | |
| Total current assets | Total current assets | | 4,417,796 | | | 3,927,600 | | |
| Total current assets | |
| Total current assets | |
| Long-term investments | |
| Long-term investments | |
| Long-term investments | Long-term investments | | 10,605,234 | | | 7,988,280 | | |
| Other noncurrent assets | Other noncurrent assets | | 415,103 | | | 441,938 | | |
| Other noncurrent assets | |
| Other noncurrent assets | |
| Operating lease right-of-use assets | |
| Operating lease right-of-use assets | |
| Operating lease right-of-use assets | Operating lease right-of-use assets | | 2,965,424 | | | 2,964,780 | | |
| Property, plant and equipment: | Property, plant and equipment: | |
| Property, plant and equipment: | |
| Property, plant and equipment: | |
| Land | |
| Land | |
| Land | Land | | 2,059,274 | | | 1,984,400 | | |
| Buildings and improvements | Buildings and improvements | | 6,379,852 | | | 5,948,039 | | |
| Buildings and improvements | |
| Buildings and improvements | |
| Furniture, fixtures and equipment | |
| Furniture, fixtures and equipment | |
| Furniture, fixtures and equipment | Furniture, fixtures and equipment | | 5,796,442 | | | 5,477,534 | | |
| Leasehold improvements | Leasehold improvements | | 1,764,326 | | | 1,660,164 | | |
| Leasehold improvements | |
| Leasehold improvements | |
| Finance lease right-of-use assets | |
| Finance lease right-of-use assets | |
| Finance lease right-of-use assets | |
| Construction in progress | Construction in progress | | 257,099 | | | 152,272 | | |
| 16,256,993 | | | 15,222,409 | | |
| Construction in progress | |
| Construction in progress | |
| | 20,393 | |
| | 20,393 | |
| | 20,393 | |
| Accumulated depreciation | |
| Accumulated depreciation | |
| Accumulated depreciation | Accumulated depreciation | | (6,566,473) | | | (6,037,887) | | |
| Net property, plant and equipment | Net property, plant and equipment | | 9,690,520 | | | 9,184,522 | | |
| Net property, plant and equipment | |
| Net property, plant and equipment | |
| | $ | |
| | $ | |
| | $ | |
| | $ | 28,094,077 | | | 24,507,120 | | |
|
See accompanying notes to consolidated financial statements.
18
| | | 2020 | | 2019 | |
| | 2023 | |
| | 2023 | |
| | 2023 | |
| LIABILITIES AND EQUITY | |
| LIABILITIES AND EQUITY | |
| LIABILITIES AND EQUITY | LIABILITIES AND EQUITY | | (Amounts are in thousands,
except par value) | |
| Current liabilities: | Current liabilities: | |
| Current liabilities: | |
| Current liabilities: | |
| Accounts payable | |
| Accounts payable | |
| Accounts payable | Accounts payable | | $ | 2,414,798 | | | 1,984,761 | | |
| Accrued expenses: | Accrued expenses: | |
| Accrued expenses: | |
| Accrued expenses: | |
| Contributions to retirement plans | |
| Contributions to retirement plans | |
| Contributions to retirement plans | Contributions to retirement plans | | 639,581 | | | 581,699 | | |
| Self-insurance reserves | Self-insurance reserves | | 161,223 | | | 149,082 | | |
| Self-insurance reserves | |
| Self-insurance reserves | |
| Salaries and wages | |
| Salaries and wages | |
| Salaries and wages | Salaries and wages | | 197,721 | | | 148,662 | | |
| Other | Other | | 499,970 | | | 461,427 | | |
| Other | |
| Other | |
| Current portion of long-term debt | |
| Current portion of long-term debt | |
| Current portion of long-term debt | Current portion of long-term debt | | 36,392 | | | 39,692 | | |
| Current portion of operating lease liabilities | Current portion of operating lease liabilities | | 345,805 | | | 335,391 | | |
| Federal and state income taxes | | 71,354 | | | 0 | | |
| Current portion of operating lease liabilities | |
| Current portion of operating lease liabilities | |
| Income taxes | |
| Income taxes | |
| Income taxes | |
| Total current liabilities | |
| Total current liabilities | |
| Total current liabilities | Total current liabilities | | 4,366,844 | | | 3,700,714 | | |
| Deferred income taxes | Deferred income taxes | | 772,722 | | | 682,484 | | |
| Deferred income taxes | |
| Deferred income taxes | |
| Self-insurance reserves | Self-insurance reserves | | 235,858 | | | 226,727 | | |
| Accrued postretirement benefit cost | | 131,356 | | | 120,015 | | |
| Self-insurance reserves | |
| Self-insurance reserves | |
| Long-term debt | |
| Long-term debt | |
| Long-term debt | Long-term debt | | 123,835 | | | 131,997 | | |
| Operating lease liabilities | Operating lease liabilities | | 2,588,258 | | | 2,603,206 | | |
| Operating lease liabilities | |
| Operating lease liabilities | |
| Finance lease liabilities | |
| Finance lease liabilities | |
| Finance lease liabilities | |
| Other noncurrent liabilities | |
| Other noncurrent liabilities | |
| Other noncurrent liabilities | Other noncurrent liabilities | | 589,340 | | | 140,633 | | |
| Total liabilities | Total liabilities | | 8,808,213 | | | 7,605,776 | | |
| Total liabilities | |
| Total liabilities | |
| Common stock related to Employee Stock Ownership Plan (ESOP) | |
| Common stock related to Employee Stock Ownership Plan (ESOP) | |
| Common stock related to Employee Stock Ownership Plan (ESOP) | Common stock related to Employee Stock Ownership Plan (ESOP) | | 3,484,549 | | | 3,259,230 | | |
| Stockholders’ equity: | Stockholders’ equity: | | | | | |
Common stock of $1 par value. Authorized 1,000,000 shares; issued and outstanding 690,982 shares in 2020 and 706,552 shares in 2019 | | 690,982 | | | 706,552 | | |
| Stockholders’ equity: | |
| Stockholders’ equity: | |
Common stock of $1 par value. Authorized 4,000 shares; issued and outstanding 3,294 shares in 2023 and 3,324 shares in 2022 | |
Common stock of $1 par value. Authorized 4,000 shares; issued and outstanding 3,294 shares in 2023 and 3,324 shares in 2022 | |
Common stock of $1 par value. Authorized 4,000 shares; issued and outstanding 3,294 shares in 2023 and 3,324 shares in 2022 | |
| Additional paid-in capital | |
| Additional paid-in capital | |
| Additional paid-in capital | Additional paid-in capital | | 4,005,969 | | | 3,758,066 | | |
| Retained earnings | Retained earnings | | 14,343,865 | | | 12,317,478 | | |
| Accumulated other comprehensive earnings | | 200,951 | | | 81,289 | | |
| Retained earnings | |
| Retained earnings | |
| Accumulated other comprehensive losses | |
| Accumulated other comprehensive losses | |
| Accumulated other comprehensive losses | |
| Common stock related to ESOP | |
| Common stock related to ESOP | |
| Common stock related to ESOP | Common stock related to ESOP | | (3,484,549) | | | (3,259,230) | | |
| Total stockholders’ equity | Total stockholders’ equity | | 15,757,218 | | | 13,604,155 | | |
| Total stockholders’ equity | |
| Total stockholders’ equity | |
| Noncontrolling interests | |
| Noncontrolling interests | |
| Noncontrolling interests | Noncontrolling interests | | 44,097 | | | 37,959 | | |
| Total equity | Total equity | | 19,285,864 | | | 16,901,344 | | |
| Total equity | |
| Total equity | |
| Commitments and contingencies | Commitments and contingencies | | 0 | | | 0 | | |
| $ | 28,094,077 | | | 24,507,120 | | |
| Commitments and contingencies | |
| Commitments and contingencies | |
| | $ | |
| | $ | |
| | $ | |
PUBLIX SUPER MARKETS, INC.
Consolidated Statements of Earnings
Years ended December 26, 2020,30, 2023, December 28, 201931, 2022
and December 29, 201825, 2021
| | 2020 | | 2019 | | 2018 | |
| (Amounts are in thousands, except per share amounts) | |
| | 2023 | |
| | (Amounts are in millions, except per share amounts) | |
| | (Amounts are in millions, except per share amounts) | |
| | (Amounts are in millions, except per share amounts) | |
| Revenues: | |
| Revenues: | |
| Revenues: | Revenues: | |
| Sales | Sales | | $ | 44,863,507 | | | 38,116,402 | | | 36,093,907 | | |
| Sales | |
| Sales | |
| Other operating income | |
| Other operating income | |
| Other operating income | Other operating income | | 340,452 | | | 346,351 | | | 301,811 | | |
| Total revenues | Total revenues | | 45,203,959 | | | 38,462,753 | | | 36,395,718 | | |
| Total revenues | |
| Total revenues | |
| Costs and expenses: | |
| Costs and expenses: | |
| Costs and expenses: | Costs and expenses: | | | | | | | |
| Cost of merchandise sold | Cost of merchandise sold | | 32,354,606 | | | 27,740,469 | | | 26,311,391 | | |
| Cost of merchandise sold | |
| Cost of merchandise sold | |
| Operating and administrative expenses | |
| Operating and administrative expenses | |
| Operating and administrative expenses | Operating and administrative expenses | | 8,837,380 | | | 7,833,035 | | | 7,339,924 | | |
| Total costs and expenses | Total costs and expenses | | 41,191,986 | | | 35,573,504 | | | 33,651,315 | | |
| Total costs and expenses | |
| Total costs and expenses | |
| Operating profit | |
| Operating profit | |
| Operating profit | Operating profit | | 4,011,973 | | | 2,889,249 | | | 2,744,403 | | |
| | Investment income | | 975,006 | | | 814,372 | | | 56,699 | | |
| Investment income (loss) | |
| | Investment income (loss) | |
| | Investment income (loss) | |
| Other nonoperating income, net | |
| Other nonoperating income, net | |
| Other nonoperating income, net | Other nonoperating income, net | | 49,676 | | | 82,365 | | | 119,866 | | |
| Earnings before income tax expense | Earnings before income tax expense | | 5,036,655 | | | 3,785,986 | | | 2,920,968 | | |
| Earnings before income tax expense | |
| Earnings before income tax expense | |
| Income tax expense | |
| Income tax expense | |
| Income tax expense | Income tax expense | | 1,064,817 | | | 780,591 | | | 539,801 | | |
| Net earnings | Net earnings | | $ | 3,971,838 | | | 3,005,395 | | | 2,381,167 | | |
| Net earnings | |
| Net earnings | |
| Weighted average shares outstanding | |
| Weighted average shares outstanding | |
| Weighted average shares outstanding | Weighted average shares outstanding | | 700,587 | | | 713,535 | | | 726,407 | | |
| Earnings per share | Earnings per share | | $ | 5.67 | | | 4.21 | | | 3.28 | | |
| Earnings per share | |
| Earnings per share | |
See accompanying notes to consolidated financial statements.
20
PUBLIX SUPER MARKETS, INC.
Consolidated Statements of Comprehensive Earnings
Years ended December 26, 2020,30, 2023, December 28, 201931, 2022
and December 29, 201825, 2021
| | | | | | | | | | | | | | | | | | | | | | | |
| | 2020 | | 2019 | | 2018 | |
| | (Amounts are in thousands) | |
| Net earnings | | $ | 3,971,838 | | | 3,005,395 | | | 2,381,167 | | |
| Other comprehensive earnings: | | | | | | | |
| Unrealized gain (loss) on debt securities net of income taxes of $47,253, $50,504 and $(6,521) in 2020, 2019 and 2018, respectively. | | 138,989 | | | 148,141 | | | (19,126) | | |
| Reclassification adjustment for net realized (gain) loss on debt securities net of income taxes of $(4,616), $(205) and $118 in 2020, 2019 and 2018, respectively. | | (13,591) | | | (602) | | | 346 | | |
| Adjustment to postretirement benefit obligation net of income taxes of $(1,955), $(3,576) and $2,963 in 2020, 2019 and 2018, respectively. | | (5,736) | | | (10,488) | | | 8,692 | | |
| Comprehensive earnings | | $ | 4,091,500 | | | 3,142,446 | | | 2,371,079 | | |
| | | | | | | | | | | | | | | | | | | | | | | |
| | 2023 | | 2022 | | 2021 | |
| | (Amounts are in millions) | |
| Net earnings | | $ | 4,349 | | | 2,918 | | | 4,412 | | |
| Other comprehensive earnings (losses): | | | | | | | |
| Unrealized gain (loss) on debt securities net of income taxes of $70, $(214) and $(68) in 2023, 2022 and 2021, respectively. | | 206 | | | (626) | | | (201) | | |
| Reclassification adjustment for net realized loss (gain) on debt securities net of income taxes of $1 and $(5) in 2022 and 2021, respectively. | | — | | | 1 | | | (16) | | |
| Adjustment to postretirement benefit obligation net of income taxes of $(0.4), $7 and $3 in 2023, 2022 and 2021, respectively. | | (1) | | | 21 | | | 11 | | |
| Comprehensive earnings | | $ | 4,554 | | | 2,314 | | | 4,206 | | |
See accompanying notes to consolidated financial statements.
21
PUBLIX SUPER MARKETS, INC.
Consolidated Statements of Cash Flows
Years ended December 26, 2020,30, 2023, December 28, 201931, 2022
and December 29, 201825, 2021
| | 2020 | | 2019 | | 2018 | |
| (Amounts are in thousands) | |
| | 2023 | |
| | (Amounts are in millions) | |
| | (Amounts are in millions) | |
| | (Amounts are in millions) | |
| Cash flows from operating activities: | |
| Cash flows from operating activities: | |
| Cash flows from operating activities: | Cash flows from operating activities: | |
| Cash received from customers | Cash received from customers | | $ | 44,885,680 | | | 38,269,943 | | | 36,296,870 | | |
| Cash received from customers | |
| Cash received from customers | |
| Cash paid to employees and suppliers | |
| Cash paid to employees and suppliers | |
| Cash paid to employees and suppliers | Cash paid to employees and suppliers | | (38,844,539) | | | (34,017,408) | | | (32,177,582) | | |
| Income taxes paid | Income taxes paid | | (789,711) | | | (373,172) | | | (563,983) | | |
| Income taxes paid | |
| Income taxes paid | |
| Self-insured claims paid | |
| Self-insured claims paid | |
| Self-insured claims paid | Self-insured claims paid | | (384,044) | | | (394,495) | | | (395,457) | | |
| Dividends and interest received | Dividends and interest received | | 241,639 | | | 217,574 | | | 192,528 | | |
| Dividends and interest received | |
| Dividends and interest received | |
| Other operating cash receipts | |
| Other operating cash receipts | |
| Other operating cash receipts | Other operating cash receipts | | 336,244 | | | 341,929 | | | 297,098 | | |
| Other operating cash payments | Other operating cash payments | | (21,052) | | | (19,940) | | | (17,548) | | |
| Other operating cash payments | |
| Other operating cash payments | |
| Net cash provided by operating activities | |
| Net cash provided by operating activities | |
| Net cash provided by operating activities | Net cash provided by operating activities | | 5,424,217 | | | 4,024,431 | | | 3,631,926 | | |
| Cash flows from investing activities: | Cash flows from investing activities: | | | | | | | |
| Cash flows from investing activities: | |
| Cash flows from investing activities: | |
| Payment for capital expenditures | |
| Payment for capital expenditures | |
| Payment for capital expenditures | Payment for capital expenditures | | (1,228,387) | | | (1,141,118) | | | (1,350,089) | | |
| Proceeds from sale of property, plant and equipment | Proceeds from sale of property, plant and equipment | | 10,297 | | | 8,609 | | | 43,834 | | |
| Proceeds from sale of property, plant and equipment | |
| Proceeds from sale of property, plant and equipment | |
| Payment for investments | |
| Payment for investments | |
| Payment for investments | Payment for investments | | (5,356,844) | | | (3,237,807) | | | (2,778,691) | | |
| Proceeds from sale and maturity of investments | Proceeds from sale and maturity of investments | | 3,146,473 | | | 2,113,287 | | | 2,342,162 | | |
| Proceeds from sale and maturity of investments | |
| Proceeds from sale and maturity of investments | |
| Net cash used in investing activities | |
| Net cash used in investing activities | |
| Net cash used in investing activities | Net cash used in investing activities | | (3,428,461) | | | (2,257,029) | | | (1,742,784) | | |
| Cash flows from financing activities: | Cash flows from financing activities: | | | | | | | |
| Cash flows from financing activities: | |
| Cash flows from financing activities: | |
| Payment for acquisition of common stock | |
| Payment for acquisition of common stock | |
| Payment for acquisition of common stock | Payment for acquisition of common stock | | (1,440,312) | | | (1,088,570) | | | (1,405,872) | | |
| Proceeds from sale of common stock | Proceeds from sale of common stock | | 249,808 | | | 311,950 | | | 307,933 | | |
| Proceeds from sale of common stock | |
| Proceeds from sale of common stock | |
| Dividends paid | |
| Dividends paid | |
| Dividends paid | Dividends paid | | (884,369) | | | (828,733) | | | (734,510) | | |
| Repayment of long-term debt | Repayment of long-term debt | | (28,374) | | | (11,061) | | | (43,593) | | |
| Repayment of long-term debt | |
| Repayment of long-term debt | |
| Other, net | |
| Other, net | |
| Other, net | Other, net | | 17,592 | | | 13,130 | | | 6,239 | | |
| Net cash used in financing activities | Net cash used in financing activities | | (2,085,655) | | | (1,603,284) | | | (1,869,803) | | |
| Net cash used in financing activities | |
| Net cash used in financing activities | |
| Net (decrease) increase in cash and cash equivalents | |
| Net (decrease) increase in cash and cash equivalents | |
| Net (decrease) increase in cash and cash equivalents | Net (decrease) increase in cash and cash equivalents | | (89,899) | | | 164,118 | | | 19,339 | | |
| Cash and cash equivalents at beginning of year | Cash and cash equivalents at beginning of year | | 763,382 | | | 599,264 | | | 579,925 | | |
| Cash and cash equivalents at beginning of year | |
| Cash and cash equivalents at beginning of year | |
| Cash and cash equivalents at end of year | Cash and cash equivalents at end of year | | $ | 673,483 | | | 763,382 | | | 599,264 | | |
| Cash and cash equivalents at end of year | |
| Cash and cash equivalents at end of year | |
See accompanying notes to consolidated financial statements.
22
| | | 2020 | | 2019 | | 2018 | |
| (Amounts are in thousands) | |
| | 2023 | |
| | 2023 | |
| | 2023 | |
| | (Amounts are in millions) | |
| | (Amounts are in millions) | |
| | (Amounts are in millions) | |
| Reconciliation of net earnings to net cash provided by operating activities: | |
| Reconciliation of net earnings to net cash provided by operating activities: | |
| Reconciliation of net earnings to net cash provided by operating activities: | Reconciliation of net earnings to net cash provided by operating activities: | |
| Net earnings | Net earnings | | $ | 3,971,838 | | | 3,005,395 | | | 2,381,167 | | |
| Net earnings | |
| Net earnings | |
Adjustments to reconcile net earnings to net cash provided by operating activities: | |
Adjustments to reconcile net earnings to net cash provided by operating activities: | |
Adjustments to reconcile net earnings to net cash provided by operating activities: | Adjustments to reconcile net earnings to net cash provided by operating activities: | |
| Depreciation and amortization | Depreciation and amortization | | 736,531 | | | 716,669 | | | 677,154 | | |
| Increase in last-in, first out (LIFO) reserve | | 19,752 | | | 39,939 | | | 24,170 | | |
| Depreciation and amortization | |
| Depreciation and amortization | |
| Increase in last-in, first-out (LIFO) reserve | |
| Increase in last-in, first-out (LIFO) reserve | |
| Increase in last-in, first-out (LIFO) reserve | |
Retirement contributions paid or payable in common stock | |
Retirement contributions paid or payable in common stock | |
Retirement contributions paid or payable in common stock | Retirement contributions paid or payable in common stock | | 418,311 | | | 409,614 | | | 373,350 | | |
| Deferred income taxes | Deferred income taxes | | 49,556 | | | 215,004 | | | 63,245 | | |
Loss (gain) on disposal and impairment of long-lived assets | | 138,573 | | | 11,036 | | | (13,185) | | |
| Deferred income taxes | |
| Deferred income taxes | |
Loss on disposal and impairment of long-lived assets | |
Loss on disposal and impairment of long-lived assets | |
Loss on disposal and impairment of long-lived assets | |
| (Gain) loss on investments | |
| (Gain) loss on investments | |
| (Gain) loss on investments | (Gain) loss on investments | | (775,571) | | | (627,624) | | | 73,254 | | |
| Net amortization of investments | Net amortization of investments | | 54,107 | | | 42,753 | | | 63,654 | | |
| Net amortization of investments | |
| Net amortization of investments | |
| Change in operating assets and liabilities providing (requiring) cash: | |
| Change in operating assets and liabilities providing (requiring) cash: | |
| Change in operating assets and liabilities providing (requiring) cash: | Change in operating assets and liabilities providing (requiring) cash: | |
| Trade receivables | Trade receivables | | (180,438) | | | (54,890) | | | (10,790) | | |
| Trade receivables | |
| Trade receivables | |
| Inventories | |
| Inventories | |
| Inventories | Inventories | | (140,234) | | | (104,514) | | | 3,614 | | |
| Other assets | Other assets | | 151,714 | | | 136,796 | | | 199,930 | | |
| Other assets | |
| Other assets | |
| Accounts payable and accrued expenses | Accounts payable and accrued expenses | | 615,521 | | | 181,154 | | | 112,383 | | |
| Federal and state income taxes | | 58,901 | | | 40,548 | | | (313,989) | | |
| Accounts payable and accrued expenses | |
| Accounts payable and accrued expenses | |
| Income taxes | |
| Income taxes | |
| Income taxes | |
| Other liabilities | |
| Other liabilities | |
| Other liabilities | Other liabilities | | 305,656 | | | 12,551 | | | (2,031) | | |
| Total adjustments | Total adjustments | | 1,452,379 | | | 1,019,036 | | | 1,250,759 | | |
| Total adjustments | |
| Total adjustments | |
| Net cash provided by operating activities | Net cash provided by operating activities | | $ | 5,424,217 | | | 4,024,431 | | | 3,631,926 | | |
| Net cash provided by operating activities | |
| Net cash provided by operating activities | |
PUBLIX SUPER MARKETS, INC.
Consolidated Statements of Stockholders’ Equity
Years ended December 26, 2020,30, 2023, December 28, 201931, 2022
and December 29, 201825, 2021
| | | | | | | | | | | | | | | | | | | | | | | | | | | | | | | | | | | | | | | | | | | | | | | | | | | | | |
| | Common Stock | | Additional Paid-in Capital | | Retained Earnings | | Common Stock (Acquired from) Sold to Stock- holders | Accumu- lated Other Compre- hensive Earnings (Losses) | Common Stock Related to ESOP | | Total Stock- holders’ Equity |
| | (Amounts are in thousands, except per share amounts) |
| Balances at December 30, 2017 | | $ | 733,440 | | | 3,139,647 | | | 10,044,564 | | | | 0 | | | | 152,636 | | | | (3,053,138) | | | 11,017,149 | |
| Comprehensive earnings | | — | | | — | | | 2,381,167 | | | | — | | | | (10,088) | | | | — | | | 2,371,079 | |
| Dividends, $1.01 per share | | — | | | — | | | (734,510) | | | | — | | | | — | | | | — | | | (734,510) | |
| Contribution of 8,440 shares to retirement plans | | 6,221 | | | 261,423 | | | — | | | | 81,780 | | | | — | | | | — | | | 349,424 | |
| Acquisition of 33,770 shares from stockholders | | — | | | — | | | — | | | | (1,405,872) | | | | — | | | | — | | | (1,405,872) | |
| Sale of 7,335 shares to stockholders | | 1,380 | | | 56,934 | | | — | | | | 249,619 | | | | — | | | | — | | | 307,933 | |
| Retirement of 25,596 shares | | (25,596) | | | — | | | (1,048,877) | | | | 1,074,473 | | | | — | | | | — | | | 0 | |
| Change for ESOP related shares | | — | | | — | | | — | | | | — | | | | — | | | | (81,861) | | | (81,861) | |
| Cumulative effect of net unrealized gain on equity securities reclassified to retained earnings | | — | | | — | | | 198,310 | | | | — | | | | (198,310) | | | | — | | | 0 | |
| Balances at December 29, 2018 | | 715,445 | | | 3,458,004 | | | 10,840,654 | | | | 0 | | | | (55,762) | | | | (3,134,999) | | | 11,823,342 | |
| Comprehensive earnings | | — | | | — | | | 3,005,395 | | | | — | | | | 137,051 | | | | — | | | 3,142,446 | |
| Dividends, $1.16 per share | | — | | | — | | | (828,733) | | | | — | | | | — | | | | — | | | (828,733) | |
| Contribution of 8,587 shares to retirement plans | | 5,605 | | | 235,017 | | | — | | | | 127,329 | | | | — | | | | — | | | 367,951 | |
| Acquisition of 24,506 shares from stockholders | | — | | | — | | | — | | | | (1,088,570) | | | | — | | | | — | | | (1,088,570) | |
| Sale of 7,026 shares to stockholders | | 1,497 | | | 65,045 | | | — | | | | 245,408 | | | | — | | | | — | | | 311,950 | |
| Retirement of 15,995 shares | | (15,995) | | | — | | | (699,838) | | | | 715,833 | | | | — | | | | — | | | 0 | |
| Change for ESOP related shares | | — | | | — | | | — | | | | — | | | | — | | | | (124,231) | | | (124,231) | |
| | | | | | | | | | | | | | | | | |
| Balances at December 28, 2019 | | 706,552 | | | 3,758,066 | | | 12,317,478 | | | | 0 | | | | 81,289 | | | | (3,259,230) | | | 13,604,155 | |
| Comprehensive earnings | | — | | | — | | | 3,971,838 | | | | — | | | | 119,662 | | | | — | | | 4,091,500 | |
| Dividends, $1.26 per share | | — | | | — | | | (884,369) | | | | — | | | | — | | | | — | | | (884,369) | |
| Contribution of 7,398 shares to retirement plan | | 4,977 | | | 242,724 | | | — | | | | 114,054 | | | | — | | | | — | | | 361,755 | |
| Acquisition of 27,797 shares from stockholders | | — | | | — | | | — | | | | (1,440,312) | | | | — | | | | — | | | (1,440,312) | |
| Sale of 4,829 shares to stockholders | | 107 | | | 5,179 | | | — | | | | 244,522 | | | | — | | | | — | | | 249,808 | |
| Retirement of 20,654 shares | | (20,654) | | | — | | | (1,061,082) | | | | 1,081,736 | | | | — | | | | — | | | 0 | |
| Change for ESOP related shares | | — | | | — | | | — | | | | — | | | | — | | | | (225,319) | | | (225,319) | |
| Balances at December 26, 2020 | | $ | 690,982 | | | 4,005,969 | | | 14,343,865 | | | | 0 | | | | 200,951 | | | | (3,484,549) | | | 15,757,218 | |
| | | | | | | | | | | | | | | | | | | | | | | | | | | | | | | | | | | | | | | | | | | | | | | | | | | | | | | | | | | | | | | | | | | | |
| | Common Stock | Additional Paid-in Capital | Retained Earnings | Common Stock (Acquired from) Sold to Stock- holders | Accumu- lated Other Compre- hensive Earnings (Losses) | Common Stock Related to ESOP | Total Stock- holders’ Equity |
| | | (Amounts are in millions, except per share amounts) | |
| Balances at December 26, 2020 | | $ | 3,455 | | | | 1,159 | | | | 14,427 | | | | — | | | | 201 | | | | (3,485) | | | | 15,757 | | |
| Comprehensive earnings | | — | | | | — | | | | 4,412 | | | | — | | | | (206) | | | | — | | | | 4,206 | | |
| Dividends, $0.286 per share | | — | | | | — | | | | (987) | | | | — | | | | — | | | | — | | | | (987) | | |
| Contribution of 34 shares to retirement plan | | 23 | | | | 267 | | | | — | | | | 118 | | | | — | | | | — | | | | 408 | | |
| Acquisition of 92 shares from stockholders | | — | | | | — | | | | — | | | | (1,137) | | | | — | | | | — | | | | (1,137) | | |
| Sale of 21 shares to stockholders | | — | | | | — | | | | — | | | | 263 | | | | — | | | | — | | | | 263 | | |
| Retirement of 60 shares | | (60) | | | | — | | | | (696) | | | | 756 | | | | — | | | | — | | | | — | | |
| Change for ESOP related shares | | — | | | | — | | | | — | | | | — | | | | — | | | | (340) | | | | (340) | | |
| | | | | | | | | | | | | | | | | | | | | | |
| Balances at December 25, 2021 | | 3,418 | | | | 1,426 | | | | 17,156 | | | | — | | | | (5) | | | | (3,825) | | | | 18,170 | | |
| Comprehensive earnings | | — | | | | — | | | | 2,918 | | | | — | | | | (604) | | | | — | | | | 2,314 | | |
| Dividends, $0.344 per share | | — | | | | — | | | | (1,166) | | | | — | | | | — | | | | — | | | | (1,166) | | |
| Contribution of 31 shares to retirement plan | | 20 | | | | 254 | | | | — | | | | 153 | | | | — | | | | — | | | | 427 | | |
| Acquisition of 152 shares from stockholders | | — | | | | — | | | | — | | | | (2,137) | | | | — | | | | — | | | | (2,137) | | |
| Sale of 27 shares to stockholders | | — | | | | 7 | | | | — | | | | 375 | | | | — | | | | — | | | | 382 | | |
| Retirement of 114 shares | | (114) | | | | — | | | | (1,495) | | | | 1,609 | | | | — | | | | — | | | | — | | |
| Change for ESOP related shares | | — | | | | — | | | | — | | | | — | | | | — | | | | (204) | | | | (204) | | |
| | | | | | | | | | | | | | | | | | | | | | |
| Balances at December 31, 2022 | | 3,324 | | | | 1,687 | | | | 17,413 | | | | — | | | | (609) | | | | (4,029) | | | | 17,786 | | |
| Comprehensive earnings | | — | | | | — | | | | 4,349 | | | | — | | | | 205 | | | | — | | | | 4,554 | | |
| Dividends, $0.39 per share | | — | | | | — | | | | (1,296) | | | | — | | | | — | | | | — | | | | (1,296) | | |
| Contribution of 31 shares to retirement plan | | 22 | | | | 309 | | | | — | | | | 119 | | | | — | | | | — | | | | 450 | | |
| Acquisition of 79 shares from stockholders | | — | | | | — | | | | — | | | | (1,165) | | | | — | | | | — | | | | (1,165) | | |
| Sale of 18 shares to stockholders | | — | | | | 9 | | | | — | | | | 269 | | | | — | | | | — | | | | 278 | | |
| Retirement of 52 shares | | (52) | | | | — | | | | (725) | | | | 777 | | | | — | | | | — | | | | — | | |
| Change for ESOP related shares | | — | | | | — | | | | — | | | | — | | | | — | | | | (191) | | | | (191) | | |
| Balances at December 30, 2023 | | $ | 3,294 | | | | 2,005 | | | | 19,741 | | | | — | | | | (404) | | | | (4,220) | | | | 20,416 | | |
See accompanying notes to consolidated financial statements.
24
PUBLIX SUPER MARKETS, INC.
Notes to Consolidated Financial Statements
(1) Summary of Significant Accounting Policies
(a)Business
Publix Super Markets, Inc. and its wholly owned subsidiaries (Company) are in the business of operating retail food supermarkets in Florida, Georgia, Alabama, South Carolina, Tennessee, North Carolina Tennessee and Virginia. The Company opened its first supermarket in Kentucky in January 2024. The Company was founded in 1930 and later merged into another corporation that was originally incorporated in 1921. The Company has no other significant lines of business or industry segments.
(b)Principles of Consolidation
The consolidated financial statements include the accounts of the Company, its wholly owned subsidiaries and certain joint ventures in which the Company has a controlling financial interest. All significant intercompany balances and transactions are eliminated in consolidation.
(c)Fiscal Year
The Company’s fiscal year ends on the last Saturday in December. Fiscal years 2020, 20192023 and 20182021 include 52 weeks and fiscal year 2022 includes 53 weeks.
(d)Cash Equivalents
The Company considers all liquid investments with maturities of three months or less to be cash equivalents.
(e)Trade Receivables
Trade receivables primarily include amounts due from vendor rebates, debit and credit card sales and pharmacy third party insurance pharmacy billings.reimbursements.
(f)Inventories
Inventories are valued at the lower of cost or market. The dollar value last-in, first-out (LIFO) method was used to determine the cost for 84% and 85%81% of inventories as of December 26, 202030, 2023 and December 28, 2019, respectively.31, 2022. Under this method, inventory is stated at cost, which is determined by applying a cost-to-retail ratio to each similar merchandise category’s ending retail value. The cost of the remaining inventories was determined using the first-in, first-out (FIFO) method. The FIFO cost of inventory approximates replacement or current cost. The FIFO method is used to value certain manufactured, seasonal, perishable and other miscellaneous inventory items due to fluctuating costs and inconsistent product availability. The Company also reduces inventory for estimated losses related to shrink. If all inventories were valued using the FIFO method, inventories and current assets would have been higher than reported by $548,749,000$893 million and $528,997,000$805 million as of December 26, 202030, 2023 and December 28, 2019,31, 2022, respectively.
(g)Investments
In 2020, the Company adopted the Accounting Standards Update (ASU) requiring companies to recognize credit losses on debt securities in earnings through an allowance that is reevaluated each reporting period. The Company adopted the ASU on a prospective basis as of December 29, 2019. Prior to the adoption of the ASU, credit losses in which the Company did not expect to recover the cost of the debt security were recognized in earnings as an other-than-temporary impairment. The adoption of the ASU did not have a material effect on the Company’s financial position, results of operations or cash flows.
Debt securities are classified as available-for-sale and measured at fair value. The Company evaluates debt securities on an individual security basis to determine if an unrealized loss is due to a credit loss or other factors, including interest rate fluctuations. The collectability of debt securities is evaluated based on criteria that include the extent to which the cost (cost of the debt security adjusted for amortization of premium or accretion of discount) exceeds fair value, the credit rating of the issuer or security, the failure of the issuer to make scheduled principal or interest payments and the financial health and prospects of the issuer or security.
Credit losses on debt securities the Company does not intend to sell and will not be required to sell prior to any anticipated recovery are recognized in earnings through an allowance. The allowance is measured as the difference between the present value of expected cash flows and the cost of the debt security, limited to the difference between the cost and the fair value of the debt security. Expected cash flows are discounted using the debt security’s effective interest rate. Subsequent changes to the allowance are recognized in earnings in the period of the change. Credit losses on debt securities the Company intends to sell or will be required to sell prior to any anticipated recovery are recognized in earnings and measured as the difference between the cost and the fair value of the debt security.
PUBLIX SUPER MARKETS, INC.
Notes to Consolidated Financial Statements
Other unrealized losses on debt securities the Company does not intend to sell and will not be required to sell prior to any anticipated recovery are reported in other comprehensive earnings net of income taxes and included as a component of stockholders’ equity. Other unrealized losses on debt securities the Company intends to sell or will be required to sell prior to any anticipated recovery are recognized in earnings and measured as the difference between the cost and the fair value of the debt security.
Equity securities are measured at fair value with net unrealized gains and losses from changes in the fair value recognized in earnings (fair value adjustment).
PUBLIX SUPER MARKETS, INC.
Notes to Consolidated Financial Statements
Interest and dividend income, amortization of premiums, accretion of discounts and realized gains and losses on debt and equity securities are included in investment income. Interest income is accrued as earned. Dividend income is recognized as income on the ex-dividend date. The cost of debt and equity securities sold is based on the specific identification method.
(h)Leases
The Company conducts a major portion of its retail operations from leased locations. The Company determines whether a lease exists at inception. Initial lease terms are typically 20 years followed by five year renewal options and may include rent escalation clauses. The Company recognizes right-of-use assets and lease liabilities based on the present value of future lease payments. Future lease payments include the initial lease term and any renewal options to the extent it is reasonably certain the option will be exercised. The present value of future lease payments is determined by using the Company’s incremental borrowing rate at the time of lease commencement. The incremental borrowing rate is estimated based on a composite index of debt for similarly rated companies with comparable terms.
Operating lease expense primarily represents fixed lease payments for operating leases recognized on a straight-line basis over the applicable lease term. Variable lease expense represents the payment of real estate taxes, insurance, maintenance and, for certain locations, additional rentals based on a percentage of sales in excess of stipulated minimums (excess rent). The payment of variable real estate taxes, insurance and maintenance is generally based on the Company’s pro-rata share of total shopping center square footage. The Company estimates excess rent, where applicable, based on annual sales projections and uses the straight-line method to amortize the cost. The annual sales projections are reviewed periodically and adjusted if necessary.
(i)Property, Plant and Equipment and Depreciation
Assets are recorded at cost and depreciated or amortized using the straight-line method over their estimated useful lives or the terms of the related leases, if shorter, as follows: buildings and improvements (10–(10‑40 years); furniture, fixtures and equipment (3–(3‑20 years); leasehold improvements (10‑20 years); and leasehold improvements (10–finance lease right-of-use assets (5‑20 years).
Maintenance and repairs are expensed as incurred. Expenditures for renewals and betterments are capitalized. The gain or loss realized on disposed assets or assets to be disposed of is recorded in earnings.
(j)Long-Lived Assets
The Company reviews its long-lived assets for impairment whenever events or changes in circumstances indicate that the net book value of an asset may not be recoverable. Recoverability of assets to be held and used is measured by a comparison of the net book value of an asset to the future net undiscounted cash flows expected to be generated by the asset. An impairment loss is recorded for the excess of the net book value over the fair value of the asset. The fair value is estimated based on expected discounted future cash flows. Assets to be disposed of are reported at the lower of the carrying amount or fair value less cost to sell and are no longer depreciated or amortized. Long-lived assets, including operating lease right-of-use assets, buildings and improvements, leasehold improvements, and furniture, fixtures and equipment, leasehold improvements and finance lease right-of-use assets, are evaluated for impairment at the supermarket level.
(k)Self-Insurance
The Company is generally self-insured for claims related to health care, employee benefits, workers’ compensation, general liability, property, plant and equipment, fleet liability and directors and officers liability. The Company uses third party insurance in certain instances to partially mitigate the risk related to these potential losses. Self-insurance reserves are established for health care, workers’ compensation, general liability and fleet liability claims. These reserves are determined based on actual claims experience and an estimate of claims incurred but not reported including, where necessary, actuarial studies. Actuarial projections of losses for general liability and workers’ compensation claims are discounted.
PUBLIX SUPER MARKETS, INC.
Notes to Consolidated Financial Statements
(l)Postretirement Benefit
The Company provides a postretirement life insurance benefit for certain salaried and hourly full-time employees who meet the eligibility requirements. Effective January 1, 2002, the Company amended the postretirement life insurance benefit under its Group Life Insurance Plan. To receive the postretirement life insurance benefit after the amendment, an employee must have had at least five years of full-time service and the employee’s age plus years of credited service must have equaled 65 or greater as of October 1, 2001. At retirement, such employees also must be at least age 55 with at least 10 years of full-time service to be eligible to receive the postretirement life insurance benefit.
PUBLIX SUPER MARKETS, INC.
Notes to Consolidated Financial Statements
Actuarial projections are used to calculate the year end postretirement benefit obligation, discounted using a yield curve methodology based on high quality bonds with a rating of AA or better. Actuarial gains and losses are amortized from accumulated other comprehensive earnings into net periodic postretirement benefit cost over future years when the accumulation of such gains or losses exceeds 10% of the year end postretirement benefit obligation. The Company included the accrued postretirement benefit obligation of $92 million and $93 million in other noncurrent liabilities on the consolidated balance sheets as of December 30, 2023 and December 31, 2022, respectively.
(m)Stock Split
On April 1, 2022, the Company filed Articles of Amendment to its Restated Articles of Incorporation in order to effect a 5-for-1 stock split of the Company’s common stock, par value $1.00 per share (Common Stock), and an increase in the number of authorized shares of Common Stock from 1 billion to 4 billion, effective as of the close of business April 14, 2022. The Articles of Amendment were approved by the Company’s Board of Directors on April 1, 2022. All applicable data, including share and per share amounts, in the consolidated financial statements and accompanying notes have been retroactively adjusted to give effect to the stock split.
(n)Comprehensive Earnings
Comprehensive earnings include net earnings and other comprehensive earnings. Other comprehensive earnings include revenues, expenses, gains and losses that have been excluded from net earnings and recorded directly to stockholders’ equity. Included in other comprehensive earnings are certain unrealized gains and losses on debt securities and adjustments to the postretirement benefit obligation net of income taxes.
(n)(o)Revenue Recognition
The Company sells grocery (including dairy, produce, floral, deli, bakery, meat and seafood), health and beauty care, general merchandise, pharmacy and other products and services. Grocery was 85%81% of sales for 20202023, 83% of sales for 2022 and 84% of sales for 2019 and 2018.2021. All other products and services were 15%19% of sales for 20202023, 17% of sales for 2022 and 16% of sales for 2019 and 2018.2021.
Revenue is recognized at the point of sale for retail sales. Customer returns are immaterial. Vendor coupons that are reimbursed are accounted for as sales. Coupons and other sales incentives offered by the Company that are not reimbursed are recorded as a reduction of sales. The Company records sales net of applicable sales taxes.
(o)(p)Other Operating Income
Other operating income is recognized on a net basis as earned. Other operating income includes income generated from other activities, primarily automated teller transaction fees, licensee sales commissions, lottery commissions, mall gift card commissions, money order commissions, money transfer fees and vending machine commissions.
(p)(q)Cost of Merchandise Sold
Cost of merchandise sold includes costs of inventory and costs related to in-store production. Cost of merchandise sold also includes inbound freight charges, purchasing and receiving costs, warehousing costs and other costs of the Company’s distribution network.
Rebates received from a vendor in connection with the purchase or promotion of the vendor’s products are recognized as a reduction of cost of merchandise sold as earned. These vendor rebates are recognized as earned in accordance with the underlying agreement with the vendor and completion of the earnings process. Short-term vendor agreements with advance payment provisions are recorded as a current liability and recognized over the appropriate period as earned according to the underlying agreements. Long-term vendor agreements with advance payment provisions are recorded as a noncurrent liability and recognized over the appropriate period as earned according to the underlying agreements.
(q)(r)Advertising Costs
Advertising costs are expensed as incurred and were $244,839,000, $245,403,000$318 million, $317 million and $249,123,000$280 million for 2020, 20192023, 2022 and 2018,2021, respectively.
(r)(s)Other Nonoperating Income, net
Other nonoperating income, net includes rent from tenants in owned shopping centers, net of related expenses, and other miscellaneous nonoperating income.
PUBLIX SUPER MARKETS, INC.
Notes to Consolidated Financial Statements
(s)(t)Income Taxes
Deferred income taxes are established for temporary differences between financial and tax reporting bases and are subsequently adjusted to reflect changes in income tax rates expected to be in effect when the temporary differences reverse. The Company recognizes accrued interest and penalties related to income tax liabilities as a component of income tax expense. The Company invests in certain investment related tax credits that promote affordable housing and renewable energy. These investments generate a return primarily through the realization of federal and state tax credits and other tax benefits. The Company accounts for its affordable housing investments using the proportional amortization method. Under this method, the investment is amortized into income tax expense in proportion to the tax credits received and the investment tax credits are recognized as a reduction of income tax expense. The Company accounts for its renewable energy investments using the deferral method. Under this method, the investment tax credits are recognized as a reduction of the renewable energy investments.
(t)(u)Common Stock and Earnings Per Share
Earnings per share is calculated by dividing net earnings by the weighted average shares outstanding. Basic and diluted earnings per share are the same because the Company does not have options or other stock compensation programs that impact the calculation of diluted earnings per share. All shares owned by the Employee Stock Ownership Plan (ESOP) are included in the earnings per share calculations. Dividends paid to the ESOP, as well as dividends on all other common stock shares, are reflected as a reduction of retained earnings. All common stock shares, including ESOP and 401(k) Plan shares, receive one vote per share and have the same dividend rights. The voting rights for ESOP shares allocated to participants’ accounts are passed through to the participants. The Trustee of the Company’s common stock in the 401(k) Plan votes the shares held in that plan.
(u)(v)Use of Estimates
The preparation of financial statements in conformity with U.S. generally accepted accounting principles requires management to make estimates and assumptions that affect the reported amounts of assets and liabilities and disclosure of contingent assets and liabilities as of the date of the financial statements and the reported amounts of revenues and expenses during the reporting period. Actual results could differ from those estimates.
(2) Fair Value of Financial Instruments
The fair value of certain of the Company’s financial instruments, including cash and cash equivalents, trade receivables and accounts payable, approximates their respective carrying amounts due to their short-term maturity.
The fair value of investments is based on market prices using the following measurement categories:
Level 1 – Fair value is determined by using quoted prices in active markets for identical investments. Investments included in this category are equity securities (exchange(primarily exchange traded funds and individual equity securities)funds).
Level 2 – Fair value is determined by using other than quoted prices. By using observable inputs (for example, benchmark yields, interest rates, reported trades and broker dealer quotes), the fair value is determined through processes such as benchmark curves, benchmarking of similar securities and matrix pricing of corporate, government-sponsored agency, state and municipal bonds by using pricing of similar bonds based on coupons, ratings and maturities. Investments included in this category are primarily debt securities (tax(taxable and tax exempt and taxable bonds), including restricted investments in taxable bonds held as collateral.
Level 3 – Fair value is determined by using other than observable inputs. Fair value is determined by using the best information available in the circumstances and requires significant management judgment or estimation. No investments are currently included in this category.
Following is a summary of fair value measurements for investments as of December 26, 202030, 2023 and December 28, 2019:31, 2022:
| | | | | | | | | | | | | | | | | | | | | | | | | | |
| | Fair Value | | Level 1 | | Level 2 | | Level 3 |
| | (Amounts are in thousands) |
| December 26, 2020 | | $ | 11,288,199 | | | 1,465,987 | | | 9,822,212 | | | 0 | |
| December 28, 2019 | | 8,426,385 | | | 2,028,547 | | | 6,397,838 | | | 0 | |
| | | | | | | | | | | | | | | | | | | | | | | | | | |
| | Fair Value | | Level 1 | | Level 2 | | Level 3 |
| | (Amounts are in millions) |
| December 30, 2023 | | $ | 13,766 | | | 2,665 | | | 11,101 | | | — | |
| December 31, 2022 | | 11,558 | | | 2,137 | | | 9,421 | | | — | |
PUBLIX SUPER MARKETS, INC.
Notes to Consolidated Financial Statements
(3) Investments
(a)Debt Securities
Following is a summary of debt securities as of December 26, 202030, 2023 and December 28, 2019:31, 2022:
| | | Cost | | | | Cost | | Gross Unrealized Gains | Gross Unrealized Losses | Fair Value |
| | (Amounts are in millions) | | | | (Amounts are in millions) |
| 2023 | |
| Taxable bonds | |
| Taxable bonds | |
| Taxable bonds | |
| | Cost | | Gross Unrealized Gains | Gross Unrealized Losses | Fair Value |
| (Amounts are in thousands) |
| 2020 | |
| Restricted investments | |
| Restricted investments | |
| Restricted investments | |
| | $ | |
| 2022 | |
| Taxable bonds | |
| Taxable bonds | |
| Taxable bonds | |
| Tax exempt bonds | Tax exempt bonds | | $ | 548,438 | | | 7,408 | | | 88 | | | 555,758 | |
| Taxable bonds | | 8,182,003 | | | 286,745 | | | 8,324 | | | 8,460,424 | |
| Restricted investments | Restricted investments | | 167,727 | | | 14,383 | | | 0 | | | 182,110 | |
| $ | 8,898,168 | | | 308,536 | | | 8,412 | | | 9,198,292 | |
| 2019 | | | | | | | | |
| Tax exempt bonds | | $ | 767,931 | | | 3,429 | | | 130 | | | 771,230 | |
| Taxable bonds | | 5,002,036 | | | 120,132 | | | 1,443 | | | 5,120,725 | |
| Restricted investments | | 169,983 | | | 10,101 | | | 0 | | | 180,084 | |
| $ | 5,939,950 | | | 133,662 | | | 1,573 | | | 6,072,039 | |
| | $ | |
The Company maintains restricted investments primarily for the benefit of the Company’s insurance carrier related to self-insurance reserves. These investments are held as collateral and not used for claim payments.
TheFollowing is a summary of the cost and fair value of debt securities by expected maturity as of December 26, 202030, 2023 and December 28, 2019 are as follows:31, 2022:
| | | 2020 | | 2019 |
| Cost | | Fair Value | | Cost | | Fair Value |
| (Amounts are in thousands) | |
| | 2023 | | | | 2023 | | 2022 |
| | Cost | | | | Cost | | Fair Value | | Cost | | Fair Value |
| | | | (Amounts are in millions) | |
| Due in one year or less | |
| Due in one year or less | |
| Due in one year or less | Due in one year or less | | $ | 677,453 | | | 682,965 | | | 437,236 | | | 438,105 | |
| Due after one year through five years | Due after one year through five years | | 5,330,696 | | | 5,533,074 | | | 3,836,333 | | | 3,900,904 | |
| Due after five years through ten years | Due after five years through ten years | | 2,886,333 | | | 2,978,301 | | | 1,661,143 | | | 1,727,594 | |
| Due after ten years | Due after ten years | | 3,686 | | | 3,952 | | | 5,238 | | | 5,436 | |
| $ | 8,898,168 | | | 9,198,292 | | | 5,939,950 | | | 6,072,039 | |
| | $ | |
PUBLIX SUPER MARKETS, INC.
Notes to Consolidated Financial Statements
The Company had 0no debt securities with credit losses as of December 26, 2020.30, 2023 and December 31, 2022.
Following is a summary of debt securities with other unrealized losses by the time period impaired as of December 26, 202030, 2023 and December 28, 2019:31, 2022:
| | | | | | | | | | | | | | | | | | | | | | | | | | | | | | | | | | | | | | | | | | | | | | | | | | | | | | | | |
| | Less Than 12 Months | | 12 Months or Longer | | Total |
| | Fair Value | | Unrealized Losses | | Fair Value | | Unrealized Losses | | Fair Value | | Unrealized Losses |
| | (Amounts are in thousands) | |
| 2020 | | | | | | | | | | | | | | | | | | |
| Tax exempt bonds | | $ | 3,704 | | | | 88 | | | | 0 | | | | 0 | | | | 3,704 | | | | 88 | | |
| Taxable bonds | | 1,157,387 | | | | 7,946 | | | | 39,622 | | | | 378 | | | | 1,197,009 | | | | 8,324 | | |
| | | | | | | | | | | | | | | | | | |
| | $ | 1,161,091 | | | | 8,034 | | | | 39,622 | | | | 378 | | | | 1,200,713 | | | | 8,412 | | |
| 2019 | | | | | | | | | | | | | | | | | | |
| Tax exempt bonds | | $ | 48,462 | | | | 11 | | | | 99,976 | | | | 119 | | | | 148,438 | | | | 130 | | |
| Taxable bonds | | 573,315 | | | | 888 | | | | 197,641 | | | | 555 | | | | 770,956 | | | | 1,443 | | |
| | | | | | | | | | | | | | | | | | |
| | $ | 621,777 | | | | 899 | | | | 297,617 | | | | 674 | | | | 919,394 | | | | 1,573 | | |
| | | | | | | | | | | | | | | | | | | | | | | | | | | | | | | | | | | | | | | | | | | | | | | | | | | | | | | | |
| | Less Than 12 Months | | 12 Months or Longer | | Total |
| | Fair Value | | Unrealized Losses | | Fair Value | | Unrealized Losses | | Fair Value | | Unrealized Losses |
| | (Amounts are in millions) | |
| 2023 | | | | | | | | | | | | | | | | | | |
| | | | | | | | | | | | | | | | | | |
| Taxable bonds | | $ | 1,276 | | | | 2 | | | | 7,845 | | | | 572 | | | | 9,121 | | | | 574 | | |
| Restricted investments | | 30 | | | | 1 | | | | 76 | | | | 2 | | | | 106 | | | | 3 | | |
| | $ | 1,306 | | | | 3 | | | | 7,921 | | | | 574 | | | | 9,227 | | | | 577 | | |
| 2022 | | | | | | | | | | | | | | | | | | |
| | | | | | | | | | | | | | | | | | |
| Taxable bonds | | $ | 3,705 | | | | 199 | | | | 4,627 | | | | 631 | | | | 8,332 | | | | 830 | | |
| Restricted investments | | 151 | | | | 2 | | | | 15 | | | | 2 | | | | 166 | | | | 4 | | |
| | $ | 3,856 | | | | 201 | | | | 4,642 | | | | 633 | | | | 8,498 | | | | 834 | | |
There are 51437 debt securities contributing to the total unrealized losses of $8,412,000$577 million as of December 26, 2020.30, 2023. Unrealized losses related to debt securities are primarily due to increases in interest rates that occurred since the debt securities were purchased. The Company continues to receive scheduled principal and interest payments on these debt securities.
(b)Equity Securities
The fair value of equity securities was $2,089,907,000$2.7 billion and $2,354,346,000$2.5 billion as of December 26, 202030, 2023 and December 28, 2019,31, 2022, respectively.
(c)Investment Income (Loss)
Net realized gain or loss on investments represents the difference between the cost and the proceeds from the sale of debt and equity securities. The net realized gain or loss on investments excludes the net gain or loss on the sale of equity securities previously recognized through the fair value adjustment, which is presented separately in the following table.
Following is a summary of investment income (loss) for 2020, 20192023, 2022 and 2018:2021:
| | 2020 | 2019 | 2018 |
| 2023 | | | 2023 | 2022 | 2021 |
| | | (Amounts are in thousands) | | (Amounts are in millions) |
| Interest and dividend income | Interest and dividend income | | $ | 199,435 | | | 186,748 | | | 129,953 | | |
| Net realized gain on investments | | 396,584 | | | 104,905 | | | 109,547 | | |
| 596,019 | | | 291,653 | | | 239,500 | | |
| Net realized gain (loss) on investments | |
| Net realized gain (loss) on investments | |
| Net realized gain (loss) on investments | |
| | 513 | |
| | 513 | |
| | 513 | |
| Fair value adjustment, due to net unrealized gain (loss), on equity securities held at end of year | Fair value adjustment, due to net unrealized gain (loss), on equity securities held at end of year | | 554,547 | | | 472,490 | | | (107,466) | | |
| Net (gain) loss on sale of equity securities previously recognized through fair value adjustment | | (175,560) | | | 50,229 | | | (75,335) | | |
| $ | 975,006 | | | 814,372 | | | 56,699 | | |
| Fair value adjustment, due to net unrealized gain (loss), on equity securities held at end of year | |
| Fair value adjustment, due to net unrealized gain (loss), on equity securities held at end of year | |
| Net gain on sale of equity securities previously recognized through fair value adjustment | |
| Net gain on sale of equity securities previously recognized through fair value adjustment | |
| Net gain on sale of equity securities previously recognized through fair value adjustment | |
| | $ | |
| | $ | |
| | $ | |
PUBLIX SUPER MARKETS, INC.
Notes to Consolidated Financial Statements
(4) Leases
(a)Lessee
In 2019, the Company adopted the ASU requiring theFollowing is a summary of lease rightsexpense for 2023, 2022 and obligations arising from existing and new lease agreements be recognized as assets and liabilities on the balance sheet. The Company adopted the ASU on a modified retrospective basis and elected the transitional provisions eliminating the requirement to restate reporting periods prior to the date of adoption. The adoption of the ASU did not have a material effect on the Company’s results of operations and had no effect on the Company’s cash flows.2021:
| | | | | | | | | | | | | | | | | | | | | | | | | | | | | |
| | | | | | | |
| 2023 | 2022 | 2021 |
| (Amounts are in millions) |
| Operating lease expense | | $ | 475 | | | | 457 | | | | 445 | | |
| Finance lease expense: | | | | | | | | | |
| Amortization of right-of-use assets | | 32 | | | | 29 | | | | 22 | | |
| Interest on lease liabilities | | 17 | | | | 15 | | | | 11 | | |
| Variable lease expense | | 203 | | | | 181 | | | | 166 | | |
| Sublease rental income | | (1) | | | | (1) | | | | (2) | | |
| | $ | 726 | | | | 681 | | | 642 | |
Following is a summary of finance lease right-of-use assets included in net property, plant and equipment and finance lease liabilities included in other accrued expenses and other noncurrent liabilities as of December 26, 2020 and December 28, 2019.
| | | | | | | | | | | | | | | | | | | | |
| 2020 | 2019 |
| (Amounts are in thousands) |
| Finance lease right-of-use assets | | $ | 291,556 | | | | 154,217 | | |
| Finance lease liabilities: | | | | | | |
| Current | | 25,254 | | | | 29,480 | | |
| Noncurrent | | 246,411 | | | | 104,806 | | |
Lease expense for 2020 and 2019 was as follows:
| | | | | | | | | | | | | | | | | | | | |
| | | | |
| 2020 | 2019 |
| (Amounts are in thousands) |
| Operating lease expense | | $ | 443,063 | | | | 434,555 | | |
| Finance lease expense: | | | | | | |
| Amortization of right-of-use assets | | 9,850 | | | | 8,128 | | |
| Interest on lease liabilities | | 4,651 | | | | 3,105 | | |
| Variable lease expense | | 159,236 | | | | 147,463 | | |
| Sublease rental income | | (2,819) | | | | (2,874) | | |
| | $ | 613,981 | | | | 590,377 | | |
Supplementalsupplemental cash flow information related to leases for 20202023, 2022 and 2019 was2021:
| | | | | | | | | | | | | | | | | | | | | | | | | | | | | |
| | | | | | | | | |
| 2023 | 2022 | 2021 |
| (Amounts are in millions) |
| Operating cash flows from rent paid for operating lease liabilities | | $ | 467 | | | | 451 | | | | 444 | | |
| | | | | | | | | |
| | | | | | | | | |
| | | | | | | | | |
| Right-of-use assets obtained in exchange for new lease liabilities: | | | | | | | | | |
| Operating leases | | 483 | | | | 445 | | | | 362 | | |
| Finance leases | | 150 | | | | 96 | | | | 188 | | |
| | | | | | | | | |
| | | | | | | | | |
| | | | | | | | | |
| | | | | | | | | |
| | | | | | | | | |
| | | | | | | | | |
Following is a summary of the weighted average remaining lease term and weighted average discount rate as follows:of December 30, 2023 and December 31, 2022:
| | | 2020 | 2019 |
| (Amounts are in thousands) |
| Operating cash flows from rent paid for operating lease liabilities | | $ | 436,988 | | | 422,596 | | |
| | Right-of-use assets obtained in exchange for new lease liabilities: | |
| 2023 | | | 2023 | 2022 |
| Weighted average remaining lease term: | |
| Operating leases | |
| Operating leases | |
| Operating leases | Operating leases | | 364,757 | | | 463,727 | | |
| Finance leases | Finance leases | | 174,307 | | | 65,539 | | |
| | Finance leases | |
| Finance leases | |
| Weighted average discount rate: | |
| Weighted average discount rate: | |
| Weighted average discount rate: | |
| Operating leases | |
| Operating leases | |
| Operating leases | |
| Finance leases | |
| Finance leases | |
| Finance leases | |
PUBLIX SUPER MARKETS, INC.
Notes to Consolidated Financial Statements
The weighted average remaining lease term and weighted average discount rate asFollowing is a summary of December 26, 2020 and December 28, 2019 are as follows:
| | | | | | | | | | | | | | | | | | | | |
| 2020 | 2019 |
| Weighted average remaining lease term: | | | | | | |
| Operating leases | | 12 years | | | 12 years | |
| Finance leases | | 19 years | | | 18 years | |
| Weighted average discount rate: | | | | | | |
| Operating leases | | 3.4 | % | | | 3.5 | % | |
| Finance leases | | 3.3 | % | | | 3.9 | % | |
Maturitiesmaturities of lease liabilities as of December 26, 2020 are as follows:30, 2023:
| | | Year | Year | | Operating
Leases | | Finance
Leases | |
| (Amounts are in thousands) | |
| 2021 | | $ | 438,358 | | | 32,962 | | |
| 2022 | | 414,464 | | | 18,163 | | |
| 2023 | | 372,632 | | | 32,879 | | |
| Year | |
| Year | |
| | (Amounts are in millions) | |
| | (Amounts are in millions) | |
| | (Amounts are in millions) | |
| 2024 | |
| 2024 | |
| 2024 | 2024 | | 326,523 | | | 17,194 | | |
| 2025 | 2025 | | 275,623 | | | 17,194 | | |
| 2025 | |
| 2025 | |
| 2026 | |
| 2026 | |
| 2026 | |
| 2027 | |
| 2027 | |
| 2027 | |
| 2028 | |
| 2028 | |
| 2028 | |
| Thereafter | Thereafter | | 1,797,109 | | | 233,575 | | |
| 3,624,709 | | | 351,967 | | |
| Thereafter | |
| Thereafter | |
| | 3,800 | |
| | 3,800 | |
| | 3,800 | |
| Less: Imputed interest | Less: Imputed interest | | (690,646) | | | (80,302) | | |
| $ | 2,934,063 | | | 271,665 | | |
| Less: Imputed interest | |
| Less: Imputed interest | |
| | $ | |
| | $ | |
| | $ | |
As of December 26, 2020,30, 2023, the Company has lease agreements that have not yet commenced with fixed lease payments totaling $359,498,000.$532 million. These leases will commence in future periods with terms ranging up to 20 years.
Prior to the adoption of the ASU, minimum rentals represented fixed lease obligations, including insurance and maintenance to the extent they were fixed in the lease. Contingent rentals represented variable lease obligations, including real estate taxes, insurance, maintenance and, for certain locations, excess rent. The Company recognized rent expense for operating leases with rent escalation clauses on a straight-line basis over the applicable lease term.
Total rental expense for 2018 was as follows:
| | | | | | | | | | | |
| | 2018 | |
| (Amounts are in thousands) |
Minimum rentals | | $ | 449,138 | | |
Contingent rentals | | 133,382 | | |
Sublease rental income | | (4,339) | | |
| | $ | 578,181 | | |
PUBLIX SUPER MARKETS, INC.
Notes to Consolidated Financial Statements
(b) Lessor
The Company leases space in owned shopping centers to tenants under noncancelable operating leases. The Company determines whether a lease exists at inception. Initial lease terms are typically five years followed by five year renewal options and may include rent escalation clauses. Lease income primarily represents fixed lease payments from tenants recognized on a straight-line basis over the applicable lease term. Variable lease income represents tenant payments for real estate taxes, insurance, maintenance and, for certain locations, excess rent.
TotalFollowing is a summary of total lease income was $172,309,000, $190,785,000 for 2023, 2022 and $183,963,000 for 2020, 2019 and 2018, respectively. Total lease income for 2020 and 2019 was as follows:2021:
| | 2020 | 2019 |
| (Amounts are in thousands) |
| 2023 | | | 2023 | 2022 | 2021 |
| (Amounts are in millions) | | | (Amounts are in millions) |
| Lease income | Lease income | | $ | 133,512 | | | 149,313 | | |
| Variable lease income | Variable lease income | | 38,797 | | | 41,472 | | |
| $ | 172,309 | | | 190,785 | | |
| Variable lease income | |
| Variable lease income | |
| | $ | |
| | $ | |
| | $ | |
In 2020, the Company offered two monthsFollowing is a summary of rent relief to tenants in Company owned shopping centers that were impacted by the coronavirus pandemic. The rent relief was recorded as a reduction to lease income and variable lease income.
Futurefuture fixed lease payments for all noncancelable operating leases as of December 26, 2020 are as follows:30, 2023:
| | Year | Year | |
(Amounts are in thousands) | | 2021 | $ | 149,716 | |
| 2022 | 122,580 | |
| 2023 | 97,354 | |
| (Amounts are in millions) | |
| (Amounts are in millions) | |
| (Amounts are in millions) | |
| 2024 | 2024 | 69,995 | |
| 2025 | 2025 | 44,908 | |
| 2026 | |
| 2027 | |
| 2028 | |
| Thereafter | Thereafter | 159,256 | |
| $ | 643,809 | |
| $ | |
PUBLIX SUPER MARKETS, INC.
Notes to Consolidated Financial Statements
(5) Consolidation of Joint Ventures and Long-Term Debt
From time to time, the Company enters into a joint venture (JV), in the legal form of a limited liability company, with certain real estate developers to partner in the development of a shopping center with the Company as the anchor tenant. The Company consolidates certain of these JVs in which it has a controlling financial interest. The Company is considered to have a controlling financial interest in a JV when it has (1) the power to direct the activities of the JV that most significantly impact the JV’s economic performance and (2) the obligation to absorb losses or the right to receive benefits from the JV that could potentially be significant to such JV.
The Company evaluates a JV using specific criteria to determine whether the Company has a controlling financial interest and is the primary beneficiary of the JV. Factors considered in determining whether the Company is the primary beneficiary include risk and reward sharing, experience and financial condition of the other JV members, voting rights, involvement in routine capital and operating decisions and each member’s influence over the JV owned shopping center’s economic performance.
Generally, most major JV decision making is shared between all members. In particular, the use and sale of JV assets, business plans and budgets are generally required to be approved by all members. However, the Company, through its anchor tenant operating lease agreement, has the power to direct the activities that most significantly influence the economic performance of the JV owned shopping center. Additionally, through its member equity interest in the JV, the Company will receive a significant portion of the JV’s benefits or is obligated to absorb a significant portion of the JV’s losses. Substantially all of the JVs are consolidated as the Company is the primary beneficiary of the JVs.
As of December 26, 2020,30, 2023, the carrying amounts of the assets and liabilities of the consolidated JVs were $199,230,000$140 million and $77,565,000,$38 million, respectively. As of December 28, 2019,31, 2022, the carrying amounts of the assets and liabilities of the consolidated JVs were $154,659,000$136 million and $78,472,000,$40 million, respectively. The assets are owned by and the liabilities are obligations of the JVs, not the Company, except for a portion of the long-term debt of certain JVs guaranteed by the Company. The JVs are financed with capital contributions from the members, loans and/or the cash flows generated by the JV owned shopping centers once in operation. Total earnings attributable to noncontrolling interests for 2020, 20192023, 2022 and 20182021 were immaterial. The Company’s involvement with these JVs does not have a significant effect on the Company’s financial condition, results of operations or cash flows.
The Company’s long-term debt results primarily from the consolidation of loans of certain JVs and loans assumed in connection with the acquisition of certain shopping centers with the Company as the anchor tenant. NaNNo loans were assumed during 20202023 or 2019.2022. Maturities of JV loans range from January 2021June 2026 through April 2027 and have variable interest rates based on a LIBORSecured Overnight Financing Rate (SOFR) index plus 175200 to 250210 basis points. Maturities of assumed shopping center loans range from April 20212024 through January 2027 and have fixed interest rates ranging from 3.7%4.5% to 7.5%.
AsFollowing is a summary of December 26, 2020, the aggregate annual maturities and scheduled payments of long-term debt are as follows:of December 30, 2023:
| | | | | |
| Year | |
| (Amounts are in thousands) |
| 2021 | $ | 36,392 | |
| 2022 | 25,238 | |
| 2023 | 38,694 | |
| 2024 | 32,165 | |
| 2025 | 400 | |
| Thereafter | 27,338 | |
| $ | 160,227 | |
| |
| | | | | |
| Year | |
| (Amounts are in millions) |
| 2024 | $ | 17 | |
| 2025 | 1 | |
| 2026 | 18 | |
| 2027 | 23 | |
| |
| |
| $ | 59 | |
| |
PUBLIX SUPER MARKETS, INC.
Notes to Consolidated Financial Statements
(6) Self-Insurance Reserves
Following is a reconciliation of the self-insurance reserves for 2023, 2022 and 2021:
| | | | | | | | | | | | | | | | | | | | | | | | | | | | | | | | | | | | | | | | | | | | | | | | |
| | Balance at
Beginning of
Year | | Additions
Charged to
Income | | Deductions
From
Reserves | | Balance at
End of
Year |
| | (Amounts are in millions) |
| 2023 | | | | | | | | | | | | | | | | |
| | | | | | | | | | | | | | | | |
| | | | | | | | | | | | | | | | |
| Current | | | $ | 210 | | | | | 597 | | | | | 544 | | | | | 263 | | |
| Noncurrent | | | 268 | | | | | (5) | | | | | — | | | | | 263 | | |
| | | $ | 478 | | | | | 592 | | | | | 544 | | | | | 526 | | |
| 2022 | | | | | | | | | | | | | | | | |
| | | | | | | | | | | | | | | | |
| | | | | | | | | | | | | | | | |
| Current | | | $ | 191 | | | | | 526 | | | | | 507 | | | | | 210 | | |
| Noncurrent | | | 249 | | | | | 19 | | | | | — | | | | | 268 | | |
| | | $ | 440 | | | | | 545 | | | | 507 | | | | 478 | |
| 2021 | | | | | | | | | | | | | | | | |
| | | | | | | | | | | | | | | | |
| | | | | | | | | | | | | | | | |
| Current | | | $ | 161 | | | | | 524 | | | | | 494 | | | | | 191 | | |
| Noncurrent | | | 236 | | | | | 13 | | | | | — | | | | | 249 | | |
| | | $ | 397 | | | | | 537 | | | | 494 | | | | 440 | |
(7) Retirement Plans
The Company has a trusteed, noncontributory ESOP for the benefit of eligible employees. The Company recognizes an expense related to the Company’s discretionary contribution to the ESOP that is approved by the Board of Directors each year. ESOP contributions can be made in Company common stock or cash. Compensation expense recorded for contributions to this plan was $417,800,000, $370,778,000$491 million, $450 million and $337,712,000$427 million for 2020, 20192023, 2022 and 2018,2021, respectively.
Since the Company’s common stock is not traded on an established securities market, the ESOP includes a put option for shares of the Company’s common stock distributed from the ESOP. Shares are distributed from the ESOP primarily to separated vested participants and certain eligible participants who elect to diversify their account balances. Under the Company’s administration of the ESOP’s put option, if the owners of distributed shares desire to sell their shares, the Company is required to purchase the shares at fair value for a specified time period after distribution of the shares from the ESOP. The fair value of distributed shares subject to the put option totaled $444,801,000$604 million and $287,328,000$629 million as of December 26, 202030, 2023 and December 28, 2019,31, 2022, respectively. The cost of the shares held by the ESOP totaled $3,039,748,000$3.6 billion and $2,971,902,000$3.4 billion as of December 26, 202030, 2023 and December 28, 2019,31, 2022, respectively. Due to the Company’s obligation under the put option, the distributed shares subject to the put option and the shares held by the ESOP are classified as temporary equity in the mezzanine section of the consolidated balance sheets and totaled $3,484,549,000$4.2 billion and $3,259,230,000$4.0 billion as of December 26, 202030, 2023 and December 28, 2019,31, 2022, respectively. The fair value of the shares held by the ESOP totaled $9,976,034,000$11.2 billion and $8,585,189,000$10.2 billion as of December 26, 202030, 2023 and December 28, 2019,31, 2022, respectively.
The Company has a 401(k) Plan for the benefit of eligible employees. The 401(k) Plan is a voluntary defined contribution plan. Effective January 1, 2020, eligibleEligible employees may contribute up to 30% of their eligible annual compensation, subject to the maximum contribution limits established by federal law. Previously, eligible employees could contribute up to 10% of their eligible annual compensation, subject to the maximum contribution limits established by federal law. The Company may make a discretionary annual matching contribution to eligible participants of this plan as determined by the Board of Directors. During 2020, 20192023, 2022 and 2018,2021, the Board of Directors approved a match of 50% of eligible annual contributions up to 3% of eligible annual compensation, not to exceed a maximum match of $750 per employee. Compensation expense recorded for the Company’s match to the 401(k) Plan was $39,858,000, $38,112,000$48 million, $47 million and $34,980,000$44 million for 2020, 20192023, 2022 and 2018,2021, respectively.
The Company intends to continue its retirement plans; however, the right to modify, amend, terminate or merge these plans has been reserved. In the event of termination, all amounts contributed under the plans must be paid to the participants or their beneficiaries.
PUBLIX SUPER MARKETS, INC.
Notes to Consolidated Financial Statements
(7)(8) Income Taxes
TotalFollowing is a summary of the allocation of total income taxes for 2020, 20192023, 2022 and 2018 were allocated as follows:2021:
| | | | | | | | | | | | | | | | | | | | | | | |
| | | 2020 | | 2019 | | 2018 |
| | | (Amounts are in thousands) |
| Earnings | | $ | 1,064,817 | | | 780,591 | | | 539,801 | |
| Other comprehensive earnings (losses) | | 40,682 | | | 46,723 | | | (3,440) | |
| | | $ | 1,105,499 | | | 827,314 | | | 536,361 | |
| | | | | | | | | | | | | | | | | | | | | | | |
| | | 2023 | | 2022 | | 2021 |
| | | (Amounts are in millions) |
| Earnings | | $ | 1,093 | | | 668 | | | 1,148 | |
| Other comprehensive earnings (losses) | | 70 | | | (206) | | | (70) | |
| | | $ | 1,163 | | | 462 | | | 1,078 | |
TheFollowing is a summary of the provision for income taxes consists of the following:for 2023, 2022 and 2021:
| | | | | | | | | | | | | | | | | | | | | | | |
| | | Current | | Deferred | | Total |
| | | (Amounts are in thousands) |
| 2020 | | | | | | |
| Federal | | $ | 871,187 | | | 56,382 | | | 927,569 | |
| State | | | 144,074 | | | (6,826) | | | 137,248 | |
| | | $ | 1,015,261 | | | 49,556 | | | 1,064,817 | |
| 2019 | | | | | | |
| Federal | | $ | 504,047 | | | 171,422 | | | 675,469 | |
| State | | | 61,540 | | | 43,582 | | | 105,122 | |
| | | $ | 565,587 | | | 215,004 | | | 780,591 | |
| 2018 | | | | | | |
| Federal | | $ | 413,735 | | | 59,377 | | | 473,112 | |
| State | | | 62,821 | | | 3,868 | | | 66,689 | |
| | | $ | 476,556 | | | 63,245 | | | 539,801 | |
| | | | | | | | | | | | | | | | | | | | | | | |
| | | Current | | Deferred | | Total |
| | | (Amounts are in millions) |
| 2023 | | | | | | |
| Federal | | $ | 848 | | | 111 | | | 959 | |
| State | | 126 | | | 8 | | | 134 | |
| | | $ | 974 | | | 119 | | | 1,093 | |
| 2022 | | | | | | |
| Federal | | $ | 810 | | | (175) | | | 635 | |
| State | | 108 | | | (75) | | | 33 | |
| | | $ | 918 | | | (250) | | | 668 | |
| 2021 | | | | | | |
| Federal | | $ | 755 | | | 264 | | | 1,019 | |
| State | | 65 | | | 64 | | | 129 | |
| | | $ | 820 | | | 328 | | | 1,148 | |
AFollowing is a reconciliation of the provision for income taxes at the federal statutory income tax rate of 21% to earnings before income taxes compared to the Company’s actual income tax expense is as follows:for 2023, 2022 and 2021:
| | | | | | | | | | | | | | | | | | | | | | | |
| | | 2020 | | 2019 | | 2018 |
| | | (Amounts are in thousands) |
| Federal tax at statutory income tax rate | | $ | 1,057,698 | | | 795,057 | | | 613,403 | |
| State income taxes (net of federal tax benefit) | | | 108,426 | | | 83,046 | | | 52,684 | |
| ESOP dividend | | | (47,449) | | | (45,493) | | | (41,175) | |
| Other, net | | | (53,858) | | | (52,019) | | | (85,111) | |
| | | | | | | |
| | | $ | 1,064,817 | | | 780,591 | | | 539,801 | |
| | | | | | | | | | | | | | | | | | | | | | | |
| | | 2023 | | 2022 | | 2021 |
| | | (Amounts are in millions) |
| Federal tax at statutory income tax rate | | $ | 1,143 | | | 753 | | | 1,168 | |
| State income taxes (net of federal tax benefit) | | 106 | | | 26 | | | 102 | |
| ESOP dividend | | (62) | | | (58) | | | (51) | |
| Renewable energy investment tax credits | | (58) | | | (16) | | | (36) | |
| Other, net | | (36) | | | (37) | | | (35) | |
| | | | | | | |
| | | $ | 1,093 | | | 668 | | | 1,148 | |
PUBLIX SUPER MARKETS, INC.
Notes to Consolidated Financial Statements
TheFollowing is a summary of the tax effects of temporary differences that give rise to significant portions of deferred income taxes as of December 26, 202030, 2023 and December 28, 2019 are as follows:31, 2022:
| | | | | | | | | | | | | | | | | |
| | | 2020 | | 2019 |
| | | (Amounts are in thousands) |
| Deferred tax liabilities and (assets): | | | | |
| Lease assets | | $ | 789,369 | | | 770,182 | |
| Property, plant and equipment | | 719,212 | | | 671,864 | |
| Investments | | 337,147 | | | 176,744 | |
| Inventories | | 30,906 | | | 30,398 | |
| Lease liabilities | | (815,024) | | | (781,250) | |
| Self-insurance reserves | | (84,509) | | | (80,655) | |
| Payroll tax deferral | | (75,770) | | | 0 | |
| Retirement plan contributions | | (48,390) | | | (46,196) | |
| Postretirement benefit cost | | (35,031) | | | (32,064) | |
| Vendor rebates | | (18,517) | | | (15,299) | |
| | | | | |
| Other | | (26,671) | | | (11,240) | |
| | | $ | 772,722 | | | 682,484 | |
| | | | | | | | | | | | | | | | | |
| | | 2023 | | 2022 |
| | | (Amounts are in millions) |
| Deferred tax liabilities and (assets): | | | | |
| Property, plant and equipment | | $ | 905 | | | 857 | |
| Lease assets | | 847 | | | 812 | |
| Investments | | 67 | | | (75) | |
| Inventories | | 60 | | | 52 | |
| Lease liabilities | | (901) | | | (858) | |
| Self-insurance reserves | | (108) | | | (96) | |
| Retirement plan contributions | | (48) | | | (48) | |
| Postretirement benefit cost | | (25) | | | (25) | |
| Vendor rebates | | (15) | | | (20) | |
| | | | | |
| Other | | (18) | | | (24) | |
| | | | | |
| | | $ | 764 | | | 575 | |
The Company expects the results of future operations and the reversal of deferred tax liabilities to generate sufficient taxable income to allow utilization of deferred tax assets; therefore, 0no valuation allowance has been recorded as of December 26, 202030, 2023 and December 28, 2019.31, 2022.
The Company has analyzed filing positions in all of the federal and state jurisdictions where it is required to file income tax returns as well as all open tax years in these jurisdictions. The periods subject to examination for the Company’s federal income tax returns are the 20172018 through 20192022 tax years. The periods subject to examination for the Company’s state income tax returns are the 20152016 through 20192022 tax years. The Company believes that the outcome of any examinations will not have a material effect on its financial condition, results of operations or cash flows.
The Company had no unrecognized tax benefits in 20202023 and 2019.2022. As a result, there will be 0no effect on the Company’s effective income tax rate in future periods due to the recognition of unrecognized tax benefits.
PUBLIX SUPER MARKETS, INC.
Notes to Consolidated Financial Statements
(8) Accumulated Other Comprehensive Earnings (Losses)
A reconciliation of the changes in accumulated other comprehensive earnings (losses) net of income taxes for 2020, 2019 and 2018 is as follows:
| | | | | | | | | | | | | | | | | | | | | | | | | | | | | | | | | | | | | | | | | |
| | | Investments | | Postretirement Benefit | | Accumulated Other Comprehensive Earnings (Losses) |
| | | | (Amounts are in thousands) | |
| Balances at December 30, 2017 | | | $ | 168,057 | | | | | (15,421) | | | | | 152,636 | | |
| Unrealized loss on debt securities | | | (19,126) | | | | | — | | | | | (19,126) | | |
| Net realized loss on debt securities reclassified to investment income | | | 346 | | | | | — | | | | | 346 | | |
| Adjustment to postretirement benefit obligation | | | — | | | | | 8,692 | | | | | 8,692 | | |
| Net other comprehensive (losses) earnings | | | (18,780) | | | | | 8,692 | | | | | (10,088) | | |
| Cumulative effect of net unrealized gain on equity securities reclassified to retained earnings | | | (198,310) | | | | | — | | | | | (198,310) | | |
| Balances at December 29, 2018 | | | (49,033) | | | | | (6,729) | | | | | (55,762) | | |
| Unrealized gain on debt securities | | | 148,141 | | | | | — | | | | | 148,141 | | |
| Net realized gain on debt securities reclassified to investment income | | | (602) | | | | | — | | | | | (602) | | |
| Adjustment to postretirement benefit obligation | | | — | | | | | (10,488) | | | | | (10,488) | | |
| Net other comprehensive earnings (losses) | | | 147,539 | | | | | (10,488) | | | | | 137,051 | | |
| | | | | | | | | | | | | |
| Balances at December 28, 2019 | | | 98,506 | | | | | (17,217) | | | | | 81,289 | | |
| Unrealized gain on debt securities | | | 138,989 | | | | | — | | | | | 138,989 | | |
| Net realized gain on debt securities reclassified to investment income | | | (13,591) | | | | | — | | | | | (13,591) | | |
| Adjustment to postretirement benefit obligation | | | — | | | | | (5,736) | | | | | (5,736) | | |
| Net other comprehensive earnings (losses) | | | 125,398 | | | | | (5,736) | | | | | 119,662 | | |
| | | | | | | | | | | | | |
| Balances at December 26, 2020 | | | $ | 223,904 | | | | | (22,953) | | | | | 200,951 | | |
| | | | | | | | | | | | | |
In 2018, the Company adopted the ASU requiring equity securities be measured at fair value with net unrealized gains and losses from changes in the fair value recognized in earnings. Prior to the adoption of the ASU, equity securities were classified as available-for-sale and measured at fair value. Changes in fair value determined to be temporary were reported in other comprehensive earnings net of income taxes. Upon adoption of the ASU, the Company reclassified the cumulative effect of the net unrealized gain on equity securities net of income taxes as of December 31, 2017 of $198,310,000 from accumulated other comprehensive earnings to retained earnings.
PUBLIX SUPER MARKETS, INC.
Notes to Consolidated Financial Statements
(9) Accumulated Other Comprehensive Earnings (Losses)
Following is a reconciliation of the changes in accumulated other comprehensive earnings (losses) net of income taxes for 2023, 2022 and 2021:
| | | | | | | | | | | | | | | | | | | | | | | | | | | | | | | | | | | | | | | | | |
| | | Investments | | Postretirement Benefit | | Accumulated Other Comprehensive Earnings (Losses) |
| | | | (Amounts are in millions) | |
| Balances at December 26, 2020 | | | $ | 224 | | | | | (23) | | | | | 201 | | |
| Unrealized loss on debt securities | | | (201) | | | | | — | | | | | (201) | | |
| Net realized gain on debt securities reclassified to investment income | | | (16) | | | | | — | | | | | (16) | | |
| Adjustment to postretirement benefit obligation | | | — | | | | | 11 | | | | | 11 | | |
| Net other comprehensive (losses) earnings | | | (217) | | | | | 11 | | | | | (206) | | |
| | | | | | | | | | | | | |
| Balances at December 25, 2021 | | | 7 | | | | | (12) | | | | | (5) | | |
| Unrealized loss on debt securities | | | (626) | | | | | — | | | | | (626) | | |
| Net realized loss on debt securities reclassified to investment income | | | 1 | | | | | — | | | | | 1 | | |
| Adjustment to postretirement benefit obligation | | | — | | | | | 21 | | | | | 21 | | |
| Net other comprehensive (losses) earnings | | | (625) | | | | | 21 | | | | | (604) | | |
| | | | | | | | | | | | | |
| Balances at December 31, 2022 | | | (618) | | | | | 9 | | | | | (609) | | |
| Unrealized gain on debt securities | | | 206 | | | | | — | | | | | 206 | | |
| | | | | | | | | | | | | |
| Adjustment to postretirement benefit obligation | | | — | | | | | (1) | | | | | (1) | | |
| Net other comprehensive earnings (losses) | | | 206 | | | | | (1) | | | | | 205 | | |
| | | | | | | | | | | | | |
| Balances at December 30, 2023 | | | $ | (412) | | | | | 8 | | | | | (404) | | |
(10) Commitments and Contingencies
(a) Letters of Credit
As of December 26, 2020, the Company had outstanding $9,118,000 in trade letters of credit and $3,709,000 in standby letters of credit to support certain purchase obligations.
(b) Litigation
The Company is subject from time to time to various lawsuits, claims and charges arising in the normal course of business, including employment, personal injury, commercial and other matters. Some lawsuits also contain class action allegations. Litigation is inherently unpredictable. Any claims against the Company, whether meritorious or not, could result in costly litigation that could adversely affect the Company’s business. The Company believes its recorded reserves are adequate in light of the probable and estimable liabilities. The estimated amount of reasonably possible losses for lawsuits, claims and charges, individually and in the aggregate, is considered to be immaterial. In the opinion of management, the ultimate resolution of these legal proceedings will not have a material adverse effect on the Company’s financial condition, results of operations or cash flows.
(10)(11) Subsequent Event
On January 4, 2021,2, 2024, the Company declared a quarterly dividend on its common stock of $0.32$0.10 per share or $221,000,000,$329 million, payable February 1, 20212024 to stockholders of record as of the close of business January 15, 2021.
(11) Quarterly Information (unaudited)
Following is a summary of the quarterly results of operations for 2020 and 2019. All quarters have 13 weeks.
| | | | | | | | | | | | | | | | | | | | | | | | | | | | | |
| | First | | Second | | Third | | Fourth | |
| | (Amounts are in thousands, except per share amounts) |
| 2020 | | | | | | | | | |
| Revenues | | $ | 11,306,951 | | | 11,468,563 | | | 11,136,409 | | | 11,292,036 | | |
| Costs and expenses | | 10,155,340 | | | 10,391,518 | | | 10,260,086 | | | 10,385,042 | | |
| Net earnings | | 667,335 | | | 1,367,055 | | | 917,584 | | | 1,019,864 | | |
| Earnings per share | | 0.94 | | | 1.94 | | | 1.31 | | | 1.47 | | |
| 2019 | | | | | | | | | |
| Revenues | | $ | 9,760,110 | | | 9,446,916 | | | 9,417,933 | | | 9,837,794 | | |
| Costs and expenses | | 8,903,535 | | | 8,767,478 | | | 8,805,903 | | | 9,096,588 | | |
| Net earnings | | 980,971 | | | 661,057 | | | 574,026 | | | 789,341 | | |
| Earnings per share | | 1.37 | | | 0.92 | | | 0.81 | | | 1.11 | | |
Following is a summary of the quarterly net earnings and earnings per share excluding the impact of net unrealized gains and losses on equity securities for 2020 and 2019.
| | | | | | | | | | | | | | | | | | | | | | | | | | | | | |
| | First | | Second | | Third | | Fourth | |
| | (Amounts are in thousands, except per share amounts) |
| 2020 | | | | | | | | | |
| Net earnings | | $ | 956,200 | | | 978,300 | | | 836,200 | | | 918,500 | | |
| Earnings per share | | 1.35 | | | 1.39 | | | 1.20 | | | 1.32 | | |
| 2019 | | | | | | | | | |
| Net earnings | | $ | 741,700 | | | 637,000 | | | 580,300 | | | 656,600 | | |
| Earnings per share | | 1.04 | | | 0.89 | | | 0.81 | | | 0.93 | | |
Schedule II
PUBLIX SUPER MARKETS, INC.
Valuation and Qualifying Accounts
Years ended December 26, 2020, December 28, 2019
and December 29, 2018
| | | | | | | | | | | | | | | | | | | | | | | | | | | | | | | | | | | | | | | | | | | | | | | | | | |
| | Balance at
Beginning of
Year | | Additions
Charged to
Income | | Deductions
From
Reserves | | Balance at
End of
Year |
| (Amounts are in thousands) |
| 2020 | | | | | | | | | | | | | | | | |
| Reserves not deducted from assets: | | | | | | | | | | | | | | | | |
| Self-insurance reserves: | | | | | | | | | | | | | | | | |
| Current | | | $ | 149,082 | | | | | 396,185 | | | | | 384,044 | | | | | 161,223 | | |
| Noncurrent | | | 226,727 | | | | | 9,131 | | | | | 0 | | | | | 235,858 | | |
| | | $ | 375,809 | | | | | 405,316 | | | | | 384,044 | | | | | 397,081 | | |
| 2019 | | | | | | | | | | | | | | | | |
| Reserves not deducted from assets: | | | | | | | | | | | | | | | | |
| Self-insurance reserves: | | | | | | | | | | | | | | | | |
| Current | | | $ | 145,241 | | | | | 398,336 | | | | | 394,495 | | | | | 149,082 | | |
| Noncurrent | | | 222,419 | | | | | 4,308 | | | | | 0 | | | | | 226,727 | | |
| | | $ | 367,660 | | | | | 402,644 | | | | | 394,495 | | | | | 375,809 | | |
| 2018 | | | | | | | | | | | | | | | | |
| Reserves not deducted from assets: | | | | | | | | | | | | | | | | |
| Self-insurance reserves: | | | | | | | | | | | | | | | | |
| Current | | | $ | 137,100 | | | | | 403,598 | | | | | 395,457 | | | | | 145,241 | | |
| Noncurrent | | | 218,598 | | | | | 3,821 | | | | | 0 | | | | | 222,419 | | |
| | | $ | 355,698 | | | | | 407,419 | | | | | 395,457 | | | | | 367,660 | | |
Item 9. Changes in and Disagreements with Accountants on Accounting and Financial Disclosure
None
Item 9A. Controls and Procedures
Disclosure Controls and Procedures
As of the end of the period covered by this Annual Report, the Company carried out an evaluation, under the supervision and with the participation of the Company’s management, including the Company’s Chief Executive Officerprincipal executive officer and Chief Financial Officer,principal financial officer, of the effectiveness of the design and operation of the Company’s disclosure controls and procedures pursuant to Exchange Act Rule 13a-15. Based upon this evaluation, the Chief Executive Officerprincipal executive officer and Chief Financial Officerprincipal financial officer each concluded that the Company’s disclosure controls and procedures were effective to provide reasonable assurance that information required to be disclosed by the Company in the reports that it files or submits under the Exchange Act is recorded, processed, summarized and reported within the time periods specified by the SEC’s rules and forms, and that such information has been accumulated and communicated to the Company’s management, including the Company’s Chief Executive Officerprincipal executive officer and Chief Financial Officer,principal financial officer, in a manner that allows timely decisions regarding required disclosure.
Internal Control over Financial Reporting
There have been no changes in the Company’s internal control over financial reporting identified in connection with the evaluation that occurred during the quarter ended December 26, 202030, 2023 that have materially affected, or are reasonably likely to materially affect, the internal control over financial reporting.
Management’s Report on Internal Control over Financial Reporting
Management of the Company is responsible for establishing and maintaining adequate internal control over financial reporting (as defined in Rule 13a-15(f) and Rule 15d-15(f) under the Exchange Act). The Company’s internal control over financial reporting is designed to provide reasonable assurance regarding the reliability of financial reporting and the preparation of financial statements for external purposes in accordance with U.S. generally accepted accounting principles. Because of inherent limitations, internal control over financial reporting may not prevent or detect misstatements. Also, projections of any evaluation of effectiveness to future periods are subject to the risk that controls may become inadequate because of changes in conditions or that the degree of compliance with the policies or procedures may deteriorate.
Management assessed the effectiveness of the Company’s internal control over financial reporting as of December 26, 2020.30, 2023. In making this assessment, management used the criteria set forth by the Committee of Sponsoring Organizations of the Treadway Commission in Internal Control – Integrated Framework (2013). Based on this assessment and these criteria, management believes that the Company’s internal control over financial reporting was effective as of December 26, 2020.30, 2023.
Item 9B. Other Information
None
Item 9C. Disclosure Regarding Foreign Jurisdictions that Prevent Inspections
Not applicable
PART III
Item 10. Directors, Executive Officers and Corporate Governance
Certain information concerning the executive officers of the Company is set forth on the following page. All other information regarding this item is incorporated by reference from the Proxy Statement of the Company (2021(2024 Proxy Statement), which the Company intends to file no later than 120 days after its fiscal year end.
The Company has adopted a Code of Ethical Conduct for Financial Managers that applies to the Company’s principal executive officer, principal financial officer, principal accounting officer or controller and all persons performing similar functions. A copy of the Code of Ethical Conduct for Financial Managers wasis filed as Exhibit 14 to this Annual Report. Any amendment to, or waiver from, any provision of the Annual ReportCode of Ethical Conduct for Financial Managers will be posted on Form 10-K for the year ended December 28, 2002.Company’s website at corporate.publix.com/stock.
Item 11. Executive Compensation
Information regarding this item is incorporated by reference from the 20212024 Proxy Statement.
Item 12. Security Ownership of Certain Beneficial Owners and Management and Related Stockholder Matters
Information regarding this item is incorporated by reference from the 20212024 Proxy Statement.
Item 13. Certain Relationships and Related Transactions and Director Independence
Information regarding this item is incorporated by reference from the 20212024 Proxy Statement.
Item 14. Principal Accounting Fees and Services
Information regarding this item is incorporated by reference from the 20212024 Proxy Statement.
| | Name | Name | | Age | | Business Experience During Last Five Years | | Served as Officer of Company Since | |
| Name | |
| Name | |
| Executive Officers of the Company | Executive Officers of the Company | |
| Executive Officers of the Company | |
| Executive Officers of the Company | |
| Norman J. Badger | |
| Norman J. Badger | |
| Norman J. Badger | |
| David E. Bornmann | |
| David E. Bornmann | |
| David E. Bornmann | David E. Bornmann | | 63 | | Senior Vice President of the Company. | | 1998 | |
| Laurie Z. Douglas | Laurie Z. Douglas | | 57 | | Senior Vice President and Chief Information Officer of the Company to January 2019, Senior Vice President, Chief Information Officer and Chief Digital Officer thereafter. | | 2006 | |
| Laurie Z. Douglas | |
| Laurie Z. Douglas | |
| John L. Goff, Jr. | |
| John L. Goff, Jr. | |
| John L. Goff, Jr. | |
| Randall T. Jones, Sr. | Randall T. Jones, Sr. | | 58 | | President of the Company to May 2016, Chief Executive Officer and President to January 2019, Chief Executive Officer thereafter. | | 2003 | |
| Randall T. Jones, Sr. | |
| Randall T. Jones, Sr. | |
| Merriann M. Metz | |
| Merriann M. Metz | |
| Merriann M. Metz | |
| Kevin S. Murphy | |
| Kevin S. Murphy | |
| Kevin S. Murphy | Kevin S. Murphy | | 50 | | Vice President of the Company to May 2016, Senior Vice President to January 2019, President thereafter. | | 2014 | |
| David P. Phillips | David P. Phillips | | 61 | | Chief Financial Officer and Treasurer of the Company and Trustee of the Committee of Trustees of the ESOP to May 2016, Executive Vice President, Chief Financial Officer and Treasurer and Trustee of the Committee of Trustees of the ESOP thereafter. | | 1990 | |
| David P. Phillips | |
| David P. Phillips | |
| Michael R. Smith | |
| Michael R. Smith | |
| Michael R. Smith | Michael R. Smith | | 61 | | Senior Vice President of the Company. | | 2005 | |
| Officers of the Company | Officers of the Company | |
| Norman J. Badger | | 42 | | District Manager of Retail Operations of the Company to July 2017, Regional Director of Retail Operations to May 2020, Vice President thereafter. | | 2020 | |
| Robert S. Balcerak, Jr. | | 60 | | Director of Real Estate Strategy of the Company to April 2017, Vice President thereafter. | | 2017 | |
| Officers of the Company | |
| Officers of the Company | |
| Monica A. Allman | |
| Monica A. Allman | |
| Monica A. Allman | |
| Randolph L. Barber | |
| Randolph L. Barber | |
| Randolph L. Barber | Randolph L. Barber | | 58 | | Director of Industrial Maintenance of the Company to January 2018, Vice President thereafter. | | 2018 | |
| Robert J. Bechtel | Robert J. Bechtel | | 57 | | Regional Director of Retail Operations of the Company to May 2016, Vice President thereafter. | | 2016 | |
| Robert J. Bechtel | |
| Robert J. Bechtel | |
| Adrian Bennett | |
| Adrian Bennett | |
| Adrian Bennett | |
| Marcy P. Benton | Marcy P. Benton | | 52 | | Director of Retail Associate Relations of the Company to September 2017, Vice President thereafter. | | 2017 | |
| Scott E. Brubaker | | 62 | | Vice President of the Company. | | 2005 | |
| G. Gino DiGrazia | | 58 | | Vice President of the Company. | | 2002 | |
| John L. Goff, Jr. | | 47 | | Regional Director of Retail Operations of the Company to January 2019, Vice President thereafter. | | 2019 | |
| Marcy P. Benton | |
| Marcy P. Benton | |
| Matthew I. Crawley | |
| Matthew I. Crawley | |
| Matthew I. Crawley | |
| Kyle C. Davis | |
| Kyle C. Davis | |
| Kyle C. Davis | |
| Christopher P. Haake | |
| Christopher P. Haake | |
| Christopher P. Haake | |
| Linda S. Hall | |
| Linda S. Hall | |
| Linda S. Hall | Linda S. Hall | | 61 | | Vice President of the Company. | | 2002 | |
| Douglas A. Harris, Jr. | Douglas A. Harris, Jr. | | 48 | | General Manager of Manufacturing Operations of the Company to March 2018, Director of Manufacturing Operations to May 2019, Vice President thereafter. | | 2019 | |
| Mark R. Irby | | 65 | | Vice President of the Company. | | 1989 | |
| Douglas A. Harris, Jr. | |
| Douglas A. Harris, Jr. | |
| Kris Jonczyk | Kris Jonczyk | | 51 | | Regional Director of Retail Operations of the Company to January 2020, Vice President thereafter. | | 2020 | |
| Linda S. Kane | | 55 | | Vice President and Assistant Secretary of the Company. | | 2000 | |
| Kris Jonczyk | |
| Kris Jonczyk | |
| Erik J. Katenkamp | |
| Erik J. Katenkamp | |
| Erik J. Katenkamp | Erik J. Katenkamp | | 49 | | Vice President of the Company. | | 2013 | |
| L. Renee Kelly | L. Renee Kelly | | 59 | | Vice President of the Company. | | 2013 | |
| L. Renee Kelly | |
| L. Renee Kelly | |
| Michael E. Lester | Michael E. Lester | | 55 | | Director of Warehousing of the Company to January 2019, Vice President thereafter. | | 2019 | |
| Christopher M. Litz | | 57 | | Vice President of the Company. | | 2016 | |
| Michael E. Lester | |
| Michael E. Lester | |
| Robert J. McGarrity | Robert J. McGarrity | | 59 | | Director of Construction of the Company to January 2017, Vice President thereafter. | | 2017 | |
| Robert J. McGarrity | |
| Robert J. McGarrity | |
| Christopher J. Mesa | |
| Christopher J. Mesa | |
| Christopher J. Mesa | |
| Bridgid A. O'Connor | |
| Bridgid A. O'Connor | |
| Bridgid A. O'Connor | |
| Brad E. Oliver | |
| Brad E. Oliver | |
| Brad E. Oliver | |
| John F. Provenzano | |
| John F. Provenzano | |
| John F. Provenzano | |
| William W. Rayburn, IV | |
| William W. Rayburn, IV | |
| William W. Rayburn, IV | |
| Malinda G. Renfroe | |
| Malinda G. Renfroe | |
| Malinda G. Renfroe | |
| | | | | | | | | | | | | | | | | | | | | |
| Name | | Age | | Business Experience During Last Five Years | | Served as Officer of Company Since | |
| Officers of the Company (Continued) | |
| Merriann M. Metz | | 45 | | Assistant General Counsel of the Company to May 2016, Assistant General Counsel and Assistant Secretary to June 2019,Vice President, General Counsel and Secretary thereafter. | | 2016 | |
| Brad E. Oliver | | 47 | | Business Development Director of Grocery Retail Support of the Company to March 2017, Business Development Director of DSD Products to January 2018, Vice President thereafter. | | 2018 | |
| Samuel J. Pero | | 58 | | Regional Director of Retail Operations of the Company to May 2016, Vice President thereafter. | | 2016 | |
| John F. Provenzano | | 47 | | Executive Director of the National Association of State Treasurers to June 2017, Vice President of the Company thereafter. | | 2017 | |
| William W. Rayburn, IV | | 58 | | Director of Real Estate Assets of the Company to September 2017, Vice President thereafter. | | 2017 | |
| Charles B. Roskovich, Jr. | | 59 | | Vice President of the Company. | | 2008 | |
| Dain Rusk | | 47 | | Vice President of Pharmacy Business Development of Albertsons Companies to August 2016, Group Vice President of Pharmacy Operations of Albertsons Companies to June 2018, Vice President of the Company thereafter. | | 2018 | |
| Marc H. Salm | | 60 | | Vice President of the Company. | | 2008 | |
| Steven B. Wellslager | | 54 | | Vice President of the Company. | | 2013 | |
| | | | | | | | | | | | | | | | | | | | | |
| Name | | Age | | Business Experience During Last Five Years | | Served as Officer of Company Since | |
| Officers of the Company (Continued) | |
| Joseph R. Riddle | | 45 | | District Manager of Retail Operations of the Company to February 2020, Regional Director of Retail Operations to April 2023, Vice President thereafter. | | 2023 | |
| Dain Rusk | | 50 | | Vice President of the Company. | | 2018 | |
| Marc H. Salm | | 63 | | Vice President of the Company. | | 2008 | |
| Mikhael H. Ser | | 53 | | Director of Construction of the Company to January 2021, Director of Facility Refrigeration and Energy Management to January 2024, Vice President thereafter. | | 2024 | |
| Christopher M. Shaw | | 54 | | Business Development Director of the Company to January 2024, Vice President thereafter. | | 2024 | |
| Marsha C. Singh | | 49 | | Regional Director of Retail Operations of the Company to January 2023, Vice President thereafter. | | 2023 | |
| D. Douglas Stalbaum | | 44 | | Director of Finance of Rooms To Go to March 2019, Director of Business Analysis and Reporting of the Company to January 2022, Vice President thereafter. | | 2022 | |
| Steven B. Wellslager | | 57 | | Vice President of the Company. | | 2013 | |
The terms of all officers expire in May 20212024 or upon the election of their successors.
PART IV
Item 15. Exhibits and Financial Statement Schedules
(a)Consolidated Financial Statements and ScheduleSchedules
The consolidated financial statements and schedule listed in the accompanying Index to Consolidated Financial Statements and Schedule are filed as part of this Annual Report. All financial statement schedules are omitted as the required information is inapplicable or the information is presented in the consolidated financial statements and related notes.
(b)Exhibits
| | | | | |
| 3.1 | |
| 3.2 | |
| 4.1 | |
| 10* | |
| 10.2* | |
| 10.5* | |
| 10.6* | |
| 10.7* | |
| 14 | |
| 21 | |
| 23 | |
| 31.1 | |
| 31.2 | |
| 31.3 | |
| 32.1 | |
| 32.2 | |
| 32.3 | |
| 101 | The following financial information from this Annual Report is formatted in Extensible Business Reporting Language: (i) Consolidated Balance Sheets, (ii) Consolidated Statements of Earnings, (iii) Consolidated Statements of Comprehensive Earnings, (iv) Consolidated Statements of Cash Flows, (v) Consolidated Statements of Stockholders’ Equity and (vi) Notes to Consolidated Financial Statements. |
| 104 | Cover Page Interactive Data File (embedded within the Inline XBRL document and included in Exhibit 101). |
| * Represents management contract or compensatory plan or arrangement. |
Item 16. Form 10-K Summary
None
SIGNATURES
Pursuant to the requirements of Section 13 or 15(d) of the Securities Exchange Act of 1934, the Registrant has duly caused this report to be signed on its behalf by the undersigned, thereunto duly authorized.
| | | | | | | | | | | |
| | | |
| | | PUBLIX SUPER MARKETS, INC. |
| | | |
March 1, 20212024 | By: | | /s/ Merriann M. Metz |
| | | Merriann M. Metz |
| | | Secretary |
Pursuant to the requirements of the Securities Exchange Act of 1934, this report has been signed below by the following persons on behalf of the Registrant and in the capacities and on the dates indicated.
| | | | | | | | | | | |
| | | |
| /s/ Jessica L. Blume | | Director | March 1, 20212024 |
| Jessica L. Blume | | | |
| | | |
| /s/ William E. Crenshaw | | Chairman of the BoardEmeritus and Director | March 1, 20212024 |
| William E. Crenshaw | | | |
| | | |
| /s/ Joseph DiBenedetto, Jr. | | Director | March 1, 20212024 |
| Joseph DiBenedetto, Jr. | | | |
| | | |
| /s/ Mark R. Irby | | Director | March 1, 2024 |
| Mark R. Irby | | | |
| | | |
| /s/ Howard M. Jenkins | | Director | March 1, 20212024 |
| Howard M. Jenkins | | | |
| | | |
| /s/ Jennifer A. Jenkins | | Director | March 1, 20212024 |
| Jennifer A. Jenkins | | | |
| | | |
| /s/ Randall T. Jones, Sr. | | Chief Executive Officer and DirectorChairman | March 1, 20212024 |
| Randall T. Jones, Sr. | | (PrincipalCo-Principal Executive Officer) | |
| | | |
| /s/ Stephen M. Knopik | | Director | March 1, 20212024 |
| Stephen M. Knopik | | | |
| | | |
| /s/ Kevin S. Murphy | | Chief Executive Officer | March 1, 2024 |
| Kevin S. Murphy | | (Co-Principal Executive Officer) | |
| | | |
| /s/ David P. Phillips | | Executive Vice President, Chief Financial Officer, Treasurer | March 1, 20212024 |
| David P. Phillips | | and Director (Principal Financial and Accounting Officer) | |