|
| | |
| | |
| UNITED STATES |
| SECURITIES AND EXCHANGE COMMISSION |
| Washington, D.C. 20549 |
| FORM 10-K |
þ ANNUAL REPORT PURSUANT TO SECTION 13 OR 15 (d)15(d) OF THE SECURITIES EXCHANGE ACT OF 1934 |
For the fiscal year ended January 31, 20132016 |
o TRANSITION REPORT PURSUANT TO SECTION 13 OR 15(d) OF THE SECURITIES EXCHANGE ACT OF 1934 |
| For the transition period from to |
Commission file number:File Number: 001-07982 |
| RAVEN INDUSTRIES, INC. |
| (Exact name of registrant as specified in its charter) |
|
| | | | |
| | South Dakota | | 46-0246171 | |
| | (State or other jurisdiction of incorporation)incorporation or organization) | | (IRS Employer Identification No.) | |
| | 205 E. 6th Street, P.O. Box 5107, Sioux Falls, SD | | 57117- 5107 | |
| | (Address of principal executive offices) | | (zip code)(Zip Code) | |
| | Registrant's telephone number including area code (605) 336-2750 | |
| Securities registered pursuant to Section 12(b) of the Act: |
| | Title of Each Class:each class: | | Name of Each Exchangeeach exchange on which Registeredregistered | |
| | Common Stock, $1 par value | | The NASDAQ Stock Market | |
| Securities registered pursuant to Section 12(g) of the Act: None |
| | | | | |
|
| | | | |
| Indicate by check mark if the registrant is a well-known seasoned issuer, as defined in Rule 405 of the Securities Act. | o | Yes | þ | No |
| Indicate by check mark if the registrant is not required to file reports pursuant to Section 13 or Section 15(d) of the Act. | o | Yes | þ | No |
| Indicate by check mark whether the registrant (1) has filed all reports required to be filed by Section 13 or 15(d) of the Securities Exchange Act of 1934 during the preceding 12 months (or for such shorter period that the registrant was required to file such reports), and (2) has been subject to such filing requirements for the past 90 days. | þ | Yes | o | No |
Indicate by checkmarkcheck mark whether the registrant has submitted electronically and posted on its corporate Website, if any, every Interactive Data File required to be submitted and posted pursuant to Rule 405 of Regulation S-T (§232.405 of this chapter)during the preceding 12 months (or for such shorter period that the registrant was required to submit and post such files). | þ | Yes | o | No |
| Indicate by check mark if disclosure of delinquent filers pursuant to Item 405 of Regulation S-K (§229.405 of this chapter)is not contained herein, and will not be contained, to the best of registrant's knowledge, in definitive proxy or information statements incorporated by reference in Part III of this Form 10-K or any amendment to this Form 10-K. | þ | | | |
|
| | | | | |
| Indicate by check mark whether the registrant is a large accelerated filer, an accelerated filer, a non-accelerated filer, or a smaller reporting company. See the definition of “accelerated filer,” “large accelerated filer” and “smaller reporting company” in Rule 12b-2 of the Exchange Act. |
| Large accelerated filer | þ | | | Accelerated filer | o |
| Non-accelerated filer | o | | | Smaller reporting company | o |
| (Do not check if a smaller reporting company) | | | |
|
| | | | |
Indicate by check mark whether the registrant is a shell company (as defined in Rule 12b-2 of the Act.)Act). | o | Yes | þ | No |
|
| | | | |
The aggregate market value of the registrant's common stock held by non-affiliates at July 31, 20122015 was approximately $1,172,470,556.$724,165,854. The aggregate market value was computed by reference to the closing price as reported on the NASDAQ Global Select Market, $32.73,$19.43, on July 31, 2012,2015, which was as of the last business day of the registrant's most recently completed second fiscal quarter. The number of shares outstanding on March 22, 20132016 was 36,332,923.36,279,928. |
| DOCUMENTS INCORPORATED BY REFERENCE |
The definitive proxy statement relating to the registrant's Annual Meeting of Shareholders, to be held May 23, 2013,24, 2016, is incorporated by reference into Part III to the extent described therein. |
| | | | | |
|
| | | |
| PART I | | |
| Item 1. | BUSINESS | | |
| Item 1A. | RISK FACTORS | | |
| Item 1B. | UNRESOLVED STAFF COMMENTS | | |
| Item 2. | PROPERTIES | | |
| Item 3. | LEGAL PROCEEDINGS | | |
| Item 4. | MINE SAFETY DISCLOSURES | | |
| | | | |
| PART II | | |
| Item 5. | MARKET FOR REGISTRANT'S COMMON EQUITY, RELATED SHAREHOLDER MATTERS, AND ISSUER PURCHASES OF EQUITY SECURITIES | | |
| | Quarterly Information | | |
| | Stock Performance | | |
| Item 6. | SELECTED FINANCIAL DATA | | |
| | Eleven-year Financial Summary | | |
| | Business Segments | | |
| Item 7. | MANAGEMENT'S DISCUSSION AND ANALYSIS OF FINANCIAL CONDITION AND RESULTS OF OPERATIONS | | |
| | Executive Summary | | |
| | Results of Operations - Segment Analysis | | |
| | Outlook | | |
| | Liquidity and Capital Resources | | |
| | Off-Balance Sheet Arrangements and Contractual Obligations | | |
| | Critical Accounting Estimates | | |
| | Accounting Pronouncements | | |
| | Forward-Looking Statements | | |
| Item 7A. | QUANTITATIVE AND QUALITATIVE DISCLOSURES ABOUT MARKET RISK | | |
| Item 8. | FINANCIAL STATEMENTS AND SUPPLEMENTARY DATA | | |
| | Management's Report on Internal Control Over Financial Reporting | | |
| | Report of Independent Registered Public Accounting Firm | | |
| | Consolidated Balance Sheets | | |
| | Consolidated Statements of Income and Comprehensive Income | | |
| | Consolidated Statements of Shareholders' Equity | | |
| | Consolidated Statements of Cash Flows | | |
| | Notes to Consolidated Financial Statements | | |
| Item 9. | CHANGES IN AND DISAGREEMENTS WITH ACCOUNTANTS ON ACCOUNTING AND FINANCIAL DISCLOSURE | | |
| Item 9A. | CONTROLS AND PROCEDURES | | |
| Item 9B. | OTHER INFORMATION | | |
| | | | |
| PART III | | |
| Item 10. | DIRECTORS, EXECUTIVE OFFICERS AND CORPORATE GOVERNANCE | | |
| Item 11. | EXECUTIVE COMPENSATION | | |
| Item 12. | SECURITY OWNERSHIP OF CERTAIN BENEFICIAL OWNERS AND MANAGEMENT AND RELATED SHAREHOLDER MATTERS | | |
| Item 13. | CERTAIN RELATIONSHIPS AND RELATED TRANSACTIONS AND DIRECTOR INDEPENDENCE | | |
| Item 14. | PRINCIPAL ACCOUNTING FEES AND SERVICES | | |
| | | | |
| PART IV | | |
| Item 15. | EXHIBITS, FINANCIAL STATEMENT SCHEDULE | | |
| INDEX TO EXHIBITS | | |
| SIGNATURES | | |
| SCHEDULE II | | |
Raven Industries, Inc. (the Company or Raven) was incorporated in February 1956 under the laws of the State of South Dakota and began operations later that same year. RavenThe Company is a diversified technology company providing a variety of products to customers within the industrial, agricultural, energy, construction, and military/aerospacedefense markets. The Company markets its products around the world and has its principal operations in the United States of America. Raven began operations as a manufacturer of high-altitude research balloons before diversifying into the industrial, agricultural, energy, constructionproduct lines that extended from technologies and military/aerospace markets.production methods of this original balloon business. The Company employs approximately 1,400910 people and is headquartered at 205 E. Sixth Street, Sioux Falls, SD 57104 - telephone (605) 336-2750. The Company's Internet address is http://www.ravenind.com and its common stock trades on the NASDAQ Global Select Market under the ticker symbol RAVN. The Company has adopted a Code of Conduct applicable to all officers, directors and employees, which is available on the website. Information on the Company's website is not part of this filing.
All reports (including Annual Reports on Form 10-K, Quarterly Reports on Form 10-Q, and current reports on Form 8-K) and proxy and information statements filed with the Securities and Exchange Commission (SEC) are available through a link from the Company's website to the SEC website. All such information is available as soon as reasonably practicable after it has been electronically filed. Filings can also be obtained free of charge by contacting the Company or the SEC. The SEC can be contacted through the SEC'sits website at http://www.sec.gov or by contactingthrough the SEC's Office of FOIA/PA Operations at 100 F Street N.E., Washington, DC 20549-2736, or by calling the SEC at 1-800-SEC-0330.1-800-732-0330.
BUSINESS SEGMENTS
The Company has three unique operating units, or divisions, that are also its reportable segments: Applied Technology Division (Applied Technology), Engineered Films Division (Engineered Films), and Aerostar Division (Aerostar). Many of the past and present product lines are an extension of technology and production methods developed in the original balloon business. Product lines have been grouped in these segments based on common technologies, production methods, and inventories; however, more than one business segment may serve each of the product markets identified above. The Company measures the profitability performance of its segments primarily based on their operating income excluding administrative and general expenses. Other expense and income taxes are not allocated to individual operating segments, and assets not identifiable to an individual segment are included as corporate assets. Segment information is reported consistent with the Company's management reporting structure.
During fiscal 2013, the Company realigned the assets and team members of its Electronic Systems Division and deployed them into the Company's Aerostar and Applied Technology Divisions. The Company adjusted its segment information, retrospectively, for all periods presented in this Annual Report on Form 10-K to reflect this change in segment reporting.
|
| |
Business segment financial information is found on the following pages:pages of this Annual Report on Form 10-K (Form 10-K): |
| Business Segments |
| Results of Operations – Segment Analysis |
| Note 13. Business Segments and Major Customer Information |
Applied Technology
Applied Technology designs, manufactures, sells and services innovative precision agriculture products and information management tools that help growers reduce costs and improve farm yields around the world. The Applied Technology product families include field computers, application controls, GPS-guidance and assisted-steering systems, automatic boom controls, yield monitoring planter controls and an integrated real-time kinematic (RTK) navigation and information platform called SlingshotTM. As a result of the realignment of the Company's Electronic Systems Division, these product families also include motor controls. The Company's investments in Site-Specific Technology Development Group, Inc. (SST), a software company, and the continued build-out of the Slingshot API platform have positioned Applied Technology to provide an information platform of choice that improves grower decision-making and business efficiencies for our agriculture retail partners.
Applied Technology sells its precision agriculture control products to both original equipment manufacturers (OEMs) and through aftermarket distribution in the United States and in most major agriculture areas around the world. Applied Technology has personnel and third-party distribution representatives located in the U.S. and key geographic areas throughout the world, including Canada, Europe, the former Soviet Republics, South Africa, South America, Australia and China. The Company's competitive
advantage in this segment is designing and selling easy to use, reliable and value-added products that are supported by an industry leading service and support team.
Engineered Films
Engineered Films produces high-performance plastic films and sheeting for industrial, energy, construction, geomembrane and agricultural applications.
The Company's sales force sells plastic sheeting to independent third-party distributors in each of the various markets it serves. The Company extrudes a significant portion of the film converted for its commercial products and believes it is one of the largest sheeting converters in the United States. Engineered Films believes its ability to both extrude and convert films allows it to provide a more customized solution to customer needs. A number of suppliers of sheeting compete with Raven on both price and product availability. Engineered Films is the Company's most capital-intensive business segment, requiring regular investments in new extrusion capacity along with printers and conversion equipment. This segment's capital expenditures were $11.5 million in fiscal 2013, $10.9 million in fiscal 2012 and $8.5 million in fiscal 2011.
Aerostar
Aerostar designs and manufactures high-altitude research balloons, tethered aerostats and radar processing systems. These products can be integrated with additional third-party sensors to provide research, communications and situational awareness to government and commercial customers. Aerostar's sales to the U.S. government or U.S. government agencies as a prime or sub-contractor include military parachutes, uniforms and protective wear. It also manufactures other sewn and sealed products on a contract basis as well as being a total solutions provider of electronics manufacturing services since the realignment of the Electronic Systems Division. Sales are made in response to competitive bid requests. High-altitude research balloons are sold directly to government agencies (usually funded by the National Aeronautics and Space Administration) or commercial users. Aerostar is the only balloon supplier for high-altitude research in the United States.
Through the recent acquisition of Vista Research, Inc. (Vista) and a separate business venture that is majority-owned by the Company, Aerostar pursues potential product and support services contracts for agencies and instrumentalities of the U.S. government. The acquisition of Vista in January 2012 positioned the Company to meet growing global demand for lower-cost detection and tracking systems used by government and law enforcement agencies. As a leading provider of surveillance systems that enhance the effectiveness of radar using sophisticated algorithms, Vista will also allow Aerostar to enhance its tethered aerostat security solutions.
MAJOR CUSTOMER INFORMATION
One customer accounted for 10% or more of consolidated sales in fiscal 2013. Sales to West Texas Plastics Limited, a customer in the Engineered Films Division, accounted for 11% of consolidated sales in both fiscal 2013 and 2012. In addition to this customer, sales to Goodrich Corporation, a customer of Aerostar, accounted for 10% of consolidated sales in fiscal 2012. As expected, revenue from this customer has continued to decline from 10% and 13%, respectively, of consolidated sales in fiscal 2012 and 2011. No other customers accounted for 10% of consolidated sales in fiscal 2012 or 2011.
SEASONAL WORKING CAPITAL REQUIREMENTS
Some seasonal demand exists in Applied Technology's agricultural market. Applied Technology builds product in the fall for winter and spring delivery. Certain sales to agricultural customers offer spring payment terms for fall and early winter shipments. The resulting fluctuations in inventory and accounts receivable have required, and may require, seasonal short-term financing.
FINANCIAL INSTRUMENTS
The principal financial instruments that the Company maintains are cash, cash equivalents, short-term investments, accounts receivable, accounts payable and acquisition-related contingent payments. The Company manages the interest rate, credit and market risks associated with these accounts through periodic reviews of the carrying value of assets and liabilities and establishment of appropriate allowances in connection with Company policies. The Company does not use off-balance sheet financing, except to enter into operating leases.
The Company uses derivative financial instruments to manage foreign currency risk. The use of these financial instruments has had no material effect on consolidated results of operations, financial condition or cash flows.
RAW MATERIALS
The Company obtains a wide variety of materials from several vendors. Principal materials include numerous electronic components for Aerostar and Applied Technology, various plastic resins for Engineered Films and fabrics for Aerostar. Engineered Films has experienced volatile resin prices over the past three years. Price increases could not always be passed on to customers due to weak demand and a competitive pricing environment. Aerostar experiences variability in lead times for components as business cycles impact demand. However, predicting future material shortages and the related potential impact on Raven is not possible.
PATENTS
The Company owns a number of patents. However, Raven does not believe that its business, as a whole, is materially dependent on any one patent or related group of patents. It believes the successful manufacture and sale of its products generally depend more upon its technical expertise, speed to market and manufacturing skills.
RESEARCH AND DEVELOPMENT
The business segments conduct ongoing research and development efforts. Most of the Company's research and development expenditures are directed toward new products in the Applied Technology, Engineered Films and Aerostar Divisions. Total Company research and development costs are presented on the Consolidated Statements of Income and Comprehensive Income.
ENVIRONMENTAL MATTERS
Except as described below, the Company believes that, in all material respects, it is in compliance with applicable federal, state and local environmental laws and regulations. Expenditures incurred in the past relating to compliance for operating facilities have not significantly affected the Company's capital expenditures, earnings or competitive position.
In connection with the sale of substantially all of the assets of the Company's Glasstite, Inc. subsidiary in fiscal 2000, the Company has agreed to assume responsibility for the investigation and remediation of any pre-October 29, 1999, environmental contamination at the Company's former Glasstite pickup-truck topper facility in Dunnell, Minnesota, as required by the Minnesota Pollution Control Agency (MPCA) or the United States Environmental Protection Agency (EPA).
The Company and the purchasers of the Company's Glasstite subsidiary conducted environmental assessments of the properties. Although these assessments continue to be evaluated by the MPCA on the basis of the data available, the Company believes that any activities that might be required as a result of the findings of the assessments will not have a material effect on the Company's results of operations, financial position or cash flows. The company had $53 thousand accrued at January 31, 2013, representing its best estimate of probable costs to be incurred related to these matters.
BACKLOG
As of February 1, 2013, the Company's order backlog totaled $51.1 million. Backlog amounts as of February 1, 2012 and 2011 were $66.6 million and $76.0 million, respectively. Because the length of time between order and shipment varies considerably by business segment and customers can change delivery schedules or potentially cancel orders, the Company does not believe that backlog, as of any particular date, is necessarily indicative of actual net sales for any future period.
EMPLOYEES
As of January 31, 2013, the Company had 1,379 employees, 1,327 in an active status. Following is a summary of active employees by segment: Applied Technology - 539; Engineered Films - 236; Aerostar - 458; Corporate Services - 94. Management believes its employee relations are satisfactory.
|
| | |
EXECUTIVE OFFICERS | | |
| | |
Name, Age and Position | | Biographical Data |
Daniel A. Rykhus, 48 | | Mr. Rykhus became the Company's President and Chief Executive Officer in 2010. He joined Raven in 1990 as Director of World Class Manufacturing, was General Manager of the Applied Technology Division from 1998 through 2009, and served as Executive Vice President from 2004 through 2010. |
President and Chief Executive Officer | |
| |
| | |
Thomas Iacarella, 59 | | Mr. Iacarella joined Raven in 1991 as Corporate Controller and has been the Company's Chief Financial Officer and Treasurer since 1998. Prior to joining the Company, he held positions with Tonka Corporation and the accounting firm now known as Ernst & Young. |
Vice President and Chief Financial Officer | |
| |
| | |
Stephanie Herseth Sandlin, 42 | | Ms. Herseth Sandlin joined Raven in August 2012 as General Counsel and Vice President of Corporate Development and also became the Company's Secretary in March 2013. Prior to joining Raven, Ms. Herseth Sandlin was a partner at OFW Law in Washington, D.C. from 2011 to 2012 and served as South Dakota's lone member of the United States House of Representatives from 2004 through 2011.
|
General Counsel and Vice President of Corporate Development | |
| |
| | |
Janet L. Matthiesen, 55 | | Ms. Matthiesen joined Raven in 2010 as Director of Administration and has been the Company's Vice President of Human Resources since April 2012. Prior to joining Raven, Ms. Matthiesen was a Human Resource Manager at Science Applications International Corporation from 2002 to 2010.
|
Vice President - Human Resources | |
| |
| | |
Matthew T. Burkhart, 37 | | Mr. Burkhart was named Division Vice President and General Manager of the Applied Technology Division on February 1, 2010. He joined Raven in 2008 as Director of Sales and became General Manager - Applied Technology Division on February 1, 2009. Prior to joining the Company, he was a Branch Manager for Johnson Controls.
|
Division Vice President and General Manager - | |
Applied Technology Division | |
| | |
Anthony D. Schmidt, 41 | | Mr. Schmidt was named Division Vice President and General Manager of the Engineered Films Division on February 1, 2012. He joined Raven in 1995 in the Applied Technology Division performing various leadership roles within manufacturing and engineering. He transitioned to Engineered Films Division in September 2011 as Manufacturing Manager. |
Division Vice President and General Manager - | |
Engineered Films Division | |
| | |
Lon E. Stroschein, 38 | | Mr. Stroschein was named Vice President and General Manager of the Aerostar Division in October 2010. He joined Raven in 2008 as International Sales Manager for Applied Technology. Prior to joining Raven, he was a bank vice president and was a member of the executive staff for a U.S. Senator.
|
Division Vice President and General Manager - | |
Aerostar Division | |
| |
Note 15 Business Segments and Major Customer Information
Applied Technology
Applied Technology designs, manufactures, sells, and services innovative precision agriculture products and information management tools that help growers reduce costs, decrease inputs, and improve farm yields around the world. The Applied Technology product families include field computers, application controls, GPS-guidance and assisted-steering systems, automatic boom controls, planter controls, and harvest controls. Applied Technology's services include high-speed in-field Internet connectivity and cloud-based data management. The Company's investment in Site-Specific Technology Development Group, Inc. (SST), a software company, and the continued build-out of the Slingshot™ platform have positioned Applied Technology as an information platform that improves grower decision-making and business efficiencies for our agriculture retail partners.
Applied Technology sells its precision agriculture control products to both original equipment manufacturers (OEMs) and through aftermarket distribution partners in the United States and in most major agricultural areas around the world. Applied Technology has personnel and third-party distribution representatives located in the U.S. and key geographic areas throughout the world. The Company's competitive advantage in this segment is designing and selling easy to use, reliable, and innovative value-added products that are supported by an industry-leading service and support team.
Engineered Films
Engineered Films produces high-performance plastic films and sheeting for energy, agricultural, construction, geomembrane, and industrial applications.
Engineered Films primarily sells plastic sheeting to independent third-party distributors in each of the various markets it serves. Through the acquisition of Integra Plastics, Inc. (Integra) in November 2014, Engineered Films also leverages a direct sales channel in the division’s energy market. The Company extrudes a significant portion of the film converted for its commercial products and believes it is one of the largest sheeting converters in the United States in the markets it serves. Engineered Films believes its ability to both extrude and convert films allows it to provide a more customized solution to customers. A number of suppliers of sheeting compete with the Company on both price and product availability. Engineered Films is the Company's most capital-intensive business segment, and historically has made sizable investments in new extrusion capacity and conversion equipment. This segment's capital expenditures were $10.8 million in fiscal 2016, $8.2 million in fiscal 2015, and $6.7 million in fiscal 2014.
Aerostar
Aerostar serves the defense/aerospace and situational awareness markets. Aerostar's products include high-altitude balloons, tethered aerostats, and radar processing systems. These products can be integrated with additional third-party sensors to provide research, communications, and situational awareness capabilities to governmental and commercial customers. Aerostar’s growth strategy emphasizes the design and manufacture of proprietary products in these markets. In previous years, Aerostar also provided contract manufacturing services. During this last year the Company largely exited this business. Net sales from contract manufacturing in fiscal 2016 were $4.7 million, compared to $31.7 million in fiscal 2015 and $51.3 million in fiscal 2014. The planned wind-down of contract manufacturing is now complete.
The acquisition of Vista Research, Inc. (Vista) in January 2012 positioned the Company to meet global demand for lower-cost target detection and tracking systems used by government agencies. Through Vista and a separate business venture that is majority-owned by the Company, Aerostar pursues potential product and support services contracts for agencies and instrumentalities of the U.S. government as well as sales of advanced radar systems, high-altitude balloons, and aerostats in international markets. In some cases, such sales will be Direct Commercial Sales to foreign governments rather than Foreign Military Sales through the U.S. government.
Aerostar sells to government agencies or commercial users primarily as a sub-contractor. The projects Aerostar bids on can be large-scale, with opportunities in the $10-$50 million range. Further, Direct Commercial Sales to foreign governments often involve large contracts subject to frequent delays because of budget uncertainties, regional military conflicts, and protracted negotiation processes. The timing of contract wins results in volatility in Aerostar’s results.
MAJOR CUSTOMER INFORMATION
No customers accounted for 10% or more of consolidated sales in fiscal 2016. Sales to Brawler Industrial Fabrics, a customer in the Engineered Films Division, accounted for 14%, and 13% of consolidated sales in fiscal years 2015 and 2014.
SEASONAL WORKING CAPITAL REQUIREMENTS
Some seasonal demand exists in Applied Technology's agricultural market. Applied Technology builds product in the fall for winter and spring delivery. Certain sales to agricultural customers offer spring payment terms for fall and early winter shipments. The resulting fluctuations in inventory and accounts receivable have required, and may require, seasonal short-term financing.
Engineered Films also sees seasonal demand peak in the second and third fiscal quarters.
FINANCIAL INSTRUMENTS
The principal financial instruments that the Company maintains are cash, cash equivalents, short-term investments, accounts receivable, accounts payable, and acquisition-related contingent payments. The Company manages the interest rate, credit, and market risks associated with these accounts through periodic reviews of the carrying value of assets and liabilities and establishment of appropriate allowances in accordance with Company policies. The Company does not use off-balance sheet financing, except to enter into operating leases.
The Company uses derivative financial instruments to manage foreign currency risk. The use of these financial instruments has had no material effect on consolidated results of operations, financial condition, or cash flows.
RAW MATERIALS
The Company obtains a wide variety of materials from numerous vendors. Principal materials include electronic components for Aerostar and Applied Technology, various plastic resins for Engineered Films, and fabrics for Aerostar. Engineered Films has experienced volatile resin prices over the past three years. Price increases could not always be passed on to customers due to weak demand and a competitive pricing environment. Predicting future material volatility and the related potential impact on the Company is not possible.
PATENTS
The Company owns a number of patents. The Company does not believe that its business, as a whole, is materially dependent on any one patent or related group of patents. As the Company continues to develop more technology-based offerings, protection of the Company’s intellectual property has become an increasingly important strategic objective. Along with a more aggressive posture toward patenting new technology and protecting trade secrets, the Company has restrictions on the disclosure of our technology to industry and business partners to ensure that our intellectual property is maintained and protected.
RESEARCH AND DEVELOPMENT
The business segments conduct ongoing research and development efforts. Most of the Company's research and development expenditures are directed toward new product development, particularly in the Applied Technology Division. Total Company research and development costs are presented in the Consolidated Statements of Income and Comprehensive Income.
ENVIRONMENTAL MATTERS
The Company believes that, in all material respects, it is in compliance with applicable federal, state and local environmental laws and regulations. Expenditures incurred in the past relating to compliance for operating facilities have not significantly affected the Company's capital expenditures, earnings, or competitive position.
In connection with the sale of substantially all of the assets of the Company's Glasstite, Inc. subsidiary in fiscal 2000, the Company agreed to assume responsibility for the investigation and remediation of any pre-October 29, 1999, environmental contamination at the Company's former Glasstite pickup-truck topper facility in Dunnell, Minnesota, as required by the Minnesota Pollution Control Agency (MPCA) or the United States Environmental Protection Agency.
The Company and the purchasers of the Company's Glasstite subsidiary conducted environmental assessments of the properties. Although these assessments continue to be evaluated by the MPCA on the basis of the data available, the Company believes that any activities that might be required as a result of the findings of the assessments will not have a material effect on the Company's results of operations, financial position, or cash flows. The Company had $37 thousand accrued at January 31, 2016, representing its best estimate of probable costs to be incurred related to this and all other environmental matters.
BACKLOG
As of February 1, 2016, the Company's order backlog totaled approximately $18.6 million. Backlog amounts as of February 1, 2015 and 2014 were $26.7 million and $51.8 million, respectively. Because the length of time between order and shipment varies considerably by business segment and customers can change delivery schedules or potentially cancel orders, the Company does not believe that backlog, as of any particular date, is necessarily indicative of actual net sales for any future period.
EMPLOYEES
As of January 31, 2016, the Company had approximately 910 employees. Following is a summary of active employees by segment: Applied Technology - 363; Engineered Films - 298; Aerostar - 175; and Corporate Services - 75. Management believes its employee relations are satisfactory.
|
| | |
| EXECUTIVE OFFICERS | | |
| | |
| Name, Age and Position | | Biographical Data |
| Daniel A. Rykhus, 51 | | Mr. Rykhus became the Company's President and Chief Executive Officer in 2010. He joined the Company in 1990 as Director of World Class Manufacturing, was General Manager of the Applied Technology Division from1998 through 2009, and served as Executive Vice President from 2004 through 2010. |
| President and Chief Executive Officer | |
| |
| | |
| Steven E. Brazones, 42 | | Mr. Brazones joined the Company in December 2014 as its Vice President, Chief Financial Officer, and Treasurer. From 2002 to 2014, Mr. Brazones held a variety of positions with H.B. Fuller Company. Most recently, he served as H.B. Fuller's Americas Region Finance Director. Previously, he served as the Assistant Treasurer and the Director of Investor Relations. Prior to his tenure with H.B. Fuller, Mr. Brazones held various roles at Northwestern Growth. |
| Vice President and Chief Financial Officer | |
| |
| |
| | |
| Stephanie Herseth Sandlin, 45 | | Ms. Herseth Sandlin joined the Company in August 2012 as General Counsel and Vice President of Corporate Development and also became the Company's Secretary in March 2013. Prior to joining the Company, Ms. Herseth Sandlin was a partner at OFW Law in Washington, D.C. from 2011 to 2012 and served as South Dakota's lone member of the United States House of Representatives from 2004 through 2011. |
| General Counsel and Vice President of Corporate Development | |
| |
| | |
| Janet L. Matthiesen, 58 | | Ms. Matthiesen joined the Company in 2010 as Director of Administration and has been the Company's Vice President of Human Resources since 2012. Prior to joining Raven, Ms. Matthiesen was a Human Resource Manager at Science Applications International Corporation from 2002 to 2010.
|
| Vice President of Human Resources | |
| |
| | |
| Brian E. Meyer, 53 | | Mr. Meyer was named Division Vice President and General Manager of the Applied Technology Division in May 2015. He joined the Company in 2010 as Chief Information Officer. Prior to joining the Company, Mr. Meyer was an information and technology executive in the health insurance industry and vice president of systems development in the property and casualty insurance industry.
|
| Division Vice President and General Manager - | |
| Applied Technology Division | |
| | |
| Anthony D. Schmidt, 44 | | Mr. Schmidt was named Division Vice President and General Manager of the Engineered Films Division in 2012. He joined the Company in 1995 in the Applied Technology Division performing various leadership roles within manufacturing and engineering. He transitioned to Engineered Films Division in 2011 as Manufacturing Manager. |
| Division Vice President and General Manager - | |
| Engineered Films Division | |
FORWARD-LOOKING STATEMENTS
Certain statements contained in this report are “forward-looking statements” within the meaning of Section 27A of the Securities Act of 1933, as amended, and Section 21E of the Securities Exchange Act of 1934, as amended, including statements regarding the expectations, beliefs, intentions or strategies regarding the future. Without limiting the foregoing, the words “anticipates,” “believes,” “expects,” “intends,” “may,” “plans” and similar expressions are intended to identify forward-looking statements. The Company intends that all forward-looking statements be subject to the safe harbor provisions of the Private Securities Litigation Reform Act. Although the Company believes that the expectations reflected in such forward-looking statements are based on reasonable assumptions, there is no assurance that such assumptions are correct or that these expectations will be achieved. Such assumptions involve important risks and uncertainties that could significantly affect results in the future. These risks and uncertainties include, but are not limited to, those relating to weather conditions and commodity prices, which could affect certain of the Company's primary markets, such as agriculture and construction and oil and gas well drilling; or changes in competition, raw material availability, technology or relationships with the Company's largest customers, any of which could adversely impact any of the Company's product lines, as well as other risks described below. The foregoing list is not exhaustive and the Company disclaims any obligation to subsequently revise any forward-looking statements to reflect events or circumstances after the date of such statements.
RISKS RELATING TO THE COMPANY
Raven operates in markets that involve significant risks,The Company's business is subject to many of whichrisks. Set forth below are beyond the Company's control. Based on current information, the Company believes that the following identifies the most significant risk factors that could affect its businesses. However,important risks we face. In evaluating our business and your investment in us, you should also consider the risks and uncertainties the Company faces are not limited to those discussed below. There could be other unknowninformation presented in or unpredictable economic, business, competitive or regulatory factors, including factors that the Company currently believes to be immaterial, that could have material adverse effectsincorporated by reference into this Annual Report on the Company's financial position, liquidity and results of operations. Past financial performance may not be a reliable indicator of future performance and historical trends should not be used to anticipate results or trends in future periods.Form 10-K.
Weather conditions could affect certain of the Company's markets such as agriculture and construction.
The Company's Applied Technology Division is largely dependent on the ability of farmers, and agricultural subcontractors known asservice providers, and custom operators to purchase agricultural equipment that includes its products. If such farmers experience adverse weather conditions resulting in poor growing conditions, or experience unfavorable crop prices or expenses, potential buyers may be less likely to purchase agricultural equipment. Conversely, if farmers experience favorable weather and growing conditions, high yields could result in unfavorable crop prices and lower farm income making potential buyers less likely to purchase agricultural equipment. Accordingly, weather conditions may adversely affect sales in the Applied Technology Division.
Weather conditions can also adversely affect sales in the Company's Engineered Films Division. To the extent weather conditions curtail construction or agricultural activity, such as a late spring or drought, sales of the segment's plastic sheeting willwould likely decrease.
Seasonal, weather-related and market demand variation could also affect quarterly results. If expected sales are deferred in a fiscal quarter while inventory has been built and operating expenses incurred, financial results could be negatively impacted.
Price fluctuations in and shortages of raw materials could have a significant impact on the Company's ability to sustain and grow earnings.
The Company's Engineered Films Division consumes significant amounts of plastic resin, the costscost of which reflectdepends upon market prices for natural gas and oil and other market forces. These prices are subject to worldwide supply and demand as well as other factors beyond the control of the Company. Although the Engineered Films Division is sometimes able to pass on such price increases to its customers, significant variations in the cost of plastic resins can affect the Company's operating results from period to period. Unusual supply disruptions, such as one caused by a natural disaster, could cause suppliers to invoke “force majeure” clauses in their supply agreements, causing shortages of material. Success in offsetting higher raw material costs with price increases is largely influenced by competitive and economic conditions and could vary significantly depending on the market served. If the Company is not able to fully offset the effects of materialadverse materials availability and correspondingly higher costs, financial results could be adversely affected.
Electronic components used by both the Applied Technology Division and Aerostar Division, are sometimes in short supply, impacting our ability to meet customer demand.
If a supplier of raw materials or components were unable to deliver due to shortage or financial difficulty, any of the Company's segments could be adversely affected.
Fluctuations in commodity prices can increase our costs and decrease our sales.
Agricultural income levels are affected by agricultural commodity prices and input costs. As a result, changes in commodity prices that reduce agricultural income levels could have a negative effect on the ability of growers and their contractorsservice providers to purchase the Company's precision agriculture products manufactured by its Applied Technology Division.
Exploration for oil and natural gas fluctuates with their price.price and recent energy market conditions suggest that while end-market conditions are not likely to deteriorate further, they are not likely to improve in the near term. Plastic sheeting manufactured and sold by our Engineered Films Division is sold as pit and pond liners to contain water used in the drilling process. Lower prices for oil and natural gas could reduce exploration activities and demand for our products.
Plastic sheeting manufacturemanufacturing uses plastic resins, which can be subject to changechanges in price as the cost of natural gas or oil changes. Accordingly, volatility in oil and natural gas prices may negatively affect our raw material costs and cost of goods sold orand potentially cause us to changeincrease prices, which could adversely affect our sales andand/or profitability.
Failure to develop and market new technologies and products could impact the Company's competitive position and have an adverse effect on the Company's financial results.
The Company's operating results in its Applied Technology, and to a lesser extent, its Engineered Films, and Aerostar are largely dependent ondepend upon the ability to renew the pipeline of new products and to bring those products to market. This ability could be adversely affected by difficulties or delays in product development such as the inability to identify viable new products, successfully complete research and development, obtain relevant regulatory approvals, obtain intellectual property protection or gain market acceptance of new products and services. Because of the lengthy development process, technological challenges, and intense competition, there can be no assurance that any of the products the Company is currently developing, or could begin to develop in the future, will achieve substantial commercial success. Technical advancements in products may also increase the risk of product failure, increasing product returns or warranty claims and settlements. In addition, sales of the Company's new products could replace sales of some of its current products, offsetting the benefit of even a successful product introduction.
The Company's electronic manufacturing services business is dependent on a small numbersales of customersproducts which are specialized and faceshighly technical in nature are subject to uncertainties, start-up costs and inefficiencies, as well as market, competitive, and compliance risks.
The Company's electronic manufacturing services (EMS) business in the Aerostar Division is dependent on a small number of customers. Accordingly, the EMS revenue is dependentCompany’s growth strategy relies on the continued growth, viability and financial stability of its customers, which consist of original equipment manufacturers of avionics and secure telecommunication equipment. Future sales are dependent on the success of the Company's customers, some of which operate in businesses associated with rapid technological change and consequent product obsolescence. Developments adverse to major customers or their products, or the failure of a major customer to pay for components or services, could have an adverse effect on EMS revenue.
Further, the Aerostar Division competes against many providers of electronics manufacturing services. Certain competitors have substantially greater resources and more geographically diversified international operations than Aerostar. This segment may also be at a competitive disadvantage with respect to price when compared to manufacturers with lower cost structures, particularly those with more offshore facilities located where labor and other costs are lower. The Company also faces competition from the manufacturing operations of current and future customers, who are continually evaluating the merits of manufacturing products internally against the advantages of outsourcing to EMS providers. Accordingly, to compete effectively, Aerostar must continue to provide technologically advanced manufacturing services, maintain strict quality standards, respond flexibly and rapidly to customers' design and schedule changes and deliver products globally on a reliable basis at competitive prices. Customersmanufacture of proprietary products. Highly technical, specialized product inventories may cancel their orders, change production quantitiesbe more susceptible to fluctuations in market demand. If demand is unexpectedly low, write-downs or delay production.impairments of such inventory may become necessary. Either of these outcomes could adversely affect our results of operations. Start-up costs and inefficiencies related to new or transferred programs can adversely affect operating results and such costs may not be recoverable in a proprietary product environment because the Company may not receive reimbursement from its customers for such costs.
Competition in agriculture markets could come from our current customers if original equipment manufacturers develop and integrate precision agriculture technology products themselves rather than purchasing from third parties, reducing demand for Applied Technology’s products.
Regulatory restrictions could be placed on hydraulic fracturing because of environmental and health concerns, reducing demand for Engineered Film’s products. For Engineered Films, the development of alternative technologies, such new programsas closed loop drilling processes that would reduce the need for pit liners in energy exploration, could also reduce demand for the Company’s products.
Aerostar’s future growth relies on sales of high-altitude balloons, advanced radar systems, and aerostats to international markets. In some cases, such sales will be Direct Commercial Sales to foreign governments rather than Foreign Military Sales through the U.S. government. Direct Commercial Sales to foreign governments often involve large contracts subject to frequent delays because of budget uncertainties, regional military conflicts, and protracted negotiation processes. Such delays could adversely affect our results of operations. The nature of these markets for Vista's radar systems and Aerostar's aerostats makes these products particularly susceptible to fluctuations in market demand. Demand fluctuations and the likelihood of delays in sales involving large contracts for such products also increase the risk of these products becoming obsolete, increasing risk associated with expected sales of such products. The value of aerostat and radar systems inventory at January 31, 2016 is approximately $12 million. This valuation is based on an estimate that the market demand for these products will be sufficient in future periods such that these inventories will be sold at a price greater than carrying value. Write-downs or transferred programsimpairment of the value of such products carried in inventory could adversely affect our results of operations. To the extent products become obsolete or anticipated sales are canceled.not realized, our expected future cash flows could be adversely impacted. An impairment could adversely impact the Company's results of operations and financial condition.
Sales of certain of Aerostar’s products into international markets increase the compliance risk associated with regulations such as The International Traffic in Arms Regulations (ITAR), as well as others, exposing the Company to fines and its employees to fines, imprisonment, or civil penalties. Potential consequences of a material violation of such regulations include damage to our reputation, litigation, and increased costs.
The Company's Aerostar segment depends on the U.S. government for a significant portion of its sales, creating uncertainty in the timing of and funding for projected contracts.
A significant portion of Aerostar's sales are to the U.S. government or U.S. government agencies as a prime or sub-contractor. Government spending has historically been cyclical. A decrease in U.S. government defense or near-space research spending or changes in spending allocationallocations could result in one or more of the Company's programs being reduced, delayed, or terminated. Reductions in the Company's existing programs, unless offset by other programs and opportunities, could adversely affect its ability to sustain and grow its future sales and earnings. The Company's U.S. government sales are funded by the federal budget, which operates on an October-to-September fiscal year. Changes in congressional schedules, negotiations for program funding levels, reduced program funding due to U.S government debt limitations, automatic budget cuts ("sequestration") or unforeseen world events can interrupt the funding for a program or contract. Funds for multi-year contracts can be changed in subsequent years in the appropriations process.
In addition, themany U.S. government has increasingly relied on indefinite delivery, indefinite quantity (IDIQ) contracts and other procurement vehicles that are subject to a competitive bidding and funding process even after the award of the basic contract, adding an additional element of uncertainty to future funding levels. Delays in the funding process or changes in funding can impact the timing of available funds or can lead to changes in program content or termination at the government's convenience. The loss of anticipated funding or the termination of multiple or large programs could have an adverse effect on the Company's future sales and earnings.
The Company derives a portion of its revenues from foreign markets, which subjects the Company to business risks, including risk of changes in government policies and laws or worldwide economic conditions.
The Company's sales outside the U.S. were $49.3$27.8 million in fiscal 2013,2016, representing 12%11% of consolidated net sales. The Company's financial results could be affected by changes in trade, monetary and fiscal policies, laws and regulations, or other activities of U.S. and non-U.S. governments, agencies and similar organizations.organizations, along with changes in worldwide economic conditions. These conditions include, but are not limited to, changes in a country's or region's economic or political conditions;condition; trade regulations affecting production, pricing, and marketing of products; local labor conditions and regulations; reduced protection of intellectual property rights in some countries; changes in the regulatory or legal environment; restrictions on currency exchange activities; the impact of fluctuations in foreign currency exchange rates, which may affect product demand and may adversely affect the profitability of our products in U.S. dollars in foreign markets where payments are made in the local currency; burdensome taxes and tariffstariffs; and other trade barriers. International risks and uncertainties also include changing social and economic conditions, terrorism, political hostilities and war, difficulty in enforcing agreements or collecting receivables, and increased transportation or other shipping costs. Any of these such risks could lead to reduced sales and reduced profitability associated with such sales.
Adverse economic conditions in the major industries the Company serves may materially affect segment performance and consolidated results of operations.
The Company's results of operations are impacted by the market fundamentals of the primary industries served. Significant declines of economic activity in the agricultural, oil and gas exploration, construction, industrial, aerospace/aviation, communication, defense and other major markets served may adversely affect segment performance and consolidated results of operations.
The Company may pursue or complete acquisitions which represent additional risk and could impact future financial results.
The Company's business strategy includes the potential for future acquisitions. Acquisitions involve a number of risks including integration of the acquired company with the Company's operations and unanticipated liabilities or contingencies related to the acquired company. Further, business strategies supported by the acquisition may be in perceived, or actual, opposition to strategies of certain of our customers and our business could be materially adversely affected if those relationships are terminated and the expected strategic benefits are delayed or are not achieved. The Company cannot ensure that the expected benefits of any future acquisitionsacquisition will be realized. Costs could be incurred on pursuits or proposed acquisitions that have not yet or may not close which could significantly impact the operating results, financial condition, or cash flows. Additionally, after the acquisition, unforeseen issues could arise which adversely affect the anticipated returns or which are otherwise not recoverable as an adjustment to the purchase price. Other acquisition risks include delays in realizing benefits from the acquired companies or products; difficulties due to lack of or limited prior experience in any new product or geographic markets we enter; unforeseen adjustments, charges or write-offs; unforeseen losses of customers or,of, or suppliers to, acquired businesses; difficulties in retaining key employees of the acquired businesses; or challenges arising from increased geographic diversity and complexity of our operations.operations and our information technology systems.
Total goodwill and intangible assets account for approximately $31.0$60.6 million, or 11%20%, of Raven'sthe Company's total assets as of January 31, 2013.2016. The Company evaluates goodwill and intangible assets for impairment annually, or when evidence of potential impairment exists. The annual impairment test is based on several factors requiring judgment. Principally, a significant decrease in expected cash flows or changes in market conditions may indicate potential impairment of recorded goodwill or intangible assets. Our expected future cash flows are dependent on several factors including revenue growth in certain of our product lines and an expectation that the pricing in commodities markets will recover in future periods. Our expected future cash flows could be adversely impacted if our anticipated revenue growth is not realized or if pricing in commodities markets does not recover in future periods. An impairment wouldcould adversely impact the Company's results of operations and financial condition.
The Company may fail to continue to attract, develop and retain key management and other key employees, which could negatively impact our operating results.
We depend on the performance of our senior management team and other key employees, including experienced and skilled technical personnel. The loss of certain members of our senior management, including our Chief Executive Officer, could negatively impact our operating results and ability to execute our business strategy. Our future success will also depend in part upon our ability to attract, train, motivate, and retain qualified personnel.
The Company may fail to protect its intellectual property effectively, or may infringe upon the intellectual property of others. others.
The Company has developed significant proprietary technology and other rights that are used in its businesses. The Company relies on trade secret, copyright, trademark, and patent laws and contractual provisions to protect the Company's intellectual property. While the Company takes enforcement of these rights seriously, other companies such as competitors or analogous persons in related markets in which the Company does not participate may attempt to copy or use the Company's intellectual property for their own benefit.
In addition, intellectual property of others also has an impact on the Company's ability to offer some of its products and services for specific uses or at competitive prices. Competitors' patents or other intellectual property may limit the Company's ability to offer products and services to its customers. Any infringement or claimed infringement of the intellectual property rights of others could result in litigation and adversely affect the Company's ability to continue to provide, or could increase the cost of providing, products and services.
Intellectual property litigation is very costly and could result in substantial expense and diversions of the Company's resources, both of which could adversely affect its businesses and financial condition and results. In addition, there may be no effective legal recourse against infringement of the Company's intellectual property by third parties, whether due to limitations on enforcement of rights in foreign jurisdictions or as a result of other factors.
Technology failures or cyber-attacks on the Company's systems could disrupt the Company's operations or the functionality of its products and negatively impact the Company's business.
The Company increasingly relies on information technology systems to process, transmit, and store electronic information. In addition, a significant portion of internal communications, as well as communication with customers and suppliers depends on
information technology. Further, the products in our Applied Technology segment depend upon GPS and other systems through which our products interact with government computer systems and other centralized information sources. We are exposed to the risk of cyber incidents in the normal course of business. Cyber incidents may be deliberate attacks for the theft of intellectual property or other sensitive information or may be the result of unintentional events. Like most companies, the Company's information technology systems may be vulnerable to interruption due to a variety of events beyond the Company's control, including, but not limited to, natural disasters, terrorist attacks, telecommunications failures, computer viruses, hackers, and other security issues. Further, attacks on centralized information sources could affect the operation of our products or cause them to malfunction. The Company has technology security initiatives and disaster recovery plans in place to mitigate the Company's risk to these vulnerabilities, but these measures may not be adequate or implemented properly to ensure that the Company's operations are not disrupted. Potential consequences of a material cyber incident include damage to our reputation, litigation, and increased cyber security protection and remediation costs. Such consequences could adversely affect our results of operations.
|
| |
| ITEM 1B. | UNRESOLVED STAFF COMMENTS |
None.
Raven's corporate office is at an owned premises located in Sioux Falls, South Dakota. TheAlong with the corporate headquarters building, the Company also owns separate manufacturing facilities for each of our business segments as well as various warehouses, training, and product development facilities. facilities in the immediate Sioux Falls area.
In addition to theseits Sioux Falls facilities, Applied Technology hasowns a product development facility in Austin, Texas and aan idle manufacturing facility located in St. Louis, Missouri;Missouri that is actively being marketed for sale. Applied Technology also leases manufacturing, research, and Aerostaroffice facilities in Middenmeer, Netherlands and Geel, Belgium and office/warehouse space in Stockholm, Saskatchewan Canada. In addition, Applied Technology leases smaller research and office facilities in South Dakota.
Engineered Films has additional owned production and conversion facilities located in Madison and Brandon, South Dakota and Midland, Texas.
Aerostar owns manufacturing, sewing, and research facilities located in Huron and Madison, South Dakota, and Sulphur Springs, Texas. AerostarAerostar's subsidiary Vista also leases facilities in Arlington, Virgina;Virginia and in Monterey, Chatsworth, and Chatsworth,Sunnyvale, California.
Most of the Company's manufacturing plants also serve as distribution centers and contain offices for sales, engineering, and manufacturing support staff. The Company believes that its properties are suitable and adequate to meet existing production needs. Additionally,Although there is idle capacity available in the Engineered Films Division, the productive capacity in the Company's facilities is substantially being utilized.used. The Company also owns approximately 6.229.6 acres of undeveloped land adjacent to the other owned property, which is available for expansion.
The following is the approximate square footage of the Company's owned or leased facilities by segment: Applied Technology - 170,000;182,000; Engineered Films - 310,000;606,000; Aerostar - 275,000;331,000; and Corporate - 150,000.150,000.
The Company is responsible for investigation and remediation of environmental contamination at one of its sold facilities (see Item 1, Business - Environmental Matters of this Annual Report on Form 10-K). In addition, the Company is involved as a defendantparty in lawsuits, claims, regulatory inquiries, or disputes arising in the normal course of its business. The potential costs and liability of such claims cannot be determined at this time. Management believes that any liability resulting from these claims will be substantially mitigated by insurance coverage. Accordingly, management does not believe the ultimate outcome of these matters will be significant to its results of operations, financial position or cash flows.
|
| |
| ITEM 4. | MINE SAFETY DISCLOSURES |
Not applicable.
|
| |
| PART II | |
| | |
| ITEM 5. | MARKET FOR REGISTRANT'S COMMON EQUITY, RELATED SHAREHOLDER MATTERS AND ISSUER PURCHASES OF EQUITY SECURITIES |
Raven'sThe Company's common stock is traded on the NASDAQ Global Select Market under the ticker symbol RAVN. The following table shows quarterly unaudited financial results, quarterly high and low salestrade prices per share of Raven'sthe Company's common stock, as reported by NASDAQ, and dividends declared for the periods indicated:
| | | QUARTERLY INFORMATION (UNAUDITED) | QUARTERLY INFORMATION (UNAUDITED) | | QUARTERLY INFORMATION (UNAUDITED) |
| (Dollars in thousands, except per-share amounts) | (Dollars in thousands, except per-share amounts) | | (Dollars in thousands, except per-share amounts) |
| | | Net Sales | Gross Profit | Operating Income | Pre-tax Income | Net Income Attributable to Raven | Net Income Per Share (a) (b) | Common Stock Market Price (b) | Cash Dividends Per Share | | | Net Sales | Gross Profit | Operating Income | Pre-tax Income | Net Income Attributable to Raven | Net Income Per Share(a) | Common Stock Market Price | Cash Dividends Per Share |
| | | | |
| | | Basic | Diluted | High | Low | (b) | | Basic | Diluted | High | Low |
| FISCAL 2013 | | | |
| FISCAL 2016 | | FISCAL 2016 | |
| First Quarter | First Quarter | $ | 117,915 |
| $ | 41,135 |
| $ | 28,432 |
| $ | 28,380 |
| $ | 19,043 |
| $ | 0.53 |
| $ | 0.52 |
| $ | 35.56 |
| $ | 28.16 |
| $ | 0.105 |
| | First Quarter | $ | 70,273 |
| $ | 20,359 |
| $ | 7,214 |
| $ | 7,170 |
| $ | 4,855 |
| $ | 0.13 |
| $ | 0.13 |
| $ | 22.85 |
| $ | 16.91 |
| $ | 0.13 |
|
| Second Quarter | Second Quarter | 101,674 |
| 30,064 |
| 17,407 |
| 17,311 |
| 11,546 |
| 0.32 |
| 0.32 |
| 37.73 |
| 28.59 |
| 0.105 |
| | Second Quarter | 67,518 |
| 17,858 |
| 6,429 |
| 6,163 |
| 4,191 |
| 0.11 |
| 0.11 |
| 22.36 |
| 18.52 |
| 0.13 |
|
| Third Quarter | Third Quarter | 97,011 |
| 29,575 |
| 16,372 |
| 16,316 |
| 10,859 |
| 0.30 |
| 0.30 |
| 34.61 |
| 26.78 |
| 0.105 |
| | Third Quarter | 67,611 |
| 16,171 |
| (2,727 | ) | (2,850 | ) | (1,581 | ) | (0.04 | ) | (0.04 | ) | 19.53 |
| 15.77 |
| 0.13 |
|
| Fourth Quarter | Fourth Quarter | 89,575 |
| 26,899 |
| 15,481 |
| 15,639 |
| 11,097 |
| 0.31 |
| 0.30 |
| 28.19 |
| 23.01 |
| 0.105 |
| | Fourth Quarter | 52,827 |
| 11,397 |
| 176 |
| 299 |
| 1,024 |
| 0.03 |
| 0.03 |
| 19.61 |
| 13.87 |
| 0.13 |
|
| Total Year | Total Year | $ | 406,175 |
| $ | 127,673 |
| $ | 77,692 |
| $ | 77,646 |
| $ | 52,545 |
| $ | 1.45 |
| $ | 1.44 |
| $ | 37.73 |
| $ | 23.01 |
| $ | 0.42 |
| | Total Year | $ | 258,229 |
| $ | 65,785 |
| $ | 11,092 |
| $ | 10,782 |
| $ | 8,489 |
| $ | 0.23 |
| $ | 0.23 |
| $ | 22.85 |
| $ | 13.87 |
| $ | 0.52 |
|
| | | | | | |
| FISCAL 2012 | | | |
| FISCAL 2015 | | FISCAL 2015 | |
| First Quarter | First Quarter | $ | 101,541 |
| $ | 32,936 |
| $ | 23,533 |
| $ | 23,520 |
| $ | 15,716 |
| $ | 0.44 |
| $ | 0.43 |
| $ | 30.96 |
| $ | 23.60 |
| $ | 0.09 |
| | First Quarter | $ | 102,510 |
| $ | 31,766 |
| $ | 16,532 |
| $ | 16,453 |
| $ | 11,038 |
| $ | 0.30 |
| $ | 0.30 |
| $ | 40.06 |
| $ | 30.29 |
| $ | 0.12 |
|
| Second Quarter | Second Quarter | 90,344 |
| 28,130 |
| 18,674 |
| 18,598 |
| 12,461 |
| 0.34 |
| 0.34 |
| 29.80 |
| 24.68 |
| 0.09 |
| | Second Quarter | 94,485 |
| 25,658 |
| 10,696 |
| 10,637 |
| 7,719 |
| 0.21 |
| 0.21 |
| 34.56 |
| 27.75 |
| 0.12 |
|
| Third Quarter | Third Quarter | 93,300 |
| 27,254 |
| 16,875 |
| 16,871 |
| 11,390 |
| 0.32 |
| 0.32 |
| 32.44 |
| 21.62 |
| 0.09 |
| | Third Quarter | 91,292 |
| 24,339 |
| 10,159 |
| 10,087 |
| 6,783 |
| 0.19 |
| 0.18 |
| 30.74 |
| 22.13 |
| 0.13 |
|
| Fourth Quarter | Fourth Quarter | 96,326 |
| 27,872 |
| 16,559 |
| 16,709 |
| 11,002 |
| 0.31 |
| 0.30 |
| 34.65 |
| 25.09 |
| 0.09 |
| | Fourth Quarter | 89,866 |
| 21,483 |
| 6,414 |
| 6,324 |
| 6,193 |
| 0.16 |
| 0.16 |
| 26.56 |
| 20.75 |
| 0.13 |
|
| Total Year | Total Year | $ | 381,511 |
| $ | 116,192 |
| $ | 75,641 |
| $ | 75,698 |
| $ | 50,569 |
| $ | 1.40 |
| $ | 1.39 |
| $ | 34.65 |
| $ | 21.62 |
| $ | 0.36 |
| | Total Year | $ | 378,153 |
| $ | 103,246 |
| $ | 43,801 |
| $ | 43,501 |
| $ | 31,733 |
| $ | 0.86 |
| $ | 0.86 |
| $ | 40.06 |
| $ | 20.75 |
| $ | 0.50 |
|
| | | | | | |
| FISCAL 2011 | | | |
| FISCAL 2014 | | FISCAL 2014 | |
| First Quarter | First Quarter | $ | 85,030 |
| $ | 27,171 |
| $ | 19,505 |
| $ | 19,557 |
| $ | 12,945 |
| $ | 0.36 |
| $ | 0.36 |
| $ | 15.90 |
| $ | 13.27 |
| $ | 0.08 |
| | First Quarter | $ | 103,680 |
| $ | 34,916 |
| $ | 20,934 |
| $ | 20,736 |
| $ | 14,003 |
| $ | 0.38 |
| $ | 0.38 |
| $ | 34.04 |
| $ | 25.46 |
| $ | 0.12 |
|
| Second Quarter | Second Quarter | 73,174 |
| 20,389 |
| 12,623 |
| 12,529 |
| 8,353 |
| 0.23 |
| 0.23 |
| 19.09 |
| 14.33 |
| 0.08 |
| | Second Quarter | 93,421 |
| 26,735 |
| 12,568 |
| 12,349 |
| 8,333 |
| 0.23 |
| 0.23 |
| 35.68 |
| 28.82 |
| 0.12 |
|
| Third Quarter | Third Quarter | 85,823 |
| 24,887 |
| 17,866 |
| 17,883 |
| 11,833 |
| 0.32 |
| 0.32 |
| 21.06 |
| 15.00 |
| 0.71 |
| (c) | Third Quarter | 104,938 |
| 31,940 |
| 18,132 |
| 18,089 |
| 12,289 |
| 0.34 |
| 0.34 |
| 34.83 |
| 28.38 |
| 0.12 |
|
| Fourth Quarter | Fourth Quarter | 70,681 |
| 18,982 |
| 10,209 |
| 10,313 |
| 7,406 |
| 0.21 |
| 0.21 |
| 24.80 |
| 20.01 |
| 0.08 |
| | Fourth Quarter | 92,638 |
| 25,763 |
| 12,360 |
| 12,449 |
| 8,278 |
| 0.23 |
| 0.23 |
| 42.99 |
| 32.64 |
| 0.12 |
|
| Total Year | Total Year | $ | 314,708 |
| $ | 91,429 |
| $ | 60,203 |
| $ | 60,282 |
| $ | 40,537 |
| $ | 1.12 |
| $ | 1.12 |
| $ | 24.80 |
| $ | 13.27 |
| $ | 0.95 |
| | Total Year | $ | 394,677 |
| $ | 119,354 |
| $ | 63,994 |
| $ | 63,623 |
| $ | 42,903 |
| $ | 1.18 |
| $ | 1.17 |
| $ | 42.99 |
| $ | 25.46 |
| $ | 0.48 |
|
(a) | Net income per share is computed discretely by quarter and may not add to the full year. | | Net income per share is computed discretely by quarter and may not add to the full year. |
(b) | All per-share and market data reflect the July 2012 two-for-one stock split. | | |
(c) | A special dividend of $0.63 per share was paid during the third quarter of fiscal 2011. | | |
As of January 31, 2013,2016, the Company had approximately 10,40012,800 beneficial holders, which includes a substantial numberamount of the Company's common stock held byof record by banks, brokers, and other financial institutions.
On November 3, 2014, the Company announced that its Board of Directors (Board) had authorized a $40.0 million stock buyback program. During fiscal 2016, the Company made purchases of 1,602,545 common shares under this plan for a total cost of $29.3 million or $18.31 per share. None of these common shares were repurchased during the fourth quarter of fiscal 2016. There is approximately $10.7 million still available for share repurchases under this Board-authorized program which remains in place until such time as the authorized spending limit is reached or is otherwise revoked by the Board.
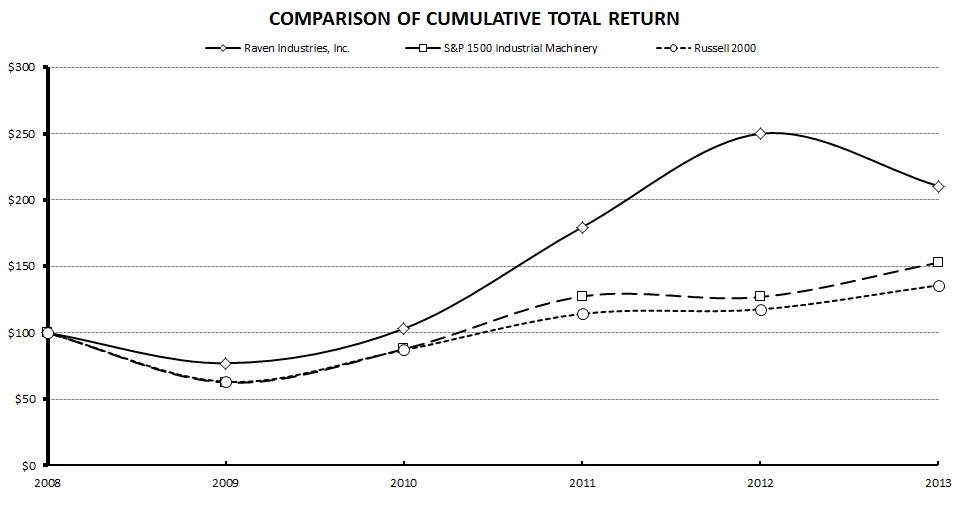
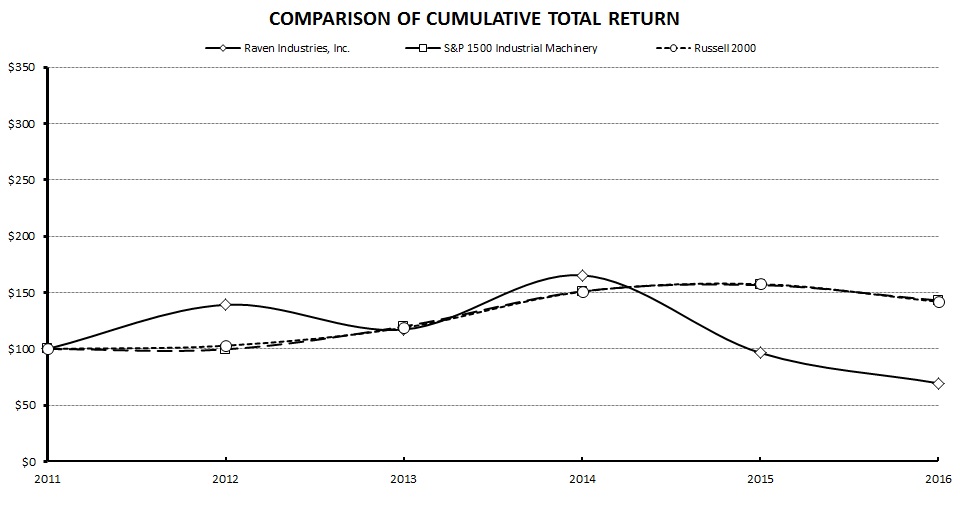
COMPARISON OF 5-YEAR CUMULATIVE TOTAL RETURN AMONG RAVEN INDUSTRIES, INC.,
S&P 1500 INDUSTRIAL MACHINERY INDEX AND RUSSELL 2000 INDEX
Raven outperformed its industrial peersThe above graph compares the cumulative total shareholders return on the Company's stock with the cumulative return of the S&P 1500 Industrial Machinery Index and the overall market in shareholder return.Russell 2000 index. Investors who bought $100 of the Company's stock on January 31, 20082011, held this for five years and reinvested the dividends would have seen its value increasedecrease to $201.5169.48. Stock performance on the graph is not necessarily indicative of future price performance.
| | | | | Years Ended January 31, | | 5-Year | | Years Ended January 31, | | 5-Year |
| Company / Index | | 2008 | | 2009 | | 2010 | | 2011 | | 2012 | | 2013 | | CAGR(a) | | 2011 | | 2012 | | 2013 | | 2014 | | 2015 | | 2016 | | CAGR(a) |
| | | | | | | | | | | | | | | | | | | | | | | | | | | | | |
| Raven Industries, Inc. | | $ | 100.00 |
| | $ | 77.08 |
| | $ | 103.15 |
| | $ | 179.62 |
| | $ | 250.00 |
| | $ | 201.51 |
| | 16.1 | % | | $ | 100.00 |
| | $ | 139.18 |
| | $ | 117.20 |
| | $ | 165.39 |
| | $ | 96.45 |
| | $ | 69.48 |
| | (7.0 | )% |
| S&P 1500 Industrial Machinery Index | | 100.00 |
| | 62.52 |
| | 87.71 |
| | 127.43 |
| | 126.95 |
| | 152.92 |
| | 8.9 | % | | 100.00 |
| | 99.63 |
| | 120.00 |
| | 151.19 |
| | 156.74 |
| | 142.97 |
| | 7.4 | % |
| Russell 2000 Index | | 100.00 |
| | 63.15 |
| | 87.04 |
| | 114.34 |
| | 117.61 |
| | 135.81 |
| | 6.3 | % | | 100.00 |
| | 102.86 |
| | 118.78 |
| | 150.88 |
| | 157.53 |
| | 141.90 |
| | 7.3 | % |
(a) compound annual growth rate (CAGR) | (a) compound annual growth rate (CAGR) | | | | | | | | | | | | | (a) compound annual growth rate (CAGR) | | | | | | | | | | | | |
(This page is intentionally left blank)
|
| |
| ITEM 6. | SELECTED FINANCIAL DATA |
| | ELEVEN-YEAR FINANCIAL SUMMARY | | (Dollars and shares in thousands, except employee counts and per-share amounts) | | For the years ended January 31, | |
| (In thousands, except employee counts and per-share amounts) | | | For the years ended January 31, |
| | | 2013 | | 2012 | | 2011 | | 2016 | | 2015 | | 2014 |
| OPERATIONS | | | | | | | | | | | | |
| Net sales | | $ | 406,175 |
| | $ | 381,511 |
| | $ | 314,708 |
| | $ | 258,229 |
| | $ | 378,153 |
| | $ | 394,677 |
|
| Gross profit | | 127,673 |
| | 116,192 |
| | 91,429 |
| | 65,785 |
| | 103,246 |
| | 119,354 |
|
Operating income | | 77,692 |
| | 75,641 |
| | 60,203 |
| | 11,092 |
| | 43,801 |
| | 63,994 |
|
Income before income taxes | | 77,646 |
| | 75,698 |
| | 60,282 |
| | 10,782 |
| | 43,501 |
| | 63,623 |
|
| Net income attributable to Raven Industries, Inc. | | $ | 52,545 |
| | $ | 50,569 |
| | $ | 40,537 |
| | 8,489 |
| | 31,733 |
| | 42,903 |
|
| Net income % of sales | | 12.9 | % | | 13.3 | % | | 12.9 | % | | 3.3 | % | | 8.4 | % | | 10.9 | % |
| Net income % of beginning equity | | 29.1 | % | | 35.8 | % | | 30.4 | % | |
| Net income % of average equity | | | 3.0 | % | | 11.4 | % | | 18.2 | % |
Cash dividends(a)(b) | | $ | 15,244 |
| | $ | 13,025 |
| | $ | 34,095 |
| | $ | 19,426 |
| | $ | 18,519 |
| | $ | 17,465 |
|
| FINANCIAL POSITION | | | | | | | | | | | | |
| Current assets | | $ | 156,748 |
| | $ | 147,559 |
| | $ | 128,181 |
| | $ | 125,733 |
| | $ | 170,979 |
| | $ | 169,405 |
|
| Current liabilities | | 33,061 |
| | 40,646 |
| | 34,335 |
| | 18,819 |
| | 31,843 |
| | 29,819 |
|
| Working capital | | $ | 123,687 |
| | $ | 106,913 |
| | $ | 93,846 |
| | $ | 106,914 |
| | $ | 139,136 |
| | $ | 139,586 |
|
| Current ratio | | 4.74 |
| | 3.63 |
| | 3.73 |
| | 6.68 |
| | 5.37 |
| | 5.68 |
|
| Property, plant and equipment | | $ | 81,238 |
| | $ | 61,894 |
| | $ | 41,522 |
| | $ | 116,162 |
| | $ | 117,513 |
| | $ | 98,076 |
|
| Total assets | | 273,210 |
| | 245,703 |
| | 187,760 |
| | 306,610 |
| | 362,873 |
| | 301,819 |
|
| Long-term debt, less current portion | | — |
| | — |
| | — |
| | — |
| | — |
| | — |
|
| Raven Industries, Inc. shareholders' equity | | $ | 221,346 |
| | $ | 180,499 |
| | $ | 141,214 |
| | $ | 268,791 |
| | $ | 305,153 |
| | $ | 251,362 |
|
| Long-term debt / total capitalization | | — | % | | — | % | | — | % | | — | % | | — | % | | — | % |
| Inventory turnover (cost of sales / average inventory) | | 5.4 |
| | 5.4 |
| | 5.6 |
| | 3.6 |
| | 4.9 |
| | 5.2 |
|
| CASH FLOWS PROVIDED BY (USED IN) | | | | | | | | | | | | |
| Operating activities | | $ | 76,456 |
| | $ | 43,831 |
| | $ | 42,085 |
| | $ | 44,008 |
| | $ | 60,083 |
| | $ | 52,836 |
|
| Investing activities | | (29,930 | ) | | (40,313 | ) | | (11,418 | ) | | (11,074 | ) | | (29,986 | ) | | (31,615 | ) |
| Financing activities | | (23,007 | ) | | (15,234 | ) | | (33,834 | ) | | (50,684 | ) | | (30,665 | ) | | (17,354 | ) |
| Change in cash | | 23,511 |
| | (11,721 | ) | | (3,121 | ) | |
| Change in cash and cash equivalents | | | (18,167 | ) | | (1,038 | ) | | 3,634 |
|
| COMMON STOCK DATA | | | | | | | | | | | | |
| EPS — basic | | $ | 1.45 |
| | $ | 1.40 |
| | $ | 1.12 |
| | $ | 0.23 |
| | $ | 0.86 |
| | $ | 1.18 |
|
| EPS — diluted | | 1.44 |
| | 1.39 |
| | 1.12 |
| | 0.23 |
| | 0.86 |
| | 1.17 |
|
Cash dividends per share(a)(b) | | 0.42 |
| | 0.36 |
| | 0.95 |
| | 0.52 |
| | 0.50 |
| | 0.48 |
|
Book value per share(b)(c) | | 6.09 |
| | 4.97 |
| | 3.91 |
| | 7.34 |
| | 8.01 |
| | 6.89 |
|
| Stock price range during the year | | | | | | | | | | | | |
| High | | $ | 37.73 |
| | $ | 34.65 |
| | $ | 24.80 |
| | $ | 22.85 |
| | $ | 40.06 |
| | $ | 42.99 |
|
| Low | | 23.01 |
| | 21.62 |
| | 13.27 |
| | 13.87 |
| | 20.75 |
| | 25.46 |
|
| Close | | $ | 26.93 |
| | $ | 32.45 |
| | $ | 23.62 |
| | $ | 15.01 |
| | $ | 21.44 |
| | $ | 37.45 |
|
| Shares and stock units outstanding, year-end | | 36,326 |
| | 36,284 |
| | 36,178 |
| | 36,600 |
| | 38,119 |
| | 36,492 |
|
| Number of shareholders, year-end | | 10,439 |
| | 10,618 |
| | 7,456 |
| | 12,791 |
| | 13,861 |
| | 11,764 |
|
| OTHER DATA | | | | | | | | | | | | |
Price / earnings ratio(c)(d) | | 18.7 |
| | 23.4 |
| | 21.1 |
| | 65.3 |
| | 24.9 |
| | 32.0 |
|
| Average number of employees | | 1,350 |
| | 1,252 |
| | 1,036 |
| | 936 |
| | 1,251 |
| | 1,264 |
|
| Sales per employee | | $ | 301 |
| | $ | 305 |
| | $ | 304 |
| | $ | 276 |
| | $ | 302 |
| | $ | 312 |
|
| Backlog | | $ | 51,121 |
| | $ | 66,641 |
| | $ | 75,972 |
| | $ | 18,567 |
| | $ | 26,718 |
| | $ | 51,793 |
|
| | | | | | | | | | | | | |
| All per-share, shares outstanding and market price data reflect the July 2012 two-for-one stock split, the October 2004 two-for-one stock split and the January 2003 two-for-one stock split. | |
| | |
| (a) Includes special dividends of $0.625 per share in fiscal 2011 and 2009; and $0.3125 per share in fiscal 2005 | |
| (b) Raven Industries, Inc. shareholders' equity, excluding equity attributable to noncontrolling interests, divided by common shares and stock units outstanding. | |
(c) Closing stock price divided by EPS — diluted. | | | | | | | |
| All per-share, shares outstanding and market price data reflect the July 2012 two-for-one stock split. | | All per-share, shares outstanding and market price data reflect the July 2012 two-for-one stock split. |
(a) The fiscal year ended January 31, 2016 includes pre-contract cost write-offs of $2,933, a goodwill impairment loss of $7,413, and a reduction of $1,483 acquisition-related contingent liability for Vista. | | (a) The fiscal year ended January 31, 2016 includes pre-contract cost write-offs of $2,933, a goodwill impairment loss of $7,413, and a reduction of $1,483 acquisition-related contingent liability for Vista. |
(b) Includes special dividends of $0.625 per share in fiscal 2011 and 2009. | | (b) Includes special dividends of $0.625 per share in fiscal 2011 and 2009. |
(c) Raven Industries, Inc. shareholders' equity, excluding equity attributable to noncontrolling interests, divided by common shares and stock units outstanding. | | (c) Raven Industries, Inc. shareholders' equity, excluding equity attributable to noncontrolling interests, divided by common shares and stock units outstanding. |
(d) Closing stock price divided by EPS — diluted. | | (d) Closing stock price divided by EPS — diluted. |
|
| | | | | | | | | | | | | | | | | | | | | | | | | | | | | | | |
| | | | | | | | | | | | | | | | |
| | | | | | | | | | | | | | | | |
| | 2010 | | 2009 | | 2008 | | 2007 | | 2006 | | 2005 | | 2004 | | 2003 |
| | | | | | | | | | | | | | | | |
| | $ | 237,782 |
| | $ | 279,913 |
| | $ | 233,957 |
| | $ | 217,529 |
| | $ | 204,528 |
| | $ | 168,086 |
| | $ | 142,727 |
| | $ | 120,903 |
|
| | 67,852 |
| | 73,448 |
| | 63,676 |
| | 57,540 |
| | 55,714 |
| | 45,212 |
| | 35,488 |
| | 28,828 |
|
| | 43,220 |
| | 46,394 |
| | 41,145 |
| | 38,302 |
| | 37,284 |
| | 27,862 |
| | 21,626 |
| | 17,065 |
|
| | 43,322 |
| | 46,901 |
| | 42,224 |
| | 38,835 |
| | 37,494 |
| | 27,955 |
| | 21,716 |
| | 17,254 |
|
| | $ | 28,574 |
| | $ | 30,770 |
| | $ | 27,802 |
| | $ | 25,441 |
| | $ | 24,262 |
| | $ | 17,891 |
| | $ | 13,836 |
| | $ | 11,185 |
|
| | 12.0 | % | | 11.0 | % | | 11.9 | % | | 11.7 | % | | 11.9 | % | | 10.6 | % | | 9.7 | % | | 9.3 | % |
| | 25.2 | % | | 26.0 | % | | 28.3 | % | | 30.1 | % | | 36.7 | % | | 26.9 | % | | 23.8 | % | | 21.5 | % |
| | $ | 9,911 |
| | $ | 31,884 |
| | $ | 7,966 |
| | $ | 6,507 |
| | $ | 5,056 |
| | $ | 15,298 |
| | $ | 3,075 |
| | $ | 2,563 |
|
| | | | | | | | | | | | | | | | |
| | $ | 117,747 |
| | $ | 98,073 |
| | $ | 100,869 |
| | $ | 73,219 |
| | $ | 71,345 |
| | $ | 61,592 |
| | $ | 55,710 |
| | $ | 49,351 |
|
| | 25,960 |
| | 23,322 |
| | 22,108 |
| | 16,464 |
| | 20,050 |
| | 20,950 |
| | 11,895 |
| | 13,167 |
|
| | $ | 91,787 |
| | $ | 74,751 |
| | $ | 78,761 |
| | $ | 56,755 |
| | $ | 51,295 |
| | $ | 40,642 |
| | $ | 43,815 |
| | $ | 36,184 |
|
| | 4.54 |
| | 4.21 |
| | 4.56 |
| | 4.45 |
| | 3.56 |
| | 2.94 |
| | 4.68 |
| | 3.75 |
|
| | $ | 33,029 |
| | $ | 35,880 |
| | $ | 35,743 |
| | $ | 36,264 |
| | $ | 25,602 |
| | $ | 19,964 |
| | $ | 15,950 |
| | $ | 16,455 |
|
| | 170,309 |
| | 144,415 |
| | 147,861 |
| | 119,764 |
| | 106,157 |
| | 88,509 |
| | 79,508 |
| | 72,816 |
|
| | — |
| | — |
| | — |
| | — |
| | 9 |
| | — |
| | 57 |
| | 151 |
|
| | $ | 133,251 |
| | $ | 113,556 |
| | $ | 118,275 |
| | $ | 98,268 |
| | $ | 84,389 |
| | $ | 66,082 |
| | $ | 66,471 |
| | $ | 58,236 |
|
| | — | % | | — | % | | — | % | | — | % | | — | % | | — | % | | 0.1 | % | | 0.3 | % |
| | 5.3 |
| | 5.2 |
| | 5.3 |
| | 5.4 |
| | 5.9 |
| | 5.8 |
| | 6.1 |
| | 4.8 |
|
| | | | | | | | | | | | | | | | |
| | $ | 47,643 |
| | $ | 39,037 |
| | $ | 27,151 |
| | $ | 26,313 |
| | $ | 21,189 |
| | $ | 18,871 |
| | $ | 19,732 |
| | $ | 12,735 |
|
| | (13,396 | ) | | (7,000 | ) | | (4,433 | ) | | (18,664 | ) | | (11,435 | ) | | (7,631 | ) | | (4,352 | ) | | (9,166 | ) |
| | (9,867 | ) | | (36,969 | ) | | (8,270 | ) | | (10,277 | ) | | (6,946 | ) | | (19,063 | ) | | (6,155 | ) | | (5,830 | ) |
| | 24,417 |
| | (5,005 | ) | | 14,489 |
| | (2,626 | ) | | 2,790 |
| | (7,823 | ) | | 9,225 |
| | (2,261 | ) |
| | | | | | | | | | | | | | | | |
| | 0.79 |
| | $ | 0.86 |
| | $ | 0.77 |
| | $ | 0.71 |
| | $ | 0.67 |
| | $ | 0.50 |
| | $ | 0.39 |
| | $ | 0.31 |
|
| | 0.79 |
| | 0.85 |
| | 0.77 |
| | 0.70 |
| | 0.66 |
| | 0.49 |
| | 0.38 |
| | 0.30 |
|
| | 0.28 |
| | 0.89 |
| | 0.22 |
| | 0.18 |
| | 0.14 |
| | 0.43 |
| | 0.09 |
| | 0.07 |
|
| | 3.69 |
| | 3.15 |
| | 3.26 |
| | 2.73 |
| | 2.34 |
| | 1.84 |
| | 1.84 |
| | 1.61 |
|
| | | | | | | | | | | | | | | | |
| | 16.59 |
| | $ | 23.91 |
| | $ | 22.93 |
| | $ | 21.35 |
| | $ | 16.58 |
| | $ | 13.47 |
| | $ | 7.62 |
| | $ | 4.60 |
|
| | 7.69 |
| | 10.30 |
| | 13.10 |
| | 12.73 |
| | 8.27 |
| | 6.54 |
| | 3.78 |
| | 2.19 |
|
| | 14.29 |
| | $ | 10.91 |
| | $ | 15.01 |
| | $ | 14.22 |
| | $ | 15.80 |
| | $ | 9.19 |
| | $ | 7.06 |
| | $ | 3.96 |
|
| | 36,102 |
| | 36,054 |
| | 36,260 |
| | 36,088 |
| | 36,144 |
| | 35,998 |
| | 36,082 |
| | 36,266 |
|
| | 7,767 |
| | 8,268 |
| | 8,700 |
| | 8,992 |
| | 9,263 |
| | 6,269 |
| | 3,560 |
| | 2,781 |
|
| | | | | | | | | | | | | | | | |
| | 18.1 |
| | 12.8 |
| | 19.6 |
| | 20.5 |
| | 23.9 |
| | 18.9 |
| | 18.8 |
| | 13.2 |
|
| | 930 |
| | 1,070 |
| | 930 |
| | 884 |
| | 845 |
| | 835 |
| | 787 |
| | 784 |
|
| | $ | 256 |
| | $ | 262 |
| | $ | 252 |
| | $ | 246 |
| | $ | 242 |
| | $ | 201 |
| | $ | 181 |
| | $ | 154 |
|
| | $ | 74,718 |
| | $ | 80,361 |
| | $ | 66,628 |
| | $ | 44,237 |
| | $ | 43,619 |
| | $ | 43,646 |
| | $ | 47,120 |
| | $ | 42,826 |
|
| | | | | | | | | | | | | | | | |
| | | | | | | | | | | | | | | | |
| | | | | | | | | | | | | | | | |
| | | | | | | | | | | | | | | | |
| | | | | | | | | | | | | | | | |
| | | | | | | | | | | | | | | | |
|
| | | | | | | | | | | | | | | | | | | | | | | | | | | | | | |
| | | | | | | | | | | | | | | |
| | | | | | | | | | | | | | | |
| 2013 | | 2012 | | 2011 | | 2010 | | 2009 | | 2008 | | 2007 | | 2006 |
| | | | | | | | | | | | | | | |
| $ | 406,175 |
| | $ | 381,511 |
| | $ | 314,708 |
| | $ | 237,782 |
| | $ | 279,913 |
| | $ | 233,957 |
| | $ | 217,529 |
| | $ | 204,528 |
|
| 127,673 |
| | 116,192 |
| | 91,429 |
| | 67,852 |
| | 73,448 |
| | 63,676 |
| | 57,540 |
| | 55,714 |
|
| 77,692 |
| | 75,641 |
| | 60,203 |
| | 43,220 |
| | 46,394 |
| | 41,145 |
| | 38,302 |
| | 37,284 |
|
| 77,646 |
| | 75,698 |
| | 60,282 |
| | 43,322 |
| | 46,901 |
| | 42,224 |
| | 38,835 |
| | 37,494 |
|
| 52,545 |
| | 50,569 |
| | $ | 40,537 |
| | $ | 28,574 |
| | $ | 30,770 |
| | $ | 27,802 |
| | $ | 25,441 |
| | $ | 24,262 |
|
| 12.9 | % | | 13.3 | % | | 12.9 | % | | 12.0 | % | | 11.0 | % | | 11.9 | % | | 11.7 | % | | 11.9 | % |
| 26.2 | % | | 31.4 | % | | 29.5 | % | | 23.2 | % | | 26.6 | % | | 25.7 | % | | 27.9 | % | | 32.3 | % |
| $ | 15,244 |
| | $ | 13,025 |
| | $ | 34,095 |
| | $ | 9,911 |
| | $ | 31,884 |
| | $ | 7,966 |
| | $ | 6,507 |
| | $ | 5,056 |
|
| | | | | | | | | | | | | | | |
| $ | 156,748 |
| | $ | 147,559 |
| | $ | 128,181 |
| | $ | 117,747 |
| | $ | 98,073 |
| | $ | 100,869 |
| | $ | 73,219 |
| | $ | 71,345 |
|
| 33,061 |
| | 40,646 |
| | 34,335 |
| | 25,960 |
| | 23,322 |
| | 22,108 |
| | 16,464 |
| | 20,050 |
|
| $ | 123,687 |
| | $ | 106,913 |
| | $ | 93,846 |
| | $ | 91,787 |
| | $ | 74,751 |
| | $ | 78,761 |
| | $ | 56,755 |
| | $ | 51,295 |
|
| 4.74 |
| | 3.63 |
| | 3.73 |
| | 4.54 |
| | 4.21 |
| | 4.56 |
| | 4.45 |
| | 3.56 |
|
| $ | 81,238 |
| | $ | 61,894 |
| | $ | 41,522 |
| | $ | 33,029 |
| | $ | 35,880 |
| | $ | 35,743 |
| | $ | 36,264 |
| | $ | 25,602 |
|
| 273,210 |
| | 245,703 |
| | 187,760 |
| | 170,309 |
| | 144,415 |
| | 147,861 |
| | 119,764 |
| | 106,157 |
|
| — |
| | — |
| | — |
| | — |
| | — |
| | — |
| | — |
| | 9 |
|
| $ | 221,346 |
| | $ | 180,499 |
| | $ | 141,214 |
| | $ | 133,251 |
| | $ | 113,556 |
| | $ | 118,275 |
| | $ | 98,268 |
| | $ | 84,389 |
|
| — | % | | — | % | | — | % | | — | % | | — | % | | — | % | | — | % | | — | % |
| 5.4 |
| | 5.4 |
| | 5.6 |
| | 5.3 |
| | 5.2 |
| | 5.3 |
| | 5.4 |
| | 5.9 |
|
| | | | | | | | | | | | | | | |
| $ | 76,456 |
| | $ | 43,831 |
| | $ | 42,085 |
| | $ | 47,643 |
| | $ | 39,037 |
| | $ | 27,151 |
| | $ | 26,313 |
| | $ | 21,189 |
|
| (29,930 | ) | | (40,313 | ) | | (11,418 | ) | | (13,396 | ) | | (7,000 | ) | | (4,433 | ) | | (18,664 | ) | | (11,435 | ) |
| (23,007 | ) | | (15,234 | ) | | (33,834 | ) | | (9,867 | ) | | (36,969 | ) | | (8,270 | ) | | (10,277 | ) | | (6,946 | ) |
| 23,511 |
| | (11,721 | ) | | (3,121 | ) | | 24,417 |
| | (5,005 | ) | | 14,489 |
| | (2,626 | ) | | 2,790 |
|
| | | | | | | | | | | | | | | |
| $ | 1.45 |
| | $ | 1.40 |
| | $ | 1.12 |
| | $ | 0.79 |
| | $ | 0.86 |
| | $ | 0.77 |
| | $ | 0.71 |
| | $ | 0.67 |
|
| 1.44 |
| | 1.39 |
| | 1.12 |
| | 0.79 |
| | 0.85 |
| | 0.77 |
| | 0.70 |
| | 0.66 |
|
| 0.42 |
| | 0.36 |
| | 0.95 |
| | 0.28 |
| | 0.89 |
| | 0.22 |
| | 0.18 |
| | 0.14 |
|
| 6.09 |
| | 4.97 |
| | 3.91 |
| | 3.69 |
| | 3.15 |
| | 3.26 |
| | 2.73 |
| | 2.34 |
|
| | | | | | | | | | | | | | | |
| $ | 37.73 |
| | $ | 34.65 |
| | $ | 24.80 |
| | $ | 16.59 |
| | $ | 23.91 |
| | $ | 22.93 |
| | $ | 21.35 |
| | $ | 16.58 |
|
| 23.01 |
| | 21.62 |
| | 13.27 |
| | 7.69 |
| | 10.30 |
| | 13.10 |
| | 12.73 |
| | 8.27 |
|
| $ | 26.93 |
| | $ | 32.45 |
| | $ | 23.62 |
| | $ | 14.29 |
| | $ | 10.91 |
| | $ | 15.01 |
| | $ | 14.22 |
| | $ | 15.80 |
|
| 36,326 |
| | 36,284 |
| | 36,178 |
| | 36,102 |
| | 36,054 |
| | 36,260 |
| | 36,088 |
| | 36,144 |
|
| 10,439 |
| | 10,618 |
| | 7,456 |
| | 7,767 |
| | 8,268 |
| | 8,700 |
| | 8,992 |
| | 9,263 |
|
| | | | | | | | | | | | | | | |
| 18.7 |
| | 23.4 |
| | 21.1 |
| | 18.1 |
| | 12.8 |
| | 19.6 |
| | 20.5 |
| | 23.9 |
|
| 1,350 |
| | 1,252 |
| | 1,036 |
| | 930 |
| | 1,070 |
| | 930 |
| | 884 |
| | 845 |
|
| $ | 301 |
| | $ | 305 |
| | $ | 304 |
| | $ | 256 |
| | $ | 262 |
| | $ | 252 |
| | $ | 246 |
| | $ | 242 |
|
| $ | 51,121 |
| | $ | 66,641 |
| | $ | 75,972 |
| | $ | 74,718 |
| | $ | 80,361 |
| | $ | 66,628 |
| | $ | 44,237 |
| | $ | 43,619 |
|
| | | | | | | | | | | | | | | |
| |
| |
| |
| |
| |
| | | BUSINESS SEGMENTS | | | | | | | | | | | | | | | | | | | | | | | | |
| (Dollars in thousands) | | | | | | | | | | | | | | | | | | | | | | | | |
| | | For the years ended January 31, | | For the years ended January 31, |
| | | 2013 | | 2012 | | 2011 | | 2010 | | 2009 | | 2008 | | 2016 | | 2015 | | 2014 | | 2013 | | 2012 | | 2011 |
| APPLIED TECHNOLOGY DIVISION | APPLIED TECHNOLOGY DIVISION | | | | | | | | | | | | | | | | | | | | | | | |
| Sales | | $ | 171,778 |
| | $ | 145,261 |
| | $ | 107,910 |
| | $ | 94,005 |
| | $ | 111,512 |
| | $ | 80,049 |
| | $ | 92,599 |
| | $ | 142,154 |
| | $ | 170,461 |
| | $ | 171,778 |
| | $ | 145,261 |
| | $ | 107,910 |
|
| Operating income | | 59,590 |
| | 49,750 |
| | 33,197 |
| | 27,538 |
| | 35,034 |
| | 22,701 |
| |
| Assets | | 84,224 |
| | 73,872 |
| | 55,740 |
| | 54,007 |
| | 51,608 |
| | 40,058 |
| |
Operating income(a) | | | 18,319 |
| | 34,557 |
| | 57,000 |
| | 59,590 |
| | 49,750 |
| | 33,197 |
|
Assets(b) | | | 65,490 |
| | 88,764 |
| | 93,395 |
| | 84,224 |
| | 73,872 |
| | 55,740 |
|
| Capital expenditures | | 10,780 |
| | 11,971 |
| | 1,947 |
| | 1,092 |
| | 2,857 |
| | 1,054 |
| | 664 |
| | 3,478 |
| | 9,324 |
| | 10,780 |
| | 11,971 |
| | 1,947 |
|
| Depreciation and amortization | | 3,874 |
| | 2,571 |
| | 2,483 |
| | 1,863 |
| | 1,646 |
| | 1,503 |
| | 4,428 |
| | 5,569 |
| | 4,332 |
| | 3,874 |
| | 2,571 |
| | 2,483 |
|
| ENGINEERED FILMS DIVISION | | | | | | | | | | | | | | | | | | | | | | | | |
| Sales | | $ | 141,976 |
| | $ | 133,481 |
| | $ | 105,838 |
| | $ | 63,783 |
| | $ | 89,858 |
| | $ | 85,316 |
| | $ | 129,465 |
| | $ | 166,634 |
| | $ | 147,620 |
| | $ | 141,976 |
| | $ | 133,481 |
| | $ | 105,838 |
|
Operating income(b)(c) | | 25,115 |
| | 21,501 |
| | 19,622 |
| | 10,232 |
| | 10,919 |
| | 17,739 |
| | 17,892 |
| | 21,802 |
| | 18,154 |
| | 25,115 |
| | 21,501 |
| | 19,622 |
|
| Assets | | 65,801 |
| | 65,100 |
| | 46,519 |
| | 35,999 |
| | 35,862 |
| | 43,688 |
| |
Assets(b) | | | 134,942 |
| | 140,023 |
| | 71,602 |
| | 65,801 |
| | 65,100 |
| | 46,519 |
|
| Capital expenditures | | 11,539 |
| | 10,937 |
| | 8,450 |
| | 1,460 |
| | 3,120 |
| | 4,012 |
| | 10,780 |
| | 8,241 |
| | 6,681 |
| | 11,539 |
| | 10,937 |
| | 8,450 |
|
| Depreciation and amortization | | 5,814 |
| | 4,313 |
| | 3,452 |
| | 3,707 |
| | 4,303 |
| | 4,046 |
| | 7,735 |
| | 6,096 |
| | 5,808 |
| | 5,814 |
| | 4,313 |
| | 3,452 |
|
| AEROSTAR DIVISION | | | | | | | | | | | | | | | | | | | | | | | | |
| Sales | | $ | 102,051 |
| | $ | 107,811 |
| | $ | 104,384 |
| | $ | 81,617 |
| | $ | 78,783 |
| | $ | 69,248 |
| | $ | 36,368 |
| | $ | 80,772 |
| | $ | 90,605 |
| | $ | 102,051 |
| | $ | 107,811 |
| | $ | 104,384 |
|
| Operating income | | 10,341 |
| | 18,308 |
| | 17,209 |
| | 12,849 |
| | 8,924 |
| | 8,256 |
| |
| Assets | | 60,689 |
| | 72,089 |
| | 38,366 |
| | 28,665 |
| | 32,777 |
| | 32,670 |
| |
Operating income(d) | | | (8,100 | ) | | 8,983 |
| | 7,816 |
| | 10,341 |
| | 18,308 |
| | 17,209 |
|
Assets(b) | | | 40,156 |
| | 59,274 |
| | 63,017 |
| | 60,689 |
| | 72,089 |
| | 38,366 |
|
| Capital expenditures | | 2,081 |
| | 4,105 |
| | 2,621 |
| | 471 |
| | 1,599 |
| | 1,187 |
| | 941 |
| | 2,799 |
| | 7,507 |
| | 2,081 |
| | 4,105 |
| | 2,621 |
|
| Depreciation and amortization | | 2,272 |
| | 1,684 |
| | 1,335 |
| | 1,151 |
| | 1,340 |
| | 1,358 |
| | 3,770 |
| | 3,474 |
| | 2,616 |
| | 2,272 |
| | 1,684 |
| | 1,335 |
|
| INTERSEGMENT ELIMINATIONS | | | | | | | | | | | | | | | | | | | | | | | | |
| Sales | | | | | | | | | | | | | | | | | | | | | | | | |
| Applied Technology Division | | $ | (974 | ) | | $ | (460 | ) | | $ | (226 | ) | | $ | (31 | ) | | $ | (5 | ) | | $ | (107 | ) | | $ | (8 | ) | | $ | (231 | ) | | $ | (386 | ) | | $ | (974 | ) | | $ | (460 | ) | | $ | (226 | ) |
| Engineered Films Division | | (124 | ) | | (193 | ) | | (307 | ) | | (210 | ) | | (210 | ) | | (533 | ) | | (195 | ) | | (652 | ) | | (505 | ) | | (124 | ) | | (193 | ) | | (307 | ) |
| Aerostar Division | | (8,532 | ) | | (4,389 | ) | | (2,891 | ) | | (1,382 | ) | | (25 | ) | | (16 | ) | | — |
| | (10,524 | ) | | (13,118 | ) | | (8,532 | ) | | (4,389 | ) | | (2,891 | ) |
| Operating income | | (61 | ) | | (188 | ) | | (41 | ) | | 8 |
| | 19 |
| | (84 | ) | | 91 |
| | 163 |
| | (111 | ) | | (61 | ) | | (188 | ) | | (41 | ) |
| Assets | | (347 | ) | | (286 | ) | | (98 | ) | | (57 | ) | | (65 | ) | | (84 | ) | | (57 | ) | | (148 | ) | | (311 | ) | | (347 | ) | | (286 | ) | | (98 | ) |
CORPORATE & OTHER(a) | | | | | | | | | | | | | | | | | | | | | | | | |
| Operating (loss) from administrative expenses | | $ | (17,293 | ) | | $ | (13,730 | ) | | $ | (9,784 | ) | | $ | (7,407 | ) | | $ | (8,502 | ) | | $ | (7,467 | ) | | $ | (17,110 | ) | | $ | (21,704 | ) | | $ | (18,865 | ) | | $ | (17,293 | ) | | $ | (13,730 | ) | | $ | (9,784 | ) |
| Assets | | 62,843 |
| | 34,928 |
| | 47,233 |
| | 51,695 |
| | 24,233 |
| | 31,529 |
| |
Assets(b)(e) | | | 66,079 |
| | 74,960 |
| | 74,116 |
| | 62,843 |
| | 34,928 |
| | 47,233 |
|
| Capital expenditures | | 5,275 |
| | 2,002 |
| | 954 |
| | 279 |
| | 425 |
| | 382 |
| | 661 |
| | 2,523 |
| | 7,189 |
| | 5,275 |
| | 2,002 |
| | 954 |
|
| Depreciation and amortization | | 1,138 |
| | 700 |
| | 361 |
| | 387 |
| | 469 |
| | 437 |
| | 1,676 |
| | 2,230 |
| | 1,439 |
| | 1,138 |
| | 700 |
| | 361 |
|
| TOTAL COMPANY | | | | | | | | | | | | | | | | | | | | | | | | |
| Sales | | $ | 406,175 |
| | $ | 381,511 |
| | $ | 314,708 |
| | $ | 237,782 |
| | $ | 279,913 |
| | $ | 233,957 |
| | $ | 258,229 |
| | $ | 378,153 |
| | $ | 394,677 |
| | $ | 406,175 |
| | $ | 381,511 |
| | $ | 314,708 |
|
Operating income (b)(d) | | 77,692 |
| | 75,641 |
| | 60,203 |
| | 43,220 |
| | 46,394 |
| | 41,145 |
| | 11,092 |
| | 43,801 |
| | 63,994 |
| | 77,692 |
| | 75,641 |
| | 60,203 |
|
| Assets | | 273,210 |
| | 245,703 |
| | 187,760 |
| | 170,309 |
| | 144,415 |
| | 147,861 |
| | 306,610 |
| | 362,873 |
| | 301,819 |
| | 273,210 |
| | 245,703 |
| | 187,760 |
|
| Capital expenditures | | 29,675 |
| | 29,015 |
| | 13,972 |
| | 3,302 |
| | 8,001 |
| | 6,635 |
| | 13,046 |
| | 17,041 |
| | 30,701 |
| | 29,675 |
| | 29,015 |
| | 13,972 |
|
| Depreciation and amortization | | 13,098 |
| | 9,268 |
| | 7,631 |
| | 7,108 |
| | 7,758 |
| | 7,344 |
| | 17,609 |
| | 17,369 |
| | 14,195 |
| | 13,098 |
| | 9,268 |
| | 7,631 |
|
| | | | | | | | | | | | | | |
(a) Assets are principally cash, investments, deferred taxes and other receivables. | | | | | | | |
(b) The year ended January 31, 2011 includes a $451 pre-tax gain on disposition of assets. | | | | | | | |
(a) The year ended January 31, 2016 includes gains of $611 on disposal of assets related to the exit of contract manufacturing operations. | | (a) The year ended January 31, 2016 includes gains of $611 on disposal of assets related to the exit of contract manufacturing operations. |
(b) Certain facilities owned by the Company are shared by more than one reporting segment. Beginning with fiscal year 2016 all facilities are reported as an asset based on the business segment that acquired the asset as we believe this better reflects the total assets of the business segment. In prior fiscal years (which have not been recast in this table), the book value of certain shared facilities was allocated across reporting segments based on usage. Expenses and costs related to these facilities, including depreciation expense, are allocated and reported in each reporting segment's operating income for each fiscal year presented. | | (b) Certain facilities owned by the Company are shared by more than one reporting segment. Beginning with fiscal year 2016 all facilities are reported as an asset based on the business segment that acquired the asset as we believe this better reflects the total assets of the business segment. In prior fiscal years (which have not been recast in this table), the book value of certain shared facilities was allocated across reporting segments based on usage. Expenses and costs related to these facilities, including depreciation expense, are allocated and reported in each reporting segment's operating income for each fiscal year presented. |
(c) The fiscal year ended January 31, 2011 includes a $451 pre-tax gain on disposition of assets. | | (c) The fiscal year ended January 31, 2011 includes a $451 pre-tax gain on disposition of assets. |
(d) The fiscal year ended January 31, 2016 includes pre-contract cost write-offs of $2,933, a goodwill impairment loss of $7,413, and a reduction of $1,483 acquisition-related contingent liability for Vista. | | (d) The fiscal year ended January 31, 2016 includes pre-contract cost write-offs of $2,933, a goodwill impairment loss of $7,413, and a reduction of $1,483 acquisition-related contingent liability for Vista. |
(e) Assets are principally cash, investments, deferred taxes, and other receivables. | | (e) Assets are principally cash, investments, deferred taxes, and other receivables. |
|
| |
| ITEM 7. | MANAGEMENT’S DISCUSSION AND ANALYSIS OF FINANCIAL CONDITION AND RESULTS OF OPERATIONS |
The Management's Discussion and Analysis of Financial Condition and Results of Operations (MD&A) is designed to enhance overall financial disclosure with commentary on the operating results, liquidity, capital resources, and financial condition of Raven Industries, Inc. (the Company or Raven). This commentary provides management's analysis of the primary drivers of year-over-year changes in key financial statement elements, business segment results, and the impact of accounting principles on the Company's financial statements. The most significant risks and uncertainties impacting the operating performance and financial condition of the Company are discussed in Item 1A., Risk Factors, of this Annual Report on Form 10-K.10-K (Form 10-K).
This discussion should be read in conjunction with Raven's Consolidated Financial Statements and notes thereto in Item 8 of this Form 10-K.
The MD&A is organized as follows:
Executive Summary
Results of Operations - Segment Analysis
Outlook
Liquidity and Capital Resources
Off-balanceOff-Balance Sheet Arrangements and Contractual Obligations
Critical Accounting Estimates
Accounting Pronouncements
EXECUTIVE SUMMARY
Raven is a diversified technology company providing a variety of products to customers within the industrial, agricultural, energy, construction, defense/aerospace, and military/aerospacesituational awareness markets. The Company is comprised of three unique operating units, or divisions, that are also itsclassified into reportable segments: Applied Technology Division, Engineered Films Division, and Aerostar Division. While each segment has distinct characteristics,As strategic actions, such as the products and technologies are largely extensions of durable competitive advantages rooted in the original research balloon business.
Effective June 1, 2012, the Company realigned the assets and team memberswind-down of its Electronic Systems Division and deployed them intocontract manufacturing business, have changed the Company's Aerostar and Applied Technology Divisions. The realigned divisions will better alignCompany’s business over the Company's corporate structure with its mission and long-term growth strategies. Electronic Systems net sales of electronic manufacturing assemblies were realignedlast several years, Raven has remained committed to Aerostar and the remaining proprietary products, after adjustments to intersegment eliminations, to Applied Technology. The Company retrospectively adjusted its segment information for all periods presented to reflect this change in segment reporting. These adjustments are reflected in the following discussion of segment results for comparison to prior year results.providing high-quality, high-value products.
Management uses a number of metricsmeasures to assess the Company's performance:
Consolidated net sales, gross margins,margin, operating income, operating margins, net income, and earnings per share
Cash flow from operations and shareholder returns
Return on sales, average assets, and average equity
Segment net sales, gross profit, gross margins,margin, operating income, and operating margins
Raven's growth strategy focuses on its proprietary product lines and the Company made the decision in fiscal year 2015 to largely wind-down its non-strategic contract manufacturing business. To assess the effectiveness of this strategy during the transition period, management has used two additional measures:
Consolidated net sales excluding contract manufacturing sales (adjusted sales)
Segment net sales excluding contract manufacturing sales (adjusted sales)
Information reported as net sales excluding contract manufacturing sales on both a consolidated and segment basis exclude sales generated from contract manufacturing activities and do not conform to generally accepted accounting principles (GAAP). As such, these are non-GAAP measures.
As described in the Notes to the Financial Statements of this Annual Report on Form 10-K, three significant one-time charges were recorded in the Aerostar Division in the fiscal 2016 third quarter. To allow evaluation of operating income and net income for the Company’s core business, the Company used three additional measures. The additional measurements are:
Segment operating income excluding Vista charges (adjusted operating income)
Consolidated operating income excluding Vista charges (consolidated adjusted operating income)
Net income excluding Vista charges (adjusted net income)
Information reported as adjusted operating income and adjusted net income excluding Vista charges, on both a consolidated and segment basis, do not conform to GAAP and are non-GAAP measures.
Non-GAAP measures should not be construed as an alternative to the reported results determined in accordance with GAAP. Management has included this non-GAAP information to assist in understanding the operating performance of the Company and its operating segments as well as the comparability of results. This non-GAAP information provided may not be consistent with the methodologies used by other companies. All non-GAAP information is reconciled with reported GAAP results in the tables that follow.
Vision and Strategy
At Raven, thereour purpose is a singular purpose behind everything we do. It is: to solve great challenges. Great challenges require great solutions. Solutions driven by quality, service, innovationRaven’s three unique divisions share resources, ideas, and peak performance set Raven apart in the development ofa passion to create technology that helps the world grow more food, produce more energy, protect the environment, and live safely.
The Raven business model is our platform for success. Our business model is defensible, sustainable, and gives us a consistent approach in the pursuit of quality financial results. This overall approach to creating value, which is employed across the three unique business segments, is summarized as follows:
ServeIntentionally serve a set of diversified market segments with attractive near- and long-term growth prospects;
Consistently manage a pipeline of growth initiatives within our market segments;
Aggressively compete on quality, service, innovation, and peak performance;
Hold ourselves accountable for continuous improvement;
Value our balance sheet as a source of strength and stability;stability with which to pursue strategic acquisitions; and
Make corporate responsibility a top priority.
This diversified business model enables us |
| | | | | | | | | | | | | | | | | | |
| | | For the years ended January 31, |
| dollars in thousands, except per-share data | | 2016 | | % change | | 2015 | | % change | | 2014 |
| Results of Operations | | | | | | | | | | |
| Net sales | | $ | 258,229 |
| | (31.7 | )% | | $ | 378,153 |
| | (4.2 | )% | | $ | 394,677 |
|
Gross margin(a) | | 25.5 | % | | | | 27.3 | % | | | | 30.2 | % |
| Operating income | | $ | 11,092 |
| | (74.7 | )% | | $ | 43,801 |
| | (31.6 | )% | | $ | 63,994 |
|
Operating margin(a) | | 4.3 | % | | | | 11.6 | % | | | | 16.2 | % |
| Net income attributable to Raven Industries, Inc. | | $ | 8,489 |
| | (73.2 | )% | | $ | 31,733 |
| | (26.0 | )% | | $ | 42,903 |
|
| Diluted income per share | | $ | 0.23 |
| | (73.3 | )% | | $ | 0.86 |
| | (26.5 | )% | | $ | 1.17 |
|
| | | | | | | | | | | |
Consolidated net sales, excluding contract manufacturing sales(b) | | $ | 252,982 |
| | (28.0 | )% | | $ | 351,205 |
| | 1.8 | % | | $ | 344,919 |
|
| | | | | | | | | | | |
Adjusted net income attributable to Raven Industries, Inc.(b) | | $ | 14,853 |
| | (53.2 | )% | | $ | 31,733 |
| | (26.0 | )% | | $ | 42,903 |
|
| | | | | | | | | | | |
| Cash Flow and Shareholder Returns | | | | | | | | | | |
| Cash flow from operating activities | | $ | 44,008 |
| | | | $ | 60,083 |
| | | | $ | 52,836 |
|
| Cash outflow for capital expenditures | | $ | 13,046 |
| | | | $ | 17,041 |
| | | | $ | 30,701 |
|
| Cash dividends | | $ | 19,426 |
| | | | $ | 18,519 |
| | | | $ | 17,465 |
|
| Common share repurchases | | $ | 29,338 |
| | | | $ | — |
| | | | $ | — |
|
| | | | | | | | | | | |
| Performance Measures | | | | | | | | | | |
Return on net sales(c) | | 3.3 | % | | | | 8.4 | % | | | | 10.9 | % |
Return on average assets(d) | | 2.5 | % | | | | 9.5 | % | | | | 14.9 | % |
Return on average equity(e) | | 3.0 | % | | | | 11.4 | % | | | | 18.2 | % |
| |
(a) The Company's gross and operating margins may not be comparable to industry peers due to variability in the classification of expenses across industries in which the Company operates. |
(b) Non-GAAP measure reconciled to GAAP in the applicable table below. |
(c) Net income divided by sales. |
(d) Net income divided by average assets. |
(e) Net income divided by average equity. |
The following table reconciles the reported net sales to weather near-term challenges, while continuing to growadjusted sales, a non-GAAP financial measure. Adjusted sales excludes contract manufacturing and build for our future. It is our culture and it is woven into how we do business.represents the Company's sales from proprietary products. |
| | | | | | | | | | | | | | | | | | |
| | | For the years ended January 31, |
| | | | | % change | | | | % change | | |
| dollars in thousands | | 2016 | | | 2015 | | | 2014 |
| Applied Technology | | | | | | | | | | |
| Reported net sales | | $ | 92,599 |
| | (34.9 | )% | | $ | 142,154 |
| | (16.6 | )% | | $ | 170,461 |
|
| Less: Contract manufacturing sales | | 546 |
| | (90.6 | )% | | 5,832 |
| | (48.5 | )% | | 11,324 |
|
Applied Technology net sales, excluding contract manufacturing sales | | $ | 92,053 |
| | (32.5 | )% | | $ | 136,322 |
| | (14.3 | )% | | $ | 159,137 |
|
| | | | | | | | | | | |
| Aerostar | | | | | | | | | | |
| Reported net sales | | $ | 36,368 |
| | (55.0 | )% | | $ | 80,772 |
| | (10.9 | )% | | $ | 90,605 |
|
| Less: Contract manufacturing sales | | 4,701 |
| | (85.2 | )% | | 31,669 |
| | (38.3 | )% | | 51,311 |
|
Aerostar net sales, excluding contract manufacturing sales | | $ | 31,667 |
| | (35.5 | )% | | $ | 49,103 |
| | 25.0 | % | | $ | 39,294 |
|
| | | | | | | | | | | |
| Consolidated Raven | | | | | | | | | | |
| Reported net sales | | $ | 258,229 |
| | (31.7 | )% | | $ | 378,153 |
| | (4.2 | )% | | $ | 394,677 |
|
| Less: Contract manufacturing sales | | 5,247 |
| | (86.0 | )% | | 37,501 |
| | (40.1 | )% | | 62,635 |
|
| Plus: Aerostar sales to Applied Technology | | — |
| | (100.0 | )% | | 10,553 |
| | (18.0 | )% | | 12,877 |
|
Consolidated net sales, excluding contract manufacturing sales | | $ | 252,982 |
| | (28.0 | )% | | $ | 351,205 |
| | 1.8 | % | | $ | 344,919 |
|
The following discussion highlightstable reconciles the reported operating (loss) income to adjusted operating income, a non-GAAP financial measure. On both a segment and consolidated basis, adjusted operating results. Segment operating results are more fully explainedincome excludes the goodwill impairment loss and associated financial impacts (pre-contract cost write-off and an acquisition-related contingent consideration benefit) all of which relate to the Vista Research, Inc. business within the Aerostar Division and all of which occurred in the Results of Operations - Segment Analysis section.fiscal 2016 third quarter.
|
| | | | | | | | | | | | | | | | | | |
| | | For the years ended January 31, |
| dollars in thousands, except per-share data | | 2013 | | % change | | 2012 | | % change | | 2011 |
| Results of Operations | | | | | | | | | | |
| Net sales | | $ | 406,175 |
| | 6 | % | | $ | 381,511 |
| | 21 | % | | $ | 314,708 |
|
Gross margins (a) | | 31.4 | % | | | | 30.5 | % | | | | 29.1 | % |
| Operating income | | $ | 77,692 |
| | 3 | % | | $ | 75,641 |
| | 26 | % | | $ | 60,203 |
|
Operating margins (a) | | 19.1 | % | | | | 19.8 | % | | | | 19.1 | % |
| Net income attributable to Raven Industries, Inc. | | $ | 52,545 |
| | 4 | % | | $ | 50,569 |
| | 25 | % | | $ | 40,537 |
|
Diluted income per share (b) | | $ | 1.44 |
| | 4 | % | | $ | 1.39 |
| | 24 | % | | $ | 1.12 |
|
| | | | | | | | | | | |
| Cash Flow and Payments to Shareholders | | | | | | | | | | |
| Cash flow from operating activities | | $ | 76,456 |
| | | | $ | 43,831 |
| | | | $ | 42,085 |
|
| Cash outflow for capital expenditures | | $ | 29,675 |
| | | | $ | 29,015 |
| | | | $ | 13,972 |
|
| Cash dividends | | $ | 15,244 |
| | | | $ | 13,025 |
| | | | $ | 34,095 |
|
| | | | | | | | | | | |
| Performance Measures | | | | | | | | | | |
Return on net sales (c) | | 12.9 | % | | | | 13.3 | % | | | | 12.9 | % |
Return on average assets (d) | | 20.3 | % | | | | 23.3 | % | | | | 22.6 | % |
Return on beginning equity (e) | | 29.1 | % | | | | 35.8 | % | | | | 30.4 | % |
| | | | | | | | | | | |
(a) The Company's gross and operating margins may not be comparable to industry peers due to variability in the classification of expenses |
| across industries in which the Company operates. |
(b) Diluted income per share reflects a two-for-one stock split effective July 25, 2012. |
(c) Net income divided by sales. |
(d) Net income divided by average assets. |
(e) Net income divided by beginning equity. |
|
| | | | | | | | | | | | | | | | | | |
| | | For the years ended January 31, |
| | | | | % change | | | | % change | | |
| (dollars in thousands) | | 2016 | | | 2015 | | | 2014 |
| Aerostar | | | | | | | | | | |
| Reported operating (loss) income | | $ | (8,100 | ) | | (190.2 | )% | | $ | 8,983 |
| | 14.9 | % | | $ | 7,816 |
|
| Plus: | | | | | | | | | | |
| Goodwill impairment loss | | 7,413 |
| | — |
| | — |
| | — |
| | — |
|
| Pre-contract costs written off | | 2,933 |
| | — |
| | — |
| | — |
| | — |
|
| Less: | | | | | | | | | | |
| Acquisition-related contingent liability benefit | | 1,483 |
| | — |
| | — |
| | — |
| | — |
|
| Aerostar adjusted operating income | | $ | 763 |
| | (91.5 | )% | | $ | 8,983 |
| | 14.9 | % | | $ | 7,816 |
|
| Aerostar adjusted operating income % of net sales | | 2.1 | % | | | | 11.1 | % | | | | 8.6 | % |
| | | | | | | | | | | |
| Consolidated Raven | | | | | | | | | | |
| Reported operating income | | $ | 11,092 |
| | (74.7 | )% | | $ | 43,801 |
| | (31.6 | )% | | $ | 63,994 |
|
| Plus: | | | | | | | | | | |
| Goodwill impairment loss | | 7,413 |
| | — |
| | — |
| | — |
| | — |
|
| Pre-contract costs written off | | 2,933 |
| | — |
| | — |
| | — |
| | — |
|
| Less: | | | | | | | | | | |
| Acquisition-related contingent liability benefit | | 1,483 |
| | — |
| | — |
| | — |
| | — |
|
| Consolidated adjusted operating income | | $ | 19,955 |
| | (54.4 | )% | | $ | 43,801 |
| | (31.6 | )% | | $ | 63,994 |
|
Consolidated adjusted operating income % of net sales
| | 7.7 | % | | | | 11.6 | % | | | | 16.2 | % |
The following table reconciles the reported net (loss) income to adjusted net income, a non-GAAP financial measure. On a consolidated basis adjusted net income excludes the goodwill impairment loss and associated financial impacts (pre-contract cost write-off and an acquisition-related contingent consideration benefit) all of which relate to the Vista Research, Inc. business within the Aerostar Division and all of which occurred in the fiscal 2016 third quarter.
|
| | | | | | | | | | | | | | | | | | |
| | | For the years ended January 31, |
| | | | | % change | | | | % change | | |
| (dollars in thousands) | | 2016 | | | 2015 | | | 2014 |
| Consolidated Raven | | | | | | | | | | |
| Reported net income attributable to Raven Industries, Inc. | | $ | 8,489 |
| | (73.2 | )% | | $ | 31,733 |
| | (26.0 | )% | | $ | 42,903 |
|
| Plus: | | | | | | | | | | |
| Goodwill impairment loss | | 7,413 |
| | | | — |
| | | | — |
|
| Pre-contract costs written off | | 2,933 |
| | | | — |
| | | | — |
|
| | | | | | | | | | | |
| Less: | | | | | | | | | | |
| Acquisition-related contingent liability benefit | | 1,483 |
| | | | — |
| | | | — |
|
| Net tax benefit on adjustments | | 2,499 |
| | | | — |
| | | | — |
|
Adjusted net income attributable to Raven Industries, Inc. | | $ | 14,853 |
| | (53.2 | )% | | $ | 31,733 |
| | (26.0 | )% | | $ | 42,903 |
|
| | | | | | | | | | | |
| Adjusted net income per common share: | | | | | | | | | | |
| ─ Basic | | $ | 0.40 |
| | (53.5 | )% | | $ | 0.86 |
| | (27.1 | )% | | $ | 1.18 |
|
| ─ Diluted | | $ | 0.40 |
| | (53.5 | )% | | $ | 0.86 |
| | (26.5 | )% | | $ | 1.17 |
|
Results of Operations - Fiscal 20132016 compared to Fiscal 20122015
The Company again posted record sales, operating income, net income and diluted earnings per share for fiscal 2013. These record levels resulted in large part from continued higher demand for Applied Technology's products as well as increased demand in Engineered Films' geomembrane and agriculture markets. With additional support from the demand for pit liners in the energy market through the first half of fiscal 2013, Engineered Films' net sales increased 6% as compared to fiscal 2012. Strong original equipment manufacturer (OEM) demand, international growth and new product sales fueled an 18% increase in net sales for Applied Technology in fiscal 2013 as compared to fiscal 2012. Aerostar's net sales decreased 5% resulting from a lack of tethered aerostat deliveries; however, in spite of this decrease, the Company's net sales increased 6% comparedin fiscal 2016 were $258.2 million, a decrease of $120.0 million, or 31.7%, from last year's net sales of $378.2 million. Excluding sales from contract manufacturing, fiscal year 2016 net sales were $253.0 million, down 28.0 % from $351.2 million infiscal year 2015. All divisions saw significant sales declines and continue to the prior fiscal year.experience reduced end-market demand in their primary markets of focus. Adverse commodity market conditions are driving reduced demand for both Applied Technology and Engineered Films, while reductions and delays in governmental defense spending are reducing demand for Aerostar, and Vista in particular.
Fiscal 2013Operating income for fiscal year 2016 was $11.1 million compared to $43.8 million in fiscal year 2015. Operating income for fiscal year 2016, adjusted for the third quarter Vista goodwill impairment and associated financial impacts, was $20.0 million compared to $43.8 million in fiscal year 2015, down 54.4% year-over-year. The adjusted operating income increased 3% from fiscal 2012decline year-over-year was primarily due to the overall sales growth partially offsetdecline and lower operating margins in Applied Technology and lower Aerostar profitability driven by higher investmentVista. The Company initiated cost reduction measures in fiscal 2016 to reduce overall spending. These cost control measures contributed to decreases of $2.8 million in research and development (R&D), spending and $9.4 million in selling, general and administrative expenses.expenses in fiscal year 2016 compared to fiscal 2015. The cost controls and restructuring savings were not enough to offset lower sales volumes in Applied Technology increasedand Aerostar.
Net income for fiscal year 2016 was $8.5 million, or $0.23 per diluted share, compared to net income of $31.7 million, or $0.86 per diluted share, in fiscal year 2015. Net income for fiscal year 2016, adjusted for the Vista goodwill impairment and associated financial impacts, was $14.9 million, down 53.2% compared to fiscal year 2015.
Engineered Films Division
Engineered Films’ fiscal 2016 net sales were $129.5 million, a decrease of $37.2 million, or 22.3%, compared to fiscal 2015. The decline in sales was primarily driven by the continuation of the substantial decline in energy market demand as a result of lower oil prices year-over-year, and lower sales into the geomembrane market, partially offset by the benefit to sales due to the acquisition of Integra Plastics, Inc. (Integra) in November 2015. The Company does not specifically model comparative market share position for any of its operating incomedivisions, but based on customer feedback and evaluation of publicly-available financial information on competitors, we do not believe that revenue trends have been the result of a material loss of market share.
The acquisition of Integra improved the Company’s ability to meet customer’s complex conversion needs and leverage a more direct sales channel into the energy market. However, significant and sustained declines in energy market demand have instead resulted in declining sales to this market. With oil prices at multi-decade lows, sales into the energy market are down approximately 80% year-over-year. Rig counts and well-completion rates continue to fall, driving down demand for Engineered Films’ energy market products. Data available from Baker Hughes, a worldwide oil field service company, shows that land-based rig counts for the Permian Basin, the division’s primary market for its energy products are down approximately 60% year-over-year as of January
31, 2016 and well-completion rates are also down. The operations of Integra were fully integrated into Engineered Films’ operations in early fiscal 2016 and, as a result, separate quantification of its impact to net sales is not determinable.
Applied Technology Division
Fiscal 2016 net sales decreased $49.6 million, or 34.9%, to $92.6 million from $142.2 million in fiscal 2015. This decline in sales was driven by 20% duea significant contraction in end-market demand. The Company believes that its market share in the United States has been largely sustained, but that international market share has declined, particularly in Latin America. Year-over-year sales to higher salesoriginal equipment manufacturer (OEM) and associated operating leverage. Engineered Films'aftermarket customers declined by 42.1% and 23.8%, respectively.
Applied Technology's operating income growth of 17% reflects higher sales and increased operating efficiencies and favorable price versus material cost spread seen in the first half of this fiscal year. Aerostar posted a decline of 44% from the prior year operating incomedecreased by 47.0% due primarily to lower sales.sales volumes. End-market demand conditions seemed to stabilize beginning in the fiscal 2016 third quarter, and the velocity of sequential sales declines have eased from the levels earlier in the year. The price of corn has declined to 8-year lows which has led to significant declines in farmer incomes. Such macro-level market conditions impact both grower sentiment and the manufacturing decisions of our strategic OEM partners. Although OEMs initiated longer than usual planned plant shutdowns during the year due to these economic conditions, the Company’s persistent stream of new agricultural technology continue to make Raven an attractive technology partner for OEMs serving agriculture. The Company’s new product introductions, if successful, can help to partially offset some of the end-market demand weakness.
Aerostar Division
Fiscal 2016 net sales were $36.4 million compared to $80.8 million in fiscal 2015, down $44.4 million. Excluding contract manufacturing sales, Aerostar's net sales decreased 35.5%, or $17.4 million, to $31.7 million for fiscal 2016. The decline in sales for the division was principally driven by Vista, but lower sales of stratospheric balloons also contributed to the decline.
Aerostar reported an operating loss of $8.1 million in fiscal 2016 compared to operating income of $9.0 million in fiscal 2015. The operating loss included a goodwill impairment charge of $7.4 million, pre-contract cost write-off of $2.9 million, and a $1.5 million acquisition-related contingent consideration benefit reported in the Company's fiscal 2016 third quarter. Excluding these items, adjusted Aerostar operating income was $0.8 million, or 91.5% below fiscal 2015 operating income of $9.0 million. This was primarily due to the lower sales volume of proprietary products, particularly within the Vista business. Aerostar’s adjusted operating income of $0.8 million excludes the effect of the goodwill impairment loss, pre-contract cost write-off, and the acquisition-related contingent consideration benefit.
From time to time, the Company incurs costs before a contract is finalized and such pre-contract costs are deferred to the balance sheet to the extent they relate to a specific project and the Company has concluded that is probable that the contract will be awarded for more than the amount deferred. Pre-contract cost deferrals are common with Vista's business pursuits. As described in Note 1 Summary of Significant Accounting Policies of the Notes to the Consolidated Financial Statements of this Form 10-K, pre-contract costs are evaluated for recoverability periodically. The Company was in negotiations throughout most of fiscal 2016 on a large international contract and also had a preauthorization letter from the prime contractor, but the contract did not materialize in the fiscal 2016 third quarter as expected. As a result, expectations were lowered as the timing and likelihood of completing certain international pursuits became less certain. Corresponding to these lower expectations, the pre-contract costs associated with these pursuits were written off and Vista recorded a charge of $2.9 million reported in “Cost of sales” in the Consolidated Statements of Income and Comprehensive Income. These charges were partially offset by a benefit of $1.5 million as the result of a reduction of an acquisition-related contingent liability (earn-out liability) due to the lowered forecast for the Aerostar Division.
Results of Operations - Fiscal 20122015 compared to Fiscal 20112014
Fiscal 2012The Company's net sales rose 21%in fiscal 2015 were $378.2 million, a decrease of $16.5 million, or 4.2%, from fiscal year 2014 net sales of $394.7 million. Engineered Films' fiscal 2015 net sales were up 12.9% over fiscal 2014, primarily driven by the agricultural and construction markets and the acquisition of Integra. Applied Technology's net sales declined reflecting persistent weakness in the precision agriculture markets, both domestic and international, and the planned decline of contract manufacturing sales to $381.5 millionnon-strategic legacy customers. Aerostar's net sales decrease was due primarily to a shift away from Aerostar's contract manufacturing business. Increased sales of proprietary products, such as lighter-than-air products, aerostat products, and diluted earnings per shareVista radar system sales partially offset these expected decreases. Excluding contract manufacturing sales, Aerostar's net sales were up 25.0% year-over-year.
Fiscal 2015 operating income decreased 31.6% from fiscal 2014 due primarily to the overall sales decline, lower gross profit margin in Applied Technology, and higher corporate general and administrative expense. Applied Technology's operating income decreased by 39.4% due to lower sales volumes as well as strategic investment in pursuing international market growth, new product development, and broadening OEM relationships. Engineered Films' operating income increased 24% to $1.39 per share20.0% as a result of overall selling price increases, higher sales growth in allof more profitable value-added films, continued operating segments: Applied Technology (35%), Engineered Films (26%)improvements, and leveraging
the Company's reclaim production line. Aerostar (3%). These levels resulted in large partposted an increase of 14.9% from higher demand for Applied Technology's productsthe prior year operating income due to a strong agriculture market and international expansion. In addition, high crude oil prices resulted in increased drilling, which drove growthlower level of pit liner sales in the energy market for Engineered Films. Aerostar also posted sales increases primarily duecontract manufacturing revenue relative to higher T-11 parachute and spare parts deliveries. Fiscal 2012 operating income increased 26% from fiscal 2011 primarily due to these increases in net sales and improved margins in Applied Technology.less operating expenses.
Cash Flow and Payments to Shareholders
The Company continues to generate strongstable operating cash flows and maintain amaintains strong capital baseliquidity as reflected in the $49.4$33.8 million cash and short-term investments balance as of January 31, 2013. 2016.
Capital expenditures totaled $29.7$13.0 million in fiscal 20132016 compared to $29.0$17.0 million in fiscal 2012.2015. Capital spending consisted primarily of expenditures related to increasedexpand Engineered Films' manufacturing capacity and a reclaim facility in Engineered Films, Applied Technology and Aerostar's investments in future growth, including product development, facilities and equipment along with renovation of the Company's downtown Sioux Falls corporate headquarters.capacity.
During fiscal 2013, $15.22016, $19.4 million was returned to shareholders though quarterly dividends. In the first quarter of fiscal 2013, theFiscal 2016 quarterly dividend was raised from 9dividends were 13 cents per share to 10.5 cents per share, representing the 26th consecutive annual increase in the dividend (excluding special dividends). During fiscal 2012, $13.0 million was returnedeach quarter. Dividends paid to shareholders through quarterly dividends.in fiscal 2015 totaled $18.5 million.
In fiscal 2016 the Company paid $29.3 million for share repurchases made pursuant to the $40.0 million share repurchase plan authorized by the Company’s Board of Directors in fiscal 2015. No shares were repurchased during fiscal 2015.
Performance Measures
The Company continues to generate strong returnsReturns on net sales, average assets and beginningaverage equity which are important gauges of Raven's abilitysuccess in efficiently producing profits. The Company’s fiscal 2016 returns were not at the level of the prior two years’ results due to efficiently produce profits. Raven generated a 12.9% return onthe declining sales levels and the three significant one-time charges recorded in the Aerostar Division in the fiscal 2013 as2016 third quarter reported in the tables above. The Company continues to capitalize onmake strategic investments in research and development for product development to retain a competitive advantagesadvantage in niche markets.
RESULTS OF OPERATIONS - SEGMENT ANALYSIS
Applied Technology
Applied Technology designs, manufactures, sells, and services innovative precision agriculture products and information management tools that help growers reduce costs, precisely control inputs, and improve farm yields aroundfor the world.global agriculture market.
| | Financial highlights for the fiscal years ended January 31, | | dollars in thousands | | 2013 | | % change | | 2012 | | % change | | 2011 | | 2016 | | % change | | 2015 | | % change | | 2014 |
| Net sales | | $ | 171,778 |
| | 18 | % | | $ | 145,261 |
| | 35 | % | | $ | 107,910 |
| | $ | 92,599 |
| | (34.9 | )% | | $ | 142,154 |
| | (16.6 | )% | | $ | 170,461 |
|
| Gross profit | | 80,853 |
| | 21 | % | | 66,913 |
| | 41 | % | | 47,455 |
| | 33,969 |
| | (41.8 | )% | | 58,325 |
| | (26.6 | )% | | 79,499 |
|
| Gross margins | | 47.1 | % | | | | 46.1 | % | | | | 44.0 | % | |
| Gross margin | | | 36.7 | % | | | | 41.0 | % | | | | 46.6 | % |
| Operating expense | | $ | 21,263 |
|
| 24 | % | | $ | 17,163 |
| | 20 | % | | $ | 14,258 |
| | $ | 15,650 |
|
| (34.2 | )% | | $ | 23,768 |
| | 5.6 | % | | $ | 22,499 |
|
| Operating expense as % of sales | | 12.4 | % | | | | 11.8 | % | | | | 13.2 | % | | 16.9 | % | | | | 16.7 | % | | | | 13.2 | % |
| Operating income | | $ | 59,590 |
| | 20 | % | | $ | 49,750 |
| | 50 | % | | $ | 33,197 |
| | $ | 18,319 |
| | (47.0 | )% | | $ | 34,557 |
| | (39.4 | )% | | $ | 57,000 |
|
| Operating margins | | 34.7 | % | | | | 34.2 | % | | | | 30.8 | % | |
| Operating margin | | | 19.8 | % | | | | 24.3 | % | | | | 33.4 | % |
Applied Technology net sales, excluding contract manufacturing sales | | | $ | 92,053 |
| | (32.5 | )% | | $ | 136,322 |
| | (14.3 | )% | | $ | 159,137 |
|
NetFor fiscal 2016, net sales increased $26.5decreased $49.6 million,, or 18%34.9%, to $171.8$92.6 million and operating as compared to $142.2 million in fiscal 2015. Operating income of $59.6decreased $16.2 million, was up $9.8 or 47.0%, to $18.3 million, or 20%, for fiscal 2013 as compared to fiscal 2012.2015.
Fiscal 20132016 fourth quarter net sales grew $5.9declined $8.0 million,, or 18%30.3%, to $38.4$18.4 million and operating income of $12.3decreased $1.2 million, rose $3.5 or 34.7%, to $2.2 million, or 40%, compared to fourth quarter fiscal 2012.2015.
A number of factors contributed to the strong full-year and fourth quarterfourth-quarter comparative results:
Market conditions. Global market fundamentals were healthy as population and income growth in emerging economies have increased demand for food. The drought domestically has created some uncertaintyDeterioratingconditions in the marketplace,agriculture market put pressure on Applied Technology during fiscal 2016. End-market demand has deteriorated from the beginning of the year and the Company believes these conditions will continue into next fiscal year. Corn prices have stabilized since the beginning of the year but overall, this has been substantially offset by higher commodity prices. The Company continues to cultivateare still at multi-year lows. Farm incomes and deepenfarmer sentiment are weak, resulting in productivity investments in precision agriculture equipment being delayed.
relationships with keySales volume. Fiscal 2016 sales declined 34.9% to $92.6 million as compared to $142.2 million in the prior fiscal year. These sales declines were driven by continued lower demand, OEM partners, which expands market shareshutdowns, and extends Raven's technology to a broader range of customers.customers managing down inventory levels. Sales in the OEM and aftermarket channels were down 42.1% and 23.8%, respectively, for fiscal 2016. Fiscal 2016 domestic sales were down 37.6% while international sales were down 25.2%.
Strategic Sales volume and new products. The favorable. Applied Technology’s net sales, comparisonsexcluding contract manufacturing sales, for the fourth quarter and fiscal 2013 results reflect strong sales growth across the majority2016 were $92.1 million, a decrease of the division's product offerings, including application controls, guidance and steering products, boom controls and injection products. Introduction of new products32.5%, compared to the market, a staple in Applied Technology's continued growth, generated sales of about $21$136.3 million in fiscal 2013.2015.
International sales. Net sales outside the U.S. accounted for 25%25.1% of segment sales in fiscal 20132016 compared to 23% for21.9% in fiscal 2012.2015. International sales increased $9.0decreased $7.9 million, or 27%25.2%, to $42.4$23.3 million in fiscal 20132016 compared to fiscal 2012. Products delivered to2015. Lower sales in Latin America, Canada, South America, Eastern Europe and South Africa generatedwere the majorityprimary drivers of this growth.the decline. These declines were partially offset by higher European revenues. European revenues were favorably impacted by the acquisition of SBG in fiscal 2015 second quarter. For the fourth quarter, international sales totaled $7.5$4.6 million, an increase of 55%45.6% from the prior year three-month period.comparative quarter. The fiscal fourth quarter 2015 sales were reduced by credits issued related to quality issues on products sold in Latin America and without these credits, the year-over-year fourth quarter increase would have been approximately 19%.
Gross margins.margin. Gross margins improvedmargin declined from 46.1%41.0% in fiscal 20122015 to 47.1%36.7% in fiscal 2013 due2016. Lower sales volumes and a reduced leverage of fixed manufacturing costs contributed to higher sales volumethe lower margin.
Restructuring expenses. Fiscal 2016 results included severance and operating leverage.other related exit activity totaling $0.6 million. These costs were offset by completion of the St. Louis contract manufacturing exit activities which resulted in gains of $0.6 million recorded in the fiscal 2016 results. There were no impairments recorded as a result of the exit of this business. No restructuring or exit costs were incurred in the three-month period ended January 31, 2016. Restructuring costs of $0.3 million were incurred for the three-month period ended January 31, 2015.
Operating expenses. Fiscal 20132016 operating expenses were 12.4%16.9% of net sales compared to 11.8%16.7% for the prior year. The increase is attributableRestructuring efforts and cost containment actions reduced both selling expense and research and development (R&D) expense as planned, but were not enough to Applied Technology's commitment to spending on product development to drive OEM demand and continued expansion into domestic and international markets.offset the lower sales volumes.
For fiscal 2012,2015, net sales increased $37.4decreased $28.3 million,, or 35%16.6%, to $145.3$142.2 million and operating income was up $16.6 million, or 50%, to $49.8 million compared to fiscal 2011.
Several factors contributed to the strong comparative results for fiscal 2012 as compared to fiscal 2011:
Market conditions. Global market fundamentals were healthy as population and income growth in emerging economies increased demand for food, while natural disasters and adverse weather conditions restricted supplies. These factors resulted in higher crop prices and wider acceptance of precision agriculture as a sound investment for maximizing yields and controlling input costs.
Sales volume and selling prices. The increase in net sales was driven by higher sales volume, as selling prices reflected only a modest increase year-over-year. The favorable year-over-year comparisons reflected strong sales growth across the majority of the division's product offerings, including application controls (i.e. control systems, flow meters, valves), field computers, guidance and steering products and boom controls.
International sales. Net sales outside the U.S. accounted for 23% of segment sales in fiscal 2012 compared to 20% for fiscal 2011. International sales of $33.4$170.5 million in fiscal 2012 increased $11.82014. Operating income decreased $22.4 million, or 55%, year-over-year as improved farm fundamentals drove strong overall demand in Brazil, and to a lesser extent, Eastern Europe, Canada, South Africa and Australia. New customers also contributed to the international sales growth, reflecting the segment's investment to expand its geographical presence.
Gross margins. Gross margins improved to 46.1% in fiscal 2012 from 44.0% in fiscal 2011 due to higher sales volume and operating leverage.
Operating expenses. Operating expenses were 11.8% of net sales in fiscal 2012 compared to 13.2% for the prior year. Although spending for R&D and business development efforts increased expenses $2.9 million compared to the prior year, such spending declined as a percentage of net sales, due to the significant growth in net sales.
Engineered Films
Engineered Films manufactures high performance plastic films and sheeting for industrial, energy, construction, geomembrane and agricultural applications.
|
| | | | | | | | | | | | | | | | | | | |
| Financial highlights for the fiscal years ended January 31, | |
| dollars in thousands | | 2013 | | % change | | 2012 | | % change | | 2011 | |
| Net sales | | $ | 141,976 |
| | 6 | % | | $ | 133,481 |
| | 26 | % | | $ | 105,838 |
| |
| Gross profit | | 30,726 |
| | 18 | % | | 26,090 |
| | 15 | % | | 22,708 |
| |
| Gross margins | | 21.6 | % | | | | 19.5 | % | | | | 21.5 | % | |
| Operating expenses | | $ | 5,611 |
| | 22 | % | | $ | 4,589 |
| | 30 | % | | $ | 3,537 |
| |
| Operating expenses as % of sales | | 4.0 | % | | | | 3.4 | % | | | | 3.3 | % | |
| Operating income | | $ | 25,115 |
| | 17 | % | | $ | 21,501 |
| | 10 | % | | $ | 19,622 |
| (a) |
| Operating margins | | 17.7 | % | | | | 16.1 | % | | | | 18.5 | % | |
(a) Includes a $451 pre-tax gain on the disposition of assets. | |
Net sales increased $8.5 million, or 6%39.4%, to $142.0$34.6 million while operating income was up $3.6 million, or 17%, to $25.1 million for fiscal 2013 compared to fiscal 2012.
These year-over-year changes were driven primarily by the following factors:
Market conditions. Economic growth in emerging markets continues to support high oil prices, though declining oil prices beginning in the second half of fiscal 2013 have decreased demand for pit liners in our energy market. Environmental and water conservation projects have increased demand for the division's containment liners in the geomembrane market.
| |
• | Sales volume and selling prices. Sales growth for fiscal 2013 was predominately driven by the increased sales into the geomembrane and agriculture markets. Geomembrane market sales have increased $6.3 million, or 43% year-over-year, and included the completion of a significant geomembrane reservoir project in Ohio in the first half of fiscal 2013. Sales of VaporSafe® fumigation film and FeedFresh™ silage covers accounted for the most of the $4.8 million year-over-year increase in the agriculture market. Energy market demand has softened but sales in this market held at solid levels for fiscal 2013. Overall, selling prices increased 3-5% during fiscal 2013 and sales volume, as measured by pounds shipped, was up 3% year-over-year.
|
Gross margins. Fiscal 2013 gross margins increased two percentage points, as compared to the prior year, due to improved operating efficiencies, positive operating leverage and favorable price versus material spread seen$57.0 million in the first half of the year. Material cost as a percentage of sales was 62% for the year ended January 31, 2013 compared with 65% for the prior year.
| |
• | Operating expenses. Fiscal 2013 operating expenses as a percentage of net sales increased to 4.0%, compared to 3.4% in the prior year. The increase was attributable to higher R&D spending as the division continues to expand its product development efforts, such as its recently announced Vapor Block® Spec 3 Showcase, a select-under-concrete-slab barrier film series.
|
Fiscal 2013 fourth quarter net sales declined $5.2 million, or 14%, to $30.8 million and operating income of $4.4 million was $2.1 million, or 33%, lower than the prior year fourth quarter.
Several factors contributed to the weaker fourth quarter comparative results:
Sales volume and selling price. Fourth quarter fiscal 2013 sales declined from the prior year fourth quarter due to lower volume. Sales volume, as measured by pounds shipped, was down 15%, with the largest decline in the energy market.
Gross margin. Gross margins decreased in the fourth quarter of fiscal 2013 to 18.2% compared to 22.1% in the prior year fourth quarter. The decrease in the margin was due to lower sales and unfavorable material cost spread.
For fiscal 2012, net sales increased $27.6 million, or 26%, to $133.5 million while operating income was up $1.9 million, or 10%, to $21.5 million compared to fiscal 2011.2014.
Fiscal 20122015 results were primarily driven by the following factors:
Market conditions. Economic growthSoftness in emergingthe agriculture market put pressure on Applied Technology throughout fiscal 2015. Falling corn prices, historically high corn inventories, cyclically high input costs, and waning grower sentiment subdued demand. Contraction of end-market demand was even more pronounced than expected as several OEMs reduced production levels.
Sales volume and new products. Persistent demand headwinds in the agriculture equipment markets continued in the second half of the year. Lower end-market demand drove sales lower in most of Applied Technology's product lines. Fiscal 2015 sales declined 16.6% to support$142.2 million as compared to $170.5 million in the prior year. The sales decline reflected both lower international sales and weakness in the North American precision agriculture equipment market, in particular with OEM sales. Aftermarket conditions were slightly better throughout the year.
International sales. Net sales outside the U.S. accounted for 21.9% of segment sales in fiscal 2015 compared to 24.5% in fiscal 2014. International sales decreased $10.5 million, or 25.3%, to $31.1 million in fiscal 2015 compared to fiscal 2014. Lower sales in Brazil and Canada were the main drivers of the decline, partially offset by increased sales in South Africa and $3.2 million of European revenues from the acquisition of SBG in May 2014.
Gross margin. Gross margin declined from 46.6% in fiscal 2014 to 41.0% in fiscal 2015. Lower net sales, lower production levels, and higher warranty expense contributed to the lower gross margin.
Operating expenses. Fiscal 2015 operating expenses were 16.7% of net sales compared to 13.2% for the prior year. This increase is attributable to higher spending in R&D, to preserve future growth opportunities, on lower sales volumes.
Engineered Films
Engineered Films manufactures high performance plastic films and sheeting for energy, agricultural, construction, geomembrane, and industrial applications.
The Company acquired Integra in November 2014. This acquisition expanded Engineered Films’ production capacity, broadened its product offerings, and enhanced converting capabilities. Adding Integra's fabrication and conversion skill sets with Raven's ability to develop value-added innovative products resulted in enhanced customer service and expanded the converting capabilities of the division.
|
| | | | | | | | | | | | | | | | | | | |
| Financial highlights for the fiscal years ended January 31, | |
| dollars in thousands | | 2016 | | % change | | 2015 | | % change | | 2014 | |
| Net sales | | $ | 129,465 |
| | (22.3 | )% | | $ | 166,634 |
| | 12.9 | % | | $ | 147,620 |
| |
| Gross profit | | 25,076 |
| | (10.8 | )% | | 28,104 |
| | 19.1 | % | | 23,592 |
| |
| Gross margin | | 19.4 | % | | | | 16.9 | % | | | | 16.0 | % | |
| Operating expenses | | $ | 7,184 |
| | 14.0 | % | | $ | 6,302 |
| | 15.9 | % | | $ | 5,438 |
| |
| Operating expenses as % of sales | | 5.5 | % | | | | 3.8 | % | | | | 3.7 | % | |
| Operating income | | $ | 17,892 |
| | (17.9 | )% | | $ | 21,802 |
| | 20.1 | % | | $ | 18,154 |
| |
| Operating margin | | 13.8 | % | | | | 13.1 | % | | | | 12.3 | % | |
For fiscal 2016, net sales decreased $37.2 million, or 22.3%, to $129.5 million as compared to fiscal 2015. Operating income was down to $17.9 million, or 17.9%, for fiscal 2016 as compared to $21.8 million for fiscal 2015.
For fiscal 2016 fourth quarter net sales decreased $15.4 million, or 37.8%, to $25.5 million as compared to $40.9 million in the fiscal 2015 fourth quarter. Operating income was down $2.7 million, or 58.8%, to $1.9 million as compared to $4.6 million in the prior year fourth quarter.
A number of factors contributed to the full-year and fourth-quarter comparative results:
Market conditions. Challenging end-market conditions have persisted in the energy market for Engineered Films. The decline in oil prices resulted in land-based rig counts decreasing more than 60% year-over-year and declining well-completion rates. While the decline in turn, increased drilling activity andoil prices has reduced demand for pit linerssales of film into the energy market, it has also led to favorable raw material cost comparisons versus the prior year. While the energy market has experienced challenging end-market conditions, demand has continued to strengthen for both Engineered Films' agricultural barrier films used in high-value crop production and grain and silage covers used to protect grain and feed.
Sales volume and selling prices. Fiscal 2016 net sales were down 22.3% to $129.5 million compared to fiscal 2015 net sales of $166.6 million. The decline in sales was driven primarily by an 80% decline in energy market sales. These declines were partially offset by the acquisition of Integra. Sales volume for fiscal 2016 was down 27.5%. Average selling prices for the same period were up approximately 7% compared to the prior fiscal year primarily due to product mix. Fourth quarter fiscal 2016 sales volumes were down approximately 38% compared to fourth quarter fiscal 2015. Fourth quarter average selling prices remained flat year-over-year.
Gross margin. Fiscal 2016 gross margin was 19.4%, 2.5 percentage points higher than the prior fiscal year. This increase was the result of gross margin expansion from value engineering, reformulation efforts, pricing discipline, and favorable raw material cost comparisons. During fiscal 2016 fourth quarter, the gross margin was 15.0% compared to 16.2% in the prior year fourth quarter. The decline was due to significantly lower volumes and the resulting decline in fixed cost absorption.
Operating expenses. Fiscal 2016 operating expenses, as a percentage of net sales, increased to 5.5%, from 3.8% in the prior year. Higher selling expenses resulting from the Integra acquisition, additional R&D costs for new product development activities and higher bad debt expense over lower sales volumes increased operating expense as a percentage of sales.
For fiscal 2015, net sales increased $19.0 million, or 12.9%, to $166.6 million while operating income was up $3.6 million, or 20.1%, to $21.8 million compared to fiscal 2014.
Fiscal 2015 results were primarily driven by the following factors:
Market conditions. Declines in oil prices tempered demand for films in the energy market but favorably impacted raw material costs for the division. Strength in the construction market and efforts to increase market share created opportunities to meet shifting market conditions and offset competitive pressures in the energy market.
Sales volume and selling prices. Fiscal 2015 net sales were up 12.9% to $166.6 million compared to fiscal 2014 net sales of $147.6 million. Net sales of construction film and barrier films for specific high-value agriculture applications were the primary drivers of these increases in fiscal 2015. Sales growthvolume and selling prices for fiscal 2012 was predominately driven by the increased demand for pit liners utilized in oil2015 were up approximately 5% and gas exploration activity. Environmental and water conservation projects increased the demand for geomembrane containment liners and covers during fiscal 2012. New product sales of FeedFresh™ and fumigation films contributed7%, respectively, compared to the year-over-year sales increase in the agriculture market. Selling prices increased approximately 10% during fiscal 2012, reflecting higher material costs as compared with fiscal 2011. Sales volume, as measured by pounds shipped, was up 12% year-over-year.prior-year period.
Gross margins.margin. Full-yearFiscal 2015 gross margins declined two percentage points, despitewere 16.9%, continuing the 26% sales growth. The lowertrend of higher gross margin was attributable tomargins than fiscal 2014. These margins reflected the impact of higher resin costs that were not fully offset by increasedaverage selling prices, inhigher sales of more profitable value-added films, and continued operating improvements and leveraging the first nine months of the fiscal 2012.Company's reclaim production line.
Operating expenses. Fiscal 20122015 operating expenses, as a percentage of net sales, increased slightly to 3.4%3.8%, compared to 3.3%3.7% in the prior year, excluding a $0.5 million gain on disposition of assets. The increase inyear. Higher selling expense of $0.4 million (13%) laggedexpenses drove the 26% increase in sales; however, a year-over-year increase in R&D spending of $0.7 million contributed to the slight increase in operating expenses as a percentage of sales. Higher R&D spending resulted from expanding product development efforts.increase.
Aerostar
Aerostar serves the defense/aerospace and situational awareness markets. The Division also provided contract manufacturing services in the past, but largely exited this business in fiscal 2016. Aerostar designs and manufactures surveillance technology, electronic and specialty-sewn and sealedproprietary products including stratospheric balloons, tethered aerostats, high-altitude scientific balloons and airships, protective wear, parachutes, military decoysradar processing systems for aerospace and marine navigation equipment. Aerostar also provides electronics manufacturing services (EMS) forsituational awareness markets. These products can be integrated with additional third-party sensors to provide research, communications, and situational awareness capabilities to governmental and commercial customers with a focus on high-
mix, low-volume production. Assemblies manufactured by the Aerostar segment include avionics, communication, environmental controls and other products where high quality is critical.customers.
Through Vista and a separate business venture that is majority-owned by the Company, Aerostar acquiredpursues potential product and support services contracts for agencies and instrumentalities of the U.S. and foreign governments. Vista Research, Inc. (Vista) atpositions the end of fiscal 2012. Vista's smart-sensing radar systems (SSRS) use sophisticated signal processing algorithms and are employed in a host ofCompany to meet global demand for lower-cost target detection and tracking applications, including wide-area surveillance for border patrol and the military.systems used by government agencies.
| | Financial highlights for the fiscal years ended January 31, | | dollars in thousands | | 2013 | | % change | | 2012 | | % change | | 2011 | | 2016 | | % change | | 2015 | | % change | | 2014 |
| Net sales | | $ | 102,051 |
| | (5 | )% | | $ | 107,811 |
| | 3 | % | | $ | 104,384 |
| | $ | 36,368 |
| | (55.0 | )% | | $ | 80,772 |
| | (10.9 | )% | | $ | 90,605 |
|
| Gross profit | | 16,155 |
| | (31 | )% | | 23,378 |
| | 10 | % | | 21,307 |
| | 6,649 |
| | (60.1 | )% | | 16,654 |
| | 1.7 | % | | 16,374 |
|
| Gross margins | | 15.8 | % | | | | 21.7 | % | | | | 20.4 | % | |
| Gross margin | | | 18.3 | % | | | | 20.6 | % | | | | 18.1 | % |
| Operating expenses | | $ | 5,814 |
| | 15 | % | | $ | 5,070 |
| | 24 | % | | $ | 4,098 |
| | $ | 7,336 |
| | (4.4 | %) | | $ | 7,671 |
| | (10.4 | )% | | $ | 8,558 |
|
| Operating expenses as % of sales | | 5.7 | % | | | | 4.7 | % | | | | 3.9 | % | | 20.2 | % | | | | 9.5 | % | | | | 9.4 | % |
| Operating income | | $ | 10,341 |
| | (44 | )% | | $ | 18,308 |
| | 6 | % | | $ | 17,209 |
| |
| Operating margins | | 10.1 | % | | | | 17.0 | % | | | | 16.5 | % | |
| Goodwill impairment loss | | | $ | 7,413 |
| | | | — |
| | | | — |
|
| Goodwill impairment loss as % of sales | | | 20.4 | % | | | | — |
| | | | — |
|
| Operating (loss) income | | | $ | (8,100 | ) | | (190.2 | )% | | 8,983 |
| | 14.9 | % | | 7,816 |
|
| Operating margin | | | (22.3 | )% | | | | 11.1 | % | | | | 8.6 | % |
Aerostar net sales, excluding contract manufacturing sales | | | $ | 31,667 |
| | (35.5 | )% | | $ | 49,103 |
| | 25.0 | % | | $ | 39,294 |
|
Net sales were unabledeclined 55.0% to reach$36.4 million from last year's resultsyear’s net sales of $107.8$80.8 million. Operating loss was $8.1 million,, declining 5% to $102.1 down $17.1 million,. Operating income of $10.3 million was down $8.0 million, or 44%, compared to fiscal 2012.2015 operating income of $9.0 million. Fiscal 2016 operating loss includes a goodwill impairment loss of $7.4 million and associated financial impacts ($2.9 million pre-contract cost write-off and a $1.5 million acquisition-related contingent consideration benefit) all of which relate to Vista.
For theFiscal 2016 fourth quarter net sales fell $6.5declined $15.6 million, or 63.3%, to $23.2$9.0 million. Aerostar reported a fiscal 2016 fourth quarter operating loss of $0.2 million from $29.7 compared to an operating income of $4.3 million in the comparative period of 2012. Operating income declined $2.6 million to $2.8 million compared to fiscal 2012prior year fourth quarter.
Fiscal 2013 and fourth quarter2016 comparative results were primarily attributable todriven by the following:following factors:
Market conditions. Throughout fiscal 2013, Aerostar faced continued uncertaintyAerostar’s growth strategy emphasizes proprietary products and sluggish demand.its focus is on proprietary technology including stratospheric balloons, advanced radar systems, and sales of aerostats in international markets. Certain of this segment'sAerostar's markets are subject to significant variability due to federalgovernment spending. ChangesUncertain demand in EMS revenues, however, were primarily duethese markets continues in fiscal 2016 as defense spending is down. Aerostar continues to expected decreasespursue substantial targeted international opportunities but the conflicts plaguing the Middle East North Africa region make these opportunities and their timing less certain. Aerostar is pioneering new markets with leading-edge applications of its high-altitude balloons in avionics sales.collaboration with Google on Project Loon. Project Loon is a program to provide high-speed wireless Internet accessibility and telecommunications to rural, remote, and under-served areas of the world.
Sales volumes. NetFiscal 2016 net sales decreased $44.4 million from the prior year, a year-over-year decrease of 55.0%. The decline was the result of both lower sales of proprietary products, particularly Vista radar sales, and the planned reduction in contract manufacturing sales.
Proprietary net sales. For fiscal 2016, net sales for proprietary products were $31.7 million, down $17.4 million, or 35.5%, from the prior fiscal 2013 reflect a full yearyear. Sales of Vista sales, $14.4 million comparedproprietary products were down primarily due to $0.6 millionVista’s lack of success in fiscal 2012,winning certain international contracts and increased intercompany sourcing to Applied Technology, which added $4.1 million. These positives were not enough to offset a decreasedeclines in tethered aerostat deliveries and electronics manufacturing sales for the year. Vista's fourth quarter net sales of $4.8 million helped moderate a $4.8 million decline in relatively high-margin aerostat sales, as well as lower electronics manufacturinggovernment defense spending that greatly reduced revenues for the three-month period. Vista.
Gross margins. Gmargin.ross margins declined For fiscal 2016, gross margin decreased 2.3 percentage points compared to the prior fiscal year. Fiscal 2016 gross margin reflects net charges of $1.4 million which are discussed further below. Vista has been pursuing international opportunities and throughout the first half of fiscal 2016 was in the process of negotiating a large international
contract for which it also had a pre-authorization letter from 21.7%the prime contractor. When the contract did not materialize in the fiscal 2016 third quarter as expected, expectations were lowered as the timing and likelihood of completing certain international pursuits became less certain. Corresponding to these lower expectations, the pre-contract costs associated with these pursuits were written off during the fiscal 2016 third quarter. Vista recorded a charge of $2.9 million for the write-off of these pre-contract costs. Partially offsetting this impairment charge, Vista recorded a benefit of $1.5 million to reflect a reduction in acquisition-related contingent liabilities due to lower expected payouts.
Goodwill impairment loss. Aerostar recorded a goodwill impairment loss of $7.4 million for fiscal 2016. The goodwill impairment charge was recorded on the Vista reporting unit. This impairment loss is described more fully in Note 6 Goodwill and Other Intangibles of the Notes to the Consolidated Financial Statements and in Critical Accounting Estimates in Item 7 of this Annual Report on Form 10-K. No impairment losses were recorded in fiscal 2012 to 15.8% for fiscal 2013. The change in product mix negatively impacted gross margins for both the fiscal year and quarter ended January 31, 2013 as last year's margins were favorably impacted by higher-margin aerostat sales. Aerostat sales accounted for roughly 17% of net sales in fiscal 2012 compared to approximately 2% in fiscal 2013.2015.
Operating expenses. OperatingFiscal 2016 operating expenses of $5.8$7.3 million were 20.2% of net sales compared to $7.7 million, or 5.7%9.5% of net sales increased $0.7 million from $5.1 million or 4.7% of sales. Higher operating expenses primarily reflect increased investment in fiscal 2015. The increase is due to continued strategic R&D to support next generation aerostatspending on radar and Vista radar technology.stratospheric technologies over lower sales.
Aerostar adjusted operating income. Excluding the unusual items discussed above, the fiscal 2016 operating income was $0.8 million, down from $9.0 million in the prior year. These operating income declines were driven primarily by the significant declines in sales volumes for the year for both contract manufacturing and proprietary products, in particular Vista.
For fiscal 2012,2015, net sales increased $3.4decreased $9.8 million,, or 3%10.9%, to $107.8$80.8 million and operating compared to fiscal 2014. Operating income grew $1.1increased $1.2 million,, or 6%14.9%, to $18.3$9.0 million as compared to fiscal 2011.2014.
Fiscal 20122015 results were driven by the following:
Market conditions. Certain of Aerostar’s markets are subject to variability due to government spending. Aerostar’s growth strategy emphasizes proprietary products over contract manufacturing. Focus is on proprietary technology opportunities, including advanced radar systems, high-altitude balloons, and sales of aerostats to international markets. Aerostar is pioneering new markets with leading-edge applications of its high-altitude balloons in collaboration with Google on Project Loon, a program to provide high-speed wireless Internet accessibility and telecommunications to rural, remote and under-served areas of the world.
Sales volumes. Fiscal 20122015 net sales increased $3.4decreased $9.8 million from the prior year, primarily due to higher T-11 parachutea year-over-year decrease of 10.9%. The drivers of this decline were lower sales of parachutes and spare parts deliveries, additional protective wearplanned declines in avionics sales and additional intercompany sourcing assembly to the Applied Technology Division,other contract manufacturing sales. These decreases were partially offset by higher Vista revenues for support activities under existing contracts and increased aerostat product and service revenues associated with a decrease in tethered aerostat deliveries.
Volatility in aerostat deliveries. The Company continued to see volatility in the delivery of aerostats which impact comparative results. Aerostat sales in fiscal 2012 were $7.3 million in the first quarter; $3.7 million in the second quarter; $1.6 million in the third quarter and $5.1 million in the fourth quarter.government contract.
Gross margin improvement.margin. Gross margin increased from 18.1% in fiscal 2014 to 20.6% for fiscal 2015. Despite the lower sales levels, gross profit margins improvedcontinued to 21.7%increase in fiscal 2015. This improvement in gross margin was favorably impacted by additional proprietary product revenues, including Vista radar sales that normally carry higher margins than other products, as well as efficiencies achieved on last-run contract manufacturing business.
Operating expenses. Fiscal 2015 operating expenses of $7.7 million were 9.5% of net sales compared to 20.4% in the prior year. Gross margin expansion on T-11 parachutes resulted from manufacturing efficiencies and higher sales volume but was partially offset by a change in product mix. Aerostat sales, which carry a relatively higher margin, accounted for approximately 16%$8.6 million, or 9.4% of net sales in fiscal 2012 compared to 21%2014. Operating spending was constrained beginning in the second quarter, driving lower spending levels in fiscal 2011.
Operating expenses. Operating expenses of $5.1 million, or 4.7% of sales, increased $1.0 million from $4.1 million, or 3.9% of sales, primarily as a result of higher investment in research and development to support next generation aerostat technology and the development of lighter but stronger materials, along with higher selling and business development expense to expand the tethered aerostat business.2015.
Corporate Expenses (administrative expenses; other income (expense), net; and income taxes)
| | | | | For the years ended January 31, | | For the years ended January 31, |
| dollars in thousands | | 2013 | | 2012 | | 2011 | | 2016 | | 2015 | | 2014 |
| Administrative expenses | | $ | 17,293 |
| | $ | 13,730 |
| | $ | 9,784 |
| | $ | 17,110 |
| | $ | 21,704 |
| | $ | 18,865 |
|
| Administrative expenses as a % of sales | | 4.3 | % | | 3.6 | % | | 3.1 | % | | 6.6 | % | | 5.7 | % | | 4.8 | % |
| Other income (expense), net | | $ | (46 | ) | | $ | 57 |
| | $ | 79 |
| |
| Other (expense) income, net | | | $ | (310 | ) | | $ | (300 | ) | | $ | (371 | ) |
| Effective tax rate | | 32.3 | % | | 33.1 | % | | 32.8 | % | | 20.6 | % | | 26.9 | % | | 32.6 | % |
Administrative expenses increased 26%decreased $4.6 million in fiscal 20132016 compared with fiscal 2012. Investments2015. Fiscal 2016 expenses reflect the Company's cost control measures put in additional legal, finance, human resourcesplace starting in the fiscal 2016 second quarter to manage expenses relative to anticipated lower sales levels as well as reductions in management incentive and information technology personnelperformance-based restricted stock unit expense based upon the fiscal 2016 results. These incentive compensation plans are based on certain financial results and reflect the decline in fiscal 2016 financial performance as compared to support currentfiscal 2015. Fiscal 2015 expenses include acquisition and future growth strategies through a strengthened corporate infrastructure accounted forintegration costs associated with the majority of the increased spending.SBG and Integra acquisitions.
Other income (expense), net consists mainlyprimarily of activity related to the Company's equity investment, interest income, and foreign currency transaction gains or losses.
The Company's fiscal 20132016 effective tax rate of 32.3% was lower thandecreased to 20.6% compared to 26.9% in the fiscal 2012prior year. The decrease in the effective tax rate of 33.1%is partially due to additionalthe R&D credits available andtax credit legislation passed by Congress enacting this credit into law retroactively.
The goodwill impairment loss recorded also had a higher deductionsignificant impact on decreasing the effective tax rate due to its impact on the calculation of the tax benefit for manufacturingqualified production activities. The Company recognized an increased tax benefit for qualified production activities. While pre-tax income is lower in the U.S.current year, this benefit is based on estimated taxable income. Taxable income is higher in comparison to pre-tax income for the year ended January 31, 2016 due to the goodwill impairment loss recorded. This impairment, described further in Note 6 Goodwill and Other Intangibles of the Notes to the Consolidated Financial Statements in this Form 10-K, does not reduce taxable income; rather, goodwill is amortized over 15 years for tax purposes.
OUTLOOK
At Raven we solve great challenges. It's thisour enduring success is built on our ability to balance the Company’s purpose that keeps us groundedand core values with necessary shifts in business strategy demanded by an ever-changing world. As the Company begins fiscal year 2017, the markets and opportunities that have meaning, align withserved by our values and provide profitable growth. core businesses remain very challenging.
For the first quarter, we continue to see positive trends in Applied Technology, thoughthe precision agriculture market is expected to decline for the third straight year. Momentum is building within the division but the Company believes conditions are not likely to improve significantly for the foreseeable future. OEM interest in our new product portfolio is strong and we face a challenging year-over-year comparison. Aerostar will again be impacted by a lack of aerostat orders. And within Engineered Films, we anticipate a challenging environment and another tough year-over-year comparison. Therefore, we do not expect to grow earningsare seeing promising developments in the first quarterinternational markets we serve, particularly in Europe and Latin America. While the division will continue its focus on reducing expenses, management has proactively made the decision not to execute additional restructuring measures. The Company is preserving its technical capabilities to capitalize on opportunities in anticipation of fiscal 2014.
One of the hallmarks of Raven's business model is the ongoing investment in its business development pipeline. Looking ahead to fiscal 2014, the quality of this pipeline is very robustexpected market share gains and encouraging. This strength ensures the Company's competitiveness and gives us confidence in our outlook for earnings growth for the year.
Despite expected lower earnings in the first quarter of fiscal 2014, management expects to return to historic earnings growth levels in fiscal 2014 by leveraging the investments made over the last few years and through disciplined execution of the Raven business model. By building and nurturing its business development pipeline in fiscal 2014, management expects to see:
Earnings growth from new products in fiscal 2017.
For Engineered Films, the prolonged, dramatic decline in oil prices continues to negatively impact rig counts and oil well completion rates. Although the energy market will be even more challenging this next fiscal year, we are intently focused on driving growth in our other markets by capitalizing on our new production capabilities. Sales to these other markets, in aggregate, are growing, but the division continues to face sales development challenges due to the depressed energy market. Cost reduction efforts are ongoing to partially offset the impact of declines in volume. A recently completed new production line providing new product developmentscapabilities is expected to contribute to sales in fiscal 2017.
For Aerostar, lower expectations continue with the timing and likelihood of completing certain international pursuits uncertain and the curtailment of government defense spending likely to continue. Aerostar continues to develop new opportunities and make progress on key strategic programs relating to both stratospheric balloon and radar opportunities. Management continues to see growth opportunity for existing marketsthe Vista business and key adjacentwill continue pursuit of international opportunities on a more measured basis. This approach will likely push-out the development of sizable Vista business pursuits over a period of time. Management is focused on managing expenses as the year’s challenges persist.
The Company believes a number of strong opportunities are in front of us to drive market expansions;share gains in fiscal year 2017. The Company is cautiously optimistic that the sequential year-over-year sales comparisons will continue to improve and expects to maintain flat sales and adjusted operating income in fiscal 2017, with potential to achieve very modest growth in each.
Potential acquisitions that support the Company's overall product and growth strategy;
Capital expansions to address capacity and capabilities; and
Earnings growth from further international market penetration with product lines from all three divisions.
LIQUIDITY AND CAPITAL RESOURCES
The Company's balance sheet continues to reflect significant liquidity and a strong capital base.liquidity. Management focuses on the current cash balance and operating cash flows in considering liquidity, as operating cash flows have historically been Raven'sthe Company's primary source of liquidity. Management expects that current cash, combined with the generation of positive operating cash flows, will be sufficient to fund the Company's normal operating, investing and financing activities. Sufficient borrowing capacity also exists if necessary for a large acquisition or major business expansion.
Raven'sThe Company's cash needs are seasonal, with working capital demands strongest in the first quarter. As a result, the discussion of trends in operating cash flows focuses on the primary drivers of year-over-year variability in working capital.
Cash and cash equivalents totaled $49.4$33.8 million at January 31, 20132016 compared to $25.8$51.9 million on the same date in 20122015, a decrease of $18.1 million. The decrease was primarily driven by higher increased cash outflow for shares repurchased under the authorized $40.0 million share buyback plan. The Company has repurchased 1.6 million shares at an average price of $18.31 for a total of $29.3 million during fiscal 2016. No shares were repurchased during fiscal 2015. These cash outflows were partially offset by positive
cash flows from operating activities. The Company had no short-term investments at January 31, 2016. Short-term investments were $0.3 million as of January 31, 2015 and 2014.
At January 31, 2016 the Company held cash and cash equivalents of $4.1 million in accounts outside the United States. These balances included undistributed earnings of foreign subsidiaries we consider to be indefinitely reinvested. If repatriated, undistributed earnings of $2.0 million would be subject to United States federal taxation. This cash flow was partially offsetestimated tax liability is approximately $0.3 million net of foreign tax credits. Our liquidity is not materially impacted by cash outflowthe amount held in accounts outside of the United States.
The Company entered into a new credit agreement dated April 15, 2015. This agreement (Credit Agreement), more fully described in Note 10 Financing Arrangements of the Notes to the Consolidated Financial Statements of this Annual Report on Form 10-K, provides for capital expenditures, dividends paida syndicated senior revolving credit facility up to shareholders and payments on acquisition-related contingent liabilities.$125 million with a maturity date of April 15, 2020. There were no borrowings against the Credit Agreement during the year or outstanding under the Credit Agreement at January 31, 2016.
Raven has an uncollateralizedLetters of credit agreement that provides a $10.5totaling $0.7 million, issued under the previous line of credit and expires November 30, 2013. There is no outstanding balance under the line of credit at January 31, 2013.with Wells Fargo Bank, N.A. (Wells Fargo) primarily to support self-insured workers' compensation bonding requirements, remain in place. The line of credit is reduced byCompany expects to have these outstanding letters of credit totaling $1.0 millionissued under the new credit facility. Until such time as that is complete, any draws required under these letters of January 31, 2013. The credit line is expected towould be renewed during fiscal 2014.settled with available cash or borrowings under the new Credit Agreement.
Operating Activities
Operating cash flows result primarily from cash received from customers, which is offset by cash payments for inventories, services, employee compensation, and income taxes. Management evaluates working capital levels through the computation of average days sales outstanding and inventory turnover. Average days sales outstanding is a measure of the Company'sCompany’s ability to negotiate favorable terms with its customers and its efficiency in enforcing its credit policy. The inventory turnover ratio is a metric used to evaluate the effectiveness of inventory management, with further consideration given to balancing the disadvantages of excess inventory with the risk of delayed customer deliveries.
Cash provided by operating activities was $76.544.0 million in fiscal 20132016 compared with $43.860.1 million in fiscal 20122015. The increase$16.1 million decrease in operating cash flows is primarily the result of higher Companylower earnings. While the Company's earnings were $23.2 million lower, these earnings reflected the impact of a $7.4 million non-cash goodwill impairment charge.
Year-over-year changes in inventory and cash generated from accounts receivable and inventory account balances.
are primary sources of changes in operating cash flows. In fiscal 2013,2016, changes in inventory and accounts receivable generated $12.9$24.3 million of cash compared to generating $11.5 million one year ago.
Cash provided by the change in inventory was $7.5 million in fiscal 2016 compared to $6.8 million in fiscal 2015. Inventory levels have decreased from $55.2 million at January 31, 2015 to $45.9 million at January 31, 2016. The Company's inventory turnover rate decreased from the prior year (trailing 12-month inventory turn of 3.6X at January 31, 2016 versus 4.9X at January 31, 2015) primarily due to higher average inventory levels at Aerostar and Engineered Films.
For accounts receivable cash provided in fiscal 2016 was $16.8 million compared to $4.7 million in fiscal 2015. The trailing 12 months days sales outstanding was 60 days at January 31, 2016 and 52 days at January 31, 2015. This increase reflects the impact of conditions within Engineered Films' energy market. This ratio stabilized during the fourth quarter at 58-60 days outstanding.
Year-over-year changes in inventory and accounts receivable were the primary sources of changes in fiscal 2015 operating cash flows. Inventory generated $6.8 million of cash versus consuming $27.1$9.2 million in fiscal 2012.2014. The Company's inventory turnover rate was consistentdecreased slightly from the prior year despiteprimarily due to the decrease inhigher average inventory levels at Engineered Films (trailing 12-month inventory turn of 5.4X4.9X in fiscal 20132015 and 5.2X in fiscal 2012)2014).
Accounts receivable generated $4.7 million in cash in fiscal 2015 as compared to generating $1.3 million cash in fiscal 2014. Cash collections continue to bewere efficient despite the increase in trailing 12 months days sales outstanding of 50from 51 days in fiscal 2013 compared2014 to 4752 days in fiscal 2012. Year-over-year variability in accounts payable and accrued liabilities consumed $4.6 million of cash in fiscal 2013 compared to cash generated of $1.7 million in fiscal 2012 due to timing of payments. 2015.
In fiscal 2013, deferred income taxes2015, uncertain tax positions consumed $1.8$3.3 million of cash compared to $5.4 milliongenerating cash of additional cash flow in fiscal 2012, which related primarily to bonus depreciation taken on qualified capital expenditures.
In fiscal 2012, inventory and accounts receivable consumed $27.1 million of cash compared to $14.7$0.7 million in fiscal 2011. The Company's inventory turnover rate declined slightly from the prior year2014 due to higher raw material inventory levelsa payment made to support increased sales (trailing 12-month inventory turn of 5.4X in fiscal 2012 versus 5.6X in fiscal 2011). Cash collections continued to be efficient, with the trailing 12 month days sales outstanding of 47 days in fiscal 2012 compared to 48 days in fiscal 2011. Year-over-year variability in accounts payable consumed $0.2 million of cash in fiscal 2012 compared to cash generated of $2.7 million in fiscal 2011 due to timing of payments. In fiscal 2012, the change in deferred income taxes contributed $5.4 million of additional operating cash flow due primarily to the deferral ofsettle a state tax liabilities resulting from bonus depreciation taken on qualified capital expenditures.liability.
Investing Activities
Cash used in investing activities totaled $29.9$11.1 million in fiscal 2013, $40.32016, $30.0 million in fiscal 20122015 and $11.4$31.6 million in fiscal 2011.2014. Capital expenditures totaled $29.7 million in fiscal 2013 compared to $29.0 million$13.0 million in fiscal 2012 and $14.02016 compared to $17.0 million in fiscal 2011. Capital2015 and $30.7 million in fiscal 2014. This fiscal 2016 spending consisted primarily relates to Engineered Films capacity expansion.
Fiscal 2016 benefited from $2.1 million in cash provided by the disposal of expendituresassets related to increasedthe exit of contract manufacturing capacityin Applied Technology and a reclaimAerostar. These cash inflows from the exit of contract manufacturing were due to selling the Company's St. Louis operations and related assets as well as our idle facility in Engineered Films, Applied Technology's research and training facilities along with renovationHuron, South Dakota. There were no material cash flows from the disposal of assets in fiscal 2015 or fiscal 2014.
Cash inflow related to business acquisitions in fiscal 2016 relate to the Company receiving a $0.4 million settlement of the Company's downtown Sioux Falls corporate headquarters.
working capital adjustment to the Integra purchase price. Cash outflows totaling $12.5 million in fiscal 2015 related to the Integra and SBG business acquisitions. There were no businesses acquired or sold in fiscal 2013. Capital outlay for payments related to business acquisitions was $11.8 million in fiscal 2012, primarily related to the Vista acquisition.2014.
Management anticipates capital spending in the $25 - $30of approximately $9 million range in fiscal 2014. As part of the Company's investment in corporate infrastructure, over the next two years Raven will continue to invest in the renovation of its downtown Sioux Falls corporate headquarters, spending approximately $11 - $13 million in that period. Expansion of2017. Maintaining Engineered Films' capacity and Applied Technology's manufacturing and research andcapital spending to advance product development facility are expected to continue. In addition, management will evaluate strategic acquisitions that result in expanded capabilities and solidifyimproved competitive advantages.
Financing Activities
Financing activities consumed cash of $23.050.7 million in fiscal 20132016 compared with $15.230.7 million in fiscal 20122015 and $33.817.4 million in fiscal 20112014.
Quarterly dividends paid in fiscal 20132016 were $15.219.4 million, or $0.42$0.52 per share ($0.13 per share per quarter), compared to $13.018.5 million in fiscal 20122015 and $11.6$17.5 million in fiscal 20112014.
In the first quarter of fiscal 2013,2016, the Company increasedbegan to repurchase common shares as part of the quarterly dividend rate (excluding special
dividends) for$40.0 million share repurchase plan authorized by the 26th consecutive year. Raven has now paid a dividend in 40 consecutive years. InCompany’s Board of Directors. During fiscal 2011,2016, the Company paid a special dividend of $22.5$29.3 million for share repurchases. No shares were repurchased during fiscal 2015 or $0.625 per share.fiscal 2014.
During fiscal 2013, theThe Company made $8.4$0.8 million in payments on of acquisition-related contingent liabilitiesliability payments related to the Vista acquisition and SBG acquisitions. During fiscal 2015 and fiscal 2014, the 2009 acquisitionCompany made payments of substantially all$0.5 million and $0.4 million, respectively, of acquisition-related contingent liabilities.
During fiscal 2016, the assetsCompany paid $0.5 million of Ranchview, Inc., a privately held Canadian corporation.
Fiscal 2012 financing cash outflow included a payment to close a line of creditdebt issuance costs associated with the Credit Agreement previously discussed. No debt issuance costs were paid during the fiscal 2015 or fiscal 2014. No borrowings or repayment have occurred on the Credit Agreement during fiscal 2016. In fiscal 2015, the Company made net debt repayments totaling $12.0 million for debt assumed as part of the Vista acquisition totaling $2.9 million.Integra and SBG acquisitions. No borrowings were made under this lineor debt repayments occurred in fiscal 2014.
Financing cash outflows in fiscal 2016 included $0.5 million of credit.employee taxes in relation to the net settlement of restricted stock units (RSUs) that vested during the year. No RSUs vested during fiscal 2015 or fiscal 2014.
OFF-BALANCE SHEET ARRANGEMENTS AND CONTRACTUAL OBLIGATIONS
As of January 31, 20132016, the Company is obligated to make cash payments in connection with its non-cancelable operating leases for facilities and equipment and unconditional purchase obligations, primarily for raw materials, in the amounts listed below. The Company has noCompany's known off-balance sheet debt orand other unrecorded obligations other than the itemsare noted in the table below.
A summary of the obligations and commitments at January 31, 20132016 is shown below.
| | | dollars in thousands | dollars in thousands | | Total | | Less than 1 year | | 1-3 years | | 3-5 years | | More than 5 years | dollars in thousands | | Total | | Less than 1 year | | 1-3 years | | 3-5 years | | More than 5 years |
| Operating leases | Operating leases | | 4,120 |
| | 1,478 |
| | 2,319 |
| | 323 |
| | — |
| Operating leases | | $ | 6,510 |
| | $ | 1,661 |
| | $ | 2,520 |
| | $ | 2,329 |
| | $ | — |
|
Unconditional purchase obligations(a) | Unconditional purchase obligations(a) | | 50,996 |
| | 50,996 |
| | — |
| | — |
| | — |
| Unconditional purchase obligations(a) | | 24,265 |
| | 24,265 |
| | — |
| | — |
| | — |
|
Postretirement benefits(b)(a) | Postretirement benefits(b)(a) | | 21,379 |
| | 235 |
| | 537 |
| | 642 |
| | 19,965 |
| Postretirement benefits(b)(a) | | 19,389 |
| | 329 |
| | 702 |
| | 712 |
| | 17,646 |
|
Acquisition-related contingent payments(c)(b) | Acquisition-related contingent payments(c)(b) | | 12,284 |
| | 732 |
| | 2,384 |
| | 3,756 |
| | 5,412 |
| Acquisition-related contingent payments(c)(b) | | 5,561 |
| | 418 |
| | 1,792 |
| | 3,278 |
| | 73 |
|
Uncertain tax positions(d)(c) | Uncertain tax positions(d)(c) | | — |
| | — |
| | — |
| | — |
| | — |
| Uncertain tax positions(d)(c) | | — |
| | — |
| | — |
| | — |
| | — |
|
Line of credit(d) | Line of credit(d) | | — |
| | — |
| | — |
| | — |
| | — |
| Line of credit(d) | | 897 |
| | 213 |
| | 425 |
| | 259 |
| | — |
|
| | | | $ | 88,779 |
| | $ | 53,441 |
| | $ | 5,240 |
| | $ | 4,721 |
| | $ | 25,377 |
| | | $ | 56,622 |
| | $ | 26,886 |
| | $ | 5,439 |
| | $ | 6,578 |
| | $ | 17,719 |
|
(a) | Includes unconditional obligations of $2,185 related to the ongoing renovations of the Company's corporate headquarters. | Postretirement benefit amounts represent expected payments on the accumulated postretirement benefit obligation before it is discounted. |
(b) | Postretirement benefit amounts represent expected payments on the accumulated postretirement benefit obligation before it is discounted. | Amounts reflect the future earn-out payments with respect to business acquisitions. Actual payments on these obligations may vary from the reported amounts since the total payment amount due depends upon certain future conditions. See below for further detail on the specific obligations. |
(c) | Amounts reflect the future earn-out payments with respect to prior year business acquisitions. Actual payments on these obligations may vary from the reported amounts since the total payment amount due depends upon certain future conditions. See below for further detail on the specific obligations. | See below for further details on specific obligations. |
(d) | See below for further details on specific obligations. | Amounts reflect administrative and unborrowed capacity fees under the line of credit described below. |
Acquisition-related obligations
The Company has a future obligationobligations for earn-out payments associated with business acquisitionsthe acquisition of Vista completed in prior years.fiscal 2012 and of SBG completed in fiscal 2015. The total liability recorded on the Consolidated Balance Sheet as of January 31, 2016 related to these future obligations was $2.8 million, of which $0.3 million was classified as "Accrued liabilities" and $2.5 million as "Other liabilities". These liabilities represent the present value of earn-out payments classified as consideration at the acquisition date. Specific to the SBG acquisition, the Company may pay up to $2.5 million in additional earn-out payments calculated and paid quarterly over the next 10 years contingent upon SBG achieving certain revenues. Specific to the Vista acquisition, the Company agreed to pay additional contingent consideration not to exceed $15.0 million, based upon earn-out percentages on specific revenue streams until January 31, 2019. The total liability recorded on the Consolidated Balance Sheet as of January 31, 2013 related to these future obligations was $3.1 million, of which $0.7 million was classified as "Accrued liabilities" and $2.4 million as "Other liabilities". These liabilities represent the present value of earn-out payments classified as consideration at the acquisition date. The Company has not paid any amount on the earn-out obligation as of January 31, 2013. In a transaction separate from the Vista acquisition but related to Vista, the Company agreed to fund a revenue-based bonus pool, also not to exceed $15.0 million, which will be accrued when the specific revenue stream is recorded using those same earn-out percentages.percentages over the same time period.
Uncertain tax positions
Raven reported a total liability for uncertain tax positions of $5.8$3.3 million at January 31, 2013.2016. The Company is not able to reasonably estimate the timing of future payments relating to these non-current tax benefits. This obligation is retired when the uncertain tax position is settled or applicable tax year is no longer subject to examination by the tax authorities.
Line of credit
Raven has anOn April 15, 2015 the Company's uncollateralized credit agreement with Wells Fargo Bank, N.A. (Wells Fargo) providing a line of credit of $10.5$10.5 million and maturing on November 30, 2016 was terminated upon the Company's entering into a new credit facility.
This new credit facility, the Credit Agreement dated as of April 15, 2015 among Raven Industries, Inc., JPMorgan Chase Bank, N.A., Toronto Branch as Canadian Administrative Agent, JPMorgan Chase Bank, National Association, as administrative agent, and each lender from time to time party thereto (the Credit Agreement), provides for a syndicated senior revolving credit facility up to $125 million with a maturity date of November 30, 2013, bearingApril 15, 2020.
Loans or borrowings defined under the Credit Agreement bear interest and fees at 1.5% abovevarying rates and terms defined in the daily one month London Inter-Bank Market Rate. Credit Agreement based on the type of borrowing as defined. The Credit Agreement includes annual administrative and unborrowed capacity fees of $0.2 million. The Credit Agreement contains customary affirmative and negative covenants, including those relating to financial reporting and notification, limits on levels of indebtedness and liens, investments, mergers and acquisitions, affiliate transactions, sales of assets, restrictive agreements, and change in control as defined in the Credit Agreement. Financial covenants include an interest coverage ratio and funded indebtedness to earnings before interest, taxes, depreciation, and amortization as defined in the Credit Agreement. $125 million was available under the Credit Agreement for borrowings as of January 31, 2016. The loan proceeds may be utilized by Raven for strategic business purposes, including acquisitions, and for working capital needs.
Letters of credit totaling $1.0$0.7 million, have been issued under the previous line of credit with Wells Fargo primarily to support self-insured workers' compensation bonding requirements. Norequirements, remain in place. The Company expects to have these outstanding letters of credit issued under the new credit facility. Until such time as that is complete, any draws required under these letters of credit would be settled with available cash or borrowings were outstanding as of January 31, 2013, 2012 and 2011 and $9.5 million was available at January 31, 2013.under the Credit Agreement. There have been no borrowings under theeither credit line with Wells Fargoagreement in the last three fiscal years. years and there were no borrowings outstanding under either credit agreement for any of the fiscal periods covered by this Annual Report on Form 10-K. The Company is in compliance with all covenants set forth in the Credit Agreement.
In the event the bank group chooses not to renew the Company's line of credit, the letters of credit would cease and alternative methods of support for the insurance obligations would be necessary, these would be more expensive and would require additional cash outlays. Management believes the chances of this arehappening to be remote.
CRITICAL ACCOUNTING ESTIMATES
Critical accounting policies are those that require the application of judgment when valuing assets and liabilities on the Company's balance sheet. These policies are discussed below because a fluctuation in actual results versus expected results could materially affect operating results and because the policies require significant judgments and estimates to be made. Accounting related to these policies is initially based on best estimates at the time of original entry in the accounting records. Adjustments are periodically recorded when the Company's actual experience differs from the expected experience underlying the estimates. These adjustments could be material if experience were to change significantly in a short period of time. The Company does not enter into derivatives or other financial instruments for trading or speculative purposes. However, Raven has used derivative financial instruments to manage the economic impact of fluctuations in currency exchange rates on transactions that are denominated in currency other than its functional currency, which is the U.S. dollar. The use of these financial instruments had no material effect on the Company's financial condition, results of operations, or cash flows.flows in fiscal year 2016, 2015, or 2014.
Inventories
The Company estimates inventory valuation each quarter. Typically, when a product reaches the end of its lifecycle, inventory value declines slowly or the product has alternative uses. Management uses its manufacturing resources planning data to help determine if inventory is slow-moving or has become obsolete due to an engineering change. The Company closely reviews items that have balances in excess of the prior year'sforecasted requirements, or that have been dropped from production requirements. Despite these reviews, technological or strategic decisions made by management or Raven'sthe Company's customers may result in unexpected excess material. Further, a decline in the market demand for the Company's products may also result in write-down of inventory balances. The electronics manufacturing businessCompany assesses current and expected selling prices in Aerostar Division typically has recoursedetermining if inventory balances should be written down to customers for obsolete or excess material. When these customers authorize inventory purchases, especially with long lead-time items, they are required to take delivery of unused material or compensate the Company accordingly.net realizable value. In every Raven operating unit, management must manage obsolete inventory risk. The accounting judgment ultimately made is an evaluation of the success that management will have in controlling inventory risk and mitigating the impact of obsolescence when it does occur.
Pre-Contract Costs
From time to time, the Company incurs costs to begin fulfilling the statement of work under a specific anticipated contract still being negotiated with the customer. If the Company determines that it is probable it will be awarded the specific anticipated contract, the pre-contract costs incurred, excluding start-up costs which are expensed as incurred, are deferred to the balance sheet and included in “Inventories.” Deferred pre-contract costs are periodically reviewed and assessed for recoverability under the contract based on the Company’s assessment of the nature of the costs, the probability and timing of the award, and other relevant facts and circumstances. Write-offs of pre-contract costs are charged to cost of sales when it becomes probable such costs will not be recoverable.
Warranties
Estimated warranty liability costs are based on historical warranty costs and average time elapsed between purchases and returns for each business segment. Warranty issues that are unusual in nature are accrued for individually.
Allowance for Doubtful Accounts
Determining the level of the allowance for doubtful accounts requires management's best estimate of the amount of probable credit losses based on historical write-off experience by segment and an estimate of the ability to collect any known problem accounts. Factors that are considered beyond historical experience include the length of time the receivables are outstanding, the current business climate, and the customer's current financial condition. Accounts receivable and any related allowance are written off after all collection efforts have been exhausted.
Revenue Recognition
Estimated returns or sales allowances are recognized upon shipment of a product. The Company sells directly to customers or distributors that incur the expense and commitment for any post-sale obligations beyond stated warranty terms.
GoodwillFor certain service-related contracts, the Company recognizes revenue under the percentage-of-completion method of accounting, whereby contract revenues are recognized on a pro-rata basis based upon the ratio of costs incurred compared to total estimated contract costs. Contract costs include labor, material, subcontracting costs, as well as allocation of indirect costs. Revenues, including estimated profits, are recorded as costs are incurred. Losses estimated to be incurred upon completion of contracts are charged to operations when they become known.
Certain contracts contain provisions for incentive payments that the Company may receive based on performance criteria related to product design, development and Long-lived Assetsproduction standards. Revenue related to the incentive payments is recognized when ultimate realization by the Company is assured, which generally occurs when the provisions and performance criteria required by the contract are met.
Goodwill
Management assesses goodwill for impairment annually, or more frequently if events or changes in circumstances indicate that an asset might be impaired, using fair value measurement techniques. For goodwill, Raventhe Company performs impairment reviews by reporting units which are determined to be: Engineered Films Division; Applied Technology Division Engineered Films Division,(including SBG which was integrated into the existing operations of this division in fiscal year 2016); and two separate reporting units in the Aerostar Division, one of which is Vista and the otherone of which is all other Aerostar operations.operations (Aerostar excluding Vista).
The Company has the option to perform a qualitative impairment assessment overbased on relevant events and circumstances to determine whether it is more likely than not that the fair value of a reporting unit is less than its carrying amount.amount, the book value of net assets. Certain events and circumstances reviewed are macroeconomics,financial outlooks, industry and economic conditions, cost inputs, overall financial performance, and other relevant entity-specific events. If events and circumstances indicate the fair value of a reporting unit is more likely than not greater than the book value of its carrying amount,net assets, then no further goodwill impairment testing is needed. If events and circumstances indicate the fair value of a reporting unit is less than the book value of its carrying value,net assets, or the Company does not elect to do the qualitative assessment, then the Company must performperforms step one of the goodwill impairment analysis.
In step one of the impairment analysis (Step 1), the fair value of each reporting unit is determined using a discounted cash flow analysis. Projecting discounted future cash flows requires the Company to make significant estimates and assumptions regarding future revenues and expenses, projected capital expenditures, changes in working capital, and the appropriate discount rate. Management
evaluates the merits of each significant assumption used to determine the fair value of the reporting unit. Actual results may differ from those used in our valuations.
In developing ourthe discounted cash flow analysis, assumptions about future revenues and expenses,the revenue growth rate, operating profit margin percentage, capital expenditures, and changes in working capital are based on our annual operating plan and long-term business plan for each of ourthe Company’s reporting units. These plans take into consideration numerous factors including experience, anticipated future economic conditions, changes in raw material prices and growth expectations. These assumptions are determined over a five-year strategic planning period. The five year growth rates for revenues and operating profits vary for each reporting unit being evaluated.
Discount rate assumptions for each reporting unit are the value-weighted average of the Company’s estimated cost of capital derived using both known and estimated customary market metrics and take into consideration ourmanagement’s assessment of risks inherent in the future cash flows of the respective reporting unit. One of the metrics considered by the Company in its selection of a discount rate is the relevant small company size premium appropriate to the reporting unit for which the valuation is being assessed. With other factors such as the optimal capital structure assumed for the reporting unit, this may result in a different discount rate assumption for each reporting unit being evaluated.
The estimated fair value of the reporting unit is then compared with the book value of its net assets. If the estimated fair value of the reporting unit is less than the book value of the net assets of the reporting unit, an impairment loss is possible and a more refined measurement of the impairment loss would take place. This is the second step of the goodwill impairment testing (Step 2), in which management may use market comparisons and recent transactions to assign the fair value of the reporting unit to all of the assets and liabilities of that unit. The valuation methodologies in both steps of goodwill impairment testing use significant estimates and assumptions. Management evaluates the merits of each significant assumption and the overall basket of assumptions which include projected futureused to determine the fair value of the reporting unit.
In fiscal 2016, as discussed below, the Company determined that there were triggering events with respect to the Engineered Films and Vista reporting units that resulted in impairment tests during the fiscal year. The impairment test with respect to Vista resulted in an impairment charge, as discussed below.
Engineered Films Reporting Unit
In the fiscal 2016 second quarter the Company determined that a triggering event occurred for its Engineered Films reporting unit primarily driven by the continuation of the substantial decline in energy market demand as a result of lower oil prices year-over-year. The Company performed a Step 1 impairment analysis using fair value techniques on the Engineered Films reporting unit as a result of changes in market conditions indicating that goodwill might be impaired. The reporting unit's fair value was estimated based on discounted cash flows and that fair value amount was compared to the net book value of the assets of the reporting unit. This analysis indicated that the estimated fair value of the Engineered Films reporting unit exceeded the net book value by approximately $50 million. Therefore, no Step 2 analysis was done.
The most significant assumptions used to determine the fair value of the Engineered Films reporting unit include: revenue growth rate (including assumptions regarding economic conditions, particularly those related to the energy markets served by the division), operating profit margin percentage, capital expenditures (particularly those impacting changes in capacity), and the discount rate.
For the Step 1 analysis performed in the second quarter, ten-year revenue expectations were built using a bottom-up approach for each market served focusing primarily on current product pipelines and new product developments, customer changes, market conditions and drivers, and production capacity. Regarding the revenue growth assumptions, energy market revenues were of particular focus due to current weak end-market demand. The Company estimated the energy market would achieve a modest rebound in demand relative to historical highs during the middle of the 10-year forecast. The resulting compound annual growth rate for net sales for the first 5 years (fiscal 2016-2020) of the forecast was approximately 6% while the compound annual growth rate (CAGR) for net sales for years 6 through 10 (fiscal 2021-2025) of the forecast was approximately 5%. The 4-year historical CAGR was approximately 11% from fiscal 2011 through fiscal 2015 on an organic basis (excluding the impact of the Integra acquisition in the fourth quarter of fiscal 2015). The perpetual growth factor selected was 3.0%, in line with average long-term GDP growth. Using the revenue growth rate to illustrate the sensitivity on this estimated fair value, a one-half percentage decrease in the average revenue growth rate over the 10-year forecast period (and the terminal growth rate in perpetuity) would have reduced the second quarter estimated fair value of the Engineered Films reporting unit by approximately $7 million.
The operating profit margin percentage assumption for the forecast period averaged approximately 13% of sales. This compares to an average operating profit margin percentage of approximately 11% of sales during fiscal years 2011-2015. The expansion in operating profit margin during the forecast period is based on the Company’s expectation of the product sales mix, including new products made possible by completion of a new extrusion line, and overall higher capacity utilization, among other factors. Higher-value products, higher margins on such products, and leverage of fixed costs at higher production levels are expected to drive increased operating margins. Using the operating profit margin percentage to illustrate the sensitivity on this estimated fair value, a one-half percentage decrease in average operating profit margin percentage over the forecast period would have reduced the second quarter estimated fair value of the Engineered Films reporting unit by approximately $7 million.
Capital expenditures are a significant input to the valuation of the Engineered Films reporting unit because of a recurring pattern of maintenance spending and spending for capacity increases. Typically, new capacity expansion occurs every three to four years. As a result of the Integra acquisition and the completion of a production line in fiscal 2016 at a cost of approximately $12 million, Engineered Films currently has excess capacity and will continue to have excess capacity for some time. Historical capital expenditures from fiscal 2011 through fiscal 2015 were approximately $23 million. The average annual capital expenditure amount used in the fair value model for the Engineered Films reporting unit was $7.0 million for the next ten years. Using capital expenditures to illustrate the sensitivity on this estimated fair value, each additional $1.0 million in average capital expenditures over the forecast period would have reduced the second quarter estimated fair value of the Engineered Films reporting unit by approximately $2 million.
The discount rate used in the determination of the fair value was 13.0%. Using the discount rate to illustrate the sensitivity on this estimated fair value, a one-half percentage point increase in the discount rate would have reduced the second quarter estimated fair value of the Engineered Films reporting unit by approximately $10 million.
There were no significant changes in market conditions or expected operating income for the Engineered Films reporting unit and no triggering events were deemed to have occurred in the third or fourth quarter of fiscal 2016. As such, the Company completed its regular annual goodwill impairment testing in the fourth quarter for the Engineered Films reporting unit based on November 30, 2015 information.
For the annual testing, because of the triggering event in the second quarter and continued weak demand in the energy market, the Company performed another Step 1 analysis. This analysis indicated that the estimated fair value of the Engineered Films reporting unit exceeded the net book value by approximately $35 million; therefore, no Step 2 analysis was performed. The prolonged energy market decline was the primary reason for this $15 million decline in the excess of estimated fair value over the net book value determined in the Step 1 analysis completed at the end of the fiscal second quarter. In that Step 1 analysis, the Company estimated the energy market would achieve a modest rebound in demand relative to historical highs during the middle of the 10-year forecast. For the annual testing, no significant energy market rebound was included in the revenue growth rate expected in the forecast period used for the annual analysis. This reduced the resulting annual growth rate for net sales for the first 5 years of the forecast to approximately 3% while the compound annual growth rate for net sales for years 6 through 10 increased slightly. The perpetual growth factor selected was 3.0%, in line with average long-term GDP growth. Using the revenue growth rate to illustrate the sensitivity on this estimated fair value, a one-half percentage decrease in the average growth rate over the forecast period would reduce the estimated fair value of the Engineered Films reporting unit by approximately $8 million.
The operating profit margin percentage assumption for the forecast period averaged approximately 13% of sales. Using the operating profit margin percentage to illustrate the sensitivity on this estimated fair value, a one-half percentage decrease in average operating profit margin over the forecast period would reduce the estimated fair value of the Engineered Films reporting unit by approximately $7 million.
For the annual Step 1 analysis, expected capital expenditures were increased approximately 2% compared to the second quarter valuation. Engineered Films currently has excess capacity and will continue to have excess capacity for some time. Using capital expenditures to illustrate the sensitivity on this estimated fair value, each additional $1.0 million in average capital expenditures over the forecast period would reduce the estimated fair value of the Engineered Films reporting unit by approximately $2 million.
The discount rate used in the determination of the fair value was 13.0%, consistent with the second quarter analysis. Using the discount rate to illustrate the sensitivity on this estimated fair value, a one-half percentage point increase in the discount rate would have reduced the estimated fair value of the Engineered Films reporting unit for the annual testing by approximately $9 million.
Engineered Films' results for the last two months of fiscal 2016 subsequent to November 30, the date of the annual impairment analysis, were substantially consistent with the forecast and no new impairment indicators were noted in the fiscal fourth quarter.
Vista Reporting Unit
In the fiscal 2016 third quarter the Company determined that a triggering event occurred for its Vista reporting unit, a subsidiary of the Aerostar Division. In addition to the Company making a change in the executive leadership of the Vista reporting unit during the quarter, financial expectations for sales and operating income of the reporting unit were lowered due to delays and uncertainties regarding the reporting unit’s pursuit of large international opportunities, one of which was expected to be awarded during the third quarter. While Vista had been in the process of negotiating a large international contract throughout fiscal 2016 and had a pre-authorization letter from the prime contractor, the contract did not materialize in the fiscal 2016 third quarter as expected and the likelihood of being awarded this or other such contracts in the next twelve months was determined to be substantially lower than it was in the second quarter. As a result of a delay in being awarded this large international contract, the Company lowered its financial forecast for the business. As a result of these factors, the Company performed a Step 1 impairment analysis using fair value techniques as of October 31, 2015.
The reporting unit's fair value was estimated based on discounted cash flows and that fair value amount was compared to the carrying value of the reporting unit. The analysis indicated that the estimated fair value of the Vista reporting unit was less than the carrying value by $8.4 million, or 35.0%. Based on these results, a Step 2 impairment analysis was performed. The fair value determined in Step 1 was allocated to the assets and liabilities of the reporting unit. Based on the Step 2 impairment analysis the Company determined that the goodwill balance was impaired as of October 31, 2015 and an impairment loss of $7.4 million was recorded in the fiscal 2016 third quarter. This goodwill impairment loss is described further in Note 6 Goodwill and Other Intangibles of the Notes to the Consolidated Financial Statements of this Form 10-K.
The most significant assumptions used to determine the fair value of the Vista reporting unit include: Revenue growth rate (particularly those related to being successful in being awarded large, international contracts and the timing thereof), operating profit margin percentage, and the discount rate.
For the third quarter testing, ten-year revenue expectations were built using a bottom-up approach for each of Vista’s markets of focus. A key driver of growth for Vista was the timing and magnitude of larger international contract awards. The resulting CAGR for net sales for the risks inherent in future cash flows),first 5 years (fiscal 2016-2020) of the forecast was approximately 1.5% while the CAGR for net sales for years 6 through 10 (fiscal 2021-2025) of the forecast was approximately 6%. The 2-year historical CAGR since we acquired this business was approximately 31%. The perpetual growth rates andfactor selected was 3.0%, in line with long-term average GDP growth. Using the revenue growth rate to illustrate the sensitivity on this estimated fair value, a one-half percentage decrease in the average revenue growth rate over the 10-year forecast period (and the terminal growth rate in perpetuity) would have reduced the estimated fair value of the Vista reporting unit by approximately $500 thousand.
Operating profit margin assumptions for the forecast period averaged approximately 10% of sales. This compares to an average operating profit margin of approximately 8% of sales during fiscal years 2013-2015. The expansion in operating profit margin during the forecast period is driven primarily by the expected savings from the restructuring plan implemented in the third quarter of fiscal 2016 (several million dollars on an annualized basis are expected) as well as leverage of operating expenses on assumed growth in sales. Using the operating profit margin to illustrate the sensitivity on this estimated fair value, a one-half percentage decrease in average operating profit margin over the forecast period would have reduced the estimated fair value of the Vista reporting unit by approximately $500 thousand.
The discount rate used in the determination of appropriate market comparables.the fair value was 19.0%. Using the discount rate to illustrate the sensitivity on this estimated fair value, a one-half percentage point increase in the discount rate would have reduced the estimated fair value of the Vista reporting unit by approximately $500 thousand.
The Company completed its annual goodwill impairment testing in the fourth quarter for the Vista reporting unit based on November 30, 2015 information. Because of the triggering event one month earlier in the third quarter and the level of expectation concerning large international contracts, the Company performed another Step 1 analysis. This analysis indicated that the estimated fair value of the Vista reporting unit exceeded the net book value (which reflected the impairment charge recognized in the third quarter) by approximately $200 thousand.
In the annual testing, the revenue growth rate expected in the forecast period used for the annual analysis increased slightly from the growth rate used in the third quarter analysis. This reduced the resulting annual growth rate for net sales for the first 5 years of the forecast to approximately 3% while the compound annual growth rate for net sales for years 6 through 10 increased slightly. The perpetual growth factor selected was 3.0%, in line with average long-term GDP growth. Using the revenue growth rate to illustrate the sensitivity on this estimated fair value, a one-half percentage decrease in the average growth rate over the forecast period would reduce the estimated fair value of the Vista reporting unit by approximately $800 thousand.
In the annual testing, operating profit margin assumption for the forecast period averaged approximately 4% of sales. Using the operating profit margin to illustrate the sensitivity on this estimated fair value, a one-half percentage decrease in average operating profit margin over the forecast period would reduce the estimated fair value of the Vista reporting unit by approximately $600 thousand.
In the annual testing, the discount rate used in the determination of the fair value was 19.0%, consistent with the third quarter analysis. Using the discount rate to illustrate the sensitivity on this estimated fair value, a one-half percentage point increase in the discount rate would reduce the estimated fair value of the Vista reporting unit by approximately $600 thousand.
Vista's results for the last two months of fiscal 2016 subsequent to November 30, the date of the annual impairment analysis, were substantially consistent with the forecast and no new impairment indicators were noted in the fiscal fourth quarter.
Aerostar (excluding Vista)
The Company completed its annual Step 1 analysis for the Aerostar reporting unit (excluding Vista) based on November 30, 2015 information. This analysis indicated that the estimated fair value of the Aerostar reporting unit exceeded the net book value by approximately $12 million. The most significant assumptions used to determine the fair value of the Aerostar reporting unit include: revenue growth rate, operating profit margin percentage, and the discount rate.
The revenue growth rate expected in the forecast period used for the annual analysis was significantly lower than the historical CAGR due to the planned exit contract manufacturing business and was based solely on management’s estimates of growth of proprietary revenues during the forecast period. The operating profit margin percentage assumption for the forecast period, however, increased based on management’s estimates as proprietary products are expected to carry a significantly higher margin than contract manufacturing business. The perpetual growth factor selected was 3.0%, in line with average long-term GDP growth. Using the revenue growth rate to illustrate the sensitivity on this estimated fair value, a one-half percentage decrease in the average growth rate over the forecast period would reduce the estimated fair value of the Aerostar reporting unit by approximately $1 million. Using the operating profit margin to illustrate the sensitivity on this estimated fair value, a one-half percentage decrease in average operating profit margin over the forecast period would reduce the estimated fair value of the Aerostar reporting unit by approximately $1 million.
The discount rate used in the determination of the fair value was 17.0%. Using the discount rate to illustrate the sensitivity on this estimated fair value, a one-half percentage point increase in the discount rate would reduce the estimated fair value of the Aerostar reporting unit by approximately $1 million.
Aerostar's results for the last two months of fiscal 2016 subsequent to November 30, the date of the annual impairment analysis, were substantially consistent with the forecast and no impairment indicators were noted in the fiscal fourth quarter.
Applied Technology
The Company completed its annual Step 1 analysis for the Applied Technology reporting unit based on November 30, 2015 information. This analysis indicated that the estimated fair value of the Applied Technology reporting unit exceeded the net book value by approximately $130 million. The most significant assumptions used to determine the fair value of the Applied Technology reporting unit include: revenue growth rate, operating profit margin percentage, and the discount rate.
The revenue growth rate expected for the annual analysis was significantly lower than the 5-year historical CAGR of 8.6% due to weak end-market conditions that resulted in declining sales beginning in fiscal 2014 for Applied Technology. The operating profit margin assumption for the forecast period was assumed to be in line with current results as the prior periods operating profit margin benefited significantly from high production levels. The perpetual growth factor selected was 3.0%, in line with average long-term GDP growth. Using the revenue growth rate to illustrate the sensitivity on this estimated fair value, a one-half percentage decrease in the average growth rate over the forecast period would reduce the estimated fair value of the Applied Technology reporting unit by approximately $10 million. Using the operating profit margin to illustrate the sensitivity on this estimated fair value, a one-half percentage decrease in average operating profit margin over the forecast period would reduce the estimated fair value of the Applied Technology reporting unit by approximately $5 million.
The discount rate used in the determination of the fair value was 13.0%. Using the discount rate to illustrate the sensitivity on this estimated fair value, a one-half percentage point increase in the discount rate would reduce the estimated fair value of the Applied Technology reporting unit by approximately $12 million.
Aerostar's results for the last two months of fiscal 2016 subsequent to November 30, the date of the annual impairment analysis, were substantially consistent with the forecast and no impairment indicators were noted in the fiscal fourth quarter.
Long-Lived Assets
For long-lived assets, including definite-lived intangibles, investments in affiliates and property plant and equipment, management tests for recoverability whenever events or changes in circumstances indicate that the asset's carrying amount may not be recoverable. Property, plant and equipment are depreciated over the estimated lives of the assets using accelerated methods, which reduces the likelihood of an impairment loss. Management periodically discusses any significant changes in the utilization of long-lived assets, which may result from, but are not limited to, an adverse change in the asset's physical condition or a significant adverse change in the business climate. For purposes of recognition and measurement of an impairment loss, a long-lived asset is grouped with other assets and liabilities at the lowest level for which identifiable cash flows are largely independent of the cash flows of other assets and liabilities. An impairment loss is recognized when the carrying amount of an asset exceeds the estimated undiscounted cash flows used in determining its fair value.
Acquisition-Related Contingent Consideration
Acquisition-related contingent consideration represents an obligation of the Company to transfer additional assets or equity interests if specified future events occur or conditions are met. This contingency is accounted for at fair value either as a liability or equity depending on the terms of the acquisition agreement. The Company determines the estimated fair value of contingent consideration as of the acquisition date, and subsequently at the end of each reporting period. In doing so, the Company makes significant estimates and assumptions regarding future events or conditions being achieved under the subject contingent agreement as well as the appropriate discount rate to apply. Such valuation techniques include one or more significant inputs that are not observable.
Uncertain Tax Positions
Accounting for tax positions requires judgments, including estimating reserves for uncertainties associated with the interpretation of income tax laws and regulations and the resolution of tax positions with tax authorities after discussions and negotiations. The ultimate outcome of these matters could result in material favorable or unfavorable adjustments to the consolidated financial statements.
ACCOUNTING PRONOUNCEMENTS
Accounting Standards Adopted
In July 2012April 2015 the Financial Accounting Standards Board (FASB) issued Accounting Standards Update (ASU) No. 2012-02, "Testing Indefinite-Lived Intangible Assets2015-04, "Compensation—Retirement Benefits (Topic 715) Practical Expedient for Impairment"the Measurement Date of an Employer’s Defined Benefit Obligation and Plan Assets" (ASU No. 2012-02)2015-04). The amendments in ASU No. 2012-02 is intended to reduce2015-04 allow a reporting entity that may incur more costs than other entities when measuring the cost and complexityfair value of testing indefinite-lived intangibleplan assets of a defined benefit pension or other postretirement benefit plan at other than goodwill for impairment. It allows Ravena month-end to perform a "qualitative" assessment to determine whether further impairment testing of indefinite-lived intangiblemeasure defined benefit plan assets and obligations using the month-end date that is necessary, similar in approachclosest to the goodwill impairment test. The revised guidancedate of event (such as a plan amendment, settlement, or curtailment that calls for a remeasurement in accordance with existing requirements) that is effectivetriggering the remeasurement. In addition, if a contribution or significant event occurs between the month-end date used to measure defined benefit plan assets and obligations and an entity’s fiscal year-end, the entity should adjust the measurement of defined benefit plan assets and obligations to reflect the effects of those contributions or significant events. However, an entity should not adjust the measurement of defined benefit plan assets and obligations for annualother events that occur between the month-end measurement and the entity’s fiscal year-end that are not caused by the entity (for example, changes in market prices or interest rates). This practical expedient for the measurement date also applies to significant events that trigger a remeasurement in an interim impairment tests performedperiod. An entity electing the practical expedient for the measurement date is required to disclose the accounting policy election and the date used to measure defined benefit plan assets and obligations in accordance with the amendments in ASU 2015-04. ASU 2015-04 is effective for fiscal years beginning after SeptemberDecember 15, 2012.2015. The Company has no material indefinite-lived intangible assets.may
adopt the standard prospectively. Early adoption is permitted. In the fiscal 2016 first quarter the Company elected to early adopt ASU 2015-04 and apply it on a prospective basis. The Company's plan that provides postretirement medical and other benefits was amended on August 25, 2015. As a result of this plan amendment, the Company elected the practical expedient pursuant to this guidance and a valuation was completed using an August 31, 2015 measurement date.
In April 2015 the FASB issued ASU No. 2015-03, "Interest—Imputation of Interest (Subtopic 835-30) Simplifying the Presentation of Debt Issuance Costs" (ASU 2015-03). The amendments in ASU 2015-03 simplify the presentation of debt issuance costs and require that debt issuance costs related to a recognized debt liability be presented in the balance sheet as a direct deduction from the carrying amount of that debt liability, consistent with debt discounts. The recognition and measurement guidance for debt issuance costs are not affected by the amendments in this update. In August 2015 the FASB issued ASU No. 2015-15 "Interest—Imputation of Interest (Subtopic 835-30) Presentation and Subsequent Measurement of Debt Issuance Costs Associated with Line-of-Credit Arrangements" (ASU 2015-15). The guidance in ASU 2015-03 does not address presentation or subsequent measurement of debt issuance costs related to line of credit arrangements. Given the absence of authoritative guidance, in ASU 2015-15, FASB adopted SEC staff comments that they would not object to an entity deferring and presenting debt issuance costs as an asset and subsequently amortizing the deferred debt issuance costs ratably over the term of the line of credit arrangement, regardless of whether there are any outstanding borrowings on the line of credit arrangement. ASU 2015-03 and 2015-15 are both effective for fiscal years beginning after December 15, 2015. The amendments are required to be applied retrospectively to all prior periods presented and early adoption is permitted. The Company elected to early adopt ASU 2015-03 in fiscal 2016 first quarter and ASU 2015-15 in fiscal 2016 third quarter. Adoption of this guidance in fiscal 2013 had no materialdid not have a significant impact on the Company's consolidated financial statements.statements, or results of operations for the period since there were no prior period costs it applied to. Debt issuance costs associated with the credit facility discussed further in Note 10 Financing Arrangements have been presented as an asset and are being amortized ratably over the term of the line of credit arrangement.
Pending
In April 2014 the FASB issued ASU No. 2014-08, "Presentation of Financial Statements (Topic 205) and Property, Plant, and Equipment (Topic 360): Reporting Discontinued Operations and Disclosures of Disposals of Components of an Entity" (ASU No. 2014-08). ASU No. 2014-08 changes the criteria for determining which disposals should be presented as discontinued operations and modifies the related disclosure requirements. Additionally, this guidance requires that a business that qualifies as held for sale upon acquisition should be reported as discontinued operations. This guidance became effective for the Company on February 1, 2015 and applies prospectively to new disposals and new classifications of disposal groups as held for sale after the effective date. The adoption of this guidance did not have an impact on the Company's consolidated financial statements, results of operations, or disclosures.
In addition to the accounting pronouncements adopted and described above, the Company adopted various other accounting pronouncements that became effective in fiscal 2016. None of this guidance had a significant impact on the Company's consolidated financial statements, results of operations, or disclosures for the period.
New Accounting Standards Not Yet Adopted
AtIn February 2016 the FASB issued ASU No. 2016-02, "Leases (Topic 842)" (ASU 2016-02). The primary difference between previous GAAP and ASU 2016-02 is the recognition of lease assets and lease liabilities by lessees for those leases classified as operating leases under previous GAAP. The guidance requires a lessee to recognize in the statement of financial position a liability to make lease payments (the lease liability) and a right-of-use asset representing its right to use the underlying asset for the lease term. When measuring assets and liabilities arising from a lease, a lessee (and a lessor) should include payments to be made in optional periods only if the lessee is reasonably certain to exercise an option to extend the lease or not to exercise an option to terminate the lease. Similarly, optional payments to purchase the underlying asset should be included in the measurement of lease assets and lease liabilities only if the lessee is reasonably certain to exercise that purchase option. For leases with a term of 12 months or less, a lessee is permitted to make an accounting policy election by class of underlying asset not to recognize lease assets and lease liabilities. If a lessee makes this election, it should recognize lease expense for such leases generally on a straight-line basis over the lease term. ASU 2016-02 is effective for fiscal years beginning after December 15, 2018. Lessees and lessors are required to recognize and measure leases at the beginning of the earliest period presented using a modified retrospective approach. The modified retrospective approach includes a number of optional practical expedients that entities may elect to apply. An entity that elects to apply the practical expedients will, in effect, continue to account for leases that commence before the effective date in accordance with previous GAAP unless the lease is modified, except that lessees are required to recognize a right-of-use asset and a lease liability for all operating leases at each reporting date based on the present value of the remaining minimum rental payments that were tracked and disclosed under previous GAAP. The Company is evaluating the impact the adoption of this guidance will have on its consolidated financial statements, results of operations, and disclosures.
In January 31, 2013 there are noof 2016, the FASB issued ASU No. 2016-01, "Financial Instruments-Overall (Subtopic 825-10): Recognition and Measurement of Financial Assets and Financial Liabilities." The updated accounting pronouncements pendingguidance requires changes to the reporting model for financial instruments. The amendments in this guidance supersede the guidance to classify equity securities with readily
determinable fair values into different categories (that is, trading or available-for sale) and require equity securities (including other ownership interests, such as partnerships, unincorporated joint ventures, and limited liability companies to be measured at fair value with changes in the fair value recognized through net income. An entity’s equity investments that are accounted for under the equity method of significance,accounting or potential significance,result in consolidation of an investee are not included within the scope of this update. The amendments also require separate presentation of financial assets and financial liabilities by measurement category and form of financial asset (that is, securities or loans and receivables) on the balance sheet or in the accompanying notes to the Company.financial statements. This guidance is effective for fiscal years beginning after December 15, 2017, including interim periods within those fiscal years. Early application guidance is provided by the update but except as discussed in the guidance, early adoption is not permitted. The Company is currently evaluating the effect the updated guidance will have on the Company's financial statements, results of operations, and disclosures.
In November 2015 the FASB issued ASU No. 2015-17, "Income Taxes (Topic 740) Balance Sheet Classification of Deferred Taxes" (ASU 2015-17). Current GAAP requires the deferred taxes for each jurisdiction (or tax-paying component of a jurisdiction) to be presented as a net current asset or liability and net noncurrentasset or liability. This requires a jurisdiction-by-jurisdiction analysis based on the classification of the assets and liabilities to which the underlying temporary differences relate, or, in the case of loss or credit carryforwards, based on the period in which the attribute is expected to be realized. Any valuation allowance is then required to be allocated on a pro rata basis, by jurisdiction, between current and noncurrent deferred tax assets. To simplify presentation, ASU 2015-17 requires that all deferred tax assets and liabilities, along with any related valuation allowance, be classified as noncurrent on the balance sheet. As a result, each jurisdiction will now only have one net noncurrent deferred tax asset or liability. The guidance does not change the existing requirement that only permits offsetting within a jurisdiction - that is, companies are still prohibited from offsetting deferred tax liabilities from one jurisdiction against deferred tax assets of another jurisdiction. ASU 2015-17 is effective for fiscal years beginning after December 15, 2016. The Company may apply the standard either prospectively to all deferred tax liabilities and assets or retrospectively to all periods presented. Early adoption is permitted. The Company is evaluating the impact the adoption of this guidance will have on its consolidated financial statements and working capital.
In September 2015 the FASB issued ASU No. 2015-16, "Business Combinations (Topic 805) Simplifying the Accounting for Measurement-Period Adjustments" (ASU 2015-16). The amendments in ASU 2015-16 apply to all entities that have reported provisional amounts for items in a business combination for which the accounting is incomplete by the end of the reporting period in which the combination occurs and, during the measurement period, have an adjustment to provisional amounts recognized. ASU 2015-16 requires that an acquirer in a business combination recognize adjustments to provisional amounts that are identified during the measurement period in the reporting period in which the adjustment amounts are determined. ASU 2015-16 requires that the acquirer record, in the same period’s financial statements, the effect on earnings of changes in depreciation, amortization, or other income effects, if any, as a result of the change to the provisional amounts, calculated as if the accounting had been completed at the acquisition date. The amendments in this update require an entity to present separately on the face of the income statement, or disclose in the notes, the portion of the amount recorded in current-period earnings by line item that would have been recorded in previous reporting periods if the adjustment to the provisional amounts had been recognized as of the acquisition date. ASU 2015-16 is effective for fiscal years beginning after December 15, 2015, including interim periods within those fiscal years. ASU 2015-16 is to be applied prospectively to adjustments to provisional amounts that occur after the effective date of the update with earlier application permitted for financial statements that have not been issued. The Company is evaluating the impact the adoption of this guidance will have on its consolidated financial statements, results of operations, and disclosures.
In July 2015 the FASB issued ASU No. 2015-11, "Inventory (Topic 330) Simplifying the Measurement of Inventory" (ASU 2015-11). The amendments in ASU 2015-11 clarify that an entity should measure inventory within the scope of this update at the lower of cost and net realizable value. Net realizable value is the estimated selling prices in the ordinary course of business, less reasonably predictable costs of completion, disposal, and transportation. Substantial and unusual losses that result from subsequent measurement of inventory should be disclosed in the financial statements. ASU 2015-11 is effective for fiscal years beginning after December 15, 2016, including interim periods within those fiscal years. The amendments are to be applied prospectively with earlier application permitted as of the beginning of an interim or annual reporting period. The Company is evaluating the impact the adoption of this guidance will have on its consolidated financial statements, results of operations, and disclosures.
In April 2015 the FASB issued ASU No. 2015-05, "Intangibles-Goodwill and Other-Internal-Use Software (Subtopic 350-40) Customer’s Accounting for Fees Paid in a Cloud Computing Arrangement" (ASU 2015-05). The amendments in ASU 2015-05 clarify existing GAAP guidance about a customer’s accounting for fees paid in a cloud computing arrangement with or without a software license. Examples of cloud computing arrangements include software as a service, platform as a service, infrastructure as a service, and other similar hosting arrangements. ASU 2015-05 adds guidance to Subtopic 350-40, Intangibles-Goodwill and Other-Internal-Use Software, which will help entities evaluate the accounting for fees paid by a customer in a cloud computing arrangement. If a cloud computing arrangement includes a software license, then the customer should account for the software license element of the arrangement consistent with the acquisition of other software licenses. If a cloud computing arrangement
does not include a software license, the customer should account for the arrangement as a service contract. The guidance does not change GAAP for a customer’s accounting for service contracts. All software licenses within the scope of Subtopic 350-40 will be accounted for consistent with other licenses of intangible assets. ASU 2015-05 is effective for fiscal years beginning after December 15, 2015. The amendments may be applied prospectively to all arrangements entered into or materially altered after the effective date or retrospectively to all prior periods presented. Early adoption is permitted. The Company is evaluating the impact the adoption of this guidance will have on its consolidated financial position, results of operations, and cash flows.
In February 2015 the FASB issued ASU No. 2015-02, "Consolidation (Topic 810) Amendments to the Consolidation Analysis" (ASU 2015-02). The amendments in ASU 2015-02 affect reporting entities that are required to evaluate whether they should consolidate certain legal entities. All legal entities are subject to reevaluation under the revised consolidation model. Specifically, the amendments: 1. Modify the evaluation of whether limited partnerships and similar legal entities are variable interest entities (VIEs) or voting interest entities; 2. Eliminate the presumption that a general partner should consolidate a limited partnership; 3. Affect the consolidation analysis of reporting entities that are involved with VIEs, particularly those that have fee arrangements and related party relationships; and 4. Provide a scope exception from consolidation guidance for reporting entities with interests in legal entities that are required to comply with or operate in accordance with requirements that are similar to those in Rule 2a-7 of the Investment Company Act of 1940. ASU 2015-02 is effective for fiscal years beginning after December 15, 2015. Early adoption is permitted. ASU 2015-02 may be applied retrospectively or using a modified retrospective approach. The Company is evaluating the impact of this guidance on its consolidated legal entities and on its consolidated financial position, results of operations, and cash flows.
In May 2014 the FASB issued ASU No. 2014-09, "Revenue from Contracts with Customers" (ASU 2014-09). ASU 2014-09 provides a comprehensive new recognition model that requires recognition of revenue when a company transfers promised goods or services to customers in an amount that reflects the consideration to which the company expects to receive in exchange for those goods or services. This guidance supersedes the revenue recognition requirements in FASB ASC Topic 605, “Revenue Recognition,” and most industry-specific guidance. ASU 2014-09 defines a five-step process to achieve this core principle and, in doing so, companies will need to use more judgment and make more estimates than under the current guidance. It also requires additional disclosure about the nature, amount, timing, and uncertainty of revenue and cash flows arising from customer contracts. In August 2015, the FASB approved a one-year deferral of the effective date (ASU 2015-14) and the standard is now effective for the Company for fiscal 2019 and interim periods therein. ASU 2014-09 may be adopted as of the original effective date, which for the Company is fiscal 2018. The guidance may be applied using either of the following transition methods: (i) a full retrospective approach reflecting the application of the standard in each prior reporting period with the option to elect certain practical expedients or (ii) a retrospective approach with the cumulative effect of initially adopting ASU 2014-09 recognized at the date of adoption (which includes additional footnote disclosures). The Company is currently evaluating the method and date of adoption and the impact the adoption of ASU 2014-09 will have on the Company’s consolidated financial position, results of operations, and disclosures.
FORWARD-LOOKING STATEMENTS
Certain statements contained in this report are “forward-looking statements” within the meaning of Section 27A of the Securities Act of 1933, as amended, and Section 21E of the Securities Exchange Act of 1934, as amended, including statements regarding the expectations, beliefs, intentions or strategies regarding the future. Without limiting the foregoing, the words “anticipates,” “believes,” “expects,” “intends,” “may,” “plans” and similar expressions are intended to identify forward-looking statements. The Company intends that all forward-looking statements be subject to the safe harbor provisions of the Private Securities Litigation Reform Act. Although the Company believes that the expectations reflected in such forward-looking statements are based on reasonable assumptions, there is no assurance that such assumptions are correct or that these expectations will be achieved. Such
assumptionsAssumptions involve important risks and uncertainties that could significantly affect results in the future. These risks and uncertainties include, but are not limited to, those relating to weather conditions and commodity prices, which could affect certainsales and profitability in some of the Company's primary markets, such as agriculture and construction and oil and gas well drilling; or changes in competition, raw material availability, technology or relationships with the Company's largest customers, risks and uncertainties relating to development of new technologies to satisfy customer requirements, possible development of competitive technologies, ability to scale production of new products without negatively impacting quality and cost, risks of operating in foreign markets, risks relating to acquisitions, including risks of integration or unanticipated liabilities or contingencies, and ability to finance investment and working capital needs for new development projects, any of which could adversely impact any of the Company's product lines, as well as other risks described below.in Item 1A., Risk Factors, of this Annual Report on Form 10-K. The foregoing list is not exhaustive and the Company disclaims any obligation to subsequently revise any forward-looking statements to reflect events or circumstances after the date of such statements. Past financial performance may not be a reliable indicator of future performance and historical trends should not be used to anticipate results or trends in future periods.
|
| |
| ITEM 7A. | QUANTITATIVE AND QUALITATIVE DISCLOSURES ABOUT MARKET RISK |
The exposure to market risks pertains mainly to changes in interest rates on cash and cash equivalents and short-term investments. The Company has no debt outstanding as of January 31, 2013.2016. The Company does not expect operating results or cash flows to be significantly affected by changes in interest rates. Additionally, the Company does not enter into derivatives or other financial instruments for trading or speculative purposes. However, the Company does utilize derivative financial instruments to manage the economic impact of fluctuation in foreign currency exchange rates on those transactions that are denominated in currency other than its functional currency, which is the U.S. dollar. The use of these financial instruments had no material effect on the Company's financial condition, results of operations or cash flows.
The Company's subsidiaries that operate outside the United States use their local currency as the functional currency. The functional currency is translated into U.S. dollars for balance sheet accounts using the period-end exchange rates, and average exchange rates for the statement of income. Adjustments resulting from financial statement translations are included as cumulative translation adjustments in "Accumulated other comprehensive income (loss)" within shareholders' equity. Foreign currency transaction gains or losses are recognized in the period incurred and are included in "Other income (expense), net" in the Consolidated Statements of Income and Comprehensive Income. Foreign currency fluctuations had no material effect on the Company's financial condition, results of operations, or cash flows.
The Company does not enter into derivatives or other financial instruments for trading or speculative purposes. However, the Company does utilize derivative financial instruments to manage the economic impact of fluctuation in foreign currency exchange rates on those transactions that are denominated in currency other than its functional currency, which is the U.S. dollar. Such transactions are principally Canadian dollar-denominated transactions. The use of these financial instruments had no material effect on the Company's financial condition, results of operations, or cash flows.
|
| | | |
| ITEM 8. | FINANCIAL STATEMENTS AND SUPPLEMENTARY DATA | | |
| | | | |
| Index to Financial Statements | |
| | | | |
| | | | Page(s)Page |
| Management's Report on Internal Control Over Financial Reporting | | |
| Report of Independent Registered Public Accounting Firm | | |
| Consolidated Financial Statements | | |
| | Consolidated Balance Sheets | | |
| | Consolidated Statements of Income and Comprehensive Income | | |
| | Consolidated Statements of Shareholders' Equity | | |
| | Consolidated Statements of Cash Flows | | |
| | Notes to Consolidated Financial Statements | | |
| Quarterly Information (Unaudited) - included in Item 5 | | |
| | | | |
MANAGEMENT'S REPORT ON INTERNAL CONTROL OVER FINANCIAL REPORTING
Our management is responsible for establishing and maintaining effective internal control over financial reporting as defined in Rule 13a-15(f) of the Securities Exchange Act of 1934. Our internal control over financial reporting is designed to provide reasonable assurance regarding the reliability of financial reporting and the preparation of financial statements for external purposes in accordance with generally accepted accounting principles.
Our internal control over financial reporting includes those policies and procedures that (i) pertain to the maintenance of records that, in reasonable detail, accurately and fairly reflect the transactions and dispositions of our assets; (ii) provide reasonable assurance that transactions are recorded as necessary to permit preparation of financial statements in accordance with generally accepted accounting principles and that our receipts and expenditures are being made only in accordance with authorizations of our management and directors; and (iii) provide reasonable assurance regarding prevention or timely detection of unauthorized acquisition, use, or disposition of our assets that could have a material effect on the financial statements.
Because of its inherent limitations, internal control over financial reporting may not prevent or detect misstatements. Also, projections of any evaluation of effectiveness to future periods are subject to the risk that controls may become inadequate because of changes in conditions, or that the degree of compliance with the policies or procedures may deteriorate.
Management has assessed effectiveness of the Company's internal control over financial reporting as of January 31, 2013.2016. In making thisits assessment itof effectiveness of internal control over financial reporting, management used the criteria described by the Committee of Sponsoring Organizations of the Treadway Commission in Internal Control - Integrated Framework(2013). Based on this assessment using those criteria, , we concluded that, as of January 31, 2013,2016, the Company's internal control over financial reporting was effective.effective at a reasonable assurance level.
The effectiveness of our internal control over financial reporting as of January 31, 20132016 has been audited by PricewaterhouseCoopers LLP, an independent registered public accounting firm, as stated in their report, which appears on the next page.
|
| | |
| /s/ DANIEL A. RYKHUS | | /s/ THOMAS IACARELLASTEVEN E. BRAZONES |
| Daniel A. Rykhus | | Thomas IacarellaSteven E. Brazones |
President &and Chief Executive Officer | | Vice President &and Chief Financial Officer |
March 28, 201329, 2016
REPORT OF INDEPENDENT REGISTERED PUBLIC ACCOUNTING FIRM
To the Board of Directors and Shareholders of Raven Industries, Inc.:
In our opinion, the accompanying consolidated balance sheets and the related consolidated statements of income and comprehensive income, of shareholders'shareholders’ equity and of cash flows present fairly, in all material respects, the financial position of Raven Industries, Inc. and its subsidiariesat January 31, 2013, 20122016, 2015, and 2011,2014, and the results of theiroperations and their cash flows for each of the three years in the period ended January 31, 20162013in conformity with accounting principles generally accepted in the United States of America. In addition, in our opinion, the financial statement schedule listed in the accompanying index appearing under Item 15 presents fairly, in all material respects, the information set forth therein when read in conjunction with the related consolidated financial statements. Also in our opinion, the Company maintained, in all material respects, effective internal control over financial reporting as of January 31, 2013,2016, based on criteria established in Internal Control - Integrated Framework (2013)issued by the Committee of Sponsoring Organizations of the Treadway Commission (COSO). The Company's management is responsible for these financial statements and financial statement schedule, for maintaining effective internal control over financial reporting and for its assessment of the effectiveness of internal control over financial reporting, included in Management's ReportManagement’s report on Internal Control over Financial Reporting. Our responsibility is to express opinions on these financial statements, on the financial statement schedule, and on the Company's internal control over financial reporting based on our integrated audits. We conducted our audits in accordance with the standards of the Public Company Accounting Oversight Board (United States). Those standards require that we plan and perform the audits to obtain reasonable assurance about whether the financial statements are free of material misstatement and whether effective internal control over financial reporting was maintained in all material respects. Our audits of the financial statements included examining, on a test basis, evidence supporting the amounts and disclosures in the financial statements, assessing the accounting principles used and significant estimates made by management, and evaluating the overall financial statement presentation. Our audit of internal control over financial reporting included obtaining an understanding of internal control over financial reporting, assessing the risk that a material weakness exists, and testing and evaluating the design and operating effectiveness of internal control based on the assessed risk. Our audits also included performing such other procedures as we considered necessary in the circumstances. We believe that our audits provide a reasonable basis for our opinions.
A company'scompany’s internal control over financial reporting is a process designed to provide reasonable assurance regarding the reliability of financial reporting and the preparation of financial statements for external purposes in accordance with generally accepted accounting principles. A company'scompany’s internal control over financial reporting includes those policies and procedures that (i) pertain to the maintenance of records that, in reasonable detail, accurately and fairly reflect the transactions and dispositions of the assets of the company; (ii) provide reasonable assurance that transactions are recorded as necessary to permit preparation of financial statements in accordance with generally accepted accounting principles, and that receipts and expenditures of the company are being made only in accordance with authorizations of management and directors of the company; and (iii) provide reasonable assurance regarding prevention or timely detection of unauthorized acquisition, use, or disposition of the company'scompany’s assets that could have a material effect on the financial statements.
Because of its inherent limitations, internal control over financial reporting may not prevent or detect misstatements. Also, projections of any evaluation of effectiveness to future periods are subject to the risk that controls may become inadequate because of changes in conditions, or that the degree of compliance with the policies or procedures may deteriorate.
/s/ PricewaterhouseCoopers LLP
Minneapolis, Minnesota
March 28, 201329, 2016
|
|
RAVEN INDUSTRIES, INC.
|
| CONSOLIDATED BALANCE SHEETS |
| (Dollars and shares in thousands, except per-share amounts) |
| | | | As of January 31, | As of January 31, |
| | 2013 | | 2012 | | 2011 | 2016 | | 2015 | | 2014 |
| ASSETS | | | | | | | | | | |
| Current assets | | | | | | | | | | |
| Cash and cash equivalents | $ | 49,353 |
| | $ | 25,842 |
| | $ | 37,563 |
| $ | 33,782 |
| | $ | 51,949 |
| | $ | 52,987 |
|
| Short-term investments | — |
| | — |
| | 1,000 |
| — |
| | 250 |
| | 250 |
|
| Accounts receivable, net | 56,303 |
| | 60,759 |
| | 39,967 |
| 38,069 |
| | 56,576 |
| | 54,643 |
|
| Inventories | 46,189 |
| | 54,756 |
| | 43,679 |
| 45,888 |
| | 55,152 |
| | 54,865 |
|
| Deferred income taxes | 3,107 |
| | 3,299 |
| | 2,733 |
| 3,110 |
| | 3,958 |
| | 3,372 |
|
| Other current assets | 1,796 |
| | 2,903 |
| | 3,239 |
| 4,884 |
| | 3,094 |
| | 3,288 |
|
| Total current assets | 156,748 |
| | 147,559 |
| | 128,181 |
| 125,733 |
| | 170,979 |
| | 169,405 |
|
| | | | | | | | | | | |
| Property, plant and equipment, net | 81,238 |
| | 61,894 |
| | 41,522 |
| 116,162 |
| | 117,513 |
| | 98,076 |
|
| Goodwill | 22,274 |
| | 22,274 |
| | 10,777 |
| 44,756 |
| | 52,148 |
| | 22,274 |
|
| Amortizable intangible assets, net | 8,681 |
| | 9,412 |
| | 1,585 |
| 15,832 |
| | 18,490 |
| | 8,156 |
|
| Other assets, net | 4,269 |
| | 4,564 |
| | 5,695 |
| |
| Other assets | | 4,127 |
| | 3,743 |
| | 3,908 |
|
| TOTAL ASSETS | $ | 273,210 |
| | $ | 245,703 |
| | $ | 187,760 |
| $ | 306,610 |
| | $ | 362,873 |
| | $ | 301,819 |
|
| | | | | | | | | | | |
| LIABILITIES AND SHAREHOLDERS' EQUITY | | | | | | | | | | |
| Current liabilities | | | | | | | | | | |
| Accounts payable | $ | 14,438 |
| | $ | 16,162 |
| | $ | 16,715 |
| $ | 6,038 |
| | $ | 11,545 |
| | $ | 12,324 |
|
| Accrued liabilities | 17,192 |
| | 22,993 |
| | 16,096 |
| 12,042 |
| | 19,187 |
| | 16,248 |
|
| Customer advances | 1,431 |
| | 1,491 |
| | 1,524 |
| 739 |
| | 1,111 |
| | 1,247 |
|
| Total current liabilities | 33,061 |
| | 40,646 |
| | 34,335 |
| 18,819 |
| | 31,843 |
| | 29,819 |
|
| | | | | | | | | | | |
| Other liabilities | 18,702 |
| | 24,467 |
| | 12,211 |
| 18,926 |
| | 25,793 |
| | 20,538 |
|
| | | | | | | | | | | |
| Commitments and contingencies |
|
| |
|
| |
|
|
|
| |
|
| |
|
|
| | | | | | | | | | | |
| Shareholders' equity | | | | | | | | | | |
| Common stock, $1 par value, authorized shares 100,000; issued 65,223; 65,132; and 65,022, respectively | 65,223 |
| | 32,566 |
| | 32,511 |
| |
| Paid in capital | 5,885 |
| | 9,607 |
| | 7,060 |
| |
| Common stock, $1 par value, authorized shares 100,000; issued 67,006; 66,947; and 65,318, respectively | | 67,006 |
| | 66,947 |
| | 65,318 |
|
| Paid-in capital | | 54,830 |
| | 53,237 |
| | 10,556 |
|
| Retained earnings | 205,695 |
| | 193,650 |
| | 156,125 |
| 233,156 |
| | 244,180 |
| | 231,029 |
|
| Accumulated other comprehensive loss | (2,095 | ) | | (1,962 | ) | | (1,120 | ) | (3,501 | ) | | (5,849 | ) | | (2,179 | ) |
| Less treasury stock at cost, 28,897 shares | (53,362 | ) | | (53,362 | ) | | (53,362 | ) | |
| Less treasury stock at cost, 30,500; 28,897; and 28,897 shares, respectively | | (82,700 | ) | | (53,362 | ) | | (53,362 | ) |
| Total Raven Industries, Inc. shareholders' equity | 221,346 |
| | 180,499 |
| | 141,214 |
| 268,791 |
| | 305,153 |
| | 251,362 |
|
| Noncontrolling interest | 101 |
| | 91 |
| | — |
| 74 |
| | 84 |
| | 100 |
|
| Total shareholders' equity | 221,447 |
| | 180,590 |
| | 141,214 |
| 268,865 |
| | 305,237 |
| | 251,462 |
|
| TOTAL LIABILITIES AND SHAREHOLDERS' EQUITY | $ | 273,210 |
| | $ | 245,703 |
| | $ | 187,760 |
| $ | 306,610 |
| | $ | 362,873 |
| | $ | 301,819 |
|
| | | | | | | | | | | |
| The accompanying notes are an integral part of the consolidated financial statements. | | | | | | | | | | |
|
|
RAVEN INDUSTRIES, INC.
|
| CONSOLIDATED STATEMENTS OF INCOME AND COMPREHENSIVE INCOME |
| (Dollars in thousands, except per-share amounts) |
| | | | For the years ended January 31, | For the years ended January 31, |
| | 2013 | | 2012 | | 2011 | 2016 | | 2015 | | 2014 |
| Net sales | $ | 406,175 |
| | $ | 381,511 |
| | $ | 314,708 |
| $ | 258,229 |
| | $ | 378,153 |
| | $ | 394,677 |
|
| Cost of sales | 278,502 |
| | 265,319 |
| | 223,279 |
| 192,444 |
| | 274,907 |
| | 275,323 |
|
| Gross profit | 127,673 |
| | 116,192 |
| | 91,429 |
| 65,785 |
| | 103,246 |
| | 119,354 |
|
| | | | | | | | | | | |
| Research and development expenses | 13,367 |
| | 9,724 |
| | 7,604 |
| 14,686 |
| | 17,440 |
| | 16,576 |
|
| Selling, general and administrative expenses | 36,614 |
| | 30,827 |
| | 24,073 |
| 32,594 |
| | 42,005 |
| | 38,784 |
|
| Gain on disposition of assets | — |
| | — |
| | (451 | ) | |
| Goodwill impairment loss | | 7,413 |
| | — |
| | — |
|
| Operating income | 77,692 |
| | 75,641 |
| | 60,203 |
| 11,092 |
| | 43,801 |
| | 63,994 |
|
| | | | | | | | | | | |
| Other income (expense), net | (46 | ) | | 57 |
| | 79 |
| |
| Other (expense), net | | (310 | ) | | (300 | ) | | (371 | ) |
| Income before income taxes | 77,646 |
| | 75,698 |
| | 60,282 |
| 10,782 |
| | 43,501 |
| | 63,623 |
|
| | | | | | | | | | | |
| Income taxes | 25,091 |
| | 25,063 |
| | 19,745 |
| 2,221 |
| | 11,705 |
| | 20,721 |
|
| Net income | 52,555 |
| | 50,635 |
| | 40,537 |
| 8,561 |
| | 31,796 |
| | 42,902 |
|
| | | | | | | | | | | |
| Net income attributable to the noncontrolling interest | 10 |
| | 66 |
| | — |
| |
| Net income (loss) attributable to the noncontrolling interest | | 72 |
| | 63 |
| | (1 | ) |
| | | | | | | | | | | |
| Net income attributable to Raven Industries, Inc. | $ | 52,545 |
| | $ | 50,569 |
| | $ | 40,537 |
| $ | 8,489 |
| | $ | 31,733 |
| | $ | 42,903 |
|
| | | | | | | | | | | |
| Net income per common share: | | | | | | | | | | |
| ─ Basic | $ | 1.45 |
| | $ | 1.40 |
| | $ | 1.12 |
| $ | 0.23 |
| | $ | 0.86 |
| | $ | 1.18 |
|
| ─ Diluted | $ | 1.44 |
| | $ | 1.39 |
| | $ | 1.12 |
| $ | 0.23 |
| | $ | 0.86 |
| | $ | 1.17 |
|
| | | | | | | | | | | |
| | | | | | | | | | | |
| Comprehensive income: | | | | | | | | | | |
| Net income | $ | 52,555 |
| | $ | 50,635 |
| | $ | 40,537 |
| $ | 8,561 |
| | $ | 31,796 |
| | $ | 42,902 |
|
| | | | | | | | | | | |
| Other comprehensive income, net of tax: | | | | | | |
| Other comprehensive income (loss), net of tax: | | | | | | |
| Foreign currency translation | (3 | ) | | (38 | ) | | 127 |
| (729 | ) | | (1,466 | ) | | (424 | ) |
| Postretirement benefits, net of income tax of $70, $432 and $25, respectively | (130 | ) | | (804 | ) | | (46 | ) | |
| Postretirement benefits, net of income tax (expense) benefit of ($1,620), $1,187, and ($183), respectively | | 3,077 |
| | (2,204 | ) | | 340 |
|
| Other comprehensive income (loss), net of tax | (133 | ) | | (842 | ) | | 81 |
| 2,348 |
| | (3,670 | ) | | (84 | ) |
| | | | | | | | | | | |
| Comprehensive income | 52,422 |
| | 49,793 |
| | 40,618 |
| 10,909 |
| | 28,126 |
| | 42,818 |
|
| | | | | | | | | | | |
| Comprehensive income attributable to noncontrolling interest | 10 |
| | 66 |
| | — |
| |
| Comprehensive income (loss) attributable to noncontrolling interest | | 72 |
| | 63 |
| | (1 | ) |
| | | | | | | | | | | |
| Comprehensive income attributable to Raven Industries, Inc. | $ | 52,412 |
| | $ | 49,727 |
| | $ | 40,618 |
| $ | 10,837 |
| | $ | 28,063 |
| | $ | 42,819 |
|
| | | | | | | |
| The accompanying notes are an integral part of the consolidated financial statements. | The accompanying notes are an integral part of the consolidated financial statements. | | | The accompanying notes are an integral part of the consolidated financial statements. | | |
|
|
RAVEN INDUSTRIES, INC.
|
| CONSOLIDATED STATEMENTS OF SHAREHOLDERS' EQUITY |
| (Dollars and shares in thousands, except per-share amounts) |
| | | | | | | | | | |
| | | | | | | |
| | td Par Common Stock | Paid-in Capital | Treasury Stock | Retained Earnings | Accumulated Other Comprehensive Income (Loss) | Raven Industries, Inc. Equity | Non controlling Interest | Total Equity | td Par Common Stock | Paid-in Capital | Treasury Stock | Retained Earnings | Accumulated Other Comprehen-sive Income (Loss) | Raven Industries, Inc. Equity | Non-controlling Interest | Total Equity |
| | Shares | Cost | Shares | | Cost |
| Balance January 31, 2010 | $ | 32,478 |
| $ | 5,604 |
| (14,449 | ) | $ | (53,362 | ) | $ | 149,732 |
| $ | (1,201 | ) | $ | 133,251 |
| $ | — |
| $ | 133,251 |
| |
| Balance January 31, 2013 | | $ | 65,223 |
| $ | 5,885 |
| 28,897 |
| | $ | (53,362 | ) | $ | 205,695 |
| $ | (2,095 | ) | $ | 221,346 |
| $ | 101 |
| $ | 221,447 |
|
| Net income | — |
| — |
| — |
| — |
| 40,537 |
| — |
| 40,537 |
| — |
| 40,537 |
| — |
| — |
| — |
| | — |
| 42,903 |
| — |
| 42,903 |
| (1 | ) | 42,902 |
|
| Other comprehensive income (loss), net of income tax | — |
| — |
| — |
| — |
| — |
| 81 |
| 81 |
| — |
| 81 |
| — |
| — |
| — |
| | — |
| — |
| (84 | ) | (84 | ) | — |
| (84 | ) |
| Cash dividends ($0.32 per share) | — |
| 17 |
| — |
| — |
| (11,563 | ) | — |
| (11,546 | ) | — |
| (11,546 | ) | |
| Cash dividends (special - $0.625 per share) | — |
| 32 |
| — |
| — |
| (22,581 | ) | — |
| (22,549 | ) | — |
| (22,549 | ) | |
| Stock surrendered upon exercise of stock options | (79 | ) | (3,038 | ) | — |
| — |
| — |
| — |
| (3,117 | ) | — |
| (3,117 | ) | |
| Employees' stock options exercised | 112 |
| 3,257 |
| — |
| — |
| — |
| — |
| 3,369 |
| — |
| 3,369 |
| |
| Cash dividends ($0.48 per share) | | — |
| 104 |
| — |
| | — |
| (17,569 | ) | — |
| (17,465 | ) | — |
| (17,465 | ) |
| Shares issued on stock options exercised, net of shares withheld for employee taxes | | 95 |
| 70 |
| — |
| | — |
| — |
| — |
| 165 |
| — |
| 165 |
|
| Share-based compensation | — |
| 1,179 |
| — |
| — |
| — |
| — |
| 1,179 |
| — |
| 1,179 |
| — |
| 4,198 |
| — |
| | — |
| — |
| — |
| 4,198 |
| — |
| 4,198 |
|
| Tax benefit from exercise of stock options | — |
| 9 |
| — |
| — |
| — |
| — |
| 9 |
| — |
| 9 |
| — |
| 299 |
| — |
| | — |
| — |
| — |
| 299 |
| — |
| 299 |
|
| Balance January 31, 2011 | 32,511 |
| 7,060 |
| (14,449 | ) | (53,362 | ) | 156,125 |
| (1,120 | ) | 141,214 |
| — |
| 141,214 |
| |
| Balance January 31, 2014 | | 65,318 |
| 10,556 |
| 28,897 |
| | (53,362 | ) | 231,029 |
| (2,179 | ) | 251,362 |
| 100 |
| 251,462 |
|
| Net income | — |
| — |
| — |
| — |
| 50,569 |
| — |
| 50,569 |
| 66 |
| 50,635 |
| — |
| — |
| — |
| | — |
| 31,733 |
| — |
| 31,733 |
| 63 |
| 31,796 |
|
| Other comprehensive income (loss), net of income tax | — |
| — |
| — |
| — |
| — |
| (842 | ) | (842 | ) | — |
| (842 | ) | — |
| — |
| — |
| | — |
| — |
| (3,670 | ) | (3,670 | ) | — |
| (3,670 | ) |
| Cash dividends ($0.36 per share) | — |
| 19 |
| — |
| — |
| (13,044 | ) | — |
| (13,025 | ) | — |
| (13,025 | ) | |
| Cash dividends ($0.50 per share) | | — |
| 142 |
| — |
| | — |
| (18,582 | ) | — |
| (18,440 | ) | — |
| (18,440 | ) |
| Dividends of less than wholly-owned subsidiary paid to noncontrolling interest | | — |
| — |
| — |
| | — |
| — |
| — |
| — |
| (79 | ) | (79 | ) |
| Shares issued in connection with business combination (net of issuance costs of $38) | | 1,542 |
| 37,672 |
| — |
| | — |
| — |
| — |
| 39,214 |
| — |
| 39,214 |
|
| Director shares issued | 7 |
| (7 | ) | — |
| — |
| — |
| — |
| — |
| — |
| — |
| 18 |
| (18 | ) | — |
| | — |
| — |
| — |
| — |
| — |
| — |
|
| Stock surrendered upon exercise of stock options | (37 | ) | (2,089 | ) | — |
| — |
| — |
| — |
| (2,126 | ) | — |
| (2,126 | ) | |
| Employees' stock options exercised | 84 |
| 2,413 |
| — |
| — |
| — |
| — |
| 2,497 |
| — |
| 2,497 |
| |
| Shares issued on stock options exercised, net of shares withheld for employee taxes | | 69 |
| 572 |
| — |
| | — |
| — |
| — |
| 641 |
| — |
| 641 |
|
| Share-based compensation | 1 |
| 1,921 |
| — |
| — |
| — |
| — |
| 1,922 |
| — |
| 1,922 |
| — |
| 4,213 |
| — |
| | — |
| — |
| — |
| 4,213 |
| — |
| 4,213 |
|
| Tax benefit from exercise of stock options | — |
| 290 |
| — |
| — |
| — |
| — |
| 290 |
| — |
| 290 |
| — |
| 100 |
| — |
| | — |
| — |
| — |
| 100 |
| — |
| 100 |
|
| Noncontrolling capital contribution | — |
| — |
| — |
| — |
| — |
| — |
| — |
| 25 |
| 25 |
| |
| Balance January 31, 2012 | 32,566 |
| 9,607 |
| (14,449 | ) | (53,362 | ) | 193,650 |
| (1,962 | ) | 180,499 |
| 91 |
| 180,590 |
| |
| Balance January 31, 2015 | | 66,947 |
| 53,237 |
| 28,897 |
| | (53,362 | ) | 244,180 |
| (5,849 | ) | 305,153 |
| 84 |
| 305,237 |
|
| Net income | — |
| — |
| — |
| — |
| 52,545 |
| — |
| 52,545 |
| 10 |
| 52,555 |
| — |
| — |
| — |
| | — |
| 8,489 |
| — |
| 8,489 |
| 72 |
| 8,561 |
|
| Other comprehensive income (loss), net of income tax | — |
| — |
| — |
| — |
| — |
| (133 | ) | (133 | ) | — |
| (133 | ) | |
| Cash dividends ($0.42 per share) | — |
| 63 |
| — |
| — |
| (15,307 | ) | — |
| (15,244 | ) | — |
| (15,244 | ) | |
| Two-for-one stock split | 32,598 |
| (7,405 | ) | (14,448 | ) | — |
| (25,193 | ) | — |
| — |
| — |
| — |
| |
| Stock surrendered upon exercise of stock options | (36 | ) | (2,215 | ) | — |
| — |
| — |
| — |
| (2,251 | ) | — |
| (2,251 | ) | |
| Employees' stock options exercised | 95 |
| 2,503 |
| — |
| — |
| — |
| — |
| 2,598 |
| — |
| 2,598 |
| |
| Other comprehensive income, net of income tax | | — |
| — |
| — |
| | — |
| — |
| 2,348 |
| 2,348 |
| — |
| 2,348 |
|
| Cash dividends ($0.52 per share) | | — |
| 169 |
| — |
| | — |
| (19,513 | ) | — |
| (19,344 | ) | — |
| (19,344 | ) |
| Dividends of less than wholly-owned subsidiary paid to noncontrolling interest | | — |
| — |
| — |
| | — |
| — |
| — |
| — |
| (82 | ) | (82 | ) |
| Share issuance costs related to fiscal 2015 business combination | | — |
| (15 | ) | — |
| | — |
| — |
| — |
| (15 | ) | — |
| (15 | ) |
| Shares issued on stock options exercised, net of shares withheld for employee taxes | | 7 |
| (54 | ) | — |
| | — |
| — |
| — |
| (47 | ) | — |
| (47 | ) |
| Shares issued on vesting of stock units, net of shares withheld for employee taxes | | 52 |
| (510 | ) | | | | (458 | ) | — |
| (458 | ) |
| Shares repurchased | | — |
| — |
| 1,603 |
| | (29,338 | ) | — |
| — |
| (29,338 | ) | — |
| (29,338 | ) |
| Share-based compensation | — |
| 3,075 |
| — |
| — |
| — |
| — |
| 3,075 |
| — |
| 3,075 |
| — |
| 2,311 |
| — |
| | — |
| — |
| — |
| 2,311 |
| — |
| 2,311 |
|
| Tax benefit from exercise of stock options | — |
| 257 |
| — |
| — |
| — |
| — |
| 257 |
| — |
| 257 |
| |
| Balance January 31, 2013 | $ | 65,223 |
| $ | 5,885 |
| (28,897 | ) | $ | (53,362 | ) | $ | 205,695 |
| $ | (2,095 | ) | $ | 221,346 |
| $ | 101 |
| $ | 221,447 |
| |
| Income tax impact related to share-based compensation | | — |
| (308 | ) | — |
| | — |
| — |
| — |
| (308 | ) | — |
| (308 | ) |
| Balance January 31, 2016 | | $ | 67,006 |
| $ | 54,830 |
| 30,500 |
| | $ | (82,700 | ) | $ | 233,156 |
| $ | (3,501 | ) | $ | 268,791 |
| $ | 74 |
| $ | 268,865 |
|
| The accompanying notes are an integral part of the consolidated financial statements. | The accompanying notes are an integral part of the consolidated financial statements. | | The accompanying notes are an integral part of the consolidated financial statements. | |
|
|
RAVEN INDUSTRIES, INC.
|
| CONSOLIDATED STATEMENTS OF CASH FLOWS |
| (Dollars in thousands) |
| | | | For the years ended January 31, | For the years ended January 31, |
| | 2013 | | 2012 | | 2011 | 2016 | | 2015 | | 2014 |
| OPERATING ACTIVITIES: | | | | | | | | | | |
| Net income | $ | 52,555 |
| | $ | 50,635 |
| | $ | 40,537 |
| $ | 8,561 |
| | $ | 31,796 |
| | $ | 42,902 |
|
| Adjustments to reconcile net income to net cash provided by operating activities: | | | | | | | | | | |
| Depreciation | 11,496 |
| | 8,180 |
| | 6,512 |
| 13,951 |
| | 14,761 |
| | 12,449 |
|
| Amortization of intangible assets | 1,602 |
| | 1,088 |
| | 1,119 |
| 3,658 |
| | 2,608 |
| | 1,746 |
|
| Gain on disposition of assets | — |
| | — |
| | (451 | ) | |
| Gain on acquistion-related contingent liability settlement | (508 | ) | | — |
| | — |
| |
| Goodwill impairment loss | | 7,413 |
| | — |
| | — |
|
| Change in fair value of acquisition-related contingent consideration | 784 |
| | (14 | ) | | 274 |
| (721 | ) | | 714 |
| | 540 |
|
| Income from equity investment | (156 | ) | | (156 | ) | | (195 | ) | (83 | ) | | (28 | ) | | (116 | ) |
| Deferred income taxes | (1,803 | ) | | 5,358 |
| | 423 |
| (3,021 | ) | | (958 | ) | | 623 |
|
| Share-based compensation expense | 3,075 |
| | 1,922 |
| | 1,179 |
| 2,311 |
| | 4,213 |
| | 4,198 |
|
| Change in operating assets and liabilities | 9,199 |
| | (23,076 | ) | | (7,273 | ) | 9,847 |
| | 7,973 |
| | (10,449 | ) |
| Other operating activities, net | 212 |
| | (106 | ) | | (40 | ) | 2,092 |
| | (996 | ) | | 943 |
|
| Net cash provided by operating activities | 76,456 |
| | 43,831 |
| | 42,085 |
| 44,008 |
| | 60,083 |
| | 52,836 |
|
| | | | | | | | | | | |
| INVESTING ACTIVITIES: | | | | | | | | | | |
| Capital expenditures | (29,675 | ) | | (29,015 | ) | | (13,972 | ) | (13,046 | ) | | (17,041 | ) | | (30,701 | ) |
| Payments related to business acquisitions, net of cash acquired | — |
| | (11,787 | ) | | (399 | ) | |
| Sales of short-term investments | — |
| | 1,000 |
| | 3,700 |
| |
| Purchases of short-term investments | — |
| | — |
| | (1,700 | ) | |
| Proceeds from disposition of assets | — |
| | — |
| | 888 |
| |
| Proceeds (payments) related to business acquisitions | | 351 |
| | (12,472 | ) | | — |
|
| Proceeds from sale of short-term investments | | 250 |
| | 500 |
| | — |
|
| Purchases of investments | | (250 | ) | | (750 | ) | | (250 | ) |
| Proceeds from sale of assets | | 2,124 |
| | — |
| | — |
|
| Other investing activities, net | (255 | ) | | (511 | ) | | 65 |
| (503 | ) | | (223 | ) | | (664 | ) |
| Net cash used in investing activities | (29,930 | ) | | (40,313 | ) | | (11,418 | ) | (11,074 | ) | | (29,986 | ) | | (31,615 | ) |
| | | | | | | | | | | |
| FINANCING ACTIVITIES: | | | | | | | | | | |
| Dividends paid | (15,244 | ) | | (13,025 | ) | | (34,095 | ) | (19,426 | ) | | (18,519 | ) | | (17,465 | ) |
| Repayment of line of credit | — |
| | (2,869 | ) | | — |
| |
| Payments for common shares repurchased | | (29,338 | ) | | — |
| | — |
|
| Proceeds from revolving line of credit | | — |
| | 2,127 |
| | — |
|
| Payment of revolving line of credit and acquisition-related debt | | — |
| | (14,116 | ) | | — |
|
| Payment of acquisition-related contingent liabilities | (8,367 | ) | | — |
| | — |
| (814 | ) | | (533 | ) | | (353 | ) |
| Debt issuance costs paid | | (548 | ) | | — |
| | — |
|
| Restricted stock units vested and issued | | (458 | ) | | — |
| | — |
|
| Employee stock option exercises net of tax benefit | | (85 | ) | | 702 |
| | 464 |
|
| Other financing activities, net | 604 |
| | 660 |
| | 261 |
| (15 | ) | | (326 | ) | | — |
|
| Net cash used in financing activities | (23,007 | ) | | (15,234 | ) | | (33,834 | ) | (50,684 | ) | | (30,665 | ) | | (17,354 | ) |
| | | | | | | |
| Effect of exchange rate changes on cash | (8 | ) | | (5 | ) | | 46 |
| (417 | ) | | (470 | ) | | (233 | ) |
| | | | | | | |
| Net increase (decrease) in cash and cash equivalents | 23,511 |
| | (11,721 | ) | | (3,121 | ) | |
| Net (decrease) increase in cash and cash equivalents | | (18,167 | ) | | (1,038 | ) | | 3,634 |
|
| Cash and cash equivalents at beginning of year | 25,842 |
| | 37,563 |
| | 40,684 |
| 51,949 |
| | 52,987 |
| | 49,353 |
|
| Cash and cash equivalents at end of year | $ | 49,353 |
| | $ | 25,842 |
| | $ | 37,563 |
| $ | 33,782 |
| | $ | 51,949 |
| | $ | 52,987 |
|
| | | | | | | | | | | |
| The accompanying notes are an integral part of the consolidated financial statements. | | | | | | | | | | |
|
|
RAVEN INDUSTRIES, INC.
|
| NOTES TO CONSOLIDATED FINANCIAL STATEMENTS |
| (Dollars in thousands, except per-share amounts) |
NOTE 1 SUMMARY OF SIGNIFICANT ACCOUNTING POLICIES |
| |
| NOTE 1 | SUMMARY OF SIGNIFICANT ACCOUNTING POLICIES
|
Basis of Presentation and Principles of Consolidation
Raven Industries, Inc. (the Company or Raven) is a diversified technology company providing a variety of products to customers within the industrial, agricultural, energy, construction, and military/aerospacedefense markets. The Company includes six wholly-ownedconducts this business through the following direct and indirect subsidiaries: Aerostar International, Inc. (Aerostar); Vista Research, Inc. (Vista); Raven International Holding Company BV (Raven Holdings); Raven Industries Canada, Inc. (Raven Canada); SBG Innovatie BV; Navtronics BVBA; Raven Industries GmbH (Raven GmbH); Raven Industries Australia Pty Ltd (Raven Australia); and Raven Do Brazil Participacoes E Servicos Technicos LTDA (Raven Brazil); and Vista Research, Inc. (Vista). The Company and these subsidiaries comprise three unique operating units, or divisions, classified into reportable segments (Applied Technology, Engineered Films, and Aerostar).
The consolidated financial statements for the periods included herein have been prepared by Raventhe Company pursuant to the rules and regulations of the Securities and Exchange Commission (SEC). The accompanying consolidated financial statements include the accounts of Raventhe Company and its wholly-owned or controlled subsidiaries. All intercompany balances and transactions have been eliminated in consolidation.
Noncontrolling Interest
Noncontrolling interests represent capital contributions, income and loss attributable to the owners of less than wholly-owned and consolidated entities. During fiscal year 2012, theThe Company entered intoowns 75% of a business venture agreement to pursue potential product and support services contracts for agencies and instrumentalities of the United States government. The business venture, Aerostar Integrated Systems (AIS), is 75% owned by the Company and is included in the Aerostar business segment. No capital contributions were made by the noncontrolling interest since the initial capitalization.capitalization in fiscal year 2013. Given the Company's majority ownership interest, the accounts of the business venture have been consolidated with the accounts of the Company, and a noncontrolling interest has been recorded for the noncontrolling investor's interests in the net assets and operations of the business venture.
Investments in Affiliate
An affiliate investment over which theThe Company owns an interest of approximately 22% in Site-Specific Technology Development Group, Inc. (SST). The Company has significant influence, but neither a controlling interest nor a majority interest in the risks or rewards of the investee,SST and as such, this affiliate investment is accounted for using the equity method. The investment balance is included in “Other assets, net,”assets” while the Company's share of the investee'sSST’s results of operations is included in “Other income (expense), net.” The Company considers whether the value of any of its equity method investments has been impaired whenever adverse events or changes in circumstances indicate that recorded values may not be recoverable. If the Company considered any such decline to be other than temporary (based on various factors, including historical financial results, product development activities, and the overall health of the affiliate's industry), an impairment loss would be recorded.
Use of Estimates
Preparing the financial statements in conformity with accounting principles generally accepted in the United States of America (GAAP) requires management to make certain estimates and assumptions. These affect the reported amounts of assets and liabilities as of the date of the financial statements and the reported amounts of revenues and expenses during the reporting period. ActualThe Company's forecasts, based principally on estimates, are critical inputs to asset valuations such as those for inventory or goodwill. These assumptions and estimates require significant judgment and actual results could differ from these estimates.assumed and estimated amounts.
Foreign Currency
The Company's subsidiaries that operate outside the United States use the local currency as their functional currency. The functional currency is translated into U.S. dollars for balance sheet accounts using the period-end exchange rates and average exchange rates for the statement of income and comprehensive income. Adjustments resulting from financial statement translations are included as foreign currency translation adjustments in “Accumulated other comprehensive income (loss)” within shareholders' equity. Foreign currency transaction gains or losses are recognized in the period incurred and are included in “Other income (expense), net” in the Consolidated Statements of Income and Comprehensive Income. Foreign currency transaction gains or losses on intercompany notes receivable and notes payable denominated in foreign currencies for which settlement is not planned in the foreseeable future are considered part the net investment and are reported in the same manner as foreign currency translation adjustments.
(Dollars in thousands, except per-share amounts)
Cash and Cash Equivalents
The Company considers all highly liquid instruments with original maturities of three or fewer months to be cash equivalents. Cash and cash equivalent balances are principally concentrated in checking, money market, and savings accounts with Wells Fargo Bank, N.A.accounts. Certificates of deposit that mature in over 90 days but less than one year are considered short-term investments. Certificates of deposit that mature in one year or more are considered to be other long-term assets and are carried at cost.
(Dollars in thousands, except per-share amounts)
Accounts Receivable and Allowance for Doubtful Accounts
Trade accounts receivable are recorded at the invoiced amount, do not bear interest, and are considered past due based on invoice terms. Unbilled receivables arise when revenues have been earned, but not billed, and are related to differences in timing. The allowance for doubtful accounts is the Company'sCompany’s best estimate of the amount of probable credit losses. This is based on historical write-off experience by segment and an estimate of the collectability of any known problem accounts. Unbilled receivables arise when revenues have been earned, but not billed, and are related to differences in timing. Unbilled receivables were not material as of January 31, 2016, 2015, or 2014.
Inventory Valuation
Inventories are carried at the lower of cost or market, with cost determined on the first-in, first-out basis. Market value encompasses consideration of all business factors including expected future sales, price, contract terms, and usefulness.
Pre-Contract Costs
From time to time, the Company incurs costs to begin fulfilling the statement of work under a specific anticipated contract still being negotiated with the customer. If the Company determines that it is probable it will be awarded the specific anticipated contract, the pre-contract costs incurred, excluding start-up costs which are expensed as incurred, are deferred to the balance sheet and included in "Inventories". Deferred pre-contract costs are periodically reviewed and assessed for recoverability under the contract based on the Company’s assessment of the nature of the costs, the probability and timing of the award, and other relevant facts and circumstances. Write-offs of pre-contract costs are charged to cost of sales when it becomes probable that such costs will not be recoverable.
The Company recorded a charge of $2,933 for the write-off of pre-contract costs specific to one international contract that was not awarded to Vista in the third quarter of fiscal 2016. No deferred pre-contract costs were written-off in the periods ended January 31, 2015 or 2014. No pre-contract costs were included in "Inventories" at January 31, 2016 or January 31, 2015.
Property, Plant and Equipment
Property, plant and equipment areheld for use is carried at the asset's cost and are depreciated over the estimated useful liveslife of the asset. With the prospective adoption of the straight-line method of depreciation for manufacturing equipment, office equipment, and furniture and fixtures placed in service on or after February 1, 2015, the Company no longer primarily uses accelerated methods of computing depreciation. This change was made as a straight-line method of depreciation more accurately reflects the economic consumption of these assets usingthan did the accelerated methods. method previously used. This prospective change in the depreciation method did not have a material effect on the Company’s financial position or results of operations for the fiscal year ended January 31, 2016.
The estimated useful lives used for computing depreciation are as follows:
|
| |
| Building and improvements | 15 - 39 years |
| Manufacturing equipment by segment | |
| Applied Technology | 3 - 5 years |
| Engineered Films | 5 - 12 years |
| Aerostar | 3 - 5 years |
| Furniture, fixtures, office equipment, and other | 3 - 7 years |
The cost of maintenance and repairs is charged to expense in the period incurred, and renewals and betterments are capitalized. The cost and related accumulated depreciation of assets sold or disposed are removed from the accounts and the resulting gain or loss is reflected in operations.
The Company capitalizes certain internal costs incurred in connection with developing or obtaining internal-use software in accordance with the accounting guidance for such costs. CapitalizedThere were no capitalized software costs in fiscal year 2016 or 2015 and capitalized software costs totaled $7203 in fiscal 2013, $553 in fiscal 2012 and $1,280 in fiscal 20112014. The costs are included in “Property, plant and equipment, net” on the Consolidated Balance Sheets. Software costs that do not meet capitalization criteria are expensed as incurred. Amortization expense related to capitalized software is computed on the straight-line basis over the estimated lives ranging from 3 to 5 years and is included in depreciation.depreciation expense.
(Dollars in thousands, except per-share amounts)
Fair Value Measurements
Fair value is defined as an exit price representing the amount that would be received to sell an asset or paid to transfer a liability in an orderly transaction between market participants. As such, fair value is a market-based measurement that should be determined based on assumptions that market participants would use in pricing an asset or liability. The Company uses the established fair value hierarchy, which classifies or prioritizes the inputs used in measuring fair value. These classifications include:
Level 1 - Observable inputs such as quoted prices in active markets;
Level 2 - Inputs other than quoted prices in active markets that are either directly or indirectly observable; and
Level 3 - Unobservable inputs in which little or no market data exists, therefore, requiring an entity to develop its own assumptions.
The Company's financial assets required to be measured at fair value on a recurring basis include cash and cash equivalents.equivalents and short-term investments. The Company determines fair value of its cash equivalents and short-term investments through quoted market prices.
The Company's goodwill and long-lived assets, including intangible assets subject to amortization, are measured at fair value on a non-recurring basis. These valuations are derived from valuation techniques in which one or more significant inputs are not observable. Our accounting policy and methodology for assessing impairment of these assets is further described below and in the Critical Accounting Estimates section of the Management's Discussion and Analysis Critical Accounting Estimates.in Part 7 of this Annual Report on Form 10-K (Form 10-K).
For all acquisitions, the Company is required to measure the fair value of the net identifiable tangible and intangible assets acquired, excluding goodwill and deferred income taxes.acquired. In addition, the Company determines the estimated fair value of contingent consideration as of the acquisition date, and subsequently at the end of each reporting period. These valuations are derived from valuation techniques in which one or more significant inputs are not observable. Fair value measurements associated with acquisitions, including acquisition-related contingent liabilities, are described in Note 5.
#5 37
Acquisition of and Investments in Businesses and Technologies.
(Dollars in thousands, except per-share amounts)
Intangible Assets
Intangible assets, primarily comprised of technologies acquired through acquisition, are recorded at cost and are presented net of accumulated amortization. Amortization is computed either on ausing an amortization method that best approximates the pattern of economic benefits which the asset provides. The Company has used both the straight-line basis or undermethod and the undiscounted cash flows method
over the estimated useful lives ranging from 3 to 20 years. The straight-line method of amortization is used when it reflects an appropriate allocation ofappropriately allocate the cost of the intangible assets to earnings in each reporting period.
The straight-line method allocates the cost of such intangible assets ratably over the asset’s life. Under the undiscounted cash flow method, the estimated cash flow attributable to each year of an intangible asset’s life is calculated as a percentage of the total of the cash flows over the asset’s life and that percentage is applied to the initial value of the asset to determine the annual amortization to be recorded.
The estimated useful lives of the Company’s intangible assets range from 3 to 20 years.
Goodwill
RavenThe Company recognizes goodwill as the excess cost of an acquired business over the net amount assigned to assets acquired and liabilities assumed. For business combinations prior to February 1, 2009, earn-out payments to sellers are added to goodwill when payable under the terms of the purchase agreement. For business combinations after February 1, 2009,Acquisition earn-out payments are accrued at fair value as of the purchase date and payments reduce the accrual without affecting goodwill. Any change in the fair value of the contingent consideration after the acquisition date is recognized in the Consolidated Statements of Income and Comprehensive Income.
Goodwill is tested for impairment on an annual basis during the fourth quarter and between annual tests whenever a triggering event indicates there may be an impairment. Impairment tests of goodwill are performed at the reporting unit level. A qualitative impairment assessment over relevant events and circumstances may be assessed to determine whether it is more likely than not that the fair value of a reporting unit is less than its carrying amount. If events and circumstances indicate the fair value of a reporting unit ismay be less than its carrying value, then the fair values are estimated based on discounted cash flows and are compared with the corresponding carrying value of the reporting unit. If the fair value of the reporting unit is less than the carrying amount, the amount of the impairment loss must be measured and then recognized to the extent the carrying value of the goodwill exceeds the implied fair value. When performing goodwill impairment testing, the fair values of reporting units are determined based on valuation techniques using the best available information, primarily discounted cash flow projections. Such valuations are derived from valuation techniques in which one or more significant inputs are not observable (Level 3 fair value measures).
(Dollars in thousands, except per-share amounts)
Long-Lived Assets
The Company periodically assesses the recoverability of long-lived and intangible assets. An impairment loss is recognized when the carrying amount of an asset exceeds the estimated undiscounted cash flows used in determining the fair value of the assets. The amount of the impairment loss to be recorded is the excess of the carrying value of the asset over its fair value.
Long-lived assets determined to be held for sale and classified as such in accordance with the applicable guidance are reported as long-term assets at the lower of the asset's carrying amount or fair value less the estimated cost to sell. Depreciation is not recorded once a long-lived asset has been classified as held for sale.
Acquisition-Related Contingent Consideration
Acquisition-related contingent consideration represents an obligation of the Company to transfer additional assets or equity interests if specified future events occur or conditions are met. This contingency is accounted for at fair value either as a liability or equity depending on the terms of the acquisition agreement. The Company determines the estimated fair value of contingent consideration as of the acquisition date, and subsequently at the end of each reporting period. In doing so, the Company makes significant estimates and assumptions regarding future events or conditions being achieved under the subject contingent agreement as well as the appropriate discount rate to apply. Such valuations are derived from valuation techniques in which one or more significant inputs are not observable (Level 3 fair value measures).
Insurance Obligations
Raven employsThe Company utilizes insurance policies to cover workers' compensation and general liability costs. Liabilities are accrued related to claims filed and estimates for claims incurred but not reported. To the extent these obligations are expected to be reimbursed by insurance, the probable insurance policy benefit is included as a component of “Other current assets.”
Contingencies
The Company is involved as a defendant in lawsuits, claims, regulatory inquiries, or disputes arising in the normal course of business. While the ultimate settlement of these claims cannot be easily estimated, management believes that any liability resulting from these claims will, in many cases, be substantially covered by insurance. Management does not believe that the ultimate outcome of any pending matters will be material to its results of operations, financial position, or cash flows.
The Company also has contingencies related to potential asset impairments or contingent liabilities. An estimate of the loss on these matters is charged to operations when it is probable that an asset has been impaired or a liability has been incurred, and the amount of the loss can be reasonably estimated. While the settlement of any claims cannot be determined at this time, management believes that any liability resulting from these claims will be substantially covered by insurance. Accordingly, managementManagement does not believe that the ultimate outcome of these mattersany such contingent asset impairment or liability will have a significant impact onbe material to its results of operations, financial position, or cash flows.
Revenue Recognition
RavenThe Company recognizes revenue when it is realized or realizable and has been earned. Revenue is recognized when there is persuasive evidence of an arrangement, the sales price is determinable, collectability is reasonably assured, and shipment or delivery has occurred (depending on the terms of the sale). The Company sells directly to customers or distributors who incur the expense and commitment for any post-sale obligations beyond stated warranty terms. Estimated returns, sales allowances, or warranty charges are recognized upon shipment of a product.
For certain long-term, service-related contracts, the Company recognizes revenue under the percentage-of-completion method of accounting, whereby contract revenues are recognized on a pro-rata basis based upon the ratio of costs incurred compared to total estimated contract costs. Contract costs include labor, material, subcontracting costs, as well as allocation of indirect costs. Revenues including estimated profits are recorded as costs are incurred. Losses estimated to be incurred upon completion of contracts are charged to operations when they become known.
Certain contracts contain provisions for incentive payments that the Company may receive based on performance criteria related to product design, development and production standards. Revenue related to the incentive payments is recognized when ultimate realization by the Company is assured, which generally occurs when the provisions and performance criteria required by the contract are met.
(Dollars in thousands, except per-share amounts)
Operating Expenses
The primary types of operating expenses are classified in the income statement as follows:
(Dollars in thousands, except per-share amounts)
|
| | | | |
| Cost of sales | | Research and development expenses | | Selling, general and administrative expenses |
Direct material costs Material acquisition and handling costs Direct labor Factory overhead including depreciation and amortization Inventory obsolescence Product warranties Shipping and handling cost | | Personnel costs Professional service fees Material and supplies Facility allocation | | Personnel costs Professional service fees Advertising Promotions Information technology equipment depreciation Office supplies Facility allocation |
The Company's research and development expenditures consist primarily of internal direct and indirect costs associated with development of technologies to support its proprietary product lines in each of its divisions. These research and development costs are expensed as incurred.
The Company's gross margins may not be comparable to industry peers due to variability in the classification of these expenses across the industries in which the Company operates.
Warranties
Accruals necessary for product warranties are estimated based on historical warranty costs and average time elapsed between purchases and returns for each division. Additional accruals are made for any significant, discrete warranty issues.
Share-Based Compensation
The Company records compensation expense related to its share-based compensation plans using the fair value method. Under this method, the fair value of share-based compensation is determined as of the grant date and the related expense is recorded over the period in which the share-based compensation vests.
Income Taxes
Deferred income taxes reflect future tax effects of temporary differences between the tax and financial reporting basis of the Company's assets and liabilities measured using enacted tax laws and statutory tax rates applicable to the periods when the temporary differences will affect taxable income. When necessary, deferred tax assets are reduced by a valuation allowance to reflect realizable value. Accruals are maintained for uncertain tax positions.
Accounting Pronouncements
Accounting Standards Adopted
In July 2012April 2015 the Financial Accounting Standards Board (FASB) issued Accounting Standards Update (ASU) No. 2012-02, "Testing Indefinite-Lived Intangible Assets2015-04, "Compensation—Retirement Benefits (Topic 715) Practical Expedient for Impairment"the Measurement Date of an Employer’s Defined Benefit Obligation and Plan Assets" (ASU No. 2012-02)2015-04). The amendments in ASU No. 2012-02 is intended to reduce2015-04 allow a reporting entity that may incur more costs than other entities when measuring the cost and complexityfair value of testing indefinite-lived intangibleplan assets of a defined benefit pension or other postretirement benefit plan at other than goodwill for impairment. It allows Ravena month-end to perform a "qualitative" assessment to determine whether further impairment testing of indefinite-lived intangiblemeasure defined benefit plan assets and obligations using the month-end date that is necessary, similar in approachclosest to the goodwill impairment test. The revised guidancedate of event (such as a plan amendment, settlement, or curtailment that calls for a remeasurement in accordance with existing requirements) that is effectivetriggering the remeasurement. In addition, if a contribution or significant event occurs between the month-end date used to measure defined benefit plan assets and obligations and an entity’s fiscal year-end, the entity should adjust the measurement of defined benefit plan assets and obligations to reflect the effects of those contributions or significant events. However, an entity should not adjust the measurement of defined benefit plan assets and obligations for annualother events that occur between the month-end measurement and the entity’s fiscal year-end that are not caused by the entity (for example, changes in market prices or interest rates). This practical expedient for the measurement date also applies to significant events that trigger a remeasurement in an interim impairment tests performedperiod. An entity electing the practical expedient for the measurement date is required to disclose the accounting policy election and the date used to measure defined benefit plan assets and obligations in accordance with the amendments in ASU 2015-04. ASU 2015-04 is effective for fiscal years beginning after SeptemberDecember 15, 2012.2015. The Company has no material indefinite-lived intangible assets.may adopt the standard prospectively. Early adoption is permitted. In the fiscal 2016 first quarter the Company elected to early adopt ASU 2015-04 and apply it on a prospective basis. The Company's plan that provides postretirement medical and other benefits was amended on August 25, 2015. As a result of this plan amendment, the Company elected the practical expedient pursuant to this guidance and a valuation was completed using an August 31, 2015 measurement date.
(Dollars in thousands, except per-share amounts)
In April 2015 the FASB issued ASU No. 2015-03, "Interest—Imputation of Interest (Subtopic 835-30) Simplifying the Presentation of Debt Issuance Costs" (ASU 2015-03). The amendments in ASU 2015-03 simplify the presentation of debt issuance costs and require that debt issuance costs related to a recognized debt liability be presented in the balance sheet as a direct deduction from the carrying amount of that debt liability, consistent with debt discounts. The recognition and measurement guidance for debt issuance costs are not affected by the amendments in this update. In August 2015 the FASB issued ASU No. 2015-15 "Interest—Imputation of Interest (Subtopic 835-30) Presentation and Subsequent Measurement of Debt Issuance Costs Associated with Line-of-Credit Arrangements" (ASU 2015-15). The guidance in ASU 2015-03 does not address presentation or subsequent measurement of debt issuance costs related to line of credit arrangements. Given the absence of authoritative guidance, in ASU 2015-15, FASB adopted SEC staff comments that they would not object to an entity deferring and presenting debt issuance costs as an asset and subsequently amortizing the deferred debt issuance costs ratably over the term of the line of credit arrangement, regardless of whether there are any outstanding borrowings on the line of credit arrangement. ASU 2015-03 and 2015-15 are both effective for fiscal years beginning after December 15, 2015. The amendments are required to be applied retrospectively to all prior periods presented and early adoption is permitted. The Company elected to early adopt ASU 2015-03 in fiscal 2016 first quarter and ASU 2015-15 in fiscal 2016 third quarter. Adoption of this guidance in fiscal 2013 had no materialdid not have a significant impact on the Company's consolidated financial statements.statements, or results of operations for the period since there were no prior period costs it applied to. Debt issuance costs associated with the credit facility discussed further in Note 10 Financing Arrangements have been presented as an asset and are being amortized ratably over the term of the line of credit arrangement.
Pending
In April 2014 the FASB issued ASU No. 2014-08, "Presentation of Financial Statements (Topic 205) and Property, Plant, and Equipment (Topic 360): Reporting Discontinued Operations and Disclosures of Disposals of Components of an Entity" (ASU No. 2014-08). ASU No. 2014-08 changes the criteria for determining which disposals should be presented as discontinued operations and modifies the related disclosure requirements. Additionally, this guidance requires that a business that qualifies as held for sale upon acquisition should be reported as discontinued operations. This guidance became effective for the Company on February 1, 2015 and applies prospectively to new disposals and new classifications of disposal groups as held for sale after the effective date. The adoption of this guidance did not have an impact on the Company's consolidated financial statements, results of operations, or disclosures.
In addition to the accounting pronouncements adopted and described above, the Company adopted various other accounting pronouncements that became effective in fiscal 2016. None of this guidance had a significant impact on the Company's consolidated financial statements, results of operations, or disclosures for the period.
New Accounting Standards Not Yet Adopted
AtIn February 2016 the FASB issued ASU No. 2016-02, "Leases (Topic 842)" (ASU 2016-02). The primary difference between previous GAAP and ASU 2016-02 is the recognition of lease assets and lease liabilities by lessees for those leases classified as operating leases under previous GAAP. The guidance requires a lessee to recognize in the statement of financial position a liability to make lease payments (the lease liability) and a right-of-use asset representing its right to use the underlying asset for the lease term. When measuring assets and liabilities arising from a lease, a lessee (and a lessor) should include payments to be made in optional periods only if the lessee is reasonably certain to exercise an option to extend the lease or not to exercise an option to terminate the lease. Similarly, optional payments to purchase the underlying asset should be included in the measurement of lease assets and lease liabilities only if the lessee is reasonably certain to exercise that purchase option. For leases with a term of 12 months or less, a lessee is permitted to make an accounting policy election by class of underlying asset not to recognize lease assets and lease liabilities. If a lessee makes this election, it should recognize lease expense for such leases generally on a straight-line basis over the lease term. ASU 2016-02 is effective for fiscal years beginning after December 15, 2018. Lessees and lessors are required to recognize and measure leases at the beginning of the earliest period presented using a modified retrospective approach. The modified retrospective approach includes a number of optional practical expedients that entities may elect to apply. An entity that elects to apply the practical expedients will, in effect, continue to account for leases that commence before the effective date in accordance with previous GAAP unless the lease is modified, except that lessees are required to recognize a right-of-use asset and a lease liability for all operating leases at each reporting date based on the present value of the remaining minimum rental payments that were tracked and disclosed under previous GAAP. The Company is evaluating the impact the adoption of this guidance will have on its consolidated financial statements, results of operations, and disclosures.
In January 31, 2013 there are noof 2016, the FASB issued ASU No. 2016-01, "Financial Instruments-Overall (Subtopic 825-10): Recognition and Measurement of Financial Assets and Financial Liabilities." The updated accounting pronouncements pendingguidance requires changes to the reporting model for financial instruments. The amendments in this guidance supersede the guidance to classify equity securities with readily determinable fair values into different categories (that is, trading or available-for sale) and require equity securities (including other ownership interests, such as partnerships, unincorporated joint ventures, and limited liability companies to be measured at fair value with changes in the fair value recognized through net income. An entity’s equity investments that are accounted for under the equity method of significance,accounting or potential significance,result in consolidation of an investee are not included within the scope of this update. The amendments also require separate presentation of financial assets and financial liabilities by measurement category and form
(Dollars in thousands, except per-share amounts)
of financial asset (that is, securities or loans and receivables) on the balance sheet or in the accompanying notes to the Company.financial statements. This guidance is effective for fiscal years beginning after December 15, 2017, including interim periods within those fiscal years. Early application guidance is provided by the update but except as discussed in the guidance, early adoption is not permitted. The Company is currently evaluating the effect the updated guidance will have on the Company's financial statements, results of operations, and disclosures.
In November 2015 the FASB issued ASU No. 2015-17, "Income Taxes (Topic 740) Balance Sheet Classification of Deferred Taxes" (ASU 2015-17). Current GAAP requires the deferred taxes for each jurisdiction (or tax-paying component of a jurisdiction) to be presented as a net current asset or liability and net noncurrentasset or liability. This requires a jurisdiction-by-jurisdiction analysis based on the classification of the assets and liabilities to which the underlying temporary differences relate, or, in the case of loss or credit carryforwards, based on the period in which the attribute is expected to be realized. Any valuation allowance is then required to be allocated on a pro rata basis, by jurisdiction, between current and noncurrent deferred tax assets. To simplify presentation, ASU 2015-17 requires that all deferred tax assets and liabilities, along with any related valuation allowance, be classified as noncurrent on the balance sheet. As a result, each jurisdiction will now only have one net noncurrent deferred tax asset or liability. The guidance does not change the existing requirement that only permits offsetting within a jurisdiction - that is, companies are still prohibited from offsetting deferred tax liabilities from one jurisdiction against deferred tax assets of another jurisdiction. ASU 2015-17 is effective for fiscal years beginning after December 15, 2016. The Company may apply the standard either prospectively to all deferred tax liabilities and assets or retrospectively to all periods presented. Early adoption is permitted. The Company is evaluating the impact the adoption of this guidance will have on its consolidated financial statements and working capital.
In September 2015 the FASB issued ASU No. 2015-16, "Business Combinations (Topic 805) Simplifying the Accounting for Measurement-Period Adjustments" (ASU 2015-16). The amendments in ASU 2015-16 apply to all entities that have reported provisional amounts for items in a business combination for which the accounting is incomplete by the end of the reporting period in which the combination occurs and, during the measurement period, have an adjustment to provisional amounts recognized. ASU 2015-16 requires that an acquirer in a business combination recognize adjustments to provisional amounts that are identified during the measurement period in the reporting period in which the adjustment amounts are determined. ASU 2015-16 requires that the acquirer record, in the same period’s financial statements, the effect on earnings of changes in depreciation, amortization, or other income effects, if any, as a result of the change to the provisional amounts, calculated as if the accounting had been completed at the acquisition date. The amendments in this update require an entity to present separately on the face of the income statement, or disclose in the notes, the portion of the amount recorded in current-period earnings by line item that would have been recorded in previous reporting periods if the adjustment to the provisional amounts had been recognized as of the acquisition date. ASU 2015-16 is effective for fiscal years beginning after December 15, 2015, including interim periods within those fiscal years. ASU 2015-16 is to be applied prospectively to adjustments to provisional amounts that occur after the effective date of the update with earlier application permitted for financial statements that have not been issued. The Company is evaluating the impact the adoption of this guidance will have on its consolidated financial statements, results of operations, and disclosures.
In July 2015 the FASB issued ASU No. 2015-11, "Inventory (Topic 330) Simplifying the Measurement of Inventory" (ASU 2015-11). The amendments in ASU 2015-11 clarify that an entity should measure inventory within the scope of this update at the lower of cost and net realizable value. Net realizable value is the estimated selling prices in the ordinary course of business, less reasonably predictable costs of completion, disposal, and transportation. Substantial and unusual losses that result from subsequent measurement of inventory should be disclosed in the financial statements. ASU 2015-11 is effective for fiscal years beginning after December 15, 2016, including interim periods within those fiscal years. The amendments are to be applied prospectively with earlier application permitted as of the beginning of an interim or annual reporting period. The Company is evaluating the impact the adoption of this guidance will have on its consolidated financial statements, results of operations, and disclosures.
In April 2015 the FASB issued ASU No. 2015-05, "Intangibles-Goodwill and Other-Internal-Use Software (Subtopic 350-40) Customer’s Accounting for Fees Paid in a Cloud Computing Arrangement" (ASU 2015-05). The amendments in ASU 2015-05 clarify existing GAAP guidance about a customer’s accounting for fees paid in a cloud computing arrangement with or without a software license. Examples of cloud computing arrangements include software as a service, platform as a service, infrastructure as a service, and other similar hosting arrangements. ASU 2015-05 adds guidance to Subtopic 350-40, Intangibles-Goodwill and Other-Internal-Use Software, which will help entities evaluate the accounting for fees paid by a customer in a cloud computing arrangement. If a cloud computing arrangement includes a software license, then the customer should account for the software license element of the arrangement consistent with the acquisition of other software licenses. If a cloud computing arrangement does not include a software license, the customer should account for the arrangement as a service contract. The guidance does not change GAAP for a customer’s accounting for service contracts. All software licenses within the scope of Subtopic 350-40 will be accounted for consistent with other licenses of intangible assets. ASU 2015-05 is effective for fiscal years beginning after December 15, 2015. The amendments may be applied prospectively to all arrangements entered into or materially altered after
(Dollars in thousands, except per-share amounts)
the effective date or retrospectively to all prior periods presented. Early adoption is permitted. The Company is evaluating the impact the adoption of this guidance will have on its consolidated financial position, results of operations, and cash flows.
In February 2015 the FASB issued ASU No. 2015-02, "Consolidation (Topic 810) Amendments to the Consolidation Analysis" (ASU 2015-02). The amendments in ASU 2015-02 affect reporting entities that are required to evaluate whether they should consolidate certain legal entities. All legal entities are subject to reevaluation under the revised consolidation model. Specifically, the amendments: 1. Modify the evaluation of whether limited partnerships and similar legal entities are variable interest entities (VIEs) or voting interest entities; 2. Eliminate the presumption that a general partner should consolidate a limited partnership; 3. Affect the consolidation analysis of reporting entities that are involved with VIEs, particularly those that have fee arrangements and related party relationships; and 4. Provide a scope exception from consolidation guidance for reporting entities with interests in legal entities that are required to comply with or operate in accordance with requirements that are similar to those in Rule 2a-7 of the Investment Company Act of 1940. ASU 2015-02 is effective for fiscal years beginning after December 15, 2015. Early adoption is permitted. ASU 2015-02 may be applied retrospectively or using a modified retrospective approach. The Company is evaluating the impact of this guidance on its consolidated legal entities and on its consolidated financial position, results of operations, and cash flows.
In May 2014 the FASB issued ASU No. 2014-09, "Revenue from Contracts with Customers" (ASU 2014-09). ASU 2014-09 provides a comprehensive new recognition model that requires recognition of revenue when a company transfers promised goods or services to customers in an amount that reflects the consideration to which the company expects to receive in exchange for those goods or services. This guidance supersedes the revenue recognition requirements in FASB ASC Topic 605, “Revenue Recognition,” and most industry-specific guidance. ASU 2014-09 defines a five-step process to achieve this core principle and, in doing so, companies will need to use more judgment and make more estimates than under the current guidance. It also requires additional disclosure about the nature, amount, timing, and uncertainty of revenue and cash flows arising from customer contracts. In August 2015, the FASB approved a one-year deferral of the effective date (ASU 2015-14) and the standard is now effective for the Company for fiscal 2019 and interim periods therein. ASU 2014-09 may be adopted as of the original effective date, which for the Company is fiscal 2018. The guidance may be applied using either of the following transition methods: (i) a full retrospective approach reflecting the application of the standard in each prior reporting period with the option to elect certain practical expedients or (ii) a retrospective approach with the cumulative effect of initially adopting ASU 2014-09 recognized at the date of adoption (which includes additional footnote disclosures). The Company is currently evaluating the method and date of adoption and the impact the adoption of ASU 2014-09 will have on the Company’s consolidated financial position, results of operations, and disclosures.
(Dollars in thousands, except per-share amounts)
|
| |
| NOTE 2 | SELECTED BALANCE SHEET INFORMATION |
Following are the components of selected balance sheet items:
| | | | | As of January 31, | | As of January 31, |
| | | 2013 | | 2012 | | 2011 | | 2016 | | 2015 | | 2014 |
| Accounts receivable, net: | | | | | | | | | | | | |
| Trade accounts | | $ | 56,508 |
| | $ | 60,929 |
| | $ | 40,267 |
| | $ | 39,103 |
| | $ | 56,895 |
| | $ | 54,962 |
|
| Allowance for doubtful accounts | | (205 | ) | | (170 | ) | | (300 | ) | | (1,034 | ) | | (319 | ) | | (319 | ) |
| | | $ | 56,303 |
| | $ | 60,759 |
| | $ | 39,967 |
| | $ | 38,069 |
| | $ | 56,576 |
| | $ | 54,643 |
|
| Inventories: | | | | | | | | | | | | |
| Finished goods | | $ | 8,571 |
| | $ | 7,094 |
| | $ | 7,994 |
| | $ | 4,896 |
| | $ | 8,127 |
| | $ | 7,232 |
|
| In process | | 2,675 |
| | 6,105 |
| | 5,424 |
| | 1,845 |
| | 1,317 |
| | 2,131 |
|
| Materials | | 34,943 |
| | 41,557 |
| | 30,261 |
| | 39,147 |
| | 45,708 |
| | 45,502 |
|
| | | $ | 46,189 |
| | $ | 54,756 |
| | $ | 43,679 |
| | $ | 45,888 |
| | $ | 55,152 |
| | $ | 54,865 |
|
| Other current assets: | | | | | | | | | | | | |
| Insurance policy benefit | | $ | 860 |
| | $ | 1,873 |
| | $ | 1,909 |
| | $ | 716 |
| | $ | 733 |
| | $ | 733 |
|
| Federal income tax receivable | | | 2,176 |
| | 713 |
| | 1,197 |
|
| Prepaid expenses and other | | 936 |
| | 1,030 |
| | 1,330 |
| | 1,992 |
| | 1,648 |
| | 1,358 |
|
| | | $ | 1,796 |
| | $ | 2,903 |
| | $ | 3,239 |
| | $ | 4,884 |
| | $ | 3,094 |
| | $ | 3,288 |
|
| Property, plant and equipment, net: | | | | | | | | | | | | |
| Held for use: | | | | | | | |
| Land | | $ | 2,077 |
| | $ | 2,077 |
| | $ | 1,798 |
| | $ | 3,054 |
| | $ | 3,246 |
| | $ | 2,077 |
|
| Buildings and improvements | | 52,936 |
| | 36,952 |
| | 24,972 |
| | 77,827 |
| | 78,140 |
| | 66,278 |
|
| Machinery and equipment | | 101,645 |
| | 89,919 |
| | 75,310 |
| | 140,995 |
| | 131,766 |
| | 114,345 |
|
| Accumulated depreciation | | (75,420 | ) | | (67,054 | ) | | (60,558 | ) | | (106,514 | ) | | (96,545 | ) | | (84,624 | ) |
| | | $ | 81,238 |
| | $ | 61,894 |
| | $ | 41,522 |
| | $ | 115,362 |
| | $ | 116,607 |
| | $ | 98,076 |
|
| Other assets, net: | | | | | | | |
| | | | | | | | |
| Held for sale: | | | | | | | |
| Land | | | $ | 244 |
| | $ | 11 |
| | $ | — |
|
| Buildings and improvements | | | 1,595 |
| | 1,522 |
| | — |
|
| Machinery and equipment | | | 329 |
| | — |
| | — |
|
| Accumulated depreciation | | | (1,368 | ) | | (627 | ) | | — |
|
| | | | 800 |
| | 906 |
| | — |
|
| | | | $ | 116,162 |
| | $ | 117,513 |
| | $ | 98,076 |
|
| Other assets: | | | | | | | |
| Investment in affiliate | | $ | 4,063 |
| | $ | 4,409 |
| | $ | 4,728 |
| | $ | 2,805 |
| | $ | 3,217 |
| | $ | 3,684 |
|
| Deferred income taxes | | — |
| | — |
| | 924 |
| |
| Other, net | | 206 |
| | 155 |
| | 43 |
| |
| Other | | | 1,322 |
| | 526 |
| | 224 |
|
| | | $ | 4,269 |
| | $ | 4,564 |
| | $ | 5,695 |
| | $ | 4,127 |
| | $ | 3,743 |
| | $ | 3,908 |
|
| Accrued liabilities: | | | | | | | | | | | | |
| Salaries and benefits | | $ | 3,978 |
| | $ | 4,297 |
| | $ | 3,264 |
| |
| Vacation | | 4,025 |
| | 4,387 |
| | 3,186 |
| |
| 401(k) contributions | | 520 |
| | 966 |
| | 253 |
| |
| Salaries and related | | | $ | 1,883 |
| | $ | 4,063 |
| | $ | 2,210 |
|
| Benefits | | | 3,864 |
| | 5,001 |
| | 5,538 |
|
| Insurance obligations | | 2,506 |
| | 2,789 |
| | 3,356 |
| | 1,730 |
| | 1,590 |
| | 1,598 |
|
| Profit sharing | | 287 |
| | 1,244 |
| | 1,627 |
| |
| Warranties | | 1,888 |
| | 1,699 |
| | 1,437 |
| | 1,835 |
| | 3,120 |
| | 2,525 |
|
| Taxes - accrued and withheld | | 1,392 |
| | 2,596 |
| | 1,453 |
| |
| Income taxes | | | 475 |
| | 536 |
| | 362 |
|
| Other taxes | | | 1,117 |
| | 1,240 |
| | 1,097 |
|
| Acquisition-related contingent consideration | | 712 |
| | 3,266 |
| | 263 |
| | 407 |
| | 1,375 |
| | 890 |
|
| Other | | 1,884 |
| | 1,749 |
| | 1,257 |
| | 731 |
| | 2,262 |
| | 2,028 |
|
| | | $ | 17,192 |
| | $ | 22,993 |
| | $ | 16,096 |
| | $ | 12,042 |
| | $ | 19,187 |
| | $ | 16,248 |
|
| Other liabilities: | | | | | | | | | | | | |
| Postretirement benefits | | $ | 8,072 |
| | $ | 7,348 |
| | $ | 5,757 |
| | $ | 7,662 |
| | $ | 11,812 |
| | $ | 7,998 |
|
| Acquisition-related contingent consideration | | 2,359 |
| | 7,655 |
| | 2,230 |
| | 2,499 |
| | 3,631 |
| | 2,457 |
|
| Deferred income taxes | | 2,453 |
| | 4,518 |
| | — |
| | 5,426 |
| | 7,091 |
| | 3,526 |
|
| Uncertain tax positions | | 5,818 |
| | 4,946 |
| | 4,224 |
| | 3,339 |
| | 3,259 |
| | 6,557 |
|
| | | $ | 18,702 |
| | $ | 24,467 |
| | $ | 12,211 |
| | $ | 18,926 |
| | $ | 25,793 |
| | $ | 20,538 |
|
(Dollars in thousands, except per-share amounts)
|
| |
| NOTE 3 | ACCUMULATED OTHER COMPREHENSIVE INCOME (LOSS) |
Other comprehensive income refers to revenue, expenses, gains, and losses that under GAAP are recorded as an element of shareholders' equity but are excluded from net income. The changes in the components of accumulated other comprehensive income (loss) (AOCI) are shown below:
|
| | | | | | | | | | | | |
| | | As of January 31, |
| | | 2013 | | 2012 | | 2011 |
| Foreign currency translation | | $ | 142 |
| | $ | 145 |
| | $ | 183 |
|
| Postretirement benefits, net of tax | | (2,237 | ) | | (2,107 | ) | | (1,303 | ) |
| Total accumulated other comprehensive loss | | $ | (2,095 | ) | | $ | (1,962 | ) | | $ | (1,120 | ) |
|
| | | | | | | | | | | | |
| | | Cumulative foreign currency translation adjustment | | Postretirement benefits | | Total |
| Balance at January 31, 2013 | | $ | 142 |
| | $ | (2,237 | ) | | $ | (2,095 | ) |
| Other comprehensive (loss) before reclassifications | | (424 | ) | | — |
| | (424 | ) |
| Amounts reclassified from accumulated other comprehensive (loss) after tax expense of ($183) | | — |
| | 340 |
| | 340 |
|
| Balance at January 31, 2014 | | (282 | ) | | (1,897 | ) | | (2,179 | ) |
| Other comprehensive (loss) before reclassifications | | (1,466 | ) | | — |
| | (1,466 | ) |
| Amounts reclassified from accumulated other comprehensive (loss) after tax benefit of $1,187 | | — |
| | (2,204 | ) | | (2,204 | ) |
| Balance at January 31, 2015 | | (1,748 | ) | | (4,101 | ) | | (5,849 | ) |
| Other comprehensive (loss) before reclassifications | | (729 | ) | | — |
| | (729 | ) |
| Amounts reclassified from accumulated other comprehensive (loss) after tax expense of ($1,620) | | — |
| | 3,077 |
| | 3,077 |
|
| Balance at January 31, 2016 | | $ | (2,477 | ) | | $ | (1,024 | ) | | $ | (3,501 | ) |
Postretirement benefit cost components are reclassified in their entirety from AOCI to net periodic benefit cost. Net periodic benefit costs are reported in net income as “Cost of sales” or “Selling, general and administrative expenses” in a manner consistent with the classification of direct labor and personnel costs of the eligible employees.
|
| |
| NOTE 4 | SUPPLEMENTAL CASH FLOW INFORMATION |
| | | | | For the years ended January 31, | | For the years ended January 31, |
| | | 2013 | | 2012 | | 2011 | | 2016 | | 2015 | | 2014 |
| Changes in operating assets and liabilities: | | | | | | | | | | | | |
| Accounts receivable | | $ | 4,362 |
| | $ | (15,569 | ) | | $ | (5,536 | ) | | $ | 16,847 |
| | $ | 4,699 |
| | $ | 1,297 |
|
| Inventories | | 8,567 |
| | (11,528 | ) | | (9,189 | ) | | 7,516 |
| | 6,753 |
| | (9,190 | ) |
| Prepaid expenses and other assets | | 976 |
| | (291 | ) | | 96 |
| | (111 | ) | | 195 |
| | (239 | ) |
| Accounts payable | | (2,937 | ) | | (233 | ) | | 2,713 |
| | (5,059 | ) | | (3,578 | ) | | (994 | ) |
| Accrued and other liabilities | | (1,709 | ) | | 4,578 |
| | 4,428 |
| | (8,978 | ) | | 48 |
| | (1,150 | ) |
| Customer advances | | (60 | ) | | (33 | ) | | 215 |
| | (368 | ) | | (144 | ) | | (173 | ) |
| | | $ | 9,199 |
| | $ | (23,076 | ) | | $ | (7,273 | ) | | $ | 9,847 |
| | $ | 7,973 |
| | $ | (10,449 | ) |
| | | | | | | | | | | | | |
| Supplemental disclosures of cash flow information: | | | | | | | |
| Cash paid during the year for income taxes | | $ | 26,697 |
| | $ | 16,782 |
| | $ | 19,700 |
| | $ | 6,558 |
| | $ | 14,011 |
| | $ | 20,002 |
|
| Interest paid | | | $ | 129 |
| | $ | 160 |
| | $ | — |
|
| | | | | | | | | | | | | |
| Significant non-cash transactions: | | | | | | | | | | | | |
| Issuance of common stock for business acquisition | | | $ | — |
| | $ | 39,252 |
| | $ | — |
|
| Capital expenditures included in accounts payable | | $ | 2,196 |
| | $ | 984 |
| | $ | 2,181 |
| | $ | 161 |
| | $ | 564 |
| | $ | 1,083 |
|
| Capital expenditures converted from inventory | | | $ | 1,036 |
| | $ | 491 |
| | $ | 418 |
|
(Dollars in thousands, except per-share amounts)
|
| |
| NOTE 5 | ACQUISITIONS OF AND INVESTMENTS IN BUSINESSES AND TECHNOLOGIES |
Vista Research
In January 2012,Integra
On November 3, 2014 the Company completedacquired all of the issued and outstanding shares of Integra Plastics, Inc. (Integra). Integra, which was a privately-held company headquartered in Madison, South Dakota, specialized in the manufacture and conversion of high-quality plastic film and sheeting. This acquisition expanded Raven's Engineered Films Division's production capacity with additional extrusion and lamination operations in Brandon, South Dakota and fabrication locations in Madison, South Dakota and Midland, Texas, as well as broadened Engineered Films' product offerings and enhanced its converting capabilities. Integra's results of operations subsequent to acquisition are included in the Engineered Films segment.
At the acquisition date, the total purchase price was valued at approximately $48,200 net of an estimated working capital adjustment included in the terms of the merger and acquisition agreement. These terms provided for payment through the issuance of 1,541,696 shares of the Company's common stock valued at $39,252, based on the closing stock price on the date of acquisition and cash payments of $9,361. The Company received $351 in settlement of the working capital adjustment to the purchase agreementprice and finalized deferred tax calculations in fiscal 2016 first quarter. These transactions resulted in an adjustment of allabout $20 to the outstanding stock of Vista Research, Inc. (Vista) for a purchase price of allocation.
$23,269, of which $12,000 was cash and $2,869 was an assumed line of credit paid by Raven at closing. The fair value of contingent considerationthe business acquired was allocated to the assets acquired and earn-outs comprised the remaining $8,400liabilities assumed based on their estimated fair values. The excess of the purchase price. Results of operations subsequent tofair value acquired over the acquisition have been combined into the Aerostar Division.
Vistaidentifiable assets acquired and liabilities assumed is a leading provider of surveillance systems that enhance the effectiveness of radars using sophisticated algorithms. Vista's smart sensing radar systems (SSRS) are employed in a host of advanced detection and tracking applications, including wide-area surveillance for the border patrol and the military. This acquisition allows Raven to enhance its tethered aerostat security solutions within its Aerostar Division and positions the Company to meet growing global demand for low-cost detection and tracking systems used by government and law enforcement agencies.
In connection with the stock purchase agreement, Raven agreed to pay an aggregate $6,500 upon receipt and delivery of a specific quantity of SSRS orders by certain milestone dates. Both of these milestones were met in fiscal 2013 and Raven paid the accrued contingent consideration of $6,500 in the fourth quarter.
Under the stock purchase agreement, the Company will also make annual payments based upon earn-out percentages on specific revenue streams for seven years after the purchase date, not to exceed $15,000.reflected as goodwill. The fair value of these contingent considerationsthe goodwill recorded as part of the purchase price allocation was $27,422. None of this goodwill is tax deductible. Goodwill resulting from this business combination is largely attributable to the experienced workforce of the acquired business and synergies expected to arise after integration of Integra products and operations into Engineered Films. Identifiable intangible assets acquired as part of the acquisition included definite-lived intangibles for customer relationships and other intangibles valued at $10,000 and $200, respectively. These intangible assets are being amortized using the straight-line method over their estimated useful life as follows: customer relationships - twelve years and other intangibles - two years. Liabilities assumed from Integra included a revolving line of credit and long-term notes with Wells Fargo Bank N.A. (Wells Fargo). The Company has a related party relationship with Wells Fargo described in Note 10 $3,071Financing Arrangements, of which $712. This debt was classifiedrepaid by the Company in "Accrued liabilities"fiscal 2015 and there was no debt outstanding at January 31, 2015.$2,359 as "Other liabilities"
The purchase price was finalized in the Consolidated Balance Sheet forfiscal 2016 first quarter after the year ended working capital adjustment was settled. The total purchase price allocated to the estimated fair values of assets acquired and liabilities assumed as follows:
|
| | | | |
| Cash | | $ | 1,600 |
|
| Accounts receivable | | 4,808 |
|
| Inventory | | 7,575 |
|
| Deferred income taxes | | 543 |
|
| Other current assets | | 24 |
|
| Property, plant and equipment, net | | 17,088 |
|
| Goodwill | | 27,422 |
|
| Customer relationships and other definite-lived intangibles | | 10,200 |
|
| Short-term and long-term debt | | (11,341 | ) |
| Current liabilities | | (4,084 | ) |
| Other liabilities | | (5,573 | ) |
| Total purchase price | | $ | 48,262 |
|
Integra net sales and net loss recognized in fiscal 2015 from the acquisition date to January 31, 2013. At January 31, 20122015 were $5,627 and $(874), respectively. The operations of Integra were fully integrated into Engineered Films’ existing operations at the fair valuebeginning of fiscal year 2016. The Company does not manage such operations or report these results separate and apart from the contingent consideration for the Vista acquisition was $8,400, of which $3,068 was classified as "Accrued liabilities" and $5,332 as "Other liabilities" in the Consolidated Balance Sheet for the year ended January 31, 2012.Engineered Films segment.
(Dollars in thousands, except per-share amounts)
SBG
On May 1, 2014, the Company completed the purchase of all issued and outstanding shares of SBG Innovatie BV and its affiliate, Navtronics BVBA (collectively, SBG). SBG has operations in the Netherlands just outside of Amsterdam and at Navtronics in Geel, Belgium. The acquisition broadened Applied Technology Division’s guided steering system product line by adding high-accuracy implement steering applications. Additionally, SBG’s headquarters have become the home office for Raven in Europe, expanding the Company’s global presence and reach into key European markets.
In connection with the purchase, the Company paid $5,000 and agreed to pay up to $2,500 in additional earn-out payments calculated using the undiscounted cash flows and paid quarterly over the next 10 years contingent upon achieving certain revenues. Projecting discounted future cash flows requires the Company to make significant estimates and assumptions regarding future revenues under the subject contingent agreement and the appropriate discount rate. Such valuations techniques include one or more significant inputs that are not observable (Level 3 fair value measures).
At January 31, 2016, the fair value of this contingent consideration was $1,499 of which $249 was classified as "Accrued liabilities" and $1,250 was classified as "Other liabilities". The fair value of this contingent consideration at January 31, 2015 was $1,432, of which $236 was classified as "Accrued liabilities" and $1,196 was classified as "Other liabilities." The Company has paid a total of $308 of this potential earn-out liability including $229 and $79 in earn-out payments during fiscal 2016 and 2015, respectively.
The fair value of the business acquired was allocated to the assets acquired and liabilities assumed based on their estimated fair values. The excess of the fair value acquired over the identifiable assets acquired and liabilities assumed is reflected as goodwill. Goodwill recorded as part of the purchase price allocation was $11,497, all$3,250, none of which is tax deductible. Goodwill resulting from this business combination is largely attributable to the experienced workforce of the acquired business and synergies expected to arise after integration of Vista products into existing Aerostar products. Identifiable intangible assets acquired as part of the acquisition were $7,810, including$2,104, and included definite-lived intangibles, such as customer relationships and proprietary technology and non-compete agreements, with atechnology. Amortization is being computed over the estimated useful life ranging from six to ten years. These intangible assets are being amortized onusing the basis of undiscounted cash flows overmethod as follows: twelve years for customer relationships and five years for proprietary technology. Liabilities acquired included debts to the former owners, a weighted average period of 4.1long-term note with a third-party bank, and deferred income taxes. As further described in Note 10 years.Financing Arrangements, this debt was repaid by the Company andthere was no debt outstanding at January 31, 2015.
The total purchase price was allocated to the estimated fair values of assets acquired and liabilities assumed as follows:
|
| | | | | | |
| Cash | | | | $ | 320 |
|
| Accounts receivable | | | | 2,375 |
|
| Inventory | | | | 264 |
|
| Other current and long term assets | | | | 3,342 |
|
| Property, plant and equipment, net | | | | 834 |
|
| Goodwill | | | | 11,497 |
|
| Existing technology | | | | 4,300 |
|
| Customer relationships | | | | 3,260 |
|
| Other intangibles | | | | 250 |
|
| Current liabilities | | | | (3,023 | ) |
| Other liabilities | | | | (150 | ) |
| Total purchase price | | | | $ | 23,269 |
|
VistaSBG net sales and net lossincome recognized in fiscal 20122015 from the acquisition date to January 31, 20122015 were $631$3,245 and $(125),$152, respectively. The operations of SBG were integrated into the existing operations of the Applied Technology Division at the beginning of fiscal year 2016.
The following pro forma consolidated condensed financial results of operations are presented as if the acquisitionfiscal year 2015 acquisitions described above had been completed at the beginning of eachthe period presented:presented (unaudited):
|
| | | | | | | | |
| | | For the years ended January 31, |
| | | 2012 | | 2011 |
| Pro forma net sales | | $ | 395,974 |
| | $ | 328,361 |
|
| Pro forma net income attributable to Raven Industries, Inc. | | 49,907 |
| | 39,948 |
|
| | | | | |
| Pro forma earnings per common share: | | | | |
| Basic | | $ | 1.38 |
| | $ | 1.10 |
|
| Diluted | | $ | 1.37 |
| | $ | 1.10 |
|
|
| | | | | | | | |
| | | (Unaudited) |
| | | For the year ended January 31, |
| | | 2015 | | 2014 |
| Net sales | | $ | 408,906 |
| | $ | 431,917 |
|
| Net income attributable to Raven Industries, Inc. | | 34,424 |
| | 45,747 |
|
| | | | | |
| Earnings per common share: | | | | |
| Basic | | $ | 0.90 |
| | $ | 1.20 |
|
| Diluted | | $ | 0.90 |
| | $ | 1.20 |
|
These unaudited pro forma consolidated financial results have been prepared for comparative purposes only and include certain adjustments, such as amortization and acquisition cost. The pro forma information does not purport to be indicative of the results of operations that actually would have resulted had the combinationthese business combinations occurred at the beginning of each period presented, or of future results of the consolidated entities.
Acquisition-related contingent consideration
In addition to the contingent consideration related to the acquisition of SBG, the Company has contingent liabilities related to prior year acquisitions. Related to the acquisition of Vista in 2012, the Company is committed to make annual payments based upon earn-out percentages on specific revenue streams for seven years after the purchase date, not to exceed $15,000. Projecting discounted future cash flows requires the Company to make significant estimates and assumptions regarding future revenues under the subject contingent agreement and the appropriate discount rate. Such valuations techniques include one or more significant inputs that are not observable (Level 3 fair value measures).
(Dollars in thousands, except per-share amounts)
As a result of the triggering event that occurred in fiscal 2016 third quarter described in Note 6 Goodwill and Other Intangibles, the Company performed both a Step 1 and Step 2 impairment analysis for the Vista reporting unit. The results of these analyses are also more fully described in Note 6 Goodwill and Other Intangibles. Prior to performing the Step 2 analysis, the Company evaluated the fair value of the remaining assets and liabilities including acquisition-related contingent consideration. This analysis included a reduction of $1,483 in the fair value of this contingent consideration. This benefit was recognized in "Cost of sales" in the Consolidated Statements of Income and Comprehensive Income for the three-month period ended October 31, 2015 and the twelve-month period ended January 31, 2016. The fair value of these contingent considerations at January 31, 2016 was $1,327, of which $78 was classified in "Accrued liabilities" and $1,249 as "Other liabilities" in the Consolidated Balance Sheet. At January 31, 2015, the fair value of the contingent consideration for the Vista acquisition was $2,989 of which $554 was classified in "Accrued liabilities" and $2,435 as "Other liabilities" in the Consolidated Balance Sheet. At January 31, 2014, the fair value of the contingent consideration for the Vista acquisition was $3,347, of which $890 was classified in “Accrued liabilities” and $2,457 as “Other liabilities” in the Consolidated Balance Sheet. These fair values were estimated using forecasted discounted cash flows. The Company has paid a total of $1,392 of this potential earn-out liability including $585, $454, and $353 in earn-out payments in fiscal year 2016, 2015, and 2014, respectively.
Equity Method Investment SST
In November 2009,The Company’s owned interest of approximately 22% in SST is accounted for using the Company acquired a 20% interest in Site Specific Technology Development Group, Inc. (SST) for $5,000.equity method. SST is a privately heldprivately-held agricultural software development and information services provider. Raven and SST are strategically aligned to provide customers with simple, more efficient ways to move and manage informationdata in the precision agriculture market.
(Dollars in thousands, except per-share amounts)
Changes in the net carrying value of the investment in SST were as follows:
| | | | | As of January 31, | | As of January 31, |
| | | 2013 | | 2012 | | 2011 | | 2016 | | 2015 | | 2014 |
| Balance at beginning of year | | $ | 4,409 |
| | $ | 4,728 |
| | $ | 5,010 |
| | $ | 3,217 |
| | $ | 3,684 |
| | $ | 4,063 |
|
| Income from equity investment | | 156 |
| | 156 |
| | 195 |
| | 83 |
| | 28 |
| | 116 |
|
| Amortization of intangible assets | | (477 | ) | | (475 | ) | | (477 | ) | | (495 | ) | | (495 | ) | | (495 | ) |
| Dividend received | | (25 | ) | | — |
| | — |
| |
| Balance at end of year | | $ | 4,063 |
| | $ | 4,409 |
| | $ | 4,728 |
| | $ | 2,805 |
| | $ | 3,217 |
| | $ | 3,684 |
|
In October 2012, SST purchased approximately 10% of its outstanding common stock to be held as treasury stock. The impact of this transaction on Raven's noncontrolling interest in SST and the carrying value of its investment was as follows: Raven's ownership interest in SST increased from 20% to 22%; Raven's basis in the net assets at acquisition decreased by $525; and the basis in the technology-related assets and goodwill increased $117 and $408, respectively, with no net impact to the carrying value of the investment.
Ranchview
Pursuant to the Company's 2009 purchase of substantially all of the assets of Ranchview Inc. (Ranchview), a privately held Canadian corporation, Raven agreed to pay contingent consideration for future sales of Ranchview products up to a maximum of $4,000. During fiscal 2013, the Company paid $1,841 in cash to the previous Ranchview owner for an early buyout of the outstanding acquisition-related contingent liability. This resulted in a gain of $508 which is included in Applied Technology operating income.
|
| |
| NOTE 6 | GOODWILL AND OTHER INTANGIBLES |
Goodwill
For goodwill, the Company performs impairment reviews by reporting unit which are determined to be Engineered Films Division, Applied Technology Divisions, and two separate reporting units in the Aerostar Division, one of which is Vista and one of which is all other Aerostar operations (Aerostar excluding Vista).
The changes in the carrying amount of goodwill by reporting segmentunit are shown below:
|
| | | | | | | | | | | | | | | | |
| | | | | | | | | |
| | | Applied Technology | | Engineered Films | | Aerostar | | Total |
| Balance at January 31, 2010 | | $ | 9,814 |
| | $ | 96 |
| | $ | 789 |
| | $ | 10,699 |
|
| Acquisition earn-outs | | 78 |
| | — |
| | — |
| | 78 |
|
| Balance at January 31, 2011 | | 9,892 |
| | 96 |
| | 789 |
| | 10,777 |
|
| Acquired goodwill | | — |
| | — |
| | 11,497 |
| | 11,497 |
|
| Balance at January 31, 2012 | | 9,892 |
| | 96 |
| | 12,286 |
| | 22,274 |
|
| Acquired goodwill | | — |
| | — |
| | — |
| | — |
|
| Balance at January 31, 2013 | | $ | 9,892 |
| | $ | 96 |
| | $ | 12,286 |
| | $ | 22,274 |
|
|
| | | | | | | | | | | | | | | | | | | | |
| | | Applied Technology | | Engineered Films | | Aerostar (exc. Vista) | | Vista | | Total |
| Balance at January 31, 2013 | | $ | 9,892 |
| | $ | 96 |
| | $ | 789 |
| | $ | 11,497 |
| | $ | 22,274 |
|
| Balance at January 31, 2014 | | 9,892 |
| | 96 |
| | 789 |
| | 11,497 |
| | 22,274 |
|
| Acquired goodwill | | 3,250 |
| | 27,216 |
| | — |
| | — |
| | 30,466 |
|
| Foreign currency translation adjustment | | (592 | ) | | — |
| | — |
| | — |
| | (592 | ) |
| Balance at January 31, 2015 | | 12,550 |
| | 27,312 |
| | 789 |
| | 11,497 |
| | 52,148 |
|
Purchase price adjustment to acquired goodwill(a) | | — |
| | 206 |
| | — |
| | — |
| | 206 |
|
| Goodwill disposed from sale of business | | (69 | ) | | — |
| | — |
| | — |
| | (69 | ) |
| Goodwill impairment loss | | — |
| | — |
| | — |
| | (7,413 | ) | | (7,413 | ) |
| Foreign currency translation adjustment | | (116 | ) | | — |
| | — |
| | — |
| | (116 | ) |
| Balance at January 31, 2016 | | $ | 12,365 |
| | $ | 27,518 |
| | $ | 789 |
| | $ | 4,084 |
| | $ | 44,756 |
|
(a) Working capital adjustment and final deferred tax adjustment for Integra acquisition (see Note 5 Acquisitions Of And Investments In Businesses And Technologies).
(Dollars in thousands, except per-share amounts)
Goodwill is tested for impairment on an annual basis and between annual tests whenever a triggering event indicates there may be an impairment. The annual impairment tests were completed for each reporting unit in the fourth quarter based on a November 30th valuation date. No triggering events were deemed to have occurred in the fourth quarter and no impairments were recorded as a result of these tests. Two of the reporting units were also tested earlier in fiscal 2016 as a result of triggering events that had occurred.
In the fiscal 2016 second quarter the Company performed a Step 1 impairment analysis using fair value techniques on the Engineered Films reporting unit as a result of changes in market conditions indicating that goodwill might be impaired. The reporting unit's fair value was estimated based on discounted cash flows and that fair value amount was compared to the carrying value of the reporting unit. In determining the estimated fair value of the Engineered films reporting unit, the Company was required to make assumptions and estimate a number of factors, including projected revenue growth rate, operating profit margin percentage, capital expenditures, and the discount rate. This analysis indicated that the estimated fair value of the Engineered Films reporting unit exceeded the net book value by approximately $50,000.
No significant changes were noted in the market conditions faced by Engineered Films in the fiscal 2016 third quarter and operating income for the year was consistent with expectations at the end of second quarter when the test was completed. Although oil prices continued to be lower and Engineered Films' sales were down, the profitability of the division continued to be higher than the trailing months at the time of the impairment analysis given lower material costs in comparison to selling price. With actual cash flows largely in line with forecasted cash flows derived for the fiscal 2016 second quarter impairment analysis, the Company concluded no triggering event occurred in the fiscal 2016 third quarter.
Goodwill Impairment Loss
In the fiscal 2016 third quarter the Company determined that a triggering event occurred for its Vista reporting unit, a subsidiary of the Aerostar division. The triggering event was caused by the lowering of financial expectations for sales and operating income of the reporting unit due to delays and uncertainties regarding the reporting unit’s pursuit of large international opportunities. Despite the Company having a pre-authorization letter from the prime contractor and being in negotiations on a large international contract through the fiscal 2016 second quarter, the contract did not materialize in the fiscal 2016 third quarter as expected. Expectations were lowered as the timing and likelihood of completing certain international pursuits became less certain. In addition, the Company made a change in the executive leadership of the reporting unit during the third quarter. The Step 1 impairment analysis was completed using fair value techniques as of October 31, 2015. In determining the estimated fair value of the Vista reporting unit, the Company was required to make assumptions and estimate a number of factors, including projected revenue growth rates (particularly those related to being successful in being awarded large, international contracts and the timing thereof), operating profit margin percentage, and the discount rate. On the basis of these estimates, the October 31, 2015 analysis indicated that the estimated fair value of the Vista reporting unit was less than the carrying value. The carrying value exceeded the estimated fair value by approximately $8,000.
Pursuant to the applicable accounting guidance, the Company performed a Step 2 impairment analysis for the Vista reporting unit. In the Step 2 impairment analysis, the fair value determined was allocated to the assets and liabilities of the reporting unit. The resulting implied fair value of the Vista goodwill was $7,413 less than the carrying value recorded for the reporting unit. This $7,413 shortfall was recorded in the fiscal 2016 third quarter as an impairment charge to operating income reported as "Goodwill impairment loss" in the Consolidated Statements of Income and Comprehensive Income.
Goodwill gross of accumulated impairment losses at January 31, 2016, 2015, and 2014 was $52,169, $52,148, and $22,274, respectively. Goodwill net of accumulated impairment losses at January 31, 2016, 2015 and 2014 was $44,756, $52,148, and $22,274, respectively.
Intangible Assets
The following table provides the gross carrying amount and related accumulated amortization of definite-lived intangible assets:
| | | | | | | | | | | | | | | | | | | | | | | | | | | | |
| | | For the years ended January 31, | | For the years ended January 31, |
| | | 2013 | | 2012 | | 2011 | | 2016 | | 2015 | | 2014 |
| | | | Accumulated | | | | Accumulated | | | | Accumulated | | | | Accumulated | | | | Accumulated | | | | Accumulated | |
| | | Amount | Amortization | Net | | Amount | Amortization | Net | | Amount | Amortization | Net | | Amount | Amortization | Net | | Amount | Amortization | Net | | Amount | Amortization | Net |
| Existing technology | | $ | 7,500 |
| $ | (3,375 | ) | $ | 4,125 |
| | $ | 7,500 |
| $ | (2,637 | ) | $ | 4,863 |
| | $ | 3,200 |
| $ | (2,159 | ) | $ | 1,041 |
| | $ | 8,825 |
| $ | (6,487 | ) | $ | 2,338 |
| | $ | 8,870 |
| $ | (5,239 | ) | $ | 3,631 |
| | $ | 7,840 |
| $ | (4,164 | ) | $ | 3,676 |
|
| Customer relationships | | 3,494 |
| (300 | ) | 3,194 |
| | 3,494 |
| (155 | ) | 3,339 |
| | 234 |
| (128 | ) | 106 |
| | 14,101 |
| (2,794 | ) | 11,307 |
| | 14,128 |
| (1,271 | ) | 12,857 |
| | 3,494 |
| (525 | ) | 2,969 |
|
| Other intangibles | | 2,506 |
| (1,144 | ) | 1,362 |
| | 2,225 |
| (1,015 | ) | 1,210 |
| | 1,426 |
| (988 | ) | 438 |
| | 4,065 |
| (1,878 | ) | 2,187 |
| | 3,657 |
| (1,655 | ) | 2,002 |
| | 2,891 |
| (1,380 | ) | 1,511 |
|
| Total | | $ | 13,500 |
| $ | (4,819 | ) | $ | 8,681 |
| | $ | 13,219 |
| $ | (3,807 | ) | $ | 9,412 |
| | $ | 4,860 |
| $ | (3,275 | ) | $ | 1,585 |
| | $ | 26,991 |
| $ | (11,159 | ) | $ | 15,832 |
| | $ | 26,655 |
| $ | (8,165 | ) | $ | 18,490 |
| | $ | 14,225 |
| $ | (6,069 | ) | $ | 8,156 |
|
(Dollars in thousands, except per-share amounts)
The estimated future amortization expense for these definite-lived intangible assets, as well as definite-lived intangible assets held by SST, during the next five years is as follows: |
| | | | | | | | | | | | | | | | | | | | |
| | | 2014 | | 2015 | | 2016 | | 2017 | | 2018 |
| Estimated amortization expense | | $ | 1,688 |
| | $ | 2,124 |
| | $ | 2,321 |
| | $ | 2,150 |
| | $ | 1,528 |
|
|
| | | | | | | | | | | | | | | | | | | | |
| | | 2017 | | 2018 | | 2019 | | 2020 | | 2021 |
| Estimated amortization expense | | $ | 3,514 |
| | $ | 2,873 |
| | $ | 2,018 |
| | $ | 1,464 |
| | $ | 1,067 |
|
|
| |
| NOTE 7 | EMPLOYEE POSTRETIREMENT BENEFITS |
The Company has two 401(k) plans covering substantially all employees as of January 31, 2013.2016. One plan, which covers the majority of employees, matches employee contributions up to 4%. Under this plan all account balances and future contributions and related earnings can be invested in several investment alternatives as well as the Company's common stock in accordance with each participant's elections. Participants' contributions to the 401(k) and the employer matching contributions are limited to 20% investment in the Company's common stock. Participants may choose to make separate investment choices for current account balances and for future contributions. Officers of the Company may not include Raven's common stock in their 401(k) plan elections.
The other 401(k) plan was assumed as part of the Vista acquisition. ContributionsEmployee contributions under this plan includeare matched up to 4% under an amendment in fiscal 2015 to eliminate a 3% annual contribution and may includeto eliminate a provision allowing an additional annual discretionary contributionscontribution. The Company also assumed an additional 401(k) profit sharing plan as part of the Integra acquisition. This plan was merged into Raven's 401(k) plan on December 31, 2014. The Company also contributes to the plan thatpost-retirement and pensions as are determined annually by management.required or customary for employees in foreign locations. Total 401(k) contribution expense for bothto all such plans was $2,0211,952, $1,5562,416, and $1,2542,412 for fiscal 20132016, 20122015, and 20112014, respectively.
In addition, the Company provides postretirement medical and other benefits to senior executive officers and senior managers. ThereThese plan obligations are no assets held forunfunded. On August 25, 2015 the Company amended the employment agreements with five of its senior executive officers eliminating the postretirement plansmedical benefits to these individuals and any obligationstheir spouses. In consideration of eliminating this retiree benefit, the senior executive officers received lump sum payments in amounts ranging from $8 to $15 based on each officer’s years of service to the Company. The Company’s current senior executive officers that either already qualified for retirement or had twenty or more years of service to the Company are covered through operating cashstill eligible for benefits under their employment agreements. The elimination of coverage for these executives reduced the benefit obligation due to prior service by approximately
$1,000 as of August 31, 2015. The amount was recognized as a negative plan amendment and investments.amortized over the average remaining years of service to full eligibility for active participants not yet fully eligible for benefits as of August 31, 2015. The accumulated benefit obligation, including the impact of the August 31, 2015 remeasurement resulting from the plan amendment, for these benefits is as follows:
| | | | | For the years ended January 31, | | For the years ended January 31, |
| | | 2013 | | 2012 | | 2011 | | 2016 | | 2015 | | 2014 |
| Benefit obligation at beginning of year | | $ | 7,560 |
| | $ | 5,969 |
| | $ | 5,512 |
| | $ | 12,125 |
| | $ | 8,254 |
| | $ | 8,307 |
|
| Service cost | | 187 |
| | 121 |
| | 62 |
| | 285 |
| | 195 |
| | 202 |
|
| Interest cost | | 335 |
| | 334 |
| | 324 |
| | 386 |
| | 366 |
| | 348 |
|
| Actuarial loss and assumption changes | | 433 |
| | 1,363 |
| | 237 |
| |
| Amendments | | | (958 | ) | | — |
| | — |
|
| Actuarial (gain) loss and assumption changes | | | (3,544 | ) | | 3,543 |
| | (340 | ) |
| Retiree benefits paid | | (208 | ) | | (227 | ) | | (166 | ) | | (303 | ) | | (233 | ) | | (263 | ) |
| Benefit obligation at end of year | | $ | 8,307 |
| | $ | 7,560 |
| | $ | 5,969 |
| | $ | 7,991 |
| | $ | 12,125 |
| | $ | 8,254 |
|
| | | | | | | | |
(Dollars in thousands, except per-share amounts)
The following tables set forth the plansplan's pre-tax adjustment to accumulated other comprehensive income/loss (AOCI):loss: | | | | | For the years ended January 31, | | For the years ended January 31, |
| | | 2013 | | 2012 | | 2011 | | 2016 | | 2015 | | 2014 |
| Amounts not yet recognized in net periodic benefit cost: | | | | | | | | | | | | |
| Net actuarial loss | | $ | 3,441 |
| | $ | 3,218 |
| | $ | 1,912 |
| | $ | 2,504 |
| | $ | 6,309 |
| | $ | 2,918 |
|
| Transition obligation | | — |
| | 23 |
| | 45 |
| |
| Prior service cost | | | (892 | ) | | — |
| | — |
|
| Total pre-tax accumulated other comprehensive loss | | $ | 3,441 |
| | $ | 3,241 |
| | $ | 1,957 |
| | $ | 1,612 |
| | $ | 6,309 |
| | $ | 2,918 |
|
| | | | | | | | | | | | | |
| Pre-tax accumulated other comprehensive loss - beginning of year related to benefit obligation | | $ | 3,241 |
| | $ | 1,957 |
| | $ | 1,935 |
| | $ | 6,309 |
| | $ | 2,918 |
| | $ | 3,441 |
|
| Reclassification adjustments recognized in benefit cost: | | | | | | | | | | | | |
| Recognized net (loss) | | (210 | ) | | (104 | ) | | (144 | ) | | (261 | ) | | (152 | ) | | (183 | ) |
| Amortization of transition obligation | | (23 | ) | | (23 | ) | | (23 | ) | |
| Amortization of prior service cost | | | 66 |
| | — |
| | — |
|
| Amounts recognized in AOCI during the year: | | | | | | | | | | | | |
| Net actuarial loss | | 433 |
| | 1,411 |
| | 189 |
| |
| Prior service cost from amendments | | | (958 | ) | | — |
| | — |
|
| Net actuarial (gain) loss | | | (3,544 | ) | | 3,543 |
| | (340 | ) |
| Pre-tax accumulated other comprehensive loss - end of year related to benefit obligation | | $ | 3,441 |
| | $ | 3,241 |
| | $ | 1,957 |
| | $ | 1,612 |
| | $ | 6,309 |
| | $ | 2,918 |
|
The net actuarial gain for fiscal year 2016 was the result of an increase in the discount rate, lower than expected claims, updated trend rates, and application of updated mortality assumptions. The net actuarial loss for fiscal year 20132015 was driven bythe result of a decrease in the discount rate and demographic changes, offset by better than expected claims experience.application of updated mortality assumptions. The net actuarial lossgain in fiscal year 2012 was primarily caused by the decrease in discount rate. The net actuarial loss in fiscal year 20112014 was driven by an increase in the ultimate health care trend rate and a decrease in the discount rate, offset by lower than expected claims.rate.
(Dollars in thousands, except per-share amounts)
The liability and net periodic benefit cost reflected in the Consolidated Balance Sheets and Consolidated Statements of Income and Comprehensive Income were as follows:
|
| | | | | | | | | | | | |
| | | For the years ended January 31, |
| | | 2016 | | 2015 | | 2014 |
| Beginning liability balance | | $ | 12,125 |
| | $ | 8,254 |
| | $ | 8,307 |
|
| Net periodic benefit cost | | 866 |
| | 713 |
| | 733 |
|
| Other comprehensive (income) loss | | (4,697 | ) | | 3,391 |
| | (523 | ) |
| Total recognized in net periodic benefit cost and other comprehensive income | | (3,831 | ) | | 4,104 |
| | 210 |
|
| Retiree benefits paid | | (303 | ) | | (233 | ) | | (263 | ) |
| Ending liability balance | | $ | 7,991 |
| | $ | 12,125 |
| | $ | 8,254 |
|
| | | | | | | |
| Current portion in accrued liabilities | | $ | 329 |
| | $ | 313 |
| | $ | 255 |
|
| Long-term portion in other liabilities | | $ | 7,662 |
| | $ | 11,812 |
| | $ | 7,999 |
|
| | | | | | | |
| Assumptions used to calculate benefit obligation: | | | | | | |
| Discount rate | | 4.25 | % | | 3.50 | % | | 4.50 | % |
| Rate of compensation increase | | 4.00 | % | | 4.00 | % | | 4.00 | % |
| Health care cost trend rates: | | | | | | |
| Health care cost trend rate assumed for next year | | 6.83%(a) | 7.00%(b) |
| | 7.20 | % | | 7.70 | % |
| Ultimate health care cost trend rate | | 4.50%(a) | 5.00%(b) |
| | 5.00 | % | | 5.00 | % |
| Year that the rate reaches the ultimate trend rate | | 2030(a) | 2025(b) | | 2025 |
| | 2025 |
|
| Assumptions used to calculated the net periodic benefit cost: | | | | | | |
| Discount rate | | 4.25%(a) | 3.50%(b) |
| | 4.50 | % | | 4.25 | % |
Rate of compensation increase
| | 4.00 | % | | 4.00 | % | | 4.00 | % |
| | | | | | | |
|
| | | | | | | | | | | | |
| | | For the years ended January 31, |
| | | 2013 | | 2012 | | 2011 |
| Beginning liability balance | | $ | 7,560 |
| | $ | 5,969 |
| | $ | 5,512 |
|
| Net periodic benefit cost | | 755 |
| | 582 |
| | 552 |
|
| Other comprehensive (income) loss | | 200 |
| | 1,236 |
| | 71 |
|
| Total recognized in net and other comprehensive income | | 955 |
| | 1,818 |
| | 623 |
|
| Retiree benefits paid | | (208 | ) | | (227 | ) | | (166 | ) |
| Ending liability balance | | $ | 8,307 |
| | $ | 7,560 |
| | $ | 5,969 |
|
| | | | | | | |
| Current portion in accrued liabilities | | $ | 235 |
| | $ | 212 |
| | $ | 212 |
|
| Long-term portion in other liabilities | | $ | 8,072 |
| | $ | 7,348 |
| | $ | 5,757 |
|
| Assumptions used to calculate benefit obligation: | | | | | | |
| Discount rate | | 4.25 | % | | 4.50 | % | | 5.75 | % |
| Wage inflation rate | | 4.00 | % | | 4.00 | % | | 4.00 | % |
| Health care cost trend rates: | | | | | | |
| Health care cost trend rate assumed for next year | | 8.10 | % | | 8.60 | % | | 9.00 | % |
| Ultimate health care cost trend rate | | 5.00 | % | | 5.00 | % | | 5.00 | % |
| Year that the rate reaches the ultimate trend rate | | 2025 |
| | 2025 |
| | 2025 |
|
The discount rate is based on matching rates of return on high-quality fixed-income investments with the timing and amount of expected benefit payments. No material fluctuations in retiree benefit payments are expected in future years. The total estimated cost to be recognized from AOCI into net periodic benefit cost over the next fiscal year is $(13); $146 of recognized net loss and
$182.(159) of amortized prior service cost.
The assumed health care cost trend rate has a significant effect on the amounts reported. The impact of a one-percentage point change in assumed health care rates would have the following effects:
|
| | | | | | | | |
| | | January 31, 2013 |
| | | One-percentage-point increase | | One-percentage-point decrease |
| Effect on total of service and interest cost components | | $ | 75 |
| | $ | (53 | ) |
| | | | | |
| Effect on accumulated postretirement benefit obligation | | $ | 1,588 |
| | $ | (1,288 | ) |
|
| | | | | | | | |
| | | January 31, 2016 |
| | | One-percentage-point increase | | One-percentage-point decrease |
| Effect on total of service and interest cost components | | $ | 89 |
| | $ | (68 | ) |
| Effect on accumulated postretirement benefit obligation | | $ | 1,445 |
| | $ | (1,129 | ) |
ChangesThe Company expects to make $329 in the warranty accrual werepostretirement medical and other benefit payments in fiscal 2017. The following postretirement other than pension benefit payments, which reflect expected future service as follows:appropriate, are expected to be paid:
|
| | | | | | | | | | | | |
| | | For the years ended January 31, |
| | | 2013 | | 2012 | | 2011 |
| Beginning balance | | $ | 1,699 |
| | $ | 1,437 |
| | $ | 1,259 |
|
| Acquired | | — |
| | 192 |
| | — |
|
| Accrual for warranties | | 2,968 |
| | 3,010 |
| | 2,461 |
|
| Settlements made (in cash or in kind) | | (2,779 | ) | | (2,940 | ) | | (2,283 | ) |
| Ending balance | | $ | 1,888 |
| | $ | 1,699 |
| | $ | 1,437 |
|
|
| | | | | |
| Fiscal | 2017 | | $ | 329 |
|
| Fiscal | 2018 | | 350 |
|
| Fiscal | 2019 | | 352 |
|
| Fiscal | 2020 | | 347 |
|
| Fiscal | 2021 - 2025 | | 2,299 |
|
(Dollars in thousands, except per-share amounts)
Changes in the warranty accrual were as follows:
|
| | | | | | | | | | | | |
| | | For the years ended January 31, |
| | | 2016 | | 2015 | | 2014 |
| Beginning balance | | $ | 3,120 |
| | $ | 2,525 |
| | $ | 1,888 |
|
| Acquired | | — |
| | 50 |
| | — |
|
| Accrual for warranties | | 1,945 |
| | 3,467 |
| | 4,561 |
|
| Settlements made | | (3,230 | ) | | (2,922 | ) | | (3,924 | ) |
| Ending balance | | $ | 1,835 |
| | $ | 3,120 |
| | $ | 2,525 |
|
The reconciliation of income tax computed at the federal statutory rate to the Company's effective income tax rate was as follows: | | | | | For the years ended January 31, | | For the years ended January 31, |
| | | 2013 | | 2012 | | 2011 | | 2016 | | 2015 | | 2014 |
| Tax at U.S. federal statutory rate | | 35.0 | % | | 35.0 | % | | 35.0 | % | | 35.0 | % | | 35.0 | % | | 35.0 | % |
| State and local income taxes, net of U.S. federal tax benefit | | 1.6 |
| | 1.0 |
| | 1.3 |
| | 2.1 |
| | (0.3 | ) | | 1.5 |
|
| Tax credit for research activities | | | (8.8 | ) | | (3.9 | ) | | (1.2 | ) |
| Tax benefit on insurance premiums | | | (3.9 | ) | | (1.0 | ) | | — |
|
| Tax benefit on qualified production activities | | (3.2 | ) | | (2.4 | ) | | (3.0 | ) | | (3.8 | ) | | (3.6 | ) | | (2.9 | ) |
| Tax credit for research activities | | (0.9 | ) | | (0.7 | ) | | (0.7 | ) | |
| Other, net | | (0.2 | ) | | 0.2 |
| | 0.2 |
| | — |
| | 0.7 |
| | 0.2 |
|
| | | 32.3 | % | | 33.1 | % | | 32.8 | % | | 20.6 | % | | 26.9 | % | | 32.6 | % |
The decrease in the effective rate for fiscal 2015 is primarily due to the permanent extension of the research and development tax credit retroactive to January 1, 2015. The tax benefit for qualified production activities is also slightly higher as a percentage. While pre-tax income is lower in the current year, the tax benefit for qualified production activities is based on estimated taxable income. Taxable income is higher in comparison to pre-tax income for period ended January 31, 2016 due to the goodwill impairment loss recorded. This impairment, described further in Note 6 Goodwill and Other Intangible Assets, does not reduce taxable income. Rather, goodwill is amortized over 15 years for tax purposes.
The effective tax rate for fiscal 2015 was impacted favorably by recognition of a $776 research and development tax credit based upon a tax study undertaken for fiscal years 2011 through 2014. The Company also recorded a $963 discrete tax benefit in fiscal 2015 after reaching a favorable tax settlement with a state tax authority on a previously recorded uncertain tax position.
Significant components of the Company's income tax provision were as follows:
| | | | | For the years ended January 31, | | For the years ended January 31, |
| | | 2013 | | 2012 | | 2011 | | 2016 | | 2015 | | 2014 |
| Income taxes: | | | | | | | | | | | | |
| Currently payable | | $ | 26,894 |
| | $ | 19,705 |
| | $ | 19,322 |
| | $ | 5,242 |
| | $ | 12,663 |
| | $ | 20,098 |
|
| Deferred (benefit) expense | | (1,803 | ) | | 5,358 |
| | 423 |
| | (3,021 | ) | | (958 | ) | | 623 |
|
| | | $ | 25,091 |
| | $ | 25,063 |
| | $ | 19,745 |
| | $ | 2,221 |
| | $ | 11,705 |
| | $ | 20,721 |
|
(Dollars in thousands, except per-share amounts)
Deferred Tax Assets
Deferred income taxes reflect the net tax effects of temporary differences between the carrying amounts of assets and liabilities for financial reporting purposes and the amounts used for income tax purposes. Significant components of the Company's deferred tax assets and liabilities were as follows:
| | | | | As of January 31, | | As of January 31, |
| | | 2013 | | 2012 | | 2011 | | 2016 | | 2015 | | 2014 |
| Current deferred tax assets: | | | | | | | | | | | | |
| Accounts receivable | | $ | 70 |
| | $ | 58 |
| | $ | 103 |
| | $ | 355 |
| | $ | 194 |
| | $ | 111 |
|
| Inventories | | 507 |
| | 452 |
| | 463 |
| | 602 |
| | 873 |
| | 583 |
|
| Accrued vacation | | 1,118 |
| | 1,248 |
| | 1,008 |
| | 836 |
| | 940 |
| | 1,032 |
|
| Insurance obligations | | 576 |
| | 559 |
| | 485 |
| | 350 |
| | 271 |
| | 276 |
|
| Accrued benefit liabilities | | | 99 |
| | 261 |
| | 291 |
|
| Warranty obligations | | 661 |
| | 595 |
| | 503 |
| | 670 |
| | 1,225 |
| | 898 |
|
| Other accrued liabilities | | 175 |
| | 387 |
| | 171 |
| | 198 |
| | 194 |
| | 181 |
|
| | | 3,107 |
| | 3,299 |
| | 2,733 |
| | 3,110 |
| | 3,958 |
| | 3,372 |
|
| | | | | | | | | | | | | |
| Non-current deferred tax assets (liabilities): | | | | | | | | | | | | |
| Postretirement benefits | | 2,826 |
| | 2,571 |
| | 2,014 |
| | 2,797 |
| | 4,243 |
| | 2,799 |
|
| Depreciation and amortization | | (9,114 | ) | | (9,673 | ) | | (3,050 | ) | | (12,195 | ) | | (16,099 | ) | | (11,522 | ) |
| Uncertain tax positions | | 1,969 |
| | 1,673 |
| | 1,426 |
| | 1,047 |
| | 1,002 |
| | 2,219 |
|
| Share-based compensation | | 1,613 |
| | 981 |
| | 601 |
| | 3,593 |
| | 4,410 |
| | 3,196 |
|
| Other | | 253 |
| | (70 | ) | | (67 | ) | | (668 | ) | | (647 | ) | | (218 | ) |
| | | (2,453 | ) | | (4,518 | ) | | 924 |
| | (5,426 | ) | | (7,091 | ) | | (3,526 | ) |
| Net deferred tax asset (liability) | | $ | 654 |
| | $ | (1,219 | ) | | $ | 3,657 |
| |
| Net deferred tax (liability) | | | $ | (2,316 | ) | | $ | (3,133 | ) | | $ | (154 | ) |
Pre-tax book income (loss) for the U.S. companies and the Canadian subsidiaryforeign subsidiaries was $76,680$9,980 and $900,$802, respectively. As of January 31, 2013,2016, undistributed earnings of $1,975 of the Canadian subsidiaryand European subsidiaries and were considered to have been reinvested indefinitely and, accordingly, the Company has not provided United States income taxes on such earnings. This estimated tax liability would be approximately $319 net of foreign tax credits.
(Dollars in thousands, except per-share amounts)
Uncertain Tax Positions
A summary of the activity related to the gross unrecognized tax benefits (excluding interest and penalties) is as follows:
| | | | | For the years ended January 31, | | For the years ended January 31, |
| | | 2013 | | 2012 | | 2011 | | 2016 | | 2015 | | 2014 |
| Gross unrecognized tax benefits at beginning of year | | $ | 3,567 |
| | $ | 3,112 |
| | $ | 2,656 |
| | $ | 2,307 |
| | $ | 4,660 |
| | $ | 4,213 |
|
| Increases in tax positions related to the current year | | 993 |
| | 699 |
| | 601 |
| | 209 |
| | 909 |
| | 795 |
|
| Decreases as a result of lapses in applicable statutes of limitation | | (347 | ) | | (244 | ) | | (145 | ) | | (227 | ) | | (393 | ) | | (348 | ) |
| Tax settlement with tax authorities | | | — |
| | (2,869 | ) | | — |
|
| Gross unrecognized tax benefits at end of year | | $ | 4,213 |
| | $ | 3,567 |
| | $ | 3,112 |
| | $ | 2,289 |
| | $ | 2,307 |
| | $ | 4,660 |
|
During the fiscalFiscal year ended January 31, 2013, the only change2016 changes to uncertain tax positions related to prior years resulted from the lapselapses of applicable statutes of limitation.limitation and fiscal year 2015 included a favorable settlement reached with a state tax authority. The total unrecognized tax benefits that, if recognized, would affect the Company's effective tax rate were $2,738, $2,318$1,631, $1,617, and $2,023$3,029 as of January 31, 2013, January 31, 20122016, 2015, and January 31, 2011,2014, respectively.
The Company does not expect any significant change in the amount of unrecognized tax benefits in the next fiscal year.
The Company recognizes interest and penalties accrued related to unrecognized tax benefits in income tax expense. At January 31, 2013, January 31, 20122016, 2015, and January 31, 2011,2014, accrued interest and penalties were $1,605, $1,379$1,051, $952, and $1,112,$1,897, respectively.
The Company files tax returns, including returns for its subsidiaries, with various federal, state, and local jurisdictions. Uncertain tax positions are related to tax years that remain subject to examination. As of January 31, 2013,2016, federal tax returns filed in the U.S., Canada and Switzerland for fiscal years ended January 31, 20082010 through January 31, 20122015 remain subject to examination by federal tax authorities. In state and local jurisdictions, tax returns for fiscal years ended January 31, 20052008 through January 31, 20122015 remain subject to examination by state and local tax authorities.
(Dollars in thousands, except per-share amounts)
|
| |
| NOTE 10 | FINANCING ARRANGEMENTS |
Raven has an
On April 15, 2015 the Company's uncollateralized credit agreement with Wells Fargo Bank, N.A. (Wells Fargo) providing a line of credit of $10,500$10,500 and maturing on November 30, 2016 was terminated upon the Company's entering into a new credit facility.
This new credit facility, the Credit Agreement dated as of April 15, 2015 among Raven Industries, Inc., JPMorgan Chase Bank, N.A., Toronto Branch as Canadian Administrative Agent, JPMorgan Chase Bank, National Association, as administrative agent, and each lender from time to time party thereto (the Credit Agreement), provides for a syndicated senior revolving credit facility up to $125,000 with a maturity date of November 30, 2013, bearing interest at 1.5% above the daily one month London Inter-Bank Market Rate (LIBOR). Letters of credit totaling $992 have been issuedApril 15, 2020. Wells Fargo, a participating lender under the line, primarily to support self-insured workers' compensation bonding requirements. No borrowings were outstanding as of January 31, 2013, 2012 and 2011 and $9,508 was available at January 31, 2013. There have been no borrowings under the credit line with Wells Fargo in the last three fiscal years.
In addition to providing the line of credit Wells FargoCredit agreement holds the majority of Raven'sthe Company's cash and cash equivalents. One member of the Company's Board of Directors is also on the Board of Directors of Wells Fargo & Company, the parent company of Wells Fargo.
Unamortized debt issuance costs associated with this Credit Agreement were $461 at January 31, 2016. Loans or borrowings defined under the Credit Agreement bear interest and fees at varying rates and terms defined in the Credit Agreement based on the type of borrowing as defined. The Credit Agreement includes annual administrative and unborrowed capacity fees of $213. The Credit Agreement also contains customary affirmative and negative covenants, including those relating to financial reporting and notification, limits on levels of indebtedness and liens, investments, mergers and acquisitions, affiliate transactions, sales of assets, restrictive agreements, and change in control as defined in the Credit Agreement. Financial covenants include an interest coverage ratio and funded indebtedness to earnings before interest, taxes, depreciation, and amortization as defined in the Credit Agreement. $125,000 was available under the Credit Agreement for borrowings as of January 31, 2016. The loan proceeds may be utilized by Raven assumedfor strategic business purposes and for working capital needs.
Simultaneous with execution of the Credit Agreement, Raven, Aerostar, Vista, and Integra entered into a revolvingguaranty agreement in favor of JPMorgan Chase Bank National Association in its capacity as administrator under the Credit Agreement for the benefit of JPMorgan Chase Bank N.A., Toronto Branch and the lenders and their affiliates under the Credit Agreement.
Letters of credit totaling $664, issued under the previous line of credit with Wells Fargo primarily to support self-insured workers' compensation bonding requirements, remain in place. The Company expects to have these outstanding letters of credit issued under the credit facility. Until such time as that is complete, any draws required under these letters of credit would be settled with available cash or borrowings under the new Credit Agreement.
There were no borrowings outstanding under either credit agreement for any of the fiscal periods covered by this Annual Report on Form 10-K. There have been no borrowings under either credit agreement in the amountlast three fiscal years. The Company is in compliance with all financial covenants set forth in the Credit Agreement.
Pursuant to the acquisition of SBG and Integra in fiscal year 2015 as described in Note 5 $2,869Acquisitions of and Investments in Businesses and Technologies, as partthe Company assumedliabilities including debts to former owners, a line of credit and long-term notes. Although there was a short-term working capital borrowing under Integra's line of credit, such borrowing and assumed debt was subsequently paid in full and the Vista acquisition. The outstanding balance on this line of credit was paidclosed. There was no assumed debt outstanding at January 31, 2016, 2015 and subsequently closed2014. The changes in January 2012. the outstanding debt are shown below:
|
| | | | | | | | | | | | | | | | |
| | | Line of credit | | Long-term notes | | Notes with former owners and others | | Debt Outstanding |
| Balance at January 31, 2013 | | $ | — |
| | $ | — |
| | $ | — |
| | $ | — |
|
| Balance at January 31, 2014 | | — |
| | — |
| | — |
| | — |
|
| Acquired in business combination | | 1,465 |
| | 9,876 |
| | 648 |
| | 11,989 |
|
| Additional borrowings | | 2,127 |
| | — |
| | — |
| | 2,127 |
|
| Debt repayment | | (3,592 | ) | | (9,876 | ) | | (648 | ) | | (14,116 | ) |
| Balance at January 31, 2015 | | $ | — |
| | $ | — |
| | $ | — |
| | $ | — |
|
| Balance at January 31, 2016 | | $ | — |
| | $ | — |
| | $ | — |
| | $ | — |
|
(a) No additional borrowings were made under thisThe line of credit prior to its being closed.and long-term notes were assumed in the Integra business combination. The notes with former owners and others were assumed in the SBG business combination.
The Company leases certain vehicles, equipment, and facilities under operating leases. Total rent and lease expense was $2,095, $759$1,977 and $546$2,395 in fiscal 20132016, 20122015, and 20112014, respectively.
(Dollars in thousands, except per-share amounts)
Future minimum lease payments under non-cancelable operating leases are as follows:
|
| | | | | | | | | | | | | | | | | | | | | | | | |
| | | 2014 | | 2015 | | 2016 | | 2017 | | 2018 | | Thereafter |
| Minimum lease payments | | $ | 1,478 |
| | $ | 1,266 |
| | $ | 1,053 |
| | $ | 202 |
| | $ | 121 |
| | $ | — |
|
|
| | | | | | | | | | | | | | | | | | | | | | | | |
| | | 2017 | | 2018 | | 2019 | | 2020 | | 2021 | | Thereafter |
| Minimum lease payments | | $ | 1,661 |
| | $ | 1,394 |
| | $ | 1,126 |
| | $ | 1,150 |
| | $ | 1,179 |
| | $ | — |
|
In the normal course of business, the Company is subject to various claims and litigation. The Company has concluded that the ultimate outcome of these matters is not expected to be material to the Company’s results of operations, financial position, or cash flows.
|
| |
| NOTE 12 | RESTRUCTURING COSTS |
In the fiscal 2015 fourth quarter, the Company announced and implemented a restructuring plan to lower Applied Technology’s cost structure in response to weak commodity prices, eroding grower sentiment, reduced demand for precision agricultural equipment, and the anticipated revenue decline of non-strategic legacy customers. In the same period, Engineered Films implemented a preemptive restructuring plan to address the decline in demand in the energy sector as the result of falling oil prices. In addition to reducing its international sales infrastructure, scaling back marketing initiatives, lowering general manufacturing overhead, and focusing R&D spending on core product lines, the Company initiated the exit of Applied Technology’s non-strategic St. Louis, Missouri contract manufacturing facility.
As a result of these actions, the Company incurred restructuring costs of approximately $399 for the fiscal year ended January 31, 2015. Such costs were principally severance benefits which were $308 for Applied Technology and $91 for Engineered Films. The Company reported $250 of this expense in "Cost of sales" and $149 in "Selling, general, and administrative expenses" in the Consolidated Statements of Income and Comprehensive Income. Approximately $344 of these restructuring costs were paid in fiscal 2015 and $55 were paid in fiscal 2016.
Subsequent to the end of fiscal 2015, the Company announced that Applied Technology's remaining contract manufacturing operations in the St. Louis, Missouri area had been successfully sold and transferred. The exit activities related to this sale and transfer were substantially completed during the fiscal 2016 first quarter. Gains of $611 were recorded in fiscal 2016 as a result of the exit activity. Receivables for inventory and estimated future royalties pursuant to the sale agreements were $255 and are reflected in "Other current assets" in the Consolidated Balance Sheet at January 31, 2016.
With continued weak end-market demand in the Engineered Films and Applied Technology divisions, on March 10, 2015 the Company announced and implemented an additional restructuring plan to further lower its cost structure. The cost reductions covered all divisions and included the corporate offices, but were weighted to Applied Technology as a result of the decline in this business and the expectation of continued end-market weakness for this division.
As a result of this action, the Company incurred restructuring costs for severance benefits of $588 for the year ended January 31, 2016. The Company reported $407 of restructuring expense in "Cost of sales" and $181 in "Selling, general, and administrative expenses" in the Consolidated Statements of Income and Comprehensive Income for fiscal 2016. Substantially all of these restructuring costs related to Applied Technology. This restructuring plan was completed during the fiscal 2016 second quarter.
In October 2015, the Company's Aerostar Division implemented a restructuring plan at Vista due to reduced demand expectations primarily related to delays and uncertainty surrounding international pursuits. The lower cost structure will help to preserve the Company's capabilities to pursue domestic and international opportunities for Vista's radar products and technology.
Restructuring costs for severance benefits were $73 for the year ended January 31, 2016. The Company reported $58 of this expense in "Cost of sales" and $15 in "Research and development expenses" in the Consolidated Statements of Income and Comprehensive Income. This restructuring plan was completed during fiscal 2016 fourth quarter and there were no unpaid costs at January 31, 2016.
(Dollars in thousands, except per-share amounts)
|
| |
NOTE 1113 | SHARE-BASED COMPENSATION |
At January 31, 20132016, Raventhe Company had two shareholder approved share-based compensation plans, which are described below. The compensation cost and related income tax benefit for these plans were as follows:
| | | | | For the years ended January 31, | | For the years ended January 31, |
| | | 2013 | | 2012 | | 2011 | | 2016 | | 2015 | | 2014 |
| Share-based compensation cost | | $ | 3,075 |
| | $ | 1,922 |
| | $ | 1,179 |
| | $ | 2,311 |
| | $ | 4,213 |
| | $ | 4,198 |
|
| Tax benefit | | 1,057 |
| | 547 |
| | 272 |
| |
| Tax (expense) benefit | | | (692 | ) | | 1,504 |
| | 1,460 |
|
(Dollars in thousands, except per-share amounts)
Share-based compensation cost capitalized as part of inventory is not significant.
Equity Compensation Plans
The Company reserved shares of its common stock for issuance to directors, officers, employees, and certain advisors of the Company through incentive stock options and non-statutory stock options, stock appreciation rights, stock awards, restricted stock, restricted stock units (RSUs), and performance awards to be granted under the Amended and Restated 2010 Stock Incentive Plan (the Plan) effective which was approved by shareholders on May 22, 2012. The aggregate number of shares initially available for which options may be granted under the Plan was 2,000,000. As of January 31, 2013,2016, the number of shares available for grant under the Plan was 1,154,366.1,293,876. Option exercises under the Plan are settled in newly issued common shares.
The Plan is administered by the Personnel and Compensation Committee of the Board of Directors (the Committee), consisting of two or more independent directors of the Company. Subject to the provisions set forth in the Plan, all of the members of the Committee shall be non-employee members of the Board of Directors. The Committee determines the option exercise prices. Theprices and the term of each grant is determined by the Committee.grant. The Committee may accelerate the exercisability of awards under the Plan or extend the term of such awards to the extent allowed by the Plan to a maximum term of ten years. Two types of awards were granted under the Plan in fiscal 2013.2015, stock options and restricted stock units.
Stock Option Awards
On April 2, 2012, theThe Company granted 151,200289,600 non-qualified stock options. On August 27, 2012, the Company granted an additional 7,600 non-qualified stock options.options during fiscal 2016. Options are granted with exercise prices not less than the market value of the Company's common stock at the date of grant. The stock options vest over a four-year period and expire after five years. Options contain retirement and change-in-control provisions that may accelerate the vesting period. The fair value of each option grant is estimated on the date of grant using the Black-Scholes option pricing model. The Company uses historical data to estimate option exercises, employee terminations, and volatility within this valuation model.
The weighted average assumptions used for the Black-Scholes option pricing model by grant year are as follows:
| | | | | For the years ended January 31, | | For the years ended January 31, |
| | | 2013 | | 2012 | | 2011 | | 2016 | | 2015 | | 2014 |
| Risk-free interest rate | | 0.86 | % | | 0.67 | % | | 1.46 | % | | 1.33 | % | | 1.32 | % | | 0.59 | % |
| Expected dividend yield | | 1.33 | % | | 1.2 | % | | 1.49 | % | | 2.59 | % | | 1.53 | % | | 1.46 | % |
| Expected volatility factor | | 49.62 | % | | 51.44 | % | | 49.33 | % | | 36.81 | % | | 38.65 | % | | 41.39 | % |
| Expected option term (in years) | | 3.75 |
| | 4.00 |
| | 4.50 |
| | 3.75 |
| | 4.00 |
| | 3.75 |
|
| | | | | | | | | | | | | |
| Weighted average grant date fair value | | $ | 10.92 |
| | $ | 11.05 |
| | $ | 7.85 |
| | $ | 4.77 |
| | $ | 9.18 |
| | $ | 9.34 |
|
(Dollars in thousands, except per-share amounts)
Outstanding stock options as of January 31, 20132016 and activity for the year then ended are presented below:
| | | | | Number
of options | | Weighted
average exercise price | | Aggregate
intrinsic
value | | Weighted
average
remaining
contractual
term
(years) | | Number
of options | | Weighted average exercise price | | Aggregate intrinsic value | | Weighted
average
remaining
contractual
term
(years) |
| Outstanding, January 31, 2012 | | 990,882 |
| | $ | 20.87 |
| | | | | |
| Outstanding, January 31, 2015 | | | 1,015,275 |
| | $ | 29.04 |
| | | | |
| Granted | | 158,800 |
| | 31.57 |
| | | | | 289,600 |
| | 20.09 |
| | | |
| Exercised | | (160,449 | ) | | 16.20 |
| | | | | (50,000 | ) | | 15.49 |
| | | |
| Forfeited | | (70,354 | ) | | 23.98 |
| | | | | (72,400 | ) | | 27.42 |
| | | |
| Expired | | (8,250 | ) | | 16.11 |
| | | | | | (256,525 | ) | | 24.18 |
| | | |
| Outstanding, January 31, 2013 | | 910,629 |
| | $ | 23.36 |
| | $ | 4,716 |
| | 2.88 | |
| Outstanding, January 31, 2016 | | | 925,950 |
| | $ | 28.44 |
| | $ | — |
| | 2.48 |
| | | | | | | | | | | | | | | |
| Outstanding exercisable, January 31, 2013 | | 401,780 |
| | $ | 18.65 |
| | $ | 3,514 |
| | 2.12 | |
| Outstanding exercisable, January 31, 2016 | | | 453,425 |
| | $ | 31.30 |
| | $ | — |
| | 1.48 |
The intrinsic value of a stock award is the amount by which the fair value of the underlying stock exceeds the exercise price of the award. The total intrinsic value of options exercised was $2,573172, $2,3621,467, and $1,1023,019 during the years ended January 31, 20132016, 20122015, and 20112014, respectively. As of January 31, 20132016, the total unrecognized compensation cost for non-vested awards was $3,4042,089, net of the effect of estimated forfeitures. This amount is expected to be recognized over a weighted average period of 2.582.23 years.
(Dollars in thousands, except per-share amounts)
Restricted Stock Unit Awards
The Company granted 21,12039,025 time-vested RSUs to employees during the year ended January 31, 20132016. The fair value of a time-vested RSU is measured based upon the closing market price of the Company's common stock on the date of grant. Time-vested RSUs will vest if, at the end of the three-year period, the employee remains employed by the Company. RSUs contain retirement and change-in-control provisions that may accelerate the vesting period. Dividends are cumulatively earned on the time-vested RSUs over the vesting period.
Activity for time-vested RSUs under the Plan in fiscal 20132016 was as follows:
| | | | | Number
of restricted stock units | | Weighted
average grant date fair value | | Number
of restricted stock units | | Weighted
average grant date fair value |
| Outstanding, January 31, 2012 | | — |
| | $ | — |
| |
| Outstanding, January 31, 2015 | | | 68,137 |
| | $ | 31.27 |
|
| Granted | | 21,120 |
| | 31.66 |
| | 39,025 |
| | 19.25 |
|
| Vested | | — |
| | — |
| | (18,526 | ) | | 31.66 |
|
| Forfeited | | (480 | ) | | 31.66 |
| | (6,710 | ) | | 29.97 |
|
| Outstanding, January 31, 2013 | | 20,640 |
| | $ | 31.66 |
| |
| Outstanding, January 31, 2016 | | | 81,926 |
| | $ | 25.53 |
|
| | | | | | | | | |
| Cumulative dividends, January 31, 2016 | | | 3,107 |
| | |
The Company also granted performance-based RSUs during the year ended January 31, 20132016. The exact number of performance shares to be issued will vary from 0% to 150% of the target award, depending on the Company's actual performance over the three-year period in comparison to the target award. The target award goalfor the fiscal 2015 and 2016 grants are based on return on equity (ROE), which is defined as net income divided by the average of beginning and ending shareholders' equity for the fiscal year. The target award for the fiscal 2014 grant is based on return on sales (ROS), which is defined as net income divided by net sales. The performance-based RSU'sRSUs will vest if, at the end of the three-year performance period, the Company has achieved certain performance goals and the employee remains employed by the Company. Performance-based RSUs contain retirement and change-in-control provisions that may accelerate the vesting period. Dividends are cumulatively earned on performance-based RSUs over the vesting period.
The fair value of the performance-based restricted stock units is based upon the closing market price of the Company's common stock on the grant date. The number of restricted stock units granted is based on 100% of the target award. The number of RSUs that will vest is determined by anthe estimated ROE or ROS target over the three-year performance period. The estimated ROS performance factor used to estimate the number of restricted stock units expected to vest is evaluated at least quarterly. The number of restricted stock units issued at the vesting date will be based on actual results.
(Dollars in thousands, except per-share amounts)
Activity for performance-based RSUs under the Plan in fiscal 20132016 was as follows:
| | | | | Number
of restricted stock units expected to vest | | Weighted
average grant date fair value | | Number
of restricted stock units expected to vest | | Weighted
average grant date fair value |
| Outstanding, January 31, 2012 | | — |
| | $ | — |
| |
| Outstanding, January 31, 2015 | | | 152,439 |
| | $ | 32.40 |
|
| Granted | | 50,940 |
| | 31.66 |
| | 68,570 |
| | 20.09 |
|
| Vested | | — |
| | — |
| | (52,502 | ) | | 31.66 |
|
| Forfeited | | (1,264 | ) | | 31.66 |
| | (17,783 | ) | | 28.27 |
|
| Performance-based adjustment | | 16,557 |
| | 31.66 |
| | (84,656 | ) | | 29.02 |
|
| Outstanding, January 31, 2013 | | 66,233 |
| | $ | 31.66 |
| |
| Outstanding, January 31, 2016 | | | 66,068 |
| | $ | 25.65 |
|
| | | | | | | | | |
| Cumulative dividends, January 31, 2016 | | | 7,557 |
| | |
As of January 31, 2013,2016, the total unrecognized compensation cost for nonvested RSU awards was $1,986576 net of the effect for estimated forfeitures. This amount is expected to be recognized over a weighted average period of 2.172.01 years.
Deferred Stock Compensation Plan for Directors
The Company reservesreserved 100,000 shares of its common stock for issuance to certain members of its Board of Directors under the Deferred Stock Compensation Plan for Directors of Raven Industries, Inc. (the Director Plan). The Director Plan is administered by the GovernancePersonnel and Compensation Committee of the Board of Directors. Under the Director Plan, any non-employee director receives a grant of a number of stock units as deferred compensation to be converted into common stock after retirement from the Board of Directors and may elect to have a specified percentage of their annual retainer converted to stock units. Under the Director Plan, a stock unit is the right to receive one share of the Company's common stock as deferred compensation, to be distributed from an account
(Dollars in thousands, except per-share amounts)
established by the Company in the name of the non-employee director. Stock units have the same value as a share of common stock but cannot be sold. Stock units are a component of the Company's equity.
Stock units granted under the Director Plan vest immediately and are expensed at the date of grant. When dividends are paid on the Company's common shares, stock units are added to the directors' balances and a corresponding amount is removed from retained earnings. The intrinsic value of a stock unit is the fair value of the underlying shares.
Outstanding stock units as of January 31, 20132016 and changes during the year then ended are presented below:
| | | | | Number
of stock units | | Weighted
average price | | Number
of stock units | | Weighted
average price |
| Outstanding, January 31, 2012 | | 49,110 |
| | $ | 32.45 |
| |
| Outstanding, January 31, 2015 | | | 69,347 |
| | $ | 21.44 |
|
| Granted | | 5,459 |
| | 32.98 |
| | 18,721 |
| | 19.23 |
|
| Deferred retainers | | 1,820 |
| | 32.98 |
| | 3,120 |
| | 19.23 |
|
| Dividends | | 797 |
| | 21.43 |
| | 2,546 |
| | 17.67 |
|
| Outstanding, January 31, 2013 | | 57,186 |
| | $ | 26.93 |
| |
| Outstanding, January 31, 2016 | | | 93,734 |
| | $ | 20.82 |
|
|
| |
NOTE 1214 | NET INCOME PER SHARE |
Basic net income per share is computed by dividing net income by the weighted average common shares and stock units outstanding. Diluted net income per share is computed by dividing net income by the weighted average common and common equivalent shares outstanding (whichwhich includes the shares issuable upon exercise of employee stock options net(net of shares assumed purchased with the option proceeds), stock units, and restricted stock units outstanding. Performance share awards are included in the diluted calculation based upon what would be issued if the end of the most recent reporting period was the end of the term of the award.
Certain outstanding options and restricted stock units were excluded from the diluted net income per-share calculations because their effect would have been anti-dilutive under the treasury stock method. For fiscal 2013, 2012
(Dollars in thousands, except per-share amounts)
The options and 2011, 397,600, 67,900 and 255,146 options, respectively, wererestricted stock units excluded from the diluted net income per-share calculation.per share calculation were as follows:
|
| | | | | | | | | |
| | | For the years ended January 31, |
| | | 2016 | | 2015 | | 2014 |
| Anti-dilutive options and restricted stock units | | 1,107,733 |
| | 781,988 |
| | 577,213 |
|
DetailsThe computation of the computation areearnings per share is presented below:
| | | | | For the years ended January 31, | | For the years ended January 31, |
| | | 2013 | | 2012 | | 2011 | | 2016 | | 2015 | | 2014 |
| Numerator: | | | | | | | | | | | | |
| Net income attributable to Raven Industries, Inc. | | $ | 52,545 |
| | $ | 50,569 |
| | $ | 40,537 |
| | $ | 8,489 |
| | $ | 31,733 |
| | $ | 42,903 |
|
| | | | | | | | | | | | | |
| Denominator: | | | | | | | | | | | | |
| Weighted average common shares outstanding | | 36,290,329 |
| | 36,182,042 |
| | 36,083,342 |
| | 37,237,717 |
| | 36,859,026 |
| | 36,379,356 |
|
| Weighted average stock units outstanding | | 54,929 |
| | 52,448 |
| | 50,450 |
| | 86,745 |
| | 69,484 |
| | 67,724 |
|
| Denominator for basic calculation | | 36,345,258 |
| | 36,234,490 |
| | 36,133,792 |
| | 37,324,462 |
| | 36,928,510 |
| | 36,447,080 |
|
| | | | | | | | | | | | | |
| Weighted average common shares outstanding | | 36,290,329 |
| | 36,182,042 |
| | 36,083,342 |
| | 37,237,717 |
| | 36,859,026 |
| | 36,379,356 |
|
| Weighted average stock units outstanding | | 54,929 |
| | 52,448 |
| | 50,450 |
| | 86,745 |
| | 69,484 |
| | 67,724 |
|
| Dilutive impact of stock options and RSUs | | 188,166 |
| | 218,730 |
| | 85,796 |
| | 75,481 |
| | 174,784 |
| | 198,295 |
|
| Denominator for diluted calculation | | 36,533,424 |
| | 36,453,220 |
| | 36,219,588 |
| | 37,399,943 |
| | 37,103,294 |
| | 36,645,375 |
|
| | | | | | | | | | | | | |
| Net income per share - basic | | $ | 1.45 |
| | $ | 1.40 |
| | $ | 1.12 |
| | $ | 0.23 |
| | $ | 0.86 |
| | $ | 1.18 |
|
| Net income per share - diluted | | $ | 1.44 |
| | $ | 1.39 |
| | $ | 1.12 |
| | $ | 0.23 |
| | $ | 0.86 |
| | $ | 1.17 |
|
|
| |
NOTE 1315 | BUSINESS SEGMENTS AND MAJOR CUSTOMER INFORMATION |
The Company's reportable segments are defined by their product lines which have been grouped in these segments based on common technologies, production methods, and inventories. These segments reflect Raven's organization into two Raven divisions and the Aerostar subsidiary. Raven'sThe Company's reportable segments are Applied Technology Division, Engineered Films Division, and Aerostar Division. Raven Canada, SBG, Raven GmbH, Raven Australia, and Raven Brazil are included in the Applied Technology Division. Vista and AIS are included in the Aerostar Division. Substantially all of the Company's long-lived assets are located in the United States.
Applied Technology designs, manufactures, sells, and services innovative precision agriculture products and information management tools that help growers reduce costs, save time, and improve farm yields around the world. Their product families include field
(Dollars in thousands, except per-share amounts)
computers, application controls, GPS-guidance and assisted-steering systems, automatic boom controls, yield monitoring and planter and seeder controls, motorharvest controls, and an integrated RTKreal-time kinematic (RTK) and information platform called Slingshot.Slingshot™. Applied Technology services include high-speed, in-field internet connectivity and cloud-based data management.
Raven'sThe Company's Engineered Films Division manufactures high-performance plastic films and sheeting for major markets throughout the United States and abroad. An important part of this business is highly technical, engineered geomembrane films that protect environmental resources through containment linings and coverings for energy, agriculture, construction, and industrial markets.
Aerostar designs and manufactures surveillance technology, electronic and specialty-sewn and sealedproprietary products including high-altitude balloons, tethered aerostats, high-altitude scientific balloons and airships,radar processing systems. These products can be integrated with additional third-party sensors to provide research, communications, and situational awareness to government and commercial customers. As the Company focused its growth strategy on its proprietary products, the Company made the decision to largely wind-down its contract manufacturing operations. For Aerostar, product lines such as manufacturing military parachutes, uniforms and protective wear parachutes, military decoys and marine navigation equipment. Aerostar also provides electronics manufacturing services (EMS)were phased out during fiscal 2016.
Through Vista and AIS, Aerostar pursues potential product and support services contracts for commercial customers with a focus on high-mix, low-volume production. Assemblies manufactured byagencies and instrumentalities of the Aerostar segment include avionics, communication, environmental controlsU.S. government and other products where high quality is critical. Aerostar acquiredto foreign governments as Direct Commercial Sales and Foreign Military Sales through the U.S. Government. Vista atpositions the end of fiscal 2012. Vista's smart-sensing radar systems use sophisticated signal processing algorithms and are employed in a host ofCompany to meet the global demand for lower-cost detection and tracking applications, including wide area surveillance for border patrol and the military.systems used by government agencies.
The Company realigned the assets and team members of its Electronic Systems Division and deployed them into the Company's Aerostar and Applied Technology Divisions effective June 1, 2012. The realigned divisions will better align the Company's corporate structure with its mission and long-term growth strategies. Electronic Systems net sales of electronic manufacturing assemblies were realigned to Aerostar and the remaining proprietary products, after adjustments to intersegment eliminations, to Applied Technology. The Company adjusted its segment information, retrospectively, for all periods presented to reflect this change in segment reporting.
The Company measures the performance of its segments based on their operating income excluding administrative and general expenses. The accounting policies of the operating segments are the same as those described in Note 1 Summary of Significant
(Dollars in thousands, except per-share amounts)
Accounting Policies.Policies. Other income, interest expense, and income taxes are not allocated to individual operating segments, and assets not identifiable to an individual segment are included as corporate assets. Segment information is reported consistent with the Company's management reporting structure.
(Dollars in thousands, except per-share amounts)
| | | Business segment information is as follows: | Business segment information is as follows: | | | | | | | | | Business segment information is as follows: | | | | |
| | | For the years ended January 31, | | For the years ended January 31, |
| | | 2013 | | 2012 | | 2011 | | 2016 | | 2015 | | 2014 |
| | | | | Previously Reported | | Revised | | Previously Reported | | Revised | |
| APPLIED TECHNOLOGY DIVISION | | | | | | | | | | | | | | | | |
| Sales | | $ | 171,778 |
| | $ | 132,632 |
| | $ | 145,261 |
| | $ | 100,090 |
| | $ | 107,910 |
| | $ | 92,599 |
| | $ | 142,154 |
| | $ | 170,461 |
|
| Operating income | | 59,590 |
| | 45,358 |
| | 49,750 |
| | 31,135 |
| | 33,197 |
| |
| Assets | | 84,224 |
| | 69,977 |
| | 73,872 |
| | 52,669 |
| | 55,740 |
| |
Operating income(a) | | | 18,319 |
| | 34,557 |
| | 57,000 |
|
Assets(b) | | | 65,490 |
| | 88,764 |
| | 93,395 |
|
| Capital expenditures | | 10,780 |
| | 11,408 |
| | 11,971 |
| | 1,769 |
| | 1,947 |
| | 664 |
| | 3,478 |
| | 9,324 |
|
| Depreciation and amortization | | 3,874 |
| | 2,351 |
| | 2,571 |
| | 2,238 |
| | 2,483 |
| | 4,428 |
| | 5,569 |
| | 4,332 |
|
| ENGINEERED FILMS DIVISION | | | | | | | | | | | | | | | | |
| Sales | | $ | 141,976 |
| | $ | 133,481 |
| | $ | 133,481 |
| | $ | 105,838 |
| | $ | 105,838 |
| | $ | 129,465 |
| | $ | 166,634 |
| | $ | 147,620 |
|
Operating income (b) | | 25,115 |
| | 21,501 |
| | 21,501 |
| | 19,622 |
| | 19,622 |
| |
| Assets | | 65,801 |
| | 65,100 |
| | 65,100 |
| | 46,519 |
| | 46,519 |
| |
Operating income | | | 17,892 |
| | 21,802 |
| | 18,154 |
|
Assets(b) | | | 134,942 |
| | 140,023 |
| | 71,602 |
|
| Capital expenditures | | 11,539 |
| | 10,937 |
| | 10,937 |
| | 8,450 |
| | 8,450 |
| | 10,780 |
| | 8,241 |
| | 6,681 |
|
| Depreciation and amortization | | 5,814 |
| | 4,313 |
| | 4,313 |
| | 3,452 |
| | 3,452 |
| | 7,735 |
| | 6,096 |
| | 5,808 |
|
| AEROSTAR DIVISION | | | | | | | | | | | | | | | | |
| Sales | | $ | 102,051 |
| | $ | 52,351 |
| | $ | 107,811 |
| | $ | 48,787 |
| | $ | 104,384 |
| | $ | 36,368 |
| | $ | 80,772 |
| | $ | 90,605 |
|
| Operating income | | 10,341 |
| | 11,468 |
| | 18,308 |
| | 9,407 |
| | 17,209 |
| |
| Assets | | 60,689 |
| | 51,822 |
| | 72,089 |
| | 18,140 |
| | 38,366 |
| |
| Capital expenditures | | 2,081 |
| | 3,875 |
| | 4,105 |
| | 2,190 |
| | 2,621 |
| |
| Depreciation and amortization | | 2,272 |
| | 1,079 |
| | 1,684 |
| | 757 |
| | 1,335 |
| |
| ELECTRONIC SYSTEMS DIVISION | | | | | | | | | | | |
| Sales | | $ | — |
| | $ | 71,744 |
| | $ | — |
| | $ | 65,852 |
| | $ | — |
| |
| Operating income | | — |
| | 11,264 |
| | — |
| | 9,917 |
| | — |
| |
| Assets | | — |
| | 24,281 |
| | — |
| | 23,385 |
| | — |
| |
Operating income(c) | | | (8,100 | ) | | 8,983 |
| | 7,816 |
|
Assets(b) | | | 40,156 |
| | 59,274 |
| | 63,017 |
|
| Capital expenditures | | — |
| | 793 |
| | — |
| | 609 |
| | — |
| | 941 |
| | 2,799 |
| | 7,507 |
|
| Depreciation and amortization | | — |
| | 825 |
| | — |
| | 823 |
| | — |
| | 3,770 |
| | 3,474 |
| | 2,616 |
|
| INTERSEGMENT ELIMINATIONS | | | | | | | | | | | | | | | | |
| Sales | | | | | | | | | | | | | | | | |
| Applied Technology Division | | $ | (974 | ) | | $ | — |
| | $ | (460 | ) | | $ | — |
| | $ | (226 | ) | | (8 | ) | | (231 | ) | | (386 | ) |
| Engineered Films Division | | (124 | ) | | (193 | ) | | (193 | ) | | (307 | ) | | (307 | ) | | (195 | ) | | (652 | ) | | (505 | ) |
| Aerostar Division | | (8,532 | ) | | (1 | ) | | (4,389 | ) | | (32 | ) | | (2,891 | ) | | — |
| | (10,524 | ) | | (13,118 | ) |
| Electronic Systems Division | | — |
| | (8,503 | ) | | — |
| | (5,520 | ) | | — |
| |
| Operating income | | (61 | ) | | (220 | ) | | (188 | ) | | (94 | ) | | (41 | ) | | 91 |
| | 163 |
| | (111 | ) |
| Assets | | (347 | ) | | (405 | ) | | (286 | ) | | (186 | ) | | (98 | ) | | (57 | ) | | (148 | ) | | (311 | ) |
| REPORTABLE SEGMENTS TOTAL | | | | | | | | | | | | | | | | |
| Sales | | $ | 406,175 |
| | $ | 381,511 |
| | $ | 381,511 |
| | $ | 314,708 |
| | $ | 314,708 |
| | $ | 258,229 |
| | $ | 378,153 |
| | $ | 394,677 |
|
Operating income (b) | | 94,985 |
| | 89,371 |
| | 89,371 |
| | 69,987 |
| | 69,987 |
| |
| Operating income | | | 28,202 |
| | 65,505 |
| | 82,859 |
|
| Assets | | 210,367 |
| | 210,775 |
| | 210,775 |
| | 140,527 |
| | 140,527 |
| | 240,531 |
| | 287,913 |
| | 227,703 |
|
| Capital expenditures | | 24,400 |
| | 27,013 |
| | 27,013 |
| | 13,018 |
| | 13,018 |
| | 12,385 |
| | 14,518 |
| | 23,512 |
|
| Depreciation and amortization | | 11,960 |
| | 8,568 |
| | 8,568 |
| | 7,270 |
| | 7,270 |
| | 15,933 |
| | 15,139 |
| | 12,756 |
|
CORPORATE & OTHER(a) | | | | | | | | | | | |
| CORPORATE & OTHER | | | | | | | |
| Operating (loss) from administrative expenses | | $ | (17,293 | ) | | $ | (13,730 | ) | | $ | (13,730 | ) | | $ | (9,784 | ) | | $ | (9,784 | ) | | $ | (17,110 | ) | | $ | (21,704 | ) | | $ | (18,865 | ) |
| Assets | | 62,843 |
| | 34,928 |
| | 34,928 |
| | 47,233 |
| | 47,233 |
| |
Assets(b) (d) | | | 66,079 |
| | 74,960 |
| | 74,116 |
|
| Capital expenditures | | 5,275 |
| | 2,002 |
| | 2,002 |
| | 954 |
| | 954 |
| | 661 |
| | 2,523 |
| | 7,189 |
|
| Depreciation and amortization | | 1,138 |
| | 700 |
| | 700 |
| | 361 |
| | 361 |
| | 1,676 |
| | 2,230 |
| | 1,439 |
|
| TOTAL COMPANY | | | | | | | | | | | | | | | | |
| Sales | | $ | 406,175 |
| | $ | 381,511 |
| | $ | 381,511 |
| | $ | 314,708 |
| | $ | 314,708 |
| | $ | 258,229 |
| | $ | 378,153 |
| | $ | 394,677 |
|
Operating income (b) | | 77,692 |
| | 75,641 |
| | 75,641 |
| | 60,203 |
| | 60,203 |
| |
| Operating income | | | 11,092 |
| | 43,801 |
| | 63,994 |
|
| Assets | | 273,210 |
| | 245,703 |
| | 245,703 |
| | 187,760 |
| | 187,760 |
| | 306,610 |
| | 362,873 |
| | 301,819 |
|
| Capital expenditures | | 29,675 |
| | 29,015 |
| | 29,015 |
| | 13,972 |
| | 13,972 |
| | 13,046 |
| | 17,041 |
| | 30,701 |
|
| Depreciation and amortization | | 13,098 |
| | 9,268 |
| | 9,268 |
| | 7,631 |
| | 7,631 |
| | 17,609 |
| | 17,369 |
| | 14,195 |
|
(a)The fiscal year ended January 31, 2016includes gains of $611 on disposal of assets related to the exit of contract manufacturing operations.
(b) Certain facilities owned by the Company are shared by more than one reporting segment. Beginning with fiscal year 2016 all facilities are reported as an asset based on the segment that acquired the asset as we believe this better reflects total assets of the business segment. In prior fiscal years (which have not been recast in this table), the book value of certain shared facilities was allocated across reporting segments based on usage. Expenses and costs related to these facilities including depreciation expense, are allocated and reported in each reporting segment's operating income for each fiscal year presented.
(c) The fiscal year ended January 31, 2016 includes pre-contract cost write-offs of $2,933, a goodwill impairment loss of $7,413, and a $1,483 reduction of an acquisition-related contingent liability for Vista as a result of changes in expected sales and cash flows.
(d) Assets are principally cash, investments, deferred taxes, and other receivables.
(b) The year ended January 31, 2011 includes a $451 pre-tax gain on disposition of assets.
(Dollars in thousands, except per-share amounts)
No customers accounted for 10% or more of consolidated sales in fiscal 2016. Sales to a customer of the Engineered Films segment accounted for 11%14% and 13% of consolidated sales in fiscal years 20132015 and 2014, respectively, and accounted for 3%5% and 2% of consolidated accounts receivable at January 31, 2013.
For fiscal 2012, one customer of the Aerostar segment2015 and one customer of the Engineered Films segment each accounted for 10% of consolidated sales. These customers comprised 10% and 1%, respectively, of consolidated accounts receivable at January 31, 2012.
One customer of the Aerostar segment accounted for 11% of consolidated accounts receivable and 13% of consolidated net sales at and for the period ended January 31, 2011.2014, respectively.
Foreign sales are attributed to countries based on location of the customer. Net sales to customers outside the United States were as follows:
| | | | | For the years ended January 31, | | For the years ended January 31, |
| | | 2013 | | 2012 | | 2011 | | 2016 | | 2015 | | 2014 |
| Canada | | $ | 20,640 |
| | $ | 15,237 |
| | $ | 12,694 |
| | $ | 11,789 |
| | $ | 14,432 |
| | $ | 16,141 |
|
| Europe | | | 10,526 |
| | 8,243 |
| | 4,131 |
|
| Latin America | | | 2,676 |
| | 9,921 |
| | 22,124 |
|
| Other foreign sales | | 28,614 |
| | 23,672 |
| | 11,975 |
| | 2,858 |
| | 4,239 |
| | 3,497 |
|
| Total foreign sales | | 49,254 |
| | 38,909 |
| | 24,669 |
| | 27,849 |
| | 36,835 |
| | 45,893 |
|
| United States | | 356,921 |
| | 342,602 |
| | 290,039 |
| | 230,380 |
| | 341,318 |
| | 348,784 |
|
| | | $ | 406,175 |
| | $ | 381,511 |
| | $ | 314,708 |
| | $ | 258,229 |
| | $ | 378,153 |
| | $ | 394,677 |
|
Effective March 21, 2016 the Board of Directors (Board) authorized an extension and increase of the authorized $40,000 stock buyback program in place and described more fully in Part II Item 5. Market For Registrant's Common Equity, Related Shareholder Matters And Issuer Purchases Of Equity Securities of this Form 10-K.
An additional $10,000 was authorized for share repurchases once the $40,000 authorization limit has been reached. With the $10,700 available under the original authorization as of January 31, 2016, a total of $20,700 is available for share repurchases until such time as the authorized spending limit is reached or is revoked by the Board.
|
| |
| ITEM 9. | CHANGES IN AND DISAGREEMENTS WITH ACCOUNTANTS ON ACCOUNTING AND FINANCIAL DISCLOSURE |
None.
|
| |
| ITEM 9A. | CONTROLS AND PROCEDURES |
Disclosure Controls and Procedures
Disclosure controls and procedures (as defined in Exchange Act Rules 13a-15(e) and 15d-15(e) are our controls and other procedures that are designed to ensure that information required to be disclosed by us in the reports that we file or submit under the Securities Exchange Act of 1934 (the Exchange Act) is recorded, processed, summarized, and reported within the time periods specified in the Securities and Exchange CommissionsSEC's rules and forms. Disclosure controls and procedures include, without limitation, controls and procedures designed to ensure that information required to be disclosed by us in the reports that we file or submit under the Exchange Act is accumulated and communicated to our management, including our Chief Executive Officer (CEO) and Chief Financial Officer (CFO), as appropriate to allow timely decisions regarding required disclosure.
As of January 31, 20132016, the end of the period covered by this report, management evaluated the effectiveness of the Company's disclosure controls and procedures as of such date.
Based on their evaluation, the CEO and CFO have concluded that the Company's disclosure controls and procedures arewere effective at a reasonable assurance level as of January 31, 2013.2016.
Management's Report on Internal Control Over Financial Reporting
Pursuant to Section 404 of the Sarbanes-Oxley Act of 2002, the Company included management’s assessment of the design and effectiveness of its internal controls over financial reporting as part of this Annual Report on Form 10-K for the fiscal year ended January 31, 2013.2016. Management's report and the report of the Company's independent registered public accounting firm are included in Part II, Item 8. captioned “Management's Report on Internal Control Over Financial Reporting" and "Report of Independent Registered Public Accounting Firm” and are incorporated herein by reference.
Changes in Internal Control Over Financial Reporting
There were no changes in the Company's internal control over financial reporting (as defined in Rules 13a-15(f) and 15d-15(f) under the Exchange Act) that occurred during the quarter ended January 31, 20132016, that have materially affected, or are reasonably likely to materially affect, the Company's internal control over financial reporting.
|
| |
| ITEM 9B. | OTHER INFORMATION |
Not applicable.
|
| |
| PART III | |
| | |
| ITEMS 10, 11, 12, 13 and 14. | DIRECTORS, EXECUTIVE OFFICERS AND CORPORATE GOVERNANCE; EXECUTIVE COMPENSATION; SECURITY OWNERSHIP OF CERTAIN BENEFICIAL OWNERS AND MANAGEMENT AND RELATED SHAREHOLDER MATTERS; CERTAIN RELATIONSHIPS AND RELATED TRANSACTIONS AND DIRECTOR INDEPENDENCE; AND PRINCIPAL ACCOUNTING FEES AND SERVICES |
The Company will file a definitive proxy statement with the Securities and Exchange Commission pursuant to Regulation 14A under the Securities Exchange Act of 1934 (the “Proxy Statement”) relating to the Company's 20132016 Annual Meeting of Shareholders. Information required by Items 10 through 14 will appear in the Proxy Statement and is incorporated herein by reference.
|
| |
| PART IV | |
| | |
| ITEM 15. | EXHIBITS, FINANCIAL STATEMENT SCHEDULE |
LIST OF DOCUMENTS FILED AS PART OF THIS REPORT
Financial Statements
See PART II, Item 8.
Financial Statement Schedule
Schedule II - Valuation and Qualifying Accounts
All other schedules for which provision is made in the applicable accounting regulations of the Securities and Exchange Commission are not required under the related instructions or are inapplicable and therefore have been omitted.
Exhibits
See index to Exhibits on the following page.
|
| | | |
Exhibit Number | | Description |
| | | |
| 2(a) |
| | Stock Purchase Agreement, dated as of December 30, 2011, by and between Aerostar International, Inc. and Vista Applied Technologies Group, Inc. (incorporated herein by reference to Exhibit 2.1 of the Company's Form 8-K filed January 6, 2012). |
| | |
| 2(b) |
| | Agreement and Plan of Merger and Reorganization, dated as of November 3, 2014, by and among Raven Industries, Inc., Infinity Acquisition, Inc., Integra Plastics, Inc. and Nikole Mulder, as the Shareholder Representative (incorporated herein by reference to Exhibit 2.1 of the Company's Form 8-K filed November 7, 2014). |
| | | |
| 3(a) |
| | Articles of Incorporation of Raven Industries, Inc. and all amendments thereto.*thereto (incorporated herein by reference to the corresponding exhibit of the Company's 10-K for the year ended January 31, 1989). |
| | | |
| 3(b) |
| | Amended and Restated Bylaws of Raven Industries (incorporated herein by reference to Exhibit B toof the Company's definitive Proxy Statement filed April 12, 2012). |
| | | |
| 4(a) |
| | Raven Industries Inc. Amended and Restated 2010 Stock Incentive Plan filed on June 11, 2012 as Exhibit 4.1 toof Raven Industries, Inc. Registration Statement on Form S-8, and incorporated herein by reference). |
| | |
| 4(b) |
| | Raven Industries, Inc. Amended and Restated 2010 Stock Incentive Plan filed on June 8, 2015 as Exhibit 4.1 of Raven Industries, Inc. Registration Statement on Form S-8, and incorporated herein by reference. |
| | |
| 10.1 |
| | Form of Amended and Restated Change in Control Agreements between Raven Industries, Inc. and the following senior executive officers: Daniel A. Rykhus, Steven E. Brazones, Stephanie Herseth Sandlin, Anthony D. Schmidt, Brian E. Meyer, and Janet L. Matthiesen dated as of March 28, 2016 and filed herewith as Exhibit 10.1. † |
| | |
| 10.2 |
| | Form of Amended and Restated Change in Control Agreements between Raven Industries, Inc. and the following senior executives: Lon E. Stroschein and Scott W. Wickersham dated as of March 28, 2016 and filed herewith as Exhibit 10.2. † |
| | | |
| 10(a) |
| | Employment Agreement between Raven Industries, Inc. and Daniel A. Rykhus dated as of February 1, 2009 (incorporated herein by reference to Exhibit 10.1 of the Company's Form 8-K filed February 1, 2009). † |
| | | |
| 10(b) |
| | Employment Agreement between Raven Industries, Inc. and James D. Groninger dated as of February 1, 2004. † *** |
| | |
10(c) |
| | Employment Agreement between Raven Industries, Inc. and Lon E. Stroschein dated as of October 1, 2010 (incorporated by reference to Exhibit 10.1 to the Company's 8-K filed October 1, 2010). † |
| | |
10(d) |
| | Employment Agreement between Raven Industries, Inc. and Anthony D. Schmidt dated as of February 1, 2012 (incorporated herein by reference to Exhibit 10.1 toof the Company's 8-K filed February 1, 2012). † |
| | | |
10(e) |
| | Employment Agreement between Raven Industries, Inc. and Thomas Iacarella dated as of February 1, 2004. † ** |
| | |
10(f)10(c) |
| | Schedule A to Employment AgreementsAgreement between Raven Industries, Inc. and each of the following Senior Executive Officers: Daniel A. Rykhus and Thomas Iacarella.(incorporated herein by reference to the corresponding exhibit number of the Company's 10-K filed March 31, 2011). † **** |
| | | |
10(g)10(d) |
| | Change in Control Agreement between Raven Industries, Inc. and each of the following officers and key employees: Daniel A. Rykhus, and Thomas Iacarella, dated as of January 31, 2008 (incorporated herein by reference to Exhibit 10.1 of the Company's 8-K filed December 17, 2007). † |
| | | |
10(h)10(e) |
| | Raven Industries, Inc. 2000 Stock Option and Compensation Plan adopted May 24, 2000 (incorporated herein by reference to Exhibit A toof the Company's definitive Proxy Statement filed April 19, 2000).† |
| | | |
10(i)10(f) |
| | Raven Industries, Inc. Deferred Compensation Plan for Directors adopted May 23, 2007 (incorporated herein by reference to Exhibit 10.1 toof the Company's 8-K filed May 24, 2007). † |
| | | |
10(j)10(g) |
| | Schedule A to Employment Agreement between Raven Industries, Inc. and Matthew T. Burkhart dated February 1, 2010Anthony D. Schmidt (incorporated herein by reference to Exhibit 10.1 tothe corresponding exhibit number of the Company's 8-K10-K filed February 2, 2010)March 31, 2011). † |
| | | |
10(k) |
| | Change in Control Agreement between Raven Industries, Inc. and Matthew T. Burkhart dated February 1, 2010 (incorporated by reference to Exhibit 10.3 to the Company's 8-K filed February 2, 2010). † |
| | |
10(l) |
| | Change in Control Agreement between Raven Industries, Inc. and Lon E. Stroschein dated October 1, 2010 (incorporated by reference to Exhibit 10.3 to the Company's 8-K filed October 1, 2010). † |
| | |
10(m) |
| | Schedule A to Employment Agreements between Raven Industries, Inc. and each of the following Senior Managers: Matthew T. Burkhart, Anthony D. Schmidt and Lon E. Stroschein. † **** |
| | |
10(n)10(h) |
| | Change in Control Agreement between Raven Industries, Inc. and Anthony D. Schmidt dated February 1, 2012 (incorporated herein by reference to Exhibit 10.3 toof the Company's 8-K filed February 1, 2012). † |
| | | |
10(o) |
| | Employment Agreement between Raven Industries, Inc. and Janet L. Matthiesen (incorporated herein by reference to Exhibit 10.1 to the Company's 8-K filed April 20, 2012). † |
| | |
10(p) |
| | Schedule A to Employment Agreement between Raven Industries, Inc. and Janet L. Matthiesen (incorporated herein by reference to Exhibit 10.2 to the Company's 8-K filed April 20, 2012). † |
| | |
10(q)10(i) |
| | Change in Control Agreement between Raven Industries, Inc. and Janet L. Matthiesen (incorporated herein by reference to Exhibit 10.3 toof the Company's 8-K filed April 20, 2012). † |
| | | |
10(r) |
| | Employment Agreement between Raven Industries, Inc. and Stephanie Herseth Sandlin dated August 27, 2012 (filed herewith as Exhibit 10.1). † |
| | |
10(s)10(j) |
| | Schedule A to Employment Agreement between Raven Industries, Inc. and Stephanie Herseth Sandlin dated August 27, 2012(incorporated herein by reference to Exhibit 10.2 of the Company's 10-K filed herewith as Exhibit 10.2)March 29, 2013). † |
| | | |
10(t)10(k) |
| | Change in Control Agreement between Raven Industries, Inc. and Steven E. Brazones dated December 1, 2014 (incorporated herein by reference to Exhibit 10.2 of the Company's 8-K filed December 4, 2014). † |
| | |
| 10(l) |
| | Offer Letter between Raven Industries, Inc. and Steven E. Brazones, dated as of October 10, 2014 incorporated herein by reference to Exhibit 10.1 of the Company's Form 10-K filed March 27, 2015). † |
| | |
| 10(m) |
| | Credit Agreement dated April 15, 2015, by and between Raven Industries, Inc. and JPMorgan Chase Bank, N.A., Toronto Branch, as Canadian Administrative Agent, JPMorgan Chase Bank National Association, as Administrative Agent, and JP Morgan Securities LLC and Wells Fargo Securities, LLC as Joint Bookrunners and Joint Lead Arrangers (incorporated herein by reference to Exhibit 10.1 of the Company's Form 8-K filed April 16, 2015). |
| | |
| 10(n) |
| | Guaranty dated April 15, 2015, made by each of the Guarantors (Raven Industries, Inc., Aerostar International, Inc., Vista Research, Inc., and Integra Plastics, Inc.) in favor of JPMorgan Chase Bank, N.A. as Administrative Agent on behalf of the guaranteed parties (incorporated herein by reference to Exhibit 10.2 of the Company's Form 8-K filed April 16, 2015). |
| | |
| 10(o) |
| | Amended Employment agreements between Raven Industries, Inc. and the following senior executive officers: Brian E. Meyer, Janet L. Matthiesen, Stephanie Herseth Sandlin, and Steven E. Brazones dated August 27, 2012 (filed herewith as25, 2015 (incorporated herein by reference to Exhibit 10.3)10.1 of the Company's 8-K filed August 31, 2015). † |
| | |
|
| | | |
| 10(p) |
| | Schedule A to the Amended Employment Agreements between Raven Industries, Inc. and the following senior executive officers: Brian E. Meyer, Janet L. Matthiesen, Stephanie Herseth Sandlin, and Steven E. Brazones dated August 25, 2015 (incorporated herein by reference to Exhibit 10.2 of the Company's 8-K filed August 31, 2015). † |
| | | |
| 21 |
| | Subsidiaries of the Registrant. |
| | | |
| 23 |
| | Consent of Independent Registered Public Accounting Firm. |
| | | |
| 31.1 |
| | Certification of Chief Executive Officer Pursuant to Rule 13a-14(a) of the Securities Exchange Act of 1934, as adopted pursuant to Section 302 of the Sarbanes-Oxley Act of 2002. |
| | | |
|
| | | |
| 31.2 |
| | Certification of Chief Financial Officer Pursuant to Rule 13a-14(a) of the Securities Exchange Act of 1934, as adopted pursuant to Section 302 of the Sarbanes-Oxley Act of 2002. |
| | | |
| 32.1 |
| | Certification of Chief Executive Officer Pursuant to 18 U.S.C. Section 1350, as adopted pursuant to Section 906 of the Sarbanes-Oxley Act of 2002. |
| | | |
| 32.2 |
| | Certification of Chief Financial Officer Pursuant to 18 U.S.C. Section 1350, as adopted pursuant to Section 906 of the Sarbanes-Oxley Act of 2002. |
| | | |
| 101.INS |
| | XBRL Instance Document |
| | | |
| 101.SCH |
| | XBRL Taxonomy Extension Schema |
| | | |
| 101.CAL |
| | XBRL Taxonomy Extension Calculation Linkbase |
| | | |
| 101.DEF |
| | XBRL Taxonomy Extension Definition Linkbase |
| | | |
| 101.LAB |
| | XBRL Taxonomy ExtenstionExtension Label Linkbase |
| | |
| | | |
| 101.PRE |
| | XBRL Taxonomy Extension Presentation Linkbase |
| | | |
| † |
| | Management contract or compensatory plan or arrangement. |
* |
| | Incorporated by reference to corresponding Exhibit Number of the Company's Form 10-K for the year ended January 31, 1989. |
** |
| | Incorporated by reference to corresponding Exhibit Number of the Company's Form 10-K for the year ended January 31, 2004. |
*** |
| | Incorporated by reference to corresponding Exhibit Number of the Company's Form 10-K for the year ended January 31, 2007. |
**** |
| | Incorporated by reference to corresponding Exhibit Number of the Company's Form 10-K for the year ended January 31, 2011. |
|
| | | |
| | SIGNATURES |
| | | |
| | | | |
| | SIGNATURES | | |
| | Pursuant to the requirements of Section 13 or 15(d) of the Securities Exchange Act of 1934, the Registrant has duly caused this report to be signed on its behalf by the undersigned, thereunto duly authorized. |
| |
| | | | |
| | RAVEN INDUSTRIES, INC. | | |
| | (Registrant) | | |
| | | | |
| | By: /s/ DANIEL A. RYKHUS | | |
| | Daniel A. Rykhus | | |
| | President and Chief Executive Officer | | |
| | | | |
| | Date: March 28, 201329, 2016 | | |
|
| | |
| Pursuant to the requirements of the Securities Exchange Act of 1934, this report has been signed below by the following persons on behalf of the Registrant and in the capacities and on the dates indicated. |
| | | |
| /s/ DANIEL A. RYKHUS | | /s/ MARK E. GRIFFIN |
| Daniel A. Rykhus | | Mark E. Griffin |
| President and Chief Executive Officer | | Director |
| (principal executive officer) and Director | | |
| | | |
| | | |
/s/ THOMAS IACARELLASTEVEN E. BRAZONES | | /s/ KEVIN T. KIRBY |
Thomas IacarellaSteven E. Brazones | | Kevin T. Kirby |
| Vice President and Chief Financial Officer | | Director |
| (principal financial and accounting officer) | | |
| | | |
| | | |
| /s/ THOMAS S. EVERIST | | /s/ MARC E. LEBARON |
| Thomas S. Everist | | Marc E. LeBaron |
| Chairman of the Board | | Director |
| | | |
| | | |
/s/ ANTHONY W. BOURJASON M. ANDRINGA | | /s/ CYNTHIA H. MILLIGAN |
Anthony W. BourJason M. Andringa | | Cynthia H. Milligan |
| Director | | Director |
| | | |
| | | |
| /s/ MARK E. GRIFFIN | | /s/ HEATHER A. WILSON |
| Mark E. Griffin | | Heather A. Wilson |
| Director | | Director |
| | |
| | |
| | | Date: March 28, 201329, 2016 |
SCHEDULE II - VALUATION AND QUALIFYING ACCOUNTS
for the years ended January 31, 20132016, 20122015 and 20112014
(in thousands)
| | | Column A | Column B | Column C | Column D | Column E | Column B | Column C | Column D | Column E |
| | | Additions | | | Additions | |
| Description | Balance at Beginning of Year | Charged to Costs and Expenses | Charged to Other Accounts | Deductions From Reserves (1) | Balance at End of Year | Balance at Beginning of Year | Charged to Costs and Expenses | Charged to Other Accounts | Deductions From Reserves (1) | Balance at End of Year |
| Deducted in the balance sheet from the asset to which it applies: | | |
| Allowance for doubtful accounts: | | |
| Year ended January 31, 2013 | $ | 170 |
| $ | 355 |
| $ | — |
| $ | 320 |
| $ | 205 |
| |
| Year ended January 31, 2012 | $ | 300 |
| $ | (91 | ) | $ | — |
| $ | 39 |
| $ | 170 |
| |
| Year ended January 31, 2011 | $ | 297 |
| $ | (1 | ) | $ | — |
| $ | (4 | ) | $ | 300 |
| |
| Year ended January 31, 2016 | | $ | 319 |
| $ | 1,066 |
| $ | — |
| $ | 351 |
| $ | 1,034 |
|
| Year ended January 31, 2015 | | $ | 319 |
| $ | 211 |
| $ | 19 |
| $ | 230 |
| $ | 319 |
|
| Year ended January 31, 2014 | | $ | 205 |
| $ | 129 |
| $ | — |
| $ | 15 |
| $ | 319 |
|
Note:
| |
| (1) | Represents uncollectable accounts receivable written off during the year, net of recoveries. |