UNITED STATES
SECURITIES AND EXCHANGE COMMISSION
Washington, D.C. 20549
FormFORM 10-K
(Mark One) |
| | | | |
(Mark One)☒ | |
x | ANNUAL REPORT PURSUANT TO SECTION 13 OR 15(D)15(d) OF THE SECURITIES EXCHANGE ACT OF 1934 |
For the fiscal year ended December 31, 2021 | | | | | |
| ☐ | For the fiscal year ended December 31, 2017, or |
o | TRANSITION REPORT PURSUANT TO SECTION 13 OR 15(D)15(d) OF THE SECURITIES EXCHANGE ACT OF 1934 |
| For the transition period from to �� . |
For the transition period from to .
Commission file number: 1-6948
SPX Corporation
(Exact Namename of Registrantregistrant as Specifiedspecified in Its Charter)
its charter) |
| | | | |
Delaware | 38-1016240 |
(State or Other Jurisdictionother jurisdiction ofIncorporation
incorporation or Organization)
organization) | 38-1016240
(I.R.S. Employer
Identification No.)
|
13320-A Ballantyne Corporate Place6325 Ardrey Kell Road Suite 400,
Charlotte, NC 28277
(Address of Principal Executive Offices)principal executive offices) (Zip Code)
Registrant’s telephone number, including area code: (980) 474-3700
Securities registered pursuant to Section 12(b) of the Act:
|
| | | | | | | |
Title of Each Classeach class | Trading Symbol(s) | Name of Each Exchangeeach exchange on Which Registeredwhich registered |
| Common Stock, Par Value $0.01 | SPXC | New York Stock Exchange |
Securities registered pursuant to Section 12(g) of the Act:
None
(Title of Class)class)
Indicate by check mark if the registrant is a well-known seasoned issuer, as defined in Rule 405 of the Securities Act. Yesx☒Noo☐
Indicate by check mark if the registrant is not required to file reports pursuant to Section 13 or Section 15(d) of the Act. Yeso☐Nox☒
Indicate by check mark whether the registrant: (1) has filed all reports required to be filed by Section 13 or 15(d) of the Securities Exchange Act of 1934 during the preceding 12 months (or for such shorter period that the registrant was required to file such reports), and (2) has been subject to such filing requirement for the past 90 days. Yesx☒Noo☐
Indicate by check mark whether the registrant has submitted electronically and posted on its corporate Web site, if any, every Interactive Data File required to be submitted and posted pursuant to Rule 405 of Regulation S-T (§232.405 of this chapter) during the preceding 12 months (or for such shorter period that the registrant was required to submit and post such files). Yesx☒Noo☐
Indicate by check mark if disclosure of delinquent filers pursuant to Item 405 of Regulation S-K is not contained herein, and will not be contained, to the best of registrant’s knowledge, in definitive proxy or information statements incorporated by reference in Part III of this Form 10-K or any amendment to this Form 10-K. o
Indicate by check mark whether the registrant is a large accelerated filer, an accelerated filer, a non-accelerated filer, smaller reporting company, or an emerging growth company. See the definitions of “large accelerated filer,” “accelerated filer,” “smaller reporting company” and “emerging growth company” in Rule 12b-2 of the Exchange Act. (Check one):
|
| | | | | | | | | | | | | | | | |
| Large accelerated filerx
| ☒ | | Accelerated filer
| Accelerated filer o
☐ |
| Non-accelerated filero (Do not check if a smaller reporting company)
| ☐ | | Smaller reporting companyo
| ☐ |
| | | | Emerging growth companyo
| ☐ |
If an emerging growth company, indicate by check mark if the registrant has elected not to used the extended transition period for complying with any new or revised financial accounting standards provided pursuant to Section 13(a) of the Exchange Acto☐
Indicate by check mark whether the registrant has filed a report on and attestation to its management’s assessment of the effectiveness of its internal control over financial reporting under Section 404(b) of the Sarbanes-Oxley Act (15 U.S.C. 7262(b)) by the registered public accounting firm that prepared or issued its audit report ☒
Indicate by check mark whether the registrant is a shell company (as defined in Rule 12b-2 of the Act). Yeso☐Nox☒
The aggregate market value of the voting stock held by non-affiliates of the registrant as of July 1, 20173, 2021 was $1,046,296,706.$2,744,821,519. The determination of affiliate status for purposes of the foregoing calculation is not necessarily a conclusive determination for other purposes.
The number of shares outstanding of the registrant’s common stock as of February 16, 2018 18, 2022 was 42,782,822.45,491,812.
Documents incorporated by reference: Portions of the Registrant’s proxy statement for its Annual Meeting to be held on May 15, 201810, 2022 are incorporated by reference into Part III of this Annual Report on Form 10-K.
SPX CORPORATION AND SUBSIDIARIES
FORM 10-K TABLE OF CONTENTS
P A R T I
ITEM 1. Business
(All currency and share amounts are in millions)
Forward-Looking Information
Some of the statements in this document and any documents incorporated by reference, including any statements as to operational and financial projections, constitute “forward-looking statements” within the meaning of Section 21E of the Securities Exchange Act of 1934, as amended (the “Exchange Act”). and Section 27A of the Securities Act of 1933, as amended. These statements relate to future events or our future financial performance and involve known and unknown risks, uncertainties and other factors that may cause our businesses’ or our industries’ actual results, levels of activity, performance or achievements to be materially different from those expressed or implied by any forward-looking statements. Such statements may address our plans, our strategies, our prospects, changes and trends in our business and the markets in which we operate under the heading “Management’s Discussion and Analysis of Financial Condition and Results of Operations” (“MD&A”) or in other sections of this document. In some cases, you can identify forward-looking statements by terminology such as “may,” “could,” “would,” “should,” “expect,” “plan,” “anticipate,” “intend,” “believe,” “estimate,” “predict,” “project,” “potential” or “continue” or the negative of those terms or other comparable terminology. Particular risks and uncertainties facing us include economic, business and other risks stemming from our internal operations, legal and regulatory risks, and uncertainties with respect to costs and availability of raw materials, availability of labor, pricing pressures, pension funding requirements, integration of acquisitions, and changes in the economy.economy, as well as the impacts of the coronavirus disease (the “COVID-19 pandemic”), which is further discussed in other sections of this document. These statements are only predictions. Actual events or results may differ materially because of market conditions in our industries or other factors, and forward-looking statements should not be relied upon as a prediction of actual results. In addition, management’s estimates of future operating results are based on our current complement of businesses, which is subject to change as management selects strategic markets.
All the forward-looking statements are qualified in their entirety by reference to the factorsrisks and uncertainties discussed in this filing, including under the heading “Risk Factors,” in this filing and any subsequent filing with the U.S. Securities and Exchange Commission (“SEC”), as well as in any documents incorporated by reference that describe risks, uncertainties, and other factors that could cause results to differ materially from those projected in these forward-looking statements. We caution you that these risk factorsdiscussions of risks and uncertainties may not be exhaustive. We operate in a continually changing business environment and frequently enter into new businesses and product lines. We cannot predict these new risk factors, and we cannot assess the impact, if any, of these new risk factors on our businesses or the extent to which any factor, or combination of factors, may cause actual results to differ materially from those projected in any forward-looking statements. Accordingly, you should not rely on forward-looking statements as a prediction of actual results. We disclaim any responsibility, except to the extent we are legally required, to update or publicly revise any forward-looking statements to reflect events or circumstances that arise after the date of this document.
Business
We wereSPX Corporation (“SPX”, “our” or “we”) was founded in Muskegon, Michigan in 1912 as the Piston Ring Company and adopted our current name in 1988. Since 1968, we have been incorporated under the laws of Delaware, and we have been listed on the New York Stock Exchange since 1972.
On September 26, 2015, (the “Distribution Date”), we completed the spin-off to our stockholders (the “Spin-Off”) of all the outstanding shares of SPX FLOW, Inc. (“SPX FLOW”), a wholly-owned subsidiary of SPX Corporation (“SPX”) prior to the Spin-Off, which at the time of the Spin-Off held the businesses comprising our Flow Technology reportable segment, our Hydraulic Technologies business, and certain of our corporate subsidiaries (collectively, the “FLOW Business”). On the Distribution Date, each of our stockholders of record as of the close of business on September 16, 2015 (the “Record Date”) received one share of common stock of SPX FLOW for every share of SPX common stock held as of the Record Date. SPX FLOW is now an independent public company trading under the symbol “FLOW” on the New York Stock Exchange. Following the Spin-Off, SPX’s common stock continues to be listed on the New York Stock Exchange and trades under the ticker symbol, “SPXC”.subsidiaries.
Prior to the Spin-Off, our businesses serving the power generation markets had a major impact on the consolidated financial results of SPX. In the recent years leading up to the Spin-Off, these businesses experienced significant declines in revenues and profitability associated with weak demand and increased competition within the global power generation markets. Based on a review of our post-spin portfolio and the belief that a recovery within the power generation markets was unlikely in the foreseeable future, we decided coming out of the Spin-Off that our strategic focus would be on our (i) scalable growth businesses that serve the heating, ventilation and ventilationcooling (“HVAC”) and detection and measurement markets and (ii) power transformer and process cooling systems businesses. As a result, we have significantly reduced our
exposure to the power generation markets as indicated by the dispositions of our dry cooling and Balcke Dürr businesses during 2016. Additionally, during 2018, we initiated a plan to wind-down the first andSPX Heat Transfer (“Heat Transfer”) business, with the wind-down completed during the fourth quartersquarter of 2016, respectively.2020. As a result of completing such wind-down activities, we are reporting the Heat Transfer business as a discontinued operation for all periods presented. Lastly, with its substantial completion of the remaining
scope on the large power projects in South Africa, our South African subsidiary, DBT Technologies (PTY) LTD’s (“DBT”), completed wind-down activities during the fourth quarter of 2021. As a result of completing wind-down activities, we are now reporting the DBT business as a discontinued operation for all periods presented. See Management’s Discussion and Analysis of Financial ConditionMD&A and Notes 1 and 4 to our consolidated financial statements for further discussion of these dispositions.actions.
On February 1, 2019, we completed the acquisition of Sabik Marine (“Sabik”), primarily a manufacturer of obstruction lighting products. The post-acquisition operating results of Sabik Marine are reflected within our Detection and Measurement reportable segment.
On July 3, 2019 and November 12, 2019, we completed the acquisitions of SGS Refrigeration Inc. (“SGS”) and Patterson-Kelley, LLC (“Patterson-Kelley”), respectively. SGS is a manufacturer of industrial refrigeration products, while Patterson-Kelley is a manufacturer and distributor of commercial boilers and water heaters. The post-acquisition operating results of SGS and Patterson-Kelley are reflected within our HVAC reportable segment.
On September 2, 2020 and November 11, 2020, we completed the acquisitions of ULC Robotics (“ULC”) and Sensors & Software, Inc. (“Sensors & Software”), respectively. ULC is leading developer of robotic systems, mechanical learning applications, and inspection technology for the energy, utility, and industrial markets, while Sensors & Software is a manufacturer and distributor of ground penetrating radar products used for locating underground utilities, detecting unexploded ordinances, and geotechnical and geological investigations. The post-acquisition operating results of ULC and Sensors & Software are reflected within our Detection and Measurement reportable segment.
On April 19, 2021 and August 2, 2021, we completed the acquisitions of Sealite Pty Ltd and affiliated entities, including Sealite USA, LLC (doing business as Avlite Systems) and Star2M Pty Ltd (collectively, "Sealite"), and Enterprise Control Systems Ltd ("ECS"), respectively. Sealite is a leader in the design and manufacture of marine and aviation Aids to Navigation products, while ECS is a manufacturer and designer of highly-engineered tactical datalinks and radio frequency (“RF”) countermeasures, including counter-drone and counter-IED RF jammers. The post-acquisition operating results of Sealite and ECS are reflected within our Detection and Measurement reportable segment.
On October 1, 2021 we completed the sale of SPX Transformer Solutions, Inc. (“Transformer Solutions”) pursuant to the terms of the Stock Purchase Agreement dated June 8, 2021 with GE-Prolec Transformers, Inc. (the “Purchaser”) and Prolec GE Internacional, S. de R.L. de C.V. We are reporting Transformer Solutions as a discontinued operation for all periods presented. See Notes 1 and 4 to our consolidated financial statements for further details. In connection with the disposition of Transformer Solutions and its classification as a discontinued operation, we have eliminated the Engineered Solutions reportable segment and have reflected the remaining operations of the former Engineered Solutions reportable segment within the HVAC reportable segment for all periods presented.
On December 15, 2021, we completed the acquisition of Cincinnati Fan & Ventilator Co., Inc. (“Cincinnati Fan”), a leader in engineered air movement solutions, including blowers and critical exhaust systems. The post-acquisition operating results of Cincinnati Fan are reflected within our HVAC reportable segment.
Unless otherwise indicated, amounts provided in Part I pertain to continuing operations only (see Notes 1 and 4 to our consolidated financial statements for information on discontinued operations).
We are a diversified, global supplier of infrastructure equipment serving the HVAC and detection and measurement power transmission and generation, and industrial markets. With operations in approximately 15 countries and over 5,000 employees,approximately 3,100 employees, we offer a wide array of highly engineered infrastructure products with strong brands.
HVAC solutions offered by our businesses include package and process cooling towers,equipment, engineered air quality solutions, residential and commercial boilers, comfort heating, and ventilation products. Our market leading brands, coupled with our commitment to continuous innovation and focus on our customers’ needs, enables our HVAC cooling and heating businesses to serve an expanding number of industrial, commercial and residential customers. Growth for our HVAC businesses will be driven by innovation, increased scalability, and our ability to meet the needs of broader markets.
Our detection and measurement product lines encompass underground pipe and cable locators, inspection and inspectionrehabilitation equipment, robotic systems, bus fare collection systems, communication technologies, and specialtyobstruction lighting. Our detection and measurement solutions enable utilities, telecommunication providers and regulators, and municipalities and transit authorities to build, monitor and maintain vital infrastructure. Our technology and decades of experience have afforded us a strong position in specific detection and measurement markets. We intend to expand our portfolio of specialized products through new, innovative hardware and software solutions in an attempt to (i) further capitalize on the detection and measurement markets we currently serve and (ii) expand the number of markets that we serve.
Within our engineered solutions platform, we are a leading manufacturer of medium and large power transformers, as well as process cooling equipment and heat exchangers. These solutions play a critical role in electricity transmission and generation. Specifically, our power transformers play an integral role in the North American power grid, while our process cooling equipment and heat exchangers assist our customers in meeting their power generation and industrial needs. The businesses within the platform are committed to driving value through continued focus on operational and engineering efficiencies.
Reportable Segments
We aggregate ourOur operating segments are aggregated into the following threetwo reportable segments: HVAC and Detection and Measurement, and Engineered Solutions.Measurement. The factors considered in determining our aggregated segments are the economic similarity of the businesses, the nature of products sold or services provided, production processes, types of customers, distribution methods, and regulatory environment. In determining our reportable segments, we apply the threshold criteria of the Segment Reporting Topic of the Financial Accounting Standards Board Codification (“Codification”). Operating income or loss for each of our reportable segments is determined before considering impairment and special charges, pension and postretirement expense, long-term incentive compensation, certain other operating income/expense and other indirect corporate expenses. This is consistent with the way our Chief Operating Decision Maker evaluates the results of each segment.
HVAC Reportable Segment
Our HVAC reportable segment had revenues of $511.0, $509.5$752.1, $740.8 and $529.1$738.7 in 2017, 20162021, 2020 and 2015,2019, respectively, and backlog of $41.4$226.9 and $28.3$150.1 as of December 31, 20172021 and 2016,2020, respectively. Approximately 99%97% of the segment’s backlog as of December 31, 20172021 is expected to be recognized as revenue during 2018.2022. The segment engineers, designs, manufactures, installs and services cooling products and engineered air quality solutions for the HVAC and industrial markets, as well as heating and ventilation products for the residential and commercial markets. The primary distribution channels for the segment’s products are direct to customers, independent manufacturing representatives, third-party distributors, and retailers. The segment serves a customercustomer base in North America, Europe, and Asia Pacific.Asia. Core brands for our cooling products include Marley, Recold, SGS and Recold, with the major competitors to these products being Baltimore Aircoil Company and Evapco. OurCincinnati Fan, while our heating and ventilation products are sold under the Berko, Qmark, Fahrenheat, and Leading Edge, and Patterson-Kelley brands, while our Marley-Wylain subsidiaryand our WM Technologies subsidiary sells its products under the Weil-McLain and Williamson-Thermoflo brands. Major competitors to these products are TPI Corporation, Ouellet, King Electric, Systemair Mfg. LLC, Cadet Manufacturing Company, and Dimplex North America Ltd for heating products, Burnham Holdings, Inc, Mestek, Cleaver Brooks and Buderus for boiler products, and TPI Corporation, Broan-NuTone LLC and Airmaster Fan Company for ventilation products.
Detection and Measurement Reportable SegmentSegment
Our Detection and Measurement reportable segment had revenues of $260.3, $226.4$467.4, $387.3 and $232.3$384.9 in 2017, 20162021, 2020 and 2015,2019, respectively, and backlogbacklog of $54.0$153.6 and $53.6$89.3 as of December 31, 20172021 and 2016,2020, respectively. Approximately 65%71% of the segment’s backlog as of December 31, 20172021 is expected to be recognized as revenue during 2018.2022. The segment engineers, designs, manufactures, services, and installs underground pipe and cable locators, inspection and inspectionrehabilitation equipment, robotic systems, bus fare collection systems, communication technologies, and specialtyobstruction lighting. The primary distribution channels for the segment’s products are direct to customers and third-party distributors. The segment serves a global customer base, with a strong presence in North America, Europe, Africa and Asia Pacific. Core brands for our underground pipe and cable locators and inspection and rehabilitation equipment are Radiodetection, Pearpoint, Schonstedt, Dielectric, andRiser Bond, Warren G-V, with the major competitors to these products being Vivax-Metrotech, Leica, Subsite, IPEK, IBAK, Cues, System Studies,ULC Robotics, and Ridgid.Sensors & Software. Our bus fare collection systems, communication technologies, and specialtyobstruction lighting are sold under the Genfare, TCI, and Flash Technology, Sabik Marine, Sealite, Avlite and ECS brand names, respectively. Major competitors to our bus fare collection systems include Scheidt & Bachmann, Trapeze Group, Init, and Vix Technology, while major competitors to our communication technologies products include Rohde & Schwarz, Thales Group, Saab Grintek, and LS Telcom. Lastly, major competitors of our specialty lighting products include H&P, TWR Lighting, Unimar, Dialight and ITL.
Engineered Solutions Reportable Segment
Our Engineered Solutions reportable segment had revenues of $654.5, $736.4 and $797.6 in 2017, 2016 and 2015, respectively, and backlog of $434.0 and $416.7 as of December 31, 2017 and 2016, respectively. Approximately 83% of the segment’s backlog as of December 31, 2017 is expected to be recognized as revenue during 2018. The segment engineers, designs, manufactures, installs and services transformers for the power transmission and distribution market, as well as process cooling equipment and rotating and stationary heat exchangers for the power generation and industrial markets. The primary distribution channels for the segment’s products are direct to customers and third-party representatives. The segment has a strong presence in North America and South Africa.
We sell transformers under the Waukesha brand name. Typical customers for this product line are publicly and privately held utilities. Our competitors in this market include ABB Ltd., GE-Prolec, Siemens, Hyundai Power Transformers, Delta Star Inc., Pennsylvania Transformer Technology, Inc., SGB-SMIT Group, Virginia Transformer Corporation, Howard Industries, Inc., and WEG S.A.
Our process cooling products and heat exchangers are sold under the brand names of SPX Cooling, Marley, Yuba, and Ecolaire, with major competitors to these products and service lines being Enexio, Hamon & Cie, Thermal Engineering International, Howden Group Ltd, Siemens AG, and Alstom SA.
Acquisitions
We did not acquire any businesses in 2017, 2016 or 2015. However, we regularly review and negotiate potential acquisitions in the ordinary course of business, some of which are or may be material.
As previously indicated, we acquired Sealite, ECS, and Cincinnati Fan in 2021, ULC and Sensors & Software in 2020, and Sabik, SGS, and Patterson-Kelley in 2019.
Divestitures
We regularly review and negotiate potential divestitures in the ordinary course of business, some of which are or may be material.material. As a resultpreviously indicated, the divestiture of this continuous review,Transformer Solutions was completed in 2021. There were no divestitures of businesses in 2020 or 2019. As previously indicated, we determined that certaincompleted the wind-down of our DBT and Heat Transfer businesses would be better strategic fits with other companies or investors.
The following businesses were disposedin the fourth quarters of during 20162021 and 2015:2020, respectively.
|
| |
Business | Year
Disposed
|
Balcke Dürr* | 2016 |
Dry Cooling | 2016 |
SPX FLOW* | 2015 |
| |
* | Reflected as a discontinued operation for all periods presented. |
International Operations
We are a multinational corporationcorporation with operations in approximatelyover 15 countries. Sales outside the United States were $182.5, $237.1$228.0, $192.4 and $303.6$150.9 in 2017, 20162021, 2020 and 2015,2019, respectively.
See Note 57 to our consolidated financial statements for more information on our international operations.
Research and Development
We are actively engaged in research and development programs designed to improve existing products and manufacturing methods and develop new products to better serve our current and future customers. These efforts encompass certain of our products with divisional engineering teams coordinating their resources. We place particular emphasis on the development of new products that are compatible with, and build upon, our manufacturing and marketing capabilities.
We expensed $23.3, $29.1 and $28.6 in 2017, 2016 and 2015, respectively, of research activities relating to the development and improvement of our products.
Patents/Trademarks
We own approximately 147own 163 domestic and 238265 foreign patents (comprising approximately 163154 patent “families”), including approximately 2634 patents that were issued in 2017,2021, covering a variety of our products and manufacturing methods. We also own a number of registered trademarks.trademarks. Although in the aggregate our patents and trademarks are of considerable importance in the operation of our business, we do not consider any single patent or trademark to be of such importance that its absence would adversely affect our ability to conduct business as presently constituted. We are both a licensor and licensee of patents. For more information, please refer to “Risk Factors.”
Outsourcing and Raw Materials
We manufacture many of the components used in our products; however, our strategy includes outsourcing certain components and sub-assemblies to other companies where strategically and economically beneficial. In instances where we depend on third-party suppliers for outsourced products or components, we are subject to the risk of customer dissatisfaction with the quality or performance of the products we sell due to supplier failure. In addition, business difficulties experienced by a third-party supplier can lead to the interruption of our ability to obtain the outsourced product or component and ultimately to our inability to supply products to our customers. We believe that we generally will be able to continue to obtain adequate supplies of key products, components or appropriate substitutes at reasonable costs. For information regarding COVID-19 impacts, please refer to "MD&A - COVID-19 Pandemic, Supply Chain Disruptions, and Other Economic Factors."
We are subject to increases in the prices of many of our key raw materials, including petroleum-based products steel and copper.steel. In recent years, we have generally been able to offset increases in raw material costs. Occasionally, we are subject to long-term supplier contracts, which may increase our exposure to pricing fluctuations. We use forward contracts to manage our exposure on forecasted purchases of commodity raw materials (“commodity contracts”). See Note 12 to our consolidated financial statements for further information on commodity contracts.
Due to our diverse products and services, as well as the wide geographic dispersion of our production facilities, we use numerous sources for the raw materials needed in our operations. We are not significantly dependent on any one or a limited number of suppliers, and we have been able to obtain suitable quantities of raw materials at competitive prices. For information regarding COVID-19 impacts, please refer to "MD&A - COVID-19 Pandemic, Supply Chain Disruptions, and Other Economic Factors."
Competition
Our competitive position cannot be determined accurately in the aggregate or by reportable or operating segment since we and our competitors do not offer all the same product lines or serve all the same markets. In addition, specific reliable comparative figures are not available for many of our competitors. In most product groups, competition comes from numerous concerns, both large and small. The principal methods of competition are service, product performance, technical innovation and price. These methods vary with the type of product sold. We believe we compete effectively on the basis of each of these factors as they apply to the various products and services offered. See “Reportable Segments” above for a discussion of our competitors.
Environmental Matters
EmploymentHuman Capital Resources
At December 31, 2017,2021, we had over 5,000 employees. approximately 3,100 employees, with approximately 2,400 employed in the United States. We also leverage temporary workers to provide flexibility for our business and manufacturing needs. Six domestic collective bargaining agreements coveredcover approximately 1,000300 of our employees. We also hadIn addition, we have various collective labor arrangements ascovering certain of that date covering certainour non-U.S. employee groups. While we generally have experienced satisfactory labor relations, we are subject to potential union campaigns, work stoppages, union negotiations and other potential labor disputes.
We believe that our future success largely depends upon our continued ability to attract and retain highly skilled employees. As such, we strive to provide an environment where employees are developed and provided challenging career growth opportunities, and know their inputs and contributions are appreciated. We offer a “Total Rewards” program that
provides comprehensive compensation and benefits packages that are competitive with the market and choices designed to reward employees and assist them in managing their well-being. In 2021, we also focused significant time on re-working many of our policies and programs to provide increased flexibility and work-life balance to our team members. Together, these opportunities present significant growth potential for our employees from a financial, professional, and personal standpoint.
As part of our focus on building and sustaining a highly capable, engaged and motivated workforce that has the ability to deliver on the current and future requirements of the company, we continue to advance our talent management framework, known as RiSE, which helps us Reach, Identify, Strengthen, and Engage our workforce. Recent areas of focus include: the enhancement of our Front-line Leadership Program, introduction of a new on-demand learning platform and the on-going expansion of our talent review and succession planning programs. We also were able to successfully move even more of our education and training programs to an online format to allow for expanded participation and broader, time-flexible development.
During 2021, we continued our focus on enhancing our Diversity, Equity & Inclusion programs, aimed at ensuring we provide an inclusive environment where everyone feels valued and respected. We launched our formal Diversity & Inclusion Statement and published an enterprise charter to align the organization on our commitments. Our Executive Officers
See Part III, Item 10Leadership Team and Diversity & Inclusion Council, both comprised of this reportsenior leaders from across the enterprise and led by our CEO, facilitated listening sessions with employees from across the globe to learn what was important to them and how we could create an even better work environment. In response to the feedback received, multiple initiatives were undertaken to increase communications, build the capabilities of our leaders (we trained over 500 employees on how to Create an Inclusive Environment) and on furthering the dialogue across the enterprise. A Day of Understanding was held in each business to communicate, engage and educate our global teams. Our networking and action groups, comprised of dozens of “Ambassadors” from across the company, were active participants in the development and implementation of our strategies and programming to ensure that the actions we take drive meaningful and impactful results for information about our executive officers.employees. We believe that through these efforts we can unlock greater potential, provide new opportunities for our employees, and benefit from diverse backgrounds and points of view. Valuing diversity and inclusion is, and will be, an on-going part of the culture we are continuously working to strengthen.
Other Matters
No customer or group of customers that, to our knowledge, are under common control accounted for more than 10%10% of our consolidated revenues for any period presented.
Our businesses maintain sufficient levels of working capital to support customer requirements, particularly inventory. We believe our businesses’ sales and payment terms are generally similar to those of our competitors.
Many of our businesses closely follow changes in the industries and end markets they serve. In addition, certain businesses have seasonal fluctuations. Historically, our businesses generally tend to be stronger in the second half of the year.
Our website address is www.spx.com. Information on our website is not incorporated by reference herein. We file reports with the SEC, including annual reports on Form 10-K, quarterly reports on Form 10-Q and current reports on Form 8-K, and certain amendments to these reports. Copies of these reports are available free of charge on our website as soon as reasonably practicable after we file the reports with the SEC. The SEC also maintains a website at www.sec.gov that contains reports, proxy and information statements, and other information regarding issuers that file electronically with the SEC. Additionally, you may read and copy any materials that we file with the SEC at the SEC’s Public Reference Room at 100 F Street, NE, Washington, DC 20549. You may obtain information on the operation of the Public Reference Room by calling the SEC at 1-800-SEC-0330.
ITEM 1A. Risk Factors
(All currency and share amounts are in millions)
You should consider the risks described below and elsewhere in our documents filed with the SEC before investing in any of our securities. We may amend, supplement or add to the risk factors described below from time to time in future reports filed with the SEC.
Risks Related to the COVID-19 Pandemic
The COVID-19 pandemic has had, and could continue to have, an adverse impact on our business.
The COVID-19 pandemic had an adverse impact on our consolidated results of operations in the first half of 2020, with diminishing impacts during the second half of 2020 and during 2021. The COVID-19 pandemic could have an adverse impact on our business and consolidated financial results during 2022 and we are unable to determine the extent, duration, or nature at this time. The intensity, duration and governmental responses to the pandemic, as well as the pace of vaccination efforts and the emergence of new variants of the virus that cause COVID-19, are all highly uncertain and could contribute to the ultimate impact on our business. Specifically, the COVID-19 pandemic could impact:
•Our suppliers’ ability to perform and the availability of materials and subcontractors’ services;
•Our customers’ ability to access credit and to pay amounts due to us;
•Our distributors’ ability to perform; and
•Our ability to:
◦Access credit;
◦Meet contractual deadlines with customers, which could result in delays in payments from customers and customers possibly seeking delay damages;
◦Complete acquisitions due to potential adverse impacts on targeted businesses or product lines; and
◦Meet the financial covenants under our senior credit and other debt agreements.
The impact of the COVID-19 pandemic has resulted, and could continue to result, in:
•Disruptions in our supply chain or increased costs for certain components or commodities;
•Labor shortages and difficulties filling the positions within our organization;
•A prolonged reduction in the demand for certain of our products;
•A prolonged shut-down of one or more of our facilities either due to exposure to the COVID-19 pandemic or to further restrictive government orders;
•Asset impairment charges;
•A loss of productivity, greater cybersecurity risk and other fraud risks, and difficulties in maintaining internal controls over financial reporting due to the impact of employees working remotely;
•An adverse impact to the funded status of our defined benefit pension plans, which could result in (i) a material charge during the fourth quarter of 2022 and (ii) on a longer-term, additional funding requirements for the plans;
•The diversion of management’s attention from core business operations; and
•Restructuring charges if we decide to reduce headcount as a result of a decline in customer demand.
Any of the above risks could have a material adverse impact on our business and consolidated financial results.
Risks Related to Contingent Liabilities
Our South African subsidiary is subject to various claims, disputes, enforcement actions, litigation, arbitration and other legal proceedings related to two large power projects in South Africa that could ultimately be resolved against it.
Since 2008, DBT had been executing on two large power projects in South Africa (Kusile and Medupi), on which it has now substantially completed its scope of work. Over such time, the business environment surrounding these projects was difficult, as DBT, along with many other contractors on the projects, experienced delays, cost over-runs, and various other challenges associated with a complex set of contractual relationships among the end customer, prime contractors, various
subcontractors (including DBT and its subcontractors), and various suppliers. DBT is currently involved in a number of claims relating to these challenges and may be subject to other claims, which could be significant. SPX has provided parent company guarantees to certain counterparties in connection with these projects. We cannot give assurance that these claims and the costs to assert DBT's claims and defend claims against DBT will not have a material adverse effect on our financial position, results of operations, or cash flows. See “MD&A - Critical Accounting Estimates - Contingent Liabilities” and Note 15 to our consolidated financial statements for further discussion.
We are subject to potential liability relating to claims, complaints and proceedings, including those relating to asbestos, environmental, product liability and other matters.
We are subject to various laws, ordinances, regulations and other requirements of government authorities in the United States and other nations. Additionally, changes in laws, ordinances, regulations, or other governmental policies may significantly increase our expenses and liabilities.
Numerous claims, complaints, and proceedings arising in the ordinary course of business have been asserted or are pending against us or certain of our subsidiaries (collectively, “claims”). These claims relate to litigation matters (e.g., class actions and contracts, intellectual property, and competitive claims), environmental matters, product liability matters (predominately associated with alleged exposure to asbestos-containing materials), and other risk management matters (e.g., general liability, automobile, and workers’ compensation claims). Periodically, claims, complaints and proceedings arising other than in the ordinary course of business have been asserted or are pending against us or certain of our subsidiaries (e.g. patent infringement), including claims with respect to businesses that we have acquired for matters arising before the relevant date of the acquisition. From time to time, we face actions by governmental authorities, both in and outside the United States. Additionally, we may become subject to other claims of which we are currently unaware, which may be significant, or the claims of which we are aware may result in our incurring significantly greater loss than we anticipate. Our insurance may be insufficient or unavailable (e.g., because of insurer insolvency) to protect us against potential loss exposures.
The liabilities we record for asbestos product liability matters are based on a number of assumptions, including historical claims and payment experience and actuarial estimates of the future period during which additional claims are reasonably foreseeable. While we base our assumptions on facts currently known to us, they entail inherently subjective judgments and uncertainties. As a result, our current assumptions for estimating these liabilities may not prove accurate, and we may be required to adjust these liabilities in the future, including as a result of our change in relevant assumptions, which could result in material charges to earnings. In addition, a significant increase in claims, costs, and/or issues with existing insurance coverage could have a material adverse impact on our financial position, results of operations and cash flows.
We face environmental exposures including, for example, those relating to discharges from and materials handled as part of our operations, the remediation of soil and groundwater contaminated by petroleum products or hazardous substances or wastes, and the health and safety of our employees. We may be liable for the costs of investigation, removal, or remediation of hazardous substances or petroleum products on, under, or in our current or formerly owned or leased properties, or from third-party disposal facilities that we may have used, without regard to whether we knew of, or caused, the presence of the contaminants. The presence of, or failure to properly remediate, these substances may have adverse effects, including, for example, substantial investigative or remedial obligations and limitations on the ability to sell or rent affected property or to borrow funds using affected property as collateral. New or existing environmental matters or changes in environmental laws or policies could lead to material costs for environmental compliance or cleanup. In addition, environmentally related product regulations are growing globally in number and complexity and could contribute to increased costs with respect to disclosure requirements, product sales and distribution related costs, and post-sale recycling and disposal costs. There can be no assurance that these liabilities and costs will not have a material adverse effect on our financial position, results of operations, or cash flows.
We devote significant time and expense to defend against the various claims, complaints, and proceedings brought against us. In addition, from time to time, we bring actions to enforce our rights against customers, suppliers, insurers, and other third parties. We cannot assure you that the expenses or distractions from operating our businesses arising from these defenses and actions will not increase materially.
We cannot assure you that our accruals and right to indemnity and insurance will be sufficient, that recoveries from insurance or indemnification claims will be available or that any of our current or future claims or other matters will not have a material adverse effect on our financial position, results of operations, or cash flows.
See “MD&A - Critical Accounting Estimates - Contingent Liabilities” and Note 15 to our consolidated financial statements for further discussion.
Risks Related to our Markets and Customers
Many of the markets in which we operate are cyclical or are subject to industry events, and our results have been and could be affected as a result.
Many of the markets in which we operate are subject to general economic cycles or industry events. In addition, certain of our businesses are subject to market-specific cycles and weather-related fluctuations, including, but not limited to:cycles.
•HVAC; and
•Power transmission and distribution products.
In addition,Furthermore, contract timing on large projects, including those relating to power transmission and distribution systems, communications technology,communication technologies, fare collection systems, and process cooling systems and towers and power generation equipment may cause significant fluctuations in revenues and profits from period to period.
The businesses of many of our customers particularly general industrial and power and energy companies, are to varying degrees cyclical and have experienced, and may continue to experience, periodic downturns. Cyclical changes and specific industry events could also affect sales of products in our other businesses. Downturns in the business cycles of our different operations may occur at the same time, which could exacerbate any adverse effects on our business. In addition, certain of our businesses have seasonal and weather-related fluctuations. Historically, many of our key businesses generally have tended to have stronger performance in the second half of the year. See "MD“MD&A - Results of Continuing Operations and Results of Reportable Segments."”
Our business depends on capital investment and maintenance expenditures by our customers.
Demand for most of our products and services depends on the level of new capital investment and planned maintenance expenditures by our customers. The level of capital expenditures by our customers fluctuates based on planned expansions, new builds and repairs, commodity prices, general economic conditions, availability of credit, and expectations of future market behavior. Any of these factors, whether individually or in the aggregate, could have a material adverse effect on our customers and, in turn, our business, financial condition, results of operations and cash flows.
The price and availability of raw materials may adversely affect our business.
We are exposed to a variety of risks relating to the price and availability of raw materials. In recent years, we have faced volatility in the prices of many key raw materials, including copper, steel and oil. Increases in the prices of raw materials or shortages or allocations of materials may have a material adverse effect on our financial position, results of operations or cash flows, as we may not be able to pass cost increases on to our customers, or our sales may be reduced. We are subject to, or may enter into, long-term supplier contracts that may increase our exposure to pricing fluctuations.
Our customers have been and could be impacted by commodity availability and prices.
A number of factors outside our control, including fluctuating commodity prices, impact the demand for our products. Increased commodity prices, including as a result of new or increased tariffs or the impact of new trade laws, may increase our customers’ cost of doing business, thus causing them to delay or cancel large capital projects.
On the other hand, declining commodity prices may cause our customers to delay or cancel projects relating to the production of such commodities. For example, declines in oil prices have led to reduced demand for certain of our power generation products. In addition, in regions where the economy is largely dependent on oil and gas, declines in oil and gas prices have impacted the ability of our customers in these regions to finance capital expenditures. As a result, certain of our customers in these regions have delayed or cancelled tenders for our spectrum monitoring and related products. Reduced demand for our products and services could result in the delay or cancellation of existing
orders or lead to excess manufacturing capacity, which unfavorably impacts our absorption of fixed manufacturing costs. Reduced demand may also erode average selling prices in the relevant market.
Credit and counterparty risks could harm our business.
The financial condition of our customers and distributors could affect our ability to market our products or collect receivables. In addition, financial difficulties faced by our customers may lead to cancellations or delays of orders.
Our customers may suffer financial difficulties that make them unable to pay for a project when completed, or they may decide not or be unable to pay us, either as a matter of corporate decision-making or in response to changes in local laws and regulations. We cannot assure you that expenses or losses for uncollectible amounts will not have a material adverse effect on our revenues, earnings and cash flows.
We operate in highly competitive markets. Our failure to compete effectively could harm our business.
We sell our products in highly competitive markets, which could result in pressure on our profit margins and limit our ability to maintain or increase the market share of our products. We compete on a number of fronts, including on the basis of service, product offerings,performance, technical capabilities, quality, serviceinnovation and pricing.price. We have a number of competitors with substantial technological and financial resources, brand recognition and established relationships with global service providers. Some of our competitors have lower cost structures, support from local governments, or both. In addition, new competitors may enter the markets in which we participate. Competitors may be able to offer lower prices, additional products or services or a more attractive mix of products or services, or services or other incentives that we cannot or will not match. These competitors may be in a stronger position to respond quickly to new or emerging technologies and may be able to undertake more extensive marketing campaigns and make more attractive offers to potential customers, employees and strategic partners. In addition, competitive environments in slow-growth markets, to which some of our businesses have exposure, have been inherently more influenced by pricing and domestic and global economic conditions. To remain competitive, we need to invest in manufacturing, marketing, customer service and support, and our distribution networks. No assurances can be made that we will have sufficient resources to continue to make the investment required to maintain or increase our market share or that our investments will be successful. If we do not compete successfully, our business, financial condition, results of operations and cash flows could be materially adversely affected.
Risks Related to our Suppliers and Vendors
The price and availability of raw materials and components has and may adversely affect our business.
We are exposed to a variety of risks relating to the price and availability of raw materials and components. In recent years, we have faced volatility in the prices of many key raw materials (e.g., steel and oil) and key components (e.g. circuit boards), including price increases in response to trade laws and tariffs and shortages related to the COVID-19 pandemic. Increases in the prices of raw materials and components, including as a result of new or increased tariffs or the impact of new trade laws, or shortages or allocations of materials and components may have a material adverse effect on our financial position, results of operations or cash flows, as there may be delays in our ability, or we may not be able, to pass cost increases on to our customers, or our sales may be reduced. We are subject to, or may enter into, long-term supplier contracts that may increase our exposure to pricing fluctuations.
The fact that we outsource various elements of the products and services we sell subjects us to the business risks of our suppliers and subcontractors, which could have a material adverse impact on our operations.
In areas where we depend on third-party suppliers and subcontractors for outsourced products, components or services, we are subject to the risk of customer dissatisfaction with the quality or performance of the products or services we sell due to supplier or subcontractor failure. In addition, business difficulties experienced by a third-party supplier or subcontractor can lead to the interruption of our ability to obtain outsourced products or services and ultimately our inability to supply products or services to our customers. Third-party supplier and subcontractor business interruptions can include, but are not limited to, work stoppages, union negotiations and other labor disputes. Current economic conditions could also impact the ability of suppliers and subcontractors to access credit and, thus, impair their ability to provide us quality products or services in a timely manner, or at all.
Cost overruns, inflation, delaysRisks Related to Information, Technology and other risks could significantly impact our results, particularly with respect to long-term fixed-price contracts.
A portion of our revenues and earnings is generated through fixed-price contracts, particularly within our Engineered Solutions reportable segment. We recognize revenues for certain of these contracts using the percentage-of-completion method of accounting whereby revenues and expenses, and thereby profit, in a given period are determined based on our estimates as to the project status and the costs remaining to complete a particular project.
Estimates of total revenues and cost at completion are subject to many variables, including the length of time to complete a contract. In addition, contract delays may negatively impact these estimates and our revenues and earnings results for affected periods.
To the extent that we underestimate the remaining cost to complete a project, we may overstate the revenues and profit in a particular period. Further, certain of these contracts provide for penalties or liquidated damages for failure to timely perform our obligations under the contract, or require that we, at our expense, correct and remedy to the satisfaction of the other party certain defects. Because some of our long-term contracts are at a fixed price, we
face the risk that cost overruns or inflation may exceed, erode or eliminate our expected profit margin, or cause us to record a loss on our projects.
Our large power projects in South Africa are an example of these types of long-term-contract-related risks. The business environment surrounding our large power projects in South Africa remains difficult, as we have experienced, cost over-runs, and various other challenges associated with a complex set of contractual relationships among the end customer, prime contractors, various subcontractors (including us and our subcontractors), and various suppliers. We are currently involved in a number of claim disputes relating to these challenges. We are pursuing various commercial alternatives for addressing these challenges, in attempt to mitigate our overall financial exposure.
Although we believe that our current estimates of revenues and costs relating to our long-term contracts are reasonable, it is possible that future revisions of such estimates could have a material effect on our consolidated financial statements.
Worldwide economic conditions could negatively impact our businesses.
Many of our customers historically have tended to delay large capital projects, including expensive maintenance and upgrades, during economic downturns. Poor macroeconomic conditions could negatively impact our businesses by adversely affecting, among other things, our:
Revenues;
Margins;
Profits;
Cash flows;
Customers’ orders, including order cancellation activity or delays on existing orders;
Customers’ ability to access credit;
Customers’ ability to pay amounts due to us; and
Suppliers’ and distributors’ ability to perform and the availability and costs of materials and subcontracted services.
Downturns in global economies could negatively impact our performance or any expectations in reporting performance. For example, economic downturns relating to lower oil and gas prices have impacted the ability of customers in countries with oil and gas dependent economies to finance certain capital projects. This, in turn, has reduced demand for certain of our spectrum monitoring and related products in these regions.
Failure to protect or unauthorized use of our intellectual property may harm our business.
Despite our efforts to protect our proprietary rights, unauthorized parties or competitors may copy or otherwise obtain and use our products or technology. The steps we have taken may not prevent unauthorized use of our technology or knowledge, particularly in foreign countries where the laws may not protect our proprietary rights to the same extent as in the United States. Costs incurred to defend our rights may be material.Cybersecurity
If we are unable to protect our information systems against data corruption, cyber-based attacks or network security breaches, our operations could be disrupted.
We are increasingly dependent on cloud-based and other information technology (“IT”) networks and systems, some of which are managed by third parties, to process, transmit, and store electronic information. We depend on such IT infrastructure for electronic communications among our locations around the world and between our personnel and suppliers and customers. In addition, we rely on these IT systems to record, process, summarize, transmit, and store electronic information, and to manage or support a variety of business processes and activities, including, among other things, our accounting and financial reporting processes; our manufacturing and supply chain processes; our sales and marketing efforts; and the data related to our research and development efforts. The failure of our IT systems or those of our business partners or third-party service providers to perform properly, or difficulties encountered in the development of new systems or the upgrade of existing systems, could disrupt our business and harm our reputation, which may result in decreased sales, increased overhead costs, excess or obsolete inventory, and product shortages, causing our business, reputation, financial condition, and operating results to suffer. Upon expiration or termination of any of our agreements with third-party vendors, we may not be able to replace the services provided to us in a timely manner or on terms and conditions, including service levels and cost, that are favorable to us, and a transition from one vendor to another vendor could subject us to operational delays and inefficiencies until the transition is complete.
Information technologyIT security threats are increasing in frequency and sophistication.sophistication and we have detected numerous attempts to compromise the security of our IT systems. Cyber-attacks may be random, coordinated, or targeted, including sophisticated computer crime threats. These threats pose a risk to the security of our systems and networks, and those of our business partners and third-party service providers, and to the confidentiality, availability, and integrity of our data. Despite our implementation of security measures, cybersecurity threats, such as malicious software, ransomware, phishing attacks, computer viruses, and attempts to gain unauthorized access, cannot be completely mitigated. Our business, reputation, operating results, and financial condition could be materially adversely affected if, as a result of a significant cyber event or otherwise, our operations or industrial processes are disrupted or shutdown; our confidential, proprietary information is stolen or disclosed; the performance or security of our cloud-based product offerings is impacted; our intranet and internet sites are compromised; data is manipulated or destroyed; we incur costs or are required to pay fines in connection with stolen customer, employee, or other confidential information; we must dedicate significant resources to system repairs or increase cyber security protection; or we otherwise incur significant litigation or other costs.
In addition, newer generations of certain of our products include IT systems, including systems that are cloud-based and/or interconnect through the internet. These systems are subject to the same cybersecurity threats described above and the failure of these systems, including by cyber-attack, could disrupt our customers’ business, leading to potential exposure for us.
Our technology is important to our success, and failure to develop new products or make the appropriate investment in technology advancements may result in the loss of any sustainable competitive advantage in products, services and processes.
We believe the development of our intellectual property rights is critical to the success of our business. In order to maintain our market positions and margins, we need to regularly develop and introduce high-quality, technologically advanced and cost-effective products on a timely basis, in many cases in multiple jurisdictions around the world. Information technology systems, platforms and products are critical to our operating environment, product offerings and competitive position. Certain digitalization initiatives important to our long-term success may require capital investment, have significant risks associated with their execution, and could take several years to implement. If we do not accurately predict, prepare and respond to new technology innovations, market developments and changing customer needs, our revenues, profitability and long-term competitiveness could be materially adversely affected.
Failure to protect or unauthorized use of our intellectual property may harm our business.
Despite our efforts to protect our proprietary rights, unauthorized parties or competitors may copy or otherwise obtain and use our products or technology. The steps we have taken may not prevent unauthorized use of our technology or knowledge, particularly in foreign countries where the laws may not protect our proprietary rights to the same extent as in the United States. Costs incurred to defend our rights may be material.
Risks Related to Our Manufacturing and Operations
Cost overruns, inflation, delays and other risks could significantly impact our results, particularly with respect to fixed-price contracts.
A portion of our revenues and earnings is generated through fixed-price contracts, particularly within our HVAC reportable segment. We recognize revenues for certain of these contracts over-time whereby revenues and expenses, and thereby profit, in a given period are determined based on our estimates as to the project status and the costs remaining to complete a particular project.
Estimates of total revenues and cost at completion are subject to many variables, including the length of time to complete a contract. In addition, contract delays may negatively impact these estimates and our revenues and earnings results for affected periods.
To the extent that we underestimate the remaining cost to complete a project, we may overstate the revenues and profit in a particular period. Further, certain of these contracts provide for penalties or liquidated damages for failure to timely perform our obligations under the contract, or require that we, at our expense, correct and remedy certain defects to the satisfaction of the other party. Because some of our contracts are at a fixed price, we face the risk that cost overruns or inflation may exceed, erode or eliminate our expected profit margin, or cause us to record a loss on our projects.
Our current and planned products may contain defects or errors that are detected only after delivery to customers. If that occurs, our reputation may be harmed and we may face additional costs.
We cannot assure you that our product development, manufacturing and integration testing will be adequate to detect all defects, errors, failures and quality issues that could impact customer satisfaction or result in claims against us with regard to our products. As a result, we may have, and from time to time have had, to replace certain components and/or provide remediation in response to the discovery of defects in products that are shipped. The occurrence of any defects, errors, failures or quality issues could result in cancellation of orders, product returns, diversion of our resources, legal actions by our customers or our customers’ end users and other losses to us or to any of our customers or end users, and could also result in the loss of or delay in market acceptance of our products and loss of sales, which would harm our business and adversely affect our revenues, profitability and cash flows.
Risks Related to Macro-Economic, Domestic and World Events
Governmental laws and regulations could negatively affect our business.
Changes in laws and regulations to which we are or may become subject could have a significant negative impact on our business. In addition, we could face material costs and risks if it is determined that we have failed to comply with relevant laws and regulations. We are subject to U.S. Customs and Export Regulations, including U.S. International Traffic and Arms Regulations and similar laws, which collectively control import, export and sale of technologies by companies and various other aspects of the operation of our business; the Foreign Corrupt Practices Act and similar anti-bribery laws, which prohibit companies from making improper payments to government officials for the purposes of obtaining or retaining business; the California Transparency in Supply Chain Act and similar laws and regulations, which relate to human trafficking and anti-slavery and impose new compliance requirements on our businesses and their suppliers; and the California Consumer Privacy Act of 2018 and the European General Data Protection Regulation, which establish data management requirements for the protection of personal information of individuals. While our policies and procedures mandate compliance with such laws and regulations, there can be no assurance that our employees and agents will always act in strict compliance. Failure to comply with such laws and regulations may result in civil and criminal enforcement, including monetary fines and possible injunctions against shipment of product or other of our activities, which could have a material adverse impact on our reported results of operations and financial condition.
Several of our businesses are reliant on or may be directly impacted by government regulations. Changes to these regulations may have a significant negative impact on these businesses. For example, (i) a reduction of Federal Aviation Administration regulations mandating lighting of towers and buildings at height; (ii) increases in Department of Energy regulations on energy efficiency requirements for heating, and (iii) a reduction in regulations requiring 811 calls to be made before the commencement of a digging project, could have a significant negative impact on these businesses. While we monitor these regulations and our businesses plan for potential changes, there can be no assurance that we will be able to adapt in each circumstance. Failure to adapt if regulations change could have a material adverse impact on our results of operations and financial condition.
Difficulties presented by domestic economic, political, legal, accounting and business operations.factors could negatively affect our business.
In 2021, approximately 81% of our revenues were generated inside the United States. Our operating results are presented inreliance on U.S. dollars for reporting purposes. The strengtheningrevenues and U.S. manufacturing bases exposes us to a number of risks, including:
•Government embargoes or weakeningforeign trade restrictions such as antidumping duties, as well as the imposition of trade sanctions by the U.S. dollarUnited States against other currenciesa class of products imported from or sold and exported to, or the loss of “normal trade relations” status with, countries in which we conduct business, could resultsignificantly increase our cost of products imported into or exported from the United States or reduce our sales and harm our business and the relaxation of embargoes and foreign trade restrictions, by the United States could adversely affect the market for our products in unfavorable translation effects as the resultsUnited States;
•Customs and tariffs may make it difficult or impossible for us to move our products or assets across borders in a cost-effective manner and may increase the cost of transactions inour raw materials, including raw materials sourced domestically;
•Transportation and shipping expenses add cost to our products;
•Complications related to shipping, including delays due to weather, labor action, or customs, may impact our profit margins or lead to lost business;
•Environmental and other laws and regulations could increase our costs or limit our ability to run our business; and
•Our ability to obtain supplies from foreign countries are translated into U.S. dollars.vendors and ship products internationally may be impaired during times of crisis or otherwise.
Increased strength
Any of the above factors or other factors affecting the movement of people and products into and from various countries to North America could have a significant negative effect on our operations. In addition, our concentration on U.S. dollar will increase the effective pricebusiness may make it difficult to enter new markets, making it more difficult for our businesses to grow.
Worldwide economic conditions could negatively impact our businesses.
Many of our products soldcustomers historically have tended to delay capital projects, including expensive maintenance and upgrades, during economic downturns. Poor macroeconomic conditions could negatively impact our businesses by adversely affecting, among other things, our:
•Revenues;
•Margins;
•Profits;
•Cash flows;
•Customers’ orders, including order cancellation activity or delays on existing orders;
•Customers’ ability to access credit;
•Customers’ ability to pay amounts due to us; and
•Suppliers’ and distributors’ ability to perform and the availability and costs of materials and subcontracted services.
Downturns in U.S. dollars into other countries, including countries utilizingglobal economies could negatively impact our performance or any expectations in reporting performance.
Our non-U.S. revenues and operations expose us to numerous risks that may negatively impact our business.
To the Euro, whichextent we generate revenues outside of the United States, non-U.S. revenues and non-U.S. manufacturing bases exposes us to a number of risks, including:
•Significant competition could come from local or long-term participants in non-U.S. markets who may have significantly greater market knowledge and substantially greater resources than we do;
•Local customers may have a material adverse effect on salespreference for locally-produced products;
•Credit risk or require usfinancial condition of local customers and distributors could affect our ability to lowermarket our prices,products or collect receivables;
•Regulatory or political systems or barriers may make it difficult or impossible to enter or remain in new markets. In addition, these barriers may impact our existing businesses, including making it more difficult for them to grow;
•Local political, economic and also decreasesocial conditions, including the possibility of hyperinflationary conditions, political instability, nationalization of private enterprises, or unexpected changes relating to currency could adversely impact our reported revenues or margins relatedand operations;
•The United Kingdom’s exit from the European Union (commonly referred to sales conducted in foreign currenciesas “Brexit”) has contributed to, the extent we are unable or determine notand may continue to increase localcontribute to, economic, currency, prices. Likewise, decreased strength of the U.S. dollar could have a material adverse effect on the cost of materialsmarket and products purchased overseas.
Similarly, increased or decreased strength of the currencies of non-U.S. countries in which we manufacture will have a comparable effect against the currencies of other jurisdictions in which we sell. For example, our Radiodetection business manufactures a number of detection instrumentsregulatory uncertainty in the United Kingdom and sellsEuropean Union and could adversely affect economic, currency, market, regulatory, or political conditions both in those regions and worldwide;
•Customs, tariffs and trade restrictions may make it difficult or impossible for us to customersmove our products or assets across borders in other countries, therefore increased strengtha cost-effective manner;
•Transportation and shipping expenses add cost to our products;
•Complications related to shipping, including delays due to weather, labor action, or customs, may impact our profit margins or lead to lost business;
•Local, regional or worldwide hostilities, including armed conflicts, could impact our operations;
•Distance and language and cultural differences may make it more difficult to manage our business and employees and to effectively market our products and services; and
•Public health crises, including the outbreak of a pandemic or contagious disease.
Any of the British pound sterling will increaseabove factors or other factors affecting social and economic activity in the effective priceUnited Kingdom, China, and South Africa or affecting the movement of people and products into and from these products sold in British pound sterling into other countries; and decreased strength of British pound sterlingcountries to our major markets, could have a material adversesignificant negative effect on our operations.
Climate change and legal or regulatory responses thereto may have an adverse impact on our business and results of operations.
There is growing concern that increases in global average temperatures as a result of increased concentration of carbon dioxide and other greenhouse gases in the costatmosphere will cause significant adverse long-term climate changes, as well as more near-term changes in weather patterns that could adversely impact our operations. Moreover, growing concern over climate change may result in additional legal or regulatory requirements designed to reduce or mitigate the effects of materialscarbon dioxide and other greenhouse gas emissions on the environment. Many of our manufacturing plants and the products purchased outsidewe manufacture, particularly in the HVAC reportable segment, use significant amounts of electricity generated by burning fossil fuels, which releases carbon dioxide. Additionally, many of the United Kingdom.products we manufacture in the HVAC reportable segment use natural gas or oil as a fuel source and may be subject to increasing regulatory restrictions aimed at “de-carbonization” or the elimination of such fuel sources. Increased energy or compliance costs and expenses as a result of increased legal or regulatory requirements may cause disruptions in, or an increase in the costs associated with, the manufacturing and distribution of our products and we may be required to develop product improvements to satisfy developing energy-efficiency targets in order to remain competitive. In addition, the impacts of climate change and legal or regulatory initiatives to address climate change could have a long-term adverse impact on our business and results of operations. If we fail to achieve or improperly report on our progress on environmental and sustainability programs and initiatives or fail to develop product improvements to satisfy developing energy-efficiency targets, the results could have an adverse impact on our business, results of operations and financial condition.
Risks Related to Acquisitions and Dispositions
Acquisitions involve a number of risks and present financial, managerial and operational challenges.
Our acquisitions involve a number of risks and present financial, managerial and operational challenges, including:
•Adverse effects on our reported operating results due to charges to earnings, including potential impairment charges associated with goodwill and other intangibles;
•Diversion of management attention from core business operations;
•Integration of technology, operations, personnel and financial and other systems;
•Increased expenses;
•Increased foreign operations, often with unique issues relating to corporate culture, compliance with legal and regulatory requirements and other challenges;
•Assumption of known and unknown liabilities and exposure to litigation;
•Increased levels of debt or dilution to existing stockholders;
•Potential disputes with the sellers of acquired businesses; and
•Potential cybersecurity risks, as acquired systems may not possess the appropriate security measures.
We conduct operational, financial, tax, systems, and legal due diligence on all acquisitions; however, we cannot assure that all potential risks or liabilities are subjectadequately discovered, disclosed, or understood in each instance.
In addition, internal controls over financial reporting of acquired companies may not be compliant with required standards. Issues may exist that could rise to laws, regulations and potential liability relating to claims, complaints and proceedings, including those relating to environmental, product liability and other matters.
We are subject to various laws, ordinances, regulations and other requirementsthe level of government authorities in the United States and other nations. With respect to acquisitions, divestitures and continuing operations, we may acquire or retain liabilities of which we are not aware, or which are of a different character or magnitude than expected. Additionally, changes in laws, ordinances, regulations, or other governmental policies may significantly increase our expenses and liabilities.
We face environmental exposures including, for example, those relating to discharges from and materials handled as part of our operations, the remediation of soil and groundwater contaminated by petroleum products or hazardous substances or wastes, and the health and safety of our employees. We may be liable for the costs of investigation, removal, or remediation of hazardous substances or petroleum products on, under,significant deficiencies or, in our current or formerly owned or leased properties, or from third-party disposal facilities that we may have used, without regard to whether we knew of, or caused, the presence of the contaminants. The presence of, or failure to properly remediate, these substances may have adverse effects, including, for example, substantial investigative or remedial obligations and limitations on the ability to sell or rent affected property or to borrow funds using affected property as collateral. New or existing environmental matters or changes in environmental laws or policies could lead tosome cases, material costs for environmental compliance or cleanup. In addition, environmentally related product regulations are growing globally in number and complexity and could contribute to increased costsweaknesses, particularly with respect to disclosure requirements,foreign companies or non-public U.S. companies.
Our integration activities may place substantial demands on our management, operational resources and financial and internal control systems. Customer dissatisfaction or performance problems with an acquired business, technology, service or product sales and distribution related costs, and post-sale recycling and disposal costs. There can be no assurance that these liabilities and costs will notcould also have a material adverse effect on our financial position, results of operations, or cash flows.
Numerous claims, complaints,reputation and proceedings arising in the ordinary course of business have been asserted or are pending against us or certain of our subsidiaries (collectively, “claims”). These claims relate to litigation matters (e.g., class actions and contracts, intellectual property, and competitive claims), environmental matters, product liability matters (predominately associated with alleged exposure to asbestos-containing materials), and other risk management matters (e.g., general liability, automobile, and workers’ compensation claims). Periodically, claims,
complaints and proceedings arising other than in the ordinary course of business have been asserted or are pending against us or certain of our subsidiaries (e.g. patent infringement and disputes with subsidiary shareholder(s)). From time to time, we face actions by governmental authorities, both in and outside the United States. Additionally, we may become subject to other claims of which we are currently unaware, which may be significant, or the claims of which we are aware may result in our incurring significantly greater loss than we anticipate. Our insurance may be insufficient or unavailable (e.g., because of insurer insolvency) to protect us against potential loss exposures.
We devote significant time and expense to defend against the various claims, complaints, and proceedings brought against us, and we cannot assure you that the expenses or distractions from operating our businesses arising from these defenses will not increase materially.
We cannot assure you that our accruals and right to indemnity and insurance will be sufficient, that recoveries from insurance or indemnification claims will be available or that any of our current or future claims or other matters will not have a material adverse effect on our financial position, results of operations, or cash flows.
See “MD&A - Critical Accounting Policies and Use of Estimates - Contingent Liabilities” and Note 13 to our consolidated financial statements for further discussion.business.
Our failure to successfully complete acquisitions could negatively affect us.
We may not be able to consummate desired acquisitions, which could materially impact our growth rate, results of operations, future cash flows and stock price. Our ability to achieve our goals depends upon, among other things, our ability to identify and successfully acquire companies, businesses and product lines, to effectively integrate them and to achieve cost savings. We may also be unable to raise additional funds necessary to consummate these acquisitions. In addition, decreases in our stock price may adversely affect our ability to consummate acquisitions. Competition for acquisitions in our business areas may be significant and result in higher prices for businesses, including businesses that we may target, which may also affect our acquisition rate or benefits achieved from our acquisitions.
We may not achieve the expected cost savings and other benefits of our acquisitions.
We strive for and expect to achieve cost savings in connection with our acquisitions, including: (i) manufacturing process and supply chain rationalization, (ii) streamlining redundant administrative overhead and support activities, and (iii) restructuring and repositioning sales and marketing organizations to eliminate redundancies.redundancies, and (iv) achieving anticipated revenue synergies. Cost savings expectations are estimates that are inherently difficult to predict and are necessarily speculative in nature, and we cannot assure you that we will achieve expected, or any, cost savings in connection with an acquisition. In addition, we cannot assure you that unforeseen factors will not offset the estimated cost savings or other benefits from our acquisitions. As a result, anticipated benefits could be delayed, differ significantly from our estimates and the other information contained in this report, or not be realized.
Our failure to successfully integrate acquisitions could have a negative effect on our operations; our acquisitions could cause financial difficulties.
Our acquisitions involve a number of risks and present financial, managerial and operational challenges, including:
Adverse effects on our reported operating results due to charges to earnings, including impairment charges associated with goodwill and other intangibles;
Diversion of management attention from core business operations;
Integration of technology, operations, personnel and financial and other systems;
Increased expenses;
Increased foreign operations, often with unique issues relating to corporate culture, compliance with legal and regulatory requirements and other challenges;
Assumption of known and unknown liabilities and exposure to litigation;
Increased levels of debt or dilution to existing stockholders; and
Potential disputes with the sellers of acquired businesses, technology, services or products.
In addition, internal controls over financial reporting of acquired companies may not be compliant with required standards. Issues may exist that could rise to the level of significant deficiencies or, in some cases, material weaknesses, particularly with respect to foreign companies or non-public U.S. companies.
Our integration activities may place substantial demands on our management, operational resources and financial and internal control systems. Customer dissatisfaction or performance problems with an acquired business, technology, service or product could also have a material adverse effect on our reputation and business.
Dispositions or liabilities retained in connection with dispositions could negatively affect us.
Our dispositions involve a number of risks and present financial, managerial and operational challenges, including diversion of management attention from running our core businesses, increased expense associated with the dispositions, potential disputes with the customers or suppliers of the disposed businesses, potential disputes with the acquirers of the disposed businesses and a potential dilutive effect on our earnings per share. In addition, we have agreed to retain certain liabilities in connection with the disposition of certain businesses, including the Balcke Dürr business.businesses. These liabilitiesliabilities may be significant and could negatively impact our business.
If dispositions are not completed in a timely manner, there may be a negative effect on our cash flows and/or our ability to execute our strategy. In addition, we may not realize some or all of the anticipated benefits of our dispositions. See “Business,” “MD
“MD&A - Results of Discontinued Operations,” and Note 4 to our consolidated financial statements for the status of our divestitures.
Governmental laws and regulations could negatively affect our business.
Changes in laws and regulationsRisks Related to which we are or may become subject could have a significant negative impact on our business. In addition, we could face material costs and risks if it is determined that we have failed to comply with relevant law and regulation. We are subject to U.S. Customs and Export Regulations, including U.S. International Traffic and Arms Regulations and similar laws, which collectively control import, export and sale of technologies by companies and various other aspects of the operation of our business; the Foreign Corrupt Practices Act and similar anti-bribery laws, which prohibit companies from making improper payments to government officials for the purposes of obtaining or retaining business; and the California Transparency in Supply Chain Act and similar laws and regulations, which relate to human trafficking and anti-slavery and impose new compliance requirements on our businesses and their suppliers. While our policies and procedures mandate compliance with such laws and regulations, there can be no assurance that our employees and agents will always act in strict compliance. Failure to comply with such laws and regulations may result in civil and criminal enforcement, including monetary fines and possible injunctions against shipment of product or other of our activities, which could have a material adverse impact on our results of operations and financial condition.
Changes in tax laws and regulations or other factors could cause our income tax obligations to increase, potentially reducing our net income and adversely affecting our cash flows.
We are subject to taxation in various jurisdictions around the world. In preparing our financial statements, we provide for income taxes based on current tax laws and regulations and the estimated taxable income within each of these jurisdictions. Our income tax obligations, however, may be higher due to numerous factors, including changes in tax laws or regulations and the outcome of audits and examinations of our tax returns.
Officials in some of the jurisdictions in which we do business have proposed, or announced that they are reviewing, tax changes that could potentially increase taxes, and other revenue-raising laws and regulations, including those that may be enacted as a result of the OECD Base Erosion and Profit Shifting project. Any such changes in tax laws or regulations could impose new restrictions, costs or prohibitions on existing practices as well as reduce our net income and adversely affect our cash flows.
On December 22, 2017, the Tax Cuts and Jobs Act (the “Act”) was enacted which significantly changes United States (“U.S.”) income tax law for businesses and individuals. The Act introduces changes that impact U.S. corporate tax rates (e.g., a reduction in the top tax rate from 35% to 21%), business-related exclusions, and deductions and credits. The Act also will have tax consequences for many entities that operate internationally, including the timing and the amount of tax to be paid on undistributed foreign earnings. We have recorded provisional amounts in our 2017 consolidated financial statements to reflect the impact of the Act, as we have yet to complete our analysis of the impact (see Notes 1 and 10 to our consolidated financial statements for additional details). The results of our analysis, which we will complete in 2018, could have a material impact on our 2018 financial position and results of operations. In addition, certain aspects of the Act are unclear and, thus, we anticipate subsequent regulations and interpretations to be issued that will provide additional guidance around application of the Act. The additional guidance could have a material impact on our financial position, results of operations, and cash flows.
There is a risk that we could be challenged by tax authorities on certain of the tax positions we have taken, or will take, on our tax returns. Although we believe that current tax laws and regulations support our positions, there can be no assurance that tax authorities will agree with our positions. In the event tax authorities were to challenge one or more of our tax positions, an unfavorable outcome could have a material adverse impact on our financial position, results of operations, and cash flows.
Human Capital Resources
The loss of key personnel and an inability to attract and retain qualified employees could have a material adverse effect on our operations.
We are dependent on the continued services of our leadership team. The loss of these personnel without adequate replacement could have a material adverse effect on our operations. Additionally, we need qualified managers and skilled employees with technical and manufacturing industry experience in many locations in order to operate our business successfully. From time to time, there may be a shortage of qualified managers or skilled labor, which may make it more difficult and expensive for us to attract and retain qualified employees. If we were unable to attract and retain sufficient numbers of qualified individuals or our costs to do so were to increase significantly, our operations could be materially adversely affected.
Our indebtednessWe are subject to work stoppages, union negotiations, labor disputes and other matters associated with our labor force, which may affectadversely impact our businessoperations and may restrict our operating flexibility.cause us to incur incremental costs.
At December 31, 2017,2021, we had $356.8 in total indebtedness. On that same date, we had $314.3 of available borrowing capacity under our revolving credit facilities, after giving effect to $35.7 reserved for outstanding letters of credit, and $33.3 of available borrowing capacity under our trade receivables financing arrangement. In addition, at December 31, 2017, we had $16.9 of available issuance capacity under our foreign credit instrument facilities after giving effect to $183.1 reserved for outstanding letters of credit. At December 31, 2017, our cash and equivalents balance was $124.3. See MD&A and Note 11 to our consolidated financial statements for further discussion. We may incur additional indebtedness in the future, including indebtedness incurred to finance, or assumed in connection with, acquisitions. We may renegotiate or refinance our senior credit facilities or other debt facilities, or enter into additionalsix domestic collective bargaining agreements that have different or more stringent terms. The levelcovering approximately 300 of our indebtedness could:
Impact our abilityover 3,100 employees. Three of these collective bargaining agreements expire in 2022 and are scheduled for negotiation and renewal. We also have various collective labor arrangements covering certain non-U.S. employee groups. We are subject to obtain new, or refinance existing, indebtedness, on favorable terms or at all;
Limit our ability to obtain, or obtain on favorable terms, additional debt financing for working capital, capital expenditures or acquisitions;
Limit our flexibility in reacting to competitivepotential union campaigns, work stoppages, union negotiations and other changes in the industry and economic conditions;
Limit our ability to pay dividends on our common stock in the future;
Coupled with a substantial decrease in net operating cash flows due to economic developments or adverse developments in our business, make it difficult to meet debt service requirements; and
Expose us to interest rate fluctuations to the extent existing borrowings are, and any new borrowingspotential labor disputes. Further, we may be at variable rates of interest,subject to work stoppages, which could result in higher interest expense and interest payments in the event of increases in interest rates.
Our ability to make scheduled payments of principal or pay interest on, or to refinance, our indebtedness and to satisfy our other debt obligations will depend upon our future operating performance, which may be affected by general economic, financial, competitive, legislative, regulatory, business and other factorsare beyond our control. In addition, we cannot assure you that future borrowingscontrol, at our suppliers or equity financing will be available for the payment or refinancing of our indebtedness. If we are unablecustomers.
Risks Related to service our indebtedness, whether in the ordinary course of business or upon an acceleration of such indebtedness, we may pursue one or more alternative strategies, such as restructuring or refinancing our indebtedness, selling assets, reducing or delaying capital expenditures, revising implementation of or delaying strategic plans or seeking additional equity capital. Any of these actions could have a material adverse effect on our business, financial condition, results of operations and stock price. In addition, we cannot assure that we would be able to take any of these actions, that these actions would enable us to continue to satisfy our capital requirements, or that these actions would be permitted under the terms of our various debt agreements.
Numerous banks in many countries are syndicate members in our credit facility. Failure of one or more of our larger lenders, or several of our smaller lenders, could significantly reduce availability of our credit, which could harm our liquidity.
Financial Matters
We may not be able to finance future needs or adapt our business plan to react to changes in economic or business conditions because of restrictions placed on us by our senior credit facilities and any existing or future instruments governing our other indebtedness.
Our senior credit facilities and agreements governing our other indebtedness contain, or future or revised instruments may contain, various restrictions and covenants that limit our ability to make distributions or other payments to our investors and creditors unless certain financial tests or other criteria are satisfied. We also must comply with certain specified financial ratios and tests. Our subsidiaries may also be subject to restrictions on their ability to make distributions to us. In addition, our senior credit facilities and agreements governing our other indebtedness contain or may contain additional affirmative and negative covenants. Material existing restrictions are described more fully in the MD“MD&A - Liquidity and Financial Condition - Senior Credit Facilities” and Note 1113 to our consolidated financial statements. Each of these restrictions could affect our ability to operate our business and may limit our ability to take advantage of potential business opportunities, such as acquisitions.
If we do not comply with the covenants and restrictions contained in our senior credit facilities and agreements governing our other indebtedness, we could default under those agreements, and the debt, together with accrued interest, could be declared due and payable. If we default under our senior credit facilities, the lenders could cause all our outstanding debt obligations under our senior credit facilities to become due and payable or require us to repay the indebtedness under these facilities. If our debt is accelerated, we may not be able to repay or refinance our debt. In addition, any default under our senior credit facilities or agreements governing our other indebtedness could lead to an acceleration of debt under other debt instruments that contain cross-acceleration or cross-default provisions. If the indebtedness under our senior credit facilities is accelerated, we may not have sufficient assets to repay amounts due under our senior credit facilities or other debt securities then outstanding. Our ability to comply with these provisions of our senior credit facilities and agreements governing our other indebtedness will be affected by changes in the economic or business conditions or other events beyond our control. Complying with our covenants may also cause us to take actions that are not favorable to us and may make it more difficult for us to successfully execute our business strategy and compete, including against companies that are not subject to such restrictions.
DifficultiesCurrency conversion risk could have a material impact on our reported results of business operations.
Our operating results are presented by economic, political, legal, accounting and business factors could negatively affect our business.
In 2017, approximately 87%in U.S. dollars for reporting purposes. The strengthening or weakening of our revenues were generated inside the United States. Our reliance on U.S. revenues and U.S. manufacturing bases exposes us to a number of risks, including:
Government embargoes or foreign trade restrictions such as anti-dumping duties, as well as the imposition of trade sanctions by the United Statesdollar against a class of products imported from or sold and exported to, or the loss of “normal trade relations” status with, countriesother currencies in which we conduct business could significantlyresult in unfavorable translation effects as the results of transactions in foreign countries are translated into U.S. dollars.
Increased strength of the U.S. dollar will increase the effective price of our cost of products importedsold in U.S. dollars into other countries, including countries utilizing the Euro, which may have a material adverse effect on sales or exported from the United States or reduce our sales and harm our business;
Customs and tariffs may make it difficult or impossible forrequire us to movelower our products
prices, and also decrease our reported revenues or assets across borders in a cost-effective manner;
Transportation and shipping expenses add cost to our products;
Complicationsmargins related to shipping, including delays duesales conducted in foreign currencies to weather, labor action,the extent we are unable or customs, may impact our profit margins or leaddetermine not to lost business;
Environmental and other laws and regulations could increase our costs or limit our ability to run our business; and
Our ability to obtain supplies from foreign vendors and ship products internationally may be impaired during times of crisis or otherwise.
Anylocal currency prices. Likewise, the increased strength of the above factors or other factors affectingU.S. dollar could allow competitors with foreign-based manufacturing costs to sell their products in the movementU.S. at lower prices. Alternatively, decreased strength of people and products into and from various countries to North Americathe U.S. dollar could have a significant negativematerial adverse effect on the cost of materials and products purchased overseas.
Similarly, increased or decreased strength of the currencies of non-U.S. countries in which we manufacture will have a comparable effect against the currencies of other jurisdictions in which we sell. For example, our operations. In addition, our concentrationRadiodetection business manufactures a number of detection instruments in the United Kingdom and sells to customers in other countries, therefore increased strength of the British pound sterling will increase the effective price of these products sold in British pound sterling into other countries; and decreased strength of British pound sterling could have a material adverse effect on U.S. business may make it difficult to enter new markets, making it more difficult for our businesses to grow.
Our non-U.S. revenuesthe cost of materials and operations expose us to numerous risks that may negatively impact our business.
To the extent we generate revenuesproducts purchased outside of the United States, non-U.S. revenues and non-U.S. manufacturing bases exposes us to a number of risks, including:
Significant competition could come from local or long-term participants in non-U.S. markets who may have significantly greater market knowledge and substantially greater resources than we do;
Local customers may have a preference for locally-produced products;
Kingdom.
Credit risk orand counterparty risks could harm our business.
The financial condition of localour customers and distributors could affect our ability to market our products or collect receivables;
Regulatory or political systems or barriers may make it difficult or impossible to enter or remain in new markets.receivables. In addition, these barriersfinancial difficulties faced by our customers may impact our existing businesses, including making it more difficult for them to grow;
Local political, economic and social conditions, including the possibility of hyperinflationary conditions, political instability, nationalization of private enterprises, or unexpected changes relating to currency could adversely impact our revenues and operations;
The United Kingdom’s decision to exit from the European Union (commonly referred to as “Brexit”) has contributed to, and may continue to contribute to, European economic, market and regulatory uncertainty and could adversely affect European or worldwide economic, market, regulatory, or political conditions;
Customs and tariffs may make it difficult or impossible for us to move our products or assets across borders in a cost-effective manner;
Transportation and shipping expenses add cost to our products;
Complications related to shipping, including delays due to weather, labor action, or customs, may impact our profit margins or lead to lost business;cancellations or delays of orders.
Local, regionalOur customers may suffer financial difficulties that make them unable to pay for a project when completed, or worldwide hostilities could impactthey may decide not or be unable to pay us, either as a matter of corporate decision-making or in response to changes in local laws and regulations. We cannot assure you that expenses or losses for uncollectible amounts will not have a material adverse effect on our operations;earnings and cash flows.
DistanceChanges in tax laws and language and cultural differences may make it more difficult to manage our business and employees and to effectively market our products and services.
Any of the above factorsregulations or other factors could cause our income tax obligations to increase, potentially reducing our net income and adversely affecting socialour cash flows.
We are subject to taxation in various jurisdictions around the world. In preparing our financial statements, we provide for income taxes based on current tax laws and economic activityregulations and the estimated taxable income within each of these jurisdictions. Our income tax obligations, however, may be higher due to numerous factors, including changes in tax laws or regulations and the United Kingdom, China,outcome of audits and South Africaexaminations of our tax returns.
Officials in some of the jurisdictions in which we do business have proposed, or affecting the movementannounced that they are reviewing, tax changes that could potentially increase taxes, and other revenue-raising laws and regulations, including those that may be enacted as a result of peoplevarious OECD projects. Changes in applicable U.S. or foreign tax laws and products intoregulations, or their interpretation and from these countries to our major markets,application, could have a significant negative effectmaterial impact on our operations.financial position, results of operations, and cash flows.
As indicated in Note 12 to our consolidated financial statements, certain of our income tax returns are currently under audit. In connection with these and any future audits, there is a risk that we could be challenged by tax authorities on certain of the tax positions we have taken, or will take, on our tax returns. Although we believe that current tax laws and regulations support our positions, there can be no assurance that tax authorities will agree with our positions. In the event tax authorities were to challenge one or more of our tax positions, an unfavorable outcome could have a material adverse impact on our financial position, results of operations, and cash flows.
If the fair value of any of our reporting units is insufficient to recover the carrying value of the goodwill and other intangibles of the respective reporting unit, a material non-cash charge to earnings could result.
At December 31, 2017,2021, we had goodwill and other intangible assets, net, of $463.5.$872.8. We conduct annual impairment testing to determine if we will be able to recover all or a portion of the carrying value of goodwill and indefinite-lived intangibles. In addition, we review goodwill and indefinite-lived intangible assets for impairment more frequently if impairment indicators arise. If the fair value is insufficient to recover the carrying value of our goodwill and indefinite-lived intangibles, we may be required to record a material non-cash charge to earnings.
The fair values of our reporting units generally are based on discounted cash flow projections that are believed to be reasonable under current and forecasted circumstances, the results of which form the basis for making judgments about carrying values of the reported net assets of our reporting units. Other considerations are also incorporated, including comparable price multiples. Many of our businesses closely follow changes in the industries and end markets that they serve. Accordingly, we consider estimates and judgments that affect the future cash flow projections, including principal methods of competition such as volume, price, service, product performance and technical innovations and estimates associated with cost reduction initiatives, capacity utilization, and assumptions for inflation and foreign currency changes. We monitor impairment indicators across all of our businesses. Significant changes in market conditions and estimates or judgments used to determine expected
future cash flows that indicate a reduction in carrying value may give, and have given, rise to impairments in the period that the change becomes known.
Cost reduction actions may affect our business.
Cost reduction actions often result in charges against earnings. These charges can vary significantly from period to period and, as a result, we may experience fluctuations in our reported net income and earnings per share due to the timing of restructuringcost reduction actions.
Our technology is important to our success, and failure to develop new products may result in a significant competitive disadvantage.
We believe the development of our intellectual property rights is critical to the success of our business. In order to maintain our market positions and margins, we need to continually develop and introduce high-quality, technologically advanced and cost-effective products on a timely basis, in many cases in multiple jurisdictions around the world. The failure to do so could result in a significant competitive disadvantage.
Our current and planned products may contain defects or errors that are detected only after delivery to customers. If that occurs, our reputation may be harmed and we may face additional costs.
We cannot assure you that our product development, manufacturing and integration testing will be adequate to detect all defects, errors, failures and quality issues that could impact customer satisfaction or result in claims against us with regard to our products. As a result, we may have, and from time to time have had, to replace certain components and/or provide remediation in response to the discovery of defects in products that are shipped. The occurrence of any defects, errors, failures or quality issues could result in cancellation of orders, product returns, diversion of our resources, legal actions by our customers or our customers’ end users and other losses to us or to any of our customers or end users, and could also result in the loss of or delay in market acceptance of our products and loss of sales, which would harm our business and adversely affect our revenues and profitability.
Changes in key estimates and assumptions related to our defined benefit pension and postretirement plans, such as discount rates, assumed long-term return on assets, assumed long-term trends of future cost, and accounting and legislative changes, as well as actual investment returns on our pension plan assets and other actuarial factors, could affect our results of operations and cash flows.
We have defined benefit pension and postretirement plans, including both qualified and non-qualified plans, which cover a portion of our salaried and hourly employees and retirees, including a portion of our employees and retirees in foreign countries. As of December 31, 2017,2021, our net liability to these plans was $156.8.$115.5. The determination of funding requirements and pension expense or income associated with these plans involves significant judgment, particularly with respect to discount rates, long-term trends of future costs and other actuarial assumptions. If our assumptions change significantly due to changes in economic, legislative and/or demographic experience or circumstances, our pension and other benefit plans’ expense, funded status and our required cash contributions to such plans could be negatively impacted. In addition, returns on plan assets could have a material impact on our pension plans’ expense, funded status and our required contributions to the plans. Changes in regulations or law could also significantly impact our obligations. For example, see “MD&A - Critical Accounting Policies and Use of Estimates” for the impact that changes in certain assumptions used in the calculation of our costs and obligations associated with these plans could have on our results of operations and financial position.
Our incurrence of additional indebtedness may affect our business and may restrict our operating flexibility.
At December 31, 2021, we had $246.0 in total indebtedness. On that same date, we had $437.8 of available borrowing capacity under our revolving credit facilities, after giving effect to $12.2 reserved for outstanding letters of credit. In addition, at December 31, 2021, we had $30.3 of available issuance capacity under our foreign credit instrument facilities after giving effect to $24.7 reserved for outstanding letters of credit. At December 31, 2021, our cash and equivalents balance was $396.0. See “MD&A - Liquidity and Financial Condition - Borrowings” and Note 13 to our consolidated financial statements for further discussion. We may incur additional indebtedness in the future, including indebtedness incurred to finance, or assumed in connection with, acquisitions. We may renegotiate or refinance our senior credit facilities or other debt facilities, or enter into additional agreements that have different or more stringent terms. Increases in the level of our indebtedness relative to our cash balances could:
•Impact our ability to obtain new, or refinance existing, indebtedness, on favorable terms or at all;
•Limit our ability to obtain, or obtain on favorable terms, additional debt financing for working capital, capital expenditures or acquisitions;
•Limit our flexibility in reacting to competitive and other changes in the industry and economic conditions;
•Limit our ability to pay dividends on our common stock in the future;
•Coupled with a substantial decrease in net operating cash flows due to economic developments or adverse developments in our business, make it difficult to meet debt service requirements; and
•Expose us to interest rate fluctuations to the extent existing borrowings are, and any new borrowings may be, at variable rates of interest, which could result in higher interest expense and interest payments in the event of increases in interest rates.
Our ability to make scheduled payments of principal or pay interest on, or to refinance, our indebtedness and to satisfy our other debt obligations will depend upon our future operating performance, which may be affected by general economic, financial, competitive, legislative, regulatory, business and other factors beyond our control. In addition, we cannot assure you that future borrowings or equity financing will be available for the payment or refinancing of our indebtedness. If we are unable to service our indebtedness, whether in the ordinary course of business or upon an acceleration of such indebtedness, we may pursue one or more alternative strategies, such as restructuring or refinancing our indebtedness, selling assets, reducing or delaying capital expenditures, revising implementation of or delaying strategic plans or seeking additional equity capital. Any of these actions could have a material adverse effect on our business, financial condition, results of operations and stock price. In addition, we cannot assure that we would be able to take any of these actions, that these actions would enable us to continue to satisfy our capital requirements, or that these actions would be permitted under the terms of our various debt agreements.
Numerous banks in many countries are syndicate members in our credit facility. Failure of one or more of our larger lenders, or several of our smaller lenders, could significantly reduce availability of our credit, which could harm our liquidity.
Failure of our internal control over financial reporting could adversely affect our business and financial results.
Our management is responsible for establishing and maintaining effective internal control over financial reporting. Internal control over financial reporting is a process to provide reasonable assurance regarding the reliability of financial reporting for external purposes in accordance with accounting principles generally accepted in the United States (“GAAP”). Because of its inherent limitations, internal control over financial reporting is not intended to provide absolute assurance that we would prevent or detect a misstatement of our financial statements or fraud. Any failure to maintain an effective system of internal control over financial reporting could limit our ability to report our financial results accurately and timely or to detect and prevent fraud. The identification of a material weakness could indicate a lack of controls adequate to generate accurate financial statements that, in turn, could cause a loss of investor confidence and decline in the market price of our common stock. We cannot assure you that we will be able to timely remediate any material weaknesses that may be identified in future periods or maintain all of the controls necessary for continued compliance.
We have identified a material weakness in our internal control over financial reporting. If this material weakness is not remediated, our failure to establish and maintain effective disclosure controls and procedures and internal control over financial reporting could result in material misstatements in our financial statements and a failure to meet our reporting and financial obligations, each of which could have a material adverse effect on our financial condition and the trading price of our common stock.
Management identified a material weakness in our internal control over financial reporting related to the available insurance coverage for liabilities associated with alleged exposure to asbestos-containing materials. A material weakness is a deficiency, or a combination of deficiencies, in internal control over financial reporting, such that there is a reasonable possibility that a material misstatement of a company’s annual or interim financial statements will not be prevented or detected on a timely basis.
As discussed in Item 9A. “Controls and Procedures” of this filing, management has evaluated its assessment of the effectiveness of internal control over financial reporting and our disclosure controls and procedures and concluded that they were not effective as of December 31, 2021.
We are subjectcommitted to work stoppages, union negotiations, labor disputesremediating the material weakness as promptly as possible, and other matters associated withmanagement is in the process of implementing the remediation plan; however, there can be no assurance as to when the material weaknesses will be remediated or that additional material weaknesses will not arise in the future. If we are unable to maintain effective internal control over financial reporting, our labor force, which mayability to record, process and report financial information timely and accurately could be adversely impact our operations and cause usaffected.
Risks Related to incur incremental costs.
At December 31, 2017, we had six domestic collective bargaining agreements covering approximately 1,000Ownership of our approximately 5,000 employees. Two of these collective bargaining agreements expire in 2018 and are scheduled for negotiation and renewal. We also have various collective labor arrangements covering certain non-U.S. employee groups. We are subject to potential union campaigns, work stoppages, union negotiations and other potential labor disputes. Further, we may be subject to work stoppages, which are beyond our control, at our suppliers or customers.Our Common Stock
Provisions in our corporate documents and Delaware law may delay or prevent a change in control of our company, and accordingly, we may not consummate a transaction that our stockholders consider favorable.
Provisions of our Certificate of Incorporation and By-laws may inhibit changes in control of our company not approved by our Board. These provisions include, for example: a staggered board of directors; a prohibition on stockholder action by written consent; a requirement that special stockholder meetings be called only by our Chairman, President or Board; advance notice requirements for stockholder proposals and nominations; limitations on stockholders’ ability to amend, alter or repeal the By-laws; enhanced voting requirements for certain business combinations involving substantial stockholders; the authority of our Board to issue, without stockholder approval, preferred stock with terms determined in its discretion; and limitations on stockholders’ ability to remove directors. In addition, we are afforded the protections of Section 203 of the Delaware General Corporation Law, which could have similar effects. In general, Section 203 prohibits us from engaging in a “business combination” with an “interested stockholder” (each as defined in Section 203) for at least three years after the time the person became an interested stockholder unless certain conditions are met. These protective provisions could result in our not consummating a transaction that our stockholders consider favorable or discourage entities from attempting to acquire us, potentially at a significant premium to our then-existing stock price.
Increases in the number of shares of our outstanding common stock could adversely affect our common stock price or dilute our earnings per share.
Sales of a substantial number of shares of common stock into the public market, or the perception that these sales could occur, could have a material adverse effect on our stock price. As of December 31, 2017,2021, we had the ability to issue up to an additional 1.682additional 4.074 shares as restricted stock shares, restricted stock units, performance stock units, or stock options under our 20022019 Stock Compensation Plan, as amended in 2006, 2011, 2012, 2015, and 2017, and0.027 under our 2006 Non-Employee Directors’ Stock Incentive Plan. We also may issue a significant number of additional shares, inin connection with acquisitions, through a registration statement, or otherwise. Additional shares issued would have a dilutive effect on our earnings per share.
Risks Related to our Spin-Off of SPX FLOW
The Spin-Off of SPX FLOW could result in substantial tax liability to us and our stockholders.
In connection with the Spin-Off of SPX FLOW we received opinions of tax counsel satisfactory to us as to the tax-free treatment of the Spin-Off and certain related transactions. However, if the factual assumptions or representations upon which the opinions are based are inaccurate or incomplete in any material respect, we will not be able to rely on the opinions. Furthermore, the opinions are not binding on the Internal Revenue Service (“IRS”) or the courts. Accordingly, the IRS may challenge the conclusions set forth in the opinions and any such challenge could prevail. If, notwithstanding the opinions, the Spin-Off or a related transaction is determined to be taxable, we could be subject to a substantial tax liability. In addition, if the Spin-Off is determined to be taxable, each holder of our common stock who received shares of SPX FLOW would generally be treated as having received a taxable distribution of property in an amount equal to the fair market value of the shares received.
The Spin-Off may expose us to potential liabilities arising out of state and federal fraudulent conveyance laws and legal dividend requirements.
The Spin-Off is subject to review under various state and federal fraudulent conveyance laws. Fraudulent conveyance laws generally provide that an entity engages in a constructive fraudulent conveyance when (1) the entity transfers assets and does not receive fair consideration or reasonably equivalent value in return, and (2) the entity (a) is insolvent at the time of the transfer or is rendered insolvent by the transfer, (b) has unreasonably small capital with which to carry on its business, or (c) intends to incur or believes it will incur debts beyond its ability to repay its debts as they mature. An unpaid creditor or an entity acting on behalf of a creditor (including, without limitation, a trustee or debtor-in-possession in a bankruptcy by us or SPX FLOW or any of our respective subsidiaries) may bring a lawsuit alleging that the Spin-Off or any of the related transactions constituted a constructive fraudulent conveyance. If a court accepts these allegations, it could impose a number of remedies, including, without limitation, voiding the distribution and returning SPX FLOW’s assets or SPX FLOW’s shares and subject us to liability.
The measure of insolvency for purposes of the fraudulent conveyance laws will vary depending on which jurisdiction’s law is applied. Generally, an entity would be considered insolvent if (1) the present fair saleable value of its assets is less than the amount of its liabilities (including contingent liabilities); (2) the present fair saleable value of its assets is less than its probable liabilities on its debts as such debts become absolute and matured; (3) it cannot pay its debts and other liabilities (including contingent liabilities and other commitments) as they mature; or (4) it has unreasonably small capital for the business in which it is engaged. We cannot assure you what standard a court would apply to determine insolvency or that a court would determine that we, SPX FLOW or any of our respective subsidiaries were solvent at the time of or after giving effect to the Spin-Off.
The distribution of SPX FLOW common stock is also subject to review under state corporate distribution statutes. Under the General Corporation Law of the State of Delaware (the “DGCL”), a corporation may only pay dividends to its stockholders either (1) out of its surplus (net assets) or (2) if there is no such surplus, out of its net profits for the fiscal year in which the dividend is declared and/or the preceding fiscal year.
Although we believe that we and SPX FLOW were each solvent at the time of the Spin-Off (including immediately after the distribution of shares of SPX FLOW common stock), that we are able to repay our debts as they mature and have sufficient capital to carry on our businesses, and that the distribution was made entirely out of surplus in accordance with Section 170 of the DGCL, we cannot assure you that a court would reach the same conclusions in determining whether SPX FLOW or we were insolvent at the time of, or after giving effect to, the Spin-Off, or whether lawful funds were available for the separation and the distribution to our stockholders.
ITEM 1B. Unresolved Staff Comments
None.
ITEM 2. Properties
The following is a summary of our principal properties related to continuing operations as of December 31, 2017:2021:
| | | | | | No. of | | Approximate Square Footage | | | | No. of | | Approximate
Square Footage |
| | Location | | Facilities | | Owned | | Leased | | Location | | Facilities | | Owned | | Leased |
| | | | | | (in millions) | | | | | | (in millions) |
| HVAC reportable segment | 7 U.S. states and 2 foreign countries | | 9 |
| | 0.6 | | 1.2 | HVAC reportable segment | 9 U.S. states and 2 foreign countries | | 16 | | | 1.7 | | | 1.5 | |
| Detection and Measurement reportable segment | 4 U.S. states and 1 foreign country | | 5 |
| | 0.2 | | 0.2 | Detection and Measurement reportable segment | 8 U.S. states and 4 foreign countries | | 18 | | | 0.4 | | | 0.3 | |
| Engineered Solutions reportable segment | 8 U.S. states and 1 foreign country | | 13 |
| | 2.4 | | 0.2 | |
| Corporate | | Corporate | 1 U.S. state | | 1 | | | — | | | 0.1 | |
| Total | | | 27 |
| | 3.2 | | 1.6 | Total | | | 35 | | | 2.1 | | | 1.9 | |
In addition to manufacturing plants, we own and lease various sales, service and other locations throughout the world. We consider these properties, as well as the related machinery and equipment, to be well maintained and suitable and adequate for their intended purposes.
ITEM 3. Legal Proceedings
We are also subject to legal proceedings and claims that arise in the normal course of business. We believe these matters are either without merit or of a kind that should not have a material effect individually or in the aggregate on our financial position, results of operations or cash flows; however, we cannot assure you that these proceedings or claims will not have a material effect on our financial position, results of operations or cash flows.
See “Risk Factors,” “MD&A — Critical Accounting Policies and Estimates — Contingent Liabilities,” and Note 13 to our consolidated financial statements for further discussion of legal proceedings.
ITEM 4. Mine Safety Disclosures
Not applicable.
P A R T I I
ITEM 5. Market For Registrant’s Common Equity, Related Stockholder Matters and Issuer Purchases of Equity Securities
Our common stock is traded on the New York Stock Exchange under the symbol “SPXC.”
Set forth below are the high and low sales prices for our common stock as reported on the New York Stock Exchange composite transaction reporting system for each quarterly period during the years 2017 and 2016, together with dividend information. We discontinued dividend payments in September 2015 in connection with the Spin-off and, thus, there werehave been no dividends declared since such time.
On May 11, 2021, our Board of Directors authorized management to repurchase our capital stock over a period expiring at the earlier of May 10, 2022 or such earlier time determined by our Board of Directors in 2016its sole discretion. Under the authorization, we may repurchase shares through open market purchases, privately negotiated transactions or 2017.otherwise, and at prices and times and in amounts as we determine, subject to applicable restrictions under our senior credit agreement. Our senior credit agreement permits an unlimited amount of share repurchases if our consolidated leverage ratio (as calculated under the senior credit agreement) is less than 2.75 to 1.00. Otherwise, the senior credit agreement restricts our repurchase of shares if the amount of repurchases in any fiscal year exceeds $100.0 million plus a basket amount based on our cumulative consolidated net income from a specified date.
|
| | | | | | | | | | | |
| | High | | Low | | Dividends Declared Per Share |
| 2017: | |
| | |
| | |
|
4th Quarter | $ | 32.71 |
| | $ | 28.09 |
| | $ | — |
|
3rd Quarter | 29.55 |
| | 23.41 |
| | — |
|
2nd Quarter | 28.93 |
| | 21.97 |
| | — |
|
1st Quarter | 28.13 |
| | 22.56 |
| | — |
|
|
| | | | | | | | | | | |
| | High | | Low | | Dividends Declared Per Share |
| 2016: | |
| | |
| | |
|
4th Quarter | $ | 25.95 |
| | $ | 15.49 |
| | $ | — |
|
3rd Quarter | 20.55 |
| | 14.05 |
| | — |
|
2nd Quarter | 17.33 |
| | 14.00 |
| | — |
|
1st Quarter | 15.52 |
| | 7.62 |
| | — |
|
ThereWe have not repurchased any shares under this authorization, and there were no repurchases of common stock during the three months ended December 31, 2017.2021. The number of shareholdersstockholders of record of our common stock as of February 16, 201818, 2022 was 3,135.2,355.
Company Performance
This graph shows a five-year comparison of cumulative total returns for SPX, the S&P 500 Index, the S&P 1500 Industrials Index, and the S&P 600 Index. The graph assumes an initial investment of $100 on December 31, 20122016 and the reinvestment of dividends.
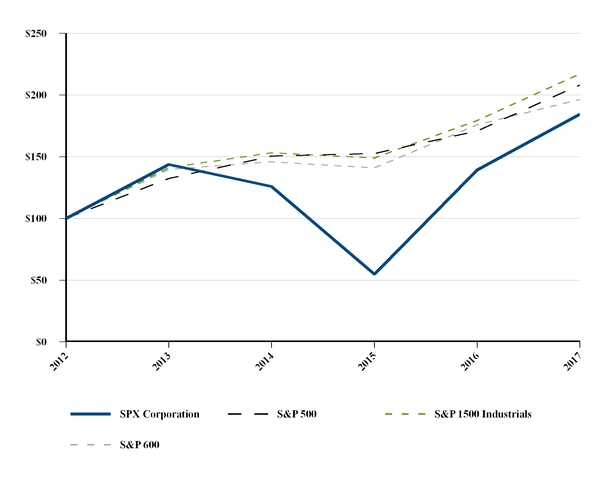
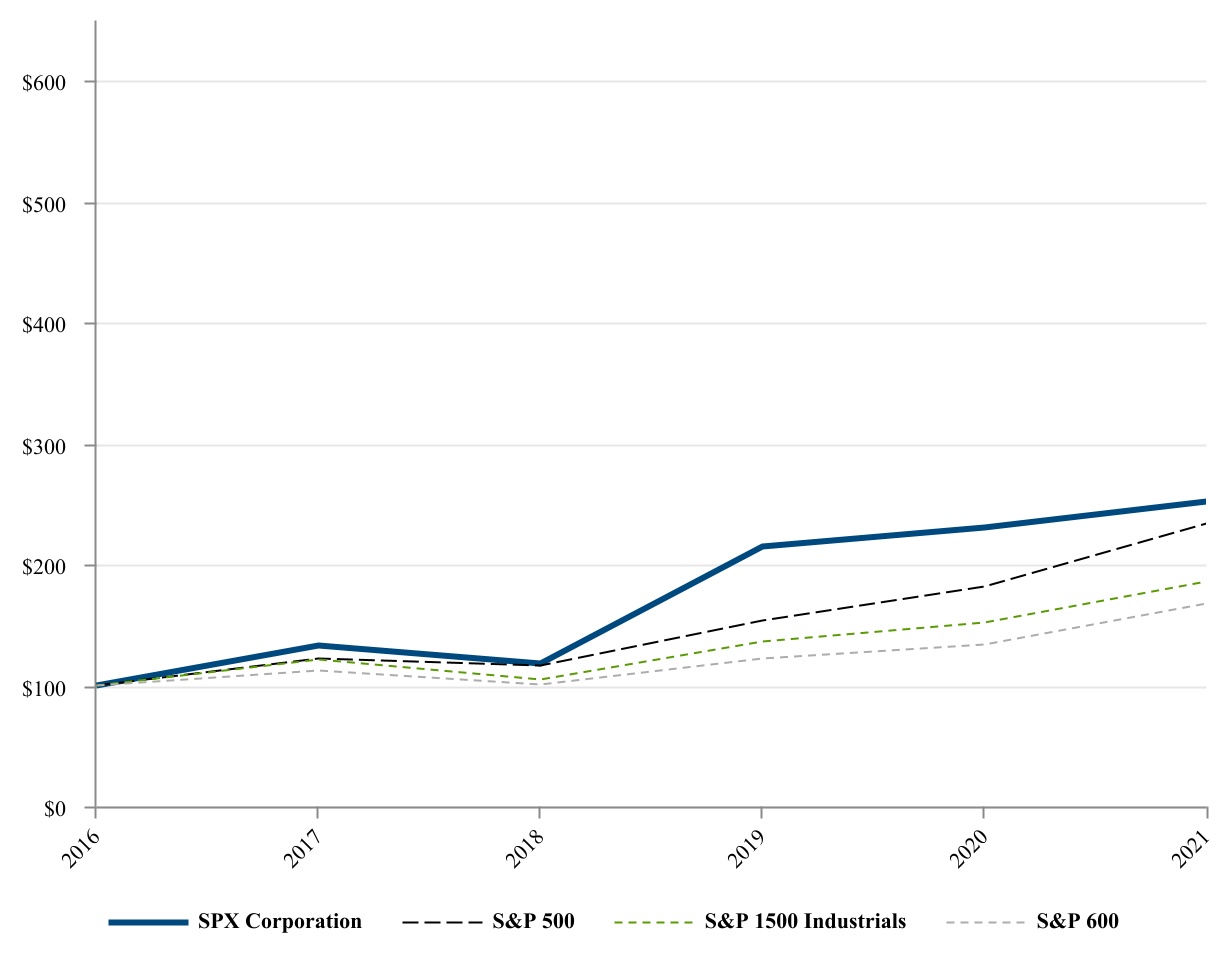
| | | | | | | | | | | | | | | | | | | | |
| 2016 | 2017 | 2018 | 2019 | 2020 | 2021 |
| SPX Corporation | $ | 100.00 | | $ | 132.34 | | $ | 118.09 | | $ | 214.50 | | $ | 229.93 | | $ | 251.60 | |
| S&P 500 | 100.00 | | 121.83 | | 116.49 | | 153.17 | | 181.35 | | 233.41 | |
| S&P 1500 Industrials | 100.00 | | 121.06 | | 104.87 | | 136.12 | | 152.03 | | 185.75 | |
| S&P 600 | 100.00 | | 111.73 | | 100.83 | | 121.86 | | 133.53 | | 167.28 | |
|
| | | | | | | | | | | | | | | | | | |
| | 2012 | 2013 | 2014 | 2015 | 2016 | 2017 |
| SPX Corporation | $ | 100.00 |
| $ | 143.71 |
| $ | 125.87 |
| $ | 54.80 |
| $ | 139.32 |
| $ | 184.37 |
|
| S&P 500 | 100.00 |
| 132.39 |
| 150.51 |
| 152.59 |
| 170.84 |
| 208.14 |
|
| S&P 1500 Industrials | 100.00 |
| 141.19 |
| 153.15 |
| 149.00 |
| 179.40 |
| 217.19 |
|
| S&P 600 | 100.00 |
| 139.65 |
| 145.85 |
| 140.95 |
| 175.83 |
| 196.46 |
|
ITEM 6. Selected Financial Data[Reserved]
|
| | | | | | | | | | | | | | | | | | | |
| | As of and for the year ended December 31, |
| | 2017 | | 2016 | | 2015 | | 2014 | | 2013 |
| | (in millions, except per share amounts) |
| Summary of Operations | |
| | |
| | |
| | |
| | |
|
Revenues (1) | $ | 1,425.8 |
| | $ | 1,472.3 |
| | $ | 1,559.0 |
| | $ | 1,694.4 |
| | $ | 1,715.1 |
|
Operating income (loss) (1)(2)(3)(4)(5)(13) | 54.8 |
| | 55.0 |
| | (122.2 | ) | | (185.3 | ) | | 32.9 |
|
Other income (expense), net (6)(7)(8) | (2.0 | ) | | (0.3 | ) | | (10.0 | ) | | 490.0 |
| | 38.4 |
|
| Interest expense, net | (15.8 | ) | | (14.0 | ) | | (20.7 | ) | | (20.1 | ) | | (62.7 | ) |
Loss on amendment/refinancing of senior credit agreement/ early extinguishment of debt (8) | (0.9 | ) | | (1.3 | ) | | (1.4 | ) | | (32.5 | ) | | — |
|
| Income (loss) from continuing operations before income taxes | 36.1 |
| | 39.4 |
| | (154.3 | ) | | 252.1 |
| | 8.6 |
|
Income tax (provision) benefit (9) | 47.9 |
| | (9.1 | ) | | 2.7 |
| | (137.5 | ) | | 13.2 |
|
| Income (loss) from continuing operations | 84.0 |
| | 30.3 |
| | (151.6 | ) | | 114.6 |
| | 21.8 |
|
Income (loss) from discontinued operations, net of tax (10) | 5.3 |
| | (97.9 | ) | | 34.6 |
| | 269.3 |
| | 190.5 |
|
| Net income (loss) | 89.3 |
| | (67.6 | ) | | (117.0 | ) | | 383.9 |
| | 212.3 |
|
| Less: Net income (loss) attributable to noncontrolling interests | — |
| | (0.4 | ) | | (34.3 | ) | | (9.5 | ) | | 2.4 |
|
| Net income (loss) attributable to SPX Corporation common shareholders | 89.3 |
| | (67.2 | ) | | (82.7 | ) | | 393.4 |
| | 209.9 |
|
Adjustment related to redeemable noncontrolling interests (11) | — |
| | (18.1 | ) | | — |
| | — |
| | — |
|
| Net income (loss) attributable to SPX Corporation common shareholders after adjustment related to redeemable noncontrolling interests | $ | 89.3 |
| | $ | (85.3 | ) | | $ | (82.7 | ) | | $ | 393.4 |
| | $ | 209.9 |
|
| Basic income (loss) per share of common stock: | |
| | |
| | |
| | |
| | |
|
| Income (loss) from continuing operations | $ | 1.98 |
| | $ | 0.30 |
| | $ | (2.90 | ) | | $ | 2.98 |
| | $ | 0.46 |
|
| Income (loss) from discontinued operations | 0.13 |
| | (2.35 | ) | | 0.87 |
| | 6.30 |
| | 4.16 |
|
| Net income (loss) per share | $ | 2.11 |
| | $ | (2.05 | ) | | $ | (2.03 | ) | | $ | 9.28 |
| | $ | 4.62 |
|
| Diluted income (loss) per share of common stock: | |
| | |
| | |
| | |
| | |
|
| Income (loss) from continuing operations | $ | 1.91 |
| | $ | 0.30 |
| | $ | (2.90 | ) | | $ | 2.94 |
| | $ | 0.46 |
|
| Income (loss) from discontinued operations | 0.12 |
| | (2.32 | ) | | 0.87 |
| | 6.20 |
| | 4.10 |
|
| Net income (loss) per share | $ | 2.03 |
| | $ | (2.02 | ) | | $ | (2.03 | ) | | $ | 9.14 |
| | $ | 4.56 |
|
Dividends declared per share (12) | $ | — |
| | $ | — |
| | $ | 0.75 |
| | $ | 1.50 |
| | $ | 1.00 |
|
| Other financial data: | |
| | |
| | |
| | |
| | |
|
| Total assets | $ | 2,040.4 |
| | $ | 1,912.5 |
| | $ | 2,179.3 |
| | $ | 5,894.3 |
| | $ | 6,851.7 |
|
| Total debt | 356.8 |
| | 356.2 |
| | 371.8 |
| | 733.1 |
| | 1,057.6 |
|
| Other long-term obligations | 915.4 |
| | 921.1 |
| | 851.6 |
| | 861.8 |
| | 930.8 |
|
| SPX shareholders’ equity | 314.7 |
| | 191.6 |
| | 345.4 |
| | 1,808.7 |
| | 2,153.3 |
|
| Noncontrolling interests | — |
| | — |
| | (37.1 | ) | | 3.2 |
| | 14.0 |
|
| Capital expenditures | 11.0 |
| | 11.7 |
| | 16.0 |
| | 19.3 |
| | 31.4 |
|
| Depreciation and amortization | 25.2 |
| | 26.5 |
| | 37.0 |
| | 40.6 |
| | 42.7 |
|
| |
| During 2017, 2015 and 2014 we made revisions to expected revenues and costs on our large power projects in South Africa. These revisions resulted in a reduction of revenue and operating income of $36.9 and $52.8, respectively, in 2017, $57.2 and $95.0, respectively, in 2015, and a reduction of revenue and operating profit of $25.0 in 2014. See Notes 5 and 13 to our consolidated financial statements for additional details. |
| |
(2)
| During 2017, we settled a contract that had been suspended and then ultimately cancelled by a customer for cash proceeds of $9.0 and other consideration. In connection with the settlement, we recorded a gain of $10.2 within our Engineered Solutions reportable segment |
| |
(3)
| During 2017, 2016, 2015, 2014 and 2013, we recognized income (expense) related to changes in the fair value of plan assets, actuarial gains (losses), settlement gains (losses) and curtailment gains (losses) of $(1.6), $(12.0), $(15.9), $(95.0), and $3.5, respectively, associated with our pension and postretirement benefit plans. |
| |
(4)
| During 2016, we recorded impairment charges of $30.1 related to the intangible assets of our SPX Heat Transfer (“Heat Transfer”) business. |
During 2014, we recorded an impairment charge of $10.9 related to the trademarks of our Heat Transfer business. In addition, during the fourth quarter of 2014, we recorded an impairment charge of $18.0 related to our former dry cooling business’s investment in a joint venture with Shanghai Electric Group Co., Ltd.
See Note 8 to our consolidated financial statements for further discussion of impairment charges associated with intangible assets.
| |
(5)
| During 2016, we sold our dry cooling business, resulting in a pre-tax gain of $18.4. |
| |
(6)
| On January 7, 2014, we completed the sale of our 44.5% interest in EGS to Emerson Electric Co. for cash proceeds of $574.1, which resulted in a pre-tax gain of $491.2. Accordingly, we recognized no equity earnings from this joint venture after 2013. Our equity earnings from this investment totaled $41.9 in 2013. |
| |
(7)
| During 2017, 2016, 2015, 2014 and 2013, we recognized gains (losses) of $(3.3), $(2.4), $(8.6), $(2.6), and $1.6, respectively, associated with foreign currency transactions, foreign currency forward contracts, and currency forward embedded derivatives. |
During 2017, 2016, 2015, 2014 and 2013, we recorded charges of $3.5, $4.2, $8.0, $3.1, and $0.0 respectively, associated with asbestos product liability matters.
| |
(8)
| During the fourth quarter of 2017, we amended our senior credit agreement. In connection with the amendment, we recorded a charge of $0.9 during 2017 to “Loss on amendment/refinancing of senior credit agreement,” which consisted of the write-off of a portion of the unamortized deferred financing costs related to our senior credit facilities. In addition, we discontinued hedge accounting for the interest rate swap agreements that were entered into to hedge the interest rate risk on our then existing variable rate term loan, which resulted in a gain during 2017 of $2.7 that was recorded to “Other expense, net.” |
During the third quarter of 2016, we elected to reduce our foreign credit instrument facilities. In connection with the reduction, we recorded a charge of $1.3 to “Loss on amendment/refinancing of senior credit agreement” during 2016 associated with the write-off of the unamortized deferred financing costs related to this previously available issuance capacity.
During the third quarter of 2015, we refinanced our senior credit facility in preparation of the Spin-Off. As a result of the refinancing, we recorded a charge of $1.4 to “Loss on amendment/refinancing of senior credit agreement” during 2015, which consisted of the write-off of a portion of the unamortized deferred financing costs related to our prior credit agreement.
During the first quarter of 2014, we completed the redemption of all of our 7.625% senior notes due in December 2014 for a total redemption price of $530.6. As a result of the redemption, we recorded a charge of $32.5 associated with the loss on early extinguishment of debt, which related to premiums paid to redeem the senior notes of $30.6, the write-off of unamortized deferred financing costs of $1.0, and other costs associated with the extinguishment of the senior notes of $0.9.
| |
(9)
| During 2017, our income tax benefit was impacted most significantly by (i) a tax benefit of $77.6 related to a worthless stock deduction in the U.S. associated with our investment in a South African subsidiary and (ii) $4.9 of tax benefits related to various audit settlements, statute expirations, and other adjustments to liabilities for uncertain tax positions, partially offset by (iii) $11.8 of provisional tax charges associated with the impact of the Tax Cuts and Jobs Act and (iv) $68.2 of foreign losses generated during the year for which no foreign tax benefit was recognized as future realization of a foreign tax benefit is considered unlikely. |
During 2016, our income tax provision was impacted by $0.3 of income taxes that were provided in connection with the $18.4 gain that was recorded on the sale of the dry cooling business, $2.4 of tax benefits related to various audit settlements, statute expirations, and other adjustments to liabilities for uncertain tax positions, and $13.7 of foreign losses generated during the year for which no tax benefit was recognized, as future realization of such tax benefit is considered unlikely.
During 2015, our income tax provision was impacted by (i) the effects of approximately $139.0 of foreign losses generated during the year for which no tax benefit was recognized, as future realization of any such tax benefit is considered unlikely, (ii) $3.7 of foreign taxes incurred during the year related to the Spin-Off and the reorganization actions undertaken to facilitate the Spin-Off, and (iii) $3.4 of taxes related to various audit settlements, statute expirations, and other adjustments to liabilities for uncertain tax positions.
During 2014, our income tax provision was impacted by the U.S. income taxes provided in connection with the $491.2 gain on the sale of our interest in EGS, income tax charges of $33.8 related to net increases in valuation allowances recorded against certain foreign deferred income tax assets, and $11.4 of income tax charges related to the repatriation of certain earnings of our non-U.S. subsidiaries. In addition, our income tax provision was impacted unfavorably by a low effective tax rate on foreign losses. The impact of these items was partially offset by the following income tax benefits: (i) $16.2 of tax benefits related to various audit settlements, statute expirations and other adjustments to liabilities for uncertain tax positions, with the most notable being the closure of our U.S. tax examination for the years 2008 through 2011, and (ii) $6.4 of tax benefits related to a loss on an investment in a foreign subsidiary.
During 2013, our income tax benefit was favorably impacted by the following benefits: (i) $9.5 related to net reductions in valuation allowances recorded against certain foreign deferred income tax assets, (ii) $4.1 related to various audit settlements and statute expirations, and (iii) $4.1 associated with the Research and Experimentation Credit generated in 2012.
| |
(10)
| During 2017, we reduced the net loss associated with the sale of Balcke Dürr by $6.8. The reduction was comprised of an additional income tax benefit recorded for the sale of $9.4, partially offset by the impact of adjustments to liabilities retained in connection with the sale and certain other adjustments. |
During 2016, we completed the sale of Balcke Dürr, resulting in a net loss of $78.6.
During 2015, we completed the Spin-Off of SPX FLOW. The operating results of SPX FLOW are presented within discontinued operations for all periods presented.
During 2014, we sold our TPS, Precision Components, and Fenn businesses, resulting in an aggregate gain of $14.4.
See Note 4 to our consolidated financial statements for additional details regarding our discontinued operations.
| |
(11)
| In connection with our noncontrolling interest in our South African subsidiary, we have reflected an adjustment of $18.1 to “Net income (loss) attributable to SPX Corporation common shareholders” for the excess redemption amount of the put option in our calculations of basic and diluted earnings per share for the year ended December 31, 2016. See Note 13 to our consolidated financial statements for additional details regarding the put option and this adjustment. |
| |
(12)
| In connection with the Spin-Off, we discontinued dividend payments immediately following the dividend payment for the second quarter of 2015. |
| |
(13)
| During 2015, 2014, and 2013 there was a significant amount of general and administrative costs associated with corporate employees and other corporate support that transferred to SPX FLOW at the time of the Spin-Off and did not meet the requirements to be presented within discontinued operations. |
ITEM 7. Management’s Discussion and Analysis of Financial Condition
and Results of Operations
(All currency and share amounts are in millions)
The following should be read in conjunction with our consolidated financial statements and the related notes thereto. Unless otherwise indicated, amounts provided in Item 7 pertain to continuing operations only.
COVID-19 Pandemic, Supply Chain Disruptions and Labor Shortages, and the Related Impacts to Our Business
The COVID-19 pandemic had an adverse impact on our consolidated results of operations in the first half of 2020, with diminishing impacts during the second half of 2020 and during 2021. During the second half of 2021, certain of our businesses began to experience supply chain disruptions and labor shortages, which have negatively impacted their production of goods and, thus, resulted in lower absorption of manufacturing costs and, in some cases, delays in shipments to customers. We are taking actions to manage the potential impacts of these matters and we will continue to assess the actual and expected impacts and the need for further actions.
Change in Accounting Method
Historically, certain of our domestic businesses within our HVAC reportable segment accounted for their inventories under the last-in, last-out (“LIFO”) method. During the fourth quarter of 2021, as a means of harmonizing our accounting method for inventories across all of our businesses, we converted the inventory accounting for these businesses to the first-in, first-out (“FIFO”) method. This change in accounting has been retrospectively applied to our consolidated financial statements. See Note 9 to our consolidated financial statements for further discussion of this change, including the impact of the change on our prior years’ consolidated financial statements.
Executive Overview
RevenueRevenues for 20172021 totaled $1,425.8,$1,219.5, compared to $1,472.3$1,128.1 in 20162020 (and $1,559.0$1,123.6 in 2015)2019). The increase in revenues during 2021, compared to 2020, was due primarily to (i) the impact of the ULC and Sensors & Software acquisitions in 2020 and the Sealite, ECS and Cincinnati Fan acquisitions in 2021 and (ii) an increase in organic revenue. The increase in organic revenue was due primarily to higher sales of heating and underground pipe and locator products, partially offset by lower sales of cooling products. During the first half of 2020, sales of heating and underground pipe and locator products were impacted negatively by the COVID-19 pandemic. Sales of cooling products declined in 2021, as several large cooling projects favorably impacted sales in 2020. The increase in revenues in 2020, compared to 2019, was due to the impact of the acquisitions of SGS and Patterson-Kelley during 2019 and ULC and Sensors & Software during 2020, partially offset by a decline in organic revenue in 2020. The decline in organic revenue during 2020 was due primarily to lower sales of heating products, domestic cooling products, and communication technologies products, partially offset by higher sales of cooling products in the international markets. A portion of the organic revenue decline in 2020 was attributable to a decline in customer demand and order delays caused by the COVID-19 pandemic.
For 2021, operating income totaled $73.7, compared to $96.9 in 2020 (and $114.0 in 2019). The decrease in revenueoperating income in 2017,2021, compared to 2016,2020, was due primarily to increases in asbestos product liability charges of $16.9 and corporate expense of $10.8. The increase in asbestos product liability charges was due primarily to a continuing unfavorable trend in the percentage of claims with payment (versus claims dismissed without payment), while the increase in corporate expense was due to a revenue declineadditional investments in continuous improvement and strategic initiatives and higher incentive compensation expense in 2021. The decrease in operating income in 2020, compared to 2019, was due primarily to declines in profitability associated with lower sales of heating products and higher-margin communication technologies products.
Operating cash flows from continuing operations totaled $131.2 in 2021, compared to $105.2 in 2020 (and $110.0 in 2019). The increase in operating cash flows from continuing operations in 2021, compared to 2020, was due primarily to (i) improved cash flows within our Engineered Solutions reportable segmentheating and underground pipe and locator businesses associated primarily with improved profitability, (ii) a decline in working capital at certain of our businesses, (iii) insurance proceeds of $15.0 associated with the settlement of an asbestos insurance coverage matter, and (iv) income tax refunds, net of tax payments, of $5.5 in 2021 (compared to income tax payments, net of refunds, of $7.6 in 2020). The decrease in organic revenue and an aggregate reductionoperating cash flows from continuing operations in revenue during 2017 of $36.9 resulting from revisions during the second and fourth quarters2020, compared to the expected revenues and costs2019, was due primarily to a decline in cash flows at certain of our large power projects in South Africa. These declines were partially offset by increased revenuesproject-related businesses during 2020, as cash receipts for these project-related businesses are often subject to contractual milestones that can impact the timing of cash flows from year-to-year.
Additional details on certain matters noted above as well as significant items impacting the financial results for 2021, 2020, and 2019 are as follows:
2021:
•On April 19, 2021, we completed the acquisition of Sealite.
◦The purchase price for Sealite was $80.3, net of cash acquired of $2.3.
◦The post-acquisition operating results of Sealite are reflected within our Detection and Measurement reportable segment and,segment.
•On August 2, 2021, we completed the acquisition of ECS.
◦The purchase price for ECS was $39.4, net of cash acquired of $5.1.
◦The seller is eligible for additional cash consideration of up to $16.8, upon achievement of certain financial performance milestones.
▪The estimated fair value of such contingent consideration was $8.2 as of the date of acquisition, which we reflected as a liability in our condensed consolidated balance sheet as of the end of the third quarter of 2021.
▪During the fourth quarter of 2021, we concluded that the probability of achieving the above financial performance milestones had lessened due to a lesser extent,delay in the execution of a large order, resulting in a reduction of the estimated fair value/liability of $6.7, with such amount recorded to "Other operating expenses, net" during the quarter.
◦The post-acquisition operating results of ECS are included within our Detection and Measurement reportable segment.
•On December 15, 2021, we completed the acquisition of Cincinnati Fan.
◦The purchase price for Cincinnati Fan was $145.2, net of cash acquired of $2.5.
◦The post-acquisition operating results of Cincinnati Fan are included within our HVAC reportable segment. Revenues
•On October 1, 2021, we completed the sale of Transformer Solutions.
◦Transformer Solutions is included in 2015 included $87.3discontinued operations for all periods presented.
◦We received net cash proceeds of revenue$620.6 and recorded a gain of $382.2 to “Gain (loss) on disposition of discontinued operations, net of tax.”
•Change in Segment Reporting Structure:
◦In connection with the disposition of Transformer Solutions and its classification as a discontinued operation, we have eliminated the Engineered Solutions reportable segment.
◦The remaining operations of the former Engineered Solutions reportable segment have been reflected within our HVAC reportable segment for all periods presented.
•DBT (our South Africa subsidiary):
◦Large Power Projects
▪On February 22, 2021 and April 28, 2021, DBT received favorable rulings from dispute adjudication panels.
•In connection with the rulings, DBT received South African Rand 126.6 ($8.6 at time of payment) and South African Rand 82.0 ($6.0 at the time of payment), respectively.
•As the rulings are subject to further arbitration, such amounts have not been reflected in our consolidated statement of operations.
•On July 5, 2021, DBT received notice from Mitsubishi Heavy Industries Power – ZAF (or “MHI”) of its intent to seek final and binding arbitration on the matter related to the dry cooling business, which was soldFebruary 22, 2021 dispute adjudication panel's ruling.
▪In May 2021, and in connection with certain claims made by MHI, MHI made a demand and received payment of South African Rand 178.7 (or $12.5 at the endtime of payment) on bonds issued by a bank.
•Under the terms of the firstbonds and our senior credit agreement, we were required to fund the payment.
•DBT denies liability for these claims and, thus, fully intends to seek, and believes it is legally entitled to, reimbursement of the South African Rand 178.7.
•As such, the amount has been reflected as a non-current asset in our consolidated balance sheet as of December 31, 2021.
▪On June 4, 2021, DBT received a revised version of the interim claim from MHI that was provided on February 26, 2019. DBT has numerous defenses and, thus, does not believe it has a probable liability associated with these claimed damages.
◦In the fourth quarter of 2016,2021, we completed the wind-down of DBT.
▪The wind-down was a culmination of a strategic shift away from the power generation markets.
▪As a result of completing the wind-down plan, we are now reporting DBT as a discontinued operation for all periods presented.
•Asbestos Product Liability Matters:
◦During 2021, we recorded charges of $51.2 related to asbestos product liability matters, with such charges related primarily to a continuing unfavorable trend in the percentage of claims with payment (versus dismissed without payment).
◦Of such charges, $48.6 were reflected in “Income from continuing operations before income taxes” and a reductionthe remainder in revenue“Gain (loss) on disposition of $57.2 resulting from a revision todiscontinued operations, net of tax.”
◦Insurance recoveries for asbestos product liability matters, net of payments, totaled $0.3 in 2021.
◦Insurance recoveries included $15.0 associated with the expected revenues and costs on our large power projects in South Africa. settlement of an insurance coverage matter.
◦See Note 1315 to our consolidated financial statements for additional detailsdetails.
•Actuarial Losses on Pension and Postretirement Plans:
◦We recorded net actuarial gains of $9.9 in the fourth quarter of 2021 in connection with the 2017annual remeasurement of our pension and 2015 revenue reductions related to our large power projectspostretirement plans, with such gains resulting primarily from increases in South Africa.discount rates.
Income for our reportable segments totaled $124.9 in 2017, compared to $142.8 in 2016 (and $38.8 in 2015). During 2017, income for our reportable segments was negatively impacted by an aggregate reduction in profit of $52.8 resulting from revisions during the second◦See Notes 1 and fourth quarters of 2017 to the expected revenues and costs on our large power projects in South Africa, partially offset by the impact of the revenue growth within our Detection and Measurement and HVAC reportable segments noted above and cost reductions within our Detection and Measurement and Engineered Solutions reportable segments. In 2015, income for our reportable segments was impacted by a reduction in profit of $95.0 resulting from a revision to the expected revenues and costs on our large power projects in South Africa. See Note 13 11 to our consolidated financial statements for additional details ondetails.
•Changes in the 2017 and 2015 profit reductionsEstimated Fair Value of an Equity Security:
◦Recorded gains of $11.8 within “Other income (expense), net” related to increases in the estimated fair value of an equity security that we hold.
◦See Note 17 to our large power projects in South Africa.consolidated financial statements for additional details.
Operating
•ULC Contingent Consideration, Indefinite-Lived Intangible Assets, and Goodwill:
◦The seller of ULC was eligible for additional cash consideration of up to $45.0, upon achievement of certain operating and financial performance milestones.
◦During the third quarter of 2021, we concluded that the operating and financial milestones associated with the ULC contingent consideration would not be achieved.
◦As a result, we reversed the related liability of $24.3, with the offset to “Other operating expenses, net.”
◦We also concluded that the lack of achievement of the above milestones, along with lower than anticipated future cash flows, from (used in) continuing operations totaled $54.2 in 2017, compared to $53.4 in 2016 [and $(76.0) in 2015]. Operating cash flows from (used in) continuing operations for 2017, 2016, and 2015 were negatively impacted by cash outflows for our large power projects in South Africaindicators of $56.5, $33.1, and $74.0, respectively, and income tax payments, net of refunds, of $22.9, $4.8, and $51.0, respectively. In addition, operating cash flows used in continuing operations in 2015 included a significant amount of disbursements for general corporate overhead costspotential impairment related to ULC’s indefinite-lived intangible assets and goodwill.
◦As such, we tested ULC’s infinite-lived intangible assets and goodwill for impairment during the third quarter of 2021.
◦Based on such testing, we determined that the carrying value of ULC’s net assets exceeded the implied fair value of the business.
◦As a corporate structure that supportedresult, we recorded an impairment charge of $24.3 to “Other operating expenses, net,” with $23.3 related to goodwill and the SPX business priorremainder to trademarks.
◦During the Spin-Off.fourth quarter of 2021, we performed our annual analysis of ULC’s indefinite-lived intangible assets and goodwill. As a result of such analysis, we recorded impairment charges of $5.2, with $0.3 related to trademarks and $4.9 to goodwill.
Other significant items impacting the financial results for 2017, 2016, and 2015 are as follows:
2017:
Income Tax Matters (see Notes◦See Note 1 and 10 to our consolidated financial statements for additional details)details.
| |
◦ | During the fourth quarter of 2017, we recorded an income tax benefit of $77.6 for a worthless stock deduction in the U.S. associated with our investment in a South African subsidiary. |
| |
◦ | On December 22, 2017, the Tax Cuts and Jobs Act (the “Act”) was enacted which significantly changes U.S. income tax law for businesses and individuals. As a result of the Act, we recorded provisional net income tax charges of $11.8 during the fourth quarter of 2017. |
Gain from a Contract Settlement -
•Sensors & Software Contingent Consideration:
◦The seller of Sensors & Software was eligible for additional cash consideration of up to $3.9, upon achievement of certain financial performance milestones.
◦During the thirdfourth quarter of 2017,2021, we settled a contractconcluded that certain of the financial milestones associated with the Sensors & Software contingent consideration had been suspendedachieved.
◦As a result, we recorded an additional charge of $0.6 to “Other operating expenses, net.”
◦The estimated fair value of such contingent consideration is $1.3 and then ultimately cancelled$0.7, which is reflected as a liability in our consolidated balance sheets at December 31, 2021 and 2020, respectively.
2020:
•In February 2020, and as a result of the December 2019 amendment that extended the maturity date of our senior credit facilities to December 17, 2024, we entered into additional interest rate swap agreements. These additional swaps:
◦Had an initial notional amount of $248.4;
◦Cover the period March 2021 to November 2024; and
◦Effectively convert borrowings under our senior credit facilities to a fixed rate of 1.061%, plus an applicable margin, during the period noted above.
•On September 2, 2020, we completed the acquisition of ULC.
◦The purchase price for ULC was $89.2, net of cash acquired of $4.0.
◦The post-acquisition operating results of ULC are reflected within our Detection and Measurement reportable segment.
•In September 2020, MHI made a demand and received payment of South African Rand 239.6 (or $14.3 at the time of payment) on certain bonds that were issued by a customer. bank in favor of MHI.
◦As required under the terms of the bonds and our senior credit agreement, we funded the South African Rand 239.6.
◦In its demand, MHI purported that DBT failed to carry out certain contractual obligations.
◦DBT denies liability and, thus, intends to seek, and believes it is fully entitled to, reimbursement of the South African Rand 239.6 that has been paid.
◦As such, we have reflected the South African Rand 239.6 (or $15.0 and $16.3 at December 31, 2021 and 2020, respectively) within non-current assets on our consolidated balance sheets as of December 31, 2021 and 2020.
◦See Note 15 to our consolidated financial statements for additional details.
•On November 11, 2020, we completed the acquisition of Sensors & Software.
◦The purchase price for Sensors & Software was $15.5, net of cash acquired of $0.3.
◦The post-acquisition operating results of Sensors & Software are reflected within our Detection and Measurement reportable segment.
•In the fourth quarter of 2020, we completed the wind-down of Heat Transfer.
◦The wind-down was initiated in 2018 after an unsuccessful attempt to sell the business.
◦The wind-down was part of a strategic shift away from the power generation markets.
◦As a result of completing the wind-down plan, we are reporting Heat Transfer as a discontinued operation for all periods presented.
•Asbestos Product Liability Matters:
◦During 2020, we recorded charges of $21.3 related to asbestos product liability matters.
◦Of such charges, $19.2 were reflected in “Income from continuing operations before income taxes” and the remainder in “Gain (loss) on disposition of discontinued operations, net of tax.”
◦Payments for asbestos product liability matters, net of insurance recoveries, totaled $19.3 in 2020.
•Actuarial Losses on Pension and Postretirement Plans:
◦We recorded net actuarial losses of $6.8 in the fourth quarter of 2020 in connection with the settlement,annual remeasurement of our pension and postretirement plans, with such losses resulting primarily from declines in discount rates on our unfunded pension and postretirement plans.
◦See Notes 1 and 11 to our consolidated financial statements for additional details.
•Changes in the Estimated Fair Value of an Equity Security:
◦During 2020, we:
| |
◦ | Received cash proceeds of $9.0 and other consideration; and |
| |
◦ | Recorded a gain of $10.2 within our Engineered Solutions reportable segment. |
Amendment▪Recorded gains of Senior Credit Agreement - $8.6 within “Other income (expense), net” related to increases in the estimated fair value of an equity security that we hold; and
▪Received distributions of $3.5, which are included in “Cash flows from operating activities.”
◦See Note 17 to our consolidated financial statements for additional details.
2019:
•On February 1, 2019, we completed the acquisition of Sabik.
◦The purchase price for Sabik was $77.2, net of cash acquired of $0.6.
◦The post-acquisition operating results of Sabik are reflected within our Detection and Measurement reportable segment.
•On July 3, 2019, we completed the acquisition of SGS.
◦The purchase price for SGS was $11.5, including contingent consideration of $1.5 that was paid during 2020.
◦The post-acquisition operating results of SGS are reflected within our HVAC reportable segment.
•On November 12, 2019, we completed the acquisition of Patterson-Kelley.
◦The purchase price for Patterson-Kelley was $59.9.
◦The post-acquisition operating results of Patterson-Kelley are reflected within our HVAC reportable segment.
•On December 19, 2017,17, 2019, we amended our senior credit agreement (see Noteagreement. In connection with the amendment, we recorded a charge of $0.6 associated with the write-off of a portion of deferred financing costs associated with the senior credit agreement.
•Asbestos Product Liability Matters:
◦During 2019, we recorded charges of $10.1 related to asbestos product liability matters.
◦Of such charges, $6.3 were reflected in “Income from continuing operations before income taxes” and the remainder in “Gain (loss) on disposition of discontinued operations, net of tax.”
◦Payments for asbestos product liability matters, net of insurance recoveries, totaled $13.1 in 2019.
•Actuarial Losses on Pension and Postretirement Plans:
◦We recorded net actuarial losses of $10.0 in the fourth quarter of 2019 in connection with the annual remeasurement of our pension and postretirement plans, with such losses resulting primarily from declines in discount rates on our unfunded pension and postretirement plans.
◦See Notes 1 and 11 to our consolidated financial statements for additional details). In connection withdetails.
•Changes in the amendment,Estimated Fair Value of an Equity Security:
◦During 2019, we:
▪Recorded gains of $7.9 within “Other income (expense), net” related to increases in the estimated fair value of an equity security that we recorded:
| |
◦ | A charge of $0.9 associated with the write-off of a portion of the deferred financing costs associated with the senior credit agreement; and |
| |
◦ | A gain of $2.7 related to the discontinuance of hedge accounting for the interest rate swap agreements that were entered into to hedge the interest rate risk on our then existing term loan. |
hold; and
▪Received distributions of $2.6, which are included in “Cash flows from operating activities.”
Actuarial Gains and Losses on Pension and Postretirement Plans (see Notes 1 and 9◦See Note 17 to our consolidated financial statements for additional details) - We recorded:
| |
◦ | An actuarial gain during the third quarter of 2017 of $2.6 related to an amendment to our postretirement plans; and |
| |
◦ | Net actuarial losses of $4.2 in the fourth quarter of 2017 in connection with the annual remeasurement of our pension and postretirement plans. |
2016:additions details.
Sale of Dry Cooling Business - On March 30, 2016, we completed the sale of the dry cooling business (see Notes 1 and 4 to our consolidated financial statements for additional details). In connection with the sale, we:
| |
◦ | Received cash proceeds of $47.6; and |
| |
◦ | Recorded a gain of $18.4, which includes a reclassification from “Accumulated other comprehensive income” of $40.4 related to foreign currency translation. |
Sale of Balcke Dürr - On December 30, 2016, we completed the sale of Balcke Dürr (see Notes 1, 4, and 15 to our consolidated financial statements for additional details).
| |
◦ | The results of Balcke Dürr are presented as a discontinued operation. |
| |
◦ | In connection with the sale, we: |
| |
▪ | Received cash proceeds of less than $0.1; |
| |
▪ | Left $21.1 of cash in the business at the time of the sale and provided the buyer a non-interest bearing loan of $9.1, payable in installments at the end of 2018 and 2019; and |
| |
▪ | Recorded a net loss of $78.6 to “Gain (loss) on disposition of discontinued operations, net of tax” within our consolidated statement of operations for 2016. |
Intangible Asset Impairment Charges - We recorded impairment charges of $30.1 related to the intangible assets of our Heat Transfer business, which included $23.9 for definite-lived intangible assets and $6.2 for indefinite-lived intangible assets (see Note 8 to our consolidated financial statements for additional details).
Actuarial Losses on Pension and Postretirement Plans (see Notes 1 and 9 to our consolidated financial statements for additional details) - During the year, we recorded net actuarial losses of $12.0.
2015:
Spin-Off of SPX FLOW - On September 26, 2015, we completed the Spin-Off of SPX FLOW (see Notes 1 and 4 to our consolidated financial statements for additional details).
| |
◦ | The results of SPX FLOW are presented as a discontinued operation. |
| |
◦ | Our 2015 results from continuing operations include a significant amount of general and administrative costs associated with corporate employees and other corporate support that transferred to SPX FLOW at the time of the Spin-Off. |
Actuarial Losses on Pension and Postretirement Plans (see Notes 1 and 9 to our consolidated financial statements for additional details) - During the year, we recorded net actuarial losses of $21.0 and a curtailment gain of $5.1.
Results of Continuing Operations
Cyclicality of End Markets, Seasonality and Competition—The financial results of our businesses closely follow changes in the industries in which they operate and end markets in which they serve. In addition, certain of our businesses have seasonal fluctuations. For example, our heating and ventilationproducts businesses tend to be stronger in the third and fourth quarters, as customer buying habits are driven largely by seasonal weather patterns. In aggregate, our businesses generally tend to be stronger in the second half of the year.
Although our businesses operate in highly competitive markets, our competitive position cannot be determined accurately in the aggregate or by segment since none of our competitors offer all the same product lines or serve all the same markets as we do. In addition, specific reliable comparative figures are not available for many of our competitors. In most product groups, competition comes from numerous concerns, both large and small. The principal methods of competition are service, product performance, technical innovation and price. These methods vary with the type of product sold. We believe we compete effectively on the basis of each of these factors.
Non-GAAP Measures — Organic revenue growth (decline) presented herein is defined as revenue growth (decline) excluding the effects of foreign currency fluctuations, acquisitions/divestitures,divestitures, and the impact of a reduction in revenue during 2021 associated with the revenue reduction that resulted from the second and fourth quarter 2017 and third quarter 2015 revisions to the expected revenues and profitssettlement of claims on our large power projects in South Africa of $13.5, $23.4 and $57.2, respectively.a legacy dry cooling project. We believe this metric is a useful financial measure for investors in evaluating our operating performance for the periods presented,presented, as, when read in conjunction with our revenues, it presents a useful tool to evaluate our ongoing operations and provides investors with a tool they can use to evaluate our management of assets held from period to period. In addition, organic revenue
growth (decline) is one of the factors we use in internal evaluations of the overall performance of our business. This metric, however, is not a measure of financial performance under accounting principles generally accepted in the United States (“GAAP”),GAAP, should not be considered a substitute for net revenue growth (decline) as determined in accordance with GAAP, and may not be comparable to similarly titled measures reported by other companies.
The following table provides selected financial information for the years ended December 31, 2017, 2016,2021, 2020, and2015, 2019, including the reconciliation of organic revenue declineincrease (decline) to net revenue decline:increase:
| | | | Year ended December 31, | | 2017 vs | | 2016 vs | | Year ended December 31, | | 2021 vs | | 2020 vs |
| | 2017 | | 2016 | | 2015 | | 2016% | | 2015% | | 2021 | | 2020 | | 2019 | | 2020 % | | 2019 % |
| Revenues | $ | 1,425.8 |
| | $ | 1,472.3 |
| | $ | 1,559.0 |
| | (3.2 | )% | | (5.6 | )% | Revenues | $ | 1,219.5 | | | $ | 1,128.1 | | | $ | 1,123.6 | | | 8.1 | % | | 0.4 | % |
| Gross profit | 330.2 |
| | 375.8 |
| | 275.9 |
| | (12.1 | ) | | 36.2 |
| Gross profit | 431.8 | | | 395.5 | | | 402.0 | | | 9.2 | | | (1.6) | |
| % of revenues | 23.2 | % | | 25.5 | % | | 17.7 | % | | |
| | |
| % of revenues | 35.4 | % | | 35.1 | % | | 35.8 | % | | | | |
| Selling, general and administrative expense | 282.3 |
| | 301.0 |
| | 387.8 |
| | (6.2 | ) | | (22.4 | ) | Selling, general and administrative expense | 309.6 | | | 272.5 | | | 275.8 | | | 13.6 | | | (1.2) | |
| % of revenues | 19.8 | % | | 20.4 | % | | 24.9 | % | | |
| | |
| % of revenues | 25.4 | % | | 24.2 | % | | 24.5 | % | | | | |
| Intangible amortization | 0.6 |
| | 2.8 |
| | 5.2 |
| | (78.6 | ) | | (46.2 | ) | Intangible amortization | 21.6 | | | 14.0 | | | 8.9 | | | 54.3 | | | 57.3 | |
| Impairment of intangible assets | — |
| | 30.1 |
| | — |
| | * |
| | * |
| |
| Impairment of goodwill and intangible assets | | Impairment of goodwill and intangible assets | 5.7 | | | 0.7 | | | — | | | * | | * |
| Special charges, net | 2.7 |
| | 5.3 |
| | 5.1 |
| | (49.1 | ) | | 3.9 |
| Special charges, net | 1.0 | | | 2.4 | | | 1.5 | | | (58.3) | | | 60.0 | |
| Gain on contract settlement | 10.2 |
| | — |
| | — |
| | * |
| | * |
| |
| Gain on sale of dry cooling business | — |
| | 18.4 |
| | — |
| | * |
| | * |
| |
| Other expense, net | (2.0 | ) | | (0.3 | ) | | (10.0 | ) | | * |
| | * |
| |
| Other operating expenses, net | | Other operating expenses, net | 20.2 | | | 9.0 | | | 1.8 | | | * | | * |
| Other income (expense), net | | Other income (expense), net | 9.0 | | | (0.1) | | | (5.2) | | | * | | * |
| Interest expense, net | (15.8 | ) | | (14.0 | ) | | (20.7 | ) | | 12.9 |
| | (32.4 | ) | Interest expense, net | (12.8) | | | (18.2) | | | (19.4) | | | (29.7) | | | (6.2) | |
| Loss on amendment/refinancing of senior credit agreement | (0.9 | ) | | (1.3 | ) | | (1.4 | ) | | (30.8 | ) | | (7.1 | ) | Loss on amendment/refinancing of senior credit agreement | — | | | — | | | (0.6) | | | * | | * |
| Income (loss) from continuing operations before income taxes | 36.1 |
| | 39.4 |
| | (154.3 | ) | | * |
| | * |
| |
| Income tax (provision) benefit | 47.9 |
| | (9.1 | ) | | 2.7 |
| | * |
| | * |
| |
| Income (loss) from continuing operations | 84.0 |
| | 30.3 |
| | (151.6 | ) | | * |
| | * |
| |
| Components of consolidated revenue decline: | |
| | |
| | |
| | |
| | |
| |
| | Income from continuing operations before income taxes | | Income from continuing operations before income taxes | 69.9 | | | 78.6 | | | 88.8 | | | (11.1) | | | (11.5) | |
| Income tax provision | | Income tax provision | (10.9) | | | (4.8) | | | (12.5) | | | * | | * |
| Income from continuing operations | | Income from continuing operations | 59.0 | | | 73.8 | | | 76.3 | | | (20.1) | | | (3.3) | |
| Components of consolidated revenue increase: | | Components of consolidated revenue increase: | | | | | | | | | |
| Organic | |
| | |
| | |
| | (0.8 | ) | | (3.3 | ) | Organic | | | | | | | 2.6 | | | (4.7) | |
| Foreign currency | |
| | |
| | |
| | 0.6 |
| | (1.9 | ) | Foreign currency | | | | | | | 0.7 | | | — | |
| Sale of dry cooling business | | | | | | | (0.5 | ) | | (4.1 | ) | |
| South Africa revenue revision | |
| | |
| | |
| | (2.5 | ) | | 3.7 |
| |
| Net revenue decline | |
| | |
| | |
| | (3.2 | ) | | (5.6 | ) | |
| Settlement of legacy dry cooling contract | | Settlement of legacy dry cooling contract | | | | | | | (0.4) | | | — | |
| Acquisitions | | Acquisitions | | 5.2 | | | 5.1 | |
| Net revenue increase | | Net revenue increase | | | | | | | 8.1 | | | 0.4 | |
| |
* | Not meaningful for comparison purposes. |
* Not meaningful for comparison purposes.
Revenues — - For 2017,2021, the decreaseincrease in revenues, compared to 2016,2020, was due, in part,due primarily to a decline in organic revenue within our Engineered Solutions reportable segment, partially offset by increases in organic revenue within our Detection and Measurement reportable segment and, to a lesser extent, our HVAC reportable segment. In addition, revenues were negatively impacted by (i) an aggregate reduction in revenue of $36.9 resulting from revisions during the second and fourth quarters of 2017 to the expected revenues and costs on our large power projects in South Africa and (ii) the impact of the saleacquisitions of the dry cooling business at the endULC and Sensors & Software in 2020 and Sealite, ECS and Cincinnati Fan in 2021 and (ii) an increase in organic revenue. The increase in organic revenue was due primarily to higher sales of the first quarter of 2016. These declines in revenue wereheating and underground pipe and locator products, partially offset by lower sales of cooling products. During the impactfirst half of a weaker U.S. dollar during 2017. See “Results2020, sales of Reportable Segments” for additional details.heating and underground pipe and locator products were impacted negatively by the COVID-19 pandemic. Sales of cooling products declined in 2021, as there were several large cooling projects that favorably impacted sales in 2020.
For 2016,2020, the decreaseincrease in revenues, compared to 2015,2019, was due to the impact of the saleacquisitions of the dry cooling business at the end of the first quarter of 2016,SGS and Patterson-Kelley during 2019 and ULC and Sensors & Software during 2020, partially offset by a decline in organic revenue and, to a lesser extent, a stronger U.S. dollar in 2016. These decreases were offset partially by the impact of a reduction in revenues of $57.2 during the third quarter of 2015 resulting from a revision to the expected revenues and costs on our large power projects in South Africa.2020. The decline in organic revenue was due primarily to lower sales of processheating products, domestic cooling products, within our Engineered Solutions reportable segment.and communication technologies products, partially offset by higher sales of cooling products in the international markets. A portion of the organic revenue decline is attributable to a decline in customer demand and order delays caused by the COVID-19 pandemic. See “Results of Reportable Segments” for additional details.
Gross Profit —Profit - For 2017,2021, the increase in gross profit and gross profit as a percentage of revenues, compared to 2020, was due primarily to the revenue increases noted above.
For 2020, the decrease in gross profit and gross profit as a percentage of revenues, compared to 2016,2019, was due primarily to an aggregate reduction in gross profitlower sales of $52.8 resulting from revisions duringhigh-margin communication technologies products and heating products.
Selling, General and Administrative (“SG&A”) Expense — For 2021, the second
and fourth quarters of 2017 to the expected revenues and costs of our large power projects in South Africa, partially offset by the impact of the organic revenue growth in our Detection and Measurement reportable segment noted above.
The increase in gross profit and gross profit as a percentage of revenue in 2016,SG&A expense, compared to 2015,2020, was due primarily to a reduction in gross profit of $95.0 during the third quarter of 2015SG&A associated with Sealite, ECS and Cincinnati Fan since their dates of acquisition in 2021 and the impact of a revisionfull year’s SG&A associated with the 2020 acquisitions of ULC and Sensors and Software. Also, additional corporate expense in 2021 associated with (i) increased investments in continuous improvement and strategic initiatives and (ii) higher incentive compensation contributed to the expected revenues and costs of our large power projectsincrease in South Africa. In addition, during 2016, gross profit and gross profit as a percentage of revenues were impacted favorably by cost reductions and improved operating efficiency at the businesses within our HVAC reportable segment and our power transformer business.SG&A in 2021.
Selling, General and Administrative (“SG&A”) Expense —
For 2017,2020, the decrease in SG&A expense, compared to 2016,2019, was due primarily to (i) a decline in actuarial losses for our pension and postretirement plans (net losses of $1.6 in 2017, compared to net losses of $12.0 in 2016 - see Note 9 to our consolidated financial statements for further details), (ii) the impact of the sale of the dry cooling business at the end of the first quarter of 2016, and (iii) cost reductions within our Detection and Measurement and Engineered Solutions reportable segments over the past year.
For 2016, the decrease in SG&A expense, compared to 2015, was due primarily to declines in corporate expense of $61.7, pension and postretirement expense of $3.2, and long-termlower incentive compensation and lower travel expense of $20.2. See “Results of Reportable Segments” for additional details on corporateduring 2020, with the lower travel expense pension and postretirement expense, and long-term incentive compensation expense.
Intangible Amortization — For 2017, the decline in intangible amortization, compared to 2016, was primarily due to the impact of the $23.9 impairment charge recorded inCOVID-19 pandemic.
Intangible Amortization — For 2021, the fourth quarter of 2016 associated with our Heat Transfer business’s definite-lived intangible assets.
For 2016, the declineincrease in intangible amortization, compared to 2015,2020, was primarilydue to the resultamortization expense associated with Sealite, ECS and Cincinnati Fan since their dates of (i) discontinuing amortization on the long-term assets of our dry cooling businessacquisition in connection with classifying the business’s assets2021 and liabilities as “held for sale,” effective December 31, 2015, and (ii) the impact of a full year’s amortization expense on the $23.9 impairment charge recorded2020 acquisitions of ULC and Sensors and Software.
For 2020, the increase in intangible amortization, compared to 2019, was due primarily to the fourth quarter of 2016amortization expense associated with our Heat Transfer business’s definite-lived intangible assets.ULC since its date of acquisition in 2020 and the impact of a full year’s amortization expense on the 2019 acquisitions of Sabik, SGS, and Patterson-Kelley.
Impairment of Goodwill and Intangible Assets — During 2021, we recorded impairment charges of $5.2 related to the goodwill and trademarks of ULC and $0.5 related to certain other trademarks. During 2020, we recorded $0.7 of impairment charges related to certain trademarks. See Note 810 to our consolidated financial statements for additional details on the impairment charge recorded for the definite-lived intangible assets of our Heat Transfer business.details.
Impairment of Intangible Assets — During 2016, we recorded impairment charges of $30.1 related to the intangible assets of our Heat Transfer business, which included $23.9 for definite-lived intangible assets and $6.2 for indefinite-lived intangible assets.
See Note 8 to our consolidated financial statements for further discussion of impairment charges.
Special Charges, Net — Special charges, net, related primarily to restructuring initiatives to consolidate manufacturing, distribution, sales and administrative facilities, reduce workforce, and rationalize certain product lines. See Note 68 to our consolidated financial statements for the details of actions taken in 2017, 20162021, 2020, and 2015.2019. The components of special charges, net, are as follows:
| | | | | | | | | | | | | | | | | |
| | Year ended December 31, |
| | 2021 | | 2020 | | 2019 |
| Employee termination costs | $ | 1.0 | | | $ | 1.0 | | | $ | 0.5 | |
| Facility consolidation costs | — | | | — | | | 0.5 | |
| Other cash costs, net | — | | | 1.0 | | | — | |
| Non-cash asset write-downs | — | | | 0.4 | | | 0.5 | |
| Total | $ | 1.0 | | | $ | 2.4 | | | $ | 1.5 | |
|
| | | | | | | | | | | |
| | Year ended December 31, |
| | 2017 | | 2016 | | 2015 |
| Employee termination costs | $ | 2.5 |
| | $ | 1.7 |
| | $ | 4.5 |
|
| Facility consolidation costs | — |
| | — |
| | 0.2 |
|
| Other cash costs, net | 0.2 |
| | — |
| | 0.1 |
|
| Non-cash asset write-downs | — |
| | 3.6 |
| | 0.3 |
|
| Total | $ | 2.7 |
| | $ | 5.3 |
| | $ | 5.1 |
|
GainOther Operating Expenses, Net – During 2021, we recorded charges of $26.3 for asbestos product liability matters related to products that we no longer manufacture, along with a charge of $0.6 related to revisions to the contingent consideration liability associated with the Sensors and Software acquisition, partially offset by income of $6.7 associated with a reduction in the liability associated with the contingent consideration related to the ECS acquisition.The charges for the asbestos product liability matters were due to a change in assumptions for estimating the related liabilities primarily as a result of a continuing unfavorable trend in the percentage of claims with payment (versus claims dismissed without payment). The charge of $0.6 was the result of finalizing the contingent consideration amount that is due on Contract Settlement — the Sensors & Software acquisition. The income associated with the ECS contingent consideration was due to a change in fair value of the related liability resulting from a lower probability of the business achieving certain defined financial milestones.
During the third quarter2020, we recorded charges of 2017, we settled$9.4 for asbestos product liability matters, net of a contract that had been suspended and then ultimately cancelled by a customer for cash proceedsgain of $9.0 and other consideration. In$0.4 related to revisions to estimates of certain liabilities retained in connection with the settlement,2016 sale of the dry cooling business.The charges for the asbestos product liability matters were due to a change in assumptions for estimating the related liabilities as a result of recent claim trends.
For 2019, we recorded charges associated with revisions to estimates of certain liabilities retained in connection with the 2016 sale of the dry cooling business.
Other Income (Expense), Net – Other income, net, for 2021 was composed primarily of pension and post retirement income of $16.4, a gain of $10.2 during$11.8 related to changes in the quarter.estimated fair value of an equity security we hold, and income derived from company-owned life insurance policies of $3.2, partially offset by charges of $21.0 associated with asbestos product liability matters. The charges associated with asbestos product liability matters were the result of a change in assumptions for estimating the related liabilities due primarily to a continuing unfavorable trend in the percentage of claims with payment (versus claims dismissed without payment).
Gain on Sale of Dry Cooling Business — On March 30, 2016, we completed the sale of our dry cooling business resulting in a gain of $18.4. See Notes 1 and 4 to our consolidated financial statements for additional details.
Other Expense, Net — Other expense, net, for 2017 2020 was composed primarily of charges of $3.5$7.6 associated with asbestos product liability matters, pension and postretirement expense of $3.0, environmental remediation charges of $1.5, and foreign currency transaction losses of $2.9, and losses on currency forward embedded derivatives (“FX embedded derivatives”)
of $0.6, partially offset by a gain of $2.7 associated with$8.6 related to changes in the
discontinuance estimated fair value of hedge accounting on our interest rate swap agreements,an equity security we hold and income derived from company-owned life insurance policies of $1.7, and equity earnings in joint ventures of $0.7.$5.0.
Other expense, net, for 20162019 was composed primarily of pension and postretirement expense of $9.9, charges of $4.2$4.5 associated with asbestos product liability matters, losses on foreign currency forward contracts (“FX forward contracts”) of $5.1, and losses on FX embedded derivatives of $1.2. These amounts were offset partially by foreign currency transaction gainslosses of $3.9,$1.5, partially offset by a gain of $7.9 related to changes in the estimated fair value of an equity security that we hold and income derived from company-owned life insurance policies of $2.8, equity earnings in joint ventures of $1.5, income associated with transition services provided in connection with the sale of the dry cooling business of $0.9, and gains on asset sales of $0.9.$4.0.
Other expense, net, for 2015 was composed primarily of charges of $8.0 associated with asbestos product liability matters, foreign currency transaction losses of $7.4, and losses on FX forward contracts of $7.7, partially offset by gains of $6.5 on FX embedded derivatives, income from company-owned life insurance policies of $3.8, and equity earnings in joint ventures of $1.5.
Interest Expense, NetNet — Interest expense, net, includes both interest expense and interest income. The increasedecrease in interest expense, net, during 2017,2021, compared to 2016,2020, was primarily athe result of a higher weighted-averagelower average effective interest raterates and higherlower average debt balances during 2017, compared to 2016.2021.
The decrease in interest expense, net, during 2016,2020, compared to 2015,2019, was primarily the result of a decline inlower average interest expense due to lowerrates during 2020, partially offset by the impact of higher average debt balances during 2016.2020.
Loss on Amendment/Refinancing of Senior Credit Agreement — During the fourth quarter of 2017,2019, we amended our senior credit agreement. In connection with the amendment, we recorded a charge of $0.9 during 2017,$0.6, which consisted of the write-off of a portion of the unamortized deferred financing costs related to our senior credit facilities.
In the third quarter of 2016, we reduced the issuance capacity under our foreign credit facilities by $200.0. In connection with such reduction, we recorded a charge of $1.3 associated with the write-off of the unamortized deferred financing costs related to the $200.0 of previously available issuance capacity.
In the third quarter of 2015, we refinanced our senior credit facilities in connection with the Spin-Off. As a result of the refinancing, we recorded a charge of $1.4 during 2015, which consisted of the write-off of unamortized deferred financing costs related to our prior senior credit facilities.
Income Taxes — During 2017,2021, we recorded an income tax benefitprovision of $47.9$10.9 on $36.1$69.9 of pre-tax income from continuing operations, resulting in an effective tax rate of (132.7)%15.6%. The most significant items impacting the effective income tax benefitrate for 20172021 were (i) earnings in jurisdictions with lower statutory rates, (ii) $4.3 of income tax benefits related to various valuation allowance adjustments, primarily due to foreign tax credits for which the future realization is now considered likely, and (iii) a tax benefit of $77.6$3.5 related to a worthless stock deduction in the U.S.resolution of certain liabilities for uncertain tax positions and interest associated with our investmentvarious refund claims, partially offset by $13.2 of tax expense associated with global intangible low-taxed income created by the liquidation of various recently acquired entities.
During 2020, we recorded an income tax provision of $4.8 on $78.6 of pre-tax income from continuing operations, resulting in a South African subsidiary and $4.9an effective tax rate of 6.1%.The most significant items impacting the effective tax rate for 2020 were (i) earnings in jurisdictions with lower statutory tax rates, (ii) $4.2 of tax benefits related to various audit settlements, statute expirations, and other adjustments to liabilities for uncertain tax positions, partially offset by $11.8and (iii) $2.8 of netexcess tax charges associated with the impact of the new tax regulations in the U.S. previously discussed and foreign losses generatedbenefits resulting from stock-based compensation awards that vested and/or were exercised during the year of $68.2 for which no foreign tax benefit was recognized as future realization of a foreign tax benefit is considered unlikely.year.
During 2016,2019, we recorded an income tax provision of $9.1$12.5 on $39.4$88.8 of a pre-tax income from continuing operations, resulting in an effective tax rate of 23.1%14.1%. The most significant items impacting the effective tax rate for 20162019 were the $0.3(i) $1.6 of income taxes provided in connection with the $18.4 gainexcess tax benefits resulting from stock-based compensation awards that was recorded on the sale of the dry cooling business, $13.7 of foreign losses generatedvested and/or were exercised during the period for which noyear, (ii) $1.3 of tax benefit was recognized as future realization of any such foreignbenefits related to our U.S. tax benefit is considered unlikely,credits and $2.4incentives, and (iii) $1.2 of tax benefits related to various audit settlements, statute expirations, and other adjustments to liabilities for uncertain tax positions.
During 2015, we recorded an income tax benefit of $2.7 on $154.3 of a pre-tax loss from continuing operations, resulting in an effective tax rate of 1.7%. The most significant item impacting the effective tax rate for 2015 was the effects of approximately $139.0 of foreign losses generated during the year for which no tax benefit was recognized, as future realization of such foreign tax benefit is considered unlikely. In addition, we incurred foreign tax charges of $3.7 related to the Spin-Off and the reorganization actions undertaken to facilitate the Spin-Off and $3.4 of net charges related to various audit settlements, statute expirations, and other adjustments to liabilities for uncertain tax positions.
Results of Discontinued Operations
SaleWind-Down of the Heat Transfer Business
Following the Spin-Off, we initiated a strategic shift away from the power generation markets. As part of this strategic shift, we sold the dry cooling and Balcke Dürr businesses in 2016 and commenced efforts to sell the Heat Transfer business. After an unsuccessful attempt to sell the Heat Transfer business, we implemented a wind-down plan for the business in 2018. During the fourth quarter of 2020, we completed the wind-down plan, which included providing all products and services on the business’s remaining contracts with customers. As a result, we are reporting Heat Transfer as a discontinued operation for all periods presented.
Sale of Transformer Solutions Business
As indicated in NoteOn October 1, to our consolidated financial statements,2021, we completed the sale of Balcke Dürr on December 30, 2016 for cash proceeds of less than $0.1. In addition, we left $21.1 of cash in Balcke Dürr atTransformer Solutions pursuant to the timeterms of the saleStock Purchase Agreement dated June 8, 2021. We transferred all of the outstanding common stock of Transformer Solutions to the Purchaser for an aggregate cash purchase price of $645.0 (the “Transaction”). The purchase price is subject to potential adjustment based on Transformer Solutions’ cash, debt and providedworking capital on the buyer with a non-interest bearing loan of $9.1, payable in installments due atdate the end of 2018Transaction was consummated, as well as for specified transaction expenses and 2019.other specified items. In connection with the sale, we received net cash proceeds of $620.6 and recorded a net lossgain of $78.6$382.2 to “Gain (loss) on disposition of discontinued operations, net of tax” within our 2021 consolidated statement of operations for 2016.
The results of Balcke Dürr are presented as a discontinued operation. Major classes of line items constituting pre-tax loss and after-tax loss of Balcke Dürr foroperations. We have classified the years ended December 31, 2016 and 2015 are shown below:
|
| | | | | | | |
| | Year ended December 31, |
| | 2016 | | 2015 |
| Revenues | $ | 153.4 |
| | $ | 160.3 |
|
| Costs and expenses: | | | |
| Costs of products sold | 144.2 |
| | 143.8 |
|
| Selling, general and administrative | 31.4 |
| | 37.9 |
|
| Impairment of goodwill | — |
| | 13.7 |
|
| Special charges (credits), net | (1.3 | ) | | 12.7 |
|
| Other expense, net | (0.2 | ) | | (0.9 | ) |
| Loss before taxes | (21.1 | ) | | (48.7 | ) |
| Income tax benefit | 4.5 |
| | 9.1 |
|
| Loss from discontinued operations | $ | (16.6 | ) | | $ | (39.6 | ) |
The following table presents selected financial information for Balcke Dürr that is included within discontinued operations in the consolidated statements of cash flows for the years ended December 31, 2016 and 2015:
|
| | | | | | | |
| | Year ended December 31, |
| | 2016 | | 2015 |
| Non-cash items included in income (loss) from discontinued operations, net of tax | | | |
| Depreciation and amortization | $ | 2.0 |
|
| $ | 2.2 |
|
| Impairment of goodwill | — |
|
| 13.7 |
|
| Capital expenditures | 0.7 |
|
| 1.9 |
|
During 2017, we reduced the net loss associated with the sale of Balcke Dürr by $6.8. The reduction was comprised of an additional income tax benefit recorded for the sale of $9.4, partially offset by the impact of adjustments to liabilities retained in connection with the sale and certain other adjustments.
Spin-Off of SPX FLOW
As indicated in Note 1 to our consolidated financial statements, we completed the Spin-Off of SPX FLOW on September 26, 2015. The results of SPX FLOW are reflectedbusiness as a discontinued operation withinin our consolidated financial statements for all periods presented. Major classesSee Notes 1 and 4 to our consolidated financial statements for additional details.
Wind-Down of line items constituting pre-tax income and after-tax incomeDBT Business
As a culmination of SPX FLOWour strategic shift away from power generation markets, we completed the wind-down of our DBT business. As a result, we are now reporting DBT as a discontinued operation in our consolidated financial statements for all periods presented. In connection with the wind-down, we recorded a charge of $19.9 to “Gain (loss) on disposition of discontinued operations, net of taxes” within our consolidated statement of operations for the year ended December 31, 2015 (1) are shown below:
|
| | | |
| Revenues | $ | 1,775.1 |
|
| Costs and expenses: |
|
|
| Costs of products sold | 1,179.3 |
|
Selling, general and administrative (2) | 368.2 |
|
| Intangible amortization | 17.7 |
|
| Impairment of intangible assets | 15.0 |
|
| Special charges | 41.2 |
|
| Other income, net | 1.3 |
|
| Interest expense, net | (32.6 | ) |
| Income before taxes | 122.4 |
|
| Income tax provision | (43.0 | ) |
| Income from discontinued operations | 79.4 |
|
| Less: Net loss attributable to noncontrolling interest | (0.9 | ) |
| Income from discontinued operations attributable to common shareholders | $ | 80.3 |
|
| |
(1)
| Represents financial results for SPX FLOW through the date of Spin-Off (i.e., the nine months ended September 26, 2015), except for a revision2021 to reflect the write-off of historical currency translation amounts associated with DBT that had been previously reported within “Stockholders' equity” of our consolidated balance sheet. DBT continues to be engaged in various dispute resolution matters related to two large power projects, as indicated in Note 15 to increase the income tax provision by $1.4 that was recorded during the fourth quarter of 2015. |
| |
(2)
| Includes $30.8 of professional fees and other costs that were incurred in connection with the Spin-Off. |
The following table presents selected financial information for SPX FLOW that is included within discontinued operations in the consolidated statement of cash flows for the year ended December 31, 2015(1):
|
| | | |
| Non-cash items included in income from discontinued operations, net of tax | |
| Depreciation and amortization | $ | 44.3 |
|
| Impairment of intangible assets | 15.0 |
|
| Capital expenditures | 43.1 |
|
(1)Represents amounts for SPX FLOW through the date of Spin-Off (i.e., the nine months ended September 26, 2015).financial statements.
Other Discontinued Operations Activity
In addition to the businesses discussed above,Heat Transfer, Transformer Solutions, and DBT, we recognized net losses of $1.5, $2.7$1.3, $3.7 and $5.2$4.4 during 2017, 20162021, 2020 and 2015, respectively, resulting2019, respectively. The net losses for 2021, 2020, and 2019 resulted primarily from adjustmentsrevisions to gains/losses on dispositions ofliabilities, including income tax liabilities, retained in connection with prior businesses classified as discontinued prior to 2015.operations.
Changes in estimates associated with liabilities retained in connection with a business divestiture (e.g., income taxes) may occur. As a result, it is possible that the resulting gains/losses on these and other previous divestitures may be materially adjusted in subsequent periods.
For the years ended December 31, 2017, 20162021, 2020 and 2015,2019, results of operations from our businesses reported as discontinued operations were as follows:
| | | | | | | | | | Year ended December 31, |
| | Year ended December 31, | | 2021 | | 2020 | | 2019 |
| | 2017 | | 2016 | | 2015 (1) | |
| Balcke Dürr | | | | | | |
| Loss from discontinued operations | $ | (2.6 | ) | | $ | (107.0 | ) | | $ | (48.7 | ) | |
| Income tax benefit | 9.4 |
| | 11.8 |
| | 9.1 |
| |
| Income (loss) from discontinued operations, net | 6.8 |
| | (95.2 | ) | | (39.6 | ) | |
| | | | | | | |
| SPX FLOW | | | | | | |
| Transformer Solutions | | Transformer Solutions | | | | | |
| Income from discontinued operations | — |
| | — |
| | 122.4 |
| Income from discontinued operations | $ | 454.9 | | | $ | 56.9 | | | $ | 39.4 | |
| Income tax provision | — |
| | — |
| | (43.0 | ) | |
Income tax provision (1) | | Income tax provision (1) | (51.8) | | | (14.0) | | | (8.8) | |
| Income from discontinued operations, net | — |
| | — |
| | 79.4 |
| Income from discontinued operations, net | 403.1 | | | 42.9 | | | 30.6 | |
| | | | | | | | | | | | |
| All other | | | | | | |
| DBT | | DBT | |
| Loss from discontinued operations | (4.0 | ) | | (3.7 | ) | | (8.6 | ) | Loss from discontinued operations | (37.8) | | | (16.6) | | | (43.1) | |
| Income tax benefit | 2.5 |
| | 1.0 |
| | 3.4 |
| Income tax benefit | 2.7 | | | 2.4 | | | 7.3 | |
| Loss from discontinued operations, net | (1.5 | ) | | (2.7 | ) | | (5.2 | ) | Loss from discontinued operations, net | (35.1) | | | (14.2) | | | (35.8) | |
| | | | | | | | | | | | |
| Total | | | | | | |
| Heat Transfer | | Heat Transfer | |
| Income (loss) from discontinued operations | (6.6 | ) | | (110.7 | ) | | 65.1 |
| Income (loss) from discontinued operations | (0.3) | | | 0.3 | | | (1.8) | |
| Income tax (provision) benefit | 11.9 |
| | 12.8 |
| | (30.5 | ) | Income tax (provision) benefit | — | | | (0.1) | | | 0.4 | |
| Income (loss) from discontinued operations, net | $ | 5.3 |
| | $ | (97.9 | ) | | $ | 34.6 |
| Income (loss) from discontinued operations, net | (0.3) | | | 0.2 | | | (1.4) | |
| | All other | | All other | |
| Loss from discontinued operations | | Loss from discontinued operations | (7.6) | | | (4.8) | | | (4.0) | |
| Income tax (provision) benefit | | Income tax (provision) benefit | 6.3 | | | 1.1 | | | (0.4) | |
| Loss from discontinued operations, net | | Loss from discontinued operations, net | (1.3) | | | (3.7) | | | (4.4) | |
| | Total | | Total | |
| Income (loss) from discontinued operations | | Income (loss) from discontinued operations | 409.2 | | | 35.8 | | | (9.5) | |
| Income tax provision | | Income tax provision | (42.8) | | | (10.6) | | | (1.5) | |
| Income (loss) from discontinued operations, net | | Income (loss) from discontinued operations, net | $ | 366.4 | | | $ | 25.2 | | | $ | (11.0) | |
| |
(1)
| For SPX FLOW, represents financial results through the date of Spin-Off (i.e., the nine months ended September 26, 2015), except for a revision to increase the income tax provision by $1.4 that was recorded during(1) During the fourth quarter of 2015. |
Other Dispositions
Sale of Dry Cooling Business
2021, we liquidated various recently acquired entities. As indicated in Note 1 to our consolidated financial statements, on November 20, 2015, we entered into an agreement for the salea result of our dry cooling business. On March 30, 2016, we completed the sale of our dry cooling business for cash proceeds for $47.6 (net of cash transferred with the business of $3.0). In connection with the sale,this action, we recorded a gainnet income tax benefit of $18.4.$16.5 within our 2021 consolidated statement of operations, which included an income tax charge of $10.9 within continuing operations and income tax benefit of $27.4 within discontinued operations.
Results of Reportable Segments
The following information should be read in conjunction with our consolidated financial statements and related notes. These results exclude the operating results of discontinued operations for all periods presented. See Note 57 to our consolidated financial statements for a description of each of our reportable segments.
Non-GAAP Measures — Throughout the following discussion of reportable segments, we use “organic revenue” growth (decline) to facilitate explanation of the operating performance of our segments. Organic revenue growth (decline) is a non-GAAP financial measure, and is not a substitute for net revenue growth (decline). Refer to the explanation of this measure and purpose of use by management under “Results of Continuing Operations — Non-GAAP Measures.”
HVAC Reportable Segment
| | | | | | | | | | | | | | | | | | | | | | | | | | | | | |
| | Year Ended December 31, | | 2021 vs.
2020 % | | 2020 vs.
2019 % |
| | 2021 | | 2020 | | 2019 | | |
| Revenues | $ | 752.1 | | | $ | 740.8 | | | $ | 738.7 | | | 1.5 | | | 0.3 | |
| Income | 104.2 | | | 102.7 | | | 103.2 | | | 1.5 | | | (0.5) | |
| % of revenues | 13.9 | % | | 13.9 | % | | 14.0 | % | | | | |
| Components of revenue increase: | | | | | | | | | |
| Organic | | | | | | | 1.3 | | | (4.8) | |
| Foreign currency | | | | | | | 0.5 | | | (0.1) | |
| Settlement of legacy dry cooling contract | | | | | | | (0.6) | | | — | |
| Acquisitions | | | | | | | 0.3 | | | 5.2 | |
| Net revenue increase | | | | | | | 1.5 | | | 0.3 | |
|
| | | | | | | | | | | | | | | | | |
| | Year Ended December 31, | | 2017 vs. 2016% | | 2016 vs. 2015% |
| | 2017 | | 2016 | | 2015 | | |
| Revenues | $ | 511.0 |
| | $ | 509.5 |
| | $ | 529.1 |
| | 0.3 |
| | (3.7 | ) |
| Income | 74.1 |
| | 80.2 |
| | 80.2 |
| | (7.6 | ) | | — |
|
| % of revenues | 14.5 | % | | 15.7 | % | | 15.2 | % | | |
| | |
|
| Components of revenue increase (decline): | |
| | |
| | |
| | |
| | |
|
| Organic | |
| | |
| | |
| | 0.3 |
| | (2.4 | ) |
| Foreign currency | |
| | |
| | |
| | — |
| | (1.3 | ) |
| Net revenue increase (decline) | |
| | |
| | |
| | 0.3 |
| | (3.7 | ) |
Revenues — For 2017,2021, the increase in revenues, compared to 2016, was due to the increase in organic revenue. The increase in organic revenue2020, was due primarily to an increase in sales of cooling products andorganic revenue for the segment’s heating and ventilation products,businesses, partially offset by a decline in salesorganic revenue at the segment's cooling businesses due to several large projects that contributed significant revenue to the segment's results in 2020. Sales of boiler products.heating products during the first half of 2020 were impacted negatively by (i) a warmer than normal winter and (ii) the COVID-19 pandemic.
For 2016,2020, the decreaseincrease in revenues, compared to 2015,2019, was due to the impact of the SGS and Patterson-Kelley acquisitions in 2019, partially offset by a decline in organic revenue.The decline in organic revenue was due to a decrease in sales of heating products and domestic cooling products.The decline in the sales of heating products was due primarily to (i) warmer than normal weather during the first half of 2020 and (ii) the negative impact of the COVID-19 pandemic on customer demand.The demand for domestic cooling products was also negatively impacted by the COVID-19 pandemic.These declines in organic revenue were offset partially by higher sales of cooling products in the international markets, with such sales favorably impacted by a number of large orders that were secured prior to the COVID-19 pandemic.
Income — For 2021, the increase in income, compared to 2020, was due primarily to the increase in revenues noted above.
For 2020, the decrease in income and margin, compared to a lesser extent,2019, was due primarily to the decline in sales of heating products noted above. This decrease in income and margin was partially offset by the impact of a stronger U.S. dollar during 2016. The organic revenue decline primarily was the result of lower sales of heating and ventilation products.
Income — For 2017, income and margin decreased, compared to 2016, primarily as a result of a less profitable sales mix associated with the segment’s cooling and boiler products as well as lower absorption of fixed costs within the boiler products business due to the lower sales volumes noted above.
For 2016, margin increased, compared to 2015, primarily as a result of(i) improved operating efficiencyoperational execution and a more profitablefavorable sales mix within the segment’s heatingdomestic cooling products business and ventilation(ii) higher sales of cooling products businesses.in the international markets.
Backlog — The segment had backlog of $41.4$226.9 (including $20.4 related to Cincinnati Fan) and $28.3$150.1 as of December 31, 20172021 and 2016,2020, respectively. Approximately 99%97% of the segment’s backlog as of December 31, 20172021 is expected to be recognized as revenue during 2018.2022.
Detection and Measurement Reportable Segment
| | | | | | | | | | | | | | | | | | | | | | | | | | | | | |
| | Year Ended December 31, | | 2021 vs.
2020 % | | 2020 vs.
2019 % |
| | 2021 | | 2020 | | 2019 | | |
| Revenues | $ | 467.4 | | | $ | 387.3 | | | $ | 384.9 | | | 20.7 | | | 0.6 | |
| Income | 69.7 | | | 69.1 | | | 81.7 | | | 0.9 | | | (15.4) | |
| % of revenues | 14.9 | % | | 17.8 | % | | 21.2 | % | | | | |
| Components of revenue increase: | | | | | | | | | |
| Organic | | | | | | | 5.0 | | | (4.4) | |
| Foreign currency | | | | | | | 1.1 | | | 0.1 | |
| Acquisitions | | | | | | | 14.6 | | | 4.9 | |
| Net revenue increase | | | | | | | 20.7 | | | 0.6 | |
|
| | | | | | | | | | | | | | | | | |
| | Year Ended December 31, | | 2017 vs. 2016% | | 2016 vs. 2015% |
| | 2017 | | 2016 | | 2015 | | |
| Revenues | $ | 260.3 |
| | $ | 226.4 |
| | $ | 232.3 |
| | 15.0 |
| | (2.5 | ) |
| Income | 63.4 |
| | 45.3 |
| | 46.0 |
| | 40.0 |
| | (1.5 | ) |
| % of revenues | 24.4 | % | | 20.0 | % | | 19.8 | % | | |
| | |
|
| Components of revenue increase (decline): | |
| | |
| | |
| | |
| | |
|
| Organic | |
| | |
| | |
| | 15.5 |
| | (0.3 | ) |
| Foreign currency | |
| | |
| | |
| | (0.5 | ) | | (2.2 | ) |
| Net revenue increase (decline) | |
| | |
| | |
| | 15.0 |
| | (2.5 | ) |
Revenues — For 2017,2021, the increase in revenues, compared to 2016,2020, was due primarily to an increasethe impact of the acquisitions of ECS and Sealite in 2021 and ULC and Sensors and Software in 2020 and, to a lesser extent, organic revenue.revenue growth and the impact of foreign currency exchange rates. The increase in organic revenue was primarily the result of an increase inhigher sales for all of the primary product lines within the segment.
For 2016, the decrease in revenues, compared to 2015, was due to a stronger U.S. dollar in 2016underground pipe and locator products and, to a lesser extent, a decline in organic revenue. The decline in organic revenue was due primarily to a decrease inhigher sales of communication technologies and obstruction
lighting products. These increases in organic revenue were offset partially by lower sales of bus fare collection systems. During the first half of 2020, sales of underground pipe and locator products generally offsetwere impacted negatively by increasesthe COVID-19 pandemic, while the decline in sales of bus fare collection systems and specialty lighting products.in the current year was due primarily to the timing of large projects, as the extent of such projects can fluctuate from year-to-year.
Income —
For 2017,2020, the increase in revenues, compared to 2019, was due primarily to the impact of the ULC acquisition and, to a lesser extent, the Sensors & Software acquisition, partially offset by a decline in organic revenue.The decline in organic revenue was primarily the result of lower sales of communication technologies products, with a portion of the decline due to order delays caused by the COVID-19 pandemic.
Income — For 2021, the increase in income, compared to 2020, was due primarily to the increase in revenue noted above, partially offset by increases in amortization expense of $7.1 and inventory step-up charges of $2.3 associated with the acquisitions noted above. The year-over-year decrease in margins was due primarily to the increases in amortization expense and inventory step-up charges noted above.
For 2020, the decrease in income and margin, compared to 2016,2019, was due primarily to the revenue increase noted above and lower SG&A expense resulting from cost reductions within our bus fare collection systems’ anddecline in sales of high-margin communication technologies’ businesses.
For 2016, the decrease in income, compared to 2015, was primarily due to the revenue declinetechnologies products noted above.
Backlog — The segment had backlogbacklog of $54.0$153.6 (including $50.8 related to Sealite and $53.6ECS) and $89.3 as of December 31, 20172021 and 2016,2020, respectively. Approximately 65%71% of the segment’s backlog as of DecemberDecember 31, 20172021 is expected to be recognized as revenue during 2018.2022.
Engineered Solutions Reportable Segment
|
| | | | | | | | | | | | | | | | | |
| | Year Ended December 31, | | 2017 vs. 2016% | | 2016 vs. 2015% |
| | 2017 | | 2016 | | 2015 | | |
| Revenues | $ | 654.5 |
| | $ | 736.4 |
| | $ | 797.6 |
| | (11.1 | ) | | (7.7 | ) |
| Income (loss) | (12.6 | ) | | 17.3 |
| | (87.4 | ) | | * |
| | * |
|
| % of revenues | (1.9 | )% | | 2.3 | % | | (11.0 | )% | | |
| | |
|
| Components of revenue decline: | |
| | |
| | |
| | |
| | |
|
| Organic | |
| | |
| | |
| | (6.7 | ) | | (4.5 | ) |
| Foreign currency | |
| | |
| | |
| | 1.5 |
| | (2.3 | ) |
| Sale of dry cooling business | | | | | | | (0.9 | ) | | (8.1 | ) |
| South Africa revenue revision | | | | | | | (5.0 | ) | | 7.2 |
|
| Net revenue decline | |
| | |
| | |
| | (11.1 | ) | | (7.7 | ) |
| |
* | Not meaningful for comparison purposes. |
Revenues — For 2017, the decrease in revenues, compared to 2016, was due primarily to a decline in organic revenue, partially offset by the impact of a weaker U.S. dollar versus the South African Rand during 2017. The decline in organic revenue was the result of lower sales related to the segment’s large power projects in South Africa, as these projects generally are in the latter stages of completion, as well as lower sales of power transformers and process cooling products. The decrease in power transformer sales was due primarily to the timing of shipments. In addition, our process cooling business has been impacted by a shift in its sales model, whereby it is now focused more on high-margin components and services and less on lower-margin large projects. In addition, the decrease in revenues compared to the same period in 2016, resulted from an aggregate reduction in revenue of $36.9 related to revisions during the second and fourth quarters of 2017 to the expected revenues and costs on the segment’s large power projects in South Africa and the impact of the sale of the dry cooling business at the end of the first quarter of 2016.
For 2016, the decrease in revenues, compared to 2015, was due primarily to the impact of the sale of the dry cooling business at the end of the first quarter of 2016, a decline in organic revenue, and, to a lesser extent, the impact of a stronger U.S. dollar in 2016, partially offset by the impact of a reduction in revenues of $57.2 during the third quarter of 2015 resulting from a revision to the expected revenues and costs on the segment’s large power projects in South Africa. The decline in organic revenues was due primarily to lower sales of process cooling products.
Income — For 2017, the decrease in profit and margin, compared to 2016, was due primarily to an aggregate reduction in profit of $52.8 associated with revisions during the second and fourth quarters of 2017 to the expected revenues and costs of the segment’s large power projects in South Africa, partially offset by a $10.2 gain recorded during the third quarter of 2017 resulting from the settlement of a contract that had been suspended and then ultimately cancelled by a customer. In addition, income and margin in 2017, compared to 2016, were favorably impacted by cost reductions at the segment’s Heat Transfer business resulting from restructuring actions that were implemented in 2016 and the sale of the dry cooling business, which generated losses in 2016 prior to its sale.
For 2016, the increase in profit and margin, compared to 2015, was due primarily to the fact that the segment’s results for 2015 included a reduction in profit of $95.0 during the third quarter of 2015 resulting from a revision to the expected revenues and costs on the segment’s large power projects in South Africa. During 2016, income and margin for the segment’s power transformer business increased as a result of improved operating efficiency. However, these increases were offset partially by lower profitability from process cooling products resulting primarily from the decline in revenue noted above.
Backlog — The segment had backlog of $434.0 and $416.7 as of December 31, 2017 and 2016, respectively. Approximately 83% of the segment’s backlog as of December 31, 2017 is expected to be recognized as revenue during 2018.
Corporate Expense and Other Expense | | | | | | | | | | | | | | | | | | | | | | | | | | | | | |
| | Year Ended December 31, | | 2021 vs.
2020 % | | 2020 vs.
2019 % |
| | 2021 | | 2020 | | 2019 | | |
| Total consolidated revenues | $ | 1,219.5 | | | $ | 1,128.1 | | | $ | 1,123.6 | | | 8.1 | | | 0.4 | |
| Corporate expense | 60.5 | | | 49.7 | | | 55.0 | | | 21.7 | | | (9.6) | |
| % of revenues | 5.0 | % | | 4.4 | % | | 4.9 | % | | | | |
| Long-term incentive compensation expense | 12.8 | | | 13.1 | | | 12.6 | | | (2.3) | | | 4.0 | |
|
| | | | | | | | | | | | | | | | | |
| | Year Ended December 31, | | 2017 vs. 2016% | | 2016 vs. 2015% |
| | 2017 | | 2016 | | 2015 | | |
| Total consolidated revenues | $ | 1,425.8 |
| | $ | 1,472.3 |
| | $ | 1,559.0 |
| | (3.2 | ) | | (5.6 | ) |
| Corporate expense | 46.2 |
| | 41.7 |
| | 103.4 |
| | 10.8 |
| | (59.7 | ) |
| % of revenues | 3.2 | % | | 2.8 | % | | 6.6 | % | | |
| | |
|
| Pension and postretirement expense | 5.4 |
| | 15.4 |
| | 18.6 |
| | (64.9 | ) | | (17.2 | ) |
| Long-term incentive compensation expense | 15.8 |
| | 13.7 |
| | 33.9 |
| | 15.3 |
| | (59.6 | ) |
Corporate Expense — Corporate expense generally relates to the cost ofassociated with our Charlotte, NC corporate headquarters. Prior to the Spin-Off, corporate expense also included costs of our Asia Pacific center in Shanghai, China, which was part of the Spin-Off, costs that were previously allocated to the Flow Business that do not meet the requirements to be presented within discontinued operations, and the cost of corporate employees who became employees of SPX FLOW at the time of the Spin-Off. The increase in corporate expense in 2017,during 2021, compared to 2016,2020, was due primarily to increased investments in continuous improvement and other strategic initiatives and higher incentive compensation expense, as well as higher professional fees. during 2021.
The decrease in corporate expense in 2016,during 2020, compared to 2015,2019, was due primarily to the elimination of costs in connectionlower incentive compensation and travel expense during 2020, with the Spin-Off, includingdecline in travel expense resulting from the costimpact of corporate employees who became employees of SPX FLOW.the COVID-19 pandemic.
Pension and Postretirement
Long-Term Incentive Compensation Expense— Pension and postretirement expense represents our consolidated expense, which we do not allocate for segment reporting purposes. The decrease in pension and postretirement expenselong-term incentive compensation in 2017,2021, compared to 2016,2020, was due primarily to a decline in actuarial losses, as net actuarial losses totaled $1.6 in 2017 and $12.0 in 2016. Actuarial losses in 2017 included net chargesrevisions to/finalization of $4.2 related to our fourththe liability associated with the 2018 long-term cash awards during the first quarter remeasurement of our plans’ assets and liabilities,2021, partially offset by an actuarial gainthe impact of $2.6 recorded in the third quartera lower amount of 2017 associated with the remeasurement of the unfunded liability related to certain postretirement benefits. The fourth quarter 2017 net charges resulted primarily from lower discount rates applied to our plans’ projected benefit obligations, partially offset by better than expected returns on our plans’ assets.
The decrease in pension and postretirement expense in 2016, compared to 2015, was due to a decline in actuarial losses, as actuarial losses in 2016 totaled $12.0 compared to $15.9 in 2015. Actuarial losses for 2016 and 2015 resulted primarily from our fourth quarter remeasurement of our plan’s assets and liabilities, with the resulting charges for the fourth quarter of 2016 and 2015 totaling $10.2 and $9.6, respectively. The fourth quarter 2016 charges resulted primarily from lower discount rates applied to our plans’ projected benefit obligations, while the fourth quarter 2015 charges resulted primarily from lower than expected returns on plan assets. Actuarial losses for 2016 also included charges of $1.8 associated with the second quarter 2016 remeasurement of the assets and liabilities of the SPX U.S. Pension Plan (the “U.S. Plan”) and Supplemental Individual Account Retirement Plan (“SIARP”) in connection with lump-sum payments that were made by these plansaward forfeitures during the quarter. Actuarial losses for 2015 also included charges of $11.4 associated with the third quarter 2015 remeasurement of the assets and liabilities of the U.S. Plan and SIARP in connection with an amendment to these plans to freeze all benefits of active non-union participants. This amendment also resulted in a curtailment gain of $5.1 during the third quarter of 2015.
See Note 9 to our consolidated financial statements for further details on our pension and postretirement plans.
Long-term Incentive Compensation Expense —2021. The increase in long-term incentive compensation expense during 2017,in 2020, compared to the respective period in 2016, was due primarily to additional charges of $1.6 in 2017 associated with certain of our long-term cash-awards, as we now expect to exceed the three-year segment income performance target required of these awards. The decrease in long-term incentive compensation expense in 2016, compared to 2015,2019, was due primarily to the fact that the 2015 amount included $21.6 of costs related to corporate employees who became employees of SPX FLOW at the time of the Spin-Off or retiredaccelerated expense in connection with the Spin-Off.2020 on certain awards.
See Note 1416 to our consolidated financial statements for further details on our long-term incentive compensation plans.
Liquidity and Financial Condition
Cash Flows
Listed below are the cash flows from (used in) operating, investing and financing activities, and discontinued operations, as well as the net change in cash and equivalents for the years ended December 31, 2017, 20162021, 2020 and 2015.2019.
| | | | | | | | | | | | | | | | | |
| | Year Ended December 31, |
| | 2021 | | 2020 | | 2019 |
| Continuing operations: | | | | | |
| Cash flows from operating activities | $ | 131.2 | | | $ | 105.2 | | | $ | 110.0 | |
| Cash flows used in investing activities | (306.0) | | | (119.9) | | | (154.9) | |
| Cash flows from (used in) financing activities | (167.8) | | | 16.3 | | | 4.7 | |
| Cash flows from discontinued operations | 663.7 | | | 14.5 | | | 24.0 | |
| Change in cash and equivalents due to changes in foreign currency exchange rates | 6.6 | | | (2.5) | | | 2.1 | |
| Net change in cash and equivalents | $ | 327.7 | | | $ | 13.6 | | | $ | (14.1) | |
|
| | | | | | | | | | | |
| | Years Ended December 31, |
| | 2017 | | 2016 | | 2015 |
| Continuing operations: | |
| | |
| | |
|
| Cash flows from (used in) operating activities | $ | 54.2 |
| | $ | 53.4 |
| | $ | (76.0 | ) |
| Cash flows from (used in) investing activities | (11.3 | ) | | 36.4 |
| | (14.0 | ) |
| Cash flows used in financing activities | (6.2 | ) | | (20.5 | ) | | (173.7 | ) |
| Cash flows used in discontinued operations | (6.6 | ) | | (77.8 | ) | | (4.6 | ) |
| Change in cash and equivalents due to changes in foreign currency exchange rates | (5.4 | ) | | 6.7 |
| | (57.9 | ) |
| Net change in cash and equivalents | $ | 24.7 |
| | $ | (1.8 | ) | | $ | (326.2 | ) |
20172021 Compared to 20162020
Operating Activities— – The increase in cash flows from operating activities, compared to 2016,2020, was due primarily to (i) improved operating cash flows acrosswithin our heating and underground pipe and locator businesses related toassociated with improved profitability, and reductions(ii) a decline in working capital partially offset by a year-over-year increaseat certain of our businesses, (iii) insurance proceeds of $15.0 associated with the settlement of an asbestos insurance coverage matter, and (iv) income tax refunds, net of tax payments, of $5.5 in net2021 (compared to income tax payments, ($22.9net of refunds, of $7.6 in 2017, compared to $4.8 in 2016) and an increase in cash outflows associated with our large power projects in South Africa ($56.5 in 2017, compared to $33.1 in 2016)2020).
Investing Activities —Activities - Cash flows used in investing activities for 20172021 were comprised primarily of cash utilized in the acquisitions of Sealite, ECS and Cincinnati Fan of $264.9, net expenditures related to company-owned life insurance policies of $31.2, and capital expenditures of $11.0 and an increase in restricted cash of $0.3. $9.6.Cash flows fromused in investing activities for 2016 related to proceeds from asset salesin 2020 were comprised primarily of $48.1 (including proceeds fromcash utilized in the saleacquisitions of the dry cooling businessULC and Sensors & Software of $47.6), partially offset by$104.4 and capital expenditures of $11.7.$15.3.
Financing Activities— During 2017, net cash – Cash flows used in financing activities during 2021 were comprised primarily related to financing fees of $3.6 paid in connection with the December 2017 amendment of our senior credit agreement and net repayments underon our various debt instruments of $1.3. During 2016,$164.5. Cash flows from financing activities during 2020 were comprised primarily of net borrowings on our various debt instruments of $15.6.
Discontinued Operations – Cash flows from discontinued operations for 2021 related primarily to proceeds received in connection with the sale of Transformer Solutions of $620.6. In addition cash flows from discontinued operations include cash flows from operations generated by Transformer Solutions, partially offset by cash flows used in financing activities primarilyDBT's operations and disbursements related to net repayments of debt of $18.9.
Discontinued Operations —liabilities retained in connection with other dispositions. Cash flows from discontinued operations for 2020 related primarily to cash flows generated by Transformer Solutions and Heat Transfer, partially offset by cash flows used in discontinuedDBT's operations for 2017 related toand disbursements for liabilities retained in connection with dispositions, while cash flows used in discontinued operations during 2016 related primarily to the operations of our Balcke Dürr business and the cash disposed of in connection with the sale of Balcke Dürr.other dispositions.
Change in Cash and Equivalents dueDue to Changes in Foreign Currency Exchange Rates— - Changes in foreign currency exchange rates did not have a significant impact on our cash and equivalents during 20172021 and 2016.2020.
2016
2020 Compared to 20152019
Operating Activities— – The increasedecrease in cash flows from operating activities, during 2016, compared to 2015,2019, was due primarily to the fact thata decline in cash flows used in operating activities during 2015 included disbursements for general corporate overhead costs related to a corporate structure that supported the SPX business prior to the Spin-Off. As previously noted, a significant portion of this corporate structure transferred to SPX FLOW at the time of the Spin-Off and, thus, was no longer partcertain of our companyproject-related businesses during 2016. In addition, operating2020, as cash flows associated with our businesses increased during 2016, comparedreceipts for these project-related business are often subject to 2015, primarily as a result ofcontractual milestones that can impact the timing of cash receipts on certain long-term projects.
Investing Activities — Cash flows from investing activities for 2016 related to proceeds from asset sales of $48.1 (including proceeds from the sale of the dry cooling business of $47.6), partially offset by capital expenditures of $11.7.year-to-year.
Investing Activities - Cash flows used in investing activities during 2015 related tofor 2020 were comprised primarily of cash utilized in the acquisitions of ULC and Sensors & Software of $104.4 and capital expenditures of $16.0,$15.3.Cash flows used in investing activities in 2019 were comprised primarily of cash utilized in the acquisitions of Sabik, SGS, and Patterson-Kelley of $147.1 and capital expenditures of $13.5, partially offset by proceeds from asset salescompany-owned life insurance policies of $2.0.$5.9.
Financing Activities— During 2016, – Cash flows from financing activities during 2020 were comprised primarily of net borrowings on our various debt instruments of $15.6.Cash flows from financing activities during 2019 were comprised primarily of net borrowings on various debt instruments of $10.0.
Discontinued Operations – Cash flows from discontinued operations for 2020 related primarily to cash flows generated by Transformer Solutions and Heat Transfer, partially offset by cash flows used in financing activities primarily related to net repayments of debt of $18.9. During 2015, net cash flows used in financing activities primarily related to the cash dividend to SPX
FLOWDBT operations and disbursements for liabilities retained in connection with the Spin-Off of $208.6 and dividends paid of $45.9, partially offset by net borrowings under our senior credit facilities of $97.0.
Discontinued Operations —other dispositions. Cash flows used infrom discontinued operations during 2016for 2019 related primarily to the operationscash flows generated by Transformer Solutions and proceeds of our Balcke Dürr business and the cash disposed of$5.5 received in connection with the sale of Balcke Dürr, whileHeat Transfer's manufacturing facility, partially offset by disbursements for liabilities retained in connection with other dispositions, net cash flows used in discontinued operations during 2015 related primarilyby Heat Transfer and DBT, and a payment of $15.6 to the cash flows associated with the FLOW Business.settle a put option held by a minority shareholder of DBT (see Note 15 to our consolidated financial statements for additional details).
Change in Cash and Equivalents dueDue to Changes in Foreign Currency Exchange Rates— - Changes in foreign currency exchange rates did not have a significant impact on our cash and equivalents during 2016. The decrease in cash2020 and equivalents due to foreign currency exchange rates for 2015 reflected primarily a reduction in U.S. dollar equivalent balances of our Euro-denominated cash and equivalents as a result of the strengthening of the U.S. dollar against the Euro during the period.2019.
Borrowings
The following summarizes our debt activity (both current and non-current) for the year ended December 31, 2017:2021:
| | | | | | | | | | | | | | December 31,
2020 | | Borrowings | | Repayments | | Other (5) | | December 31,
2021 |
| December 31,
2016 |
| Borrowings |
| Repayments |
| Other (5) |
| December 31,
2017 | |
| Revolving loans | $ | — |
|
| $ | 54.6 |
|
| $ | (54.6 | ) |
| $ | — |
|
| $ | — |
| |
Term loans (1)(2) | 339.6 |
|
| 350.0 |
|
| (341.2 | ) |
| (0.7 | ) |
| 347.7 |
| |
Revolving loans (1) | | Revolving loans (1) | $ | 129.8 | | | $ | 209.9 | | | $ | (339.7) | | | $ | — | | | $ | — | |
Term loan (2) | | Term loan (2) | 248.6 | | | — | | | (6.3) | | | 0.4 | | | 242.7 | |
Trade receivables financing arrangement (3) | — |
|
| 74.0 |
|
| (74.0 | ) |
| — |
|
| — |
| Trade receivables financing arrangement (3) | 28.0 | | | 179.0 | | | (207.0) | | | — | | | — | |
Other indebtedness (4) | 16.6 |
|
| 38.7 |
|
| (48.8 | ) |
| 2.6 |
|
| 9.1 |
| Other indebtedness (4) | 6.0 | | | 0.6 | | | (1.0) | | | (2.3) | | | 3.3 | |
| Total debt | 356.2 |
|
| $ | 517.3 |
|
| $ | (518.6 | ) |
| $ | 1.9 |
|
| 356.8 |
| Total debt | 412.4 | | | $ | 389.5 | | | $ | (554.0) | | | $ | (1.9) | | | 246.0 | |
| Less: short-term debt | 14.8 |
|
|
|
|
|
|
|
|
|
|
| 7.0 |
| Less: short-term debt | 101.2 | | | | | | | | | 2.2 | |
| Less: current maturities of long-term debt | 17.9 |
|
|
|
|
|
|
|
| 0.5 |
| Less: current maturities of long-term debt | 7.2 | | | 13.0 | |
| Total long-term debt | $ | 323.5 |
|
|
|
|
|
|
|
| $ | 349.3 |
| Total long-term debt | $ | 304.0 | | | $ | 230.8 | |
| |
(1)
| As noted below, we amended our senior credit agreement on December 19, 2017 and proceeds of $350.0 were made available by way of a new term loan facility, with $328.1 utilized to repay, in full, amounts outstanding under the then-existing term loan facility |
| |
(2)
| The new term loan is repayable in quarterly installments of 1.25% of the initial loan amount of $350.0, beginning in the first quarter of 2019, with the remaining balance payable in full on December 19, 2022. Balances are net of unamortized debt issuance costs of $2.3 and $1.6 at December 31, 2017 and December 31, 2016, respectively. |
| |
(3)
| Under this arrangement, we can borrow, on a continuous basis, up to $50.0, as available. At December 31, 2017, we had $33.3 of available borrowing capacity under this facility. |
| |
(4)
| Primarily includes capital lease obligations of $2.1 and $1.7, balances under purchase card programs of $2.8 and $3.9, borrowings under a line of credit in South Africa of $0.0 and $10.2, and borrowings under a line of credit in China of $4.1 and $0.0, at December 31, 2017 and 2016, respectively. The purchase card program allows for payment beyond the normal payment terms for goods and services acquired under the program. As this arrangement extends the payment of these purchases beyond their normal payment terms through third-party lending institutions, we have classified these amounts as short-term debt. |
| |
(5)
| “Other” primarily includes debt assumed, foreign currency translation on any debt instruments denominated in currencies other than the U.S. dollar, debt issuance costs incurred in connection with the new term loan, and the impact of amortization of debt issuance costs associated with the term loan. |
(1)While not due for repayment until December 2024 under the terms of our senior credit agreement, we classify within current liabilities the portion of the outstanding balance that we believe will be repaid over the next year, with such amount based on an estimate of cash that is expected to be generated over such period.
(2)The term loan is repayable in quarterly installments beginning in the first quarter of 2021, with the quarterly installments equal to 0.625% of the initial term loan balance of $250.0 during 2021, 1.25% in each of the four quarters of 2022 and 2023, and 1.25% during the first three quarters of 2024. The remaining balance is payable in full on December 17, 2024. Balances are net of unamortized debt issuance costs of $1.0 and $1.4 at December 31, 2021 and December 31, 2020, respectively.
(3)Under this arrangement, we can borrow, on a continuous basis, up to $50.0, as available. At December 31, 2021, there was no available borrowing capacity under the agreement.
(4)Primarily includes balances under a purchase card program of $2.2 and $1.7 and finance lease obligations of $1.1 and $2.6 at December 31, 2021 and 2020, respectively. The purchase card program allows for payment beyond the normal payment terms for goods and services acquired under the program. As this arrangement extends the payment of these purchases beyond their normal payment terms through third-party lending institutions, we have classified these amounts as short-term debt.
(5)“Other” primarily includes debt assumed, foreign currency translation on any debt instruments denominated in currencies other than the U.S. dollar, and the impact of amortization of debt issuance costs associated with the term loan.
Maturities of long-term debt payable during each of the five years subsequent to December 31, 20172021 are $0.5, $18.0, $18.0, $17.9are $13.0, $12.9, $218.9, $0.0, and $297.7,$0.0 respectively.
Senior Credit Facilities
On December 19, 2017,17, 2019, we amended our senior credit agreement (the “Credit Agreement”) to, among other things, extend the term of each facility under the Credit Agreement (with the aggregate of each facility comprising the “Senior Credit Facilities”) and provide for committed senior secured financing with an aggregate amount of $900.0, consisting$800.0. On May 24, 2021, we elected to reduce our participating foreign credit instrument facility and bilateral foreign credit instrument facility, available for performance letters of credit and guarantees, by an aggregate amount of $20.0 and $25.0, respectively. The facility reduction resulted in a write-off of deferred finance costs of $0.2, recorded to “Interest expense” in the consolidated statement of operations for the year ended December 31, 2021. After this reduction, and repayments of term loans through December 31, 2021, our committed senior secured financing consists of the following at December 31, 2021 (each with thea final maturity of December 19, 2022)17, 2024):
•A new term loan facility in an aggregatewith a remaining principle amount, as of $350.0;December 31, 2021, of $243.7;
•A domestic revolving credit facility, available for loans and letters of credit, in an aggregate principal amount up to $200.0;of $300.0;
•A global revolving credit facility, available for loans in USD, Euros, GBPBritish Pound Sterling, and other currencies, in anthe aggregate principal amount up to the equivalent of $150.0;
•A participationparticipating foreign credit instrument facility, available for performance letters of credit and guarantees, in an aggregate principal amount up to the equivalent of $145.0 (previously $175.0);$35.0; and
•A bilateral foreign credit instrument facility, available for performance letters of credit and guarantees, in an aggregate principal amount up to the equivalent of $55.0 (previously $125.0).$20.0.
The above amendment of our Credit Agreement also:
Adjusts the maximum aggregate amount of additional commitments
•Requires that we may seek, without consent of existing lenders, to add an incremental term loan facility and/or increase the commitments in respect of the domestic revolving credit facility, the global revolving credit facility, the participation foreign credit instrument facility, and/or the bilateral foreign credit instrument facility, to (i) the greater of (A) $200.0 or (B) our Consolidated EBITDA for the preceding four fiscal quarters, plus (ii) an amount equal to all voluntary prepayments of the term loan facility and the voluntary prepayments accompanied by permanent commitment reductions of revolving credit facilities and foreign credit instrument facilities, plus (iii) an unlimited amount so long as, immediately after giving effect thereto, our Consolidated Senior Secured Leverage Ratio for the prior four fiscal quarters does not exceed 2.75 to 1.00 (with the provisions described in clauses (ii) and (iii) being essentially unchanged from the previous agreement);
Permits unlimited investments, capital stock repurchases and dividends, and prepayments of subordinated debt if ourmaintain a Consolidated Leverage Ratio after giving pro forma effect to such payments, is less than 2.75 to 1.00 (2.50 to 1.00 prior to(defined in the amendment);
Increases the Consolidated Leverage Ratio that we are required to maintainCredit Agreement) as of the last day of anyeach fiscal quarter to not more than 3.503.75 to 1.00 (or 4.00up to 4.25 to 1.00 for the four fiscal quarters after certain permitted acquisitions);
•Requires that we maintain a Consolidated Interest Coverage Ratio as of the last day of each fiscal quarter to not less than 3.00 to 1.00; and included certain add-backs in the definition of consolidated EBITDA used in determining such ratio; and
Adjusts•Establishes per annum fees charged and theapplies interest rate margins applicable to Eurodollar and alternate base rate loans, in each case based on the Consolidated Leverage Ratio, to be as follows:
| | | | | | | | | | | | | | | | | | | | | | | | | | | | | | | | | | | | | | | | | | | | |
Consolidated
Leverage
Ratio | | Domestic
Revolving
Commitment
Fee | | Global
Revolving
Commitment
Fee | | Letter of
Credit
Fee | | Foreign
Credit
Commitment
Fee | | Foreign
Credit
Instrument
Fee | | LIBOR
Rate
Loans | | ABR
Loans |
| Greater than or equal to 3.50 to 1.0 | | 0.350 | % | | 0.350 | % | | 2.000 | % | | 0.350 | % | | 1.250 | % | | 2.000 | % | | 1.000 | % |
| Between 2.50 to 1.0 and 3.50 to 1.0 | | 0.300 | % | | 0.300 | % | | 1.750 | % | | 0.300 | % | | 1.000 | % | | 1.750 | % | | 0.750 | % |
| Between 1.75 to 1.0 and 2.50 to 1.0 | | 0.275 | % | | 0.275 | % | | 1.500 | % | | 0.275 | % | | 0.875 | % | | 1.500 | % | | 0.500 | % |
| Less than 1.75 to 1.0 | | 0.250 | % | | 0.250 | % | | 1.375 | % | | 0.250 | % | | 0.800 | % | | 1.375 | % | | 0.375 | % |
The interest rates applicable to loans under the Credit Agreement are, at our option, equal to either (i) an alternate base rate (the highest of (a) the federal funds effective rate plus 0.5%, (b) the prime rate of Bank of America, N.A., and (c) the one-month LIBOR rate plus 1.0%) or (ii) a reserve-adjusted LIBOR rate for dollars (Eurodollars) plus, in each case, an applicable margin percentage as previously discussed, which varies based on our Consolidated Leverage Ratio (defined in the Credit Agreement generally as the ratio of consolidated total debt (excluding the face amount of undrawn letters of credit, bank undertakings and analogous instruments and net of cash and cash equivalents) at the date of determination to consolidated adjusted EBITDA for the four fiscal quarters ended most recently before such date). We may elect interest periods of one, two, three or six months (and, if consented to by all relevant lenders, twelve months) for Eurodollar borrowings.
The weighted-average interest rate of outstanding borrowings under our Senior Credit Facilities was approximately 1.5% at December 31, 2021.
|
| | | | | | | | | | | | | | | | | | | | | |
Consolidated Leverage Ratio | | Domestic Revolving Commitment Fee | | Global Revolving Commitment Fee | | Letter of Credit Fee | | Foreign Credit Commitment Fee | | Foreign Credit Instrument Fee | | LIBOR Rate Loans | | ABR Loans |
| Greater than or equal to 3.00 to 1.0 | | 0.350 | % | | 0.350 | % | | 2.000 | % | | 0.350 | % | | 1.250 | % | | 2.000 | % | | 1.000 | % |
| Between 2.25 to 1.0 and 3.00 to 1.0 | | 0.300 | % | | 0.300 | % | | 1.750 | % | | 0.300 | % | | 1.000 | % | | 1.750 | % | | 0.750 | % |
| Between 1.50 to 1.0 and 2.25 to 1.0 | | 0.275 | % | | 0.275 | % | | 1.500 | % | | 0.275 | % | | 0.875 | % | | 1.500 | % | | 0.500 | % |
| Less than 1.50 to 1.0 | | 0.250 | % | | 0.250 | % | | 1.375 | % | | 0.250 | % | | 0.800 | % | | 1.375 | % | | 0.375 | % |
The fees and bilateral foreign credit commitments are as specified above for foreign credit commitments unless otherwise agreed with the bilateral foreign issuing lender. We also pay fronting fees on the outstanding amounts of letters of credit and foreign credit instruments (in the participation facility) at the rates of 0.125% per annum and 0.25% per annum, respectively.
We areSPX is the borrower under each of the above facilities, and certain of our foreign subsidiaries are (and we may designate other foreign subsidiaries to be) borrowers under the global revolving credit facility and the foreign credit instrument facilities. All borrowings and other extensions of credit under the Credit Agreement are subject to the satisfaction of customary conditions, including absence of defaults and accuracy in material respects of representations and warranties.
The letters of credit under the domestic revolving credit facility are stand-by letters of credit requested by SPX on behalf of any of our subsidiaries or certain joint ventures. The foreign credit instrument facility is used to issue foreign credit instruments, including bank undertakings to support our foreign operations.
The interest rates applicable to loans under the Credit Agreement are, at our option, equal to either (i) an alternate base rate (the highest of (a) the federal funds effective rate plus 0.5%, (b) the prime rate of Bank of America, N.A., and (c) the one-month LIBOR rate plus 1.0%) or (ii) a reserve-adjusted LIBOR rate for dollars (Eurodollars) plus, in each case, an applicable margin percentage as previously discussed, which varies based on our Consolidated Leverage Ratio (as defined in the Credit Agreement generally as the ratio of consolidated total debt (excluding the face amount of undrawn letters of credit, bank undertakings and analogous instruments and net of cash and cash equivalents not to exceed $150.0) at the date of determination to consolidated adjusted EBITDA for the four fiscal quarters ended most recently before such date). We may elect interest periods of one, two, three or six months (and, if consented to by all relevant lenders, twelve months) for Eurodollar borrowings.
The weighted-average interest rate of outstanding borrowings under our Senior Credit Facilities was approximately 3.2% at December 31, 2017.
The fees and bilateral foreign credit commitments are as specified above for foreign credit commitments unless otherwise agreed with the bilateral foreign issuing lender. We also pay fronting fees on the outstanding amounts of letters of credit and foreign credit instruments (in the participation facility) at the rates of 0.125% per annum and 0.25% per annum, respectively.
The Credit Agreement requires mandatory prepayments in amounts equal to the net proceeds from the sale or other disposition of, including from any casualty to, or governmental taking of, property in excess of specified values (other than in the ordinary course of business and subject to other exceptions) by SPX or our subsidiaries. Mandatory prepayments will be applied to repay, first, amounts outstanding under any term loans and, then, amounts (or cash collateralize letters of credit) outstanding under the global revolving credit facility and the domestic revolving credit facility (without reducing the commitments thereunder). No prepayment is required generally to the extent the net proceeds are reinvested (or committed to be reinvested) in permitted acquisitions, permitted investments or assets to be used in our business within 360 days (and if committed to be reinvested, actually reinvested within 180360 days after the end of such 360-day period) of the receipt of such proceeds.
We may voluntarily prepay loans under the Credit Agreement, in whole or in part, without premium or penalty. Any voluntary prepayment of loans will be subject to reimbursement of the lenders’ breakage costs in the case of a prepayment of Eurodollar rate borrowings other than on the last day of the relevant interest period. Indebtedness under the Credit Agreement is guaranteed by:
•Each existing and subsequently acquired or organized domestic material subsidiary with specified exceptions; and
•SPX with respect to the obligations of our foreign borrower subsidiaries under the global revolving credit facility, the participation foreign credit instrument facility and the bilateral foreign credit instrument facility.
Indebtedness under the Credit Agreement is secured by a first priority pledge and security interest in 100% of the capital stock of our domestic subsidiaries (with certain exceptions) held by SPX or our domestic subsidiary guarantors and 65% of the capital stock of our material first-tier foreign subsidiaries (with certain exceptions). If SPX obtains a corporate credit rating from Moody’s and S&P and such corporate credit rating is less than “Ba2” (or not rated) by Moody’s and less than “BB” (or not rated) by S&P, then SPX and our domestic subsidiary guarantors are required to grant security interests, mortgages and other liens on substantially all of their assets. If SPX’s corporate credit rating is “Baa3” or better by Moody’s or “BBB-” or better by S&P and no defaults then exist, all collateral security is to be released and the indebtedness under the Credit Agreement would be unsecured.
The Credit Agreement requires that SPX maintain:
A Consolidated Interest Coverage Ratio (defined in the Credit Agreement generally as the ratio of consolidated adjusted EBITDA for the four fiscal quarters ended on such date to consolidated cash interest expense for such period) as of the last day of any fiscal quarter of at least 3.50 to 1.00; and
As previously discussed, a Consolidated Leverage Ratio as of the last day of any fiscal quarter of not more than 3.50 to 1.00 (or 4.00 to 1.00 for the four fiscal quarters after certain permitted acquisitions).
The Credit Agreement also contains covenants that, among other things, restrict our ability to incur additional indebtedness, grant liens, make investments, loans, guarantees, or advances, make restricted junior payments, including dividends, redemptions of capital stock, and voluntary prepayments or repurchase of certain other indebtedness, engage in mergers, acquisitions or sales of assets, enter into sale and leaseback transactions, or engage
in certain transactions with affiliates, and otherwise restrict certain corporate activities. The Credit Agreement contains customary representations, warranties, affirmative covenants and events of default.
As previously discussed, weWe are permitted under the Credit Agreement to repurchase our capital stock and pay cash dividends in an unlimited amount if our Consolidated Leverage Ratio is (after giving pro forma effect to such payments) less than 2.75 to 1.00. If our Consolidated Leverage Ratio is (after giving pro forma effect to such payments) greater than or equal to 2.75 to 1.00, the aggregate amount of such repurchases and dividend declarations cannot exceed (A) $50.0$100.0 in any fiscal year plus (B) an additional amount for all such repurchases and dividend declarations made after the effective dateSeptember 1, 2015 equal to the sum of (i) $100.0 plus (ii) a positive amount equal to 50% of cumulative Consolidated Net Income (as defined in the Credit Agreement
generally as consolidated net income subject to certain adjustments solely for the purposes of determining this basket) during the period from the effective dateSeptember 1, 2015 to the end of the most recent fiscal quarter preceding the date of such repurchase or dividend declaration for which financial statements have been (or were required to be) delivered (or, in case such Consolidated Net Income is a deficit, minus 100% of such deficit) plus (iii) certain other amounts.amounts, less our previous usage of such additional amount for certain other investments and restricted junior payments.
At December 31, 2017,2021, we had $314.3$437.8 of available borrowing capacity under our revolving credit facilities after giving effect to $35.7$12.2 reserved for outstanding letters of credit. In addition, at December 31, 2017,2021, we had $16.9$30.3 of available issuance capacity under our foreign credit instrument facilities after giving effect to $183.1$24.7 reserved for outstanding letters of credit.
At December 31, 2017,2021, we were in compliance with all covenants of our Credit Agreement.
Other Borrowings and Financing Activities
Certain of our businesses purchase goods and services under a purchase card programsprogram allowing for payment beyond their normal payment terms. As of December 31, 20172021 and 2016,2020, the participating businesses had $2.8$2.2 and $3.9,$1.7, respectively, outstanding under these arrangements.this arrangement.
We are party to a trade receivables financing agreement, whereby we can borrow, on a continuous basis, up to $50.0. Availability of funds may fluctuate over time given, among other things, changes in eligible receivable balances, but will not exceed the $50.0 program limit. The facility contains representations, warranties, covenants and indemnities customary for facilities of this type. The facility does not contain any covenants that we view as materially constraining to the activities of our business.
In addition, we maintain line of credit facilities in China, India, and South Africa available to fund operations in these regions, when necessary. At December 31, 2017, the aggregate amount of borrowing capacity under these facilities was $20.2, while the aggregate borrowings outstanding were $4.2.
Financial Instruments
We measure our financial assets and liabilities on a recurring basis, and nonfinancial assets and liabilities on a non-recurring basis, at fair value. Fair value is the price that would be received to sell an asset or paid to transfer a liability in an orderly transaction between market participants at the measurement date. We utilize market data or assumptions that we believe market participants would use in pricing the asset or liability, including assumptions about risk and the risks inherent in the inputs to the valuation technique. These inputs can be readily observable quoted prices in active markets for identical assets or liabilities (Level 1), significant other observable inputs (Level 2) or significant unobservable inputs (Level 3).
Our derivative financial assets and liabilities include interest rate swap agreements, forward contracts to manage exposure on contracts with forecasted transactions denominated in non-functional currencies and to manage the risk of transaction gains and losses associated with assets/liabilities denominated in currencies other than the functional currency of certain subsidiaries ("FX forward contracts, FX embedded derivatives,contracts"), and, as related to Transformer Solutions through its date of disposition, forward contracts that manage the exposure on forecasted purchases of commodity raw materials (“commodity contracts”) that are measured at fair value using observable market inputs such as forward rates, interest rates, our own credit risk, and our counterparties’ credit risks. Based on these inputs, the derivative assets and liabilities are classified within Level 2 of the valuation hierarchy. Based on our continued ability to enter into forward contracts, we consider the markets for our fair value instruments active.
As of December 31, 2017,2021, there was no significant impact to the fair value of our derivative liabilities due to our own credit risk as the related instruments are collateralized under our Senior Credit Facilities. Similarly, there was no significant impact to the fair value of our derivative assets based on our evaluation of our counterparties’ credit risk.
We primarily use the income approach, which uses valuation techniques to convert future amounts to a single present amount. Assets and liabilities measured at fair value on a recurring basis are further discussed below.
Interest Rate Swaps
During the second quarter of 2016, we entered intoWe previously maintained interest rate swap agreements (“Swaps”)that matured in March 2021 and effectively converted borrowings under our senior credit facilities to hedgea fixed rate of 2.535%, plus the interest rate risk on our then existing variable rate term loan. Asapplicable margin.
In February 2020, and as a result of amendinga December 2019 amendment that extended the maturity date of our Credit Agreement onsenior credit facilities to December 19, 2017, these17, 2024, we entered into additional interest swap agreements (“Swaps”). The Swaps no longer qualifiedhave a notional amount of $243.7, cover the period from March 2021 to November 2024, and effectively convert borrowings under our senior credit facilities to a fixed rate of 1.061%, plus the applicable margin.
We have designated and are accounting for hedge accounting, resulting in a gain (recorded to “Other expense, net”) in 2017 of $2.7.our interest rate swap agreements as cash flow hedges. As of December 31, 2017, the aggregate notional amount of these Swaps was $162.6. In addition, we have recorded a current asset of $3.3 as of December 31, 2017 to recognize the fair value of these Swaps. As of December 31, 2016,2021 and 2020, the unrealized gain (loss), net of tax, recorded in accumulatedAccumulated other comprehensive income (“AOCI”("AOCI") was $0.7.$0.5 and $(5.9), respectively. In addition, as of December 31, 2021, the fair value of our interest rate swap agreements was $0.6
(with $2.5 recorded as a non-current asset and $1.9 as a current liability), and $7.8 at December 31, 2020 (with $1.4 recorded as a current liability and the remainder in long-term liabilities). Changes in fair value of our interest rate swap agreements are reclassified into earnings as a component of interest expense, when the forecasted transaction impacts earnings.
Currency Forward Contracts
We manufacture and sell our products in a number of countries and, as a result, are exposed to movements in foreign currency exchange rates. Our objective is to preserve the economic value of non-functional currency-denominated cash flows and to minimize the impact of changes as a result of currency fluctuations. Our principal currency exposures relate to the South African Rand, GBPBritish Pound Sterling, and Euro.
From time to time, we enter into FX forward contracts to manage the exposure on contracts with forecasted transactions denominated in non-functional currencies and to manage the risk of transaction gains and losses associated with assets/liabilities denominated in currencies other than the functional currency of certain subsidiaries (“FX forward contracts”). In addition, some of our contracts contain currency forward embedded derivatives (“FX embedded derivatives”), because the currency of exchange is not “clearly and closely” related to the functional currency of either party to the transaction. Certainsubsidiaries. None of our FX forward contracts are designated as cash flow hedges. To the extent these derivatives are effective in offsetting the variability of the hedged cash flows, changes in the derivatives’ fair value are not included in current earnings, but are included in AOCI. These changes in fair value are reclassified into earnings as a component of revenues or cost of products sold, as applicable, when the forecasted transaction impacts earnings. In addition, if the forecasted transaction is no longer probable, the cumulative change in the derivatives’ fair value is recorded as a component of “Other expense, net” in the period in which the transaction is no longer considered probable of occurring. To the extent a previously designated hedging transaction is no longer an effective hedge, any ineffectiveness measured in the hedging relationship is recorded in earnings in the period in which it occurs.
We had FX forward contracts with an aggregate notional amount of $9.0$8.7 and $8.8$6.3 outstanding as of December 31, 20172021 and 2016,2020, respectively, with all of the $9.0$8.7 scheduled to mature in 2018. We also had2022. The fair value of our FX embedded derivatives with an aggregate notional amount of $1.1 and $0.9forward contracts was less than $0.1 at December 31, 20172021 and 2016, respectively, with all of the $1.1 scheduled to mature in 2018. There were no unrealized gains or losses recorded in AOCI related to FX forward contracts as of December 31, 2017 and 2016. The net loss recorded in “Other expense, net” related to FX forward contracts and embedded derivatives totaled $0.4 in 2017, $6.3 in 2016 and $1.2 in 2015.2020.
Commodity Contracts
From time to time, we enterentered into commodity contracts to manage the exposure on forecasted purchases of commodity raw materials. The outstanding notional amounts of commodity contracts were 3.6related solely to Transformer Solutions. As discussed in Note 1, on October 1, 2021, we completed the sale of Transformer Solutions. Immediately prior to the sale, we extinguished the existing commodity contracts and 4.1 poundsreclassified from AOCI a net loss of copper at$0.6 to “Gain (loss) on disposition of discontinued operations, net of tax” within our consolidated statement of operations for the year ended December 31, 20172021. Prior to extinguishment, we designated and 2016, respectively. We designate and accountaccounted for these contractscontracts as cash flow hedges and, to the extent these commodity contracts arewere effective in offsetting the variability of the forecasted purchases, the change in fair value iswas included in AOCI. We reclassify AOCIreclassified amounts associated with our commodity contracts to costout of products soldAOCI when the forecastedforecasted transaction impactsimpacted earnings. As of December 31, 2017 and 2016,2020, the fair valuevalues of these contracts was $1.1 (current asset) and $1.1 (current asset), respectively.a current asset of $2.4. Since these commodity contracts related to our Transformer Solutions business, the amount has been recorded within assets of discontinued operations of our consolidated balance sheet. The unrealized gain, (loss), net of taxes, recorded in AOCI was $0.8 and $0.8$1.5 as of December 31, 2017 and 2016, respectively. We anticipate reclassifying the unrealized gain as of December 31, 2017 to income over the next 12 months.
Other Fair Value Financial Assets and Liabilities
The carrying amounts of cash and equivalents and receivables reported in our consolidated balance sheets approximate fair value due to the short maturity of those instruments.
The fair value of our debt instruments as of December 31, 2017 approximated the related carrying values due primarily to the variable market-based interest rates for such instruments.2020.
Concentrations of Credit Risk
Financial instruments that potentially subject us to significant concentrations of credit risk consist of cash and equivalents, trade accounts receivable, insurance recovery assets associated with asbestos product liability matters, and interest rate swap and foreign currency forward and commodity contracts.
These financial instruments, other than trade accounts receivable, are placed with high-quality financial institutions and insurance companies throughout the world. We periodically evaluate the credit standing of these financial institutions.institutions and insurance companies.
We maintain cash levels in bank accounts that, at times, may exceed federally-insured limits. We have not experienced significant loss, and believe we are not exposed to significant risk of loss, in these accounts.
We have credit loss exposure in the event of nonperformance by counterparties to the above financial instruments, but have no other off-balance-sheet credit risk of accounting loss. We anticipate, however, that counterparties will be able to fully satisfy their obligations under the contracts. We do not obtain collateral or other security to support financial instruments subject to credit risk, but we do monitor the credit standing of counterparties.
Concentrations of credit risk arising from trade accounts receivable are due to selling to customers in a particular industry. Credit risks are mitigated by performing ongoing credit evaluations of our customers’ financial conditions and obtaining collateral, advance payments, or other security when appropriate. No one customer, or group of customers that to our knowledge are under common control, accounted for more than 10% of our revenues for any period presented.
Cash and Other Commitments
Our SeniorBalances under our Credit FacilitiesAgreement are payable in full on December 19, 2022.17, 2024. Our term loan is repayable in quarterly installments of 1.25% of the initial loan amount of $350.0, beginning in the first fiscal quarter of 2019.2021, with the quarterly installments equal to 0.625% of the initial term loan balance of $250.0 during 2021, 1.25% in each of the four quarters of 2022 and 2023, and 1.25% during the first three quarters of 2024. The remaining balance is repayable in full on December 19, 2022.17, 2024.
We use operating leases to finance certain equipment, vehicles and properties. At December 31, 2017,2021, we had $38.3 of$43.7 of future minimum rental payments under operating leases with remaining non-cancelable terms in excess of one year.
Capital expenditures for 2017 totaled $11.0,2021 totaled $9.6, compared to $11.7$15.3 and $16.0$13.5 in 20162020 and 2015,2019, respectively. Capital expenditures in 20172021 related primarilyprimarily to upgrades to manufacturing facilities, including replacement of equipment. We expect 20182022 capital expenditures to approximate $12.0$15.0 to $14.0,$20.0, with a significant portion related to replacement of equipment.
In 2017,2021, we made contributions and direct benefit payments of $18.7$12.3 to our defined benefit pension and postretirement benefit plans. We expect to make $17.4$12.5 of minimum required funding contributions and direct benefit payments in 2018.2022. Our pension plans have not experienced any liquidity difficulties or counterparty defaults due to the volatility in the credit markets. Our pension funds earned asset returns of approximately 8%1.0% in 2017.2021. See Note 911 to our consolidated financial statements for further disclosure of expected future contributions and benefit payments.
On a netnet basis, both from continuing and discontinued operations, we paid $22.9, $4.8net income tax refunds (payments) totaled $5.5, $(7.6), and $51.0 of income taxes for 2017, 2016$(7.0) in 2021, 2020, and 2015,2019, respectively. In 2017,2021, we made paymentspayments of $25.6$22.0 associated with the actual and estimated tax liability for federal, state and foreign tax obligations and received refunds of $2.7. The$27.5. The amount of income taxes that we receive or pay annually is dependent on various factors, including the timing of certain deductions. Deductions and the amount of income taxes can and do vary from year to year.
As of December 31, 2017, except as discussed in Notes 4, 13 and 15 to our consolidated financial statements and in the contractual obligations table below, we did not have any material guarantees, off-balance sheet arrangements or purchase commitments other than the following: (i) $35.7 of certain standby letters of credit outstanding, all of which reduce the available borrowing capacity on our domestic revolving credit facility; (ii) $183.1 of letters of credit outstanding, all of which reduce the available borrowing capacity on our foreign trade facilities; and (iii) approximately $102.4 of surety bonds. In addition, $35.7 of our standby letters of credit relate to self-insurance or environmental matters.year-to-year.
Our Certificate of Incorporation provides that we indemnify our officers and directors to the fullest extent permitted by the Delaware General Corporation Law for any personal liability in connection with their employment or service with us, subject to limited exceptions. While we maintain insurance for this type of liability, the liability could exceed the amount of the insurance coverage.
We continually review each of our businesses in order to determine their long-term strategic fit. These reviews could result in selected acquisitions to expand an existing business or result in the disposition of an existing business. In addition, you should read “Risk Factors,” “Results for Reportable Segments” included in this MD&A, and “Business” for an understanding of the risks, uncertainties and trends facing our businesses.
Off-Balance Sheet Arrangements
As of December 31, 2021, except as discussed in Notes 15 and 17 to our consolidated financial statements and in the contractual obligations table below, we did not have any material guarantees, off-balance sheet arrangements or purchase commitments other than the following: (i) $30.8 of certain standby letters of credit outstanding, all of which relate to self-insurance or environmental matters and $12.2 of which reduce the available borrowing capacity on our domestic revolving credit facility, (ii) $24.7 of letters of credit outstanding, all of which reduce the available borrowing capacity on our foreign trade facilities, and (iii) $87.1 of surety bonds.
Contractual Obligations
The following is a summary of our primary contractual obligations as of December 31, 2017:2021:
| | | | | | | | | | | | | | Total | | Due
Within
1 Year | | Due in
1-3 Years | | Due in
3-5 Years | | Due After
5 Years |
| | Total | | Due Within 1 Year | | Due in 1-3 Years | | Due in 3-5 Years | | Due After 5 Years | |
| Short-term debt obligations | $ | 7.0 |
| | $ | 7.0 |
| | $ | — |
| | $ | — |
| | $ | — |
| |
| Long-term debt obligations | 352.1 |
| | 0.5 |
| | 36.0 |
| | 315.6 |
| | — |
| Long-term debt obligations | $ | 244.8 | | | $ | 13.0 | | | $ | 231.8 | | | $ | — | | | $ | — | |
Pension and postretirement benefit plan contributions and payments(1) | 210.7 |
| | 17.3 |
| | 31.0 |
| | 25.7 |
| | 136.7 |
| Pension and postretirement benefit plan contributions and payments(1) | 177.0 | | | 12.5 | | | 22.5 | | | 19.5 | | | 122.5 | |
Purchase and other contractual obligation(2) | 91.8 |
| | 90.8 |
| | 0.9 |
| | 0.1 |
| | — |
| |
Future minimum operating lease payment(3) | 38.3 |
| | 8.3 |
| | 14.4 |
| | 9.0 |
| | 6.6 |
| |
Purchase and other contractual obligations(2) | | Purchase and other contractual obligations(2) | 145.6 | | | 100.1 | | | 45.5 | | | — | | | — | |
Future minimum operating lease payments(3) | | Future minimum operating lease payments(3) | 43.7 | | | 8.8 | | | 16.6 | | | 7.1 | | | 11.2 | |
| Interest payments | 68.0 |
| | 13.3 |
| | 28.4 |
| | 26.3 |
| | — |
| Interest payments | 21.6 | | | 7.1 | | | 14.5 | | | — | | | — | |
Total contractual cash obligations(4)(5) | $ | 767.9 |
| | $ | 137.2 |
| | $ | 110.7 |
| | $ | 376.7 |
| | $ | 143.3 |
| Total contractual cash obligations(4)(5) | $ | 632.7 | | | $ | 141.5 | | | $ | 330.9 | | | $ | 26.6 | | | $ | 133.7 | |
____________________________
| |
(1)Estimated minimum required pension funding and pension and postretirement benefit payments are based on actuarial estimates using current assumptions for, among other things, discount rates, expected long-term rates of return on plan assets (where applicable), and health care cost trend rates. The expected pension contributions for the U.S. plans in 2021 and thereafter reflect the minimum required contributions under the Pension Protection Act of 2006 and the Worker, Retiree, and Employer Recovery Act of 2008. These contributions do not reflect potential voluntary contributions, or additional contributions that may be required in connection with acquisitions, dispositions or related
plan mergers. See Note 11 to our consolidated financial statements for additional information on expected future contributions and benefit payments. (2)Represents contractual commitments to purchase goods and services at specified dates. (3)Represents rental payments under operating leases with remaining non-cancelable terms in excess of one year. (4)Contingent obligations, such as environmental accruals and those relating to uncertain tax positions generally do not have specific payment dates and accordingly have been excluded from the above table. We believe that within the next 12 months it is reasonably possible that our previously unrecognized tax benefits could decrease up to $5.0. (5)In addition, the above table does not include potential payments under our derivative financial instruments.
(1)
| Estimated minimum required pension funding and pension and postretirement benefit payments are based on actuarial estimates using current assumptions for, among other things, discount rates, expected long-term rates of return on plan assets (where applicable), rate of compensation increases, and health care cost trend rates. The expected pension contributions for the U.S. plans in 2018 and thereafter reflect the minimum required contributions under the Pension Protection Act of 2006 and the Worker, Retiree, and Employer Recovery Act of 2008. These contributions do not reflect potential voluntary contributions, or additional contributions that may be required in connection with acquisitions, dispositions or related plan mergers. See Note 9 to our consolidated financial statements for additional information on expected future contributions and benefit payments. |
| |
(2)
| Represents contractual commitments to purchase goods and services at specified dates. |
| |
(3)
| Represents rental payments under operating leases with remaining non-cancelable terms in excess of one year. |
| |
(4)
| Contingent obligations, such as environmental accruals and those relating to uncertain tax positions generally do not have specific payment dates and accordingly have been excluded from the above table. We believe that within the next 12 months it is reasonably possible that our previously unrecognized tax benefits could decrease by approximately $3.0 to $15.0. |
| |
(5)
| In addition, the above table does not include potential payments under (i) our derivative financial instruments or (ii) the guarantees and bonds associated with Balcke Dürr. |
Critical Accounting Policies and Use of Estimates
The preparation of financial statements in accordance with GAAP requires us to make estimates and assumptions that affect the reported amounts of assets, liabilities, revenues and expenses, and disclosure of contingent assets and liabilities. The accounting policies that we believe are most critical to the portrayal of our financial condition and results of operations, and that require our most difficult, subjective or complex judgments in estimating the effect of inherent uncertainties, are listed below. This section should be read in conjunction with Notes 1 and 2 to our consolidated financial statements, which include a detailed discussion of these and other accounting policies.
Contingent Liabilities
Numerous claims, complaints and proceedings arising in the ordinary course of business have been asserted or are pending against us or certain of our subsidiaries (collectively, “claims”). These claims relate to litigation matters (e.g., class actions, derivative lawsuits and contracts, intellectual property and competitive claims), environmental matters, product liability matters (predominately associated with alleged exposure to asbestos-containing materials), and other risk management matters (e.g., general liability, automobile, and workers’ compensation claims). Additionally, we may become subject to other claims of which we are currently unaware, which may be significant, or the claims of which we are aware may result in our incurring significantly greater loss than we anticipate. While we (and our subsidiaries) maintain property, cargo, auto, product, general liability, environmental, and directors’ and officers’ liability insurance and have acquired rights under similar policies in connection with acquisitions that we believe cover a significant portion of these claims, this insurance may be insufficient or unavailable (e.g., in the case of insurer
insolvency) to protect us against potential loss exposures. Also, while we believe we are entitled to indemnification from third parties for some of these claims, these rights may be insufficient or unavailable to protect us against potential loss exposures.
Our recorded liabilities related to these matters totaled $685.7 (including $641.2 for asbestos product liability matters)$658.8 and $653.5 (including $605.6 for asbestos product liability matters)$575.7 at December 31, 20172021 and 2016,2020, respectively. Of these amounts, $584.3 and $499.8 are included in “Other long-term liabilities” within our consolidated balance sheets at December 31, 2021 and 2020, respectively, with the remainder included in “Accrued expenses.” The liabilities we record for these claimsmatters are based on a number of assumptions, includingincluding historical claims and payment experience and, with respect to asbestos claims, actuarial estimates of the future period during which additional claims are reasonably foreseeable.experience. While we base our assumptions on facts currently known to us, they entail inherently subjective judgments and uncertainties. As a result, our current assumptions for estimating these liabilities may not prove accurate, and we may be required to adjust these liabilities in the future, which could result in charges to earnings. These variances relative to current expectations could have a material impact on our financial position and results of operations.
Our asbestos-related claims are typical in certain of the industries in which we operate or pertain to legacy businesses we no longer operate. It is not unusual in these cases for fifty or more corporate entities to be named as defendants. We vigorously defend these claims, many of which are dismissed without payment, and the significant majority of costs related to these claims have historically been paid pursuant to our insurance arrangements. Our recorded insurance recovery assets associated with the asbestos product liability matters, with such amounts totaling $590.9 and $564.4liabilities related to asbestos-related claims were as follows at December 31, 20172021 and 2016, respectively. These2020:
| | | | | | | | | | | |
| December 31, |
| 2021 | | 2020 |
Insurance recovery assets (1) | $ | 526.2 | | | $ | 496.4 | |
Liabilities for claims (2) | 616.5 | | 535.2 |
(1)Of these amounts $473.6 and $446.4 are included in “Other assets” at December 31, 2021 and 2020, respectively, while the remainder is included in “Other current assets.”
(2)Of these amounts $561.4 and $479.9 are included in “Other long-term liabilities” at December 31, 2021 and 2020, respectively, while the remainder is included in “Accrued expenses.”
The liabilities we record for asbestos-related claims are based on a number of assumptions. In estimating our liabilities for asbestos-related claims, we consider, among other things, the following:
•The number of pending claims by disease type and jurisdiction.
•Historical information by disease type and jurisdiction with regard to:
◦Average number of claims settled with payment (versus dismissed without payment); and
◦Average claim settlement amounts.
•The period over which we can reasonably project asbestos-related claims (currently projecting through 2057).
The following table presents information regarding activity for asbestos-related claims for the years ended December 31, 2021, 2020 and 2019:
| | | | | | | | | | | | | | | | | |
| Year ended December 31 |
| 2021 | | 2020 | | 2019 |
| Pending claims, beginning of year | 9,782 | | 11,079 | | 13,767 |
| Claims filed | 2,826 | | 2,449 | | 3,607 |
| Claims resolved | (2,543) | | (3,746) | | (6,295) |
| Pending claims, end of year | 10,065 | | 9,782 | | 11,079 |
The assets we record for asbestos-related claims represent amounts that we believe we are or will be entitled to recover under agreements we have with insurance companies. The assets we record foramount of these insurance recoveriesassets are based on a number of assumptions, including the continued solvency of the insurers and are subject to a varietyour legal interpretation of uncertainties.our rights for recovery under the agreements we have with the insurers. Our current assumptions for estimating these assets may not prove accurate, and we may be required to adjust these assets in the future, which could result in additional charges to earnings.future. These variances relative to current expectations could have a material impact on our financial position and results of operations.
During the years ended December 31, 2021, 2020 and 2019, our (receipts) payments for asbestos-related claims, net of respective insurance recoveries of $53.9, $35.4, and $47.1, were $(0.3), $19.3 and $13.1, respectively. The year ended December 31, 2021 includes insurance proceeds of $15.0 associated with the settlement of an asbestos insurance coverage matter. A significant increase in claims, costs and/or issues with existing insurance coverage (e.g., dispute with or insolvency of insurer(s)) could have a material adverse impact on our share of future payments related to these matters, and, as a result, have a material impact on our financial position, results of operations and cash flows.
During the years ended December 31, 2021, 2020, and 2019, we recorded charges of $51.2, $21.3, and $10.1, respectively, as a result of changes in estimates associated with the liabilities and assets related to asbestos-related claims. Of these charges, $48.6, $19.2 and $6.3 were reflected in “Income from continuing operations before income taxes” for the years ended December 31, 2021, 2020, and 2019, respectively, and $2.6, $2.1, and $3.8, respectively, were reflected in “Gain (loss) on disposition of discontinued operations, net of tax.”
Large Power Projects in South Africa
The business environment surrounding ourOverview - Since 2008, DBT had been executing on two large power projects in South Africa remains(Kusile and Medupi), on which it has now substantially completed its scope of work. Over such time, the business environment surrounding these projects was difficult, as we haveDBT, along with many other contractors on the projects, experienced delays, cost over-runs, and various other challenges associated with a complex set of contractual relationships among the end customer, prime contractors, various subcontractors (including usDBT and ourits subcontractors), and various suppliers. We currently are involved in a numberDBT's remaining responsibilities relate largely to resolution of claim disputes relating to these challenges. We are pursuing various commercial alternatives for addressing these challenges, in attempt to mitigate our overall financial exposure.
During the third quarterclaims, primarily between itself and one of 2015, we gained additional insight into the path for completing these projects, including our remaining scope, the estimated costs for completing such scope, and our expected recoverability of costs fromits prime contractors, MHI.
The challenges related to the projects have resulted in (i) significant adjustments to our revenue and our subcontractors. In responsecost estimates for the projects, (ii) DBT’s submission of numerous change orders to this new information, we revised our estimates of revenuesthe prime contractors, (iii) various claims and costs associateddisputes between DBT and other parties involved with the projects (e.g., prime contractors, subcontractors, suppliers, etc.), and (iv) the possibility that DBT may become subject to additional claims, which could be significant. It is possible that some outstanding claims may not be resolved until after the prime contractors complete their scopes of work. Our future financial position, operating results, and cash flows could be materially impacted by the resolution of current and any future claims.
Claims by DBT - DBT has asserted claims against MHI of approximately South African Rand 1,000.0 (or $62.6). As DBT prepares these claims for dispute resolution processes, the amounts, along with the characterization, of the claims could change. Of these claims, South African Rand 566.5 (or $35.5), which is inclusive of the amounts awarded in the adjudications referred to below, are currently proceeding through contractual dispute resolution processes and DBT is likely to initiate additional dispute resolution processes. DBT is also pursuing several claims to force MHI to abide by its contractual obligations and provide DBT with certain benefits that MHI may have received from its customer on the projects. These revisions resultedIn addition to existing asserted claims, DBT believes it has additional claims and rights to recovery based on its performance under the contracts with, and actions taken by, MHI. DBT is continuing to evaluate the claims and the amounts owed to it under the contracts based on MHI's failure to comply with its contractual obligations. The amounts DBT may recover for current and potential future claims against MHI are not currently known given (i) the extent of current and potential future claims by MHI against DBT (see below for further discussion) and (ii) the unpredictable nature of any dispute resolution processes that may occur in connection with these current and potential future claims. No revenue has been recorded in the consolidated financial statements with respect to current or potential future claims against MHI.
On July 23, 2020, a dispute adjudication panel issued a ruling in favor of DBT on certain matters related to the Kusile and Medupi projects. The panel (i) ruled that DBT had achieved takeover on 9 of the units; (ii) ordered MHI to return $2.3 of bonds (which have been subsequently returned by MHI); (iii) ruled that DBT is entitled to the return of an increaseadditional $4.3 of bonds upon the completion of certain administrative milestones; (iv) ordered MHI to pay South African Rand 18.4 (or $1.1 at the time of the ruling) in incentive payments for work performed by DBT (which MHI has subsequently paid); and (v) ruled that MHI waived its rights to assert delay damages against DBT on one of the units of the Kusile project. The ruling is subject to MHI’s rights to seek further arbitration in the matter, as provided in the contracts. As such, the incentive payments noted above have not been recorded in our “Loss from continuingconsolidated statements of operations.
On February 22, 2021, a dispute adjudication panel issued a ruling in favor of DBT related to costs incurred in connection with delays on two units of the Kusile project. In connection with the ruling, MHI paid DBT South African Rand 126.6 (or $8.6 at the time of payment). This ruling is subject to MHI’s rights to seek further arbitration in the matter and, thus, the amount awarded has not been reflected in our consolidated statement of operations before income taxes” for the year ended December 31, 20152021. On July 5, 2021, DBT received notice from MHI of $95.0, which is comprisedits intent to seek final and binding arbitration in this matter.
On April 28, 2021, a dispute adjudication panel issued a ruling in favor of a reductionDBT related to costs incurred in revenue of $57.2 and an increase in cost of products sold of $37.8.
Over the pastconnection with delays on two years, we have implemented various initiatives that have reduced the risk associated with our large power projects in South Africa, including more recent steps to accelerate the timeline for completing certain portionsunits of the projects.Medupi project. In addition, significant progress has occurred with regard to the projects, as we have now completed the majority of our contractual scope and expect to complete the remainder by the end of 2019.
During 2017, we experienced higher than expected costs associated with (i) our efforts to accelerate completion of certain scopes of work, (ii) financial and other challenges facing certain of our subcontractors, and (iii) delays and other on-site productivity challenges. As a result, during the second and fourth quarters of 2017, we revised our estimates of revenues and costs associatedconnection with the projects. These revisions resultedruling, MHI paid DBT South African Rand 82.0 (or $6.0 at the time of payment). This ruling is subject to MHI’s rights to seek further arbitration in a charge to “Income (loss) from continuingthe matter and, thus, the amount awarded has not been reflected in our consolidated statement of operations before income taxes” of $52.8 duringfor the year ended December 31, 2017 ($22.92021.
Claims by MHI - On February 26, 2019, DBT received notification of an interim claim consisting of both direct and $29.9, duringconsequential damages from MHI alleging, among other things, that DBT (i) provided defective product and (ii) failed to meet certain project milestones. In September 2020, MHI made a demand on certain bonds issued in its favor by DBT, based solely on these alleged defects, but without further substantiation or other justification (see further discussion below). On December 30, 2020, MHI notified DBT of its intent to take these claims to binding arbitration even though the secondvast majority of these claims has not been brought appropriately before a dispute adjudication board as required under the relevant subcontracts.On June 4, 2021, in connection with the arbitration, DBT received a revised version of the claim. Similar to the interim claim, we believe the vast majority of the damages summarized in the revised claim are unsubstantiated and, fourth quartersthus, any loss for the majority of 2017, respectively)these claims is considered remote. For the remainder of the claims in both the interim notification and the revised
version, which largely appear to be direct in nature (approximately South African Rand 790.0 or $49.5), which is comprised ofDBT has numerous defenses and, thus, we do not believe that DBT has a reduction in revenue of $36.9 ($13.5 and $23.4, during the second and fourth quarters of 2017, respectively) and an increase in cost of products sold of $15.9 ($9.4 and $6.5, during the second and fourth quarters of 2017, respectively).
We recognize revenueprobable loss associated with unapproved change ordersthese claims. In addition, we do not believe MHI has followed the appropriate dispute resolution processes under our agreement and therefore most, if not all, of its claims against DBT are invalid. As such, no loss has been recorded in the consolidated financial statements with respect to these claims. DBT intends to vigorously defend itself against these claims. Although it is reasonably possible that some loss may be incurred in connection with these claims, we currently are unable to estimate the potential loss or range of potential loss associated with these claims due to the extent(i) lack of support provided by MHI for these claims; (ii) complexity of contractual relationships between the related costs have been incurredend customer, MHI, and DBT; (iii) legal interpretation of the amount expectedcontract provisions and application of recovery is probableSouth African law to the contracts; and reasonably estimable. At December 31, 2017, the projected revenues(iv) unpredictable nature of any dispute resolution processes that may occur in connection with these claims.
In April and July 2019, DBT received notifications of intent to claim liquidated damages totaling South African Rand 407.2 (or $25.5) from MHI alleging that DBT failed to meet certain project milestones related to our large power projects in South Africa included approximately $29.0 related tothe construction of the filters for both the Kusile and Medupi projects. DBT has numerous defenses against these claims and, unapproved change orders. Wethus, we do not believe that DBT has a probable loss associated with these amountsclaims. As such, no loss has been recorded in the consolidated financial statements with respect to these claims. Although it is reasonably possible that some loss may be incurred in connection with these claims, we currently are recoverable underunable to estimate the provisionspotential loss or range of potential loss.
MHI has made other claims against DBT totaling South African Rand 176.2 (or $11.0). DBT has numerous defenses against these claims and, thus, we do not believe that DBT has a probable loss associated with these claims. As such, no loss has been recorded in the consolidated financial statements with respect to these claims.
Bonds Issued in Favor of MHI - DBT is obligated with respect to bonds issued by banks in favor of MHI. In September of 2020, MHI made a demand, and received payment of South African Rand 239.6 (or $14.3 at the time of payment), on certain of these bonds. In May 2021, MHI made an additional demand, and received payment of South African Rand 178.7 (or $12.5 at time of payment), on certain of the related contracts and reflect our best estimate of recoverable amounts.
Althoughremaining bonds at such time. In both cases, we believe that our current estimates of revenues and costs relating to these projects are reasonable, it is possible that future revisions of such estimates could have a material effect on our consolidated financial statements.
Noncontrolling Interest in South African Subsidiary
Our South African subsidiary, DBT Technologies (PTY) LTD (“DBT”), has a Black Economic Empowerment shareholder (the “BEE Partner”) that holds a 25.1% noncontrolling interest in DBT. Underfunded the payment as required under the terms of the shareholder agreementbonds and our senior credit agreement. In its demands, MHI purported that DBT failed to carry out its obligations to rectify certain alleged product defects and that DBT failed to meet certain project milestones. DBT denies liability for such allegations and, thus, fully intends to seek, and believes it is legally entitled to, reimbursement of the South African Rand 418.3 (or $26.2) that has been paid. However, given the extent and complexities of the claims between DBT and MHI, reimbursement of the BEE PartnerSouth African Rand 418.3 (or $26.2) is unlikely to occur over the next twelve months. As such, we have reflected the South African Rand 418.3 (or $26.2) as a non-current asset within our consolidated balance sheet as of December 31, 2021.
The remaining bond of $1.8 issued to MHI as a performance guarantee could be exercised by MHI for an alleged breach of DBT's obligation. In the event that MHI were to receive payment on a portion, or all, of the remaining bond, we would be required to reimburse the issuing bank.
In addition to this bond, SPX Corporation has guaranteed DBT’s performance on these projects to the prime contractors, including MHI.
Claim against Surety - On February 5, 2021, DBT received payment of $6.7 on bonds issued in support of performance by one of DBT's sub-contractors. The sub-contractor maintains a right to seek recovery of such amount and, thus, the amount received by DBT has not been reflected in our consolidated statement of operations for the year ended December 31, 2021.
Settlement with the Minority Shareholder of DBT – On October 16, 2019, SPX Technologies (PTY) LTD, (“DBT’s parent company, along with DBT and SPX Technologies”),Corporation, executed an agreement with the BEE Partner had the option to put its ownership interest in DBT to SPX Technologies, the majoritythen minority shareholder of DBT atto settle a redemption amount determined in accordance withput option and other claims between the terms of the shareholder agreement (the “Put Option”). The BEE Partner notified SPX Technologies of its intention to exercise the Put Option and, on July 6, 2016, an Arbitration Tribunal declared that the BEE Partner was entitled to South African Rand 287.3 in connection with the exercise of the Put Option, having not considered an amount due from the BEE Partner underparties for a promissory notetotal payment of South African Rand 30.3 held by SPX Technologies. As a result, we have reflected230.0 (or $15.6 at the net redemptiontime of payment).The difference between the settlement amount (South African Rand 230.0) and the amount previously recorded for the matter of South African Rand 257.0, or South African Rand 27.0 (or $20.9 and $18.5 at December 31, 2017 and 2016, respectively) within “Accrued expenses” on our consolidated balance sheets as$1.8), along with a tax benefit of December 31, 2017 and 2016,$3.8 associated with the related offset recorded to “Paid-in-capital” and “Accumulated other comprehensive income.” In addition, during 2016 we reclassified $38.7 from “Noncontrolling Interests” to “Paid-in capital.” Lastly, under the two-class methodtotal payment of calculating earnings per share, we haveSouth African Rand 230.0, has been reflected as an adjustment of $18.1 to “Net income (loss) attributable to SPX Corporation common shareholders” for the excess redemption amount of the Put Option (i.e., the increase in the redemption amount during the year ended December 31, 2016 in excess of fair value)stockholders” in our calculations of basic and diluted earnings per share for the year ended December 31, 2016.2019.
In August 2016, SPX Technologies applied to the High Court of South Africa (the “Court”) to have the Arbitration Tribunal’s ruling set aside. The Court heard arguments on SPX Technologies application in November 2017. On January 22, 2018, the Court ruled in SPX Technologies favor and set aside the Arbitration Tribunal’s ruling. This ruling by the Court is subject to appeal by the BEE Partner. The BEE Partner has filed for leave to appeal the decision and SPX Technologies will continue to assert all legal defenses available to it.
Beginning in the third quarter of 2016, in connection with our accounting for the redemption of the BEE Partner’s ownership interest in DBT, we discontinued allocating earnings/losses of DBT to the BEE Partner within our consolidated financial statements.
Patent Infringement Lawsuit
Our subsidiary, SPX Cooling Technologies, Inc. (“SPXCT”), is a defendant in a legal action brought by Baltimore Aircoil Company (“BAC”) alleging that a SPXCT product infringes United States Patent No. 7,107,782, entitled “Evaporative Heat Exchanger and Method.” BAC filed suit on July 16, 2013 in the United States District Court for the District of Maryland (the “District Court”) seeking monetary damages and injunctive relief.
On November 4, 2016, the jury for the trial in the District Court found in favor of SPXCT. The verdict by the District Court is currently under appeal by BAC. We believe that we will ultimately be successful in any future judicial processes; however, to the extent we are not successful, the outcome could have a material adverse effect on our financial position, results of operations, and cash flows.
Environmental Matters
We believe that we are in substantial compliance with applicable environmental requirements. We are currently involved in various investigatory and remedial actions at our facilities and at third-party waste disposal sites. It is our policy to accrue for estimated losses from legal actions or claims when events exist that make the realization of the losses or expenses probable and they can be reasonably estimated. Our environmental accruals cover anticipated costs, including investigation, remediation, and
operation and maintenance of clean-up sites. Accordingly, our estimates may change based on future developments, including new or changes in existing environmental laws or policies, differences in costs required to complete anticipated actions from estimates provided, future findings of investigation or remediation actions, or alteration to the expected remediation plans. We expense costs incurred to investigate and remediate environmental issues unless they extend the economic useful lives of related assets. We record liabilities when it is probable that an obligation has been incurred and the amounts can be reasonably estimated. Our estimates are based primarily on investigations and remediation plans established by independent consultants, regulatory agencies and potentially responsible third parties. It is our policy to realize a change in estimates once it becomes probable and can be reasonably estimated. In determining our accruals, we generally do not discount environmental accruals and do not reduce them by anticipated insurance, litigation and other recoveries. We take into account third-party indemnification from financially viable parties in determining our accruals where there is no dispute regarding the right to indemnification.
Self-Insured Risk Management Matters
We are self-insured for certain of our workers’ compensation, automobile, product and general liability, disability and health costs, and we believe that we maintain adequate accruals to cover our retained liability. Our accruals for self-insurance liabilitiesrisk management matters are determined by us, are based on claims filed and an estimate of claims incurred but not yet reported, and generally are not discounted. We consider a number of factors, including third-party actuarial valuations, when making these determinations. We maintain third-party stop-loss insurance policies to cover certain liability costs in excess of predetermined retained amounts; however, this insurance may be insufficient or unavailable (e.g., because of insurer insolvency) to protect us against potential loss exposures. The key assumptions considered in estimating the ultimate cost to settle reported claims and the estimated costs associated with incurred but not yet reported claims include, among other things, our historical and industry claims experience, trends in health care and administrative costs, our current and future risk management programs, and historical lag studies with regard to the timing between when a claim is incurred versus when it is reported.
Long-Term ContractRevenue Recognition
We recognize revenue in accordance with Accounting Standards Codification 606, which requires revenue to be recognized over-time or at a point in time.
Certain
Most of our businesses primarily withinrecognize revenue at a point in time as satisfaction of the Engineered Solutions reportable segment,related performance obligations occur at the time of shipment or delivery, while certain of our businesses recognize revenues and profits from long-term construction/installation contracts under the percentage-of-completion method of accounting. The percentage-of-completion method requires estimates of future revenuesrevenue and costs overfor long-term contracts over-time.
The revenue for these long-term contracts is recorded based on the full termpercentage of product delivery. We measure the percentage-of-completion principally by the contract costs incurred to date as a percentage offor each contract to the estimated total costs for thatsuch a contract at completion. In 2017, 20162021, 2020, and 2015,2019, we recognized $255.5, $336.1$142.4, $164.0 and $361.8$135.1, respectively, of revenues under the percentage-of-completion method, respectively.
such method. We record any provision for estimated losses on uncompleted long-term contracts in the period in which the losses are determined. In the case of customer
Our long-term contracts often include unapproved change orders and claims. We include in our contract estimates additional revenue for uncompleted long-term contracts,unapproved change orders or claims when we include estimated recoveriesbelieve we have an enforceable right to the unapproved change order or claim and the amount can be reliably estimated. In evaluating these criteria, we consider the contractual/legal basis for work performed in forecasting ultimate profitabilitythe claim, the cause of any additional costs incurred, the reasonableness of those costs, and the objective evidence available to support the claim. These estimates are also based on these contracts.historical award experience. Due to uncertainties inherent in the estimation process, it is reasonably possible that the ultimate revenues and completion costs on our long-term contracts, including those arising from contract penalty provisions and final contract settlements, will be revised during the duration of athe contract. These revisions torevised revenues and costs and income are recognized in the period in which the revisions are determined.
Our estimation process for determining revenues and costs for our long-term contracts accounted for under the percentage-of-completion method is based upon (i) our historical experience, (ii) the professional judgment and knowledge of our engineers, project managers, and operations and financial professionals, and (iii) an assessment of the key underlying factors (see below) that impact the revenues and costs of our long-term contracts. Each long-term contract is unique, but typically similar enough to other contracts that we can effectively leverage our experience. .
As our long-term contracts generally range from ninesix to eighteen months in duration, we typically reassess the estimated revenues and costs of these contracts on a quarterly basis, but may reassess more often as situations warrant. We record changes in estimates of revenues and costs when identified using the cumulative catch-up method prescribed under the Revenue Recognition Topic of the Codification.method.
We believe the underlying factors used to estimate our long-term contracts costs to complete and percentage-of-completion are sufficiently reliable to provide a reasonable estimate of revenue and profit; however, due to the length of time over
which revenues are generated and costs are incurred, along with the judgment required in developing the underlying factors, the variability of revenue and cost can be significant. Factors that may affect revenue and costs relating to long-term contracts include, but are not limited to, the following:
Sales Price Incentives and Sales Price Escalation Clauses — Sales price incentives and sales price escalations that are reasonably assured and reasonably estimable are recorded over the performance period of the contract. Otherwise, these amounts are recorded when awarded.
•Cost Recovery for Product Design Changes and Claims — On occasion, design specifications may change during the course of the contract. Any additional costs arising from these changes may be supported by change orders, or we may submit a claim to the customer. Change orders and claims related to design changes are accounted for as described above. See below for our accounting policies related to claims.
•Material Availability and Costs — Our estimates of material costs generally are based on existing supplier relationships, adequate availability of materials, prevailing market prices for materials, and, in some cases, long-term supplier contracts. Changes in our supplier relationships, delays in obtaining materials, or changes in material prices can have a significant impact on our cost and profitability estimates.
•Use of Subcontractors — Our arrangements with subcontractors are generally based on fixed prices; however, our estimates of the cost and profitability can be impacted by subcontractor delays, customer claims arising from subcontractor performance issues, or a subcontractor’s inability to fulfill its obligations.
•Labor Costs and Anticipated Productivity Levels — Where applicable, we include the impact of labor improvements in our estimation of costs, such as in cases where we expect a favorable learning curve over the duration of the contract. In these cases, if the improvements do not materialize, costs and profitability could be adversely impacted. Additionally, to the extent we are more or less productive than originally anticipated, estimated costs and profitability may also be impacted.
•Effect of Foreign Currency Fluctuations — Fluctuations between currencies in which our long-term contracts are denominated and the currencies under which contract costs are incurred can have an impact on profitability. When the impact on profitability is potentially significant, we may enter into FX forward contracts or prepay certain vendors for raw materials to manage the potential exposure. See Note 1214 to our consolidated financial statements for additional details on our FX forward contracts.
Costs and estimated earningsIn some cases, the timing of revenue recognition, particularly for revenue recognized over time, differs from when such amounts are invoiced to customers, resulting in excess of billings on uncompleted contracts arise when revenues have been recorded buta contract asset (revenue recognition precedes the amounts have not been billed under the termsinvoicing of the contracts. These amountsrelated revenue amount) or a contract liability (payment from the customer precedes recognition of the related revenue amount). Contract assets are billed torecoverable from customers based upon various measures of performance, including achievement of certain milestones, completion of specifiedspecific units, or completion of the contract.
We periodically make claims against customers, suppliers and subcontractors associated with alleged non-performance and other disputes over contractual terms. Claims relatedIn contracts where a portion of the price may vary, we estimate the variable consideration at the amount to long-term contracts are recognized as additional revenues or as a reduction of costs only afterwhich we have determined that collectionexpect to be entitled, which is included in the transaction price to the extent it is probable that a significant reversal of cumulative revenue recognized will not occur. We analyze the risk of a significant revenue reversal and, if necessary, constrain the amount is reasonably estimable. Claims made by us may involve negotiationof variable consideration recognized in order to mitigate this risk.
See Note 1 and in certain cases, litigation or other dispute-resolution processes. In the event we incur litigation or other dispute-resolution costs in connection with claims, these costs are expensed as incurred, although we may seek5 to recover these costs. Claims against us are recognized when a loss is considered probable and amounts are reasonably estimable.our consolidated financial statements for further information on our revenue recognition policies.
Impairment of Goodwill and Indefinite-Lived Intangible Assets
Goodwill and indefinite-lived intangible assets are not amortized, but instead are subject to annual impairment testing. We review goodwill and indefinite-lived intangible assets for impairment annually during the fourth quarter and continually assess whether a triggering event has occurred to determine whether the carrying value exceeds the implied fair value. We monitor the results of each of our reporting units as a means of identifying trends and/or matters that may impact their financial results and, thus, be an indicator of a potential impairment. The trends and/or matters that we specifically monitor for each of our reporting units are as follows:
•Significant variances in financial performance (e.g., revenues, earnings and cash flows) in relation to expectations and historical performance;
•Significant changes in end markets or other economic factors;
•Significant changes or planned changes in our use of a reporting unit’s assets; and
•Significant changes in customer relationships and competitive conditions.
The identification and measurement of goodwill impairment involves the estimation of the fair value of reporting units. We have the option to assess impairment through a qualitative assessment, which includes factors such as general economic conditions, negative developments in equity and credit markets, adverse changes in the markets in which a reporting unit operates, increases in input costs that have a negative effect on earnings and cash flows, or a trend of negative or declining cash flows over multiple periods, among others. When a potential impairment is indicated, we perform our impairmentquantitative testing by
comparing the estimated fair value of the reporting unit to the carrying
value of the reported net assets, with suchassets. Under our quantitative testing, occurring during the fourth quarter of each year in conjunction with our annual financial planning process (or more frequently if impairment indicators arise), based primarily on events and circumstances existing as of the end of the third quarter. Fairfair value is generally based on the income approach using a calculation of discounted cash flows, based on the most recent financial projections for the reporting units. The revenue growth rates included in the financial projections are our best estimates based on current and forecasted market conditions, and the profit margin assumptions are projected by each reporting unit based on current cost structure and, when applicable, anticipated net cost reductions.
The calculation of fair value for our reporting units incorporates many assumptions including future growth rates, profit margin and discount factors. Changes in economic and operating conditions impacting these assumptions could result in impairment charges in future periods.
After performing our qualitative assessment during the fourth quarter of 2021, we concluded that, with the exception of our Cues and ULC reporting units, it was not more likely than not that the fair values of our reporting units were less than their respective carrying values and, therefore, did not perform a quantitative analysis on these reporting units. Based on our annual goodwill impairment testing in 2017,quantitative review of the Cues and ULC reporting units during the fourth quarter of 2021, we determinedconcluded that the estimated fair value of eachULC, after impairment charges of our reporting units$5.2, approximates the carrying value of its net assets, and the estimated fair value of Cues exceeded the carrying value of theirits respective net assets by 30%. The total goodwill for ULC was $12.0 as of December 31, 2021. A change in assumptions used in ULC's quantitative analysis (e.g., projected revenues and profit growth rates, discount rates, industry price multiples, etc.) could result in the reporting unit's estimated fair value being less than the carrying value of its net assets. In addition to ULC, the fair value of Sealite, ECS and Cincinnati Fan, acquisitions over 100%.the past 12 months, approximate their carrying value. If ULC, Sealite, ECS or Cincinnati Fan are unable to achieve their respective current financial forecast, we may be required to record an impairment charge in a future period related to their respective goodwill.
We perform our annual trademarks impairment testing during the fourth quarter, or on a more frequent basis if there are indications of potential impairment. The fair values of our trademarks are determined by applying estimated royalty rates to projected revenues, with the resulting cash flows discounted at a rate of return that reflects current market conditions. The basis for these projected revenues is the annual operating plan for each of the related businesses, which is prepared in the fourth quarter of each year. In connection with the annual impairment testing of our trademarks during the fourth quarters of 2021 and 2020, we recorded impairment charges of $0.5 and $0.7, respectively, related to certain of these trademarks
See Note 810 to our consolidated financial statements for additional details.
Employee Benefit Plans
Defined benefit plans cover a portion of our salaried and hourly paid employees, including certain employees in foreign countries. Additionally, domestic postretirement plans provide health and life insurance benefits for certain retirees and their dependents. We recognize changes in the fair value of plan assets and actuarial gains and losses into earnings during the fourth quarter of each year, unless earlier remeasurement is required, as a component of net periodic benefit expense. The remaining components of pension/postretirement expense, primarily service and interest costs and expected return on plan assets, are recorded on a quarterly basis.
Our pension plans have not experienced any significant impact on liquidity or counterparty exposure due to the volatility in the credit markets.
The costs and obligations associated with these plans are determined based on actuarial valuations. The critical assumptions used in determining these related expenses and obligations are discount rates and healthcare cost projections. These critical assumptions are calculated based on company data and appropriate market indicators, and are evaluated at least annually by us in consultation with outside actuaries. Other assumptions involving demographic factors such as retirement patterns mortality, turnover and the rate of increase in compensation levelsmortality, are evaluated periodically and are updated to reflect our experience and expectations for the future. While management believes that the assumptions used are appropriate, actual results may differ.
The discount rate enables us to state expected future cash flows at a present value on the measurement date. This rate is the yield on high-quality fixed income investments at the measurement date. A lower discount rate increases the present value of benefit obligations and increases pension expense. Including the effects of recognizing actuarial gains and losses into earnings as described above, a 50 basis point decrease in the discount rate for our domestic plans would have increased our 20172021 pension expense by approximately $17.9, $16.6, and a 50 basis point increase in the discount rate would have decreased our 20172021 pension expense by approximately $16.3.$15.3.
The trend in healthcare costs is difficult to estimate,estimate, and it can significantly impact our postretirement liabilities and costs. The healthcare cost trend rate for 2018,2021, which is the weighted-average annual projected rate of increase in the per capita cost of covered benefits, is 7.25%6.3%. This rate is assumed to decrease to 5.0% by 2027 and then remain at that level. Including the effects of recognizing actuarial gains and losses into earnings as described above, a 100 basis point increase in the healthcare cost trend rate would have increased our 2017 postretirement expense by approximately $1.4, and a 100 basis point decrease in the healthcare cost trend rate would have decreased our 2017 postretirement expense by approximately $1.6.
See Note 911 to our consolidated financial statements for further information on our pension and postretirement benefit plans.
Income Taxes
We record our income taxes based on the Income Taxes Topic of the Codification, which includes an estimate of the amount of income taxes payable or refundable for the current year and deferred income tax liabilities and assets for the future tax consequences of events that have been recognized in our consolidated financial statements or tax returns.
Deferred tax assets and liabilities reflect the net tax effects of temporary differences between the carrying amounts of assets and liabilities for financial reporting purposes and the amounts used for income tax purposes. We periodically assess the realizability of deferred tax assets and the adequacy of deferred tax liabilities, including the results of local, state, federal or foreign statutory tax audits or estimates and judgments used.
Realization of deferred tax assets involves estimates regarding (i) the timing and amount of the reversal of taxable temporary differences, (ii) expected future taxable income, and (iii) the impact of tax planning strategies. We believe that it is more likely than not that we will not realize the benefit of certain deferred tax assets and, accordingly, have established a valuation allowance against them. In assessing the need for a valuation allowance, we consider all available positive and negative evidence, including past operating results, projections of future taxable income and the feasibility of and potential changes to ongoing tax planning strategies. The projections of future taxable income include a number of estimates and assumptions regarding our volume, pricing and costs. Although realization is not assured for the remaining deferred tax assets, we believe it is more likely than not that the remaining deferred tax assets will be realized through future taxable earnings or alternative tax strategies. However, deferred tax assets could be reduced in the near term if our estimates of taxable income are significantly reduced or tax strategies are no longer viable.
The amount of income tax that we pay annually is dependent on various factors, including the timing of certain deductions and ongoing audits by federal, state and foreign tax authorities, which may result in proposed adjustments. We perform reviews of our income tax positions on a quarterly basis and accrue for potential uncertain tax positions. Accruals for these uncertain tax positions are recordedclassified as “Income taxes payable” and “Deferred and other income taxes” in our consolidated balance sheets based on an expectation as to the timing of when the matter will be resolved. As events change or resolutions occur, these accruals are adjusted, such as in the case of audit settlements with taxing authorities. We believe we have adequately provided for any reasonably foreseeable outcome related to these matters.
Our future results may include favorable or unfavorable adjustments to our estimated tax liabilities due to closure of income tax examinations, statute expirations, new regulatory or judicial pronouncements, changes in tax laws, changes in projected levels of taxable income, future tax planning strategies, or other relevant events. See Note 1012 to our consolidated financial statements for additional details regarding our uncertain tax positions.
Parent Guarantees and Bonds Associated with Balcke Dürr
As discussed in Note 1 to our consolidated financial statements, in connection with the sale of Balcke Dürr, we remain contingently obligated under existing parent company guarantees and bank and surety bonds which totaled approximately Euro 79.0 and Euro 79.0, respectively, at the time of sale (and Euro 76.1 and Euro 47.9, respectively, at December 31, 2017). We have accounted for our contingent obligation in accordance with the Guarantees Topic of the Codification, which required that we record a liability for the estimated fair value of the parent company guarantees and the bonds in connection with the accounting for the sale of Balcke Dürr. We estimated the fair value of the parent company guarantees and bank and surety bonds considering the probability of default by Balcke Dürr and an estimate of the amount we would be obligated to pay in the event of a default (unobservable inputs - Level 3). In addition, under the related purchase agreement, Balcke Dürr provided cash collateral and mutares AG provided a partial guarantee in the event any of the parent company guarantees or bonds are called. We recorded an asset for the estimated fair value of the cash collateral provided by Balcke Dürr and the partial guarantee provided by mutares AG, with the estimated fair values based on the terms and conditions and relative risk associated with each of these securities. By way of an offset to “Other expense, net,” we are reducing the liability and amortizing the asset, with the reduction of the liability generally to occur at the earlier of the completion of the related underlying project milestones or the expiration of the guarantees or bonds, and the amortization of the asset to occur based on the expiration terms of each of the securities. We will continue to evaluate the adequacy of the recorded liability and will record an adjustment to the liability if we conclude that it is probable that we will be required to fund an amount greater than what is recorded. See Notes 4 and 15 to our consolidated financial statements for further information.
New Accounting Pronouncements
See Note 3 to our consolidated financial statements for a discussion of recent accounting pronouncements.
ITEM 7A. Quantitative and Qualitative Disclosures about Market Risk
(All currency amounts are in millions)
We are exposed to market risk related to changes in interest rates, foreign currency exchange rates and commodity raw material prices, and we selectively use financial instruments to manage these risks. We do not enter into financial instruments for speculative or trading purposes; however, these instruments may be deemed speculative if the future cash flows originally hedged are no longer probable of occurring as anticipated. Our currency exposures vary, but are primarily concentrated in the South African Rand, GBP,British Pound Sterling, and Euro. We generally do not hedge currency translation exposures. Our exposures for commodity raw materials vary, with the highest concentration relating to steel copper and oil. See Note 1214 to our consolidated financial statements for further details.
The following table provides information, as of December 31, 2017,2021, about our primary outstanding debt obligations and presents principal cash flows by expected maturity dates, weighted-average interest rates and fair values.
| | | | | | Expected Maturity Date |
| | | | | 2022 | | 2023 | | 2024 | | 2025 | | Thereafter | | Total | | Fair Value |
| Senior Credit Facilities | | Senior Credit Facilities | | $ | 12.5 | | | $ | 12.5 | | | $ | 218.7 | | | $ | — | | | $ | — | | | $ | 243.7 | | | $ | 243.7 | |
| Average interest rate | | Average interest rate | | | | | | | | | | | | 1.5 | % | | |
| | | | Expected Maturity Date | |
| | 2018 | | 2019 | | 2020 | | 2021 | | Thereafter | | Total | | Fair Value | |
| Term loan | $ | — |
| | $ | 17.5 |
| | $ | 17.5 |
| | $ | 17.5 |
| | $ | 297.5 |
| | $ | 350.0 |
| | $ | — |
| |
| Average interest rate | |
| | |
| | |
| | |
| | |
| | 3.2 | % | | |
| |
We believe that cash and equivalents, cash flows from operations, and availability under revolving credit facilities and our trade receivables financing arrangement will be sufficient to fund working capital needs, planned capital expenditures, other operational cash requirements and required debt service obligations.
WeAt December 31, 2021, we had interest rate swap agreementsswaps with an aggregatea notional amount of $162.6 at December 31, 2017.$243.7 that cover the period from March 2021 to November 2024. The fair value of the Swapsthese swaps was $3.3 (recorded$0.6 at December 31, 2021, with $2.5 recorded as a non-current asset and $1.9 as a current asset)liability.
From time to time, we enter into FX forward contracts to manage the exposure on contracts with forecasted transactions denominated in non-functional currencies and to manage the risk of transaction gains and losses associated with assets/liabilities denominated in currencies other than the functional currency of certain subsidiaries. None of our FX forward contracts are designated as of December 31, 2017.
cash flow hedges. We had FX forward contracts with an aggregate notional amount of $9.0$8.7 at December 31, 2017,2021, with all of the $9.0 $8.7 scheduled to mature in 2018. We also had FX embedded derivatives with an aggregate notional amount of $1.1 at December 31, 2017, with all of the $1.1 scheduled to mature in 2018.2022. The aggregate fair value of our FX forward contracts and FX embedded derivatives was $0.4 (recorded as a current liability) as of December 31, 2017.
We had commodity contracts with an outstanding notional amount of 3.6 pounds of copperless than $0.1 at December 31, 2017. The fair value of these contracts was $1.1 (recorded as a current asset) as of December 31, 2017.2021.
ITEM 8. Financial Statements And Supplementary Data
SPX Corporation and Subsidiaries
Index To Consolidated Financial Statements
December 31, 2017
2021 |
| | | | |
| Page |
| SPX Corporation and Subsidiaries | |
| |
| Consolidated Financial Statements: | |
| |
| |
| |
| |
| |
| |
All schedules are omitted because they are not applicable, not required or because the required information is included in our consolidated financial statements or notes thereto.
REPORT OF INDEPENDENT REGISTERED PUBLIC ACCOUNTING FIRM
To the Shareholdersstockholders and the Board of Directors of SPX Corporation:Corporation
Opinion on the Financial Statements and Financial Highlights
We have audited the accompanying consolidated balance sheets of SPX Corporation and subsidiaries (the "Company") as of December 31, 20172021 and 2016,2020, the related consolidated statements of operations, comprehensive income, (loss),stockholders' equity, and cash flows, for each of the three years in the period ended December 31, 2017,2021, and the related notes (collectively referred to as the "financial statements"). In our opinion, the financial statements present fairly, in all material respects, the financial position of the Company as of December 31, 20172021 and 2016,2020, and the results of its operations and its cash flows for each of the three years in the period ended December 31, 2017,2021, in conformity with accounting principles generally accepted in the United States of America.
We have also audited, in accordance with the standards of the Public Company Accounting Oversight Board (United States) (PCAOB), the Company's internal control over financial reporting as of December 31, 2017,2021, based on criteria established in Internal Control -— Integrated Framework (2013) issued by the Committee of Sponsoring Organizations of the Treadway Commission and our report dated February 21, 2018,25, 2022, expressed an unqualifiedadverse opinion on the Company's internal control over financial reporting.reporting because of a material weakness.
Change in Accounting Principle
As discussed in Note 1 to the consolidated financial statements, the Company elected to change its method of accounting for inventory from the last-in, first-out (“LIFO”) cost method to the first-in, first-out (“FIFO”) cost method which has been retrospectively applied to the consolidated financial statements for the years ended December 31, 2021, 2020, and 2019.
Basis for Opinion
These financial statements are the responsibility of the Company's management. Our responsibility is to express an opinion on the Company's financial statements based on our audits. We are a public accounting firm registered with the PCAOB and are required to be independent with respect to the Company in accordance with the U.S. federal securities laws and the applicable rules and regulations of the Securities and Exchange Commission and the PCAOB.
We conducted our audits in accordance with the standards of the PCAOB. Those standards require that we plan and perform the audit to obtain reasonable assurance about whether the financial statements are free of material misstatement, whether due to error or fraud. Our audits included performing procedures to assess the risks of material misstatement of the financial statements, whether due to error or fraud, and performing procedures that respond to those risks. Such procedures included examining, on a test basis, evidence regarding the amounts and disclosures in the financial statements. Our audits also included evaluating the accounting principles used and significant estimates made by management, as well as evaluating the overall presentation of the financial statements. We believe that our audits provide a reasonable basis for our opinion.
Emphasis
Critical Audit Matters
The critical audit matters communicated below are matters arising from the current-period audit of a Matter
As discussed in Note 1the financial statements that were communicated or required to be communicated to the consolidatedaudit committee and that (1) relate to accounts or disclosures that are material to the financial statements and (2) involved our especially challenging, subjective, or complex judgments. The communication of critical audit matters does not alter in any way our opinion on September 26, 2015, the Company completedfinancial statements, taken as a whole, and we are not, by communicating the spin-off of SPX FLOW, Inc. through a distributioncritical audit matters below, providing separate opinions on the critical audit matters or on the accounts or disclosures to which they relate.
Contingent Liabilities and Other Matters — Large Power Projects in South Africa — Refer to Notes 2 and 15 to the financial statements
Critical Audit Matter Description
Since 2008, DBT Technologies (PTY) LTD (“DBT”) (South African subsidiary of the sharesCompany) had been executing on two large power projects in South Africa (Kusile and Medupi), which it has now substantially completed its scope of SPX FLOW, Inc.work. Over such time, the business environment surrounding these projects was difficult, as DBT, along with many other contractors on the projects, experienced delays, cost over-runs, and various other challenges associated with a complex set of contractual relationships among the end customer, prime contractors, various subcontractors (including DBT and its subcontractors), and various suppliers. These matters resulted in claims and disputes between DBT and other parties involved with the projects, including allegations that DBT provided defective product and failed to meet certain project milestones. It is the Company’s policy to accrue for estimated losses from legal actions or claims when events exist that make the realization of the losses probable and they can be reasonably estimated. The Company does not believe it has probable losses associated with these claims and disputes.
We identified the South African power project claims and disputes as a critical audit matter because the evaluation of the probability of potential outcomes of these various claims and disputes and related disclosures involves significant judgment by management. This required a high degree of auditor judgment and an increased extent of effort when evaluating the Company’s legal and accounting positions and related disclosures.
How the Critical Audit Matter Was Addressed in the Audit
Our audit procedures related to the South African power project claims and disputes included the following, among others:
•We tested the effectiveness of controls related to the South African power project claims and disputes.
•We obtained and evaluated legal confirmations from the Company’s internal and external counsels.
•We held discussions with the Company’s internal and external counsels to determine the status of the South African power project claims and disputes, the contractual provisions for settlement or other legal resolution, and their awareness of any pending or threatened litigation, claims, and assessments omitted.
•We read minutes of meetings of the Board of Directors and its committees and conducted public domain searches for evidence of unrecorded loss contingencies or contradictory evidence related to the Company’s stockholders. The operating resultspositions related to the South African power project claims and disputes.
•We evaluated the accuracy and completeness of SPX FLOW, Inc. have been presented as discontinued operationsthe Company’s disclosures in the 2015 consolidated financial statements.statements for consistency with our knowledge of matters related to the South African power projects claims and disputes.
Contingent Liabilities and Other Matters — Asbestos Product Liabilities and Insurance Recovery Assets — Refer to Notes 2 and 15 to the financial statements
Critical Audit Matter Description
The Company maintains liabilities for asbestos-related claims. These claims are largely offset by insurance recovery assets. Recorded asbestos product liabilities are based on a number of assumptions, including historical claims and payment experience, and actuarial estimates of the future period during which additional claims are reasonably foreseeable. Insurance recovery assets are based on certain assumptions, including the continued solvency of the insurers and legal interpretation of rights for recovery under the insurance policies.
We identified asbestos product liabilities and insurance recovery assets as a critical audit matter given the subjectivity of estimating projected claims, the projected settlement values of reported and unreported claims, the complexity of determining the associated insurance recovery assets, and a material weakness related to the insurance recovery assets as described in “Management's Report on Internal Control Over Financial Reporting”. This required a high degree of auditor judgment and an increased extent of effort, including the need to involve our actuarial and insurance specialist, when performing audit procedures to evaluate the reasonableness of the asbestos product liabilities and the associated insurance recovery assets.
How the Critical Audit Matter Was Addressed in the Audit
Our audit procedures related to asbestos product liabilities and insurance recovery assets included the following, among others:
•We tested the effectiveness of controls related to asbestos product liabilities.
•We evaluated the methods and assumptions used by management to estimate the asbestos product liabilities by testing the underlying data that served as the basis for the actuarial estimates, including historical claims and payment experience, to test that the inputs to the actuarial estimates were complete and accurate.
•With the assistance of our actuarial and insurance specialist, we:
◦Developed independent estimates of the asbestos product liabilities and compared our estimates to management’s estimates.
◦Assessed the ongoing financial solvency of insurance carriers and the recoverability of the recorded insurance recovery assets.
•We independently confirmed a selection of insurance policies directly with insurance carriers.
•We independently confirmed a selection of defense costs directly with external legal counsel.
•We developed an independent expectation of the insurance recovery assets and compared our estimates to management’s estimates and recalculated the insurance recovery assets for entities under coverage-in-place agreements.
/s/ Deloitte & Touche LLP
Charlotte, North Carolina
February 21, 2018
25, 2022
We have served as the Company’s auditor since 2002.
SPX Corporation and Subsidiaries
Consolidated Statements of Operations
(in millions, except per share amounts)
|
| | | | | | | | | | | |
| | Year ended December 31, |
| | 2017 | | 2016 | | 2015 |
| Revenues | $ | 1,425.8 |
| | $ | 1,472.3 |
| | $ | 1,559.0 |
|
| Costs and expenses: | | | | | |
| Cost of products sold | 1,095.6 |
| | 1,096.5 |
| | 1,283.1 |
|
| Selling, general and administrative | 282.3 |
| | 301.0 |
| | 387.8 |
|
| Intangible amortization | 0.6 |
| | 2.8 |
| | 5.2 |
|
| Impairment of intangible assets | — |
| | 30.1 |
| | — |
|
| Special charges, net | 2.7 |
| | 5.3 |
| | 5.1 |
|
| Gain on contract settlement | 10.2 |
| | — |
| | — |
|
| Gain on sale of dry cooling business | — |
| | 18.4 |
| | — |
|
| Operating income (loss) | 54.8 |
| | 55.0 |
| | (122.2 | ) |
| Other expense, net | (2.0 | ) | | (0.3 | ) | | (10.0 | ) |
| Interest expense | (17.1 | ) | | (14.8 | ) | | (22.0 | ) |
| Interest income | 1.3 |
| | 0.8 |
| | 1.3 |
|
| Loss on amendment/refinancing of senior credit agreement | (0.9 | ) | | (1.3 | ) | | (1.4 | ) |
| Income (loss) from continuing operations before income taxes | 36.1 |
| | 39.4 |
| | (154.3 | ) |
| Income tax (provision) benefit | 47.9 |
| | (9.1 | ) | | 2.7 |
|
| Income (loss) from continuing operations | 84.0 |
| | 30.3 |
| | (151.6 | ) |
| Income (loss) from discontinued operations, net of tax | — |
| | (16.6 | ) | | 39.8 |
|
| Gain (loss) on disposition of discontinued operations, net of tax | 5.3 |
| | (81.3 | ) | | (5.2 | ) |
| Income (loss) from discontinued operations, net of tax | 5.3 |
| | (97.9 | ) | | 34.6 |
|
| Net income (loss) | 89.3 |
| | (67.6 | ) | | (117.0 | ) |
| Less: Net loss attributable to noncontrolling interests | — |
| | (0.4 | ) | | (34.3 | ) |
| Net income (loss) attributable to SPX Corporation common shareholders | 89.3 |
| | (67.2 | ) | | (82.7 | ) |
| Adjustment related to redeemable noncontrolling interest (Note 13) | — |
| | (18.1 | ) | | — |
|
Net income (loss) attributable to SPX Corporation common shareholders after adjustment related to redeemable noncontrolling interest | $ | 89.3 |
| | $ | (85.3 | ) | | $ | (82.7 | ) |
| | | | | | |
| Amounts attributable to SPX Corporation common shareholders after adjustment related to redeemable noncontrolling interest: | | | | | |
| Income (loss) from continuing operations, net of tax | $ | 84.0 |
| | $ | 12.6 |
| | $ | (118.2 | ) |
| Income (loss) from discontinued operations, net of tax | 5.3 |
| | (97.9 | ) | | 35.5 |
|
| Net income (loss) | $ | 89.3 |
| | $ | (85.3 | ) | | $ | (82.7 | ) |
| Basic income (loss) per share of common stock: | | | | | |
| Income (loss) from continuing operations attributable to SPX Corporation common shareholders after adjustment related to redeemable noncontrolling interest | $ | 1.98 |
| | $ | 0.30 |
| | $ | (2.90 | ) |
| Income (loss) from discontinued operations attributable to SPX Corporation common shareholders | 0.13 |
| | (2.35 | ) | | 0.87 |
|
| Net income (loss) per share attributable to SPX Corporation common shareholders after adjustment related to redeemable noncontrolling interest | $ | 2.11 |
| | $ | (2.05 | ) | | $ | (2.03 | ) |
| Weighted-average number of common shares outstanding — basic | 42.413 |
| | 41.610 |
| | 40.733 |
|
| Diluted income (loss) per share of common stock: | | | | | |
| Income (loss) from continuing operations attributable to SPX Corporation common shareholders after adjustment related to redeemable noncontrolling interest | $ | 1.91 |
| | $ | 0.30 |
| | $ | (2.90 | ) |
| Income (loss) from discontinued operations attributable to SPX Corporation common shareholders | 0.12 |
| | (2.32 | ) | | 0.87 |
|
| Net income (loss) per share attributable to SPX Corporation common shareholders after adjustment related to redeemable noncontrolling interest | $ | 2.03 |
| | $ | (2.02 | ) | | $ | (2.03 | ) |
| Weighted-average number of common shares outstanding — diluted | 43.905 |
| | 42.161 |
| | 40.733 |
|
The accompanying notes are an integral part of these statements.
SPX Corporation and Subsidiaries
Consolidated Statements of Comprehensive Income (Loss)
(in millions)
|
| | | | | | | | | | | |
| | Year ended December 31, |
| | 2017 | | 2016 | | 2015 |
| Net income (loss) | $ | 89.3 |
| | $ | (67.6 | ) | | $ | (117.0 | ) |
| Other comprehensive income (loss), net: | |
| | |
| | |
| Pension liability adjustment, net of tax (provision) benefit of $(9.8), $0.4, and $(0.1) in 2017, 2016 and 2015, respectively | 15.2 |
| | (0.6 | ) | | (0.4 | ) |
| Net unrealized gains (losses) on qualifying cash flow hedges, net of tax (provision) benefit of $0.4, $(1.7) and $(0.3) in 2017, 2016 and 2015, respectively | (0.7 | ) | | 3.3 |
| | (0.6 | ) |
| Foreign currency translation adjustments | 0.5 |
| | (50.9 | ) | | (132.9 | ) |
| Other comprehensive Income (loss), net | 15.0 |
| | (48.2 | ) | | (133.9 | ) |
| Total comprehensive income (loss) | 104.3 |
| | (115.8 | ) | | (250.9 | ) |
| Less: Total comprehensive loss attributable to noncontrolling interests | — |
| | (0.4 | ) | | (34.3 | ) |
| Total comprehensive income (loss) attributable to SPX Corporation common shareholders | $ | 104.3 |
| | $ | (115.4 | ) | | $ | (216.6 | ) |
| | | | | | | | | | | | | | | | | |
| Year ended December 31, |
| 2021 | | 2020 | | 2019 |
| Revenues | $ | 1,219.5 | | | $ | 1,128.1 | | | $ | 1,123.6 | |
| Costs and expenses: | | | | | |
| Cost of products sold | 787.7 | | | 732.6 | | | 721.6 | |
| Selling, general and administrative | 309.6 | | | 272.5 | | | 275.8 | |
| Intangible amortization | 21.6 | | | 14.0 | | | 8.9 | |
| Impairment of goodwill and intangible assets | 5.7 | | | 0.7 | | | — | |
| Special charges, net | 1.0 | | | 2.4 | | | 1.5 | |
| Other operating expenses, net | 20.2 | | | 9.0 | | | 1.8 | |
| Operating income | 73.7 | | | 96.9 | | | 114.0 | |
| Other income (expense), net | 9.0 | | | (0.1) | | | (5.2) | |
| Interest expense | (13.3) | | | (18.4) | | | (21.0) | |
| Interest income | 0.5 | | | 0.2 | | | 1.6 | |
| Loss on amendment/refinancing of senior credit agreement | — | | | — | | | (0.6) | |
| | | | | |
| Income from continuing operations before income taxes | 69.9 | | | 78.6 | | | 88.8 | |
| Income tax provision | (10.9) | | | (4.8) | | | (12.5) | |
| Income from continuing operations | 59.0 | | | 73.8 | | | 76.3 | |
| Income (loss) from discontinued operations, net of tax | 5.7 | | | 28.9 | | | (6.6) | |
| Gain (loss) on disposition of discontinued operations, net of tax | 360.7 | | | (3.7) | | | (4.4) | |
| Gain (loss) from discontinued operations, net of tax | 366.4 | | | 25.2 | | | (11.0) | |
| Net income | 425.4 | | | 99.0 | | | 65.3 | |
| Less: Net loss attributable to noncontrolling interests | — | | | — | | | — | |
| Net income attributable to SPX Corporation common stockholders | 425.4 | | | 99.0 | | | 65.3 | |
| Adjustment related to redeemable noncontrolling interest (Note 15) | — | | | — | | | 5.6 | |
Net income attributable to SPX Corporation common stockholders after
adjustment related to redeemable noncontrolling interest | $ | 425.4 | | | $ | 99.0 | | | $ | 70.9 | |
| | | | | |
| Amounts attributable to SPX Corporation common stockholders after adjustment related to redeemable noncontrolling interest: | | | | | |
| Income from continuing operations, net of tax | $ | 59.0 | | | $ | 73.8 | | | $ | 76.3 | |
| Gain (loss) from discontinued operations, net of tax | 366.4 | | | 25.2 | | | (5.4) | |
| Net income | $ | 425.4 | | | $ | 99.0 | | | $ | 70.9 | |
| Basic income (loss) per share of common stock: | | | | | |
| Income from continuing operations attributable to SPX Corporation common stockholders after adjustment related to redeemable noncontrolling interest | $ | 1.30 | | | $ | 1.65 | | | $ | 1.74 | |
| Income (loss) from discontinued operations attributable to SPX Corporation common stockholders | 8.09 | | | 0.57 | | | (0.13) | |
| Net income per share attributable to SPX Corporation common stockholders after adjustment related to redeemable noncontrolling interest | $ | 9.39 | | | $ | 2.22 | | | $ | 1.61 | |
| Weighted-average number of common shares outstanding — basic | 45.289 | | | 44.628 | | | 43.942 | |
| Diluted income (loss) per share of common stock: | | | | | |
| Income from continuing operations attributable to SPX Corporation common stockholders after adjustment related to redeemable noncontrolling interest | $ | 1.27 | | | $ | 1.61 | | | $ | 1.70 | |
| Income (loss) from discontinued operations attributable to SPX Corporation common stockholders | 7.88 | | | 0.55 | | | (0.12) | |
| Net income per share attributable to SPX Corporation common stockholders after adjustment related to redeemable noncontrolling interest | $ | 9.15 | | | $ | 2.16 | | | $ | 1.58 | |
| Weighted-average number of common shares outstanding — diluted | 46.495 | | | 45.766 | | | 44.957 | |
The accompanying notes are an integral part of these statements.
SPX Corporation and Subsidiaries
Consolidated Balance SheetsStatements of Comprehensive Income
(in millions, except share data)
|
| | | | | | | |
| | December 31, 2017 | | December 31, 2016 |
| ASSETS | | | |
| Current assets: | | | |
| Cash and equivalents | $ | 124.3 |
| | $ | 99.6 |
|
| Accounts receivable, net | 267.5 |
| | 251.7 |
|
| Inventories, net | 143.0 |
| | 145.7 |
|
| Other current assets (includes income taxes receivable of $62.4 and $1.2 at December 31, 2017 and 2016, respectively) | 97.7 |
| | 30.6 |
|
| Total current assets | 632.5 |
| | 527.6 |
|
| Property, plant and equipment: | |
| | |
| Land | 15.8 |
| | 15.4 |
|
| Buildings and leasehold improvements | 120.5 |
| | 117.3 |
|
| Machinery and equipment | 330.4 |
| | 329.8 |
|
| | 466.7 |
| | 462.5 |
|
| Accumulated depreciation | (280.1 | ) | | (267.0 | ) |
| Property, plant and equipment, net | 186.6 |
| | 195.5 |
|
| Goodwill | 345.9 |
| | 340.4 |
|
| Intangibles, net | 117.6 |
| | 117.9 |
|
| Other assets | 706.9 |
| | 680.5 |
|
| Deferred income taxes | 50.9 |
| | 50.6 |
|
| TOTAL ASSETS | $ | 2,040.4 |
| | $ | 1,912.5 |
|
| LIABILITIES AND EQUITY | |
| | |
| Current liabilities: | |
| | |
| Accounts payable | $ | 159.7 |
| | $ | 137.6 |
|
| Accrued expenses | 292.6 |
| | 304.3 |
|
| Income taxes payable | 1.2 |
| | 1.7 |
|
| Short-term debt | 7.0 |
| | 14.8 |
|
| Current maturities of long-term debt | 0.5 |
| | 17.9 |
|
| Total current liabilities | 461.0 |
| | 476.3 |
|
| Long-term debt | 349.3 |
| | 323.5 |
|
| Deferred and other income taxes | 29.6 |
| | 42.4 |
|
| Other long-term liabilities | 885.8 |
| | 878.7 |
|
| Total long-term liabilities | 1,264.7 |
| | 1,244.6 |
|
| Commitments and contingent liabilities (Note 13) |
|
| |
|
|
| Equity: | |
| | |
| Common stock (51,186,064 and 42,650,599 issued and outstanding at December 31, 2017, respectively, and 50,754,779 and 41,940,089 issued and outstanding at December 31, 2016, respectively) | 0.5 |
| | 0.5 |
|
| Paid-in capital | 1,309.8 |
| | 1,307.9 |
|
| Retained deficit | (742.3 | ) | | (831.6 | ) |
| Accumulated other comprehensive income | 250.1 |
| | 235.1 |
|
| Common stock in treasury (8,535,465 and 8,814,690 shares at December 31, 2017 and 2016, respectively) | (503.4 | ) | | (520.3 | ) |
| Total equity | 314.7 |
| | 191.6 |
|
| TOTAL LIABILITIES AND EQUITY | $ | 2,040.4 |
| | $ | 1,912.5 |
|
| | | | | | | | | | | | | | | | | |
| Year ended December 31, |
| 2021 | | 2020 | | 2019 |
| Net income | $ | 425.4 | | | $ | 99.0 | | | $ | 65.3 | |
| Other comprehensive income (loss), net: | | | | | |
| Pension and postretirement liability adjustment, net of tax benefit of $1.2, $1.2, and $0.5 in 2021, 2020 and 2019, respectively | (3.6) | | | (3.6) | | | (1.8) | |
| Net unrealized gains (losses) on qualifying cash flow hedges, net of tax (provision) benefit of $(1.5), $0.9, and $0.3 in 2021, 2020 and 2019, respectively | 4.9 | | | (2.8) | | | (1.0) | |
| | | | | |
| Foreign currency translation adjustments | 14.1 | | | 10.6 | | | 2.2 | |
| Other comprehensive income (loss), net | 15.4 | | | 4.2 | | | (0.6) | |
| Total comprehensive income | 440.8 | | | 103.2 | | | 64.7 | |
| Less: Total comprehensive loss attributable to noncontrolling interests | — | | | — | | | — | |
| Total comprehensive income attributable to SPX Corporation common stockholders | $ | 440.8 | | | $ | 103.2 | | | $ | 64.7 | |
The accompanying notes are an integral part of these statements.
SPX Corporation and Subsidiaries
Consolidated Statements of EquityBalance Sheets
(in millions, except per share amounts)
|
| | | | | | | | | | | | | | | | | | | | | | | | | | | | | | | |
| | Common
Stock | | Paid-In
Capital | | Retained
Earnings (Deficit) | | Accum. Other
Comprehensive
Income | | Common
Stock In
Treasury | | SPX
Corporation
Shareholders’
Equity | | Noncontrolling
Interests | | Total
Equity |
| Balance at December 31, 2014 | $ | 1.0 |
| | $ | 2,608.0 |
| | $ | 2,628.6 |
| | $ | 62.6 |
| | $ | (3,491.5 | ) | | $ | 1,808.7 |
| | $ | 3.2 |
| | $ | 1,811.9 |
|
| Net Loss | — |
| | — |
| | (82.7 | ) | |
|
| | — |
| | (82.7 | ) | | (34.3 | ) | | (117.0 | ) |
| Other comprehensive loss, net | — |
| | — |
| | — |
| | (133.9 | ) | | — |
| | (133.9 | ) | | — |
| | (133.9 | ) |
| Dividends declared ($0.75 per share) | — |
| | — |
| | (30.9 | ) | | — |
| | — |
| | (30.9 | ) | | — |
| | (30.9 | ) |
| Incentive plan activity | — |
| | 14.7 |
| | — |
| | — |
| | — |
| | 14.7 |
| | — |
| | 14.7 |
|
| Long-term incentive compensation expense, including $6.0 related to discontinued operations | — |
| | 39.9 |
| | — |
| | — |
| | — |
| | 39.9 |
| | — |
| | 39.9 |
|
| Restricted stock and restricted stock unit vesting, including related tax benefit of $0.7 and net of tax withholdings | — |
| | (13.0 | ) | | — |
| | — |
| | 5.2 |
| | (7.8 | ) | | — |
| | (7.8 | ) |
| Other changes in noncontrolling interests | — |
| | — |
| | — |
| | — |
| | — |
| | — |
| | 5.3 |
| | 5.3 |
|
| Spin-Off of FLOW Business | — |
| | — |
| | (1,617.2 | ) | | 354.6 |
| | — |
| | (1,262.6 | ) | | (11.3 | ) | | (1,273.9 | ) |
| Balance at December 31, 2015 | 1.0 |
| | 2,649.6 |
| | 897.8 |
| | 283.3 |
| | (3,486.3 | ) | | 345.4 |
| | (37.1 | ) | | 308.3 |
|
| Net loss | — |
| | — |
| | (67.2 | ) | | | | — |
| | (67.2 | ) | | (0.4 | ) | | (67.6 | ) |
| Other comprehensive loss, net | — |
| | — |
| | — |
| | (48.2 | ) | | — |
| | (48.2 | ) | | — |
| | (48.2 | ) |
| Incentive plan activity | — |
| | 8.8 |
| | — |
| | — |
| | — |
| | 8.8 |
| | — |
| | 8.8 |
|
| Long-term incentive compensation expense | — |
| | 12.7 |
| | — |
| | — |
| | — |
| | 12.7 |
| | — |
| | 12.7 |
|
| Restricted stock and restricted stock unit vesting, including related tax benefit of $2.2 and net of tax withholdings | — |
| | (21.8 | ) | | — |
| | — |
| | 17.9 |
| | (3.9 | ) | | — |
| | (3.9 | ) |
| Treasury share retirement | (0.5 | ) | | (1,285.4 | ) | | (1,662.2 | ) | | | | 2,948.1 |
| | — |
| | — |
| | — |
|
| Adjustment related to redeemable noncontrolling interest (Note 13) | — |
| | (56.0 | ) | | — |
| | — |
| | — |
| | (56.0 | ) | | 38.7 |
| | (17.3 | ) |
| Other changes in noncontrolling interests | — |
| | — |
| | — |
| | — |
| | — |
| | — |
| | (1.2 | ) | | (1.2 | ) |
| Balance at December 31, 2016 | 0.5 |
| | 1,307.9 |
| | (831.6 | ) | | 235.1 |
| | (520.3 | ) | | 191.6 |
| | — |
| | 191.6 |
|
| Net income | — |
| | — |
| | 89.3 |
| | — |
| | — |
| | 89.3 |
| | — |
| | 89.3 |
|
| Other comprehensive income, net | — |
| | — |
| | — |
| | 15.0 |
| | — |
| | 15.0 |
| | — |
| | 15.0 |
|
| Incentive plan activity | — |
| | 11.3 |
| | — |
| | — |
| | — |
| | 11.3 |
| | — |
| | 11.3 |
|
| Long-term incentive compensation expense | — |
| | 12.0 |
| | — |
| | — |
| | — |
| | 12.0 |
| | — |
| | 12.0 |
|
| Restricted stock and restricted stock unit vesting, including related tax benefit of $0.6 and net of tax withholdings | — |
| | (21.4 | ) | | — |
| | — |
| | 16.9 |
| | (4.5 | ) | | — |
| | (4.5 | ) |
| Balance at December 31, 2017 | $ | 0.5 |
| | $ | 1,309.8 |
| | $ | (742.3 | ) | | $ | 250.1 |
| | $ | (503.4 | ) | | $ | 314.7 |
| | $ | — |
| | $ | 314.7 |
|
| | | | | | | | | | | |
| December 31, 2021 | | December 31, 2020 |
| ASSETS | | | |
| Current assets: | | | |
| Cash and equivalents | $ | 388.2 | | | $ | 64.0 | |
| Accounts receivable, net | 223.4 | | | 210.8 | |
| Contract assets | 28.9 | | | 32.5 | |
| Inventories, net | 189.8 | | | 155.0 | |
| Other current assets (includes income taxes receivable of $8.7 and $27.3 at December 31, 2021 and 2020, respectively) | 73.1 | | | 88.4 | |
| | | |
| Assets of discontinued operations | — | | | 124.4 | |
| Total current assets | 903.4 | | | 675.1 | |
| Property, plant and equipment: | | | |
| Land | 13.9 | | | 12.9 | |
| Buildings and leasehold improvements | 62.9 | | | 59.2 | |
| Machinery and equipment | 231.4 | | | 208.3 | |
| 308.2 | | | 280.4 | |
| Accumulated depreciation | (194.9) | | | (173.6) | |
| Property, plant and equipment, net | 113.3 | | | 106.8 | |
| Goodwill | 457.3 | | | 368.6 | |
| Intangibles, net | 415.5 | | | 305.0 | |
| Other assets | 675.9 | | | 591.7 | |
| Deferred income taxes | 11.0 | | | 23.9 | |
| Assets of discontinued operations | — | | | 219.1 | |
| Assets of DBT and Heat Transfer (includes cash and cash equivalents of $7.8 and $4.3 at December 31, 2021 and 2020, respectively) - Note 4 | 52.2 | | | 43.5 | |
| TOTAL ASSETS | $ | 2,628.6 | | | $ | 2,333.7 | |
| LIABILITIES AND STOCKHOLDERS' EQUITY | | | |
| Current liabilities: | | | |
| Accounts payable | $ | 119.6 | | | $ | 102.1 | |
| Contract liabilities | 44.7 | | | 38.8 | |
| Accrued expenses | 217.9 | | | 206.6 | |
| Income taxes payable | 42.1 | | | 0.4 | |
| Short-term debt | 2.2 | | | 101.2 | |
| Current maturities of long-term debt | 13.0 | | | 7.2 | |
| | | |
| Liabilities of discontinued operations | — | | | 115.8 | |
| Total current liabilities | 439.5 | | | 572.1 | |
| Long-term debt | 230.8 | | | 304.0 | |
| Deferred and other income taxes | 31.3 | | | 26.6 | |
| Other long-term liabilities | 788.5 | | | 741.4 | |
| Liabilities of discontinued operations | — | | | 31.4 | |
| Liabilities of DBT and Heat Transfer (Note 4) | 35.6 | | | 18.1 | |
| Total long-term liabilities | 1,086.2 | | | 1,121.5 | |
| Commitments and contingent liabilities (Note 15) | 0 | | 0 |
| Stockholders' equity: | | | |
| Common stock (53,011,255 and 45,467,768 issued and outstanding at December 31, 2021, respectively, and 52,704,973 and 45,032,325 issued and outstanding at December 31, 2020, respectively) | 0.5 | | | 0.5 | |
| Paid-in capital | 1,334.2 | | | 1,319.9 | |
| Retained deficit | (51.8) | | | (477.2) | |
| Accumulated other comprehensive income | 263.9 | | | 248.5 | |
| Common stock in treasury (7,543,487 and 7,672,648 shares at December 31, 2021 and 2020 respectively) | (443.9) | | | (451.6) | |
| Total stockholders' equity | 1,102.9 | | | 640.1 | |
| | | |
| TOTAL LIABILITIES AND STOCKHOLDERS' EQUITY | $ | 2,628.6 | | | $ | 2,333.7 | |
The accompanying notes are an integral part of these statements.
SPX Corporation and Subsidiaries
Consolidated Statements of Stockholders' Equity
(in millions) | | | | | | | | | | | | | | | | | | | | | | | | | | | | | | | | | | | |
| Common
Stock | | Paid-In
Capital | | Retained Deficit | | Accum. Other
Comprehensive
Income | | Common
Stock In
Treasury | | Total Stockholders' Equity |
| Balance at December 31, 2018 | $ | 0.5 | | | $ | 1,295.4 | | | $ | (641.0) | | | $ | 244.9 | | | $ | (475.8) | | | $ | 424.0 | |
| Net income | — | | | — | | | 65.3 | | | — | | | — | | | 65.3 | |
| Other comprehensive loss, net | — | | | — | | | — | | | (0.6) | | | — | | | (0.6) | |
| Incentive plan activity | — | | | 13.0 | | | — | | | — | | | — | | | 13.0 | |
| Long-term incentive compensation expense | — | | | 10.8 | | | — | | | — | | | — | | | 10.8 | |
| Restricted stock and restricted stock unit vesting | — | | | (22.4) | | | — | | | — | | | 15.8 | | | (6.6) | |
| Adjustment related to redeemable noncontrolling interest (Note 15) | — | | | 5.6 | | | — | | | — | | | — | | | 5.6 | |
| Balance at December 31, 2019 | 0.5 | | | 1,302.4 | | | (575.7) | | | 244.3 | | | (460.0) | | | 511.5 | |
| Impact of adoption of ASU 2016-13 - See Note 3 | — | | | — | | | (0.5) | | | — | | | — | | | (0.5) | |
| Net income | — | | | — | | | 99.0 | | | — | | | — | | | 99.0 | |
| Other comprehensive income, net | — | | | — | | | — | | | 4.2 | | | — | | | 4.2 | |
| Incentive plan activity | — | | | 17.5 | | | — | | | — | | | — | | | 17.5 | |
| Long-term incentive compensation expense | — | | | 12.8 | | | — | | | — | | | — | | | 12.8 | |
| Restricted stock unit vesting | — | | | (12.8) | | | — | | | — | | | 8.4 | | | (4.4) | |
| Balance at December 31, 2020 | 0.5 | | | 1,319.9 | | | (477.2) | | | 248.5 | | | (451.6) | | | 640.1 | |
| Net income | — | | | — | | | 425.4 | | | — | | | — | | | 425.4 | |
| Other comprehensive income, net | — | | | — | | | — | | | 15.4 | | | — | | | 15.4 | |
| Incentive plan activity | — | | | 12.8 | | | — | | | — | | | — | | | 12.8 | |
| Long-term incentive compensation expense | — | | | 14.2 | | | — | | | — | | | — | | | 14.2 | |
| Restricted stock unit vesting | — | | | (12.7) | | | — | | | — | | | 7.7 | | | (5.0) | |
| Balance at December 31, 2021 | $ | 0.5 | | | $ | 1,334.2 | | | $ | (51.8) | | | $ | 263.9 | | | $ | (443.9) | | | $ | 1,102.9 | |
The accompanying notes are an integral part of these statements.
SPX Corporation and Subsidiaries
Consolidated Statements of Cash Flows
(in millions) | | | | | | | | | | | | | | | | | |
| Year ended December 31, |
| 2021 | | 2020 | | 2019 |
| Cash flows from (used in) operating activities: | | | | | |
| Net income | $ | 425.4 | | | $ | 99.0 | | | $ | 65.3 | |
| Less: Gain (loss) from discontinued operations, net of tax | 366.4 | | | 25.2 | | | (11.0) | |
| Income from continuing operations | 59.0 | | | 73.8 | | | 76.3 | |
| Adjustments to reconcile income from continuing operations to net cash from operating activities | | | | | |
| Special charges, net | 1.0 | | | 2.4 | | | 1.5 | |
| Gain on change in fair value of equity security | (11.8) | | | (8.6) | | | (7.9) | |
| Loss on amendment/refinancing of senior credit agreement | — | | | — | | | 0.6 | |
| Impairment of goodwill and intangible assets | 5.7 | | | 0.7 | | | — | |
| Deferred and other income taxes | (1.4) | | | 0.3 | | | 13.8 | |
| Depreciation and amortization | 42.3 | | | 31.9 | | | 24.4 | |
| Pension and other employee benefits | (8.6) | | | 10.7 | | | 16.9 | |
| Long-term incentive compensation | 12.8 | | | 13.1 | | | 12.6 | |
| Other, net | 4.3 | | | 5.0 | | | 1.8 | |
| Changes in operating assets and liabilities, net of effects from acquisitions: | | | | | |
| Accounts receivable and other assets | (19.8) | | | 33.5 | | | 36.3 | |
| Inventories | (21.0) | | | — | | | (8.8) | |
| Accounts payable, accrued expenses and other | 70.3 | | | (56.1) | | | (56.1) | |
| | | | | |
| Cash spending on restructuring actions | (1.6) | | | (1.5) | | | (1.4) | |
| Net cash from continuing operations | 131.2 | | | 105.2 | | | 110.0 | |
| Net cash from discontinued operations | 43.4 | | | 21.1 | | | 38.6 | |
| Net cash from operating activities | 174.6 | | | 126.3 | | | 148.6 | |
| Cash flows from (used in) investing activities: | | | | | |
| Proceeds (expenditures) related to company-owned life insurance policies, net | (31.2) | | | (0.2) | | | 5.9 | |
| | | | | |
| Business acquisitions, net of cash acquired | (265.2) | | | (104.4) | | | (147.1) | |
| Capital expenditures | (9.6) | | | (15.3) | | | (13.5) | |
| Other | — | | | — | | | (0.2) | |
| Net cash used in continuing operations | (306.0) | | | (119.9) | | | (154.9) | |
| Net cash from (used in) discontinued operations | 620.1 | | | (6.2) | | | 1.2 | |
| Net cash from (used in) investing activities | 314.1 | | | (126.1) | | | (153.7) | |
| Cash flows from (used in) financing activities: | | | | | |
| | | | | |
| Borrowings under senior credit facilities | 209.9 | | | 197.6 | | | 593.8 | |
| Repayments under senior credit facilities | (346.0) | | | (207.8) | | | (560.2) | |
| Borrowings under trade receivables agreement | 179.0 | | | 134.4 | | | 93.0 | |
| Repayments under trade receivables agreement | (207.0) | | | (106.4) | | | (116.0) | |
| Net repayments under other financing arrangements | (0.4) | | | (2.2) | | | (0.6) | |
| Payment of contingent consideration | — | | | (1.5) | | | — | |
| Minimum withholdings paid on behalf of employees for net share settlements, net of proceeds from the exercise of employee stock options and other | (3.3) | | | 2.2 | | | (3.7) | |
| Financing fees paid | — | | | — | | | (1.6) | |
| | | | | |
| | | | | |
| | | | | |
| Net cash from (used in) continuing operations | (167.8) | | | 16.3 | | | 4.7 | |
| Net cash from (used in) discontinued operations | 0.2 | | | (0.4) | | | (15.8) | |
| Net cash from (used in) financing activities | (167.6) | | | 15.9 | | | (11.1) | |
| | | | | |
|
| | | | | | | | | | | |
| | Year ended December 31, |
| | 2017 | | 2016 | | 2015 |
| Cash flows from (used in) operating activities: | | | | | |
| Net income (loss) | $ | 89.3 |
| | $ | (67.6 | ) | | $ | (117.0 | ) |
| Less: Income (loss) from discontinued operations, net of tax | 5.3 |
| | (97.9 | ) | | 34.6 |
|
| Income (loss) from continuing operations | 84.0 |
| | 30.3 |
| | (151.6 | ) |
| Adjustments to reconcile income (loss) from continuing operations to net cash from (used in) operating activities |
|
| | |
| | |
|
| Special charges, net | 2.7 |
| | 5.3 |
| | 5.1 |
|
| Gain on asset sales | — |
| | (0.9 | ) | | (1.2 | ) |
| Gain on sale of dry cooling business | — |
| | (18.4 | ) | | — |
|
| Impairment of intangible assets | — |
| | 30.1 |
| | — |
|
| Loss on amendment/refinancing of senior credit agreement | 0.9 |
| | 1.3 |
| | 1.4 |
|
| Deferred and other income taxes | (21.0 | ) | | — |
| | 4.9 |
|
| Depreciation and amortization | 25.2 |
| | 26.5 |
| | 37.0 |
|
| Pension and other employee benefits | 14.9 |
| | 24.8 |
| | 35.2 |
|
| Long-term incentive compensation | 15.8 |
| | 13.7 |
| | 33.9 |
|
| Other, net | 4.7 |
| | 3.2 |
| | 3.8 |
|
| Changes in operating assets and liabilities, net of effects from acquisition and divestitures |
|
| | |
| | |
|
| Accounts receivable and other assets | (102.8 | ) | | (28.7 | ) | | (6.9 | ) |
| Inventories | 4.5 |
| | 8.5 |
| | (21.2 | ) |
| Accounts payable, accrued expenses and other | 28.3 |
| | (40.2 | ) | | (11.3 | ) |
| Cash spending on restructuring actions | (3.0 | ) | | (2.1 | ) | | (5.1 | ) |
| Net cash from (used in) continuing operations | 54.2 |
| | 53.4 |
| | (76.0 | ) |
| Net cash from (used in) discontinued operations | (6.6 | ) | | (46.9 | ) | | 37.5 |
|
| Net cash from (used in) operating activities | 47.6 |
| | 6.5 |
| | (38.5 | ) |
| Cash flows from (used in) investing activities: |
|
| | |
| | |
|
| Proceeds from asset sales | — |
| | 48.1 |
| | 2.0 |
|
| Increase in restricted cash | (0.3 | ) | | — |
| | — |
|
| Capital expenditures | (11.0 | ) | | (11.7 | ) | | (16.0 | ) |
| Net cash from (used in) continuing operations | (11.3 | ) | | 36.4 |
| | (14.0 | ) |
| Net cash used in discontinued operations (includes cash divested with the sale of Balcke Dürr of $30.2 in 2016) | — |
| | (30.9 | ) | | (40.2 | ) |
| Net cash from (used in) investing activities | (11.3 | ) | | 5.5 |
| | (54.2 | ) |
| Cash flows used in financing activities: |
|
| | |
| | |
|
| Borrowings under senior credit facilities | 404.6 |
| | 56.2 |
| | 1,264.0 |
|
| Repayments under senior credit facilities | (395.8 | ) | | (65.0 | ) | | (1,167.0 | ) |
| Borrowings under trade receivables agreement | 74.0 |
| | 72.0 |
| | 156.0 |
|
| Repayments under trade receivables agreement | (74.0 | ) | | (72.0 | ) | | (166.0 | ) |
| Net borrowings (repayments) under other financing arrangements | (10.1 | ) | | (10.1 | ) | | 12.2 |
|
| Minimum withholdings paid on behalf of employees for net share settlements, net of proceeds from the exercise of employee stock options and other | (1.3 | ) | | (1.6 | ) | | (6.2 | ) |
| Financing fees paid | (3.6 | ) | | — |
| | (12.2 | ) |
| Dividends paid | — |
| | — |
| | (45.9 | ) |
| Cash divested in connection with the spin-off of FLOW Business | — |
| | — |
| | (208.6 | ) |
| Net cash used in continuing operations | (6.2 | ) | | (20.5 | ) | | (173.7 | ) |
| Net cash used in discontinued operations | — |
| | — |
| | (1.9 | ) |
| Net cash used in financing activities | (6.2 | ) | | (20.5 | ) | | (175.6 | ) |
| Change in cash and equivalents due to changes in foreign currency exchange rates | (5.4 | ) | | 6.7 |
| | (57.9 | ) |
| Net change in cash and equivalents | 24.7 |
| | (1.8 | ) | | (326.2 | ) |
| Consolidated cash and equivalents, beginning of period | 99.6 |
| | 101.4 |
| | 427.6 |
|
| Consolidated cash and equivalents, end of period | $ | 124.3 |
| | $ | 99.6 |
| | $ | 101.4 |
|
| Cash and equivalents of continuing operations | $ | 124.3 |
| | $ | 99.6 |
| | $ | 97.2 |
|
| | | | | | | | | | | | | | | | | |
| Change in cash and equivalents due to changes in foreign currency exchange rates | 6.6 | | | (2.5) | | | 2.1 | |
| Net change in cash and equivalents | 327.7 | | | 13.6 | | | (14.1) | |
| Consolidated cash and equivalents, beginning of period | 68.3 | | | 54.7 | | | 68.8 | |
| Consolidated cash and equivalents, end of period | $ | 396.0 | | | $ | 68.3 | | | $ | 54.7 | |
| | | | | |
| Supplemental disclosure of cash flow information: | | | | | |
| Interest paid | $ | 11.4 | | | $ | 17.5 | | | $ | 16.1 | |
| Income tax refunds (payments), net | $ | 5.5 | | | $ | (7.6) | | | $ | (7.0) | |
| Non-cash investing and financing activity: | | | | | |
| Debt assumed | $ | 0.4 | | | $ | 2.9 | | | $ | 1.3 | |
| | | | | | | | | | | | | | | | | |
| Year ended December 31, |
| 2021 | | 2020 | | 2019 |
| Components of cash and equivalents: | | | | | |
| Cash and cash equivalents | $ | 388.2 | | | $ | 64.0 | | | $ | 50.7 | |
| Cash and cash equivalents included in assets of DBT and Heat Transfer | 7.8 | | | 4.3 | | | 4.0 |
| Total cash and cash equivalents | $ | 396.0 | | | $ | 68.3 | | | $ | 54.7 | |
|
| | | | | | | | | | | |
| Supplemental disclosure of cash flow information: |
|
| | |
| |
|
|
| Interest paid | $ | 15.1 |
| | $ | 12.5 |
| | $ | 60.8 |
|
| Income taxes paid, net of refunds of $2.7, $4.3 and $8.8 in 2017, 2016 and 2015, respectively | $ | 22.9 |
| | $ | 4.8 |
| | $ | 51.0 |
|
| Non-cash investing and financing activity: |
|
| | |
| | |
|
| Debt assumed | $ | 0.9 |
| | $ | 3.9 |
| | $ | 1.0 |
|
The accompanying notes are an integral part of these statements.
Notes to Consolidated Financial Statements
December 31, 20172021
(All currency and share amounts are in millions, except per share and par value data)
(1) Basis of Presentation and Summary of Significant Accounting Policies
Our significant accounting policies are described below, as well as in other Notes that follow. Unless otherwise indicated, amounts provided in these Notes pertain to continuing operations only (see Note 4 for information on discontinued operations).
Principles of Consolidation — The consolidated financial statements include SPX Corporation’s (“SPX”, “our”, or “we”) accounts prepared in conformity with accounting principles generally accepted in the United States (“GAAP”) after the elimination of intercompany transactions. Investments in unconsolidated companies where we exercise significant influence but do not have control are accounted for using the equity method. In determining whether we are the primary beneficiary of a variable interest entity (“VIE”), we perform a qualitative analysis that considers the design of the VIE, the nature of our involvement and the variable interests held by other parties to determine which party has the power to direct the activities of the VIE that most significantly impact the entity’s economic performance, and which party has the obligation to absorb losses or the right to receive benefits of the entity that could potentially be significant to the VIE. We have an interest in a VIE, in which we are not the primary beneficiary, as a resultAll of the sale of Balcke Dürr. See below and in Notes 2, 4 and 15 for further discussion of the Balcke Dürr sale. All otherour VIEs are considered immaterial, individually and in aggregate, to our consolidated financial statements.
Spin-Off of FLOW BusinessShift Away from the Power Generation Markets —On September 26, 2015, (the “Distribution Date”), we completed the spin-off to our stockholders (the “Spin-Off”) of all the outstanding shares of SPX FLOW, Inc. (“SPX FLOW”), a wholly-owned subsidiary of SPX prior to the Spin-Off, which at the time of the Spin-Off held the businesses comprising our Flow Technology reportable segment, our Hydraulic Technologies business, and certain of our corporate subsidiaries (collectively, the “FLOW Business”). On the Distribution Date, each of our stockholders of record as of the close of business on September 16, 2015 (the “Record Date”) received one share of common stock of SPX FLOW for every share of SPX common stock held as of the Record Date. SPX FLOW is now an independent public company trading under the symbol “FLOW” on the New York Stock Exchange. Following the Spin-Off, SPX’s common stock continues to be listed on the New York Stock Exchange and trades under the ticker symbol, “SPXC”. The financial results of SPX FLOW for the year ended December 31, 2015 have been classified as discontinued operations within the accompanying consolidated financial statements.
Shift Away from the Power Generation Markets —subsidiaries. Prior to the Spin-Off, our businesses serving the power generation markets had a major impact on the consolidated financial results of SPX. In the recent years leading up to the Spin-Off, these businesses experienced significant declines in revenues and profitability associated with weak demand and increased competition within the global power generation markets. Based on a review of our post-spin portfolio and the belief that a recovery within the power generation markets was unlikely in the foreseeable future, we decided coming out of the Spin-Off that our strategic focus would be on our (i) scalable growth businesses that serve the heating, ventilation and ventilationcooling (“HVAC”) and detection and measurement markets and (ii) power transformertransformers and process cooling systems businesses.business. As a result, we have significantly reduced our exposure to the power generation markets as indicated by the disposalsactivities summarized below:
•Sale of Dry Cooling Business -– On March 30, 2016, we completed the sale of our dry cooling business, a business that provides dry cooling systems to the global power generation markets and was previously reported within our Engineered Solutions reportable segment, to Paharpur Cooling Towers Limited. See Note 4 for additional details.markets.
•Sale of Balcke Dürr Business -– On December 30, 2016, we completed the sale of Balcke Dürr, a business that provides heat exchangers and other related components to the European and Asian power generation markets, to a subsidiary of mutares AG (the “Buyer”).markets. Balcke Dürr historically had been the most significant of our power generation businesses and, in recent years, had experienced significant declines in its operating performance as evidenced by its net loss of $39.6 in 2015. With the sale, we eliminated the losses and liquidity needs of Balcke Dürr, which were expected to be significant in the foreseeable future.businesses. As we considered the disposition of Balcke Dürr to be the cornerstone of our strategic shift away from the power generation markets, and given the significance of Balcke Dürr’s financial results to our overall operations prior to its disposition, we began classifying Balcke Dürr as a discontinued operation at the time of its disposition.
•Wind-Down of the SPX Heat Transfer Business – After an unsuccessful attempt to sell the SPX Heat Transfer (“Heat Transfer”) business, and as a continuation of our strategic shift away from power generation markets, we initiated a wind-down plan for the business in 2018. During the fourth quarter of 2020, we completed the plan, which included providing all products and services on the business’s remaining contracts with customers. As a result, we are reporting Heat Transfer as a discontinued operation in the accompanying consolidated financial statements.See Note 4 for additional details.
•Wind-Down of DBT Technologies Business - As a culmination of our strategic shift away from power generation markets, we substantially ceased all operations of, and have ceased accepting new businesses in, our South African subsidiary, DBT Technologies (PTY) LTD (“DBT”). As a result, we are reporting DBT as a discontinued operation in the accompanying consolidated financial statements. DBT continues to be involved in various dispute resolution matters related to 2 large power projects. See Note 4 for additional details regarding DBT's presentation as a discontinued operation and Note 15 regarding the dispute resolution matters.
Sale of Transformer Solutions Business — On October 1, 2021, we completed the sale of SPX Transformer Solutions, Inc. (“Transformer Solutions”) pursuant to the terms of the Stock Purchase Agreement dated June 8, 2021 with GE-Prolec Transformers, Inc. (the “Purchaser”) and Prolec GE Internacional, S. de R.L. de C.V. We transferred all of the outstanding common stock of Transformer Solutions to the Purchaser for an aggregate cash purchase price of $645.0 (the “Transaction”). The purchase price is subject to potential adjustment based on Transformer Solutions’ cash, debt and working capital on the
date the Transaction was consummated, as well as for specified transaction expenses and other specified items. In connection with the sale, we received cash proceeds of $620.6 and recorded a gain of $382.2 to “Gain (loss) on disposition of discontinued operations, net of tax” within our 2021 consolidated statement of operations. Historically, Transformer Solutions’ operations have had a significant impact on our consolidated financial results, with revenues totaling approximately 25% of our total consolidated revenues. As we no longer have a consequential presence in the power transmission and distribution markets, and given Transformer Solutions' significance to our historical consolidated financial results, we have concluded that the sale of Transformer Solutions represents a strategic shift. Accordingly, we have classified Balcke Dürrthe business as a discontinued operation in the accompanying consolidated financial statements. See Note 4 for additional details.
New Income Tax RegulationsChange in Segment Reporting Structure — As noted above, Transformer Solutions and DBT are now being reported as discontinued operations within the United States — On December 22, 2017, the Tax Cuts and Jobs Act (the “Act”) was enacted which significantly changes United States (“U.S.”) income tax law for businesses and individuals. The Act introduces changes that impact U.S. corporate tax rates (e.g., a reduction in the top tax rate from 35% to 21%), business-related exclusions, and deductions and credits.accompanying consolidated financial statements. In addition, the Act will have tax consequencesremaining operations of our former Engineered Solutions reportable segment, with annual income representing less than 5% of the total income of our reportable segments, are being reported within our HVAC reportable segment, as these operations are now being managed, and evaluated by our Chief Operating Decision Maker, as part of our HVAC cooling business.
Acquisitions in 2021:
•Sealite - On April 19, 2021, we completed the acquisition of Sealite Pty Ltd and affiliated entities, including Sealite USA, LLC (doing business as Avlite Systems) and Star2M Pty Ltd (collectively, "Sealite"). Sealite is a leader in the design and manufacture of marine and aviation Aids to Navigation products. We purchased Sealite for many entities that operate internationally,cash proceeds of $80.3, net of cash acquired of $2.3. The post acquisition operating results of Sealite are reflected within our Detection and Measurement reportable segment.
•ECS - On August 2, 2021, we completed the acquisition of Enterprise Control Systems Ltd (“ECS”), a leader in the design and manufacture of highly-engineered tactical datalinks and radio frequency (“RF”) countermeasures, including counter-drone and counter-IED RF jammers. We purchased ECS for cash proceeds of $39.4, net of cash acquired of $5.1. Under the timingterms of the purchase and sales agreement, the amountseller is eligible for additional cash consideration of taxup to $16.8, with payment to be paid on undistributed foreign earnings. Given the significancemade in 2022 upon successful achievement of certain financial performance milestones. The estimated fair value of such contingent consideration as of the changesdate of acquisition was $8.2, which we reflected as a liability in our condensed consolidated balance sheet as of the end of the third quarter of 2021. During the fourth quarter of 2021, we concluded that will result from the Act, companiesprobability of achieving the above financial performance milestones had lessened due to a delay in the execution of a large order, resulting in a reduction of the estimated liability of $6.7, with such amount recorded within "Other operating expenses, net" in the 2021 consolidated statement of operations. The post-acquisition operating results of ECS are likelyreflected within our Detection and Measurement reportable segment.
•Cincinnati Fan - On December 15, 2021, we completed the acquisition of Cincinnati Fan & Ventilator Co., Inc. (“Cincinnati Fan”), a leader in engineered air movement solutions, including blowers and critical exhaust systems. We purchased Cincinnati Fan for cash proceeds of $145.2, net of cash acquired of $2.5. The purchase price is subject to encounter a situationadjustment based on the final calculation of working capital, cash, and debt as of the date of the acquisition. The post acquisition operating results of Cincinnati Fan are reflected within our HVAC reportable segment.
The assets acquired and liabilities assumed in which the accountingSealite, ECS, and Cincinnati Fan transactions have been recorded at estimates of fair value as determined by management, based on information available and assumptions as to future operations and are subject to change, primarily for the final assessment and valuation of certain income tax effectsamounts.
Acquisitions in 2020:
•ULC – On September 2, 2020, we completed the acquisition of ULC Robotics (“ULC”), a leading developer of robotic systems, machine learning applications, and inspection technology for the energy, utility, and industrial markets, for cash proceeds of $89.2, net of cash acquired of $4.0. Under the terms of the Act willpurchase and sales agreement, the seller was eligible for additional cash consideration of up to $45.0, with payments scheduled to be incomplete bymade upon successful achievement of certain operational and financial performance milestones. At the time theirof the acquisition, we recorded a liability of $24.3, which represented the estimated fair value of the contingent consideration. During the third quarter of 2021, we concluded that the operational and financial statementsmilestones noted above would not be achieved. As a result, we reversed the liability of $24.3 during the third quarter, with the offset recorded to “Other operating expenses, net” (See Note 10 for further discussion of this matter). The post-acquisition operating results of ULC are issuedreflected within our Detection and Measurement reportable segment.
•Sensors & Software – On November 11, 2020, we completed the acquisition of Sensors & Software Inc. (“Sensors & Software“), a leading manufacturer and distributor of ground penetrating radar products used for locating underground utilities, detecting unexploded ordinances, and geotechnical and geological investigations, for cash proceeds of $15.5, net of cash acquired of $0.3. Under the reporting period that includesterms of the enactmentpurchase and sales agreement, the seller is eligible for additional cash consideration of up to $3.9, with payment scheduled to be made upon successful achievement of defined financial performance milestones during the twelve months following the date of acquisition. At the time of the acquisition, we recorded a liability of $0.7 which represented the estimated fair value of the contingent consideration. During the fourth quarter of 2021, we concluded that certain of these financial milestones had been achieved, resulting in an increase to the liability of $0.6, with the offset reflected in “Other operating expenses, net” in the accompanying 2021 consolidated statement of operations. The estimated fair value of such contingent consideration is $1.3 and $0.7, which is reflected as a liability in the accompanying consolidated balance sheets as of December 22, 2017. In recognition31, 2021 and 2020, respectively. The post-acquisition operating results of Sensors & Software are reflected within our Detection and Measurement reportable segment.
Acquisitions in 2019:
•Sabik – On February 1, 2019, we completed the acquisition of Sabik Marine (“Sabik”), primarily a manufacturer of obstruction lighting products, for a purchase price of $77.2, net of cash acquired of $0.6. The post-acquisition operating results of Sabik are reflected within our Detection and Measurement reportable segment.
•SGS – On July 3, 2019, we completed the acquisition of SGS Refrigeration Inc. (“SGS”), a manufacturer of industrial refrigeration products, for cash proceeds of $11.5, including contingent consideration of $1.5 that was paid during the first quarter of 2020. The post-acquisition operating results of SGS are reflected within our HVAC reportable segment.
•Patterson-Kelley – On November 12, 2019, we completed the acquisition of Patterson-Kelley, LLC (“Patterson-Kelley”), a manufacturer and distributor of commercial boilers and water heaters, for cash proceeds of $59.9. The post-acquisition operating results of Patterson-Kelley are reflected within our HVAC reportable segment.
Inventories — Historically, certain of our domestic businesses within our HVAC reportable segment accounted for their inventories under the last-in, last-out (“LIFO”) method. During the fourth quarter of 2021, as a means of harmonizing our accounting method for inventories across all of our businesses, we converted the inventory accounting for these businesses to the first-in, first-out (“FIFO”) method. This change in accounting has been retrospectively applied to our consolidated financial statements. See Note 9 for further discussion of this potential situation, the Securities and Exchange Commission issued Staff Accounting Bulletin No. 118 (“SAB 118”). SAB 118 provides guidance on how companies should apply Accounting Standard Codification (“ASC”) Topic 740, Income Taxes, in accounting forchange, including the impact of the Act. Specifically, SAB 118 indicates that to the extent accounting for certain income tax effects of the Act is incomplete, but an entity can determine a reasonable estimate for those effects, such estimates should be included in an entity’sthis change on our prior years’ consolidated financial statements. The reasonable estimates are to be reported as provisional amounts during a measurement period. The measurement period begins with the reporting period that includes the Act’s enactment date and ends when an entity has finalized its analysis of the information that is needed in order to complete the accounting requirements of ASC 740, but in no circumstances would the measurement period extend beyond one year from the enactment date. In circumstances when a reasonable estimate cannot be determined, an entity would continue to apply ASC 740 (e.g., when recognizing and measuring current and deferred income taxes) based on the provisions of the tax law that were in effect prior to the Act being enacted. In addition, to the extent the accounting for certain income tax effects of the Act are complete, these completed amounts will not be provisional amounts. SAB 118 also indicates that an entity should provide various disclosures about the material financial reporting impacts of the Act for which accounting under ASC 740 is incomplete. See Note 10 for a discussion of the impact of the Act on our 2017 consolidated financial statements, including disclosure of any provisional amounts that have been recorded and circumstances where reasonable estimates could not be made.
Retirement of Treasury Stock —In 2016, we retired 50.0 shares, or $2,948.1, of “Common stock in treasury.” Under the applicable state law, these shares represent authorized and unissued shares upon retirement. In accordance with our accounting policy, we allocate any excess of share repurchase over par value between “Paid-in capital” and “Retained earnings,” resulting in respective reductions of $1,285.4 and $1,662.2.
Foreign Currency Translation and Transactions — The financial statements of our foreign subsidiaries are translated into U.S. dollars in accordance with the Foreign Currency Matters Topic of the Financial Accounting Standards Board Codification (“Codification”). Gains and losses on foreign currency translations are reflected as a separate component of stockholders' equity and other comprehensive income. Foreign currency transaction gains and losses, as well as gains and losses related to foreign currency forward contracts, and currency forward embedded derivatives, are included in “Other expense,income (expense), net,” with the related net losses totaling $3.3, $2.4$0.9, $0.6 and $8.6$0.9 in 2017, 20162021, 2020 and 2015,2019, respectively.
Cash Equivalents — We consider highly liquid money market investments with original maturities of three months or less at the date of purchase to be cash equivalents.
Revenue Recognition — We recognize revenues from product sales upon shipment to the customer (e.g., FOB shipping point) or upon receipt by the customer (e.g., FOB destination),revenue in accordance with the agreed upon customer terms. Revenues from service contracts and long-term maintenance arrangements are recognized on a straight-line basis over the agreement period. Sales with FOB destination terms are primarily to power transformer customers. Sales to distributors with return rights are recognized upon shipment to the distributor with expected returns estimated and accrued at the time of sale. The accrual considers restocking chargesAccounting Standards Codification (“ASC”) 606. See Note 5 for returns and in some cases the distributor must issue a replacement order before the return is authorized. Actual return experience may vary from our estimates. We recognize revenues separatelypolicy for arrangements with multiple deliverables that meet the criteria for separate units of accountingrecognizing revenue under ASC 606 as defined by the Revenue Recognition Topic of the Codification. The deliverables under these arrangements typically include hardware and software components, installation, maintenance, extended warranties and software upgrades. Amounts allocated to each element are based on its objectively determined fair value, suchwell as the sales price of the product or service when it is sold separately, competitor prices for similar products or our best estimate. The hardware and software components are usually recognized as revenue contemporaneously, as both arevarious other disclosures required for essential functionality of the products, with the installation being recognized upon completion. Revenues related to maintenance, extended warranties and software upgrades are recognized on a pro-rata basis over the coverage period.by ASC 606.
We offer sales incentive programs primarily to effect volume rebates and promotional and advertising allowances. These programs are only significant to one of our business units. The liability for these programs, and the resulting reduction to reported revenues, is determined primarily through trend analysis, historical experience and expectations regarding customer participation.
Amounts billed for shipping and handling are included in revenues. Costs incurred for shipping and handling are recorded in cost of products sold. Taxes assessed by governmental authorities that are directly imposed on a revenue-producing transaction between a seller and a customer are presented on a net basis (excluded from revenues) in our consolidated statements of operations.
In addition, certain of our businesses, primarily within the Engineered Solutions reportable segment, also recognize revenues from long-term construction/installation contracts under the percentage-of-completion method of accounting. The percentage-of-completion is measured principally by the percentage of costs incurred to date for each contract to the estimated total costs for such contract at completion. We recognize revenues for similar short-term contracts using the completed-contract method of accounting.
Provisions for any estimated losses on uncompleted long-term contracts are made in the period in which such losses are determined. In the case of customer change orders for uncompleted long-term contracts, estimated recoveries are included for work performed in forecasting ultimate profitability on certain contracts. Due to uncertainties inherent in the estimation process, it is possible that completion costs, including those arising from contract penalty provisions and final contract settlements, may be revised in the near-term. Such revisions to costs and income are recognized in the period in which the revisions are determined.
Costs and estimated earnings in excess of billings arise when revenues have been recorded but the amounts have not been billed under the terms of the contracts. These amounts are recoverable from customers upon various measures of performance, including achievement of certain milestones, completion of specified units or completion of the contract. Claims related to long-term contracts are recognized as revenue only after we have determined that collection is probable and the amount can be reliably estimated. Claims made by us involve negotiation and, in certain cases, litigation or other dispute-resolution processes. In the event we incur litigation or other dispute-resolution costs in connection with claims, such costs are expensed as incurred, although we may seek to recover these costs. Claims against us are recognized when a loss is considered probable and amounts are reasonably estimable.
We recognized $255.5, $336.1 and $361.8 in revenues under the percentage-of-completion method for the years ended December 31, 2017, 2016 and 2015, respectively. Costs and estimated earnings on uncompleted contracts, from their inception, and related amounts billed as of December 31, 2017 and 2016 were as follows:
|
| | | | | | | |
| | 2017 | | 2016 |
| Costs incurred on uncompleted contracts | $ | 1,261.3 |
| | $ | 1,191.4 |
|
| Estimated earnings (loss) to date | (59.9 | ) | | 25.0 |
|
| | 1,201.4 |
| | 1,216.4 |
|
| Less: Billings to date | (1,202.0 | ) | | (1,235.8 | ) |
| Billings in excess of costs and estimated earnings | $ | (0.6 | ) | | $ | (19.4 | ) |
These amounts are included in the accompanying consolidated balance sheets at December 31, 2017 and 2016 as shown below. Amounts for billed retainages and receivables to be collected in excess of one year are not significant for the periods presented.
|
| | | | | | | |
| | 2017 | | 2016 |
Costs and estimated earnings in excess of billings(1) | $ | 28.8 |
| | $ | 33.9 |
|
Billings in excess of costs and estimated earnings on uncompleted contracts(2) | (29.4 | ) | | (53.3 | ) |
| Net billings in excess of costs and estimated earnings | $ | (0.6 | ) | | $ | (19.4 | ) |
| |
(1)
| Reported as a component of “Accounts receivable, net.” |
| |
(2)
| Reported as a component of “Accrued expenses.” |
Research and Development Costs — We expense research and development costs as incurred. We charge costs incurred in the research and development of new software included in products to expense until technological feasibility is established. After technological feasibility is established, additional eligible costs are capitalized until the product is
available for general release. We amortize these costs over the economic lives of the related products and include the amortization in cost of products sold. We perform periodic reviews of the recoverability of these capitalized software costs. At the time we determine that capitalized amounts are not recoverable based on the estimated cash flows to be generated from the applicable software, we write off any unrecoverable capitalized amounts. Capitalized software, net of amortization, totaled $8.3$0.1 and $10.5$1.3 as of December 31, 20172021 and 2016,2020, respectively. Capitalized software amortization expense totaled $1.3, $2.5, and $2.4 $1.2in 2021, 2020, and $0.2 for 2017, 2016 and 2015,2019, respectively. We expensed research activities relating to the development and improvement of our products of $23.3, $29.1$30.7, $28.1 and $28.6$24.3 in 2017, 20162021, 2020 and 2015,2019, respectively.
Property, Plant and Equipment — Property, plant and equipment (“PP&E”) is stated at cost, less accumulated depreciation. We use the straight-line method for computing depreciation expense over the useful lives of PP&E, which do not exceed 40 years for buildings and range from 3 to 15 years for machinery and equipment. Depreciation expense, including amortization of capitalfinance leases, was $22.2, $22.5$19.4, $15.4 and $31.8$13.1 for the years ended December 31, 2017, 20162021, 2020 and 2015,2019, respectively. Leasehold improvements are amortized over the life of the related asset or the life of the lease, whichever is shorter. Interest is capitalized on significant construction or installation projects. No interest was capitalized during 2017, 20162021, 2020 or 2015.2019.
Pension and Postretirement — We recognize changes in the fair value of plan assets and actuarial gains and losses in earnings during the fourth quarter of each year, unless earlier remeasurement is required, as a component of net periodic benefit expenseexpense/income and, accordingly, recognize the effects of plan investment performance, interest rate changes, and changes in actuarial assumptions as a component of earnings in the year in which they occur. The remaining components of pension/postretirement expense,expense/income, primarily service and interest costs and expected return on plan assets, are recorded on a quarterly basis.
Income Taxes — We account for our income taxes based on the requirements of the Income Taxes Topic of the Codification, which includes an estimate of the amount of taxes payable or refundable for the current year and deferred tax liabilities and assets for the future tax consequences of events that have been recognized in our consolidated financial statements or tax returns. Deferred income taxes reflect the net tax effects of temporary differences between the carrying amounts of assets and liabilities for financial reporting purposes and the amounts used for income tax purposes. We periodically assess the realizability of deferred tax assets and the adequacy of deferred tax liabilities, including the results of local, state, federal or foreign statutory tax audits or estimates and judgments used.
Derivative Financial Instruments — We use foreign currency forward contracts to manage our exposures to fluctuating currency exchange rates, forward contracts to manage the exposure on forecasted purchases of commodity raw materials (“commodity contracts”) and interest rate protection agreements to manage our exposures to fluctuating interest rate risk on variable rate debt. Derivatives are recorded on the balance sheet and measured at fair value. For derivatives designated as hedges of the fair value of assets or liabilities, the changes in fair values of both the derivatives and the hedged items are recorded in current earnings. For derivatives designated as cash flow hedges, the effective portion of the changeschange in fair value of the derivatives is recorded in accumulated other comprehensive income (“AOCI”) and subsequently recognized in earnings when the hedged items impact earnings. Changes in the fair value of derivatives not designated as hedges, and the ineffective portion of cash flow hedges, are recorded in currentforecasted transaction impacts earnings. We do not enter into financial instruments for speculative or trading purposes.
For those transactions that are designated as cash flow hedges, on the date the derivative contract is entered into, we document our hedge relationship, including identification of the hedging instruments and the hedged items, as well as our risk management objectives and strategies for undertaking the hedge transaction.transaction. We also assess, both at inception and quarterly thereafter, whether such derivatives are highly effective in offsetting changes in the fair value of the hedged item. See Notes 1214 and 1417 for further information.
Cash flows from hedging activities are included in the same category as the items being hedged, which are primarily operating activities.
Reclassification of Prior Years’ Amounts – Certain prior years’ amounts have been reclassified to conform to the current year presentation, including amounts related to the inclusion of Transformer Solutions and DBT within discontinued operations.
(2) Use of Estimates
The preparation of our consolidated financial statements in conformity with GAAP requires us to make estimates and assumptions. These estimates and assumptions affect the reported amounts of assets and liabilities, the disclosure of contingent assets and liabilities at the date of the consolidated financial statements, and the reported amounts of revenues (e.g., our percentage-of-completion estimates described above) and expenses during the reporting period. We evaluate these estimates and judgments on an ongoing basis and base our estimates on experience, current and expected future conditions, third-party evaluations and various other assumptions that we believe are reasonable under the circumstances. The results of these estimates form the basis for making judgments about the carrying values of assets and liabilities as well as identifying and assessing the accounting treatment with respect to commitments and contingencies. Actual results may differ from the estimates and assumptions used in the consolidated financial statements and related notes.
Listed below are certain significant estimates and assumptions used in the preparation of our consolidated financial statements. Certain other estimates and assumptions are further explained in the related notes.
Accounts Receivable Allowances — We provide allowances for estimated losses on uncollectible accounts based on our historical experience and the evaluation of the likelihood of success in collecting specific customer receivables. In addition, we
maintain allowances for customer returns, discounts and invoice pricing discrepancies, with such allowances primarily based on historical experience. Summarized below is the activity for these allowance accounts.
| | | | | | | | | | | | | | | | | |
| Year ended December 31, |
| 2021 | | 2020 | | 2019 |
| Balance at beginning of year | $ | 11.5 | | | $ | 8.5 | | | $ | 9.3 | |
| Acquisitions | — | | | 0.3 | | | 0.3 | |
| Allowances provided | 14.9 | | | 18.6 | | | 18.2 | |
| Write-offs, net of recoveries, credits issued and other | (16.0) | | | (15.9) | | | (19.3) | |
| Balance at end of year | $ | 10.4 | | | $ | 11.5 | | | $ | 8.5 | |
|
| | | | | | | | | | | |
| | Year ended December 31, |
| | 2017 | | 2016 | | 2015 |
| Balance at beginning of year | $ | 10.1 |
| | $ | 9.1 |
| | $ | 12.9 |
|
| Allowances provided | 13.2 |
| | 15.7 |
| | 14.0 |
|
| Write-offs, net of recoveries, credits issued and other | (13.1 | ) | | (14.7 | ) | | (17.8 | ) |
| Balance at end of year | $ | 10.2 |
| | $ | 10.1 |
| | $ | 9.1 |
|
Inventory — We estimate losses for excess and/or obsolete inventory and the net realizable value of inventory based on the aging and historical utilization of the inventory and the evaluation of the likelihood of recovering the inventory costs based on anticipated demand and selling price.
Long-Lived Assets and Intangible Assets Subject to Amortization — We continually review whether events and circumstances subsequent to the acquisition of any long-lived assets, orincluding intangible assets subject to amortization, have occurred that indicate the remaining estimated useful lives of those assets may warrant revision or that the remaining balance of those assets may not be fully recoverable. If events and circumstances indicate that the long-lived assets should be reviewed for possible impairment, we use projections to assess whether future cash flows on an undiscounted basis related to the assets are likely to exceed the related carrying amount. We will record an impairment charge to the extent that the carrying value of the assets exceed their fair values as determined by valuation techniques appropriate in the circumstances, which could include the use of similar projections on a discounted basis.
In determining the estimated useful lives of definite-lived intangibles, we consider the nature, competitive position, life cycle position, and historical and expected future operating cash flows of each acquired asset, as well as our commitment to support these assets through continued investment and legal infringement protection.
Goodwill and Indefinite-Lived Intangible Assets — We testreview goodwill and indefinite-lived intangible assets for impairment annually during the fourth quarter and continually assess whether a triggering event has occurred to determine whether the carrying value exceeds the implied fair value. TheIn reviewing goodwill for impairment, we first assess qualitative factors to determine whether the existence of events or circumstances leads to a determination that it is more likely than not (greater than 50%) that the estimated fair value of a reporting unit is less than its carrying amount. If we determine that an impairment is more likely than not, we then perform a quantitative impairment test (described below). Otherwise, no further analysis is required. Our qualitative evaluation is an assessment of factors, including reporting unit-specific operating results, as well as industry, market, and general economic conditions. Our quantitative analysis of the fair value of reporting units is based generally on discounted projected cash flows, but we also consider factors such as comparable industry price multiples. We employ cash flow projections that we believe to be reasonable under current and forecasted circumstances, the results of which form the basis for making judgments about the carrying values of the reported net assets of our reporting units. Many of our businesses closely follow changes in the industries and end markets that they serve. Accordingly, we consider estimates and judgments that affect the future cash flow projections, including principal methods of competition, such as volume, price, service, product performance and technical innovations, as well as estimates associated with cost reduction initiatives, capacity utilization and assumptions for inflation and foreign currency changes. Actual results may differ from these estimates under different assumptions or conditions.
Accrued Expenses — We make estimates and judgments in establishing accruals as required under GAAP. Summarized in the table below are the components of accrued expenses at December 31, 20172021 and 2016.2020.
| | | | | | | | | | | |
| December 31, |
| 2021 | | 2020 |
| Employee benefits | $ | 66.7 | | | $ | 69.2 | |
| Warranty | 11.8 | | | 11.6 | |
Other (1) | 139.4 | | | 125.8 | |
| Total | $ | 217.9 | | | $ | 206.6 | |
(1)Other consists of various items including, among other items, the current portion of our liabilities related to risk management matters, environmental remediation costs, and operating leases, as well as, accrued rebates, legal, interest and restructuring costs, none of which is individually material.
|
| | | | | | | |
| | December 31, |
| | 2017 | | 2016 |
| Employee benefits | $ | 68.9 |
| | $ | 69.3 |
|
Unearned revenue(1) | 100.1 |
| | 117.8 |
|
| Warranty | 13.8 |
| | 15.6 |
|
Other(2) | 109.8 |
| | 101.6 |
|
| Total | $ | 292.6 |
| | $ | 304.3 |
|
| |
(1)
| Unearned revenue includes billings in excess of costs and estimated earnings on uncompleted contracts accounted for under the percentage-of-completion method of revenue recognition, customer deposits and unearned amounts on service contracts. |
| |
(2)
| Other consists of various items including, among other items, accrued legal costs, interest and restructuring costs, none of which is individually material. |
Legal — It is our policy to accrue for estimated losses from legal actions or claims when events exist that make the realization of the losses probable and they can be reasonably estimated. We do not discount legal obligations or reduce them by anticipated insurance recoveries. See Note 15 for additional details.
Environmental Remediation Costs — We expense costs incurred to investigate and remediate environmental issues unless they extend the economic useful lives of related assets. We record liabilities when it is probable that an obligation has been incurred and the amounts can be reasonably estimated. Our environmental accruals cover anticipated costs, including investigation, remediation and operation and maintenance of clean-up sites. Our estimates are based primarily on investigations and remediation plans established by independent consultants, regulatory agencies and potentially responsible third parties. We generally do not discount environmental obligations or reduce them by anticipated insurance recoveries.
Risk Management Matters — We are subject to claims associated with risk management matters (e.g., product liability, predominately associated with alleged exposure to asbestos-containing materials, general liability, automobile, and workers’ compensation claims). The liabilities we record for these claims are based on a number of assumptions, including historical claims and payment experience and, with respect to asbestos claims, actuarial estimates of the future period during which additional claims are reasonably foreseeable. We also have recorded insurance recovery assets associated with the asbestos product liability matters. These assets represent amounts that we believe we are or will be entitled to recover under agreements we have with insurance companies. The assets we record for these insurance recoveries are based on a number of assumptions, including the continued solvency of the insurers, and are subject to a varietyour legal interpretation of uncertainties.our rights for recovery under the agreements we have with the insurers. In addition, we are self-insured for certain of our workers’ compensation, automobile, product, general liability, disability and health costs, and we maintain adequate accruals to cover our retained liabilities. Our accruals for self-insurance liabilities are based on claims filed and an estimate of claims incurred but not yet reported, and generally are not discounted. We consider a number of factors, including third-party actuarial valuations, when making these determinations. We maintain third-party stop-loss insurance policies to cover certain liability costs in excess of predetermined retained amounts; however, this insurance may be insufficient or unavailable (e.g., because of insurer insolvency) to protect us against potential loss exposures. The key assumptions considered in estimating the ultimate cost to settle reported claims and the estimated costs associated with incurred but not yet reported claims include, among other factors, our historical and industry claims experience, trends in health care and administrative costs, our current and future risk management programs, and historical lag studies with regard to the timing between when a claim is incurred and reported. See Note 1315 for additional details.
Warranty — In the normal course of business, we issue product warranties for specific products and provide for the estimated future warranty cost in the period in which the sale is recorded. We provide for the estimate of warranty cost based on contract terms and historical warranty loss experience that is periodically adjusted for recent actual experience. Because warranty estimates are forecasts that are based on the best available information, claims costs may differ from amounts provided. In addition, due to the seasonal fluctuations at certain of our businesses, the timing of warranty provisions and the usage of warranty accruals can vary period to period. We make adjustments to initial obligations for warranties as changes in the obligations become reasonably estimable. The following is an analysis of our product warranty accrual for the periods presented:
| | | | Year ended December 31, | | Year ended December 31, |
| | 2017 | | 2016 | | 2015 | | 2021 | | 2020 | | 2019 |
| Balance at beginning of year | $ | 35.8 |
| | $ | 36.3 |
| | $ | 34.5 |
| Balance at beginning of year | $ | 35.3 | | | $ | 31.7 | | | $ | 30.1 | |
| Acquisitions | | Acquisitions | 0.1 | | | 1.6 | | | 0.4 | |
| Provisions | 13.0 |
| | 15.2 |
| | 18.1 |
| Provisions | 8.5 | | | 12.4 | | | 12.0 | |
| Usage | (15.4 | ) | | (15.5 | ) | | (16.0 | ) | Usage | (9.1) | | | (10.6) | | | (10.7) | |
| Currency translation adjustment | 0.5 |
| | (0.2 | ) | | (0.3 | ) | Currency translation adjustment | — | | | 0.2 | | | (0.1) | |
| Balance at end of year | 33.9 |
| | 35.8 |
| | 36.3 |
| Balance at end of year | 34.8 | | | 35.3 | | | 31.7 | |
| Less: Current portion of warranty | 13.8 |
| | 15.6 |
| | 17.0 |
| Less: Current portion of warranty | 11.8 | | | 11.6 | | | 10.8 | |
| Non-current portion of warranty | $ | 20.1 |
| | $ | 20.2 |
| | $ | 19.3 |
| Non-current portion of warranty | $ | 23.0 | | | $ | 23.7 | | | $ | 20.9 | |
Income Taxes — We perform reviews of our income tax positions on a continuous basis and accrue for potential uncertain tax positions in accordance with the Income Taxes Topic of the Codification. Accruals for these uncertain tax positions are classified as “Income taxes payable” and “Deferred and other income taxes” in the accompanying consolidated balance sheets based on an expectation as to the timing of when the matter will be resolved. As events change or resolutions occur, these accruals are adjusted, such as in the case of audit settlements with taxing authorities. For tax positions where it is more likely than not that a tax benefit will be sustained, we record the largest amount of tax benefit with a greater than 50% likelihood of being realized upon ultimate settlement with a taxing authority, assuming such authority has full knowledge of all relevant information. These reviews also entail analyzing the realization of deferred tax assets. When we believe that it is more
likely than not that we will not realize a benefit for a deferred tax asset based on all available evidence, we establish a valuation allowance.
Employee Benefit Plans — Defined benefit plans cover a portion of our salaried and hourly employees, including certain employees in foreign countries. As discussed in Note 1, we recognize changes in the fair value of plan assets and actuarial gains and losses associated with our pension and postretirement benefit plans in earnings during the fourth quarter of each year, unless earlier remeasurement is required, as a component of net periodic benefit expense. The remaining components of pension/postretirement expense, primarily service and interest costs and expected return on plan assets, are recorded on a quarterly basis. See Note 911 for further discussion of our pension and postretirement benefits.
We derive pension expense from an actuarial calculation based on the defined benefit plans’ provisions and our assumptions regarding discount rate and rate of increase in compensation levels.rate. We primarily determine the discount rate for our more significant U.S. plans by matching the expected projected benefit obligation cash flows for each of the plans to a yield curve that is representative of long-term, high-quality (rated AA or higher) fixed income debt instruments as of the measurement date. For our other plans, we determine the discount rate based on representative bond indices. The rate of increase in compensation levels is established based on our expectations of current and foreseeable future increases in compensation. We also consult with independent actuaries in determining these assumptions.
Parent Guarantees and Bonds Associated with Balcke Dürr — As further discussed in Note 4, inIn connection with the sale of Balcke Dürr in 2016, we remainbecame contingently obligated under existing parent company guarantees and bank and surety bonds which totaled approximately EuroEuro 79.0 and Euro 79.0, respectively,respectively, at the time of sale. Since the sale (and Euro 76.1of Balcke Dürr, the guarantees have expired and, Euro 47.9, respectively, at December 31, 2017).as of the third quarter of 2021, all the bonds have been returned. We have accounted for our contingent obligation in accordance with the Guarantees Topic of the Codification, which required that we record a liability for the estimated fair value of the parent company guarantees and the bonds in connection with the accounting for the sale of Balcke Dürr. We estimated the fair value of the parent company guarantees and bank and surety bonds considering the probability of default by Balcke Dürr and an estimate of the amount we would be obligated to pay in the event of a default. As also discussed in Note 4, underUnder the related purchase agreement, Balcke Dürr provided cash collateral and mutares AGthe parent company of the buyer provided a partial guarantee in the event any of the parent company guarantees or bonds arewere called. We recorded an asset for the estimated fair value of the cash collateral provided by Balcke Dürr and the partial guarantee provided by mutares AG,the parent company of the buyer, with the estimated fair values based on the terms and conditions and relative risk associated with each of these securities. By way of an offset to “Other expense, net,” we are reducing the liability and amortizing the asset, with the reduction of the liability generally to occur upon return of the guarantee or bond which is expected to occur at the earlier of the completion of the related underlying project milestones or the expiration ofAs the guarantees or bonds,have expired and the amortization of the asset to occur based on the expiration terms of each of the securities. We will continue to evaluate the adequacy of thebonds have been returned, we no longer have assets or liabilities recorded liability and will record an adjustment to the liability if we conclude that it is probable that we will be required to fund an amount greater than what is recorded.for this matter. See Note 1517 for further information regarding the estimated fair values of the parent company guarantees and bonds, as well as the cash collateral provided by Balcke Dürr and the partial guarantee provided by mutares AG.
additional details.
(3) New Accounting Pronouncements
The following is a summary of new accounting pronouncements that apply or may apply to our business.
In May 2014,June 2016, the Financial Accounting Standards Board (“FASB”) issued a new standard on revenue recognition that outlines a single comprehensive modelAccounting Standards Update (“ASU”) 2016-13.ASU 2016-13 changes how entities measure credit losses for entities to use in accounting for revenue arising from contracts with customers and supersedes most current revenue recognition guidance, including industry-specific guidance. The new standard contains a five-step approach that entities will apply to determine the measurement of revenue and timing of when it is recognized, including (i) identifying the contract(s) with a customer, (ii) identifying the separate performance obligations in the contract, (iii) determining the transaction price, (iv) allocating the transaction price to separate performance obligations, and (v) recognizing revenue when (or as) each performance obligation is satisfied. The new standard requires a number of disclosures intended to enable users of financial statements to understand the nature, amount, timing and uncertainty of revenue, and the related cash flows. The disclosures include qualitative and quantitative information about contracts with customers, significant judgments made in applying the revenue guidance, and assets recognized from the costs to obtain or fulfill a contract. The standard is effective for interim and annual reporting periods beginning after December 15, 2017 and we plan to adopt the standard using the modified retrospective transition method. The modified retrospective transition approach will recognize any changes from the beginning of the year of initial application through retained earnings with no restatement of comparative periods. The more significant effects on our existing accounting policies will be associated with our power transformer business. Under the new standard, revenue for our power transformers will be recognized over time, which is a change from our current accounting policy of recognizing revenue for power transformers at a point in time. We have yet to finalize our analysis of the initial impact of adopting the new standard, but currently estimate that the adoption will result in a decrease to our retained deficit, as of January 1, 2018, of less than $6.0. We do not believe the adoption will have a material impact on our future results of operations.
In February 2016, the FASB issued an amendment to existing guidance that requires lessees to recognize assets and liabilities for the rightscertain other instruments that are not measured at fair value through net income, including trade receivables, based on historical experience, current conditions, and obligations created by long-term leases. In addition, this amendment requires new qualitativereasonable and quantitative disclosures about leasing arrangements. This standard is effective for annual periods beginning on or after December 15, 2018 for public business entities, and interim periods within those fiscal years. Early adoption is permitted, and adoption mustsupportable forecasts. The requirements of ASU 2016-13 are to be applied on a modified retrospective basis. We are currently evaluatingbasis, which entails recognizing the initial effect this new standard will have on our consolidated financial statements.
In March 2016, the FASB issued an amendment to existing guidance that simplifies several aspects of the accounting for employee shared-based payment transactions, including the accounting for income taxes, forfeitures, and statutory tax withholding requirements, as well as classificationadoption in the statement of cash flows. This standard is effective for annual reporting periods beginning after December 15, 2016, including interim periods within those annual reporting periods. The standard requires that all excess tax benefits and deficiencies previously recorded in “equity” be prospectively recorded to the statement of operations within the income tax (provision) benefit. These excess tax benefits and deficiencies are primarily driven by fluctuations in our stock price between the date a share-based award is granted and the date the award vests. As such, under this standard we could experience volatility in our income tax (provision) benefit and effective income tax rate. The standard also requires excess tax benefits or deficiencies be presented as an operating activity within the statement of cash flows rather than as a financing activity.retained earnings. We adopted this guidanceASU 2016-13 on January 1, 2017. As such, we recognized income tax benefits of $0.62020, which resulted in our 2017 consolidated statement of operations and classified such amount within operating activitiesan increase of our 2017 consolidated statementretained deficit of cash flows. Lastly, we elected to continue estimating stock-based compensation award forfeitures in determining the amount of compensation expense to be recognized each period.$0.5.
In August 2016, the FASB issued an amendment to existing guidance to reduce diversity in practice in how certain cash receipts and cash payments are presented in the statement of cash flows. This amendment provides clarification on eight specific cash flow presentation issues. The issues include, but are not limited to, debt prepayment or extinguishment costs, settlement of zero-coupon debt, proceeds from the settlement of insurance claims, and cash receipts from payments on beneficial interests in securitization transactions. This amendment is effective for annual reporting periods beginning after December 15, 2017, including interim periods within those annual reporting periods. Early adoption is permitted. We will adopt the standard, effective January 1, 2018. The adoption of this standard is not expected to have a material impact on our consolidated financial statements.
In January 2017, the FASB issued an amendment to simplify the subsequent measurement of goodwill by removing the second step of the two-step impairment test. The amendment requires that an entity recognize an impairment charge for the amount by which the carrying amount exceeds the reporting unit’s fair value. This amendment is effective
for annual reporting periods beginning after December 31, 2019, including interim periods within those annual reporting periods. EarlyWe adopted this guidance during the first quarter of 2020, with such adoption having no impact to our consolidated financial statements.
In August 2018, the FASB issued amended guidance to simplify fair value measurement disclosure requirements. The new provisions eliminate the requirements to disclose (i) transfers between Level 1 and Level 2 of the fair value hierarchy, (ii) policies related to valuation processes and the timing of transfers between levels of the fair value hierarchy, and (iii) net asset value disclosure of estimates of timing of future liquidity events. The FASB also modified disclosure requirements of Level 3 fair value measurements. This guidance is effective for annual periods beginning after December 15, 2019. We adopted this guidance on January 1, 2020, with no impact on our consolidated financial statements.
In December 2019, the FASB issued ASU No. 2019-12, Simplifying the Accounting for Income Taxes (Topic 740). This ASU simplifies the accounting for income taxes by, among other things, eliminating certain existing exceptions related to the general approach in ASC 740 relating to franchise taxes, reducing complexity in the interim-period accounting for year-to-date loss limitations and changes in tax laws, and clarifying the accounting for the step-up in the tax basis of goodwill. The transition requirements are primarily prospective and the effective date is for interim and annual reporting periods beginning after December 15, 2020, with early adoption permitted. We adopted this guidance on January 1, 2021, with no material impact on our consolidated financial statements.
The London Interbank Offered Rate (“LIBOR”) is scheduled to be discontinued on June 30, 2023, with some tenors ceasing on December 31, 2021. In an effort to address the various challenges created by such discontinuance, the FASB issued two amendments to existing guidance, ASU No. 2020-04 and No. 2021-01, Reference Rate Reform. The amended guidance is designed to provide relief from the accounting analysis and impacts that may otherwise be required for modifications to agreements (e.g., loans, debt securities, derivatives, etc.) necessitated by the reference rate reform. It also provides optional expedients to enable companies to continue to apply hedge accounting to certain hedging relationships impacted by the reference rate reform. Application of the guidance in the amendments is optional, is only available in certain situations, and is only available for companies to apply until December 31, 2022. In preparation of our adoption of these amendments, we entered into a LIBOR transition amendment related to our global revolving credit facility, as described in Note 13. Upon adoption, we do not believe these amendments will have a material impact to our consolidated financial statements.
In October 2021, the FASB issued ASU No. 2021-08, Business Combinations (Topic 805): Accounting for Contract Assets and Contract Liabilities from Contracts with Customers. This ASU requires acquiring entities to apply Topic 606 to recognize and measure contract assets and contract liabilities in a business combination. This guidance is effective for public entities for fiscal years beginning after December 15, 2022, including interim periods within those fiscal years. The impact of adopting this amendmentguidance on our consolidated financial statements will depend on business combinations occurring on or after the results of future goodwill impairment tests.effective date.
In March 2017, the FASB issued an amendment to revise the presentation of net periodic pension and postretirement benefit cost. The amendment requires the service cost component to be presented separately from the other components of net periodic pension and postretirement benefit cost. Service cost will be presented with other employee compensation costs within operating income. The other components of net periodic pension and postretirement benefit cost, such as interest cost, expected return on plan assets, amortization of prior service cost/credits, and gains or losses, are required to be separately presented outside of operating income. This amendment is effective for annual reporting periods beginning after December 15, 2017, including interim periods within those annual periods. The amendment to the presentation in the income statement of the service cost component and the other components of net periodic pension cost and net periodic postretirement benefit cost shall be applied retrospectively. We will adopt the standard, effective January 1, 2018. The adoption is not expected to have a material impact on our consolidated financial statements. See Note 9 for details of our pension and postretirement expense.
In August 2017, the FASB issued significant amendments to hedge accounting. The FASB’s new guidance will make more financial and nonfinancial hedging strategies eligible for hedge accounting. It also amends the presentation and disclosure requirements and changes how companies assess effectiveness. It is intended to more closely align hedge accounting with companies’ risk management strategies, simplify the application of hedge accounting, and increase transparency as to the scope and results of hedging programs. The amendments can be adopted immediately in any interim or annual period (including the current period). The mandatory effective date for calendar year-end public companies is January 1, 2019. We are currently evaluating the effect this amendment will have on our consolidated financial statements.
In February 2018, the FASB amended its guidance for reporting comprehensive income to reflect the potential impacts of the reduction in the corporate tax rate resulting from the Tax Cuts and Jobs Act. The amendment gives the option of reclassifying the stranded tax effects within AOCI to retained earnings during the fiscal year or quarter in which the effect of the lower tax rate is recorded. The amendment is effective for years beginning after December 15, 2018, with early adoption permitted. We expect to adopt this amendment as of January 1, 2018, with the impact not expected to be material to our retained deficit.
(4) Acquisitions and Discontinued Operations and Other Dispositions
Sale of Balcke Dürr BusinessAcquisitions
As indicated in Note 1, on February 1, 2019, July 3, 2019, November 12, 2019, September 2, 2020, November 11, 2020, April 19, 2021, August 2, 2021 and December 30, 2016,15, 2021, we completed the acquisitions of Sabik, SGS, Patterson-Kelley, ULC, Sensors & Software, Sealite, ECS, and Cincinnati Fan, respectively. The pro forma effects of these acquisitions are not material to our consolidated results of operations.
Sale of Transformer Solutions Business
As discussed in Note 1, on October 1, 2021, we completed the sale of Balcke DürrTransformer Solutions for net cash proceeds of less than $0.1. In addition, we left $21.1 of cash in Balcke Dürr at the time of the sale and provided the Buyer with a non-interest bearing loan of $9.1, payable in installments due at the end of 2018 and 2019.$620.6. In connection with the sale, we recorded a net lossgain of $78.6$382.2 to “Gain“Gain (loss) on disposition of discontinued operations, net of tax” duringtax” within our consolidated statement of operations for the fourth quarter of 2016.year ended December 31, 2021.
The purchase agreement provides that existing parent company guarantees and bank and surety bonds, which totaled approximately Euro 79.0 and Euro 79.0, respectively, at the time of sale (and Euro 76.1 and Euro 47.9, respectively, at December 31, 2017), will remain in place through each instrument’s expiration date, with such expiration dates occurring through 2022. Balcke Dürr and the Buyer have provided us a full indemnity in the event that any of these guarantees or bonds are called. Also, at the time of sale, Balcke Dürr provided cash collateral of Euro 4.0 and mutares AG provided a guarantee of Euro 5.0 as a security for the above indemnifications (Euro 4.0 and Euro 3.0, respectively, at December 31, 2017). The net loss recorded at the time of the sale of $78.6 includes a charge of $5.1 associated with the estimated fair value of the guarantees and bonds, after consideration of the indemnifications provided in the event any of the guarantees or bonds are called. See Note 15 for further details regarding the estimated fair value of these guarantees and bonds.
The final sales price for Balcke Dürr is subject to adjustment based on cash and working capital existing at the closing date and is subject to agreement with the Buyer. Final agreement of the cash and working capital amounts with the Buyer has yet to occur. Accordingly, it is possible that the sales price and resulting loss for this divestiture may be materially adjusted in subsequent periods.
As indicated in Note 1, the results of Balcke DürrTransformer Solutions are presented as a discontinued operation for all periods presented. Major line items constituting pre-tax income and after-tax income of Transformer Solutions for the period January 1, 2021 to October 1, 2021 and the years ended December 2020 and 2019 are shown below:
| | | | | | | | | | | | | | | | | | | | |
| |
| | 2021 | | 2020 | | 2019 |
| Revenues | | $ | 313.5 | | | $ | 427.4 | | | $ | 403.4 | |
| Costs and expenses: | | | | | | |
| Cost of product sold | | 257.2 | | | 338.7 | | | 334.1 | |
| Selling, general and administrative | | 28.4 | | | 32.7 | | | 30.2 | |
| Special charges | | — | | | — | | | 0.3 | |
| Other income, net | | — | | | 0.9 | | | 0.6 | |
| Income before tax | | 27.9 | | | 56.9 | | | 39.4 | |
| Income tax provision | | (7.0) | | | (14.0) | | | (8.8) | |
| Income after tax | | $ | 20.9 | | | $ | 42.9 | | | $ | 30.6 | |
The assets and liabilities of Transformer Solutions have been classified as assets and liabilities of discontinued operations as of December 31, 2020. The major line items constituting Transformer Solutions assets and liabilities as of December 31, 2020 are shown below:
| | | | | | | | |
| ASSETS | | |
| Accounts receivable, net | | $ | 50.9 | |
| Contract assets | | 48.6 | |
| Inventories, net | | 21.7 | |
| Other current assets | | 3.2 | |
| Property, plant and equipment: | | |
| Land | | 6.5 | |
| Buildings and leasehold improvements | | 63.1 | |
| Machinery and equipment | | 141.1 | |
| | 210.7 | |
| Accumulated depreciation | | (131.0) | |
| Property, plant and equipment, net | | 79.7 | |
| Goodwill | | 131.3 | |
| Other assets | | 8.1 | |
| Total assets - discontinued operations | | $ | 343.5 | |
| LIABILITIES | | |
| Accounts payable | | $ | 34.1 | |
| Contract liabilities | | 57.2 | |
| Accrued expenses | | 24.5 | |
| Deferred and other income taxes | | 22.3 | |
| Other long-term liabilities | | 9.1 | |
| Total liabilities - discontinued operations | | $ | 147.2 | |
Wind-Down of DBT Business
As discussed in Note 1, we completed the wind-down of our DBT business in the fourth quarter of 2021. As a result of completing the wind-down plan, we are now reporting DBT as a discontinued operation for all periods presented. In connection with the wind-down, we recorded a charge of $19.9 to “Gain (loss) on disposition of discontinued operations, net of tax”within our consolidated statement of operations for the accompanying consolidated financial statements. year ended December 31, 2021 to reflect the write-off of historical currency translation amounts associated with DBT that had been previously reported within “Stockholders' equity.”
Major classes of line items constituting pre-tax loss and after-tax loss of Balcke DürrDBT for the years ended December 31, 20162021, 2020 and 20152019 are shown below:
| | | | | | | | | | | | | | | | | | | | |
| |
| | 2021 | | 2020 | | 2019 |
Revenues (1) | | $ | 0.5 | | | $ | 4.0 | | | $ | (6.1) | |
| Costs and expenses: | | | | | | |
| Cost of product sold | | 0.9 | | | 6.9 | | | 22.4 | |
| Selling, general and administrative | | 15.1 | | | 14.8 | | | 11.6 | |
| Special charges | | 1.3 | | | 0.8 | | | 2.6 | |
| Other income (expense), net | | (1.2) | | | 1.9 | | | (0.6) | |
| Interest income, net | | 0.1 | | | — | | | 0.2 | |
| Loss before tax | | (17.9) | | | (16.6) | | | (43.1) | |
| Income tax benefit | | 2.7 | | 2.4 | | 7.3 |
| Loss after tax | | $ | (15.2) | | | $ | (14.2) | | | $ | (35.8) | |
(1) During the year ended December 31, 2019, we reduced the amount of revenue associated with the large power projects in South Africa by $23.5. See below for further discussion.
During February, April, and July of 2019, we received a number of claims from the prime contractors on the large power projects in South Africa asserting various amounts of damages. In consideration of these claims (including the magnitude of the claims and claims in areas that had not been previously identified by the prime contractors), and in accordance with ASC 606, we analyzed the risk of a significant revenue reversal associated with the amount of variable consideration that had been recorded for these projects. Based on such analysis, we reduced the amount of cumulative revenue associated with variable consideration on these projects by $17.5 during the first quarter of 2019, as it was no longer probable that such amounts of revenue would not be reversed.
On June 28, 2019, DBT reached an agreement with Alstom S&E Africa (PTY) LTD (“Alstom/GE”), one of the prime contractors on the large power projects in South Africa to, among other things, settle all material outstanding claims between the parties (other than certain pass-through claims relating to third parties). In connection with the agreement, we reduced the amount of cumulative revenue associated with variable consideration on the large power projects in South Africa by $6.0 during the second quarter of 2019.
|
| | | | | | | |
| | Year ended December 31, |
| | 2016 | | 2015 |
| Revenues | $ | 153.4 |
| | $ | 160.3 |
|
| Costs and expenses: | | | |
| Costs of products sold | 144.2 |
| | 143.8 |
|
| Selling, general and administrative | 31.4 |
| | 37.9 |
|
| Impairment of goodwill | — |
| | 13.7 |
|
| Special charges (credits), net | (1.3 | ) | | 12.7 |
|
| Other expense | (0.2 | ) | | (0.9 | ) |
| Loss before taxes | (21.1 | ) | | (48.7 | ) |
| Income tax benefit | 4.5 |
| | 9.1 |
|
| Loss from discontinued operations | $ | (16.6 | ) | | $ | (39.6 | ) |
The following table presents selected financial information for Balcke Dürr that isassets and liabilities of DBT have been included within discontinued operations“Assets of DBT and Heat Transfer” and “Liabilities of DBT and Heat Transfer,” respectively, on the consolidated balance sheets as of December 31, 2021 and 2020. The major line items constituting DBT's assets and liabilities as of December 31, 2021 and 2020 are shown below:
| | | | | | | | | | | | | | |
| | December 31, 2021 | | December 31, 2020 |
| ASSETS | | | | |
| Cash and equivalents | | $ | 7.8 | | | $ | 4.3 | |
| Accounts receivable, net | | 9.1 | | | 10.1 | |
| Other current assets | | 7.0 | | | 7.5 | |
| Property, plant and equipment: | | | | |
| Buildings and leasehold improvements | | 0.2 | | | 5.7 | |
| Machinery and equipment | | 1.5 | | | 7.3 | |
| | 1.7 | | | 13.0 | |
| Accumulated depreciation | | (1.5) | | | (9.8) | |
| Property, plant and equipment, net | | 0.2 | | | 3.2 | |
| Other assets | | 27.6 | | | 17.9 | |
| Total assets of DBT | | $ | 51.7 | | | $ | 43.0 | |
| LIABILITIES | | | | |
| Accounts payable | | $ | 2.3 | | | $ | 2.3 | |
| Contract liabilities | | 5.6 | | | 7.5 | |
| Accrued expenses | | 22.4 | | | 2.5 | |
| Other long-term liabilities | | 4.9 | | | 5.3 | |
| Total liabilities of DBT | | $ | 35.2 | | | $ | 17.6 | |
Wind-Down of the Heat Transfer Business
As discussed in Note 1, we completed the wind-down of our Heat Transfer business in the consolidated statementsfourth quarter of cash flows2020. As a result of completing the wind-down plan, we are reporting Heat Transfer as a discontinued operation for all periods presented.
Major line items constituting pre-tax income (loss) and after-tax income (loss) of Heat Transfer for the years ended December 31, 20162020 and 2015:2019 are shown below:
| | | | | | | | | | | | | | | | | |
| | | |
| | | | | 2020 | | 2019 |
| Revenues | | | | | $ | 3.9 | | | $ | 4.5 | |
| Costs and expenses: | | | | | | | |
| Cost of products sold | | | | | 3.1 | | | 6.1 | |
| Selling, general and administrative | | | | | 0.1 | | | 0.9 | |
| Special charges (credits), net | | | | | 0.4 | | | (0.4) | |
| Other income, net | | | | | — | | | 0.3 | |
| Income (loss) before tax | | | | | 0.3 | | | (1.8) | |
| Income tax (provision) benefit | | | | | (0.1) | | | 0.4 | |
| Income (loss) after tax | | | | | $ | 0.2 | | | $ | (1.4) | |
|
| | | | | | | |
| | Year ended December 31, |
| | 2016 | | 2015 |
| Non-cash items included in income (loss) from discontinued operations, net of tax | | | |
| Depreciation and amortization | $ | 2.0 |
|
| $ | 2.2 |
|
| Impairment of goodwill | — |
|
| 13.7 |
|
| Capital expenditures | 0.7 |
|
| 1.9 |
|
During 2017, we reducedThe assets and liabilities of Heat Transfer have been included within “Assets of DBT and Heat Transfer” and “Liabilities of DBT and Heat Transfer,” respectively, on the net loss associated with the saleconsolidated balance sheets as of Balcke Dürr by $6.8.December 31, 2021 and 2020. The reduction was comprised of an additional income tax benefit recorded for the sale of $9.4, partially offset by the impact of adjustments to liabilities retained in connection with the sale and certain other adjustments.
Spin-Off of SPX FLOW
As indicated in Note 1, we completed the Spin-Off of SPX FLOW on September 26, 2015. The results of SPX FLOW are presented as a discontinued operation within the accompanying consolidated statements of operations and consolidated statements of cash flows. Major classes ofmajor line items constituting pre-tax incomeHeat Transfer's assets and after-tax income of SPX FLOW for the year ended December 31, 2015 (1) are shown below:
|
| | | |
| Revenues | $ | 1,775.1 |
|
| Costs and expenses: |
|
|
| Costs of products sold | 1,179.3 |
|
Selling, general and administrative (2) | 368.2 |
|
| Intangible amortization | 17.7 |
|
| Impairment of intangible assets | 15.0 |
|
| Special charges | 41.2 |
|
| Other income, net | 1.3 |
|
| Interest expense, net | (32.6 | ) |
| Income before taxes | 122.4 |
|
| Income tax provision | (43.0 | ) |
| Income from discontinued operations | 79.4 |
|
| Less: Net loss attributable to noncontrolling interest | (0.9 | ) |
| Income from discontinued operations attributable to common shareholders | $ | 80.3 |
|
| |
(1)
| Represents financial results for SPX FLOW through the date of Spin-Off (i.e., the nine months ended September 26, 2015), except for a revision to increase the income tax provision by $1.4 that was recorded during the fourth quarter of 2015. |
| |
(2)
| Includes $30.8 of professional fees and other costs that were incurred in connection with the Spin-Off. |
The following table presents selected financial information for SPX FLOW that is included within discontinued operations in the consolidated statement of cash flows for the year ended December 31, 2015(1):
|
| | | |
| Non-cash items included in income from discontinued operations, net of tax | |
| Depreciation and amortization | $ | 44.3 |
|
| Impairment of intangible assets | 15.0 |
|
| Capital expenditures | 43.1 |
|
| |
(1)
| Represents financial results for SPX FLOW through the date of Spin-Off (i.e., the nine months ended September 26, 2015). |
In connection with the Spin-Off, we entered into definitive agreements with SPX FLOW that, among other matters, set forth the terms and conditions of the Spin-Off and provide a framework for our relationship with SPX FLOW after the Spin-Off, including the following:
Separation and Distribution Agreement;
Tax Matters Agreement;
Employee Matters Agreement; and
Trademark License Agreement.
Pursuant to the Separation and Distribution Agreement, the Employee Matters Agreement and the Tax Matters Agreement, SPX FLOW has agreed to indemnify us for certain liabilities and we have agreed to indemnify SPX FLOW for certain liabilities, in each case for uncapped amounts. Asas of December 31, 2017, no indemnification claims have been initiated.2021 and 2020 are shown below:
The financial activity governed by these agreements between SPX FLOW and us was not material to our consolidated financial results for the years ended December 31, 2017, 2016 and 2015.
We also entered into a five-year agreement with SPX FLOW to lease office space for our corporate headquarters. Annual lease costs associated with the agreement are $2.1. | | | | | | | | | | | | | | |
| | December 31, 2021 | | December 31, 2020 |
| ASSETS | | | | |
| Accounts receivable, net | | $ | 0.1 | | | $ | 0.1 | |
| Other current assets | | 0.2 | | | 0.2 | |
| Other assets | | 0.2 | | | 0.2 | |
| Total assets of Heat Transfer | | $ | 0.5 | | | $ | 0.5 | |
| LIABILITIES | | | | |
| Accounts payable | | $ | 0.3 | | | $ | 0.2 | |
| Accrued expenses | | 0.1 | | | 0.3 | |
| Total liabilities of Heat Transfer | | $ | 0.4 | | | $ | 0.5 | |
Other Discontinued Operations Activity
In addition to the businesses discussed above,Transformer Solutions, DBT and Heat Transfer, we recognized net losses of $1.5, $2.7$1.3, $3.7 and $5.2$4.4 during 2017, 20162021, 2020 and 2015, respectively, resulting2019, respectively. The net losses for 2021, 2020, and 2019 resulted primarily from adjustmentsrevisions to gains/losses on dispositions ofliabilities, including income tax liabilities, retained in connection with prior businesses classified as discontinued prior to 2015.operations.
Changes in estimates associated with liabilities retained in connection with a business divestiture (e.g., income taxes) may occur. As a result, it is possible that the resulting gains/losses on these and other previous divestitures may be materially adjusted in subsequent periods.
For the years ended December 31, 2017, 20162021, 2020 and 2015,2019, results of operations from our businesses reported as discontinued operations were as follows:
| | | | | | | | | | | | | | | | | |
| |
| 2021 | | 2020 | | 2019 |
| Transformer Solutions | | | | | |
| Income from discontinued operations | $ | 454.9 | | | $ | 56.9 | | | $ | 39.4 | |
Income tax provision (1) | (51.8) | | | (14.0) | | | (8.8) | |
| Income from discontinued operations, net | 403.1 | | | 42.9 | | | 30.6 | |
| | | | | |
| DBT | | | | | |
| Loss from discontinued operations | (37.8) | | | (16.6) | | | (43.1) | |
| Income tax benefit | 2.7 | | | 2.4 | | | 7.3 | |
| Loss from discontinued operations, net | (35.1) | | | (14.2) | | | (35.8) | |
| | | | | |
| Heat Transfer | | | | | |
| Income (loss) from discontinued operations | (0.3) | | | 0.3 | | | (1.8) | |
| Income tax (provision) benefit | — | | | (0.1) | | | 0.4 | |
| Income (loss) from discontinued operations, net | (0.3) | | | 0.2 | | | (1.4) | |
| | | | | |
| All other | | | | | |
| Loss from discontinued operations | (7.6) | | | (4.8) | | | (4.0) | |
| Income tax (provision) benefit | 6.3 | | | 1.1 | | | (0.4) | |
| Loss from discontinued operations, net | (1.3) | | | (3.7) | | | (4.4) | |
| | | | | |
| Total | | | | | |
| Income (loss) from discontinued operations | 409.2 | | | 35.8 | | | (9.5) | |
| Income tax provision | (42.8) | | | (10.6) | | | (1.5) | |
| Income (loss) from discontinued operations, net | $ | 366.4 | | | $ | 25.2 | | | $ | (11.0) | |
|
| | | | | | | | | | | |
| | Year ended December 31, |
| | 2017 | | 2016 | | 2015 (1) |
| Balcke Dürr | | | | | |
| Loss from discontinued operations | $ | (2.6 | ) | | $ | (107.0 | ) | | $ | (48.7 | ) |
| Income tax benefit | 9.4 |
| | 11.8 |
| | 9.1 |
|
| Income (loss) from discontinued operations, net | 6.8 |
| | (95.2 | ) | | (39.6 | ) |
| | | | | | |
| SPX FLOW | | | | | |
| Income from discontinued operations | — |
| | — |
| | 122.4 |
|
| Income tax provision | — |
| | — |
| | (43.0 | ) |
| Income from discontinued operations, net | — |
| | — |
| | 79.4 |
|
| | | | | | |
| All other | | | | | |
| Loss from discontinued operations | (4.0 | ) | | (3.7 | ) | | (8.6 | ) |
| Income tax benefit | 2.5 |
| | 1.0 |
| | 3.4 |
|
| Loss from discontinued operations, net | (1.5 | ) | | (2.7 | ) | | (5.2 | ) |
| | | | | | |
| Total | | | | | |
| Income (loss) from discontinued operations | (6.6 | ) | | (110.7 | ) | | 65.1 |
|
| Income tax (provision) benefit | 11.9 |
| | 12.8 |
| | (30.5 | ) |
| Income (loss) from discontinued operations, net | $ | 5.3 |
| | $ | (97.9 | ) | | $ | 34.6 |
|
| |
(1)
| For SPX FLOW, represents financial results through the date of Spin-Off (i.e., the nine months ended September 26, 2015), except for a revision to increase the income tax provision by $1.4 that was recorded during the fourth quarter of 2015. |
Other Dispositions
(1) During the fourth quarter of 2021, we liquidated certain recently acquired entities. As indicated in Note 1, on March 30, 2016, we completed the salea result of our dry cooling business for cash proceeds of $47.6 (net of cash transferred with the business of $3.0). In connection with the sale,this action, we recorded a gainnet income tax benefit of $18.4.$16.5 within our 2021 consolidated statement of operations, which included an income tax charge of $10.9 within continuing operations and income tax benefit of $27.4 within discontinued operations.
(5) Revenues from Contracts
Summarized below is our policy for recognizing revenue under ASC 606, as well as the various disclosures required by ASC 606.
Performance Obligations - Certain of our contracts are comprised of multiple deliverables, which can include hardware and software components, installation, maintenance, and extended warranties. For these contracts, we evaluate whether these deliverables represent separate performance obligations as defined by ASC 606. In some cases, a customer contracts with us to integrate a complex set of tasks and components into a single project or capability (even if the single project results in the delivery of multiple units). Hence, the entire contract is treated as a single performance obligation. In contrast, we may promise to provide distinct goods or services within a contract, in which case we separate the contract into more than one performance obligation. If a contract is separated into more than one performance obligation, we allocate the total transaction price to each performance obligation in an amount based on the estimated relative standalone selling prices of the promised goods or services underlying each performance obligation. In cases where we sell standard products with observable standalone selling prices, these selling prices are used to determine the relative standalone selling price. In cases where we sell a customized customer specific solution, we typically use the expected cost plus margin approach to estimate the standalone selling price of each performance obligation. Sales taxes and other usage-based taxes are excluded from revenue.
Remaining performance obligations represent performance obligations that have yet to be satisfied. As a practical expedient, we do not disclose performance obligations (i) that are part of a contract that has an original expected duration of less than one year and/or (ii) where our right to consideration corresponds directly to the value transferred to the customer. Performance obligations for contracts with an original duration in excess of one year that have yet to be satisfied as of the end of a period primarily relate to our Aids to Navigation systems, communication technologies products, large process cooling systems, as well as certain of our bus fare collection systems. As of December 31, 2021, the aggregate amount allocated to remaining performance obligations after the effect of practical expedients was $105.8. We expect to recognize revenue on
approximately 63% and 88% of the remaining performance obligations over the next 12 and 24 months, respectively, with the remaining recognized thereafter.
Options - We offer options within certain of our contracts to purchase future goods or services. To the extent the option provides a material right to a future benefit (i.e., future goods and services at a discount from the relative standalone selling price), we separate the material right as a performance obligation and adjust the standalone selling price of the other performance obligations within the contract. When determining the relative standalone selling price of the option, we first determine the incremental discount that the customer would receive by exercising the option and then adjust that value based on the probability of option exercise (based, where possible, on historical experience). Revenue is recognized for the option as either the option is exercised or when it expires.
Contract Combination and Modification - We assess each contract at its inception to determine whether it should be combined with other contracts for revenue recognition purposes. When making this determination, we consider factors such as whether two or more contracts with a customer were negotiated at or near the same time or were negotiated with an overall profit objective. Contracts are sometimes modified for changes in contract specifications, scope, or price (or a combination of these). Contract modifications for goods or services that are not distinct within the context of the contract (generally associated with specification changes for certain product lines within our HVAC reportable segment) are accounted for as part of the existing contract. Contract modifications for goods or services that are distinct (i.e., adding or subtracting distinct goods or services) are accounted for as either a termination of the existing contract and the creation of a new contract (where the goods or services are not priced at their standalone selling price), or the creation of separate contract (where the goods or services are priced at their standalone selling price).
Variable Consideration - We determine the transaction price for each contract based on the consideration we expect to receive for the products or services being provided under the contract. For contracts where a portion of the price may vary, we estimate the variable consideration at the amount to which we expect to be entitled, which is included in the transaction price to the extent it is probable that a significant reversal of cumulative revenue recognized will not occur. We analyze the risk of a significant revenue reversal and, if necessary, constrain the amount of variable consideration recognized in order to mitigate this risk. Variable consideration primarily pertains to late delivery penalties and unapproved change orders and claims (levied by us and/or against us). Actual amounts of consideration ultimately received may differ from our estimates. If actual results vary from our estimates, we will adjust these estimates, which would affect revenue and earnings, in the period such variances become known.
As noted above, the nature of our contracts gives rise to several types of variable consideration, including unapproved change orders and claims. We include in our contract estimates additional revenue for unapproved change orders or claims against the customer when we believe we have an enforceable right to the unapproved change order or claim, the amount can be reliably estimated, and the above criteria have been met. In evaluating these criteria, we consider the contractual/legal basis for the claim, the cause of any additional costs incurred, the reasonableness of those costs, and the objective evidence available to support the claim. These estimates are also based on historical award experience.
Returns, Customer Sales Incentives and Warranties - We have certain arrangements that require us to estimate, at the time of sale, the amounts of variable consideration that should be excluded from revenue as (i) certain amounts are not expected to be collected from customers and/or (ii) the product may be returned. We principally rely on historical experience, specific customer agreements, and anticipated future trends to estimate these amounts at the time of shipment and to reduce the transaction price. These arrangements include volume rebates, which are estimated using the most likely amount method, as well as early payment discounts and promotional and advertising allowances, which are estimated using the expected value method. We primarily offer assurance-type standard warranties that the product will conform to published specifications for a defined period of time after delivery. These types of warranties do not represent separate performance obligations. We establish provisions for estimated returns and warranties primarily based on contract terms and historical experience, using the expected value method. Certain businesses offer extended warranties, which are considered separate performance obligations.
Contract Costs - We have elected to apply the practical expedient provided under ASC 606 which allows an entity to expense incremental costs of obtaining or fulfilling a contract when incurred if the amortization period of the asset that the entity otherwise would have recorded is one year or less. Shipping and handling costs associated with outbound freight after control over a product has transferred to a customer are accounted for as fulfillment costs and are included in cost of products sold. The gain includes a reclassification from “Equity”net asset recorded for incremental costs incurred to obtain or fulfill contracts, after consideration of the practical expedient mentioned above, is not material to our consolidated financial statements.
Nature of Goods and Services, Satisfaction of Performance Obligations, and Payment Terms
Our HVAC product lines include package and process cooling equipment, residential and commercial boilers, comfort heating and ventilation products, and engineered air movement solutions. Performance obligations for our HVAC product lines relate primarily to the delivery of equipment and components, construction and reconstruction of cooling towers and other comprehensive income of $40.4components, and providing installation, replacement/spare parts and various other services. Performance obligations related to foreign currency translation.delivery of equipment and components are satisfied at the time of shipment or delivery (i.e., control is transferred at a point in time). The typical length of these contracts is one to three months and payment terms are generally 15 to 60 days after shipment to the customer. Performance obligations for construction and reconstruction of cooling towers and other components, and providing installation and various other services, are typically satisfied through a contract with us to provide a customer-specific solution. The customer typically controls the work in process due to contractual termination clauses whereby we have an enforceable right to recovery of cost incurred including a reasonable profit for work performed to date on products or services that do not have an alternative use to us. Additionally, certain projects are performed on customer sites such that the customer controls the asset as it is created or enhanced. As such, performance obligations for these product lines are generally satisfied over time, with the related revenue recorded based on the percentage of costs incurred to date for each contract to the estimated total costs for such contract at completion, as this method best depicts how control of the product or service is being transferred. The length of customer contract for these product lines is generally 6 to 18 months. Revenue for sales of certain engineered components and all replacement/spare parts is recognized upon shipment or delivery (i.e., at a point in time). Payments on longer-term contracts are generally commensurate with milestones defined in the related contract, while payments for the replacement/spare parts contracts typically occur 30 to 60 days after delivery.
Our detection and measurement product lines include underground pipe and cable locators, inspection and rehabilitation equipment, robotic systems, bus fare collection systems, communication technologies, and obstruction lighting. Performance obligations for these product lines relate to delivery of equipment and components, installation and other short-term services, long-term maintenance and software subscription services, pipeline remediation services and development of robotics. Performance obligations for equipment and components generally are satisfied at the time of shipment or delivery (i.e., control is transferred at a point in time). Performance obligations for installation and other short-term services, pipeline remediation, and development of robotics are satisfied over time as the installation or service is performed. Performance obligations for maintenance and software subscription services are satisfied over time, with the related revenue recorded evenly throughout the contract service period as this method best depicts how control of the service is transferred. Payment terms for equipment and components are typically 30 to 60 days after shipment or delivery, while payment for services typically occurs at completion for shorter-term engagements (less than three months in duration) and throughout the service period for longer-term engagements (generally greater than three months in duration). These product lines have varying contract lengths ranging from one to eighteen months (with the longer term contracts generally associated with our bus fare collection systems and communication technologies products lines), with the typical duration being one to three months. (5)Customer prepayments, progress billings, and retention payments are customary for some of our longer-term contracts. Customer prepayments, progress billings, and retention payments are not considered a significant financing component because they are intended to protect either the customer or ourselves in the event that some or all of the obligations under the contract are not completed. Additionally, most contract assets are expected to convert to accounts receivable, and contract liabilities are expected to convert to revenue, within one year. As such, after applying the practical expedient to exclude potential financing components that are less than one year in duration, we do not have any such financing components.
Disaggregated Revenues
We disaggregate revenue from contracts with customers by major product line and based on the timing of recognition for each of our reportable segments, as we believe such disaggregation best depicts how the nature, amount, timing, and uncertainty of our revenues and cash flows are effected by economic factors, with such disaggregation presented below for the years ended December 31, 2021, 2020, and 2019:
| | | | | | | | | | | | | | | | | | | | |
| | Year Ended December 31, 2021 |
| Reportable Segments | | HVAC | | Detection and Measurement | | Total |
| | | | | | |
| Major product lines | | | | | | |
| Package and process cooling equipment and services, and engineered air quality solutions | | $ | 433.8 | | | $ | — | | | $ | 433.8 | |
| Boilers, comfort heating, and ventilation | | 318.3 | | | — | | | 318.3 | |
| Underground locators, inspection and rehabilitation equipment, and robotic systems | | — | | | 256.8 | | | 256.8 | |
| Communication technologies, obstruction lighting, and bus fare collection systems | | — | | | 210.6 | | | 210.6 | |
| | $ | 752.1 | | | $ | 467.4 | | | $ | 1,219.5 | |
| | | | | | |
| Timing of Revenue Recognition | | | | | | |
| Revenues recognized at a point in time | | $ | 661.2 | | | $ | 415.9 | | | $ | 1,077.1 | |
| Revenues recognized over time | | 90.9 | | | 51.5 | | | 142.4 | |
| | $ | 752.1 | | | $ | 467.4 | | | $ | 1,219.5 | |
| | | | | | | | | | | | | | | | | | | | |
| | Year Ended December 31, 2020 |
| Reportable Segments | | HVAC | | Detection and Measurement | | Total |
| | | | | | |
| Major product lines | | | | | | |
| Package and process cooling equipment and services | | $ | 447.1 | | | $ | — | | | $ | 447.1 | |
| Boilers, comfort heating, and ventilation | | 293.7 | | | — | | | 293.7 | |
| Underground locators, inspection and rehabilitation equipment, and robotic systems | | — | | | 217.8 | | | 217.8 | |
| Communication technologies, obstruction lighting, and bus fare collection systems | | — | | | 169.5 | | | 169.5 | |
| | $ | 740.8 | | | $ | 387.3 | | | $ | 1,128.1 | |
| | | | | | |
| Timing of Revenue Recognition | | | | | | |
| Revenues recognized at a point in time | | $ | 622.2 | | | $ | 341.9 | | | $ | 964.1 | |
| Revenues recognized over time | | 118.6 | | | 45.4 | | | 164.0 | |
| | $ | 740.8 | | | $ | 387.3 | | | $ | 1,128.1 | |
| | | | | | | | | | | | | | | | | | | | |
| | Year Ended December 31, 2019 |
| Reportable Segments | | HVAC | | Detection and Measurement | | Total |
| | | | | | |
| Major product lines | | | | | | |
| Package and process cooling equipment and services | | $ | 429.7 | | | $ | — | | | $ | 429.7 | |
| Boilers, comfort heating, and ventilation | | 309.0 | | | — | | | 309.0 | |
| Underground locators and inspection and rehabilitation equipment | | — | | | 194.3 | | | 194.3 | |
| Communication technologies, obstruction lighting, and bus fare collection systems | | — | | | 190.6 | | | 190.6 | |
| | $ | 738.7 | | | $ | 384.9 | | | $ | 1,123.6 | |
| | | | | | |
| Timing of Revenue Recognition | | | | | | |
| Revenues recognized at a point in time | | $ | 631.4 | | | $ | 357.1 | | | $ | 988.5 | |
| Revenues recognized over time | | 107.3 | | | 27.8 | | | 135.1 | |
| | $ | 738.7 | | | $ | 384.9 | | | $ | 1,123.6 | |
Contract Balances
Our customers are invoiced for products and services at the time of delivery or based on contractual milestones, resulting in outstanding receivables with payment terms from these customers (“Contract Accounts Receivable”). In some cases, the timing of revenue recognition, particularly for revenue recognized over time, differs from when such amounts are invoiced to customers, resulting in a contract asset (revenue recognition precedes the invoicing of the related revenue amount) or a contract liability (payment from the customer precedes recognition of the related revenue amount). Contract assets and liabilities are generally classified as current. On a contract-by-contract basis, the contract assets and contract liabilities are reported net within our consolidated balance sheets. Our contract balances consisted of the following as of December 31, 2021 and 2020:
| | | | | | | | | | | | | | | | | |
| Contract Balances | December 31, 2021 | | December 31, 2020 | | Change |
Contract Accounts Receivable (1) | $ | 215.3 | | | $ | 200.6 | | | $ | 14.7 | |
| Contract Assets | 28.9 | | | 32.5 | | | (3.6) | |
| Contract Liabilities - current | (44.7) | | | (38.8) | | | (5.9) | |
Contract Liabilities - non-current (2) | (5.8) | | | (3.4) | | | (2.4) | |
| Net contract balance | $ | 193.7 | | | $ | 190.9 | | | $ | 2.8 | |
_____________________
(1) Included in “Accounts receivable, net” within the accompanying consolidated balance sheets.
(2) Included in “Other long-term liabilities” within the accompanying consolidated balance sheets.
The $2.8 increase in our net contract balance from December 31, 2020 to December 31, 2021 was due primarily to revenue recognized during the period, partially offset by cash payments received from customers during the period.
During 2021, we recognized revenues of $34.0 related to our contract liabilities at December 31, 2020.
(6) Leases
Summarized below is our policy under, as well as the various other disclosures required by, ASC 842.
We have elected to account for lease agreements with lease and non-lease components as a single component for all leases. Leases with an initial term of 12 months or less are not recorded on our consolidated balance sheets and we recognize lease expense for these leases on a straight-line basis over the lease term.
We review if an arrangement is a lease at inception and conclude whether the contract contains an identified asset if we have the right to obtain substantially all the economic benefit and direct the use of the asset. Operating leases with right-of-use (“ROU”) assets are reflected within “Other assets,” “Accrued expenses,” and “Other long-term liabilities” within our consolidated balance sheets. Finance leases are included in “Property, plant and equipment,” “Current maturities of long-term debt,” and “Long-term debt.”
ROU assets represent our right to use an underlying asset for the lease term and lease liabilities represent our obligation to make lease payments arising from the lease. Operating lease ROU assets and the related liabilities are recognized at commencement date based on the present value of lease payments over the lease term. These payments include renewal options when reasonably certain to be exercised, and exclude termination options. As none of our leases provide an implicit rate, we use our incremental borrowing rate based on the information available at commencement date in determining the present value of lease payments. The operating lease ROU asset also includes any prepaid lease payments and excludes lease incentives.
We have operating and finance leases for facilities, equipment, and vehicles. Our leases have remaining lease terms of one year to 10 years, some of which include options to extend the leases for up to 5 years, and some of which include options to terminate the lease within one year. We rent or sublease certain space within owned facilities to third parties under operating leases, with the impact of these lease arrangements being immaterial to our consolidated financial statements.
The components of lease expense were as follows:
| | | | | | | | | | | | |
| Year ended | |
| December 31, 2021 | | December 31, 2020 | |
Operating lease cost (1) | $ | 13.5 | | | $ | 11.5 | | |
| Variable lease cost | 0.1 | | | — | | |
| | | | |
| Finance lease cost: | | | | |
| Amortization of right-of-use assets | $ | 0.6 | | | $ | 0.6 | | |
| Interest on lease liabilities | — | | | 0.1 | | |
| Total finance lease cost | $ | 0.6 | | | $ | 0.7 | | |
__________________________
(1) Includes short-term lease cost of $4.3 and $2.5, at December 31, 2021 and 2020 respectively.
Supplemental cash flow information related to leases was as follows:
| | | | | | | | | | | |
| Year ended |
| December 31, 2021 | | December 31, 2020 |
| Cash paid for amounts included in the measurement of lease liabilities: | | | |
| Operating cash flow from operating leases | $ | 9.4 | | | $ | 9.1 | |
| Operating cash flows from finance leases | — | | | 0.1 | |
| Financing cash flows from finance leases | 0.6 | | | 1.3 | |
| Non-cash activities: | | | |
| Operating lease right-of-use assets obtained in exchange for new lease obligations | 9.1 | | | 19.8 | |
| Finance lease right-of-use assets obtained in exchange for new lease obligations | 0.4 | | | 1.2 | |
Supplemental balance sheet information related to leases was as follows:
| | | | | | | | | | | | | | |
| December 31, 2021 | | December 31, 2020 | |
| Operating Leases: | | | | Affected Line Item in the Consolidated Balance Sheets |
Operating lease ROU assets (1) | $ | 41.7 | | | $ | 40.5 | | Other assets |
| | | | |
| Operating lease current liabilities | $ | 7.7 | | | $ | 7.3 | | Accrued expenses |
| Operating lease non-current liabilities | 31.5 | | | 30.9 | | Other long-term liabilities |
| Total operating lease liabilities | $ | 39.2 | | | $ | 38.2 | | |
| | | | |
| Finance Leases: | | | | |
| Finance Lease Assets | $ | 1.0 | | | $ | 2.5 | | Property, plant and equipment, net |
| | | | |
| Finance lease current liabilities | $ | 0.5 | | | $ | 1.0 | | Current maturities of long-term debt |
| Finance lease non-current liabilities | 0.6 | | | 1.6 | | Long-term debt |
| Total finance lease liabilities | $ | 1.1 | | | $ | 2.6 | | |
(1) Includes favorable leasehold interests as of December 31, 2021 and 2020 of $6.4 and $6.6, respectively, recorded as part of the acquisition of Patterson-Kelley.
The weighted average remaining lease terms (years) of our leases as of December 31, 2021 and December 31, 2020, were as follows:
| | | | | | | | | | | |
| December 31, |
| 2021 | | 2020 |
| Operating Leases | 6.6 | | 7.0 |
| Finance Leases | 2.3 | | 3.2 |
The discount rate utilized to determine the present value of lease payments over the lease term is our incremental borrowing rate based on the information available at lease commencement date. In developing the incremental borrowing rate, we considered the interest rate that reflects a term similar to the underlying lease term on a fully collateralized basis. We concluded to apply the incremental borrowing rate at a consolidated portfolio level using a five-year term, as the results did not materially differ upon further stratification. The weighted-average discount rate for our operating leases was 3.1% and 3.0% at December 31, 2021 and 2020, respectively, and finance leases was 3.0% and 3.6% at December 31, 2021 and 2020, respectively.
The future minimum payments under our operating and finance leases were as follows as of December 31, 2021:
| | | | | | | | | | | | | | | | | |
| Operating Leases | | Finance Leases | | Total |
| | | | | |
| Next 12 months | $ | 8.8 | | | $ | 0.5 | | | $ | 9.3 | |
| 12 to 24 months | 8.6 | | | 0.4 | | | 9.0 | |
| 24 to 36 months | 8.0 | | | 0.2 | | | 8.2 | |
| 36 to 48 months | 3.9 | | | — | | | 3.9 | |
| 48 to 60 months | 3.2 | | | — | | | 3.2 | |
| Thereafter | 11.2 | | | — | | | 11.2 | |
| Total lease payments | 43.7 | | | 1.1 | | | 44.8 | |
| Less imputed interest | 4.5 | | | — | | | 4.5 | |
| Total | $ | 39.2 | | | $ | 1.1 | | | $ | 40.3 | |
(7) Information on Reportable Segments
We are a global supplier of highly specialized, engineered solutions with operations in approximately 15 countries and sales in over 100 countries around the world.
We have aggregated our operating segments into the following three2 reportable segments: HVAC and Detection and Measurement, and Engineered Solutions.Measurement. The factors considered in determining our aggregated segments are the economic similarity of the businesses, the nature of products sold or services provided, production processes, types of customers, distribution methods, and regulatory environment. In determining our reportable segments, we apply the threshold criteria of the Segment Reporting Topic of the Codification. Operating income or loss for each of our reportable segments is determined before considering impairment and special charges, pension and postretirement expense/income, long-term incentive compensation, certain other operating income/expense, and other indirect corporate expenses. This is consistent with the way our CODMChief Operating Decision Maker evaluates the results of each segment.
HVAC Reportable Segment
Our HVAC reportable segment engineers, designs, manufactures, installs and services package and process cooling products and engineered air movement solutions for the HVAC industrial and industrialpower generation markets, as well as boilers and comfort heating and ventilation products for the residential and commercial markets. The primary distribution channels for the segment’s products are direct to customers, independent manufacturing representatives, third-party distributors, and retailers. The segment serves a customer base in North America, Europe, and Asia Pacific.Asia.
Detection and Measurement Reportable Segment
Our Detection and Measurement reportable segment engineers, designs, manufactures, services, and installs underground pipe and cable locators, inspection and inspectionrehabilitation equipment, robotic systems, bus fare collection systems, communication technologies, and specialtyobstruction lighting. The primary distribution channels for the segment’s products are direct to customers and third-party
distributors. The segment serves a global customer base, with a strong presence in North America, Europe, Africa and Asia Pacific.Asia.
Engineered Solutions Reportable Segment
Our Engineered Solutions reportable segment engineers, designs, manufactures, installs and services transformers for the power transmission and distribution market and process cooling equipment and heat exchangers for the industrial and power generation markets. The primary distribution channels for the segment’s products are direct to customers and third-party representatives. The segment has a strong presence in North America and South Africa.
Corporate Expense
Corporate expense generally relates to the cost of our Charlotte, NC corporate headquarters, our former Asia Pacific center in Shanghai, China, which was part of the Spin-Off, and costs that were previously allocated to the FLOW Business and that do not meet the requirements to be presented within discontinued operations.headquarters.
Financial data for our reportable segments for the years ended December 31, 2017, 20162021, 2020 and 20152019 were as follows:
| | | | | | | | | | | | | | | | | |
| 2021 | | 2020 | | 2019 |
| Revenues: | | | | | |
| HVAC reportable segment | $ | 752.1 | | | $ | 740.8 | | | $ | 738.7 | |
| Detection and Measurement reportable segment | 467.4 | | | 387.3 | | | 384.9 | |
| Consolidated revenues | $ | 1,219.5 | | | $ | 1,128.1 | | | $ | 1,123.6 | |
| | | | | |
| Income: | | | | | |
| HVAC reportable segment | $ | 104.2 | | | $ | 102.7 | | | $ | 103.2 | |
| Detection and Measurement reportable segment | 69.7 | | | 69.1 | | | 81.7 | |
| Total income for segments | 173.9 | | | 171.8 | | | 184.9 | |
| Corporate expense | 60.5 | | | 49.7 | | | 55.0 | |
| | | | | |
| Long-term incentive compensation expense | 12.8 | | | 13.1 | | | 12.6 | |
| Impairment of goodwill and intangible assets | 5.7 | | | 0.7 | | | — | |
| Special charges, net | 1.0 | | | 2.4 | | | 1.5 | |
Other operating expenses, net (1) | 20.2 | | | 9.0 | | | 1.8 | |
| Consolidated operating income | $ | 73.7 | | | $ | 96.9 | | | $ | 114.0 | |
| | | | | |
| | | | | |
| Capital expenditures: | | | | | |
| HVAC reportable segment | $ | 5.3 | | | $ | 7.0 | | | $ | 8.7 | |
| Detection and Measurement reportable segment | 3.4 | | | 2.7 | | | 2.3 | |
| General corporate | 0.9 | | | 5.6 | | | 2.5 | |
| Total capital expenditures | $ | 9.6 | | | $ | 15.3 | | | $ | 13.5 | |
| Depreciation and amortization: | | | | | |
| HVAC reportable segment | $ | 11.5 | | | $ | 11.0 | | | $ | 8.2 | |
| Detection and Measurement reportable segment | 28.0 | | | 17.6 | | | 13.2 | |
| General corporate | 2.8 | | | 3.3 | | | 3.0 | |
| Total depreciation and amortization | $ | 42.3 | | | $ | 31.9 | | | $ | 24.4 | |
| | | | | |
| | | | | |
| 2021 | | 2020 | | 2019 |
| Identifiable assets: | | | | | |
| HVAC reportable segment | $ | 808.4 | | | $ | 632.2 | | | $ | 654.0 | |
| Detection and Measurement reportable segment | 835.4 | | | 772.5 | | | 609.4 | |
General corporate and eliminations (2) | 406.4 | | | 45.6 | | | 33.5 | |
Insurance recovery assets (3) | 526.2 | | | 496.4 | | | 509.6 | |
| Discontinued operations | 52.2 | | | 387.0 | | | 361.3 | |
| Total identifiable assets | $ | 2,628.6 | | | $ | 2,333.7 | | | $ | 2,167.8 | |
| Geographic Areas: | | | | | |
Revenues: (4) | | | | | |
| United States | $ | 991.5 | | | $ | 935.7 | | | $ | 972.7 | |
| China | 57.9 | | | 41.7 | | | 31.1 | |
| United Kingdom | 80.1 | | | 88.4 | | | 59.0 | |
| Other | 90.0 | | | 62.3 | | | 60.8 | |
| $ | 1,219.5 | | | $ | 1,128.1 | | | $ | 1,123.6 | |
| | | | | |
| | | | | |
| Tangible Long-Lived Assets: | | | | | |
| United States | $ | 762.4 | | | $ | 695.6 | | | $ | 682.3 | |
| Other | 37.8 | | | 26.8 | | | 41.4 | |
| Long-lived assets of continuing operations | 800.2 | | | 722.4 | | | 723.7 | |
| Long-lived assets of discontinued operations, DBT and Heat Transfer | 28.0 | | | 109.1 | | | 95.7 | |
| Total tangible long-lived assets | $ | 828.2 | | | $ | 831.5 | | | $ | 819.4 | |
|
| | | | | | | | | | | |
| | 2017 |
| 2016 |
| 2015 |
| Revenues: | | | | | |
| HVAC segment | $ | 511.0 |
| | $ | 509.5 |
| | $ | 529.1 |
|
| Detection and Measurement segment | 260.3 |
| | 226.4 |
| | 232.3 |
|
Engineered Solutions segment (1) | 654.5 |
| | 736.4 |
| | 797.6 |
|
| Consolidated revenues | $ | 1,425.8 |
| | $ | 1,472.3 |
| | $ | 1,559.0 |
|
| Income (loss): | | | | | |
| HVAC segment | $ | 74.1 |
| | $ | 80.2 |
| | $ | 80.2 |
|
| Detection and Measurement segment | 63.4 |
| | 45.3 |
| | 46.0 |
|
Engineered Solutions segment (1)(3) | (12.6 | ) | | 17.3 |
| | (87.4 | ) |
| Total income for segments | 124.9 |
| | 142.8 |
| | 38.8 |
|
| Corporate expense | 46.2 |
| | 41.7 |
| | 103.4 |
|
| Pension and postretirement expense | 5.4 |
| | 15.4 |
| | 18.6 |
|
| Long-term incentive compensation expense | 15.8 |
| | 13.7 |
| | 33.9 |
|
| Impairment of intangible assets | — |
| | 30.1 |
| | — |
|
| Special charges, net | 2.7 |
| | 5.3 |
| | 5.1 |
|
| Gain on sale of dry cooling business | — |
| | 18.4 |
| | — |
|
| Consolidated operating income (loss) | $ | 54.8 |
| | $ | 55.0 |
| | $ | (122.2 | ) |
| | | | | | |
| Capital expenditures: | | | | | |
| HVAC segment | $ | 2.2 |
| | $ | 1.9 |
| | $ | 2.3 |
|
| Detection and Measurement segment | 0.8 |
| | 0.7 |
| | 1.2 |
|
| Engineered Solutions segment | 6.1 |
| | 6.5 |
| | 8.1 |
|
| General corporate | 1.9 |
| | 2.6 |
| | 4.4 |
|
| Total capital expenditures | $ | 11.0 |
| | $ | 11.7 |
| | $ | 16.0 |
|
| Depreciation and amortization: | | | | | |
| HVAC segment | $ | 5.5 |
| | $ | 5.3 |
| | $ | 4.6 |
|
| Detection and Measurement segment | 4.1 |
| | 3.5 |
| | 2.8 |
|
| Engineered Solutions segment | 12.5 |
| | 15.2 |
| | 20.7 |
|
| General corporate | 3.1 |
| | 2.5 |
| | 8.9 |
|
| Total depreciation and amortization | $ | 25.2 |
| | $ | 26.5 |
| | $ | 37.0 |
|
| | | | | | |
|
| | | | | | | | | | | |
| | 2017 | | 2016 | | 2015 |
| Identifiable assets: | | | | | |
| HVAC segment | $ | 747.1 |
| | $ | 710.1 |
| | $ | 623.0 |
|
| Detection and Measurement segment | 277.8 |
| | 244.2 |
| | 256.5 |
|
| Engineered Solutions segment | 557.8 |
| | 567.6 |
| | 808.6 |
|
| General corporate | 457.7 |
| | 390.6 |
| | 371.2 |
|
| Discontinued operations | — |
| | — |
| | 120.0 |
|
| Total identifiable assets | $ | 2,040.4 |
| | $ | 1,912.5 |
| | $ | 2,179.3 |
|
| Geographic Areas: | | | | | |
Revenues: (2) | | | | | |
| United States | $ | 1,243.3 |
| | $ | 1,235.2 |
| | $ | 1,255.4 |
|
| China | 28.0 |
| | 33.5 |
| | 83.6 |
|
South Africa (1) | 56.9 |
| | 105.4 |
| | 54.2 |
|
| United Kingdom | 60.8 |
| | 59.1 |
| | 69.6 |
|
| Other | 36.8 |
| | 39.1 |
| | 96.2 |
|
| | $ | 1,425.8 |
| | $ | 1,472.3 |
| | $ | 1,559.0 |
|
| | | | | | |
| Tangible Long-Lived Assets: | | | | | |
| United States | $ | 919.6 |
| | $ | 897.0 |
| | $ | 835.9 |
|
| Other | 24.8 |
| | 29.6 |
| | 40.4 |
|
| Long-lived assets of continuing operations | 944.4 |
| | 926.6 |
| | 876.3 |
|
| Long-lived assets of discontinued operations | — |
| | — |
| | 35.8 |
|
| Total tangible long-lived assets | $ | 944.4 |
| | $ | 926.6 |
| | $ | 912.1 |
|
| |
(1)
| As further discussed in Note 13, during the second and fourth quarters of 2017, we made revisions to our estimates of expected revenues and costs on our large power projects in South Africa. As a result of these revisions, we reduced 2017 revenues by $36.9 ($13.5 and $23.4 during the second and fourth quarters of 2017, respectively) and 2017 segment income by $52.8 ($22.9 and $29.9 in the second and fourth quarters of 2017, respectively). During the third quarter of 2015, we also made revisions to our estimates of expected revenues and costs on our large power projects in South Africa. As a result of these revisions, we reduced revenue and segment income by $57.2 and $95.0, respectively, during the third quarter of 2015. |
| |
(2)
| Revenues are included in the above geographic areas based on the country that recorded the customer revenue. |
| |
(3)
| During the third quarter of 2017, we settled a contract that had been suspended and then ultimately canceled by a customer for cash proceeds of $9.0 and other consideration. In connection with the settlement, we recorded a gain of $10.2 during the quarter within our Engineered Solutions reportable segment. |
(1)For 2021, includes charges of $26.3 for asbestos product liability matters related to products we no longer manufacture and $0.6 related to revisions to the liability associated with the contingent consideration for the Sensors & Software acquisition, partially offset by income of $6.7 related to the reduction of the liability associated with contingent consideration for the ECS acquisition. For 2020, includes charges of $9.4 for asbestos product liability matters, net of a gain of $0.4 related to revisions to estimates of certain liabilities retained in connection with the 2016 sale of the dry cooling business.For 2019, includes charges of $1.8 related to revisions to estimates of certain liabilities retained in connection with the 2016 sale of the dry cooling business. (6)(2)General corporate and eliminations is comprised of general corporate assets and includes elimination or netting of intercompany amounts, primarily related to certain deferred tax balances and cash management arrangements.
(3)Insurance recovery assets are associated with asbestos product liability matters. Refer to Note 15 for additional details.
(4)Revenues are included in the above geographic areas based on the country that recorded the revenue.
(8) Special Charges, Net
As part of our business strategy, we periodically right-size and consolidate operations to improve long-term results. Additionally, from time to time, we alter our business model to better serve customer demand, discontinue lower-margin product lines and rationalize and consolidate manufacturing capacity. Our restructuring and integration decisions are based, in part, on discounted cash flows and are designed to achieve our goals of reducing structural footprint and maximizing profitability. As a result of our strategic review process, we recorded net special charges of $2.7$1.0 in 2017, $5.32021, $2.4 in 20162020, and $5.1$1.5 in 2015.2019. These net special charges were primarily related to restructuring initiatives to consolidate manufacturing and sales facilities, reduce workforce, and rationalize certain product lines.
The components of the charges have been computed based on actual cash payouts, including severance and other employee benefits based on existing severance policies, local laws, and other estimated exit costs, and our estimate of the realizable value of the affected tangible and intangible assets.
Impairments of long-lived assets, including amortizable intangibles, which represent non-cash asset write-downs, typically arise from business restructuring decisions that lead to the disposition of assets no longer required in the restructured business. For these situations, we recognize a loss when the carrying amount of an asset exceeds the sum of the undiscounted cash flows expected to result from the use and eventual disposition of the asset. Fair values for assets subject to impairment testing are determined primarily by management, taking into consideration various factors including third-party appraisals, quoted market prices and previous experience. If an asset remains in service
at the decision date, the asset is written down to its fair value and the resulting net book value is depreciated over its remaining economic useful life. When we commit to a plan to sell an asset, including the initiation of a plan to locate a buyer, and it is probable that the asset will be sold within one year based on its current condition and sales price, depreciation of the asset is discontinued and the asset is classified as an asset held for sale. The asset is written down to its fair value less any selling costs.
Liabilities for exit costs, including, among other things, severance, other employee benefit costs, and operating lease obligations on idle facilities, are measured initially at their fair value and recorded when incurred.
We anticipate that the liabilities related to restructuring actions will be paid within one year from the period in which the action was initiated.
Special charges for the years ended December 31, 2017, 20162021, 2020 and 20152019 are described in more detail below and in the applicable sections that follow:
| | | | | | | | | | | | | | | | | |
| Years Ended December 31, |
| 2021 | | 2020 | | 2019 |
| Employee termination costs | $ | 1.0 | | | $ | 1.0 | | | $ | 0.5 | |
| Facility consolidation costs | — | | | — | | | 0.5 | |
| Other cash costs, net | — | | | 1.0 | | | — | |
| Non-cash asset write-downs | — | | | 0.4 | | | 0.5 | |
| Total | $ | 1.0 | | | $ | 2.4 | | | $ | 1.5 | |
|
| | | | | | | | | | | |
| | Years Ended December 31, |
| | 2017 | | 2016 | | 2015 |
| Employee termination costs | $ | 2.5 |
| | $ | 1.7 |
| | $ | 4.5 |
|
| Facility consolidation costs | — |
| | — |
| | 0.2 |
|
| Other cash costs, net | 0.2 |
| | — |
| | 0.1 |
|
| Non-cash asset write-downs | — |
| | 3.6 |
| | 0.3 |
|
| Total | $ | 2.7 |
| | $ | 5.3 |
| | $ | 5.1 |
|
20172021 Charges:
| | | | | | | | | | | | | | | | | | | | | | | | | | | | | |
| Employee
Termination
Costs | | Facility
Consolidation
Costs | | Other
Cash Costs, Net | | Non-Cash
Asset
Write-downs | | Total
Special
Charges |
| HVAC reportable segment | $ | 0.1 | | | $ | — | | | $ | — | | | $ | — | | | $ | 0.1 | |
| Detection and Measurement reportable segment | 0.9 | | | — | | | — | | | — | | | 0.9 | |
| Corporate | — | | | — | | | — | | | — | | | — | |
| Total | $ | 1.0 | | | $ | — | | | $ | — | | | $ | — | | | $ | 1.0 | |
|
| | | | | | | | | | | | | | | | | | | |
| | Employee Termination Costs | | Facility Consolidation Costs | | Other Cash Costs, Net | | Non-Cash Asset Write-downs | | Total Special Charges |
| HVAC segment | $ | 0.4 |
| | $ | — |
| | $ | — |
| | $ | — |
| | $ | 0.4 |
|
| Detection and Measurement segment | 0.3 |
| | — |
| | — |
| | — |
| | 0.3 |
|
| Engineered Solutions segment | 1.7 |
| | — |
| | 0.2 |
| | — |
| | 1.9 |
|
| Corporate | 0.1 |
| | — |
| | — |
| | — |
| | 0.1 |
|
| Total | $ | 2.5 |
| | $ | — |
| | $ | 0.2 |
| | $ | — |
| | $ | 2.7 |
|
HVAC Segment — – Charges for 2017 related primarily to severance costs associated with a restructuring action at the segment’s Cooling Americas’ business. These actions resulted in the termination of 12 employees.
Detection and Measurement Segment — Charges for 20172021 related to severance costs associated with a restructuring action at one of the segment’s communication technologies business. Theheating businesses. This action resulted in the termination of 86 employees.
Engineered Solutions Segment —
Detection & Measurement – Charges for 20172021 related primarily to severance costs associated with restructuring actions at the segment’s process coolinglocation and South Africaninspection businesses. These actions resulted in the termination of 11144 employees.
2020 Charges:
| | | | | | | | | | | | | | | | | | | | | | | | | | | | | |
| Employee
Termination
Costs | | Facility
Consolidation
Costs | | Other
Cash Costs, Net | | Non-Cash
Asset
Write-downs | | Total
Special
Charges |
| HVAC reportable segment | $ | 0.5 | | | $ | — | | | $ | — | | | $ | — | | | $ | 0.5 | |
| Detection and Measurement reportable segment | 0.3 | | | — | | | — | | | — | | | 0.3 | |
| Corporate | 0.2 | | | — | | | 1.0 | | | 0.4 | | | 1.6 | |
| Total | $ | 1.0 | | | $ | — | | | $ | 1.0 | | | $ | 0.4 | | | $ | 2.4 | |
HVAC – Charges for 2020 related to severance costs associated with restructuring actions at the segment’s Cooling Americas and heating businesses. These actions resulted in the termination of 11 employees.
Detection & Measurement – Charges for 2020 related severance costs for a restructuring action at the segment’s bus fare collection systems business. The action resulted in the termination of 5employees.
Corporate – Charges for 2020 related primarily to (i) asset impairment and other charges associated with the move to a new corporate headquarters and (ii) cost incurred for a legal entity reorganization initiative.
2019 Charges:
| | | | | | | | | | | | | | | | | | | | | | | | | | | | | |
| Employee
Termination
Costs | | Facility
Consolidation
Costs | | Other
Cash Costs, Net | | Non-Cash
Asset
Write-downs | | Total
Special
Charges |
| HVAC reportable segment | $ | 0.3 | | | $ | 0.5 | | | $ | — | | | $ | 0.5 | | | $ | 1.3 | |
| Detection and Measurement reportable segment | — | | | — | | | — | | | — | | | — | |
| Corporate | 0.2 | | | — | | | — | | | — | | | 0.2 | |
| Total | $ | 0.5 | | | $ | 0.5 | | | $ | — | | | $ | 0.5 | | | $ | 1.5 | |
HVAC — Charges for 20172019 related primarily to severance, asset impairment, and other charges associated with the relocation of certain of the segment's operations and severance costs associated with a restructuring action at the segment's Cooling EMEA business. These actions resulted in the termination of 19 employees.
Corporate — Charges for 2019 related to severance costs incurred in connection with the salerationalization of Balcke Dürr. These actions resulted in the termination of 4 employees.certain administrative functions.
2016 Charges:
|
| | | | | | | | | | | | | | | | | | | |
| | Employee Termination Costs | | Facility Consolidation Costs | | Other Cash Costs, Net | | Non-Cash Asset Write-downs | | Total Special Charges |
| HVAC segment | $ | — |
| | $ | — |
| | $ | — |
| | $ | — |
| | $ | — |
|
| Detection and Measurement segment | 0.5 |
| | — |
| | — |
| | 0.3 |
| | 0.8 |
|
| Engineered Solutions segment | 1.2 |
| | — |
| | — |
| | 3.3 |
| | 4.5 |
|
| Corporate | — |
| | — |
| | — |
| | — |
| | — |
|
| Total | $ | 1.7 |
| | $ | — |
| | $ | — |
| | $ | 3.6 |
| | $ | 5.3 |
|
Detection and Measurement Segment — Charges for 2016 related to severance and other costs associated with our bus fare collection business. These actions resulted in the termination of 19 employees.
Engineered Solutions Segment — Charges for 2016 related primarily to costs incurred in connection with restructuring actions at our SPX Heat Transfer (“Heat Transfer”) business in order to reduce the cost base of the business in response to reduced demand. The cost incurred for the Heat Transfer business restructuring actions included asset impairment charges of $3.3 associated with the discontinuance of a product line and outsourcing initiatives, as well as severance costs. These restructuring activities resulted in the termination of 97 employees.
2015 Charges:
|
| | | | | | | | | | | | | | | | | | | |
| | Employee Termination Costs | | Facility Consolidation Costs | | Other Cash Costs, Net | | Non-Cash Asset Write-downs | | Total Special Charges |
| HVAC segment | $ | 0.9 |
| | $ | 0.1 |
| | $ | (0.2 | ) | | $ | 0.3 |
| | $ | 1.1 |
|
| Detection and Measurement segment | 0.9 |
| | — |
| | — |
| | — |
| | 0.9 |
|
| Engineered Solutions segment | 1.6 |
| | 0.1 |
| | 0.3 |
| | — |
| | 2.0 |
|
| Corporate | 1.1 |
| | — |
| | — |
| | — |
| | 1.1 |
|
| Total | $ | 4.5 |
| | $ | 0.2 |
| | $ | 0.1 |
| | $ | 0.3 |
| | $ | 5.1 |
|
HVAC Segment — Charges for 2015 related primarily to severance and other costs associated with facility consolidation efforts in Asia Pacific. These actions resulted in the termination of 44 employees.
Detection and Measurement Segment — Charges for 2015 related to severance costs associated with restructuring initiatives at the segment’s specialty lighting and bus fare collection businesses. These actions resulted in the termination of 21 employees.
Engineered Solutions Segment — Charges for 2015 related primarily to severance and other costs associated with restructuring actions at the segment’s dry cooling business. These actions resulted in the termination of 134 employees.
Corporate — Charges for 2015 related to severance costs incurred in connection with the Spin-Off.
The following is an analysis of our restructuring liabilities for the years ended December 31, 2017, 20162021, 2020 and 2015:2019:
| | | | December 31, | | |
| | 2017 | | 2016 | | 2015 | | 2021 | | 2020 | | 2019 |
| Balance at beginning of year | $ | 0.9 |
| | $ | 1.6 |
| | $ | 1.7 |
| Balance at beginning of year | $ | 0.9 | | | $ | 0.4 | | | $ | 0.8 | |
Special charges(1) | 2.7 |
| | 1.7 |
| | 4.8 |
| Special charges(1) | 1.0 | | | 2.0 | | | 1.0 | |
| Utilization — cash | (3.0 | ) | | (2.1 | ) | | (5.1 | ) | Utilization — cash | (1.6) | | | (1.5) | | | (1.4) | |
| Currency translation adjustment and other | — |
| | (0.3 | ) | | 0.2 |
| |
| | Balance at the end of year | $ | 0.6 |
| | $ | 0.9 |
| | $ | 1.6 |
| Balance at the end of year | $ | 0.3 | | | $ | 0.9 | | | $ | 0.4 | |
| |
(1)
| The years ended December 31, 2017, 2016 and 2015 excluded $0.0, $3.6 and $0.3, respectively, of non-cash charges that impacted special charges but not the restructuring liabilities. |
(1)The years ended December 31, 2021, 2020 and 2019 excluded $0.0, $0.4 and $0.5, respectively, of non-cash charges that impacted special charges but not the restructuring liabilities.
(7)(9) Inventories, Net
Inventories at December 31, 20172021 and 20162020 comprised the following:
| | | | December 31, | | December 31, |
| | 2017 | | 2016 | | 2021 | | 2020 |
| Finished goods | $ | 33.0 |
| | $ | 43.0 |
| Finished goods | $ | 55.1 | | | $ | 49.5 | |
| Work in process | 56.0 |
| | 50.0 |
| Work in process | 21.1 | | | 21.1 | |
| Raw materials and purchased parts | 66.4 |
| | 64.9 |
| Raw materials and purchased parts | 113.6 | | | 84.4 | |
| Total FIFO cost | 155.4 |
| | 157.9 |
| |
| Excess of FIFO cost over LIFO inventory value | (12.4 | ) | | (12.2 | ) | |
| Total inventories | $ | 143.0 |
| | $ | 145.7 |
| Total inventories | $ | 189.8 | | | $ | 155.0 | |
Inventories include material, labor and factory overhead costs and are reduced, when necessary, to estimated net realizable values. CertainHistorically, certain of our domestic businesses within our HVAC reportable segment accounted for their inventories are valued usingunder the last-in, first-out (“LIFO”)LIFO method. TheseAs indicated in Note 1, during the fourth quarter of 2021, we converted the inventory accounting for these businesses to the FIFO method. We believe that this change in accounting is preferable as it (i) results in a consistent method to value inventories were approximately 56%across all of our businesses, (ii) it improves comparability with industry peers, (iii) better reflects current inventory costs, and 51%(iv) aligns with how we internally monitor the performance of total inventory atour businesses.
The effects of this accounting change have been retrospectively applied to all periods presented. This change resulted in a reduction of our to “Retained deficit” of $9.1 as of December 31, 20172018. The impact of this accounting change on our consolidated statements of operations and 2016, respectively. Otherconsolidated statements of comprehensive income for the years ended December 31, 2019 and 2020, and our consolidated balance sheet as of December 31, 2020, was as follows:
| | | | | | | | | | | | | | | | | |
| As Computed under LIFO | | Effect of Change | | As Adjusted |
| Consolidated Statement of Operations for the year ended December 31, 2019: | | | | | |
| Income from continuing operations before income taxes | $ | 88.7 | | | $ | 0.1 | | | $ | 88.8 | |
| Income tax provision | (12.4) | | | (0.1) | | | (12.5) | |
| Income from continuing operations, net of tax | 76.3 | | | — | | | 76.3 | |
| Loss from discontinued operations, net of tax | (11.0) | | | — | | | (11.0) | |
| Net income | 65.3 | | | — | | | 65.3 | |
| Adjustment related to redeemable noncontrolling interest | 5.6 | | — | | | 5.6 |
| Net income attributable to SPX common stockholders | $ | 70.9 | | | $ | — | | | $ | 70.9 | |
| | | | | |
| | | | | | | | | | | | | | | | | |
| Basic income (loss) per share of common stock: | | | | | |
| Income from continuing operations, net of tax | $ | 1.74 | | | $ | — | | | $ | 1.74 | |
| Loss from discontinued operations, net of tax | (0.13) | | | — | | | (0.13) | |
| Net income attributable to SPX common stockholders after adjustment related to redeemable noncontrolling interest | $ | 1.61 | | | $ | — | | | $ | 1.61 | |
| | | | | |
| Diluted income per share of common stock: | | | | | |
| Income from continuing operations, net of tax | $ | 1.70 | | | $ | — | | | $ | 1.70 | |
| Loss from discontinued operations, net of tax | (0.12) | | | — | | | (0.12) | |
| Net income attributable to SPX common stockholders after adjustment related to redeemable noncontrolling interest | $ | 1.58 | | | $ | — | | | $ | 1.58 | |
| | | | | |
| Total comprehensive income | $ | 64.7 | | | $ | — | | | $ | 64.7 | |
| | | | | |
| Consolidated Statement of Operations for the year ended December 31, 2020 | | | | | |
| Income from continuing operations before income taxes | $ | 76.3 | | | $ | 2.3 | | | $ | 78.6 | |
| Income tax provision | (4.2) | | | (0.6) | | | (4.8) | |
| Income from continuing operations | 72.1 | | | 1.7 | | | 73.8 | |
| Gain from discontinued operations, net of tax | 25.1 | | | 0.1 | | | 25.2 | |
| Net income | $ | 97.2 | | | $ | 1.8 | | | $ | 99.0 | |
| | | | | |
| Basic income per share of common stock: | | | | | |
| Income from continuing operations, net of tax | $ | 1.61 | | | $ | 0.04 | | | $ | 1.65 | |
| Gain from discontinued operations, net of tax | 0.57 | | | — | | | 0.57 | |
| Net income attributable to SPX common stockholders | $ | 2.18 | | | $ | 0.04 | | | $ | 2.22 | |
| | | | | |
| Diluted income per share of common stock: | | | | | |
| Income from continuing operations, net of tax | $ | 1.57 | | | $ | 0.04 | | | $ | 1.61 | |
| Gain from discontinued operations, net of tax | 0.55 | | | — | | | 0.55 | |
| Net income attributable to SPX common stockholders | $ | 2.12 | | | $ | 0.04 | | | $ | 2.16 | |
| | | | | |
| Total comprehensive income | $ | 101.4 | | | $ | 1.8 | | | $ | 103.2 | |
| | | | | |
| Consolidated Balance Sheet as of December 31, 2020: | | | | | |
| Inventories, net | $ | 143.1 | | | $ | 11.9 | | | $ | 155.0 | |
| Current assets of discontinued operations | 121.6 | | | 2.8 | | | 124.4 | |
| Deferred and other income taxes | 23.5 | | | 3.1 | | | 26.6 | |
| Non-current liabilities of discontinued operations | 30.7 | | | 0.7 | | | 31.4 | |
| Retained deficit | (488.1) | | | 10.9 | | | (477.2) | |
The following table compares amounts that would have been reported under the LIFO method with amounts reported under the FIFO method in the accompanying consolidated statement of operations and consolidated statement of comprehensive income for the year ended December 31, 2021, and the consolidated balance sheet as of December 31, 2021:
| | | | | | | | | | | | | | | | | |
| As Computed under LIFO | | As Reported under FIFO | | Effect of Change |
| Income from continuing operations before income taxes | $ | 58.3 | | | $ | 69.9 | | | $ | 11.6 | |
| Income tax provision | (8.0) | | | (10.9) | | | (2.9) | |
| Income from continuing operations, net of tax | 50.3 | | | 59.0 | | | 8.7 | |
| Gain from discontinued operations, net of tax | 368.5 | | | 366.4 | | | (2.1) | |
| Net income attributable to SPX common stockholders | $ | 418.8 | | | $ | 425.4 | | | $ | 6.6 | |
| | | | | |
| Basic income per share of common stock: | | | | | |
| Income from continuing operations, net of tax | $ | 1.11 | | | $ | 1.30 | | | $ | 0.19 | |
| Gain from discontinued operations, net of tax | 8.14 | | 8.09 | | (0.05) | |
| Net income attributable to SPX common stockholders | $ | 9.25 | | | $ | 9.39 | | | $ | 0.14 | |
| | | | | |
| Total Comprehensive Income | $ | 434.3 | | | $ | 440.8 | | | $ | 6.5 | |
| | | | | |
| Diluted income per share of common stock: | | | | | |
| Income from continuing operations, net of tax | $ | 1.08 | | | $ | 1.27 | | | $ | 0.19 | |
| Gain from discontinued operations, net of tax | 7.93 | | 7.88 | | (0.05) | |
| Net income attributable to SPX common stockholders | $ | 9.01 | | | $ | 9.15 | | | $ | 0.14 | |
| | | | | |
| Inventories, net | $ | 166.3 | | | $ | 189.8 | | | $ | 23.5 | |
| Deferred and other income taxes | 25.3 | | 31.3 | | 6.0 | |
| Retained deficit | (69.3) | | | (51.8) | | | 17.5 | |
The impact of the change from LIFO to FIFO on our consolidated statements of cash flows for the years ended December 31, 2021, 2020, and 2019 was limited to the changes in income noted above, along with offsetting changes within inventories are valued usingand deferred and other income taxes. As a result, this accounting change had no impact on our total cash flows from operating, investing, and financing activities during the first-in, first-out (“FIFO”) method.years ended December 31, 2021, 2020, and 2019.
(8)
(10) Goodwill and Other Intangible Assets
The changes in the carrying amount of goodwill, by reportable segment, for the year ended December 31, 2017,2021, were as follows:
| | | | | | | | | | | | | | | | | | | | | | | | | | | | | | | |
| December 31,
2020 | | Goodwill
Resulting
from Business
Combinations (1) | | | | Impairments (2) | | Foreign
Currency
Translation | | December 31,
2021 |
| HVAC reportable segment | | | | | | | | | | | |
| Gross goodwill | $ | 492.2 | | | $ | 46.0 | | | | | $ | — | | | $ | (9.3) | | | $ | 528.9 | |
| Accumulated impairments | (340.6) | | | — | | | | | — | | | 6.5 | | | (334.1) | |
| Goodwill | 151.6 | | | 46.0 | | | | | — | | | (2.8) | | | 194.8 | |
| Detection and Measurement reportable segment | | | | | | | | | | | |
| Gross goodwill | 351.5 | | | 78.7 | | | | | — | | | (5.3) | | | 424.9 | |
| Accumulated impairments | (134.5) | | | — | | | | | (28.2) | | | 0.3 | | | (162.4) | |
| Goodwill | 217.0 | | | 78.7 | | | | | (28.2) | | | (5.0) | | | 262.5 | |
| Total | | | | | | | | | | | |
| Gross goodwill | 843.7 | | | 124.7 | | | | | — | | | (14.6) | | | 953.8 | |
| Accumulated impairments | (475.1) | | | — | | | | | (28.2) | | | 6.8 | | | (496.5) | |
| Goodwill | $ | 368.6 | | | $ | 124.7 | | | | | $ | (28.2) | | | $ | (7.8) | | | $ | 457.3 | |
(1) Reflects (i) goodwill acquired with the Sealite, ECS and Cincinnati Fan acquisitions of $47.7, $25.9 and $46.0, respectively, (ii) and increase in ULC's goodwill during 2021 of $3.1 resulting from revisions to the valuation of certain assets and liabilities and income tax accounts, and (iii) an increase in Sensors & Software's goodwill of $2.0 resulting from revisions to the valuation of certain assets and liabilities and income tax accounts. As indicated in Note 1, the acquired assets, including goodwill, and liabilities assumed in the Sealite, ECS and Cincinnati Fan acquisitions have been recorded at estimates of fair value and are subject to change upon completion of acquisition accounting.
(2) As indicated in Note 1, we concluded during the third quarter of 2021 that the operating and financial milestones related to the ULC contingent consideration would not be achieved, resulting in the reversal of the related liability of $24.3, with the offset to “Other operating expenses, net.” We also concluded that the lack of achievement of these milestones, along with lower than anticipated future cash flows, were indicators of potential impairment related to ULC’s goodwill and indefinite-lived intangible assets. As such, we tested ULC’s goodwill and indefinite-lived intangible assets for impairment during the quarter. Based on such testing, we determined that the carrying value of ULC’s net assets exceeded the implied fair value of the business. As a result, we recorded an impairment charge to “Other operating expenses, net” of $24.3 during the third quarter, with $23.3 related to goodwill and the remainder to trademarks. In connection with our annual impairment analysis of ULC's goodwill and indefinite-lived intangibles, during the fourth quarter of 2021, we determined that the carrying value of ULC's net assets exceeded the implied fair value of the business by $5.2. As a result, we recorded impairment charges of $4.9 and $0.3 related to the business's goodwill and trademarks, respectively.
|
| | | | | | | | | | | | | | | |
| | December 31,
2016 | | Impairments | | Foreign
Currency
Translation | | December 31,
2017 |
| HVAC segment | | | | | | | |
| Gross goodwill | $ | 258.5 |
| | $ | — |
| | $ | 5.2 |
| | $ | 263.7 |
|
| Accumulated impairments | (144.2 | ) | | — |
| | (0.5 | ) | | (144.7 | ) |
| Goodwill | 114.3 |
| | — |
| | 4.7 |
| | 119.0 |
|
| Detection and Measurement segment | | | | | | | |
| Gross goodwill | 214.4 |
| | — |
| | 2.2 |
| | 216.6 |
|
| Accumulated impairments | (134.2 | ) | | — |
| | (1.8 | ) | | (136.0 | ) |
| Goodwill | 80.2 |
| | — |
| | 0.4 |
| | 80.6 |
|
| Engineered Solutions segment | | | | | | | |
| Gross goodwill | 351.4 |
| | — |
| | 6.9 |
| | 358.3 |
|
| Accumulated impairments | (205.5 | ) | | — |
| | (6.5 | ) | | (212.0 | ) |
| Goodwill | 145.9 |
| | — |
| | 0.4 |
| | 146.3 |
|
| Total | | | | | | | |
| Gross goodwill | 824.3 |
| | — |
| | 14.3 |
| | 838.6 |
|
| Accumulated impairments | (483.9 | ) | | — |
| | (8.8 | ) | | (492.7 | ) |
| Goodwill | $ | 340.4 |
| | $ | — |
| | $ | 5.5 |
| | $ | 345.9 |
|
The changes in the carrying amount of goodwill, by reportable segment, for the year ended December 31, 2016,2020, were as follows:
| | | | | | | | | | | | | | | | | | | | | | | | | | | | | | | |
| December 31,
2019 | | Goodwill
Resulting
from Business
Combinations (1) | | Impairments | | | | Foreign
Currency
Translation | | December 31,
2020 |
| HVAC reportable segment | | | | | | | | | | | |
| Gross goodwill | $ | 480.0 | | | $ | 0.8 | | | $ | — | | | | | $ | 11.4 | | | $ | 492.2 | |
| Accumulated impairments | (332.5) | | | — | | | — | | | | | (8.1) | | | (340.6) | |
| Goodwill | 147.5 | | | 0.8 | | | — | | | | | 3.3 | | | 151.6 | |
| Detection and Measurement reportable segment | | | | | | | | | | | |
| Gross goodwill | 304.1 | | | 42.7 | | | — | | | | | 4.7 | | | 351.5 | |
| Accumulated impairments | (133.6) | | | — | | | — | | | | | (0.9) | | | (134.5) | |
| Goodwill | 170.5 | | | 42.7 | | | — | | | | | 3.8 | | | 217.0 | |
| Total | | | | | | | | | | | |
| Gross goodwill | 784.1 | | | 43.5 | | | — | | | | | 16.1 | | | 843.7 | |
| Accumulated impairments | (466.1) | | | — | | | — | | | | | (9.0) | | | (475.1) | |
| Goodwill | $ | 318.0 | | | $ | 43.5 | | | $ | — | | | | | $ | 7.1 | | | $ | 368.6 | |
|
| | | | | | | | | | | | | | | |
| | December 31,
2015 | | Disposition of Business (1) | | Foreign
Currency
Translation | | December 31,
2016 |
| HVAC segment | | | | | | | |
| Gross goodwill | $ | 261.3 |
| | $ | — |
| | $ | (2.8 | ) | | $ | 258.5 |
|
| Accumulated impairments | (145.2 | ) | | — |
| | 1.0 |
| | (144.2 | ) |
| Goodwill | 116.1 |
| | — |
| | (1.8 | ) | | 114.3 |
|
| Detection and Measurement segment | | | | | | | |
| Gross goodwill | 219.1 |
| | — |
| | (4.7 | ) | | 214.4 |
|
| Accumulated impairments | (138.0 | ) | | — |
| | 3.8 |
| | (134.2 | ) |
| Goodwill | 81.1 |
| | — |
| | (0.9 | ) | | 80.2 |
|
| Engineered Solutions segment | | | | | | | |
| Gross goodwill | 391.6 |
| | (36.1 | ) | | (4.1 | ) | | 351.4 |
|
| Accumulated impairments | (235.3 | ) | | 25.9 |
| | 3.9 |
| | (205.5 | ) |
| Goodwill | 156.3 |
| | (10.2 | ) | | (0.2 | ) | | 145.9 |
|
| Total | | | | | | | |
| Gross goodwill | 872.0 |
| | (36.1 | ) | | (11.6 | ) | | 824.3 |
|
| Accumulated impairments | (518.5 | ) | | 25.9 |
| | 8.7 |
| | (483.9 | ) |
| Goodwill | $ | 353.5 |
| | $ | (10.2 | ) | | $ | (2.9 | ) | | $ | 340.4 |
|
(1)Represents Reflects goodwill allocatedacquired with the ULC and Sensors & Software acquisitions of $37.3 and $5.4, respectively, and a net increase in Patterson-Kelley's goodwill during 2020 of $0.4 resulting from revisions to our dry cooling business upon its disposition.the valuation of certain liabilities and tangible assets and an increase in SGS's goodwill during the first half of 2020 of $0.4 resulting from revisions to the valuation of certain income tax accounts.
Identifiable intangible assets were as follows:
| | | | | | | | | | | | | | | | | | | | | | | | | | | | | | | | | | | |
| December 31, 2021 | | December 31, 2020 |
| Gross
Carrying
Value | | Accumulated
Amortization | | Net
Carrying
Value | | Gross
Carrying
Value | | Accumulated
Amortization | | Net
Carrying
Value |
Intangible assets with determinable lives:(1) | | | | | | | | | | | |
| Customer relationships | $ | 188.2 | | | $ | (26.7) | | | $ | 161.5 | | | $ | 103.4 | | | $ | (16.2) | | | $ | 87.2 | |
| Technology | 80.1 | | | (11.9) | | | 68.2 | | | 54.4 | | | (6.8) | | | 47.6 | |
| Patents | 4.5 | | | (4.5) | | | — | | | 4.5 | | | (4.5) | | | — | |
| Other | 31.6 | | | (18.0) | | | 13.6 | | | 18.8 | | | (12.5) | | | 6.3 | |
| 304.4 | | | (61.1) | | | 243.3 | | | 181.1 | | | (40.0) | | | 141.1 | |
Trademarks with indefinite lives (2) | 172.2 | | | — | | | 172.2 | | | 163.9 | | | — | | | 163.9 | |
Total | $ | 476.6 | | | $ | (61.1) | | | $ | 415.5 | | | $ | 345.0 | | | $ | (40.0) | | | $ | 305.0 | |
|
| | | | | | | | | | | | | | | | | | | | | | | |
| | December 31, 2017 | | December 31, 2016 |
| | Gross
Carrying
Value | | Accumulated
Amortization | | Net
Carrying
Value | | Gross
Carrying
Value | | Accumulated
Amortization | | Net
Carrying
Value |
| Intangible assets with determinable lives: | | | | | | | | | | | |
| Customer relationships | $ | 1.4 |
| | $ | (1.4 | ) | | $ | — |
| | $ | 1.4 |
| | $ | (1.4 | ) | | $ | — |
|
| Technology | 2.1 |
| | (0.5 | ) | | 1.6 |
| | 2.1 |
| | (0.4 | ) | | 1.7 |
|
| Patents | 4.5 |
| | (4.5 | ) | | — |
| | 4.5 |
| | (4.5 | ) | | — |
|
| Other | 11.7 |
| | (7.9 | ) | | 3.8 |
| | 12.7 |
| | (7.4 | ) | | 5.3 |
|
| | 19.7 |
| | (14.3 | ) | | 5.4 |
| | 20.7 |
| | (13.7 | ) | | 7.0 |
|
Trademarks with indefinite lives (1) | 112.2 |
| | — |
| | 112.2 |
| | 110.9 |
| | — |
| | 110.9 |
|
Total | $ | 131.9 |
| | $ | (14.3 | ) | | $ | 117.6 |
| | $ | 131.6 |
| | $ | (13.7 | ) | | $ | 117.9 |
|
| |
(1)
| Changes in the gross carrying value during the year ended December 31, 2017 related to foreign currency translation. |
Amortization expense was $0.6, $2.8 $21.6, $14.0 and $5.2$8.9 for the years ended December 31, 2017, 20162021, 2020 and 2015,2019, respectively. Estimated amortization expense is approximately $28.0 for 2022 and $23.0 over each of the next fivefour years is $0.6thereafter related to these intangible assets.
At December 31, 2017,2021, the net carrying value of intangible assets with determinable lives consisted of $3.8$106.2 in the HVAC reportable segment and $1.6$137.1 in the Engineered SolutionsDetection and Measurement reportable segment. Trademarks with indefinite lives consisted of $89.5$105.4 in the HVAC reportable segment $10.3and $66.8 in the Detection and Measurement segment,reportable segment.
As indicated in Note 1, we review goodwill and $12.4 in the Engineered Solutions segment.
Consistent with the requirements of the Intangible — Goodwill and Other Topic of the Codification, the fair values of our reporting units generally are estimated using discounted cash flow projections that we believe to be reasonable under current and forecasted circumstances, the results of which form the basisindefinite-lived intangible assets for making judgments about carrying values of the reported net assets of our reporting units. Other considerations are also incorporated, including comparable industry price multiples. Many of our reporting units closely follow changes in the industries and end markets that they serve. Accordingly, we consider estimates and judgments that affect the future cash flow projections, including principal
methods of competition such as volume, price, service, product performance and technical innovations and estimates associated with cost improvement initiatives, capacity utilization and assumptions for inflation and foreign currency changes. Any significant change in market conditions and estimates or judgments used to determine expected future cash flows that indicate a reduction in carrying value may give rise to impairment in the period that the change becomes known.
We perform our annual goodwill impairment testingannually during the fourth quarter in conjunction with our annual financial planning process, with such testing based primarily on events and circumstances existing as of the end of the third quarter. In addition, we test goodwill for impairment on a more frequent basis if there are indications of potential impairment. Based on our annualIn reviewing goodwill and indefinite-lived intangible assets for impairment, testing inwe initially perform a qualitative analysis. If there is an indication of impairment, we then perform a quantitative analysis. During the fourth quarter of 2017,2021, we concludedperformed quantitative analyses on the goodwill and indefinite-lived intangible assets of our Cues and ULC reporting units. Based on such analysis, we determined that the fair value of Cues’ net assets exceeded the related carrying value by approximately 30%. Our quantitative analysis of the ULC reporting unit resulted in impairment charges of $5.2, with $4.9 related to goodwill and $0.3 to the ULC trademarks. After such impairment charges, ULC’s total goodwill was $12.0 as of December 31, 2021. A change in assumptions used in ULC's quantitative analysis (e.g., projected revenues and profit growth rates, discount rates, industry price multiples, etc.) could result in the reporting unit's estimated fair value of each of our reporting units exceedsbeing less than the carrying value of its net assets. In addition to ULC, the fair value of Sealite, ECS and Cincinnati Fan, acquisitions over the past 12 months, approximate their carrying value. If ULC, Sealite, ECS, or Cincinnati Fan are unable to achieve their respective net assets by over 100%.current financial forecast, we may be required to record an impairment charge in a future period related to their respective goodwill.
We perform our annual
Our quantitative analysis of trademarks impairment testing during the fourth quarter, oris based on a more frequent basis if there are indications of potential impairment. The fair values of our trademarks are determined by applying estimated royalty rates to projected revenues, with the resulting cash flows discounted at a rate of return that reflects current market conditions. The basis for these projected revenues isIn addition to the annual operating plan for each$1.3 of 2021 impairment charges related to the related businesses, which is prepared inULC trademarks, during the fourth quarterquarters of each year.
During 2016,2021 and 2020, we recorded impairment charges of $30.1 associated with Heat Transfer’s trademarks$0.5 and definite-lived intangible assets. As of December 31, 2017, the carrying value of Heat Transfer’s intangible assets was $4.9.$0.7, respectively, related to certain other trademarks.
(9)(11) Employee Benefit Plans
Overview — Defined benefit pension plans cover a portion of our salaried and hourly paid employees, including certain employees in foreign countries. Beginning in 2001, we discontinued providing these pension benefits generally to newly hired employees. Effective January 31, 2018, we will no longer providediscontinued providing service credits to active participants.
We have domestic postretirement plans that provide health and life insurance benefits to certain retirees and their dependents. Beginning in 2003, we discontinued providing these postretirement benefits generally to newly hired employees.
The plan year-end date for all our plans is December 31.
Actuarial Gains and Losses - As indicated in NoteNotes 1 and 2, changes in fair value of plan assets and actuarial gains and losses related to our pension and postretirement plans are recorded to earnings during the fourth quarter of each year, unless earlier remeasurement is required. Below is a summary of transactions during the first three quarters of 2015, 2016 and 2017 that required remeasurement of our pension and postretirement plans.
On July 14, 2015, we amended the SPX U.S. Pension Plan (the “U.S. Plan”) and the Supplemental Individual Account Retirement Plan (“SIARP”) to freeze all benefits for active non-union participants. The amendment resulted in a curtailment gain of $5.1. In connection with the amendment, we remeasured the assets and liabilities of the U.S. Plan and the SIARP, which resulted in a charge to net periodic pension benefit expense of $11.4 during 2015.
In connection with the Spin-Off, participants in the U.S. Plan that were transferred to SPX FLOW became eligible to elect a lump-sum payment option in lieu of a future pension benefit under the U.S. Plan. During the second quarter of 2016, approximately 9%, or $25.2, of the projected benefit obligation of the U.S. Plan was settled as a result of lump-sum payments. In connection with these lump-sum payments, we remeasured the assets and liabilities of the U.S. Plan during the second quarter of 2016, which resulted in a charge to net periodic pension benefit expense of $1.0 during 2016.
During the second quarter of 2016, we made lump-sum payments to certain participants of the SIARP, settling approximately 22%, or $2.7, of the SIARP’s projected benefit obligation. In connection with these lump-sum payments, we remeasured the liabilities of the SIARP, which resulted in a charge to net periodic pension benefit expense of $0.8 during 2016.
In July 2014, we discontinued our sponsorship of post-65 age healthcare plans, effective January 1, 2015, which resulted in eligible retirees being transitioned to coverage in the individual healthcare insurance market that we subsidize through health reimbursement accounts. In November 2014, a lawsuit was filed challenging certain aspects of this action. In September 2017, we received a favorable ruling related to the lawsuit. During the third quarter of 2017, in connection with the favorable ruling, we reduced our unfunded liability related to postretirement benefits by $26.8. The
offset for the reduction of the unfunded liability was recorded to accumulated other comprehensive income and represents unrecognized prior service credits. These unrecognized prior service credits are being recorded to net periodic postretirement benefit (income) expense over a period of approximately eight years, beginning in the fourth quarter of 2017. In addition, we remeasured our unfunded liability related to postretirement benefits, which resulted in a gain within net periodic postretirement benefit expense and a reduction of the unfunded liability of $2.6 during the third quarter of 2017.
Defined Benefit Pension Plans
Plan assets — Our investment strategy is based on the long-term growth and protection of principle while mitigating overall risk to ensure that funds are available to pay benefit obligations. The domestic plan assets are invested in a broad range of investment classes, including fixed income securities and domestic and international equities. We engage various investment managers who are regularly evaluated on long-term performance, adherence to investment guidelines and the ability to manage risk commensurate with the investment style and objective for which they were hired. We continuously monitor the value of assets by class and routinely rebalance our portfolio with the goal of meeting our target allocations.
The strategy for bonds emphasizes investment-grade corporate and government debt with maturities matching a portion of the longer duration pension liabilities. The bonds strategy also includes a high yield element, which is generally shorter in duration. The strategy for equity assets is to minimize concentrations of risk by investing primarily in companies in a diversified mix of industries worldwide, while targeting neutrality in exposure to global versus regional markets, fund types and fund managers. A small portion of U.S. plan assets (Level 3 assets) is allocated to private equity partnerships and real estate asset fund investments for diversification, providing opportunities for above market returns.
Allowable investments under the plan agreements include fixed income securities, equity securities, mutual funds, venture capital funds, real estate and cash and equivalents. In addition, investments in futures and option contracts, commodities and other derivatives are allowed in commingled fund allocations managed by professional investment managers. Investments prohibited under the plan agreements include private placements and short selling of stock. No shares of our common stock were held by our defined benefit pension plans as of December 31, 20172021 or 2016.2020.
Actual asset allocation percentages of each class of our domestic and foreign pension plan assets as of December 31, 20172021 and 2016,2020, along with the current targeted asset investment allocation percentages, each of which is based on the midpoint of an allocation range, were as follows:
Domestic Pension Plans
|
| | | | | | | | |
| | Actual Allocations | | Mid-point of Target Allocation Range |
| | 2017 | | 2016 | | 2017 |
| Fixed income common trust funds | 70 | % | | 44 | % | | 65 | % |
| Commingled global fund allocation | 12 | % | | 19 | % | | 18 | % |
| Corporate bonds | 1 | % | | 11 | % | | — | % |
| Global equity common trust funds | 7 | % | | 12 | % | | 5 | % |
| U.S. Government securities | 9 | % | | 12 | % | | 10 | % |
Short-term investments (1) | 1 | % | | 2 | % | | 2 | % |
| Total | 100 | % | | 100 | % | | 100 | % |
| | | | | | | | | | | | | | | | | |
| Actual
Allocations | | Mid-point of Target
Allocation Range |
| 2021 | | 2020 | | 2021 |
| Fixed income common trust funds | 67 | % | | 68 | % | | 65 | % |
| Commingled global fund allocation | 6 | % | | 11 | % | | 6 | % |
| | | | | |
| Global equity common trust funds | 15 | % | | 5 | % | | 15 | % |
| | | | | |
| U.S. Government securities | 10 | % | | 9 | % | | 12 | % |
Short-term investments and other (1) | 2 | % | | 7 | % | | 2 | % |
| | | | | |
| Total | 100 | % | | 100 | % | | 100 | % |
| |
(1)
| Short-term investments are generally invested in actively managed common trust funds or interest-bearing accounts. |
(1)Short-term investments are generally invested in actively managed common trust funds or interest-bearing accounts.
Foreign Pension Plans
|
| | | | | | | | |
| | Actual Allocations | | Mid-point of Target Allocation Range |
| | 2017 | | 2016 | | 2017 |
| Global equity common trust funds | 17 | % | | 16 | % | | 14 | % |
| Global equities | — | % | | 8 | % | | — | % |
| Fixed income common trust funds | 46 | % | | 30 | % | | 39 | % |
| Commingled global fund allocation | 34 | % | | 20 | % | | 36 | % |
| Non-U.S. Government securities | — | % | | 24 | % | | 7 | % |
Short-term investments (1) | 3 | % | | 2 | % | | 4 | % |
| Total | 100 | % | | 100 | % | | 100 | % |
| | | | | | | | | | | | | | | | | |
| Actual
Allocations | | Mid-point of Target
Allocation Range |
| 2021 | | 2020 | | 2021 |
| Global equity common trust funds | 9 | % | | 9 | % | | 9 | % |
| | | | | |
| Fixed income common trust funds | 61 | % | | 65 | % | | 66 | % |
| Commingled global fund allocation | 27 | % | | 25 | % | | 25 | % |
| | | | | |
| Non-U.S. Government securities | — | % | | — | % | | — | % |
Short-term investments (1) | 3 | % | | 1 | % | | — | % |
| Total | 100 | % | | 100 | % | | 100 | % |
| |
(1)
| Short-term investments are generally invested in actively managed common trust funds or interest-bearing accounts. |
(1)Short-term investments are generally invested in actively managed common trust funds or interest-bearing accounts.
The fair values of pension plan assets at December 31, 2017,2021, by asset class, were as follows: | | | | | | | | | | | | | | | | | | | | | | | |
| Total | | Quoted Prices in Active
Markets for Identical
Assets
(Level 1) | | Significant
Observable Inputs
(Level 2) | | Significant
Unobservable
Inputs
(Level 3) |
| Asset class: | | | | | | | |
| Debt securities: | | | | | | | |
Fixed income common trust funds (1) (2) | $ | 291.2 | | | $ | — | | | $ | 291.2 | | | $ | — | |
| | | | | | | |
| Non-U.S. Government securities | 0.3 | | | — | | | 0.3 | | | — | |
| U.S. Government securities | 25.8 | | | — | | | 25.8 | | | — | |
| Equity securities: | | | | | | | |
Global equity common trust funds (1) (3) | 58.0 | | | — | | | 58.0 | | | — | |
| | | | | | | |
| | | | | | | |
| | | | | | | |
| | | | | | | |
| | | | | | | |
| | | | | | | |
| | | | | | | |
| | | | | | | |
| Alternative investments: | | | | | | | |
Commingled global fund allocations (1) (4) | 67.4 | | | — | | | 67.4 | | | — | |
| Other: | | | | | | | |
Short-term investments (5) | 10.4 | | | 10.4 | | | — | | | — | |
| Other | 0.9 | | | — | | | — | | | 0.9 | |
| Total | $ | 454.0 | | | $ | 10.4 | | | $ | 442.7 | | | $ | 0.9 | |
|
| | | | | | | | | | | | | | | |
| | Total | | Quoted Prices in Active Markets for Identical Assets (Level 1) | | Significant Observable Inputs (Level 2) | | Significant Unobservable Inputs (Level 3) |
| Asset class: | | | | | | | |
| Debt securities: | | | | | | | |
Fixed income common trust funds (1) (2) | $ | 270.2 |
| | $ | — |
| | $ | 270.2 |
| | $ | — |
|
| Corporate bonds | 1.6 |
| | — |
| | 1.6 |
| | — |
|
| Non-U.S. Government securities | — |
| | — |
| | — |
| | — |
|
| U.S. Government securities | 25.2 |
| | — |
| | 25.2 |
| | — |
|
| Equity securities: | | | | | | | |
Global equity common trust funds (1) (3) | 50.6 |
| | — |
| | 50.6 |
| | — |
|
| Global equities: | — |
| | — |
| | — |
| | — |
|
| Alternative investments: | | | | | | | |
Commingled global fund allocations (1) (4) | 95.1 |
| | — |
| | 95.1 |
| | — |
|
| Other: | | | | | | | |
Short-term investments (5) | 9.4 |
| | 9.4 |
| | — |
| | — |
|
| Other | 1.0 |
| | — |
| | — |
| | 1.0 |
|
| Total | $ | 453.1 |
| | $ | 9.4 |
| | $ | 442.7 |
| | $ | 1.0 |
|
The fair values of pension plan assets at December 31, 2016,2020, by asset class, were as follows:
| | | | | | | | | | | | | | | | | | | | | | | |
| Total | | Quoted Prices in Active
Markets for Identical
Assets (Level 1) | | Significant
Observable Inputs
(Level 2) | | Significant
Unobservable
Inputs
(Level 3) |
| Asset class: | | | | | | | |
| Debt securities: | | | | | | | |
Fixed income common trust funds (1) (2) | $ | 315.4 | | | $ | — | | | $ | 315.4 | | | $ | — | |
| | | | | | | |
| Non-U.S. Government securities | 0.3 | | | — | | | 0.3 | | | — | |
| U.S. Government securities | 25.2 | | | — | | | 25.2 | | | — | |
| Equity securities: | | | | | | | |
Global equity common trust funds (1) (3) | 32.1 | | | — | | | 32.1 | | | — | |
| Alternative Investments: | | | | | | | |
| | | | | | | |
| | | | | | | |
| | | | | | | |
| | | | | | | |
| | | | | | | |
| | | | | | | |
| | | | | | | |
| | | | | | | |
Commingled global fund allocations (1) (4) | 81.7 | | | — | | | 81.7 | | | — | |
| Other: | | | | | | | |
Short-term investments (5) | 22.5 | | | 22.5 | | | — | | | — | |
| Other | 0.9 | | | — | | | — | | | 0.9 | |
| Total | $ | 478.1 | | | $ | 22.5 | | | $ | 454.7 | | | $ | 0.9 | |
|
| | | | | | | | | | | | | | | |
| | Total | | Quoted Prices in Active Markets for Identical Assets (Level 1) | | Significant Observable Inputs (Level 2) | | Significant Unobservable Inputs (Level 3) |
| Asset class: | | | | | | | |
| Debt securities: | | | | | | | |
Fixed income common trust funds (1) (2) | $ | 163.1 |
| | $ | — |
| | $ | 163.1 |
| | $ | — |
|
| Corporate bonds | 29.1 |
| | — |
| | 29.1 |
| | — |
|
| Non-U.S. Government securities | 39.0 |
| | — |
| | 39.0 |
| | — |
|
| U.S. Government securities | 31.1 |
| | — |
| | 31.1 |
| | — |
|
| Equity securities: | | | | | | | |
Global equity common trust funds (1) (3) | 57.6 |
| | — |
| | 57.6 |
| | — |
|
| Global equities: | 13.2 |
| | — |
| | 13.2 |
| | — |
|
| Alternative investments: | | | | |
|
| |
|
|
Commingled global fund allocations (1) (4) | 80.6 |
| | — |
| | 80.6 |
| | — |
|
| Other: | | | | |
|
| |
|
|
Short-term investments (5) | 10.5 |
| | 10.5 |
| | — |
| | — |
|
| Other | 1.0 |
| | — |
| | — |
| | 1.0 |
|
| Total | $ | 425.2 |
| | $ | 10.5 |
| | $ | 413.7 |
| | $ | 1.0 |
|
| |
(1)
| Common/commingled trust funds are similar to mutual funds, with a daily net asset value per share measured by the fund sponsor and used as the basis for current transactions. These investments, however, are not registered with the U.S. Securities and Exchange Commission and participation is not open to the public. The funds are valued at the net asset value per share multiplied by the number of shares held as of the measurement date. |
| |
(2)
| (2)This class represents investments in actively managed common trust funds that invest in a variety of fixed income investments, which may include corporate bonds, both U.S. and non-U.S. municipal securities, interest rate swaps, options and futures. |
| |
(3)
| This class represents investments in actively managed common trust funds that invest primarily in equity securities, which may include common stocks, options and futures. |
| |
(4)
| This class represents investments in actively managed common trust funds with investments in both equity and debt securities. The investments may include common stock, corporate bonds, U.S. and non-U.S. municipal securities, interest rate swaps, options and futures. |
| |
(5)
| Short-term investments are valued at $1.00/unit, which approximates fair value. Amounts are generally invested in actively managed common trust funds or interest-bearing accounts. |
Our domestic pension plans participate in a variety of fixed income investments, which may include corporate bonds, both U.S. and non-U.S. municipal and government securities, lending program through J.P. Morgan Chase Bank, National Association. Securities loaned are required to be fully collateralized by cash or otherinterest rate swaps, options and futures.
(3)This class represents investments in actively managed common trust funds that invest primarily in equity securities, which may include common stocks, options and futures.
(4)This class represents investments in actively managed common trust funds with investments in both equity and debt securities. The gross collateralinvestments may include common stock, corporate bonds, U.S. and the related liability to return collateral amounted to $0.5non-U.S. municipal securities, interest rate swaps, options and $2.9futures.
(5)Short-term investments are valued at December 31, 2017 and 2016, respectively, and have been included within Level 2 of the$1.00/unit, which approximates fair value hierarchyvalue. Amounts are generally invested in the tables above.actively managed common trust funds or interest-bearing accounts.
The following table summarizes changes in the fair value of Level 3 assets for the years ended December 31, 2017 and 2016:
|
| | | | | | | | | | | | | | | | | | | |
| | Global Equity Common Trust Funds | | Commingled Global Fund Allocations | | Fixed Income Common Trust Funds | | Other | | Total |
| Balance at December 31, 2015 | $ | — |
| | $ | — |
| | $ | — |
| | $ | 1.0 |
| | $ | 1.0 |
|
| Transfer from Level 3 to Level 2 assets | — |
| | — |
| | — |
| | — |
| | — |
|
| Sales | — |
| | — |
| | — |
| | — |
| | — |
|
| Balance at December 31, 2016 | — |
| | — |
| | — |
| | 1.0 |
| | 1.0 |
|
| Transfer from Level 3 to Level 2 assets | — |
| | — |
| | — |
| | — |
| | — |
|
| Sales | — |
| | — |
| | — |
| | — |
| | — |
|
| Balance at December 31, 2017 | $ | — |
| | $ | — |
| | $ | — |
| | $ | 1.0 |
| | $ | 1.0 |
|
Employer Contributions — We currently fund U.S. pension plans in amounts equal to the minimum funding requirements of the Employee Retirement Income Security Act of 1974, plus additional amounts that may be approved from time to time. During 2017,2021, we made no0 contributions to our qualified domestic pension plans, and direct benefit payments of $6.3$5.5 to our non-qualified domestic pension plans. In 2018,2022, we do not expect to make any minimum required funding contributions to our qualified domestic pension plans and expect to make direct benefit payments of $6.0$5.3 to our non-qualified domestic pension plans.
In 2017,2021, we made contributionscontributions of $3.4$0.9 to our foreign pension plans. In 2018,2022, we expect to make contributions of $2.5$1.2 to our foreign pension plans.
Estimated Future Benefit Payments — Following is a summary, as of December 31, 2017,2021, of the estimated future benefit payments for our pension plans in each of the next five fiscal years and in the aggregate for five fiscal years thereafter. Benefit payments are paid from plan assets or directly by us for our non-funded plans. The expected benefit payments are estimated based on the same assumptions used at December 31, 20172021 to measure our obligations and include benefits attributable to estimated future employee service.
Estimated future benefit payments: (Domestic and foreign pension plans)
|
| | | | | | | |
| | Domestic Pension Benefits | | Foreign Pension Benefits |
| 2018 | $ | 24.8 |
| | $ | 4.7 |
|
| 2019 | 22.6 |
| | 5.5 |
|
| 2020 | 23.1 |
| | 5.3 |
|
| 2021 | 23.3 |
| | 5.5 |
|
| 2022 | 23.9 |
| | 6.4 |
|
| Subsequent five years | 115.1 |
| | 36.1 |
|
(Domestic and foreign pension plans)
| | | | | | | | | | | |
| Domestic
Pension
Benefits | | Foreign
Pension
Benefits |
| 2022 | $ | 26.7 | | | $ | 6.3 | |
| 2023 | 26.4 | | | 6.0 | |
| 2024 | 26.0 | | | 6.4 | |
| 2025 | 25.1 | | | 7.5 | |
| 2026 | 26.1 | | | 7.2 | |
| Subsequent five years | 98.1 | | | 39.6 | |
Obligations and Funded Status — The funded status of our pension plans is dependent upon many factors, including returns on invested assets and the level of market interest rates. Our non-funded pension plans account for $71.5$60.4 of the current underfunded status, as these plans are not required to be funded. The following tables show the domestic and foreign pension plans’ funded status and amounts recognized in our consolidated balance sheets:
| | | | | | | | | | | | | | | | | | | | | | | |
| Domestic Pension
Plans | | Foreign Pension
Plans |
| 2021 | | 2020 | | 2021 | | 2020 |
| Change in projected benefit obligation: | | | | | | | |
| Projected benefit obligation — beginning of year | $ | 364.7 | | | $ | 348.2 | | | $ | 192.2 | | | $ | 175.0 | |
| | | | | | | |
| Service cost | — | | | — | | | — | | | — | |
| Interest cost | 8.4 | | | 10.8 | | | 3.4 | | | 3.8 | |
| | | | | | | |
| Actuarial (gains) losses | (12.9) | | | 30.4 | | | (4.8) | | | 14.3 | |
| Settlements | (10.5) | | | (10.3) | | | (3.0) | | | — | |
| | | | | | | |
| | | | | | | |
| Benefits paid | (14.3) | | | (14.4) | | | (5.1) | | | (6.7) | |
| Foreign exchange and other | — | | | — | | | (0.3) | | | 5.8 | |
| Projected benefit obligation — end of year | $ | 335.4 | | | $ | 364.7 | | | $ | 182.4 | | | $ | 192.2 | |
The actuarial gains and losses for all pension plans in 2021 and 2020 were primarily related to a change in the discount rate used to measure the benefit obligations of those plans.
| | | | | | | | | | | | | | | | | | | | | | | |
| Domestic Pension
Plans | | Foreign Pension
Plans |
| 2021 | | 2020 | | 2021 | | 2020 |
| Change in plan assets: | | | | | | | |
| Fair value of plan assets — beginning of year | $ | 279.8 | | | $ | 263.6 | | | $ | 198.3 | | | $ | 178.1 | |
| Actual return on plan assets | (0.1) | | | 35.1 | | | 3.6 | | | 19.9 | |
| Contributions (employer and employee) | 5.5 | | | 5.8 | | | 0.9 | | | 0.9 | |
| Settlements | (10.5) | | | (10.3) | | | (3.0) | | | — | |
| Benefits paid | (14.3) | | | (14.4) | | | (5.1) | | | (6.7) | |
| | | | | | | |
| Foreign exchange and other | — | | | — | | | (1.1) | | | 6.1 | |
| | | | | | | |
| Fair value of plan assets — end of year | $ | 260.4 | | | $ | 279.8 | | | $ | 193.6 | | | $ | 198.3 | |
| Funded status at year-end | (75.0) | | | (84.9) | | | 11.2 | | | 6.1 | |
| Amounts recognized in the consolidated balance sheets consist of: | | | | | | | |
| Other assets | $ | 2.2 | | | $ | 2.6 | | | $ | 11.4 | | | $ | 8.6 | |
| | | | | | | |
| Accrued expenses | (5.2) | | | (5.4) | | | — | | | — | |
| | | | | | | |
| Other long-term liabilities | (72.0) | | | (82.1) | | | (0.2) | | | (2.5) | |
| Net amount recognized | $ | (75.0) | | | $ | (84.9) | | | $ | 11.2 | | | $ | 6.1 | |
| Amount recognized in accumulated other comprehensive income (pre-tax) consists of — net prior service (credits) costs | (0.1) | | | (0.2) | | | 1.2 | | | 1.2 | |
|
| | | | | | | | | | | | | | | |
| | Domestic Pension Plans | | Foreign Pension Plans |
| | 2017 | | 2016 | | 2017 | | 2016 |
| Change in projected benefit obligation: | | | | | | | |
| Projected benefit obligation — beginning of year | $ | 348.1 |
| | $ | 371.1 |
| | $ | 157.6 |
| | $ | 155.7 |
|
Divestiture of Balcke Dürr (1) | — |
|
| — |
|
| — |
|
| (6.7 | ) |
| Service cost | 0.3 |
| | 0.4 |
| | — |
| | — |
|
| Interest cost | 13.4 |
| | 13.9 |
| | 4.9 |
| | 5.6 |
|
| Actuarial losses | 16.5 |
| | 9.5 |
| | 6.7 |
| | 27.4 |
|
Settlements (2) | — |
| | (36.4 | ) | | — |
| | — |
|
| Curtailment losses | 0.9 |
| | — |
| | — |
| | — |
|
| Benefits paid | (22.1 | ) | | (10.4 | ) | | (8.1 | ) | | (6.4 | ) |
| Foreign exchange and other | — |
| | — |
| | 14.1 |
| | (18.0 | ) |
| Projected benefit obligation — end of year | $ | 357.1 |
| | $ | 348.1 |
| | $ | 175.2 |
| | $ | 157.6 |
|
| |
(1)
| Represents the transfer of Balcke Dürr’s pension liabilities as a result of the sale. |
| |
(2)
| Amount in 2016 includes settlement payments of $27.9 in connection with lump-sum payment actions for the U.S. Plan and the SIARP. |
|
| | | | | | | | | | | | | | | |
| | Domestic Pension Plans | | Foreign Pension Plans |
| | 2017 | | 2016 | | 2017 | | 2016 |
| Change in plan assets: | | | | | | | |
| Fair value of plan assets — beginning of year | $ | 261.9 |
| | $ | 279.2 |
| | $ | 163.3 |
| | $ | 163.5 |
|
| Actual return on plan assets | 23.6 |
| | 19.5 |
| | 10.6 |
| | 25.6 |
|
| Contributions (employer and employee) | 6.3 |
| | 10.0 |
| | 3.4 |
| | 0.5 |
|
| Settlements | — |
| | (36.4 | ) | | — |
| | — |
|
| Benefits paid | (22.1 | ) | | (10.4 | ) | | (8.7 | ) | | (6.1 | ) |
| Foreign exchange and other | — |
| | — |
| | 14.8 |
| | (20.2 | ) |
| Fair value of plan assets — end of year | $ | 269.7 |
| | $ | 261.9 |
| | $ | 183.4 |
| | $ | 163.3 |
|
| Funded status at year-end | (87.4 | ) | | (86.2 | ) | | 8.2 |
| | 5.7 |
|
| Amounts recognized in the consolidated balance sheets consist of: | | | | | | | |
| Other assets | $ | — |
| | $ | — |
| | $ | 8.4 |
| | $ | 6.3 |
|
| Accrued expenses | (5.9 | ) | | (5.9 | ) | | — |
| | — |
|
| Other long-term liabilities | (81.5 | ) | | (80.3 | ) | | (0.2 | ) | | (0.6 | ) |
| Net amount recognized | $ | (87.4 | ) | | $ | (86.2 | ) | | $ | 8.2 |
| | $ | 5.7 |
|
| Amount recognized in accumulated other comprehensive income (pre-tax) consists of — net prior service credits | $ | (0.6 | ) | | $ | (0.7 | ) | | $ | — |
| | $ | — |
|
The following is information about our pension plans that had accumulated benefit obligations in excess of the fair value of their plan assets at December 31, 20172021 and 2016:2020:
| | | | | | | | | | | | | | | | | | | | | | | |
| Domestic Pension
Plans | | Foreign Pension
Plans |
| 2021 | | 2020 | | 2021 | | 2020 |
| Projected benefit obligation | $ | 329.0 | | | $ | 357.9 | | | $ | 0.2 | | | $ | 50.9 | |
| Accumulated benefit obligation | 329.0 | | | 357.9 | | | 0.2 | | | 50.9 | |
| Fair value of plan assets | 251.8 | | | 270.4 | | | — | | | 48.4 | |
|
| | | | | | | | | | | | | | | |
| | Domestic Pension Plans | | Foreign Pension Plans |
| | 2017 | | 2016 | | 2017 | | 2016 |
| Projected benefit obligation | $ | 357.1 |
| | $ | 348.1 |
| | $ | 0.2 |
| | $ | 43.8 |
|
| Accumulated benefit obligation | 357.1 |
| | 347.9 |
| | 0.2 |
| | 43.8 |
|
| Fair value of plan assets | 269.7 |
| | 261.9 |
| | — |
| | 43.2 |
|
The accumulated benefit obligation for all domestic and foreign pension plans was $357.1was $335.4 and $175.2,$182.4, respectively, at December 31, 2021 and $364.7 and $192.2, respectively, at December 31, 2017 and $347.9 and $157.6, respectively, at December 31, 2016.2020.
Components of Net Periodic Pension Benefit Expense (Income) — Net periodic pension benefit expense (income) for our domestic and foreign pension plans included the following components:
Domestic Pension Plans
| | | | Year ended December 31, | | Year ended December 31, |
| | 2017 | | 2016 | | 2015 | | 2021 | | 2020 | | 2019 |
| Service cost | $ | 0.3 |
| | $ | 0.4 |
| | $ | 2.5 |
| Service cost | $ | — | | | $ | — | | | $ | — | |
| Interest cost | 13.4 |
| | 13.9 |
| | 16.5 |
| Interest cost | 8.4 | | | 10.8 | | | 13.3 | |
| Expected return on plan assets | (10.1 | ) | | (12.9 | ) | | (18.0 | ) | Expected return on plan assets | (8.7) | | | (9.5) | | | (9.8) | |
| Amortization of unrecognized prior service credits | (0.1 | ) | | (0.2 | ) | | (0.1 | ) | Amortization of unrecognized prior service credits | (0.1) | | | (0.1) | | | (0.1) | |
Recognized net actuarial losses (1) | 3.9 |
| | 3.2 |
| | 18.9 |
| |
| Total net periodic pension benefit expense | $ | 7.4 |
| | $ | 4.4 |
| | $ | 19.8 |
| |
Recognized net actuarial (gains) losses (1) | | Recognized net actuarial (gains) losses (1) | (4.2) | | | 4.7 | | | 6.5 | |
| Total net periodic pension benefit (income) expense | | Total net periodic pension benefit (income) expense | $ | (4.6) | | | $ | 5.9 | | | $ | 9.9 | |
| |
(1)(1)Consists primarily of our reported actuarial (gains) losses, the difference between actual and expected returns on plan assets, settlement gains (losses), and curtailment gains (losses). | Consists primarily of our reported actuarial (gains) losses, the difference between actual and expected returns on plan assets, settlement gains (losses), and curtailment gains. The actuarial losses for 2016 included $1.8 related to the lump-sum payment actions that took place during the second quarter of the year. The actuarial losses for 2015 included a charge of $11.4 and a curtailment gain of $5.1 related to the freeze of all benefits for non-union participants of the U.S. Plan and the SIARP during the third quarter of the year. |
Foreign Pension Plans
| | | | | | | | | | | | | | | | | |
| Year ended December 31, |
| 2021 | | 2020 | | 2019 |
| Service cost | $ | — | | | $ | — | | | $ | — | |
| Interest cost | 3.4 | | | 3.8 | | | 4.8 | |
| Expected return on plan assets | (5.8) | | | (5.7) | | | (6.7) | |
| | | | | |
Recognized net actuarial (gains) losses (1) | (1.8) | | | 0.2 | | | 1.0 | |
| Total net periodic pension benefit income | $ | (4.2) | | | $ | (1.7) | | | $ | (0.9) | |
(1)Consists of our reported actuarial (gains) losses and the difference between actual and expected returns on plan assets.
|
| | | | | | | | | | | |
| | Year ended December 31, |
| | 2017 | | 2016 | | 2015 |
| Service cost | $ | — |
| | $ | — |
| | $ | 1.3 |
|
| Interest cost | 4.9 |
| | 5.6 |
| | 7.7 |
|
| Expected return on plan assets | (6.4 | ) | | (6.6 | ) | | (9.7 | ) |
Recognized net actuarial losses (1) | 3.1 |
| | 8.2 |
| | 3.8 |
|
| Total net periodic pension benefit expense | 1.6 |
| | 7.2 |
| | 3.1 |
|
| Less: Net periodic pension expense of discontinued operations | — |
| | (0.2 | ) | | (2.2 | ) |
| Net periodic pension benefit expense of continuing operations | $ | 1.6 |
| | $ | 7.0 |
| | $ | 0.9 |
|
| |
(1)
| Consists of our reported actuarial losses and the difference between actual and expected returns on plan assets. |
Assumptions — Actuarial assumptions used in accounting for our domestic and foreign pension plans were as follows:
| | | | Year ended December 31, | | Year ended December 31, |
| | 2017 | | 2016 | | 2015 | | 2021 | | 2020 | | 2019 |
| Domestic Pension Plans | | | | | | Domestic Pension Plans | | | | | |
| Weighted-average actuarial assumptions used in determining net periodic pension expense: | | | | | | Weighted-average actuarial assumptions used in determining net periodic pension expense: | |
| Discount rate | 3.98 | % | | 4.06 | % | | 4.09 | % | Discount rate | 2.35 | % | | 3.16 | % | | 4.29 | % |
| Rate of increase in compensation levels | 3.75 | % | | 3.75 | % | | 3.75 | % | Rate of increase in compensation levels | N/A | | N/A | | N/A |
| Expected long-term rate of return on assets | 4.00 | % | | 5.00 | % | | 5.75 | % | Expected long-term rate of return on assets | 3.22 | % | | 3.75 | % | | 4.25 | % |
| Weighted-average actuarial assumptions used in determining year-end benefit obligations: | | | | | | Weighted-average actuarial assumptions used in determining year-end benefit obligations: | |
| Discount rate | 3.57 | % | | 3.98 | % | | 4.24 | % | Discount rate | 2.83 | % | | 2.35 | % | | 3.16 | % |
| Rate of increase in compensation levels | 3.75 | % | | 3.75 | % | | 3.75 | % | Rate of increase in compensation levels | N/A | | N/A | | N/A |
| Foreign Pension Plans | | | | | | Foreign Pension Plans | |
| Weighted-average actuarial assumptions used in determining net periodic pension expense: | | | | | | Weighted-average actuarial assumptions used in determining net periodic pension expense: | |
| Discount rate | 2.97 | % | | 3.82 | % | | 3.68 | % | Discount rate | 1.76 | % | | 2.27 | % | | 3.02 | % |
| Rate of increase in compensation levels | N/A |
| | N/A |
| | 4.00 | % | Rate of increase in compensation levels | N/A | | N/A | | N/A |
| Expected long-term rate of return on assets | 4.09 | % | | 4.57 | % | | 5.81 | % | Expected long-term rate of return on assets | 3.31 | % | | 3.81 | % | | 4.69 | % |
| Weighted-average actuarial assumptions used in determining year-end benefit obligations: | | | | | | Weighted-average actuarial assumptions used in determining year-end benefit obligations: | |
| Discount rate | 2.76 | % | | 2.97 | % | | 3.82 | % | Discount rate | 2.19 | % | | 1.76 | % | | 2.27 | % |
| Rate of increase in compensation levels | N/A |
| | N/A |
| | 4.00 | % | Rate of increase in compensation levels | N/A | | N/A | | N/A |
We review the pension assumptions annually. Pension income or expense for the year is determined using assumptions as of the beginning of the year (except for the effects of recognizing changes in the fair value of plan assets and actuarial gains and losses in the fourth quarter of each year), while the funded status is determined using assumptions as of the end of the year. We determined assumptions and established them at the respective balance sheet date using the following principles: (i) the expected long-term rate of return on plan assets is established based on forward looking long-term expectations of asset returns over the expected period to fund participant benefits based on the target investment mix of our plans;plans and (ii) the discount rate is primarily determined by matching the expected projected benefit obligation cash flows for each of the plans to a yield curve that is representative of long-term, high-quality (rated AA or higher) fixed income debt instruments as of the measurement date; and (iii) the rate of increase in compensation levels is established based on our expectations of current and foreseeable future increases in compensation. In addition, we consider advice from independent actuaries.date.
Postretirement Benefit Plans
Employer Contributions and Future Benefit Payments — Our postretirement medical plans are unfunded and have no plan assets, but are instead funded by us on a pay-as-you-go basis in the form of direct benefit payments or policy premium payments. In 2017,2021, we made benefit payments of $9.0$5.9 to our postretirement benefit plans. Following is a summary, as of December 31, 2017,2021, of the estimated future benefit payments for our postretirement plans in each of the next five fiscal years and in the aggregate for five fiscal years thereafter. The expected benefit payments are estimated based on the same assumptions used at December 31, 20172021 to measure our obligations and include benefits attributable to estimated future employee service.
| | | | | |
| Postretirement Payments |
| 2022 | $ | 6.0 | |
| 2023 | 5.4 | |
| 2024 | 4.9 | |
| 2025 | 4.4 | |
| 2026 | 4.0 | |
| Subsequent five years | 14.8 | |
|
| | | |
| | Postretirement Payments |
| 2018 | $ | 8.9 |
|
| 2019 | 8.2 |
|
| 2020 | 7.5 |
|
| 2021 | 6.9 |
|
| 2022 | 6.3 |
|
| Subsequent five years | 23.9 |
|
Obligations and Funded Status — The following tables show the postretirement plans’ funded status and amounts recognized in our consolidated balance sheets:
| | | | | | | | | | | |
| Postretirement
Plans |
| 2021 | | 2020 |
| Change in projected postretirement benefit obligation: | | | |
| Projected postretirement benefit obligation — beginning of year | $ | 60.5 | | | $ | 63.6 | |
| | | |
| Interest cost | 1.0 | | | 1.6 | |
| Actuarial (gains) losses | (3.9) | | | 1.9 | |
| Benefits paid | (5.9) | | | (6.6) | |
| | | |
| | | |
| | | |
| Projected postretirement benefit obligation — end of year | $ | 51.7 | | | $ | 60.5 | |
| Funded status at year-end | $ | (51.7) | | | $ | (60.5) | |
| Amounts recognized in the consolidated balance sheets consist of: | | | |
| Accrued expenses | $ | (5.9) | | | $ | (6.7) | |
| | | |
| Other long-term liabilities | (45.8) | | | (53.8) | |
| Net amount recognized | $ | (51.7) | | | $ | (60.5) | |
| Amount recognized in accumulated other comprehensive income (pre-tax) consists of — net prior service credits | $ | (15.5) | | | $ | (20.2) | |
|
| | | | | | | |
| | Postretirement Benefits |
| | 2017 | | 2016 |
| Change in accumulated postretirement benefit obligation: | | | |
| Accumulated postretirement benefit obligation — beginning of year | $ | 115.3 |
| | $ | 120.8 |
|
| Interest cost | 3.5 |
| | 4.2 |
|
| Actuarial (gains) losses | (5.4 | ) | | 0.6 |
|
| Benefits paid | (9.0 | ) | | (10.3 | ) |
| Plan amendment | (26.8 | ) | | — |
|
| Accumulated postretirement benefit obligation — end of year | $ | 77.6 |
| | $ | 115.3 |
|
| Funded status at year-end | $ | (77.6 | ) | | $ | (115.3 | ) |
| Amounts recognized in the consolidated balance sheets consist of: | | | |
| Accrued expenses | $ | (8.7 | ) | | $ | (11.7 | ) |
| Other long-term liabilities | (68.9 | ) | | (103.6 | ) |
| Net amount recognized | $ | (77.6 | ) | | $ | (115.3 | ) |
| Amount recognized in accumulated other comprehensive income (pre-tax) consists of — net prior service credits | $ | (31.0 | ) | | $ | (5.9 | ) |
The net periodic postretirement benefit expense (income) included the following components:
| | | | Year ended December 31, | | Year ended December 31, |
| | 2017 | | 2016 | | 2015 | | 2021 | | 2020 | | 2019 |
| Service cost | $ | — |
| | $ | — |
| | $ | 0.1 |
| Service cost | $ | — | | | $ | — | | | $ | — | |
| Interest cost | 3.5 |
| | 4.2 |
| | 4.4 |
| Interest cost | 1.0 | | | 1.6 | | | 2.4 | |
| Amortization of unrecognized prior service credits | (1.7 | ) | | (0.8 | ) | | (0.8 | ) | Amortization of unrecognized prior service credits | (4.7) | | | (4.7) | | | (4.0) | |
| Plan amendment | (2.6 | ) | | — |
| | (1.8 | ) | |
| | Recognized net actuarial (gains) losses | (2.8 | ) | | 0.6 |
| | (4.0 | ) | Recognized net actuarial (gains) losses | (3.9) | | | 1.9 | | | 2.5 | |
| Net periodic postretirement benefit expense (income) | $ | (3.6 | ) | | $ | 4.0 |
| | $ | (2.1 | ) | |
| Net periodic postretirement benefit (income) expense | | Net periodic postretirement benefit (income) expense | $ | (7.6) | | | $ | (1.2) | | | $ | 0.9 | |
Actuarial assumptions used in accounting for our domestic postretirement plans were as follows:
| | | | Year ended December 31, | | Year ended December 31, |
| | 2017 | | 2016 | | 2015 | | 2021 | | 2020 | | 2019 |
| Assumed health care cost trend rates: | | | | | | Assumed health care cost trend rates: | | | | | |
| Health care cost trend rate for next year | 7.25 | % | | 7.50 | % | | 6.60 | % | Health care cost trend rate for next year | 6.25 | % | | 6.50 | % | | 6.75 | % |
| Rate to which the cost trend rate is assumed to decline (the ultimate trend rate) | 5.00 | % | | 5.00 | % | | 5.00 | % | Rate to which the cost trend rate is assumed to decline (the ultimate trend rate) | 5.00 | % | | 5.00 | % | | 5.00 | % |
| Year that the rate reaches the ultimate trend rate | 2027 |
| | 2027 |
| | 2024 |
| Year that the rate reaches the ultimate trend rate | 2027 | | 2027 | | 2027 |
| Discount rate used in determining net periodic postretirement benefit expense | 3.60 | % | | 3.88 | % | | 3.53 | % | Discount rate used in determining net periodic postretirement benefit expense | 2.00 | % | | 2.97 | % | | 4.09 | % |
| Discount rate used in determining year-end postretirement benefit obligation | 3.34 | % | | 3.69 | % | | 3.88 | % | Discount rate used in determining year-end postretirement benefit obligation | 2.56 | % | | 2.00 | % | | 2.97 | % |
The accumulated postretirement benefit obligation was determined using the terms and conditions of our various plans, together with relevant actuarial assumptions and health care cost trend rates. It is our policy to review the postretirement assumptions annually. The assumptions are determined by us and are established based on our prior experience and our expectations that future health care cost trend rates will decline. In addition, we consider advice from independent actuaries.
Assumed health care cost trend rates can have a significant effect on the amounts reported for the postretirement benefit plans. Including the effects of recognizing actuarial gains and losses into earnings, a one percentage point increase in the assumed health care cost trend rate would have increased our estimated 2017 postretirement expense by $1.4, and a one percentage point decrease in the assumed health care cost trend rate would have decreased our estimated 2017 postretirement expense by $1.6.
Defined Contribution Retirement Plans
We maintain a defined contribution retirement plan (the “DC Plan”) pursuant to Section 401(k) of the U.S. Internal Revenue Code. Under the DC Plan, eligible U.S. employees may voluntarily contribute up to 50% of their compensation into the DC Plan and we match a portion of participating employees’ contributions. Our matching contributions are primarily made in newly issued shares of company common stock and are issued at the prevailing market price. The matching contributions vest with the employee immediately upon the date of the match and there are no restrictions on the resale of common stock held by employees.
Under the DC Plan, we contributed 0.334, 0.605contributed 0.135, 0.192 and 0.4340.199 shares of our common stock to employee accounts in 2017, 20162021, 2020 and 2015,2019, respectively. Compensation expense is recorded based on the market value of shares as the shares are contributed to employee accounts. We recorded $8.7$7.8 in 2017, $8.82021, $7.7 in 20162020 and $10.2$7.0 in 20152019 as compensation expense related to the matching contribution.
Certain collectively-bargained employees participate in the DC Plan with company contributions not being made in company common stock, although company common stock is offered as an investment option under these plans.
We also maintain a Supplemental Retirement Savings Plan (“SRSP”), which permits certain members of our senior management and executive groups to defer eligible compensation in excess of the amounts allowed under the DC Plan. We match a portion of participating employees’ deferrals to the extent allowable under the SRSP provisions. The matching contributions vest with the participant immediately. Our funding of the participants’ deferrals and our matching contributions are held in certain mutual funds (as allowed under the SRSP), as directed by the participant. The fair values of these assets, which totaled $21.2$18.3 and $19.1$20.9 at December 31, 20172021 and 2016,2020, respectively, are based on quoted prices in active markets for identical assets (Level 1). In addition, the assets under the SRSP are available to the general creditors in the event of our bankruptcy and, thus, are maintained on our consolidated balance sheets within other non-current“Other assets,” with a corresponding amount in other“Other long-term liabilitiesliabilities” for our obligation to the participants. Lastly, these assets are accounted for as trading securities. During 2017, 20162021, 2020 and 2015,2019, we recorded compensation expense of $0.2, $0.2 $0.7 and $0.7,$0.2, respectively, relating to our matching contributions to the SRSP.
(10) (12) Income Taxes
Income (loss) from continuing operations before income taxes and the (provision for) benefit from income taxes consisted of the following:
| | | | | | | | | | Year ended December 31, |
| | Year ended December 31, | | 2021 | | 2020 | | 2019 |
| | 2017 | | 2016 | | 2015 | |
| Income (loss) from continuing operations: | | | | | | |
| Income from continuing operations: | | Income from continuing operations: | | | | | |
| United States | $ | 68.8 |
| | $ | 14.0 |
| | $ | (14.2 | ) | United States | $ | 17.2 | | | $ | 39.6 | | | $ | 52.9 | |
| Foreign | (32.7 | ) | | 25.4 |
| | (140.1 | ) | Foreign | 52.7 | | | 39.0 | | | 35.9 | |
| | $ | 36.1 |
| | $ | 39.4 |
| | $ | (154.3 | ) | | $ | 69.9 | | | $ | 78.6 | | | $ | 88.8 | |
| (Provision for) benefit from income taxes: | | | | | | (Provision for) benefit from income taxes: | | | | | |
| Current: | | | | | | Current: | |
| United States | $ | 30.4 |
| | $ | (4.3 | ) | | $ | 10.9 |
| United States | $ | (5.4) | | | $ | (0.7) | | | $ | 6.8 | |
| Foreign | (3.5 | ) | | (4.8 | ) | | (3.3 | ) | Foreign | (6.9) | | | (3.8) | | | (5.5) | |
| Total current | 26.9 |
| | (9.1 | ) | | 7.6 |
| Total current | (12.3) | | | (4.5) | | | 1.3 | |
| Deferred and other: | | | | | | Deferred and other: | | | | | |
| United States | 23.5 |
| | 0.2 |
| | (10.7 | ) | United States | 0.8 | | | (0.3) | | | (12.8) | |
| Foreign | (2.5 | ) | | (0.2 | ) | | 5.8 |
| Foreign | 0.6 | | | — | | | (1.0) | |
| Total deferred and other | 21.0 |
| | — |
| | (4.9 | ) | Total deferred and other | 1.4 | | | (0.3) | | | (13.8) | |
| Total (provision) benefit | $ | 47.9 |
| | $ | (9.1 | ) | | $ | 2.7 |
| |
| Total provision | | Total provision | $ | (10.9) | | | $ | (4.8) | | | $ | (12.5) | |
The reconciliation of income tax computed at the U.S. federal statutory tax rate to our effective income tax rate was as follows:
|
| | | | | | | | |
| | Year ended December 31, |
| | 2017 | | 2016 | | 2015 |
| Tax at U.S. federal statutory rate | 35.0 | % | | 35.0 | % | | 35.0 | % |
| State and local taxes, net of U.S. federal benefit | 4.4 | % | | 5.0 | % | | (0.1 | )% |
| U.S. credits and exemptions | (8.5 | )% | | (12.9 | )% | | 1.5 | % |
| Foreign earnings/losses taxed at lower rates | (14.9 | )% | | (5.9 | )% | | (9.0 | )% |
| Audit settlements with taxing authorities | (0.1 | )% | | — | % | | 0.7 | % |
| Adjustments to uncertain tax positions | (9.8 | )% | | (1.9 | )% | | (5.4 | )% |
| Changes in valuation allowance | 54.4 | % | | 17.4 | % | | (18.8 | )% |
| Tax on distributions of foreign earnings | — | % | | 0.7 | % | | (0.2 | )% |
| Worthless stock deductions and other basis adjustments | (226.3 | )% | | — | % | | (2.4 | )% |
| Disposition of dry cooling business | — | % | | (15.6 | )% | | — | % |
| U.S. tax reform | 32.6 | % | | — | % | | — | % |
| Other | 0.5 | % | | 1.3 | % | | 0.4 | % |
| | (132.7 | )% | | 23.1 | % | | 1.7 | % |
| | | | | | | | | | | | | | | | | |
| Year ended December 31, |
| 2021 | | 2020 | | 2019 |
| Tax at U.S. federal statutory rate | 21.0 | % | | 21.0 | % | | 21.0 | % |
| State and local taxes, net of U.S. federal benefit | 0.4 | % | | 1.8 | % | | 0.8 | % |
| U.S. credits and exemptions | (20.4) | % | | (4.4) | % | | (3.3) | % |
| Foreign earnings/losses taxed at different rates | 12.6 | % | | (4.6) | % | | (2.8) | % |
| Nondeductible expenses | 3.3 | % | | 2.2 | % | | 2.5 | % |
| Adjustments to uncertain tax positions | (2.4) | % | | (4.4) | % | | (0.5) | % |
Changes in valuation allowance (1) | 47.9 | % | | (0.6) | % | | (1.8) | % |
| Share-based compensation | (1.8) | % | | (3.6) | % | | (1.8) | % |
| | | | | |
| | | | | |
Capital loss (1) | (42.5) | % | | — | % | | — | % |
| Goodwill impairment and basis adjustments | 7.3 | % | | — | % | | — | % |
| Statutory rate changes | 2.1 | % | | — | % | | (0.6) | % |
| Adjustments to contingent consideration | (8.9) | % | | — | % | | — | % |
| | | | | |
| Other | (3.0) | % | | (1.3) | % | | 0.6 | % |
| 15.6 | % | | 6.1 | % | | 14.1 | % |
(1) During the fourth quarter of 2021, we generated a capital loss in connection with the liquidation of certain recently acquired entities. All but $2.0 of the income tax benefit associated with the capital loss has been reflected in “Gain (loss) from discontinued operations, net of tax” in the accompanying consolidated statement of operations for the year ended December 31, 2021. As such, the capital loss had only a minimal impact on our effective income tax rate for continuing operations during the year ended December 31, 2021.
Significant components of our deferred tax assets and liabilities were as follows:
| | | | | | | | | | | |
| As of December 31, |
| 2021 | | 2020 |
| Deferred tax assets: | | | |
| NOL and credit carryforwards | $ | 118.6 | | | $ | 141.0 | |
| Pension, other postretirement and postemployment benefits | 31.1 | | | 36.5 | |
| Payroll and compensation | 16.3 | | | 15.0 | |
| Legal, environmental and self-insurance accruals | 35.9 | | | 22.6 | |
| Working capital accruals | 17.0 | | | 17.1 | |
| Other | 9.8 | | | 8.4 | |
| Total deferred tax assets | 228.7 | | | 240.6 | |
| Valuation allowance | (89.8) | | | (92.0) | |
| Net deferred tax assets | 138.9 | | | 148.6 | |
| Deferred tax liabilities: | | | |
| Intangible assets recorded in acquisitions | 79.4 | | | 65.2 | |
| Basis difference in affiliates | 19.8 | | | 16.3 | |
| Accelerated depreciation | 13.3 | | | 11.9 | |
| Deferred income | 20.2 | | | 29.4 | |
| Other | 16.8 | | | 11.1 | |
| Total deferred tax liabilities | 149.5 | | | 133.9 | |
| $ | (10.6) | | | $ | 14.7 | |
|
| | | | | | | |
| | As of December 31, |
| | 2017 | | 2016 |
| Deferred tax assets: | | | |
| NOL and credit carryforwards | $ | 146.0 |
| | $ | 78.2 |
|
| Pension, other postretirement and postemployment benefits | 41.2 |
| | 77.2 |
|
| Payroll and compensation | 18.2 |
| | 22.8 |
|
| Legal, environmental and self-insurance accruals | 25.3 |
| | 35.1 |
|
| Working capital accruals | 11.5 |
| | 16.4 |
|
| Other | 17.6 |
| | 20.7 |
|
| Total deferred tax assets | 259.8 |
| | 250.4 |
|
| Valuation allowance | (110.9 | ) | | (75.8 | ) |
| Net deferred tax assets | 148.9 |
| | 174.6 |
|
| Deferred tax liabilities: | | | |
| Intangible assets recorded in acquisitions | 53.9 |
| | 68.3 |
|
| Basis difference in affiliates | 3.7 |
| | 10.6 |
|
| Accelerated depreciation | 28.8 |
| | 40.6 |
|
| Other | 12.9 |
| | 6.6 |
|
| Total deferred tax liabilities | 99.3 |
| | 126.1 |
|
| | $ | 49.6 |
| | $ | 48.5 |
|
The Tax Cuts and Jobs Act
As indicated in Note 1, on December 22, 2017, the Tax Cuts and Jobs Act was enacted which significantly changes U.S. income tax law for businesses and individuals. The Act introduces changes that impact U.S. corporate tax rates (e.g., a reduction in the top tax rate from 35% to 21%), business-related exclusions, and deductions and credits. In addition, the Act will have tax consequences for many entities that operate internationally, including the timing and the amount of tax to be paid on undistributed foreign earnings.
As a result of the reduction in the federal corporate income tax rate and other legislative changes in the Act, we have revalued our net U.S. federal deferred tax assets, resulting in a charge of $11.8. Further, we considered the transition tax required for the mandatory one-time “deemed repatriation” and our preliminary analysis indicates we will not have a liability in this regard.
Given the significance and number of changes required by the Act and the historical complexity of our global tax structure, we have yet to complete our analysis of the impact of the Act on our consolidated financial statements. As a result, the above net charges are based on current estimates (i.e., provisional amounts). In addition, other adjustments
may be necessary to our income tax accounts to properly reflect the impact of certain provisions of the Act that have not been contemplated. For example, the potential impact of the Act on our liability for uncertain tax positions and various state tax implications of the Act have not been considered in our provisional amounts. As more guidance is issued and we better understand the full impact of the Act on our tax positions, we will finalize our analysis, with any resulting adjustments, which could be material, reflected in our 2018 consolidated financial statements.
General Matters
Deferred income taxes reflect the net tax effects of temporary differences between the carrying amounts of assets and liabilities for financial reporting purposes and the amounts used for income tax purposes. We periodically assess deferred tax assets to determine if they are likely to be realized and the adequacy of deferred tax liabilities, incorporating the results of local, state, federal and foreign tax audits in our estimates and judgments.
At December 31, 2017,2021, we had the following tax loss carryforwards available: federal,had $352.0 of state and $288.0 of foreign tax loss carryforwards of approximately $27.0, $659.0, and $293.0, respectively.available. We also had federal and state tax credit carryforwards of $32.4.$8.0. Of these amounts, $6.8$41.9 expire in 20182022 and $714.0$310.7 expire at various times between 20182023 and 2036.2040. The remaining carryforwards have no expiration date.
Realization of deferred tax assets, including those associated with net operating loss and credit carryforwards, is dependent upon generating sufficient taxable income in the appropriate tax jurisdiction. We believe that it is more likely than not that we may not realize the benefit of certain of these deferred tax assets and, accordingly, have established a valuation allowance against these deferred tax assets. Although realization is not assured for the remaining deferred tax assets, we believe it is more likely than not that the deferred tax assets will be realized through future taxable earnings or tax planning strategies. However, deferred tax assets could be reduced in the near term if our estimates of taxable income are significantly reduced or tax planning strategies are no longer viable. TheOur valuation allowance increaseddecreased by $35.1$2.2 in 20172021 and increased by $4.9$1.6 in 2016.2020. The 2017 increase2021 decrease was primarily driven by the lossesutilization of state attributes in connection with our sale of Transformer Solutions. As previously indicated, we recorded an income tax benefit associated with the capital loss that was generated from the liquidation of certain recently acquired entities, with $2.0 recorded to continuing operations and the remainder to discontinued operations. As such, the capital loss had no net impact to our valuation allowance during the year for our large power projects in South Africa and the impact of the Act on the realization of certain deferred tax assets.ended December 31, 2021.
The amount of income tax that we pay annually is dependent on various factors, including the timing of certain deductions. These deductions can vary from year to year,year-to-year, and, consequently, the amount of income taxes paid in future years will vary from the amounts paid in prior years.
Unrecognized Tax BenefitsUndistributed Foreign Earnings
In general, it is our practice and intention to reinvest the earnings of our non-U.S. subsidiaries in those operations. As of December 31, 2017,2021, we have $172.0 of undistributed earnings of our foreign subsidiaries. The majority of these earnings have already been reinvested in our overseas businesses. Further, we believe future domestic cash generation will be sufficient to meet future domestic cash needs. For this reason, we have not recorded a provision for U.S. or foreign withholding taxes on the excess of the amount for financial reporting over the tax basis of investments in foreign subsidiaries that are essentially permanent in duration. Generally, such amounts may become subject to U.S. taxation upon the remittance of dividends and under certain other circumstances. It is not practicable to estimate the amount of a deferred tax liability related to the undistributed earnings of our foreign subsidiaries in the event that these earnings are no longer considered to be indefinitely reinvested, due to the hypothetical nature of the calculation.
Unrecognized Tax Benefits
As of December 31, 2021, we had gross and net unrecognized tax benefits of $31.3$7.1 and $20.6, respectively. Of$6.4, respectively. All of these net unrecognized tax benefits $15.7 would impact our effective tax rate from continuing operations if recognized. Similarly, at December 31, 20162020 and 2015,2019, we had gross unrecognizedunrecognized tax benefits of $37.9$13.6 (net unrecognized tax benefits of $25.2)$11.0) and $48.8$17.2 (net unrecognized tax benefits of $30.1)$13.9), respectively.respectively.
We classify interest and penalties related to unrecognized tax benefits as a component of our income tax (provision) benefit. As of December 31, 2017,2021, gross accrued interest totaled $3.9totaled $2.6 (net accrued interest of $2.5)$2.2), while the related amounts as of December 31, 20162020 and 20152019 were $3.7$3.8 (net accrued interest of $2.4)$3.0) and $5.4$4.1 (net accrued interest of $4.5)$3.2), respectively. Our income tax (provision) benefit for the years ended December 31, 2017, 20162021, 2020 and 20152019 included gross interest income (expense) of $(0.2), $1.8$1.0, $0.2, and $0.2,$(0.5), respectively, resulting from adjustments to our liability for uncertain tax positions. As of December 31, 2017, 20162021, 2020 and 2015,2019, we had no accrual 0 accrual for penalties included in our unrecognized tax benefits.
Based on the outcome of certain examinations or as a result of the expiration of statutes of limitations for certain jurisdictions, we believe that within the next 12 months it is reasonably possible that our previously unrecognized tax benefits could decrease by approximately $3.0 up to $15.0.$5.0. The previously unrecognized tax benefits relate to a variety of tax matters including deemed income inclusions, transfer pricing and various state matters.
The aggregate changes in the balance of unrecognized tax benefits for the years ended December 31, 2017, 20162021, 2020 and 20152019 were as follows:
| | | | Year ended December 31, | | Year ended December 31, |
| | 2017 | | 2016 | | 2015 | | 2021 | | 2020 | | 2019 |
| Unrecognized tax benefit — opening balance | $ | 37.9 |
| | $ | 48.8 |
| | $ | 63.3 |
| Unrecognized tax benefit — opening balance | $ | 13.6 | | | $ | 17.2 | | | $ | 20.3 | |
| Gross increases — tax positions in prior period | 1.6 |
| | 3.6 |
| | 14.1 |
| Gross increases — tax positions in prior period | 0.7 | | | 0.3 | | | 1.1 | |
| Gross decreases — tax positions in prior period | (0.3 | ) | | (9.3 | ) | | (7.6 | ) | Gross decreases — tax positions in prior period | (6.4) | | | (2.2) | | | (0.8) | |
| Gross increases — tax positions in current period | 0.3 |
| | 0.7 |
| | 11.3 |
| Gross increases — tax positions in current period | 0.2 | | | 0.2 | | | 0.2 | |
| Settlements | (1.3 | ) | | — |
| | — |
| Settlements | — | | | (0.3) | | | (2.1) | |
| Lapse of statute of limitations | (7.1 | ) | | (5.9 | ) | | (4.4 | ) | Lapse of statute of limitations | (1.1) | | | (1.7) | | | (1.5) | |
| Gross decreases — Spin-Off | — |
| | — |
| | (26.7 | ) | |
| | Change due to foreign currency exchange rates | 0.2 |
| | — |
| | (1.2 | ) | Change due to foreign currency exchange rates | 0.1 | | | 0.1 | | | — | |
| Unrecognized tax benefit — ending balance | $ | 31.3 |
| | $ | 37.9 |
| | $ | 48.8 |
| Unrecognized tax benefit — ending balance | $ | 7.1 | | | $ | 13.6 | | | $ | 17.2 | |
Other Tax Matters
During 2017,2021, our income tax benefitprovision was impacted most significantly by (i) earnings in jurisdictions with lower statutory tax rates, (ii) $4.3 of income tax benefits related to various valuation allowance adjustments, primarily due to foreign tax credits for which the future realization is now considered likely, and (iii) a tax benefit of $77.6$3.5 related to a worthless stock deduction in the U.S.resolution of certain liabilities for uncertain tax positions and interest associated with various refund claims, partially offset by $13.2 of tax expense associated with global intangible low-taxed income created by the liquidation of various recently acquired entities.
During 2020, our investmentincome tax provision was impacted most significantly by (i) earnings in a South African subsidiary andjurisdictions with lower statutory tax rates, (ii) $4.9$4.2 of tax benefits related to various audit settlements, statute expirations, and other adjustments to liabilities for uncertain tax positions, partially offset byand (iii) $11.8$2.8 of netexcess tax charges associated with the impact of the new U.S. tax regulations described more fully above and (iv) $68.2 of foreign losses generatedbenefits resulting from stock-based compensation awards that vested and/or were exercised during the period for which no foreign tax benefit was recognized as future realization of any such foreign tax benefit is considered unlikely.year.
During 2016,2019, our income tax provision was impacted most significantly by (i) the $0.3$1.6 of income taxes provided in connection with the $18.4 gainexcess tax benefits resulting from stock-based compensation awards that was recorded on the sale of the dry cooling business, (ii) $13.7 of foreign losses generatedvested and/or were exercised during the period for which no tax benefit was recognized as future realization of any such tax benefit is considered unlikely, and (iii) $2.4year, (ii) $1.3 of tax benefits related to various audit settlements, statute expirations,our U.S. tax credits and other adjustments to liabilities for uncertain tax positions.
During 2015, our income tax benefit was impacted most significantly by (i) the effects of approximately $139.0 of foreign losses generated during the year for which no tax benefit was recognized, as future realization of any such tax benefit is considered unlikely, (ii) $3.7 of foreign taxes incurred during the year related to the Spin-Off and the reorganization actions undertaken to facilitate the Spin-Off,incentives, and (iii) $3.4$1.2 of taxestax benefits related to various audit settlements, statute expirations, and other adjustments to liabilities for uncertain tax positions.
We perform reviews of our income tax positions on a continuous basis and accrue for potential uncertain positions when we determine that an uncertaina tax position meets the criteria of the Income Taxes Topic of the Codification. Accruals for these uncertain tax positions are recorded in “Income taxes payable” and “Deferred and other income taxes” in the accompanying consolidated balance sheets based on the expectation as to the timing of when the matters will be resolved. As events change and resolutions occur, these accruals are adjusted, such as in the case of audit settlements with taxing authorities.
We have filedThe Internal Revenue Service (“IRS”) concluded its audit of our 2013, 2014, 2015, 2016 and 2017 federal income tax returnsreturns. In connection with such, we recorded a tax benefit of $2.2 during 2021 related to the resolution of certain liabilities for the 2014, 2015,uncertain tax positions and 2016 tax years and those returns are subject to examination. With regard to all open tax years, we believe any contingencies are adequately provided for.interest associated with various refund claims.
State income tax returns generally are subject to examination for a period of three to five years after filing the respective tax returns. The impact on such tax returns of any federal changes remains subject to examination by various states for a period of up to one year after formal notification to the states. We have various state income tax returns in the process of examination. We believe any uncertain tax positions related to these examinations have been adequately provided for.
We have various foreign income tax returns under examination. The most significant of these are in Germany for the 2010 through 2014 tax years. We believe that any uncertain tax positions related to these examinations have been adequately provided for.
An unfavorable resolution of one or more of the above matters could have a material adverse effect on our results of operations or cash flows in the quarter and year in which an adjustment is recorded or the tax is due or paid. As
audits and examinations are still in process, the timing of the ultimate resolution and any payments that may be required for the above matters cannot be determined at this time.
(11)
Coronavirus Aid, Relief, and Economic Security Act (“CARES Act”)
On March 27, 2020, the CARES Act was enacted into law and provides changes to various tax laws that impact businesses. We do not believe these changes impact our current and deferred income tax balances; therefore, no resulting adjustments have been recorded to such balances as of December 31, 2021 and 2020.
As provided within the CARES Act, we are deferring payments of our social security payroll taxes, for the period March 27, 2020 to December 31, 2020, with such deferral totaling $3.5 as of December 31, 2021. One-half of the deferred amount was paid in 2021, with the remainder required to be paid in 2022.
(13) Indebtedness
The following summarizes our debt activity (both current and non-current) for the year ended December 31, 2017:2021:
| | | | | | | | | | | | | | December 31,
2020 | | Borrowings | | Repayments | | Other (5) | | December 31,
2021 |
| December 31,
2016 |
| Borrowings |
| Repayments |
| Other (5) |
| December 31,
2017 | |
| Revolving loans | $ | — |
|
| $ | 54.6 |
|
| $ | (54.6 | ) |
| $ | — |
|
| $ | — |
| |
Term loans (1)(2) | 339.6 |
|
| 350.0 |
|
| (341.2 | ) |
| (0.7 | ) |
| 347.7 |
| |
Revolving loans (1) | | Revolving loans (1) | $ | 129.8 | | | $ | 209.9 | | | $ | (339.7) | | | $ | — | | | $ | — | |
Term loan (2) | | Term loan (2) | 248.6 | | | — | | | (6.3) | | | 0.4 | | | 242.7 | |
Trade receivables financing arrangement (3) | — |
|
| 74.0 |
|
| (74.0 | ) |
| — |
|
| — |
| Trade receivables financing arrangement (3) | 28.0 | | | 179.0 | | | (207.0) | | | — | | | — | |
Other indebtedness (4) | 16.6 |
|
| 38.7 |
|
| (48.8 | ) |
| 2.6 |
|
| 9.1 |
| Other indebtedness (4) | 6.0 | | | 0.6 | | | (1.0) | | | (2.3) | | | 3.3 | |
| Total debt | 356.2 |
|
| $ | 517.3 |
|
| $ | (518.6 | ) |
| $ | 1.9 |
|
| 356.8 |
| Total debt | 412.4 | | | $ | 389.5 | | | $ | (554.0) | | | $ | (1.9) | | | 246.0 | |
| Less: short-term debt | 14.8 |
|
|
|
|
|
|
|
|
|
|
| 7.0 |
| Less: short-term debt | 101.2 | | | | | | | | | 2.2 | |
| Less: current maturities of long-term debt | 17.9 |
|
|
|
|
|
|
|
| 0.5 |
| Less: current maturities of long-term debt | 7.2 | | | 13.0 | |
| Total long-term debt | $ | 323.5 |
|
|
|
|
|
|
|
| $ | 349.3 |
| Total long-term debt | $ | 304.0 | | | $ | 230.8 | |
(1)While not due for repayment until December 2024 under the terms of our senior credit agreement, we classify within current liabilities the portion of the outstanding balance that we believe will be repaid over the next year, with such amount based on an estimate of cash that is expected to be generated over such period.
| |
(1)
| As noted below, we amended our senior credit agreement on December 19, 2017 and proceeds of $350.0 were made available by way of a new term loan facility, with $328.1 utilized to repay, in full, amounts outstanding under the then-existing term loan facility.
|
| |
(2)
| The new term loan is repayable in quarterly installments of 1.25% of the initial loan amount of $350.0, beginning in the first quarter of 2019, with the remaining balance payable in full on December 19, 2022. Balances are net of unamortized debt issuance costs of $2.3 and $1.6 at December 31, 2017 and December 31, 2016, respectively. |
| |
(3)
| Under this arrangement, we can borrow, on a continuous basis, up to $50.0, as available. At December 31, 2017, we had $33.3 of available borrowing capacity under this facility. |
| |
(4)
| Primarily includes capital lease obligations of $2.1 and $1.7, balances under purchase card programs of $2.8 and $3.9, borrowings under a line of credit in South Africa of $0.0 and $10.2, and borrowings under a line of credit in China of $4.1 and $0.0, at December 31, 2017 and 2016, respectively. The purchase card program allows for payment beyond the normal payment terms for goods and services acquired under the program. As this arrangement extends the payment of these purchases beyond their normal payment terms through third-party lending institutions, we have classified these amounts as short-term debt. |
| |
(5)
| “Other” primarily includes debt assumed, foreign currency translation on any debt instruments denominated in currencies other than the U.S. dollar, debt issuance costs incurred in connection with the new term loan, and the impact of amortization of debt issuance costs associated with the term loan. |
(2)The term loan is repayable in quarterly installments beginning in the first quarter of 2021, with the quarterly installments equal to 0.625% of the initial term loan balance of $250.0 during 2021, 1.25% in each of the four quarters of 2022 and 2023, and 1.25% during the first three quarters of 2024. The remaining balance is payable in full on December 17, 2024. Balances are net of unamortized debt issuance costs of $1.0 and $1.4 at December 31, 2021 and December 31, 2020, respectively.
(3)Under this arrangement, we can borrow, on a continuous basis, up to $50.0, as available. At December 31, 2021, there was no available borrowing capacity under the agreement.
(4)Primarily includes balances under a purchase card program of $2.2 and $1.7 and finance lease obligations of $1.1 and $2.6 at December 31, 2021 and 2020, respectively. The purchase card program allows for payment beyond the normal payment terms for goods and services acquired under the program. As this arrangement extends the payment of these purchases beyond their normal payment terms through third-party lending institutions, we have classified these amounts as short-term debt.
(5)“Other” primarily includes debt assumed, foreign currency translation on any debt instruments denominated in currencies other than the U.S. dollar, and the impact of amortization of debt issuance costs associated with the term loan.
Maturities of long-term debt payable during each of the five years subsequent to December 31, 2017 are $0.5, $18.0, $18.0, $17.92021 are $13.0, $12.9, $218.9, $0.0, and $297.7,$0.0 respectively.
Senior Credit Facilities
On December 19, 2017,17, 2019, we amended our senior credit agreement (the “Credit Agreement”) to, among other things, extend the term of each facility under the Credit Agreement (with the aggregate of each facility comprising the “Senior Credit Facilities”) and provide for committed senior secured financing with an aggregate amount of $900.0, consisting$800.0. On May 24, 2021, we elected to reduce our participating foreign credit instrument facility and bilateral foreign credit instrument facility, available for performance letters of credit and guarantees, by an aggregate amount of $20.0 and $25.0, respectively. The facility reduction resulted in a write-off of deferred finance costs of $0.2, recorded to “Interest expense” in the accompanying consolidated statement of operations for the year ended December 31, 2021. After this reduction, and repayments of term loans through
December 31, 2021, our committed senior secured financing consists of the following at December 31, 2021 (each with thea final maturity of December 19, 2022)17, 2024):
•A new term loan facility in an aggregate principlewith a remaining principal amount, as of $350.0;December 31, 2021, of $243.7;
•A domestic revolving credit facility, available for loans and letters of credit, in an aggregate principal amount up to $200.0;of $300.0;
•A global revolving credit facility, available for loans in USD, Euros, GBPBritish Pound Sterling, and other currencies, in anthe aggregate principal amount up to the equivalent of $150.0;
•A participationparticipating foreign credit instrument facility, available for performance letters of credit and guarantees, in an aggregate principal amount up to the equivalent of $145.0 (previously $175.0);$35.0; and
•A bilateral foreign credit instrument facility, available for performance letters of credit and guarantees, in an aggregate principal amount up to the equivalent of $55.0 (previously $125.0).$20.0.
The above amendment of our Credit Agreement also:
Adjusts the maximum aggregate amount of additional commitments
•Requires that we may seek, without consent of existing lenders, to add an incremental term loan facility and/or increase the commitments in respect of the domestic revolving credit facility, the global revolving credit facility, the participation foreign credit instrument facility, and/or the bilateral foreign credit instrument facility, to (i) the greater of (A) $200.0 or (B) our Consolidated EBITDA for the preceding four fiscal quarters, plus (ii) an amount equal to all voluntary prepayments of the term loan facility and the voluntary prepayments accompanied by permanent commitment reductions of revolving credit facilities and foreign credit instrument facilities, plus (iii) an unlimited amount so long as, immediately after giving effect thereto, our Consolidated Senior Secured Leverage Ratio for the prior four fiscal quarters does not exceed 2.75 to 1.00 (with the provisions described in clauses (ii) and (iii) being essentially unchanged from the previous agreement);
Permits unlimited investments, capital stock repurchases and dividends, and prepayments of subordinated debt if ourmaintain a Consolidated Leverage Ratio after giving pro forma effect to such payments, is less than 2.75 to 1.00 (2.50 to 1.00 prior to(defined in the amendment);
Increases the Consolidated Leverage Ratio that we are required to maintainCredit Agreement) as of the last day of anyeach fiscal quarter to not more than 3.503.75 to 1.00 (or 4.00up to 4.25 to 1.00 for the four fiscal quarters after certain permitted acquisitions);
•Requires that we maintain a Consolidated Interest Coverage Ratio as of the last day of each fiscal quarter to not less than 3.00 to 1.00; and included certain add-backs in the definition of consolidated EBITDA used in determining such ratio; and
Adjusts•Establishes per annum fees charged and theapplies interest rate margins applicable to Eurodollar and alternate base rate loans, in each case based on the Consolidated Leverage Ratio, to be as follows:
| | | | | | | | | | | | | | | | | | | | | | | | | | | | | | | | | | | | | | | | | | | | |
Consolidated
Leverage
Ratio | | Domestic
Revolving
Commitment
Fee | | Global
Revolving
Commitment
Fee | | Letter of
Credit
Fee | | Foreign
Credit
Commitment
Fee | | Foreign
Credit
Instrument
Fee | | LIBOR
Rate
Loans | | ABR
Loans |
| Greater than or equal to 3.50 to 1.0 | | 0.350 | % | | 0.350 | % | | 2.000 | % | | 0.350 | % | | 1.250 | % | | 2.000 | % | | 1.000 | % |
| Between 2.50 to 1.0 and 3.50 to 1.0 | | 0.300 | % | | 0.300 | % | | 1.750 | % | | 0.300 | % | | 1.000 | % | | 1.750 | % | | 0.750 | % |
| Between 1.75 to 1.0 and 2.50 to 1.0 | | 0.275 | % | | 0.275 | % | | 1.500 | % | | 0.275 | % | | 0.875 | % | | 1.500 | % | | 0.500 | % |
| Less than 1.75 to 1.0 | | 0.250 | % | | 0.250 | % | | 1.375 | % | | 0.250 | % | | 0.800 | % | | 1.375 | % | | 0.375 | % |
The interest rates applicable to loans under the Credit Agreement are, at our option, equal to either (i) an alternate base rate (the highest of (a) the federal funds effective rate plus 0.5%, (b) the prime rate of Bank of America, N.A., and (c) the one-month LIBOR rate plus 1.0%) or (ii) a reserve-adjusted LIBOR rate for dollars (Eurodollars) plus, in each case, an applicable margin percentage as previously discussed, which varies based on our Consolidated Leverage Ratio (defined in the Credit Agreement generally as the ratio of consolidated total debt (excluding the face amount of undrawn letters of credit, bank undertakings and analogous instruments and net of cash and cash equivalents) at the date of determination to consolidated adjusted EBITDA for the four fiscal quarters ended most recently before such date). We may elect interest periods of one, two, three or six months (and, if consented to by all relevant lenders, twelve months) for Eurodollar borrowings.
The weighted-average interest rate of outstanding borrowings under our Senior Credit Facilities was approximately 1.5% at December 31, 2021.
On December 9, 2021, in preparation of our adoption of ASU No. 2020-04 and No. 2021-01, Reference Rate Reform (see Note 3), we entered into a LIBOR transition amendment related to our global revolving credit facility for certain foreign currencies. This amendment provides for a transition within the Credit Agreement from the LIBOR rate to a successor rate.
The fees and bilateral foreign credit commitments are as specified above for foreign credit commitments unless otherwise agreed with the bilateral foreign issuing lender. We also pay fronting fees on the outstanding amounts of letters of credit and foreign credit instruments (in the participation facility) at the rates of 0.125% per annum and 0.25% per annum, respectively.
|
| | | | | | | | | | | | | | | | | | | | | | | | | | | | |
Consolidated
Leverage
Ratio | | Domestic
Revolving
Commitment
Fee | | Global
Revolving
Commitment
Fee | | Letter of
Credit
Fee | | Foreign
Credit
Commitment
Fee | | Foreign
Credit
Instrument
Fee | | LIBOR
Rate
Loans | | ABR
Loans |
| Greater than or equal to 3.00 to 1.0 | | 0.350 | % | | 0.350 | % | | 2.000 | % | | 0.350 | % | | 1.250 | % | | 2.000 | % | | 1.000 | % |
| Between 2.25 to 1.0 and 3.00 to 1.0 | | 0.300 | % | | 0.300 | % | | 1.750 | % | | 0.300 | % | | 1.000 | % | | 1.750 | % | | 0.750 | % |
| Between 1.50 to 1.0 and 2.25 to 1.0 | | 0.275 | % | | 0.275 | % | | 1.500 | % | | 0.275 | % | | 0.875 | % | | 1.500 | % | | 0.500 | % |
| Less than 1.50 to 1.0 | | 0.250 | % | | 0.250 | % | | 1.375 | % | | 0.250 | % | | 0.800 | % | | 1.375 | % | | 0.375 | % |
We areSPX is the borrower under each of the above facilities, and certain of our foreign subsidiaries are (and we may designate other foreign subsidiaries to be) borrowers under the global revolving credit facility and the foreign credit instrument facilities. All borrowings and other extensions of credit under the Credit Agreement are subject to the satisfaction of customary conditions, including absence of defaults and accuracy in material respects of representations and warranties.
The letters of credit under the domestic revolving credit facility are stand-by letters of credit requested by SPX on behalf of any of our subsidiaries or certain joint ventures. The foreign credit instrument facility is used to issue foreign credit instruments, including bank undertakings to support our foreign operations.
The interest rates applicable to loans under the Credit Agreement are, at our option, equal to either (i) an alternate base rate (the highest of (a) the federal funds effective rate plus 0.5%, (b) the prime rate of Bank of America, N.A., and (c) the one-month LIBOR rate plus 1.0%) or (ii) a reserve-adjusted LIBOR rate for dollars (Eurodollars) plus, in each case, an applicable margin percentage as previously discussed, which varies based on our Consolidated Leverage Ratio (as defined in the Credit Agreement generally as the ratio of consolidated total debt (excluding the face amount of undrawn letters of credit, bank undertakings and analogous instruments and net of cash and cash equivalents not to exceed $150.0) at the date of determination to consolidated adjusted EBITDA for the four fiscal quarters ended most recently before such date). We may elect interest periods of one, two, three or six months (and, if consented to by all relevant lenders, twelve months) for Eurodollar borrowings.
The weighted-average interest rate of outstanding borrowings under our Senior Credit Facilities was approximately 3.2% at December 31, 2017.
The fees and bilateral foreign credit commitments are as specified above for foreign credit commitments unless otherwise agreed with the bilateral foreign issuing lender. We also pay fronting fees on the outstanding amounts of letters of credit and foreign credit instruments (in the participation facility) at the rates of 0.125% per annum and 0.25% per annum, respectively.
The Credit Agreement requires mandatory prepayments in amounts equal to the net proceeds from the sale or other disposition of, including from any casualty to, or governmental taking of, property in excess of specified values (other than in the ordinary course of business and subject to other exceptions) by SPX or our subsidiaries. Mandatory prepayments will be applied to repay, first, amounts outstanding under any term loans and, then, amounts (or cash collateralize letters of credit) outstanding under the global revolving credit facility and the domestic revolving credit facility (without reducing the commitments thereunder). No prepayment is required generally to the extent the net proceeds are reinvested (or committed to be reinvested) in permitted acquisitions, permitted investments or assets to be used in our business within 360 days (and if committed to be reinvested, actually reinvested within 180360 days after the end of such 360-day period) of the receipt of such proceeds.
We may voluntarily prepay loans under the Credit Agreement, in whole or in part, without premium or penalty. Any voluntary prepayment of loans will be subject to reimbursement of the lenders’ breakage costs in the case of a prepayment of Eurodollar rate borrowings other than on the last day of the relevant interest period. Indebtedness under the Credit Agreement is guaranteed by:
•Each existing and subsequently acquired or organized domestic material subsidiary with specified exceptions; and
•SPX with respect to the obligations of our foreign borrower subsidiaries under the global revolving credit facility, the participation foreign credit instrument facility and the bilateral foreign credit instrument facility.
Indebtedness under the Credit Agreement is secured by a first priority pledge and security interest in 100% of the capital stock of our domestic subsidiaries (with certain exceptions) held by SPX or our domestic subsidiary guarantors and 65% of the capital stock of our material first-tier foreign subsidiaries (with certain exceptions). If SPX obtains a corporate credit rating from Moody’s and S&P and such corporate credit rating is less than “Ba2” (or not rated) by Moody’s and less than “BB” (or not rated) by S&P, then SPX and our domestic subsidiary guarantors are required to grant security interests, mortgages and other liens on substantially all of their assets. If SPX’s corporate credit rating is “Baa3” or better by Moody’s or “BBB-” or better by S&P and no defaults then exist, all collateral security is to be released and the indebtedness under the Credit Agreement would be unsecured.
The Credit Agreement requires that SPX maintain:
A Consolidated Interest Coverage Ratio (defined in the Credit Agreement generally as the ratio of consolidated adjusted EBITDA for the four fiscal quarters ended on such date to consolidated cash interest expense for such period) as of the last day of any fiscal quarter of at least 3.50 to 1.00; and
As previously discussed, a Consolidated Leverage Ratio as of the last day of any fiscal quarter of not more than 3.50 to 1.00 (or 4.00 to 1.00 for the four fiscal quarters after certain permitted acquisitions).
The Credit Agreement also contains covenants that, among other things, restrict our ability to incur additional indebtedness, grant liens, make investments, loans, guarantees, or advances, make restricted junior payments, including dividends, redemptions of capital stock, and voluntary prepayments or repurchase of certain other indebtedness, engage in mergers, acquisitions or sales of assets, enter into sale and leaseback transactions, or engage in certain transactions with affiliates, and otherwise restrict certain corporate activities. The Credit Agreement contains customary representations, warranties, affirmative covenants and events of default.
As previously discussed, weWe are permitted under the Credit Agreement to repurchase our capital stock and pay cash dividends in an unlimited amount if our Consolidated Leverage Ratio is (after giving pro forma effect to such payments) less than 2.75 to 1.00. If our Consolidated Leverage Ratio is (after giving pro forma effect to such payments) greater than or equal to 2.75 to 1.00, the aggregate amount of such repurchases and dividend declarations cannot exceed (A) $50.0$100.0 in any fiscal year plus (B) an additional amount for all such repurchases and dividend declarations made after the Effective DateSeptember 1, 2015 equal to the sum of (i) $100.0 plus (ii) a positive amount equal to 50% of cumulative Consolidated Net Income (as defined in the Credit Agreement generally as consolidated net income subject to certain
adjustments solely for the purposes of determining this basket) during the period from the Effective DateSeptember 1, 2015 to the end of the most recent fiscal quarter preceding the date of such repurchase or dividend declaration for which financial statements have been (or were required to be) delivered (or, in case such Consolidated Net Income is a deficit, minus 100% of such deficit) plus (iii) certain other amounts.amounts, less our previous usage of such additional amount for certain other investments and restricted junior payments.
At December 31, 2017,2021, we had $314.3$437.8 of available borrowing capacity under our revolving credit facilities after giving effect to $35.7$12.2 reserved for outstanding letters of credit. In addition, at December 31, 2017,2021, we had $16.9$30.3 of available issuance capacity under our foreign credit instrument facilities after giving effect to $183.1$24.7 reserved for outstanding letters of credit.
At December 31, 2017,2021, we were in compliance with all covenants of our Credit Agreement.
In connection with the December 2017 amendment of our Credit Agreement, we recorded a charge of $0.9 to “Loss on amendment/refinancing of senior credit agreement” related to the write-off of unamortized deferred financing costs. During 2016, we reduced the issuance capacity of our foreign credit instrument facilities resulting in a charge of $1.3 to “Loss on amendment/refinancing of senior credit agreement” associated with the write-off of unamortized deferred financing costs. During 2015, we recorded a charge of $1.4 to “Loss on amendment/refinancing of senior credit agreement” related to the refinancing of our senior credit agreement in connection with the Spin-Off, with the charge resulting from the write-off of unamortized deferred financing costs.
Other Borrowings and Financing Activities
Certain of our businesses purchase goods and services under a purchase card programsprogram allowing for payment beyond their normal payment terms. As of December 31, 20172021 and 2016,2020, the participating businesses had $2.8$2.2 and $3.9,$1.7, respectively, outstanding under these arrangements.this arrangement.
We are party to a trade receivables financing agreement, whereby we can borrow, on a continuous basis, up to $50.0. Availability of funds may fluctuate over time given, among other things, changes in eligible receivable balances, but will not exceed the $50.0 program limit. The facility contains representations, warranties, covenants and indemnities customary for facilities of this type. The facility does not contain any covenants that we view as materially constraining to the activities of our business.
In addition, we maintain uncommitted line of credit facilities in China India, and South Africa available to fund operations in these regions, when necessary.necessary, and at the discretion of the lender. At December 31, 2017,2021, the aggregate amount of borrowing capacity under these facilities was $20.2,$20.0, while the aggregatethere were no borrowings outstanding were $4.2.outstanding.
(12)(14) Derivative Financial Instruments and Concentrations of Credit Risk
Interest Rate Swaps
During the second quarter of 2016, we entered intoWe previously maintained interest rate swap agreements (“Swaps”)that matured in March 2021 and effectively converted borrowings under our senior credit facilities to hedgea fixed rate of 2.535%, plus the interest rate risk on our then existing variable rate term loan. Asapplicable margin.
In February 2020, and as a result of amendinga December 2019 amendment that extended the maturity date of our Credit Agreement onsenior credit facilities to December 19, 2017, these17, 2024, we entered into additional interest swap agreements (“Swaps”). The Swaps no longer qualifiedhave a notional amount of $243.7, cover the period from March 2021 to November 2024, and effectively convert borrowings under our senior credit facilities to a fixed rate of 1.061%, plus the applicable margin.
We have designated and are accounting for hedge accounting, resulting in a gain (recorded to “Other expense, net”) in 2017 of $2.7.our interest rate swap agreements as cash flow hedges. As of December 31, 2017, the aggregate notional amount of these Swaps was $162.6. In addition, we have recorded a current asset of $3.3 as of December 31, 2017 to recognize the fair value of these Swaps. As of December 31, 2016,2021 and 2020, the unrealized gain (loss), net of tax, recorded in accumulated other comprehensive income (“AOCI”)AOCI was $0.7$0.5 and $(5.9), respectively. In addition, as of December 31, 2021, the fair value of our interest rate swap agreements was $0.6 (with $2.5 recorded as a non-current asset and $1.9 as a current liability), and $7.8 at December 31, 2020 (with $1.4 recorded as a current liability and the remainder in long-term liabilities). Changes in fair value of our interest rate swap agreements are reclassified into earnings as a component of interest expense, when the forecasted transaction impacts earnings.
Currency Forward Contracts and Currency Forward Embedded Derivatives
We manufacture and sell our products in a number of countries and, as a result, are exposed to movements in foreign currency exchange rates. Our objective is to preserve the economic value of non-functional currency-denominated cash flows and to minimize the impact of changes as a result of currency fluctuations. Our principal currency exposures relate to the South African Rand, GBP,British Pound Sterling, and Euro.
From time to time, we enter into forward contracts to manage the exposure on contracts with forecasted transactions denominated in non-functional currencies and to manage the risk of transaction gains and losses associated with assets/liabilities denominated in currencies other than the functional currency of certain subsidiaries (“FX forward contracts”). In addition, some of our contracts contain currency forward embedded derivatives (“FX embedded derivatives”), because the currency of exchange is not “clearly and closely” related to the functional currency of either party to the transaction. CertainNone of our FX forward contracts are designated as cash flow hedges. To the extent
these derivatives are effective in offsetting the variability of the hedged cash flows, changes in the derivatives’ fair value are not included in current earnings, but are included in AOCI. These changes in fair value are reclassified into earnings as a component of revenues or cost of products sold, as applicable, when the forecasted transaction impacts earnings. In addition, if the forecasted transaction is no longer probable, the cumulative change in the derivatives’ fair value is recorded as a component of “Other expense, net” in the period in which the transaction is no longer considered probable of occurring. To the extent a previously designated hedging transaction is no longer an effective hedge, any ineffectiveness measured in the hedging relationship is recorded in earnings in the period in which it occurs.
We had FX forward contracts with an aggregate notional amount of $9.0$8.7 and $8.8$6.3 outstanding as of December 31, 20172021 and 2016,2020, respectively, with all of the $9.0$8.7 scheduled to mature in 2018. We also had2022. The fair value of our FX embedded derivatives with an aggregate notional amount of $1.1 and $0.9forward contracts was less than $0.1 at December 31, 20172021 and 2016, respectively, with all of the $1.1 scheduled to mature in 2018. There were no unrealized gains or losses recorded in AOCI related to FX forward contracts as of December 31, 2017 and 2016. The net loss recorded in “Other expense, net” related to FX forward contracts and embedded derivatives totaled $0.4 in 2017, $6.3 in 2016 and $1.2 in 2015.2020.
Commodity Contracts
From time to time, we enterentered into commodity contracts to manage the exposure on forecasted purchases of commodity raw materials. The outstanding notional amounts of commodity contracts were 3.6related solely to Transformer Solutions. As discussed in Note 1, on October 1, 2021, we completed the sale of Transformer Solutions. Immediately prior to the sale, we extinguished the existing commodity contracts and 4.1 poundsreclassified from AOCI a net loss of copper at$0.6 to “Gain (loss) on disposition of discontinued operations, net of tax” within our consolidated statement of operations for the year ended December 31, 20172021. Prior to extinguishment, we designated and 2016, respectively. We designate and accountaccounted for these contracts as cash flow hedges and, to the extent these commodity contracts arewere effective in offsetting the variability of the forecasted purchases, the change in fair value iswas included in AOCI. We reclassify AOCIreclassified amounts associated with our commodity contracts to costout of products soldAOCI when the forecasted transaction impactsimpacted earnings. As of December 31, 2017 and 2016,2020, the fair values of these contracts were $1.1 (current asset) and $1.1 (current asset), respectively.was a current asset of $2.4. Since these commodity contracts related to our Transformer Solutions business, the amount has been recorded within assets of discontinued operations in the accompanying consolidated balance sheet. The unrealized gains,gain, net of taxes, recorded in AOCI were $0.8 and $0.8was $1.5 as of December 31, 2017 and 2016, respectively. We anticipate reclassifying the unrealized gain as of December 31, 2017 to income over the next 12 months.2020.
Concentrations of Credit Risk
Financial instruments that potentially subject us to significant concentrations of credit risk consist of cash and equivalents, trade accounts receivable, insurance recovery assets associated with asbestos product liability matters, and interest rate swap and foreign currency forward and commodity contracts. These financial instruments, other than trade accounts receivable, are placed with high-quality financial institutions and insurance companies throughout the world. We periodically evaluate the credit standing of these financial institutions.institutions and insurance companies.
We maintain cash levels in bank accounts that, at times, may exceed federally-insured limits. We have not experienced significant loss, and believe we are not exposed to significant risk of loss, in these accounts.
We have credit loss exposure in the event of nonperformance by counterparties to the above financial instruments, but have no other off-balance-sheet credit risk of accounting loss. We anticipate, however, that counterparties will be able to fully satisfy their obligations under the contracts. We do not obtain collateral or other security to support financial instruments subject to credit risk, but we do monitor the credit standing of counterparties.
Concentrations of credit risk arising from trade accounts receivable are due to selling to customers in a particular industry. We mitigate our creditCredit risks are mitigated by performing ongoing credit evaluations of our customers’ financial conditions and obtaining collateral, advance payments, or other security when appropriate. No one customer, or group of customers that to our knowledge are under common control, accounted for more than 10% of our revenues for any period presented.
(13) Commitments,(15) Contingent Liabilities and Other Matters
Leases
We lease certain manufacturing facilities, offices, sales and service locations, machinery and equipment, vehicles and office equipment under various leasing programs accounted for as operating and capital leases, some of which include scheduled rent increases stated in the lease agreement. We do not have any significant leases that require rental payments based on contingent events nor have we received any significant lease incentive payments.
Operating Leases
The future minimum rental payments under operating leases with remaining non-cancelable terms in excess of one year are:
|
| | | |
| Year Ending December 31, |
| 2018 | $ | 8.3 |
|
| 2019 | 7.9 |
|
| 2020 | 6.5 |
|
| 2021 | 4.6 |
|
| 2022 | 4.4 |
|
| Thereafter | 6.6 |
|
| Total minimum payments | $ | 38.3 |
|
Total operating lease expense, inclusive of rent based on scheduled rent increases and rent holidays recognized on a straight-line basis, was $12.9 in 2017, $13.2 in 2016 and $13.4 in 2015.
General
Numerous claims, complaints and proceedings arising in the ordinary course of business have been asserted or are pending against us or certain of our subsidiaries (collectively, “claims”). These claims relate to litigation matters (e.g., class actions, derivative lawsuits and contracts, intellectual property and competitive claims), environmental matters, product liability matters (predominately associated with alleged exposure to asbestos-containing materials), and other risk management matters (e.g., general liability, automobile, and workers’ compensation claims). Additionally, we may become subject to other claims of which we are currently unaware, which may be significant, or the claims of which we are aware may result in our incurring significantly greater loss than we anticipate. While we (and our subsidiaries) maintain property, cargo, auto, product, general liability, environmental, and directors’ and officers’ liability insurance and have acquired rights under similar policies in connection with acquisitions that we believe cover a significant portion of these claims, this insurance may be insufficient or unavailable (e.g., in the case of insurer insolvency) to protect us against potential loss exposures. Also, while we believe we are entitled to indemnification from third parties for some of these claims, these rights may be insufficient or unavailable to protect us against potential loss exposures.
Our recorded liabilities related to these matters totaled $685.7 (including $641.2 for asbestos product liability matters)$658.8 and $653.5 (including $605.6 for asbestos product liability matters)$575.7 at December 31, 20172021 and 2016,2020, respectively. Of these amounts, $651.6$584.3 and $621.0$499.8 are included in “Other long-term liabilities” within our consolidated balance sheets at December 31, 20172021 and 2016,2020, respectively, with the remainder included in “Accrued expenses.” The liabilities we record for these claimsmatters are based on a number of assumptions, including historical claims and payment experience and, with respect to asbestos claims, actuarial estimates of the future period during which additional claims are reasonably foreseeable.experience. While we base our assumptions on facts currently known to us, they entail inherently subjective judgments and uncertainties. As a result, our current assumptions for estimating these liabilities may not prove accurate, and we may be required to adjust these liabilities in the future, which could result in charges to earnings. These variances relative to current expectations could have a material impact on our financial position and results of operations.
Our asbestos-related claims are typical in certain of the industries in which we operate or pertain to legacy businesses we no longer operate. It is not unusual in these cases for fifty50 or more corporate entities to be named as defendants. We vigorously defend these claims, many of which are dismissed without payment, and the significant majority of costs related to these claims have historically been paid pursuant to our insurance arrangements. Our recorded assets and liabilities related to asbestos-related claims were as follows at December 31, 2021 and 2020:
| | | | | | | | | | | |
| December 31, |
| 2021 | | 2020 |
Insurance recovery assets (1) | $ | 526.2 | | | $ | 496.4 | |
Liabilities for claims (2) | 616.5 | | 535.2 |
(1)Of these amounts $473.6 and $446.4 are included in “Other assets” at December 31, 2021 and 2020, respectively, while the remainder is included in “Other current assets.”
(2)Of these amounts $561.4 and $479.9 are included in “Other long-term liabilities” at December 31, 2021 and 2020, respectively, while the remainder is included in “Accrued expenses.”
The liabilities we record for asbestos-related claims are based on a number of assumptions. In estimating our liabilities for asbestos-related claims, we consider, among other things, the following:
•The number of pending claims by disease type and jurisdiction.
•Historical information by disease type and jurisdiction with regard to:
◦Average number of claims settled with payment (versus dismissed without payment); and
◦Average claim settlement amounts.
•The period over which we can reasonably project asbestos-related claims (currently projecting through 2057).
The following table presents information regarding activity for asbestos-related claims for the years ended December 31, 2021, 2020 and 2019:
| | | | | | | | | | | | | | | | | |
| Year ended December 31 |
| 2021 | | 2020 | | 2019 |
| Pending claims, beginning of year | 9,782 | | 11,079 | | 13,767 |
| Claims filed | 2,826 | | 2,449 | | 3,607 |
| Claims resolved | (2,543) | | (3,746) | | (6,295) |
| Pending claims, end of year | 10,065 | | 9,782 | | 11,079 |
The assets we record for asbestos-related claims represent amounts that we believe we are or will be entitled to recover under agreements we have with insurance companies. The amount of these assets are based on a number of assumptions, including the continued solvency of the insurers and our legal interpretation of our rights for recovery under the agreements we have with the insurers. Our current assumptions for estimating these assets may not prove accurate, and we may be required to adjust these assets in the future. These variances relative to current expectations could have a material impact on our financial position and results of operations.
During the years ended December 31, 2017, 20162021, 2020 and 2015,2019, our (receipts) payments for asbestos-related matters,claims, net of respective insurance recoveries of $53.9, $35.4, and $47.1, were $1.0, $5.8$(0.3), $19.3 and $6.9,$13.1, respectively. The year ended December 31, 2021 includes insurance proceeds of $15.0, associated with the settlement of an asbestos insurance coverage matter. A significant increase in claims, costs and/or issues with existing insurance coverage (e.g., dispute with or insolvency of insurer(s)) could have a material adverse impact on our share of future payments related to these matters, and, as a result, have a material impact on our financial position, results of operations and cash flows.
We have recorded insurance recovery assets associated with the asbestos product liability matters, with such amounts totaling $590.9 and $564.4 at December 31, 2017 and 2016, respectively, and included in “Other assets” within our consolidated balance sheets. These assets represent amounts that we believe we are or will be entitled to recover under agreements we have with insurance companies. The assets we record for these insurance recoveries are based on a number of assumptions, including the continued solvency of the insurers, and are subject to a variety of uncertainties. Our current assumptions for estimating these assets may not prove accurate, and we may be required to adjust these assets in the future, which could result in additional charges to earnings. These variances relative to current expectations could have a material impact on our financial position and results of operations.
During the years ended December 31, 2017, 2016,2021, 2020, and 2015,2019, we recorded charges of $5.7, $4.9,$51.2, $21.3, and $11.2,$10.1, respectively, as a result of changes in estimates associated with the liabilities and assets related to asbestos product liability matters.asbestos-related claims. Of these charges, $3.5, $4.2$48.6, $19.2 and $8.0$6.3 were recorded to “Other expense, net”reflected in “Income from continuing operations before income taxes” for the years ended December 31, 2017, 2016,2021, 2020, and 2015,2019, respectively, and $2.2, $0.7,$2.6, $2.1, and $3.2$3.8, respectively, to “Gainwere reflected in “Gain (loss) on disposition of discontinued operations, net of tax.”
Large Power Projects in South Africa
The business environment surrounding ourOverview - Since 2008, DBT had been executing on 2 large power projects in South Africa remains(Kusile and Medupi), on which it has now substantially completed its scope of work. Over such time, the business environment surrounding these projects was difficult, as we haveDBT, along with many other contractors on the projects, experienced delays, cost over-runs, and various other challenges associated with a complex set of contractual relationships among the end customer, prime contractors, various subcontractors (including usDBT and ourits subcontractors), and various suppliers. We currently are involved in a numberDBT's remaining responsibilities relate largely to resolution of claim disputes relating to these challenges. We are pursuing various commercial alternatives for addressing these challenges, in attempt to mitigate our overall financial exposure.
During the third quarterclaims, primarily between itself and one of 2015, we gained additional insight into the path for completing these projects, including our remaining scope, the estimated costs for completing such scope, and our expected recoverability of costs fromits prime contractors, Mitsubishi Heavy Industries Power—ZAF (f.k.a. Mitsubishi-Hitachi Power Systems Africa (PTY) LTD), or “MHI.”
The challenges related to the projects have resulted in (i) significant adjustments to our revenue and our subcontractors. In responsecost estimates for the projects, (ii) DBT’s submission of numerous change orders to this new information, we revised our estimates of revenuesthe prime contractors, (iii) various claims and costs associateddisputes between DBT and other parties involved with the projects (e.g., prime contractors, subcontractors, suppliers, etc.), and (iv) the possibility that DBT may become subject to additional claims, which could be significant. It is possible that some outstanding claims may not be resolved until after the prime contractors complete their scopes of work. Our future financial position, operating results, and cash flows could be materially impacted by the resolution of current and any future claims.
Claims by DBT - DBT has asserted claims against MHI of approximately South African Rand 1,000.0 (or $62.6). As DBT prepares these claims for dispute resolution processes, the amounts, along with the characterization, of the claims could change. Of these claims, South African Rand 566.5 (or $35.5), which is inclusive of the amounts awarded in the adjudications referred to below, are currently proceeding through contractual dispute resolution processes and DBT is likely to initiate additional dispute resolution processes. DBT is also pursuing several claims to force MHI to abide by its contractual obligations and provide DBT with certain benefits that MHI may have received from its customer on the projects. These revisions resultedIn addition to existing asserted claims, DBT believes it has additional claims and rights to recovery based on its performance under the contracts with, and actions taken by, MHI. DBT is continuing to evaluate the claims and the amounts owed to it under the contracts based on MHI's failure to comply with its contractual obligations. The amounts DBT may recover for current and potential future claims against MHI are not currently known given (i) the extent of current and potential future claims by MHI against DBT (see below for further discussion) and (ii) the unpredictable nature of any dispute resolution processes that may occur in connection with these current and potential future claims. No revenue has been recorded in the accompanying consolidated financial statements with respect to current or potential future claims against MHI.
On July 23, 2020, a dispute adjudication panel issued a ruling in favor of DBT on certain matters related to the Kusile and Medupi projects. The panel (i) ruled that DBT had achieved takeover on 9 of the units; (ii) ordered MHI to return $2.3 of bonds (which have been subsequently returned by MHI); (iii) ruled that DBT is entitled to the return of an increaseadditional $4.3 of bonds upon the completion of certain administrative milestones; (iv) ordered MHI to pay South African Rand 18.4 (or $1.1 at the time of the ruling) in incentive payments for work performed by DBT (which MHI has subsequently paid); and (v) ruled that MHI waived its rights to assert delay damages against DBT on 1 of the units of the Kusile project. The ruling is subject to MHI’s rights to seek further arbitration in the matter, as provided in the contracts. As such, the incentive payments noted above have not been recorded in our “Loss from continuingaccompanying consolidated statements of operations.
On February 22, 2021, a dispute adjudication panel issued a ruling in favor of DBT related to costs incurred in connection with delays on 2 units of the Kusile project. In connection with the ruling, MHI paid DBT South African Rand 126.6 (or $8.6 at the time of payment). This ruling is subject to MHI’s rights to seek further arbitration in the matter and, thus, the amount awarded has not been reflected in our accompanying consolidated statement of operations before income taxes” for the year ended December 31, 20152021. On July 5, 2021, DBT received notice from MHI of $95.0, which is comprisedits intent to seek final and binding arbitration in this matter.
On April 28, 2021, a dispute adjudication panel issued a ruling in favor of a reductionDBT related to costs incurred in revenue of $57.2 and an increase in cost of products sold of $37.8.
Over the pastconnection with delays on two years, we have implemented various initiatives that have reduced the risk associated with our large power projects in South Africa, including more recent steps to accelerate the timeline for completing certain portionsunits of the projects.Medupi project. In addition, significant progress has occurred with regard to the projects, as we have now completed the majority of our contractual scope and expect to complete the remainder by the end of 2019.
During 2017, we experienced higher than expected costs associated with (i) our efforts to accelerate completion of certain scopes of work, (ii) financial and other challenges facing certain of our subcontractors, and (iii) delays and other on-site productivity challenges. As a result, during the second and fourth quarters of 2017, we revised our estimates of revenues and costs associatedconnection with the projects. These revisions resultedruling, MHI paid DBT South African Rand 82.0 (or $6.0 at the time of payment). This ruling is subject to MHI’s rights to seek further arbitration in a charge to “Income (loss) from continuingthe matter and, thus, the amount awarded has not been reflected in our accompanying consolidated statement of operations before income taxes” of $52.8 duringfor the year ended December 31, 2017 ($22.92021.
Claims by MHI - On February 26, 2019, DBT received notification of an interim claim consisting of both direct and $29.9, duringconsequential damages from MHI alleging, among other things, that DBT (i) provided defective product and (ii) failed to meet certain project milestones. In September 2020, MHI made a demand on certain bonds issued in its favor by DBT, based solely on these alleged defects, but without further substantiation or other justification (see further discussion below). On December 30, 2020, MHI notified DBT of its intent to take these claims to binding arbitration even though the secondvast majority of these claims had not been brought appropriately before a dispute adjudication board as required under the relevant subcontracts.On June 4, 2021, in connection with the arbitration, DBT received a revised version of the claim. Similar to the interim claim, we
believe the vast majority of the damages summarized in the revised claim are unsubstantiated and, fourth quartersthus, any loss for the majority of 2017, respectively)these claims is considered remote. For the remainder of the claims in both the interim notification and the revised version, which largely appear to be direct in nature (approximately South African Rand 790.0 or $49.5), which is comprised ofDBT has numerous defenses and, thus, we do not believe that DBT has a reduction in revenue of $36.9 ($13.5 and $23.4, during the second and fourth quarters of 2017, respectively) and an increase in cost of products sold of $15.9 ($9.4 and $6.5, during the second and fourth quarters of 2017, respectively).
We recognize revenueprobable loss associated with unapproved change ordersthese claims. In addition, we do not believe MHI has followed the appropriate dispute resolution processes under our agreement and therefore most, if not all, of its claims against DBT are not valid. As such, no loss has been recorded in the consolidated financial statements with respect to these claims. DBT intends to vigorously defend itself against these claims. Although it is reasonably possible that some loss may be incurred in connection with these claims, we currently are unable to estimate the potential loss or range of potential loss associated with these claims due to the extent(i) lack of support provided by MHI for these claims; (ii) complexity of contractual relationships between the related costs have been incurredend customer, MHI, and DBT; (iii) legal interpretation of the amount expectedcontract provisions and application of recovery is probableSouth African law to the contracts; and reasonably estimable. At December 31, 2017, the projected revenues(iv) unpredictable nature of any dispute resolution processes that may occur in connection with these claims.
In April and July 2019, DBT received notifications of intent to claim liquidated damages totaling South African Rand 407.2 (or $25.5) from MHI alleging that DBT failed to meet certain project milestones related to our large power projects in South Africa included approximately $29.0 related tothe construction of the filters for both the Kusile and Medupi projects. DBT has numerous defenses against these claims and, unapproved change orders. Wethus, we do not believe that DBT has a probable loss associated with these amountsclaims. As such, no loss has been recorded in the accompanying consolidated financial statements with respect to these claims. Although it is reasonably possible that some loss may be incurred in connection with these claims, we currently are recoverable underunable to estimate the provisionspotential loss or range of potential loss.
MHI has made other claims against DBT totaling South African Rand 176.2 (or $11.0). DBT has numerous defenses against these claims and, thus, we do not believe that DBT has a probable loss associated with these claims. As such, no loss has been recorded in the accompanying consolidated financial statements with respect to these claims.
Bonds Issued in Favor of MHI - DBT is obligated with respect to bonds issued by banks in favor of MHI. In September of 2020, MHI made a demand, and received payment of South African Rand 239.6 (or $14.3 at the time of payment), on certain of these bonds. In May 2021, MHI made an additional demand, and received payment of South African Rand 178.7 (or $12.5 at time of payment), on certain of the related contracts and reflect our best estimate of recoverable amounts.
Althoughremaining bonds at such time. In both cases, we believe that our current estimates of revenues and costs relating to these projects are reasonable, it is possible that future revisions of such estimates could have a material effect on our consolidated financial statements.
Noncontrolling Interest in South African Subsidiary
Our South African subsidiary, DBT Technologies (PTY) LTD (“DBT”), has a Black Economic Empowerment shareholder (the “BEE Partner”) that holds a 25.1% noncontrolling interest in DBT. Underfunded the payment as required under the terms of the shareholder agreementbonds and our senior credit agreement. In its demands, MHI purported that DBT failed to carry out its obligations to rectify certain alleged product defects and that DBT failed to meet certain project milestones. DBT denies liability for such allegations and, thus, fully intends to seek, and believes it is legally entitled to, reimbursement of the South African Rand 418.3 (or $26.2) that has been paid. However, given the extent and complexities of the claims between DBT and MHI, reimbursement of the BEE PartnerSouth African Rand 418.3 (or $26.2) is unlikely to occur over the next twelve months. As such, we have reflected the South African Rand 418.3 (or $26.2) as a non-current asset within our consolidated balance sheet as of December 31, 2021.
The remaining bond of $1.8 issued to MHI as a performance guarantee could be exercised by MHI for an alleged breach of DBT's obligation. In the event that MHI were to receive payment on a portion, or all, of the remaining bond, we would be required to reimburse the issuing bank.
In addition to this bond, SPX Corporation has guaranteed DBT’s performance on these projects to the prime contractors, including MHI.
Claim against Surety - On February 5, 2021, DBT received payment of $6.7 on bonds issued in support of performance by one of DBT's sub-contractors. The sub-contractor maintains a right to seek recovery of such amount and, thus, the amount received by DBT has not been reflected in our accompanying consolidated statement of operations for the year ended December 31, 2021.
Settlement with the Minority Shareholder of DBT – On October 16, 2019, SPX Technologies (PTY) LTD, (“DBT’s parent company, along with DBT and SPX Technologies”),Corporation, executed an agreement with the BEE Partner had the option to put its ownership interest in DBT to SPX Technologies, the majoritythen minority shareholder of DBT atto settle a redemption amount determined in accordance withput option and other claims between the terms of the shareholder agreement (the “Put Option”). The BEE Partner notified SPX Technologies of its intention to exercise the Put Option and, on July 6, 2016, an Arbitration Tribunal declared that the BEE Partner was entitled to South African Rand 287.3 in connection with the exercise of the Put Option, having not considered an amount due from the BEE Partner underparties for a promissory notetotal payment of South African Rand 30.3 held by SPX Technologies. As a result, we have reflected230.0 (or $15.6 at the net redemptiontime of payment).The difference between the settlement amount (South African Rand 230.0) and the amount previously recorded for the matter of South African Rand 257.0, or South African Rand 27.0 (or $20.9 and $18.5 at December 31, 2017 and 2016, respectively) within “Accrued expenses” on our consolidated balance sheets as$1.8), along with a tax benefit of December 31, 2017 and 2016,$3.8 associated with the related offset recorded to “Paid-in capital” and “Accumulated other comprehensive income.” In addition, during 2016 we reclassified $38.7 from “Noncontrolling Interests” to “Paid-in capital.” Lastly, under the two-class methodtotal payment of calculating earnings per share, we haveSouth African Rand 230.0, has been reflected
as an adjustment of $18.1 to “Net income (loss) attributable to SPX Corporation common shareholders” for the excess redemption amount of the Put Option (i.e., the increase in the redemption amount during the year ended December 31, 2016 in excess of fair value)stockholders” in our calculations of basic and diluted earnings per share for the year ended December 31, 2016.2019.
In August 2016, SPX Technologies applied to the High Court of South Africa (the “Court”) to have the Arbitration Tribunal’s ruling set aside. The Court heard arguments on SPX Technologies application in November 2017. On January 22, 2018, the Court ruled in SPX Technologies favor and set aside the Arbitration Tribunal’s ruling. This ruling by the Court is subject to appeal by the BEE Partner. The BEE Partner has filed for leave to appeal the decision and SPX Technologies will continue to assert all legal defenses available to it.
Beginning in the third quarter of 2016, in connection with our accounting for the redemption of the BEE partner’s ownership interest in DBT, we discontinued allocating earnings/losses of DBT to the BEE Partner within our consolidated financial statements.
Patent Infringement Lawsuit
Our subsidiary, SPX Cooling Technologies, Inc. (“SPXCT”), is a defendant in a legal action brought by Baltimore Aircoil Company (“BAC”) alleging that a SPXCT product infringes United States Patent No. 7,107,782, entitled “Evaporative Heat Exchanger and Method.” BAC filed suit on July 16, 2013 in the United States District Court for the District of Maryland (the “District Court”) seeking monetary damages and injunctive relief.
On November 4, 2016, the jury for the trial in the District Court found in favor of SPXCT. The verdict by the District Court is currently under appeal by BAC. We believe that we will ultimately be successful in any future judicial processes; however, to the extent we are not successful, the outcome could have a material adverse effect on our financial position, results of operations, and cash flows.
Litigation Matters
We are subject to other legal matters that arise in the normal course of business. We believe these matters are either without merit or of a kind that should not have a material effect, individually or in the aggregate, on our financial position,
results of operations or cash flows; however, we cannot assure yougive assurance that these proceedings or claims will not have a material effect on our financial position, results of operations or cash flows.
Environmental Matters
Our operations and properties are subject to federal, state, local and foreign regulatory requirements relating to environmental protection. It is our policy to comply fully with all applicable requirements. As part of our effort to comply, we have a comprehensive environmental compliance program that includes environmental audits conducted by internal and external independent professionals, as well as regular communications with our operating units regarding environmental compliance requirements and anticipated regulations. Based on current information, we believe that our operations are in substantial compliance with applicable environmental laws and regulations, and we are not aware of any violations that could have a material effect, individually or in the aggregate, on our business, financial condition, and results of operations or cash flows. As of December 31, 2017,2021, we had liabilities for site investigation and/or remediation at 2818 sites (30(25 sites at December 31, 2016)2020) that we own or control. In addition, while we believe that we maintain adequate accruals to cover the costs of site investigation and/or remediation, we cannot provide assurance that new matters, developments, laws and regulations, or stricter interpretations of existing laws and regulations will not materially affect our business or operations in the future.
Our environmental accruals cover anticipated costs, including investigation, remediation, and operation and maintenance of clean-up sites. Our estimates are based primarily on investigations and remediation plans established by independent consultants, regulatory agencies and potentially responsible third parties. Accordingly, our estimates may change based on future developments, including new or changes in existing environmental laws or policies, differences in costs required to complete anticipated actions from estimates provided, future findings of investigation or remediation actions, or alteration to the expected remediation plans. It is our policy to revise an estimate once it becomes probable and the amount of change can be reasonably estimated. We generally do not discount our environmental accruals and do not reduce them by anticipated insurance recoveries. We take into account third-party indemnification from financially viable parties in determining our accruals where there is no dispute regarding the right to indemnification.
In the case of contamination at offsite, third-party disposal sites, as of December 31, 2017,2021, we have been notified that we are potentially responsible and have received other notices of potential liability pursuant to various environmental laws at 15 9sites (22(11 sites at December 31, 2016)2020) at which the liability has not been settled, of which 9 sites have been active in the past few years. These laws may impose liability on certain persons that are considered jointly and severally liable for the costs of investigation and remediation of hazardous substances present at these sites, regardless of fault or legality of the original disposal. These persons include the present or former owners or operators of the site and companies that generated, disposed of or arranged for the disposal of hazardous substances at the site. We are considered a “de minimis” potentially responsible party at most of the sites, and we estimate that our aggregate liability, if any, related to these sites is not material to our consolidated financial statements. We conduct extensive environmental due diligence with respect to potential acquisitions, including environmental site assessments and such further testing as we may deem warranted. If an environmental matter is identified, we estimate the cost and either establish a liability, purchase insurance or obtain an indemnity from a financially sound seller; however, in connection with our acquisitions or dispositions, we may assume or retain significant environmental liabilities, some of which we may be unaware. The potential costs related to these environmental matters and the possible impact on future operations are uncertain due in part to the complexity of government laws and regulations and their interpretations, the varying costs and effectiveness of various clean-up technologies, the uncertain level of insurance or other types of recovery, and the questionable level of our responsibility. We record a liability when it is both probable and the amount can be reasonably estimated.
In our opinion, after considering accruals established for such purposes, the cost of remedial actions for compliance with the present laws and regulations governing the protection of the environment isare not expected to have a material impact, individually or in the aggregate, on our financial position, results of operations or cash flows.
Self-Insured Risk Management Matters
We are self-insured for certain of our workers’ compensation, automobile, product and general liability, disability and health costs, and we believe that we maintain adequate accruals to cover our retained liability. Our accruals for risk management matters are determined by us, are based on claims filed and estimates of claims incurred but not yet reported, and generally are not discounted. We consider a number of factors, including third-party actuarial valuations, when making these determinations. We maintain third-party stop-loss insurance policies to cover certain liability costs in excess of predetermined retained amounts. This insurance may be insufficient or unavailable (e.g., because of insurer insolvency) to protect us against loss exposure.exposures.
Executive Agreements
The Board of Directors has approved an employment agreement for our President and Chief Executive Officer. This agreement had an initial term through December 31, 2017 and, thereafter, rolling terms of one year, and specifies the executive’s current compensation, benefits and perquisites, severance entitlements, and other employment rights and responsibilities. The Compensation Committee of the Board of Directors has approved severance benefit agreements for our other six6 executive officers. These agreements cover each executive’s entitlements in the event that the executive’s employment is terminated for other than cause, death or disability, or the executive resigns with good reason. The Compensation Committee of the Board of Directors has also approved change of control agreements for each of our executive officers, which cover each executive’s entitlements following a change of control.
(14) Shareholders’(16) Stockholders’ Equity and Long-Term Incentive Compensation
Income (Loss) Per Share
The following table sets forth the computations of the components used for the calculation of basic and diluted income (loss) per share:
| | | | | | | | | | | | | | | | | |
| Year ended December 31, |
| 2021 | | 2020 | | 2019 |
| Numerator: | | | | | |
| Income from continuing operations attributable to SPX Corporation common stockholders for calculating basic and diluted income per share | $ | 59.0 | | | $ | 73.8 | | | $ | 76.3 | |
| Income (loss) from discontinued operations, net of tax | $ | 366.4 | | | $ | 25.2 | | | $ | (11.0) | |
| Adjustment related to redeemable noncontrolling interest (Note 15) | — | | | — | | | 5.6 | |
| Income (loss) from discontinued operations attributable to SPX Corporation common stockholders for calculating basic and diluted income per share | $ | 366.4 | | | $ | 25.2 | | | $ | (5.4) | |
| Denominator: | | | | | |
| Weighted-average number of common shares used in basic income per share | 45.289 | | | 44.628 | | | 43.942 | |
| Dilutive securities — Employee stock options, restricted stock shares and restricted stock units | 1.206 | | | 1.138 | | | 1.015 | |
| Weighted-average number of common shares and dilutive securities used in diluted income per share | 46.495 | | | 45.766 | | | 44.957 | |
|
| | | | | | | | | | | |
| | Year ended December 31, |
| | 2017 | | 2016 | | 2015 |
| Numerator: | | | | | |
| Income (loss) from continuing operations | $ | 84.0 |
| | $ | 30.3 |
| | $ | (151.6 | ) |
| Less: Net loss attributable to noncontrolling interests | — |
| | (0.4 | ) | | (33.4 | ) |
| Adjustment related to redeemable noncontrolling interest (Note13) | — |
| | (18.1 | ) | | — |
|
| Income (loss) from continuing operations attributable to SPX Corporation common shareholders for calculating basic and diluted income per share | $ | 84.0 |
| | $ | 12.6 |
| | $ | (118.2 | ) |
| Income (loss) from discontinued operations, net of tax | $ | 5.3 |
| | $ | (97.9 | ) | | $ | 34.6 |
|
| Less: Net loss attributable to noncontrolling interest | — |
| | — |
| | (0.9 | ) |
| Income (loss) from discontinued operations attributable to SPX Corporation common shareholders for calculating basic and diluted income per share | $ | 5.3 |
| | $ | (97.9 | ) | | $ | 35.5 |
|
| Denominator: | | | | | |
| Weighted-average number of common shares used in basic income (loss) per share | 42.413 |
| | 41.610 |
| | 40.733 |
|
| Dilutive securities — Employee stock options, restricted stock shares and restricted stock units | 1.492 |
| | 0.551 |
| | — |
|
| Weighted-average number of common shares and dilutive securities used in diluted income (loss) per share | 43.905 |
| | 42.161 |
| | 40.733 |
|
For the year ended December 31, 2015, 0.351 of unvested restricted stock shares/units were excluded from the computation of diluted earnings per share as we incurred losses from continuing operations during the year. For the years ended December 31, 2017, 2016,2021, 2020, and 2015, 0.563, 1.045,2019, 0.245, 0.300, and 0.5530.319, respectively, of unvested restricted stock shares/units respectively, were excluded from the computation of diluted earnings per share as the assumed proceeds for these instruments exceeded the average market value of the underlying common stock for the related years. For the years ended December 31, 2017, 20162021, 2020, and 2015, 0.997, 1.343,2019, 0.627, 0.793, and 0.505,0.942, respectively, of outstanding stock options were excluded from the computation of diluted earnings per share as the assumed proceeds for these instruments exceeded the average market value of the underlying common stock for the related years.
Common Stock and Treasury Stock
At December 31, 2017,2021, we had 200.0 authorized shares of common stock (par value $0.01). Common shares issued, treasury shares and shares outstanding are summarized in the table below.
|
| | | | | | | | |
| | Common Stock Issued | | Treasury Stock | | Shares Outstanding |
| December 31, 2014 | 100.064 |
| | (59.206 | ) | | 40.858 |
|
| Restricted stock shares and restricted stock units | 0.102 |
| | 0.096 |
| | 0.198 |
|
| Other | 0.360 |
| | — |
| | 0.360 |
|
| December 31, 2015 | 100.526 |
| | (59.110 | ) | | 41.416 |
|
| Restricted stock shares and restricted stock units | 0.042 |
| | 0.295 |
| | 0.337 |
|
| Retirement of treasury stock | (50.000 | ) | | 50.000 |
| | — |
|
| Other | 0.187 |
| | — |
| | 0.187 |
|
| December 31, 2016 | 50.755 |
| | (8.815 | ) | | 41.940 |
|
| Restricted stock units | — |
| | 0.280 |
| | 0.280 |
|
| Other | 0.431 |
| | — |
| | 0.431 |
|
| December 31, 2017 | 51.186 |
| | (8.535 | ) | | 42.651 |
|
In 2016, we retired 50.0 shares or $2,948.1 of “Common stock in treasury.” Under the applicable state law, these shares represent authorized and unissued shares upon retirement. In accordance with our accounting policy, we allocate any excess of share repurchase over par value between “Paid-in capital” and “Retained deficit,” resulting in respective adjustments of $1,285.4 and $1,662.2. | | | | | | | | | | | | | | | | | |
| Common Stock
Issued | | Treasury
Stock | | Shares
Outstanding |
| Balance at December 31, 2018 | 51.529 | | | (8.078) | | | 43.451 | |
| | | | | |
| | | | | |
| Restricted stock units | — | | | 0.264 | | | 0.264 | |
| Other | 0.488 | | | — | | | 0.488 | |
| Balance at December 31, 2019 | 52.017 | | | (7.814) | | | 44.203 | |
| | | | | |
| Restricted stock units | — | | | 0.141 | | | 0.141 | |
| | | | | |
| Other | 0.688 | | | — | | | 0.688 | |
| Balance at December 31, 2020 | 52.705 | | | (7.673) | | | 45.032 | |
| | | | | |
| Restricted stock units | — | | | 0.130 | | | 0.130 | |
| | | | | |
| Other | 0.306 | | | — | | | 0.306 | |
| Balance at December 31, 2021 | 53.011 | | | (7.543) | | | 45.468 | |
Long-Term Incentive Compensation
Under theOn May 9, 2019, our stockholders approved our 2019 Stock Compensation Plan (the “2019 Plan”) which replaced our 2002 Stock Compensation Plan, as amended in 2006, 2011, 2012 and 2015 up(the “Prior Plan”). As a result of the approval of the 2019 Plan, no further awards were permitted to 1.682be made under the Prior Plan. Up to 4.074 shares of our common stock were available for grant at December 31, 2017.2021 under the 2019 Plan. The 2002 Stock Compensation2019 Plan permits the issuance of new shares or shares from treasury upon the exercise of options, vesting of time-based restricted stock units (“RSU’s”) and performance stock units (“PSU’s”), or the granting of restricted stock shares (“RS’s”). Each RSU, RS and RSPSU granted reduces availability by two2 shares. Each PSUSimilar awards were permitted to be granted in 2017 reduces availability by its maximum vesting attainmentunder the Prior Plan before the approval of 150%, or 3.0 shares.the 2019 Plan.
PSU’s, RSU’s and RS’s may be granted to certain eligible employees or non-employee directors in accordance with applicable equity compensation plan documents and agreements. Subject to participants’ continued employment and other plan terms and conditions, the restrictions lapse and awards generally vest over a period of time, generally one or three years. In some instances, such as death, disability, or retirement, stock may vest concurrently with or following an employee’s termination. PSU’s are eligible to vest at the end of the performance period, with performance based on the total return of our stock over the three-year performance period against a peer group within the S&P 600 Capital Goods Index, while the RSU’s and RS’s vest based on the passage of time since grant date. PSU’s, RSU’s, and RS’s that do not vest within the applicable vesting period are forfeited.
Eligible employees received PSU’s in 2014 and 2013 as to which the employee could earn between 25% and 125% of the target performance award in the event the awards met the required vesting criteria. Vesting for the 2014 and 2013 target performance awards was based on SPX shareholder return versus the S&P Composite 1500 Industrials Index over three-year periods ended December 31, 2016 and December 31, 2015, respectively. In connection with the Spin-Off, the 2014 and 2013 PSU’s were modified to allow for a minimum vesting equivalent to 50% of the underlying shares at the end of the applicable remaining service periods. In connection with this modification, we recorded additional stock compensation expense of $2.1 in 2015. The remaining 2014 and 2013 PSU’s (i.e., the remaining 50%) did not meet the required performance target for the three years ended December 31, 2016 and 2015, respectively, and, as a result, these awards were forfeited.
We grant RSU’s or RS’s to non-employee directors under the 2006 Non-Employee Directors’ Stock Incentive Plan (the “Directors’ Plan”) and the 2002 Stock Compensation2019 Plan. Under the Directors’ Plan, up to 0.027 shares of our common stock were available for grant at December 31, 2017.2021. The 2017, 20162021, 2020 and 20152019 grants to non-employee directors generally vest over a one-year vesting period,1 year-period, with the 20172021 grants scheduled to vest in their entirety immediately prior to the annual meeting of stockholders in May 2018.2022.
Stock options may be granted to key employees in the form of incentive stock options or nonqualifiednon-qualified stock options. The option price per share may be no less than the fair market value of our common stock at the close of business the day prior to the date of grant. Upon exercise, the employee has the option to surrender previously owned shares at current value in payment of the exercise price and/or for withholding tax obligations.
The recognition of compensation expense for share-based awards, including stock options, is based on their grant date fair values. The fair value of each award is amortized over the lesser of the award’s requisite or derived service period, which is generally up to three years. Compensation expense within income from continuing operations related to PSU’s, RSU’s, RS’s and stock options totaledtotaled $12.9, $12.0 $12.7 and $33.9$10.0 for the years ended December 31, 2017, 20162021, 2020 and 2015,2019, respectively, with the related tax benefit being $4.6, $4.8$2.2, $2.0 and $12.9$2.4 for the years ended December 31, 2017, 20162021, 2020 and 2015,2019, respectively.
During 2017 and 2016,In years prior to 2019, annual long-term cash awards were granted to executive officers and other members of senior management. These awards are eligible to vest at the end of a three-year performance measurement period, with performance based on our achievement of a target segment income amount over the three-year measurement period. Long-term incentive compensation expense for 20172021, 2020, and 20162019 included $3.8$(0.1), $1.1 and $1.0,$2.6, respectively, associated with long-term cash awards.
We use the Monte Carlo simulation model valuation technique to determine fair value of our restricted stock awards that contain a market condition (i.e., the PSU’s). The Monte Carlo simulation model utilizes multiple input variables that determine
the probability of satisfying the market condition stipulated in the award and calculates the fair value of each PSU. We issued PSU’s to eligible participants on March 1, 20172021, February 20, 2020 and March 2, 2016, while there were no PSU’s issued during 2015.February 21, 2019. We used the following assumptions in determining the fair value of these awards:
| | | | | | | | | | | | | | | | | | | | | | | |
| Annual Expected
Stock Price
Volatility | | Annual Expected
Dividend Yield | | Risk-Free Interest Rate | | Correlation
Between Total
Shareholder
Return for SPX
and the
Applicable
S&P Index |
| March 1, 2021 | | | | | | | |
| SPX Corporation | 42.88 | % | | — | % | | 0.25 | % | | 60.24 | % |
| Peer group within S&P 600 Capital Goods Index | 51.25 | % | | n/a | | 0.25 | % | | |
| February 20, 2020 | | | | | | | |
| SPX Corporation | 29.47 | % | | — | % | | 1.35 | % | | 35.47 | % |
| Peer group within S&P 600 Capital Goods Index | 34.93 | % | | n/a | | 1.35 | % | | |
| February 21, 2019 | | | | | | | |
| SPX Corporation | 32.70 | % | | — | % | | 2.53 | % | | 38.75 | % |
| Peer group within S&P 600 Capital Goods Index | 34.75 | % | | n/a | | 2.48 | % | | |
|
| | | | | | | | | | |
| | Annual Expected
Stock Price
Volatility | | Annual Expected
Dividend Yield | | Risk-Free Interest Rate | | Correlation
Between Total
Shareholder
Return for SPX
and the
Applicable
S&P Index |
| March 1, 2017 | | | | | | | |
| SPX Corporation | 41.03 | % | | — | % | | 1.52 | % | | 0.3685 |
| Peer group within S&P 600 Capital Goods Index | 34.49 | % | | n/a |
| | 1.52 | % | | |
| March 2, 2016 | | | | | | | |
| SPX Corporation | 36.91 | % | | — | % | | 0.97 | % | | 0.3354 |
| Peer group within S&P 600 Capital Goods Index | 32.94 | % | | n/a |
| | 0.97 | % | | |
Annual expected stock price volatility is based on the three-year historical volatility. There is no annual expected dividend yield as we discontinued dividend payments in 2015 and do not expect to pay dividends for the foreseeable future. The average risk-free interest rate is based on the one-year through three-year daily treasury yield curve rate as of the grant date.
The following table summarizes the PSU, RSU, and RS activity from December 31, 20142018 through December 31, 2017:2021:
|
| | | | | | |
| | Unvested PSU’s, RSU’s, and RS’s | | Weighted-Average Grant-Date Fair Value Per Share |
| December 31, 2014 | 1.168 |
| | $ | 69.22 |
|
| Pre-spin: | | | |
| Granted | 0.451 |
| | 81.60 |
|
| Vested | (0.262 | ) | | 78.71 |
|
| Canceled | (0.212 | ) | | 52.67 |
|
| Impact of Spin-Off: | | | |
| Terminations | (0.785 | ) | | * |
|
| Conversions | 1.010 |
| | * |
|
| Post-spin | | | |
| Granted | 0.510 |
| | 12.32 |
|
| Canceled | (0.011 | ) | | 20.34 |
|
| December 31, 2015 | 1.869 |
| | 17.63 |
|
| Granted | 0.423 |
| | 13.97 |
|
| Vested | (0.528 | ) | | 10.32 |
|
| Forfeited | (0.062 | ) | | 20.46 |
|
| December 31, 2016 | 1.702 |
| | 16.47 |
|
| Granted | 0.252 |
| | 28.22 |
|
| Vested | (0.483 | ) | | 18.17 |
|
| Forfeited | (0.241 | ) | | 20.83 |
|
| December 31, 2017 | 1.230 |
| | $ | 17.41 |
|
| | | | | | | | | | | |
| Unvested PSU’s, RSU’s, and RS’s | | Weighted-Average
Grant-Date Fair
Value Per Share |
| December 31, 2018 | 0.652 | | | $ | 24.65 | |
| Granted | 0.430 | | | 35.49 | |
| Vested | (0.446) | | | 18.75 | |
| Forfeited | (0.030) | | | 35.10 | |
| December 31, 2019 | 0.606 | | | 36.17 | |
| Granted | 0.277 | | | 46.61 | |
| Vested | (0.233) | | | 31.49 | |
| Forfeited | (0.006) | | | 41.37 | |
| December 31, 2020 | 0.644 | | | 42.32 | |
| Granted | 0.243 | | | 57.24 | |
| Vested | (0.219) | | | 37.40 | |
| Forfeited | (0.032) | | | 53.69 | |
| December 31, 2021 | 0.636 | | | $ | 49.14 | |
As of December 31, 2017,2021, there was $8.1$10.9 of unrecognized compensation cost related to PSU’s, RSU’s and RS’s. We expect this cost to be recognized over a weighted-average period of 1.41.8 years.
Stock Options
On March 1, 2017, March 2, 20162021, February 20, 2020 and October 14, 2015,February 21, 2019, we granted stock options totaling 0.208, 0.5050.105, 0.125 and 0.883, respectively, of which 0.188 were exercisable as of December 31, 2017.0.186, respectively. The exercise price per share of these options is $27.40, $12.85$58.34, $50.09 and $12.36, respectively,$36.51, respectively, and the maximum contractual term of these options is ten years.
The fair value of each stock option granted on March 1, 2017, March 2, 20162021, February 20, 2020 and October 14, 2015February 21, 2019 was $9.60, $4.11$23.49, $17.40 and $3.76,$13.31, respectively. The fair value of each option grant was estimated using a Black-Scholes option-pricing model with the following assumptions:
| | | | | | | | | | | | | | | | | |
| March 1, 2021 | | February 20, 2020 | | February 21, 2019 |
| Annual expected stock price volatility | 41.15 | % | | 33.48 | % | | 32.70 | % |
| Annual expected dividend yield | — | % | | — | % | | — | % |
| Risk-free interest rate | 0.91 | % | | 1.41 | % | | 2.53 | % |
| Expected life of stock option (in years) | 6.0 | | 6.0 | | 6.0 |
|
| | | | | | | | |
| | March 1,
2017 | | March 2,
2016 | | October 14
2015 |
| Annual expected stock price volatility | 32.00 | % | | 30.06 | % | | 27.86 | % |
| Annual expected dividend yield | — | % | | — | % | | — | % |
| Risk-free interest rate | 2.14 | % | | 1.50 | % | | 1.64 | % |
| Expected life of stock option (in years) | 6.0 |
| | 6.0 |
| | 6.0 |
|
Annual expected stock price volatility for the March 1, 20172021, February 20, 2020 and March 2, 2016 grantFebruary 21, 2019 grants were based on a weighted average of SPX’s stock volatility since the Spin-Off and an average of the most recent six-year historical volatility of a peer company group, while the annual expected stock price volatility for the October 14, 2015 grant was based on the six-year historical volatility of SPX’s common stock.group. There is no annual expected dividend yield as we discontinued dividend payments in 2015 and do not expect to pay dividends for the foreseeable future. The average risk-free interest rate is based on the five-year and seven-year treasury constant maturity rates. The expected option life is based on a three-year pro-rata vesting schedule and represents the period of time that awards are expected to be outstanding.
The following table shows stock option activity from December 31, 20142018 through December 31, 2017.2021.
| | | | | | | | | | | |
| Shares | | Weighted-
Average Exercise
Price |
| Options outstanding at December 31, 2018 | 1.718 | | | $ | 16.58 | |
| Exercised | (0.202) | | | 13.46 | |
| Forfeited | (0.013) | | | 33.15 | |
| Granted | 0.189 | | | 36.50 | |
| Options outstanding at December 31, 2019 | 1.692 | | | 19.05 | |
| Exercised | (0.412) | | | 14.97 | |
| Forfeited | — | | | — | |
| Granted | 0.139 | | | 49.57 | |
| Options outstanding at December 31, 2020 | 1.419 | | | 23.21 | |
| Exercised | (0.123) | | | 15.82 | |
| Forfeited | (0.008) | | | 50.11 | |
| Granted | 0.105 | | | 58.34 | |
| Options outstanding at December 31, 2021 | 1.393 | | | $ | 26.35 | |
|
| | | | | | |
| | Shares | | Weighted- Average Exercise Price |
| Options outstanding and exercisable at December 31, 2014 | — |
| | $ | — |
|
| Granted pre-spin | 0.323 |
| | 85.87 |
|
| Impact of Spin-Off: | | | |
| Terminations | (0.282 | ) | | 85.87 |
|
| Conversions | 0.123 |
| | * |
|
| Granted post-spin | 0.883 |
| | 12.36 |
|
| Options outstanding and exercisable at December 31, 2015 | 1.047 |
| | 12.91 |
|
| Granted | 0.505 |
| | 12.85 |
|
| Options outstanding and exercisable at December 31, 2016 | 1.552 |
| | 12.89 |
|
| Exercised | (0.125 | ) | | 20.67 |
|
| Forfeited | (0.027 | ) | | 14.45 |
|
| Granted | 0.208 |
| | 27.40 |
|
| Options outstanding and exercisable at December 31, 2017 | 1.608 |
| | $ | 14.67 |
|
As of December 31, 2017,2021, 1.150 of the above stock options were exercisable and there was $2.2$1.6 of unrecognized compensation cost related to the outstanding stock options. We expect this cost to be recognized over a weighted-average period of 1.22.0 years.
Accumulated Other Comprehensive Income
The changes in the components of accumulated other comprehensive income, net of tax, for the year ended December 31, 20172021 were as follows:
|
| | | | | | | | | | | | | | | |
| | Foreign Currency Translation Adjustment | | Net Unrealized Gains on Qualifying Cash Flow Hedges(3) | | Pension and Postretirement Liability Adjustment and Other(1)(4) | | Total |
| December 31, 2016 | $ | 229.7 |
| | $ | 1.5 |
| | $ | 3.9 |
| | $ | 235.1 |
|
Other comprehensive income before reclassifications (1) | 0.5 |
| | 2.3 |
| | 16.3 |
| | 19.1 |
|
Amounts reclassified from accumulated other comprehensive income (2) | — |
| | (3.0 | ) | | (1.1 | ) | | (4.1 | ) |
| Current-period other comprehensive income (loss) | 0.5 |
| | (0.7 | ) | | 15.2 |
| | 15.0 |
|
| December 31, 2017 | $ | 230.2 |
| | $ | 0.8 |
| | $ | 19.1 |
| | $ | 250.1 |
|
| | | | | | | | | | | | | | | | | | | | | | | | | |
| Foreign
Currency
Translation
Adjustment | | Net Unrealized Gains (losses) on Qualifying Cash Flow Hedges(1) | | | | Pension and Postretirement Liability Adjustment(2) | | Total |
| Balance at December 31, 2020 | $ | 238.6 | | | $ | (4.4) | | | | | $ | 14.3 | | | $ | 248.5 | |
| Other comprehensive income (loss) before reclassifications | (5.8) | | | 5.3 | | | | | — | | | (0.5) | |
| Amounts reclassified from accumulated other comprehensive income (loss) | 19.9 | | | (0.4) | | | | | (3.6) | | | 15.9 | |
| Current-period other comprehensive income (loss) | 14.1 | | | 4.9 | | | | | (3.6) | | | 15.4 | |
| Balance at December 31, 2021 | $ | 252.7 | | | $ | 0.5 | | | | | $ | 10.7 | | | $ | 263.9 | |
(1) As indicated in Note 9, we reduced our unfunded liability related to postretirement benefitsNet of tax (provision) benefit of $(0.1) and increased “Accumulated other comprehensive income” (before tax) by $26.8.$1.4 as of December 31, 2021 and 2020, respectively.
(2) As indicated in Note 12, we discontinued hedge accounting for our Swaps resulting in a reclassification from “Accumulated other comprehensive income” (before tax) of $2.7.
| |
(3)
| Net of tax provision of $0.5 and $0.9 as of December 31, 2017 and 2016, respectively. |
(4) Net of tax provision of $12.5$3.7 and $2.7$4.9 as of December 31, 20172021 and 2016,2020, respectively. The balances as of December 31, 20172021 and 20162020 include unamortizedunamortized prior service credits.
The changes in the components of accumulated other comprehensive income, net of tax, for the year ended December 31, 20162020 were as follows:
|
| | | | | | | | | | | | | | | |
| | Foreign Currency Translation Adjustment | | Net Unrealized Losses on Qualifying Cash Flow Hedges(2) | | Pension and Postretirement Liability Adjustment and Other(3) | | Total |
| Balance at December 31, 2015 | $ | 280.6 |
| | $ | (1.8 | ) | | $ | 4.5 |
| | $ | 283.3 |
|
| Other comprehensive income (loss) before reclassifications | (11.9 | ) | | 1.1 |
| | — |
| | (10.8 | ) |
Amounts reclassified from accumulated other comprehensive income (1) | (39.0 | ) | | 2.2 |
| | (0.6 | ) | | (37.4 | ) |
| Current-period other comprehensive income (loss) | (50.9 | ) | | 3.3 |
| | (0.6 | ) | | (48.2 | ) |
| Balance at December 31, 2016 | $ | 229.7 |
| | $ | 1.5 |
| | $ | 3.9 |
| | $ | 235.1 |
|
| | | | | | | | | | | | | | | | | | | | | | | |
| Foreign
Currency
Translation
Adjustment | | Net Unrealized
Losses on
Qualifying
Cash
Flow
Hedges (1) | | Pension and
Postretirement
Liability Adjustment and Other (2) | | Total |
| Balance at December 31, 2019 | $ | 228.0 | | | $ | (1.6) | | | $ | 17.9 | | | $ | 244.3 | |
| Other comprehensive income (loss) before reclassifications | 10.6 | | | (5.7) | | | — | | | 4.9 | |
| Amounts reclassified from accumulated other comprehensive income (loss): | — | | | 2.9 | | | (3.6) | | | (0.7) | |
| Current-period other comprehensive income (loss) | 10.6 | | | (2.8) | | | (3.6) | | | 4.2 | |
| Balance at December 31, 2020 | $ | 238.6 | | | $ | (4.4) | | | $ | 14.3 | | | $ | 248.5 | |
| |
(1)
| In connection with the sale of our dry cooling business, we reclassified $40.4 of other comprehensive income related to foreign currency translation to “Gain on sale of dry cooling business.” |
| |
(2)
| Net of tax (provision) benefit of $(0.9) and $0.8 as of December 31, 2016 and 2015, respectively. |
| |
(3)
| Net of tax provision of $2.7 and $3.1 as of December 31, 2016 and 2015, respectively. The balances as of December 31, 2016 and 2015 include unamortized prior service credits. |
(1) Net of tax benefit of $1.4 and $0.5 as of December 31, 2020 and 2019, respectively.
(2) Net of tax provision of $4.9 and $6.1 as of December 31, 2020 and 2019, respectively. The balances as of December 31, 2020 and 2019 include unamortized prior service credits.
The following summarizes amounts reclassified from each component of accumulated comprehensive income for the years ended December 31, 20172021 and 2016:2020:
| | | | Amount Reclassified from AOCI | | Affected Line Items in the Consolidated Statements of Operations | | Amount
Reclassified
from
AOCI | | Affected
Line Items
in the
Consolidated Statements of
Operations |
| | Year ended December 31, | | | Year ended
December 31, | | |
| | 2017 | | 2016 | | | 2021 | | 2020 | |
| (Gains) losses on qualifying cash flow hedges: | | | | | (Gains) losses on qualifying cash flow hedges: | | | | |
| FX forward contracts | $ | — |
| | $ | 1.0 |
| | Revenues | |
| | Commodity contracts | (2.5 | ) | | 2.0 |
| | Cost of products sold | Commodity contracts | $ | (3.8) | | | $ | (0.9) | | | Income from discontinued operations, net of tax |
| Swaps | 0.3 |
| | — |
| | Interest Expense | |
| Swaps | (2.7 | ) | | — |
| | Other Expense, net | Swaps | 3.2 | | | 4.7 | | | Interest expense |
| Pre-tax | (4.9 | ) | | 3.0 |
| | Pre-tax | (0.6) | | | 3.8 | | |
| Income taxes | 1.9 |
| | (0.8 | ) | | Income taxes | 0.2 | | | (0.9) | | |
| | $ | (3.0 | ) | | $ | 2.2 |
| | | $ | (0.4) | | | $ | 2.9 | | |
| Pension and postretirement items: | | | | | Pension and postretirement items: | | | | |
| | Amortization of unrecognized prior service credits - Pre-tax | $ | (1.8 | ) | | $ | (1.0 | ) | | Selling, general and administrative | Amortization of unrecognized prior service credits - Pre-tax | $ | (4.8) | | | $ | (4.8) | | | Other income (expense), net |
| | Income taxes | 0.7 |
| | 0.4 |
| | Income taxes | 1.2 | | | 1.2 | | |
| | $ | (1.1 | ) | | $ | (0.6 | ) | | | $ | (3.6) | | | $ | (3.6) | | |
| | | | | | | | | | |
| Recognition of foreign currency translation adjustments related to business dispositions: | | | | | |
| Recognition of foreign currency translation adjustment associated with the sale of our dry cooling business | $ | — |
| | $ | (40.4 | ) | | Gain on sale of dry cooling business | |
| Recognition of foreign currency translation adjustment associated with the sale our Balcke Dürr business | — |
| | 1.4 |
| | Gain (loss) on disposition of discontinued operations, net of tax | |
| Loss on reclassification of foreign currency translation adjustments: | | Loss on reclassification of foreign currency translation adjustments: | |
| DBT | | DBT | $ | 19.9 | | | $ | — | | | Gain on disposition of discontinued operations, net of tax |
| Income taxes | | Income taxes | — | | | — | | |
| | $ | — |
| | $ | (39.0 | ) | | | $ | 19.9 | | | $ | — | | |
Common Stock in Treasury
As described above, in 2016, we retired 50.0 shares or $$2,948.1 of “Common stock in treasury.” In addition, duringDuring the years ended December 31, 2017, 20162021, 2020 and 2015,2019, “Common stock in treasury” was decreased by the settlement of restricted stock units issued from treasury stock of $16.9, $17.9$7.7, $8.4 and $7.0, respectively, and increased by $0.0, $0.0 and $1.8, respectively, for common stock that was surrendered by recipients of restricted stock as a means of funding the related minimum income tax withholding requirements.$15.8, respectively.
Dividends
In connection with the Spin-Off, we discontinued dividend payments immediately following the second quarter dividend payment for 2015. Dividends declared totaled $30.9 for the year ended December 31, 2015, while dividends paid were $45.9.
Preferred Stock
None of our 3.0 shares of authorized no par value preferred stock was outstanding at December 31, 2017, 20162021, 2020 or 2015.
2019.
(15)
(17) Fair Value
Fair value is the price that would be received to sell an asset or paid to transfer a liability in an orderly transaction between market participants at the measurement date. In the absence of active markets for the identical assets or liabilities, such measurements involve developing assumptions based on market observable data and, in the absence of such data, internal information consistent with what market participants would use in a hypothetical transaction that occurs at the measurement date. Observable inputs reflect market data obtained from independent sources, while unobservable inputs reflect our market assumptions. Preference is given to observable inputs. These two types of inputs create the following fair value hierarchy:
•Level 1 — Quoted prices for identical instruments in active markets.
•Level 2 — Quoted prices for similar instruments in active markets; quoted prices for identical or similar instruments in markets that are not active; and model-derived valuations whose inputs are observable or whose significant value drivers are observable.
•Level 3 — Significant inputs to the valuation model are unobservable.
There were no changes during the periods presented to the valuation techniques we use to measure asset and liability fair values on a recurring basis. There were no transfers between the three levels of the fair value hierarchy for the periods presented.
Valuation MethodologiesMethods Used to Measure Fair Value on a Non-Recurring Basis
Parent Guarantees and Bonds Associated with Balcke Dürr—As indicated in Note 4, inIn connection with the 2016 sale of Balcke Dürr, existing parent company guarantees and bank and surety bonds, which totaled approximately Euro 79.0 and Euro 79.0, respectively, remained in place at the time of sale (and Euro 76.1 and Euro 47.9, respectively, at December 31, 2017), will remain in place through each instrument’s expiration date, with such expiration dates occurring through 2022.sale. These guarantees and bonds provideprovided protections for Balcke Dürr customers in regard to advance payments, performance, and warranties on projects in existence at the time of sale. In addition, certain bonds relaterelated to lease obligations and foreign tax matters in existence at the time of sale. Balcke Dürr and the Buyer haveacquirer of Balcke Dürr provided us a fullan indemnity in the event that any of these guaranteesthe bonds were called or bonds are called.payments were made under the guarantees. Also, at the time of sale, Balcke Dürr provided cash collateral of Euro 4.0 and mutares AGthe parent company of the buyer provided a guarantee of Euro 5.0 as a security for the above indemnificationsindemnifications (Euro 4.00.0 and Euro 3.0, respectively,0.0, respectively, at December 31, 2017)2021). In connection with the sale, we recorded a liability for the estimated fair value of the guarantees and bonds and an asset for the estimated fair value of the cash collateral and indemnities provided. Since the sale of Balcke Dürr, the guarantees have expired and bonds have been returned. Summarized below are the liability (related to the parent company guarantees and bank and surety bonds) and asset (related to the cash collateral and guarantee provided by mutares AG)the parent company of the buyer) recorded at the time of sale, along with the change in the liability and the asset during 2017.2021, 2020, and 2019.
| | | | | | | | | | | | | | | | | | | | | | | | | | | | | | | | | | | | | | |
| | Year ended |
| | December 31, 2021 | | December 31, 2020 | | December 31, 2019 |
| | Guarantees and Bonds Liability (1) | | Indemnification Assets (1) | | Guarantees and Bonds Liability (1) | | Indemnification Assets (1) | | Guarantees and Bonds Liability (1) | | Indemnification Assets (1) |
| Balance at beginning of year | | $ | 1.8 | | | $ | — | | | $ | 2.0 | | | $ | 0.3 | | | $ | 4.4 | | | $ | 1.2 | |
Reduction/Amortization for the period (2) | | (1.7) | | | — | | | (0.4) | | | (0.3) | | | (2.3) | | | (0.9) | |
| Impact of changes in foreign currency rates | | (0.1) | | | — | | | 0.2 | | | — | | | (0.1) | | | — | |
Balance at end of period (3) | | $ | — | | | $ | — | | | $ | 1.8 | | | $ | — | | | $ | 2.0 | | | $ | 0.3 | |
|
| | | | | | | | |
| | | Twelve Months Ended December 31, 2017 |
| | | Guarantees and Bonds Liability | | Indemnification Assets |
Balance as of December 31, 2016 (1) (2) | | $ | 9.9 |
| | $ | 4.8 |
|
Reduction/Amortization for the period (3) | | (2.5 | ) | | (2.6 | ) |
| Impact of changes in foreign currency rates | | 1.3 |
| | 0.6 |
|
Balance as of December 31, 2017 (2) | | $ | 8.7 |
| | $ | 2.8 |
|
___________________________
| |
(1)
| (1)In connection with the sale, we estimated the fair value of the existing parent company guarantees and bank and surety bonds considering the probability of default by Balcke Dürr and an estimate of the amount we would be obligated to pay in the event of a default. Additionally, we estimated the fair value of the cash collateral provided by Balcke Dürr and the guarantee provided by mutares AG based on the terms and conditions and relative risk associated with each of these securities (unobservable inputs - Level 3). |
| |
(2)
| Balance associated with the guarantees and bonds is reflected within “Other long-term liabilities,” while the balance associated with the indemnification assets is reflected within “Other assets.” |
| |
(3)
| We reduce the liability generally at the earlier of the completion of the related underlying project milestones or the expiration of the guarantees or bonds. We amortize the asset based on the expiration terms of each of the securities. We record the reduction of the liability and the amortization of the asset to “Other expense, net.” |
The net loss recorded at the time of sale of $78.6 includes a charge of $5.1 associated with the estimated fair value of the guarantees and bonds, after consideration of the cash collateral and guarantee provided by Balcke Dürr and mutares AG, respectively.the guarantee provided by the parent company of the buyer based on the terms and conditions and relative risk associated with each of these securities (unobservable inputs - Level 3).
(2)We reduced the liability generally at the earlier of the completion of the related underlying project milestones or the expiration of the guarantees or bonds. We amortized the asset based on the expiration terms of each of the securities. We recorded the reduction of the liability and the amortization of the asset to “Other income (expense), net.”
(3)Balance associated with the guarantees and bonds is reflected within "Other long-term liabilities" within the accompanying consolidated balance sheet as of December 31, 2020.
Contingent Consideration for Sensors & Software and ECS Acquisitions — In connection with acquisitions of Sensors & Software and ECS, the respective sellers are eligible for additional cash consideration of $3.9 and $16.8, respectively, with payment of such contingent consideration dependent upon the achievement of certain milestones. The estimated fair value of such contingent consideration is $1.3 and $1.5, respectively, with such amounts reflected as liabilities within our consolidated balance sheet as of December 31, 2021. We estimated the fair value of the contingent consideration for these acquisitions based on the probability of Sensors & Software and ECS achieving the applicable milestones.
Goodwill, Indefinite-Lived Intangible and Other Long-Lived Assets— Certain of our non-financial assets are subject to impairment analysis, including long-lived assets, indefinite-lived intangible assets and goodwill. We review the carrying amounts of such assets whenever events or changes in circumstances indicate that the carrying amounts may not be recoverable or at least annually for indefinite-lived intangible assets and goodwill. Any resulting asset impairment would require that the instrument be recorded at its fair value. As of December 31, 2017, we did not have any significant non-financial assets or liabilities that are required to be measured at fair value on a recurring or non-recurring basis.
During the fourth quarter of 2016, we concluded that the carrying value of Heat Transfer’s definite-lived intangible assets (customer relationships and technology) may not be recoverable. As a result, we performed an impairment analysis on such assets. Based on such analysis, we determined that the fair values of these assets were less than their respective carrying values, resulting in an aggregate impairment charge of $23.9. The fair value of the customer relationship intangible asset was based on the estimated future cash flows of the asset, discounted at a rate of return that reflected the relative risk of the cash flows (unobservable inputs - Level 3). The fair values for the technology intangible assets were based on applying estimated royalty rates to projected revenues associated with the assets, discounted at a rate of return that reflected the relative risk of the revenues and current market conditions (unobservable inputs - Level 3).
We perform our annual trademarks impairment testing during the fourth quarter, or on a more frequent basis if there are indications of potential impairment. The fair values of our trademarks are determined by applying estimated royalty rates to projected revenues, with the resulting amount discounted at a rate of return that reflects the relative risk of the revenues and current market conditions (fair value based on unobservable inputs - Level 3, as defined above). Based on our annual impairment testing during the fourth quarter of 2016, we recorded an impairment charge associated with Heat Transfer’s trademarks of $2.2. In addition, we recorded impairment charges of $4.0 during the first quarter of 2016 associated with Heat Transfer’s trademarks.
Valuation MethodologiesMethods Used to Measure Fair Value on a Recurring Basis
Derivative Financial Instruments— Our financial derivative assets and liabilities include commodity contracts (until the sale of Transformer Solutions), interest rate swaps, and FX forward contracts, FX embedded derivatives and commodity contracts, valued using valuation models based on observable market inputs such as forward rates, interest rates, our own credit risk and the credit risk of our counterparties, which comprise investment-grade financial institutions. Based on these inputs, the derivative assets and liabilities are classified within Level 2 of the valuation hierarchy. We have not made any adjustments to the inputs obtained from the independent sources. Based on our continued ability to enter into forward contracts, we consider the markets for our fair value instruments active. We primarily use the income approach, which uses valuation techniques to convert future amounts to a single present amount.
As of December 31, 2017,2021, there had been no significant impact to the fair value of our derivative liabilities due to our own credit risk, as the related instruments are collateralized under our senior credit facilities. Similarly, there had been no significant impact to the fair value of our derivative assets based on our evaluation of our counterparties’ credit risks.
Equity Security - We estimate the fair value of an equity security that we hold utilizing a practical expedient under existing guidance, with such estimated fair value based on our ownership percentage applied to the net asset value of the investee as presented in the investee’s most recent audited financial statements.
During the years ended December 31, 2021, 2020 and 2019, we recorded gains of $11.8, $8.6 and $7.9, respectively, to “Other income (expense), net” related to increases in the estimated fair value of such equity security. In addition, we received distributions during 2020 and 2019 of $3.5 and $2.6, respectively, included within “cash flows from operating activities” in our consolidated statements of cash flows. As of December 31, 2021 and 2020, the equity security had an estimated fair value of $38.8 and $27.0, respectively. We are restricted from transferring this investment without approval of the manager of the investee.
Indebtedness and Other— The estimated fair value of our debt instruments as of December 31, 20172021 and December 31, 20162020 approximated the related carrying values due primarily to the variable market-based interest rates for such instruments.
See Note 13 for further details.
(16)
(18) Quarterly Results (Unaudited)
|
| | | | | | | | | | | | | | | | | | | | | | | | | | | | | | | |
| | First (5) | | Second (5) | | Third (5) | | Fourth (5) |
| | 2017 | | 2016 | | 2017 | | 2016 | | 2017 | | 2016 | | 2017 | | 2016 |
Operating revenues (1) | $ | 340.6 |
| | $ | 360.6 |
| | $ | 349.7 |
| | $ | 371.4 |
| | $ | 348.5 |
| | $ | 345.0 |
| | $ | 387.0 |
| | $ | 395.3 |
|
Gross profit (1) | 88.1 |
| | 89.9 |
| | 76.1 |
| | 91.1 |
| | 85.1 |
| | 80.8 |
| | 80.9 |
| | 114.0 |
|
Income (loss) from continuing operations, net of tax (2) | 10.3 |
| | 20.2 |
| | (8.3 | ) | | 6.5 |
| | 22.0 |
| | 6.6 |
| | 60.0 |
| | (3.0 | ) |
Income (loss) from discontinued operations, net of tax (3) | 7.1 |
| | (6.6 | ) | | (0.7 | ) | | (3.5 | ) | | 0.3 |
| | (4.7 | ) | | (1.4 | ) | | (83.1 | ) |
| Net income (loss) | 17.4 |
| | 13.6 |
| | (9.0 | ) | | 3.0 |
| | 22.3 |
| | 1.9 |
| | 58.6 |
| | (86.1 | ) |
| Less: Net income (loss) attributable to noncontrolling interests | — |
| | 0.6 |
| | — |
| | (1.0 | ) | | — |
| | — |
| | — |
| | — |
|
| Net income (loss) attributable to SPX Corporation common shareholders | 17.4 |
| | 13.0 |
| | (9.0 | ) | | 4.0 |
| | 22.3 |
| | 1.9 |
| | 58.6 |
| | (86.1 | ) |
Adjustment related to redeemable noncontrolling interest (4) | — |
| | — |
| | — |
| | (18.1 | ) | | — |
| | — |
| | — |
| | — |
|
| Net income (loss) attributable to SPX Corporation common shareholders after adjustment related to redeemable noncontrolling interest | $ | 17.4 |
| | $ | 13.0 |
| | $ | (9.0 | ) | | $ | (14.1 | ) | | $ | 22.3 |
| | $ | 1.9 |
| | $ | 58.6 |
| | $ | (86.1 | ) |
| Basic income (loss) per share of common stock: | | | | | | | | | | | | | | | |
| Continuing operations, net of tax | $ | 0.24 |
| | $ | 0.47 |
| | $ | (0.19 | ) | | $ | (0.25 | ) | | $ | 0.51 |
| | $ | 0.16 |
| | $ | 1.41 |
| | $ | (0.07 | ) |
| Discontinued operations, net of tax | 0.17 |
| | (0.16 | ) | | (0.02 | ) | | (0.09 | ) | | 0.01 |
| | (0.12 | ) | | (0.03 | ) | | (1.99 | ) |
| Net income (loss) | $ | 0.41 |
| | $ | 0.31 |
| | $ | (0.21 | ) | | $ | (0.34 | ) | | $ | 0.52 |
| | $ | 0.04 |
| | $ | 1.38 |
| | $ | (2.06 | ) |
| Diluted income (loss) per share of common stock: | | | | | | | | | | | | | | | |
| Continuing operations, net of tax | $ | 0.24 |
| | $ | 0.47 |
| | $ | (0.19 | ) | | $ | (0.25 | ) | | $ | 0.50 |
| | $ | 0.16 |
| | $ | 1.35 |
| | $ | (0.07 | ) |
| Discontinued operations, net of tax | 0.16 |
| | (0.16 | ) | | (0.02 | ) | | (0.09 | ) | | 0.01 |
| | (0.12 | ) | | (0.03 | ) | | (1.99 | ) |
| Net income (loss) | $ | 0.40 |
| | $ | 0.31 |
| | $ | (0.21 | ) | | $ | (0.34 | ) | | $ | 0.51 |
| | $ | 0.04 |
| | $ | 1.32 |
| | $ | (2.06 | ) |
| | | | | | | | | | | | | | | | | | | | | | | | | | | | | | | | | | | | | | | | | | | | | | | |
| First (4) | | Second (4) | | Third (4) | | Fourth (4) |
| 2021 | | 2020 | | 2021 | | 2020 | | 2021 | | 2020 | | 2021 | | 2020 |
| Operating revenues | $ | 287.2 | | | $ | 254.7 | | | $ | 296.6 | | | $ | 257.3 | | | $ | 285.7 | | | $ | 267.8 | | | $ | 350.0 | | | $ | 348.3 | |
Gross profit (1) | 104.4 | | | 90.5 | | | 102.3 | | | 89.4 | | | 95.8 | | | 92.1 | | | 129.3 | | | 123.5 | |
Income from continuing operations, net of tax (1)(2) | 23.0 | | | 14.5 | | | 17.7 | | | 19.3 | | | 13.9 | | | 19.5 | | | 4.4 | | | 20.5 | |
Income from discontinued operations, net of tax (1)(3) | 3.8 | | | 8.6 | | | 44.2 | | | 8.2 | | | 316.4 | | | 3.1 | | | 2.0 | | | 5.3 | |
Net income | $ | 26.8 | | | $ | 23.1 | | | $ | 61.9 | | | $ | 27.5 | | | $ | 330.3 | | | $ | 22.6 | | | $ | 6.4 | | | $ | 25.8 | |
| Basic income per share of common stock: | | | | | | | | | | | | | | | |
| Continuing operations, net of tax | $ | 0.51 | | | $ | 0.33 | | | $ | 0.39 | | | $ | 0.43 | | | $ | 0.31 | | | $ | 0.44 | | | $ | 0.10 | | | $ | 0.46 | |
| Discontinued operations, net of tax | 0.08 | | | 0.19 | | | 0.98 | | | 0.19 | | | 6.98 | | | 0.07 | | | 0.04 | | | 0.11 | |
| Net income | $ | 0.59 | | | $ | 0.52 | | | $ | 1.37 | | | $ | 0.62 | | | $ | 7.29 | | | $ | 0.51 | | | $ | 0.14 | | | $ | 0.57 | |
| Diluted income per share of common stock: | | | | | | | | | | | | | | | |
| Continuing operations, net of tax | $ | 0.50 | | | $ | 0.32 | | | $ | 0.38 | | | $ | 0.42 | | | $ | 0.30 | | | $ | 0.42 | | | $ | 0.10 | | | $ | 0.44 | |
| Discontinued operations, net of tax | 0.08 | | | 0.19 | | | 0.95 | | | 0.18 | | | 6.78 | | | 0.07 | | | 0.04 | | | 0.12 | |
| Net income | $ | 0.58 | | | $ | 0.51 | | | $ | 1.33 | | | $ | 0.60 | | | $ | 7.08 | | | $ | 0.49 | | | $ | 0.14 | | | $ | 0.56 | |
Note: The sum of the quarters’ income per share may not equal the full year per share amounts.
| |
(1)
| During the second and fourth quarters of 2017, we determined that additional cost would be required in order to complete certain remaining portions of large power projects in South Africa. As such, we revised our estimates of revenues and costs associated with the projects. These revisions resulted in charges to “Income (loss) from continuing operations before income taxes” of $22.9 and $29.9, respectively, which is comprised of a reduction in revenue of $13.5 and $23.4, respectively, and increases in cost of products sold of $9.4 and $6.5, respectively, in the second and fourth quarters of 2017. See Notes 5 and 13 to our consolidated financial statements for additional details. |
| |
(2)
| During the first quarter of 2016, we completed the sale of our dry cooling business, resulting in a pre-tax gain of $17.9. During the second quarter of 2016, we reduced the pre-tax gain by $1.2 associated with adjustments to certain retained liabilities. During the third quarter of 2016, we increased the pre-tax gain by $1.7 associated with the working capital settlement related to the transaction. See Notes 1 and 4 for additional details. |
During the first and fourth quarters of 2016, we recorded impairment charges of $4.0 and $26.1, respectively, associated with the intangible assets of our Heat Transfer business. See Note 8 for additional details
During the second quarter of 2016, we recognized pre-tax actuarial losses of $1.8 associated with certain of our U.S. pension plans. See Note 9 for additional details.
During the third quarter of 2017, in connection with a favorable legal ruling, we reduced our unfunded liability related to postretirement benefits resulting in a pre-tax gain of $2.6. See Note 9 for additional details.
During the third quarter of 2017, we settled a contract that had been suspended and then ultimately cancelled by a customer resulting in a pre-tax gain of $10.2. See Note 5 for additional details.
(1)During the fourth quarter of 20172021, and 2016,as further discussed in Note 9, we converted the inventory accounting for certain of our businesses from the LIFO method to the FIFO method. This change in accounting has been retrospectively applied to our consolidated financial statements. Within the quarterly results presented above, and compared to what has been previously reported, we have restated gross profit, income from continuing operations, net of tax, income from discontinued operations, net of tax, and net income as follows:
| | | | | | | | | | | | | | | | | | | | | | | | | | | | | | | | | | | | | | | | | |
| First | | Second | | Third | | Fourth |
| 2021 | | 2020 | | 2021 | | 2020 | | 2021 | | 2020 | | 2020 |
| Gross profit | $ | — | | | $ | 0.5 | | | $ | 0.5 | | | $ | 0.5 | | | $ | 1.5 | | | $ | (0.2) | | | $ | 1.5 | |
| Income from continuing operations, net of tax | — | | | 0.4 | | | 0.4 | | | 0.4 | | | 1.1 | | | (0.2) | | | 1.1 | |
| Income from discontinued operations, net of tax | — | | | — | | | — | | | — | | | (2.1) | | | — | | | 0.1 | |
| Net income | — | | | 0.4 | | | 0.4 | | | 0.4 | | | (1.0) | | | (0.2) | | | 1.2 | |
(2) During the fourth quarter of 2021 and 2020, we recognized pre-tax actuarial lossesgains (losses) of $4.2$9.9 and $10.2,$(6.8), respectively, associated with our pension and postretirement benefit plans. See Note 911 for additional details.
During the fourth quarter of 2017,2021 and 2020, we recognized an income tax benefitrecorded charges of $77.6 for$46.3 ($44.6 to continuing operations and $1.7 to discontinued operations) and $19.1 ($17.0 to continuing operations and $2.1 to discontinued operations), respectively, as a worthless stock deductionresult of changes in the U.S.estimates associated with our investment in a South African subsidiary.the assets and liabilities recorded for asbestos product liability matters.
During the fourth quarter of 2021, we recorded impairment charges of $5.7 related to (i) the goodwill and indefinite-lived intangible assets of ULC ($5.2) and (ii) certain other indefinite-lived intangible assets ($0.5). See Note 10 for additional details.
(3) During the second quarter of 2021, we recorded tax benefits of $33.0 in “Income from discontinued operations, net of tax” including (i) $28.6 for the excess tax basis in the stock of Transformer Solutions and (ii) $4.4 for previously unrecognized state net operating losses, each as a result of the definitive agreement to sell the business.
As discussed in Note 1, on October 1, 2021, we completed the sale of Transformer Solutions for net cash proceeds of $620.6. In connection with the sale, we recorded a gain of $357.7 to “Gain (loss) on disposition of discontinued operations, net of tax” within our consolidated statement of operations for the third quarter 2021.
During the fourth quarter of 2017,2021, we recorded a provisional net chargeincreased the gain by $24.5, with the additional gain related primarily to the utilization of $11.8income tax benefits associated with the impact of the new corporate tax regulations that were enacted in the U.S.. See Note 10 for additional details.liquidating certain recently acquired entities.
During
In the fourth quarter of 2017,2021, and in connection with the completion of the wind-down of our DBT business, we recorded a pre-tax charge of $0.9 and a pre-tax gain of $2.7 associated with an amendment of our Credit Agreement, with the charge related$19.9 to discontinued operations to reflect the write-off of deferred financing costs andhistorical currency translation amounts associated with DBT that had been previously reported within “Stockholders’ equity.”
(4) We establish actual interim closing dates using a fiscal calendar, which requires our businesses to close their books on the gain relatedSaturday closest to the discontinuanceend of hedge accountingthe first calendar quarter, with the second and third quarters being 91 days in length. Our fourth quarter ends on our interest rate swap agreements. See Notes 11December 31. The interim closing dates for the first, second and 12 for additional details.third quarters of 2021 were April 3, July 3 and October 2, compared to the respective March 28, June 27 and September 26, 2020 dates. This practice only affects the quarterly reporting periods and not the annual reporting period. We had five more days in the first quarter of 2021 and had six fewer days in the fourth quarter of 2021 than in the respective 2020 periods.
117
| |
(3)
| During the fourth quarter of 2016, we recorded a net loss on the sale of Balcke Dürr of $78.6. During the first quarter of 2017, we reduced the net loss by $7.2. During the second quarter of 2017, we increased the net loss by $0.4. See Note 4 for additional details. |
| |
(4)
| During the second quarter of 2016, in connection with the noncontrolling interest in our South Africa subsidiary, we have reflected an adjustment of $18.1 to “Net income (loss) attributable to SPX Corporation common shareholders” for the excess redemption amount of the Put Option (i.e., the increase in the redemption amount during 2016 in excess of fair value) in our calculations of basic and diluted earnings per share (see Note 13 for additional details). |
| |
(5)
| We establish actual interim closing dates using a fiscal calendar, which requires our businesses to close their books on the Saturday closest to the end of the first calendar quarter, with the second and third quarters being 91 days in length. Our fourth quarter ends on December 31. The interim closing dates for the first, second and third quarters of 2017 are April 1, July 1 and September 30, compared to the respective April 2, July 2 and October 1, 2016 dates. This practice only affects the quarterly reporting periods and not the annual reporting period. We had two fewer days in the first quarter of 2017 and had one more day in the fourth quarter of 2017 than in the respective 2016 periods. |
ITEM 9. Changes In and Disagreements With Accountants on Accounting and Financial Disclosure
None.
ITEM 9A. Controls and Procedures
Disclosure Controls and Procedures
SPX management, including the Chief Executive Officer and Chief Financial Officer, conducted an evaluation of the effectiveness of disclosure controls and procedures, pursuant to Exchange Act Rule 13a-15(b), as of December 31, 2017.2021. Based on that evaluation, the Chief Executive Officer and Chief Financial Officer concluded that our disclosure controls and procedures are effective.were not effective as of December 31, 2021 due to the material weakness discussed below related to the accounting for asbestos-related insurance recovery assets.
Management’s Report on Internal Control Over Financial Reporting
Management is responsible for establishing and maintaining adequate internal control over financial reporting. Our internal control framework and processes were designed to provide reasonable assurance to management and the Board of Directors regarding the reliability of financial reporting and the preparation of our consolidated financial statements for external purposes in accordance with accounting principles generally accepted in the United States of America.
Our internal control over financial reporting includes those policies and procedures that:
•Pertain to the maintenance of records that, in reasonable detail, accurately and fairly reflect the transactions and dispositions of our assets;
•Provide reasonable assurance that transactions are recorded properly to allow for the preparation of financial statements in accordance with generally accepted accounting principles, and that our receipts and expenditures are being made only in accordance with authorizations of our management and the Board of Directors; and
•Provide reasonable assurance regarding prevention or timely detection of unauthorized acquisition, use, or disposition of our assets that could have a material effect on the consolidated financial statements.
Because of its inherent limitations, a system of internal control over financial reporting can provide only reasonable assurance and may not prevent or detect misstatements. Further, because of changing conditions, effectiveness of internal control over financial reporting may vary over time.
Management assessed the effectiveness of our internal control over financial reporting and concluded that, as of December 31, 2017, such internal control was effective2021, at the reasonable assurance level described above. In making this assessment, management used the criteria set forth by the Committee of Sponsoring Organizations of the Treadway Commission (“COSO”) in Internal Control - Integrated Framework (2013). Based on this assessment, our Chief Executive Officer and Chief Financial Officer concluded, given the existence of a material weakness described below, that our internal control over financial reporting was not effective as of December 31, 2021.
A material weakness is a deficiency, or a combination of deficiencies, in internal control over financial reporting such that there is a reasonable possibility that a material misstatement of the registrant’s annual or interim financial statements will not be prevented or detected on a timely basis.
As a result of its assessment, management, with the participation of our Chief Executive Officer and Chief Financial Officer, identified a deficiency in the design and operating effectiveness of our internal controls related to the insurance recovery assets associated with alleged exposure to asbestos-containing materials. While the deficiency did not cause material misstatements to the financial statements, it presented a reasonable possibility that a material misstatement to the financial statements could have occurred.
Management excluded from its assessment of internal control over financial reporting as of December 31, 2021, the internal control over financial reporting of Sealite, ECS and Cincinnati Fan, which were acquired on April 19, 2021, August 2, 2021 and December 15, 2021, respectively. This exclusion is consistent with guidance issued by the U.S. Securities and Exchange Commission that an assessment of a recently acquired business may be omitted from the scope of management's report on internal control over financial reporting in the year of acquisition. The total assets of these acquired entities (excluding goodwill and intangible assets, which are included within the scope of our assessment) represented approximately 2% of our
consolidated total assets as of December 31, 2021 and their aggregate revenues represented approximately 3% of our consolidated revenues for the year ended December 31, 2021. See a discussion of these acquisitions in Note 1 of the Notes to the Consolidated Financial Statements contained in Item 8 of this Annual Report on Form 10-K.
The effectiveness of our internal control over financial reporting as of December 31, 20172021 has been audited by Deloitte & Touche LLP, an independent registered public accounting firm, as stated in their report included in this Form 10-K.
Remediation Plan and Status
Our remediation efforts are in process as we have subsequently designed control procedures to address the material weakness. Management will, among other procedures,
•Perform a reconciliation of data used in our accounting assessments to the records of external legal counsel and third-party administrators to verify the completeness of recorded insurance recovery assets associated with alleged exposure to asbestos-containing materials.
•On a quarterly basis, monitor changes in available insurance and, to the extent there are changes, confirm all changes with the external legal counsel and third-party administrators and verify all such changes are properly reflected in the insurance availability reports.
We will implement, document policies and procedures for, and test the implementation and operating effectiveness of, the newly-designed controls in future periods. The material weakness in our internal control over financial reporting will not be considered remediated until the newly-designed controls operate for a sufficient period of time.
Changes in Internal Control Over Financial Reporting
In connection withOther than those described above, there have been no changes in the evaluation by SPX management, including the Chief Executive Officer and Chief Financial Officer, of our internal control over financial reporting pursuant to Exchange Act(as defined in Rule 13a-15(d), the changes below were identified13a‐15(d)) during the quarter ended December 31, 20172021 that have materially affected, or that are reasonably likely to materially affect, our internal control over financial reporting.
During 2017, we identified prior year financial misstatements associated with our South African subsidiary (the “Subsidiary”). These misstatements related to the accuracy and completeness of the Subsidiary’s revenues and cost of products sold under the percentage-of-completion method of accounting. Although these misstatements are not material to our consolidated financial statements in any period, the misstatements are the result of design and operating effectiveness deficiencies that existed within the Subsidiary’s internal controls environment relating to the existence of certain project-related materials, completeness of the reconciliations of recorded revenues to supporting billing
documents, and the review of the accuracy and completeness of project costs. We updated our evaluation of internal controls in the fourth quarter of 2017 and concluded that these deficiencies represented material weaknesses that existed prior to 2017.
We have remediated these material weaknesses through (i) implementation of regular physical inventory counts and the reduction of inventories in the course of project progression, (ii) improvements to the design of the revenue reconciliation process, and (iii) improvements to the effectiveness of the quarterly project reviews. These enhanced control activities contributed to our identification of the misstatements noted above.
REPORT OF INDEPENDENT REGISTERED PUBLIC ACCOUNTING FIRM
To the Shareholdersstockholders and the Board of Directors of SPX Corporation:Corporation
Opinion on Internal Control over Financial Reporting
We have audited the internal control over financial reporting of SPX Corporation and subsidiaries (the “Company”) as of December 31, 2017,2021, based on criteria established in Internal Control -— Integrated Framework (2013) issued by the Committee of Sponsoring Organizations of the Treadway Commission (COSO). In our opinion, because of the effect of the material weakness identified below on the achievement of the objectives of the control criteria, the Company has not maintained in all material respects, effective internal control over financial reporting as of December 31, 2017,2021, based on criteria established in Internal Control -— Integrated Framework (2013) issued by COSO.
We have also audited, in accordance with the standards of the Public Company Accounting Oversight Board (United States) (PCAOB), the consolidated financial statements as of and for the year ended December 31, 2017,2021, of the Company and our report dated February 21, 2018,25, 2022, expressed an unqualified opinion on those financial statements,statements.
As described in Management’s Report on Internal Control over Financial Reporting, management excluded from its assessment the internal control over financial reporting at Sealite Pty Ltd (“Sealite”), Enterprise Control Systems Ltd (“ECS”), and included an explanatory paragraph regardingCincinnati Fan & Ventilator Co., Inc. (“Cincinnati Fan”), which were acquired on April 19, 2021, August 2, 2021, and December 15, 2021, respectively, and whose aggregate total assets (excluding goodwill and intangible assets, which were integrated into the Company’s spin-off of SPX FLOW, Inc. through the distributionCompany's control environment) and aggregate revenues constitute approximately 2% and 3%, respectively, of the sharesrelated amounts in the Company's consolidated financial statements as of SPX FLOW, Inc. toand for the Company’s stockholders.year ended December 31, 2021. Accordingly, our audit did not include the internal control over financial reporting at Sealite, ECS, and Cincinnati Fan.
Basis for Opinion
The Company’s management is responsible for maintaining effective internal control over financial reporting and for its assessment of the effectiveness of internal control over financial reporting, included in the accompanying Management’s Report on Internal Control overOver Financial Reporting. Our responsibility is to express an opinion on the Company’s internal control over financial reporting based on our audit. We are a public accounting firm registered with the PCAOB and are required to be independent with respect to the Company in accordance with the U.S. federal securities laws and the applicable rules and regulations of the Securities and Exchange Commission and the PCAOB.
We conducted our audit in accordance with the standards of the PCAOB. Those standards require that we plan and perform the audit to obtain reasonable assurance about whether effective internal control over financial reporting was maintained in all material respects. Our audit included obtaining an understanding of internal control over financial reporting, assessing the risk that a material weakness exists, testing and evaluating the design and operating effectiveness of internal control based on the assessed risk, and performing such other procedures as we considered necessary in the circumstances. We believe that our audit provides a reasonable basis for our opinion.
Definition and Limitations of Internal Control over Financial Reporting
A company’s internal control over financial reporting is a process designed to provide reasonable assurance regarding the reliability of financial reporting and the preparation of financial statements for external purposes in accordance with generally accepted accounting principles. A company’s internal control over financial reporting includes those policies and procedures that (1) pertain to the maintenance of records that, in reasonable detail, accurately and fairly reflect the transactions and dispositions of the assets of the company; (2) provide reasonable assurance that transactions are recorded as necessary to permit preparation of financial statements in accordance with generally accepted accounting principles, and that receipts and expenditures of the company are being made only in accordance with authorizations of management and directors of the company; and (3) provide reasonable assurance regarding prevention or timely detection of unauthorized acquisition, use, or disposition of the company’s assets that could have a material effect on the financial statements.
Because of its inherent limitations, internal control over financial reporting may not prevent or detect misstatements. Also, projections of any evaluation of effectiveness to future periods are subject to the risk that controls may become inadequate because of changes in conditions, or that the degree of compliance with the policies or procedures may deteriorate.
Material Weakness
A material weakness is a deficiency, or a combination of deficiencies, in internal control over financial reporting, such that there is a reasonable possibility that a material misstatement of the company’s annual or interim financial statements will not be prevented or detected on a timely basis. The following material weakness has been identified and included in management's assessment: The Company identified a deficiency in the design and operating effectiveness of internal controls related to the insurance recovery assets associated with alleged exposure to asbestos-containing materials.
This material weakness was considered in determining the nature, timing, and extent of audit tests applied in our audit of the consolidated financial statements as of and for the year ended December 31, 2021, of the Company, and this report does not affect our report on such financial statements.
/s/ Deloitte & Touche LLP
Charlotte, North Carolina
February 21, 201825, 2022
ITEM 9B. Other Information
Not applicable.
ITEM 9C. Disclosure Regarding Foreign Jurisdictions that Prevent Inspections
Not applicable.
P A R T I I I
ITEM 10. Directors, Executive Officers and Corporate Governance
| |
a) | Directors of the company. |
a)Directors of the company.
This information is included in our definitive proxy statement for the 20182022 Annual Meeting of Stockholders under the heading “Election of Directors” and is incorporated herein by reference.
| |
b) | Executive Officers of the company. |
b)Executive Officers of the company.
Eugene J. Lowe, III, 49,53, President and Chief Executive Officer and a member of the Board of Directors since September 2015. Mr. Lowe joined SPX in 2008, was appointed an officer of the company in December 2014, and previously served as President, Thermal Equipment and Services from February 2013 to September 2015, President, Global Evaporative Cooling from March 2010 to February 2013, and Vice President of Global Business Development and Marketing, Thermal Equipment and Services from June 2008 to March 2010. Prior to joining SPX, Mr. Lowe held positions with Milliken & Company, Lazard Technology Partners, Bain & Company, and Andersen Consulting.
Scott W. SprouleJames E. Harris, 48,59, Vice President, Chief Financial Officer and Treasurer since September 2015.August 2020. Mr. SprouleHarris joined SPX in 2005, was appointed an officer of thefrom Elevate Textiles, Inc., a private equity portfolio company, in September 2015, and previouslywhere he served as CFO, Thermal Equipment and Services from December 2014Chief Financial Officer prior to September 2015,being promoted to interim Chief Executive Officer. Before joining Elevate in 2019, Jamie spent over ten years with Coca-Cola Consolidated, the largest independent Coca-Cola franchisee in the United States, where he served as Senior Vice President – Chief Financial Officer, and CFO, Flow Power & Energy from September 2013 to November 2014, CFO, Flow Technology from May 2012 to September 2013,subsequently Executive Vice President of Corporate Finance from July 2009 to May 2012, CFO, Test– Business Transformation and Measurement from August 2007 to July 2009, and Assistant Corporate Controller from August 2005 to August 2007. Prior to joining SPX, Mr. Sproule heldBusiness Services. His prior executive roles include senior financial positions with Corning Incorporated, Eastman Kodak Company,MedCath Corporation, Fresh Foods Inc., and PricewaterhouseCoopers.The Shelton Companies.
J. Randall Data, 52,56, President, South Africa and Global Operations since August 2015 and was appointed an officer of the company in September 2015. Prior to joining SPX, Mr. Data spent over 27 years with The Babcock & Wilcox Company. Most recently, he was President and Chief Operating Officer of Babcock & Wilcox Power Generation Group, Inc., a subsidiary of The Babcock & Wilcox Company, from April 2012 to July 2015. While at The Babcock & Wilcox Company, Mr. Data held numerous leadership positions in the global operations of the steam generating and environmental equipment businesses.
Brian G. Mason, 52, President, Transformer Solutions since January 2015 and was appointed an officer of the company in January 2017. Prior to joining SPX, Mr. Mason spent over 14 years with Emerson Electric. Most recently, he was President, Emerson Connectivity Solutions, from March 2004 to July 2014, and President, Cinch Connectivity Solutions, from July 2014 to December 2014, having led the divestiture of Emerson Connectivity Solutions and its integration with Cinch Connectors/Bel Fuse. While at Emerson Electric, Mr. Mason held leadership positions in various technology-oriented businesses. He has also held leadership roles at General Cable, Winegard, and General Electric.
John W. Nurkin, 48,52, Vice President, General Counsel and Secretary since September 2015. Mr. Nurkin joined SPX in 2005, was appointed an officer of the company in September 2015, and previously served as Segment General Counsel, Industrial Products and Services and Corporate Commercial from September 2013 to September 2015, Vice President of New Venture Development and Assistant General Counsel from January 2011 to September 2013, Segment General Counsel, Industrial Products and Services from January 2007 to January 2011, and Group General Counsel, Industrial Products and Services from October 2005 to January 2007. Prior to joining SPX, Mr. Nurkin was a partner at the law firm of Moore & Van Allen.
John W. Swann, III, 47,51, President, Weil-McLain and Marley Engineered Products since August 2013, and President, Radiodetection since September 2015.2015 and President, Heating and Location & Inspection since 2018. Mr. Swann joined SPX in 2004, was appointed an officer of the company in September 2015, and previously served as President, Hydraulic Technologies from January 2011 to August 2013, Vice President of New Venture Development from February 2010 to January 2011, and Director of Business Development from August 2004 to February 2010. Prior to joining SPX, Mr. Swann held positions with PricewaterhouseCoopers and Andersen Business Consulting.
NaTausha H. White, 46,50, Vice President and Chief Human Resources Officer since April 2015 and was appointed an officer of the company in September 2015. Ms. White returned to SPX in April 2015 after serving as the Vice President of Human Resources for Integrated Network Solutions at Harris Corporation from June 2013 to
April 2015. Prior to that, she was responsible for the Human Resources function at SPX’s Global Evaporative Cooling business from July 2012 to June 2013. From 2006 to 2012, she served in various human resources leadership positions within United Technologies Corporation. Ms. White began her career at Georgia-Pacific Corporation, spending 12 years in a variety of human resource management roles.
| |
c) | Section 16(a) Beneficial Ownership Reporting Compliance. |
Ankush Kumar,48,President, SPX Global Cooling since October of 2020. Mr. Kumar joined SPX from Gardner Denver Holdings, Inc., a global industrial manufacturer, where he led the fluid transfer equipment and liquid-ring compressor systems businesses. He also previously spent 13 years at McKinsey & Company, where his focus was growth through strategy deployment, business development and commercial performance transformation.
c)Section 16(a) Beneficial Ownership Reporting Compliance.
This information is included in our definitive proxy statement for the 20182022 Annual Meeting of Stockholders under the heading “Section“Delinquent Section 16(a) Beneficial Ownership Reporting Compliance”Reports” and is incorporated herein by reference.
d)Code of Ethics.
This information is included in our definitive proxy statement for the 20182022 Annual Meeting of Stockholders under the heading “Corporate Governance” and is incorporated herein by reference.
| |
e) | Information regarding our Audit Committee and Nominating and Governance Committee is set forth in our definitive proxy statement for the 2018 Annual Meeting of Stockholders under the headings “Corporate Governance” and “Board Committees” and is incorporated herein by reference. |
e)Information regarding our Audit Committee and Nominating and Governance Committee is set forth in our definitive proxy statement for the 2022 Annual Meeting of Stockholders under the headings “Corporate Governance” and “Board Committees” and is incorporated herein by reference.
ITEM 11. Executive Compensation
This information is included in our definitive proxy statement for the 20182022 Annual Meeting of Stockholders under the headings “Executive Compensation” and “Director Compensation” and is incorporated herein by reference.
ITEM 12. Security Ownership of Certain Beneficial Owners and Management and Related Stockholder
Matters
This information is included in our definitive proxy statement for the 20182022 Annual Meeting of Stockholders under the headings “Ownership of Common Stock” and “Equity Compensation Plan Information” and is incorporated herein by reference.
ITEM 13. Certain Relationships and Related Transactions, and Director Independence
This information is included in our definitive proxy statement for the 20182022 Annual Meeting of Stockholders under the heading “Corporate Governance” and is incorporated herein by reference.
ITEM 14. Principal Accountant Fees and Services
This information is included in our definitive proxy statement for the 20182022 Annual Meeting of Stockholders under the heading “Ratification of the Appointment of Independent Public Accountants” and is incorporated herein by reference.
P A R T I V
ITEM 15. Exhibits and Financial Statement Schedules
The following documents are filed as part of this Form 10-K:
| |
1. | All financial statements. See Index to Consolidated Financial Statements on page 50 of this Form 10-K. |
| |
2. | Financial Statement Schedules. None required. See page 50 of this Form 10-K. |
| |
3. | Exhibits. See Index to Exhibits. |
1.All financial statements. See Index to Consolidated Financial Statements on page 51 of this Form 10-K.
2.Financial Statement Schedules. None required. See page 51 of this Form 10-K.
3.Exhibits. See Index to Exhibits.
ITEM 16. Form 10-K Summary
We have chosen not to include an optional summary of the information required by this Form 10-K. For a reference to the information in this Form 10-K, investors should refer to the Table of Contents to this Form 10-K.
SIGNATURES
Pursuant to the requirements of Section 13 or 15(d) of the Securities Exchange Act of 1934, the Registrant has duly caused this report to be signed on its behalf by the undersigned, thereunto duly authorized on this 21st25th day of February, 2018.
|
| | | | | | | |
| SPX CORPORATION
(Registrant)
|
| By | /s/ SCOTT W. SPROULEJAMES E. HARRIS |
| | Scott W. Sproule
James E. Harris
Vice President, Chief Financial Officer and Treasurer |
Pursuant to the requirements of the Securities Exchange Act of 1934, this report has been signed below by the following persons on behalf of the Registrant and in the capacities indicated on this 21st25th day of February, 2018.
|
| | | | | | | |
| /s/ EUGENE J. LOWE, III | | /s/ SCOTT W. SPROULEJAMES E. HARRIS |
Eugene J. Lowe, III
President and Chief Executive Officer
| | Scott W. Sproule
James E. Harris
Vice President, Chief Financial Officer and Treasurer |
| /s/ PATRICK J. O’LEARY | | /s/ RICKY D. PUCKETT |
Patrick J. O’Leary
Director
| | Ricky D. Puckett
Director
|
| /s/ DAVID A. ROBERTS | | /s/ RUTH G. SHAW |
David A. Roberts
Director
| | Ruth G. Shaw
Director
|
| /s/ ROBERT B. TOTH | | /s/ ANGEL S. WILLIS |
Robert B. Toth
Director
| | Angel S. Willis
Director |
| /s/ MEENAL A. SETHNA | | /s/ TANA L. UTLEY |
Robert B. Toth
Meenal A. Sethna
Director
| | Tana L. Utley
Director
|
| | /s/ MICHAEL A. REILLY | | |
| | Michael A. Reilly
Chief Accounting Officer, Vice President,
Finance, and Corporate Controller
| | |
INDEX TO EXHIBITS
|
| | | | | | | |
| Item No. | | Description |
| 2.1 |
| — | |
3.12.2 |
| — | |
| 3.1 | | — | |
| 3.2 |
| — | |
| 3.3 |
| — | |
10.14.1 |
| — | |
10.2 |
| — | |
10.310.1 |
| — | |
10.4 |
| — |
| |
10.5 |
| — |
| |
10.6 |
| — |
| |
10.7 |
| — |
| Share Purchase Agreement, dated as of November 22, 2016, by and among SPX Cooling Technologies Leipzig GmbH, Marley Cooling Tower (Holdings) Limited, and SPX Mauritius Ltd. (collectively, the “Sellers,” and each a “Seller”), and mutares Holding-24 AG (“Purchaser”), and, as parent guarantor, mutares AG incorporated by reference from our Current Report on Form 8-K/A filed on January 6, 2017 (File no. 1-6948). |
10.810.2 |
| — |
| |
| 10.3 | | — | |
10.910.4 |
| — |
| |
10.1010.5 |
| — |
| |
10.1110.6 |
| — |
| |
10.1210.7 |
| — |
| Credit Agreement, dated as of September 1, 2015, among SPX Corporation, the Foreign Subsidiary Borrowers party thereto, Bank of America, N.A., as Administrative Agent, Deutsche Bank AG Deutschlandgeschäft Branch, as Foreign Trade Facility Agent, and the other agents and lenders party thereto, incorporated by reference from our Current Report on Form 8-K filed on September 2, 2015 (File no. 1-6948). |
10.1310.8 |
| — |
| First Amendment to Credit Agreement, dated as of March 20, 2017, among SPX Corporation, the Foreign Subsidiary Borrowers, the Subsidiary Guarantors, the Lenders party thereto, Deutsche Bank AG Deutschlandgeschäft Branch, as Foreign Trade Facility Agent, and Bank of America, N.A., as Administrative Agent, incorporated by reference from our Current Report on Form 8-K filed on March 22, 2017 (File no. 1-6948). |
|
| 10.9 | | | | |
10.14 |
| — |
| Second Amendment to Credit Agreement and Amendment to Guarantee and Collateral Agreement, dated as of December 19, 2017, among SPX Corporation, the Foreign Subsidiary Borrowers, the Subsidiary Guarantors, the Lenders party thereto, Deutsche Bank AG Deutschlandgeschäft Branch, as Foreign Trade Facility Agent, and Bank of America, N.A., as Administrative Agent, incorporated by reference from our Current Report on Form 8-K filed on December 20, 2017 (File no. 1-6948). |
*10.1510.10 |
| — | Third Amendment to Credit Agreement, dated as of December 17, 2019, among SPX Corporation, the Foreign Subsidiary Borrowers, the Subsidiary Guarantors, the Lenders party thereto, Deutsche Bank AG Deutschlandgeschäft Branch, as Foreign Trade Facility Agent, and Bank of America, N.A., as Administrative Agent, incorporated by reference from our Current Report on Form 8-K filed on December 18, 2019 (File no. 1-6948). |
| 10.11 | | — | |
| | | | | | | | |
| 10.12 | | — | |
*10.1610.13 |
| — | |
*10.1710.14 |
| — | |
*10.1810.15 |
| — | |
*10.1910.16 |
| — | |
*10.2010.17 |
| — | |
| *10.18 | — | |
| *10.19 | — | |
| *10.20 | — | |
| *10.21 | — | |
| *10.22 | — | |
| *10.23 | — | |
*10.2110.24 |
| — | |
*10.2210.25 |
| — | |
*10.2310.26 |
| — | |
*10.24 |
| — | |
*10.25 |
| — | |
*10.26 |
| — | |
*10.27 |
| — | |
*10.28 |
| — | |
*10.29 |
| — | |
*10.30 |
| — | |
*10.31 |
| — | |
*10.32 |
| — | |
|
| | | | |
*10.33 |
| — | |
*10.34 |
| — | |
*10.35 |
| — | |
*10.36 |
| — | |
*10.3710.27 |
| — | |
10.38*10.28 |
| — | |
*10.3910.29 |
| — | |
*10.4010.30 |
| — | |
*10.4110.31 |
| — | |
| | | | | | | | |
10.42*10.32 |
| — | |
10.43*10.33 |
| — | |
10.44*10.34 |
| — | |
*10.4510.35 |
| — | |
*10.4610.36 |
| — | |
10.47*10.37 |
| — | |
*10.4810.38 |
| — | |
*10.4910.39 |
| — | |
10.50*10.40 |
| — | |
*10.5110.41 |
| — | |
*10.5210.42 |
| — | |
*10.5310.43 |
| — | |
*10.5410.44 |
| — | |
*10.5510.45 |
| — |
| |
|
| *10.46 | | | | |
*10.56 |
| — |
| |
21.1*10.47 |
| — |
| |
23.1*10.48 |
| — |
| |
| | |
| 18.1 | | — | |
| 21.1 | | — | |
| 23.1 | | — | |
24.131.1 |
| — |
| |
31.1 |
| — |
| |
| 31.2 |
| — |
| |
| 32.1 |
| — |
| |
101.1101.INS |
— | —Inline XBRL Instance Document (the instance document does not appear in the Interactive Data File because its XBRL tags are embedded within the Inline XBRL document) |
| 101.SCH |
— | Inline XBRL Taxonomy Extension Schema Document |
SPX Corporation financial information from its Form 10-K for | | | | | | | | |
| 101.CAL | — | Inline XBRL Taxonomy Extension Calculation Linkbase Document |
| 101.DEF | — | Inline XBRL Taxonomy Extension Definitions Linkbase Document |
| 101.LAB | — | Inline XBRL Taxonomy Extension Label Linkbase Document |
| 101.PRE | — | Inline XBRL Taxonomy Extension Presentation Linkbase Document |
| 104.1 | | — | Cover Page Interactive Data File (formatted as Inline XBRL and contained in the fiscal year ended December 31, 2017, formatted in XBRL, including: (i) Consolidated Statements of Operations for the years ended December 31, 2017, 2016 and 2015; (ii) Consolidated Statements of Comprehensive Income (Loss) for the years ended December 31, 2017, 2016 and 2015; (iii) Consolidated Balance SheetsInteractive Data File submitted as of December 31, 2017 and 2016; (iv) Consolidated Statements of Equity for the years ended December 31, 2017, 2016 and 2015; (v) Consolidated Statements of Cash Flows for the years ended December 31, 2017, 2016 and 2015; and (vi) Notes to Consolidated Financial Statements.(Exhibit 101.1) |
* Denotes management contract or compensatory plan or arrangement.