UNITED STATES SECURITIES AND EXCHANGE COMMISSION
Washington, D.C. 20549
Form 10-K
|
| | |
| þ | | ANNUAL REPORT PURSUANT TO SECTION 13 OR 15(d) OF THE SECURITIES EXCHANGE ACT OF 1934 For the fiscal year ended December 31, 20112014 |
| OR |
| o | | TRANSITION REPORT PURSUANT TO SECTION 13 OR 15(d) OF THE SECURITIES EXCHANGE ACT OF 1934 For the transition period from to |
Commission file number 1-6402-1
Service Corporation International
(Exact name of registrant as specified in its charter)
|
| | |
| Texas | | 74-1488375 |
(State or other jurisdiction of incorporation or organization) | | (I.R.S. employer identification no.) |
1929 Allen Parkway Houston, Texas (Address of principal executive offices) | | 77019 (Zip code) |
Registrant’s telephone number, including area code:
713-522-5141
Securities registered pursuant to Section 12(b) of the Act:
|
| | |
| Title of Each Class | | Name of Each Exchange on Which Registered |
| Common Stock ($1 par value) | | New York Stock Exchange |
Securities registered pursuant to Section 12(g) of the Act:
None
Indicate by check mark if the registrant is a well-known seasoned issuer, as defined in Rule 405 of the Securities Act. Yes þ No o
Indicate by check mark if the registrant is not required to file reports pursuant to Section 13 or Section 15(d) of the Act. Yes o No þ
Indicate by check mark whether the registrant (1) has filed all reports required to be filed by Section 13 or 15(d) of the Securities Exchange Act of 1934 during the preceding 12 months (or for such shorter period that the registrant was required to file such reports), and (2) has been subject to such filing requirements for the past 90 days. Yes þ No o
Indicate by check mark whether the registrant has submitted electronically and posted on its corporate Web site, if any, every Interactive Data File required to be submitted and posted pursuant to Rule 405 of Regulation S-T (§ 232.405 of this chapter) during the preceding 12 months (or for such shorter period that the registrant was required to submit and post such files.files). Yes þ No o
Indicate by check mark if disclosure of delinquent filers pursuant to Item 405 of Regulation S-K is not contained herein, and will not be contained, to the best of registrant’s knowledge, in definitive proxy or information statements incorporated by reference in Part III of this Form 10-K or any amendment to this Form 10-K. þ
Indicate by check mark whether the registrant is a large accelerated filer, an accelerated filer, a non-accelerated filer, or a smaller reporting company. See the definitions of “large accelerated filer,” “accelerated filer” and “smaller reporting company” in Rule 12b-2 of the Exchange Act. (Check one):
|
| | |
Large accelerated filer þ | | Accelerated filer o |
Non-accelerated filer o (Do not check if a smaller reporting company) | | Smaller Reporting company o |
Indicate by check mark whether the registrant is a shell company (as defined in the Securities Exchange Act of 1934 Rule 12b-2). Yes o No þ
The aggregate market value of the common stock held by non-affiliates of the registrant (assuming that the registrant’s only affiliates are its officers and directors) was $2,442,496,792$4,221,605,973 based upon a closing market price of $11.68$20.72 on June 30, 20112014 of a share of common stock as reported on the New York Stock Exchange.
The number of shares outstanding of the registrant’s common stock as of February 9, 201211, 2015 was 221,524,032202,902,489 (net of treasury shares).
DOCUMENTS INCORPORATED BY REFERENCE
Portions of the registrant’s Proxy Statement in connection with its 20122015 Annual Meeting of Stockholders (Part III).
SERVICE CORPORATION INTERNATIONAL
INDEX
|
| | | | |
| | | | Page |
|
| | | | | |
| | | | | |
| | | | | |
| | | | | |
| | | | | |
| | | | Mine Safety Disclosures | |
|
| | | | | |
| | | | | |
| | | | | |
| | | | | |
| | | | | |
| | | | | |
| | | | | |
| | | | | |
|
| | | | | |
| | | | | |
| | | | | |
| | | | | |
| | | | | |
|
| | | | | |
| |
| |
GLOSSARY
The following terms are common to the deathcare industry, are used throughout this report, and have the following meanings:
Atneed — Funeral and cemetery arrangements sold after a death has occurred.
Burial Vaults — A reinforced container intended to inhibit the subsidence of the earth and house the casket after it is placed in the ground.ground, also known as outer burial containers.
Cancellation — Termination of a preneed funeral or cemetery contract, which relieves us of the obligation to provide the goods and services included in the contract. Cancellations may be requested by the customer or be initiated by us for failure to comply with the contractual terms for payment. State or provincial laws govern the amount of refund, if any, owed to the customer.
Care Trust Corpus - The deposits and net realized capital gains and losses included in a perpetual care trust that cannot be withdrawn.
Cemetery Perpetual Care or Endowment Care Fund (ECF) — A trust fund established for the purpose of maintaining cemetery grounds and property into perpetuity.perpetuity, also referred to as a perpetual care trust. Capital gains within the perpetual care trusts are generally not distributable to us, so they are not included in our revenues. However, the capital gains increase the investable perpetual care trust assets and trust corpus, increasing the potential for higher ordinary investment income in the future. Where allowable by state, capital gains can be distributed to us and they are recognized as cemetery revenues in the period earned.
Cemetery Property — Developed lots, lawn crypts, mausoleum spaces, cremation niches, and cremation memorialization property available for sale as interment rights and undeveloped land we intend to develop.
Cemetery Property Revenue — Recognized sales of cemetery property interment rights when a minimum of 10% of the sales price has been collected and the property has been constructed and is available for interment.
Cemetery Merchandise and Services — Stone and bronze memorials, markers, merchandise installations, and burial openings and closings.
Cremation — The reduction of human remains to bone fragments by intense heat.
Cremation Memorialization — Products specifically designed to commemorate and honor the life of an individual that has been cremated. These products include funeral merchandise and cemetery property types that provide for the disposition of cremated remains such as benches, boulders, statues, ossuaries, and reefs. They also include memorial walls and books where the name of the individual is inscribed but the remains have been scattered or kept by the family.
Funeral Merchandise and Services — Professional services relating to funerals and cremations and funeral-related merchandise, including caskets, casket memorialization products, burial vaults, cremation receptacles, cremation memorialization products, and flowers.
Funeral Recognized Preneed Revenue —Funeral merchandise and travel protection sold on a preneed contract and delivered before a death has occurred.
Funeral Services Performed — The number of funeral services provided after the date of death, sometimes referred to as funeral volume.
General Agency (GA) Revenues — Commissions we receive from third-party life insurance companies for life insurance policies or annuities sold to preneed customers for the purpose of funding preneed funeral arrangements. The commission rate paid is determined based on the product type sold, the length of payment terms, and the age of the insured/annuitant.
Interment — The burial or final placement of human remains in the ground.ground, in mausoleums, in cremation niches, or cremation memorialization property.
Lawn Crypt — An underground outer burial receptacle constructed of concrete and reinforced steel, which is usually pre-installed in predetermined designated areas.
Marker — A method of identifying a deceased person in a particular burial space, crypt, niche, or niche.cremation memorialization property. Permanent burial markers are usually made of bronze granite, or stone.
Maturity — When the underlying contracted merchandise is delivered or service is performed, or merchandise is delivered, typically at death. This is the point at which preneed contracts are converted to atneed contracts (note — delivery of certain merchandise and services can occur prior to death).
Mausoleum — An above ground structure that is designed to house caskets and cremation urns.
Merchandise and Service Trust — A trust account established in accordance with state or provincial law into which we deposit the required percentage of customers' payments for preneed funeral or cemetery merchandise and services. The amounts deposited can be withdrawn only after we have completed our obligations under the preneed contract or the cancellation of the contract.
Preneed — Purchase of productscemetery property interment rights and funeral and cemetery merchandise and services prior to a death occurring.
Preneed Backlog — Future revenues from unfulfilled preneed funeral and cemetery contractual arrangements.
Preneed Cemetery Production — Sales of preneed or atneed cemetery contracts. These earnings are recorded in Deferred preneed cemetery revenues until the merchandise is delivered, the service is performed, or when a minimum of 10% of the sales price has been collected and the property has been constructed and is available for interment.
Preneed Funeral Production — Sales of preneed funeral trust-funded and insurance-funded contracts. Preneed funeral trust-funded contracts are recorded in Deferred preneed funeral revenues until the merchandise is delivered or atneed cemetery contracts.the service is performed. We do not reflect the unfulfilled preneed funeral insurance-funded contract amounts in our consolidated balance sheet. The proceeds of the life insurance policies or annuity contracts will be reflected in funeral revenues as these funerals are performed by us in the future.
Sales Average — Average revenue per funeral service performed, excluding the impact of funeral recognized preneed revenue, GA revenue, and certain other revenues.
Trust Fund Income — Recognized investment earnings from our merchandise and service and perpetual care trust investments.
As used herein, “SCI”, “Company”, “we”, “our”, and “us” refer to Service Corporation International and companies owned directly or indirectly by Service Corporation International, unless the context requires otherwise.
PART I
General
We are North America’s largest provider of deathcare products and services, with a network of funeral homes and cemeteries unequalledunequaled in geographic scale and reach. At December 31, 2011,2014, we operated 1,4231,559 funeral service locations and 374466 cemeteries (including 214258 funeral service/cemetery combination locations) in North America, which are geographically diversified across 4345 states, eight Canadian provinces, and the District of Columbia. Our funeral segment also includes operations in Germany that we intend to exit when economic valuesColumbia, and conditions are conducive to a sale.Puerto Rico. Our funeral service and cemetery operations consist of funeral service locations, cemeteries, funeral service/cemetery combination locations, crematoria, and related businesses. We sell cemetery property and funeral and cemetery productsmerchandise and services at the time of need and on a preneed basis.
History
We were incorporated in Texas in July of 1962. Our original business plan was based on efficiencies of scale, specifically reducing overhead costs by sharing resources such as embalming,preparation services, accounting, transportation, and personnel among funeral homes in a business “cluster.” After proving the plan’s effectiveness in Houston in the early 1960s, SCI set out to apply this operating strategy through the acquisition of death caredeathcare businesses in other markets. It was the beginning of a three-decade period of expansion that would create a North American network of nearly 1,400 funeral homes and cemeteries by the end of 1992. Beginning in 1993, we expanded beyond North America, acquiring major deathcare companies in Australia, the United Kingdom, and France, plus smaller holdings in other European countries and South America. By the end of 1999, our global network numbered more than 4,500 funeral service locations, cemeteries, and crematories in more than 20 countries.
During the mid to late 1990s, acquisitions of deathcare facilities became extremely competitive, resulting in increased prices for acquisitions and substantially reduced returns on invested capital. In 1999, we significantly reduced our level of acquisition activity and over the next several years implemented various initiatives to pay down debt, increase cash flow, reduce overhead costs, and increase efficiency. We divested our international businesses and many North American funeral homes and cemeteries that were either underperforming or did not fit our long-term strategy. At the same time, we began to capitalize on the strength of our network by introducing to North America the first transcontinental brand of deathcare services and products — Dignity Memorial® (See www.dignitymemorial.com). Information contained on our website is not part of this report.
In late 2006, having arrived at a position of significant financial strength and improved operating efficiency, we acquired the then second largest company in the North American deathcare industry, Alderwoods Group. By combining the two leading companies in the deathcare industry, we were able to realize more than $90 million in annual pretax cost synergies, savings, and revenue enhancement opportunities. In early 2010, we acquired the then fifth largest company in the North American deathcare industry, Keystone North America. In June of 2011, we acquired 70% of the outstanding shares of The Neptune Society, Inc. (Neptune), which is the nation's largest direct cremation organization. Subsequently, in 2013 and 2014, we acquired the remaining 30% of the outstanding shares of Neptune. In December 2013, we purchased Stewart Enterprises, Inc. (Stewart), the then second largest operator of funeral homes and cemeteries in North America.
Funeral and Cemetery Operations
Worldwide,At December 31, 2014, we have 1,4351,559 funeral service locations and 374466 cemeteries (including 214258 funeral service/cemetery combination locations) covering 4345 states, eight Canadian provinces, the District of Columbia, and Germany.Puerto Rico. See Note 16 in Part II, Item 8. Financial Statements and Supplementary Data, for financial information about our business segments and geographic areas.
Our funeral service and cemetery operations consist of funeral service locations, cemeteries, funeral service/cemetery combination locations, crematoria, and related businesses. We provide all professional services relating to funerals and cremations, including the use of funeral facilities and motor vehicles and preparation and embalming services. Funeral-related merchandise, including caskets, casket memorialization products, burial vaults, cremation receptacles, cremation memorialmemorialization products, flowers, and other ancillary products and services, is sold at funeral service locations. Our cemeteries provide cemetery property interment rights, including developed lots, lawn crypts, mausoleum spaces, lots,cremation niches, and lawn crypts,cremation memorialization property and sell cemetery-related merchandise and services, including stone and bronze memorials, markers, merchandise installations, flowers, and burial openings and closings.
We also sell preneed cemetery property interment rights and funeral and cemetery productsmerchandise and services whereby a customer contractually agrees to the terms of certain products and services to be delivered and performed in the future. We define these sales as preneed sales. As a result of such preneed sales, our backlog of unfulfilled preneed funeral and preneed cemetery contracts was $6.9$9.3 billion and $6.8$9.2 billion at December 31, 20112014 and 2010,2013, respectively.
Funeral service/cemetery combination locations are those businesses in which a funeral service location is physically located within or adjoining a cemetery that we own. Combination locations allow certain facility, personnel, and equipment costs to be
shared between the funeral service location and cemetery. Such combination facilities typically can be more cost competitive and
have higher gross margins than if the funeral and cemetery operations were operated separately. Combination locations also create synergies between funeral and cemetery preneed sales force personnel and give families added convenience to purchase both funeral and cemetery productsmerchandise and services at a single location. WithWe have the acquisitionlargest number of Alderwoods, we acquiredcombination locations in North America. Fifty-five percent of our cemeteries are part of a combination location. Our combination operations include Rose Hills, which is the largest combination operation in the United States, performing over 4,500 funeral services and 8,0007,800 cemetery interments per year.
In 20112014 our operations in the United States and Canada were organized into 2930 major markets, 4750 metro markets, and 7873 main street markets. Each market is led by a market manager or director with responsibility for funeral and/or cemetery operations and preneed sales. Within each market, the funeral homes and cemeteries share common resources such as personnel, preparation services, and vehicles. There are four market support centers in North America to assist market directors with financial, administrative, pricing, and human resource needs. These support centers are located in Houston, Miami, New York, and Los Angeles. The primary functions of the support centers are to help facilitate the execution of corporate strategies, coordinate communication between operations and the field and corporate offices, and serve as liaisons for the implementation of policies and procedures.
The following table at December 31, 20112014 provides the number of our funeral homes and cemeteries by country, and by state, territory, or province:
| | | Country, State/Territory/Province | | Number of Funeral Homes | | Number of Cemeteries | | Total | | Number of Funeral Homes | | Number of Cemeteries | | Total |
| United States | | |
| | |
| | |
| | |
| | |
| | |
|
| Alabama | | 30 |
| | 9 |
| | 39 |
| | 38 |
| | 14 |
| | 52 |
|
| Arizona | | 35 |
| | 11 |
| | 46 |
| | 34 |
| | 11 |
| | 45 |
|
| Arkansas | | 8 |
| | — |
| | 8 |
| | 12 |
| | 3 |
| | 15 |
|
| California | | 131 |
| | 30 |
| | 161 |
| | 171 |
| | 36 |
| | 207 |
|
| Colorado | | 24 |
| | 11 |
| | 35 |
| | 25 |
| | 11 |
| | 36 |
|
| Connecticut | | 18 |
| | — |
| | 18 |
| | 19 |
| | — |
| | 19 |
|
| Delaware | | | — |
| | 1 |
| | 1 |
|
| District of Columbia | | 1 |
| | — |
| | 1 |
| | 1 |
| | — |
| | 1 |
|
| Florida | | 113 |
| | 54 |
| | 167 |
| | 132 |
| | 60 |
| | 192 |
|
| Georgia | | 38 |
| | 19 |
| | 57 |
| | 37 |
| | 21 |
| | 58 |
|
| Hawaii | | 2 |
| | 2 |
| | 4 |
| | 2 |
| | 2 |
| | 4 |
|
| Idaho | | 7 |
| | 1 |
| | 8 |
| | 6 |
| | 1 |
| | 7 |
|
| Illinois | | 46 |
| | 25 |
| | 71 |
| | 49 |
| | 24 |
| | 73 |
|
| Indiana | | 43 |
| | 9 |
| | 52 |
| | 41 |
| | 9 |
| | 50 |
|
| Iowa | | 4 |
| | 2 |
| | 6 |
| | 4 |
| | 2 |
| | 6 |
|
| Kansas | | 8 |
| | 2 |
| | 10 |
| | 9 |
| | 5 |
| | 14 |
|
| Kentucky | | 16 |
| | 3 |
| | 19 |
| | 15 |
| | 5 |
| | 20 |
|
| Louisiana | | 26 |
| | 5 |
| | 31 |
| | 27 |
| | 9 |
| | 36 |
|
| Maine | | 11 |
| | — |
| | 11 |
| | 11 |
| | — |
| | 11 |
|
| Maryland | | 14 |
| | 7 |
| | 21 |
| | 16 |
| | 13 |
| | 29 |
|
| Massachusetts | | 30 |
| | — |
| | 30 |
| | 26 |
| | — |
| | 26 |
|
| Michigan | | 36 |
| | — |
| | 36 |
| | 38 |
| | — |
| | 38 |
|
| Minnesota | | 11 |
| | 2 |
| | 13 |
| | 12 |
| | 2 |
| | 14 |
|
| Mississippi | | 20 |
| | 2 |
| | 22 |
| | 17 |
| | 4 |
| | 21 |
|
| Missouri | | 20 |
| | 5 |
| | 25 |
| | 26 |
| | 9 |
| | 35 |
|
| Nebraska | | 2 |
| | — |
| | 2 |
| | 4 |
| | 2 |
| | 6 |
|
| Nevada | | 14 |
| | 6 |
| | 20 |
| | 13 |
| | 6 |
| | 19 |
|
| New Hampshire | | 6 |
| | — |
| | 6 |
| | 6 |
| | — |
| | 6 |
|
| New Jersey | | 21 |
| | — |
| | 21 |
| | 21 |
| | — |
| | 21 |
|
| New Mexico | | | 1 |
| | — |
| | 1 |
|
| New York | | 88 |
| | — |
| | 88 |
| | 87 |
| | — |
| | 87 |
|
| North Carolina | | 47 |
| | 11 |
| | 58 |
| | 59 |
| | 17 |
| | 76 |
|
| Ohio | | 43 |
| | 11 |
| | 54 |
| | 43 |
| | 13 |
| | 56 |
|
| Oklahoma | | 14 |
| | 7 |
| | 21 |
| | 14 |
| | 7 |
| | 21 |
|
| Oregon | | 12 |
| | 3 |
| | 15 |
| | 18 |
| | 4 |
| | 22 |
|
| Pennsylvania | | 23 |
| | 17 |
| | 40 |
| | 22 |
| | 16 |
| | 38 |
|
| Rhode Island | | 4 |
| | — |
| | 4 |
| |
| South Carolina | | 6 |
| | 5 |
| | 11 |
| |
| Tennessee | | 34 |
| | 14 |
| | 48 |
| |
| Texas | | 144 |
| | 55 |
| | 199 |
| |
| Utah | | 3 |
| | 3 |
| | 6 |
| |
| Vermont | | 4 |
| | — |
| | 4 |
| |
| Puerto Rico | | | 12 |
| | 9 |
| | 21 |
|
| | | Rhode Island | | | 4 |
| | — |
| | 4 |
|
| South Carolina | | | 9 |
| | 9 |
| | 18 |
|
| Tennessee | | | 40 |
| | 18 |
| | 58 |
|
| Texas | | | 162 |
| | 61 |
| | 223 |
|
| Utah | | | 4 |
| | 3 |
| | 7 |
|
| Vermont | | | 4 |
| | — |
| | 4 |
|
| Virginia | | 31 |
| | 12 |
| | 43 |
| | 39 |
| | 23 |
| | 62 |
|
| Washington | | 45 |
| | 15 |
| | 60 |
| | 44 |
| | 13 |
| | 57 |
|
| West Virginia | | 3 |
| | 6 |
| | 9 |
| | 14 |
| | 10 |
| | 24 |
|
| Wisconsin | | 15 |
| | — |
| | 15 |
| | — |
| | 3 |
| | 3 |
|
| Canada | | |
| | |
| | |
| | |
| | |
| | |
|
| Alberta | | 10 |
| | — |
| | 10 |
| | 9 |
| | — |
| | 9 |
|
| British Columbia | | 34 |
| | 7 |
| | 41 |
| | 37 |
| | 7 |
| | 44 |
|
| Manitoba | | 4 |
| | 3 |
| | 7 |
| | 4 |
| | 3 |
| | 7 |
|
| New Brunswick | | 5 |
| | — |
| | 5 |
| | 5 |
| | — |
| | 5 |
|
| Nova Scotia | | 12 |
| | — |
| | 12 |
| | 11 |
| | — |
| | 11 |
|
| Ontario | | 47 |
| | — |
| | 47 |
| | 46 |
| | — |
| | 46 |
|
| Quebec | | 45 |
| | — |
| | 45 |
| | 44 |
| | — |
| | 44 |
|
| Saskatchewan | | 15 |
| | — |
| | 15 |
| | 15 |
| | — |
| | 15 |
|
| Germany | | 12 |
| | — |
| | 12 |
| |
| Total | | 1,435 |
| | 374 |
| | 1,809 |
| |
Total (1) | | | 1,559 |
| | 466 |
| | 2,025 |
|
(1) Includes businesses held for sale at December 31, 2014.
We believe we have satisfactory title to the properties owned and used in our business, subject to various liens, encumbrances, and easements that are incidental to ownership rights and uses and do not materially detract from the value of the property. We also lease a number of facilities that we use in our business under both capital and operating leases.
At December 31, 2011,2014, we owned approximately 89%88% of the real estate and buildings used at our facilities, and the remainder of the facilities were leased. At December 31, 2011,2014, our 374466 cemeteries contained a total of approximately 26,54033,270 acres, of which approximately 60% was developed.
A map of our locations in North America is presented below:
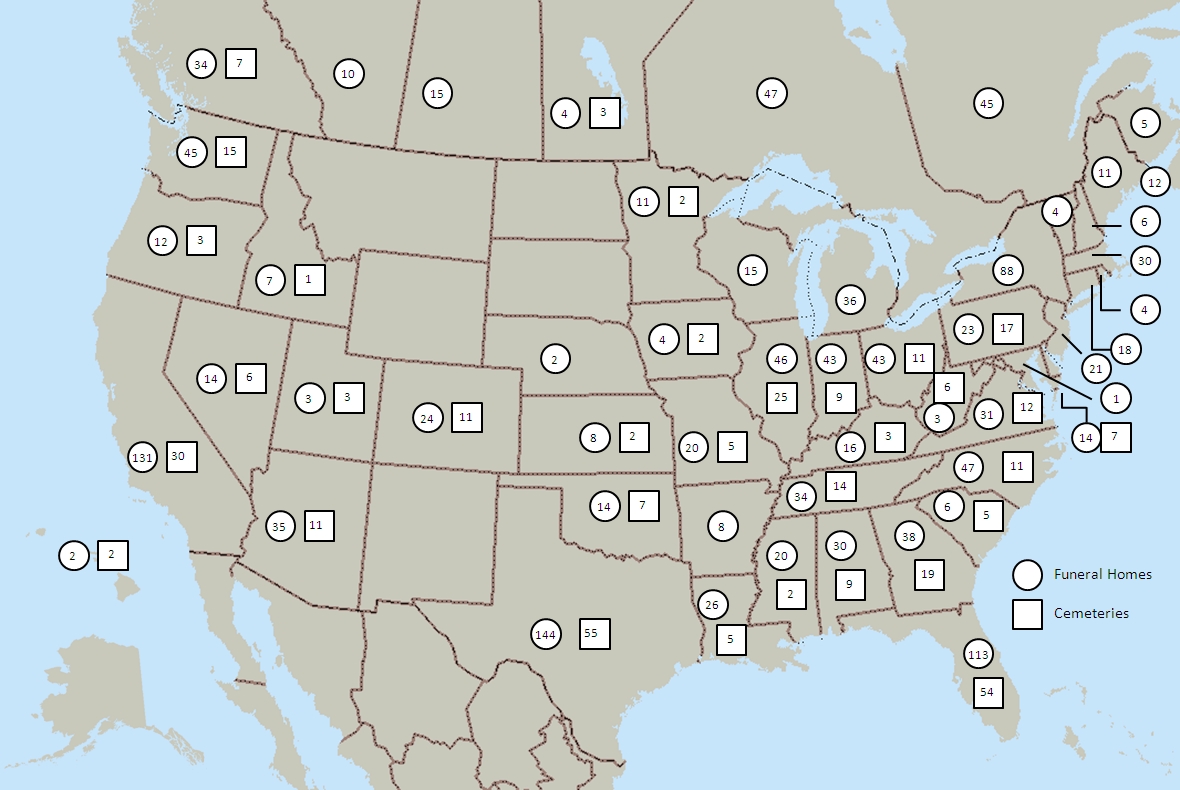
7
Competition
Although there are several public companies that own funeral homes and cemeteries, the majority of deathcare businesses
in North America are locally-owned, independent operations. We estimate that our funeral and cemetery market share in North America is approximately 13%16% based on estimated total industry revenues. The position of a single funeral home or cemetery in any community is a function of the name, reputation, and location of that funeral home or cemetery, although competitive pricing, professional service and attention, and well-maintained locations are also important.
We believe we have an unparalleled network of funeral service locations and cemeteries that offer high-quality products and services at prices that are competitive with local competing funeral homes, cemeteries, and retail locations. Within this network, the funeral service locations and cemeteries operate under various names as most operations were acquired as existing businesses. We have co-branded our funeral operations in North America under the name Dignity Memorial®. We believe our transcontinental branding strategy gives us a strategic advantage and identity in the industry. While this branding process is intended to emphasize our seamless national network of funeral service locations and cemeteries, the original names associated with acquired operations, and their inherent goodwill and heritage, generally remain the same. For example, Geo. H. Lewis & Sons Funeral Directors is now Geo. H. Lewis & Sons Funeral Directors, a Dignity Memorial® provider.
Strategies for Growth
We believe we are well-positioned for long-term profitable growth. We are the largest company in the North American deathcare industry with unparalleled scale on both a national and local basis and are poised to benefit from the aging of America. The demographic landscape is driving our company strategy. According to the United States Census Bureau, the current number of Americans that are 60 and older is approximately 67 million. This number is expected to grow to more than 77 million by 2020, resulting in a growing number of people that will likely be interested in preneed options.
We have demonstrated that we can generate significant and consistent cash flow, even in difficult economic times. This, coupled with our financial position and liquidity, allows usthree core strategies designed to deploy our available free cash flow to enhancegrow the value of the company. Our free cash flow deployment focus is centered on strategic acquisitions, share repurchases and dividends, and opportunistic debt repurchases when we believe we can reduce liquidity riskcompany and enhance shareholder value:
Grow revenues,
Leverage our near-term maturity profile.scale, and
Our strategies for growth can be categorized in three areas as follows:Deploy capital
Target Our Customer
Grow Revenues
Under our first core strategy of growing revenues, we have a three-pronged approach that is focused on the customer and consists of 1) remaining relevant to the customer, 2) growing preneed sales, and 3) managing our footprint.
Remaining Relevant to the Customer. Remaining relevant to our customer is key to generating revenue growth in a changing customer environment. We work to meet the varying needs of our customers to give them what they want. In our funeral segment, we focus on memorialization services that will be meaningful to the customer and their family members and friends. We continue to build on our extensive consumer research to market our productsoffer contemporary product and services on a preneed basis. Our strategy to combine targeted direct mail, select media advertising, seminars and the internet is generating quality preneed sales leads. During 2011, we continued toservice offerings. We also focus on enhanced trainingthe ethnic traditions and customs important to our customers. Additionally, we emphasize the simplicity and convenience of our packaged offerings.
In our cemetery segment, we have created tiers within our cemetery product offerings to provide more choices for sales managementour customers. As with our funeral home segment, we also cater to the ethnic traditions and sales counselors and also added additional sales management resources in certain markets aimed at increasing preneed sales production and sales counselor productivity.
During 2010, we updatedcustoms important to our individual location websites and our Dignity Memorial® website (www.DignityMemorial.com) to capture customers and generate preneed sales leads via the power of the internet. We now have the ability to display obituaries on our locations’ websites that allow friends and family of the deceased to check the schedule of services, write condolences, post photos or videos, and share this information through social media. In addition, those reading the obituaries have the opportunity to learn more about Dignity Memorial® and begin developing their own funeral arrangements. Similarly, we continue to enhance and develop our Dignity Planning® website at www.DignityPlanning.com, which allows customers to make end-of-life arrangements online whether direct or through a partnership with select insurance companies.
customers. We continue to develop innovative products such as recurring floral placements and testcustomized cemetery property offerings. We have also simplified the decision-making process.
Growing Our Preneed Sales. Our preneed sales program drives revenue growth now and into the future. Within our funeral segment, our preneed sales create brand awareness, grow future market share and diversify our revenue stream in a low-inflation environment. Due to our scale, our preneed sales program is not capital intensive and gives us a competitive advantage. Within our cemetery segment, we have a focus on increasing sales force productivity combined with tiered cemetery property offerings and pricing to drive current revenue growth. Our backlog of preneed funeral and cemetery revenues at the end of 2014 was approximately $9.3 billion, which bodes well for future earnings and cash flow.
Managing Our Footprint. We will continue to manage our footprint with a customer-driven focus. Within our funeral segment, we continue to pursue strategic acquisitions and to build new productsfuneral homes in areas that provide us with the potential for scale and services including eventareas with the highest return customer categories and reception services, enhanced floral offerings, a broadermarket traits. Within our cemetery merchandise program,segment, we plan to pursue strategic acquisitions to create more opportunities to sell to Baby Boomers through our customer-driven strategy. We believe our unparalleled business footprint and other relevant contemporary products and services. We are also focused on product and service offerings that appeal specificallygeographic diversity uniquely positions us to cremation customers.benefit from the aging Baby Boomer population.
Drive Operating Discipline and Leverage Our Unparalleled Scale
Our second core strategy is leveraging our unparalleled scale, which we are addressing with a three-pronged approach-1) develop our sales organization, 2) network optimization, and 3) use our scale with our preneed trust and insurance backlog. Our size and broad geographic network of businesses gives us a significant advantage in this industry.
Develop Our Sales Organization. Over the past several years, we have invested in the infrastructure and training of our sales organization. During 2015, we will focus on enhancing the productivity and effectiveness of the sales team and growing our sales counselor headcount. We believe that our scale allows us to expand our sales organization in a manner that our competitors cannot afford to replicate.
Network Optimization.We continue to drive operating discipline and leverage our scale through the standardization ofstandardizing processes and the use of key performance metrics for staffing and other operational and administrative activities.capitalizing on new technologies. We continuallyregularly examine our purchasing spend to look for waysopportunities to consolidate our supplier base, modify processes and policies for more efficient purchasing and employ metrics to manage and improve supplier performance. In Additionally, many of our accounting and administrative functions are outsourced to third-party providers, allowing for greater efficiency.
Use Our Scale with Our Preneed Trust and Insurance Backlog.2010, With our $9.3 billion backlog, we completed implementation of a major initiative pertainingbenefit from having access to cemetery maintenance, which resultedpremier financial partners in the outsourcingindustry. For our trust investments, we have access to preeminent money managers and lower fee structures, which we believe is a low risk structure that will provide us with higher returns and lower cost of routine lawn care activitiesadministration over time. We also enjoy favorable terms with our insurance provider.
Deploy Capital
Our third core strategy is to a limited number of regional vendors and improving cemetery interment efficiency. In 2011, we benefited from streamlining the preneed funeral and cemetery arrangement and record-keeping process through technological improvements.
Manage and Grow the Footprint
We are managing our network of business locations by positioning each business location to support the preferences of its local customer base, while monitoring each marketmaximize capital deployment opportunities. Our priority for changing demographics and competitive dynamics. We are also looking to optimize our portfolio through strategic market reviews. We expect to pursue selective business expansion through construction or targetedcapital deployment is 1) acquisitions of cemeteries and funeral homes with a focus on the highest return customer categories.
Employeeslocation new builds, 2) dividends, 3) share repurchases, and 4) debt repurchases.
Acquisitions and Funeral Location New Builds.As noted above, we plan to use our capital to manage our footprint by focusing on strategic acquisitions and building new funeral homes where the expected returns are attractive and exceed our weighted average cost of capital plus a risk premium.
Dividends. We expect to continue to return capital to our shareholders in the form of dividends, subject to the approval by our Board of Directors.
Share Repurchases. Absent opportunities for strategic acquisitions, we expect to continue to repurchase shares of our common stock using a value-weighted share repurchase strategy.
Debt Repurchases. We plan to actively manage our near-term liquidity profile and leverage targets through debt repurchases when market conditions are favorable to do so.
Associates
At December 31, 2011,2014, we employed 12,720 (12,691 in North America)15,442 individuals on a full-time basis and 8,171 (8,135 in North America)8,220 individuals on a part-time basis. Of the full-time employees, 12,078associates, 14,507 were employed in the funeral and cemetery operations and 642935 were employed in corporate or other overhead activities and services. All eligible employeesassociates in the United States who so elect are covered by our group health and life insurance plans. Associates covered by a collective bargaining agreement are typically covered by union health plans and are not eligible to participate in our health insurance plan. At December 31, 2014 and 2013, there were 9,022 and 9,706 associates, respectively, who had elected to participate in our group health insurance plans. Eligible employeesassociates in the United States are participants incovered by retirement plans of SCI or various subsidiaries, while international employeesassociates are covered by other SCI (or SCI subsidiary) defined or government-mandated benefit plans. Approximately 3.3%2.9% of our employees in North Americaassociates are represented by unions. Although labor disputes occur from time to time, relations with employeesassociates are generally considered favorable.
Regulation
Our funeral home operations are regulated by the Federal Trade Commission (the “FTC”) under the FTC’s Trade Regulation Rule on Funeral Industry Practices (the “Funeral Rule”), which went into effect in 1984. The Funeral Rule defines certain acts or practices as unfair or deceptive and contains certain requirements to prevent these acts or practices. The preventive measures require a funeral provider to give consumers accurate, itemized price information and various other disclosures about funeral goods and services and prohibit a funeral provider from: (1) misrepresenting legal, crematory, and cemetery requirements; (2) embalming for a fee without permission; (3) requiring the purchase of a casket for direct cremation; and (4) requiring consumers to buy certain funeral goods or services as a condition for furnishing other funeral goods or services.
Our operations are also subject to regulations,regulation, supervision, and licensing under numerous foreign, federal, state, and local laws ordinances, and regulations including extensive regulations concerning trust funds, preneed sales of funeralas well as Canadian and cemetery products and services, and various other aspects of our business. We strive to comply in all material respects with the provisions of theseprovincial laws ordinances, and regulations. Since 1984, we have operated in the United States under the Federal Trade Commission (FTC) comprehensive trade regulation rule for the funeral industry. The rule containsFor example, state laws impose licensing requirements for funeral homes and funeral directors and regulate preneed sales including our preneed trust activities. Our facilities are subject to environmental, health, and safety regulations. We take various measures in order to comply with the Funeral Rule and laws and regulations. For example, we have established and maintain policies, procedures, and practices; we engage in training of our personnel; and we carry out ongoing reviews of our compliance efforts. We believe that we are in substantial compliance with the Funeral Rule and all laws and regulations.
Federal, state, and local legislative bodies and regulatory agencies (including Canadian legislative bodies and agencies) frequently propose new laws and regulations, some of which could have a material effect on our operations and on the deathcare industry practices, including extensive price and other affirmative disclosures and imposes mandatory itemizationin general. We cannot accurately predict the outcome of funeral goods and services.any proposed legislation or regulation or the effect that any such legislation or regulation might have on us.
Other
Our corporate headquarters are located at 1929 Allen Parkway, Houston, Texas 77019. The property consists of approximately 120,000 square feet of office space and 185,000 square feet of parking space. We own and utilize an additional building located in Houston, Texas for corporate activities containing a total of approximately 38,000 square feet of office space. We also lease approximately 29,000 square feet of office space in Houston, Texas, which we utilize for corporate activities. We own a building in Jefferson, Louisiana with approximately 98,200 square feet of office space that we use, in part, for corporate activities.
We make available free of charge, on or through our website, our annual, quarterly, and current reports and any amendments to those reports, as soon as reasonably practicable after electronically filing such reports with the Securities and Exchange Commission (SEC). Our website is http://www.sci-corp.com and our telephone number is (713) 522-5141. The SEC also maintains an internet site at http://www.sec.gov that contains reports, proxy and information statements, and other information regarding issuers that file electronically. The public may read and copy any materials we file with the SEC at the SEC’s Public Reference
Room at 100 F Street, N.E., Washington, DC 20549. Information on the operation of the Public Reference Room may be obtained by calling the SEC at 1-800-SEC-0330.
Each of our Board of Directors’ standing committee charters, our Corporate Governance Guidelines, our Code of Ethics for Board Members, and our Code of Conduct for Officers and Employees are available, free of charge, through our website or, upon request, in print. We will post on our internet website all waivers to or amendments of our Code of Conduct for Officers and Employees, which are required to be disclosed by applicable law and rules of the New York Stock Exchange listing standards. Information contained on our website is not part of this report.
Cautionary Statement on Forward-Looking Statements
The statements in this Form 10-K that are not historical facts are forward-looking statements made in reliance on the safe harbor protections provided under the Private Securities Litigation Reform Act of 1995. These statements may be accompanied by words such as “believe”, “estimate”, “project”, “expect”, “anticipate”, or “predict” that convey the uncertainty of future events or outcomes. These statements are based on assumptions that we believe are reasonable; however, many important factors could cause our actual consolidated results in the future to differ materially from the forward-looking statements made herein and in any other documents or oral presentations made by, or on behalf of, the Company. These factors are discussed below. We assume no obligation to publicly update or revise any forward-looking statements made herein or any other forward-looking statements made by the Company, whether as a result of new information, future events, or otherwise.
Our affiliated funeral and cemetery trust funds own investments in equity securities, fixed income securities, and mutual funds, which are affected by market conditions that are beyond our control.
In connection with our preneed funeral and preneed cemetery merchandise and service sales, most affiliated funeral and cemetery trust funds own investments in equity securities, fixed income securities, and mutual funds. OurThe fair value of these investments, and our earnings and investment gains and losses on these equity securities and mutual funds are affected by financial market conditions that are beyond our control.
The following table summarizes our investment returns (realized and unrealized), excluding certain fees, on our trust funds for the years ended December 31:
| | | | 2011 | | 2010 | | 2009 | 2014 | | 2013 | | 2012 |
| Preneed funeral merchandise and service trust funds | 0.7 | % | | 12.3 | % | | 23.0 | % | 3.7 | % | | 16.6 | % | | 12.4 | % |
| Preneed cemetery merchandise and service trust funds | 0.7 | % | | 14.0 | % | | 27.3 | % | 3.4 | % | | 19.3 | % | | 13.4 | % |
| Perpetual care trust funds | 5.2 | % | | 13.0 | % | | 22.4 | % | 5.2 | % | | 7.6 | % | | 10.5 | % |
Generally, earnings or gains and losses on our trust investments are recognized and we withdraw cash when the underlying merchandise is delivered, service is performed, merchandise is delivered, or upon contract cancellation; however, our cemetery perpetual care trusts recognize earnings, and in certain states capital gains and losses, and we withdraw cash when we incur qualifying cemetery maintenance costs.
If the investments in our trust funds experience significant declines in 20122015 or subsequent years, there could be insufficient funds in the trusts to cover the costs of delivering servicesmerchandise and merchandiseservices or maintaining cemeteries in the future. We may be required to cover any such shortfall with cash flows from operations, which could have a material adverse effect on our financial condition, results of operations, or cash flows. For more information related to our trust investments, see Notes 4, 5, and 6 in Part II, Item 8. Financial Statements and Supplementary Data.
If the fair market value of these trusts, plus any other amount due to us upon delivery of the associated contracts, were to decline below the estimated costs to deliver the underlying products and services, we would record a charge to earnings to record a liability for the expected losses on the delivery of the associated contracts. As of December 31, 2011,2014, no such charge was required. For additional information, see Critical Accounting Policies, Recent Accounting Pronouncements, and Accounting Changesin Part II, Item 7. Management’s Discussion and Analysis of Financial Condition and Results of Operations.
We may be required to replenish our affiliated funeral and cemetery trust funds in order to meet minimum funding requirements, which would have a negative effect on our earnings and cash flow.
In certain states and provinces, we have withdrawn allowable distributable earnings including unrealized gains prior to the maturity or cancellation of the related contract. Additionally, some states have laws that either require replenishment of investment
losses under certain circumstances or impose various restrictions on withdrawals of future earnings when trust fund values drop below certain prescribed amounts. In the event of market declines that result in a decrease in trust fund value, we may be required to deposit portions or all of these amounts into the respective trusts in some future period. As of December 31, 2011,2014, we had unrealized losses of $13.1$14.6 million in the various trusts within these states. See Off-Balance Sheet Arrangements, Contractual Obligations, and Commercial and Contingent Commitments in Part II, Item 7.
Our ability to execute our strategic plan depends on many factors, some of which are beyond our control.
Our strategic plan is focused on cost managementcontinued revenue growth, leverage of scale, and the continued implementation of key revenue initiatives.capital deployment. Many of the factors that impact our ability to execute our strategic plan, such as the number of deaths and general economic conditions, are beyond our control. Changes in operating conditions, such as supply disruptions and labor disputes, could negatively impact our operations. Our inability to achieve the levels ofleverage scale to drive cost savings, productivity improvements, preneed production, or earnings growth anticipated by management could affect our financial performance. Our inability to identify acquisition candidates and to complete acquisitions, divestitures, or strategic alliances as planned or to realize expected synergies and strategic benefits could impact our financial performance. Our inability to deploy capital to maximize shareholder value could impact our financial performance. We cannot give assurance that we will be able to execute any or all of our strategic plan. Failure to execute any or all of our strategic plan could have a material adverse effect on our financial condition, results of operations, orand cash flows.
Our credit agreements contain covenants that may prevent us from engaging in certain transactions.
Our bank credit facility contains, among other things, various affirmative and negative covenants that may prevent us from engaging in certain transactions that might otherwise be considered beneficial to us. The covenants limits,limit, among other things, our and our subsidiaries’ ability to:
Incur additional indebtedness (including guarantee obligations);
Create liens on assets;
Engage in certain transactions with affiliates;
Enter into sale-leaseback transactions;
Engage in mergers, liquidations, and dissolutions;
Sell assets;
Pay dividends, distributions, and other payments in respect of our capital stock;
Purchase our capital stock in the open market;
Make investments, loans, or advances;
Repay indebtedness or amend the agreements relating thereto;
Create restrictions on our ability to receive distributions from subsidiaries; and
Change our lines of business.
Our bank credit facility requires us to maintain certain leverage and interest coverage ratios. These covenants and coverage ratios may require us to take actions to reduce our indebtedness or act in a manner contrary to our strategic plan and business objectives. In addition, events beyond our control, including changes in general economic and business conditions, may affect our ability to satisfy these covenants. A breach of any of these covenants could result in a default of our indebtedness. If an event of default (if incurredunder our bank credit facility occurs, and such event of default continues unremedied for 30 days after we receive notice of such bank credit facility default) under our bank credit facility occurs,thereof, the lenders party thereto could elect to declare all amounts outstanding thereunder, together with accrued interest, immediately due and payable. Any such declaration would also result in an event of default under our Senior Indenture governing our various senior notes. For additional information, see Liquidity and Capital Resources in Part II, Item 7. Management’s Discussion and Analysis of Financial Condition and Results of Operations and Note 10 in Part II, Item 8. Financial Statements and Supplementary Data.
If we lost the ability to use surety bonding to support our preneed funeral and preneed cemetery activities, we may be required to make material cash payments to fund certain trust funds.
We have entered into arrangements with certain surety companies whereby such companies agree to issue surety bonds on our behalf as financial assurance or as required by existing state and local regulations. The surety bonds are used for various business purposes; however, the majority of the surety bonds issued and outstanding have been issued to support our preneed funeral and cemetery activities. In the event all of the surety companies cancelledcanceled or did not renew our surety bonds, which generally
have twelve-month renewal periods, we would be required to either obtain replacement coverage or fund approximately $187.8$184.7 million into state-mandated trust accounts as of December 31, 2011.2014. There can be no assurance that we would be able to obtain replacement coverage at a similar cost or at all.
The funeral home and cemetery industry continues to be increasinglyis competitive.
In North America, the funeral home and cemetery industry is characterized by a large number of locally-owned, independent operations. To compete successfully, our funeral service locations and cemeteries must maintain good reputations and high professional standards, as well as offer attractive products and services at competitive prices. In addition, we must market the Company in such a manner as to distinguish us from our competitors. We have historically experienced price competition from independent funeral home and cemetery operators, monument dealers, casket retailers, low-cost funeral providers, and other non-traditionalnontraditional providers of servicesmerchandise and merchandise.services. If we are unable to successfully compete, our financial condition, results of operations, and cash flows could be materially adversely affected.
Increasing death benefits related to preneed funeral contracts funded through life insurance or annuity contracts may not cover future increases in the cost of providing a price-guaranteed funeral service.
We sell price-guaranteed preneed funeral contracts through various programs providing for future funeral services at prices prevailing when the agreements are signed. For preneed funeral contracts funded through life insurance or annuity contracts, we receive in cash a general agency commission that typically averages approximately 19.4%22% of the total sale from the third-party insurance company. Additionally, there iswe receive an increasing death benefit associated with the contract of approximately 1% per year to be received in cash at the time the funeral is performed. There is no guarantee that the increasing death benefit will cover future increases in the cost of providing a price-guaranteed funeral service, and any such excess cost could be materially adverse to our financial condition, results of operations, and future cash flows, revenues, and operating margins.flows.
The financial condition of third-party insurance companies that fund our preneed funeral contracts may impact our future revenues.
Where permitted, customers may arrange their preneed funeral contract by purchasing a life insurance or annuity policy from third-party insurance companies. The customer/policy holder assigns the policy benefits to our funeral home to pay for the preneed funeral contract at the time of need. If the financial condition of the third-party insurance companies were to deteriorate materially because of market conditions or otherwise, there could be an adverse effect on our ability to collect all or part of the proceeds of the life insurance policy, including the annual increase in the death benefit, whenif we fulfill the preneed contract at the time of need. Failure to collect such proceeds could have a material adverse effect on our financial condition, results of operations, orand cash flows.
Unfavorable results of litigation could have a material adverse impact on our financial statements.
As discussed in Note 12 of Part II, Item 8. Financial Statements and Supplementary Data, we are subject to a variety of claims and lawsuits in the ordinary course of our business. Adverse outcomes in some or all of the pending cases may result in significant monetary damages or injunctive relief against us, as litigation and other claims are subject to inherent uncertainties. There existsAny such adverse outcomes, in pending cases or other lawsuits that may arise in the possibility offuture, could have a material adverse impact on our financial position, cash flows, and results of operations, for the period in which the effect of an unfavorable final outcome becomes probable and reasonably estimable.cash flows.
Unfavorable publicity could affect our reputation and business.
Since our operations relate to life events involving emotional stress for our client families, our business is dependent on consumercustomer trust and confidence. Unfavorable publicity about our business generally or in relation to any specific location could affect our reputation and consumers’customers’ trust and confidence in our products and services, thereby having an adverse impact upon our sales and financial results as well as the price of our common stock.
If the number of deaths in our markets declines, our cash flows and revenues may decrease.
If the number of deaths in our markets declines, the number of funeral services and interments performed by us could decrease and our financial condition, results of operations, and cash flows could be materially adversely affected. Variations and seasonality of deaths throughout each year may also cause revenues to fluctuate between quarters or years.
If we are not able to respond effectively to changing consumer preferences, our market share, revenues, and profitability could decrease.
Future market share, revenues, and profits will depend in part on our ability to anticipate, identify, and respond to changing consumer preferences. We may not correctly anticipate or identify trends in consumer preferences, or we may identify them later than our competitors do. In addition, any strategies we may implement to address these trends may prove incorrect or ineffective.
The continuing upward trend in the number of cremations performed in North America could result in lower revenues and gross profit.
There is a continuing upward trend in the number of cremations performed in North America as an alternative to traditional funeral service dispositions. In our North American operations during 2011, 44.4%2014, 51.6% of the comparable funeral services we performed were cremation cases compared to 41.9%50.1% and 41.0%48.2% performed in 20102013 and 2009,2012, respectively. We continue to expand our cremation memorialization products and services, which have resulted in higherOur average revenues per cremationrevenue for cremations with service performed.is lower than that for traditional burials. If we are unable to continue to successfully expand our cremation memorialization products and services, and cremations remain a significant percentage of our funeral services, our financial condition, results of operations, and cash flows could be materially adversely affected.
Our funeral home and cemetery businesses are high fixed-cost businesses.
The majority of our operations are managed in groups called “markets”. Markets are geographical groups of funeral service locations and cemeteries that share common resources such as operating personnel, preparation services, clerical staff, motor vehicles, and preneed sales personnel. Personnel costs, the largest component of our operating expenses, are the cost components most beneficially affected by this grouping. We must incur many of these costs regardless of the number of funeral services or interments performed. Because we cannot necessarily decrease these costs when we experience lower sales volumes, a sales decline may cause our margin percentages to decline at a greater rate than the decline in revenues.
Regulation and compliance could have a material adverse impact on our financial results.
Our operations are subject to regulation, supervision, and licensing under numerous foreign, federal, state, and local laws, ordinances, and regulations, including extensive regulations concerning trust funds, preneed sales of funeral and cemetery products and services, and various other aspects of our business. For example, the funeral home industry is regulated at the federal level by the Federal Trade Commission, which requires funeral homes to take actions designed to protect consumers. Our facilities are also subject to stringent health, safety, and environmental regulations. Our pay practices, including wage and hour overtime pay, are subject to federal and state regulations. Violations of applicable laws could result in fines or sanctions against us.
Businesses in general are subject to the impact of recentregulation and major legislation, including healthcare reform. We may experience significant increases in costs as a result of business regulations and laws, which are beyond our control, including increases in the Patient Protection and Affordable Care Act and the Dodd-Frank Wall Street Reform and Consumer Protection Act. Many provisionscost of these complex laws could impact our business, and many of the provisions require implementation through regulations that have not yet been promulgated.healthcare. Although we do not knowseek to control increases in these costs, continued upward pressure on costs could reduce the ultimate impactprofitability of these laws, we expect such laws will increase our costs and the potential risks of failure to comply.business.
In addition, from time to time, governments and agencies propose to amend or add regulations or reinterpret existing regulations, which could increase costs and decrease cash flows. For example, foreign, federal, state, local, and other regulatory agencies have considered and may enact additional legislation or regulations that could affect the deathcare industry. These include regulations that require more liberal refund and cancellation policies for preneed sales of products and services, limit or eliminate our ability to use surety bonding, increase trust requirements, require the deposit of funds or collateral to offset unrealized losses of trusts, and/or prohibit the common ownership of funeral homes and cemeteries in the same market. If adopted by the regulatory authorities of the jurisdictions in which we operate, these and other possible proposals could have a material adverse effect on our financial condition, results of
operations, and cash flows.
Compliance with laws, regulations, industry standards, and customs concerning burial procedures and the handling and care of human remains is critical to the continued success of our business and any operations we may acquire. Litigation and regulatory proceedings regarding these issues could have a material adverse effect on our financial condition, results of operations, and cash flows. We are continually monitoring and reviewing our operations in an effort to ensure that we are in compliance with these laws, regulations, and standards and, where appropriate, taking appropriate corrective action.
Cemetery burial practice claims could have a material adverse impact on our financial results.
Our cemetery practices have evolved and improved over time. Most of our cemeteries have been operating for decades and, therefore, may have used practices and procedures that are outdated in comparison to today's standards. When cemetery disputes occur, we may be subjected to litigation and liability for improper burial practices, including (i)(1) burial practices of a different era that are judged today in hindsight as being outdated, and (ii)(2) alleged violations of our practices and procedures by one or more of our associates. In addition, since we acquired most of our cemeteries, we may be subject to litigation and liability based upon
actions or events that occurred before we acquired or managed the cemeteries. Claims or litigation based upon our cemetery burial practices could have a material adverse impact on our financial condition, results of operations, and cash flows.
A number of years may elapse before particular tax matters, for which we have established accruals, are audited and finally resolved.
The number of tax years with open tax audits varies depending on the tax jurisdiction. In the United States, the Internal Revenue Service is currently examining our tax returns for 1999 through 20052007 and various state jurisdictions are auditing years through 2010.2012. While it is often difficult to predict the final outcome or the timing of resolution of any particular tax matter, we believe that our accruals reflect the probable outcome of known tax contingencies. However, unfavorable settlement of any particular issue may reduce a deferred tax asset or require the use of cash.cash, which may have a material adverse impact to our financial statements. Favorable resolution could result in reduced income tax expense reported in the financial statements in the future. See Note 9 of Part II, Item 8. Financial Statements and Supplementary Data for additional information.
Declines in overall economic conditions beyond our control could reduce future potential earnings and cash flows and could result in future impairments to goodwill impairments.and/or other intangible assets.
In addition to an annual review, we assess the impairment of goodwill and/or other intangible assets whenever events or changes in circumstances indicate that the carrying value may be greater than fair value. Factors that could trigger an interim impairment review include, but are not limited to, a significant decline in our stock price, significant underperformance relative to historical or projected future operating results, and significant negative industry or economic trends. If these factors occur, we may have a triggering event, which could result in an impairment of our goodwill. Based on the results of our annual goodwill impairment test in 2011, we concluded that there was no impairment of our goodwill. However, ifand/or other intangible assets. If economic conditions worsen causing deterioration in our operating revenues, operating margins, and cash flows, we may have a triggering event that could result in an impairment of our goodwill.goodwill and/or other intangible assets. Our cemetery segment, which has a goodwill balance of $63.1$300.0 million as of December 31, 2011,2014, is more sensitive to market conditions and goodwill impairments because it is more reliant on preneed sales, which are impacted by customer discretionary spending. For additional information, see Critical Accounting Policies, Recent Accounting Pronouncements, and Accounting Changes in Part II, Item 7. Management’s Discussion and Analysis of Financial Condition and Results of Operations.
Any failure to maintain the security of the information relating to our customers, their loved ones, our associates, and our vendors could damage our reputation, could cause us to incur substantial additional costs and to become subject to litigation, and could adversely affect our operating results.
In the ordinary course of our business, we receive certain personal information, in both physical and electronic formats, about our customers, their loved ones, our associates, and our vendors. In addition, our on-line operations at our websites depend upon the secure transmission of confidential information over public networks, including information permitting electronic payments. We maintain substantial security measures and data backup systems to protect, store, and prevent unauthorized access to such information. Nevertheless, it is possible that computer hackers and others (through cyberattacks, which are rapidly evolving and becoming increasingly sophisticated, or by other means) might defeat our security measures in the future and obtain the personal information of customers, their loved ones, our associates, and our vendors that we hold. Further, our associates, contractors, or third parties with whom we do business may attempt to circumvent our security measures in order to misappropriate such information and may purposefully or inadvertently cause a breach, corruption, or data loss involving such information. A breach of our security measures or failure in our backup systems could adversely affect our reputation with our customers and their loved ones, our associates, and our vendors; as well as our operations, results of operations, financial condition, and cash flows; and could result in litigation against us or the imposition of penalties. Moreover, a security breach could require that we expend significant additional resources to upgrade further the security measures that we employ to guard such important personal information against cyberattacks and other attempts to access such information and could result in a disruption of our operations.
Our Canadian business exposes us to operational, economic, and currency risks.
Our Canadian operations represent a significant portion of our revenues. Our ability to successfully conduct operations in Canada is affected by many of the same risks we face in our U.S. operations, as well as unique costs and difficulties of managing Canadian operations. Our Canadian operations may be adversely affected by local laws, customs and regulations, as well as political and economic conditions. Significant fluctuations in exchange rates between the U.S. dollar and the Canadian dollar may adversely affect our results of operations and cash flows.
Our level of indebtedness could adversely affect our ability to raise additional capital to fund our operations, limit our ability to react to changes in the economy or our industry, and prevent us from fulfilling our obligations under our indebtedness.
We have a significant amount of indebtedness which could have important consequences, including the following:
it may limit our ability to obtain additional debt or equity financing for working capital, capital expenditures, acquisitions, debt service requirements, and general corporate or other purposes;
a portion of our cash flows from operations will be dedicated to the payment of principal and interest on our indebtedness, including indebtedness we may incur in the future, and will not be available for other purposes, including to finance our working capital, capital expenditures, acquisitions, and general corporate or other purposes;
it could limit our flexibility in planning for, or reacting to, changes in our business and the industry in which we operate and place us at a competitive disadvantage compared to our competitors that have less debt;
it could make us more vulnerable to downturns in general economic or industry conditions or in our business, or prevent us from carrying out activities that are important to our growth;
it could increase our interest expense if interest rates in general increase because a portion of our indebtedness, including all of our indebtedness under our senior credit facilities, bears interest at floating rates; and
it could make it more difficult for us to satisfy our obligations with respect to our indebtedness, and any failure to comply with the obligations of any of our debt instruments, including any financial and other restrictive covenants, could result in an event of default under the agreements governing our other indebtedness which, if not cured or waived, could result in the acceleration of our indebtedness.
Any of the above listed factors could materially affect our business, financial condition, results of operations, and cash flows.
In addition to our high level of indebtedness, we also have significant rental and other obligations under our operating and capital leases for funeral service locations, cemetery operating and maintenance equipment, and transportation equipment. These obligations could further increase the risks described above.
Failure to maintain effective internal control over financial reporting could adversely affect our results of operations, investor confidence and our stock price.
The accuracy of our financial reporting depends on the effectiveness of our internal control over financial reporting. Internal control over financial reporting can provide only reasonable assurance with respect to the preparation and fair presentation of financial statements and may not prevent or detect misstatements because of its inherent limitations. If we do not maintain effective internal control over financial reporting or implement controls sufficient to provide reasonable assurance with respect to the preparation and fair presentation of our financial statements, we could be unable to file accurate financial reports on a timely basis, and our results of operations, investor confidence, and stock price could be materially adversely affected.
In connection with management’s assessment of internal control over financial reporting under Section 404 of the Sarbanes-Oxley Act of 2002, as of December 31, 2014, we did not maintain effective internal control over financial reporting in relation to the compilation and review of our tax basis balance sheet and management concluded that this constitutes a material weakness. See Item 9A, Controls and Procedures, for a discussion of our internal control over financial reporting and the material weakness.
While this material weakness did not result in any material misstatement of our historical financial statements, it did result in adjustments to provision for income taxes, deferred tax assets, deferred tax liabilities, goodwill, other liabilities, income taxes, and accumulated deficit and revisions to our consolidated financial statements for fiscal years 2013 and 2012. We have revised our 2013 and 2012 financial statements in this filing, as described in Note 2 in Part II, Item 8. Financial Statements and Supplementary Data. Although we believe we are taking and previously took appropriate actions to remediate the control deficiencies we identified and to strengthen our internal control over financial reporting, we cannot assure you that we will not discover other material weaknesses in the future or that no material weakness will result from any difficulties, errors, delays, or disruptions. If the new controls we are implementing to address the material weakness do not operate effectively, if we are unsuccessful in implementing or following these new processes, or if we are otherwise unable to remediate this material weakness, we may not timely or accurately report our financial condition or results of operations. This could adversely affect investor and business partner confidence in our financial reports and our stock price.
| |
| Item 1B. | Unresolved Staff Comments. |
None.
Information regarding properties is set forth in Part I, Item 1. Business.
| |
| Item 3. | Legal Proceedings. |
Information regarding legal proceedings is set forth in Note 12 of Part II, Item 8. Financial Statements and Supplementary Data.
EXECUTIVE OFFICERS OF THE COMPANY
The following table sets forth as of February 13, 2012,2015, the name and age of each executive officer of the Company, the office held, and the year first elected an officer.
| | | Officer Name | | Age | | Position | | Year First
Became Officer | | Age | | Position | | Year First
Became Officer |
| R. L. Waltrip | | 81 |
| | Chairman of the Board | | 1962 | | 84 |
| | Chairman of the Board | | 1962 |
| Thomas L. Ryan | | 46 |
| | President and Chief Executive Officer | | 1999 | | 49 |
| | President and Chief Executive Officer | | 1999 |
| Michael R. Webb | | 53 |
| | Executive Vice President and Chief Operating Officer | | 1998 | | 56 |
| | Executive Vice President and Chief Operating Officer | | 1998 |
| J. Daniel Garrison | | 60 |
| | Senior Vice President Sales | | 1998 | |
| Eric D. Tanzberger | | | 46 |
| | Senior Vice President, Chief Financial Officer and Treasurer | | 2000 |
| Gregory T. Sangalis | | | 59 |
| | Senior Vice President, General Counsel and Secretary | | 2007 |
| Stephen M. Mack | | | 63 |
| | Senior Vice President, Operations | | 1998 |
| Sumner J. Waring, III | | | 46 |
| | Senior Vice President, Operations | | 2002 |
| Philip C. Jacobs | | 57 |
| | Senior Vice President and Chief Marketing Officer | | 2007 | | 60 |
| | Senior Vice President, Chief Marketing Officer | | 2007 |
| Stephen M. Mack | | 60 |
| | Senior Vice President Middle Market Operations | | 1998 | |
| Steven A. Tidwell | | | 53 |
| | Senior Vice President, Sales and Merchandising | | 2010 |
| Elisabeth G. Nash | | 50 |
| | Senior Vice President Operations Services | | 2004 | | 53 |
| | Senior Vice President, Operations Services | | 2004 |
| Gregory T. Sangalis | | 56 |
| | Senior Vice President General Counsel and Secretary | | 2007 | |
| Eric D. Tanzberger | | 43 |
| | Senior Vice President Chief Financial Officer and Treasurer | | 2000 | |
| Sumner J. Waring, III | | 43 |
| | Senior Vice President Operations | | 2002 | |
| Kenneth G. Myers, Jr. | | | 57 |
| | Senior Vice President, Operations | | 2014 |
| John Del Mixon, II | | | 51 |
| | Vice President, Information Technology | | 2010 |
| John H. Faulk | | 36 |
| | Vice President Business Development | | 2010 | | 39 |
| | Vice President, Business Development | | 2010 |
| Joseph A. Hayes | | 55 |
| | Vice President Ethics and Business Conduct and Assistant General Counsel | | 2007 | | 58 |
| | Vice President, Ethics and Business Conduct and Assistant General Counsel | | 2007 |
| Jane D. Jones | | 56 |
| | Vice President Human Resources | | 2005 | |
| Gerry D. Heard | | | 50 |
| | Vice President, Sales | | 2012 |
| Albert R. Lohse | | 51 |
| | Vice President Litigation and Risk Management | | 2004 | | 54 |
| | Vice President, Litigation and Risk Management | | 2004 |
| John Del Mixon, II | | 48 |
| | Vice President Information Technology | | 2010 | |
| Tammy R. Moore | | 44 |
| | Vice President and Corporate Controller | | 2010 | | 47 |
| | Vice President, Corporate Controller | | 2010 |
| Steven A. Tidwell | | 50 |
| | Vice President Main Street Market Operations | | 2010 | |
| Sarah E. Adams | | | 51 |
| | Vice President, Tax | | 2014 |
Mr. Waltrip is the founder and Chairman of the Board of SCI. He has provided invaluable leadership to the Company for over 4050 years. A licensed funeral director, Mr. Waltrip grew up in his family’s funeral business and assumed management of the firm in the 1950s. He began buying additional funeral homes in the 1960’s and achieved significant cost efficiencies through the “cluster” strategy of sharing pooled resources among numerous locations. At the end of 2011, the network he began had grown to include more than 1,700 funeral service locations and cemeteries. Mr. Waltrip took the Company public in 1969. The enterprise he began has now grown into a network of more than 2,000 locations. Mr. Waltrip holds a Bachelor’sBachelor of Business Administration degree in business administration from the University of Houston.
Mr. Ryan was electedhas been Chief Executive Officer of the Company in Februarysince 2005 and has served as President of SCI since July 2002. From 2002 to 2005, Mr. Ryan was Chief Operating Officer of SCI, and from 2000 to 2002 he was Chief Executive Officer of European operations. From the time he joined the CompanySCI in 1996 andto 2000, Mr. Ryan served in a variety of financial management roles until November 2000, when he was asked to serve as Chief Executive Officer of European Operations. In July 2002, Mr. Ryan was appointed Chief Operating Officer of SCI, a position he held until February 2005.roles. Before joining SCI, Mr. Ryan was a Certified Public Accountant with Coopers & Lybrand LLP for eight years. He holds a Bachelor’s degree inBachelor of Business Administration degree from the University of Texas at Austin. Mr. Ryan serves as Chairman of the Board of Trustees of the United Way of Greater Houston. Mr. Ryan also serves on the Board of Directors of the Greater Houston Partnership, and the Salvation Army Greater Houston Area Advisory Board. In addition, he serves on the Greater Houston Community Foundation Governing Council and the University of Texas McCombs Business School Advisory Council. Mr. Ryan is a member of the Board of Trust Managers of Weingarten Realty Investors and serves as a director of SCI and Chesapeake Energy.
Mr. Webb has been Chief Operating Officer of SCI since February 2005 and has served as Executive Vice President of SCI since July 2002. He joined the Company in 1991 when it acquired Arlington Corporation, a regional funeral and cemetery consolidator where he was thenserved as Chief Financial Officer. Prior to joining Arlington Corporation, Mr. Webb held various executive financial and development roles at Days Inns of America and Telemundo Group, Inc. In 1993, Mr. Webb joined our corporate development group, which he later led on a global basis before accepting operational responsibility for our Australian and Hispanic businesses. Prior to joining Arlington Corporation, Mr. Webb was promoted to Vice President International Corporate Development in February 1998held various executive financial and was named Executive Vice President in July 2002. In February 2005, he was promoted to Chief Operating Officer.development roles at Days Inns of America and Telemundo Group, Inc. He is a graduate of the University of Georgia, where he earned a Bachelor of Business Administration degree.
Mr. GarrisonTanzberger was appointed Senior Vice President, Chief Financial Officer in June 2006, and was named Treasurer in July 2007. He joined the Company in 1978August 1996 and worked in a series ofheld various financial management positions untilprior to being promoted to Corporate Controller in August 2002. Prior to joining the Company, Mr. Tanzberger was Assistant Corporate Controller at Kirby Marine Transportation Corporation, an inland waterway barge and tanker company. He also served at Coopers & Lybrand L.L.P. Mr. Tanzberger holds a Bachelor of Business Administration degree from the University of Notre Dame. He serves on the Board of Directors of New Orleans Medical Mission Services.
Mr. Sangalis joined the Company in 2007 as Senior Vice President, General Counsel and Secretary. In 2012, his responsibilities were expanded to include Human Resources. Mr. Sangalis previously served as Senior Vice President, Law and Administration for Team Inc., a leading provider of specialty industrial maintenance and construction services. Prior to that, Mr. Sangalis served as Managing Director and General Counsel of Main Street Equity Ventures II, a private equity investment firm, and as Senior Vice President General Counsel and Secretary for Waste Management, Inc., the leading provider of waste management services in North America. Mr. Sangalis holds a Bachelor of Business Administration degree from Indiana University and a Master of Business Administration degree from the University of Minnesota. He earned his Doctor of Jurisprudence degree from the University of Minnesota Law School where he graduated Cum Laude.
Mr. Mack was appointed Senior Vice President, Operations in February 2014 after having served as Senior Vice President, Middle Market Operations May 2004. Mr. Mack joined the Company in 1973 as a resident funeral director. In 1984, he was promotedappointed District Manager, Southeast Region. He became Vice President, Eastern Region, in 1986, then Regional President in 1992. Mr. Mack was elected to the position of Corporate Vice President in 1998 and, in August 2002, he was appointed Senior Vice President, Eastern Operations, a position he held until May 2004. He graduated from Farmingdale State University of New York.
Mr. Waring, a licensed funeral director, joined the Company in 1996 as Area Vice President of Operations when SCI acquired his family's funeral business. He was appointed President of the SoutheasternNortheast Region in 1992.1999 and President of the Pacific Region in September 2001. In 1998,September 2002, Mr. GarrisonWaring was promoted toappointed Vice President, International Operations. In 2000, Mr. Garrison becameWestern Operations, a position he held until May 2004 when he was appointed Vice President, North American Cemetery Operations, was promoted to Vice President Operations Services in August 2002, andMajor Markets Operations. He was promoted to Senior Vice President, Operations Support in February 2005. He assumed his current position as Senior Vice President Sales in February 2010.2006. In July 2008, Mr. Garrison hasWaring's responsibilities were expanded to include business development. Mr. Waring holds a Bachelor of Sciencein Business Administration degree from Stetson University, a degree in Administrative Managementmortuary science from Clemson University.
Mr. Jacobs joined SCI in 2007 as Senior Vice President and Chief Marketing Officer. Prior to joining the Company, Mr. Jacobs was employed by CompUSA as Chief Marketing Officer. Prior to that, he was employed by Publicis Worldwide as Chief Marketing Officer and prior to that held other management roles over the past 23 years at several of the nation’s top advertising agencies, as well as client-side positions. Mr. Jacobs holds a Bachelor of Science degree from the University of Tennessee and a Masters degree from Vanderbilt University.
Mr. Mack joined the Company in 1973 as a resident director after graduating from Farmingdale State University of New York. He became Vice President of the Eastern Region in 1986, and in February 1998 Mr. Mack was appointed Vice President North American Funeral Operations. Mr. Mack was promoted to Senior Vice President Eastern Operations in August 2002 and assumed the office of Senior Vice President Middle Market Operations, his current position, in May 2004.
Ms. Nash joined SCI in 2002 as Managing Director of Strategic Planning and Process Improvement. Prior to joining SCI, Ms. Nash worked for the Pennzoil Corporation and held various senior management accounting and financial positions. In 2004, Ms. Nash was promoted to Vice President Process & Technology. In 2010, Ms. Nash was named Senior Vice President Operations Services. She is a graduate of Texas A&M University, where she received a Bachelor of Business Administration degree in Accounting.
Mr. Sangalis joined the Company in 2007 as Senior Vice President, General Counsel and Secretary. He previously served as Senior Vice President, Law and Administration for Team Inc., a leading provider of specialty industrial maintenance and construction services. Prior to that, Mr. Sangalis served as Managing Director and General Counsel of Main Street Equity Ventures II, a private equity investment firm, and as Senior Vice President General Counsel and Secretary for Waste Management, Inc., the leading provider of waste management services in North America. Mr. Sangalis holds a Bachelor’s degree in Finance from Indiana University and a Master of Business Administration from the University of Minnesota. He earned his Juris Doctorate from the University of Minnesota Law School.
Mr. Tanzberger joined the Company in August 1996 as Manager of Budgets & Financial Analysis. He was promoted to Vice President Investor Relations and Assistant Corporate Controller in January 2000 and to Corporate Controller in August 2002. In 2006, Mr. Tanzberger was promoted to the position of Senior Vice President and Chief Financial Officer. In 2007, Mr. Tanzberger was appointed Treasurer. Prior to joining the Company, Mr. Tanzberger was Assistant Corporate Controller at Kirby Marine Transportation Corporation, an inland waterway barge and tanker company, from January through August 1996. Prior thereto, he was a Certified Public Accountant with Coopers & Lybrand L.L.P. for more than five years. Mr. Tanzberger is a graduate of the University of Notre Dame, where he earned a Bachelor of Business Administration degree.
Mr. Waring, a licensed funeral director, joined the Company as an Area Vice President in 1996 when we merged with his family’s funeral business. Mr. Waring was appointed Regional President of the Northeast Region in 1999 and was promoted to Regional President of the Pacific Region in September 2001. Mr. Waring was promoted to Vice President Western Operations in August 2002 and assumed the office of Vice President Major Market Operations in November 2003. In February 2006, Mr. Waring was promoted to Senior Vice President Major Market Operations. In July 2008, Mr. Waring’s responsibilities were expanded to include business development. In February 2010, Mr. Waring’s responsibilities were further expanded to include human resources. He has held his current position as Senior Vice President Operations since February 2010. Mr. Waring holds a Bachelor of Science degree in Business Administration from Stetson University, a degree in Mortuary Science from Mt. Ida College and a Master of Business Administration degree from the University of Massachusetts Dartmouth.
Mr. Faulk joined SCI in March 2010 as Vice President Business Development, to oversee the Company’s strategic growth, including mergers and acquisitions, real estate, and construction. Prior to joining the Company, Mr. Faulk worked for Bain & Company, Inc. since 2002. At Bain, he helped Fortune 500 Companies and specialty retailers identify profit growth opportunities and achieve strong operating results. He holds a Master’s degree in Business Administration from the Darden Graduate School of Business at the University of Virginia and a Bachelor’s degree in Electrical Engineering from the University of Virginia.
Mr. Hayes was appointed Vice President Ethics and Business Conduct and Assistant General Counsel in November 2007. Mr. Hayes joined the Company in 1991 as corporate counsel. He was named Managing Counsel in 1996 and Assistant General Counsel in 2005. Prior to joining SCI, Mr. Hayes practiced law in Chicago and San Diego, specializing in securities, mergers and acquisitions, and commercial transactions. He received a Bachelor’s degree in Commerce from DePaul University and earned his Juris Doctorate from the University of California at Berkeley.
Mrs. Jones joined SCI in 2003 from Dynegy, Inc., where she served as Vice President of Total Rewards. She oversees human resources, training and education, and payroll and commission services — activities that assist more than 20,000 employees in North America. Mrs. Jones was promoted to Vice President Human Resources in February 2005. She holds a Bachelor of Business Administration degree in Accounting with a minor in Finance from Southern Methodist University. She is a Certified Compensation Professional.
Mr. Lohse joined SCI in 2000 as Managing Director of Litigation and has since been involved in the resolution of major
litigation issues for the Company. Mr. Lohse was promoted to Vice President Corporate Governance in 2004 and to Vice President Litigation and Risk Management in 2007. Before joining the Company, Mr. Lohse was Managing Partner at McDade, Fogler, Maines & Lohse, where he conducted a general civil trial practice. Prior to that, he practiced tort and commercial litigation at Fulbright & Jaworski. Mr. Lohse received a Bachelor of Business Administration degree from the University of Texas and a Juris Doctorate from the University of Houston Law Center.
Mr. Mixon joined SCI in 1995 as a Project Manager in the Information Technology Department. He later served as Directeur Informatique for OGF, a former subsidiary company based in Paris, France. Most recently, he has led the Information Technology Department and the Outsourcing Management Office as Managing Director. Prior to SCI, Mr. Mixon worked for Andersen Consulting (now Accenture PLC) and served on active duty in the United States Army achieving the rank of Captain. He holds a Bachelor of Science degree in Commerce from Washington and Lee University and a Master of Science degree in Systems Management from the University of Southern California.
Mrs. Moore joined the Company in August 2002 as Manager of Financial Reporting. She was promoted to Director of Financial Reporting in 2004 and Managing Director and Assistant Controller in June 2006. In February 2010, she was promoted to Vice President and Corporate Controller and oversees all general accounting, internal and external reporting, customer service and financial planning and analysis. Prior to joining the Company, Mrs. Moore was a Certified Public Accountant with PricewaterhouseCoopers LLP for more than three years. She holds a Bachelor of Business Administration degree in Accounting from the University of Texas at San Antonio.
Mr. Tidwell joined SCI as Vice President, Main Street Market Operations in March 2010.2010 and was promoted to Senior Vice President, Sales and Merchandising in 2012. As a co-founder of Keystone North America, Inc., Mr. Tidwell served as its President and Chief Executive Officer from May of 2007 until it was acquired by SCI in March 2010. In his role, Mr. Tidwell worked closely with Keystone’s Senior Leadership Team to develop and implement organic growth strategies, as well as external growth and acquisition strategies. He began his career as a licensed Funeral Directorfuneral director and Embalmerembalmer in Nashville, Tennessee and has been actively involved in the funeral home and cemetery profession for three decades. He holds an Associate of Arts degree from John A. Gupton College and has attended executive management and leadership programs at the Harvard Business School, the Owen School of Business at Vanderbilt University, and the Center for Creative Leadership.
Each officerMs. Nash was named Senior Vice President, Operations Services in 2010, responsible for process improvement, the market support center operations and, information technology. Prior to that she was Vice President, Process Improvement and Technology, where she led the redefinition of SCI's field and home office processes and systems. Before joining SCI, Ms. Nash served in various senior management accounting and financial positions with Pennzoil Co. She holds a Bachelor of Business Administration degree from Texas A&M University.
Mr. Myers was named Senior Vice President, Operations in December 2013 and is responsible for SCI’s Main Street and Canada operations. He joined SCI after the acquisition of Stewart Enterprises in 2013 where he previously served as the Executive Vice President, Operations and Sales since 2007. In early 2006, Mr. Myers joined Stewart as a Senior Vice President and served on the Senior Executive Committee after working as a strategic consultant in 2005. Prior to joining Stewart, Mr. Myers served as the President, CEO and Director of Conrad Industries from 2001 – 2003, a public company serving the marine fabrication and construction industry located in Morgan City, Louisiana. From 1980-2001, he worked for Northrop Grumman Ship Systems (formerly Avondale Shipyards) based in New Orleans, Louisiana, and served in various senior management roles in the accounting group and as the Vice President in charge of the CompanyCompany’s largest shipbuilding program, the LPD 17 Class. Mr. Myers is elected bya graduate of Nicholls State University in Thibodaux, Louisiana, holding a Bachelor of Business Administration degree. He is a Certified Public Accountant (CPA) and a Project Management Institute (PMI) Project Management Professional (PMP). He also serves on the Boardboard of Directors and holds their office untilthe Delgado Community College Foundation in New Orleans, Louisiana.
Mr. Mixon was appointed Vice President, Information Technology in February 2010. Mr. Mixon joined SCI in 1995 as a successor is elected and qualified or until earlier death, resignation, or removalProject Manager in the manner prescribedInformation Technology Department. He later served as Directeur Informatique for OFG, a former subsidiary company based in Paris, France. He led the Information Technology Department and Outsourcing Management Office as Managing Director before being promoted to his current role. Prior to SCI, Mr. Mixon worked for Andersen Consulting (now Accenture
PLC) and served on active duty in the BylawsUnited States Army achieving the rank of Captain. He holds a Bachelor of Science degree from Washington and Lee University and a Master of Science degree from the University of Southern California.
Mr. Faulk joined SCI in March 2010 as Vice President, Business Development, to oversee the Company's strategic growth, including Mergers and Acquisitions, Real Estate, and Construction. Prior to joining the Company, Mr. Faulk worked for Bain & Company, Inc. where he helped Fortune 500 Companies and specialty retailers identify profit growth opportunities and achieve strong operating results. He holds a Master of Business Administration degree from the Darden Graduate School of Business at the University of Virginia and a Bachelor of Science degree from the University of Virginia.
Mr. Hayes was appointed Vice President, Ethics and Business Conduct/Assistant General Counsel in November 2007. Mr. Hayes joined the Company in 1991 as corporate counsel. He was named Managing Counsel in 1996 and Assistant General Counsel in 2005. Prior to joining SCI, Mr. Hayes practiced law in Chicago and San Diego, specializing in securities, mergers and acquisitions, and commercial transactions. He received a Bachelor of Science degree with highest honors from DePaul University and earned his Doctor of Jurisprudence from the University of California at Berkeley.
Mr. Heard was appointed Vice President, Sales in August 2012. Mr. Heard began his SCI career as a high school intern at a Company funeral home, where he continued to work while attending the University of Houston. In 1986, he joined our sales force as a Family Service Counselor and was promoted to the role of Sales Manager in 1989. Throughout his years with SCI, Mr. Heard was appointed to numerous leadership roles, including: Area Sales Director; Senior Vice President of Sales, Houston and Gulf Regions; Managing Director of Sales for Middle Markets; Managing Director of North America Sales; and Senior Managing Director, Major Market Sales.
Mr. Lohse was appointed Vice President, Litigation and Risk Management in August 2004. Mr. Lohse joined SCI in 2000 as Managing Director of Litigation to lead the Company in the resolution of major litigation issues, a position he held until August 2004. Before joining SCI, he was managing partner at McDade, Fogler, Maines & Lohse, where he conducted a general civil trial practice. Prior to that, Mr. Lohse practiced tort and commercial litigation at Fulbright & Jaworski. He holds a Bachelor of Business Administration degree from the University of Texas and a Doctor of Jurisprudence from the University of Houston Law Center.
Ms. Moore joined the Company in August 2002 as Manager of Financial Reporting. She was promoted to Director of Financial Reporting in 2004 and Managing Director and Assistant Controller in June 2006. In February 2010, she was promoted to Vice President, Corporate Controller and oversees all general accounting, internal and external reporting, customer service and strategic planning and analysis. Prior to joining the Company, Ms. Moore was a Certified Public Accountant with PricewaterhouseCoopers LLP for more than three years. She holds a Bachelor of Business Administration degree from the University of Texas at San Antonio.
Ms. Adams joined the Company in 2014 as Vice President, Tax. Prior to joining SCI, Ms. Adams was a Partner with Ernst & Young LLP in their Business Tax Services practice where she had 20 years of experience on a variety of public and private oil field service, engineering, manufacturing, retail and casino clients. She has extensive experience with Fortune 1000 companies, including in the areas associated with mergers and acquisitions, purchase accounting, research and development tax credits, embedded cost analysis, and IRS audits, appeals and mediation. Ms. Adams is a Certified Public Accountant and a member of the Company. Each officerAICPA. She received both her Bachelor of a subsidiaryBusiness Administration and Masters of Tax Accounting from the Company is elected by the subsidiary’s boardUniversity of directors and holds their office until a successor is elected and qualified or until earlier death, resignation, or removal in the manner prescribed in the Bylaws of the Subsidiary.Alabama.
| |
| Item 4. | Mine Safety Disclosures. |
Not applicable.
PART II
| |
| Item 5. | Market for Registrant's Common Equity, Related Stockholder Matters, and Issuer Purchases of Equity Securities |
Our common stock has been traded on the New York Stock Exchange since May 14, 1974. On December 31, 2011,2014, there were 4,0094,994 holders of record of our common stock. In calculating the number of stockholders, we consider clearing agencies and security position listings as one stockholder for each agency or listing. At December 31, 2011,2014, we had 222,955,853204,876,542 shares outstanding, net of 1,709,542591,561 treasury shares.
During 2011,In 2014 and 2013 we paid quarterly cash dividends totaling $44.8$71.5 million and accrued $11.0$57.2 million, for dividends that we subsequently paid on January 31, 2012. During 2010, we paid cash dividends totaling $40.0 million. respectively. While we intend to pay regular quarterly cash dividends for the foreseeable future, all subsequent dividends are subject to final determination by our Board of Directors each quarter after its review of our financial performance.
The table below shows our quarterly high and low closing common stock prices for the two years ended December 31:
| | | | 2011 | | 2010 | 2014 | | 2013 |
| | High | | Low | | High | | Low | High | | Low | | High | | Low |
| First quarter | $ | 11.13 |
| | $ | 8.12 |
| | $ | 9.07 |
| | $ | 7.36 |
| $ | 19.88 |
| | $ | 16.82 |
| | $ | 16.73 |
| | $ | 14.17 |
|
| Second quarter | $ | 11.90 |
| | $ | 10.81 |
| | $ | 9.48 |
| | $ | 7.29 |
| $ | 20.80 |
| | $ | 18.66 |
| | $ | 18.44 |
| | $ | 15.50 |
|
| Third quarter | $ | 12.01 |
| | $ | 8.44 |
| | $ | 8.65 |
| | $ | 7.04 |
| $ | 22.34 |
| | $ | 19.96 |
| | $ | 19.23 |
| | $ | 17.91 |
|
| Fourth quarter | $ | 10.83 |
| | $ | 8.69 |
| | $ | 8.71 |
| | $ | 7.82 |
| $ | 23.22 |
| | $ | 20.30 |
| | $ | 19.24 |
| | $ | 17.17 |
|
Options in our common stock are primarily traded on the Philadelphia Stock Exchange and the Chicago Board Options Exchange. Our common stock is traded on the New York Stock Exchange under the symbol SCI.
Stock Performance Graph.This graph assumes the total return on $100 invested on December 31, 2006,2009, in SCI Common Stock, the S&P 500 Index, and a peer group selected by the Company (the “Peer Group”). The Peer Group is comprised ofcomprises Carriage Services, Inc., Hillenbrand Inc., and Matthews International Corp., and Stewart Enterprises, Inc. Hillenbrand Inc. is included in the Peer Group starting March 31, 2008 when it was spun off from Hillenbrand Industries, Inc. Prior to the spin-off, the Peer Group included Hillenbrand Industries, Inc. Rock of Ages Corporation was included in the Peer Group until January 19, 2011 when it was acquired by Swenson Granite, LLC. Stewart Enterprises, Inc. was included in the Peer Group until December 31, 2013 when it was acquired by us. Total return data assumes reinvestment of dividends.
TOTAL STOCKHOLDER RETURNS
INDEXED RETURNS
Years Ending

21
For equity compensation plan information, see Part III of this Form 10-K.
On OctoberDecember 31, 2011,2014, we issued 1,2821,165 deferred common stock equivalents or units pursuant to provisions regarding the receipt of dividends under the Amended and Restated Director Fee Plan to four non-employee directors. These issuances were unregistered as they did not constitute a “sale” within the meaning of Section 2(3) of the Securities Act of 1933, as amended.
Since August 2004, we have repurchased a total of $1.3$1.8 billion of common stock at an average cost per share of $9.40. During$10.43. Under our share repurchase program, during the three monthsyear ended December 31, 2011,2014 we repurchased $5.1 million11,424,446 shares of our common stock at an aggregate cost of $50.7$241.7 million, including commissions (average which is an average cost per share of $9.92).$21.13. During the year ended December 31, 2013, there were no shares repurchased under our share repurchase program. In August 2011,November 2014, our Board of Directors approved an increase in our share repurchase program authorizing the investment of up to an additional $116.6$290.0 million to repurchase our common stock, bringing total authorization up to $199.4 million.$300.0 million. The remaining dollar value of shares to be purchased under the share repurchase program was $99.6$238.8 million at December 31, 2011.2014. As discussed in Item 1A, our credit agreement contains covenants that may restrict our ability to repurchase our common stock. Pursuant to the program, we repurchased shares of our common stock during the fourth quarter of 2011 as set forth in the table below:
|
| | | | | | | | | | | | | |
| Period | | Total Number of
Shares Purchased | | Average
Price Paid per Share | | Total Number
of Shares
Purchased as
Part of Publicly
Announced Programs | | Dollar Value of
Shares That
May Yet be
Purchased Under the Program |
| October 1, 2011 — October 31, 2011 | | 1,369,952 |
| | $ | 9.54 |
| | 1,369,952 |
| | 137,195,035 |
|
| November 1, 2011 — November 30, 2011 | | 1,137,148 |
| | $ | 9.96 |
| | 1,137,148 |
| | 125,870,016 |
|
| December 1, 2011 — December 31, 2011 | | 2,603,906 |
| | $ | 10.10 |
| | 2,603,906 |
| | 99,558,483 |
|
| | | 5,111,006 |
| | |
| | 5,111,006 |
| | |
|
|
| | | | | | | | | | | | | |
| Period | | Total Number of
Shares Purchased | | Average
Price Paid per Share | | Total Number
of Shares
Purchased as
Part of Publicly
Announced Programs | | Dollar Value of
Shares That
May Yet be
Purchased Under the Program |
| October 1, 2014 — October 31, 2014 | | 1,793,875 |
| | $ | 21.08 |
| | 1,793,875 |
| | 23,176,590 |
|
| November 1, 2014 — November 30, 2014 | | 1,736,361 |
| | $ | 22.02 |
| | 1,736,361 |
| | 275,201,637 |
|
| December 1, 2014 — December 31, 2014 | | 1,613,561 |
| | $ | 22.56 |
| | 1,613,561 |
| | 238,761,296 |
|
| | | 5,143,797 |
| | | | 5,143,797 |
| | |
Subsequent to December 31, 2011,2014, we repurchased an additional 1,831,9211,974,053 shares of common stockfor $45.1 million at an aggregate cost of $20.0 million including commissions (averageaverage cost per share of $10.90). In February 2012, our Board of Directors approved an increase in our share repurchase program authorizing the investment of up to an additional $119.9 million to repurchase our common stock. After this increase, the remaining dollar value of shares authorized to be purchased under our share repurchase program is approximately $199.4 million.$22.84.
| |
| Item 6. | Selected Financial Data. |
The data set forth below should be read in conjunction with our consolidated financial statements and accompanying notes to these consolidated financial statements. This historical information is not necessarily indicative of future results. The table below contains selected consolidated financial data as of and for the years ended December 31, 20072010 through December 31, 2014.
| Selected Consolidated Financial Information |
| | | | | | | | | | | | | | | | | | | |
| | Years Ended December 31, |
| | 2014 | | 2013 | | 2012 | | 2011 | | 2010 |
| | (Dollars in millions, except per share amounts) |
| Selected Consolidated Statements of Operations Data: | | | |
| | |
| | |
| | |
|
| Revenues | $ | 2,994.0 |
| | $ | 2,550.5 |
| | $ | 2,404.4 |
| | $ | 2,309.5 |
| | $ | 2,184.0 |
|
| Net income | 178.8 |
| | 152.6 |
| | 155.4 |
| | 147.3 |
| | 129.7 |
|
| Net income attributable to noncontrolling interests | (6.3 | ) | | (5.3 | ) | | (1.6 | ) | | (1.3 | ) | | (0.6 | ) |
| Net income attributable to common stockholders | 172.5 |
| | 147.3 |
| | 153.8 |
| | 146.0 |
| | 129.1 |
|
| Earnings per share: | | | |
| | |
| | |
| | |
|
| Income from continuing operations attributable to common stockholders | | | |
| | |
| | |
| | |
|
| Basic | 0.84 |
| | 0.72 |
| | 0.72 |
| | 0.63 |
| | 0.52 |
|
| Diluted | 0.82 |
| | 0.70 |
| | 0.71 |
| | 0.62 |
| | 0.51 |
|
| Net income attributable to common stockholders | | | | | | | | | |
| Basic | 0.82 |
| | 0.70 |
| | 0.71 |
| | 0.62 |
| | 0.52 |
|
| Diluted | 0.81 |
| | 0.68 |
| | 0.70 |
| | 0.62 |
| | 0.52 |
|
| Cash dividends declared per share | 0.34 |
| | 0.27 |
| | 0.23 |
| | 0.20 |
| | 0.16 |
|
| Selected Consolidated Balance Sheet Data (at December 31): | | | |
| | |
| | |
| | |
|
| Total assets | $ | 11,923.6 |
| | $ | 12,833.6 |
| | $ | 9,588.5 |
| | $ | 9,233.1 |
| | $ | 9,099.6 |
|
| Long-term debt (less current maturities), including capital leases | $ | 2,963.8 |
| | $ | 3,125.5 |
| | $ | 1,916.6 |
| | $ | 1,861.1 |
| | $ | 1,832.4 |
|
| Equity | $ | 1,377.4 |
| | $ | 1,480.2 |
| | $ | 1,415.2 |
| | $ | 1,463.3 |
| | $ | 1,529.9 |
|
| Selected Consolidated Statement of Cash Flows Data: | | | | | | | | | |
| Net cash provided by operating activities | $ | 317.4 |
| | $ | 384.7 |
| | $ | 369.2 |
| | $ | 388.1 |
| | $ | 354.4 |
|
See Note 2 of Part II, Item 8. Financial Statements and Supplementary Data for details related to the revision impacts on the financial statements as of December 31, 2013 and for each of the two years in the period ended December 31, 2013. The impacts on the selected financial data as a result of our discontinued German operations and certain deferred tax adjustments as of December 31, 2012, 2011 and 2010, and for each of the two years in the period ended December 31, 2011. are as follows:
| Selected Consolidated Financial Information |
| | | | | | | | | | | | | | | | | | | |
| | Years Ended December 31, |
| | 2011 | | 2010 | | 2009 | | 2008 | | 2007(1) |
| | (Dollars in millions, except per share amounts) |
| Selected Consolidated Statements of Operations Data: | | | |
| | |
| | |
| | |
|
| Revenue | $ | 2,316.0 |
| | $ | 2,190.6 |
| | $ | 2,053.5 |
| | $ | 2,155.6 |
| | $ | 2,285.3 |
|
| Income from continuing operations before cumulative effect of accounting changes | $ | 146.2 |
| | $ | 127.0 |
| | $ | 123.1 |
| | $ | 97.6 |
| | $ | 243.3 |
|
| (Loss) income from discontinued operations, net of tax | $ | — |
| | $ | — |
| | $ | — |
| | $ | (0.4 | ) | | $ | 4.4 |
|
| Net income | $ | 146.2 |
| | $ | 127.0 |
| | $ | 123.1 |
| | $ | 97.2 |
| | $ | 247.7 |
|
| Net income attributable to noncontrolling interests | $ | (1.3 | ) | | $ | (0.6 | ) | | $ | — |
| | $ | (0.1 | ) | | $ | — |
|
| Net income attributable to common stockholders | $ | 144.9 |
| | $ | 126.4 |
| | $ | 123.1 |
| | $ | 97.1 |
| | $ | 247.7 |
|
| Earnings per share: | | | |
| | |
| | |
| | |
|
| Income from continuing operations attributable to common stockholders | | | |
| | |
| | |
| | |
|
| Basic | $ | .62 |
| | $ | .51 |
| | $ | .49 |
| | $ | .38 |
| | $ | .85 |
|
| Diluted | $ | .62 |
| | $ | .50 |
| | $ | .49 |
| | $ | .37 |
| | $ | .83 |
|
| Net income attributable to common stockholders | | | |
| | |
| | |
| | |
|
| Basic | $ | .62 |
| | $ | .51 |
| | $ | .49 |
| | $ | .38 |
| | $ | .87 |
|
| Diluted | $ | .61 |
| | $ | .50 |
| | $ | .49 |
| | $ | .37 |
| | $ | .85 |
|
| Cash dividends declared per share | $ | .20 |
| | $ | .16 |
| | $ | .16 |
| | $ | .16 |
| | $ | .13 |
|
| Selected Consolidated Balance Sheet Data (at December 31): | | | |
| | |
| | |
| | |
|
| Total assets | $ | 9,327.8 |
| | $ | 9,190.5 |
| | $ | 8,890.9 |
| | $ | 8,110.9 |
| | $ | 8,932.2 |
|
| Long-term debt (less current maturities), including capital leases | $ | 1,861.1 |
| | $ | 1,832.4 |
| | $ | 1,840.5 |
| | $ | 1,821.4 |
| | $ | 1,820.1 |
|
| Equity | $ | 1,412.2 |
| | $ | 1,479.9 |
| | $ | 1,482.8 |
| | $ | 1,293.2 |
| | $ | 1,492.1 |
|
| Selected Consolidated Statement of Cash Flows Data: | | | |
| | |
| | |
| | |
|
| Net cash provided by operating activities | $ | 388.1 |
| | $ | 354.4 |
| | $ | 372.1 |
| | $ | 350.3 |
| | $ | 356.2 |
|
|
| | | | | | | | | | | |
| | Years Ended December 31, |
| | 2011 | | 2010 |
| | As previously reported | | As revised | | As previously reported | | As revised |
| | (Dollars in millions, except per share amounts) |
| Net income | 146.2 |
| | 147.3 |
| | 127.0 |
| | 129.7 |
|
| Net income attributable to common stockholders | 144.9 |
| | 146.0 |
| | 126.4 |
| | 129.1 |
|
| Earnings per share: | | | | | | | |
| Income from continuing operations attributable to common stockholders | | | | | | | |
| Basic | 0.62 |
| | 0.63 |
| | 0.51 |
| | 0.52 |
|
| Diluted | 0.62 |
| | 0.62 |
| | 0.50 |
| | 0.51 |
|
| Net income attributable to common stockholders | | | | | | | |
| Basic | 0.62 |
| | 0.62 |
| | 0.51 |
| | 0.52 |
|
| Diluted | 0.61 |
| | 0.62 |
| | 0.50 |
| | 0.52 |
|
| |
(1) | Results for 2007 include a $158.1 million pretax gain on redemption of securities related to our former equity investment in France. |
|
| | | | | | | | | | | | | | | | | | | | | | | |
| | Years Ended December 31, |
| | 2012 | | 2011 | | 2010 |
| | As previously reported | | As revised | | As previously reported | | As revised | | As previously reported | | As revised |
| | (Dollars in millions) |
| Total assets | $ | 9,683.6 |
| | $ | 9,588.5 |
| | $ | 9,327.8 |
| | $ | 9,233.1 |
| | $ | 9,190.5 |
| | $ | 9,190.5 |
|
| Equity | $ | 1,362.8 |
| | $ | 1,415.2 |
| | $ | 1,412.2 |
| | $ | 1,463.3 |
| | $ | 1,479.9 |
| | $ | 1,479.9 |
|
| |
| Item 7. | Management’s Discussion and Analysis of Financial Condition and Results of Operations. |
The Company
We are North America’s largest provider of deathcare products and services, with a network of funeral homes and cemeteries unequalled in geographic scale and reach. At December 31, 2014, we operated 1,559 funeral service locations and 466 cemeteries (including 258 combination locations) in North America, which are geographically diversified across 45 states, eight Canadian provinces, the District of Columbia, and Puerto Rico. Our funeral service and cemetery operations consist of funeral service locations, cemeteries, funeral service/cemetery combination locations, crematoria, and related businesses. We sell cemetery property and funeral and cemetery productsmerchandise and services at the time of need and on a preneed basis.
Our financial position is enhanced by our $9.3 billion backlog of future revenues from both trust and insurance-funded sales at December 31, 2014, which is the result of preneed funeral and cemetery sales. Preneed arrangements provide us with a current opportunity to secure future market share while deterring the customer from going to a competitor in the future. We believe it adds to the stability and predictability of our revenue and cash flows. While revenue on the majority of preneed funeral sales is deferred until the time of need, sales of preneed cemetery property interment rights provide opportunities for full current revenue recognition (to the extent we collect 10% from the customer and the property is fully developed).
We believe we have the financial strength and flexibility to reward shareholders through dividends while maintaining a prudent capital structure and pursuing new opportunities for profitable growth.
Factors affecting our operating results include: demographic trends in terms of population growth and average age, which impact death rates and number of deaths; establishing and maintaining leading market share positions supported by strong local heritage and relationships; effectively responding to increasing cremation trends by selling complementary merchandise and services and cremation memorialization cemetery property; controlling salary, merchandise costs, and other expense categories; and exercising pricing leverage related to our at-need revenues. The average revenue per funeral contract is influenced by the mix of burial and cremation services because our average cremation service revenue is approximately half of the average revenue earned from a burial service. To further enhance revenue opportunities we are developing memorialization products and services that specifically appeal to cremation customers. We believe that these additional products and services will help drive increases in the average revenue for a cremation in future periods.
For further discussion of our key operating metrics, see our Results of Operations and Cash Flow sections below.
Financial Condition, Liquidity and Capital Resources
Capital Allocation Considerations
We rely on cash flow from operations as a significant source of liquidity. Our cash flow from operating activities provided $317.4 million in 2014. In addition, as of December 31, 2014, we have $233.4 million in excess borrowing capacity under our bank credit facility. As of December 31, 2014, we have $90.9 million in current maturities of long-term debt, which primarily consists of the current amounts due on the Term Loan and capital leases.
Our bank credit facility requires us to maintain certain leverage and interest coverage ratios. As of December 31, 2014, we were in compliance with all of our debt covenants. Our financial covenant requirements and actual ratios as of December 31, 2014 are as follows:
|
| | | | |
| Per Credit Agreement | | Actual |
| Leverage ratio | 4.75 (Max) | | 3.69 |
|
| Interest coverage ratio | 3.00 (Min) | | 4.66 |
|
We believe the sources of liquidity can be supplemented by our ability to access the capital markets for additional debt or equity securities. We believe that our $177.3 million of cash on hand, future operating cash flows, and the available capacity under our credit facility will give us adequate liquidity to meet our short-term needs as well as our long-term financial obligations.
It is our intention to evaluate the best uses of our cash flow that will yield the highest value and return on capital. Our capital deployment strategy is prioritized as follows:
Invest in acquisitions and new builds. We intend to make acquisitions of funeral homes and cemeteries when pricing and terms are favorable. We expect an acquisition investment to earn an after-tax cash return that is in excess of our weighted average cost of capital with room for execution risk. We will also invest in the construction of funeral home facilities We target businesses with favorable customer segments and/or where we can achieve additional economies of scale.
Pay a dividend. Our quarterly dividend rate has steadily grown from $0.025 per common share in 2005 to $0.09 per common share in 2014. We intend to continue to grow our cash dividend commensurate with the growth of our free cash flow. While we intend to pay regular quarterly cash dividends for the foreseeable future, all future dividends are subject to limitations in our debt covenants and final determination by our Board of Directors each quarter upon review of our financial performance.
Repurchase shares. Absent a strategic acquisition opportunity, we believe share repurchases are attractive at the appropriate price. Under our share repurchase program, during the year ended December 31, 2014, we repurchased 11,424,446 shares of common stock at an aggregate cost of $241.7 million, which is an average cost per share of $21.15. On November 11, 2014, the Board of Directors increased the authorized level of repurchases of its common stock by approximately $290.0 million. After the repurchases and the increase, the remaining dollar value of shares authorized to be purchased under our share repurchase program was $238.8 million at December 31, 2014. We intend to make purchases from time to time in the open market or through privately negotiated transactions, subject to market conditions, debt covenants, and normal trading restrictions. Our credit agreement contains covenants that limit our ability to repurchase our common stock. There can be no assurance that we will buy our common stock under our repurchase program in the future.
Repurchase debt. We will seek to make open market debt repurchases when it is opportunistic to do so relative to other capital deployment opportunities in order to manage our near-term debt maturity profile. During 2014, we paid $230.0 million to reduce the outstanding balance on our term loan. Of this amount, our credit agreement required $200.0 million from the proceeds of the Federal Trade Commission (FTC) mandated divestitures under our consent order related to the Stewart acquisition.
The Company has a relatively consistent annual cash flow stream which is generally resistant to down economic cycles. This cash flow stream is available to substantially reduce our long-term debt maturities should we choose to do so. Furthermore, the Company's capital expenditures are generally discretionary in nature and can be managed based on the availability of operating cash flow.
Cash Flow
We believe our ability to generate strong operating cash flow is one of our fundamental financial strengths and provides us with substantial flexibility in meeting operating and investing needs.
Operating Activities
Net cash provided by operating activities was $317.4 million, $384.7 million, and $369.2 million for the years ended December 31, 2014, 2013, and 2012 respectively. Included in 2014 are acquisition and transition costs of $61.7 million (primarily related to the acquisition of Stewart), a $24.8 million premium paid on early extinguishment of debt, $63.8 million of tax payments related to divestitures, $30.1 million in excess tax benefits from share-based awards, and $10.8 million in legal defense and other costs. Included in 2013 are $45.4 million of acquisition and transition costs (primarily related to Stewart) and $10.1 million of legal defense and other costs. Included in 2012 are $6.6 million in tax payments related to settlement of an IRS audit and $4.7 of system transition and other costs.
Excluding the above items, cash flow from operations increased $68.4 million for 2014 versus 2013 and $59.7 million for 2013 versus 2012. The 2014 increase was driven by the increase in the company's size due to the Stewart acquisition and comprises:
•a $423.2 million increase in cash receipts from customers primarily due to preneed cash receipts from higher preneed sales and an increase in consolidated atneed revenue and
•a $11.7 million increase in General Agency (GA) receipts due to an increase in preneed insurance production; partially offset by
•a $130.7 million increase in vendor and other payments,
•a $169.0 million increase in payroll,
•a $50.3 million increase in interest payments, and
•a $16.5 million increase in tax payments.
The 2013 increase was driven by:
a $132.9 million increase in cash receipts from customers resulting from increased revenues primarily from acquisitions and improved collection rates at existing locations,
a $47.4 million increase in net trust fund withdrawals, and
a $9.3 million increase in General Agency (GA) receipts due to an increase in insurance production; partially offset by
a $71.8 million increase in vendor and other payments,
a $47.7 million increase in payroll, and
a $10.4 million increase in cash tax payments.
Investing Activities
Cash flows from investing activities provided $257.3 million in 2014 compared to using $1,156.8 million and $175.0 million in 2013 and 2012, respectively. The change in both periods is primarily related to $1.1 billion (net of cash acquired) capital deployed in 2013 for the strategic acquisition of Stewart Enterprises. Additionally, proceeds from divestitures increased $411.2 million in 2014 over 2013 primarily from the required sale of locations under our consent decree with the Federal Trade Commission. Proceeds from divestitures were $3.2 million higher in 2013 than in 2012.
Capital expenditures grew $31.6 million in 2014 compared to 2013 after having decreased slightly in 2013 from 2012. The 2014 increase primarily stems from the increase in the size of the company following the Stewart acquisition.
Financing Activities
Financing activities used $538.0 million in 2014 compared to providing $825.1 million in 2013 and using $231.5 million in 2012.
During 2014 we repaid $278.2 million of our debt, net of issuances. Outside of payments made when due under the terms of the debt instruments, our major activity in 2014 was to refinance portions of our debt, taking advantage of the historically low interest rates in 2014. In 2013 we borrowed $902.1 million, net of repayments, primarily to fund the acquisition of Stewart. In 2012 we repaid $5.5 million of our debt, net of issuances as we refinanced and extended the average maturity date.
We spent $242.9 million, $1.7 million, and $186.8 million on share repurchases in 2014, 2013, and 2012, respectively. The repurchase activity in 2013 is significantly lower than the other years as we reduced our activity to save cash for the acquisition of Stewart.
Our dividend rate has steadily increased since 2005. We have paid $71.5 million, $57.2 million, and $60.3 million of dividends in 2014, 2013, and 2012, respectively. We changed the timing of our dividend payments in 2012 and, consequently, paid five dividends during that year.
Proceeds from stock option exercises increased $26.1 million in 2014 compared to 2013 after decreasing $12.1 million in 2013 compared to 2012.
We acquired the remaining 10% of Neptune in 2014 for $15.0 million after acquiring 20% in 2013 for $23.3 million.
Off-Balance Sheet Arrangements, Contractual Obligations, and Commercial and Contingent Commitments
We have assumed various financial obligations and commitments in the ordinary course of conducting our business. We have contractual obligations requiring future cash payments under existing contractual arrangements, such as debt maturities, interest on long-term debt, operating lease agreements, and employment, consulting, and non-competition agreements. We also have commercial and contingent obligations that result in cash payments only if certain events occur requiring our performance pursuant to a funding commitment.
The following table details our known future cash payments (on an undiscounted basis) related to various contractual obligations as of December 31, 2014.
|
| | | | | | | | | | | | | | | | | | | | |
| | | Payments Due by Period |
| Contractual Obligations | | 2015 | | 2016-2017 | | 2018-2019 | | Thereafter | | Total |
| | | | | (Dollars in millions) | | |
Debt maturities, net of discounts (including capital leases)(1) | | $ | 90.9 |
| | $ | 538.9 |
| | $ | 867.3 |
| | $ | 1,557.6 |
| | $ | 3,054.7 |
|
Interest obligation on long-term debt(2) | | 154.4 |
| | 273.1 |
| | 211.1 |
| | 324.1 |
| | 962.7 |
|
Operating lease agreements(3) | | 14.0 |
| | 22.4 |
| | 16.0 |
| | 62.5 |
| | 114.9 |
|
Employment and management, consulting, and non-competition agreements(4) | | 7.2 |
| | 9.5 |
| | 7.2 |
| | 5.1 |
| | 29.0 |
|
Pension obligation(5) | | 3.9 |
| | 7.2 |
| | 6.5 |
| | 11.8 |
| | 29.4 |
|
| Total contractual obligations | | $ | 270.4 |
| | $ | 851.1 |
| | $ | 1,108.1 |
| | $ | 1,961.1 |
| | $ | 4,190.7 |
|
| |
| (1) | Our outstanding indebtedness contains standard provisions, such as payment delinquency default clauses and change of control clauses. In addition, our bank credit facility agreement contains a maximum leverage ratio and a minimum interest coverage ratio. See “Capital Allocation Considerations” and Note 10 in Part II, Item 8. Financial Statements and Supplementary Data, for additional details related to our long-term debt. |
| |
| (2) | Approximately 75% of our total debt is fixed rate debt for which the interest obligation was calculated at the stated rate. Future interest obligations on our floating rate debt are based on the current forward rate curve of the underlying index. See Note 10 in Part II, Item 8. Financial Statements and Supplementary Data, for additional information related to our future interest obligations. |
| |
| (3) | The majority of our lease arrangements contain options to (i) purchase the property at fair value on the exercise date, (ii) purchase the property for a value determined at the inception of the leases, or (iii) renew for the fair rental value at the end of the primary lease term. Our leases primarily relate to funeral and cemetery operating and maintenance equipment. See Note 12 in Part II, Item 8. Financial Statements and Supplementary Data, for additional details related to our leases. |
| |
| (4) | We have entered into employment and management, consulting, and non-competition agreements that require us to make cash payments over the contractual period. The agreements have been primarily entered into with certain officers and employees and former owners of businesses acquired. Agreements with contractual periods less than one year are excluded. See Note 12 in Part II, Item 8. Financial Statements and Supplementary Data, for additional details related to these agreements. |
| |
| (5) | See Note 15 in Part II, Item 8. Financial Statements and Supplementary Data, for discussion of our pension plans. |
The following table details our known potential or possible future cash payments (on an undiscounted basis) related to various commercial and contingent obligations as of December 31, 2014.
|
| | | | | | | | | | | | | | | | | | | | |
| | | Expiration by Period |
| Commercial and Contingent Obligations | | 2015 | | 2016-2017 | | 2018-2019 | | Thereafter | | Total |
| | | | | (Dollars in millions) | | |
Surety obligations(1) | | $ | 184.7 |
| | $ | — |
| | $ | — |
| | $ | — |
| | $ | 184.7 |
|
Long-term obligations related to uncertain tax positions(2) | | 145.4 |
| | 42.1 |
| | 0.3 |
| | 51.5 |
| | 239.3 |
|
Letters of credit(3) | | 32.2 |
| | — |
| | — |
| | — |
| | 32.2 |
|
| Total commercial and contingent obligations | | $ | 362.3 |
| | $ | 42.1 |
| | $ | 0.3 |
| | $ | 51.5 |
| | $ | 456.2 |
|
| |
| (1) | Represents the aggregate funding obligation associated with our surety bond arrangements assuming our surety partners did not renew any of our surety obligations and we could not find replacement surety assurance. See the section titled “Financial Assurances” following this table in this Form 10-K for more information related to our surety bonds. |
| |
| (2) | We have recorded a liability for unrecognized tax benefits and related interest and penalties of $239.3 million as of December 31, 2014. See Note 9 in Part II, Item 8. Financial Statements and Supplementary Data, for additional information related to our uncertain tax positions. These amounts are reflected in the periods when the statutes of limitations expire. |
| |
| (3) | We are occasionally required to post letters of credit, issued by a financial institution, to secure certain insurance programs or other obligations. Letters of credit generally authorize the financial institution to make a payment to the beneficiary upon the satisfaction of a certain event or the failure to satisfy an obligation. The letters of credit are generally posted for one-year terms and are usually automatically renewed upon maturity until such time as we have satisfied the commitment secured by the letter of credit. We are obligated to reimburse the issuer only if the beneficiary collects on the letter of credit. We believe it is unlikely we will be required to fund a claim under our outstanding letters of credit. As of December 31, 2014, the 31.6 million of our letters of credit were supported by our Bank credit facility, which expires in July 2018, and $0.6 million of our letters of credit are outside of our credit facility. |
Not included in the above table are potential funding obligations related to our funeral and cemetery merchandise and service trusts. In certain states and provinces, we have withdrawn allowable distributable earnings including unrealized gains prior to the maturity or cancellation of the related contract. Additionally, some states have laws that either require replenishment of investment losses under certain circumstances or impose various restrictions when trust fund values drop below certain prescribed amounts. In the event that our trust investments do not recover from market declines, we may be required to deposit portions or all of these amounts into the respective trusts in some future period. As of December 31, 2014, we had unrealized losses of $14.6 million in the various trusts within these states.
Financial Assurances
In support of our operations, we have entered into arrangements with certain surety companies whereby such companies agree to issue surety bonds on our behalf as financial assurance and/or as required by existing state and local regulations. The surety bonds are used for various business purposes; however, the majority of the surety bonds issued and outstanding have been used to support our preneed funeral and cemetery sales activities. The obligations underlying these surety bonds are recorded on the consolidated balance sheet as Deferred preneed funeral revenues and Deferred preneed cemetery revenues. The breakdown of surety bonds between funeral and cemetery preneed arrangements, as well as surety bonds for other activities, is described below.
|
| | | | | | | |
| | December 31, 2014 | | December 31, 2013 |
| | (Dollars in millions) |
| Preneed funeral | $ | 121.1 |
| | $ | 120.3 |
|
| Preneed cemetery: | |
| | |
|
| Merchandise and services | 138.1 |
| | 131.3 |
|
| Pre-construction | 4.6 |
| | 2.9 |
|
| Bonds supporting preneed funeral and cemetery obligations | 263.8 |
| | 254.5 |
|
| Bonds supporting preneed business permits | 4.4 |
| | 2.8 |
|
| Other bonds | 18.0 |
| | 17.9 |
|
| Total surety bonds outstanding | $ | 286.2 |
| | $ | 275.2 |
|
When selling preneed funeral and cemetery contracts, we may post surety bonds where allowed by state law. We post the surety bonds in lieu of trusting a certain amount of funds received from the customer. The $263.8 million in bonds supporting preneed funeral and cemetery obligations differs from the $184.7 million potential funding obligation disclosed in our “Commercial and Contingent Obligations” table above because the amount of the bond posted is generally determined by the total amount of the preneed contract that would otherwise be required to be trusted, in accordance with applicable state law, at the time we enter into the contract. We would only be required to fund the trust for the portion of the preneed contract for which we have received payment from the customer, less any applicable retainage, in accordance with state law. For the years ended December 31, 2014, 2013, and 2012, we had $19.6 million, $18.5 million, and $18.4 million, respectively, of cash receipts from sales attributable to bonded contracts. These amounts do not consider reductions associated with taxes, obtaining costs, or other costs.
Surety bond premiums are paid annually and are automatically renewable until maturity of the underlying preneed contracts, unless we are given prior notice of cancellation. Except for cemetery pre-construction bonds (which are irrevocable), the surety companies generally have the right to cancel the surety bonds at any time with appropriate notice. In the event a surety company were to cancel the surety bond, we are required to obtain replacement surety assurance from another surety company or fund a trust for an amount generally less than the posted bond amount. Management does not expect that we will be required to fund material future amounts related to these surety bonds due to a lack of surety capacity or surety company non-performance.
Preneed Funeral and Cemetery Activities and Backlog of Contracts
In addition to selling our products and services to client families at the time of need, we sell price-guaranteed preneed funeral and cemetery contracts, which provide for future funeral or cemetery merchandise and services. Since preneed funeral and cemetery merchandise or services will generally not be provided until sometime in the future, most states and provinces require that all or a portion of the funds collected from customers on preneed funeral and cemetery contracts be paid into merchandise and service trusts until the merchandise is delivered or the service is performed. In certain situations, as described above, where permitted by state or provincial laws, we post a surety bond as financial assurance for a certain amount of the preneed funeral or cemetery contract in lieu of placing funds into trust accounts. Where permitted by state or provincial law, customers may arrange their preneed funeral contract by purchasing a life insurance or annuity policy from third-party insurance companies.
Trust-funded Preneed Funeral and Cemetery Contracts: The funds collected from customers are deposited into trust and primarily invested by independent trustees in accordance with state and provincial laws. We retain any funds above the amounts required to be deposited into trust accounts and use them for working capital purposes, generally to offset the selling and administrative costs of our preneed programs.
Investment earnings associated with the trust investments are expected to mitigate the inflationary costs of providing the preneed funeral and cemetery merchandise and services in the future for the prices that were guaranteed at the time of sale. Our preneed funeral and cemetery trust assets are consolidated and recorded in our consolidated balance sheet at fair value. Investment earnings on trust assets are generally accumulated in the trust and distributed as the revenue associated with the preneed funeral
or cemetery contract is recognized or canceled by the customer. In certain states and provinces, the trusts are allowed to distribute a portion of the investment earnings to us prior to that date.
If a preneed funeral or cemetery contract is canceled prior to delivery, state or provincial law determines the amount of the refund owed to the customer, if any, including the amount of the attributed investment earnings. Upon cancellation, we receive the amount of principal deposited to trust and previously undistributed net investment earnings and, where required, issue a refund to the customer. We retain excess funds, if any, and recognize the attributed investment earnings (net of any investment earnings payable to the customer) as revenues in our consolidated statement of operations. In certain jurisdictions, we may be obligated to fund any shortfall if the amounts deposited by the customer exceed the funds in trust. Funds in trust assets exceeded customer deposits at December 31, 2014. See Off-Balance Sheet Arrangements, Contractual Obligations, and Commercial and Contingent Commitments for additional information about potential funding obligations related to our funeral and cemetery merchandise and service trusts. Based on our historical experience, we have included a cancellation reserve for preneed funeral and cemetery contracts in our consolidated balance sheet of $125.0 million and $149.3 million as of December 31, 2014 and 2013, respectively.
While the contract is outstanding, cash flow is provided by the amount retained from funds collected from the customer and any distributed investment earnings. At the time of death maturity, we receive the principal and undistributed investment earnings from the funeral trust and any remaining receivable due from the customer. At the time of delivery or storage of cemetery merchandise and service items for which we were required to deposit funds to trust, we receive the principal and undistributed investment earnings from the cemetery trust. There is generally no remaining receivable due from the customer, as our policy is to deliver preneed cemetery merchandise and service items only upon payment of the contract balance in full. This cash flow at the time of service, delivery, or storage is generally less than the associated revenue recognized, thus reducing cash flow from operating activities.
The tables below detail our results of preneed funeral and cemetery production and maturities, excluding insurance contracts, for the years ended December 31, 2014 and 2013.
|
| | | | | | | |
| | Years Ended December 31, |
| | 2014 | | 2013 |
| | (Dollars in millions) |
| Funeral: | |
| | |
|
| Preneed trust-funded (including bonded): | |
| | |
|
| Sales production | $ | 230.5 |
| | $ | 180.3 |
|
| Sales production (number of contracts) | 84,136 |
| | 65,982 |
|
| Maturities | $ | 218.6 |
| | $ | 189.3 |
|
| Maturities (number of contracts) | 61,734 |
| | 53,562 |
|
| Cemetery: | |
| | |
|
| Sales production: | |
| | |
|
| Preneed | $ | 687.5 |
| | $ | 559.6 |
|
| Atneed | 307.2 |
| | 241.0 |
|
| Total sales production | $ | 994.7 |
| | $ | 800.6 |
|
| Sales production deferred to backlog: | |
| | |
|
| Preneed | $ | 299.8 |
| | $ | 215.7 |
|
| Atneed | 232.0 |
| | 180.6 |
|
| Total sales production deferred to backlog | $ | 531.8 |
| | $ | 396.3 |
|
| Revenue recognized from backlog: | |
| | |
|
| Preneed | $ | 234.7 |
| | $ | 184.3 |
|
| Atneed | 230.5 |
| | 178.7 |
|
| Total revenue recognized from backlog | $ | 465.2 |
| | $ | 363.0 |
|
Insurance-funded Preneed Funeral Contracts: Where permitted by state or provincial law, customers may arrange their preneed funeral contract by purchasing a life insurance or annuity policy from third-party insurance companies, for which we earn a commission as general sales agent for the insurance company. These general agency commissions (GA revenues) are based on a percentage per contract sold and are recognized as funeral revenues when the insurance purchase transaction between the customer and third-party insurance provider is completed. Direct selling costs incurred pursuant to the sale of insurance-funded preneed funeral contracts are expensed as incurred. The policy amount of the insurance contract between the customer and the third-party insurance company generally equals the amount of the preneed funeral contract. We do not reflect the unfulfilled insurance-funded preneed funeral contract amounts in our consolidated balance sheet. Approximately 72% and 76% of our preneed funeral production relates to insurance-funded preneed funeral contracts in 2014 and 2013, respectively.
The third-party insurance company collects funds related to the insurance contract directly from the customer. The life insurance contracts include a death benefit escalation provision, general agency commissions received at the time of sale, and have lower ongoing administrative costs; all of which are expected to mitigate the inflationary costs of providing the preneed funeral merchandise and services in the future at the prices that were guaranteed at the time of the preneed sale. The customer/policy holder assigns the policy benefits to our funeral home to pay for the preneed funeral contract at the time of need.
The table below details the results of insurance-funded preneed funeral production and maturities for the years ended December 31, 2014 and 2013, and the number of contracts associated with those transactions.
|
| | | | | | | |
| | Years Ended December 31, |
| | 2014 | | 2013 |
| | (Dollars in millions) |
| Preneed funeral insurance-funded: | |
| | |
|
Sales production(1) | $ | 591.7 |
| | $ | 570.1 |
|
Sales production (number of contracts)(1) | 93,096 |
| | 98,146 |
|
| General agency revenue | $ | 123.0 |
| | $ | 106.5 |
|
| Maturities | $ | 353.5 |
| | $ | 332.9 |
|
| Maturities (number of contracts) | 60,542 |
| | 58,035 |
|
| |
| (1) | Amounts are not included in our consolidated balance sheet. |
Backlog of Preneed Funeral and Cemetery Contracts: The following table reflects our backlog of trust-funded deferred preneed funeral and cemetery contract revenues, including amounts related to Deferred preneed funeral and cemetery receipts held in trust at December 31, 2014 and 2013. Additionally, the table reflects our backlog of unfulfilled insurance-funded contracts (which are not included in our consolidated balance sheet) at December 31, 2014 and 2013. The backlog amounts presented are reduced by an amount that we believe will cancel before maturity based on historical experience. The table does not include the backlog associated with businesses that are held for sale.
The table also reflects our preneed funeral and cemetery receivables and trust investments (fair value and cost bases) associated with the backlog of deferred preneed funeral and cemetery contract revenues, net of the estimated cancellation allowance. We believe that the table below is meaningful because it sets forth the aggregate amount of future revenues we expect to recognize as a result of maturities of preneed sales in the future, as well as the amount of assets associated with those revenues. Because the future revenues exceed the asset amounts, future revenues will exceed the cash distributions actually received from the associated trusts.
|
| | | | | | | | | | | | | | | |
| | December 31, 2014 | | December 31, 2013 |
| | Fair Value | | Cost | | Fair Value | | Cost |
| | (Dollars in billions) |
| Deferred preneed funeral revenues | $ | 0.54 |
| | $ | 0.54 |
| | $ | 0.55 |
| | $ | 0.55 |
|
| Deferred preneed funeral receipts held in trust | 1.63 |
| | 1.63 |
| | 1.66 |
| | 1.59 |
|
| | 2.17 |
| | 2.17 |
| | 2.21 |
| | 2.14 |
|
| Allowance for cancellation on trust investments | (0.17 | ) | | (0.17 | ) | | (0.19 | ) | | (0.19 | ) |
| Backlog of trust-funded preneed funeral revenues | 2.00 |
| | 2.00 |
| | 2.02 |
| | 1.95 |
|
| Backlog of insurance-funded preneed funeral revenues | 4.82 |
| | 4.82 |
| | 4.75 |
| | 4.75 |
|
| Total backlog of preneed funeral revenues | $ | 6.82 |
| | $ | 6.82 |
| | $ | 6.77 |
| | $ | 6.70 |
|
| | | | | | | | |
| Preneed funeral receivables and trust investments | $ | 1.84 |
| | $ | 1.85 |
| | $ | 1.87 |
| | $ | 1.79 |
|
| Allowance for cancellation on trust investments | (0.16 | ) | | (0.16 | ) | | (0.18 | ) | | (0.18 | ) |
| Assets associated with backlog of trust-funded deferred preneed funeral revenues, net of estimated allowance for cancellation | 1.68 |
| | 1.69 |
| | 1.69 |
| | 1.61 |
|
| Insurance policies associated with insurance-funded deferred preneed funeral revenues, net of estimated allowance for cancellation | 4.82 |
| | 4.82 |
| | 4.75 |
| | 4.75 |
|
| Total assets associated with backlog of preneed funeral revenues, net of estimated allowance for cancellation | $ | 6.50 |
| | $ | 6.51 |
| | $ | 6.44 |
| | $ | 6.36 |
|
| | | | | | | | |
| Deferred preneed cemetery revenues | $ | 1.06 |
| | $ | 1.06 |
| | $ | 1.02 |
| | $ | 1.02 |
|
| Deferred preneed cemetery receipts held in trust | 1.52 |
| | 1.53 |
| | 1.58 |
| | 1.41 |
|
| | 2.58 |
| | 2.59 |
| | 2.60 |
| | 2.43 |
|
| Allowance for cancellation on trust investments | (0.11 | ) | | (0.11 | ) | | (0.18 | ) | | (0.18 | ) |
| Total backlog of deferred cemetery revenues | $ | 2.47 |
| | $ | 2.48 |
| | $ | 2.42 |
| | $ | 2.25 |
|
| | | | | | | | |
| Preneed cemetery receivables and trust investments | $ | 2.31 |
| | $ | 2.32 |
| | $ | 2.29 |
| | $ | 2.12 |
|
| Allowance for cancellation on trust investments | (0.13 | ) | | (0.13 | ) | | (0.19 | ) | | (0.19 | ) |
| Total assets associated with backlog of deferred cemetery revenues, net of estimated allowance for cancellation | $ | 2.18 |
| | $ | 2.19 |
| | $ | 2.10 |
| | $ | 1.93 |
|
The fair value of our funeral and cemetery trust investments was based on a combination of quoted market prices, observable inputs such as interest rates or yield curves, and appraisals. For more information on how market values are estimated, see Notes 4, 5, and 6 in Part II, Item 8. Financial Statements and Supplementary Data. The difference between the backlog and asset amounts represents the contracts for which we have posted surety bonds as financial assurance in lieu of trusting, the amounts collected from customers that were not required to be deposited into trust, and allowable cash distributions from trust assets. The table also reflects the amounts expected to be received from insurance companies through the assignment of policy proceeds related to insurance-funded funeral contracts.
Trust InvestmentsCash Flow
We believe our ability to generate strong operating cash flow is one of our fundamental financial strengths and provides us with substantial flexibility in meeting operating and investing needs.
Operating Activities
Net cash provided by operating activities was $317.4 million, $384.7 million, and $369.2 million for the years ended December 31, 2014, 2013, and 2012 respectively. Included in 2014 are acquisition and transition costs of $61.7 million (primarily related to the acquisition of Stewart), a $24.8 million premium paid on early extinguishment of debt, $63.8 million of tax payments related to divestitures, $30.1 million in excess tax benefits from share-based awards, and $10.8 million in legal defense and other costs. Included in 2013 are $45.4 million of acquisition and transition costs (primarily related to Stewart) and $10.1 million of legal defense and other costs. Included in 2012 are $6.6 million in tax payments related to settlement of an IRS audit and $4.7 of system transition and other costs.
Excluding the above items, cash flow from operations increased $68.4 million for 2014 versus 2013 and $59.7 million for 2013 versus 2012. The 2014 increase was driven by the increase in the company's size due to the Stewart acquisition and comprises:
•a $423.2 million increase in cash receipts from customers primarily due to preneed cash receipts from higher preneed sales and an increase in consolidated atneed revenue and
•a $11.7 million increase in General Agency (GA) receipts due to an increase in preneed insurance production; partially offset by
•a $130.7 million increase in vendor and other payments,
•a $169.0 million increase in payroll,
•a $50.3 million increase in interest payments, and
•a $16.5 million increase in tax payments.
The 2013 increase was driven by:
a $132.9 million increase in cash receipts from customers resulting from increased revenues primarily from acquisitions and improved collection rates at existing locations,
a $47.4 million increase in net trust fund withdrawals, and
a $9.3 million increase in General Agency (GA) receipts due to an increase in insurance production; partially offset by
a $71.8 million increase in vendor and other payments,
a $47.7 million increase in payroll, and
a $10.4 million increase in cash tax payments.
Investing Activities
Cash flows from investing activities provided $257.3 million in 2014 compared to using $1,156.8 million and $175.0 million in 2013 and 2012, respectively. The change in both periods is primarily related to $1.1 billion (net of cash acquired) capital deployed in 2013 for the strategic acquisition of Stewart Enterprises. Additionally, proceeds from divestitures increased $411.2 million in 2014 over 2013 primarily from the required sale of locations under our consent decree with the Federal Trade Commission. Proceeds from divestitures were $3.2 million higher in 2013 than in 2012.
Capital expenditures grew $31.6 million in 2014 compared to 2013 after having decreased slightly in 2013 from 2012. The 2014 increase primarily stems from the increase in the size of the company following the Stewart acquisition.
Financing Activities
Financing activities used $538.0 million in 2014 compared to providing $825.1 million in 2013 and using $231.5 million in 2012.
During 2014 we repaid $278.2 million of our debt, net of issuances. Outside of payments made when due under the terms of the debt instruments, our major activity in 2014 was to refinance portions of our debt, taking advantage of the historically low interest rates in 2014. In 2013 we borrowed $902.1 million, net of repayments, primarily to fund the acquisition of Stewart. In 2012 we repaid $5.5 million of our debt, net of issuances as we refinanced and extended the average maturity date.
We spent $242.9 million, $1.7 million, and $186.8 million on share repurchases in 2014, 2013, and 2012, respectively. The repurchase activity in 2013 is significantly lower than the other years as we reduced our activity to save cash for the acquisition of Stewart.
Our dividend rate has steadily increased since 2005. We have paid $71.5 million, $57.2 million, and $60.3 million of dividends in 2014, 2013, and 2012, respectively. We changed the timing of our dividend payments in 2012 and, consequently, paid five dividends during that year.
Proceeds from stock option exercises increased $26.1 million in 2014 compared to 2013 after decreasing $12.1 million in 2013 compared to 2012.
We acquired the remaining 10% of Neptune in 2014 for $15.0 million after acquiring 20% in 2013 for $23.3 million.
Off-Balance Sheet Arrangements, Contractual Obligations, and Commercial and Contingent Commitments
We have assumed various financial obligations and commitments in the ordinary course of conducting our business. We have contractual obligations requiring future cash payments under existing contractual arrangements, such as debt maturities, interest on long-term debt, operating lease agreements, and employment, consulting, and non-competition agreements. We also have commercial and contingent obligations that result in cash payments only if certain events occur requiring our performance pursuant to a funding commitment.
The following table details our known future cash payments (on an undiscounted basis) related to various contractual obligations as of December 31, 2014.
|
| | | | | | | | | | | | | | | | | | | | |
| | | Payments Due by Period |
| Contractual Obligations | | 2015 | | 2016-2017 | | 2018-2019 | | Thereafter | | Total |
| | | | | (Dollars in millions) | | |
Debt maturities, net of discounts (including capital leases)(1) | | $ | 90.9 |
| | $ | 538.9 |
| | $ | 867.3 |
| | $ | 1,557.6 |
| | $ | 3,054.7 |
|
Interest obligation on long-term debt(2) | | 154.4 |
| | 273.1 |
| | 211.1 |
| | 324.1 |
| | 962.7 |
|
Operating lease agreements(3) | | 14.0 |
| | 22.4 |
| | 16.0 |
| | 62.5 |
| | 114.9 |
|
Employment and management, consulting, and non-competition agreements(4) | | 7.2 |
| | 9.5 |
| | 7.2 |
| | 5.1 |
| | 29.0 |
|
Pension obligation(5) | | 3.9 |
| | 7.2 |
| | 6.5 |
| | 11.8 |
| | 29.4 |
|
| Total contractual obligations | | $ | 270.4 |
| | $ | 851.1 |
| | $ | 1,108.1 |
| | $ | 1,961.1 |
| | $ | 4,190.7 |
|
| |
| (1) | Our outstanding indebtedness contains standard provisions, such as payment delinquency default clauses and change of control clauses. In addition, our bank credit facility agreement contains a maximum leverage ratio and a minimum interest coverage ratio. See “Capital Allocation Considerations” and Note 10 in Part II, Item 8. Financial Statements and Supplementary Data, for additional details related to our long-term debt. |
| |
| (2) | Approximately 75% of our total debt is fixed rate debt for which the interest obligation was calculated at the stated rate. Future interest obligations on our floating rate debt are based on the current forward rate curve of the underlying index. See Note 10 in Part II, Item 8. Financial Statements and Supplementary Data, for additional information related to our future interest obligations. |
| |
| (3) | The majority of our lease arrangements contain options to (i) purchase the property at fair value on the exercise date, (ii) purchase the property for a value determined at the inception of the leases, or (iii) renew for the fair rental value at the end of the primary lease term. Our leases primarily relate to funeral and cemetery operating and maintenance equipment. See Note 12 in Part II, Item 8. Financial Statements and Supplementary Data, for additional details related to our leases. |
| |
| (4) | We have entered into employment and management, consulting, and non-competition agreements that require us to make cash payments over the contractual period. The agreements have been primarily entered into with certain officers and employees and former owners of businesses acquired. Agreements with contractual periods less than one year are excluded. See Note 12 in Part II, Item 8. Financial Statements and Supplementary Data, for additional details related to these agreements. |
| |
| (5) | See Note 15 in Part II, Item 8. Financial Statements and Supplementary Data, for discussion of our pension plans. |
The following table details our known potential or possible future cash payments (on an undiscounted basis) related to various commercial and contingent obligations as of December 31, 2014.
|
| | | | | | | | | | | | | | | | | | | | |
| | | Expiration by Period |
| Commercial and Contingent Obligations | | 2015 | | 2016-2017 | | 2018-2019 | | Thereafter | | Total |
| | | | | (Dollars in millions) | | |
Surety obligations(1) | | $ | 184.7 |
| | $ | — |
| | $ | — |
| | $ | — |
| | $ | 184.7 |
|
Long-term obligations related to uncertain tax positions(2) | | 145.4 |
| | 42.1 |
| | 0.3 |
| | 51.5 |
| | 239.3 |
|
Letters of credit(3) | | 32.2 |
| | — |
| | — |
| | — |
| | 32.2 |
|
| Total commercial and contingent obligations | | $ | 362.3 |
| | $ | 42.1 |
| | $ | 0.3 |
| | $ | 51.5 |
| | $ | 456.2 |
|
| |
| (1) | Represents the aggregate funding obligation associated with our surety bond arrangements assuming our surety partners did not renew any of our surety obligations and we could not find replacement surety assurance. See the section titled “Financial Assurances” following this table in this Form 10-K for more information related to our surety bonds. |
| |
| (2) | We have recorded a liability for unrecognized tax benefits and related interest and penalties of $239.3 million as of December 31, 2014. See Note 9 in Part II, Item 8. Financial Statements and Supplementary Data, for additional information related to our uncertain tax positions. These amounts are reflected in the periods when the statutes of limitations expire. |
| |
| (3) | We are occasionally required to post letters of credit, issued by a financial institution, to secure certain insurance programs or other obligations. Letters of credit generally authorize the financial institution to make a payment to the beneficiary upon the satisfaction of a certain event or the failure to satisfy an obligation. The letters of credit are generally posted for one-year terms and are usually automatically renewed upon maturity until such time as we have satisfied the commitment secured by the letter of credit. We are obligated to reimburse the issuer only if the beneficiary collects on the letter of credit. We believe it is unlikely we will be required to fund a claim under our outstanding letters of credit. As of December 31, 2014, the 31.6 million of our letters of credit were supported by our Bank credit facility, which expires in July 2018, and $0.6 million of our letters of credit are outside of our credit facility. |
Not included in the above table are potential funding obligations related to our funeral and cemetery merchandise and service trusts. In certain states and provinces, we have withdrawn allowable distributable earnings including unrealized gains prior to the maturity or cancellation of the related contract. Additionally, some states have laws that either require replenishment of investment losses under certain circumstances or impose various restrictions when trust fund values drop below certain prescribed amounts. In the event that our trust investments do not recover from market declines, we may be required to deposit portions or all of these amounts into the respective trusts in some future period. As of December 31, 2014, we had unrealized losses of $14.6 million in the various trusts within these states.
Financial Assurances
In support of our operations, we have entered into arrangements with certain surety companies whereby such companies agree to issue surety bonds on our behalf as financial assurance and/or as required by existing state and local regulations. The surety bonds are used for various business purposes; however, the majority of the surety bonds issued and outstanding have been used to support our preneed funeral and cemetery sales activities. The obligations underlying these surety bonds are recorded on the consolidated balance sheet as Deferred preneed funeral revenues and Deferred preneed cemetery revenues. The breakdown of surety bonds between funeral and cemetery preneed arrangements, as well as surety bonds for other activities, is described below.
|
| | | | | | | |
| | December 31, 2014 | | December 31, 2013 |
| | (Dollars in millions) |
| Preneed funeral | $ | 121.1 |
| | $ | 120.3 |
|
| Preneed cemetery: | |
| | |
|
| Merchandise and services | 138.1 |
| | 131.3 |
|
| Pre-construction | 4.6 |
| | 2.9 |
|
| Bonds supporting preneed funeral and cemetery obligations | 263.8 |
| | 254.5 |
|
| Bonds supporting preneed business permits | 4.4 |
| | 2.8 |
|
| Other bonds | 18.0 |
| | 17.9 |
|
| Total surety bonds outstanding | $ | 286.2 |
| | $ | 275.2 |
|
When selling preneed funeral and cemetery contracts, we may post surety bonds where allowed by state law. We post the surety bonds in lieu of trusting a certain amount of funds received from the customer. The $263.8 million in bonds supporting preneed funeral and cemetery obligations differs from the $184.7 million potential funding obligation disclosed in our “Commercial and Contingent Obligations” table above because the amount of the bond posted is generally determined by the total amount of the preneed contract that would otherwise be required to be trusted, in accordance with applicable state law, at the time we enter into the contract. We would only be required to fund the trust for the portion of the preneed contract for which we have received payment from the customer, less any applicable retainage, in accordance with state law. For the years ended December 31, 2014, 2013, and 2012, we had $19.6 million, $18.5 million, and $18.4 million, respectively, of cash receipts from sales attributable to bonded contracts. These amounts do not consider reductions associated with taxes, obtaining costs, or other costs.
Surety bond premiums are paid annually and are automatically renewable until maturity of the underlying preneed contracts, unless we are given prior notice of cancellation. Except for cemetery pre-construction bonds (which are irrevocable), the surety companies generally have the right to cancel the surety bonds at any time with appropriate notice. In the event a surety company were to cancel the surety bond, we are required to obtain replacement surety assurance from another surety company or fund a trust for an amount generally less than the posted bond amount. Management does not expect that we will be required to fund material future amounts related to these surety bonds due to a lack of surety capacity or surety company non-performance.
Preneed Funeral and Cemetery Activities and Backlog of Contracts
In addition to selling our products and services to client families at the time of need, we sell price-guaranteed preneed funeral and cemetery contracts, which provide for future funeral or cemetery servicesmerchandise and merchandise.services. Since preneed funeral and cemetery merchandise or services or merchandise will generally not be provided until sometime in the future, most states and provinces require that all or a portion of the funds collected from customers on preneed funeral and cemetery contracts be paid into merchandise and service trusts and/or escrow accounts until the merchandise is delivered or the service is performed. In certain situations, as described above, where permitted by state or provincial laws, we post a surety bond as financial assurance for a certain amount of the preneed funeral or cemetery contract in lieu of placing funds into trust accounts. Where permitted by state or provincial law, customers may arrange their preneed funeral contract by purchasing a life insurance or annuity policy from third-party insurance companies.
Trust-funded Preneed Funeral and Cemetery Contracts: The funds collected from customers are deposited into trust and primarily invested by independent trustees in accordance with state and provincial laws. We retain any funds above the amounts required to be deposited into trust accounts and use them for working capital purposes, generally to offset the selling and administrative costs of our preneed programs.
Investment earnings associated with the trust investments are expected to mitigate the inflationary costs of providing the preneed funeral and cemetery servicesmerchandise and merchandiseservices in the future for the prices that were guaranteed at the time of sale.
Also, we Our preneed funeral and cemetery trust assets are requiredconsolidated and recorded in our consolidated balance sheet at fair value. Investment earnings on trust assets are generally accumulated in the trust and distributed as the revenue associated with the preneed funeral
or cemetery contract is recognized or canceled by statethe customer. In certain states and provincial lawprovinces, the trusts are allowed to paydistribute a portion of the proceeds frominvestment earnings to us prior to that date.
If a preneed funeral or cemetery contract is canceled prior to delivery, state or provincial law determines the preneed or atneed saleamount of cemetery property interment rights into perpetual care trusts. For these investments, the original corpus remains in the trust in perpetuity and the net ordinary earnings are distributed and are intended to offset the expense to maintain the cemetery property. The majority of states require that net capital gains or losses are retained and addedrefund owed to the corpus, but certain states allowcustomer, if any, including the net realized capital gains and losses to be included in the net ordinary earnings that are distributed.
Independent trustees manage and invest allamount of the attributed investment earnings. Upon cancellation, we receive the amount of principal deposited to trust and previously undistributed net investment earnings and, where required, issue a refund to the customer. We retain excess funds, if any, and recognize the attributed investment earnings (net of any investment earnings payable to the customer) as revenues in our consolidated statement of operations. In certain jurisdictions, we may be obligated to fund any shortfall if the amounts deposited intoby the customer exceed the funds in trust. Funds in trust assets exceeded customer deposits at December 31, 2014. See Off-Balance Sheet Arrangements, Contractual Obligations, and Commercial and Contingent Commitments for additional information about potential funding obligations related to our funeral and cemetery merchandise and service truststrusts. Based on our historical experience, we have included a cancellation reserve for preneed funeral and cemetery contracts in our consolidated balance sheet of $125.0 million and $149.3 million as well asof December 31, 2014 and 2013, respectively.
While the cemetery perpetual care trusts. The trustees are selected based on their respective geographic footprint and qualifications per state and provincial regulations. All ofcontract is outstanding, cash flow is provided by the trustees engage the same independent investment advisor either directly or indirectly through SCI's wholly-owned registered investment advisor. The trustees, with inputamount retained from funds collected from the customer and any distributed investment advisor, establish anearnings. At the time of death maturity, we receive the principal and undistributed investment policy that serves as an operating document to guide the investment activities of the trusts including asset allocation and manager selection. The investments are also governed by state and provincial guidelines. Asset allocation is based on the liability structure of each funeral, cemetery, and perpetual care trust. The investment advisor recommends investment managers to the trustees that are selected on the basis of various criteria set forth in the investment policy. The primary investment objectives forearnings from the funeral trust and any remaining receivable due from the customer. At the time of delivery or storage of cemetery merchandise and service trusts include (1) achieving growth ofitems for which we were required to deposit funds to trust, we receive the principal over time sufficientand undistributed investment earnings from the cemetery trust. There is generally no remaining receivable due from the customer, as our policy is to preservedeliver preneed cemetery merchandise and increase the purchasing powerservice items only upon payment of the assets and (2) preserving capital within acceptable levelscontract balance in full. This cash flow at the time of volatility and risk. Preneed funeral and cemetery contractsservice, delivery, or storage is generally take years to mature. Therefore,less than the funds associated with these contracts are often invested for several market cycles. While cemetery perpetual care trusts share the same investment objectives as listed above, these trusts emphasize providing a steady stream of investment income with some capital appreciation. All of the trusts seek to control risk and volatility through a combination of asset styles, asset classes, and institutional investment managers.
As of the end of the year, 81% of our trusts were under the control and custody of two large financial institutions engaged as preferred trustees. The U.S. trustees primarily use common trust fund structures as the investment vehicle for their trusts. Through the common trust fund structure, each respective trustee manages the allocation of assets through individual managed accounts or institutional mutual funds. In the event a particular state prohibits the use of a common trust fund as a qualified investment, the trustee utilizes institutional mutual funds. The U.S. trusts include a modest allocation to alternative investments, which are comprised primarily of private equity investments and real estate investment trusts. These investments are typically structured as limited liability companies (LLCs) and are managed by certain trustees. The trusts that are eligible to allocate a portion of their investments to alternative investments purchase units of the respective LLCs.
Fixed Income Securities
Fixed income investments are intended to preserve principal, provide a source of current income, and reduce overall portfolio volatility. The SCI trusts have direct investments primarily in government and corporate fixed income securities.
Canadian government fixed income securities are investments in Canadian federal and provincial government instruments. In many cases, regulatory restrictions mandate that the fundsrevenue recognized, thus reducing cash flow from the sales of preneed funeral and cemetery products sold in certain Canadian jurisdictions must be invested in these instruments.
Equity Securitiesoperating activities.
Equity investments have historically provided long-term capital appreciation in excessThe tables below detail our results of inflation. The SCI trusts have direct investments primarily in domestic equity portfolios that include large, mid,preneed funeral and small capitalization companies of different investment objectives (i.e., growthcemetery production and value). The majority ofmaturities, excluding insurance contracts, for the equity portfolio is managed by multiple institutional investment managers that specialize in an objective-specific area of expertise. Our equity securities are exposed to market risk; however, we believe these securities are well-diversified. As of December 31, 2011, the largest single equity position represented less than 1% of the total equity securities portfolio.
Mutual Funds
The SCI trust funds employ institutional mutual funds where operationally or economically efficient. Institutional mutual funds are utilized to invest in various asset classes including US equities, non-US equities, convertible bonds, corporate bonds, government bonds, Treasury inflation protected securities (TIPS), high yield bonds, real estate investment trusts (REITs), and commodities. The mutual funds are governed by guidelines outlined in their individual prospectuses.
Private Equity
The objective of these investments is to provide high rates of return with controlled volatility. These investments are typically long-term in duration. These investments are diversified by strategy, sector, manager, and vintage year. Private equity exposure is typically accessed through LLCs established by certain preferred trustees. These LLCs invest in numerous limited partnerships, including private equity, fund of funds, distressed debt, and mezzanine financing. The trustees that have oversight of their respective LLCs work closely with the investment advisor in making all current investments.
Trust Investment Performance
The trust fund income recognized over a period of years from these investment assets can be volatile. During the twelve months ended December 31, 2011, the Standard2014 and Poor’s 500 Index increased approximately 2.1% and the Barclay’s Aggregate Index increased approximately 7.8%, while the combined SCI trust assets increased approximately 2.2%.
SCI, its trustees, and the investment advisor continue to monitor the capital markets and the trusts on an ongoing basis. The trustees, with input from the investment advisor, will take prudent action as needed to achieve the investment goals and objectives of the trusts.
Capital Allocation Considerations
We rely on cash flow from operations as a significant source of liquidity. Our cash flow from operating activities provided $388.1 million in 2011. In addition, we have $402.3 million in excess borrowing capacity under our bank credit facility. We have no significant maturities of long-term debt until October 2014.
Our bank credit facility requires us to maintain certain leverage and interest coverage ratios. As of December 31, 2011, we were in compliance with all of our debt covenants. Our financial covenant requirements and actual ratios as of December 31, 2011 are as follows:2013.
|
| | | | |
| Per Credit Agreement | | Actual |
Leverage ratio | 4.00 (Max) | | 3.12 |
|
Interest coverage ratio | 3.00 (Min) | | 4.35 |
|
|
| | | | | | | |
| | Years Ended December 31, |
| | 2014 | | 2013 |
| | (Dollars in millions) |
| Funeral: | |
| | |
|
| Preneed trust-funded (including bonded): | |
| | |
|
| Sales production | $ | 230.5 |
| | $ | 180.3 |
|
| Sales production (number of contracts) | 84,136 |
| | 65,982 |
|
| Maturities | $ | 218.6 |
| | $ | 189.3 |
|
| Maturities (number of contracts) | 61,734 |
| | 53,562 |
|
| Cemetery: | |
| | |
|
| Sales production: | |
| | |
|
| Preneed | $ | 687.5 |
| | $ | 559.6 |
|
| Atneed | 307.2 |
| | 241.0 |
|
| Total sales production | $ | 994.7 |
| | $ | 800.6 |
|
| Sales production deferred to backlog: | |
| | |
|
| Preneed | $ | 299.8 |
| | $ | 215.7 |
|
| Atneed | 232.0 |
| | 180.6 |
|
| Total sales production deferred to backlog | $ | 531.8 |
| | $ | 396.3 |
|
| Revenue recognized from backlog: | |
| | |
|
| Preneed | $ | 234.7 |
| | $ | 184.3 |
|
| Atneed | 230.5 |
| | 178.7 |
|
| Total revenue recognized from backlog | $ | 465.2 |
| | $ | 363.0 |
|
We believe our sources
Insurance-funded Preneed Funeral Contracts: Where permitted by state or provincial law, customers may arrange their preneed funeral contract by purchasing a life insurance or annuity policy from third-party insurance companies, for which we earn a commission as general sales agent for the insurance company. These general agency commissions (GA revenues) are based on a percentage per contract sold and are recognized as funeral revenues when the insurance purchase transaction between the customer and third-party insurance provider is completed. Direct selling costs incurred pursuant to the sale of liquidity can be supplemented by our ability to accessinsurance-funded preneed funeral contracts are expensed as incurred. The policy amount of the capital markets for additional debt or equity securities. We believe that our cash on hand, future operating cash flows,insurance contract between the customer and the available capacity underthird-party insurance company generally equals the amount of the preneed funeral contract. We do not reflect the unfulfilled insurance-funded preneed funeral contract amounts in our long-term bank credit facility will be adequateconsolidated balance sheet. Approximately 72% and 76% of our preneed funeral production relates to meetinsurance-funded preneed funeral contracts in 2014 and 2013, respectively.
The third-party insurance company collects funds related to the insurance contract directly from the customer. The life insurance contracts include a death benefit escalation provision, general agency commissions received at the time of sale, and have lower ongoing administrative costs; all of which are expected to mitigate the inflationary costs of providing the preneed funeral merchandise and services in the future at the prices that were guaranteed at the time of the preneed sale. The customer/policy holder assigns the policy benefits to our financial obligations overfuneral home to pay for the next 12 months.preneed funeral contract at the time of need.
We expect to continue to focus on funding growth initiatives that generate increased profitability, revenue,
The table below details the results of insurance-funded preneed funeral production and cash flows. These capital investments includematurities for the construction of high-end cemetery property (such as private family estates)years ended December 31, 2014 and 2013, and the constructionnumber of funeral home facilities. We will also consider the acquisition of additional deathcare operations that fit our long-term customer-focused strategy, if such acquisitions have the proper return on investment. Our outlook for capital improvements at existing facilities and cemetery development expenditures in 2012 is $95 to $105 million.
Since November 2007, we have paid quarterly dividends of $0.04 per common share. On February 9, 2011, our Board of Directors approved the payment of a quarterly dividend of $0.05 per share. While we intend to pay regular quarterly cash dividends for the foreseeable future, all future dividends are subject to limitations in our debt covenants and final determination by our Board of Directors each quarter upon review of our financial performance.contracts associated with those transactions.
|
| | | | | | | |
| | Years Ended December 31, |
| | 2014 | | 2013 |
| | (Dollars in millions) |
| Preneed funeral insurance-funded: | |
| | |
|
Sales production(1) | $ | 591.7 |
| | $ | 570.1 |
|
Sales production (number of contracts)(1) | 93,096 |
| | 98,146 |
|
| General agency revenue | $ | 123.0 |
| | $ | 106.5 |
|
| Maturities | $ | 353.5 |
| | $ | 332.9 |
|
| Maturities (number of contracts) | 60,542 |
| | 58,035 |
|
| |
| (1) | Amounts are not included in our consolidated balance sheet. |
Currently,Backlog of Preneed Funeral and Cemetery Contracts: The following table reflects our backlog of trust-funded deferred preneed funeral and cemetery contract revenues, including amounts related to Deferred preneed funeral and cemetery receipts held in trust at December 31, 2014 and 2013. Additionally, the table reflects our backlog of unfulfilled insurance-funded contracts (which are not included in our consolidated balance sheet) at December 31, 2014 and 2013. The backlog amounts presented are reduced by an amount that we believe will cancel before maturity based on historical experience. The table does not include the backlog associated with businesses that are held for sale.
The table also reflects our preneed funeral and cemetery receivables and trust investments (fair value and cost bases) associated with the backlog of deferred preneed funeral and cemetery contract revenues, net of the estimated cancellation allowance. We believe that the table below is meaningful because it sets forth the aggregate amount of future revenues we expect to recognize as a result of maturities of preneed sales in the future, as well as the amount of assets associated with those revenues. Because the future revenues exceed the asset amounts, future revenues will exceed the cash distributions actually received from the associated trusts.
|
| | | | | | | | | | | | | | | |
| | December 31, 2014 | | December 31, 2013 |
| | Fair Value | | Cost | | Fair Value | | Cost |
| | (Dollars in billions) |
| Deferred preneed funeral revenues | $ | 0.54 |
| | $ | 0.54 |
| | $ | 0.55 |
| | $ | 0.55 |
|
| Deferred preneed funeral receipts held in trust | 1.63 |
| | 1.63 |
| | 1.66 |
| | 1.59 |
|
| | 2.17 |
| | 2.17 |
| | 2.21 |
| | 2.14 |
|
| Allowance for cancellation on trust investments | (0.17 | ) | | (0.17 | ) | | (0.19 | ) | | (0.19 | ) |
| Backlog of trust-funded preneed funeral revenues | 2.00 |
| | 2.00 |
| | 2.02 |
| | 1.95 |
|
| Backlog of insurance-funded preneed funeral revenues | 4.82 |
| | 4.82 |
| | 4.75 |
| | 4.75 |
|
| Total backlog of preneed funeral revenues | $ | 6.82 |
| | $ | 6.82 |
| | $ | 6.77 |
| | $ | 6.70 |
|
| | | | | | | | |
| Preneed funeral receivables and trust investments | $ | 1.84 |
| | $ | 1.85 |
| | $ | 1.87 |
| | $ | 1.79 |
|
| Allowance for cancellation on trust investments | (0.16 | ) | | (0.16 | ) | | (0.18 | ) | | (0.18 | ) |
| Assets associated with backlog of trust-funded deferred preneed funeral revenues, net of estimated allowance for cancellation | 1.68 |
| | 1.69 |
| | 1.69 |
| | 1.61 |
|
| Insurance policies associated with insurance-funded deferred preneed funeral revenues, net of estimated allowance for cancellation | 4.82 |
| | 4.82 |
| | 4.75 |
| | 4.75 |
|
| Total assets associated with backlog of preneed funeral revenues, net of estimated allowance for cancellation | $ | 6.50 |
| | $ | 6.51 |
| | $ | 6.44 |
| | $ | 6.36 |
|
| | | | | | | | |
| Deferred preneed cemetery revenues | $ | 1.06 |
| | $ | 1.06 |
| | $ | 1.02 |
| | $ | 1.02 |
|
| Deferred preneed cemetery receipts held in trust | 1.52 |
| | 1.53 |
| | 1.58 |
| | 1.41 |
|
| | 2.58 |
| | 2.59 |
| | 2.60 |
| | 2.43 |
|
| Allowance for cancellation on trust investments | (0.11 | ) | | (0.11 | ) | | (0.18 | ) | | (0.18 | ) |
| Total backlog of deferred cemetery revenues | $ | 2.47 |
| | $ | 2.48 |
| | $ | 2.42 |
| | $ | 2.25 |
|
| | | | | | | | |
| Preneed cemetery receivables and trust investments | $ | 2.31 |
| | $ | 2.32 |
| | $ | 2.29 |
| | $ | 2.12 |
|
| Allowance for cancellation on trust investments | (0.13 | ) | | (0.13 | ) | | (0.19 | ) | | (0.19 | ) |
| Total assets associated with backlog of deferred cemetery revenues, net of estimated allowance for cancellation | $ | 2.18 |
| | $ | 2.19 |
| | $ | 2.10 |
| | $ | 1.93 |
|
The fair value of our funeral and cemetery trust investments was based on a combination of quoted market prices, observable inputs such as interest rates or yield curves, and appraisals. For more information on how market values are estimated, see Notes 4, 5, and 6 in Part II, Item 8. Financial Statements and Supplementary Data. The difference between the backlog and asset amounts represents the contracts for which we have approximately $199.4 million authorized under our share repurchase program. We intendposted surety bonds as financial assurance in lieu of trusting, the amounts collected from customers that were not required to make purchasesbe deposited into trust, and allowable cash distributions from timetrust assets. The table also reflects the amounts expected to time inbe received from insurance companies through the open market or through privately negotiated transactions, subjectassignment of policy proceeds related to market conditions, debt covenants, and normal trading restrictions. Our credit agreement contains covenants that limit our ability to repurchase our common stock. There can be no assurance that we will buy our common stock under our share repurchase program in the future.insurance-funded funeral contracts.
Cash Flow
We believe our ability to generate strong operating cash flow is one of our fundamental financial strengths and provides us with substantial flexibility in meeting operating and investing needs.
Operating Activities
Net cash provided by operating activities increased $33.7was $317.4 million, $384.7 million, and $369.2 million for the years ended December 31, 2014, 2013, and 2012 respectively. Included in 2014 are acquisition and transition costs of $61.7 million (primarily related to $388.1the acquisition of Stewart), a $24.8 million premium paid on early extinguishment of debt, $63.8 million of tax payments related to divestitures, $30.1 million in 2011excess tax benefits from $354.4share-based awards, and $10.8 million in 2010. Thislegal defense and other costs. Included in 2013 are $45.4 million of acquisition and transition costs (primarily related to Stewart) and $10.1 million of legal defense and other costs. Included in 2012 are $6.6 million in tax payments related to settlement of an IRS audit and $4.7 of system transition and other costs.
Excluding the above items, cash flow from operations increased $68.4 million for 2014 versus 2013 and $59.7 million for 2013 versus 2012. The 2014 increase was driven by:by the increase in the company's size due to the Stewart acquisition and comprises:
•a $423.2 million increase in cash receipts from customers primarily due to preneed cash receipts from higher preneed sales and an increase in consolidated atneed revenue and
•a $$11.7 million increase in General Agency (GA) receipts due to an increase in preneed insurance production; partially offset by
•98.2a $130.7 million increase in vendor and other payments,
•a $169.0 million increase in payroll,
•a $50.3 million increase in interest payments, and
•a $16.5 million increase in tax payments.
The 2013 increase was driven by:
a $132.9 million increase in cash receipts from customers resulting from increased revenues primarily from acquisitions and improved collection rates at existing locations;
locations,a $16.3$47.4 million increase in tax refundsnet trust fund withdrawals, and lower cash tax payments;
a $16.7$9.3 million increase in General Agency (GA) receipts due in part to acquisitions;
a $7.6 million increase in net trust fund withdrawals;
a $3.5 million increase in royalty income; partially offset by,
a $67.5 million increase in vendor payments resulting primarily from increases in variable costs from the Keystone acquisition;
a $39.3 million increase in employee compensation as a result of acquisitions; and
a $4.0 million increase in cash interest payments.
Net cash provided by operating activities decreased $17.7 million to $354.4 million in 2010 from $372.1 in 2009. This decrease was driven by:
a $47.0 million increase in employee compensation as a result of merit increases in 2010 that did not occur in 2009, and an increase in 2010 incentive payments was due to achieving certain targets for 2009;
a $70.1 million increase in vendor payments resulting from increases in variable costs from the Keystone and Palm Mortuaries acquisitions;
an $11.3 million decrease in certain life insurance proceeds in 2010 compared to 2009;production; partially offset by;
an $87.1 million increase in cash receipts from customers resulting from increased funeral case volume and revenues primarily from the Keystone and Palm Mortuaries acquisitions;
a $12.8 million increase in GA revenue receipts due to increased preneed funeral insurance productions; and
an $11.9 million increase in net trust fund withdrawals due to increased withdrawals on qualifying cemetery perpetual care expenses.
Investing Activities
Cash flows from investing activities used $190.3 million in 2011 compared to using $279.7 million in 2010. This decrease was primarily attributable to a decrease of $199.5 million in cash spent for acquisitions (primarily the Keystone acquisition in 2010), partially offset by a $66.3 million decrease in cash receipts from divestitures and assets sales, a $23.3 million decrease in withdrawals of restricted funds, and a $20.5 million increase in capital expenditures.
Cash flows from investing activities used $279.7 million in 2010 compared to using $152.5 million in 2009. This increase was primarily attributable to an increase of $214.2 million in cash spent for acquisitions (primarily the Keystone acquisition) and a $14.1 million increase in capital expenditures, partially offset by a $58.1 million increase in cash receipts from divestitures and assets sales and a $42.9 million increase in withdrawals of restricted funds.
Financing Activities
Financing activities used $238.7 million in 2011 compared to using $88.2 million in 2010. This increase was primarily driven by a $413.2 million decrease in proceeds from the issuance of long-term debt (net of debt issuance costs) and an $80.4 million
a $71.8 million increase in vendor and other payments,
a $47.7 million increase in payroll, and
a $10.4 million increase in cash tax payments.
Investing Activities
Cash flows from investing activities provided $257.3 million in 2014 compared to using $1,156.8 million and $175.0 million in 2013 and 2012, respectively. The change in both periods is primarily related to $1.1 billion (net of cash acquired) capital deployed in 2013 for the strategic acquisition of Stewart Enterprises. Additionally, proceeds from divestitures increased $411.2 million in 2014 over 2013 primarily from the required sale of locations under our consent decree with the Federal Trade Commission. Proceeds from divestitures were $3.2 million higher in 2013 than in 2012.
Capital expenditures grew $31.6 million in 2014 compared to 2013 after having decreased slightly in 2013 from 2012. The 2014 increase primarily stems from the increase in the repurchasessize of Company common stock, partially offset by a $316.2 million decrease in debt payments, a $23.2 million decrease in capital lease payments, and a $6.5 million increase in proceeds from exercise of stock options.the company following the Stewart acquisition.
Financing Activities
Financing activities used $88.2$538.0 million in 20102014 compared to using $178.4providing $825.1 million in 2009. This decrease2013 and using $231.5 million in 2012.
During 2014 we repaid $278.2 million of our debt, net of issuances. Outside of payments made when due under the terms of the debt instruments, our major activity in 2014 was to refinance portions of our debt, taking advantage of the historically low interest rates in 2014. In 2013 we borrowed $902.1 million, net of repayments, primarily driven by a $356.3to fund the acquisition of Stewart. In 2012 we repaid $5.5 million increaseof our debt, net of issuances as we refinanced and extended the average maturity date.
We spent $242.9 million, $1.7 million, and $186.8 million on share repurchases in proceeds from2014, 2013, and 2012, respectively. The repurchase activity in 2013 is significantly lower than the issuanceother years as we reduced our activity to save cash for the acquisition of long-term debt (netStewart.
Our dividend rate has steadily increased since 2005. We have paid $71.5 million, $57.2 million, and $60.3 million of debt issuance costs), partially offset by a $113.0 million increasedividends in debt2014, 2013, and 2012, respectively. We changed the timing of our dividend payments a $116.9 million increase in repurchases of Company common stock, a $15.6 million decline in proceeds from the exercise of stock options,2012 and, a $21.9 million increase in capital lease payments.consequently, paid five dividends during that year.
Proceeds from long-term debt (net of debt issuance costs) were $85.0stock option exercises increased $26.1 million in 2011 due2014 compared to a drawdown under our Bank credit facility of which $20.0 million was repaid in December of 2011. Proceeds from long-term debt (net of debt issuance costs) were $498.22013 after decreasing $12.1 million in 2010 due2013 compared to a $250.02012.
We acquired the remaining 10% of Neptune in 2014 for $15.0 million issuance of the 7.0% Notes due May 2019, the release of funds heldafter acquiring 20% in escrow2013 for the $150.0 million issuance of the 8.0% Notes due November 2021, and a $110.0 million drawdown under our Bank credit facility. Proceeds from long-term debt (net of debt issuance costs) were $141.9 million in 2009 due to a $150.0 million drawdown under our Bank credit facility.
The table below sets forth the payments of debt for the years ended December 31:
|
| | | | | | | | | | | |
| | 2011 | | 2010 | | 2009 |
| | (Dollars in millions) |
| 7.7% Notes due April 2009 | $ | — |
| | $ | — |
| | $ | 28.7 |
|
| 7.875% Debentures due February 2013 | 4.0 |
| | 25.5 |
| | 22.8 |
|
| 7.375% Senior Notes due October 2014 | — |
| | 70.5 |
| | 4.9 |
|
| 6.75% Notes due April 2015 | 22.3 |
| | 3.0 |
| | 36.9 |
|
| 6.75% Notes due April 2016 | 16.9 |
| | 20.1 |
| | 15.9 |
|
| 7.0% Notes due June 2017 | — |
| | — |
| | 4.5 |
|
| Bank credit facility due March 2016 | 20.0 |
| | 260.0 |
| | — |
|
| Series B Senior Notes due November 2011 | — |
| | — |
| | 150.0 |
|
| Obligations under capital leases | 23.0 |
| | 46.2 |
| | 24.3 |
|
| Mortgage notes and other debt, maturities through 2047 | 2.8 |
| | 3.1 |
| | 5.5 |
|
| Total Debt Payments | $ | 89.0 |
| | $ | 428.4 |
| | $ | 293.5 |
|
We repurchased 19.9 million shares in 2011 and 14.0 million shares in 2010, for $197.3 million and $116.9 million, respectively. We did not repurchase any shares in 2009.
We paid cash dividends of $44.8 million in 2011, $40.0 million in 2010, and $40.2 million in 2009.$23.3 million.
Off-Balance Sheet Arrangements, Contractual Obligations, and Commercial and Contingent Commitments
We have assumed various financial obligations and commitments in the ordinary course of conducting our business. We have contractual obligations requiring future cash payments under existing contractual arrangements, such as debt maturities, interest on long-term debt, operating lease agreements, and employment, consulting, and non-competition agreements. We also have commercial and contingent obligations that result in cash payments only if certain events occur requiring our performance pursuant to a funding commitment.
The following table details our known future cash payments (on an undiscounted basis) related to various contractual obligations as of December 31, 2011.2014.
|
| | | | | | | | | | | | | | | | | | | | |
| | | Payments Due by Period |
| Contractual Obligations | | 2015 | | 2016-2017 | | 2018-2019 | | Thereafter | | Total |
| | | | | (Dollars in millions) | | |
Debt maturities, net of discounts (including capital leases)(1) | | $ | 90.9 |
| | $ | 538.9 |
| | $ | 867.3 |
| | $ | 1,557.6 |
| | $ | 3,054.7 |
|
Interest obligation on long-term debt(2) | | 154.4 |
| | 273.1 |
| | 211.1 |
| | 324.1 |
| | 962.7 |
|
Operating lease agreements(3) | | 14.0 |
| | 22.4 |
| | 16.0 |
| | 62.5 |
| | 114.9 |
|
Employment and management, consulting, and non-competition agreements(4) | | 7.2 |
| | 9.5 |
| | 7.2 |
| | 5.1 |
| | 29.0 |
|
Pension obligation(5) | | 3.9 |
| | 7.2 |
| | 6.5 |
| | 11.8 |
| | 29.4 |
|
| Total contractual obligations | | $ | 270.4 |
| | $ | 851.1 |
| | $ | 1,108.1 |
| | $ | 1,961.1 |
| | $ | 4,190.7 |
|
|
| | | | | | | | | | | | | | | | | | | | |
| | | Payments Due by Period |
| Contractual Obligations | | 2012 | | 2013-2014 | | 2015-2016 | | Thereafter | | Total |
| | | | | (Dollars in millions) | | |
| Debt maturities(1) | | $ | 23.6 |
| | $ | 235.0 |
| | $ | 447.1 |
| | $ | 1,179.0 |
| | $ | 1,884.7 |
|
| Interest obligation on long-term debt(2) | | 126.2 |
| | 247.7 |
| | 194.0 |
| | 302.5 |
| | 870.4 |
|
| Operating lease agreements(3) | | 13.2 |
| | 20.5 |
| | 13.1 |
| | 41.2 |
| | 88.0 |
|
| Employment, consulting, and non-competition agreements(4) | | 8.5 |
| | 10.8 |
| | 5.7 |
| | 7.8 |
| | 32.8 |
|
| Pension obligation(5) | | 3.6 |
| | 7.2 |
| | 5.8 |
| | 10.4 |
| | 27.0 |
|
| Total contractual obligations | | $ | 175.1 |
| | $ | 521.2 |
| | $ | 665.7 |
| | $ | 1,540.9 |
| | $ | 2,902.9 |
|
| |
| (1) | Our outstanding indebtedness contains standard provisions, such as payment delinquency default clauses and change of control clauses. In addition, our bank credit facility agreement contains a maximum leverage ratio and a minimum interest coverage ratio. See “Capital Allocation Considerations” and Note 10 in Part II, Item 8. Financial Statements and Supplementary Data, for additional details related to our long-term debt. |
| |
| (2) | Approximately 89%75% of our total debt is fixed rate debt for which the interest obligation was calculated at the stated rate. Future interest obligations on our floating rate debt are based on the current forward rate curve of the underlying index. See Note 10 in Part II, Item 8. Financial Statements and Supplementary Data, for additional information related to our future interest obligations. |
| |
| (3) | The majority of our lease arrangements contain options to (i) purchase the property at fair value on the exercise date, (ii) purchase the property for a value determined at the inception of the leases, or (iii) renew for the fair rental value at the end of the primary lease term. Our leases primarily relate to funeral service locations and cemetery operating and maintenance equipment. See Note 12 in Part II, Item 8. Financial Statements and Supplementary Data, for additional details related to our leases. |
| |
| (4) | We have entered into employment and management, employment, consulting, and non-competition agreements that contractually require us to make cash payments over the contractual period. The agreements have been primarily entered into with certain officers and employees and former owners of businesses acquired. Agreements with contractual periods less than one year are excluded. See Note 12 in Part II, Item 8. Financial Statements and Supplementary Data, for additional details related to these agreements. |
| |
| (5) | See Note 15 in Part II, Item 8. Financial Statements and Supplementary Data, for discussion of our pension plans. |
The following table details our known potential or possible future cash payments (on an undiscounted basis) related to various commercial and contingent obligations as of December 31, 2011.2014.
| | | | | Expiration by Period | | Expiration by Period |
| Commercial and Contingent Obligations | | 2012 | | 2013-2014 | | 2015-2016 | | Thereafter | | Total | | 2015 | | 2016-2017 | | 2018-2019 | | Thereafter | | Total |
| | | | | (Dollars in millions) | | | | | | (Dollars in millions) | | |
| Surety obligations(1) | | $ | 187.8 |
| | $ | — |
| | $ | — |
| | $ | — |
| | $ | 187.8 |
| |
| Long-term obligations related to uncertain tax positions(2) | | 87.5 |
| | 15.9 |
| | 6.9 |
| | 87.8 |
| | 198.1 |
| |
| Letters of credit(3) | | — |
| | — |
| | 32.7 |
| | — |
| | 32.7 |
| |
Surety obligations(1) | | | $ | 184.7 |
| | $ | — |
| | $ | — |
| | $ | — |
| | $ | 184.7 |
|
Long-term obligations related to uncertain tax positions(2) | | | 145.4 |
| | 42.1 |
| | 0.3 |
| | 51.5 |
| | 239.3 |
|
Letters of credit(3) | | | 32.2 |
| | — |
| | — |
| | — |
| | 32.2 |
|
| Total commercial and contingent obligations | | $ | 275.3 |
| | $ | 15.9 |
| | $ | 39.6 |
| | $ | 87.8 |
| | $ | 418.6 |
| | $ | 362.3 |
| | $ | 42.1 |
| | $ | 0.3 |
| | $ | 51.5 |
| | $ | 456.2 |
|
| |
| (1) | Represents the aggregate funding obligation associated with our surety bond arrangements assuming our surety partners did not renew any of our surety obligations and we could not find replacement surety assurance. See the section titled “Financial Assurances” following this table in this Form 10-K for more information related to our surety bonds. |
| |
| (2) | In accordance with the Income Tax Topic of the Financial Accounting Standards Board’s (FASB) Accounting Standards Codification (ASC), weWe have recorded a liability for unrecognized tax benefits and related interest and penalties of $198.1$239.3 million as of December 31, 2011.2014. See Note 9 in Part II, Item 8. Financial Statements and Supplementary Data, for additional information related to our uncertain tax positions. These amounts are reflected in the periods when the statutes of limitations expire.
|
| |
| (3) | We are occasionally required to post letters of credit, issued by a financial institution, to secure certain insurance programs or other obligations. Letters of credit generally authorize the financial institution to make a payment to the beneficiary upon the satisfaction of a certain event or the failure to satisfy an obligation. The letters of credit are generally posted for one-year terms and are usually automatically renewed upon maturity until such time as we have satisfied the commitment secured by the letter of credit. We are obligated to reimburse the issuer only if the beneficiary collects on the letter of credit. We believe it is unlikely we will be required to fund a claim under our outstanding letters of credit. As of December 31, 2014, the 31.6 million of our letters of credit were supported by our Bank credit facility, which expires in July 2018, and $0.6 million of our letters of credit are outside of our credit facility. |
or other obligations. Letters of credit generally authorize the financial institution to make a payment to the beneficiary upon the satisfaction of a certain event or the failure to satisfy an obligation. The letters of credit are generally posted for one-year terms and are usually automatically renewed upon maturity until such time as we have satisfied the commitment secured by the letter of credit. We are obligated to reimburse the issuer only if the beneficiary collects on the letter of credit. We believe it is unlikely we will be required to fund a claim under our outstanding letters of credit. As of December 31, 2011, the full amount of our letters of credit was supported by our Bank credit facility, which expires in March 2016.
Not included in the above table are potential funding obligations related to our funeral and cemetery merchandise and service trusts. In certain states and provinces, we have withdrawn allowable distributable earnings including unrealized gains prior to the maturity or cancellation of the related contract. Additionally, some states have laws that either require replenishment of investment losses under certain circumstances or impose various restrictions when trust fund values drop below certain prescribed amounts. In the event that our trust investments do not recover from recent market declines, we may be required to deposit portions or all of these amounts into the respective trusts in some future period. As of December 31, 2011,2014, we had unrealized losses of $13.1$14.6 million in the various trusts within these states.
Financial Assurances
In support of our operations, we have entered into arrangements with certain surety companies whereby such companies agree to issue surety bonds on our behalf as financial assurance and/or as required by existing state and local regulations. The surety bonds are used for various business purposes; however, the majority of the surety bonds issued and outstanding have been used to support our preneed funeral and cemetery sales activities. The obligations underlying these surety bonds are recorded on the consolidated balance sheet as Deferred preneed funeral revenues and Deferred preneed cemetery revenues. The breakdown of surety bonds between funeral and cemetery preneed arrangements, as well as surety bonds for other activities, is described below.
| | | | December 31, 2011 | | December 31, 2010 | December 31, 2014 | | December 31, 2013 |
| | (Dollars in millions) | (Dollars in millions) |
| Preneed funeral | $ | 116.6 |
| | $ | 121.0 |
| $ | 121.1 |
| | $ | 120.3 |
|
| Preneed cemetery: | |
| | |
| |
| | |
|
| Merchandise and services | 116.6 |
| | 120.2 |
| 138.1 |
| | 131.3 |
|
| Pre-construction | 6.3 |
| | 5.1 |
| 4.6 |
| | 2.9 |
|
| Bonds supporting preneed funeral and cemetery obligations | 239.5 |
| | 246.3 |
| 263.8 |
| | 254.5 |
|
| Bonds supporting preneed business permits | 2.2 |
| | 5.1 |
| 4.4 |
| | 2.8 |
|
| Other bonds | 15.4 |
| | 14.2 |
| 18.0 |
| | 17.9 |
|
| Total surety bonds outstanding | $ | 257.1 |
| | $ | 265.6 |
| $ | 286.2 |
| | $ | 275.2 |
|
When selling preneed funeral and cemetery contracts, we may post surety bonds where allowed by state law. We post the surety bonds in lieu of trusting a certain amount of funds received from the customer. The $239.5$263.8 million in bonds supporting preneed funeral and cemetery obligations differs from the $187.8$184.7 million potential funding obligation disclosed in our “Commercial and Contingent Obligations” table above because the amount of the bond posted is generally determined by the total amount of the preneed contract that would otherwise be required to be trusted, in accordance with applicable state law, at the time we enter into the contract. We would only be required to fund the trust for the portion of the preneed contract for which we have received payment from the customer, less any applicable retainage, in accordance with state law. For the years ended December 31, 2011, 2010,2014, 2013, and 2009,2012, we had $18.9$19.6 million, $18.8$18.5 million, and $23.8$18.4 million, respectively, of cash receipts from sales attributable to bonded contracts. These amounts do not consider reductions associated with taxes, obtaining costs, or other costs.
Surety bond premiums are paid annually and are automatically renewable until maturity of the underlying preneed contracts, unless we are given prior notice of cancellation. Except for cemetery pre-construction bonds (which are irrevocable), the surety companies generally have the right to cancel the surety bonds at any time with appropriate notice. In the event a surety company were to cancel the surety bond, we are required to obtain replacement surety assurance from another surety company or fund a trust for an amount generally less than the posted bond amount. Management does not expect that we will be required to fund material future amounts related to these surety bonds due to a lack of surety capacity or surety company non-performance.
Preneed Funeral and Cemetery Activities and Backlog of Contracts
In addition to selling our products and services to client families at the time of need, we sell price-guaranteed preneed funeral and cemetery contracts, which provide for future funeral or cemetery servicesmerchandise and merchandise.services. Since preneed funeral and cemetery merchandise or services or merchandise will generally not be provided until sometime in the future, most states and provinces require that all or a portion
of the funds collected from customers on preneed funeral and cemetery contracts be paid into merchandise and service trusts until the merchandise is delivered or the service is performed. In certain situations, as described above, where permitted by state or provincial laws, we post a surety bond as financial assurance for a certain amount of the preneed funeral or cemetery contract in lieu of placing funds into trust accounts. Where permitted by state or provincial law, customers may arrange their preneed funeral contract by purchasing a life insurance or annuity policy from third-party insurance companies.
Trust-FundedTrust-funded Preneed Funeral and Cemetery Contracts:The funds collected from customers are deposited into trust and primarily invested by independent trustees in accordance with state and provincial laws. We retain any funds above the amounts required to be deposited into trust accounts and use them for working capital purposes, generally to offset the selling and administrative costs of our preneed programs.
Investment earnings associated with the trust investments are expected to mitigate the inflationary costs of providing the preneed funeral and cemetery servicesmerchandise and merchandiseservices in the future for the prices that were guaranteed at the time of sale. Our preneed funeral and cemetery trust assets are consolidated and recorded in our consolidated balance sheet at fair market value. Investment earnings on trust assets are generally accumulated in the trust and distributed as the revenue associated with the preneed funeral
or cemetery contract is recognized or cancelledcanceled by the customer. In certain states and provinces, the trusts are allowed to distribute a portion of the investment earnings to us prior to that date.
If a preneed funeral or cemetery contract is cancelledcanceled prior to delivery, state or provincial law determines the amount of the refund owed to the customer, if any, including the amount of the attributed investment earnings. Upon cancellation, we receive the amount of principal deposited to trust and previously undistributed net investment earnings and, where required, issue a refund to the customer. We retain excess funds, if any, and recognize the attributed investment earnings (net of any investment earnings payable to the customer) as revenues in our consolidated statement of operations. In certain jurisdictions, we may be obligated to fund any shortfall if the amounts deposited by the customer exceed the funds in trust. Funds in trust assets exceeded customer deposits at December 31, 2011.2014. See Off-Balance Sheet Arrangements, Contractual Obligations, and Commercial and Contingent Commitments for additional information about potential funding obligations related to our funeral and cemetery merchandise and service trusts. Based on our historical experience, we have included a cancellation reserve for preneed funeral and cemetery contracts in our consolidated balance sheet of $136.0$125.0 million and $134.8$149.3 million as of December 31, 20112014 and 2010,2013, respectively.
The cash flow activity over the life of a trust-funded preneed funeral or cemetery contract from the date of sale to its recognition or cancellation is captured in the following operating cash flow line items in our consolidated statement of cash flows:
Decrease in preneed funeral receivables, net and trust investments;
Increase in preneed cemetery receivables, net and trust investments;
(Decrease) increase in deferred preneed funeral revenue;
Increase in deferred preneed cemetery revenue;
Decrease in deferred preneed funeral receipts held in trust;
Decrease in deferred preneed cemetery receipts held in trust; and
While the contract is outstanding, cash flow is provided by the amount retained from funds collected from the customer and any distributed investment earnings. At the time of death maturity, we receive the principal and undistributed investment earnings from the funeral trust and any remaining receivable due from the customer. At the time of delivery or storage of cemetery merchandise and service items for which we were required to deposit funds to trust, we receive the principal and undistributed investment earnings from the cemetery trust. There is generally no remaining receivable due from the customer, as our policy is to deliver preneed cemetery merchandise and service items only upon payment of the contract balance in full. This cash flow at the time of service, delivery, or storage is generally less than the associated revenue recognized, thus reducing cash flow from operating activities.
The tables below detail our North America results of preneed funeral and cemetery production and maturities, excluding insurance contracts, for the years ended December 31, 20112014 and 2010.2013.
| | | | North America | | | | | |
| | Years Ended December 31, | Years Ended December 31, |
| | 2011 | | 2010 | 2014 | | 2013 |
| | (Dollars in millions) | (Dollars in millions) |
| Funeral: | |
| | |
| |
| | |
|
| Preneed trust-funded (including bonded): | |
| | |
| |
| | |
|
| Sales production (1) | $ | 134.5 |
| | $ | 117.3 |
| |
| Sales production (number of contracts) (1) | 38,567 |
| | 26,954 |
| |
| Sales production | | $ | 230.5 |
| | $ | 180.3 |
|
| Sales production (number of contracts) | | 84,136 |
| | 65,982 |
|
| Maturities | $ | 209.3 |
| | $ | 179.8 |
| $ | 218.6 |
| | $ | 189.3 |
|
| Maturities (number of contracts) | 47,476 |
| | 41,205 |
| 61,734 |
| | 53,562 |
|
| Cemetery: | |
| | |
| |
| | |
|
| Sales production: | |
| | |
| |
| | |
|
| Preneed | $ | 458.9 |
| | $ | 412.6 |
| $ | 687.5 |
| | $ | 559.6 |
|
| Atneed | 236.5 |
| | 240.6 |
| 307.2 |
| | 241.0 |
|
| Total sales production | $ | 695.4 |
| | $ | 653.2 |
| $ | 994.7 |
| | $ | 800.6 |
|
| Sales production deferred to backlog: | |
| | |
| |
| | |
|
| Preneed | $ | 185.6 |
| | $ | 169.7 |
| $ | 299.8 |
| | $ | 215.7 |
|
| Atneed | 178.0 |
| | 180.1 |
| 232.0 |
| | 180.6 |
|
| Total sales production deferred to backlog | $ | 363.6 |
| | $ | 349.8 |
| $ | 531.8 |
| | $ | 396.3 |
|
| Revenue recognized from backlog: | |
| | |
| |
| | |
|
| Preneed | $ | 153.9 |
| | $ | 153.7 |
| $ | 234.7 |
| | $ | 184.3 |
|
| Atneed | 178.3 |
| | 180.1 |
| 230.5 |
| | 178.7 |
|
| Total revenue recognized from backlog | $ | 332.2 |
| | $ | 333.8 |
| $ | 465.2 |
| | $ | 363.0 |
|
(1) The increase in sales production in 2011 is the result of our acquisition of Neptune Cremation Society, which has a lower average selling price per contract.
Insurance-FundedInsurance-funded Preneed Funeral Contracts:Where permitted by state or provincial law, customers may arrange their preneed funeral contract by purchasing a life insurance or annuity policy from third-party insurance companies, for which we earn a commission as general sales agent for the insurance company. These general agency commissions (GA revenues) are based on a percentage per contract sold and are recognized as funeral revenues when the insurance purchase transaction between the customer and third-party insurance provider is completed. Direct selling costs incurred pursuant to the sale of insurance-funded preneed funeral contracts are expensed as incurred. The policy amount of the insurance contract between the customer and the third-party insurance company generally equals the amount of the preneed funeral contract. We do not reflect the unfulfilled insurance-funded preneed funeral contract amounts in our consolidated balance sheet. Approximately 78%72% and 76% of our North America preneed funeral production relates to insurance-funded preneed funeral contracts in both 20112014 and 2010.2013, respectively.
The third-party insurance company collects funds related to the insurance contract directly from the customer. The life insurance contracts include a death benefit escalation provision, general agency commissions received at the time of sale, and have lower ongoing administrative costs; all of which isare expected to offsetmitigate the inflationary costs of providing the preneed funeral servicesmerchandise and merchandiseservices in the future at the prices that were guaranteed at the time of the preneed sale. The customer/policy holder assigns the policy benefits to our funeral home to pay for the preneed funeral contract at the time of need.
Additionally, we may receive cash overrides based on achieving certain dollar volume targets of life insurance policies sold as a result of marketing agreements entered into in connection with the sale of our insurance subsidiaries in 2000. Included in GA revenues for 2011 and 2010 were cash overrides in the amount of $18.5 million and $13.7 million, respectively.
The table below details the North America results of insurance-funded preneed funeral production and maturities for the years ended December 31, 20112014 and 2010,2013, and the number of contracts associated with those transactions.
| | | | North America | | | | | |
| | Years Ended December 31, | Years Ended December 31, |
| | 2011 | | 2010 | 2014 | | 2013 |
| | (Dollars in millions) | (Dollars in millions) |
| Preneed funeral insurance-funded: | |
| | |
| |
| | |
|
| Sales production (1) | $ | 475.5 |
| | $ | 413.1 |
| $ | 591.7 |
| | $ | 570.1 |
|
| Sales production (number of contracts) (1) | 81,883 |
| | 71,532 |
| 93,096 |
| | 98,146 |
|
| General agency revenue | $ | 86.8 |
| | $ | 68.3 |
| $ | 123.0 |
| | $ | 106.5 |
|
| Maturities | $ | 292.9 |
| | $ | 282.8 |
| $ | 353.5 |
| | $ | 332.9 |
|
| Maturities (number of contracts) | 53,179 |
| | 52,650 |
| 60,542 |
| | 58,035 |
|
| |
| (1) | Amounts are not included in our consolidated balance sheet. |
North America Backlog of Preneed Funeral and Cemetery Contracts:The following table reflects our North America backlog of trust-funded deferred preneed funeral and cemetery contract revenues, including amounts related to Deferred preneed funeral and cemetery receipts held in trust at December 31, 20112014 and 2010.2013. Additionally, the table reflects our North America backlog of unfulfilled insurance-funded contracts (which are not included in our consolidated balance sheet) at December 31, 20112014 and 2010.2013. The backlog amounts presented are reduced by an amount that we believe will cancel before maturity based on historical experience. The table does not include the backlog associated with businesses that are held for sale.
The table also reflects our North America preneed funeral and cemetery receivables and trust investments (market(fair value and cost bases) associated with the backlog of deferred preneed funeral and cemetery contract revenues, net of the estimated cancellation allowance. We believe that the table below is meaningful because it sets forth the aggregate amount of future revenues we expect to recognize as a result of maturities of preneed sales in the future, as well as the amount of assets associated with those revenues. Because the future revenues exceed the asset amounts, future revenues will exceed the cash distributions actually received from the associated trusts.
| | | | December 31, 2011 | | December 31, 2010 | December 31, 2014 | | December 31, 2013 |
| | Market | | Cost | | Market | | Cost | Fair Value | | Cost | | Fair Value | | Cost |
| | (Dollars in billions) | (Dollars in billions) |
| Deferred preneed funeral revenues | $ | 0.58 |
| | $ | 0.58 |
| | $ | 0.58 |
| | $ | 0.58 |
| $ | 0.54 |
| | $ | 0.54 |
| | $ | 0.55 |
| | $ | 0.55 |
|
| Deferred preneed funeral receipts held in trust | 1.27 |
| | 1.29 |
| | 1.22 |
| | 1.18 |
| 1.63 |
| | 1.63 |
| | 1.66 |
| | 1.59 |
|
| | $ | 1.85 |
| | $ | 1.87 |
| | $ | 1.80 |
| | $ | 1.76 |
| 2.17 |
| | 2.17 |
| | 2.21 |
| | 2.14 |
|
| Allowance for cancellation on trust investments | (0.15 | ) | | (0.15 | ) | | (0.13 | ) | | (0.13 | ) | (0.17 | ) | | (0.17 | ) | | (0.19 | ) | | (0.19 | ) |
| Backlog of trust-funded preneed funeral revenues | $ | 1.70 |
| | $ | 1.72 |
| | $ | 1.67 |
| | $ | 1.63 |
| 2.00 |
| | 2.00 |
| | 2.02 |
| | 1.95 |
|
| Backlog of insurance-funded preneed funeral revenues | 3.40 |
| | 3.40 |
| | 3.28 |
| | 3.28 |
| 4.82 |
| | 4.82 |
| | 4.75 |
| | 4.75 |
|
| Total backlog of preneed funeral revenues | $ | 5.10 |
| | $ | 5.12 |
| | $ | 4.95 |
| | $ | 4.91 |
| $ | 6.82 |
| | $ | 6.82 |
| | $ | 6.77 |
| | $ | 6.70 |
|
| | | | | | | | | |
| Preneed funeral receivables and trust investments | $ | 1.48 |
| | $ | 1.50 |
| | $ | 1.42 |
| | $ | 1.40 |
| $ | 1.84 |
| | $ | 1.85 |
| | $ | 1.87 |
| | $ | 1.79 |
|
| Allowance for cancellation on trust investments | (0.14 | ) | | (0.14 | ) | | (0.12 | ) | | (0.12 | ) | (0.16 | ) | | (0.16 | ) | | (0.18 | ) | | (0.18 | ) |
| Assets associated with backlog of trust-funded deferred preneed funeral revenues, net of estimated allowance for cancellation | $ | 1.34 |
| | $ | 1.36 |
| | $ | 1.30 |
| | $ | 1.28 |
| 1.68 |
| | 1.69 |
| | 1.69 |
| | 1.61 |
|
| Insurance policies associated with insurance-funded deferred preneed funeral revenues, net of estimated allowance for cancellation | 3.40 |
| | 3.40 |
| | 3.28 |
| | 3.28 |
| 4.82 |
| | 4.82 |
| | 4.75 |
| | 4.75 |
|
| Total assets associated with backlog of preneed funeral revenues, net of estimated allowance for cancellation | $ | 4.74 |
| | $ | 4.76 |
| | $ | 4.58 |
| | $ | 4.56 |
| $ | 6.50 |
| | $ | 6.51 |
| | $ | 6.44 |
| | $ | 6.36 |
|
| | | | | | | | | |
| Deferred preneed cemetery revenues | $ | 0.83 |
| | $ | 0.83 |
| | $ | 0.81 |
| | $ | 0.81 |
| $ | 1.06 |
| | $ | 1.06 |
| | $ | 1.02 |
| | $ | 1.02 |
|
| Deferred preneed cemetery receipts held in trust | 1.15 |
| | 1.15 |
| | 1.19 |
| | 1.13 |
| 1.52 |
| | 1.53 |
| | 1.58 |
| | 1.41 |
|
| | $ | 1.98 |
| | $ | 1.98 |
| | $ | 2.00 |
| | $ | 1.94 |
| 2.58 |
| | 2.59 |
| | 2.60 |
| | 2.43 |
|
| Allowance for cancellation on trust investments | (0.16 | ) | | (0.16 | ) | | (0.15 | ) | | (0.15 | ) | (0.11 | ) | | (0.11 | ) | | (0.18 | ) | | (0.18 | ) |
| Total backlog of deferred cemetery revenues | $ | 1.82 |
| | $ | 1.82 |
| | $ | 1.85 |
| | $ | 1.79 |
| $ | 2.47 |
| | $ | 2.48 |
| | $ | 2.42 |
| | $ | 2.25 |
|
| | | | | | | | | |
| Preneed cemetery receivables and trust investments | $ | 1.60 |
| | $ | 1.59 |
| | $ | 1.56 |
| | $ | 1.50 |
| $ | 2.31 |
| | $ | 2.32 |
| | $ | 2.29 |
| | $ | 2.12 |
|
| Allowance for cancellation on trust investments | (0.15 | ) | | (0.15 | ) | | (0.16 | ) | | (0.16 | ) | (0.13 | ) | | (0.13 | ) | | (0.19 | ) | | (0.19 | ) |
| Total assets associated with backlog of deferred cemetery revenues, net of estimated allowance for cancellation | $ | 1.45 |
| | $ | 1.44 |
| | $ | 1.40 |
| | $ | 1.34 |
| $ | 2.18 |
| | $ | 2.19 |
| | $ | 2.10 |
| | $ | 1.93 |
|
The marketfair value of our funeral and cemetery trust investments was based on a combination of quoted market prices, observable inputs such as interest rates or yield curves, and appraisals. For more information on how market values are estimated, see Critical Accounting Policies below.Notes 4, 5, and 6 in Part II, Item 8. Financial Statements and Supplementary Data. The difference between the backlog and asset amounts represents the contracts for which we have posted surety bonds as financial assurance in lieu of trusting, the amounts collected from customers that were not required to be deposited into trust, and allowable cash distributions from trust assets. The table also reflects the amounts expected to be received from insurance companies through the assignment of policy proceeds related to insurance-funded funeral contracts.
Trust Investments
In addition to selling our products and services to client families at the time of need, we sell price-guaranteed preneed funeral and cemetery contracts, which provide for future funeral or cemetery merchandise and services. Since preneed funeral and cemetery merchandise or services will generally not be provided until sometime in the future, most states and provinces require that all or a portion of the funds collected from customers on preneed funeral and cemetery contracts be paid into trusts and/or escrow accounts until the merchandise is delivered or the service is performed. Investment earnings associated with the trust investments are expected to mitigate the inflationary costs of providing the preneed funeral and cemetery merchandise and services in the future for the prices that were guaranteed at the time of sale.
Also, we are required by state and provincial law to pay a portion of the proceeds from the preneed or atneed sale of cemetery property interment rights into perpetual care trusts. For these investments, the original corpus remains in the trust in perpetuity and the net ordinary earnings are distributed and are intended to offset the expense to maintain the cemetery property. The majority of states require that net capital gains or losses are retained and added to the corpus, but certain states allow the net realized capital gains and losses to be included in the net ordinary earnings that are distributed.
Independent trustees manage and invest the majority of the funds deposited into the funeral and cemetery merchandise and services trusts as well as the cemetery perpetual care trusts. The majority of trustees are selected based on their respective geographic footprint and qualifications per state and provincial regulations. Most of the trustees engage the same independent investment managers. These trustees, with input from SCI's wholly owned registered investment advisor, establish an investment policy that serves as an operating document to guide the investment activities of the trusts including asset allocation and manager selection. The investments are also governed by state and provincial guidelines. Asset allocation is based on the liability structure of each funeral, cemetery, and perpetual care trust. The investment advisor recommends investment managers to the trustees that are selected on the basis of various criteria set forth in the investment policy. The primary investment objectives for the funeral and cemetery merchandise and service trusts include (1) achieving growth of principal over time sufficient to preserve and increase the purchasing power of the assets and (2) preserving capital within acceptable levels of volatility and risk. Preneed funeral and cemetery contracts generally take years to mature; therefore, the funds associated with these contracts are often invested for several market cycles. The cemetery perpetual care trusts' investment objectives emphasize providing a steady stream of investment income with some capital appreciation. All of the trusts seek to control risk and volatility through a combination of asset classes, investment styles, asset classes, and a diverse mix of investment managers.
During the fourth quarter of 2014 we implemented a change to the legal structure of our trust assets. As part of the change in legal structure, three managed limited liability companies (LLCs), one for each trust type, were established, each with a different, independent trustee acting as a custodian. All US trust assets that were invested in common trust funds and a majority of the trust assets that were invested in institutional mutual funds were liquidated and reinvested in such LLCs. Each financial institution, acting as trustee, manages its allocation of trust assets and compliance with the investment policy through the purchase of these LLCs’ units. For those accounts not eligible for participation in the LLCs or in the event a particular state’s regulations contain investment restrictions, the trustee utilizes institutional mutual funds that comply with our investment policy statement or with such state restrictions. This new legal structure will mitigate certain risks associated with managing our trust assets, as well as provide additional investment and operational efficiencies. Additionally, due to cash distributions to us from the perpetual care trust funds as a result of realizing net capital gains created by the new SCI trust structure, we recognized approximately $15.0 million of perpetual care trust income in the fourth quarter of 2014.
The U.S. trusts also include a modest allocation to alternative investments, which comprise primarily private equity investments. These investments are also structured as limited liability companies and are managed by certain trustees. The trusts that are eligible to invest in alternative investments do so by purchasing units of these alternative investments LLCs.
Fixed Income Securities
Fixed income investments are intended to preserve principal, provide a source of current income, and reduce overall portfolio volatility. The trusts have direct investments primarily in government and corporate fixed income securities.
Canadian government fixed income securities are investments in Canadian federal and provincial government instruments. In many cases, regulatory restrictions mandate that the funds from the sales of preneed funeral and cemetery products sold in certain Canadian jurisdictions must be invested in these instruments.
Equity Securities
Equity investments have historically provided long-term capital appreciation in excess of inflation. The trusts have direct investments primarily in domestic equity portfolios that include large, mid, and small capitalization companies of different investment objectives (i.e., growth and value). The majority of the equity portfolio is managed by multiple institutional investment managers that specialize in an objective-specific area of expertise. Our equity securities are exposed to market risk; however, we believe these securities are well-diversified. As of December 31, 2014, the largest single equity position represented less than 1% of the total equity securities portfolio.
Mutual Funds
The trust funds employ institutional mutual funds where operationally or economically efficient. Institutional mutual funds are utilized to invest in various asset classes including US equities, non-US equities, corporate bonds, government bonds, Treasury inflation protected securities (TIPS), high yield bonds, and commodities. The mutual funds are governed by guidelines outlined in their individual prospectuses.
Private Equity
The objective of these investments is to provide high rates of return with controlled volatility. These investments are typically long-term in duration. These investments are diversified by strategy, sector, manager, and vintage year. Private equity exposure is
typically accessed through alternative investments LLCs established by certain preferred trustees. These LLCs invest in numerous limited partnerships, including private equity, fund of funds, distressed debt, and mezzanine financing. The trustees that have oversight of their respective LLCs work closely with the investment advisor in making all current investment decisions.
Trust Investment Performance
The trust fund income recognized over a period of years from these investment assets can be volatile. During the year ended December 31, 2014, the Standard and Poor’s 500 Index increased 13.7% and the Barclay’s Aggregate Index increased 6.0%, while the combined SCI trust assets increased 4.1%.
SCI, its trustees, and the investment advisor continue to monitor the capital markets and the trusts on an ongoing basis. The trustees, with input from the investment advisor, will take prudent action as needed to achieve the investment goals and objectives of the trusts.
Results of Operations — Years Ended December 31, 2011, 2010,2014, 2013, and 20092012
Results of operations for the years ended December 31, 2013 and 2012 have been revised as described in Note 2 of Part II, Item 8. Financial Statements and Supplementary Data. In addition, the results of operations have been recast to reflect discontinued operations related to our former operations in Germany.
Management Summary
Key developments in 20112014 were as follows:
Funeral gross profit increased $13.7$54.1 million, or 15.5%, primarily due to the contribution of our legacy Stewart funeral homes.
Cemetery gross profit increased $72.7 million, or 36.4%, due to an increase in funeral operating revenue primarily from the Keystone acquisition, higher trust fund income, and higher General Agency revenues, partially offset by higher advertising and selling expenses.
Cemetery gross profit increased $15.6 million due to an increase in preneed property construction and sales production, and trust fund income, partially offset by higher selling related expenses and merchandise costs.
the contribution of our legacy Stewart cemeteries.Results of Operations — Years Ended December 31, 2011, 2010,2014, 2013, and 20092012
In 2011,2014, we reported consolidated net income attributable to common stockholders of $144.9$172.5 million ($0.61 ($0.81 per diluted share) compared to net income attributable to common stockholders in 20102013 of $126.4$147.3 million ($0.50 ($0.68 per diluted share) and net income attributable to common stockholders in 20092012 of $123.1$153.8 million ($0.49 ($0.70 per diluted share). These results were impacted by certain significant items that (decreased) increasedimpacted earnings, including:
| | | | 2011 | | 2010 | | 2009 | 2014 | | 2013 | | 2012 |
| | (Dollars in thousands) | (Dollars in thousands) |
| Net after-tax losses from the sale of assets | $ | (1,774 | ) | | $ | (2,245 | ) | | $ | (1,790 | ) | $ | (3,196 | ) | | $ | (4,505 | ) | | $ | (1,309 | ) |
| After-tax (losses) gains from the early extinguishment of debt, net | $ | (2,184 | ) | | $ | (5,928 | ) | | $ | 2,113 |
| |
| After-tax expenses related to acquisitions | $ | (1,408 | ) | | $ | (9,383 | ) | | $ | (8,235 | ) | |
| Net after-tax (losses) gains from the early extinguishment of debt, net | | $ | (17,997 | ) | | $ | 296 |
| | (14,366 | ) |
| Net after-tax expenses related to system and process transition costs | | $ | (5,671 | ) | | $ | (5,331 | ) | | $ | (5,905 | ) |
| Net after-tax expenses related to the Stewart acquisition and transition costs | | $ | (27,205 | ) | | $ | (33,229 | ) | | $ | — |
|
| Net after-tax expenses related to legal defense fees and labor matters | | $ | (7,421 | ) | | $ | (7,384 | ) | | $ | — |
|
| Change in certain tax reserves and other | $ | (2,629 | ) | | $ | (5,033 | ) | | $ | 1,977 |
| $ | (3,152 | ) | | (1,369 | ) | | $ | 679 |
|
Consolidated Versus Comparable Results — Years Ended December 31, 2011, 2010,2014, 2013, and 20092012
The table below reconciles our consolidated GAAP results to our comparable, or “same store,” results for the years ended December 31, 2011, 2010,2014, 2013, and 2009.2012. We define comparable operations (or same store operations) as those funeral and cemetery locations owned by us for the entire period beginning January 1, 20102013 and ending December 31, 2011.2014. The following tables present operating results for funeral and cemetery locations that were owned by us for these years.
|
| | | | | | | | | | | | | | | | |
| 2011 | | Consolidated | | Less:
Activity
Associated with
Acquisition/New Construction | | Less:
Activity
Associated
with Divestitures | | Comparable |
| | | (Dollars in millions) |
| North America Revenue | | |
| | |
| | |
| | |
|
| Funeral revenue | | $ | 1,566.9 |
| | $ | 146.8 |
| | $ | 3.4 |
| | $ | 1,416.7 |
|
| Cemetery revenue | | 742.5 |
| | 6.0 |
| | 4.4 |
| | 732.1 |
|
| | | 2,309.4 |
| | 152.8 |
| | 7.8 |
| | 2,148.8 |
|
| Germany revenue | | 6.6 |
| | — |
| | — |
| | 6.6 |
|
| Total revenue | | $ | 2,316.0 |
| | $ | 152.8 |
| | $ | 7.8 |
| | $ | 2,155.4 |
|
| North America Gross Profits | | |
| | |
| | |
| | |
|
| Funeral gross profits (losses) | | $ | 330.2 |
| | $ | 25.9 |
| | $ | (0.8 | ) | | $ | 305.1 |
|
| Cemetery gross profits | | 147.8 |
| | 0.5 |
| | 0.4 |
| | 146.9 |
|
| | | 478.0 |
| | 26.4 |
| | (0.4 | ) | | 452.0 |
|
| Germany gross profits | | 0.5 |
| | — |
| | — |
| | 0.5 |
|
| Total gross profits (losses) | | $ | 478.5 |
| | $ | 26.4 |
| | $ | (0.4 | ) | | $ | 452.5 |
|
|
| | | | | | | | | | | | | | | | |
| 2010 | | Consolidated | | Less:
Activity
Associated with
Acquisition/New Construction | | Less:
Activity
Associated
with Divestitures | | Comparable |
| | | (Dollars in millions) |
| North America Revenue | | |
| | |
| | |
| | |
|
| Funeral revenue | | $ | 1,486.3 |
| | $ | 76.3 |
| | $ | 15.0 |
| | $ | 1,395.0 |
|
| Cemetery revenue | | 697.7 |
| | 3.5 |
| | 9.3 |
| | 684.9 |
|
| | | 2,184.0 |
| | 79.8 |
| | 24.3 |
| | 2,079.9 |
|
| Germany revenue | | 6.6 |
| | — |
| | — |
| | 6.6 |
|
| Total revenue | | $ | 2,190.6 |
| | $ | 79.8 |
| | $ | 24.3 |
| | $ | 2,086.5 |
|
| North America Gross Profits | | |
| | |
| | |
| | |
|
| Funeral gross profits (losses) | | $ | 316.1 |
| | $ | 20.0 |
| | $ | (0.9 | ) | | $ | 297.0 |
|
| Cemetery gross profits | | 132.2 |
| | 0.4 |
| | 0.6 |
| | 131.2 |
|
| | | 448.3 |
| | 20.4 |
| | (0.3 | ) | | 428.2 |
|
| Germany gross profits | | 0.9 |
| | — |
| | — |
| | 0.9 |
|
| Total gross profits (losses) | | $ | 449.2 |
| | $ | 20.4 |
| | $ | (0.3 | ) | | $ | 429.1 |
|
|
| | | | | | | | | | | | | | | | |
| 2009 | | Consolidated | | Less:
Activity
Associated with
Acquisition/New Construction | | Less:
Activity
Associated
with Divestitures | | Comparable |
| | | (Dollars in millions) |
| North America Revenue | | |
| | | | |
| | |
|
| Funeral revenue | | $ | 1,385.1 |
| | $ | 0.1 |
| | $ | 24.4 |
| | $ | 1,360.6 |
|
| Cemetery revenue | | 661.6 |
| | — |
| | 15.7 |
| | 645.9 |
|
| | | 2,046.7 |
| | 0.1 |
| | 40.1 |
| | 2,006.5 |
|
| Germany revenue | | 6.8 |
| | — |
| | — |
| | 6.8 |
|
| Total revenue | | $ | 2,053.5 |
| | $ | 0.1 |
| | $ | 40.1 |
| | $ | 2,013.3 |
|
| North America Gross Profits | | |
| | | | |
| | |
|
| Funeral gross profits (losses) | | $ | 305.4 |
| | $ | (0.8 | ) | | $ | (0.7 | ) | | $ | 306.9 |
|
| Cemetery gross profits (losses) | | 115.6 |
| | (0.4 | ) | | 0.5 |
| | 115.5 |
|
| | | 421.0 |
| | (1.2 | ) | | (0.2 | ) | | 422.4 |
|
| Germany gross profits | | 0.4 |
| | — |
| | — |
| | 0.4 |
|
| Total gross profits (losses) | | $ | 421.4 |
| | $ | (1.2 | ) | | $ | (0.2 | ) | | $ | 422.8 |
|
|
| | | | | | | | | | | | | | | | |
| 2014 | | Consolidated | | Less:
Activity
Associated with
Acquisition/New Construction | | Less:
Activity
Associated
with Divestitures | | Comparable |
| | | (Dollars in millions) |
| Revenue | | |
| | |
| | |
| | |
|
| Funeral revenue | | $ | 1,920.5 |
| | $ | 230.8 |
| | $ | 53.9 |
| | $ | 1,635.8 |
|
| Cemetery revenue | | 1,073.5 |
| | 151.6 |
| | 34.4 |
| | 887.5 |
|
| Total revenue | | $ | 2,994.0 |
| | $ | 382.4 |
| | $ | 88.3 |
| | $ | 2,523.3 |
|
| | | | | | | | | |
| Gross profits | | |
| | |
| | |
| | |
|
| Funeral gross profits | | $ | 403.9 |
| | $ | 57.4 |
| | $ | 15.1 |
| | $ | 331.4 |
|
| Cemetery gross profits | | 271.9 |
| | 32.0 |
| | 5.6 |
| | 234.3 |
|
| Total gross profits | | $ | 675.8 |
| | $ | 89.4 |
| | $ | 20.7 |
| | $ | 565.7 |
|
|
| | | | | | | | | | | | | | | | |
| 2013 | | Consolidated | | Less:
Activity
Associated with
Acquisition/New Construction | | Less:
Activity
Associated
with Divestitures | | Comparable |
| | | (Dollars in millions) |
| Revenue | | |
| | |
| | |
| | |
|
| Funeral revenue | | $ | 1,698.5 |
| | $ | 9.8 |
| | $ | 53.6 |
| | $ | 1,635.1 |
|
| Cemetery revenue | | 852.0 |
| | 4.1 |
| | 26.1 |
| | 821.8 |
|
| Total revenue | | 2,550.5 |
| | 13.9 |
| | 79.7 |
| | 2,456.9 |
|
| | | | | | | | | |
| Gross profits | | |
| | |
| | |
| | |
|
| Funeral gross profits | | $ | 349.8 |
| | $ | 1.8 |
| | $ | 13.5 |
| | $ | 334.5 |
|
| Cemetery gross profits (losses) | | 199.2 |
| | (0.2 | ) | | 5.0 |
| | 194.4 |
|
| Total gross profits | | $ | 549.0 |
| | $ | 1.6 |
| | $ | 18.5 |
| | $ | 528.9 |
|
|
| | | | | | | | | | | | |
| 2012 | | Consolidated | | Less:
Activity
Associated
with Divestitures | | Comparable |
| | | (Dollars in millions) |
| Revenue | | |
| | |
| | |
|
| Funeral revenue | | $ | 1,619.7 |
| | $ | 57.5 |
| | $ | 1,562.2 |
|
| Cemetery revenue | | 784.7 |
| | 25.7 |
| | 759.0 |
|
| Total revenue | | $ | 2,404.4 |
| | $ | 83.2 |
| | $ | 2,321.2 |
|
| | | | | | | |
| Gross profits | | |
| | |
| | |
|
| Funeral gross profits | | $ | 347.4 |
| | $ | 12.5 |
| | $ | 334.9 |
|
| Cemetery gross profits | | 175.4 |
| | 3.5 |
| | 171.9 |
|
| Total gross profits | | $ | 522.8 |
| | $ | 16.0 |
| | $ | 506.8 |
|
The following table provides the data necessary to calculate our consolidated average revenue per funeral service for the years ended December 31, 2011, 2010,2014, 2013, and 2009.2012. We calculate average revenue per funeral service by dividing consolidated funeral revenue, excluding General Agency (GA) revenues, recognized preneed revenues, and certain other revenues to avoid distorting our averages of normal funeral services revenue, by the number of funeral services performed during the period. Recognized preneed revenues are preneed sales of merchandise that are delivered at the time of sale, including memorial merchandise and
travel protection insurance, and are excluded from our calculation of consolidated average revenue per funeral service because the associated funeral service has not yet been performed.
| | | | 2011 | | 2010 | | 2009 | 2014 | | 2013 | | 2012 |
| | (Dollars in millions, except average revenue per funeral service) | (Dollars in millions, except average revenue per funeral service) |
| Consolidated funeral revenue | $ | 1,573.5 |
| | $ | 1,492.9 |
| | $ | 1,391.9 |
| $ | 1,920.5 |
| | $ | 1,698.5 |
| | $ | 1,619.7 |
|
| Less: GA revenues | 86.8 |
| | 68.3 |
| | 57.3 |
| |
| Less: Other revenues | 37.1 |
| | 11.2 |
| | 8.4 |
| |
| Adjusted Consolidated funeral revenue | $ | 1,449.6 |
| | $ | 1,413.4 |
| | $ | 1,326.2 |
| |
| Less: Consolidated recognized preneed revenue | | 85.6 |
| | 75.6 |
| | 55.8 |
|
| Less: Consolidated GA revenue | | 123.0 |
| | 106.5 |
| | 94.0 |
|
| Less: Other revenue | | 13.1 |
| | 18.0 |
| | 8.1 |
|
| Adjusted consolidated funeral revenue | | $ | 1,698.8 |
| | $ | 1,498.4 |
| | $ | 1,461.8 |
|
| Consolidated funeral services performed | 277,983 |
| | 270,351 |
| | 258,044 |
| 325,641 |
| | 286,851 |
| | 283,516 |
|
| Consolidated average revenue per funeral service | $ | 5,215 |
| | $ | 5,228 |
| | $ | 5,139 |
| $ | 5,217 |
| | $ | 5,224 |
| | $ | 5,156 |
|
The following table provides the data necessary to calculate our comparable average revenue per funeral service for the years ended December 31, 2011, 2010,2014, 2013, and 2009.2012. We calculate average revenue per funeral service by dividing comparable funeral revenue, excluding General Agency (GA) revenues, recognized preneed revenues, and other revenues to avoid distorting our averages of normal funeral services revenue, by the comparable number of funeral services performed during the period. Recognized preneed revenues are preneed sales of merchandise that are delivered at the time of sale, including memorial merchandise and travel protection insurance, and are excluded from our calculation of comparable average revenue per funeral services because the associated funeral service has not yet been performed.
| | | | 2011 | | 2010 | | 2009 | 2014 | | 2013 | | 2012 |
| | (Dollars in millions, except average revenue per funeral service) | (Dollars in millions, except average revenue per funeral service) |
| Comparable funeral revenue | $ | 1,423.3 |
| | $ | 1,401.6 |
| | $ | 1,367.4 |
| $ | 1,635.8 |
| | $ | 1,635.1 |
| | $ | 1,562.2 |
|
| Less: GA revenues | 84.0 |
| | 66.4 |
| | 56.9 |
| |
| Less: Other revenues | 8.3 |
| | 9.0 |
| | 8.4 |
| |
| Adjusted Comparable funeral revenue | $ | 1,331.0 |
| | $ | 1,326.2 |
| | $ | 1,302.1 |
| |
| Less: Comparable recognized preneed revenue | | 82.0 |
| | 73.8 |
| | 54.5 |
|
| Less: Comparable GA revenue | | 106.1 |
| | 104.0 |
| | 92.0 |
|
| Less: Other revenue | | 10.5 |
| | 9.9 |
| | 7.5 |
|
| Adjusted comparable funeral revenue | | $ | 1,437.2 |
| | $ | 1,447.4 |
| | $ | 1,408.2 |
|
| Comparable funeral services performed | 248,060 |
| | 254,328 |
| | 252,690 |
| 271,255 |
| | 276,260 |
| | 271,998 |
|
| Comparable average revenue per funeral service | $ | 5,366 |
| | $ | 5,215 |
| | $ | 5,153 |
| $ | 5,298 |
| | $ | 5,239 |
| | $ | 5,177 |
|
Funeral Results
Funeral Revenue
Consolidated revenues from funeral operations increased $80.6$222.0 million to $1,573.5$1,920.5 million for the year ended December 31, 20112014 from $1,492.9$1,698.5 million for the same period in 2010.2013. This increase is primarily attributable to the $21.7 million increase in comparable revenues described below and $70.5 million of additional revenues as the result of acquisitions in 2011 and 2010.
These increases were partially offset by a decline of $11.6 million in revenues contributed by non-strategic assets that were divested throughout our legacy Stewart funeral homes.
2011 and 2010. Comparable revenues from funeral operations were $1,423.3$1,635.8 million for the year ended December 31, 20112014 compared to $1,401.6$1,635.1 million for the same period in 2010.2013. This increase was primarily due to the 2.9%1.1% increase in average revenue per funeral service as described below, an increase in recognized preneed revenues of $8.2 million, and a $17.6$2.1 million increase in GA revenues that resulted from increased preneed insurance production.. These increases were partially offset by the 2.5%1.8% decrease in the number of comparable funeral services performed as described below.
Consolidated revenues from funeral operations increased $101.0$78.8 million in 20102013 compared to the same period in 2009.2012. This increase is primarily due to the increase in comparable revenues described below and $76.2$9.8 million of additional revenues as the result of acquisitions in 2010 and 2009,2013, partially offset by a decline of $9.4$3.9 million in revenues contributed by non-strategic assets that were divested throughout 20102013 and 2009.2012. Our comparable funeral revenues increased $34.2$72.9 million,, or 2.5%4.7%, in 20102013 compared to the year ended December 31, 2009same period in 2012 primarily as a result ofdue to the 1.2% increase in the average revenue per funeral service described below andcoupled with a $9.5 million1.6% increase in the number of comparable funeral services performed as well as an increase in recognized preneed revenues of $19.3 million and higher GA revenues that resulted from increased preneed funeral insurance production.of $12.0 million.
Funeral Services Performed
Our consolidated funeral services performed increased 2.8%13.5% during the year ended December 31, 20112014 compared to the same period in 2010,2013, primarily as the result of acquisitions in 2011 and 2010,from services performed by our legacy Stewart funeral homes, partially offset by a 2.5%1.8% decline in comparable funeral services performed noted below. Our comparable funeral services performed decreased 2.5% during the year ended December 31, 2011 compared to the same period in 2010.performed. We believe the decline in deaths in our marketscomparable decrease is consistent with trends experienced by other funeral service providers and industry vendors compared to the year ended December 31, 2010.2013 and is largely a result of a strong flu season in 2013 not recurring in 2014. Our comparable cremation rate of 44.4%51.6% in 20112014 increased from 41.9%50.1% and 41.0%48.2% in 20102013 and 2009,2012, respectively. WeThis growth in comparable cremations was generated mostly by cremations for nontraditional funeral customers. While the average revenue for cremations with service is lower than that for burials, we continue to expand our cremation memorialization productsproduct and services,service offerings, which have resulted in higher average sales for cremation services.
Average Revenue Per Funeral Service
Our consolidated average revenue per funeral service decreased $13 or 0.2%was relatively flat in 20112014 compared to 2010,2013, primarily asdue to the increase in the number of cremations coupled with a result of changeslower average on our Canadian locations due to a decline in product mix.foreign currency exchange rates. Our comparable average revenue per funeral increased $151$59, or 1.1%, or 2.9%in 20112014 compared to the same period in 2010. This increase was primarily attributable to2013. Excluding an $8.1 million ($32 per service) increase in trust fund income, a $6.1 million ($25 per service) favorableunfavorable Canadian currency impact and a 1.8%higher funeral trust fund income, the comparable average revenue per funeral service experienced 1.5% growth despite the increase due to changesin cremation rates. The increase is primarily from expanded new merchandise and service offerings including themed events, unique reception services, customized flower placements, and personalized memorialization in our product mix.cemeteries. Additionally, we have introduced enhanced flexibility in our Dignity packages which makes it easier for customers to customize their choices.
Funeral Gross Profit
Consolidated funeral gross profits increased $13.7$54.1 million in 20112014 compared to the same period in 2010.2013. This increase is primarily attributable to $5.9 million of additional gross profits related to acquisitions that occurred in 2011 and 2010 andcontributions from our legacy Stewart funeral homes, partially offset by the increasedecrease in comparable funeral gross profits described below.
Comparable funeral gross profits increased $7.7decreased $3.1 million,, or 2.6%0.9%, and the comparable gross margin percentage increaseddecreased from 21.3%20.5% to 21.5%20.3% when compared to the same period in 20102013 primarily as a result of a $6.6 million increase in comparable selling costs as a result of planned advertising and media spend and commissions paid for increased preneed production, offset by the increase in comparable revenue described above being partially offset by the following:
and a $13.0 million increasedecline in comparable sellingdirect costs resulting from increased advertising and increased commissions for preneed production. Selling costs are recognized in the period incurred; however, the revenue associatedof service performed, consistent with the preneed production is not recognized until the services are performed as described in Critical Accounting Policies, Recent Accounting Pronouncements, and Accounting Changes below;
a $5.1 million unfavorable Canadian currency impact on expenses; partially offset by
a $4.3 million decrease in merchandise expense.funeral services performed.
Consolidated funeral gross profits increased $11.2$2.4 million, or 0.7%, in 20102013 as compared to 20092012 primarily attributable to $20.8$1.8 million of additional profits related to acquisitions that occurred in 2010 and 2009 and the decrease in comparable funeral gross profits described below.
Gross profit from our comparable funeral locations decreased $9.4 million, or 3.1%, in 2010 compared to 2009. This decrease is primarily a result of the increase in comparable revenue described above being more than offset by;
a $9.7 million increase in comparable selling costs resulting from increased advertising and increased commissions for preneed production. Selling costs are recognized in the period incurred; however, the revenue associated with the preneed production is not recognized until the services are performed as described in Critical Accounting Policies, Recent Accounting Pronouncements, and Accounting Changes below;
a $3.2 million increase in insurance expense as the result of a 2009 favorable adjustment in self-insurance casualty reserves
that did not occur in 2010; and
an $11.5 million unfavorable Canadian currency impact on expenses.2013.
Cemetery Results
Cemetery Revenue
Consolidated revenues from our cemetery operations increased $44.8$221.5 million,, or 6.4%26.0%, in 20112014 compared to 20102013 primarily as a result of the increase in comparable revenues described below and $2.5 million in additional revenues generatedcontributed by acquisitions in 2011our legacy Stewart cemeteries, and 2010, partially offset by a declinean increase of $4.9$8.3 million in revenues contributed by non-strategic assets that were divested throughout 20112014 and 2010.2013. Comparable cemetery revenues increased $47.2$65.7 million,, or 6.9%8.0%, in 20112014 when compared with 2010.2013 primarily as a result of an increase in preneed sales production of developed land and completed cemetery property and recognized trust fund income. Of this increase, $15.0 million of recognized trust fund income was due to cash distributions to us from the perpetual care trust funds as a result of realizing net capital gains created by the new SCI trust structure.
Consolidated revenues from our cemetery operations increased $67.3 million, or 8.6%, in 2013 compared to 2012 primarily as a result of the increase in comparable revenues described below and $4.1 million as the result of acquisitions in 2013. Comparable cemetery revenues increased $62.8 million, or 8.3%, in 2013 when compared with 2012. This increase was primarily driven by a $42.9$47.8 million increase in recognized preneed property revenues as a result of 2011 marketing2013 sales initiatives and a $10.4$10.4 million increase in trust fund income as the result of improved conditions in the equity and debt markets in 20112013 compared to 2010.2012.
Consolidated revenues from our cemetery operations increased $36.1 million, or 5.5%, in 2010 compared to 2009 primarily as a result of the increase in comparable revenues described below and $3.5 million in additional revenues generated by acquisitions in 2010 and 2009, partially offset by a decline of $6.4 million in revenues contributed by non-strategic assets that were divested throughout 2010 and 2009. Comparable cemetery revenues increased $39.0 million, or 6.0%, in 2010 when compared with 2009. This increase was primarily driven by a $21.8 million increase in recognized property revenues as a result of 2010 marketing initiatives and a $7.7 million increase in trust fund income as the result of improved conditions in the equity and debt markets in 2010 compared to 2009.
Cemetery Gross Profits
Consolidated cemetery gross profit increased $15.6$72.7 million,, or 11.8%36.5%, in 20112014 compared to 20102013. This increase is the result of the contributions from our legacy Stewart cemeteries and the increase in comparable gross profits. Comparable cemetery gross profits increased $39.9 million, or 20.5%, and our comparable gross margin percentage increased from 23.7% to 26.4% in 2014 compared to the same period in 2013. This increase is primarily the result of higher revenues described above, partially offset by
a $12.8 million increase in comparable selling costs as a result of planned advertising and media spend and commissions paid for increased preneed production;
a $4.6 million increase in direct property and merchandise costs driven by higher revenues described above;
a $3.3 million increase in utility and maintenance expenses; and
a $3.1 million increase in salaries and other employee-related costs.
Consolidated cemetery gross profit increased $23.8 million, or 13.6%, in 2013 compared to 2012. This increase is the result of the increase in comparable gross profits of $22.5 million, or 13.1%. Our comparable gross margin percentage increased from 22.6% to 23.7% in 2013 compared to the same period in 2012. This increase is primarily the result of the increase in comparable gross profits. Comparable cemetery gross profits increased $15.7 million, or 12.0%, and our comparable gross margin percentage increased from 19.2% to 20.1% in 2011 compared to the same period in 2010. This increase is primarily the result of:
The increase in comparable revenues described above, partially offset by;
a $15.1$16.7 million increase in comparable selling costs stemmingprimarily resulting from increased advertising and increased commissions onfor preneed production;
a $7.9$8.6 million increase in property cost ofgeneral and administrative expenses including employee related costs and other professional fees;
a $7.4 million increase in overhead expenses including investments in our sales as a result of higher property sales;support infrastructure and expenses related to legal defense fees and labor matters; and
a $3.3$4.9 million increase in maintenance expense driven by higher revenues.
Consolidated cemetery gross profit increased $16.6 million, or 14.4%, in 2010 compared to 2009. This increase is primarily the result of the increase in comparable gross profits described below:
a $0.8 million in additional gross profits generated by acquisitions in 2010 and 2009, partially offset by;
a decline of $0.1 million in gross profits contributed by non-strategic assets that were divested throughout 2010 and 2009.
Comparable cemetery gross profits increased $15.7 million, or 13.6%, and our comparable gross margin percentage increased from 17.9% to 19.2% in 2010 compared to the same period in 2009. This increase is primarily the result of:
The increase in comparable revenues described above, partially offset by;
a $12.3 million increase in selling costs stemming from increased advertising and increased commissions on preneed production;
a $2.8 million increase indirect property and merchandise costs driven by higher revenues described above; and
a $3.0 million increase in insurance expense as a result of a 2009 favorable adjustment in self-insurance casualty reserves that did not recur in 2010.
above.Other Financial Statement Items
General and Administrative Expenses
General and administrative expenses increased $0.2were $184.9 million to $103.9 million in 20112014 compared to $103.7$155.1 million in 2010.2013 and $121.9 million in 2012. The increase is primarily due to a $9.02014 amounts included $45.5 million increase in employee-related compensation plan expenses, partially offset by a $6.7 million decrease in acquisition and transition costs primarily related to Stewart, $12.3 million in legal settlements and a $1.8defense fees related to the settlement of the Eden matter and $9.5 million decrease in professional service fees. Generalsystem and
administrative expenses increased $1.2 process transition costs. The 2013 amounts included $36.1 million to $103.7 million in 2010 compared to $102.5 million in 2009. The increase is primarily due to a $4.6 million increase in acquisition and transition costs primarily related to Stewart, $8.2 million in system and a $1.5process transition costs and $5.3 million increase in employee-relatedlegal defense fees. The 2012 amounts included $9.1 million in system and process transition costs. Excluding these costs, general and administrative expenses increased $12.1 million in 2014 compared to 2013 which reflects the overhead cost of the new combined entity, after declining $7.3 million in 2013 compared to 2012 due to lower compensation plan expenses, insurance-related expenses, and tax-related expenses primarily offset by a $5.2 million decrease in professional service fees.expenses.
(Losses) Gains (losses) on Divestitures and Impairment Charges, Net
In 2011,2014, we recognized an $11.0a $116.6 million net pre-tax gain on asset divestitures and impairments primarily as the result of the required Federal Trade Commission divestitures of funeral and cemetery locations in the United States as a result of the Stewart acquisition.
In 2013, we recognized a $6.3 million net pre-tax loss on asset divestitures and impairments. This loss was primarily due to the impairments and asset divestitures associated with non-strategic funeral and cemetery locations in the United States and Canada.
In 2010,2012, we recognized an $8.5a $1.5 million net pre-tax gainloss on asset divestitures and impairments. This gainloss was primarily due to a $6.2 million gain on assets we owned that were divested under our agreementthe impairments and asset divestitures associated with the Federal Trade Commission arising from our acquisition of Keystone North America and net gains of $10.3 million on divestitures of certain non-strategic funeral and cemetery assetslocations in the United States and Canada, partially offset by $8.0 million in impairment charges on certain intangible assets and other asset divestitures.
In 2009, we recognized a $4.3 million net pre-tax gain on asset divestitures and impairments. This gain was primarily due to an $18.8 million release of value-added tax (VAT), Social Security, and litigation indemnifications related to our former French operations, offset by $14.5 million in net losses on asset divestitures and impairment charges.Canada.
Interest Expense
Interest expense increased $5.6$35.2 million to $133.8$177.6 million in 20112014 compared to $142.4 million in 2013. The increase in interest expense is primarily due to incremental debt associated with the Stewart acquisition.
$128.2 millionInterest expense increased $7.3 million to $142.4 million in 2010.2013 compared to $135.1 million in 2012. The increase in interest expense is primarily due to the November 2010 issuance of our 7.0%5.375% Senior Notes due May 2019, partially offset by open market debt repurchases in 2011 and 2010. Certain of these debt repurchases were refinanced through our credit facility, which has a lower interest rate.
Interest expense decreased $0.8 million to $128.2 million in 2010 compared to $129.0 million in 2009. The decrease in interest expense primarily resulted from the retirement of scheduled debt maturities, open market debt repurchases, and a lower weighted average borrowing rate in 2010 compared to 2009.January 2022.
(Losses) Gains on Early Extinguishment of Debt, Net
During 2014, we recognized a $29.2 million loss on early extinguishment of debt as we took advantage of historically low interest rates to refinance our 6.75% Senior Notes due 2015, our 6.5% Senior Notes due 2019, and our 7.0% Senior Notes due 2019.
During 2013, we paid an aggregate of $31.8 million to retire $26.4 million in capital lease obligations, our remaining $4.8 million 7.875% Debenture due February 2013, and to extinguish $0.6 million in other debt. Certain of the above transactions
resulted in the recognition of a gain of $0.5 million recorded in Gains on early extinguishment of debt, net in our consolidated statement of operations.
During 2011,2012, we repaid $20.0 million of amounts drawn onredeemed our bank credit facility and made debt payments of $46.0 million, which included $3.8 million7.375% Senior Notes due October 2014 with an aggregate principal amount of our 7.875% Notes due February 2013, $20.8 million aggregate principal amount of our 6.75% Notes due April 2015, and $15.6 million aggregate principal amount of our 6.75% Notes due April 2016. Certain of the above transactions$180.7 million. This transaction resulted in the recognition of a loss of $3.5$22.7 million recorded in (Losses) gainsLosses on early extinguishment of debt, net in our consolidated statement of operations, which represents the write-off of unamortized deferred loan costs of $0.4$1.3 million and $3.1a make-whole provision of $21.4 million paid in premium oncash upon retiring the purchase of these notes.debt. This refinancing allowed the company to replace 7.375% debt due in 2014 with 4.5% debt due in 2020.
During 2010, we repaid $260 million of amounts drawn on our bank credit facility and made debt payments of $122.2 million, which included $25.5 million aggregate principal amount of our 7.875% Debentures due February 2013, $70.5 million aggregate principal amount of our 7.375% Senior Notes due October 2014, 3.0 million aggregate principal amount of our 6.75% Notes due April 2015, and $20.1 million aggregate principal amount of our 6.75% Notes due April 2016. Certain of the above transactions resulted in the recognition of a loss of $9.4 million recorded in (Losses) gains on early extinguishment of debt, net in our consolidated statement of operations, which represents the write-off of unamortized deferred loan costs of $1.4 million and $8.0 million in premium on the purchase of these notes.
During 2009, we repaid $150.0 million aggregate principal amount of our Series B Senior Notes due November 2011, $23.5 million aggregate principal amount of our 7.875% Debentures due February 2013, $5.0 million aggregate principal amount of our 7.375% Senior Notes due October 2014, $39.8 million aggregate principal amount of our 6.75% Notes due April 2015, $16.9 million aggregate principal amount of our 6.75% Notes due April 2016, and $5.0 million aggregate principal amount of our 7.0% Notes due June 2017. As a result of these transactions, we recognized a gain of $3.1 million during the year ended December 31, 2009, which represents a $5.1 million net discount on the purchase of the notes and the write-off of unamortized deferred loan costs of $2.0 million.
Other (Expense) Income, Net
Other (expense) income, net decreased $3.8 million to $0.8 million expense in 2011 compared to $3.0 million income in 2010, primarily due to an unfavorable foreign currency exchange impact between U.S. and Canadian subsidiaries.
Other (expense) income, net increased $1.7 million to $3.0 million in 2010 compared to $1.3 million in 2009, primarily due to a favorable foreign currency exchange impact from liability settlements between U.S. and Canadian subsidiaries.
Provision for Income Taxes
The 20112014 consolidated effective tax rate was 35.2%56.1%, compared to 42.1%37.9% and 38.3%36.7% in 20102013 and 2009,2012, respectively. We sold our Puerto Rican subsidiaryThe 2014 effective tax rate increased 18.2% over prior year primarily due to non-deductible goodwill resulting from gains on required divestitures associated with the Stewart acquisition and the increase in the third quarterunrecognized tax benefits coupled with higher state tax expenses which are partially offset by state legislative changes and foreign earnings taxed at lower rates.
During 2012, we reached a partial settlement with the Internal Revenue Service ("IRS") in connection with its audit of 2011. Our outsideour affiliate's, SCI Funeral and Cemetery Purchasing Cooperative (the COOP), 2003 - 2005 federal income tax basisreturns. In connection with this settlement we reduced our 2012 tax expense by $3.1 million for adjustments to our "unrecognized tax benefits" - that is, the aggregate tax effect of differences between tax return positions and the benefits recognized in the business was significantly higher than our book basis. Consequently, we recognized a tax loss that was significantly higher than the book loss on the sale which is permanent in nature.financial statements. The decrease in thelower effective tax rate for the year ended December 31, 2011 as compared to2012 includes the previous two years is primarily due tobenefit associated with the closure of that sale.
Our 2010 and 2009 effective tax rates were negatively impacted by permanent book and tax basis differences related to North American asset divestitures. During 2010 we recognized US tax on the post-acquisition integration of certain Keystone entities into SCI's structure. Our overall foreign tax expense increased in 2010 due to an increase in foreign earnings. This increase was partially offset by a decrease in foreign statutory rates. In 2010 our state tax expense was impacted by permanent items affecting our overall effective rate as well as an increase in state statutory tax rates. During 2009 we experienced a decrease in state tax expense due to a restructuring of some of our state operating entities.
During 2010, the Internal Revenue Service approved three requests for tax accounting method changes relating to the recognition of trust earnings accumulated in cemetery and funeral trusts, revenue from preneed sales of cemetery merchandise, and revenue from non-trusted customer payments for preneed funeral contracts. The effective date for these tax accounting method changes is for the fiscal year ended December 31, 2010. In accordance with §481(a) of the US Internal Revenue Code this adjustment recalculates the income previously recognized to determine what should have been recognized under the new tax accounting method. The cumulative impact of these accounting method changes resulted in an adjustment under §481(a) for 2010 of $190.3 million that represents a decrease in current year taxable income, a decrease in a previously recognized deferred tax asset related to deferred revenue, and an increase in our deferred tax asset related to our net operation loss carryover. Although these changes had no tax impact on the overall effective tax rate, there was a savings in cash taxes including a refund of our 2010 Federal estimated tax payments of $7.1 million which was received in 2011.audit.
Weighted Average Shares
The diluted weighted average number of shares outstanding was $236.7214.2 million in 2011,2014, compared to $250.6216.0 million in 2010,2013, and $252.5219.1 million in 2009.2012. The decrease in all years primarily reflects the impact of shares repurchased under our share repurchase program.program and a very minimal amount of shares forfeited by RSA participants for tax payments.
Critical Accounting Policies, Recent Accounting Pronouncements, and Accounting Changes
Our consolidated financial statements are impacted by the accounting policies used and the estimates and assumptions made by management during their preparation. See Note 2 in Part II, Item 8. Financial Statements and Supplementary Data, for more information. Estimates and assumptions affect the carrying values of assets and liabilities and disclosures of contingent assets and liabilities at the balance sheet date. Actual results could differ from such estimates due to uncertainties associated with the methods and assumptions underlying our critical accounting measurements. The following is a discussion of our critical accounting policies pertaining to revenue recognition, business combinations, valuation of goodwill, valuation of intangible assets, valuation of long-lived assets,fair value measurements, loss contract analysis, and the use of estimates, fair value measurements, and non-controlling interests.estimates.
Revenue Recognition
Funeral revenue is recognized when funeral merchandise is delivered or funeral services are performed or funeralperformed. Merchandise delivery and service performance generally take place after the time of need. Delivery of some preneed items, primarily certain memorial merchandise is delivered.and travel protection insurance, are delivered prior to the time of need. We refer to these items as recognized preneed revenue. Our trade receivables primarily consist of amounts due for funeral services already performed.
Revenue associated with cemetery merchandise and services is recognized when merchandise is delivered or the service is performed or merchandise is delivered.
Under the Revenue Recognition Topic of the ASC revenue from constructed cemetery property is not recognized until a minimum percentage of the sales price has been collected. The revenues associated with a preneed cemetery contract, however, may be recognized as different contract events occur. Preneed sales of cemetery interment rights (cemetery burial property) are recognized when a minimum of 10% of the sales price has been collected and the property has been constructed or is available for interment.performed. For services and non-personalized merchandise (such as vaults), and services, we defer the revenues until the merchandise is delivered and the services are performed, andgenerally after the merchandise is delivered.time of need. For personalized marker merchandise, with the customer’s direction generally obtained at the time of sale, we can choose to order, store, and transfer title to the customer. In situations in which we have no further obligation or involvement related to the merchandise, we recognize revenues and record the cost of sales in accordance with the Revenue Recognition Topic of the ASC upon the earlier of vendor storage of these items or delivery in our cemetery. Preneed sales of cemetery interment rights (cemetery burial property) are recognized when a minimum of 10% of the sales price has been collected and the property has been constructed and is available for interment.
Pursuant to state or provincial law, all or a portion of the proceeds from funeral and cemetery merchandise or services sold on a preneed basis may be required to be paid into trust funds. We defer investment earnings related to these merchandise and service trusts until the associated merchandise is delivered or services are performed.
Valuation of Goodwill
We record the excess of purchase price over the fair value of identifiable net assets acquired in business combinations as goodwill. Goodwill is tested annually during the fourth quarter, for impairment by assessing the fair value of each of our reporting units. We test for impairment of goodwill in accordance with the Intangibles Topic of the ASC annually during the fourth quarter.
Our goodwill impairment test involves estimates and management judgment. In the first step of our goodwill impairment test, we compare the fair value of a reporting unit to its carrying amount, including goodwill. We determine fair value of each reporting unit using both a market and income approach. Our methodology considers discounted cash flows and multiples of EBITDA (earnings before interest, taxes, depreciation, and amortization) for both SCI and its competitors.. The discounted cash flow valuation uses projections of future cash flows and includes assumptions concerning future operating performance and economic conditions that may differ from actual future cash flows. We do not record an impairment of goodwill in instances where the fair value of a reporting unit exceeds its carrying amount. If the aggregate fair value is less than the related carrying amount for a reporting unit, we compare the implied fair value of goodwill (as defined in the Intangibles Topic of the ASC) to the carrying amount of goodwill. If the carrying amount of reporting unit goodwill exceeds the implied fair value of that goodwill, an impairment loss is recognized in an amount equal to that excess. Based on our most recent annual impairment test performed during the fourth quarter with amounts recorded as of October 1, 2011, we concluded that there was no impairment of goodwill as of December 31, 2011.
For our most recent annual impairment test performed in the fourth quarter, we used a 7.0% discount rate, growth rates ranging from 2.6%1.9% to 5.6%6.3% over a three-yearfive-year period, plus a terminal value determined using the constant growth method in projecting our future cash flows. We used an 8.5% discount rate, which reflected our weighted average cost of capital based on our capital structure, as adjusted for equity risk premiums. Fair value was calculated as the sum of the projected discounted cash flows of our reporting units over the next threefive years plus terminal value at the end of those threefive years. Our terminal value was calculated using long-term growth rates of 2.6%2.5% and 2.9% for our funeral and cemetery reporting units, respectively.
In addition to our annual review, we assess the impairment of goodwill whenever certain events or changes in circumstances indicate that the carrying value may be greater than fair value. Factors that could trigger an interim impairment review include, but are not limited to, significant underperformance relative to historical or projected future operating results and significant negative industry or economic trends. No interim goodwill impairments reviews were performed in 2011.2014 or 2013.
Valuation of Intangible Assets
Our intangible assets include customer relationships, trademarks and tradenames, and other intangible assets primarily resulting from acquisitions. Our trademark and tradenames and water rightscertain other intangible assets are considered to have an indefinite life and are not subject to amortization. We test for impairment of intangible assets in accordance with the Intangibles Topic of the ASC annually during the fourth quarter.
Our intangible assets impairment tests involve estimates and management judgment. For trademark and tradenames, our test uses the relief from royalty method whereby we determine the fair value of the assets by discounting the cash flows that represent a savings over having to pay a royalty fee for use of the trademark and tradenames. The discounted cash flow valuation uses projections of future cash flows and includes assumptions concerning future operating performance and economic conditions that may differ from actual future cash flows. For our most recent annual impairment test performed in the fourth quarter, using October 1 data, we estimated that the pre-tax savings would be range from 1.0% to 4.0% of the revenues associated with the trademark and tradenames, based primarily on our research of intellectual property valuation and licensing databases. We also assumed a terminal growth rate of 2.6%2.5% and 2.9% for our funeral and cemetery segments, respectively, and discounted the cash flows at an 8.7%a 7.2% discount rate based on the relative risk of these assets to our overall business. Based on our annual impairment test performed during the fourth quarter, we recorded a $1.2 million impairment in (Losses) gains on divestitures and impairment charges, net on certain license assets.
In addition to our annual review, we assess the impairment of intangible assets whenever certain events or changes in circumstances indicate that the carrying value may be greater than the fair value. Factors that could trigger an interim impairment review include, but are not limited to, significant underperformance relative to historical or projected future operating results and significant negative industry or economic trends. No interim intangible impairment reviews were performed in 2011.2014 or 2013.
Valuation of Long-Lived AssetsFair Value Measurements
We reviewmeasure the carryingavailable-for-sale securities held by our funeral merchandise and service, cemetery merchandise and service, and cemetery perpetual care trusts at fair value of our long-lived assets for impairment whenever events or circumstances indicate that the carrying amount of the asset may not be recoverable, in accordance with the Intangibles and Property, Plant, and Equipment Topics of the ASC. This guidance requires that long-lived assets to be held and used are reported at the lower of their carrying amount or fair value.on a recurring basis. Fair value is the price that would be received to sell an asset or paid to transfer a liability in an orderly transaction between market participants at the measurement date. We utilize a three-level valuation hierarchy for disclosure of fair value measurements. The valuation hierarchy is based onupon the transparency of inputs to the valuation of an income approachasset or liability as of the measurement date. The three levels are defined as follows:
Level 1 — inputs to the valuation methodology are quoted prices (unadjusted) for identical assets or liabilities in active markets;
Level 2 — inputs to the valuation methodology include quoted prices for similar assets or liabilities in active markets, and inputs that utilizes projectionsare observable for the asset or liability, either directly or indirectly, for substantially the full term of undiscounted future cash flows expectedthe financial instrument; and
Level 3 — inputs to be generatedthe valuation methodology are unobservable and significant to the fair value measurement.
An asset’s or liability’s categorization within the valuation hierarchy is based upon the lowest level of input that is significant to the fair value measurement. Certain available-for-sale securities held by our long-lived assets.
Assetsfuneral merchandise and service, cemetery merchandise and service, and cemetery perpetual care trusts have been classified in Level 3 of the hierarchy due to be disposedthe significant management judgment required as a result of and assets not expected to provide any future service potential are recorded at the lowerabsence of their carrying amountquoted market prices, inherent lack of liquidity, or fair value less estimated cost to sell.the long-term nature of the securities. For additional information regarding impairment or disposaldisclosures for all of long-lived assets,our available-for-sale securities, see Note 20Notes 4, 5, and 6 in Part II, Item 8. Financial Statements and Supplementary Data.
Loss Contract Analysis
We perform an analysis to determine whether our preneed contracts are in a loss position, which would necessitate a charge to earnings. For this analysis, we add the sales prices of the underlying contracts and net realized earnings, then subtract net unrealized losses to derive the net amount of estimated proceeds for contracts as of the balance sheet date. We consider unrealized gains and losses based on current market prices quoted for the investments, and we do not include future expected returns on the investments in our analysis. We compare our estimated proceeds to the estimated direct costs to deliver our contracts, which consist primarily of funeral and cemetery merchandise costs and salaries, supplies, and equipment related to the delivery of a preneed contract. If a deficiency were to exist, we may record a charge to earnings and a corresponding liability for the expected loss on delivery of those contracts from our backlog. As of December 31, 2011,2014, no such charge was required. Due to the positive margins of our preneed contracts and the trust portfolio returns we have experienced in prior years, we believe there is currently capacity for additional market depreciation before a loss contract would result.
Use of Estimates
The preparation of financial statements in conformity with Generally Accepted Accounting Principles in the United States (GAAP) requires management to make certain estimates and assumptions. These estimates and assumptions affect the carrying values of assets and liabilities and disclosures of contingent assets and liabilities at the balance sheet date. Actual results could differ from such estimates due to uncertainties associated with the methods and assumptions underlying our critical accounting measurements. Key estimates used by management include:
Allowances — We provide various allowances and/or cancellation reserves for our funeral and cemetery preneed and atneed receivables, as well as for our preneed funeral and preneed cemetery deferred revenues. These allowances are based on an analysis of historical trends and include, where applicable, collection and cancellation activity. We also record an estimate of general agency revenues that may be cancelledcanceled in their first year and revenue would be charged back by the insurance company. These estimates are impacted by a number of factors, including changes in economy, relocation, and demographic or competitive changes in our areas of operation.
Valuation of trust investments — The trust investments include marketable securities that are classified as available-for-sale in accordance with the Investments in Debt and Equity Securities Topic of the ASC.available-for-sale. When available, we use quoted market prices for specific securities. When quoted market prices are not available for the specific security, fair values are estimated by using either quoted market prices for securities with similar characteristics or a fair value model with observable inputs that include a combination of interest rates, yield curves, credit risks, prepayment terms, rating, and tax exempt status.
The valuation of private equity and other investments requires significant management judgment due to the absence of quoted market prices, inherent lack of liquidity, and the long-term nature of such assets. The fair value of these investments is estimated based on the market value of the underlying real estate and private equity instruments. The underlying real estate value is determined using the most recent appraisals. The private equity investmentsinstruments are valued using appraisals and a discounted cash flow methodology depending on the underlying assets. The appraisals assess value based on a combination of replacement cost, comparative sales analysis,reported net asset values discounted by 0% to 20% for risk and discounted cash flow analysis. See Fair Value Measurements below0% to 10% for additional information.liquidity.
Legal liability reserves — Contingent liabilities, principally for legal matters, are recorded when it is probable that a liability has been incurred and the amount of the loss can be reasonably estimated in accordance with the Contingencies Topic of the ASC.estimated. Liabilities accrued for legal matters require judgments regarding projected outcomes and a range of loss based on historical experience and recommendations of legal counsel. However, litigation is inherently unpredictable and excessive verdicts do occur. As disclosed in Note 12 in Part II, Item 8. Financial Statements and Supplementary Data, our legal exposures and the ultimate outcome of these legal proceedings could be material to operating results or cash flows in any given quarter or year.
Depreciation of long-lived assets — We depreciate our long-lived assets ratably over their estimated useful lives. These estimates of useful lives may be affected by such factors as changing market conditions or changes in regulatory requirements.
Valuation of assets acquired and liabilities assumed — We have applied the guidance in the Business Combinations Topic of the ASC to our business combinations. Tangible and intangible assets and liabilities assumed are recorded at their fair value and goodwill is recognized for any difference between the price of acquisition and our fair value determination. We have customarily estimated our purchase costs and other related transactions known to us at closing of the acquisition. To the
extent that information not available to us at the closing date subsequently became available during the allocationmeasurement period, we have adjusted our goodwill, assets, or liabilities associated with the acquisition.
Income taxes — We compute income taxes using the liability method. Our ability to realize the benefit of our federal, state, and foreign deferred tax assets requires us to achieve certain future earnings levels. We have established a valuation allowance against a portion of our deferred tax assets and we could be required to further adjust that valuation allowance if market conditions change materially and future earnings are, or are projected to be, significantly different than our current estimates.
During the fourth quarter of 2010 the Company underwent a restructuring of its Canadian subsidiaries. The restructuring triggered a U.S. dividend of $6.9 million for which U.S. federal taxes have been provided for the year ended December 31, 2010. The dividend is less than current year earnings and other prior year earnings required to be permanently reinvested. At December 31, 2011 and 2010, U.S. income taxes had not been provided on $93.0 million and $256.0 million, respectively, of the remaining undistributed earnings of our Canadian subsidiaries. We intend to permanently reinvest these undistributed foreign earnings in those businesses outside the United States. It is not practicable to determine the amount of federal income taxes, if any, that might become due if such earnings are repatriated.
We file income tax returns, including tax returns for our subsidiaries, with U.S. federal, state, local, and foreign jurisdictions. Our tax returns are subject to routine compliance review by the various federal, state, and foreign taxing authorities in the jurisdictions in which we have operated and filedfile tax returns in the ordinary course of business. We accrue tax expense to reduce our tax benefits in those situations where it is more likely than not that we will not prevail against the tax authorities should they challenge the tax return position that gave rise to the benefit. We believe that our tax returns are materially correct as filed, and we will vigorously defend any challenges and proposed adjustments to those filings made by the tax authorities. A number of years may elapse before particular tax matters, for which we have established accruals, are audited and finally resolved. The number of tax years that may be subject to a tax audit varies depending on the tax jurisdiction. Current audits are occurring inconsider the United States to be our most significant tax jurisdiction; however, the taxing authority in Canada is auditing various tax returns. While we have effectively concluded our 2003 - 2005 tax years with respect to our affiliate the COOP, SCI and subsidiaries' tax years 1999 through 2005 remain under review at the IRS Appeals level. SCI and subsidiaries are under audit for 2006-2007 as a result of carry back claims. Furthermore, SCI and its affiliates are under audit by various state and foreign locations covering open taxjurisdiction for years 2010 through 2010. The Internal Revenue Service is in various stages of auditing tax years 1999 through 2005.2012. While it is often difficult to predict the final outcome or the timing of resolution of any particular tax matter, we believe that our accruals reflect the probable outcome of known tax contingencies. Unfavorable settlement of any particular issue would reduce a deferred tax asset or require the payment of cash. Favorable resolution could result in reduced income tax expense reported in the financial statements in the future. Our tax accruals for uncertain tax positions are presented in the balance sheet within Other liabilities.liabilities.
Pension cost — Our pension plans are frozen with no benefits accruing to participants except interest. Pension costs and liabilities are actuarially determined based on certain assumptions, including the discount rate used to compute future benefit obligations. Weighted-average discount rates used to determine net periodic pension cost were 4.41%3.69% and 4.80%2.90% as of December 31, 20112014 and 2010,2013, respectively. We verify the reasonableness of the discount rate by comparing our rate to the rate earned on high-quality fixed income investments, such as the Moody’s Aa index.
Insurance loss reserves — We purchase comprehensive general liability, morticians and cemetery professional liability, automobile liability, and workers’ compensation insurance coverages structured with high deductibles. This high-deductible insurance program means we are primarily self-insured for claims and associated costs and losses covered by these policies. Historical insurance industry experience indicates a high degree of inherent variability in assessing the ultimate amount of losses associated with casualty insurance claims. This is especially true with respect to liability and workers’ compensation exposures due to the extended period of time that transpires between when the claim might occur and the full settlement of such claim, often many years. We continually evaluate loss estimates associated with claims and losses related to these insurance coverages falling within the deductible of each coverage. Assumptions based on factors such as claim settlement patterns, claim development trends, claim frequency and severity patterns, inflationary trends, and data reasonableness will generally affect the analysis and determination of the “best estimate” of the projected ultimate claim losses. The results of these evaluations are used to both analyze and adjust our insurance loss reserves.
As of December 31, 2011,2014, reported losses within our retention for workers’ compensation, general liability, and auto liability incurred during the period May 1, 1991 through December 31, 20112014 were approximately $319.4$477.2 million over 20.823.7 years. The selected fully developed ultimate settlement value estimated was $360.3$531.3 million for the same period. Paid losses were $307.7$457.3 million indicating a reserve requirement of $52.6$74.0 million.
At December 31, 20112014 and 2010,2013, the balances in our reserve for workers’ compensation, general, and auto liability and the related activity were as follows:
| | | | (Dollars in millions) | (Dollars in millions) |
| Balance at December 31, 2009 | $ | 57.9 |
| |
| Balance at December 31, 2012 | | $ | 57.5 |
|
| Additions | 24.2 |
| 26.2 |
|
| Payments | (28.2 | ) | (27.2 | ) |
| Balance at December 31, 2010 | $ | 53.9 |
| |
| Acquisition | | $ | 21.5 |
|
| Balance at December 31, 2013 | | $ | 78.0 |
|
| Additions | 16.9 |
| 29.5 |
|
| Payments | (18.2 | ) | (33.5 | ) |
| Balance at December 31, 2011 | $ | 52.6 |
| |
| Balance at December 31, 2014 | | $ | 74.0 |
|
Fair Value Measurements
We measure the available-for-sale securities held by our funeral merchandise and service, cemetery merchandise and service, and cemetery perpetual care trusts at fair value on a recurring basis in accordance with the Fair Value Measurements Topic of the ASC. This guidance defines fair value as the price that would be received to sell an asset or paid to transfer a liability in an orderly transaction between market participants at the measurement date, establishes a framework for measuring fair value, and expands disclosures about instruments measured at fair value. The guidance establishes a three-level valuation hierarchy for disclosure of fair value measurements. The valuation hierarchy is based upon the transparency of inputs to the valuation of an asset or liability as of the measurement date. The three levels are defined as follows:
Level 1 — inputs to the valuation methodology are quoted prices (unadjusted) for identical assets or liabilities in active markets;
Level 2 — inputs to the valuation methodology include quoted prices for similar assets or liabilities in active markets, and inputs that are observable for the asset or liability, either directly or indirectly, for substantially the full term of the financial instrument; and
Level 3 — inputs to the valuation methodology are unobservable and significant to the fair value measurement.
An asset’s or liability’s categorization within the valuation hierarchy is based upon the lowest level of input that is significant to the fair value measurement. Certain available-for-sale securities held by our funeral merchandise and service, cemetery merchandise and service, and cemetery perpetual care trusts have been classified in Level 3 of the hierarchy due to the significant management judgment required as a result of the absence of quoted market prices, inherent lack of liquidity, or the long-term nature of the securities. For additional disclosures required by FASB guidance for all of our available-for-sale securities, see Notes 4, 5, and 6 in Part II, Item 8. Financial Statements and Supplementary Data.
In January 2010, the Financial Accounting Standards Board (FASB) amended the Fair Value Measurements and Disclosure (FVM&D) Topic of the Accounting Standards Codification (ASC) to require additional disclosures on (1) transfers between levels, (2) Level 3 activity presented on a gross basis, (3) valuation technique, and (4) inputs into the valuation. We adopted Items 1, 3, and 4 during the three months ended March 31, 2010, and the adoption did not impact our unaudited condensed consolidated financial statements. We adopted Item 2 during the three months ended March 31, 2011, and the appropriate disclosures are contained in Notes 4, 5, and 6.
Recent Accounting Pronouncements and Accounting Changes
For discussion of recent accounting pronouncements and accounting changes, see Note 3 in Part II, Item 8. Financial Statements and Supplementary Data.
| |
| Item 7A. | Quantitative and Qualitative Disclosures About Market Risk. |
The market risk inherent in our financial instruments and positions includes the price risk associated with the marketable equity and debt securities included in our portfolio of trust investments, the interest rate risk associated with our floating rate debt, and the currency risk associated with our foreign operations (primarily in Canada).Canadian operations. Our market-sensitive instruments and positions are considered to be “other-than-trading”. Our exposure to market risk as discussed below includes forward-looking statements and represents an estimate of possible changes in fair value or future earnings that might occur, assuming hypothetical changes in equity markets, interest rates, and currencies. Our views on market risk are not necessarily indicative of actual results that may occur, and they do not represent the maximum possible gains or losses that may occur. Actual fair value movements related to changes in equity markets, interest rates and currencies, along with the timing of such movements, may differ from those estimated.
Marketable Equity and Debt Securities — Price Risk
In connection with our preneed funeral operations and preneed cemetery merchandise and service sales, the related funeral and cemetery trust funds own investments in equity and debt securities and mutual funds, which are sensitive to current market prices.
Cost and market values as of December 31, 20112014 are presented in Notes 4, 5, and 6 in Part II, Item 8, Financial Statements and Supplementary Data. Also, see Item 7, Management’s Discussion and Analysis of Financial Condition and Results of Operations, Financial Conditions, Liquidity, and Capital Resources, for discussion of trust investments.
Market-Rate Sensitive Instruments — Interest Rate Risk
At December 31, 20112014 and 2010,2013, approximately 89%75% and 93%76%, respectively, of our total debt consisted of fixed rate debt at a weighted average rate of 6.69%5.21% and 6.80%5.25%, respectively. The fair market value of our debt was $135.1$134.2 million more than its
carrying value at December 31, 2011.2014. A hypothetical 10% increase in interest rates associated with our floating rate debt would increase our interest expense by $0.4$1.6 million. See Note 10 and 11 in Part II, Item 8. Financial Statements and Supplementary Data, for additional information.
Market-Rate Sensitive Instruments — Currency Risk
At December 31, 20112014 and 2010,2013, our foreign currency exposure was primarily associated with the Canadian dollar and the Euro.dollar. A hypothetical 10% adverse change in the strength of the U.S. dollar relative to our foreign currency instruments would have negatively affected our income from our continuing operations, on an annual basis, by $0.9$3.9 million for the year ended December 31, 20112014 and $4.0$4.6 million for the year ended December 31, 2010.2013.
At December 31, 2011,2014, approximately 3%5% of our stockholders’ equity and 14%debt and 8% of our operating income werewas denominated in foreign currencies, primarily the Canadian dollar. Approximately 3% of our stockholders’ equity and debt and 15% of our operating income werewas denominated in foreign currencies, primarily the Canadian dollar, at December 31, 2010.2013. We do not have an investment in foreign operations considered to be in highly inflationary economies.
| |
| Item 8. | Financial Statements and Supplementary Data. |
INDEX TO FINANCIAL STATEMENTS AND RELATED SCHEDULE
|
| |
| | Page |
| Financial Statements: | |
| Report of Independent Registered Public Accounting Firm | |
Consolidated Statement of Operations for the years ended December 31, 2011, 2010,2014, 2013, and 20092012 | |
| Consolidated Statement of Comprehensive Income for the years ended December 31, 2014, 2013, and 2012 | |
Consolidated Balance Sheet as of December 31, 20112014 and 20102013 | |
Consolidated Statement of Cash Flows for the years ended December 31, 2011, 2010,2014, 2013, and 20092012 | |
Consolidated Statement of Equity for the three years ended December 31, 20112014 | |
| Notes to Consolidated Financial Statements | |
| 1. Nature of Operations | |
| 2. Summary of Significant Accounting Policies | |
| 3. Recent Accounting Pronouncements and Accounting Changes | |
| 4. Preneed Funeral Activities | |
| 5. Preneed Cemetery Activities | |
| 6. Cemetery Perpetual Care Trusts | |
| 7. Deferred Preneed Funeral and Cemetery Receipts Held in Trust and Care Trusts’ Corpus | |
| 8. Goodwill and Intangible Assets | |
| 9. Income Taxes | |
| 10. Debt | |
| 11. Credit Risk and Fair Value of Financial Instruments | |
| 12. Commitments and Contingencies | |
| 13. Equity | |
| 14. Share-Based Compensation | |
| 15. Retirement Plans | |
| 16. Segment Reporting | |
| 17. Supplementary Information | |
| 18. Earnings Per Share | |
| 19. Acquisition | |
| 20. Divestiture-Related Activities | |
| 21. Quarterly Financial Data (Unaudited) | |
| Financial Statement Schedule: | |
| II — Valuation and Qualifying Accounts | |
All other schedules have been omitted because the required information is not applicable or is not present in amounts sufficient to require submission or because the information required is included in the consolidated financial statements or the related notes thereto.
REPORT OF INDEPENDENT REGISTERED PUBLIC ACCOUNTING FIRM
Report of Independent Registered Public Accounting Firm
To the Board of Directors and Stockholders of
Service Corporation International:International
In our opinion, the consolidated financial statements listed in the accompanying index present fairly, in all material respects, the financial position of Service Corporation International and its subsidiaries at December 31, 20112014 and 2010,2013, and the results of their operations and their cash flows for each of the three years in the period ended December 31, 20112014 in conformity with accounting principles generally accepted in the United States of America. In addition, in our opinion, the financial statement schedule listed in the accompanying indexpresents fairly, in all material respects, the information set forth therein when read in conjunction with the related consolidated financial statements. Also in our opinion, the Company maintained,did not maintain, in all material respects, effective internal control over financial reporting as of December 31, 2011,2014, based on criteria established in Internal Control - Integrated Framework (2013) issued by the Committee of Sponsoring Organizations of the Treadway Commission (COSO). because a material weakness in internal control over financial reporting related to the failure to design and implement internal controls which address the completion and review of the tax basis balance sheet existed as of that date. A material weakness is a deficiency, or a combination of deficiencies, in internal control over financial reporting, such that there is a reasonable possibility that a material misstatement of the annual or interim financial statements will not be prevented or detected on a timely basis. The material weakness referred to above is described in Management's Report on Internal Control over Financial Reporting appearing under Item 9A. We considered this material weakness in determining the nature, timing, and extent of audit tests applied in our audit of the 2014 consolidated financial statements, and our opinion regarding the effectiveness of the Company’s internal control over financial reporting does not affect our opinion on those consolidated financial statements. The Company's management is responsible for these financial statements and financial statement schedule, for maintaining effective internal control over financial reporting and for its assessment of the effectiveness of internal control over financial reporting included in Management's Report on Internal Control over Financial Reporting appearing under Item 9A.management’s report referred to above. Our responsibility is to express opinions on these financial statements, on the financial statement schedule, and on the Company's internal control over financial reporting based on our integrated audits. We conducted our audits in accordance with the standards of the Public Company Accounting Oversight Board (United States). Those standards require that we plan and perform the audits to obtain reasonable assurance about whether the financial statements are free of material misstatement and whether effective internal control over financial reporting was maintained in all material respects. Our audits of the financial statements included examining, on a test basis, evidence supporting the amounts and disclosures in the financial statements, assessing the accounting principles used and significant estimates made by management, and evaluating the overall financial statement presentation. Our audit of internal control over financial reporting included obtaining an understanding of internal control over financial reporting, assessing the risk that a material weakness exists, and testing and evaluating the design and operating effectiveness of internal control based on the assessed risk. Our audits also included performing such other procedures as we considered necessary in the circumstances. We believe that our audits provide a reasonable basis for our opinions.
A company'scompany’s internal control over financial reporting is a process designed to provide reasonable assurance regarding the reliability of financial reporting and the preparation of financial statements for external purposes in accordance with generally accepted accounting principles. A company'scompany’s internal control over financial reporting includes those policies and procedures that (i) pertain to the maintenance of records that, in reasonable detail, accurately and fairly reflect the transactions and dispositions of the assets of the company; (ii) provide reasonable assurance that transactions are recorded as necessary to permit preparation of financial statements in accordance with generally accepted accounting principles, and that receipts and expenditures of the company are being made only in accordance with authorizations of management and directors of the company; and (iii) provide reasonable assurance regarding prevention or timely detection of unauthorized acquisition, use, or disposition of the company'scompany’s assets that could have a material effect on the financial statements.
Because of its inherent limitations, internal control over financial reporting may not prevent or detect misstatements. Also, projections of any evaluation of effectiveness to future periods are subject to the risk that controls may become inadequate because of changes in conditions, or that the degree of compliance with the policies or procedures may deteriorate.
/s/ PricewaterhouseCoopers LLP
Houston, Texas
February 13, 20122015
SERVICE CORPORATION INTERNATIONAL CONSOLIDATED STATEMENT OF OPERATIONS | SERVICE CORPORATION INTERNATIONAL CONSOLIDATED STATEMENT OF OPERATIONS | SERVICE CORPORATION INTERNATIONAL CONSOLIDATED STATEMENT OF OPERATIONS |
| | | Years Ended December 31, | Years Ended December 31, |
| | 2011 | | 2010 | | 2009 | 2014 | | 2013 | | 2012 |
| | (In thousands, except per share amounts) | (In thousands, except per share amounts) |
| Revenues | $ | 2,316,040 |
| | $ | 2,190,552 |
| | $ | 2,053,520 |
| $ | 2,994,012 |
|
| $ | 2,550,466 |
| | $ | 2,404,430 |
|
| Costs and expenses | (1,837,504 | ) | | (1,741,329 | ) | | (1,632,125 | ) | (2,318,199 | ) |
| (2,001,419 | ) | | (1,881,658 | ) |
| Gross profits | 478,536 |
| | 449,223 |
| | 421,395 |
| 675,813 |
|
| 549,047 |
| | 522,772 |
|
| General and administrative expenses | (103,860 | ) | | (103,689 | ) | | (102,501 | ) | (184,877 | ) |
| (155,128 | ) | | (121,891 | ) |
| (Losses) gains on divestitures and impairment charges, net | (10,977 | ) | | 8,512 |
| | 4,253 |
| |
| Other operating income | — |
| | — |
| | 740 |
| |
| Gains (losses) on divestitures and impairment charges, net | | 116,613 |
|
| (6,263 | ) | | (1,511 | ) |
| Operating income | 363,699 |
| | 354,046 |
| | 323,887 |
| 607,549 |
| | 387,656 |
| | 399,370 |
|
| Interest expense | (133,782 | ) | | (128,196 | ) | | (128,981 | ) | (177,571 | ) |
| (142,360 | ) | | (135,068 | ) |
| (Losses) gains on early extinguishment of debt, net | (3,509 | ) | | (9,400 | ) | | 3,146 |
| (29,158 | ) |
| 468 |
| | (22,706 | ) |
| Other (expense) income, net | (772 | ) | | 3,009 |
| | 1,316 |
| |
| Other income (expense), net | | 1,780 |
|
| (558 | ) | | 3,687 |
|
| Income from continuing operations before income taxes | 225,636 |
| | 219,459 |
| | 199,368 |
| 402,600 |
| | 245,206 |
| | 245,283 |
|
| Provision for income taxes | (79,404 | ) | | (92,458 | ) | | (76,275 | ) | (225,980 | ) |
| (93,024 | ) | | (90,111 | ) |
| Income from continuing operations | | 176,620 |
|
| 152,182 |
| | 155,172 |
|
| Net income from discontinued operations, net of tax | | 2,186 |
|
| 406 |
| | 262 |
|
| Net income | 146,232 |
| | 127,001 |
| | 123,093 |
| 178,806 |
|
| 152,588 |
| | 155,434 |
|
| Net (income) loss attributable to noncontrolling interests | (1,329 | ) | | (584 | ) | | 5 |
| |
| Net income attributable to noncontrolling interests | | (6,337 | ) |
| (5,256 | ) | | (1,589 | ) |
| Net income attributable to common stockholders | $ | 144,903 |
| | $ | 126,417 |
| | $ | 123,098 |
| $ | 172,469 |
|
| $ | 147,332 |
| | $ | 153,845 |
|
| Basic earnings per share: | |
| | |
| | |
| |
| | |
| | |
|
| Net income attributable to common stockholders | $ | 0.62 |
| | $ | 0.51 |
| | $ | 0.49 |
| $ | 0.82 |
| | $ | 0.70 |
| | $ | 0.71 |
|
| Basic weighted average number of shares | 234,242 |
| | 248,871 |
| | 251,709 |
| 210,741 |
|
| 211,811 |
| | 215,712 |
|
| Diluted earnings per share: | |
| | |
| | |
| |
| | |
| | |
|
| Net income attributable to common stockholders | $ | 0.61 |
| | $ | 0.50 |
| | $ | 0.49 |
| $ | 0.81 |
| | $ | 0.68 |
| | $ | 0.70 |
|
| Diluted weighted average number of shares | 236,669 |
| | 250,602 |
| | 252,484 |
| 214,200 |
|
| 216,014 |
| | 219,066 |
|
| Dividends declared per share | $ | 0.20 |
| | $ | 0.16 |
| | $ | 0.16 |
| $ | 0.34 |
| | $ | 0.27 |
| | $ | 0.23 |
|
(See notes to consolidated financial statements)
SERVICE CORPORATION INTERNATIONAL
CONSOLIDATED STATEMENT OF COMPREHENSIVE INCOME
|
| | | | | | | | | | | |
| | | | | | |
| | Years Ended December 31, |
| | 2014 | | 2013 | | 2012 |
| | (In thousands) |
| Net income | $ | 178,806 |
| | $ | 152,588 |
| | $ | 155,434 |
|
| Other comprehensive income: | | | | | |
| Foreign currency translation adjustments | (32,096 | ) | | (23,292 | ) | | 5,892 |
|
| Reclassification of foreign currency translation adjustments to discontinued operations | 3,114 |
| | — |
| | — |
|
| Total comprehensive income | 149,824 |
| | 129,296 |
| | 161,326 |
|
| Total comprehensive income attributable to noncontrolling interests | (6,382 | ) | | (5,240 | ) | | (1,616 | ) |
| Total comprehensive income attributable to common stockholders | $ | 143,442 |
| | $ | 124,056 |
| | $ | 159,710 |
|
(See notes to consolidated financial statements)
SERVICE CORPORATION INTERNATIONAL CONSOLIDATED BALANCE SHEET | SERVICE CORPORATION INTERNATIONAL CONSOLIDATED BALANCE SHEET | SERVICE CORPORATION INTERNATIONAL
CONSOLIDATED BALANCE SHEET |
| | | December 31, | December 31, |
| | 2011 | | 2010 | 2014 | | 2013 |
| | (In thousands, except share amounts) | (In thousands, except share amounts) |
ASSETS | | Current assets: | |
| | |
| |
| | |
|
| Cash and cash equivalents | $ | 128,569 |
| | $ | 170,846 |
| $ | 177,335 |
| | $ | 141,584 |
|
| Receivables, net | 103,892 |
| | 107,185 |
| 109,050 |
| | 101,424 |
|
| Deferred tax assets | 44,316 |
| | 41,371 |
| 1,128 |
| | 30,282 |
|
| Inventories, net | 25,513 |
| | 27,372 |
| 29,697 |
| | 32,741 |
|
| Current assets of discontinued operations | | — |
| | 4,750 |
|
| Current assets held for sale | | 45 |
| | 4,569 |
|
| Other | 25,803 |
| | 27,746 |
| 79,601 |
| | 63,746 |
|
| Total current assets | 328,093 |
| | 374,520 |
| 396,856 |
| | 379,096 |
|
| Preneed funeral receivables, net and trust investments | 1,478,865 |
| | 1,424,557 |
| 1,843,023 |
| | 1,870,243 |
|
| Preneed cemetery receivables, net and trust investments | 1,595,940 |
| | 1,563,893 |
| 2,306,669 |
| | 2,292,348 |
|
| Cemetery property, at cost | 1,497,703 |
| | 1,508,787 |
| 1,739,216 |
| | 1,752,269 |
|
| Property and equipment, net | 1,618,361 |
| | 1,627,698 |
| 1,861,403 |
| | 1,912,514 |
|
| Non-current assets of discontinued operations | | — |
| | 2,491 |
|
| Non-current assets held for sale | | 6,702 |
| | 823,327 |
|
| Goodwill, net | 1,361,493 |
| | 1,307,484 |
| 1,810,853 |
| | 1,825,721 |
|
| Deferred charges and other assets | 430,851 |
| | 396,582 |
| 617,546 |
| | 633,000 |
|
| Cemetery perpetual care trust investments | 1,016,506 |
| | 987,019 |
| 1,341,376 |
| | 1,342,591 |
|
| Total assets | $ | 9,327,812 |
| | $ | 9,190,540 |
| $ | 11,923,644 |
| | $ | 12,833,600 |
|
LIABILITIES & EQUITY | | Current liabilities: | |
| | |
| |
| | |
|
| Accounts payable and accrued liabilities | $ | 358,904 |
| | $ | 342,651 |
| $ | 453,028 |
| | $ | 482,839 |
|
| Current maturities of long-term debt | 23,554 |
| | 22,502 |
| 90,931 |
| | 176,362 |
|
| Current liabilities of discontinued operations | | — |
| | 4,728 |
|
| Current liabilities held for sale | | 14 |
| | 4,390 |
|
| Income taxes | 3,150 |
| | 1,474 |
| 8,035 |
| | 5,263 |
|
| Total current liabilities | 385,608 |
| | 366,627 |
| 552,008 |
| | 673,582 |
|
| Long-term debt | 1,861,116 |
| | 1,832,380 |
| 2,963,794 |
| | 3,125,548 |
|
| Deferred preneed funeral revenues | 575,546 |
| | 580,223 |
| 540,164 |
| | 551,948 |
|
| Deferred preneed cemetery revenues | 833,303 |
| | 813,493 |
| 1,062,381 |
| | 1,016,275 |
|
| Deferred tax liability | 405,615 |
| | 323,303 |
| |
| Deferred tax liabilities | | 448,824 |
| | 387,169 |
|
| Non-current liabilities of discontinued operations | | — |
| | 968 |
|
| Non-current liabilities held for sale | | 6,988 |
| | 517,251 |
|
| Other liabilities | 414,773 |
| | 399,620 |
| 495,565 |
| | 491,238 |
|
| Deferred preneed funeral and cemetery receipts held in trust | 2,424,356 |
| | 2,408,074 |
| 3,148,884 |
| | 3,248,463 |
|
| Care trusts’ corpus | 1,015,300 |
| | 986,872 |
| 1,327,658 |
| | 1,340,930 |
|
| Commitments and contingencies (Note 12) |
|
| |
|
|
|
| |
|
|
| Equity: | |
| | |
| |
| | |
|
| Common stock, $1 per share par value, 500,000,000 shares authorized, 224,665,395 and 242,019,650 shares issued, respectively, and 222,955,853 and 241,035,250 shares outstanding, respectively | 222,956 |
| | 241,035 |
| |
| Common stock, $1 per share par value, 500,000,000 shares authorized, 205,458,331 and 212,326,642 shares issued, respectively, and 204,866,770 and 212,316,642 shares outstanding, respectively | | 204,867 |
| | 212,317 |
|
| Capital in excess of par value | 1,430,330 |
| | 1,603,112 |
| 1,186,304 |
| | 1,259,348 |
|
| Accumulated deficit | (367,044 | ) | | (477,459 | ) | (81,859 | ) | | (90,026 | ) |
| Accumulated other comprehensive income | 105,852 |
| | 112,768 |
| 59,414 |
| | 88,441 |
|
| Total common stockholders’ equity | 1,392,094 |
| | 1,479,456 |
| 1,368,726 |
| | 1,470,080 |
|
| Noncontrolling interests | 20,101 |
| | 492 |
| 8,652 |
| | 10,148 |
|
| Total equity | 1,412,195 |
| | 1,479,948 |
| 1,377,378 |
| | 1,480,228 |
|
| Total liabilities and equity | $ | 9,327,812 |
| | $ | 9,190,540 |
| |
SERVICE CORPORATION INTERNATIONAL
CONSOLIDATED BALANCE SHEET |
| | | | | | | |
| Total liabilities and equity | $ | 11,923,644 |
| | $ | 12,833,600 |
|
(See notes to consolidated financial statements)
SERVICE CORPORATION INTERNATIONAL CONSOLIDATED STATEMENT OF CASH FLOWS |
| | | | | | | | | | | |
| | Years Ended December 31, |
| | 2014 | | 2013 | | 2012 |
| | | | (In thousands) |
| | |
| Cash flows from operating activities: | |
| | |
| | |
|
| Net income | $ | 178,806 |
|
| $ | 152,588 |
| | $ | 155,434 |
|
| Adjustments to reconcile net income to net cash provided by operating activities: | |
|
| |
| | |
|
| Income from discontinued operations, net of tax | (2,186 | ) |
| (406 | ) | | (262 | ) |
| Losses (gains) on early extinguishment of debt, net | 29,158 |
|
| (468 | ) | | 22,706 |
|
| Premiums paid on early extinguishment of debt | (24,804 | ) |
| — |
| | — |
|
| Depreciation and amortization | 140,002 |
|
| 122,235 |
| | 119,862 |
|
| Amortization of intangible assets | 36,640 |
|
| 21,859 |
| | 23,853 |
|
| Amortization of cemetery property | 60,439 |
|
| 48,344 |
| | 44,976 |
|
| Amortization of loan costs | 8,825 |
|
| 15,943 |
| | 4,905 |
|
| Provision for doubtful accounts | 7,376 |
|
| 7,874 |
| | 9,705 |
|
| Provision for deferred income taxes | 129,671 |
|
| 71,708 |
| | 71,685 |
|
| (Gains) losses on divestitures and impairment charges, net | (116,613 | ) |
| 6,263 |
| | 1,511 |
|
| Share-based compensation | 13,127 |
|
| 11,925 |
| | 10,983 |
|
| Excess tax benefits from share-based awards | (30,123 | ) |
| — |
| | — |
|
| Change in assets and liabilities, net of effects from acquisitions and dispositions: |
|
|
|
|
| |
|
|
| (Increase) decrease in receivables | (18,644 | ) |
| 11,017 |
| | (9,782 | ) |
| Increase in other assets | (11,013 | ) |
| (14,815 | ) | | (6,901 | ) |
| (Decrease) increase in payables and other liabilities | (12,038 | ) |
| (1,995 | ) | | 26,360 |
|
| Effect of preneed funeral production and maturities: |
|
|
|
|
| |
|
|
| Decrease in preneed funeral receivables, net and trust investments | 30,357 |
|
| 47,648 |
| | 37,341 |
|
| Decrease in deferred preneed funeral revenues | (23,069 | ) |
| (9,260 | ) | | (41,228 | ) |
| Decrease in deferred preneed funeral receipts held in trust | (52,869 | ) |
| (50,990 | ) | | (22,357 | ) |
| Effect of preneed cemetery production and maturities: |
|
|
|
|
| |
|
|
| Increase in preneed cemetery receivables, net and trust investments | (43,964 | ) |
| (73,626 | ) | | (96,837 | ) |
| Increase in deferred preneed cemetery revenues | 54,049 |
|
| 30,785 |
| | 20,817 |
|
| Decrease in deferred preneed cemetery receipts held in trust | (34,664 | ) |
| (12,761 | ) | | (587 | ) |
| Other | (108 | ) |
| (27 | ) | | (3,684 | ) |
| Net cash provided by operating activities from continuing operations | 318,355 |
|
| 383,841 |
| | 368,500 |
|
| Net cash (used in) provided by operating activities from discontinued operations | (1,000 | ) |
| 868 |
| | 746 |
|
| Net cash provided by operating activities | 317,355 |
|
| 384,709 |
| | 369,246 |
|
| Cash flows from investing activities: |
|
|
|
|
| |
|
|
| Capital expenditures | (144,499 | ) |
| (112,939 | ) | | (115,322 | ) |
| Acquisitions, net of cash acquired | (15,336 | ) |
| (1,057,122 | ) | | (65,463 | ) |
| Proceeds from divestitures and sales of property and equipment | 424,383 |
|
| 13,219 |
| | 9,995 |
|
| Net (deposits) withdrawals of restricted funds and other | (12,225 | ) |
| 341 |
| | (3,815 | ) |
| Net cash provided by (used in) investing activities from continuing operations | 252,323 |
|
| (1,156,501 | ) | | (174,605 | ) |
| Net cash provided by (used in) investing activities from discontinued operations | 4,963 |
|
| (292 | ) | | (349 | ) |
| Net cash provided by (used in) investing activities | 257,286 |
|
| (1,156,793 | ) | | (174,954 | ) |
| Cash flows from financing activities: |
|
|
|
|
| |
|
|
| Proceeds from issuance of long-term debt | 755,000 |
|
| 1,055,000 |
| | 227,507 |
|
| Debt issuance costs | (10,500 | ) |
| (36,064 | ) | | (4,500 | ) |
| Payments of debt | (230,561 | ) |
| (90,466 | ) | | (607 | ) |
| Early extinguishment of debt | (762,764 | ) |
| (80 | ) | | (202,140 | ) |
| Principal payments on capital leases | (29,380 | ) |
| (26,280 | ) | | (25,760 | ) |
| Proceeds from exercise of stock options | 32,376 |
|
| 6,309 |
| | 18,389 |
|
| Excess tax benefits from share-based awards | 30,123 |
|
| — |
| | — |
|
| Purchase of Company common stock | (242,874 | ) |
| (1,708 | ) | | (186,766 | ) |
| Payments of dividends | (71,517 | ) |
| (57,229 | ) | | (60,296 | ) |
| Purchase of noncontrolling interest | (15,000 | ) |
| (23,333 | ) | | (3,000 | ) |
| Bank overdrafts and other | 7,130 |
|
| 336 |
| | 6,199 |
|
| Net cash (used in) provided by financing activities from continuing operations | (537,967 | ) |
| 826,485 |
| | (230,974 | ) |
SERVICE CORPORATION INTERNATIONAL CONSOLIDATED STATEMENT OF CASH FLOWS |
| | | | | | | | | | | |
| Net cash used in financing activities from discontinued operations | — |
|
| (1,370 | ) | | (538 | ) |
| Net cash (used in) provided by financing activities | (537,967 | ) |
| 825,115 |
| | (231,512 | ) |
| Net change in cash of discontinued operations | 1,361 |
|
| 785 |
| | 1,049 |
|
| Effect of foreign currency | (2,284 | ) |
| (1,001 | ) | | 1,287 |
|
| Net increase (decrease) in cash and cash equivalents | 35,751 |
|
| 52,815 |
| | (34,884 | ) |
| Cash and cash equivalents at beginning of period | 141,584 |
|
| 88,769 |
| | 123,653 |
|
| Cash and cash equivalents at end of period | $ | 177,335 |
|
| $ | 141,584 |
| | $ | 88,769 |
|
(See notes to consolidated financial statements)
SERVICE CORPORATION INTERNATIONAL CONSOLIDATED STATEMENT OF CASH FLOWS |
| | | | | | | | | | | |
| | Years Ended December 31, |
| | 2011 | | 2010 | | 2009 |
| | | | (In thousands) |
| | |
| Cash flows from operating activities: | |
| | |
| | |
|
| Net income | $ | 146,232 |
| | $ | 127,001 |
| | $ | 123,093 |
|
| Adjustments to reconcile net income to net cash provided by operating activities: | |
| | |
| | |
|
| Losses (gains) on early extinguishments of debt, net | 3,509 |
| | 9,400 |
| | (3,146 | ) |
| Depreciation and amortization | 118,047 |
| | 116,391 |
| | 111,102 |
|
| Amortization of intangible assets | 25,591 |
| | 25,197 |
| | 21,698 |
|
| Amortization of cemetery property | 40,046 |
| | 32,418 |
| | 30,664 |
|
| Amortization of loan costs | 4,436 |
| | 4,266 |
| | 7,575 |
|
| Provision for doubtful accounts | 9,251 |
| | 8,155 |
| | 11,351 |
|
| Provision for deferred income taxes | 66,512 |
| | 76,934 |
| | 57,866 |
|
| Losses (gains) on divestitures and impairment charges, net | 10,977 |
| | (8,512 | ) | | (4,253 | ) |
| Share-based compensation | 9,144 |
| | 8,878 |
| | 9,684 |
|
| Change in assets and liabilities, net of effects from acquisitions and dispositions: |
|
| |
|
| |
|
|
| Increase in receivables | (3,322 | ) | | (14,561 | ) | | (8,245 | ) |
| Decrease in other assets | 6,815 |
| | 2,603 |
| | 11,161 |
|
| Increase in payables and other liabilities | 14,610 |
| | 16,374 |
| | 30,899 |
|
| Effect of preneed funeral production and maturities: |
|
| |
|
| |
|
|
| Decrease in preneed funeral receivables, net and trust investments | 69,688 |
| | 45,988 |
| | 18,963 |
|
| (Decrease) increase in deferred preneed funeral revenue | (32,158 | ) | | (14,778 | ) | | 92 |
|
| Decrease in deferred preneed funeral receipts held in trust | (50,591 | ) | | (36,322 | ) | | (22,558 | ) |
| Effect of preneed cemetery production and maturities: |
|
| |
|
| |
|
|
| Increase in preneed cemetery receivables, net and trust investments | (65,581 | ) | | (53,224 | ) | | (41,427 | ) |
| Increase in deferred preneed cemetery revenue | 23,636 |
| | 10,558 |
| | 24,999 |
|
| Decrease in deferred preneed cemetery receipts held in trust | (9,419 | ) | | (648 | ) | | (11,702 | ) |
| Other | 689 |
| | (1,739 | ) | | 4,254 |
|
| Net cash provided by operating activities | 388,112 |
| | 354,379 |
| | 372,070 |
|
| Cash flows from investing activities: |
|
| |
|
| |
|
|
| Capital expenditures | (118,375 | ) | | (97,899 | ) | | (83,790 | ) |
| Acquisitions | (99,570 | ) | | (299,083 | ) | | (84,932 | ) |
| Proceeds from divestitures and sales of property and equipment, net | 24,529 |
| | 90,835 |
| | 32,696 |
|
| Net withdrawals (deposits) of restricted funds and other | 3,159 |
| | 26,437 |
| | (16,459 | ) |
| Net cash used in investing activities | (190,257 | ) | | (279,710 | ) | | (152,485 | ) |
| Cash flows from financing activities: |
|
| |
|
| |
|
|
| Proceeds from issuance of long-term debt | 85,000 |
| | 510,000 |
| | 150,000 |
|
| Debt issuance costs | — |
| | (11,828 | ) | | (8,146 | ) |
| Payments of debt | (22,774 | ) | | (263,063 | ) | | (33,058 | ) |
| Early extinguishment of debt | (43,194 | ) | | (119,105 | ) | | (236,114 | ) |
| Principal payments on capital leases | (23,030 | ) | | (46,214 | ) | | (24,288 | ) |
| Proceeds from exercise of stock options | 8,227 |
| | 1,759 |
| | 17,407 |
|
| Purchase of Company common stock | (197,302 | ) | | (116,878 | ) | | — |
|
| Payments of dividends | (44,795 | ) | | (40,001 | ) | | (40,195 | ) |
| Bank overdrafts and other | (798 | ) | | (2,856 | ) | | (4,036 | ) |
| Net cash used in financing activities | (238,666 | ) | | (88,186 | ) | | (178,430 | ) |
| Effect of foreign currency | (1,466 | ) | | 4,618 |
| | 10,193 |
|
| Net (decrease) increase in cash and cash equivalents | (42,277 | ) | | (8,899 | ) | | 51,348 |
|
| Cash and cash equivalents at beginning of period | 170,846 |
| | 179,745 |
| | 128,397 |
|
| Cash and cash equivalents at end of period | $ | 128,569 |
| | $ | 170,846 |
| | $ | 179,745 |
|
(See notes to consolidated financial statements)
SERVICE CORPORATION INTERNATIONAL
CONSOLIDATED STATEMENT OF EQUITY
|
| | | | | | | | | | | | | | | | | | | | | | | | | | | |
| | Common Stock | | Treasury Stock, Par Value | | Capital in Excess of Par Value | | Accumulated Deficit | | Accumulated Other Comprehensive Income | | Noncontrolling Interest | | Total |
| | (In thousands, except per share amounts) |
| Balance at December 31, 2008 | $ | 249,953 |
| | $ | (481 | ) | | $ | 1,733,814 |
| | $ | (726,756 | ) | | $ | 36,649 |
| | $ | — |
| | $ | 1,293,179 |
|
| Comprehensive income: | |
| | |
| | |
| | |
| | |
| | |
| | |
|
| Net income |
|
| |
|
| |
|
| | 123,098 |
| |
|
| | (5 | ) | | 123,093 |
|
| Foreign currency translation |
|
| |
|
| |
|
| |
|
| | 60,493 |
| | 30 |
| | 60,523 |
|
| Total comprehensive income |
|
| |
|
| |
|
| |
|
| |
|
| |
|
| | 183,616 |
|
| Tax benefits related to share-based awards |
|
| |
|
| | 19,059 |
| |
|
| |
|
| |
|
| | 19,059 |
|
| Dividends declared on common stock ($.16 per share) |
|
| |
|
| | (40,381 | ) | |
|
| |
|
| |
|
| | (40,381 | ) |
| Stock option exercises | 3,643 |
| |
|
| | 13,764 |
| |
|
| |
|
| |
|
| | 17,407 |
|
| Restricted stock award, net of forfeitures and other | 830 |
| |
|
| | (830 | ) | |
|
| |
|
| |
|
| | — |
|
| Employee share-based compensation earned |
|
| |
|
| | 9,684 |
| |
|
| |
|
| |
|
| | 9,684 |
|
| Issuance of shares from treasury stock | 1 |
| | 71 |
| | 383 |
| |
|
| |
|
| |
|
| | 455 |
|
| Noncontrolling interest payments |
|
| |
|
| |
|
| |
|
| |
|
| | (231 | ) | | (231 | ) |
| Retirement of treasury shares | (400 | ) | | 400 |
| |
|
| |
|
| |
|
| |
|
| | — |
|
| Other |
|
| |
|
| |
|
| | (218 | ) | |
|
| | 218 |
| | — |
|
| Balance at December 31, 2009 | $ | 254,027 |
| | $ | (10 | ) | | $ | 1,735,493 |
| | $ | (603,876 | ) | | $ | 97,142 |
| | $ | 12 |
| | $ | 1,482,788 |
|
| Comprehensive income: | |
| | |
| | |
| | |
| | |
| | |
| | |
|
| Net income |
|
| |
|
| |
|
| | 126,417 |
| |
|
| | 584 |
| | 127,001 |
|
| Foreign currency translation |
|
| |
|
| |
|
| |
|
| | 15,626 |
| | 9 |
| | 15,635 |
|
| Total comprehensive income |
|
| |
|
| |
|
| |
|
| |
|
| |
|
| | 142,636 |
|
| Tax benefits related to share-based awards |
|
| |
|
| | (229 | ) | |
|
| |
|
| |
|
| | (229 | ) |
| Dividends declared on common stock ($.16 per share) |
|
| |
|
| | (39,442 | ) | |
|
| |
|
| |
|
| | (39,442 | ) |
| Stock option exercises | 431 |
| |
|
| | 1,328 |
| |
|
| |
|
| |
|
| | 1,759 |
|
| Restricted stock awards, net of forfeitures and other | 532 |
| |
|
| | (532 | ) | |
|
| |
|
| |
|
| | — |
|
| Employee share-based compensation |
|
| |
|
| | 8,878 |
| |
|
| |
|
| |
|
| | 8,878 |
|
| Purchase of Company common stock |
|
| | (14,008 | ) | | (102,870 | ) | |
|
| |
|
| |
|
| | (116,878 | ) |
| Noncontrolling interest payments |
|
| |
|
| |
|
| |
|
| |
|
| | (113 | ) | | (113 | ) |
| Retirement of treasury shares | (12,973 | ) | | 12,973 |
| |
|
| |
|
| |
|
| |
|
| | — |
|
| Other | 3 |
| | 60 |
| | 486 |
| |
|
| |
|
| |
|
| | 549 |
|
| Balance at December 31, 2010 | $ | 242,020 |
| | $ | (985 | ) | | $ | 1,603,112 |
| | $ | (477,459 | ) | | $ | 112,768 |
| | $ | 492 |
| | $ | 1,479,948 |
|
| Comprehensive income: | |
| | |
| | |
| | |
| | |
| | |
| | |
|
| Net income |
|
| |
|
| |
|
| | 144,903 |
| |
|
| | 1,329 |
| | 146,232 |
|
| Foreign currency translation |
|
| |
|
| |
|
| |
|
| | (6,916 | ) | | (9 | ) | | (6,925 | ) |
| Total comprehensive income |
|
| |
|
| |
|
| |
|
| |
|
| |
|
| | 139,307 |
|
| Dividends declared on common stock ($.20 per share) |
|
| |
|
| | (46,171 | ) | |
|
| |
|
| |
|
| | (46,171 | ) |
| Stock option exercises | 1,208 |
| |
|
| | 7,019 |
| |
|
| |
|
| |
|
| | 8,227 |
|
| Restricted stock awards, net of forfeitures | 539 |
| |
|
| | (539 | ) | |
|
| |
|
| |
|
| | — |
|
| Employee share-based compensation earned |
|
| |
|
| | 9,144 |
| |
|
| |
|
| |
|
| | 9,144 |
|
| Purchase of Company common stock |
|
| | (19,899 | ) | | (142,915 | ) | | (34,488 | ) | |
|
| |
|
| | (197,302 | ) |
| Acquisition | | | | | | | | | | | 18,857 |
| | 18,857 |
|
| Noncontrolling interest payments |
|
| |
|
| |
|
| |
|
| |
|
| | (568 | ) | | (568 | ) |
| Retirement of treasury shares | (19,174 | ) | | 19,174 |
| |
|
| |
|
| |
|
| |
|
| | — |
|
| Other | 73 |
| |
|
| | 680 |
| |
|
| |
|
| |
|
| | 753 |
|
| Balance at December 31, 2011 | $ | 224,666 |
| | $ | (1,710 | ) | | $ | 1,430,330 |
| | $ | (367,044 | ) | | $ | 105,852 |
| | $ | 20,101 |
| | $ | 1,412,195 |
|
|
| | | | | | | | | | | | | | | | | | | | | | | | | | | |
| | Common Stock | | Treasury Stock, Par Value | | Capital in Excess of Par Value | | Accumulated Deficit(1) | | Accumulated Other Comprehensive Income | | Noncontrolling Interest | | Total |
| | (In thousands, except per share amounts) |
| Balance at December 31, 2011 | $ | 224,666 |
| | $ | (1,710 | ) | | $ | 1,430,330 |
| | $ | (315,977 | ) | | $ | 105,852 |
| | $ | 20,101 |
| | $ | 1,463,262 |
|
| Comprehensive income | — |
| | — |
| | — |
| | 153,845 |
| | 5,865 |
| | 1,616 |
| | 161,326 |
|
| Dividends declared on common stock ($.23 per share) | — |
| | — |
| | (49,253 | ) | | — |
| | — |
| | — |
| | (49,253 | ) |
| Stock option exercises | 2,993 |
| | — |
| | 15,396 |
| | — |
| | — |
| | — |
| | 18,389 |
|
| Restricted stock award, net of forfeitures and other | 483 |
| | — |
| | (483 | ) | | — |
| | — |
| | — |
| | — |
|
| Employee share-based compensation earned | — |
| | — |
| | 10,983 |
| | — |
| | — |
| | — |
| | 10,983 |
|
| Purchase of Company common stock | — |
| | (15,467 | ) | | (99,002 | ) | | (72,297 | ) | | — |
| | — |
| | (186,766 | ) |
| Purchase of noncontrolling interest | — |
| | — |
| | (1,762 | ) | | — |
| | — |
| | (1,238 | ) | | (3,000 | ) |
| Noncontrolling interest payments | — |
| | — |
| | — |
| | — |
| | — |
| | (679 | ) | | (679 | ) |
| Retirement of treasury shares | (17,167 | ) | | 17,167 |
| | — |
| | — |
| | — |
| | — |
| | — |
|
| Other | 82 |
| | — |
| | 849 |
| | — |
| | — |
| | — |
| | 931 |
|
| Balance at December 31, 2012 | $ | 211,057 |
| | $ | (10 | ) | | $ | 1,307,058 |
| | $ | (234,429 | ) | | $ | 111,717 |
| | $ | 19,800 |
| | $ | 1,415,193 |
|
| | |
| | |
| | |
| | |
| | |
| | |
| | |
|
| Comprehensive income | — |
| | — |
| | — |
| | 147,332 |
| | (23,276 | ) | | 5,240 |
| | 129,296 |
|
| Dividends declared on common stock ($.27 per share) | — |
| | — |
| | (57,229 | ) | | — |
| | — |
| | — |
| | (57,229 | ) |
| Stock option exercises | 1,087 |
| | — |
| | 8,226 |
| | — |
| | — |
| | — |
| | 9,313 |
|
| Restricted stock awards, net of forfeitures and other | 378 |
| | (3 | ) | | (375 | ) | | — |
| | — |
| | — |
| | — |
|
| Employee share-based compensation earned | — |
| | — |
| | 11,925 |
| | — |
| | — |
| | — |
| | 11,925 |
|
| Purchase of Company common stock | — |
| | (275 | ) | | (1,508 | ) | | (2,929 | ) | | — |
| | — |
| | (4,712 | ) |
| Purchase of noncontrolling interest | — |
| | — |
| | (10,023 | ) | | — |
| | — |
| | (13,310 | ) | | (23,333 | ) |
| Acquisition | — |
| | — |
| | — |
| | — |
| | — |
| | 118 |
| | 118 |
|
| Noncontrolling interest payments | — |
| | — |
| | — |
| | — |
| | — |
| | (1,700 | ) | | (1,700 | ) |
| Retirement of treasury shares | (278 | ) | | 278 |
| | — |
| | — |
| | — |
| | — |
| | — |
|
| Other | 83 |
| | — |
| | 1,274 |
| | — |
| | — |
| | — |
| | 1,357 |
|
| Balance at December 31, 2013 | $ | 212,327 |
| | $ | (10 | ) | | $ | 1,259,348 |
| | $ | (90,026 | ) | | $ | 88,441 |
| | $ | 10,148 |
| | $ | 1,480,228 |
|
| | |
| | |
| | |
| | |
| | |
| | |
| | |
|
| Comprehensive income | — |
| | — |
| | — |
| | 172,469 |
| | (29,027 | ) | | 6,382 |
| | 149,824 |
|
| Dividends declared on common stock ($.34 per share) | — |
| | — |
| | (71,517 | ) | | — |
| | — |
| | — |
| | (71,517 | ) |
| Stock option exercises | 3,642 |
| | — |
| | 29,495 |
| | — |
| | — |
| | — |
| | 33,137 |
|
| Restricted stock awards, net of forfeitures | 352 |
| | — |
| | (352 | ) | | — |
| | — |
| | — |
| | — |
|
| Employee share-based compensation earned | — |
| | — |
| | 13,127 |
| | — |
| | — |
| | — |
| | 13,127 |
|
| Purchase of Company common stock | — |
| | (11,537 | ) | | (67,796 | ) | | (164,302 | ) | | — |
| | — |
| | (243,635 | ) |
| Tax benefits related to stock-based awards | — |
| | — |
| | 30,123 |
| | — |
| | — |
| | — |
| | 30,123 |
|
| Purchase of noncontrolling interest | — |
| | — |
| | (7,441 | ) | | — |
| | — |
| | (7,559 | ) | | (15,000 | ) |
| Noncontrolling interest payments | — |
| | — |
| | — |
| | — |
| | — |
| | (319 | ) | | (319 | ) |
| Retirement of treasury shares | (10,956 | ) | | 10,956 |
| | — |
| | — |
| | — |
| | — |
| | — |
|
| Other | 93 |
| | — |
| | 1,317 |
| | — |
| | — |
| | — |
| | 1,410 |
|
| Balance at December 31, 2014 | $ | 205,458 |
| | $ | (591 | ) | | $ | 1,186,304 |
| | $ | (81,859 | ) | | $ | 59,414 |
| | $ | 8,652 |
| | $ | 1,377,378 |
|
(1) The statement of equity at December 31, 2011 was adjusted to reflect an increase of $51.1 million to the accumulated deficit as a result of the deferred tax revision discussed in Note 2, Summary of Significant Accounting Policies.
(See notes to consolidated financial statements)
SERVICE CORPORATION INTERNATIONAL
NOTES TO CONSOLIDATED FINANCIAL STATEMENTS
We are North America’s largest provider of deathcare products and services, with a network of funeral service locations and cemeteries primarily operating in the United States and Canada. Our funeral service and cemetery operations consist of funeral service locations, cemeteries, funeral service/cemetery combination locations, crematoria, and related businesses.
Funeral service locationsWe provide all professional services relating to funerals and cremations, including the use of funeral facilities and motor vehicles and preparation and embalming services. Funeral-related merchandise, including caskets, casket memorialization products, burial vaults, cremation receptacles, cremation memorialmemorialization products, flowers, and other ancillary products and services, is sold at funeral service locations. CemeteriesOur cemeteries provide cemetery property interment rights, including developed lots, lawn crypts, mausoleum spaces, lots,cremation niches, and lawn crypts,cremation memorialization property and sell cemetery-related merchandise and services, including stone and bronze memorials, markers, merchandise installations, flowers, and burial openings and closings. We also sell preneed funeral and cemetery productsmerchandise and services whereby a customer contractually agrees to the terms of certain productsmerchandise and services to be provided in the future.
| |
| 2. | Summary of Significant Accounting Policies |
Principles of Consolidation and Basis of Presentation
Our consolidated financial statements include the accounts of Service Corporation International (SCI) and all subsidiaries in which we hold a controlling financial interest. Our financial statements also include the accounts of the funeral merchandise and service trusts, cemetery merchandise and service trusts, and cemetery perpetual care trusts in which we have a variable interest and are the primary beneficiary. Intercompany balances and transactions have been eliminated in consolidation.
Reclassifications and Revision of Prior Period Financial Statements
Certain reclassifications have been made to prior yearsperiod amounts to conform to the current period financial statement presentation with no effect on our previously reported results of operations, consolidated financial position, resultsor cash flows. We sold our German operations and the financial data related to those operations has been reclassified as discontinued operations in all periods. We also retrospectively adjusted the financial statements to reflect measurement period adjustments made throughout 2014 related to our acquisition of Stewart Enterprises (Stewart). For further information on this acquisition and these adjustments, see Note 19.
Additionally, we have revised our prior period amounts to correct for the following:
$30.0 million from Long-term debt to Current maturities of long-term debt in our consolidated balance sheet at December 31, 2013. The original misclassification, which was identified and disclosed in the first quarter of 2014, relates to amounts payable in 2014 for our Term Loan due July 2018.
Misstatements in the determination of certain deferred tax amounts originating in 2013 and prior periods and primarily relating to the 2006 purchase accounting for the acquisition of Alderwoods Group Inc. that were identified during the fourth quarter of 2014. Other adjustments primarily relate to the tax basis of fixed assets, intangibles, and deferred revenue. The correction of these items impacted the consolidated balance sheet as of December 31, 2013 and consolidated statements of operations for the years ended December 31, 2013 and 2012 as presented in the company’s annual report.
We assessed the applicable guidance issued by the Securities and Exchange Commission and Financial Accounting Standards Board (FASB) and concluded that these misstatements were not material to our consolidated financial statements for the aforementioned prior periods; however, we did conclude that correcting these prior misstatements would be material to the full year consolidated statement of operations. As a result of this analysis, all prior period consolidated financial statements have been revised in this Form 10-K filing. Any other changes throughout the remainder of the Form 10-K reflect the changes below. The following is a summary of the consolidated statement of operations, the consolidated balance sheet, and the consolidated statement of cash flows line items impacted by the debt and income tax revisions:
|
| | | | | | | | | | | | | | | |
| |
| Year Ended December 31, 2013 |
| | As previously reported | | Revisions | | Reclassifications | | As revised |
| | (in thousands) |
| Provision for income taxes | $ | (96,615 | ) | | $ | 3,484 |
| | $ | 107 |
| | $ | (93,024 | ) |
| Net income | $ | 149,104 |
| | $ | 3,484 |
| | $ | — |
| | $ | 152,588 |
|
| Net income attributable to common stockholders | $ | 143,848 |
| | $ | 3,484 |
| | $ | — |
| | $ | 147,332 |
|
| Net income attributable to common stockholders per share: | | |
| | | | |
| Basic | $ | 0.68 |
| | $ | 0.02 |
| | $ | — |
| | $ | 0.70 |
|
| Diluted | $ | 0.67 |
| | $ | 0.01 |
| | $ | — |
| | $ | 0.68 |
|
|
| | | | | | | | | | | | | | | |
| |
| | Year Ended December 31, 2012 |
| | As previously reported | | Revisions | | Reclassifications | | As revised |
| | (in thousands) |
| Provision for income taxes | $ | (91,548 | ) | | $ | 1,299 |
| | $ | 138 |
| | $ | (90,111 | ) |
| Net income | $ | 154,135 |
| | $ | 1,299 |
| | $ | — |
| | $ | 155,434 |
|
| Net income attributable to common stockholders | $ | 152,546 |
| | $ | 1,299 |
| | $ | — |
| | $ | 153,845 |
|
| Net income attributable to common stockholders per share: | | | | | | | |
| Basic | $ | 0.71 |
| | $ | — |
| | $ | — |
| | $ | 0.71 |
|
| Diluted | $ | 0.70 |
| | $ | — |
| | $ | — |
| | $ | 0.70 |
|
|
| | | | | | | | | | | | | | | |
| Summary of Revised Consolidated Balance Sheet Amounts |
| | December 31, 2013 |
| | As previously reported | | Revisions | | Reclassifications | | As revised |
| | (in thousands) |
| Deferred tax assets | $ | 39,074 |
| | $ | (3,750 | ) | | $ | (5,042 | ) | | $ | 30,282 |
|
| Total current assets | $ | 393,747 |
| | $ | (3,750 | ) | | $ | (10,901 | ) | | $ | 379,096 |
|
| Goodwill | $ | 1,922,102 |
| | $ | (91,016 | ) | | $ | (5,365 | ) | | $ | 1,825,721 |
|
| Total assets | $ | 12,906,070 |
| | $ | (94,766 | ) | | $ | 22,296 |
| | $ | 12,833,600 |
|
| Current maturities of long-term debt | $ | 146,362 |
| | $ | 30,000 |
| | $ | — |
| | $ | 176,362 |
|
| Income taxes | $ | 6,391 |
| | $ | (1,202 | ) | | $ | 74 |
| | $ | 5,263 |
|
| Total current liabilities | $ | 642,584 |
| | $ | 28,798 |
| | $ | 2,200 |
| | $ | 673,582 |
|
| Long-term debt | $ | 3,155,548 |
| | $ | (30,000 | ) | | $ | — |
| | $ | 3,125,548 |
|
| Deferred tax liabilities | $ | 619,200 |
| | $ | (190,355 | ) | | $ | (41,676 | ) | | $ | 387,169 |
|
| Other liabilities | $ | 430,393 |
| | $ | 40,941 |
| | $ | 19,904 |
| | $ | 491,238 |
|
| Accumulated deficit | $ | (145,876 | ) | | $ | 55,850 |
| | $ | — |
| | $ | (90,026 | ) |
| Total equity | $ | 1,424,378 |
| | $ | 55,850 |
| | $ | — |
| | $ | 1,480,228 |
|
| Total liabilities and equity | $ | 12,906,070 |
| | $ | (94,766 | ) | | $ | 22,296 |
| | $ | 12,833,600 |
|
|
| | | | | | | | | | | | | | | |
Summary of Revised Consolidated Statement of Cash Flows(1) Amounts |
| | Year Ended December 31, 2013 |
| | As previously reported | | Revisions | | Reclassifications | | As revised |
| | (In thousands, except per share amounts) |
| Net income | $ | 149,104 |
| | $ | 3,484 |
| | $ | — |
| | $ | 152,588 |
|
| Adjustments to reconcile net income to net cash provided by operating activities: | | | | | | | |
| Provision for deferred income taxes | $ | 74,100 |
| | $ | (2,282 | ) | | $ | (110 | ) | | $ | 71,708 |
|
| Change in assets and liabilities, net of effects from acquisitions and dispositions: | | | | | | | |
| (Decrease) increase in payables and other liabilities | $ | (284 | ) | | $ | (1,202 | ) | | $ | (509 | ) | | $ | (1,995 | ) |
|
| | | | | | | | | | | | | | | |
Summary of Revised Consolidated Statement of Cash Flows(1) Amounts |
| | Year Ended December 31, 2012 |
| | As previously reported | | Revisions | | Reclassifications | | As revised |
| | (In thousands, except per share amounts) |
| Net income | $ | 154,135 |
| | $ | 1,299 |
| | $ | — |
| | $ | 155,434 |
|
| Adjustments to reconcile net income to net cash provided by operating activities: | | | | | | | |
| Provision for deferred income taxes | $ | 72,984 |
| | $ | (1,299 | ) | | $ | — |
| | $ | 71,685 |
|
| Change in assets and liabilities, net of effects from acquisitions and dispositions: | | | | | | | |
| (Decrease) increase in payables and other liabilities | $ | 25,240 |
| | $ | — |
| | $ | 1,120 |
| | $ | 26,360 |
|
(1) These revisions had no net impact on Net cash provided by operating, investing, or cash flows.financing activities.
Use of Estimates in the Preparation of Financial Statements
The preparation of the consolidated financial statements in conformity with accounting principles generally accepted in the United States of America requires management to make estimates and assumptions that may affect the reported amounts of assets and liabilities and disclosure of contingent assets and liabilities at the date of the consolidated financial statements and the reported amounts of revenues and expenses during the reporting period. As a result, actual results could differ from these estimates.
Cash and Cash Equivalents
We consider all highly liquid investments with an original maturity of three months or less to be cash equivalents. At December 31, 2011, the majority of our cash was invested in commercial paper. The carrying amounts of our cash and cash equivalents approximate fair value due to the short-term nature of these instruments.
Accounts Receivable and Allowance for Doubtful Accounts
Our trade receivables primarily consist of amounts due for funeral services already performed. We provide various allowances and cancellation reserves for our funeral and cemetery preneed and atneed receivables as well as for our preneed funeral and preneed cemetery deferred revenues. These allowances are based on an analysis of historical trends of collection and cancellation activity. Atneed funeral and cemetery receivables are considered past due after 30 days. Collections are generally managed by the locations or third party agencies acting on behalf of the locations, until a receivable is 180 days delinquent at which time it is fully reserved and sent to a collection agency. These estimates are impacted by a number of factors, including changes in the economy, relocation, and demographic or competitive changes in our areas of operation.
Inventories and Cemetery Property
Funeral and cemetery merchandise are stated at the lower of average cost or market. Cemetery property is recorded at cost. Inventory costs and cemetery property are relieved using specific identification in performance of a contract. Amortization expense for cemetery property was $40.0$60.4 million,, $32.4 $48.3 million,, and $30.7$45.0 million for the years ended December 31, 2011, 2010,2014, 2013, and 20092012, respectively.
SERVICE CORPORATION INTERNATIONAL
NOTES TO CONSOLIDATED FINANCIAL STATEMENTS — (Continued)
Property and Equipment, Net
Property and equipment are recorded at cost. Maintenance and repairs are charged to expense whereas renewals and major replacements that extend the assets useful lives are capitalized. Depreciation is recognized ratably over the estimated useful lives of the various classes of assets. Buildings are depreciated over a period ranging from seven to forty years, equipment is depreciated over a period from three to eight years, and leasehold improvements are depreciated over the shorter of the lease term or ten years. Depreciation and amortization expense related to property and equipment was $118.0$140.0 million,, $116.4 $122.2 million,, and $111.1$119.9 million for the years ended December 31, 2011, 2010,2014, 2013, and 2009,2012, respectively. When property is sold or retired, the cost and related accumulated depreciation are removed from the consolidated balance sheet; resulting gains and losses are included in the consolidated statement of operations in the period of sale or disposal.
Leases
We have lease arrangements primarily related to funeral service locations and transportation equipment that were primarily classified as capital leases at December 31, 2011.2014. Lease terms related to funeral home properties generally range from one to 3540 years with options to renew at varying terms. Lease terms related to transportation equipment generally range from one to five years with options to renew at varying terms. We calculate operating lease expense ratably over the lease term. We consider reasonably assured renewal options and fixed escalation provisions in our calculation. For more information related to leases, see Note 12.
Goodwill
The excess of purchase price over the fair value of identifiable net assets acquired in business combinations is recorded as goodwill. Goodwill is tested annually, during the fourth quarter, for impairment by assessing the fair value of each of our reporting units. We performed our annual impairment test of goodwill in accordance with the Intangibles Topic of the Accounting Standards Codification (ASC) during the fourth quarter.
Our goodwill impairment test involves estimates and management judgment. In the first step of our goodwill impairment test, we compare the fair value of a reporting unit to its carrying amount, including goodwill. We determine fair value of each reporting unit using both a market and income approach. Our methodology considers discounted cash flows and multiples of EBITDA (earnings before interest, taxes, depreciation, and amortization) for both SCI and its competitors.. The discounted cash flow valuation uses projections of future cash flows and includes assumptions concerning future operating performance and economic conditions that may differ from actual future cash flows. We do not record an impairment of goodwill in instances where the fair value of a reporting unit exceeds its carrying amount. If the aggregate step one fair value is less than the related carrying amount for a reporting unit, we compare the implied fair value of goodwill (as defined in the Intangibles Topic of the ASC) to the carrying amount of goodwill. If the carrying amount of reporting unit goodwill exceeds the implied fair value of that goodwill, an impairment loss is recognized in an amount equal to that excess. Based on our most recent annual impairment test performed during the fourth quarter, we concluded that there was no impairment of goodwill as of December 31, 2011.
For our most recent annual impairment test performed in the fourth quarter, we used a 7.0% discount rate, growth rates ranging from 2.6%1.9% to 5.6%6.3% over a three-yearfive-year period, plus a terminal value determined using the constant growth method in projecting our future cash flows. We used an 8.5% discount rate, which reflected our weighted average cost of capital based on our capital structure, as adjusted for equity risk premiums. Fair value was calculated as the sum of the projected discounted cash flows of our reporting units over the next threefive years plus terminal value at the end of those threefive years. Our terminal value was calculated using a long-term growth rate of 2.6%2.5% and 2.9% for our funeral and cemetery reporting units, respectively.
In addition to our annual review, we assess the impairment of goodwill whenever certain events or changes in circumstances indicate that the carrying value may be greater than fair value. Factors that could trigger an interim impairment review include, but are not limited to, significant underperformance relative to historical or projected future operating results and significant negative industry or economic trends. No interim goodwill impairment reviews were required in 2011.2014 or 2013. For more information related to goodwill, see Note 8.
Other Intangible Assets
Our intangible assets include customer relationships, trademarks and tradenames, and other intangible assets primarily resulting from acquisitions. Our trademark and tradenames and water rightscertain other intangible assets are considered to have an indefinite life and are not subject to amortization. We test for impairment of intangible assets in accordance with the Intangibles Topic of the ASC annually during the fourth quarter.
Our intangible assets impairment tests involve estimates and management judgment. For trademark and tradenames, our test uses the relief from royalty method whereby we determine the fair value of the assets by discounting the cash flows that represent a savings over having to pay a royalty fee for use of the trademark and tradenames. The discounted cash flow valuation uses
SERVICE CORPORATION INTERNATIONAL
NOTES TO CONSOLIDATED FINANCIAL STATEMENTS — (Continued)
projections of future cash flows and includes assumptions concerning future operating performance and economic conditions that may differ from actual future cash flows. For our most recent annual impairment test performed in the fourth quarter, we estimated that the pre-tax savings would be range from 1.0% to 4.0% of the revenues associated with the trademark and tradenames, based primarily on our research of intellectual property valuation and licensing databases. We also assumed a terminal growth rate of 2.6%2.5% and 2.9% for our funeral and cemetery segments, respectively, and discounted the cash flows at an 8.7%a 7.2% discount rate based on the relative risk of these assets to our overall business. Based on our annual impairment test performed during the fourth quarter, we recorded a $1.2 million impairment on certain intangible assets as of December 31, 2011.
In addition to our annual review, we assess the impairment of intangible assets whenever certain events or changes in circumstances indicate that the carrying value may be greater than the fair value. Factors that could trigger an interim impairment review include, but are not limited to, significant underperformanceunder-performance relative to historical or projected future operating results and significant negative industry or economic trends. No interim intangible impairment reviews were required in 2011.2014 or 2013.
Certain of our customer relationship intangible assets associated with prior acquisitions are relieved using specific identification in performance of a contract. We amortize all other finite-lived intangible assets on a straight-line basis over their estimated useful lives of 5-20which range from two to forty years. For more information related to intangible assets, see Note 8.
Valuation of Long-Lived AssetsFair Value Measurements
We reviewmeasure the carryingavailable-for-sale securities held by our funeral merchandise and service, cemetery merchandise and service, and cemetery perpetual care trusts at fair value of our long-lived assets for impairment whenever events or circumstances indicate that the carrying amount of the asset may not be recoverable, in accordance with the Intangibles and Property, Plant, and Equipment Topic of the ASC. Under this guidance, long-lived assets to be held and used are reported at the lower of their carrying amount or fair value.on a recurring basis. Fair value is based onthe price that would be received to sell an income approach that utilizes projections of undiscounted future cash flows expectedasset or paid to be generated by our long-lived assets. No long-lived asset impairment reviews were requiredtransfer a liability in 2011. While we believe our estimates of undiscounted future cash flows used in performing this test are reasonable, different assumptions regarding such cash flows and comparable sales values could materially affect our evaluations.
Assets to be disposed of and assets not expected to provide any future service potential are recordedan orderly transaction between market participants at the lowermeasurement date. We utilize a three-level valuation hierarchy for disclosure of their carrying amount or fair value less estimated costmeasurements. The valuation hierarchy is based upon the transparency of inputs to sell. We determinedthe valuation of an asset or liability as of the measurement date. The three levels are defined as follows:
Level 1 — inputs to the valuation methodology are quoted prices (unadjusted) for identical assets or liabilities in active markets;
Level 2 — inputs to the valuation methodology include quoted prices for similar assets or liabilities in active markets, and inputs that are observable for the asset or liability, either directly or indirectly, for substantially the full term of the financial instrument; and
Level 3 — inputs to the valuation methodology are unobservable and significant to the fair value measurement.
An asset’s or liability’s categorization within the valuation hierarchy is based upon the lowest level of assetsinput that is significant to be disposedthe fair value measurement. Certain available-for-sale securities held by our funeral merchandise and service, cemetery merchandise and service, and cemetery perpetual care trusts have been classified in Level 3 of usingthe hierarchy due to the significant management judgment required as a result of the absence of quoted market approach. See Note 20prices, inherent lack of liquidity, or the long-term nature of the securities. For additional disclosures for additional information related to assets to be disposed.all of our available-for-sale securities, see Notes 4, 5, and 6.
Treasury Stock
We make treasury stock purchases in the open market or through privately negotiated transactions subject to market conditions and normal trading restrictions. We account for the repurchase of our common stock under the par value method. We use the average cost method upon the subsequent reissuance of treasury shares. On December 15, 2011,In 2014, we cancelled 19.2canceled 10.9 million shares of common stock held in our treasury. We cancelled 13.0canceled 0.3 million and 0.417.2 million shares of common stock held in our treasury in 20102013 and 2009,2012, respectively. These retired treasury shares were changed to authorized but unissued status.
Foreign Currency Translation
All assets and liabilities of our foreign subsidiaries are translated into U.S. dollars at exchange rates in effect as of the end of the reporting period. Revenue and expense items are translated at the average exchange rates for the reporting period. The resulting translation adjustments are included in Equity as a component of Accumulated other comprehensive income in the consolidated statement of equity and consolidated balance sheet.
The functional currency of SCI and its subsidiaries is the respective local currency. The transactional currency gains and losses that arise from transactions denominated in currencies other than the functional currencies of our operations are recorded in Other (expenses) income (expense), net in the consolidated statement of operations. We do not have an investment in foreign operations considered to be in highly inflationary economies.
Fair Value Measurements
We measure the available-for-sale securities held by our funeral merchandise and service, cemetery merchandise and service, and cemetery perpetual care trusts at fair value on a recurring basis in accordance with the Fair Value Measurements and Disclosure (FVM&D) Topic of the ASC. This guidance defines fair value as the price that would be received to sell an asset or paid to transfer a liability in an orderly transaction between market participants at the measurement date, establishes a framework for measuring fair value, and expands disclosures about instruments measured at fair value. The guidance establishes a three-level valuation hierarchy for disclosure of fair value measurements. The valuation hierarchy is based upon the transparency of inputs to the valuation of an asset or liability as of the measurement date. The three levels are defined as follows:
SERVICE CORPORATION INTERNATIONAL
NOTES TO CONSOLIDATED FINANCIAL STATEMENTS — (Continued)
Level 1 — inputs to the valuation methodology are quoted prices (unadjusted) for identical assets or liabilities in active markets;
Level 2 — inputs to the valuation methodology include quoted prices for similar assets or liabilities in active markets, and inputs that are observable for the asset or liability, either directly or indirectly, for substantially the full term of the financial instrument; and
Level 3 — inputs to the valuation methodology are unobservable and significant to the fair value measurement.
An asset’s or liability’s categorization within the valuation hierarchy is based upon the lowest level of input that is significant to the fair value measurement. Certain available-for-sale securities held by our funeral merchandise and service, cemetery merchandise and service, and cemetery perpetual care trusts have been classified in Level 3 of the hierarchy due to significant management judgment required as a result of the absence of quoted market prices, inherent lack of liquidity, or the long-term nature of the securities. For additional disclosures required by FASB guidance for all of our available-for-sale securities, see Notes 4, 5, and 6.
In January 2010, the Financial Accounting Standards Board (FASB) amended the Fair Value Measurements and Disclosure (FVM&D) Topic of the Accounting Standards Codification (ASC) to require additional disclosures on (1) transfers between levels, (2) Level 3 activity presented on a gross basis, (3) valuation technique, and (4) inputs into the valuation. We adopted Items 1, 3, and 4 during the three months ended March 31, 2010, and the adoption did not impact our unaudited condensed consolidated financial statements. We adopted Item 2 during the three months ended March 31, 2011, and the appropriate disclosures are contained in Notes 4, 5, and 6.
Funeral Operations
Revenue is recognized when funeral merchandise is delivered or funeral services are performed or funeral merchandise is delivered.performed. We sell price-guaranteed preneed funeral contracts through various programs providing for future funeral services at prices prevailing when the agreements are signed. Revenue associated with sales of preneed funeral contracts is deferred until such time thatfuneral merchandise is delivered or the funeral services are performed, or funeralgenerally at the time of need. Travel protection insurance and certain memorialization merchandise is delivered. Sales taxes collected are recognizedsold on a netpreneed basis is delivered to the customer at the time of sale and is recognized at the time delivery has occurred. While these items are sold as part of preneed funeral arrangements they are also offered on a stand-alone basis. The total consideration received for these arrangements is allocated to each item based on relative selling price determined using either vendor specific objective evidence of the selling price or third-party evidence of selling price. Vendor specific objective evidence of the selling price is determined based on the price we sell the items for on a stand-alone basis. Third-party evidence of selling price is based on the price of our largely interchangeable products that are sold in our consolidated financial statements.stand-alone sales to similarly situated customers. There is no general right of return for delivered items.
Pursuant to state or provincial law, all or a portion of the proceeds from funeral merchandise or services sold on a preneed basis may be required to be paid into trust funds. We defer investment earnings related to these merchandise and service trusts until the associated merchandise is delivered or services are performed. Costs related to sales of merchandise and services are charged to expense when merchandise is delivered or services are performed. Sales taxes collected are recognized on a net basis in our consolidated financial statements. See Note 4 for more information regarding preneed funeral activities.
Cemetery Operations
Revenue associated with sales of cemetery merchandise and services is recognized when merchandise is delivered or the service is performed or merchandise is delivered.performed. Revenue associated with sales of preneed cemetery property interment rights is recognized in accordance withdeferred until the Revenue Recognition Topic of the ASC. Under this guidance, revenue related to the preneed sale of unconstructed cemetery property is deferred until it is constructed and a minimum of 10% of the sales price is collected. For services and non-personalized merchandise (such as vaults), and services, we defer the revenues until the merchandise is delivered or the services are performed or the merchandise is delivered.performed. For personalized marker merchandise, with the customer’s direction generally obtained at the time of sale, we can choose to order, store, and transfer title to the customer. In situations in which we have no further obligation or involvement related to the merchandise, we recognize revenues and record the cost of sales in accordance with the Revenue Recognition Topic of the ASC upon the earlier of vendor storage of these items or delivery in our cemetery. Sales taxes collected are recognizedThe total consideration received for these arrangements is allocated to each item based on relative selling price determined using vendor specific objective evidence of the selling price. Vendor specific objective evidence of the selling price is determined based on the price we sell the items for on a net basis in our consolidated financial statements.stand-alone basis. There is no general right of return for delivered items.
Pursuant to state or provincial law, all or a portion of the proceeds from cemetery merchandise or services sold on a preneed basis may be required to be paid into trust funds. We defer investment earnings related to these merchandise and services trusts until the associated merchandise is delivered or services are performed.
A portion of the proceeds from the sale of cemetery property interment rights is required by state or provincial law to be paid into perpetual care trust funds. Investment earnings from these trusts are distributed to us regularly, are recognized in current cemetery revenues, and are intended to defray cemetery maintenance costs, which are expensed as incurred. The principal of such perpetual care trust funds generally cannot be withdrawn.
Costs related to the sale of property interment rights include the property and construction costs specifically identified by project. At the completion of the project,Property and construction costs are charged to expense when the revenue is recognized by specific identification in the same period revenue is recognized.performance of a contract. Costs related to sales of merchandise and services are charged to expense when merchandise is delivered or when services are performed.
SERVICE CORPORATION INTERNATIONAL
NOTES TO CONSOLIDATED FINANCIAL STATEMENTS — (Continued)
Sales taxes collected are recognized on a net basis in our consolidated financial statements. See Notes 5 and 6 for more information regarding preneed cemetery and perpetual care activities.
Preneed Funeral and Cemetery Receivables
We sell preneed funeral and cemetery contracts whereby the customer enters into arrangements for future merchandise and services prior to the time of need. As these contracts are entered into prior to the delivery of the related goodsmerchandise and services, the preneed funeral and cemetery receivables are offset by a comparable deferred revenue amount. These receivables have an interest component for which interest income is recorded when the interest amount is considered collectible and realizable, which typically coincides with cash payment. We do not accrue interest on financing receivables that are not paid in accordance with the contractual payment date given the nature of our goodsmerchandise and services, the nature of our contracts with customers, and the timing of the delivery of our services. We do not consider receivables to be past due until the servicemerchandise or goodsservices are required to be delivered at which time the preneed receivable is paid or reclassified as a trade receivable with payment terms of less than 30 days. As the preneed funeral and cemetery receivables are offset by comparable deferred revenue amount,amounts, we have no risk of loss related to these receivables.
If a preneed contract is cancelledcanceled prior to delivery, state or provincial law determines the amount of the refund owed to the customer, if any, including the amount of the attributed investment earnings. Upon cancellation, we receive the amount of principal deposited to the trust and previously undistributed net investment earnings and, where required, issue a refund to the customer. We retain excess funds, if any, and recognize the attributed investment earnings (net of any investment earnings payable to the customer) as revenue in the consolidated statement of operations. In certain jurisdictions, we may be obligated to fund any shortfall if the amount deposited by the customerscustomer exceed the funds in trust. Based on our historical experience, we have provided an allowance for cancellation of these receivables, which is recorded as a reduction in receivables with a corresponding offset to deferred revenue.
Income Taxes
We compute income taxes using the liability method. Our ability to realize the benefit of our federal and state deferred tax assets requires us to achieve certain future earnings levels. We have established a valuation allowance against a portion of our deferred tax assets and we could be required to further adjust that valuation allowance if market conditions change materially and future earnings are, or are projected to be, significantly different than our current estimates.
Stock-Based Compensation60
In April 2010,July 2013, the FASB issued additional guidance forFinancial Accounting Standards Board (FASB) amended the Compensation — Stock CompensationIncome Taxes Topic of the ASCAccounting Standards Codification (ASC) to clarify classificationeliminate a diversity in practice for the presentation of an employee stock-based payment awardunrecognized tax benefits when net operating loss carryforwards, similar tax losses, or tax credit carryforwards exist. The amendment requires that the exercise price is denominatedunrecognized tax benefit be presented as a reduction of the deferred tax assets associated with the carryforwards except in the currency ofcertain circumstances when it would be reflected as a market in which the underlying equity security trades. This guidance becameliability. We adopted this amendment effective for us at January 1, 2011. The adoption did not2014 with no impact on our unaudited condensedconsolidated results of operations, consolidated financial statements.
Multi-Deliverable Arrangements
In October 2009, the FASB issued authoritative guidance that impacts the recognition of revenue in multi-deliverable arrangements. The guidance establishes a selling-price hierarchy for determining the selling price of a deliverable. The goal of this guidance is to clarify disclosures related to multi-deliverable arrangements and to align the accounting with the underlying economics of the multi-deliverable transaction. This guidance became effective for us in the first quarter of 2011, and its adoption did not impact our unaudited condensed consolidated financial statements.
position, or cash flows.
| |
| 3. | Recent Accounting Pronouncements and Accounting Changes |
Fair Value MeasurementsDiscontinued Operations
In May 2011,April 2014, the FASB amended the FVM&D TopicPresentation of Financial Statements and Property, Plant, and Equipment Topics of the ASCAccounting Standards Codification (ASC) to change the requirement for reporting discontinued operations. Under the new guidance, a disposal of a component of an entity is required to be reported in discontinued operations if the disposal represents a strategic shift that expands disclosures about items markedhas (or will have) a major effect on an entity’s operations and financial results. Fewer disposals are expected to fair value that are categorized within Level 3 ofqualify as discontinued operations under the fair value hierarchy to include qualitative explanations of the valuation methodology used and sensitivity analysis of the inputs into the valuation. The amendmentnew guidance. It also requires the disclosure of pretax income of disposals that itemsdo not qualify as discontinued operations. The new guidance is effective with disposals that are not measured at fair value but foroccur after January 1, 2015.
Revenue Recognition
In May 2014, the FASB issued Accounting Standards Update (ASU) No. 2014-09, “Revenue from Contracts with Customers” (Topic 606), which supersedes the revenue recognition requirements in ASC Topic 605, “Revenue Recognition”, and most industry-specific guidance. This ASU is based on the principle that revenue is recognized to depict the transfer of goods or services to customers in an amount that reflects the consideration to which the fair valueentity expects to be entitled in exchange for those goods or services. The ASU also requires additional disclosure about the nature, amount, timing and uncertainty of revenue and cash flows arising from customer contracts, including significant judgments and changes in judgments and assets recognized from costs incurred to obtain or fulfill a contract. Additionally, the ASU requires the deferral of direct incremental selling costs to the period in which the underlying revenue is disclosed also disclose the levelrecognized. The amendments in the fair value hierarchy in which those items were categorized.ASU will be applied using one of two retrospective methods. The amendednew guidance is effective for us in the first quarter of 2012beginning January 1, 2017 and we do not believe that this guidance will have anyare still evaluating the impact of adoption on our consolidated financial condition or results of operations.
Comprehensive Income
In June 2011, the FASB amended the Comprehensive Income Topic of the ASC to require the disclosure of the components of other comprehensive income, which we currently disclose elsewhere in our filings, be shown as either part of one statement of
SERVICE CORPORATION INTERNATIONAL
NOTES TO CONSOLIDATED FINANCIAL STATEMENTS — (Continued)
comprehensive income or as a separate statement of other comprehensive income immediately following the income statement. The amended guidance is effective for us in the first quarter of 2012 and will not have any impact on our consolidated financial condition or results of operations.
Goodwill Testing
In September 2011, the FASB amended the Intangibles - Goodwill and Other Topic of the ASC that allows us to make a qualitative assessment of whether it is more likely than not that the fair value of a reporting unit is less than its carrying amount, including goodwill. If, after assessing the relevant information, we determine it is more likely than not that the fair value is more than the carrying amount, no additional work is necessary. If we determine it is more likely than not that the fair value is less than the carrying amount, then we are required to proceed to the quantitative approach. The amended guidance is effective for us in our annual test in the fourth quarter of 2012. We do not expect the adoption to impact our consolidated financial condition or results of operations.
| |
| 4. | Preneed Funeral Activities |
Preneed funeral receivables, net and trust investments
Preneed funeral receivables, net and trust investments represent trust investments, including investment earnings, and customer receivables, net of unearned finance charges, related to unperformed, price-guaranteed preneed funeral contracts. Our funeral merchandise and service trusts are variable interest entities as defined in the Consolidation Topic of the ASC. In accordance with this guidance, weentities. We have determined that we are the primary beneficiary of these trusts, as we absorb a majority of the losses and returns associated with these trusts. Our cemetery trust investments detailed in Notes 5 and 6 are also accounted for as variable interest entities. When we receive payments from the customer, we deposit the amount required by law into the trust and reclassify the corresponding amount from Deferred preneed funeral revenues into Deferred preneed funeral and cemetery receipts held in trust. Amounts are withdrawn from the trusts after the contract obligations are performed. Cash flows from preneed funeral contracts are presented as operating cash flows in our consolidated statement of cash flows.
Preneed funeral receivables, net and trust investments are reduced by the trust investment earnings (realized and unrealized) that we have been allowed to withdraw in certain states prior to maturity. These earnings are recorded in Deferred preneed funeral revenues until the merchandise is delivered or the service is performed or the merchandise is delivered.performed.
The table below sets forth certain investment-related activities associated with our preneed funeral merchandise and service trusts for the years ended December 31:
| | | | 2011 | | 2010 | | 2009 | 2014 | | 2013 | | 2012 |
| | | | (In thousands) | | | | | (In thousands) | | |
| Deposits | $ | 72,750 |
| | $ | 80,027 |
| | $ | 85,901 |
| $ | 102,553 |
| | $ | 82,168 |
| | $ | 81,601 |
|
| Withdrawals | 109,013 |
| | 103,418 |
| | 104,437 |
| $ | 131,352 |
| | $ | 125,914 |
| | $ | 100,635 |
|
Purchases of available-for-sale securities | 527,681 |
| | 467,221 |
| | 372,058 |
| $ | 1,238,257 |
| | $ | 393,169 |
| | $ | 563,628 |
|
Sales of available-for-sale securities | 610,917 |
| | 479,128 |
| | 398,984 |
| $ | 1,318,512 |
| | $ | 435,267 |
| | $ | 555,709 |
|
Realized gains from sales of available-for-sale securities | 61,272 |
| | 36,807 |
| | 28,715 |
| $ | 168,567 |
| | $ | 65,011 |
| | $ | 60,833 |
|
Realized losses from sales of available-for-sale securities | (41,162 | ) | | (46,601 | ) | | (57,118 | ) | $ | (113,748 | ) | | $ | (9,732 | ) | | $ | (21,454 | ) |
(1) The increase in activity in 2014 is the result of changing the legal structure of the trust investments.
The components of Preneed funeral receivables, net and trust investments in our consolidated balance sheet at December 31 were as follows:
| | | | 2011 | | 2010 | 2014 | | 2013 |
| | (In thousands) | (In thousands) |
| Trust investments, at market | $ | 892,685 |
| | $ | 875,043 |
| $ | 1,205,747 |
| | $ | 1,438,326 |
|
| Cash and cash equivalents | 101,111 |
| | 121,212 |
| 162,229 |
| | 128,217 |
|
| Assets associated with businesses held for sale | | — |
| | (181,535 | ) |
| Insurance-backed fixed income securities | 277,650 |
| | 220,287 |
| 260,899 |
| | 280,969 |
|
| Trust investments | 1,271,446 |
| | 1,216,542 |
| 1,628,875 |
| | 1,665,977 |
|
| Receivables from customers | 246,601 |
| | 247,434 |
| 262,700 |
| | 259,784 |
|
| Unearned finance charge | (5,425 | ) | | (5,620 | ) | (11,054 | ) | | (10,179 | ) |
| | 1,512,622 |
| | 1,458,356 |
| 1,880,521 |
| | 1,915,582 |
|
| Allowance for cancellation | (33,757 | ) | | (33,799 | ) | (37,498 | ) | | (45,339 | ) |
| Preneed funeral receivables and trust investments | $ | 1,478,865 |
| | $ | 1,424,557 |
| $ | 1,843,023 |
| | $ | 1,870,243 |
|
SERVICE CORPORATION INTERNATIONAL
NOTES TO CONSOLIDATED FINANCIAL STATEMENTS — (Continued)
The activity in Preneed funeral receivables, net and trust investments for the years ended December 31 was as follows:
| | | | 2011 | | 2010 | | 2009 | 2014 | | 2013 | | 2012 |
| | | | (In thousands) | | | | | (In thousands) | | |
| Beginning balance — Preneed funeral receivables and trust investments | $ | 1,424,557 |
| | $ | 1,356,353 |
| | $ | 1,191,692 |
| $ | 1,870,243 |
| | $ | 1,536,257 |
| | $ | 1,484,764 |
|
| Net preneed contract sales | 111,447 |
| | 126,121 |
| | 155,834 |
| 247,994 |
| | 192,712 |
| | 124,962 |
|
| Cash receipts from customers, net of refunds | (106,489 | ) | | (99,142 | ) | | (118,049 | ) | (211,830 | ) | | (170,921 | ) | | (125,625 | ) |
| Deposits to trust | 72,750 |
| | 80,027 |
| | 85,901 |
| 102,553 |
| | 82,168 |
| | 81,601 |
|
| Acquisitions (dispositions) of businesses, net | 143,252 |
| | 29,607 |
| | (6,226 | ) | |
| Net undistributed investment (losses) earnings (1) | (11,348 | ) | | 82,097 |
| | 164,003 |
| |
| (Divestitures) acquisitions of businesses, net | | (19,203 | ) | | 271,395 |
| | 6,021 |
|
Net undistributed investment earnings (1) | | 22,480 |
| | 125,986 |
| | 84,611 |
|
| Maturities and distributed earnings | (148,820 | ) | | (140,593 | ) | | (141,135 | ) | (162,059 | ) | | (153,446 | ) | | (126,130 | ) |
| Change in cancellation allowance | (30 | ) | | (1,140 | ) | | (2,054 | ) | 7,644 |
| | (3,245 | ) | | 934 |
|
| Effect of foreign currency and other | (6,454 | ) | | (8,773 | ) | | 26,387 |
| (14,799 | ) | | (10,663 | ) | | 5,119 |
|
| Ending balance — Preneed funeral receivables and trust investments | $ | 1,478,865 |
| | $ | 1,424,557 |
| | $ | 1,356,353 |
| $ | 1,843,023 |
| | $ | 1,870,243 |
| | $ | 1,536,257 |
|
| |
| (1) | Includes both realized and unrealized investment earnings (losses).earnings. |
The cost and market values associated with our funeral merchandise and service trust investments recorded at fair market value at December 31, 20112014 and 20102013 are detailed below. Cost reflects the investment (net of redemptions) of control holders in common trust funds, mutual funds, and private equity investments.the trusts. Fair market value represents the value of the underlying securities held by the common trust funds, mutual funds at published values, and the estimated market value of private equity investments.trusts.
|
| | | | | | | | | | | | | | | | |
| | | December 31, 2014 |
| | Fair Value Hierarchy Level | Cost | | Unrealized Gains | | Unrealized Losses | | Fair Value |
| | | | | (In thousands) | | |
| Fixed income securities: | | |
| | |
| | |
| | |
|
| U.S. Treasury | 2 | $ | 85,775 |
| | $ | 468 |
| | $ | (455 | ) | | $ | 85,788 |
|
| Canadian government | 2 | 90,430 |
| | 449 |
| | (874 | ) | | 90,005 |
|
| Corporate | 2 | 24,765 |
| | 423 |
| | (126 | ) | | 25,062 |
|
| Residential mortgage-backed | 2 | 1,325 |
| | 29 |
| | (12 | ) | | 1,342 |
|
| Asset-backed | 2 | 6 |
| | — |
| | — |
| | 6 |
|
| Equity securities: | | |
| | |
| | |
| | |
|
| Preferred stock | 2 | 2,503 |
| | 113 |
| | (113 | ) | | 2,503 |
|
| Common stock: | | |
| | |
| | |
| | |
|
| United States | 1 | 377,441 |
| | 18,533 |
| | (7,405 | ) | | 388,569 |
|
| Canada | 1 | 14,708 |
| | 4,292 |
| | (895 | ) | | 18,105 |
|
| Other international | 1 | 38,035 |
| | 1,175 |
| | (1,560 | ) | | 37,650 |
|
| Mutual funds: | | |
| | |
| | |
| | |
|
| Equity | 1 | 308,548 |
| | 3,332 |
| | (15,901 | ) | | 295,979 |
|
| Fixed income | 1 | 229,414 |
| | 869 |
| | (3,576 | ) | | 226,707 |
|
| Private equity | 3 | 35,094 |
| | 2,649 |
| | (9,418 | ) | | 28,325 |
|
| Other | 3 | 5,084 |
| | 726 |
| | (104 | ) | | 5,706 |
|
| Trust investments | | $ | 1,213,128 |
| | $ | 33,058 |
| | $ | (40,439 | ) | | $ | 1,205,747 |
|
|
| | | | | | | | | | | | | | | |
| | December 31, 2011 |
| | Cost | | Unrealized Gains | | Unrealized Losses | | Fair Market Value |
| | | | (In thousands) | | |
| Fixed income securities: | |
| | |
| | |
| | |
|
| U.S. Treasury | $ | 77,299 |
| | $ | 4,565 |
| | $ | (373 | ) | | $ | 81,491 |
|
| Canadian government | 114,586 |
| | 838 |
| | (109 | ) | | 115,315 |
|
| Corporate | 49,210 |
| | 1,849 |
| | (770 | ) | | 50,289 |
|
| Residential mortgage-backed | 3,292 |
| | 71 |
| | (34 | ) | | 3,329 |
|
| Asset-backed | 126 |
| | 6 |
| | — |
| | 132 |
|
| Equity securities: | |
| | |
| | |
| | |
|
| Preferred stock | 2,041 |
| | 50 |
| | (153 | ) | | 1,938 |
|
| Common stock: | |
| | |
| | |
| | |
|
| United States | 258,738 |
| | 40,992 |
| | (22,715 | ) | | 277,015 |
|
| Canada | 23,986 |
| | 2,511 |
| | (1,771 | ) | | 24,726 |
|
| Other international | 18,954 |
| | 1,045 |
| | (1,296 | ) | | 18,703 |
|
| Mutual funds: | |
| | |
| | |
| | |
|
| Equity | 134,383 |
| | 2,384 |
| | (18,982 | ) | | 117,785 |
|
| Fixed income | 193,134 |
| | 5,044 |
| | (13,114 | ) | | 185,064 |
|
| Private equity | 35,017 |
| | 218 |
| | (19,249 | ) | | 15,986 |
|
| Other | 484 |
| | 428 |
| | — |
| | 912 |
|
| Trust investments | $ | 911,250 |
| | $ | 60,001 |
| | $ | (78,566 | ) | | $ | 892,685 |
|
SERVICE CORPORATION INTERNATIONAL
NOTES TO CONSOLIDATED FINANCIAL STATEMENTS — (Continued)
| | | | December 31, 2010 | | December 31, 2013 |
| | Cost | | Unrealized Gains | | Unrealized Losses | | Fair Market Value | Fair Value Hierarchy Level | Cost | | Unrealized Gains | | Unrealized Losses | | Fair Value |
| | | | (In thousands) | | | | | | (In thousands) | | |
| Fixed income securities: | |
| | |
| | |
| | |
| | |
| | |
| | |
| | |
|
| U.S. Treasury | $ | 71,948 |
| | $ | 2,061 |
| | $ | (334 | ) | | $ | 73,675 |
| 2 | $ | 111,824 |
| | $ | 1,299 |
| | $ | (5,599 | ) | | $ | 107,524 |
|
| Canadian government | 121,137 |
| | 1,004 |
| | (20 | ) | | 122,121 |
| 2 | 100,263 |
| | 81 |
| | (1,113 | ) | | 99,231 |
|
| Corporate | 33,627 |
| | 2,751 |
| | (285 | ) | | 36,093 |
| 2 | 64,579 |
| | 3,515 |
| | (691 | ) | | 67,403 |
|
| Residential mortgage-backed | 5,310 |
| | 135 |
| | (22 | ) | | 5,423 |
| 2 | 2,438 |
| | 23 |
| | (33 | ) | | 2,428 |
|
| Asset-backed | 2,984 |
| | 97 |
| | (2 | ) | | 3,079 |
| 2 | 3,407 |
| | — |
| | (10 | ) | | 3,397 |
|
| Equity securities: | |
| | |
| | |
| | |
| | |
| | |
| | |
| | |
|
| Preferred stock: | 2,835 |
| | 296 |
| | (78 | ) | | 3,053 |
| |
| Preferred stock | | 2 | 30,485 |
| | 754 |
| | (235 | ) | | 31,004 |
|
| Common stock: | |
| | |
| | |
| | |
| | |
| | |
| | |
| | |
|
| United States | 268,650 |
| | 63,301 |
| | (8,391 | ) | | 323,560 |
| 1 | 370,123 |
| | 77,963 |
| | (2,928 | ) | | 445,158 |
|
| Canada | 22,452 |
| | 4,542 |
| | (798 | ) | | 26,196 |
| 1 | 27,710 |
| | 4,346 |
| | (1,217 | ) | | 30,839 |
|
| Other international | 21,611 |
| | 2,240 |
| | (2,330 | ) | | 21,521 |
| 1 | 36,017 |
| | 4,986 |
| | (198 | ) | | 40,805 |
|
| Mutual funds: | |
| | |
| | |
| | |
| | |
| | |
| | |
| | |
|
| Equity | 116,260 |
| | 6,123 |
| | (18,289 | ) | | 104,094 |
| 1 | 260,686 |
| | 22,530 |
| | (2,303 | ) | | 280,913 |
|
| Fixed income | 134,181 |
| | 6,316 |
| | (5,628 | ) | | 134,869 |
| 1 | 317,280 |
| | 3,228 |
| | (19,577 | ) | | 300,931 |
|
| Private equity | 27,864 |
| | 1,395 |
| | (16,890 | ) | | 12,369 |
| 3 | 32,909 |
| | 2,702 |
| | (8,726 | ) | | 26,885 |
|
| Other | 8,833 |
| | 615 |
| | (458 | ) | | 8,990 |
| 3 | 1,550 |
| | 291 |
| | (33 | ) | | 1,808 |
|
| Trust investments | $ | 837,692 |
| | $ | 90,876 |
| | $ | (53,525 | ) | | $ | 875,043 |
| | $ | 1,359,271 |
| | $ | 121,718 |
| | $ | (42,663 | ) | | $ | 1,438,326 |
|
Where quoted prices are available in an active market, securities held by the common trust funds and mutual funds are classified as Level 1 investments pursuant to the three-level valuation hierarchy as required by the FVM&D Topic of the ASC.hierarchy.
Where quoted market prices are not available for the specific security, fair values are estimated by using either quoted prices of securities with similar characteristics or an income approach fair value model with observable inputs that include a combination of interest rates, yield curves, credit risks, prepayment speeds, rating, and tax-exempt status. These funds are classified as Level 2 investments pursuant to the three-level valuation hierarchy as required by the FVM&D Topic of the ASC.hierarchy.
The valuation of private equity and other alternative investments requires significant management judgment due to the absence of quoted market prices, inherent lack of liquidity, and the long-term nature of such assets. The fair value of these investments is estimated based on the market value of the underlying real estate and private equity investments. The underlying real estate value is determined using the most recent available appraisals. Private equity investmentsinstruments are valued using market appraisals orbased on reported net asset values discounted by 0% to 20% for risk and 0% to 10% for liquidity. A significant increase (decrease) in the discounts results in a discounted cash flow methodology, which is an income approachdirectionally opposite change in the fair value model, depending on the nature of the underlying assets. The appraisals assess value based on a combinationinstruments. Valuation policies and procedures are determined by our Trust Services department, which reports to our Chief Financial Officer. Additionally, valuations are reviewed by the Investment Committee of replacement cost, comparative sales analysis, and discounted cash flow analysis.the Board of Directors quarterly. These funds are classified as Level 3 investments pursuant to the three-level valuation hierarchy as required by the FVM&D Topic of the ASC.hierarchy.
As of December 31, 2011,2014, our unfunded commitment for our private equity and other investments was $11.4$25.4 million which, if called, would be funded by the assets of the trusts. Our private equity and other investments include several funds that invest in limited partnerships, distressed debt, real estate, and mezzanine financing. The majority of theThese investments can never be redeemed at discount; others can be redeemed without a discount. Generally, however,by the funds. Instead, the nature of the investments in this category is that the distributions are received through the liquidation of the underlying assets of the funds. We estimate that the underlying assets will be liquidated over the next 2 to 10 years.
Our investments classified as Level 1 securities include common stock and mutual funds. Level 2 securities include U.S. Treasury, Canadian government, corporate, mortgage-backed fixed income securities, and preferred stock. Our private equity and other alternative investments are classified as Level 3 securities.
The inputs into the fair value of our market-based funeral merchandise and service trust investments are categorized as follows:
SERVICE CORPORATION INTERNATIONAL
NOTES TO CONSOLIDATED FINANCIAL STATEMENTS — (Continued)
|
| | | | | | | | | | | | | | | |
| | Quoted Market Prices in Active Markets (Level 1) | | Significant Other Observable Inputs (Level 2) | | Significant Unobservable Inputs (Level 3) | | Fair Market Value |
| | | | (In thousands) | | |
| Trust investments at December 31, 2011 | $ | 623,293 |
| | $ | 252,494 |
| | $ | 16,898 |
| | $ | 892,685 |
|
| Trust investments at December 31, 2010 | $ | 610,240 |
| | $ | 243,444 |
| | $ | 21,359 |
| | $ | 875,043 |
|
The change in our market-based funeral merchandise and service trust investments with significant unobservable inputs (Level 3) is as follows for the years ended December 31, 2011, 2010,2014, 2013, and 2009 (in thousands)2012 :
|
| | | | | | | | | | | |
| | 2011 | | 2010 | | 2009 |
| Fair market value, beginning balance at January 1, | $ | 21,359 |
| | $ | 12,052 |
| | $ | 40,880 |
|
Net unrealized losses included in Accumulated other comprehensive income(1) | (5,234 | ) | | (3,949 | ) | | (9,205 | ) |
Net realized losses included in Other (expense) income, net(2) | (92 | ) | | (530 | ) | | (27 | ) |
| Purchases | 18 |
| | 7,343 |
| | — |
|
| Sales | (8,156 | ) | | (108 | ) | | — |
|
| Contributions | 10,392 |
| | 7,213 |
| | 2,779 |
|
| Distributions and other | (1,389 | ) | | (662 | ) | | (484 | ) |
| Transfers out of Level 3 | — |
| | — |
| | (21,891 | ) |
| Fair market value, ending balance at December 31, | $ | 16,898 |
| | $ | 21,359 |
| | $ | 12,052 |
|
|
| | | | | | | | | | | | | | | | | | | | | | | |
| | 2014 | | 2013 | | 2012 |
| | Private Equity | | Other | | Private Equity | | Other | | Private Equity | | Other |
| | | | | | (In thousands) | | | | |
| Fair value, beginning balance at January 1, | $ | 26,885 |
| | $ | 1,808 |
| | $ | 17,879 |
| | $ | 744 |
| | $ | 15,986 |
| | $ | 912 |
|
Net unrealized gains (losses) included in Accumulated other comprehensive income(1) | 2,242 |
| | 826 |
| | 13,429 |
| | 1,442 |
| | (403 | ) | | (159 | ) |
Net realized losses included in Other income (expense), net(2) | (39 | ) | | (6 | ) | | (43 | ) | | (3 | ) | | (58 | ) | | (2 | ) |
| Purchases | — |
| | 3,214 |
| | 1,188 |
| | — |
| | — |
| | — |
|
| Sales | — |
| | — |
| | — |
| | — |
| | (9 | ) | | — |
|
| Contributions | 6,122 |
| | 4 |
| | 3,229 |
| | — |
| | 4,664 |
| | — |
|
| Distributions and other | (6,885 | ) | | (140 | ) | | (9,245 | ) | | (393 | ) | | (2,301 | ) | | (7 | ) |
| Acquisitions | — |
| | — |
| | 448 |
| | 18 |
| | — |
| | — |
|
| Fair value, ending balance at December 31, | $ | 28,325 |
| | $ | 5,706 |
| | $ | 26,885 |
| | $ | 1,808 |
| | $ | 17,879 |
| | $ | 744 |
|
| |
| (1) | All unrealized losses recognized in Accumulated other comprehensive income for our funeral merchandise and service trust investments are attributable to our preneed customers and are offset by a corresponding reclassification in Accumulated other comprehensive income to Deferred preneed funeral and cemetery receipts held in trust. See Note 7 for further information related to our Deferred preneed funeral and cemetery receipts held in trust. |
| |
| (2) | All losses recognized in Other income (expense) income,, net for our funeral merchandise and service trust investments are attributable to our preneed customers and are offset by a corresponding reclassification in Other income (expense) income,, net to Deferred preneed funeral and cemetery receipts held in trust. See Note 7 for further information related to our Deferred preneed funeral and cemetery receipts held in trust. |
Maturity dates of our fixed income securities range from 20112015 to 2041.2044. Maturities of fixed income securities at December 31, 20112014 are estimated as follows:
| | | | Fair Market Value | Fair Value |
| | (In thousands) | (In thousands) |
| Due in one year or less | $ | 140,654 |
| $ | 123,545 |
|
| Due in one to five years | 49,267 |
| 32,659 |
|
| Due in five to ten years | 39,232 |
| 29,426 |
|
| Thereafter | 21,403 |
| 16,573 |
|
| | $ | 250,556 |
| $ | 202,203 |
|
Earnings from all our funeral merchandise and service trust investments are recognized in funeral revenues when merchandise is delivered or a service is performed or merchandise is delivered.performed. Fees charged by our wholly-owned registered investment advisor are also included in current revenues in the period in which they are earned. In addition, we are entitled to retain, in certain jurisdictions, a portion of collected customer payments when a customer cancels a preneed contract; these amounts are also recognized in current revenues. Recognized earnings (realized and unrealized) related to our funeral merchandise and service trust investments were $37.7$62.8 million,, $29.5 $48.5 million,, and $23.7$38.7 million for the years ended December 31, 2011, 2010,2014, 2013, and 2009,2012, respectively.
We assess our trust investments for other-than-temporary declines in fair value on a quarterly basis. Impairment charges resulting from this assessment are recognized as investment losses in Other income (expense) income,, net and a decrease to Preneed funeral receivables, net and trust investments. These investment losses, if any, are offset by the corresponding reclassification in Other (expense) income, net, which reduces Deferred preneed funeral receipts held in trust. See Note 7 for further information related to our Deferred preneed funeral receipts held in trust. For the years ended December 31, 2011, 2010,2014, 2013, and 2009,2012, we recorded a
SERVICE CORPORATION INTERNATIONAL
NOTES TO CONSOLIDATED FINANCIAL STATEMENTS — (Continued)
$24.7 $41.8 million,, an $8.1 a $0.8 million,, and a $22.5$0.8 million, respectively, impairment charge for other-than-temporary declines in fair value related to unrealized losses on certain investments.
We have determined that the remaining unrealized losses in our funeral merchandise and service trust investments are considered temporary in nature, as the unrealized losses were due to temporary fluctuations in interest rates and equity prices. The investments are diversified across multiple industry segments using a balanced allocation strategy to minimize long-term risk. We believe that none of the securities are other-than-temporarily impaired based on our analysis of the investments. Our analysis included a review of the portfolio holdings and discussions with the individual money managers as to the sector exposures, credit ratings, and the severity and duration of the unrealized losses. Our funeral merchandise and service trust investment unrealized losses, their associated fair market values, and the duration of unrealized losses for the years ended December 31, 20112014 and 2010,2013, are shown in the following tables.
| | | | December 31, 2011 | December 31, 2014 |
| | In Loss Position Less Than 12 Months | | In Loss Position Greater Than 12 Months | | Total | In Loss Position Less Than 12 Months | | In Loss Position Greater Than 12 Months | | Total |
| | Fair Market Value | | Unrealized Losses | | Fair Market Value | | Unrealized Losses | | Fair Market Value | | Unrealized Losses | Fair Market Value | | Unrealized Losses | | Fair Market Value | | Unrealized Losses | | Fair Market Value | | Unrealized Losses |
| | | | | | (In thousands) | | | | | | | | | (In thousands) | | | | |
| Fixed income securities: | |
| | |
| | |
| | |
| | |
| | |
| |
| | |
| | |
| | |
| | |
| | |
|
| U.S. Treasury | $ | 6,977 |
| | $ | (90 | ) | | $ | 8,709 |
| | $ | (283 | ) | | $ | 15,686 |
| | $ | (373 | ) | $ | 32,243 |
| | $ | (412 | ) | | $ | 4,978 |
| | $ | (43 | ) | | $ | 37,221 |
| | $ | (455 | ) |
| Canadian government | 9,597 |
| | (109 | ) | | — |
| | — |
| | 9,597 |
| | (109 | ) | 2,894 |
| | (52 | ) | | 14,904 |
| | (822 | ) | | 17,798 |
| | (874 | ) |
| Corporate | 17,328 |
| | (692 | ) | | 662 |
| | (78 | ) | | 17,990 |
| | (770 | ) | 4,988 |
| | (56 | ) | | 2,420 |
| | (70 | ) | | 7,408 |
| | (126 | ) |
| Residential mortgage-backed | 600 |
| | (4 | ) | | 295 |
| | (30 | ) | | 895 |
| | (34 | ) | 217 |
| | (10 | ) | | 106 |
| | (2 | ) | | 323 |
| | (12 | ) |
| Equity securities: | |
| | |
| | |
| | |
| |
|
| |
|
| |
| | |
| | |
| | |
| |
|
| |
|
|
| Preferred Stock | 1,244 |
| | (153 | ) | | — |
| | — |
| | 1,244 |
| | (153 | ) | |
| Preferred stock | | 26 |
| | (113 | ) | | — |
| | — |
| | 26 |
| | (113 | ) |
| Common stock: | |
| | |
| | |
| | |
| | |
| | |
| |
| | |
| | |
| | |
| | |
| | |
|
| United States | 84,450 |
| | (18,120 | ) | | 14,924 |
| | (4,595 | ) | | 99,374 |
| | (22,715 | ) | 126,527 |
| | (7,403 | ) | | 438 |
| | (2 | ) | | 126,965 |
| | (7,405 | ) |
| Canada | 8,448 |
| | (1,491 | ) | | 513 |
| | (280 | ) | | 8,961 |
| | (1,771 | ) | 1,752 |
| | (379 | ) | | 1,085 |
| | (516 | ) | | 2,837 |
| | (895 | ) |
| Other international | 7,263 |
| | (615 | ) | | 2,403 |
| | (681 | ) | | 9,666 |
| | (1,296 | ) | 19,593 |
| | (1,557 | ) | | 2 |
| | (3 | ) | | 19,595 |
| | (1,560 | ) |
| Mutual funds: | |
| | |
| | |
| | |
| |
|
| |
|
| |
| | |
| | |
| | |
| |
|
| |
|
|
| Equity | 76,559 |
| | (9,173 | ) | | 26,053 |
| | (9,809 | ) | | 102,612 |
| | (18,982 | ) | 233,827 |
| | (13,219 | ) | | 23,717 |
| | (2,682 | ) | | 257,544 |
| | (15,901 | ) |
| Fixed income | 68,378 |
| | (5,500 | ) | | 9,314 |
| | (7,614 | ) | | 77,692 |
| | (13,114 | ) | 112,160 |
| | (3,128 | ) | | 11,452 |
| | (448 | ) | | 123,612 |
| | (3,576 | ) |
| Private equity | 1,977 |
| | (3,499 | ) | | 13,502 |
| | (15,750 | ) | | 15,479 |
| | (19,249 | ) | 203 |
| | (461 | ) | | 13,870 |
| | (8,957 | ) | | 14,073 |
| | (9,418 | ) |
| Other | | 5 |
| | (11 | ) | | 464 |
| | (93 | ) | | 469 |
| | (104 | ) |
| Total temporarily impaired securities | $ | 282,821 |
| | $ | (39,446 | ) | | $ | 76,375 |
| | $ | (39,120 | ) | | $ | 359,196 |
| | $ | (78,566 | ) | $ | 534,435 |
| | $ | (26,801 | ) | | $ | 73,436 |
| | $ | (13,638 | ) | | $ | 607,871 |
| | $ | (40,439 | ) |
SERVICE CORPORATION INTERNATIONAL
NOTES TO CONSOLIDATED FINANCIAL STATEMENTS — (Continued)
| | | | December 31, 2010 | December 31, 2013 |
| | In Loss Position Less Than 12 Months | | In Loss Position Greater Than 12 Months | | Total | In Loss Position Less Than 12 Months | | In Loss Position Greater Than 12 Months | | Total |
| | Fair Market Value | | Unrealized Losses | | Fair Market Value | | Unrealized Losses | | Fair Market Value | | Unrealized Losses | Fair Market Value | | Unrealized Losses | | Fair Market Value | | Unrealized Losses | | Fair Market Value | | Unrealized Losses |
| | | | | | (In thousands) | | | | | | | | | (In thousands) | | | | |
| Fixed income securities: | |
| | |
| | |
| | |
| | |
| | |
| |
| | |
| | |
| | |
| | |
| | |
|
| U.S. Treasury | $ | 10,433 |
| | $ | (316 | ) | | $ | 393 |
| | $ | (18 | ) | | $ | 10,826 |
| | $ | (334 | ) | $ | 29,008 |
| | $ | (3,595 | ) | | $ | 19,633 |
| | $ | (2,004 | ) | | $ | 48,641 |
| | $ | (5,599 | ) |
| Canadian government | 1,632 |
| | (2 | ) | | 668 |
| | (18 | ) | | 2,300 |
| | (20 | ) | 9,545 |
| | (120 | ) | | 18,981 |
| | (993 | ) | | 28,526 |
| | (1,113 | ) |
| Corporate | 5,619 |
| | (285 | ) | | — |
| | — |
| | 5,619 |
| | (285 | ) | 21,525 |
| | (346 | ) | | 5,665 |
| | (345 | ) | | 27,190 |
| | (691 | ) |
| Mortgage-backed | 836 |
| | (9 | ) | | 263 |
| | (13 | ) | | 1,099 |
| | (22 | ) | |
| Residential mortgage-backed | | 1,397 |
| | (25 | ) | | 174 |
| | (8 | ) | | 1,571 |
| | (33 | ) |
| Asset-backed | 225 |
| | (1 | ) | | 53 |
| | (1 | ) | | 278 |
| | (2 | ) | 3,311 |
| | (10 | ) | | — |
| | — |
| | 3,311 |
| | (10 | ) |
| Equity securities: | |
| | |
| | |
| | |
| | |
| | |
| |
| | |
| | |
| | |
| | |
| | |
|
| Preferred Stock | 1,045 |
| | (78 | ) | | — |
| | — |
| | 1,045 |
| | (78 | ) | |
| Preferred stock | | 14,182 |
| | (235 | ) | | — |
| | — |
| | 14,182 |
| | (235 | ) |
| Common stock: | |
| | |
| | |
| | |
| | |
| | |
| |
| | |
| | |
| | |
| | |
| | |
|
| United States | 41,491 |
| | (3,019 | ) | | 24,919 |
| | (5,372 | ) | | 66,410 |
| | (8,391 | ) | 47,054 |
| | (2,153 | ) | | 3,374 |
| | (775 | ) | | 50,428 |
| | (2,928 | ) |
| Canada | 4,493 |
| | (324 | ) | | 1,361 |
| | (474 | ) | | 5,854 |
| | (798 | ) | 2,439 |
| | (576 | ) | | 1,992 |
| | (641 | ) | | 4,431 |
| | (1,217 | ) |
| Other international | 5,251 |
| | (862 | ) | | 3,446 |
| | (1,468 | ) | | 8,697 |
| | (2,330 | ) | 3,433 |
| | (138 | ) | | 375 |
| | (60 | ) | | 3,808 |
| | (198 | ) |
| Mutual funds: | |
| | |
| | |
| | |
| | |
| | |
| |
| | |
| | |
| | |
| | |
| | |
|
| Equity | 3,778 |
| | (110 | ) | | 61,844 |
| | (18,179 | ) | | 65,622 |
| | (18,289 | ) | 16,383 |
| | (337 | ) | | 12,638 |
| | (1,966 | ) | | 29,021 |
| | (2,303 | ) |
| Fixed income | 9,630 |
| | (156 | ) | | 8,818 |
| | (5,472 | ) | | 18,448 |
| | (5,628 | ) | 145,425 |
| | (4,984 | ) | | 38,774 |
| | (14,593 | ) | | 184,199 |
| | (19,577 | ) |
| Private equity | 214 |
| | (71 | ) | | 6,715 |
| | (16,819 | ) | | 6,929 |
| | (16,890 | ) | — |
| | — |
| | 13,002 |
| | (8,726 | ) | | 13,002 |
| | (8,726 | ) |
| Other | 8 |
| | (2 | ) | | 309 |
| | (456 | ) | | 317 |
| | (458 | ) | — |
| | — |
| | 527 |
| | (33 | ) | | $ | 527 |
| | $ | (33 | ) |
| Total temporarily impaired securities | $ | 84,655 |
| | $ | (5,235 | ) | | $ | 108,789 |
| | $ | (48,290 | ) | | $ | 193,444 |
| | $ | (53,525 | ) | $ | 293,702 |
| | $ | (12,519 | ) | | $ | 115,135 |
| | $ | (30,144 | ) | | $ | 408,837 |
| | $ | (42,663 | ) |
Deferred Preneed Funeral Revenues
At December 31, 20112014 and 2010,2013, Deferred preneed funeral revenues, net of allowance for cancellation, represent future funeral revenues, including distributed trust investment earnings associated with unperformed trust-funded preneed funeral contracts that are not held in trust accounts. Deferred preneed funeral revenues are recognized in current funeral revenues when merchandise is delivered or the service is performed or merchandise is delivered.performed. Future funeral service revenues and net trust investment earnings that are held in trust accounts are included in Deferred preneed funeral receipts held in trust.
The following table summarizes the activity in Deferred preneed funeral revenues for the years ended December 31 were as follows:
| | | | 2011 | | 2010 | | 2009 | 2014 | | 2013 | | 2012 |
| | (In thousands) | (In thousands) |
| Beginning balance — Deferred preneed funeral revenues, net | $ | 580,223 |
| | $ | 596,966 |
| | $ | 588,198 |
| $ | 551,948 |
| | $ | 535,136 |
| | $ | 573,477 |
|
| Net preneed contract sales | 105,866 |
| | 112,678 |
| | 141,752 |
| 198,195 |
| | 144,202 |
| | 103,341 |
|
| Acquisitions (dispositions) of businesses, net | 142,026 |
| | 26,816 |
| | (794 | ) | |
| Net investment (losses) earnings (1) | (12,164 | ) | | 83,605 |
| | 135,842 |
| |
| (Divestitures) acquisitions of businesses, net | | (21,639 | ) | | 298,047 |
| | (4,491 | ) |
Net investment earnings(1) | | 24,256 |
| | 126,428 |
| | 83,788 |
|
| Recognized deferred preneed revenues | (182,408 | ) | | (151,484 | ) | | (153,382 | ) | (258,534 | ) | | (200,680 | ) | | (164,037 | ) |
| Change in cancellation allowance | (1,526 | ) | | (761 | ) | | (2,972 | ) | 21,272 |
| | (5,670 | ) | | 1,304 |
|
| Change in deferred preneed funeral receipts held in trust | (57,936 | ) | | (69,694 | ) | | (117,181 | ) | 26,131 |
| | (343,878 | ) | | (61,068 | ) |
| Effect of foreign currency and other | 1,465 |
| | (17,903 | ) | | 5,503 |
| (1,465 | ) | | (1,637 | ) | | 2,822 |
|
| Ending balance — Deferred preneed funeral revenues, net | $ | 575,546 |
| | $ | 580,223 |
| | $ | 596,966 |
| $ | 540,164 |
| | $ | 551,948 |
| | $ | 535,136 |
|
| |
| (1) | Includes both realized and unrealized investment earnings (losses).earnings. |
Insurance-Funded Preneed Funeral Contracts
Not included in our consolidated balance sheet are insurance-funded preneed funeral contracts that will be funded by life insurance or annuity contracts issued by third party insurers. Where permitted by state or provincial law, customers may arrange their preneed funeral contract by purchasing a life insurance or annuity policy from third-party insurance companies, for which
SERVICE CORPORATION INTERNATIONAL
NOTES TO CONSOLIDATED FINANCIAL STATEMENTS — (Continued)
we earn a commission as general sales agent for the insurance company. These general agency commissions (GA revenues) are based on a percentage per contract sold and are recognized as funeral revenues when the insurance purchase transaction between the customer and third-party insurance provider is completed. GA revenues recognized in 2011, 2010,2014, 2013, and 20092012 were $86.8$123.0 million,, $68.3 $106.5 million,, and $57.3$94.0 million,, respectively. Direct selling costs incurred pursuant to the sale of insurance-funded preneed funeral contracts are expensed as incurred. The policy amount of the insurance contract between the customer and the third-party insurance company generally equals the amount of the preneed funeral contract. We do not reflect the unfulfilled insurance-funded preneed funeral contract amounts in our consolidated balance sheet. The proceeds of the life insurance policies or annuity contracts will be reflected in funeral revenues as these funerals are performed by the Company.
| |
| 5. | Preneed Cemetery Activities |
Preneed cemetery receivables, net and trust investments
Preneed cemetery receivables, net and trust investments represent trust investments, including investment earnings, and customer receivables, net of unearned finance charges, for contracts sold in advance of when the property interment rights, merchandise, or services are needed. Our cemetery merchandise and service trusts are variable interest entities as defined in the Consolidation Topic of the ASC. In accordance with this guidance, weentities. We have determined that we are the primary beneficiary of these trusts, as we absorb a majority of the losses and returns associated with these trusts. The trust investments detailed in Notes 4 and 6 are also accounted for as variable interest entities. When we receive payments from the customer, we deposit the amount required by law into the trust and reclassify the corresponding amount from Deferred preneed cemetery revenues into Deferred preneed funeral and cemetery receipts held in trust. Amounts are withdrawn from the trusts when the contract obligations are performed. Cash flows from preneed cemetery contracts are presented as operating cash flows in our consolidated statement of cash flows.
Preneed cemetery receivables, net and trust investments are reduced by the trust investment earnings (realized and unrealized) that we have been allowed to withdraw in certain states prior to maturity. These earnings are recorded in Deferred preneed cemetery revenues until the merchandise is delivered or the service is performed or the merchandise is delivered.performed.
The table below sets forth certain investment-related activities associated with our preneed cemetery merchandise and service trusts for the years ended December 31:
| | | | 2011 | | 2010 | | 2009 | 2014 | | 2013 | | 2012 |
| | | | (In thousands) | | | | | (In thousands) | | |
| Deposits | $ | 98,121 |
| | $ | 96,864 |
| | $ | 92,687 |
| $ | 129,581 |
| | $ | 106,185 |
| | $ | 98,130 |
|
| Withdrawals | 109,382 |
| | 100,474 |
| | 104,580 |
| $ | 150,064 |
| | $ | 119,576 |
| | $ | 98,738 |
|
Purchases of available-for-sale securities | 595,683 |
| | 638,368 |
| | 625,248 |
| $ | 1,786,800 |
| | $ | 477,772 |
| | $ | 746,761 |
|
Sales of available-for-sale securities | 525,534 |
| | 592,813 |
| | 593,133 |
| $ | 1,842,417 |
| | $ | 498,852 |
| | $ | 700,091 |
|
Realized gains from sales of available-for-sale securities | 67,167 |
| | 43,413 |
| | 44,972 |
| $ | 271,507 |
| | $ | 101,337 |
| | $ | 87,665 |
|
Realized losses from sales of available-for-sale securities | (46,889 | ) | | (51,771 | ) | | (75,254 | ) | $ | (138,473 | ) | | $ | (14,593 | ) | | $ | (29,397 | ) |
(1) The increase in activity in 2014 is the result of changing the legal structure of the trust investments.
The components of Preneed cemetery receivables, net and trust investments in the consolidated balance sheet at December 31 were as follows:
| | | | 2011 | | 2010 | 2014 | | 2013 |
| | (In thousands) | (In thousands) |
| Trust investments, at market | $ | 1,051,464 |
| | $ | 1,062,771 |
| $ | 1,404,298 |
| | $ | 1,549,182 |
|
| Cash and cash equivalents | 104,554 |
| | 122,866 |
| 126,914 |
| | 138,459 |
|
| Assets associated with businesses held for sale | | (4,571 | ) | | (102,354 | ) |
| Insurance-backed fixed income securities | 5 |
| | 9,158 |
| 12 |
| | 4 |
|
| Trust investments | 1,156,023 |
| | 1,194,795 |
| 1,526,653 |
| | 1,585,291 |
|
| Receivables from customers | 517,917 |
| | 452,296 |
| 881,082 |
| | 798,072 |
|
| Unearned finance charges | (33,766 | ) | | (39,205 | ) | (31,524 | ) | | (29,561 | ) |
| | 1,640,174 |
| | 1,607,886 |
| 2,376,211 |
| | 2,353,802 |
|
| Allowance for cancellation | (44,234 | ) | | (43,993 | ) | (69,542 | ) | | (61,454 | ) |
| Preneed cemetery receivables and trust investments | $ | 1,595,940 |
| | $ | 1,563,893 |
| $ | 2,306,669 |
| | $ | 2,292,348 |
|
The activity in Preneed cemetery receivables, net and trust investments for the years ended December 31 was as follows:
SERVICE CORPORATION INTERNATIONAL
NOTES TO CONSOLIDATED FINANCIAL STATEMENTS — (Continued)
| | | | 2011 | | 2010 | | 2009 | 2014 | | 2013 | | 2012 |
| | | | (In thousands) | | | | | (In thousands) | | |
| Beginning balance — Preneed cemetery receivables and trust investments | $ | 1,563,893 |
| | $ | 1,382,717 |
| | $ | 1,062,952 |
| $ | 2,292,348 |
| | $ | 1,826,835 |
| | $ | 1,595,940 |
|
| Net preneed contract sales | 468,850 |
| | 423,985 |
| | 408,328 |
| 688,336 |
| | 562,433 |
| | 501,654 |
|
| (Dispositions) acquisitions of businesses, net | (5,500 | ) | | 5,508 |
| | 7,749 |
| |
| (Divestitures) acquisitions of businesses, net | | (10,898 | ) | | 190,870 |
| | 1,124 |
|
| Net undistributed investment (losses) earnings (1) | (24,407 | ) | | 121,225 |
| | 271,804 |
| (18,038 | ) | | 203,499 |
| | 133,351 |
|
| Cash receipts from customers, net of refunds | (403,524 | ) | | (373,071 | ) | | (351,459 | ) | (615,489 | ) | | (471,710 | ) | | (417,965 | ) |
| Deposits to trust | 98,121 |
| | 96,864 |
| | 92,687 |
| 129,581 |
| | 106,185 |
| | 98,130 |
|
| Maturities, deliveries, and associated earnings | (109,382 | ) | | (100,474 | ) | | (104,580 | ) | (150,064 | ) | | (119,576 | ) | | (98,738 | ) |
| Change in cancellation allowance | (759 | ) | | (3,764 | ) | | (10,141 | ) | 843 |
| | 3,002 |
| | (3,481 | ) |
| Effect of foreign currency and other | 8,648 |
| | 10,903 |
| | 5,377 |
| (9,950 | ) | | (9,190 | ) | | 16,820 |
|
| Ending balance — Preneed cemetery receivables and trust investments | $ | 1,595,940 |
| | $ | 1,563,893 |
| | $ | 1,382,717 |
| $ | 2,306,669 |
| | $ | 2,292,348 |
| | $ | 1,826,835 |
|
| |
| (1) | Includes both realized and unrealized investment earnings (losses). earnings. |
The cost and market values associated with our cemetery merchandise and service trust investments recorded at fair market value at December 31, 20112014 and 20102013 are detailed below. Cost reflects the investment (net of redemptions) of control holders in common trust funds, mutual funds, and private equity investments.the trusts. Fair market value represents the value of the underlying securities held by the common trust funds, mutual funds at published values, and the estimated market value of private equity investments.trusts.
| | | | December 31, 2011 | | December 31, 2014 |
| | Cost | | Unrealized Gains | | Unrealized Losses | | Fair Market Value | Fair Value Hierarchy Level | Cost | | Unrealized Gains | | Unrealized Losses | | Fair Value |
| | | | (In thousands) | | | | | | (In thousands) | | |
| Fixed income securities: | |
| | |
| | |
| | |
| | |
| | |
| | |
| | |
|
| U.S. Treasury | $ | 51,022 |
| | $ | 6,438 |
| | $ | (313 | ) | | $ | 57,147 |
| 2 | $ | 63,447 |
| | $ | 257 |
| | $ | (605 | ) | | $ | 63,099 |
|
| Canadian government | 16,566 |
| | 381 |
| | (24 | ) | | 16,923 |
| 2 | 21,687 |
| | 261 |
| | (134 | ) | | 21,814 |
|
| Corporate | 42,803 |
| | 2,033 |
| | (961 | ) | | 43,875 |
| 2 | 8,725 |
| | 122 |
| | (116 | ) | | 8,731 |
|
| Residential mortgage-backed | 167 |
| | 5 |
| | (2 | ) | | 170 |
| 2 | 111 |
| | 3 |
| | (1 | ) | | 113 |
|
| Asset-backed | | 2 | 170 |
| | 16 |
| | — |
| | 186 |
|
| Equity securities: | |
| | |
| | |
| | |
| | |
| | |
| | |
| | |
|
| Preferred stock | 3,365 |
| | 86 |
| | (270 | ) | | 3,181 |
| 2 | 10 |
| | 1 |
| | — |
| | 11 |
|
| Common stock: | |
| | |
| | |
| | |
| | |
| | |
| | |
| | |
|
| United States | 408,075 |
| | 71,138 |
| | (30,454 | ) | | 448,759 |
| 1 | 557,955 |
| | 22,746 |
| | (11,706 | ) | | 568,995 |
|
| Canada | 18,289 |
| | 2,547 |
| | (1,780 | ) | | 19,056 |
| 1 | 10,962 |
| | 5,011 |
| | (841 | ) | | 15,132 |
|
| Other international | 30,501 |
| | 1,843 |
| | (1,536 | ) | | 30,808 |
| 1 | 55,632 |
| | 1,605 |
| | (2,395 | ) | | 54,842 |
|
| Mutual funds: | |
| | |
| | |
| | |
| | |
| | |
| | |
| | |
|
| Equity | 197,523 |
| | 3,317 |
| | (24,911 | ) | | 175,929 |
| 1 | 344,443 |
| | 4,244 |
| | (18,430 | ) | | 330,257 |
|
| Fixed income | 248,529 |
| | 11,670 |
| | (20,238 | ) | | 239,961 |
| 1 | 314,600 |
| | 679 |
| | (4,702 | ) | | 310,577 |
|
| Private equity | 30,783 |
| | 53 |
| | (15,617 | ) | | 15,219 |
| 3 | 32,342 |
| | 3,185 |
| | (6,183 | ) | | 29,344 |
|
| Other | 306 |
| | 130 |
| | — |
| | 436 |
| 3 | 1,082 |
| | 186 |
| | (71 | ) | | 1,197 |
|
| Trust investments | $ | 1,047,929 |
| | $ | 99,641 |
| | $ | (96,106 | ) | | $ | 1,051,464 |
| | $ | 1,411,166 |
| | $ | 38,316 |
| | $ | (45,184 | ) | | $ | 1,404,298 |
|
SERVICE CORPORATION INTERNATIONAL
NOTES TO CONSOLIDATED FINANCIAL STATEMENTS — (Continued)
| | | | December 31, 2010 | | December 31, 2013 |
| | Cost | | Unrealized Gains | | Unrealized Losses | | Fair Market Value | Fair Value Hierarchy Level | Cost | | Unrealized Gains | | Unrealized Losses | | Fair Value |
| | | | (In thousands) | | | | | | (In thousands) | | |
| Fixed income securities: | |
| | |
| | |
| | |
| | |
| | |
| | |
| | |
|
| U.S. Treasury | $ | 50,884 |
| | $ | 2,493 |
| | $ | (307 | ) | | $ | 53,070 |
| 2 | $ | 113,293 |
| | $ | 1,714 |
| | $ | (8,876 | ) | | $ | 106,131 |
|
| Canadian government | 15,669 |
| | 362 |
| | (4 | ) | | 16,027 |
| 2 | 17,073 |
| | 170 |
| | (261 | ) | | 16,982 |
|
| Corporate | 39,265 |
| | 3,387 |
| | (402 | ) | | 42,250 |
| 2 | 48,838 |
|
| 5,262 |
|
| (646 | ) |
| 53,454 |
|
| Residential mortgage-backed | 863 |
| | 31 |
| | (1 | ) | | 893 |
| 2 | 406 |
| | 2 |
| | (2 | ) | | 406 |
|
| Asset-backed | 6,336 |
| | 261 |
| | (5 | ) | | 6,592 |
| 2 | 3,336 |
| | — |
| | (13 | ) | | 3,323 |
|
| Equity securities: | |
| | |
| | |
| | |
| | |
| | |
| | |
| | |
|
| Preferred stock: | 4,577 |
| | 453 |
| | (124 | ) | | 4,906 |
| |
| Preferred stock | | 2 | 16,654 |
| | 1,106 |
| | (123 | ) | | 17,637 |
|
| Common stock: | |
| | |
| | |
| | |
| | |
| | |
| | |
| | |
|
| United States | 386,537 |
| | 82,385 |
| | (10,821 | ) | | 458,101 |
| 1 | 423,524 |
| | 147,258 |
| | (3,231 | ) | | 567,551 |
|
| Canada | 17,279 |
| | 3,869 |
| | (850 | ) | | 20,298 |
| 1 | 15,361 |
| | 4,063 |
| | (935 | ) | | 18,489 |
|
| Other international | 31,466 |
| | 2,485 |
| | (3,645 | ) | | 30,306 |
| 1 | 44,017 |
| | 10,079 |
| | (200 | ) | | 53,896 |
|
| Mutual funds: | |
| | |
| | |
| | |
| | |
| | |
| | |
| | |
|
| Equity | 202,328 |
| | 15,173 |
| | (18,569 | ) | | 198,932 |
| 1 | 325,927 |
| | 49,428 |
| | (1,704 | ) | | 373,651 |
|
| Fixed income | 226,567 |
| | 8,537 |
| | (9,959 | ) | | 225,145 |
| 1 | 337,986 |
| | 5,236 |
| | (33,649 | ) | | 309,573 |
|
| Private equity | 19,596 |
| | 13 |
| | (13,890 | ) | | 5,719 |
| 3 | 28,625 |
| | 3,372 |
| | (5,153 | ) | | 26,844 |
|
| Other | 874 |
| | 43 |
| | (385 | ) | | 532 |
| 3 | 1,078 |
| | 200 |
| | (33 | ) | | 1,245 |
|
| Trust investments | $ | 1,002,241 |
| | $ | 119,492 |
| | $ | (58,962 | ) | | $ | 1,062,771 |
| | $ | 1,376,118 |
| | $ | 227,890 |
| | $ | (54,826 | ) | | $ | 1,549,182 |
|
Where quoted prices are available in an active market, securities held by the common trust funds and mutual funds are classified as Level 1 investments pursuant to the three-level valuation hierarchy as required by the FVM&D Topic of the ASC.hierarchy.
Where quoted market prices are not available for the specific security, fair values are estimated by using either quoted prices of securities with similar characteristics or an income approach fair value model with observable inputs that include a combination of interest rates, yield curves, credit risks, prepayment speeds, rating, and tax-exempt status. These funds are classified as Level 2 investments pursuant to the three-level valuation hierarchy as required by the FVM&D Topic of the ASC.hierarchy.
The valuation of private equity and other alternative investments requires significant management judgment due to the absence of quoted market prices, inherent lack of liquidity, and the long-term nature of such assets. The fair value of these investments is estimated based on the market value of the underlying real estate and private equity investments. The underlying real estate value is determined using the most recent available appraisals. Private equity investmentsinstruments are valued using market appraisals orbased on reported net asset values discounted by 0% to 20% for risk and 0% to 10% for liquidity. A significant increase (decrease) in the discounts results in a discounted cash flow methodology, which is an income approachdirectionally opposite change in the fair value model, depending on the nature of the underlying assets. The appraisals assess value based on a combinationinstruments. Valuation policies and procedures are determined by our Trust Services department, which reports to our Chief Financial Officer. Additionally, valuations are reviewed by the Investment Committee of replacement cost, comparative sales analysis, and discounted cash flow analysis.the Board of Directors quarterly. These funds are classified as Level 3 investments pursuant to the three-level valuation hierarchy as required by the FVM&D Topic of the ASC.hierarchy.
As of December 31, 2011,2014, our unfunded commitment for our private equity and other investments was $11.8$26.9 million which, if called, would be funded by the assets of the trusts. Our private equity and other investments include several funds that invest in limited partnerships, distressed debt, real estate, and mezzanine financing. The majority of theThese investments can never be redeemed at discount;. others can be redeemed without a discount. Generally, however,by the funds. Instead, the nature of the investments in this category is that the distributions are received through the liquidation of the underlying assets of the funds. We estimate that the underlying assets will be liquidated over the next 2 to 10 years.
Our investments classified as Level 1 securities include common stock and mutual funds. Level 2 securities include U.S. Treasury, Canadian government, corporate, mortgage-backed and asset-backed fixed income securities, and preferred stock. Our private equity and other alternative investments are classified as Level 3 securities.
The inputs into the fair value of our market-based cemetery merchandise and service trust investments are categorized as follows:
SERVICE CORPORATION INTERNATIONAL
NOTES TO CONSOLIDATED FINANCIAL STATEMENTS — (Continued)
|
| | | | | | | | | | | | | | | |
| | Quoted Market Prices in Active Markets (Level 1) | | Significant Other Observable Inputs (Level 2) | | Significant Unobservable Inputs (Level 3) | | Fair Market Value |
| | | | (In thousands) | | |
| Trust investments at December 31, 2011 | $ | 914,513 |
| | $ | 121,296 |
| | $ | 15,655 |
| | $ | 1,051,464 |
|
| Trust investments at December 31, 2010 | $ | 932,782 |
| | $ | 123,738 |
| | $ | 6,251 |
| | $ | 1,062,771 |
|
The change in our market-based cemetery merchandise and service trust investments with significant unobservable inputs (Level 3) is as follows for the years ended December 31 (in thousands):
|
| | | | | | | | | | | |
| | 2011 | | 2010 | | 2009 |
| Fair market value, beginning balance at January 1, | $ | 6,251 |
| | $ | 4,341 |
| | $ | 31,837 |
|
Net unrealized gains (losses) included in Accumulated other comprehensive income(1) | 286 |
| | (4,304 | ) | | (14,039 | ) |
Net realized losses included in Other (expense) income, net(2) | (101 | ) | | (529 | ) | | (27 | ) |
| Sales | — |
| | (48 | ) | | — |
|
| Contributions | 10,795 |
| | 7,508 |
| | 2,672 |
|
| Distributions and other | (1,576 | ) | | (717 | ) | | (510 | ) |
| Transfers out of Level 3 | — |
| | — |
| | (15,592 | ) |
| Fair market value, ending balance at December 31 | $ | 15,655 |
| | $ | 6,251 |
| | $ | 4,341 |
|
|
| | | | | | | | | | | | | | | | | | | | | | | |
| | 2014 | | 2013 | | 2012 |
| | Private Equity | | Other | | Private Equity | | Other | | Private Equity | | Other |
| | | | | | (In thousands) | | | | |
| Fair value, beginning balance at January 1, | $ | 26,844 |
| | $ | 1,245 |
| | $ | 17,687 |
| | $ | 450 |
| | $ | 15,219 |
| | $ | 436 |
|
Net unrealized gains (losses) included in Accumulated other comprehensive income(1) | 3,313 |
| | (73 | ) | | 15,420 |
| | 1,218 |
| | 100 |
| | 28 |
|
Net realized losses included in Other income (expense), net(2) | (43 | ) | | (7 | ) | | (48 | ) | | (5 | ) | | (64 | ) | | (2 | ) |
| Purchases | — |
| | 196 |
| | — |
| | — |
| | — |
| | — |
|
| Contributions | 6,582 |
| | 4 |
| | 3,430 |
| | — |
| | 4,932 |
| | — |
|
| Distributions and other | (7,352 | ) | | (168 | ) | | (9,645 | ) | | (418 | ) | | (2,500 | ) | | (12 | ) |
| Fair value, ending balance at December 31, | $ | 29,344 |
| | $ | 1,197 |
| | $ | 26,844 |
| | $ | 1,245 |
| | $ | 17,687 |
| | $ | 450 |
|
| |
| (1) | All unrealized gains (losses) recognized in Accumulated other comprehensive income for our cemetery merchandise and service trust investments are attributable to our preneed customers and are offset by a corresponding reclassification in Accumulated other comprehensive income to Deferred preneed funeral and cemetery receipts held in trust. See Note 7 for further information related to our Deferred preneed funeral and cemetery receipts held in trust. |
| |
| (2) | All losses recognized in Other income (expense) income,, net for our cemetery merchandise and service trust investments are attributable to our preneed customers and are offset by a corresponding reclassification in Other income (expense) income,, net to Deferred preneed funeral and cemetery receipts held in trust. See Note 7 for further information related to our Deferred preneed funeral and cemetery receipts held in trust. |
Maturity dates of our fixed income securities range from 20112015 to 2041.2044. Maturities of fixed income securities (excluding mutual funds) at December 31, 20112014 are estimated as follows:
| | | | Fair Market Value | Fair Value |
| | (In thousands) | (In thousands) |
| Due in one year or less | $ | 9,841 |
| $ | 13,302 |
|
| Due in one to five years | 45,470 |
| 36,354 |
|
| Due in five to ten years | 34,622 |
| 21,784 |
|
| Thereafter | 28,182 |
| 22,503 |
|
| | $ | 118,115 |
| $ | 93,943 |
|
Earnings from all our cemetery merchandise and service trust investments are recognized in cemetery revenues when merchandise is delivered or a service is performed or merchandise is delivered.performed. Fees charged by our wholly-owned registered investment advisor are also included in current revenues in the period in which they are earned. In addition, we are entitled to retain, in certain jurisdictions, a portion of collected customer payments when a customer cancels a preneed contract; these amounts are also recognized in current revenues. Recognized earnings (realized and unrealized) related to our cemetery merchandise and service trust investments were $20.7$48.2 million,, $15.1 $39.0 million,, and $8.6$27.7 million for the years ended December 31, 2011, 2010,2014, 2013, and 2009,2012, respectively.
We assess our trust investments for other-than-temporary declines in fair value on a quarterly basis. Impairment charges resulting from this assessment are recognized as investment losses in Other income (expense) income,, net and a decrease to Preneed cemetery receivables, net and trust investments. These investment losses, if any, are offset by the corresponding reclassification in Other income (expense) income,, net, which reduces Deferred preneed cemetery receipts held in trust. See Note 7 for further information related to our Deferred preneed cemetery receipts held in trust. For the years ended December 31, 2011, 2010,2014, 2013, and 2009,2012, we
SERVICE CORPORATION INTERNATIONAL
NOTES TO CONSOLIDATED FINANCIAL STATEMENTS — (Continued)
recorded a $28.7$60.0 million,, a $5.7$1.6 million,, and a $41.2$0.8 million, respectively, impairment charge for other-than-temporary declines in fair value related to unrealized losses on certain investments.
We have determined that the remaining unrealized losses in our cemetery merchandise and service trust investments are considered temporary in nature, as the unrealized losses were due to temporary fluctuations in interest rates and equity prices. The investments are diversified across multiple industry segments using a balanced allocation strategy to minimize long-term risk. We
believe that none of the securities are other-than-temporarily impaired based on our analysis of the investments. Our analysis included a review of the portfolio holdings and discussions with the individual money managers as to the sector exposures, credit ratings, and the severity and duration of the unrealized losses. Our cemetery merchandise and service trust investment unrealized losses, their associated fair market values, and the duration of unrealized losses for the years ended December 31, 20112014 and 2010,2013, are shown in the following tables:
| | | | December 31, 2011 | December 31, 2014 |
| | In Loss Position Less Than 12 Months | | In Loss Position Greater Than 12 Months | | Total | In Loss Position Less Than 12 Months | | In Loss Position Greater Than 12 Months | | Total |
| | Fair Market Value | | Unrealized Losses | | Fair Market Value | | Unrealized Losses | | Fair Market Value | | Unrealized Losses | Fair Value | | Unrealized Losses | | Fair Value | | Unrealized Losses | | Fair Value | | Unrealized Losses |
| | | | | | (In thousands) | | | | | | | | | (In thousands) | | | | |
| Fixed income securities: | |
| | |
| | |
| | |
| | |
| | |
| |
| | |
| | |
| | |
| | |
| | |
|
| U.S. Treasury | $ | 1,736 |
| | $ | (51 | ) | | $ | 3,038 |
| | $ | (262 | ) | | $ | 4,774 |
| | $ | (313 | ) | $ | 45,072 |
| | $ | (605 | ) | | $ | — |
| | $ | — |
| | $ | 45,072 |
| | $ | (605 | ) |
| Canadian government | 4,024 |
| | (24 | ) | | — |
| | — |
| | 4,024 |
| | (24 | ) | — |
| | — |
| | 4,858 |
| | (134 | ) | | 4,858 |
| | (134 | ) |
| Corporate | 15,044 |
| | (850 | ) | | 1,747 |
| | (111 | ) | | 16,791 |
| | (961 | ) | 2,017 |
| | (61 | ) | | 1,936 |
| | (55 | ) | | 3,953 |
| | (116 | ) |
| Residential mortgage-backed | 2 |
| | (1 | ) | | 15 |
| | (1 | ) | | 17 |
| | (2 | ) | 33 |
| | (1 | ) | | — |
| | — |
| | 33 |
| | (1 | ) |
| Equity securities: | |
| | |
| | |
| | |
| | |
| | |
| |
| | |
| | |
| | |
| | |
| | |
|
| Preferred stock: | 1,583 |
| | (270 | ) | | — |
| | — |
| | 1,583 |
| | (270 | ) | |
| Common stock: | |
| | |
| | |
| | |
| | |
| | |
| |
| | |
| | |
| | |
| | |
| | |
|
| United States | 123,849 |
| | (26,401 | ) | | 17,085 |
| | (4,053 | ) | | 140,934 |
| | (30,454 | ) | 192,015 |
| | (11,706 | ) | | 585 |
| | — |
| | 192,600 |
| | (11,706 | ) |
| Canada | 7,694 |
| | (1,260 | ) | | 366 |
| | (520 | ) | | 8,060 |
| | (1,780 | ) | 2,069 |
| | (319 | ) | | 778 |
| | (522 | ) | | 2,847 |
| | (841 | ) |
| Other international | 8,654 |
| | (629 | ) | | 3,772 |
| | (907 | ) | | 12,426 |
| | (1,536 | ) | 28,308 |
| | (2,395 | ) | | — |
| | — |
| | 28,308 |
| | (2,395 | ) |
| Mutual funds: | |
| | |
| | |
| | |
| | |
| | |
| |
| | |
| | |
| | |
| | |
| | |
|
| Equity | 115,725 |
| | (11,222 | ) | | 36,398 |
| | (13,689 | ) | | 152,123 |
| | (24,911 | ) | 303,211 |
| | (18,329 | ) | | 1,577 |
| | (101 | ) | | 304,788 |
| | (18,430 | ) |
| Fixed income | 48,950 |
| | (7,686 | ) | | 9,367 |
| | (12,552 | ) | | 58,317 |
| | (20,238 | ) | 159,572 |
| | (4,106 | ) | | 15,113 |
| | (596 | ) | | 174,685 |
| | (4,702 | ) |
| Private equity | 466 |
| | (254 | ) | | 14,213 |
| | (15,363 | ) | | 14,679 |
| | (15,617 | ) | 88 |
| | (100 | ) | | 7,518 |
| | (6,083 | ) | | 7,606 |
| | (6,183 | ) |
| Other | | 2 |
| | (3 | ) | | 259 |
| | (68 | ) | | 261 |
| | (71 | ) |
| Total temporarily impaired securities | $ | 327,727 |
| | $ | (48,648 | ) | | $ | 86,001 |
| | $ | (47,458 | ) | | $ | 413,728 |
| | $ | (96,106 | ) | $ | 732,387 |
| | $ | (37,625 | ) | | $ | 32,624 |
| | $ | (7,559 | ) | | $ | 765,011 |
| | $ | (45,184 | ) |
SERVICE CORPORATION INTERNATIONAL
NOTES TO CONSOLIDATED FINANCIAL STATEMENTS — (Continued)
| | | | December 31, 2010 | December 31, 2013 |
| | In Loss Position Less Than 12 Months | | In Loss Position Greater Than 12 Months | | Total | In Loss Position Less Than 12 Months | | In Loss Position Greater Than 12 Months | | Total |
| | Fair Market Value | | Unrealized Losses | | Fair Market Value | | Unrealized Losses | | Fair Market Value | | Unrealized Losses | Fair Value | | Unrealized Losses | | Fair Value | | Unrealized Losses | | Fair Value | | Unrealized Losses |
| | | | | | (In thousands) | | | | | | | | | (In thousands) | | | | |
| Fixed income securities: | |
| | |
| | |
| | |
| | |
| | |
| |
| | |
| | |
| | |
| | |
| | |
|
| U.S. Treasury | $ | 6,057 |
| | $ | (295 | ) | | $ | 315 |
| | $ | (12 | ) | | $ | 6,372 |
| | $ | (307 | ) | $ | 44,995 |
| | $ | (6,040 | ) | | $ | 24,961 |
| | $ | (2,836 | ) | | $ | 69,956 |
| | $ | (8,876 | ) |
| Canadian government | 2,908 |
| | (4 | ) | | — |
| | — |
| | 2,908 |
| | (4 | ) | 9,424 |
|
| (120 | ) |
| 3,066 |
|
| (141 | ) |
| 12,490 |
|
| (261 | ) |
| Corporate | 8,577 |
| | (402 | ) | | — |
| | — |
| | 8,577 |
| | (402 | ) | 15,019 |
|
| (424 | ) |
| 3,069 |
|
| (222 | ) |
| 18,088 |
|
| (646 | ) |
| Residential mortgage-backed | — |
| | — |
| | 20 |
| | (1 | ) | | 20 |
| | (1 | ) | 144 |
| | (2 | ) | | — |
| | — |
| | 144 |
| | (2 | ) |
| Asset-backed | 766 |
| | (4 | ) | | 56 |
| | (1 | ) | | 822 |
| | (5 | ) | 3,248 |
| | (13 | ) | | — |
| | — |
| | 3,248 |
| | (13 | ) |
| Equity securities: | |
| | |
| | |
| | |
| | |
| | |
| |
| | |
| | |
| | |
| | |
| | |
|
| Preferred stock: | 1,749 |
| | (124 | ) | | — |
| | — |
| | 1,749 |
| | (124 | ) | |
| Preferred stock | | 5,588 |
| | (123 | ) | | — |
| | — |
| | 5,588 |
| | (123 | ) |
| Common stock: | |
| | |
| | |
| | |
| | |
| | |
| |
| | |
| | |
| | |
| | |
| | |
|
| United States | 63,027 |
| | (4,450 | ) | | 31,108 |
| | (6,371 | ) | | 94,135 |
| | (10,821 | ) | 46,189 |
| | (2,648 | ) | | 3,480 |
| | (583 | ) | | 49,669 |
| | (3,231 | ) |
| Canada | 3,131 |
| | (181 | ) | | 1,475 |
| | (669 | ) | | 4,606 |
| | (850 | ) | 1,568 |
| | (502 | ) | | 1,935 |
| | (433 | ) | | 3,503 |
| | (935 | ) |
| Other international | 8,542 |
| | (1,403 | ) | | 5,259 |
| | (2,242 | ) | | 13,801 |
| | (3,645 | ) | 4,332 |
| | (124 | ) | | 700 |
| | (76 | ) | | 5,032 |
| | (200 | ) |
| Mutual funds: | |
| | |
| | |
| | |
| | |
| | |
| |
| | |
| | |
| | |
| | |
| | |
|
| Equity | 5,107 |
| | (112 | ) | | 92,630 |
| | (18,457 | ) | | 97,737 |
| | (18,569 | ) | 3,847 |
| | (54 | ) | | 14,430 |
| | (1,650 | ) | | 18,277 |
| | (1,704 | ) |
| Fixed income | 25,887 |
| | (354 | ) | | 14,600 |
| | (9,605 | ) | | 40,487 |
| | (9,959 | ) | 134,294 |
| | (5,527 | ) | | 63,800 |
| | (28,122 | ) | | 198,094 |
| | (33,649 | ) |
| Private equity | — |
| | — |
| | 5,557 |
| | (13,890 | ) | | 5,557 |
| | (13,890 | ) | — |
| | — |
| | 6,589 |
| | (5,153 | ) | | 6,589 |
| | (5,153 | ) |
| Other | 7 |
| | (1 | ) | | 303 |
| | (384 | ) | | 310 |
| | (385 | ) | — |
| | — |
| | 283 |
| | (33 | ) | | 283 |
| | (33 | ) |
| Total temporarily impaired securities | $ | 125,758 |
| | $ | (7,330 | ) | | $ | 151,323 |
| | $ | (51,632 | ) | | $ | 277,081 |
| | $ | (58,962 | ) | $ | 268,648 |
| | $ | (15,577 | ) | | $ | 122,313 |
| | $ | (39,249 | ) | | $ | 390,961 |
| | $ | (54,826 | ) |
Deferred Preneed Cemetery Revenues
At December 31, 20112014 and 2010,2013, Deferred preneed cemetery revenues, net of allowance for cancellation, represent future cemetery revenues, including distributed trust investment earnings associated with unperformed trust-funded preneed cemetery contracts that are not held in trust accounts. Deferred preneed cemetery revenues are recognized in current cemetery revenues when merchandise is delivered or the service is performed or merchandise is delivered.performed. Future cemetery revenues and net trust investment earnings that are held in trust accounts are included in Deferred preneed cemetery receipts held in trust.
The following table summarizes the activity in Deferred preneed cemetery revenues for the years ended December 31:
| | | | 2011 | | 2010 | | 2009 | 2014 | | 2013 | | 2012 |
| | (In thousands) | (In thousands) |
| Beginning balance — Deferred preneed cemetery revenues | $ | 813,493 |
| | $ | 817,543 |
| | $ | 771,117 |
| $ | 1,016,275 |
| | $ | 861,148 |
| | $ | 833,303 |
|
| Net preneed and atneed deferred sales | 363,523 |
| | 349,786 |
| | 342,984 |
| 531,768 |
| | 396,264 |
| | 380,887 |
|
| (Dispositions) acquisitions of businesses, net | (10,861 | ) | | 1,090 |
| | 5,461 |
| |
| Net investment (losses) earnings(1) | (26,431 | ) | | 117,331 |
| | 242,483 |
| |
| (Divestitures) acquisitions of businesses, net | | (25,071 | ) | | 212,624 |
| | 1,089 |
|
Net investment (losses) earnings(1) | | (22,378 | ) | | 201,941 |
| | 130,012 |
|
| Recognized deferred preneed revenues | (350,356 | ) | | (347,996 | ) | | (325,036 | ) | (493,739 | ) | | (386,632 | ) | | (363,072 | ) |
| Change in cancellation allowance | 802 |
| | (2,457 | ) | | 10,855 |
| 3,833 |
| | 18,358 |
| | 3,968 |
|
| Change in deferred preneed cemetery receipts held in trust | 37,173 |
| | (125,974 | ) | | (235,031 | ) | 55,636 |
| | (298,337 | ) | | (133,612 | ) |
| Effect of foreign currency and other | 5,960 |
| | 4,170 |
| | 4,710 |
| (3,943 | ) | | 10,909 |
| | 8,573 |
|
| Ending balance — Deferred preneed cemetery revenues | $ | 833,303 |
| | $ | 813,493 |
| | $ | 817,543 |
| $ | 1,062,381 |
| | $ | 1,016,275 |
| | $ | 861,148 |
|
| |
| (1) | Includes both realized and unrealized investment earnings (losses). earnings. |
| |
| 6. | Cemetery Perpetual Care Trusts |
We are required by state and provincial law to pay into cemetery perpetual care trusts a portion of the proceeds from the sale of cemetery property interment rights. Our cemetery perpetual care trusts are variable interest entities as defined in the Consolidation Topic of the ASC. In accordance with this guidance, weentities. We have determined that
we are the primary beneficiary of these trusts, as
SERVICE CORPORATION INTERNATIONAL
NOTES TO CONSOLIDATED FINANCIAL STATEMENTS — (Continued)
we absorb a majority of the losses and returns associated with these trusts. The merchandise and service trust investments detailed in Notes 4 and 5 are also accounted for as variable interest entities. We consolidate our cemetery perpetual care trust investments with a corresponding amount recorded as Care trusts’ corpus. Cash flows from cemetery perpetual care contracts are presented as operating cash flows in our consolidated statement of cash flows.
The table below sets forth certain investment-related activities associated with our cemetery perpetual care trusts for the years ended December 31:
| | | | 2011 | | 2010 | | 2009 | 2014 | | 2013 | | 2012 |
| | (In thousands) | (In thousands) |
| Deposits | $ | 23,785 |
| | $ | 22,828 |
| | $ | 22,336 |
| $ | 42,220 |
| | $ | 26,501 |
| | $ | 24,869 |
|
| Withdrawals | 34,737 |
| | 41,418 |
| | 31,196 |
| $ | 46,981 |
| | $ | 33,557 |
| | $ | 33,177 |
|
Purchases of available-for-sale securities | 444,616 |
| | 442,219 |
| | 369,536 |
| $ | 1,306,314 |
| | $ | 139,439 |
| | $ | 252,021 |
|
Sales of available-for-sale securities | 410,175 |
| | 365,017 |
| | 285,370 |
| $ | 1,396,669 |
| | $ | 99,701 |
| | $ | 136,391 |
|
Realized gains from sales of available-for-sale securities | 34,275 |
| | 11,753 |
| | 11,288 |
| $ | 134,259 |
| | $ | 17,916 |
| | $ | 11,463 |
|
Realized losses from sales of available-for-sale securities | (16,310 | ) | | (9,792 | ) | | (20,512 | ) | $ | (51,093 | ) | | $ | (2,738 | ) | | $ | (6,595 | ) |
(1) The increase in activity in 2014 is the result of changing the legal structure of the trust investments.
The components of Cemetery perpetual care trust investments in our consolidated balance sheet at December 31 were as follows:
| | | | 2011 | | 2010 | 2014 | | 2013 |
| | (In thousands) | (In thousands) |
| Trust investments, at market | $ | 952,573 |
| | $ | 922,228 |
| $ | 1,192,966 |
| | $ | 1,352,251 |
|
| Cash and cash equivalents | 63,933 |
| | 64,791 |
| 149,694 |
| | 78,509 |
|
| Assets associated with businesses held for sale | | (1,284 | ) | | (88,169 | ) |
| Cemetery perpetual care trust investments | $ | 1,016,506 |
| | $ | 987,019 |
| $ | 1,341,376 |
| | $ | 1,342,591 |
|
The cost and market values associated with our cemetery perpetual care trust investments recorded at fair market value at December 31, 20112014 and 20102013 are detailed below. Cost reflects the investment (net of redemptions) of control holders in common trust funds, mutual funds, and private equity investments.the trusts. Fair market value represents the value of the underlying securities or cash held by the common trust funds, mutual funds at published values, and the estimated market value of private equity investments.trusts.
SERVICE CORPORATION INTERNATIONAL
NOTES TO CONSOLIDATED FINANCIAL STATEMENTS — (Continued)
| | | | December 31, 2011 | | December 31, 2014 |
| | Cost | | Unrealized Gains | | Unrealized Losses | | Fair Market Value | Fair Value Hierarchy Level | Cost | | Unrealized Gains | | Unrealized Losses | | Fair Value |
| | | | (In thousands) | | | | | | (In thousands) | | |
| Fixed income securities: | |
| | |
| | |
| | |
| | |
| | |
| | |
| | |
|
| U.S. Treasury | $ | 981 |
| | $ | 39 |
| | $ | — |
| | $ | 1,020 |
| 2 | $ | 794 |
| | $ | 40 |
| | $ | (4 | ) | | $ | 830 |
|
| Canadian government | 29,015 |
| | 686 |
| | (43 | ) | | 29,658 |
| 2 | 31,993 |
| | 442 |
| | (233 | ) | | 32,202 |
|
| Corporate | 21,197 |
| | 528 |
| | (134 | ) | | 21,591 |
| 2 | 16,762 |
| | 344 |
| | (210 | ) | | 16,896 |
|
| Residential mortgage-backed | 1,662 |
| | 53 |
| | (13 | ) | | 1,702 |
| 2 | 910 |
| | 15 |
| | (6 | ) | | 919 |
|
| Asset-backed | 83 |
| | 2 |
| | (1 | ) | | 84 |
| 2 | 661 |
| | 10 |
| | (4 | ) | | 667 |
|
| Equity securities: | |
| | |
| | |
| | |
| | |
| | |
| | |
| | |
|
| Preferred stock | 6,475 |
| | 18 |
| | (1,146 | ) | | 5,347 |
| 2 | 4,439 |
| | 60 |
| | (12 | ) | | 4,487 |
|
| Common stock: | |
| | |
| | |
| | |
| | |
| | |
| | |
| | |
|
| United States | 141,880 |
| | 14,443 |
| | (9,113 | ) | | 147,210 |
| 1 | 225,129 |
| | 9,340 |
| | (4,881 | ) | | 229,588 |
|
| Canada | 13,374 |
| | 1,483 |
| | (1,423 | ) | | 13,434 |
| 1 | 7,419 |
| | 2,737 |
| | (596 | ) | | 9,560 |
|
| Other international | 16,836 |
| | 1,314 |
| | (1,421 | ) | | 16,729 |
| 1 | 8,102 |
| | 90 |
| | (399 | ) | | 7,793 |
|
| Mutual funds: | |
| | |
| | |
| | |
| | |
| | |
| | |
| | |
|
| Equity | 21,801 |
| | 1,598 |
| | (579 | ) | | 22,820 |
| 1 | 17,310 |
| | 3,264 |
| | (93 | ) | | 20,481 |
|
| Fixed income | 654,883 |
| | 29,758 |
| | (9,402 | ) | | 675,239 |
| 1 | 846,230 |
| | 1,580 |
| | (14,263 | ) | | 833,547 |
|
| Private equity | 23,212 |
| | 374 |
| | (12,737 | ) | | 10,849 |
| 3 | 34,288 |
| | 408 |
| | (10,788 | ) | | 23,908 |
|
| Other | 8,018 |
| | 850 |
| | (1,978 | ) | | 6,890 |
| 3 | 13,526 |
| | 1,094 |
| | (2,532 | ) | | 12,088 |
|
| Cemetery perpetual care trust investments | $ | 939,417 |
| | $ | 51,146 |
| | $ | (37,990 | ) | | $ | 952,573 |
| | $ | 1,207,563 |
| | $ | 19,424 |
| | $ | (34,021 | ) | | $ | 1,192,966 |
|
| | | | December 31, 2010 | | December 31, 2013 |
| | Cost | | Unrealized Gains | | Unrealized Losses | | Fair Market Value | Fair Value Hierarchy Level | Cost | | Unrealized Gains | | Unrealized Losses | | Fair Value |
| | | | (In thousands) | | | | | | (In thousands) | | |
| Fixed income securities: | |
| | |
| | |
| | |
| | |
| | |
| | |
| | |
|
| U.S. Treasury | $ | 5,651 |
| | $ | 863 |
| | $ | (31 | ) | | $ | 6,483 |
| 2 | $ | 1,588 |
| | $ | 9 |
| | $ | (14 | ) | | $ | 1,583 |
|
| Canadian government | 26,702 |
| | 642 |
| | (7 | ) | | 27,337 |
| 2 | 28,487 |
| | 301 |
| | (459 | ) | | 28,329 |
|
| Corporate | 48,278 |
| | 5,219 |
| | (249 | ) | | 53,248 |
| 2 | 43,191 |
| | 312 |
| | (263 | ) | | 43,240 |
|
| Residential mortgage-backed | 1,764 |
| | 55 |
| | (6 | ) | | 1,813 |
| 2 | 4,256 |
| | 14 |
| | (19 | ) | | 4,251 |
|
| Asset-backed | 363 |
| | 5 |
| | — |
| | 368 |
| 2 | 3,006 |
| | 5 |
| | (11 | ) | | 3,000 |
|
| Equity securities: | |
| | |
| | |
| | |
| | |
| | |
| | |
| | |
|
| Preferred stock | 7,789 |
| | 1,385 |
| | (112 | ) | | 9,062 |
| 2 | 25,946 |
| | 192 |
| | (252 | ) | | 25,886 |
|
| Common stock: | |
| | |
| | |
| | |
| | |
| | |
| | |
| | |
|
| United States | 116,799 |
| | 16,916 |
| | (6,640 | ) | | 127,075 |
| 1 | 231,093 |
| | 53,782 |
| | (2,087 | ) | | 282,788 |
|
| Canada | 11,510 |
| | 2,510 |
| | (758 | ) | | 13,262 |
| 1 | 8,846 |
| | 2,222 |
| | (623 | ) | | 10,445 |
|
| Other international | 16,004 |
| | 2,175 |
| | (1,845 | ) | | 16,334 |
| 1 | 20,671 |
| | 1,319 |
| | (167 | ) | | 21,823 |
|
| Mutual funds: | |
| | |
| | |
| | |
| | |
| | |
| | |
| | |
|
| Equity | 65,114 |
| | 6,964 |
| | (7,239 | ) | | 64,839 |
| 1 | 41,270 |
| | 5,693 |
| | (35 | ) | | 46,928 |
|
| Fixed income | 562,879 |
| | 24,773 |
| | (2,334 | ) | | 585,318 |
| 1 | 819,244 |
| | 35,963 |
| | (2,598 | ) | | 852,609 |
|
| Private equity | 23,428 |
| | 351 |
| | (13,344 | ) | | 10,435 |
| 3 | 28,309 |
| | 472 |
| | (9,002 | ) | | 19,779 |
|
| Other | 8,475 |
| | 836 |
| | (2,657 | ) | | 6,654 |
| 3 | 10,521 |
| | 1,153 |
| | (84 | ) | | 11,590 |
|
| Cemetery perpetual care trust investments | $ | 894,756 |
| | $ | 62,694 |
| | $ | (35,222 | ) | | $ | 922,228 |
| | $ | 1,266,428 |
| | $ | 101,437 |
| | $ | (15,614 | ) | | $ | 1,352,251 |
|
Where quoted prices are available in an active market, securities held by the common trust funds and mutual funds are classified as Level 1 investments pursuant to the three-level valuation hierarchy as required by the FVM&D Topic of the ASC.hierarchy.
SERVICE CORPORATION INTERNATIONAL
NOTES TO CONSOLIDATED FINANCIAL STATEMENTS — (Continued)
Where quoted market prices are not available for the specific security, fair values are estimated by using either quoted prices of securities with similar characteristics or an income approach fair value model with observable inputs that include a combination of interest rates, yield curves, credit risks, prepayment speeds, rating, and tax-exempt status. These funds are classified as Level 2 investments pursuant to the three-level valuation hierarchy as required by the FVM&D Topic of the ASC.hierarchy.
The valuation of private equity and other alternative investments requires significant management judgment due to the absence of quoted market prices, inherent lack of liquidity, and the long-term nature of such assets. The fair value of these investments is estimated based on the market value of the underlying real estate and private equity investments. The underlying real estate value is determined using the most recent available appraisals. Private equity investmentsinstruments are valued using market appraisals orbased on reported net asset values discounted by 0% to 20% for risk and 0% to 10% for liquidity. A significant increase (decrease) in the discounts results in a discounted cash flow methodology, which is an income approachdirectionally opposite change in the fair value model, depending on the nature of the underlying assets. The appraisals assess value based on a combinationinstruments. Valuation policies and procedures are determined by our Trust Services department, which reports to our Chief Financial Officer. Additionally, valuations are reviewed by the Investment Committee of replacement cost, comparative sales analysis, and discounted cash flow analysis.the Board of Directors quarterly. These funds are classified as Level 3 investments pursuant to the three-level valuation hierarchy as requiredhierarchy.
As of December 31, 2014, our unfunded commitment for our private equity and other investments was $8.9 million which, if called, would be funded by the FVM&D Topicassets of the ASC.
trusts. Our private equity and other investments include several funds that invest in limited partnerships, distressed debt, real estate, and mezzanine financing. The majority of theThese investments can never be redeemed at discount; others can be redeemed without a discount. Generally, however,by the funds. Instead, the nature of the investments in this category is that the distributions are received through the liquidation of the underlying assets of the funds. We estimate that the underlying assets will be liquidated over the next 2 to 10 years.
Our investments classified as Level 1 securities include common stock and mutual funds. Level 2 securities include U.S. Treasury, Canadian government, corporate, mortgage-backed and asset-backed fixed income securities, and preferred stock. Our private equity and other alternative investments are classified as Level 3 securities.
The inputs into the fair value of our market-based cemetery perpetual care investments are categorized as follows:
|
| | | | | | | | | | | | | | | |
| | Quoted Market Prices in Active Markets (Level 1) | | Significant Other Observable Inputs (Level 2) | | Significant Unobservable Inputs (Level 3) | | Fair Market Value |
| | | | (In thousands) | | |
| Trust investments at December 31, 2011 | $ | 875,432 |
| | $ | 59,402 |
| | $ | 17,739 |
| | $ | 952,573 |
|
| Trust investments at December 31, 2010 | $ | 806,828 |
| | $ | 98,311 |
| | $ | 17,089 |
| | $ | 922,228 |
|
The change in our market-based cemetery perpetual care trust investments with significant unobservable inputs (Level 3) is as follows for the years ended December 31 (in thousands):
|
| | | | | | | | | | | |
| | 2011 | | 2010 | | 2009 |
| Fair market value, beginning balance | $ | 17,089 |
| | $ | 14,943 |
| | $ | 48,276 |
|
Net unrealized gains (losses) included in Accumulated other comprehensive income(1) | 7,400 |
| | 7,018 |
| | (27,920 | ) |
Net realized losses included in Other (expense) income, net(2) | (310 | ) | | (2,613 | ) | | (121 | ) |
| Sales | (44 | ) | | (155 | ) | | — |
|
| Contributions | 118 |
| | 11,140 |
| | 4,263 |
|
| Distributions and other | (6,514 | ) | | (13,244 | ) | | (2,343 | ) |
| Transfers out of Level 3 | — |
| | — |
| | (7,212 | ) |
| Fair market value, ending balance | $ | 17,739 |
| | $ | 17,089 |
| | $ | 14,943 |
|
|
| | | | | | | | | | | | | | | | | | | | | | | |
| | 2014 | | 2013 | | 2012 |
| | Private Equity | | Other | | Private Equity | | Other | | Private Equity | | Other |
| | | | | | (In thousands) | | | | |
| Fair value, beginning balance at January 1, | $ | 19,779 |
| | $ | 11,590 |
| | $ | 11,122 |
| | $ | 7,659 |
| | $ | 10,849 |
| | $ | 6,890 |
|
Net unrealized gains included in Accumulated other comprehensive income(1) | 1,216 |
| | 2,145 |
| | 6,897 |
| | 4,081 |
| | 1,648 |
| | 1,035 |
|
Net realized losses included in Other income (expense), net(2) | (70 | ) | | (44 | ) | | (142 | ) | | (76 | ) | | (162 | ) | | (43 | ) |
| Sales | — |
| | (17 | ) | | — |
| | — |
| | (26 | ) | | — |
|
| Contributions | 10,461 |
| | — |
| | 3,706 |
| | — |
| | 4,171 |
| | — |
|
| Distributions and other | (7,478 | ) | | (1,586 | ) | | (1,841 | ) | | (508 | ) | | (5,358 | ) | | (223 | ) |
| Acquisitions | — |
| | — |
| | 37 |
| | 434 |
| | — |
| | — |
|
| Fair value, ending balance at December 31, | $ | 23,908 |
| | $ | 12,088 |
| | $ | 19,779 |
| | $ | 11,590 |
| | $ | 11,122 |
| | $ | 7,659 |
|
| |
| (1) | All unrealized gains (losses) recognized in Accumulated other comprehensive income for our cemetery perpetual care trust investments are offset by a corresponding reclassification in Accumulated other comprehensive income to Care trusts’ corpus. See Note 7 for further information related to our Care trusts’ corpus. |
| |
| (2) | All losses recognized in Other income (expense) income,, net for our cemetery perpetual care trust investments are offset by a corresponding reclassification in Other income (expense) income,, net to Care trusts’ corpus. See Note 7 for further information related to our Care trusts’ corpus. |
SERVICE CORPORATION INTERNATIONAL
NOTES TO CONSOLIDATED FINANCIAL STATEMENTS — (Continued)
Maturity dates of our fixed income securities range from 20112015 to 2041.2044. Maturities of fixed income securities at December 31, 20112014 are estimated as follows:
| | | | Fair Market Value | Fair Value |
| | (In thousands) | (In thousands) |
| Due in one year or less | $ | 7,850 |
| $ | 18,602 |
|
| Due in one to five years | 23,325 |
| 23,463 |
|
| Due in five to ten years | 21,622 |
| 8,593 |
|
| Thereafter | 1,258 |
| 856 |
|
| | $ | 54,055 |
| $ | 51,514 |
|
Distributable earnings from these cemetery perpetual care trust investments are recognized in current cemetery revenues to the extent we incur qualifying cemetery maintenance costs. Fees charged by our wholly-owned registered investment advisor are also included in current revenues in the period in which they are earned. Recognized earnings related to these cemetery perpetual care trust investments were $43.0$72.4 million,, $38.6 $44.1 million,, and $37.6$44.7 million for the years ended December 31, 2011, 2010,2014, 2013, and 2009,2012, respectively.
We assess our trust investments for other-than-temporary declines in fair value on a quarterly basis. Impairment charges resulting from this assessment are recognized as investment losses in Other (expense) income, net and a decrease to Cemetery perpetual care trust investments. These investment losses, if any, are offset by the corresponding reclassification in Other (expense) income, net, which reduces Care trusts’ corpus. See Note 7 for further information related to our Care trusts’ corpus. For the years ended December 31, 2011, 2010,2014, 2013, and 2009,2012, we recorded a $0.7$8.1 million,, a $7.8$0.2 million,, and a $13.1$0.8 million, respectively, impairment charge for other-than-temporary declines in fair value related to unrealized losses on certain investments.
We have determined that the remaining unrealized losses in our cemetery perpetual care trust investments are considered temporary in nature, as the unrealized losses were due to temporary fluctuations in interest rates and equity prices. The investments are diversified across multiple industry segments using a balanced allocation strategy to minimize long-term risk. We believe that none of the securities are other-than-temporarily impaired based on our analysis of the investments. Our analysis included a review of the portfolio holdings, and discussions with the individual money managers as to the sector exposures, credit ratings, and the severity and duration of the unrealized losses. Our cemetery perpetual care trust investment unrealized losses, their associated fair market values and the duration of unrealized losses for the years ended December 31, 20112014 and 2010,2013, are shown in the following table:
SERVICE CORPORATION INTERNATIONAL
NOTES TO CONSOLIDATED FINANCIAL STATEMENTS — (Continued)
| | | | December 31, 2011 | December 31, 2014 |
| | In Loss Position Less Than 12 Months | | In Loss Position Greater Than 12 Months | | Total | In Loss Position Less Than 12 Months | | In Loss Position Greater Than 12 Months | | Total |
| | Fair Market Value | | Unrealized Losses | | Fair Market Value | | Unrealized Losses | | Fair Market Value | | Unrealized Losses | Fair Market Value | | Unrealized Losses | | Fair Market Value | | Unrealized Losses | | Fair Market Value | | Unrealized Losses |
| | | | | | (In thousands) | | | | | | | | | (In thousands) | | | | |
| Fixed income securities: | |
| | |
| | |
| | |
| | |
| | |
| |
| | |
| | |
| | |
| | |
| | |
|
| U.S. Treasury | | $ | 497 |
| | $ | (4 | ) | | $ | — |
| | $ | — |
| | $ | 497 |
| | $ | (4 | ) |
| Canadian government | $ | 7,057 |
| | $ | (43 | ) | | $ | — |
| | $ | — |
| | $ | 7,057 |
| | $ | (43 | ) | — |
| | — |
| | 7,825 |
| | (233 | ) | | 7,825 |
| | (233 | ) |
| Corporate | 3,854 |
| | (73 | ) | | 1,456 |
| | (61 | ) | | 5,310 |
| | (134 | ) | 4,656 |
| | (108 | ) | | 3,198 |
| | (102 | ) | | 7,854 |
| | (210 | ) |
| Residential mortgage-backed | 58 |
| | (1 | ) | | 127 |
| | (12 | ) | | 185 |
| | (13 | ) | 256 |
| | (5 | ) | | 69 |
| | (1 | ) | | 325 |
| | (6 | ) |
| Asset-backed | 51 |
| | (1 | ) | | — |
| | — |
| | 51 |
| | (1 | ) | 373 |
| | (4 | ) | | — |
| | — |
| | 373 |
| | (4 | ) |
| Equity securities: | |
| | |
| | |
| | |
| | |
| | |
| |
| | |
| | |
| | |
| | |
| | |
|
| Preferred stock | 4,393 |
| | (1,116 | ) | | 21 |
| | (30 | ) | | 4,414 |
| | (1,146 | ) | 2,224 |
| | (11 | ) | | 49 |
| | (1 | ) | | 2,273 |
| | (12 | ) |
| Common stock: | |
| | |
| | |
| | |
| | |
| | |
| |
| | |
| | |
| | |
| | |
| | |
|
| United States | 39,716 |
| | (5,459 | ) | | 9,055 |
| | (3,654 | ) | | 48,771 |
| | (9,113 | ) | 100,370 |
| | (4,803 | ) | | 419 |
| | (78 | ) | | 100,789 |
| | (4,881 | ) |
| Canada | 4,402 |
| | (772 | ) | | 565 |
| | (651 | ) | | 4,967 |
| | (1,423 | ) | 2,418 |
| | (244 | ) | | 757 |
| | (352 | ) | | 3,175 |
| | (596 | ) |
| Other international | 5,738 |
| | (1,226 | ) | | 104 |
| | (195 | ) | | 5,842 |
| | (1,421 | ) | 4,444 |
| | (399 | ) | | — |
| | — |
| | 4,444 |
| | (399 | ) |
| Mutual funds: | |
| | |
| | |
| | |
| | |
| | |
| |
| | |
| | |
| | |
| | |
| | |
|
| Equity | 9,852 |
| | (564 | ) | | 2,717 |
| | (15 | ) | | 12,569 |
| | (579 | ) | 2,601 |
| | (85 | ) | | 153 |
| | (8 | ) | | 2,754 |
| | (93 | ) |
| Fixed income | 144,350 |
| | (5,498 | ) | | 51,301 |
| | (3,904 | ) | | 195,651 |
| | (9,402 | ) | 576,890 |
| | (14,177 | ) | | 2,581 |
| | (86 | ) | | 579,471 |
| | (14,263 | ) |
| Private equity | 254 |
| | (324 | ) | | 10,189 |
| | (12,413 | ) | | 10,443 |
| | (12,737 | ) | 9,213 |
| | (798 | ) | | 14,254 |
| | (9,990 | ) | | 23,467 |
| | (10,788 | ) |
| Other | 140 |
| | (181 | ) | | 5,660 |
| | (1,797 | ) | | 5,800 |
| | (1,978 | ) | 4,069 |
| | (352 | ) | | 6,276 |
| | (2,180 | ) | | 10,345 |
| | (2,532 | ) |
| Total temporarily impaired securities | $ | 219,865 |
| | $ | (15,258 | ) | | $ | 81,195 |
| | $ | (22,732 | ) | | $ | 301,060 |
| | $ | (37,990 | ) | $ | 708,011 |
|
| $ | (20,990 | ) | | $ | 35,581 |
| | $ | (13,031 | ) | | $ | 743,592 |
| | $ | (34,021 | ) |
| | | | December 31, 2010 | December 31, 2013 |
| | In Loss Position Less Than 12 Months | | In Loss Position Greater Than 12 Months | | Total | In Loss Position Less Than 12 Months | | In Loss Position Greater Than 12 Months | | Total |
| | Fair Market Value | | Unrealized Losses | | Fair Market Value | | Unrealized Losses | | Fair Market Value | | Unrealized Losses | Fair Market Value | | Unrealized Losses | | Fair Market Value | | Unrealized Losses | | Fair Market Value | | Unrealized Losses |
| | | | | | (In thousands) | | | | | | | | | (In thousands) | | | | |
| Fixed income securities: | |
| | |
| | |
| | |
| | |
| | |
| |
| | |
| | |
| | |
| | |
| | |
|
| U.S. Treasury | $ | 1,669 |
| | $ | (31 | ) | | $ | — |
| | $ | — |
| | $ | 1,669 |
| | $ | (31 | ) | $ | 1,339 |
| | $ | (14 | ) | | $ | 20 |
| | $ | — |
| | $ | 1,359 |
| | $ | (14 | ) |
| Canadian government | 4,966 |
| | (7 | ) | | — |
| | — |
| | 4,966 |
| | (7 | ) | 15,777 |
| | (214 | ) | | 5,131 |
| | (245 | ) | | 20,908 |
| | (459 | ) |
| Corporate | 9,181 |
| | (221 | ) | | 675 |
| | (28 | ) | | 9,856 |
| | (249 | ) | 22,530 |
|
| (129 | ) |
| 3,299 |
|
| (134 | ) |
| 25,829 |
|
| (263 | ) |
| Residential mortgage-backed | 137 |
| | (2 | ) | | 92 |
| | (4 | ) | | 229 |
| | (6 | ) | 2,959 |
| | (18 | ) | | 10 |
| | (1 | ) | | 2,969 |
| | (19 | ) |
| Asset-backed | | 2,835 |
| | (10 | ) | | 15 |
| | (1 | ) | | 2,850 |
| | (11 | ) |
| Equity securities: | |
| | |
| | |
| | |
| | | | | |
| | |
| | |
| | |
| | | | |
| Preferred stock | 1,561 |
| | (90 | ) | | 29 |
| | (22 | ) | | 1,590 |
| | (112 | ) | 14,647 |
| | (245 | ) | | 44 |
| | (7 | ) | | 14,691 |
| | (252 | ) |
| Common stock: | |
| | |
| | |
| | |
| | | | | |
| | |
| | |
| | |
| | | | |
| United States | 15,419 |
| | (1,464 | ) | | 16,419 |
| | (5,176 | ) | | 31,838 |
| | (6,640 | ) | 23,820 |
| | (1,561 | ) | | 3,253 |
| | (526 | ) | | 27,073 |
| | (2,087 | ) |
| Canada | 1,545 |
| | (82 | ) | | 1,454 |
| | (676 | ) | | 2,999 |
| | (758 | ) | 667 |
| | (129 | ) | | 1,794 |
| | (494 | ) | | 2,461 |
| | (623 | ) |
| Other international | 3,175 |
| | (242 | ) | | 2,383 |
| | (1,603 | ) | | 5,558 |
| | (1,845 | ) | 1,540 |
| | (54 | ) | | 524 |
| | (113 | ) | | 2,064 |
| | (167 | ) |
| Mutual funds: | |
| | |
| | |
| | |
| | | | | |
| | |
| | |
| | |
| | | | |
| Equity | 866 |
| | (10 | ) | | 29,974 |
| | (7,229 | ) | | 30,840 |
| | (7,239 | ) | 390 |
| | (14 | ) | | 163 |
| | (21 | ) | | 553 |
| | (35 | ) |
| Fixed income | 18,166 |
| | (134 | ) | | 53,553 |
| | (2,200 | ) | | 71,719 |
| | (2,334 | ) | 181,662 |
| | (2,090 | ) | | 28,494 |
| | (508 | ) | | 210,156 |
| | (2,598 | ) |
| Private equity | 1 |
| | (1 | ) | | 10,060 |
| | (13,343 | ) | | 10,061 |
| | (13,344 | ) | — |
| | — |
| | 19,242 |
| | (9,002 | ) | | 19,242 |
| | (9,002 | ) |
| Other | 1 |
| | (2 | ) | | 5,568 |
| | (2,655 | ) | | 5,569 |
| | (2,657 | ) | — |
| | — |
| | 9,739 |
| | (84 | ) | | 9,739 |
| | (84 | ) |
| Total temporarily impaired securities | $ | 56,687 |
| | $ | (2,286 | ) | | $ | 120,207 |
| | $ | (32,936 | ) | | $ | 176,894 |
| | $ | (35,222 | ) | $ | 268,166 |
| | $ | (4,478 | ) | | $ | 71,728 |
| | $ | (11,136 | ) | | $ | 339,894 |
| | $ | (15,614 | ) |
SERVICE CORPORATION INTERNATIONAL
NOTES TO CONSOLIDATED FINANCIAL STATEMENTS — (Continued)
| |
| 7. | Deferred Preneed Funeral and Cemetery Receipts Held in Trust and Care Trusts’ Corpus |
Deferred Preneed Funeral and Cemetery Receipts Held in Trust
We consolidate the merchandise and service trusts associated with our preneed funeral and cemetery activities in accordance withas we are the Consolidation Topicprimary beneficiary of the ASC.trusts. Although the guidance requires the consolidation ofwe consolidate the merchandise and service trusts, it does not change the legal relationships among the trusts, us, or our customers. The customers are the legal beneficiaries of these merchandise and service trusts; therefore, their interests in these trusts represent a liability to us.
The components of Deferred preneed funeral and cemetery receipts held in trust in our consolidated balance sheet at December 31, 20112014 and 20102013 are detailed below.
| | | | December 31, 2011 | | December 31, 2010 | December 31, 2014 | | December 31, 2013 |
| | Preneed Funeral | | Preneed Cemetery | | Total | | Preneed Funeral | | Preneed Cemetery | | Total | Preneed Funeral | | Preneed Cemetery | | Total | | Preneed Funeral | | Preneed Cemetery | | Total |
| | | (In thousands) | | | | (In thousands) | | | (In thousands) | | | | (In thousands) | |
| Trust investments | $ | 1,271,446 |
| | $ | 1,156,023 |
| | $ | 2,427,469 |
| | $ | 1,216,542 |
| | $ | 1,194,795 |
| | $ | 2,411,337 |
| $ | 1,628,875 |
| | $ | 1,526,653 |
| | $ | 3,155,528 |
| | $ | 1,665,977 |
| | $ | 1,585,291 |
| | $ | 3,251,268 |
|
| Accrued trust operating payables and other | (1,261 | ) | | (1,852 | ) | | (3,113 | ) | | (975 | ) | | (2,288 | ) | | (3,263 | ) | (2,487 | ) | | (4,157 | ) | | (6,644 | ) | | (1,108 | ) | | (1,697 | ) | | (2,805 | ) |
| Deferred preneed funeral and cemetery receipts held in trust | $ | 1,270,185 |
| | $ | 1,154,171 |
| | $ | 2,424,356 |
| | $ | 1,215,567 |
| | $ | 1,192,507 |
| | $ | 2,408,074 |
| $ | 1,626,388 |
| | $ | 1,522,496 |
| | $ | 3,148,884 |
| | $ | 1,664,869 |
| | $ | 1,583,594 |
| | $ | 3,248,463 |
|
Care Trusts’ Corpus
The Care trusts’ corpus reflected in our consolidated balance sheet represents the cemetery perpetual care trusts, including the related accrued expenses.
The components of Care trusts’ corpus in our consolidated balance sheet at December 31, 20112014 and 20102013 are detailed below.
| | | | December 31, 2011 | | December 31, 2010 | December 31, 2014 | | December 31, 2013 |
| | (In thousands) | (In thousands) |
| Cemetery perpetual care trust investments | $ | 1,016,506 |
| | $ | 987,019 |
| $ | 1,341,376 |
| | $ | 1,342,591 |
|
| Accrued trust operating payables and other | (1,206 | ) | | (147 | ) | (13,718 | ) | | (1,661 | ) |
| Care trusts’ corpus | $ | 1,015,300 |
| | $ | 986,872 |
| $ | 1,327,658 |
| | $ | 1,340,930 |
|
Other Income (Expense) Income,, Net
The components of Other income (expense) income,, net in our consolidated statement of operations for the years ended December 31, 2011, 2010,2014, 2013, and 20092012 are detailed below. See Notes 4, 5, and 6 for further discussion of the amounts related to our funeral, cemetery, and cemetery perpetual care trusts.
| | | | Year Ended December 31, 2011 | Year Ended December 31, 2014 |
| | Funeral Trusts | | Cemetery Trusts | | Cemetery Perpetual Care Trusts | | Other, Net | | Total | Funeral Trusts | | Cemetery Trusts | | Cemetery Perpetual Care Trusts | | Other, Net | | Total |
| | | | | | (In thousands) | | | | | | | | | (In thousands) | | |
| | |
| Realized gains | $ | 61,272 |
| | $ | 67,167 |
| | $ | 34,275 |
| | $ | — |
| | $ | 162,714 |
| $ | 168,567 |
| | $ | 271,507 |
| | $ | 134,259 |
| | $ | — |
| | $ | 574,333 |
|
| Realized losses | (41,162 | ) | | (46,889 | ) | | (16,310 | ) | | — |
| | (104,361 | ) | (113,748 | ) | | (138,473 | ) | | (51,093 | ) | | — |
| | (303,314 | ) |
| Impairment charges | (24,705 | ) | | (28,705 | ) | | (741 | ) | | — |
| | (54,151 | ) | (41,846 | ) | | (60,040 | ) | | (8,072 | ) | | — |
| | (109,958 | ) |
| Interest, dividend, and other ordinary income | 22,283 |
| | 26,902 |
| | 35,467 |
| | — |
| | 84,652 |
| 22,668 |
| | 17,597 |
| | 35,464 |
| | — |
| | 75,729 |
|
| Trust expenses and income taxes | (7,303 | ) | | (10,579 | ) | | (2,774 | ) | | — |
| | (20,656 | ) | (19,590 | ) | | (20,833 | ) | | (17,581 | ) | | — |
| | (58,004 | ) |
| Net trust investment income | 10,385 |
| | 7,896 |
| | 49,917 |
| | — |
| | 68,198 |
| 16,051 |
| | 69,758 |
| | 92,977 |
| | — |
| | 178,786 |
|
| Reclassification to deferred preneed funeral and cemetery receipts held in trust and care trusts’ corpus | (10,385 | ) | | (7,896 | ) | | (49,917 | ) | | — |
| | (68,198 | ) | (16,051 | ) | | (69,758 | ) | | (92,977 | ) | | — |
| | (178,786 | ) |
| Other (expense) income, net | — |
| | — |
| | — |
| | (772 | ) | | (772 | ) | |
| Total other (expense) income, net | $ | — |
| | $ | — |
| | $ | — |
| | $ | (772 | ) | | $ | (772 | ) | |
| Other income (expense), net | | — |
| | — |
| | — |
| | 1,780 |
| | 1,780 |
|
| Total other income (expense), net | | $ | — |
| | $ | — |
| | $ | — |
| | $ | 1,780 |
| | $ | 1,780 |
|
|
| | | | | | | | | | | | | | | | | | | |
| | Year Ended December 31, 2013 |
| | Funeral Trusts | | Cemetery Trusts | | Cemetery Perpetual Care Trusts | | Other, Net | | Total |
| | (In thousands) |
| Realized gains | $ | 65,011 |
| | $ | 101,337 |
| | $ | 17,916 |
| | $ | — |
| | $ | 184,264 |
|
| Realized losses | (9,732 | ) | | (14,593 | ) | | (2,738 | ) | | — |
| | (27,063 | ) |
| Impairment charges | (829 | ) | | (1,575 | ) | | (192 | ) | | — |
| | (2,596 | ) |
| Interest, dividend, and other ordinary income | 24,912 |
| | 20,527 |
| | 27,452 |
| | — |
| | 72,891 |
|
| Trust expenses and income taxes | (11,371 | ) | | (14,633 | ) | | (2,628 | ) | | — |
| | (28,632 | ) |
| Net trust investment income | 67,991 |
| | 91,063 |
| | 39,810 |
| | — |
| | 198,864 |
|
| Reclassification to deferred preneed funeral and cemetery receipts held in trust and care trusts’ corpus | (67,991 | ) | | (91,063 | ) | | (39,810 | ) | | — |
| | (198,864 | ) |
| Other income (expense), net | — |
| | — |
| | — |
| | (558 | ) | | (558 | ) |
| Total other income (expense), net | $ | — |
| | $ | — |
| | $ | — |
| | $ | (558 | ) | | $ | (558 | ) |
SERVICE CORPORATION INTERNATIONAL
NOTES TO CONSOLIDATED FINANCIAL STATEMENTS — (Continued)
|
| | | | | | | | | | | | | | | | | | | |
| | Year Ended December 31, 2010 |
| | Funeral Trusts | | Cemetery Trusts | | Cemetery Perpetual Care Trusts | | Other, Net | | Total |
| | (In thousands) |
| Realized gains | $ | 36,807 |
| | $ | 43,413 |
| | $ | 11,753 |
| | $ | — |
| | $ | 91,973 |
|
| Realized losses | (46,601 | ) | | (51,771 | ) | | (9,792 | ) | | — |
| | (108,164 | ) |
| Impairment charges | (8,135 | ) | | (5,749 | ) | | (7,771 | ) | | — |
| | (21,655 | ) |
| Interest, dividend, and other ordinary income | 18,571 |
| | 22,464 |
| | 34,356 |
| | — |
| | 75,391 |
|
| Trust expenses and income taxes | (4,920 | ) | | (9,708 | ) | | (1,872 | ) | | — |
| | (16,500 | ) |
| Net trust investment (loss) income | (4,278 | ) | | (1,351 | ) | | 26,674 |
| | — |
| | 21,045 |
|
| Reclassification to deferred preneed funeral and cemetery receipts held in trust and care trusts’ corpus | 4,278 |
| | 1,351 |
| | (26,674 | ) | | — |
| | (21,045 | ) |
| Other (expense) income, net | — |
| | — |
| | — |
| | 3,009 |
| | 3,009 |
|
| Total other (expense) income, net | $ | — |
| | $ | — |
| | $ | — |
| | $ | 3,009 |
| | $ | 3,009 |
|
| | | | Year Ended December 31, 2009 | December 31, 2012 |
| | Funeral Trusts | | Cemetery Trusts | | Cemetery Perpetual Care Trusts | | Other, Net | | Total | Funeral Trusts | | Cemetery Trusts | | Cemetery Perpetual Care Trusts | | Other, Net | | Total |
| | | | | | (In thousands) | | | | | | | | | (In thousands) | | | | |
| Realized gains | $ | 28,715 |
| | $ | 44,972 |
| | $ | 11,288 |
| | $ | — |
| | $ | 84,975 |
| $ | 60,833 |
| | $ | 87,665 |
| | $ | 11,463 |
| | $ | — |
| | $ | 159,961 |
|
| Realized losses | (57,118 | ) | | (75,254 | ) | | (20,512 | ) | | — |
| | (152,884 | ) | (21,454 | ) | | (29,397 | ) | | (6,595 | ) | | — |
| | (57,446 | ) |
| Impairment charges | (22,476 | ) | | (41,245 | ) | | (13,067 | ) | | — |
| | (76,788 | ) | (781 | ) | | (824 | ) | | (760 | ) | | — |
| | (2,365 | ) |
| Interest, dividend, and other ordinary income | 21,694 |
| | 25,273 |
| | 37,436 |
| | — |
| | 84,403 |
| 17,017 |
| | 17,244 |
| | 34,032 |
| | — |
| | 68,293 |
|
| Trust expenses and income taxes | (4,127 | ) | | (3,789 | ) | | (3,240 | ) | | — |
| | (11,156 | ) | (10,685 | ) | | (13,389 | ) | | (1,355 | ) | | — |
| | (25,429 | ) |
| Net trust investment (loss) income | (33,312 | ) | | (50,043 | ) | | 11,905 |
| | — |
| | (71,450 | ) | |
| Net trust investment income | | 44,930 |
| | 61,299 |
| | 36,785 |
| | — |
| | 143,014 |
|
| Reclassification to deferred preneed funeral and cemetery receipts held in trust and care trusts’ corpus | 33,312 |
| | 50,043 |
| | (11,905 | ) | | — |
| | 71,450 |
| (44,930 | ) | | (61,299 | ) | | (36,785 | ) | | — |
| | (143,014 | ) |
| Other (expense) income, net | — |
| | — |
| | — |
| | 1,316 |
| | 1,316 |
| — |
| | — |
| | — |
| | 3,687 |
| | 3,687 |
|
| Total other (expense) income, net | $ | — |
| | $ | — |
| | $ | — |
| | $ | 1,316 |
| | $ | 1,316 |
| $ | — |
| | $ | — |
| | $ | — |
| | $ | 3,687 |
| | $ | 3,687 |
|
| |
| 8. | Goodwill and Intangible Assets |
The changes in the carrying amounts of goodwill for our funeral and cemetery reporting units are as followsfollows: (in thousands):
|
| | | | | | | | | | | | | | | | | | | | | | | |
| | 2011 | | 2010 |
| | Funeral | | Cemetery | | Total | | Funeral | | Cemetery | | Total |
| Balance as of January 1: | |
| | |
| | |
| | |
| | |
| | |
|
| Goodwill | $ | 1,244,206 |
| | $ | 210,072 |
| | $ | 1,454,278 |
| | $ | 1,140,742 |
| | $ | 207,384 |
| | $ | 1,348,126 |
|
| Accumulated impairment losses | — |
| | (146,794 | ) | | (146,794 | ) | | — |
| | (146,794 | ) | | (146,794 | ) |
| Goodwill, net | 1,244,206 |
| | 63,278 |
| | 1,307,484 |
| | 1,140,742 |
| | 60,590 |
| | 1,201,332 |
|
| | | | | | | | | | | | |
| Increase in goodwill related to acquisitions | 60,933 |
| | 463 |
| | 61,396 |
| | 114,020 |
| | 6,076 |
| | 120,096 |
|
| Reduction of goodwill related to divestitures | (4,332 | ) | | (598 | ) | | (4,930 | ) | | (16,581 | ) | | (3,388 | ) | | (19,969 | ) |
| Effect of foreign currency and other | (2,457 | ) | | — |
| | (2,457 | ) | | 6,025 |
| | — |
| | 6,025 |
|
| | 54,144 |
| | (135 | ) | | 54,009 |
| | 103,464 |
| | 2,688 |
| | 106,152 |
|
| Balance as of December 31: | |
| | |
| | | | |
| | |
| | |
|
| Goodwill | 1,298,350 |
| | 209,937 |
| | 1,508,287 |
| | 1,244,206 |
| | 210,072 |
| | 1,454,278 |
|
| Accumulated impairment losses | — |
| | (146,794 | ) | | (146,794 | ) | | — |
| | (146,794 | ) | | (146,794 | ) |
| Goodwill, net | $ | 1,298,350 |
| | $ | 63,143 |
| | $ | 1,361,493 |
| | $ | 1,244,206 |
| | $ | 63,278 |
| | $ | 1,307,484 |
|
|
| | | | | | | | | | | | | | | | | | | | | | | |
| | 2014 | | 2013 |
| | Funeral | | Cemetery | | Total | | Funeral | | Cemetery | | Total |
| | (in thousands) |
| Balance as of January 1, | $ | 1,526,011 |
| | $ | 299,710 |
| | $ | 1,825,721 |
| | $ | 1,248,316 |
| | $ | 43,078 |
| | $ | 1,291,394 |
|
| | | | | | | | | | | | |
| Increase in goodwill related to acquisitions | 292 |
| | 3,238 |
| | 3,530 |
| | 318,202 |
| | 258,659 |
| | 576,861 |
|
| Reduction of goodwill related to divestitures | (5,959 | ) | | (2,960 | ) | | (8,919 | ) | | (31,844 | ) | | (2,027 | ) | | (33,871 | ) |
| Effect of foreign currency and other | (9,465 | ) | | (14 | ) | | (9,479 | ) | | (8,663 | ) | | — |
| | (8,663 | ) |
| Activity | (15,132 | ) | | 264 |
| | (14,868 | ) | | 277,695 |
| | 256,632 |
| | 534,327 |
|
| | | | | | | | | | | | |
| Balance as of December 31, | $ | 1,510,879 |
| | $ | 299,974 |
| | $ | 1,810,853 |
| | $ | 1,526,011 |
| | $ | 299,710 |
| | $ | 1,825,721 |
|
The components of intangible assets at December 31 were as follows:
SERVICE CORPORATION INTERNATIONAL
NOTES TO CONSOLIDATED FINANCIAL STATEMENTS — (Continued)
| | | | Useful life | | | | | Useful life | | | | |
| | Minimum | | Maximum | | 2011 | | 2010 | Minimum | | Maximum | | 2014 | | 2013 |
| | (Years) | | (In thousands) | (Years) | | (In thousands) |
| Amortizing intangibles: | | | | | | | | |
| Covenants-not-to-compete | 2 | - | 20 | | $ | 200,973 |
| | $ | 195,346 |
| 2 | - | 20 | | $ | 209,920 |
| | $ | 217,758 |
|
| Customer relationships | 10 | - | 20 | | 100,423 |
| | 93,218 |
| 10 | - | 20 | | 148,351 |
| | 151,427 |
|
| Tradenames | 5 | - | 5 | | 3,600 |
| | 3,600 |
| 5 | - | 5 | | 12,750 |
| | 12,750 |
|
| Other | 5 | - | 40 | | 6,050 |
| | 6,050 |
| 5 | - | 40 | | 11,927 |
| | 17,027 |
|
| | | 311,046 |
| | 298,214 |
| | 382,948 |
| | 398,962 |
|
| Less: Accumulated amortization | | 189,773 |
| | 171,597 |
| | 220,682 |
| | 227,119 |
|
| Amortizing intangibles, net | | 121,273 |
| | 126,617 |
| | 162,266 |
| | 171,843 |
|
| | | | | | | | | |
| Non-amortizing intangibles: | | | | | | | | |
| Tradenames | | Indefinite | | 121,838 |
| | 82,732 |
| | Indefinite | | 220,875 |
| | 215,135 |
|
| Other | | Indefinite | | 10,140 |
| | 10,140 |
| | Indefinite | | 10,640 |
| | 11,640 |
|
| Non-amortizing intangibles | | 131,978 |
| | 92,872 |
| | 231,515 |
| | 226,775 |
|
| | | | | | | | | |
| Intangible assets, net | | $ | 253,251 |
| | $ | 219,489 |
| | $ | 393,781 |
| | $ | 398,618 |
|
Amortization expense for intangible assets was $25.6$36.6 million,, $25.2 $21.9 million,, and $21.7$23.9 million for the years ended December 31, 2011, 2010,2014, 2013, and 2009,2012, respectively. The following is estimated amortization expense, excluding certain customer relationship intangibles for which we are unable to provide an estimate because they are amortized based on specific identification in the performance of a preneed contract, for the five years subsequent to December 31, 20112014 (in thousands):
|
| | | |
| 2012 | $ | 14,591 |
|
| 2013 | 12,589 |
|
| 2014 | 10,929 |
|
| 2015 | 8,236 |
|
| 2016 | 7,745 |
|
| | $ | 54,090 |
|
|
| | | |
| 2015 | $ | 9,946 |
|
| 2016 | $ | 9,206 |
|
| 2017 | $ | 7,484 |
|
| 2018 | $ | 6,627 |
|
| 2019 | $ | 4,144 |
|
The provision or benefit for income taxes includes U.S. federal income taxes (determined on a consolidated return basis), foreign income taxes, and state income taxes.
Income from continuing operations before income taxes for the years ended December 31 was composed of the following components:
| | | | 2011 | | 2010 | | 2009 | 2014 | | 2013 | | 2012 |
| | (In thousands) | (In thousands) |
| United States | $ | 196,788 |
| | $ | 169,544 |
| | $ | 175,212 |
| $ | 360,800 |
| | $ | 199,374 |
| | $ | 210,830 |
|
| Foreign | 28,848 |
| | 49,915 |
| | 24,156 |
| 41,800 |
| | 45,832 |
| | 34,453 |
|
| | $ | 225,636 |
| | $ | 219,459 |
| | $ | 199,368 |
| $ | 402,600 |
| | $ | 245,206 |
| | $ | 245,283 |
|
Income tax provision (benefit) for the years ended December 31 consisted of the following:
SERVICE CORPORATION INTERNATIONAL
NOTES TO CONSOLIDATED FINANCIAL STATEMENTS — (Continued)
| | | | 2011 | | 2010 | | 2009 | 2014 | | 2013 | | 2012 |
| | (In thousands) | (In thousands) |
| Current: | |
| | |
| | |
| |
| | |
| | |
|
| United States | $ | 1,267 |
| | $ | 1,752 |
| | $ | 13 |
| $ | 67,511 |
| | $ | 2,207 |
| | $ | 3,752 |
|
| Foreign | 5,844 |
| | 12,326 |
| | 9,200 |
| 10,859 |
| | 12,445 |
| | 8,638 |
|
| State | 5,781 |
| | 1,446 |
| | 9,196 |
| 17,939 |
| | 6,664 |
| | 6,036 |
|
| Total current income taxes | 12,892 |
| | 15,524 |
| | 18,409 |
| 96,309 |
| | 21,316 |
| | 18,426 |
|
| Deferred: | |
| | |
| | |
| |
| | |
| | |
|
| United States | $ | 57,845 |
| | $ | 64,814 |
| | $ | 57,767 |
| $ | 108,514 |
| | $ | 64,355 |
| | $ | 60,699 |
|
| Foreign | 279 |
| | 185 |
| | (806 | ) | (653 | ) | | 58 |
| | 118 |
|
| State | 8,388 |
| | 11,935 |
| | 905 |
| 21,810 |
| | 7,295 |
| | 10,868 |
|
| Total deferred income taxes | 66,512 |
| | 76,934 |
| | 57,866 |
| 129,671 |
| | 71,708 |
| | 71,685 |
|
| Total income taxes | $ | 79,404 |
| | $ | 92,458 |
| | $ | 76,275 |
| $ | 225,980 |
| | $ | 93,024 |
| | $ | 90,111 |
|
We made income tax payments of $13.1$106.3 million,, $29.3 $26.0 million,, and $27.2$23.1 million in 2011, 2010,2014, 2013, and 2009,2012, respectively, and received refunds of $8.5$0.6 million,, $8.3 $0.5 million,, and $5.6 million. The Internal Revenue Service approved our application for a change in accounting method in December 2010. As a result we overpaid our estimated 2010 Federal and state income taxes. The overpayment of our estimated Federal income tax is included in our 2011 refunds; however, we elected to apply the overpayment of our 2010 state income tax to our 2011 estimated income tax payments which lowered our 2011 cash tax payments.$1.5 million.
The differences between the U.S. federal statutory income tax rate and our effective tax rate for the years ended December 31 were as follows:
| | | | 2011 | | 2010 | | 2009 | 2014 | | 2013 | | 2012 |
| | (In thousands) | (In thousands) |
| Computed tax provision at the applicable federal statutory income tax rate | $ | 78,973 |
| | $ | 76,811 |
| | $ | 69,779 |
| $ | 140,910 |
| | $ | 86,002 |
| | $ | 85,988 |
|
| State and local taxes, net of federal income tax benefits | 9,895 |
| | 8,775 |
| | 6,565 |
| 25,736 |
| | 8,221 |
| | 11,007 |
|
| Dividends received deduction and tax exempt interest | (644 | ) | | (1,168 | ) | | (947 | ) | (1,612 | ) | | (592 | ) | | (525 | ) |
| Foreign jurisdiction differences | (4,789 | ) | | (3,101 | ) | | (3,707 | ) | (4,424 | ) | | (3,685 | ) | | (3,409 | ) |
| Permanent differences associated with dispositions | (6,329 | ) | | 7,192 |
| | 2,950 |
| 61,892 |
| | 268 |
| | 602 |
|
| Changes in uncertain tax positions | 1,584 |
| | 1,138 |
| | (134 | ) | 4,624 |
| | 3,710 |
| | (479 | ) |
| Other | 714 |
| | 2,811 |
| | 1,769 |
| (1,146 | ) | | (900 | ) | | (3,073 | ) |
| Provision for income taxes | $ | 79,404 |
| | $ | 92,458 |
| | $ | 76,275 |
| $ | 225,980 |
| | $ | 93,024 |
| | $ | 90,111 |
|
| Total effective tax rate | 35.2 | % | | 42.1 | % | | 38.3 | % | 56.1 | % | | 37.9 | % | | 36.7 | % |
The 20112014 consolidated effective tax rate was 35.2%56.1%, compared to 42.1%37.9% and 38.3%36.7% in 20102013 and 2009,2012, respectively. We sold our Puerto Rican subsidiaryThe 2014 effective tax rate increased 18.2% over prior year primarily due to non-deductible goodwill resulting from gains on required divestitures associated with the Stewart acquisition and the increase in the third quarterunrecognized tax benefits coupled with higher state tax expenses which are partially offset by state legislative changes and foreign earnings taxed at lower rates.
During 2012, we reached a partial settlement with the Internal Revenue Service ("IRS") in connection with its audit of 2011. Our outsideour affiliate's, SCI Funeral and Cemetery Purchasing Cooperative, 2003 - 2005 federal income tax basisreturns. In connection with this settlement we reduced our 2012 tax expense by $3.1 million for adjustments to our "unrecognized tax benefits" - that is, the aggregate tax effect of differences between tax return positions and the benefits recognized in the business was significantly higher than our book basis. Consequently, we recognized a tax loss that was significantly higher than the book loss on the sale which is permanent in nature.financial statements. The decrease in thelower effective tax rate for the year ended December 31, 2011 as compared to2012 includes the previous two years is primarily due tobenefit associated with the closure of that sale.
Our 2010 and 2009 effective tax rate was negatively impacted by permanent book and tax basis differences relate to North American asset divestitures. During 2010 we recognized U.S. tax on post-acquisition integration of certain Keystone entities into SCI’s structure. Our overall foreign tax expense increased in 2010 due to an increase in foreign earnings. This increase was partially offset by a decrease in foreign statutory rates. In 2010 our state tax expense was impacted by permanent items affecting our overall effective rate as well as an increase in state statutory tax rates. During 2009 we experienced a decrease in state tax expense due to a restructuring of some of our state operating entities.
During 2010, the Internal Revenue Service approved three requests for tax accounting method changes relating to the recognition of trust earnings accumulated in cemetery and funeral trusts, revenue from preneed sales of cemetery merchandise, and revenue from non-trusted customer payments for preneed funeral contracts. The effective date for these tax accounting method changes is for the fiscal year ended December 31, 2010. In accordance with § 481(a) of the U.S. Internal Revenue Code this adjustment recalculates the income previously recognized to determine what should have been recognized under the new tax accounting method. The cumulative impact of these accounting method changes resulted in an adjustment under § 481(a) for 2010
SERVICE CORPORATION INTERNATIONAL
NOTES TO CONSOLIDATED FINANCIAL STATEMENTS — (Continued)
of $190.3 million that represents a decrease in current year taxable income, a decrease in a previously recognized deferred tax asset related to deferred revenue, and an increase in our deferred tax asset related to our net operation loss carryover. Although these changes had no tax impact on the overall effective tax rate, there was a savings in cash taxes including a refund of our 2010 Federal estimated tax payments of $7.1 million which was received in 2011.audit.
Deferred taxes are determined based on differences between the financial reporting and tax bases of assets and liabilities and are measured using the enacted tax rates. The tax effects of temporary differences and carry-forwards that give rise to significant portions of deferred tax assets and liabilities as of December 31 consisted of the following:
| | | | 2011 | | 2010 | 2014 | | 2013 |
| | (In thousands) | (In thousands) |
| Inventories and cemetery property, principally due to purchase accounting adjustments | $ | (352,323 | ) | | $ | (344,160 | ) | |
| Property and equipment, principally due to differences in depreciation methods and purchase accounting adjustments | (194,875 | ) | | (170,305 | ) | |
| Inventories and cemetery property | | $ | (338,446 | ) | | $ | (368,650 | ) |
| Property and equipment | | (183,332 | ) | | (159,734 | ) |
| Intangibles | (74,278 | ) | | (82,587 | ) | (309,271 | ) | | (323,311 | ) |
| Payables, principally due to sales of cemetery interment rights and related products | (32,949 | ) | | (28,779 | ) | |
| Other | | (6,870 | ) | | (35,103 | ) |
| Deferred tax liabilities | (654,425 | ) | | (625,831 | ) | (837,919 | ) | | (886,798 | ) |
| Loss and tax credit carry-forwards | 215,285 |
| | 235,393 |
| 181,092 |
| | 252,272 |
|
| Deferred revenue on preneed funeral and cemetery contracts, principally due to earnings from trust funds | 92,640 |
| | 98,335 |
| |
| Deferred revenue on preneed funeral and cemetery contracts | | 262,202 |
| | 305,504 |
|
| Accrued liabilities | 11,308 |
| | 24,469 |
| 99,908 |
| | 109,103 |
|
| Other | 44,506 |
| | 49,316 |
| |
| Deferred tax assets | 363,739 |
| | 407,513 |
| 543,202 |
| | 666,879 |
|
| Less: Valuation allowance | (63,681 | ) | | (63,614 | ) | (134,201 | ) | | (114,719 | ) |
| Net deferred income tax liability | $ | (354,367 | ) | | $ | (281,932 | ) | $ | (428,918 | ) | | $ | (334,638 | ) |
As a result of our acquisition of Stewart, our net deferred tax liability increased by $14.7 million primarily as a result of deferred taxes being recorded as part of the purchase accounting entries recording assets and liabilities at fair value.
Deferred tax assets and Deferred income tax liabilities consisted of the following as ofare recognized in our consolidated balance sheet at December 31 (in thousands):as follows:
| | | | | | | 2014 | | 2013 |
| | 2011 | | 2010 | (in thousands) |
| Current deferred tax assets | $ | 44,316 |
| | $ | 40,740 |
| $ | 1,128 |
| | $ | 30,282 |
|
| Non-current deferred tax assets | 6,932 |
| | 631 |
| 18,778 |
| | 22,249 |
|
| Non-current deferred tax liabilities | (405,615 | ) | | (323,303 | ) | (448,824 | ) | | (387,169 | ) |
| Net deferred income tax liability | $ | (354,367 | ) | | $ | (281,932 | ) | $ | (428,918 | ) | | $ | (334,638 | ) |
In addition to the loss and tax credit carry-forward amounts reflected as deferred tax assets in the table above, we have taken certain tax deductions related to the exercised employee stock options and vested restricted shares that are in excess of the stock-based compensation amounts recorded in our consolidated financial statements (“windfall tax benefits”). Pursuant to the Stock Compensation Topic under the ASC, suchSuch windfall tax benefits are not recognized in our consolidated financial statements unless they reduce income taxes payable. As of December 31, 20112014 and 20102013 we have windfall tax benefits of $13.0$2.7 million and $9.5$36.3 million,, respectively, which when realized will be recorded as a reduction to current taxes payable and a credit to Capital in excess of par value in our consolidated financial statements.
During the fourth quarter of 2010, the Company underwent a restructuring of its Canadian subsidiaries. The restructuring triggered a U.S. dividend of $6.9 million for which U.S. federal taxes have been provided for the year ended At December 31, 2010. The dividend is less than current year earnings2014 and other prior year earnings required to be permanently reinvested. At December 31, 2011 and 2010,2013, U.S. income taxes had not been provided on $93.0$259.4 million and $256.0$241.5 million,, respectively, of the remaining undistributed earnings of our Canadian subsidiaries. We intend to permanently reinvest these undistributed foreign earnings in those businesses outside the United States. It is not practicable to determine the amount of federal income taxes, if any, that might become due if such earnings are repatriated.
The following table summarizes the activity related to our gross unrecognized tax benefits from January 1, 20092012 to December 31, 20112014 (in thousands):
SERVICE CORPORATION INTERNATIONAL
NOTES TO CONSOLIDATED FINANCIAL STATEMENTS — (Continued)
| | | | Federal, State and Foreign Tax | Federal, State and Foreign Tax |
| | (In thousands) | (In thousands) |
| Balance at December 31, 2008 | $ | 142,457 |
| |
| Balance at December 31, 2011 | | $ | 197,223 |
|
| Reductions to tax positions related to the current year | | (2,100 | ) |
| Reductions to tax positions related to prior years | | (10,224 | ) |
| Balance at December 31, 2012 | | $ | 184,899 |
|
| Additions to tax positions related to the current year | | 3,019 |
|
| Additions to tax positions related to the acquisition of Stewart, offset to goodwill | | 1,556 |
|
| Reductions to tax positions related to prior years | | (8,800 | ) |
| Statute expirations | | (2,844 | ) |
| Balance at December 31, 2013 | | $ | 177,830 |
|
| Additions to tax positions related to the current year | 5,154 |
| 8,721 |
|
| Additions to tax positions related to prior years | 1,076 |
| 10,085 |
|
| Statute expirations | (4,243 | ) | |
| Balance at December 31, 2009 | $ | 144,444 |
| |
| Additions to tax positions related to the current year | 10,215 |
| |
| Additions to tax positions related to prior years | 110 |
| |
| Statute expirations | (2,004 | ) | |
| Balance at December 31, 2010 | $ | 152,765 |
| |
| Additions to tax positions related to the current year | 4,971 |
| |
| Additions to tax positions related to prior years | 60 |
| |
| Statute expirations | (1,484 | ) | |
| Balance at December 31, 2011 | $ | 156,312 |
| |
| Reductions to tax positions related to the current year | | (1,075 | ) |
| Reductions to tax positions related to prior years | | (2,325 | ) |
| Reductions to tax positions related to the acquisition of Stewart, offset to goodwill | | (1,556 | ) |
| Balance at December 31, 2014 | | $ | 191,680 |
|
Our total unrecognized tax benefits that, if recognized, would affect our effective tax rates were $37.8$77.3 million,, $39.3 $37.1 million,, and $41.2$34.9 million as of December 31, 2011, 2010,2014, 2013, and 2009,2012, respectively.
During 2011, in accordance with the Income Tax Topic under the ASC,2014, we recorded an increase of $3.5$13.8 million in our liability for unrecognized tax benefits, of which $5.0$7.7 million was ana net increase to U.S. tax positions taken in the current year, and $0.1$7.8 million was ana net increase related to U.S. tax positions taken in prior years. In addition, we recorded a $1.5$1.6 million decrease to our tax liability dueU.S. positions related to the expiration of statute of limitations on positionsacquired entities taken in previous fiscal years.prior years, offset to goodwill.
Consistent with our historical financial reporting, we include potential accrued interest and penalties related to unrecognized tax benefits within our income tax provision account. We have accrued $41.8$47.6 million,, $38.8 $44.5 million, and $36.0$41.6 million for the payment of interest, net of tax benefits, and penalties as of December 31, 2011, 2010,2014, 2013, and 2009,2012, respectively. We recognized an increase of interest and penalties of $3.0$3.1 million, $3.6 and $3.0 million, and $3.8 million for the years ended December 31, 2011, 2010,2014, and 2009,2013, respectively. We recognized a decrease of interest and penalties of $0.2 million for the year ended December 31, 2012. To the extent interest and penalties are not assessed with respect to uncertain tax positions or the uncertainty of deductions in the future, amounts accrued will be reduced and reflected as a reduction of the overall income tax provision.
We file income tax returns, including tax returns for our subsidiaries, with federal, state, local, and foreign jurisdictions. Our tax returns are subject to routine compliance review by the taxing authorities in the jurisdictions in which we file tax returns in the ordinary course of business. We consider the United States to be our most significant tax jurisdiction; however, the taxing authoritiesauthority in Canada and Spain areis auditing various tax returns. Current auditsWhile we have effectively concluded our 2003 - 2005 tax years with respect to our affiliate SCI Funeral and Cemetery Purchasing Cooperative, SCI and subsidiaries' tax years 1999 through 2005 remain under review at the IRS Appeals level. SCI and subsidiaries are occurring in the United Statesunder audit for 2006-2007 as a result of carry back claims. Furthermore, SCI and its affiliates are under audit by various state and foreign locations covering open taxjurisdictions for years 2010 through 2010. The Internal Revenue Service is in various stages of auditing tax years 1999 through 2005.2012. It is
reasonably possible that changes to our global unrecognized tax benefits could be significant; however, due to the uncertainty regarding the timing of completion of audits and possible outcomes, a current estimate of the range of increases or decreases that may occur within the next twelve months cannot be made.
Various subsidiaries have foreign, federal, and state carry-forwards in the aggregate of $2.9$3.3 billion with expiration dates through 2030.2031. Such loss carry-forwards will expire as follows:
| | | | Federal | | State | | Foreign | | Total | Federal | | State | | Foreign | | Total |
| | | | (In thousands) | | | | | (In thousands) | | |
| 2012 | $ | 691 |
| | $ | 56,990 |
| | $ | — |
| | $ | 57,681 |
| |
| 2013 | 1,733 |
| | 10,640 |
| | — |
| | 12,373 |
| |
| 2014 | 115 |
| | 42,324 |
| | 64 |
| | 42,503 |
| |
| 2015 | 3,667 |
| | 39,430 |
| | — |
| | 43,097 |
| $ | — |
| | $ | 80,429 |
| | $ | — |
| | $ | 80,429 |
|
| 2016 | | — |
| | 158,616 |
| | — |
| | 158,616 |
|
| 2017 | | — |
| | 243,893 |
| | — |
| | 243,893 |
|
| 2018 | | — |
| | 105,303 |
| | — |
| | 105,303 |
|
| Thereafter | 219,083 |
| | 2,548,627 |
| | 312 |
| | 2,768,022 |
| 9,736 |
| | 2,728,094 |
| | 470 |
| | 2,738,300 |
|
| Total | $ | 225,289 |
| | $ | 2,698,011 |
| | $ | 376 |
| | $ | 2,923,676 |
| $ | 9,736 |
| | $ | 3,316,335 |
| | $ | 470 |
| | $ | 3,326,541 |
|
In addition to the above loss carry-forwards, we have $64.1$59.1 million of foreign losses that have an indefinite expiration.
A valuation allowance has been established because more-likely-than-not uncertainties exist with respect to our future
SERVICE CORPORATION INTERNATIONAL
NOTES TO CONSOLIDATED FINANCIAL STATEMENTS — (Continued)
realization of certain loss carry-forwards. The valuation allowance is primarily attributable to state net operating losses and reflects our expectation that the net operating losses in certain jurisdictions will expire before we generate sufficient taxable income to utilize the losses. In 2011,2014, we recorded a net $5.0$21.5 million increase in state valuation allowance related to state estimated net operating losses expected to expire unutilized. We recorded a $2.1 million decrease in international valuation allowances due to an increasefluctuations in net operating losses which is primarily attributable to state net operating lossesthe exchange rate between the Euro and reflects our expectation that the net operating losses in certain jurisdictions will expire before we generate sufficient taxable income to utilize the losses. We recorded a $4.8 million decrease in foreign valuation allowances which is primarily related to the completion of the sale of our Puerto Rico subsidiary resulting in a decrease in foreign valuation allowances which had been booked against their deferred tax assets.US dollar.
At December 31, 2011,2014, our loss and tax credit carry-forward deferred tax assets and related valuation allowances by jurisdiction are as follows:
| | | | Federal | | State(1) | | Foreign | | Total | Federal | | State | | Foreign | | Total |
| | | | (In thousands) | | | | | (In thousands) | | |
| Loss and tax credit carry-forwards | $ | 99,457 |
| | $ | 93,393 |
| | $ | 22,435 |
| | $ | 215,285 |
| $ | 3,587 |
| | $ | 155,956 |
| | $ | 21,549 |
| | $ | 181,092 |
|
| Valuation allowance | $ | 4,107 |
| | $ | 41,330 |
| | $ | 18,244 |
| | $ | 63,681 |
| $ | — |
| | $ | 116,923 |
| | $ | 17,278 |
| | $ | 134,201 |
|
| |
| (1) | Presented net of Federal benefit |
Our federal loss and tax credit carryforwards exclude windfall tax benefits, suspended net operating losses and credit carryforwards which, when realized, will reduce current income taxes payable by an additional $2.7 million.
10. Debt
Debt as of December 31 was as follows:
| | | | 2011 | | 2010 | 2014 | | 2013 |
| | (In thousands) | (In thousands) |
| 7.875% Debentures due February 2013 | $ | 4,757 |
| | $ | 8,557 |
| |
| 7.375% Senior Notes due October 2014 | 180,692 |
| | 180,692 |
| |
| 3.125% Senior Convertible Notes due July 2014 | | $ | — |
| | $ | 86,416 |
|
| 6.75% Senior Notes due April 2015 | 136,465 |
| | 157,250 |
| — |
| | 136,465 |
|
| 6.75% Senior Notes due April 2016 | 197,377 |
| | 212,927 |
| 197,377 |
| | 197,377 |
|
| 3.375% Senior Convertible Notes due July 2016 | | 134 |
| | 45,119 |
|
| 7.0% Senior Notes due June 2017 | 295,000 |
| | 295,000 |
| 295,000 |
| | 295,000 |
|
| 7.625% Senior Notes due October 2018 | 250,000 |
| | 250,000 |
| 250,000 |
| | 250,000 |
|
| 6.5% Senior Notes due April 2019 | | — |
| | 200,000 |
|
| 7.0% Senior Notes due May 2019 | 250,000 |
| | 250,000 |
| — |
| | 250,000 |
|
| 4.5% Senior Notes due November 2020 | | 200,000 |
| | 200,000 |
|
| 8.0% Senior Notes due November 2021 | 150,000 |
| | 150,000 |
| 150,000 |
| | 150,000 |
|
| 5.375% Senior Notes due January 2022 | | 425,000 |
| | 425,000 |
|
| 5.375% Senior Notes due May 2024 | | 550,000 |
| | — |
|
| 7.5% Senior Notes due April 2027 | 200,000 |
| | 200,000 |
| 200,000 |
| | 200,000 |
|
| Bank credit facility due March 2016 | 65,000 |
| | — |
| |
| Term Loan due July 2018 | | 370,000 |
| | 600,000 |
|
| Bank credit facility due July 2018 | | 235,000 |
| | 30,000 |
|
| Obligations under capital leases | 124,330 |
| | 118,339 |
| 181,002 |
| | 189,697 |
|
| Mortgage notes and other debt, maturities through 2047 | 35,937 |
| | 38,223 |
| |
| Unamortized pricing discounts and other | (4,888 | ) | | (6,106 | ) | |
| Mortgage notes and other debt, maturities through 2050 | | 4,117 |
| | 4,752 |
|
| Unamortized (discounts) premiums and other, net | | (2,905 | ) | | 42,084 |
|
| Total debt | 1,884,670 |
| | 1,854,882 |
| 3,054,725 |
| | 3,301,910 |
|
| Less current maturities | (23,554 | ) | | (22,502 | ) | |
| Less: | | | | |
| Current maturities of debt, capital lease obligations, and mortgage notes | | (91,584 | ) | | (153,738 | ) |
| Current maturities of unamortized discounts (premiums) and other, net | | 653 |
| | (22,624 | ) |
| Total current maturities | | (90,931 | ) | | (176,362 | ) |
| Total long-term debt | $ | 1,861,116 |
| | $ | 1,832,380 |
| $ | 2,963,794 |
| | $ | 3,125,548 |
|
Current maturities of debt at December 31, 2011 were2014 primarily comprised ofcomprise our capital lease obligations and mortgage notes. amounts due under our term loan.
Our consolidated debt had a weighted average interest rate of 6.69%5.21% and 6.80%5.25% at December 31, 20112014 and 2010,2013, respectively. Approximately 89%75% and 93%76% of our total debt had a fixed interest rate at December 31, 20112014 and 2010,2013, respectively.
The aggregate maturities of our debt for the five years subsequent to December 31, 20112014 and thereafter (in thousands) are as follows:
|
| | | |
| 2012 | $ | 23,554 |
|
| 2013 | 27,299 |
|
| 2014 | 207,708 |
|
| 2015 | 176,448 |
|
| 2016 | 270,653 |
|
| 2017 and thereafter | 1,179,008 |
|
| | $ | 1,884,670 |
|
|
| | | |
| | Aggregate Maturities of Debt |
| 2015 | $ | 90,931 |
|
| 2016 | 223,449 |
|
| 2017 | 315,414 |
|
| 2018 | 858,277 |
|
| 2019 | 9,003 |
|
| 2020 and thereafter | 1,557,651 |
|
| | $ | 3,054,725 |
|
Bank Credit Facility
As of December 31, 2010, we hadThe Company has a $400$500.0 million Bank bank credit facility due November 2013July 2018 with a syndicate of financial institutions,banks, including a sublimit of $175$175 million for letters of credit. In the first quarterAs of 2011,December 31, 2014, we amendedhave $235.0 million outstanding borrowings under our bank credit facility to increase the availability thereunder from $400and have issued $31.6 million to $500 million and extended the maturity to March 2016.
As of December 31, 2011, we had $65.0 million outstanding cash advances and then used it to support $32.7 million of letters of credit. The Bankbank credit facility provides us with flexibility for refinancing debt and acquisitions, working capital,
if needed, and is guaranteed by a majority of our domestic subsidiaries. The subsidiary guaranty is a guaranty of payment of the outstanding amount of the total lending commitment, including letters of credit. The Bankbank credit facility contains certain financial covenants, including a minimum interest coverage ratio, a maximum leverage ratio, and certain dividend and share repurchase restrictions. As of December 31, 2014 we are in compliance with all covenants. We pay a quarterly fee on the unused commitment, which was 0.35%. at December 31, 2014. As of December 31, 2011,2014, we have $402.3$233.4 million in borrowing capacity under the facility.
Debt Issuances and Additions
In November 2010,May 2014, we issued $250.0$550.0 million of unsecured 7.0%5.375% Senior Notes due May 2019.2024. We used the net proceeds from this offering, along with a $95.0 million draw on our Bank Credit Facility, to repay our 6.75% Senior Notes due April 2015, 6.5% Senior Notes due April 2019, and 7.0% Senior Notes due May 2019 along with associated refinancing costs. The newly issued notes are subject to the provisions of the Company’sCompany's Senior Indenture dated as of February 1, 1993, as amended, which includes covenants limiting, among other things, the creation of liens securing indebtedness and sale-leaseback transactions.
In February 2014, we drew $110.0 million on our Bank Credit Facility, which we used along with cash on hand to repay our 3.125% Senior Convertible Notes due July 2014 and substantially all of our 3.375% Senior Convertible Notes due July 2016.
In July 2013, the Company issued $425 million in 5.375% Senior Notes due January 2022. In conjunction with the Stewart acquisition, we assumed $200.0 million, $86.4 million, and $46.3 million in aggregate principal amount of 6.5% Senior Notes due 2019, 3.125% Senior Convertible Notes due 2014, and 3.375% Senior Convertible Notes due 2016, respectively. These notes had fair value premiums of $10.0 million, $21.7 million, and $14.2 million, respectively, which are included in unamortized premiums (discounts) and other, net above as of December 31, 2013.
In November 2012, we issued $200.0 million of unsecured 4.5% Senior Notes due November 2020. We used the net proceeds from the offering to repay our indebtedness under our amended and restated credit facility and for general corporate purposes.7.375% Senior Notes due October 2014.
Debt Extinguishments and Reductions
During 2011,the year ended December 31, 2014, we made debt payments of $46.0$993.4 million, including the following purchases on the open market: for scheduled and early extinguishment payments as follows:
$3.8250.0 million in aggregate principal amount of our 7.875%7.0% Senior Notes due February 2013;
May 2019;$20.8200.0 million in aggregate principal amountand $9.1 million in unamortized premiums of our 6.75%6.5% Senior Notes due April 2015; and
2019;$15.6136.5 million in aggregate principal amount of our 6.75% Senior Notes due April 2016.2015;
$230.0 million in aggregate principal of our Term Loan due July 2018. Of this amount our credit agreement required $200.0 million from the proceeds of the Federal Trade Commission (FTC) mandated divestitures under our consent order related to the Stewart acquisition;
$86.4 million in aggregate principal and $21.7 million in unamortized premiums of our 3.125% Senior Convertible Notes due 2014;
$45.0 million in aggregate principal and $14.2 million in unamortized premiums of our 3.375% Senior Convertible Notes due 2016;
$0.5 million in other debt.
Certain of the above transactions resulted in the recognition of a loss of $29.2 million recorded in $3.5(Losses) gains on early extinguishment of debt in our unaudited condensed consolidated statement of operations.
In addition to repaying $86.6 million of outstanding cash advances on our previous credit facility during 2013, we paid an aggregate of $31.8 million to repay our remaining $4.8 million 7.875% Debenture due February 2013, to retire $26.4 million in capital lease obligations and to extinguish $0.6 million in other debt. Certain of the above transactions resulted in the recognition of a gain $0.5 million recorded in gains on early extinguishment of debt, net in our Consolidated Statement of Operations. As mentioned above, we have paid down a total of $167.0 million in debt including $107.9 million in principal and premiums associated with our 3.125% Senior Convertible Notes due July 2014 and $59.1 million in principal and premiums associated with our 3.375% Senior Convertible Notes due July 2016. We did not incur any gains or losses as a result of these transactions.
During 2012, we paid an aggregate of $206.6 million, to redeem our 7.375% Senior Notes due October 2014 with a principal amount of $180.7 million and to retire $25.8 million in capital lease obligations. Certain of the above transactions resulted in the recognition of a loss of $22.7 million recorded in (Losses) gains on early extinguishment of debt, net in our consolidated statementConsolidated Statement
of Operations, which represents the write-off of unamortized deferred loan costs of $0.4$1.3 million and $3.1$21.4 million in premium on the purchase of these notes.
During 2010, we made debt payments of $122.2 million, which included the following purchases on the open market:
$25.5 million aggregate principal amount ofa make-whole provision paid in cash upon retiring our 7.875% Senior Notes due February 2013;
$70.5 million aggregate principal amount of our 7.375% Senior Notes due October 2014;
$3.0 million aggregate principal amount of our 6.75% Senior Notes2014. This refinancing allowed the Company to replace 7.375% debt due April 2015; and
$20.1 million aggregate principal amount of our 6.75% Senior Notesin 2014 with 4.5% debt due April 2016.
Certain of the above transactions resulted in the recognition of a loss of $9.4 million recorded in (Losses) gains on early extinguishment of debt. net during the year ended December 31, 2010, which represents the write-off of unamortized deferred loan costs of $1.4 million and $8.0 million in premium on the purchase of these notes.2020.
Capital Leases
In 2011, 2010,2014, 2013, and 20092012 we acquired $31.3$35.7 million,, $22.8 $40.1 million,, and $64.1$78.9 million,, respectively, of capital leases, primarily related to transportation equipment usingequipment. We retired $29.4 million and $26.4 million of capital leases.lease obligations for the years ended December 31, 2014, and 2013, respectively. See additional information regarding these leases in Note 12.
Additional Debt Disclosures
At December 31, 20112014 and 2010,2013, we have deposits of $4.1$7.4 million and $15.6$7.6 million,, respectively, in restricted, interest-bearing accounts that were pledged as collateral for various credit instruments and commercial commitments. Our restricted cashcommitments and is included in Deferred charges and other assets in our consolidated balance sheet. Unamortized pricing discounts, totaling $4.9 million and $6.1 million at December 31, 2011 and 2010, respectively, primarily relate to our 6.75% Senior Notes due April 2015, 6.75% Senior Notes due April 2016, 7.0% Senior Notes due June 2017, and our 8.0% Senior Notes due November 2021.
We had assets of approximately $2.8$1.7 million and $3.6$2.1 million pledged as collateral for the mortgage notes and other debt at December 31, 20112014 and 2010,2013, respectively.
Cash interest payments for the three years ended December 31 (in thousands) were as follows:
|
| | | |
| Payments in 2011 | $ | 129,105 |
|
| Payments in 2010 | 125,138 |
|
| Payments in 2009 | 122,224 |
|
|
| | | |
| Payments in 2014 | $ | 175,327 |
|
| Payments in 2013 | $ | 125,022 |
|
| Payments in 2012 | $ | 131,723 |
|
Cash interest payments forecasted as of December 31, 20112014 for the five years subsequent to December 31, 20112014 and thereafter (in thousands) are as follows:
|
| | | |
| Payments in 2012 | $ | 126,225 |
|
| Payments in 2013 | 125,678 |
|
| Payments in 2014 | 121,951 |
|
| Payments in 2015 | 104,370 |
|
| Payments in 2016 | 89,578 |
|
| Payments in 2017 and thereafter | 302,520 |
|
|
| | | |
| Payments in 2015 | $ | 154,408 |
|
| Payments in 2016 | $ | 144,134 |
|
| Payments in 2017 | $ | 128,986 |
|
| Payments in 2018 | $ | 114,305 |
|
| Payments in 2019 | $ | 96,830 |
|
| Payments in 2020 and thereafter | $ | 324,075 |
|
| |
| 11. | Credit Risk and Fair Value of Financial Instruments |
Fair Value Estimates
The fair value estimates of the following financial instruments have been determined using available market information and appropriate valuation methodologies. The carrying values of cash and cash equivalents, trade receivables, and trade payables approximate the fair values of those instruments due to the short-term nature of the instruments. The faircarrying values of receivables on preneed funeral and cemetery contracts are impracticableapproximate fair value due to estimate because of the lack of a trading market and the diverse number of individual contracts with varying terms.
The fair value of our debt instruments at December 31 was as follows:
| | | | 2011 | | 2010 | 2014 | | 2013 |
| | (In thousands) | (In thousands) |
| 7.875% Debentures due February 2013 | $ | 4,971 |
| | $ | 9,092 |
| |
| 7.375% Senior Notes due October 2014 | 196,954 |
| | 194,244 |
| |
| 3.125% Senior Convertible Notes due July 2014 | | — |
| | 106,939 |
|
| 6.75% Senior Notes due April 2015 | 150,083 |
| | 161,968 |
| — |
| | 144,653 |
|
| 6.75% Senior Notes due April 2016 | 216,375 |
| | 216,653 |
| 208,075 |
| | 214,904 |
|
| 3.125% Senior Convertible Notes due July 2016 | | 160 |
| | 60,487 |
|
| 7.0% Senior Notes due June 2017 | 323,025 |
| | 302,375 |
| 320,043 |
| | 333,259 |
|
| 7.625% Senior Notes due October 2018 | 276,875 |
| | 262,500 |
| 277,538 |
| | 288,875 |
|
| 6.5% Senior Notes due April 2019 | | — |
| | 210,000 |
|
| 7.0% Senior Notes due May 2019 | 262,500 |
| | 251,250 |
| — |
| | 270,000 |
|
| 4.5% Senior Notes due November 2020 | | 201,700 |
| | 192,610 |
|
| 8.0% Senior Notes due November 2021 | 167,550 |
| | 158,063 |
| 174,375 |
| | 173,625 |
|
| 5.375% Senior Notes due January 2022 | | 437,750 |
| | 431,588 |
|
| 5.375% Senior Notes due May 2024 | | 558,250 |
| | — |
|
| 7.5% Senior Notes due April 2027 | 195,750 |
| | 194,920 |
| 220,890 |
| | 215,750 |
|
| Bank credit facility due March 2016 | 65,000 |
| | — |
| |
| Term Loan due July 2018 | | 370,000 |
| | 600,000 |
|
| Bank credit facility due July 2018 | | 235,000 |
| | 30,000 |
|
| Mortgage notes and other debt, maturities through 2047 | 36,340 |
| | 37,991 |
| 4,117 |
| | 4,752 |
|
| Total fair value of debt instruments | $ | 1,895,423 |
| | $ | 1,789,056 |
| $ | 3,007,898 |
| | $ | 3,277,442 |
|
The fair values of our long-term, fixed rate securities were estimated using market prices for those securities, and therefore they are classified within Level 12 of the Fair Value Measurements hierarchy as required by the FVM&D Topic of the ASC.fair value hierarchy. The term loan, bank credit facility, and the mortgage and other debt are classified within Level 3 of the Fair Value Measurements hierarchy. The fair values of these instruments have been estimated using discounted cash flow analysis based on our incremental borrowing rate for similar borrowing arrangements.
SERVICE CORPORATION INTERNATIONAL
NOTES TO CONSOLIDATED FINANCIAL STATEMENTS — (Continued)
Credit Risk Exposure
Our cash deposits, some of which exceed insured limits, are distributed among various market and national banks in the jurisdictions in which we operate. In addition, we regularly invest excess cash in financial instruments which are not insured, such as money-market funds and Eurodollar time deposits, that are offered by a variety of reputable financial institutions and commercial paper that is offered by corporations with quality credit ratings. We believe that the credit risk associated with such instruments is minimal.
We grant credit to customers in the normal course of business. The credit risk associated with our funeral, cemetery, and preneed funeral and preneed cemetery receivables due from customers is generally considered minimal because of the diversification of the customers served. Furthermore, bad debts have not been significant relative to the volume of deferred revenues. Customer payments on preneed funeral or preneed cemetery contracts that are either placed into state-regulated trusts or used to pay premiums on life insurance contracts generally do not subject us to collection risk. Insurance-funded contracts are subject to supervision by state insurance departments and are protected in the majority of states by insurance guaranty acts.
| |
| 12. | Commitments and Contingencies |
Leases
Our leases principally relate to funeral home facilities and transportation equipment. The majority of our lease arrangements contain options to (i) purchase the property at fair value on the exercise date, (ii) purchase the property for a value determined at the inception of the lease, or (iii) renew the lease for the fair rental value at the end of the primary lease term. Rental expense for operating leases was $25.7$37.2 million,, $24.7 $28.4 million,, and $22.8$26.8 million for the years ended December 31, 2011, 2010,2014, 2013, and 2009,2012, respectively. As of December 31, 2011,2014, future minimum lease payments for non-cancelable operating and capital leases exceeding one year were as follows:
| | | | Operating | | Capital | Operating | | Capital |
| | (In thousands) | (In thousands) |
| 2012 | $ | 13,215 |
| | $ | 24,930 |
| |
| 2013 | 11,210 |
| | 21,420 |
| |
| 2014 | 9,248 |
| | 27,168 |
| |
| 2015 | 7,328 |
| | 39,439 |
| $ | 14,049 |
| | $ | 31,377 |
|
| 2016 | 5,760 |
| | 7,474 |
| 12,219 |
| | 26,366 |
|
| 2017 and thereafter | 41,192 |
| | 18,531 |
| |
| 2017 | | 10,202 |
| | 20,654 |
|
| 2018 | | 8,726 |
| | 63,380 |
|
| 2019 | | 7,308 |
| | 9,125 |
|
| 2020 and thereafter | | 62,468 |
| | 30,100 |
|
| Total | $ | 87,953 |
| | $ | 138,962 |
| $ | 114,972 |
| | 181,002 |
|
| Less: Interest on capital leases | |
| | (14,632 | ) | | | (18,508 | ) |
| Total principal payable on capital leases | |
| | $ | 124,330 |
|
|
| | $ | 162,494 |
|
Employment and Management, Consulting, and Non-Competition Agreements
We have entered into employment and management, employment, consulting, and non-competition agreements, generally for five to ten years, with certain officers and employees and former owners of businesses that we acquired. At December 31, 2011,2014, the maximum estimated future cash commitments under agreements with remaining commitment terms, and with original terms of more than one year, were as follows:
|
| | | | | | | | | | | | | | | |
| | Employment | | Consulting | | Non-Competition | | Total |
| | (In thousands) |
| 2012 | $ | 3,603 |
| | $ | 852 |
| | $ | 4,074 |
| | $ | 8,529 |
|
| 2013 | 2,079 |
| | 438 |
| | 3,462 |
| | 5,979 |
|
| 2014 | 1,473 |
| | 330 |
| | 2,988 |
| | 4,791 |
|
| 2015 | 491 |
| | 201 |
| | 2,477 |
| | 3,169 |
|
| 2016 | 205 |
| | 99 |
| | 2,196 |
| | 2,500 |
|
| 2017 and thereafter | 432 |
| | 262 |
| | 7,136 |
| | 7,830 |
|
| Total | $ | 8,283 |
| | $ | 2,182 |
| | $ | 22,333 |
| | $ | 32,798 |
|
|
| | | | | | | | | | | | | | | |
| | Employment and Management | | Consulting | | Non-Competition | | Total |
| | (In thousands) |
| 2015 | $ | 2,236 |
| | $ | 587 |
| | $ | 4,376 |
| | $ | 7,199 |
|
| 2016 | 938 |
| | 218 |
| | 3,872 |
| | 5,028 |
|
| 2017 | 767 |
| | 103 |
| | 3,622 |
| | 4,492 |
|
| 2018 | 333 |
| | 75 |
| | 3,414 |
| | 3,822 |
|
| 2019 | 126 |
| | 69 |
| | 3,236 |
| | 3,431 |
|
| 2020 and thereafter | 16 |
| | 38 |
| | 4,999 |
| | 5,053 |
|
| Total | $ | 4,416 |
| | $ | 1,090 |
| | $ | 23,519 |
| | $ | 29,025 |
|
SERVICE CORPORATION INTERNATIONAL
NOTES TO CONSOLIDATED FINANCIAL STATEMENTS — (Continued)
Insurance Loss Reserves
We purchase comprehensive general liability, morticians and cemetery professional liability, automobile liability, and workers’ compensation insurance coverage structured with high deductibles. The high-deductible insurance program means we are primarily self-insured for claims and associated costs and losses covered by these policies. As of December 31, 20112014 and 2010,2013, we have self-insurance reserves of $52.7$74.0 million and $53.9$78.0 million,, respectively.
Litigation
We are a party to various litigation matters, investigations, and proceedings. Some of the more frequent ordinary routine litigations incidental to our business are based on burial practices claims and employment related matters, including discrimination, harassment, and wage and hour laws and regulations. For each of our outstanding legal matters, we evaluate the merits of the case, our exposure to the matter, possible legal or settlement strategies, and the likelihood of an unfavorable outcome. We intend to vigorously defend ourselves in the lawsuits described herein; however, if we determine that an unfavorable outcome is probable and can be reasonably estimated, we establish the necessary accruals. We hold certain insurance policies that may reduce cash outflows with respect to an adverse outcome of certain of these litigation matters. We accrue such insurance recoveries when they become probable of being paid and can be reasonably estimated.
Burial Practices Claims. We are named as a defendant in various lawsuits alleging improper burial practices at certain of our cemetery locations. These lawsuits include but are not limited to the Garcia and Sands lawsuits described in the following paragraphs.
Reyvis Garcia and Alicia Garcia v. Alderwoods Group, Inc., Osiris Holding of Florida, Inc., a Florida corporation, d/b/a Graceland Memorial Park South, f/k/a Paradise Memorial Gardens, Inc., was filed in December 2004, in the Circuit Court of the Eleventh Judicial Circuit in and for Miami-Dade County, Florida, Case No. 04-25646 CA 32. Plaintiffs are the son and sister of the decedent, Eloisa Garcia, who was buried at Graceland Memorial Park South in March 1986, when the cemetery was owned by Paradise Memorial Gardens, Inc. Initially, the suit sought damages on the individual claims of the plaintiffs relating to the burial of Eloisa Garcia. Plaintiffs claimed that due to poor recordkeeping, spacing issues and maps, and the fact that the family could not afford to purchase a marker for the grave, the burial location of the decedent could not be readily located. Subsequently, the decedent’s grave was located and verified. In July 2006, plaintiffs amended their complaint, seeking to certify a class of all persons buried at this cemetery whose burial sites cannot be located, claiming that this was due to poor recordkeeping, maps, and surveys at the cemetery. Plaintiffs subsequently filed a third amended class action complaint and added two additional named plaintiffs. The plaintiffs are seeking unspecified monetary damages, as well as equitable and injunctive relief. On May 4, 2011, the trial court certified a class and we are appealing that ruling. We cannot quantify our ultimate liability, if any, for the payment of any damages.
F. Charles Sands, individually and on behalf of all others similarly situated, v. Eden Memorial Park, et al.; Case No. BC421528; in the Superior Court of the State of California for the County of Los Angeles — Central District. This case was filed in September 2009 against SCI and certain subsidiaries regarding our Eden Memorial Park cemetery in Mission Hills, California. The plaintiff seeks to certify a class of cemetery plot owners and their families. The plaintiff seeks compensatory, consequential and punitive damages as well as the appointment of a receiver to oversee cemetery operations. The plaintiff claims the cemetery damaged and desecrated burials in order to prepare adjoining graves for subsequent burials.We cannot quantify our ultimate liability, if any, for the payment of any damages.
Antitrust Claims. We are named as a defendant in an antitrust case filed in 2005. The case is Cause No 4:05-CV-03394; Funeral Consumers Alliance, Inc. v. Service Corporation International, et al.; in the United States District Court for the Southern District of Texas — Houston (“Funeral Consumers Case”). This was a purported class action on behalf of casket consumers throughout the United States alleging that we and several other companies involved in the funeral industry violated federal antitrust laws and state consumer laws by engaging in various anti-competitive conduct associated with the sale of caskets. Based on the case proceeding as a class action, the plaintiffs filed an expert report indicating that the damages sought from all defendants range from approximately $950 million to $1.5 billion before trebling. However, the trial court denied the plaintiffs’ motion to certify the case as a class action. We deny that we engaged in anticompetitive practices related to our casket sales, and we have filed reports of our experts, which vigorously dispute the validity of the plaintiffs’ damages theories and calculations. The trial court dismissed plaintiffs’ claims on September 24, 2010, and the plaintiffs filed an appeal on October 19, 2010. We cannot quantify our ultimate liability, if any, in this lawsuit.
Wage and Hour Claims. We are named a defendant in various lawsuits alleging violations of federal and state laws regulating wage and hour overtime pay, including but not limited to thePrise, Bryant, Bryant, Helm, Stickle, and Southern lawsuitsSambrosky lawsuit described below.
Charles Samborsky, et al, individually and on behalf of those persons similarly situated, v. SCI California Funeral Services, Inc., et al ; Case No. BC544180; in the following paragraphs.
Prise, et al., v. Alderwoods Group, Inc., and Service Corporation International; Cause No. 06-164; inSuperior Court of the United States District CourtState of California for the Western DistrictCounty of Pennsylvania (the “Wage and Hour Lawsuit”). The Wage and Hour LawsuitLos Angeles, Central District-Central Civil West Courthouse. This lawsuit was filed by two former Alderwoods (Pennsylvania), Inc. employees in December 2006April 2014 against an SCI subsidiary and purports to have been brought under the Fair Labor Standards Act (“FLSA”)
on behalf of all Alderwoods and SCI-affiliated employees who performed work for which they were not
SERVICE CORPORATION INTERNATIONAL
NOTES TO CONSOLIDATED FINANCIAL STATEMENTS — (Continued)
fully compensated, including work for which overtime pay was owed. Although the court initially conditionally certified a class of claimsworked as to certain job positions for Alderwoods employees, the court granted our motion to decertify the class on September 9, 2011.
Plaintiffsfamily service counselors in California since April 2010. The plaintiffs allege causes of action for violations of the FLSA, failure to maintain proper records, breach of contract,various violations of state laws regulating wage and hour laws, unjust enrichment, fraud and deceit, quantum meruit, negligent misrepresentation, and negligence. Plaintiffspay. The plaintiffs seek injunctive relief, unpaid wages, liquidated, compensatory consequential and punitive damages, attorneys’ fees and costs, interest, and pre- and post-judgment interest.injunctive relief. We cannot quantify our ultimate liability, if any, in this lawsuit.
Bryant, et al.Claims Regarding Acquisition of Stewart Enterprises. We are involved in the following lawsuits.
Karen Moulton, Individually and on behalf of all others similarly situated v. Alderwoods Group,Stewart Enterprises, Inc., Service Corporation International et aland others.; Case No. 3:07-CV-5696-SI;2013-5636; in the U.S.Civil District Court for the Northern DistrictParish of California.New Orleans. This lawsuitcase was filed on November 8, 2007as a class action in June 2013 against SCI and various subsidiariesour subsidiary in connection with SCI's proposed acquisition of Stewart Enterprises, Inc. The plaintiffs allege that SCI aided and individuals. It is relatedabetted breaches of fiduciary duties by Stewart Enterprises and its board of directors in negotiating the combination of Stewart Enterprises with a subsidiary of SCI. The plaintiffs seek damages concerning the combination. We filed exceptions to the Wage and Hour Lawsuit, raising similar claims and brought by the same attorneys. This lawsuit has been transferredplaintiffs’ complaint that were granted in June 2014. Thus, subject to appeals, SCI will no longer be party to the U.S. District Court for the Western District of Pennsylvaniasuit. The case will continue against our subsidiary Stewart Enterprises and is now Case No. 08-CV-00891-JFC.its former individual directors. We cannot quantify our ultimate liability, if any, in this lawsuit.for the payment of damages.
Bryant,S.E. Funeral Homes of California, Inc. v. The Roman Catholic Archbishop of Los Angeles, et al. v. Service Corporation International, et al.; Case No. RG-07359593; and Helm, et al. v. AWGI & SCI; Case No. RG-07359602;BC559142; in the Superior Court of the State of California for the County of Alameda. These cases wereLos Angeles. The plaintiff is a company indirectly owned by Stewart Enterprises, Inc. The plaintiff filed this action in September 2014 to prevent The Roman Catholic Archbishop of Los Angeles (the “Archdiocese”) from terminating six ground leases. In reliance on December 5, 2007 by counsel for plaintiffsthe leases having 40 year terms beginning at the earliest in 1997, the plaintiff had previously made material investments since 1997 in constructing and operating funeral homes, chapels, mausoleums, and other improvements on the leased premises. In addition, the plaintiff has created a material backlog of deferred preneed revenue that plaintiff expects to receive in the Wagecoming years. In September 2014, the Archdiocese delivered notices purporting to terminate the leases and Hour Lawsuit. These cases assert state law claims similar toalleging that the federal claims assertedleases were breached because the plaintiff did not obtain the Archdiocese’s consent before Stewart Enterprises, Inc. entered into a reverse merger with an affiliate of SCI. The plaintiff disputes this contention and seeks, among other things, a declaratory judgment declaring that the Archdiocese’s purported termination notices are invalid, requiring specific performance of the leases, or, in the Wagealternative, awarding plaintiff compensatory damages and Hour Lawsuit. These cases were removed to federal court in the U.S. District Courtdamages for the Northern District of California, San Francisco/Oakland Division. The Bryant case is now Case No. 3:08-CV-01190-SI and the Helm case is now Case No. C 08-01184-SI. On December 29, 2009, the court in the Helm case denied the plaintiffs’ motion to certify the case as a class action. The plaintiffs modified and refiled their motion for certification. On March 9, 2011, the court denied plaintiffs’ renewed motions to certify a class in both of the Bryant and Helm cases. The plaintiffs have also (i) filed additional lawsuits with similar allegations seeking class certification of state law claims in different states, and (ii) made a large number of demands for arbitration.unjust enrichment. We cannot quantify ourthe ultimate liability, if any, in these lawsuits.
Stickle, et al. v. Service Corporation International, et al.; Case No. 08-CV-83; in the U.S. District Court for Arizona, Phoenix Division. Counsel for plaintiffs in the Wage and Hour Lawsuit filed this case on January 17, 2008, against SCI and various related entities and individuals asserting FLSA and other ancillary claims based on the alleged failure to pay for overtime. In September 2009, the Court conditionally certified a class of claims as to certain job positions of SCI affiliated employees. On April 20, 2011, the court granted our motion to decertify the class. We cannot quantify our ultimate liability, if any, in this lawsuit.
Southern, et al. v. SCI Kentucky Funeral Services, Inc.; Case No. 11CIO6501; in the Jefferson Circuit Court, Division Eight, Kentucky. This lawsuit was filed on October 6, 2011 against an SCI subsidiary and purports to have been brought on behalf of employees who worked in Kentucky as funeral directors. The plaintiffs allege causes of action for various violations of Kentucky wage and hour laws, and breach of contract. Plaintiffs seek unpaid wages, compensatory and exemplary relief, damages, attorneys' fees and costs, and pre- and post judgment interest. We cannot quantify our ultimate liability, if any,outcome in this lawsuit.
The ultimate outcome of the matters described above cannot be determined at this time. We intend to vigorously defend all of the above lawsuits; however, an adverse decision in one or more of such matters could have a material effect on us, our financial condition, results of operations, and cash flows.
(All shares reported in whole numbers)
Share Authorization
We are authorized to issue 1,000,000 shares of preferred stock, $1 per share par value. No preferred shares were issued as of December 31, 20112014 or 2010.2013. At December 31, 20112014 and 2010, 2013, 500,000,000 common shares of $1 par value were authorized. We had 222,955,853204,866,770 and 241,035,250212,316,642 shares issued and outstanding, net of 1,709,542591,561 and 984,40010,000 shares held in treasury at par at December 31, 20112014 and 2010,2013, respectively.
Accumulated Other Comprehensive Income
Our components of Accumulated other comprehensive income are as follows:
SERVICE CORPORATION INTERNATIONAL
NOTES TO CONSOLIDATED FINANCIAL STATEMENTS — (Continued)
|
| | | | | | | | | | | |
| | Foreign Currency Translation Adjustment | | Unrealized Gains and Losses | | Accumulated Other Comprehensive (Loss) Income |
| | (In thousands) |
| Balance at December 31, 2008 | $ | 36,649 |
| | $ | — |
| | $ | 36,649 |
|
| Activity in 2009 | 60,493 |
| | — |
| | 60,493 |
|
| Increase in net unrealized gains, net of tax, associated with available-for-sale securities of the trusts, net of taxes | — |
| | 323,131 |
| | 323,131 |
|
Reclassification of net unrealized gains, net of tax, activity attributable to the Deferred preneed funeral and cemetery receipts held in trust and Care trusts’ corpus, net of taxes | — |
| | (323,131 | ) | | (323,131 | ) |
| Balance at December 31, 2009 | $ | 97,142 |
| | $ | — |
| | $ | 97,142 |
|
| Activity in 2010 | 15,626 |
| | — |
| | 15,626 |
|
| Increase in net unrealized gains associated with available-for-sale securities of the trusts, net of taxes | — |
| | 147,688 |
| | 147,688 |
|
Reclassification of net unrealized gains activity attributable to the Deferred preneed funeral and cemetery receipts held in trust and Care trusts’ corpus, net of taxes | — |
| | (147,688 | ) | | (147,688 | ) |
| Balance at December 31, 2010 | $ | 112,768 |
| | $ | — |
| | $ | 112,768 |
|
| Activity in 2011 | (6,916 | ) | | — |
| | (6,916 | ) |
| Reduction in net unrealized gains associated with available-for-sale securities of the trusts, net of taxes | — |
| | (80,789 | ) | | (80,789 | ) |
Reclassification of net unrealized losses activity attributable to the Deferred preneed funeral and cemetery receipts held in trust and Care trusts’ corpus, net of taxes | — |
| | 80,789 |
| | 80,789 |
|
| Balance at December 31, 2011 | $ | 105,852 |
| | $ | — |
| | $ | 105,852 |
|
|
| | | | | | | | | | | |
| | Foreign Currency Translation Adjustment | | Unrealized Gains and Losses | | Accumulated Other Comprehensive (Loss) Income |
| | (In thousands) |
| Balance at December 31, 2011 | $ | 105,852 |
| | $ | — |
| | $ | 105,852 |
|
| Activity in 2012 | 5,865 |
| | — |
| | 5,865 |
|
| Reduction in net unrealized gains associated with available-for-sale securities of the trusts, net of taxes | — |
| | 95,686 |
| | 95,686 |
|
Reclassification of net unrealized losses activity attributable to the Deferred preneed funeral and cemetery receipts held in trust and Care trusts’ corpus, net of taxes | — |
| | (95,686 | ) | | (95,686 | ) |
| Balance at December 31, 2012 | $ | 111,717 |
| | $ | — |
| | $ | 111,717 |
|
| Activity in 2013 | (23,276 | ) | |
|
| | (23,276 | ) |
| Increase in net unrealized gains associated with available-for-sale securities of the trusts, net of taxes | — |
| | (113,553 | ) | | (113,553 | ) |
Reclassification of net unrealized gains activity attributable to the Deferred preneed funeral and cemetery receipts held in trust and Care trusts’ corpus, net of taxes | — |
| | 113,553 |
| | 113,553 |
|
| Balance at December 31, 2013 | $ | 88,441 |
| | $ | — |
| | $ | 88,441 |
|
| Activity in 2014 | (32,141 | ) | | — |
| | (32,141 | ) |
Reclassification of foreign currency translation adjustments to Net income from discontinued operations | 3,114 |
| | — |
| | 3,114 |
|
| Increase in net unrealized gains associated with available-for-sale securities of the trusts, net of taxes | — |
| | (166,570 | ) | | (166,570 | ) |
Reclassification of net unrealized gains activity attributable to the Deferred preneed funeral and cemetery receipts held in trust and Care trusts’ corpus, net of taxes | — |
| | 166,570 |
| | 166,570 |
|
| Balance at December 31, 2014 | $ | 59,414 |
| | $ | — |
| | $ | 59,414 |
|
The assets and liabilities of foreign operations are translated into U.S. dollars using the current exchange rate. The U.S. dollar amount that arises from such translation, as well as exchange gains and losses on intercompany balances of a long-term investment nature, are included in the cumulative currency translation adjustments in Accumulated other comprehensive income.
Share Repurchase Program
Subject to market conditions, normal trading restrictions, and limitations in our debt covenants, we may make purchases in the open market or through privately negotiated transactions under our share repurchase program. During 2011,Under our share repurchase program, during 2014, we repurchased 19,752,17411,424,446 shares of common stock at an aggregate cost of $195.7$241.7 million,, which is an average cost per share of $9.91.$21.15. During 2010,2013, there were no shares repurchased under our share repurchase program. During 2012, we repurchased 13,927,51015,294,567 shares of common stock at an aggregate cost of $116.2$184.9 million,, which is an average cost per share of $8.34. During 2009, we did not repurchase any shares of our common stock.$12.09 under the program. In August 2011,November 2014, our Board of Directors approved an additional increase in our share repurchase program authorizing the investment of up to an additional $116.6$290.0 million to repurchase our common stock.stock, bringing total authorization up to $300.0 million. The remaining dollar value of shares authorized to be purchased under the share repurchase program was $99.6$238.8 million at December 31, 2011.2014.
Subsequent to December 31, 2011,2014, we repurchased an additional 1,831,9211,974,053 shares of common stockfor $45.1 million at an aggregate cost of $20.0 million including commissions (averageaverage cost per share of $10.90). In February 2012, our Board of Directors approved an increase in our share repurchase program authorizing the investment of up to an additional $119.9 million to repurchase our common stock. After this increase, the remaining dollar value of shares authorized to be purchased under our share repurchase program is approximately $199.4 million.$22.84.
Cash Dividends
On November 8, 2011,11, 2014, our Board of Directors approved a cash dividend of $0.05$0.09 per common share. At share paid on December 31, 2011, this dividend totaling $11.0 million was recorded in Accounts payable and accrued liabilities and Capital in Excess2014 to stockholders of Par Value in our consolidated balance sheet.record as of December 15, 2014. We paid this dividend subsequent to December 31, 2011. We paid $44.8$71.5 million,, $40.0 $57.2 million,, and $40.2$60.3 million in cash dividends in 2011, 2010,2014, 2013, and 2009,2012, respectively. In 2012, five dividends were paid including the fourth quarter 2012 dividend, which historically would have been paid in the first quarter of 2013. On February 8, 201210, 2015 our Board of Directors approved a cash dividend of $0.05$0.10 per common share payable on April 30, 2012March 31, 2014 to stockholders of record as of April 13, 2012.March 16, 2014.
14. Share-Based Compensation
| |
| 14. | Share-Based Compensation |
Stock Benefit Plans
We maintain benefit plans whereby shares of our common stock may be issued pursuant to the exercise of stock options or restricted stock granted to officers and key employees. Our Amended and Restated Incentive Plan reserves 44,000,000 shares of common stock for outstanding and future awards of stock options, restricted stock, and other stock based awards to officers and key employees.
Our benefit plans allow for options to be granted as either non-qualified or incentive stock options. The options historically have been granted annually, or upon hire, as approved by the Compensation Committee of the Board of Directors. The options are granted with an exercise price equal to the market price of our common stock on the date the grant, as approved by the Compensation Committee of the Board of Directors. The options are generally exercisable at a rate of 331/3% each year unless alternative vesting methods are approved by the Compensation Committee of the Board of Directors. Restricted stock awards are generally expensed to income ratably over the period during which the restrictions lapse. At December 31, 20112014 and 2010, 11,789,4832013, 4,916,787 and 4,297,1866,744,936 shares, respectively, were reserved for future option and restricted stock grants under our stock benefit plans.
We utilize the Black-Scholes option valuation model for estimating the fair value of our stock options. This model allows the use of a range of assumptions related to volatility, risk-free interest rate, expected holding period, and dividend yield. The expected volatility utilized in the valuation model is based on the historical volatility of our stock price. The dividend yield and expected holding period are based on historical experience and management’s estimate of future events. The risk-free interest rate is derived from the U.S. Treasury yield curve based on the expected life of the option in effect at the time of grant. The fair values of our stock options are calculated using the following weighted average assumptions, based on the methods described above for the years ended December 31, 2011, 2010,2014, 2013, and 2009:2012:
| | | | | Years Ended December 31, | | Years Ended December 31, |
| Assumptions | | 2011 | | 2010 | | 2009 | | 2014 | | 2013 | | 2012 |
| Dividend yield | | 2.4 | % | | 1.9 | % | | 3.5 | % | | 1.8 | % | | 1.9 | % | | 1.8 | % |
| Expected volatility | | 38.4 | % | | 37.5 | % | | 32.3 | % | | 27.1 | % | | 35.2 | % | | 40.8 | % |
| Risk-free interest rate | | 2.4 | % | | 2.3 | % | | 1.8 | % | | 1.1 | % | | 0.7 | % | | 0.8 | % |
| Expected holding period (years) | | 5.0 |
| | 5.0 |
| | 5.0 |
| | 4.0 |
| | 4.0 |
| | 5.0 |
|
The following table summarizes certain information with respect to stock option and restricted share compensation for 2011, 2010,2014, 2013, and 2009,2012, as included in our consolidated statement of operations for those respective periods:
| | | | December 31, | December 31, |
| | 2011 | | 2010 | | 2009 | 2014 | | 2013 | | 2012 |
| | (In thousands) | (In thousands) |
| Total pretax employee share-based compensation expense included in net income | $ | 9,144 |
| | $ | 8,878 |
| | $ | 9,684 |
| $ | 13,127 |
| | $ | 11,925 |
| | $ | 10,983 |
|
| Income tax benefit related to share-based compensation included in net income | $ | 3,218 |
| | $ | 3,740 |
| | $ | 3,705 |
| $ | 7,368 |
| | $ | 4,689 |
| | $ | 4,092 |
|
We realized windfall tax deductions of $4.9$31.6 million,, $2.7 $7.3 million,, and $7.1$16.3 million in excess of previously recorded tax benefits, based on the option and restricted share value at the time of grant for the years ended December 31, 2011, 2010,2014, 2013, and 2009,2012, respectively. Pursuant to the Stock-Based Compensation Topic of the ASC, theThe additional tax benefit associated with the windfall is not recognized until the deduction reduces taxes payable.
Stock Options
The following table sets forth stock option activity for the year ended December 31, 2011:2014:
(Shares reported in whole numbers and not in thousands)
|
| | | | | | |
| | Options | | Weighted-Average Exercise Price |
| Outstanding at December 31, 2010 | 12,312,783 |
| | $ | 7.53 |
|
| Granted | 2,394,430 |
| | $ | 9.09 |
|
| Exercised | (1,208,140 | ) | | $ | 6.81 |
|
| Canceled | (94,857 | ) | | $ | 5.32 |
|
| Outstanding at December 31, 2011 | 13,404,216 |
| | $ | 7.88 |
|
| Exercisable at December 31, 2011 | 8,216,969 |
| | $ | 8.17 |
|
|
| | | | | | |
| | Options | | Weighted-Average Exercise Price |
| Outstanding at December 31, 2013 | 13,319,750 |
| | $ | 9.84 |
|
| Granted | 2,495,850 |
| | $ | 17.41 |
|
| Exercised | (3,642,126 | ) | | $ | 9.10 |
|
| Forfeited and other | (66,368 | ) | | $ | 8.52 |
|
| Outstanding at December 31, 2014 | 12,107,106 |
| | $ | 11.63 |
|
| Exercisable at December 31, 2014 | 7,673,557 |
| | $ | 9.17 |
|
During the twelve months ended December 31, 2011, 19,857 of the canceled shares were forfeited. The aggregate intrinsic value for stock options outstanding and exercisable was $38.8$134.2 million and $22.2$103.8 million,, respectively, at December 31, 2011.2014.
Set forth below is certain information related to stock options outstanding and exercisable at December 31, 2011:2014:
(Shares reported in whole numbers and not in thousands)
|
| | | | | | | | | | | | | | | | | |
| | | Options Outstanding | | Options Exercisable |
| | | Number Outstanding at December 31, | | Weighted- Average Remaining | | Weighted- Average | | Number Exercisable at December 31, | | Weighted- Average |
| Range of Exercise Price | | 2011 | | Contractual Life | | Exercise Price | | 2011 | | Exercise Price |
| $4.01 — 6.00 | | 3,675,996 |
| | 5.1 |
| | $ | 4.19 |
| | 2,366,751 |
| | $ | 4.19 |
|
| $6.01 — 9.00 | | 3,883,760 |
| | 4.2 |
| | $ | 7.74 |
| | 2,405,385 |
| | $ | 7.80 |
|
| $9.01 — 15.00 | | 5,844,460 |
| | 5.0 |
| | $ | 10.31 |
| | 3,444,833 |
| | $ | 11.16 |
|
| $4.01 — 15.00 | | 13,404,216 |
| | 4.8 |
| | $ | 7.88 |
| | 8,216,969 |
| | $ | 8.17 |
|
|
| | | | | | | | | | | | | | | | |
| | | Options Outstanding | | Options Exercisable |
| | | Number Outstanding at December 31, | | Weighted- Average Remaining | | Weighted- Average | | Number Exercisable at December 31, | | Weighted- Average |
| Range of Exercise Price | | 2014 | | Contractual Life | | Exercise Price | | 2014 | | Exercise Price |
| $4.01 — 8.00 | | 2,784,838 |
| | 2.6 | | $ | 6.01 |
| | 2,784,838 |
| | $ | 6.01 |
|
| $8.01 — 12.00 | | 4,871,490 |
| | 3.8 | | $ | 10.43 |
| | 4,228,505 |
| | $ | 10.32 |
|
| $12.01 — 16.00 | | 1,996,328 |
| | 6.0 | | $ | 15.20 |
| | 660,214 |
| | $ | 15.08 |
|
| $16.01 — 20.00 | | 2,454,450 |
| | 7.1 | | $ | 17.41 |
| | — |
| | $ | — |
|
| $4.01 — 20.00 | | 12,107,106 |
| | 4.6 | | $ | 11.62 |
| | 7,673,557 |
| | $ | 9.17 |
|
Other information pertaining to option activity during the years ended December 31 is as follows:
| | | | 2011 | | 2010 | | 2009 | 2014 | | 2013 | | 2012 |
| Weighted average grant-date fair value of stock options granted | $ | 2.73 |
| | $ | 2.31 |
| | $ | 0.87 |
| $ | 3.34 |
| | $ | 3.68 |
| | $ | 3.41 |
|
| Total fair value of stock options vested (in thousands) | $ | 5,015 |
| | $ | 6,022 |
| | $ | 6,439 |
| $ | 6,814 |
| | $ | 5,997 |
| | $ | 5,088 |
|
| Total intrinsic value of stock options exercised (in thousands) | $ | 5,184 |
| | $ | 1,804 |
| | $ | 7,001 |
| $ | 42,048 |
| | $ | 8,855 |
| | $ | 20,333 |
|
For the years ended December 31, 2011, 2010,2014, 2013, and 2009,2012, cash received from the exercise of stock options was $8.2$32.4 million,, $1.8 $6.3 million,, and $17.4$18.4 million,, respectively. We recognized compensation expense of $5.1$7.5 million,, $5.3 $6.7 million,, and $6.5$6.2 million related to stock options for the years ended December 31, 2011, 2010,2014, 2013, and 2009,2012, respectively. As of December 31, 2011,2014, the unrecognized compensation expense related to stock options of $6.6$8.8 million is expected to be recognized over a weighted average period of 1.41.3 years.
Restricted Shares
Restricted share activity was as follows:
(Shares reported in whole numbers)
| | | | Restricted Shares | | Weighted-Average Grant-Date Fair Value | Restricted Shares | | Weighted-Average Grant-Date Fair Value |
| Nonvested restricted shares at December 31, 2010 | 1,167,273 |
| | $ | 6.35 |
| |
| Nonvested restricted shares at December 31, 2013 | | 1,183,229 |
| | $ | 11.81 |
|
| Granted | 538,620 |
| | $ | 9.13 |
| 351,860 |
| | $ | 17.49 |
|
| Vested | (540,723 | ) | | $ | 6.58 |
| (207,659 | ) | | $ | 11.26 |
|
| Nonvested restricted shares at December 31, 2011 | 1,165,170 |
| | $ | 7.53 |
| |
| Forfeited and other | | (8,170 | ) | | $ | 14.67 |
|
| Nonvested restricted shares at December 31, 2014 | | 1,319,260 |
| | $ | 13.39 |
|
The fair market value of our restricted stock, as determined on the grant date, is being amortized and charged to income (with an offsetting credit to Capital in excess of par value) generally over the average period during which the restrictions lapse. At
December 31, 2011,2014, unrecognized compensation expense of $5.1$6.5 million related to restricted shares, which is recorded in Capital in excess of par value on our balance sheet, is expected to be recognized over a weighted average period of 1.3 years. We recognized compensation expense of $4.1$5.7 million,, $3.6 $5.2 million,, and $3.2$4.9 million during the years ended December 31, 2011, 2010,2014, 2013, and 2009,2012, respectively, related to our restricted shares.
We currently have a supplemental retirement plan for certain current and former key employees (SERP), a supplemental retirement plan for officers and certain key employees (Senior SERP), a retirement plan for certain non-employee directors (Directors’ Plan), a Retirement Plan for Rose Hills Trustees, and a Rose Hills Supplemental Retirement Plan, (Rose Hills SERP)and a Stewart Supplemental Retirement Plan (collectively, the “Plans”). We also provide a 401(k) employee savings plan. All of our Plans have a measurement date of December 31.
The Plans are frozen; therefore, the participants do not earn incremental benefits from additional years of service, and we do not incur any additional service cost since December 31, 2000.
Retirement benefits under the SERP are based on years of service and average monthly compensation, reduced by benefits under Social Security. The Senior SERP provides retirement benefits based on years of service and position. The Directors’ Plan provides for an annual benefit to directors following retirement, based on a vesting schedule.
The components of the Plans’ net periodic benefit cost for the years ended December 31 were as follows:
|
| | | | | | | | | | | |
| | 2011 | | 2010 | | 2009 |
| | (In thousands) |
| Interest cost on projected benefit obligation | $ | 1,306 |
| | $ | 1,498 |
| | $ | 1,849 |
|
| Actual return on plan assets | — |
| | — |
| | — |
|
| Recognized net actuarial (gains) losses | (289 | ) | | 534 |
| | 2,197 |
|
| | $ | 1,017 |
| | $ | 2,032 |
| | $ | 4,046 |
|
|
| | | | | | | | | | | |
| | 2014 | | 2013 | | 2012 |
| | (In thousands) |
| Interest cost on projected benefit obligation | $ | 1,293 |
| | $ | 780 |
| | $ | 1,109 |
|
| Recognized net actuarial losses (gains) | 2,401 |
| | (1,205 | ) | | 1,418 |
|
| | $ | 3,694 |
| | $ | (425 | ) | | $ | 2,527 |
|
The Plans’ funded status at December 31 was as follows:
| | | | 2011 | | 2010 | 2014 | | 2013 |
| | (In thousands) | (In thousands) |
| Change in Benefit Obligation: | |
| | |
| |
| | |
|
| Benefit obligation at beginning of year | $ | 31,377 |
| | $ | 32,891 |
| $ | 37,499 |
| | $ | 28,674 |
|
| Acquisition of benefit obligation | | — |
| | 21,407 |
|
| Interest cost | 1,306 |
| | 1,498 |
| 1,293 |
| | 780 |
|
| Actuarial loss | 49 |
| | 846 |
| |
| Actuarial gain (loss) | | 2,401 |
| | (856 | ) |
| Benefits paid | (3,518 | ) | | (3,858 | ) | (4,273 | ) | | (12,506 | ) |
| Benefit obligation at end of year | $ | 29,214 |
| | $ | 31,377 |
| $ | 36,920 |
| | $ | 37,499 |
|
| Change in Plan Assets: | |
| | |
| |
| | |
|
| Fair value of plan assets at beginning of year | $ | — |
| | $ | — |
| $ | — |
| | $ | — |
|
| Employer contributions | 3,518 |
| | 3,858 |
| 4,273 |
| | 12,506 |
|
| Benefits paid, including expenses | (3,518 | ) | | (3,858 | ) | (4,273 | ) | | (12,506 | ) |
| Fair value of plan assets at end of year | $ | — |
| | $ | — |
| $ | — |
| | $ | — |
|
| Funded status of plan | $ | (29,214 | ) | | $ | (31,377 | ) | $ | (36,920 | ) | | $ | (37,499 | ) |
| Net amount recognized in the Consolidated Balance Sheet | $ | (29,214 | ) | | $ | (31,377 | ) | $ | (36,920 | ) | | $ | (37,499 | ) |
| Funding Summary: | |
| | |
| |
| | |
|
| Projected benefit obligations | $ | 29,214 |
| | $ | 31,377 |
| $ | 36,920 |
| | $ | 37,499 |
|
| Accumulated benefit obligation | $ | 29,214 |
| | $ | 31,377 |
| $ | 36,920 |
| | $ | 37,499 |
|
| Amounts Recognized in the Consolidated Balance Sheet: | |
| | |
| |
| | |
|
| Accrued benefit liability | $ | (29,214 | ) | | $ | (31,377 | ) | $ | (36,920 | ) | | $ | (37,499 | ) |
The retirement benefits under the Plans are unfunded obligations of the Company. We have purchased various life insurance policies on the participants in the Plans with the intent to use the proceeds or any cash value buildup from such policies to assist in meeting, at least to the extent of such assets, the Plan’s funding requirements. The face value of these insurance policies at
SERVICE CORPORATION INTERNATIONAL
NOTES TO CONSOLIDATED FINANCIAL STATEMENTS — (Continued)
December 31, 20112014 and 20102013 was $51.1$47.8 million and $51.6$47.4 million,, respectively, and the cash surrender value was $37.5$37.0 million and $37.3$35.8 million,, respectively. The outstanding loans against the policies are minimal and there are no restrictions in the policies regarding loans.
The Plans’ weighted-average assumptions used to determine the benefit obligation and net benefit cost are as follows: we base our discount rate used to compute future benefit obligations using an analysis of expected future benefit payments. The reasonableness of our discount rate is verified by comparing the rate to the rate earned on high-quality fixed income investments, such as the Moody’s Aa index, plus 50 basis points. The assumed rate of return on plan assets was not applicable as we pay plan benefits as they come due. As all Plans are curtailed, the assumed rate of compensation increase is zero.
| | | | 2011 | | 2010 | | 2009 | 2014 | | 2013 | | 2012 |
| Weighted average discount rate used to determine obligations | 4.05 | % | | 4.45 | % | | 5.00 | % | 3.42 | % | | 3.66 | % | | 2.90 | % |
| Weighted average discount rate used to determine net periodic pension cost | 4.41 | % | | 4.80 | % | | 5.97 | % | 3.69 | % | | 2.90 | % | | 4.05 | % |
The following benefit payments are expected to be paid in future years related to our Plans:Plans (in thousands):
|
| | | |
| 2012 | $ | 3,646 |
|
| 2013 | 3,577 |
|
| 2014 | 3,600 |
|
| 2015 | 3,011 |
|
| 2016 | 2,760 |
|
| Years 2017 through 2021 | 10,373 |
|
|
| | | |
| 2015 | $ | 3,940 |
|
| 2016 | $ | 3,768 |
|
| 2017 | $ | 3,471 |
|
| 2018 | $ | 3,264 |
|
| 2019 | $ | 3,195 |
|
| Years 2020 through 2024 | $ | 11,771 |
|
We have an employee savings plan that qualifies under section 401(k) of the Internal Revenue Code for the exclusive benefit of our United States employees. Under the plan, participating employees may contribute a portion of their pretax and/or after-tax income in accordance with specified guidelines up to a maximum of 50%.
During 2011, 2010,2014, 2013, and 20092012 we matched a percentage of the employee contributions through contributions of cash. For these years, our matching contribution was based upon the following:
|
| | |
| Years of Vesting Service | | Percentage of Deferred Compensation |
| 0 — 5 years | | 75% of the first 6% of deferred compensation |
| 6 — 10 years | | 100% of the first 6% of deferred compensation |
| 11 or more years | | 125% of the first 6% of deferred compensation |
The amount of our matched contributions in 2011, 2010,2014, 2013, and 20092012 was $22.3$26.8 million,, $20.3 $24.3 million,, and $18.1$23.1 million,, respectively.
16. Segment Reporting
Our operations are both product based and geographically based, and the reportable operating segments presented below include our funeral and cemetery operations. Our geographic areas include United States Canada, and Germany.Canada. We conduct both funeral and cemetery operations in the United States and Canada and funeral operations in Germany.Canada.
Our reportable segment information is as follows:
SERVICE CORPORATION INTERNATIONAL
NOTES TO CONSOLIDATED FINANCIAL STATEMENTS — (Continued)
| | | | Funeral | | Cemetery | | Reportable Segments | Funeral | | Cemetery | | Reportable Segments |
| | (In thousands) | (In thousands) |
| 2011 | |
| | |
| | |
| |
| 2014 | | |
| | |
| | |
|
| Revenues from external customers | $ | 1,573,498 |
| | $ | 742,542 |
| | $ | 2,316,040 |
| $ | 1,920,477 |
| | $ | 1,073,535 |
| | $ | 2,994,012 |
|
| Interest expense | 3,957 |
| | 305 |
| | 4,262 |
| $ | 4,714 |
| | $ | 510 |
| | $ | 5,224 |
|
| Depreciation and amortization | 89,872 |
| | 21,355 |
| | 111,227 |
| $ | 101,792 |
| | $ | 28,754 |
| | $ | 130,546 |
|
| Amortization of intangible assets | 18,582 |
| | 5,540 |
| | 24,122 |
| $ | 24,841 |
| | $ | 11,700 |
| | $ | 36,541 |
|
| Gross profit | 330,732 |
| | 147,804 |
| | 478,536 |
| $ | 403,938 |
| | $ | 271,875 |
| | $ | 675,813 |
|
| Amortization of cemetery property | — |
| | 40,046 |
| | 40,046 |
| $ | — |
| | $ | 60,439 |
| | $ | 60,439 |
|
| Total assets | 4,494,331 |
| | 4,496,749 |
| | 8,991,080 |
| $ | 5,209,177 |
| | $ | 6,248,713 |
| | $ | 11,457,890 |
|
| Capital expenditures | 45,275 |
| | 57,972 |
| | 103,247 |
| $ | 52,610 |
| | $ | 78,588 |
| | $ | 131,198 |
|
| 2010 | |
| | |
| | |
| |
| 2013 | | |
| | |
| | |
|
| Revenues from external customers | $ | 1,492,838 |
| | $ | 697,714 |
| | $ | 2,190,552 |
| $ | 1,698,493 |
| | $ | 851,973 |
| | $ | 2,550,466 |
|
| Interest expense | 3,033 |
| | 257 |
| | 3,290 |
| $ | 4,736 |
| | $ | 348 |
| | $ | 5,084 |
|
| Depreciation and amortization | 87,897 |
| | 20,909 |
| | 108,806 |
| $ | 92,588 |
| | $ | 23,384 |
| | $ | 115,972 |
|
| Amortization of intangible assets | 17,464 |
| | 6,095 |
| | 23,559 |
| $ | 17,245 |
| | $ | 4,590 |
| | $ | 21,835 |
|
| Gross profit | 317,068 |
| | 132,155 |
| | 449,223 |
| $ | 349,791 |
| | $ | 199,256 |
| | $ | 549,047 |
|
| Amortization of cemetery property | — |
| | 32,418 |
| | 32,418 |
| $ | — |
| | $ | 48,344 |
| | $ | 48,344 |
|
| Total assets | 4,262,675 |
| | 4,450,028 |
| | 8,712,703 |
| $ | 5,675,371 |
| | $ | 6,594,300 |
| | $ | 12,269,671 |
|
| Capital expenditures | 34,762 |
| | 48,427 |
| | 83,189 |
| $ | 50,304 |
| | $ | 58,315 |
| | $ | 108,619 |
|
| 2009 | |
| | |
| | |
| |
| 2012 | | |
| | |
| | |
|
| Revenues from external customers | $ | 1,391,894 |
| | $ | 661,626 |
| | $ | 2,053,520 |
| $ | 1,619,687 |
| | $ | 784,743 |
| | $ | 2,404,430 |
|
| Interest expense | 2,548 |
| | 847 |
| | 3,395 |
| $ | 4,302 |
| | $ | 384 |
| | $ | 4,686 |
|
| Depreciation and amortization | 85,324 |
| | 21,889 |
| | 107,213 |
| $ | 90,707 |
| | $ | 22,736 |
| | $ | 113,443 |
|
| Amortization of intangible assets | 15,473 |
| | 6,105 |
| | 21,578 |
| $ | 18,803 |
| | $ | 5,021 |
| | $ | 23,824 |
|
| Gross profit | 305,809 |
| | 115,586 |
| | 421,395 |
| $ | 347,359 |
| | $ | 175,413 |
| | $ | 522,772 |
|
| Amortization of cemetery property | — |
| | 30,664 |
| | 30,664 |
| $ | — |
| | $ | 44,976 |
| | $ | 44,976 |
|
| Total assets | 4,081,512 |
| | 4,215,968 |
| | 8,297,480 |
| $ | 4,477,259 |
| | $ | 4,777,450 |
| | $ | 9,254,709 |
|
| Capital expenditures | 38,348 |
| | 38,726 |
| | 77,074 |
| $ | 43,678 |
| | $ | 58,155 |
| | $ | 101,833 |
|
The following table reconciles certain reportable segment amounts to our corresponding consolidated amounts:
SERVICE CORPORATION INTERNATIONAL
NOTES TO CONSOLIDATED FINANCIAL STATEMENTS — (Continued)
| | | | Reportable Segments | | Corporate | | Consolidated | Reportable Segments | | Corporate | | Consolidated |
| | (In thousands) | (In thousands) |
| 2011 | |
| | |
| | |
| |
| 2014 | | |
| | |
| | |
|
| Revenue from external customers | $ | 2,316,040 |
| | $ | — |
| | $ | 2,316,040 |
| $ | 2,994,012 |
| | $ | — |
| | $ | 2,994,012 |
|
| Interest expense | 4,262 |
| | 129,520 |
| | 133,782 |
| $ | 5,224 |
| | $ | 172,347 |
| | $ | 177,571 |
|
| Depreciation and amortization | 111,227 |
| | 6,820 |
| | 118,047 |
| $ | 130,546 |
| | $ | 9,456 |
| | $ | 140,002 |
|
| Amortization of intangible assets | 24,122 |
| | 1,469 |
| | 25,591 |
| $ | 36,541 |
| | $ | 99 |
| | $ | 36,640 |
|
| Total assets | 8,991,080 |
| | 336,732 |
| | 9,327,812 |
| $ | 11,457,890 |
| | $ | 465,754 |
| | $ | 11,923,644 |
|
| Capital expenditures | 103,247 |
| | 15,128 |
| | 118,375 |
| $ | 131,198 |
| | $ | 13,301 |
| | $ | 144,499 |
|
| 2010 | |
| | |
| | |
| |
| 2013 | | |
| | |
| | |
|
| Revenue from external customers | $ | 2,190,552 |
| | $ | — |
| | $ | 2,190,552 |
| $ | 2,550,466 |
| | $ | — |
| | $ | 2,550,466 |
|
| Interest expense | 3,290 |
| | 124,906 |
| | 128,196 |
| $ | 5,084 |
| | $ | 137,276 |
| | $ | 142,360 |
|
| Depreciation and amortization | 108,806 |
| | 7,585 |
| | 116,391 |
| $ | 115,972 |
| | $ | 6,263 |
| | $ | 122,235 |
|
| Amortization of intangible assets | 23,559 |
| | 1,638 |
| | 25,197 |
| $ | 21,835 |
| | $ | 24 |
| | $ | 21,859 |
|
| Total assets | 8,712,703 |
| | 477,837 |
| | 9,190,540 |
| $ | 12,269,671 |
| | $ | 563,929 |
| | $ | 12,833,600 |
|
| Capital expenditures | 83,189 |
| | 14,710 |
| | 97,899 |
| $ | 108,619 |
| | $ | 4,320 |
| | $ | 112,939 |
|
| 2009 | |
| | |
| | | |
| 2012 | | |
| | |
| | |
| Revenue from external customers | $ | 2,053,520 |
| | $ | — |
| | $ | 2,053,520 |
| $ | 2,404,430 |
| | $ | — |
| | $ | 2,404,430 |
|
| Interest expense | 3,395 |
| | 125,586 |
| | 128,981 |
| $ | 4,686 |
| | $ | 130,382 |
| | $ | 135,068 |
|
| Depreciation and amortization | 107,213 |
| | 3,889 |
| | 111,102 |
| $ | 113,443 |
| | $ | 6,419 |
| | $ | 119,862 |
|
| Amortization of intangible assets | 21,578 |
| | 120 |
| | 21,698 |
| $ | 23,824 |
| | $ | 29 |
| | $ | 23,853 |
|
| Total assets | 8,297,480 |
| | 593,462 |
| | 8,890,942 |
| $ | 9,254,709 |
| | $ | 333,817 |
| | $ | 9,588,526 |
|
| Capital expenditures | 77,074 |
| | 6,716 |
| | 83,790 |
| $ | 101,833 |
| | $ | 13,488 |
| | $ | 115,321 |
|
The following table reconciles gross profits from reportable segments shown above to our consolidated income from continuing operations before income taxes:
| | | | 2011 | | 2010 | | 2009 | 2014 | | 2013 | | 2012 |
| | (In thousands) | (In thousands) |
| Gross profit from reportable segments | $ | 478,536 |
| | $ | 449,223 |
| | $ | 421,395 |
| $ | 675,813 |
| | $ | 549,047 |
| | $ | 522,772 |
|
| General and administrative expenses | (103,860 | ) | | (103,689 | ) | | (102,501 | ) | (184,877 | ) | | (155,128 | ) | | (121,891 | ) |
| (Losses) gains on divestitures and impairment charges, net | (10,977 | ) | | 8,512 |
| | 4,253 |
| |
| Other operating income | — |
| | — |
| | 740 |
| |
| Gains (losses) on divestitures and impairment charges, net | | 116,613 |
| | (6,263 | ) | | (1,511 | ) |
| Operating income | 363,699 |
| | 354,046 |
| | 323,887 |
| 607,549 |
| | 387,656 |
| | 399,370 |
|
| Interest expense | (133,782 | ) | | (128,196 | ) | | (128,981 | ) | (177,571 | ) | | (142,360 | ) | | (135,068 | ) |
| (Losses) gains on early extinguishment of debt, net | (3,509 | ) | | (9,400 | ) | | 3,146 |
| (29,158 | ) | | 468 |
| | (22,706 | ) |
| Other (expense) income, net | (772 | ) | | 3,009 |
| | 1,316 |
| |
| Other income (expense), net | | 1,780 |
| | (558 | ) | | 3,687 |
|
| Income from continuing operations before income taxes | $ | 225,636 |
| | $ | 219,459 |
| | $ | 199,368 |
| $ | 402,600 |
| | $ | 245,206 |
| | $ | 245,283 |
|
Our geographic area information was as follows:
SERVICE CORPORATION INTERNATIONAL
NOTES TO CONSOLIDATED FINANCIAL STATEMENTS — (Continued)
| | | | United States | | Canada | | Germany | | Total | United States | | Canada | | Total |
| | (In thousands) | (In thousands) |
| 2011 | |
| | |
| | |
| | |
| |
| 2014 | | |
| | |
| | |
|
| Revenues from external customers | $ | 2,103,738 |
| | $ | 205,733 |
| | $ | 6,569 |
| | $ | 2,316,040 |
| $ | 2,792,010 |
| | $ | 202,002 |
| | $ | 2,994,012 |
|
| Interest expense | 133,479 |
| | 303 |
| | — |
| | 133,782 |
| $ | 177,245 |
| | $ | 326 |
| | $ | 177,571 |
|
| Depreciation and amortization | 105,931 |
| | 11,723 |
| | 393 |
| | 118,047 |
| $ | 129,510 |
| | $ | 10,492 |
| | $ | 140,002 |
|
| Amortization of intangible assets | 24,223 |
| | 1,368 |
| | — |
| | 25,591 |
| $ | 35,895 |
| | $ | 745 |
| | $ | 36,640 |
|
| Amortization of cemetery property | 35,375 |
| | 4,671 |
| | — |
| | 40,046 |
| $ | 55,679 |
| | $ | 4,760 |
| | $ | 60,439 |
|
| Operating income | 311,790 |
| | 51,367 |
| | 542 |
| | 363,699 |
| $ | 557,608 |
| | $ | 49,941 |
| | $ | 607,549 |
|
| (Losses) gains on divestitures and impairment charges, net | (10,299 | ) | | (678 | ) | | — |
| | (10,977 | ) | |
| Gains on divestitures and impairment charges, net | | $ | 116,046 |
| | $ | 567 |
| | $ | 116,613 |
|
| Long-lived assets | 4,553,557 |
| | 351,813 |
| | 3,038 |
| | 4,908,408 |
| $ | 5,717,850 |
| | $ | 300,515 |
| | $ | 6,018,365 |
|
| 2010 | |
| | |
| | |
| | |
| |
| 2013 | | |
| | |
| | |
|
| Revenues from external customers | $ | 1,981,190 |
| | $ | 202,760 |
| | $ | 6,602 |
| | $ | 2,190,552 |
| $ | 2,334,667 |
| | $ | 215,799 |
| | $ | 2,550,466 |
|
| Interest expense | 127,971 |
| | 225 |
| | — |
| | 128,196 |
| $ | 141,991 |
| | $ | 369 |
| | $ | 142,360 |
|
| Depreciation and amortization | 104,496 |
| | 11,507 |
| | 388 |
| | 116,391 |
| $ | 111,210 |
| | $ | 11,025 |
| | $ | 122,235 |
|
| Amortization of intangible assets | 23,524 |
| | 1,673 |
| | — |
| | 25,197 |
| $ | 20,846 |
| | $ | 1,013 |
| | $ | 21,859 |
|
| Amortization of cemetery property | 27,688 |
| | 4,730 |
| | — |
| | 32,418 |
| $ | 42,972 |
| | $ | 5,372 |
| | $ | 48,344 |
|
| Operating income | 301,297 |
| | 51,799 |
| | 950 |
| | 354,046 |
| $ | 331,143 |
| | $ | 56,513 |
| | $ | 387,656 |
|
| (Losses) gains on divestitures and impairment charges, net | 6,837 |
| | 1,600 |
| | 75 |
| | 8,512 |
| |
| Losses on divestitures and impairment charges, net | | $ | (5,958 | ) | | $ | (305 | ) | | $ | (6,263 | ) |
| Long-lived assets | 4,467,176 |
| | 363,008 |
| | 3,600 |
| | 4,833,784 |
| $ | 5,793,719 |
| | $ | 329,785 |
| | $ | 6,123,504 |
|
| 2009 | |
| | |
| | |
| | |
| |
| 2012 | | |
| | |
| | |
|
| Revenues from external customers | $ | 1,869,042 |
| | $ | 177,665 |
| | $ | 6,813 |
| | $ | 2,053,520 |
| $ | 2,191,532 |
| | $ | 212,898 |
| | $ | 2,404,430 |
|
| Interest expense | 128,798 |
| | 140 |
| | 43 |
| | 128,981 |
| $ | 134,643 |
| | $ | 425 |
| | $ | 135,068 |
|
| Depreciation and amortization | 100,380 |
| | 10,273 |
| | 449 |
| | 111,102 |
| $ | 108,411 |
| | $ | 11,451 |
| | $ | 119,862 |
|
| Amortization of intangible assets | 19,969 |
| | 1,729 |
| | — |
| | 21,698 |
| $ | 22,433 |
| | $ | 1,420 |
| | $ | 23,853 |
|
| Amortization of cemetery property | 27,545 |
| | 3,119 |
| | — |
| | 30,664 |
| $ | 39,803 |
| | $ | 5,173 |
| | $ | 44,976 |
|
| Operating income | 288,108 |
| | 35,462 |
| | 317 |
| | 323,887 |
| $ | 346,289 |
| | $ | 53,081 |
| | $ | 399,370 |
|
| (Losses) gains on divestitures and impairment charges, net | 8,906 |
| | (4,614 | ) | | (39 | ) | | 4,253 |
| |
| Losses on divestitures and impairment charges, net | | $ | (1,502 | ) | | $ | (9 | ) | | $ | (1,511 | ) |
| Long-lived assets | 4,526,789 |
| | 354,677 |
| | 4,022 |
| | 4,885,488 |
| $ | 4,484,911 |
| | $ | 359,882 |
| | $ | 4,844,793 |
|
SERVICE CORPORATION INTERNATIONAL
NOTES TO CONSOLIDATED FINANCIAL STATEMENTS — (Continued)
| |
| 17. | Supplementary Information |
The detail of certain balance sheet accounts is as follows:
| | | | December 31, | December 31, |
| | 2011 | | 2010 | 2014 | | 2013 |
| | (In thousands) | (In thousands) |
| Cash and cash equivalents: | |
| | |
| |
| | |
|
| Cash | $ | 67,937 |
| | $ | 78,382 |
| $ | 132,743 |
| | $ | 101,952 |
|
| Commercial paper and temporary investments | 60,632 |
| | 92,464 |
| 44,592 |
| | 39,632 |
|
| | $ | 128,569 |
| | $ | 170,846 |
| $ | 177,335 |
| | $ | 141,584 |
|
| Receivables, net: | |
| | |
| |
| | |
|
| Notes receivable | $ | 1,313 |
| | $ | 1,395 |
| $ | 8,381 |
| | $ | 1,140 |
|
| Atneed funeral receivables, net of allowances of $7,755 and $10,852, respectively | 77,103 |
| | 85,853 |
| |
| Atneed cemetery receivables, net of allowances of $1,989 and $3,121, respectively | 12,837 |
| | 10,235 |
| |
| Atneed funeral receivables, net of allowances of $6,200 and $8,895, respectively | | 61,306 |
| | 66,671 |
|
| Atneed cemetery receivables, net of allowances of $2,346 and $2,742, respectively | | 14,842 |
| | 13,841 |
|
| Other | 12,639 |
| | 9,702 |
| 24,521 |
| | 19,772 |
|
| | $ | 103,892 |
| | $ | 107,185 |
| $ | 109,050 |
| | $ | 101,424 |
|
| Other current assets: | |
| | |
| |
| | |
|
| Income tax receivable | $ | 8,670 |
| | $ | 14,499 |
| $ | 22,581 |
| | $ | 2,933 |
|
| Prepaid insurance | 4,221 |
| | 4,182 |
| 5,270 |
| | 8,583 |
|
| Restricted cash | 4,138 |
| | 3,650 |
| 28,926 |
| | 6,550 |
|
| Bond conversion asset | | — |
| | 21,682 |
|
| Deferred debt issuance costs | | 9,180 |
| | 9,082 |
|
| Other | 8,774 |
| | 5,415 |
| 13,644 |
| | 14,916 |
|
| | $ | 25,803 |
| | $ | 27,746 |
| $ | 79,601 |
| | $ | 63,746 |
|
| Cemetery property: | |
| | |
| |
| | |
|
| Undeveloped land | $ | 1,072,170 |
| | $ | 1,083,290 |
| $ | 1,186,325 |
| | $ | 1,192,613 |
|
| Developed land, lawn crypts, and mausoleums | 425,533 |
| | 425,497 |
| |
| Developed lots, lawn crypts, mausoleum spaces, cremation niches, and cremation memorialization property | | 552,891 |
| | 559,656 |
|
| | $ | 1,497,703 |
| | $ | 1,508,787 |
| $ | 1,739,216 |
| | $ | 1,752,269 |
|
| Property and equipment: | |
| | |
| |
| | |
|
| Land | $ | 515,100 |
| | $ | 509,100 |
| $ | 603,509 |
| | $ | 610,339 |
|
| Buildings and improvements | 1,526,290 |
| | 1,496,310 |
| 1,783,171 |
| | 1,779,584 |
|
| Operating equipment | 456,852 |
| | 427,607 |
| 500,511 |
| | 500,721 |
|
| Leasehold improvements | 24,717 |
| | 23,302 |
| 50,862 |
| | 25,642 |
|
| Capital leases | 168,538 |
| | 156,235 |
| 204,991 |
| | 185,875 |
|
| | 2,691,497 |
| | 2,612,554 |
| 3,143,044 |
| | 3,102,161 |
|
| Less: Accumulated depreciation | (976,823 | ) | | (891,846 | ) | (1,163,921 | ) | | (1,083,151 | ) |
| Accumulated amortization of capital leases | (96,313 | ) | | (93,010 | ) | |
| Less: Accumulated amortization of capital leases | | (117,720 | ) | | (106,496 | ) |
| | $ | 1,618,361 |
| | $ | 1,627,698 |
| $ | 1,861,403 |
| | $ | 1,912,514 |
|
| Deferred charges and other assets: | |
| | |
| |
| | |
|
| Intangible assets, net | 253,251 |
| | 219,489 |
| 393,781 |
| | 398,618 |
|
| Restricted cash | 6,903 |
| | 14,755 |
| 16,073 |
| | 2,409 |
|
| Non-current deferred tax assets | 6,932 |
| | — |
| 18,778 |
| | 22,249 |
|
| Notes receivable, net of allowances of $1,665 and $3,111, respectively | 11,488 |
| | 11,781 |
| |
| Notes receivable, net of allowances of $11,259 and $10,986, respectively | | 4,858 |
| | 11,651 |
|
| Cash surrender value of insurance policies | 77,791 |
| | 72,420 |
| 102,856 |
| | 90,177 |
|
| Other | 74,486 |
| | 78,137 |
| 81,200 |
| | 107,896 |
|
| | $ | 430,851 |
| | $ | 396,582 |
| $ | 617,546 |
| | $ | 633,000 |
|
SERVICE CORPORATION INTERNATIONAL
NOTES TO CONSOLIDATED FINANCIAL STATEMENTS — (Continued)
| | | | December 31, | December 31, |
| | 2011 | | 2010 | 2014 | | 2013 |
| | (In thousands) | (In thousands) |
| Accounts payable and accrued liabilities: | |
| | |
| |
| | |
|
| Accounts payable | $ | 115,302 |
| | $ | 116,543 |
| $ | 137,270 |
| | $ | 143,686 |
|
| Accrued compensation | 82,145 |
| | 69,988 |
| 86,880 |
| | 104,464 |
|
| Accrued dividend | 11,027 |
| | 9,602 |
| |
| Accrued interest | 22,555 |
| | 22,923 |
| 30,133 |
| | 36,583 |
|
| Accrued property taxes | 13,057 |
| | 13,726 |
| 14,346 |
| | 14,395 |
|
| Self insurance reserves | 52,697 |
| | 53,892 |
| 73,991 |
| | 77,962 |
|
| Bank overdraft | 15,309 |
| | 15,582 |
| 27,798 |
| | 5,152 |
|
| Bond conversion liability | | — |
| | 18,744 |
|
| Other accrued liabilities | 46,812 |
| | 40,395 |
| 82,610 |
| | 81,853 |
|
| | $ | 358,904 |
| | $ | 342,651 |
| $ | 453,028 |
| | $ | 482,839 |
|
| Other liabilities: | |
| | |
| |
| | |
|
| Accrued pension | $ | 29,214 |
| | $ | 31,377 |
| $ | 35,614 |
| | $ | 35,629 |
|
| Deferred compensation | 49,711 |
| | 42,246 |
| 80,580 |
| | 65,605 |
|
| Customer refund obligation reserve | 76,270 |
| | 75,517 |
| 60,019 |
| | 59,826 |
|
| Tax liability | 207,701 |
| | 201,183 |
| 239,265 |
| | 222,365 |
|
| Indemnification liability | 2,490 |
| | 2,689 |
| 236 |
| | 442 |
|
| Payable to perpetual care fund | | 64,722 |
| | 56,501 |
|
| Other | 49,387 |
| | 46,608 |
| 15,129 |
| | 50,870 |
|
| | $ | 414,773 |
| | $ | 399,620 |
| $ | 495,565 |
| | $ | 491,238 |
|
SERVICE CORPORATION INTERNATIONAL
NOTES TO CONSOLIDATED FINANCIAL STATEMENTS — (Continued)
Revenues and Costs and Expenses
The detail of certain income statement accounts is as follows for the years ended December 31:
| | | | 2011 | | 2010 | | 2009 | 2014 | | 2013 | | 2012 |
| | (In thousands) | (In thousands) |
| Merchandise revenues: | |
| | |
| | |
| |
| | |
| | |
|
| Funeral | $ | 514,548 |
| | $ | 489,744 |
| | $ | 450,892 |
| $ | 616,992 |
| | $ | 584,438 |
| | $ | 552,308 |
|
| Cemetery | 516,677 |
| | 481,508 |
| | 446,035 |
| 743,765 |
| | 609,142 |
| | 554,516 |
|
| Total merchandise revenues | 1,031,225 |
| | 971,252 |
| | 896,927 |
| 1,360,757 |
| | 1,193,580 |
| | 1,106,824 |
|
| Services revenues: | |
| | |
| | |
| |
| | |
| | |
|
| Funeral | 968,747 |
| | 930,163 |
| | 882,186 |
| 1,167,386 |
| | 989,613 |
| | 965,226 |
|
| Cemetery | 195,376 |
| | 186,236 |
| | 183,288 |
| 295,195 |
| | 212,932 |
| | 203,113 |
|
| Total services revenues | 1,164,123 |
| | 1,116,399 |
| | 1,065,474 |
| 1,462,581 |
| | 1,202,545 |
| | 1,168,339 |
|
| Other revenues | 120,692 |
| | 102,901 |
| | 91,119 |
| 170,674 |
| | 154,341 |
| | 129,267 |
|
| Total revenues | $ | 2,316,040 |
| | $ | 2,190,552 |
| | $ | 2,053,520 |
| $ | 2,994,012 |
| | $ | 2,550,466 |
| | $ | 2,404,430 |
|
| Merchandise costs and expenses: | |
| | |
| | |
| |
| | |
| | |
|
| Funeral | $ | 258,173 |
| | $ | 247,104 |
| | $ | 226,931 |
| $ | 294,237 |
| | $ | 266,538 |
| | $ | 258,860 |
|
| Cemetery | 222,406 |
| | 204,665 |
| | 191,489 |
| 317,690 |
| | 254,065 |
| | 234,031 |
|
| Total cost of merchandise | 480,579 |
| | 451,769 |
| | 418,420 |
| 611,927 |
| | 520,603 |
| | 492,891 |
|
| Services costs and expenses: | |
| | |
| | |
| |
| | |
| | |
|
| Funeral | 496,557 |
| | 453,678 |
| | 419,855 |
| 635,096 |
| | 548,554 |
| | 520,243 |
|
| Cemetery | 97,702 |
| | 94,776 |
| | 98,923 |
| 140,402 |
| | 100,865 |
| | 98,809 |
|
| Total cost of services | 594,259 |
| | 548,454 |
| | 518,778 |
| 775,498 |
| | 649,419 |
| | 619,052 |
|
| Overhead and other expenses | 762,666 |
| | 741,106 |
| | 694,927 |
| 930,774 |
| | 831,397 |
| | 769,715 |
|
| Total cost and expenses | $ | 1,837,504 |
| | $ | 1,741,329 |
| | $ | 1,632,125 |
| $ | 2,318,199 |
| | $ | 2,001,419 |
| | $ | 1,881,658 |
|
Certain Non-Cash Financing and Investing Transactions
|
| | | | | | | | | | | |
| | Years Ended December 31, |
| | 2011 | | 2010 | | 2009 |
| | (In thousands) |
| Dividends accrued but not paid | $ | 11,027 |
| | $ | 9,602 |
| | $ | 10,161 |
|
| Financing held in escrow | $ | — |
| | $ | — |
| | $ | 147,173 |
|
|
| | | | | | | | | | | |
| | Years Ended December 31, |
| | 2014 | | 2013 | | 2012 |
| | (In thousands) |
| Options exercised by attestation | $ | 761 |
| | $ | 3,004 |
| | $ | — |
|
| Shares repurchased | (761 | ) | | $ | (3,004 | ) | | $ | — |
|
Basic earnings per common share (EPS) excludes dilution and is computed by dividing Net income attributable to common stockholders by the weighted average number of common shares outstanding for the period. Diluted EPS reflects the potential dilution that could occur if securities or other obligations to issue common stock were exercised or converted into common stock or resulted in the issuance of common stock that shared in our earnings.
A reconciliation of the numerators and denominators of the basic and diluted EPS for the three years ended December 31 is presented below:
SERVICE CORPORATION INTERNATIONAL
NOTES TO CONSOLIDATED FINANCIAL STATEMENTS — (Continued)
| | | | 2011 | | 2010 | | 2009 | 2014 | | 2013 | | 2012 |
| | (In thousands, except per share amounts) | (In thousands, except per share amounts) |
| Amounts attributable to common stockholders: | |
| | |
| | |
| |
| | |
| | |
|
| Net income: | |
| | |
| | |
| |
| Income from continuing operations — basic | | $ | 170,283 |
| | $ | 146,926 |
| | $ | 153,583 |
|
| After tax interest on convertible debt | | 51 |
| | 51 |
| | 51 |
|
| Income from continuing operations — diluted | | $ | 170,334 |
| | $ | 146,977 |
| | $ | 153,634 |
|
| Income from discontinued operations, net of tax | | $ | 2,186 |
| | $ | 406 |
| | $ | 262 |
|
| Net income — basic | $ | 144,903 |
| | $ | 126,417 |
| | $ | 123,098 |
| $ | 172,469 |
| | $ | 147,332 |
| | $ | 153,845 |
|
| After tax interest on convertible debt | 51 |
| | 51 |
| | 51 |
| 51 |
| | 51 |
| | 51 |
|
| Net income — diluted | $ | 144,954 |
| | $ | 126,468 |
| | $ | 123,149 |
| $ | 172,520 |
| | $ | 147,383 |
| | $ | 153,896 |
|
| Weighted average shares: | |
| | |
| | |
| |
| | |
| | |
|
| Weighted average shares — basic | 234,242 |
| | 248,871 |
| | 251,709 |
| 210,741 |
| | 211,811 |
| | 215,712 |
|
| Stock options | 2,306 |
| | 1,610 |
| | 654 |
| 3,338 |
| | 4,082 |
| | 3,233 |
|
| Convertible debt | 121 |
| | 121 |
| | 121 |
| 121 |
| | 121 |
| | 121 |
|
| Weighted average shares — diluted | 236,669 |
| | 250,602 |
| | 252,484 |
| 214,200 |
| | 216,014 |
| | 219,066 |
|
| Amounts attributable to common stockholders: | | | | | | |
| Income from continuing operations per share: | | | | | | |
| Basic | | $ | 0.81 |
| | $ | 0.70 |
| | $ | 0.71 |
|
| Diluted | | $ | 0.80 |
| | $ | 0.68 |
| | $ | 0.70 |
|
| Income from discontinued operations per share: | | | | | | |
| Basic | | $ | 0.01 |
| | $ | — |
| | $ | — |
|
| Diluted | | $ | 0.01 |
| | $ | — |
| | $ | — |
|
| Net income per share: | |
| | |
| | |
| |
| | |
| | |
|
| Basic | $ | 0.62 |
| | $ | 0.51 |
| | $ | 0.49 |
| $ | 0.82 |
| | $ | 0.70 |
| | $ | 0.71 |
|
| Diluted | $ | 0.61 |
| | $ | 0.50 |
| | $ | 0.49 |
| $ | 0.81 |
| | $ | 0.68 |
| | $ | 0.70 |
|
The computation of diluted earnings per share excludes outstanding stock options and convertible debt in certain periods in which the inclusion of such options and debt would be antidilutive to the periods presented. Total options not currently included in the computation of diluted EPS in shares are 4.91.5 million,, 4.8 1.2 million,, and 6.21.3 million for the years ended December 31, 2011, 2010,2014, 2013, and 2009,2012, respectively.
We adopted the FASB’s recent authoritative guidance on determining whether instruments granted in share-based payment transactions are participating securities, effective January 1, 2009. Our adoption had an immaterial impact on our reported EPS as reflected in these consolidated financial statements.
In March 2010,Stewart
On December 23, 2013, pursuant to a tender offer, we acquired Keystone North America,Stewart Enterprises, Inc. (Keystone)(Stewart) for C$8.07$13.25 per share in cash, resulting in a purchase price of $288.9 million,$1.5 billion, which includes the refinancingassumption of $80.7$331.5 million of Keystone’sStewart’s debt.
We incurred acquisition costs of $7.1$39.7 million of which $3.7$28.4 million is included in General and Administrative Expensesadministrative expenses and $11.3 million is included in Interest expense for the year ended December 31, 2010, respectively, and the remainder was incurred in prior periods.2013.
The primary reasons for the merger and the principal factors that contributed to the recognition of goodwill in this acquisition were:
the acquisition of KeystoneStewart enhances our network footprint, enabling us to serve a number of new, complementary areas;
combining the two companies’ operations provides synergies and related cost savings through the elimination of duplicate home office functions and economies of scale; and
the acquisition of Keystone’sStewart’s preneed backlog of deferred revenues enhances our long-term stability.
The following table summarizes the adjusted fair values of the assets acquired and liabilities assumed as of March 26, 2010, for various purchase price allocation adjustments made subsequent to our first quarter results:
SERVICE CORPORATION INTERNATIONAL
NOTES TO CONSOLIDATED FINANCIAL STATEMENTS — (Continued)
| | | | (In thousands) | (In thousands) |
| Accounts receivable | $ | 6,131 |
| $ | 11,119 |
|
| Other current assets | 20,200 |
| 190,518 |
|
| Cemetery property | 19,949 |
| 287,449 |
|
| Property and equipment, net | 105,888 |
| 330,125 |
|
| Preneed funeral and cemetery receivables and trust investments | 66,395 |
| 645,440 |
|
| Finite-lived intangible assets | 34,312 |
| 75,444 |
|
| Indefinite-lived intangible assets | 33,700 |
| 79,400 |
|
| Acquired assets held for sale | | 520,023 |
|
| Deferred charges and other assets | 6,533 |
| 278,631 |
|
| Goodwill | 108,643 |
| 573,808 |
|
| Total assets acquired | 401,751 |
| 2,991,957 |
|
| Current liabilities | 11,719 |
| 219,373 |
|
| Long-term debt | 2,548 |
| 270,668 |
|
| Deferred preneed funeral and cemetery revenues and deferred receipts held in trusts | 69,336 |
| 740,441 |
|
| Deferred tax liability | 20,939 |
| |
| Assumed liabilities held for sale | | 242,835 |
|
| Deferred income taxes | | 58,493 |
|
| Other liabilities | 8,347 |
| 294,674 |
|
| Total liabilities assumed | 112,889 |
| 1,826,484 |
|
| Noncontrolling interest | | 118 |
|
| Net assets acquired | $ | 288,862 |
| $ | 1,165,355 |
|
The gross amount of accounts receivable is $8.2$14.0 million,, of which $2.1$2.9 million is not expected to be collected. Included in Preneedpreneed funeral and cemetery receivables and trust investments are receivables under preneed contracts with a fair value of $5.2 million.$140.0 million. The gross amount due under the contracts is $5.5$170.3 million,, of which $0.3$30.3 million is not expected to be collected.
We have finalizedcompleted our assessmentpurchase price allocation. During the twelve months of 2014, we made the following adjustments to our estimates of the fair values. value of assets and liabilities and revised the consolidated balance sheet as of December 31, 2013 included in this filing to reflect these adjustments:
|
| | | |
| | (In thousands) |
| Decrease in the fair value of accounts receivable and other current assets | $ | (10,900 | ) |
| Increase in the fair value of cemetery property | 2,674 |
|
| Decrease in property and equipment, net | (10,331 | ) |
| Decrease in the fair value of preneed funeral and cemetery receivables and trust investments | (9,570 | ) |
| Decrease in the fair value of finite-lived intangible assets | (30,834 | ) |
| Increase in the fair value of acquired assets held for sale | 85,775 |
|
| Increase in the fair value of deferred charges and other assets | 311 |
|
| Decrease in the fair value of deferred preneed funeral and cemetery revenues and deferred receipts held in trust | 42,417 |
|
| Change in the fair value of acquired assets and liabilities held for sale | (89,198 | ) |
| Decrease in the fair value of deferred income taxes | 41,676 |
|
| Other | (17,250 | ) |
| Total adjustment to goodwill | $ | 4,770 |
|
Goodwill, land, and certain identifiable intangible assets recorded in the acquisition are not subject to amortization; however, the goodwill and intangible assets will be tested periodically for impairment as required by the Intangible Assets Topic of the ASC.impairment. Of the $108.6$573.8 million in goodwill recognized, $4.3$258.2 million was allocated to our cemetery segment and $104.3$315.6 million was allocated to our funeral segment. As a result of the carryover
of Keystone’sStewart’s tax basis, $26.0$3.0 million of this goodwill is deductible for tax purposes. The identified intangible assets are comprised ofcomprise the following:
| | | | Useful life | | | Useful life | | |
| | Minimum | | Maximum | | Fair Value | Minimum | | Maximum | | Fair Value |
| | (Years) | | (In thousands) | (Years) | | (In thousands) |
| Preneed customer relationships related to insurance claims | 10 | | 10 | | $ | 15,200 |
| 10 | | 20 | | $ | 28,500 |
|
| Other preneed customer relationships | 10 |
| 14 | | 1,740 |
| 10 | | 14 | | 20,502 |
|
| Selling and management agreements | | 10 | | 40 | | 5,900 |
|
| Covenants-not-to-compete | 5 |
| 15 | | 13,332 |
| 5 | | 15 | | 5,480 |
|
| Operating leases | 5 |
| 15 | | 440 |
| 26 | | 34 | | 5,912 |
|
| Tradenames | 5 | | 5 | | 3,600 |
| 5 | | 5 | | 9,150 |
|
| Tradenames | | Indefinite | | 33,200 |
| | Indefinite | | 77,900 |
|
| Licenses and permits | | Indefinite | | 500 |
| | Indefinite | | 1,500 |
|
| Total intangible assets |
| | $ | 68,012 |
| | $ | 154,844 |
|
Included in our results of operations for the twelve months ended December 31, 20102013 is revenue of $83.7$11.4 million and net income of $16.7$0.8 million for the period from the acquisition date (March 26, 2010)(December 23, 2013) through December 31, 2010.2013. The following unaudited pro forma summary presents financial information as if the acquisition had occurred at the beginning of the year presented for the consolidated company:on January 1, 2012:
| | | | | | | 2013 | | 2012 |
| | | 2010 | (In thousands) |
| | | (In thousands) | (unaudited) |
| Revenue | | $ | 2,220,204 |
| $ | 2,919,278 |
| | $ | 2,848,451 |
|
| Net income | | $ | 129,970 |
| $ | 203,916 |
| | $ | 135,010 |
|
Neptune
SERVICE CORPORATION INTERNATIONAL
NOTES TO CONSOLIDATED FINANCIAL STATEMENTS — (Continued)
The CompanyDuring 2013, we acquired 70%an additional 20% of the outstanding shares of The Neptune Society Inc.Inc (Neptune) on June 3, 2011 for $44 millionincreasing our ownership from 70% to 90%. During 2014 we acquired the remaining 10% of the outstanding shares. Neptune is the nation's largest direct cremation organization with a network of 30 locations in nine states.states at the time of our original acquisition. Neptune operates under the brand names Neptune Society, NeptuneNational Cremation Service, and Trident Society. With this acquisition we will be expanding theexpanded our footprint into a sector of the market that will continue to grow and that we dowas not currently targettargeted through our traditional funeral service and cemetery network. We have not completed our evaluation of purchase price allocation as we are still reviewing the underlying accounting records.allocation. As a result of this acquisition, we recognized $37.6$37.6 million of intangible assets and $37.3$37.3 million of goodwill.
| |
| 20. | Divestiture-Related Activities |
As divestitures occur in the normal course of business, gains or losses on the sale of such locations are recognized in the income statement line item (Losses) gainsGains (losses) on divestitures and impairment charges, net.net, Additionally, as divestitures occur pursuant to our ongoing asset sale programs, adjustments are made through this income statement line item to reflect the difference between actual proceeds received from the sale compared to the original estimates.
(Losses) gains on divestitures and impairment charges, netwhich consist of the following for the years ended December 31:
| | | | 2011 | | 2010 | | 2009 | 2014 | | 2013 | | 2012 |
| | (In thousands) | (In thousands) |
| (Losses) gains on divestitures, net | $ | (8,526 | ) | | $ | 16,547 |
| | $ | 20,787 |
| |
| Gains (losses) on divestitures, net | | $ | 122,535 |
| | $ | (3,350 | ) | | $ | 639 |
|
| Impairment losses | (2,451 | ) | | (8,035 | ) | | (16,534 | ) | (5,922 | ) | | (2,913 | ) | | (2,150 | ) |
| | $ | (10,977 | ) | | $ | 8,512 |
| | $ | 4,253 |
| $ | 116,613 |
| | $ | (6,263 | ) | | $ | (1,511 | ) |
KeystoneAssets Held for Sale
We have identified certain properties that we intended to sell as they do not meet our strategic goals and have classified them as held for sale in our December 31, 2014 consolidated balance sheet. In conjunctionconnection with this revised classification, we have recorded an impairment loss of approximately $3.0 million in our consolidated statement of operations for the year ended December 31, 2014.
Additionally, in connection with the acquisition of Keystone,Stewart, we entered into an agreementagreed to a consent order with the staff of the Federal Trade Commission (FTC) that identifies certain properties the FTC required us to sell 22 funeral homes and five cemeteries, which were sold for $34.9 million indivest as a result of the second quarter of 2010. We recognized a gain on divestitures of $6.2 million associated with the former SCI properties.acquisition. The consent order
has been approved by the FTC commissioners. As a result, these properties were classified as assets held for sale in our December 31, 2013 consolidated balance sheet.
Net assets held for sale at December 31, were as follows:
|
| | | | | | |
| | 2014 | 2013 |
| | (In thousands) |
| Current assets | $ | 45 |
| $ | 4,569 |
|
| Preneed funeral and cemetery receivables and trust investments | 5,048 |
| 356,064 |
|
| Cemetery property | 165 |
| 89,060 |
|
| Property and equipment, net | 43 |
| 71,618 |
|
| Goodwill | 88 |
| 190,976 |
|
| Deferred charges and other assets | 74 |
| 27,440 |
|
| Cemetery perpetual care trust investments | 1,284 |
| 88,169 |
|
| Total assets | $ | 6,747 |
| $ | 827,896 |
|
| Accounts payable and accrued liabilities | 14 |
| 4,390 |
|
| Deferred preneed funeral and cemetery revenues and deferred receipts held in trusts | 5,677 |
| 424,780 |
|
| Care trusts' corpus | 1,284 |
| 88,262 |
|
| Other long term liabilities | 27 |
| 4,209 |
|
| Total liabilities | 7,002 |
| 521,641 |
|
| Net assets held for sale | $ | (255 | ) | $ | 306,255 |
|
Discontinued Operations
During the twelve months ended December 31, 2014 we sold our operations in Germany for approximately $6.9 million and are presenting the assets and results of operations as discontinued operations. Assets of discontinued operations at December 31, 2013 were as follows: |
| | | |
| | December 31, |
| | 2013 |
| | (in thousands) |
| Current assets | $ | 4,750 |
|
| Property and equipment, net | 116 |
|
| Deferred charges and other assets | 2,375 |
|
| Total assets | $ | 7,241 |
|
| Accounts payable and accrued liabilities | 4,728 |
|
| Deferred preneed funeral revenues | 938 |
|
| Other long term liabilities | 30 |
|
| Total liabilities | 5,696 |
|
| Net assets of discontinued operations | $ | 1,545 |
|
The results of our discontinued operations for the twelve months ended December 31, 2014, 2013, and 2012 were as follows:
|
| | | | | | | | | | | |
| | Twelve Months Ended |
| | December 31, |
| | 2014 | | 2013 | | 2012 |
| | (In thousands) |
| Revenues | $ | 1,613 |
| | $ | 5,907 |
| | $ | 6,051 |
|
| Costs and expenses | (1,471 | ) | | (5,393 | ) | | (5,609 | ) |
| Gain on disposition | 2,136 |
| | — |
| | — |
|
| Other expense, net | (2 | ) | | (1 | ) | | (42 | ) |
| Income from discontinued operations before income taxes | 2,276 |
| | 513 |
| | 400 |
|
| Provision for income taxes | (90 | ) | | (107 | ) | | (138 | ) |
| Net income from discontinued operations | $ | 2,186 |
| | $ | 406 |
| | $ | 262 |
|
21. Quarterly Financial Data (Unaudited)
Quarterly financial data for 20112014 and 20102013 is as follows:
| | | | First Quarter | | Second Quarter | | Third Quarter | | Fourth Quarter | First Quarter | | Second Quarter | | Third Quarter | | Fourth Quarter |
| | (In thousands, except per share amounts) | (In thousands, except per share amounts) |
| 2011 | |
| | |
| | |
| | |
| |
| 2014 | | |
| | |
| | |
| | |
|
| Revenues | $ | 579,699 |
| | $ | 576,774 |
| | $ | 572,999 |
| | $ | 586,568 |
| $ | 745,509 |
| | $ | 746,746 |
| | $ | 718,314 |
| | $ | 783,443 |
|
| Costs and expenses | (453,253 | ) | | (461,751 | ) | | (465,949 | ) | | (456,551 | ) | $ | (579,269 | ) | | $ | (590,882 | ) | | $ | (570,016 | ) | | $ | (578,032 | ) |
| Gross profits | 126,446 |
| | 115,023 |
| | 107,050 |
| | 130,017 |
| $ | 166,240 |
| | $ | 155,864 |
| | $ | 148,298 |
| | $ | 205,411 |
|
| Operating income | 97,193 |
| | 80,495 |
| | 78,186 |
| | 107,825 |
| $ | 107,418 |
| | $ | 144,731 |
| | $ | 135,120 |
| | $ | 220,280 |
|
| Income from continuing operations before income taxes (1) | 63,994 |
| | 44,827 |
| | 44,042 |
| | 72,773 |
| $ | 63,958 |
| | $ | 69,316 |
| | $ | 91,735 |
| | $ | 177,591 |
|
| Provision for income taxes | (24,065 | ) | | (18,089 | ) | | (9,027 | ) | | (28,223 | ) | $ | (22,707 | ) | | $ | (37,357 | ) | | $ | (74,934 | ) | | $ | (90,982 | ) |
| Net income | 39,929 |
| | 26,738 |
| | 35,015 |
| | 44,550 |
| $ | 41,391 |
| | $ | 31,781 |
| | $ | 17,685 |
| | $ | 87,949 |
|
| Net (income) loss attributable to noncontrolling interests | (1,165 | ) | | (645 | ) | | 481 |
| | — |
| |
| Net income attributable to noncontrolling interests | | $ | (289 | ) | | $ | (5,859 | ) | | $ | (34 | ) | | $ | (155 | ) |
| Net income attributable to common stockholders | 38,764 |
| | 26,093 |
| | 35,496 |
| | 44,550 |
| $ | 41,102 |
| | $ | 25,922 |
| | $ | 17,651 |
| | $ | 87,794 |
|
| Net income attributable to common stockholders per share (2): | |
| | |
| | |
| | |
| |
Net income attributable to common stockholders per share(2): | | |
| | |
| | |
| | |
|
| Basic — EPS | 0.16 |
| | 0.11 |
| | 0.15 |
| | 0.20 |
| $ | 0.19 |
| | $ | 0.12 |
| | $ | 0.08 |
| | $ | 0.42 |
|
| Diluted — EPS | 0.16 |
| | 0.11 |
| | 0.15 |
| | 0.20 |
| $ | 0.19 |
| | $ | 0.12 |
| | $ | 0.08 |
| | $ | 0.42 |
|
| 2010 | |
| | |
| | |
| | |
| |
2013(3) | | |
| | |
| | |
| | |
|
| Revenues | $ | 530,863 |
| | $ | 555,273 |
| | $ | 533,165 |
| | $ | 571,251 |
| $ | 650,418 |
| | $ | 624,231 |
| | $ | 608,589 |
| | $ | 667,228 |
|
| Costs and expenses | (418,505 | ) | | (445,975 | ) | | (430,518 | ) | | (446,331 | ) | $ | (491,092 | ) | | $ | (498,248 | ) | | $ | (492,784 | ) | | $ | (519,296 | ) |
| Gross profits | 112,358 |
| | 109,298 |
| | 102,647 |
| | 124,920 |
| $ | 159,326 |
| | $ | 125,983 |
| | $ | 115,805 |
| | $ | 147,932 |
|
| Operating income | 85,626 |
| | 95,926 |
| | 68,496 |
| | 103,998 |
| $ | 127,434 |
| | $ | 89,059 |
| | $ | 83,046 |
| | $ | 88,117 |
|
| Income from continuing operations before income taxes (1) | 51,441 |
| | 67,425 |
| | 28,621 |
| | 71,972 |
| $ | 93,680 |
| | $ | 56,092 |
| | $ | 45,633 |
| | $ | 49,801 |
|
| Provision for income taxes | (20,116 | ) | | (27,198 | ) | | (9,941 | ) | | (35,203 | ) | $ | (35,290 | ) | | $ | (21,598 | ) | | $ | (18,407 | ) | | $ | (17,729 | ) |
| Net income | 31,325 |
| | 40,227 |
| | 18,680 |
| | 36,769 |
| $ | 58,722 |
| | $ | 34,435 |
| | $ | 27,394 |
| | $ | 32,037 |
|
| Net (income) loss attributable to noncontrolling interests | (413 | ) | | 58 |
| | 85 |
| | (314 | ) | |
| Net income attributable to noncontrolling interests | | $ | (1,102 | ) | | $ | (820 | ) | | $ | (615 | ) | | $ | (2,719 | ) |
| Net income attributable to common stockholders | 30,912 |
| | 40,285 |
| | 18,765 |
| | 36,455 |
| $ | 57,620 |
| | $ | 33,615 |
| | $ | 26,779 |
| | $ | 29,318 |
|
| Net income attributable to common stockholders per share (2): | |
| | |
| | |
| | |
| |
Net income attributable to common stockholders per share(2): | | |
| | |
| | |
| | |
|
| Basic — EPS | 0.12 |
| | 0.16 |
| | 0.08 |
| | 0.15 |
| $ | 0.27 |
| | $ | 0.16 |
| | $ | 0.13 |
| | $ | 0.14 |
|
| Diluted — EPS | 0.12 |
| | 0.16 |
| | 0.08 |
| | 0.15 |
| $ | 0.27 |
| | $ | 0.16 |
| | $ | 0.12 |
| | $ | 0.14 |
|
| |
| (1) | Includes (losses)(Losses) gains on divestitures and impairment charges, net, as described in Note 20. |
| |
| (2) | Net income per share is computed independently for each of the quarters presented. Therefore, the sum of the quarters’ net income per share may not equal the total computed for the year. |
| |
| (3) | See Note 2 for details related to the revision which was recorded for the quarter ended December 31, 2013. The revision reduced the provision for income taxes and increased net income attributable to common stockholders by $3.5 million and increased basic and diluted EPS by $0.02. |
SERVICE CORPORATION INTERNATIONAL SCHEDULE II — VALUATION AND QUALIFYING ACCOUNTS Three Years Ended December 31, 2011
|
| | | | | | | | | | | | | | | | | | | | |
| Description | | Balance at Beginning of Period | | Charged (Credited) to Costs and Expenses | | Charged (Credited) to Other Accounts(1) | | Write-Offs(2) | | Balance at End of Period |
| | | (In thousands) |
| Current provision: | | |
| | |
| | |
| | |
| | |
|
| Allowance for doubtful accounts: | | |
| | |
| | |
| | |
| | |
|
| Year Ended December 31, 2011 | | $ | 13,973 |
| | $ | 9,254 |
| | $ | 25,813 |
| | $ | (39,296 | ) | | $ | 9,744 |
|
| Year Ended December 31, 2010 | | $ | 14,171 |
| | $ | 8,153 |
| | $ | 17,926 |
| | $ | (26,277 | ) | | $ | 13,973 |
|
| Year Ended December 31, 2009 | | $ | 19,735 |
| | $ | 11,346 |
| | $ | 56 |
| | $ | (16,966 | ) | | $ | 14,171 |
|
| Due After One Year: | | |
| | |
| | |
| | |
| | |
|
| Allowance for doubtful accounts: | | |
| | |
| | |
| | |
| | |
|
| Year Ended December 31, 2011 | | $ | 3,111 |
| | $ | — |
| | $ | — |
| | $ | (1,446 | ) | | $ | 1,665 |
|
| Year Ended December 31, 2010 | | $ | 3,135 |
| | $ | — |
| | $ | — |
| | $ | (24 | ) | | $ | 3,111 |
|
| Year Ended December 31, 2009 | | $ | 2,775 |
| | $ | — |
| | $ | 720 |
| | $ | (360 | ) | | $ | 3,135 |
|
| Preneed Funeral and Preneed Cemetery | | |
| | |
| | |
| | |
| | |
|
| Asset allowance for cancellation: | | |
| | |
| | |
| | |
| | |
|
| Year Ended December 31, 2011 | | $ | 77,792 |
| | $ | 2,852 |
| | $ | (2,652 | ) | | $ | — |
| | $ | 77,992 |
|
| Year Ended December 31, 2010 | | $ | 71,202 |
| | $ | 3,204 |
| | $ | 3,386 |
| | $ | — |
| | $ | 77,792 |
|
| Year Ended December 31, 2009 | | $ | 58,618 |
| | $ | 3,249 |
| | $ | 9,335 |
| | $ | — |
| | $ | 71,202 |
|
| Deferred Preneed Funeral and Cemetery | | |
| | |
| | |
| | |
| | |
|
| Revenue allowance for cancellation: | | |
| | |
| | |
| | |
| | |
|
| Year Ended December 31, 2011 | | $ | (134,760 | ) | | $ | — |
| | $ | (1,244 | ) | | $ | — |
| | $ | (136,004 | ) |
| Year Ended December 31, 2010 | | $ | (130,897 | ) | | $ | — |
| | $ | (3,863 | ) | | $ | — |
| | $ | (134,760 | ) |
| Year Ended December 31, 2009 | | $ | (137,769 | ) | | $ | — |
| | $ | 6,872 |
| | $ | — |
| | $ | (130,897 | ) |
| Deferred tax valuation allowance: | | |
| | |
| | |
| | |
| | |
|
| Year Ended December 31, 2011 | | $ | 63,614 |
| | $ | 67 |
| | $ | — |
| | $ | — |
| | $ | 63,681 |
|
| Year Ended December 31, 2010 | | $ | 68,192 |
| | $ | 76 |
| | $ | (4,654 | ) | | $ | — |
| | $ | 63,614 |
|
| Year Ended December 31, 2009 | | $ | 54,225 |
| | $ | 13,967 |
| | $ | — |
| | $ | — |
| | $ | 68,192 |
|
SERVICE CORPORATION INTERNATIONAL SCHEDULE II — VALUATION AND QUALIFYING ACCOUNTS Three Years Ended December 31, 2014 |
| | | | | | | | | | | | | | | | | | | | |
| Description | | Balance at Beginning of Period | | Charged (Credited) to Costs and Expenses | | Charged (Credited) to Other Accounts(1) | | Write-Offs(2) | | Balance at End of Period |
| | | (In thousands) |
| Current provision: | | |
| | |
| | |
| | |
| | |
|
| Allowance for doubtful accounts: | | |
| | |
| | |
| | |
| | |
|
| Year Ended December 31, 2014 | | $ | 11,637 |
| | $ | 7,376 |
| | $ | 55,573 |
| | $ | (66,040 | ) | | $ | 8,546 |
|
| Year Ended December 31, 2013 | | $ | 8,884 |
| | $ | 7,874 |
| | $ | 54,774 |
| | $ | (59,895 | ) | | $ | 11,637 |
|
| Year Ended December 31, 2012 | | $ | 9,172 |
| | $ | 9,705 |
| | $ | 38,123 |
| | $ | (48,116 | ) | | $ | 8,884 |
|
| Due After One Year: | | |
| | |
| | |
| | |
| | |
|
| Allowance for doubtful accounts: | | |
| | |
| | |
| | |
| | |
|
| Year Ended December 31, 2014 | | $ | 10,986 |
| | $ | — |
| | $ | 273 |
| | $ | — |
| | $ | 11,259 |
|
| Year Ended December 31, 2013 | | $ | 1,316 |
| | $ | — |
| | $ | 9,670 |
| | $ | — |
| | $ | 10,986 |
|
| Year Ended December 31, 2012 | | $ | 1,665 |
| | $ | — |
| | $ | 1 |
| | $ | (350 | ) | | $ | 1,316 |
|
| Preneed Funeral and Preneed Cemetery | | |
| | |
| | |
| | |
| | |
|
| Asset allowance for cancellation: | | |
| | |
| | |
| | |
| | |
|
| Year Ended December 31, 2014 | | $ | 106,793 |
| | $ | 2,950 |
| | $ | (2,703 | ) | | $ | — |
| | $ | 107,040 |
|
| Year Ended December 31, 2013 | | $ | 83,642 |
| | $ | 4,498 |
| | $ | 18,653 |
| | $ | — |
| | $ | 106,793 |
|
| Year Ended December 31, 2012 | | $ | 78,564 |
| | $ | 4,549 |
| | $ | 529 |
| | $ | — |
| | $ | 83,642 |
|
| Deferred Preneed Funeral and Cemetery | | |
| | |
| | |
| | |
| | |
|
| Revenue allowance for cancellation: | | |
| | |
| | |
| | |
| | |
|
| Year Ended December 31, 2014 | | $ | (149,288 | ) | | $ | — |
| | $ | 24,258 |
| | $ | — |
| | $ | (125,030 | ) |
| Year Ended December 31, 2013 | | $ | (131,320 | ) | | $ | — |
| | $ | (17,968 | ) | | $ | — |
| | $ | (149,288 | ) |
| Year Ended December 31, 2012 | | $ | (136,004 | ) | | $ | — |
| | $ | 4,684 |
| | $ | — |
| | $ | (131,320 | ) |
| Deferred tax valuation allowance: | | |
| | |
| | |
| | |
| | |
|
| Year Ended December 31, 2014 | | $ | 114,719 |
| | $ | 21,285 |
| | $ | (1,803 | ) | | $ | — |
| | $ | 134,201 |
|
| Year Ended December 31, 2013 | | $ | 71,013 |
| | $ | 6,213 |
| | $ | 37,493 |
| | $ | — |
| | $ | 114,719 |
|
| Year Ended December 31, 2012 | | $ | 66,851 |
| | $ | 3,713 |
| | $ | 449 |
| | $ | — |
| | $ | 71,013 |
|
| |
| (1) | Primarily relates to acquisitions and dispositions of operations. |
| |
| (2) | Uncollected receivables written off, net of recoveries. |
| |
| Item 9. | Changes In and Disagreements with Accountants on Accounting and Financial Disclosure |
None.
| |
| Item 9A. | Controls and Procedures. |
Evaluation of Disclosure Controls and Procedures
Our management, with the participation of our Chief Executive Officer (CEO) and Chief Financial Officer (CFO), conducted an evaluation of the effectiveness of ourWe have established disclosure controls and procedures as such term is definedthat are designed to ensure that the information required to be disclosed by the Company in the reports that it files or submits under Rules 13a-15(e) and 15d-15(e) of the Securities Exchange Act of 1934, as amended (the Exchange Act), as of the end of the period covered by this Annual Report on Form 10-K. Based on this evaluation, our CEO and CFO concluded that our disclosure controls and procedures as of December 31, 2011 were effective to ensure that information we are required to disclose in the reports that we file or submit under the Exchange Act“Exchange Act”) is (i) recorded, processed, summarized, and reported within the time periods specified in the SEC’sSEC rules
and forms and (ii)that such information is accumulated and communicated to our management, including our CEOprincipal executive officer and CFO,principal financial officer (who are our Chief Executive Officer and Chief Financial Officer, respectively) as appropriate to allow timely decisions regarding required disclosure. In designing and evaluating our disclosure controls and procedures, management recognized that disclosure controls and procedures can provide only reasonable, not absolute, assurance that the objectives of the disclosure controls and procedures are met.
Our management, including our Chief Executive Officer and Chief Financial Officer, evaluated the effectiveness of our disclosure controls and procedures. Based on this evaluation and as described below under "Management’s Report on Internal Control over Financial Reporting," we have identified a material weakness in our internal control over financial reporting (as defined in Exchange Act Rules 13a-15(f) and 15d-15(f)). Due to this material weakness, our Chief Executive Officer and Chief Financial Officer concluded that our disclosure controls and procedures were not effective as of December 31, 2014.
In light of the material weakness in internal control over financial reporting, prior to filing this Annual Report on Form 10-K, we completed other procedures, including validating, and in certain cases correcting, the completeness and accuracy of the underlying data used for accounting for income taxes. These additional procedures have allowed us to conclude that, notwithstanding the material weakness in our internal control over financial reporting, the consolidated financial statements included in this report fairly present, in all material respects, our financial position, results of operations, and cash flows for the periods presented in conformity with GAAP.
Management’s Report on Internal Control Over Financial Reporting
Our managementManagement is responsible for establishing and maintaining adequate internal control over financial reporting, (asas such term is defined in Rule 13-a-15(f))Exchange Act Rules 13a-15(f) and 15d-15(f). SCI’sThe Company's internal control over financial reporting isincludes those policies and procedures that (i) pertain to the maintenance of records that, in reasonable detail, accurately and fairly reflect the transactions and dispositions of assets of the Company; (ii) provide reasonable assurance that transactions are recorded as necessary to permit preparation of financial statements in accordance with generally accepted accounting principles, and that receipts and expenditures of the Company are being made only in accordance with authorizations of management and directors of the Company; and (iii) provide reasonable assurance regarding prevention or timely detection of unauthorized acquisition, use, or disposition of the Company’s assets that could have a process, undermaterial effect on the supervision of our CEO and CFO,financial statements.
Internal control over financial reporting is designed to provide reasonable assurance regarding the reliability of financial reporting and the preparation of financial statements prepared for external purposes in accordance with generally accepted accounting principles.
Because of its inherent limitations, internal control over financial reporting may not prevent or detect misstatements. Also, projections of any evaluation of effectiveness to future periods are subject to the risk that controls may become inadequate because of changes in conditions or that the degree of compliance with the policies or procedures may deteriorate.
Our management, with the participation of our CEOChief Executive Officer and CFO, hasChief Financial Officer, assessed the effectiveness of our internal control over financial reporting as of December 31, 2011 based on2014 using the frameworkcriteria established in Internal Control —- Integrated Framework (2013) issued by the Committee of Sponsoring Organizations of the Treadway Commission.Commission (COSO). Based on this assessment ourand those criteria, management concluded that due to the material weakness described below, our internal control over financial reporting was not effective as of December 31, 2011.2014.
A material weakness is a deficiency, or a combination of deficiencies, in internal control over financial reporting, such that there is a reasonable possibility that a material misstatement of the company’s annual or interim financial statements will not be prevented or detected on a timely basis.
We did not design and implement internal controls which address the completion and review of our tax basis balance sheet. Although, this material weakness did not result in any material misstatements of our consolidated financial statements, it did result in misstatements related to income tax accounts, goodwill and other liabilities, and accumulated deficit and therefore revisions to our 2013 and 2012 consolidated financial statements were required. However, this material weakness could result in a misstatement of the aforementioned account balances or disclosures that would result in a material misstatement to the annual or interim consolidated financial statements that would not be prevented or detected.
The effectiveness of ourthe Company's internal control over financial reporting as of December 31, 20112014, has been audited by PricewaterhouseCoopers LLP, an independent registered public accounting firm, as stated in their report, which is included in Item 8, "Financial Statements and Supplementary Data" of this Annual Report on Form 10-K.
Remedial Actions
In April 2014, management undertook a project to reconcile deferred tax assets and liabilities utilizing a tax basis balance sheet approach based upon the December 31, 2012, as filed tax returns. During this process, the Company identified certain errors on its historical tax basis balance sheet. While the Company has been consistently reconciling these balances properly in accordance with generally accepted accounting principles, the opening tax basis balance sheet contained certain errors causing the ending balances to be misstated. For additional details of the adjustments, see Note 2, Summary of Significant Accounting Policies - Reclassifications and Revision of Prior Period Financial Statements.
We have implemented and will continue to refine controls to address the material weakness and to strengthen our overall internal controls over accounting for income taxes specific to the preparation and review of the annual tax basis balance sheet following the filing of our income tax returns.
We and our Board of Directors are committed to maintaining a strong internal control environment, and believe that these remediation efforts will represent significant improvements in our controls. While we believe that implementing controls around the annual preparation and review of a tax basis balance sheet will remediate the material weakness we have identified, the material weakness in internal control will not be considered fully addressed until the new procedures have been in place for a sufficient period of time and tested to allow management to conclude that the controls are effective.
Changes in Internal Control over Financial Reporting
There were noManagement, together with our Chief Executive Officer and Chief Financial Officer, evaluated the changes in our internal control over financial reporting during the quarter ended December 31, 20112014. As outlined above, we have implemented and will continue to refine controls to remediate the material weakness related to our tax basis balance sheet. The implemented controls are changes in our internal control over financial reporting during the quarter ended December 31, 2014, that have materially affected, or are reasonably likely to materially affect, our internal control over financial reporting.
Item 9B. Other Information.
None.
None.
PART III
| |
| Item 10. | Directors, Executive Officers, and Corporate Governance |
| |
| Item 11. | Executive Compensation |
| |
| Item 12. | Security Ownership of Certain Beneficial Owners and Management and Related Stockholder Matters |
| |
| Item 13. | Certain Relationships and Related Transactions and Director Independence |
| |
| Item 14. | Employee Stock Purchase PlanPrincipal Accountant Fees and Services |
Information required by PART III (Items 10, 11, 12, 13 and 14) has been omitted as we intend to file with the Commission not later than 120 days after the end of our fiscal year a definitive proxy statement that includes such information. Such information is set forth in such proxy statement (i) with respect to Item 10, under the captions “Proxy Voting: Questions and Answers,” “Election of Directors,” “Other Matters — Section 16(a) Beneficial Ownership Reporting Compliance” and “Report of the Audit Committee,” (ii) with respect to Items 11 and 13, under the captions “Election of Directors,” “Compensation Discussion and Analysis,” “Compensation Committee Report,” “Certain Information with Respect to Officers and Directors,” “Compensation Committee Interlocks and Insider Participation” and “Certain Transactions”, (iii) with respect to Item 12, under the caption “Voting Securities and Principal Holders”, and (iv) with respect to Item 14, under the caption “Proposal to Approve the Selection of Independent AccountantsRegistered Public Accounting Firm — Audit Fees and All Other Fees”. The information as specified in the preceding sentence is incorporated herein by reference; provided however, notwithstanding anything set forth in this Form 10-K, the information under the captions “Compensation Committee Report” and “Report of the Audit Committee” in such proxy statement, is not incorporated by reference into this Form 10-K.
The information regarding our executive officers called for by Item 401 of Regulation S-K and the information regarding our code of ethics called for by Item 406 of Regulation S-K has been included in PART I of this report. The information regarding our equity compensation plan information called for by Item 201(d) of Regulation S-K is set forth below.
Equity Compensation Plan Information at December 31, 2011:2014:
|
| | | | | | | | | | | |
| | | Number of Securities to be Issued upon Exercise of Outstanding Options, Warrants and Rights | | Weighted-Average Exercise Price of Outstanding Options, Warrants and Rights | | Number of Securities Remaining Available for Future Issuance Under Equity Compensation Plans (Excluding Securities Reflected in Column (a)) | |
| Plan Category | | (a) | | (b) | | (c) | |
| Equity compensation plans approved by security holders | | 12,809,565 |
| | $ | 7.89 |
| | 13,404,216 |
| |
| Equity compensation plans not approved by security holders(1) | | 594,651 |
| | $ | 7.79 |
| | 783,124 |
| (2) |
| Total | | 13,404,216 |
| | $ | 7.88 |
| | 14,187,340 |
| |
| |
(1) | Includes options outstanding under the 1996 Nonqualified Incentive Plan under which nonqualified stock options were granted to employees who are not officers or directors. We have 594,651 total options outstanding under the 1996 Non-qualified Incentive Plan. No shares of our common stock are available for any future grants under this plan. See Note 15 in Part II, Item 8. Financial Statements and Supplementary Data, for a further description of 1996 Nonqualified Incentive Plan. This plan has not been submitted for stockholder approval.
|
| |
(2) | Includes an estimated 783,124 shares available under the Employee Stock Purchase Plan. Under such plan, a dollar value of shares (not an amount of shares) is registered. The above estimate was determined by dividing (i) the remaining unissued dollar value of registered shares at December 31, 2011, which was $8.3 million, by (ii) the closing price of $10.65 per share of common stock at December 31, 2011. This plan is being terminated effective as of December 31, 2011.
|
The Employee Stock Purchase Plan enables Company employees in North America to invest via payroll deductions up to $500 (or $700 Canadian) per month in our common stock. Contributions are utilized to purchase the stock in the open market. With respect to Canadian employees who meet certain requirements, we will provide annually a match equal to 25% of the amount of the employee’s contribution subject to a maximum contribution per participant of $2,100 Canadian. This plan has not been submitted for stockholder approval. |
| | | | | | | | | | |
| | | Number of Securities to be Issued upon Exercise of Outstanding Options, Warrants and Rights | | Weighted-Average Exercise Price of Outstanding Options, Warrants and Rights | | Number of Securities Remaining Available for Future Issuance Under Equity Compensation Plans (Excluding Securities Reflected in Column (a)) |
| Plan Category | | (a) | | (b) | | (c) |
| Equity compensation plans approved by security holders | | 12,107,106 |
| | $ | 11.63 |
| | 4,916,787 |
|
PART IV
| |
| Item 15. | Exhibits and Financial Statement Schedule |
(a)(1)-(2) Financial Statements and Schedule:
The financial statements and schedule are listed in the accompanying Index to Financial Statements and Related Schedule on page 4546 of this report.
(3) Exhibits:
The exhibits listed on the accompanying Exhibit Index on pages 99-101114-116 are filed as part of this report.
(b) Included in (a) above.
(c) Included in (a) above.
SIGNATURES
Pursuant to the requirements of Section 13 or 15(d) of the Securities Exchange Act of 1934, the Registrant, Service Corporation International, has duly caused this report to be signed on its behalf by the undersigned, thereunto duly authorized.
|
| | |
| | | SERVICE CORPORATION INTERNATIONAL |
| | | |
| | By: | /s/ Gregory T. Sangalis |
| | | (Gregory T. Sangalis, Senior Vice President, General
Counsel, and Secretary) |
Dated: February 13, 20122015
Pursuant to the requirements of the Securities Exchange Act of 1934, this report has been signed below by the following persons on behalf of the Registrant and in the capacities and on the date indicated.
|
| | | | | | |
| Signature | | Title | | Date |
| | | | | |
| /s/ R. L. WALTRIP* | | Chairman of the Board | | February 13, 20122015 |
| (R. L. Waltrip) | | | | |
| | | | | |
| /s/ THOMAS L. RYAN* | | President, Chief Executive Officer, and Director (Principal Executive Officer) | | February 13, 20122015 |
| (Thomas L. Ryan) | | | |
| | | | | |
| /s/ ERIC D. TANZBERGER* | | Senior Vice President, Chief Financial Officer, and Treasurer (Principal Financial Officer) | | February 13, 20122015 |
| (Eric D. Tanzberger) | | | |
| | | | | |
| /s/ TAMMY R. MOORE* | | Vice President and Corporate Controller (Principal Accounting Officer) | | February 13, 20122015 |
| (Tammy R. Moore) | | | |
| | | | | |
| /s/ ALAN R. BUCKWALTER, III* | | Director | | February 13, 20122015 |
| (Alan R. Buckwalter, III) | | | | |
| | | | | |
| /s/ ANTHONY L. COELHO* | | Director | | February 13, 20122015 |
| (Anthony L. Coelho) | | | | |
| | | | |
/s/ A. J. FOYT, JR.* | | Director | | February 13, 2012 |
(A. J. Foyt, Jr.) | | | | |
| | | | | |
| /s/ MALCOLM GILLIS* | | Director | | February 13, 20122015 |
| (Malcolm Gillis) | | | | |
| | | | | |
| /s/ VICTOR L. LUND* | | Director | | February 13, 20122015 |
| (Victor L. Lund) | | | | |
| | | | | |
| /s/ JOHN W. MECOM, JR.* | | Director | | February 13, 20122015 |
| (John W. Mecom, Jr.) | | | | |
| | | | | |
| /s/ CLIFTON H. MORRIS, JR.* | | Director | | February 13, 20122015 |
| (Clifton H. Morris, Jr.) | | | | |
| | | | | |
| /s/ W. BLAIR WALTRIP* | | Director | | February 13, 20122015 |
| (W. Blair Waltrip) | | | | |
| | | | |
| /s/ MARCUS A. WATTS* | | Director | | February 13, 2015 |
| (Marcus A. Watts) | | | | |
| | | | | |
| /s/ EDWARD E. WILLIAMS* | | Director | | February 13, 20122015 |
| (Edward E. Williams) | | | | |
| | | | | |
| *By | /s/ GREGORY T. SANGALIS | | | | February 13, 20122015 |
| | (Gregory T. Sangalis, as
Attorney-In-Fact for each of the
Persons indicated) | | | | |
EXHIBIT INDEX
PURSUANT TO ITEM 601 OF REG. S-K
|
| | | | | |
| ExhibitNumber | | | Description |
| 3.1 |
| | — |
| Restated Articles of Incorporation. (Incorporated by reference to Exhibit 3.1 to Registration Statement No. 333-10867 on Form S-3). |
| 3.2 |
| | — |
| Articles of Amendment to Restated Articles of Incorporation. (Incorporated by reference to Exhibit 3.1 to Form 10-Q for the fiscal quarter ended September 30, 1996). |
| 3.3 |
| | — |
| Statement of Resolution Establishing Series of Shares of Series D Junior Participating Preferred Stock, dated July 27, 1998. (Incorporated by reference to Exhibit 3.2 to Form 10-Q for the fiscal quarter ended June 30, 1998). |
| 3.4 |
| | — |
| Bylaws, as amended. (Incorporated by reference to Exhibit 3.13.4 to Form 8-K dated November 16, 2007)10-K for the year ended December 31, 2013). |
| 4.1 |
| | — |
| Senior Indenture dated as of February 1, 1993 by and between the Company and The Bank of New York, as trustee. (Incorporated by reference as Exhibit 4.1 to Form S-4 filed September 2, 2004 (File No. 333-118763)). |
| 4.2 |
| | — |
| Agreement of Resignation, Appointment of Acceptance, dated October 21, 2005, among the Company, The Bank of New York and The Bank of New York Trust Company, N.A., appointing a successor trustee for the Senior Indenture dated as of February 1, 1993. (Incorporated by reference to Exhibit 4.1 to Form 10-Q for the fiscal quarter ended June 30, 2005). |
| 10.1 |
| | — |
| Retirement Plan For Non-Employee Directors. (Incorporated by reference to Exhibit 10.1 to Form 10-K for the fiscal year ended December 31, 1991). |
| 10.2 |
| | — |
| First Amendment to Retirement Plan For Non-Employee Directors. (Incorporated by reference to Exhibit 10.2 to Form 10-K for the fiscal year ended December 31, 2000). |
| 10.3 |
| | — |
| Second Amendment to Retirement Plan for Non-Employee Directors. (Incorporated by reference to Exhibit 10.3 to Form 10-K for the fiscal year ended December 31, 2010). |
| 10.4 |
| | — |
| Employment Agreement, dated December 28, 2006, between SCI Executive Services, Inc. and R.L. Waltrip (including Non-Competition Agreement and Amendment to Employment Agreement, dated November 11, 1991, among the Company, R. L. Waltrip and Claire Waltrip). (Incorporated by reference to Exhibit 10.4 to Form 10-K for the fiscal year ended December 31, 2006). |
| 10.5 |
| | — |
| Amendment to Employment and Noncompetition Agreement, dated November 30, 2007, between SCI Executive Services, Inc. and R. L. Waltrip. (Incorporated by reference to Exhibit 10.5 to Form 10-K for the fiscal year ended December 31, 2007). |
| 10.6 |
| | — |
| Amendment to Employment and Noncompetition Agreement, dated December 1, 2010, between SCI Executive Services, Inc. and R.L. Waltrip. (Incorporated by reference to Exhibit 10.7 to Form 10-K for the fiscal year ended December 31, 2010). |
| 10.7 |
| | — |
| Employment and Noncompetition Agreement, dated January 1, 2004, between SCI Executive Services, Inc. and Thomas L. Ryan. (Incorporated by reference to Exhibit 10.9 to Form 10-K for the fiscal year ended December 31, 2003). |
| 10.8 |
| | — |
| Addendum to Employment and Noncompetition Agreement, dated December 1, 2005, between SCI Executive Services, Inc. and Thomas L. Ryan. (Incorporated by reference to Exhibit 10.12 to Form 10-K for the fiscal year ended December 31, 2005). |
| 10.9 |
| | — |
| Amendment to Employment and Noncompetition Agreement, dated November 30, 2007, between SCI Executive Services, Inc. and Thomas L. Ryan. (Incorporated by reference to Exhibit 10.8 to Form 10-K for fiscal year ended December 31, 2007). |
| 10.10 |
| | — |
| Amendment to Employment and Noncompetition Agreement, dated December 1, 2010, between SCI Executive Services, Inc. and Thomas L. Ryan. (Incorporated by reference to Exhibit 10.11 to Form 10-K for the fiscal year ended December 31, 2010). |
| 10.11 |
| | — |
| Employment and Noncompetition Agreement, dated January 1, 2004, between SCI Executive Services, Inc. and Michael R. Webb. (Incorporated by reference to Exhibit 10.10 to Form 10-K for the fiscal year ended December 31, 2003). |
| 10.12 |
| | — |
| Addendum to Employment and Noncompetition Agreement, dated December 1, 2005, between SCI Executive Services, Inc. and Michael R. Webb. (Incorporated by reference to Exhibit 10.14 to Form 10-K for the fiscal year ended December 31, 2005). |
| 10.13 |
| | — |
| Amendment to Employment and Noncompetition Agreement, dated November 30, 2007, between SCI Executive Services, Inc. and Michael R. Webb. (Incorporated by reference to Exhibit 10.11 to Form 10-K for the fiscal year ended December 31, 2007). |
|
| | | | | |
| ExhibitNumber | | | Description |
| 10.14 |
| | — |
| Amendment to Employment and Noncompetition Agreement, dated December 1, 2010, between SCI Executive Services, Inc. and Michael R. Webb. (Incorporated by reference to Exhibit 10.15 to Form 10-K for the fiscal year ended December 31, 2010). |
|
| | | | | |
ExhibitNumber | | | Description |
| 10.15 |
| | — |
| Employment and Noncompetition Agreement, dated December 28, 2006 between SCI Executive Services, Inc. and Eric D. Tanzberger. (Incorporated by reference to Exhibit 10.11 to Form 10-K for the fiscal year ended December 31, 2006). |
| 10.16 |
| | — |
| Amendment to Employment and Noncompetition Agreement, dated November 30, 2007, between SCI Executive Services, Inc. and Eric D. Tanzberger. (Incorporated by reference to Exhibit 10.13 to Form 10-K for the fiscal year ended December 31, 2007). |
| 10.17 |
| | — |
| Amendment to Employment and Noncompetition Agreement , dated December 1, 2010, between SCI Executive Services, Inc. and Eric D. Tanzberger. (Incorporated by reference to Exhibit 10.18 to Form 10-K for the fiscal year ended December 31, 2010). |
| 10.18 |
| | — |
| Employment and Noncompetition Agreement, dated December 28, 2006, between SCI Executive Services, Inc. and Sumner J. Waring, III. (Incorporated by reference to Exhibit 10.9 to Form 10-K for the fiscal year ended December 31, 2006). |
| 10.19 |
| | — |
| Amendment to Employment and Noncompetition Agreement, dated November 30, 2007, between SCI Executive Services, Inc. and Sumner J. Waring, III. (Incorporated by reference to Exhibit 10.15 to Form 10-K for the fiscal year ended December 31, 2009). |
| 10.20 |
| | — |
| Amendment to Employment and Noncompetition Agreement, dated December 1, 2010, between SCI Executive Services, Inc. and Sumner J. Waring, III. (Incorporated by reference to Exhibit 10.21 to Form 10-K for the fiscal year ended December 31, 2010). |
| 10.21 |
| | — |
| Form of Employment and Noncompetition Agreement pertaining to non-senior officers. (Incorporated by reference to Exhibit 10.12 to Form 10-K for the fiscal year ended December 31, 2003). |
| 10.22 |
| | — |
| Form of Addendum to Employment and Noncompetition Agreement pertaining to the preceding exhibit. (Incorporated by reference to Exhibit 10.20 to Form 10-K for the fiscal year ended December 31, 2005). |
| 10.23 |
| | — |
| Form of Amendment to Employment and Noncompetition Agreement dated November 30, 2007, between SCI Executive Services, Inc. and non-senior officers. (Incorporated by reference to Exhibit 10.18 to Form 10-K for the fiscal year ended December 31, 2007). |
| 10.24 |
| | — |
| Form of Amendment to Employment and Noncompetition Agreement, dated December 1, 2010, between SCI Executive Services, Inc. and non-senior officers. (Incorporated by reference to Exhibit 10.25 to Form 10-K for the fiscal year ended December 31, 2010). |
| 10.25 |
| | — |
| Amended 1996 Incentive Plan. (Incorporated by reference to Appendix A to Proxy Statement dated April 6, 2007). |
| 10.26 |
| | — |
| Amended and Restated Incentive Plan. (Incorporated by reference to Appendix B to Proxy Statement dated April 1, 2011). |
| 10.27 |
| | — |
| Supplemental Executive Retirement Plan for Senior Officers (as amended and restated effective as of January 1, 1998). (Incorporated by reference to Exhibit 10.28 to Form 10-K for the fiscal year ended December 31, 1998). |
| 10.28 |
| | — |
| First Amendment to Supplemental Executive Retirement Plan for Senior Officers. (Incorporated by reference to Exhibit 10.28 to Form 10-K for the fiscal year ended December 31, 2000). |
| 10.29 |
| | — |
| SCI 401(k) Retirement Savings Plan, as Amendedconsisting of the Charles Schwab Defined Contribution Plan and Restated. (Incorporated by reference to Exhibit 4.7 to Registration Statement No. 333-119681). |
10.30 |
| | — |
| First AmendmentTrust, Basic Plan Document #01; the Adoption Agreements to the SCI 401(k) Retirement Savings Plan.Plan and the SCI Union 401(k) Retirement Savings Plan, each as amended effective July 1, 2014, and the Directed Employee Benefit Trust Agreement between Service Corporation International and Charles Schwab Bank. (Incorporated by reference to Exhibit 10.210.1 to Form 10-Q for the quarterly period ended SeptemberJune 30, 2004)2014). |
10.31 |
| | — |
| Second Amendment to the SCI 401(k) Retirement Savings Plan, and Third Amendment to the SCI 401(k) Retirement Savings Plan. (Incorporated by reference to Exhibit 10.26 to Form 10-K for the fiscal year ended December 31, 2004). |
10.32 |
| | — |
| Fourth Amendment to the SCI 401(k) Retirement Savings Plan. (Incorporated by reference to Exhibit 10.27 to Form 10-K for the fiscal year ended December 31, 2006). |
10.33 |
| | — |
| Fifth Amendment to the SCI 401(k) Retirement Savings Plan. (Incorporated by reference to Exhibit 10.30 to Form 10-K for the fiscal year ended December 31, 2007). |
10.34 |
| | — |
| Sixth Amendment to the SCI 401(k) Retirement Savings Plan. (Incorporated by reference to Exhibit 10.30 to Form 10-K for the fiscal year ended December 31, 2008). |
10.35 |
| | — |
| Amended and Restated Director Fee Plan. (Incorporated by reference to Annex C to Proxy Statement dated April 1, 2011). |
10.36 |
| | — |
| Employee Stock Purchase Plan. (Incorporated by reference to Exhibit 1.1 to Registration Statement No. 2-62484 on Form S-8). |
10.37 |
| | — |
| Amendment No. 1 to the Employee Stock Purchase Plan. (Incorporated by reference to Exhibit 15.1 to Registration Statement No. 2-62484 on Form S-8). |
|
| | | | | |
ExhibitNumber | | | Description |
10.38 |
| | — |
| Amendment No. 2 to the Employee Stock Purchase Plan. (Incorporated by reference to Exhibit 28.3 to Registration Statement No. 33-25061 on Form S-8). |
10.39 |
| | — |
| Amendment No. 3 to the Employee Stock Purchase Plan. (Incorporated by reference to Exhibit 28.4 to Registration Statement No. 33-35708 on Form S-8). |
10.40 |
| | — |
| Amendment No. 4 to the Employee Stock Purchase Plan. (Incorporated by reference to Exhibit 10.34 to Form 10-K for the fiscal year ended December 31, 2009). |
10.41 |
| | — |
| Amendment No. 5 to the Employee Stock Purchase Plan. (Incorporated by reference to Exhibit 10.31 to Form 10-K for the fiscal year ended December 31, 1999). |
10.42 |
| | — |
| Amendment No. 6 to the Employee Stock Purchase Plan. (Incorporated by reference to Exhibit 10.44 to Form 10-K for the fiscal year ended December 31, 2002). |
10.43 |
| | — |
| Amendment No. 7 to the Employee Stock Purchase Plan. (Incorporated by reference to Exhibit 10.45 to Form 10-K for the fiscal year ended December 31, 2002). |
10.44 |
| | — |
| Agreement between Merrill Lynch Canada Inc. and Service Corporation International. (Incorporated by reference to Exhibit 28.5 to Post-Effective Amendment No. 1 to Registration Statement No. 33-8907 on Form S-8). |
10.45 |
| | — |
| First Amendment to Agreement between Merrill Lynch Canada Inc. and Service Corporation International. (Incorporated by reference to Exhibit 4.2 to Current Report on Form 8-K dated December 21, 1993). |
10.46 |
| | — |
| Employee Stock Purchase Plan Administration Agreement dated July 25, 2001 between Service Corporation International (Canada) Limited and Fastrak Systems Inc. (Incorporated by reference to Exhibit 10.48 to Form 10-K for the fiscal year ended December 31, 2002). |
10.47 |
| | — |
| Form of Indemnification Agreement for officers and directors. (Incorporated by reference to Exhibit 10.1 to Form 10-Q for the quarterly period ended September 30, 2004). |
10.4810.32 |
| | — |
| Form of Executive Deferred Compensation Plan as Amended and Restated Effective December 8, 2009. (Incorporated by reference to Exhibit 10.42 to Form 10-K for the fiscal year ended December 31, 2009.) |
10.4910.33 |
| | — |
| Amendment One to Executive Deferred Compensation Plan. (Incorporated by reference to Exhibit 10.50 to Form 10-K for the fiscal year ended December 31, 2010). |
10.5010.34 |
| | — |
| Amendment Two to Executive Deferred Compensation Plan. (Incorporated by reference to Exhibit 10.1 to Form 10-Q for the quarterly period ended September 30, 2014). |
| 10.35 |
| | — |
| Amendment Three to Executive Deferred Compensation Plan. |
|
| | | | | |
| ExhibitNumber | | | Description |
| 10.36 |
| | — |
| Form of Performance Unit Grant Award Agreement. |
10.5110.37 |
| | — |
| Second Amended and Restated Revolving Credit Agreement, dated as of March 18, 2011July 2, 2013 among Service Corporation International, the lendersLenders party thereto and JPMorgan Chase Bank, N.A., as Administrative Agent for the lenders dated as of March 18, 2011. (Incorporated by reference to Exhibit 10.1 to Form 8-K dated March 24, 2011). |
10.52 |
| | — |
| Agreement and First Amendment to Second Amended and Restated Credit Agreement, dated as of May 27, 2011, among the Company and the lenders party thereto. (Incorporated by reference to Exhibit 10.1 to Form 8-K dated June 3, 2011).July 8, 2013.) |
| 12.1 |
| | — |
| Ratio of Earnings to Fixed Charges. |
| 21.1 |
| | — |
| Subsidiaries of the Company. |
| 23.1 |
| | — |
| Consent of Independent Registered Public Accounting Firm (PricewaterhouseCoopers LLP). |
| 24.1 |
| | — |
| Powers of Attorney. |
| 31.1 |
| | — |
| Certification of Thomas L. Ryan as Principal Executive Officer in satisfaction of Section 302 of the Sarbanes-Oxley Act of 2002. |
| 31.2 |
| | — |
| Certification of Eric D. Tanzberger as Principal Financial Officer in satisfaction of Section 302 of the Sarbanes-Oxley Act of 2002. |
| 32.1 |
| | — |
| Certification of Periodic Financial Reports by Thomas L. Ryan as Principal Executive Officer in satisfaction of Section 906 of the Sarbanes- Oxley Act of 2002. |
| 32.2 |
| | — |
| Certification of Periodic Financial Reports by Eric D. Tanzberger as Principal Financial Officer in satisfaction of Section 906 of the Sarbanes-Oxley Act of 2002. |
| 101 |
| | — |
| Interactive data file. |
In the above list, the management contracts or compensatory plans or arrangements are set forth in Exhibits 10.1 through 10.50.10.36.
Pursuant to Item 601(b)(4) of Regulation S-K, there are not filed as exhibits to this report certain instruments with respect to long-term debt under which the total amount of securities authorized thereunder does not exceed 10 percent of the total assets of Registrant and its subsidiaries on a consolidated basis. Registrant agrees to furnish a copy of any such instrument to the Commission upon request.