UNITED STATES
SECURITIES AND EXCHANGE COMMISSION
Washington, D.C. 20549
FORM 10-K
|
| |
| ☒ | ANNUAL REPORT PURSUANT TO SECTION 13 OR 15(d) OF THE SECURITIES EXCHANGE ACT OF 1934
|
THE SECURITIES EXCHANGE ACT OF 1934
|
| | | |
| For the fiscal year ended | December 31, 201628, 2019 | Commission file number 1–6770 | 1-6770 |
MUELLER INDUSTRIES, INC.
(Exact name of registrant as specified in its charter)
Delaware
|
|
|
| Delaware | 25-0790410 |
| (State or other jurisdiction | (I.R.S. Employer |
| of incorporation or organization) | (I.R.S. Employer Identification No.) |
8285 Tournament Drive, |
| | |
| 150 Schilling Boulevard | Suite 150100 | |
Memphis, Tennessee
Collierville | 38125
Tennessee | 38017 |
| (Address of principal executive offices) | (Zip Code) |
Registrant'sRegistrant’s telephone number, including area code: (901) (901) 753-3200
Securities registered pursuant to Section 12(b) of the Act:
|
| | |
| Title of each class | Trading Symbol | Name of each exchange on which registered |
| |
| Common Stock, $0.01 Par Value | MLI | New York Stock Exchange |
Securities registered pursuant to Section 12(g) of the Act: None
Indicate by check mark whether the Registrant is a well-known seasoned issuer, as defined in Rule 405 of the Securities Act. Yes☒ No ☐
Indicate by check mark if the Registrant is not required to file reports pursuant to Section 13 or Section 15(d) of the Act. Yes ☐ No☒
Indicate by a check mark whether the Registrant (1) has filed all reports required to be filed by Section 13 or 15(d) of the Securities Exchange Act of 1934 during the preceding 12 months (or for such shorter period that the Registrant was required to file such reports), and (2) has been subject to such filing requirements for the past 90 days. Yes☒ No ☐
Indicate by check mark whether the Registrant has submitted electronically and posted on its corporate Website, if any, every Interactive Data File required to be submitted and posted pursuant to Rule 405 of Regulation S-T (§232.405 of this chapter) during the preceding 12 months (or for such shorter period that the Registrant was required to submit and post such files). Yes☒ No ☐
Indicate by check mark if disclosure of delinquent filers pursuant to Item 405 of Regulation S-K (Section 229.405 of this chapter) is not contained herein, and will not be contained, to the best of Registrant'sRegistrant’s knowledge, in definitive proxy or information statements incorporated by reference in Part III of this Form 10-K or any amendment to this Form 10-K. ☒
Indicate by check mark whether the Registrant is a large accelerated filer, an accelerated filer, a non-accelerated filer, or a smaller reporting company. See the definitions of "large“large accelerated filer," "accelerated filer"” “accelerated filer,” “smaller reporting company,” and "smaller reporting company"“emerging growth company” in Rule 12b-2 of the Exchange Act.
|
| | | |
| Large accelerated filer | ☒
| Accelerated filer | ☐ |
| Non-accelerated filer | ☐ | Smaller reporting company | ☐ |
| Emerging growth company | ☐ | | |
If an emerging growth company, indicate by check mark if the registrant has elected not to use the extended transition period for complying with any new or revised financial accounting standards provided pursuant to Section 13(a) of the Exchange Act. ☐
Indicate by check mark whether the Registrant is a shell company (as defined in Rule 12b-2 of the Act). Yes ☐ No ☒
The aggregate market value of the voting and non-voting common equity held by non-affiliates computed by reference to the price at which the common equity was last sold, or the average bid and asked price of such common equity, as of the last business day of the Registrant'sRegistrant’s most recently completed second fiscal quarter was $1,795,668,379.$1,597,828,319.
The number of shares of the Registrant'sRegistrant’s common stock outstanding as of February 24, 201721, 2020 was 57,602,563 56,995,167 excluding 22,580,441 23,187,837 treasury shares.
DOCUMENTS INCORPORATED BY REFERENCE
Portions of the following document are incorporated by reference into this Report: Registrant'sRegistrant’s Definitive Proxy Statement for the 20172020 Annual Meeting of Stockholders, scheduled to be mailed on or about March 30, 201726, 2020 (Part III).
MUELLER INDUSTRIES, INC.
_____________________
As used in this report, the terms "we," "us," "our," "Company," "Mueller,"“we,” “us,” “our,” “Company,” “Mueller,” and "Registrant"“Registrant” mean Mueller Industries, Inc. and its consolidated subsidiaries taken as a whole, unless the context indicates otherwise.
____________________
|
| | | |
| | | | Page |
| Part I | | |
| | | | |
| | | | |
| | | | |
| | | | |
| | | |
| | | | |
| | | |
| | | | |
| Part II | | |
| | | | |
| | | | |
| | | | |
| | | |
| | | | |
| | | | |
| | | |
| | | | |
| | | | |
| | | | |
| Part III | | |
| | | | |
| | | | |
| | | | |
| | | | |
| | | | |
| | | | |
| Part IV | | |
| | | | |
| | | | |
| | | | |
| | |
| | | | |
| |
PART I
Introduction
Mueller Industries, Inc. (the Company) is a leading manufacturer of copper, brass, aluminum, and plastic products. The range of these products we manufacture is broad: copper tube and fittings; line sets; brass and copper alloy rod, bar, and shapes; aluminum and brass forgings; aluminum impact extrusions; PEX plastic fittingstube and valves;fittings; refrigeration valves and fittings; compressed gas valves; fabricated tubular products; pressure vessels; steel nipples; and steel nipples.insulated flexible duct systems. We also resell imported brass and plastic plumbing valves, plastic fittings, malleable iron fittings, faucets, and plumbing specialty products. Our operations are located throughout the United States and in Canada, Mexico, Great Britain, South Korea, the Middle East, and China. The Company was incorporated in Delaware on October 3, 1990.
During the first quarter of 2016, we made changes to our management reporting structure as a result of a change in the way the Chief Executive Officer, who serves as the Chief Operating Decision Maker, manages and evaluates the business, makes key operating decisions, and allocates resources. Previously, we had two reportable segments: Plumbing & Refrigeration and OEM. During the first quarter, we realigned our operating segments into three reportable segments: Piping Systems, Industrial Metals, and Climate. The changes to the reporting structure resulted from management's decision to operationally separate certain businesses in order to enhance the level of focus on those businesses. This included the appointment of separate management teams. In addition, as a result of several acquisitions, we separated certain businesses with similar characteristics to create the Industrial Metals and Climate segments. These businesses were previously aggregated within the OEM segment. Management has recast certain prior year amounts to conform to the current year presentation. Each of theour reportable segments is composed of certain operating segments that are aggregated primarily by the nature of products offered. These are the Piping Systems, Industrial Metals, and Climate segments.
Certain administrative expenses and expenses related primarily to retiree benefits at inactive operations are combined into the Corporate and Eliminations classification.
Financial information concerning segments and geographic information appears under "Note“Note 3 – Segment Information"Information” in the Notes to Consolidated Financial Statements, which is incorporated herein by reference.
New housing starts and commercial construction are important determinants of the Company'sour sales to the heating, ventilation, and air-conditioning (HVAC), refrigeration, and plumbing markets because the principal end use of a significant portion of our products is in the construction of single and multi-family housing and commercial buildings. Repairs and remodeling projects are also important drivers of underlying demand for these products. In addition, our products are used in various transportation, automotive, and industrial applications.
Piping Systems Segment
The Piping Systems segment is composed of Domestic Piping Systems Group, Canadian Operations,Great Lakes Copper (Great Lakes), Pexcor Manufacturing Company and Heatlink Group Inc. (collectively, Heatlink Group), Die-Mold Tool Limited (Die-Mold), European Operations, Trading Group, Jiangsu Mueller-Xingrong Copper Industries Limited (Mueller-Xingrong), and Jungwoo Metal Ind. Co., LTD (Jungwoo-Mueller).
The Domestic Piping Systems Group manufactures copper tube, and fittings, plastic fittings, and line sets. These products are manufactured in the U.S., sold in the U.S., and exported to markets worldwide. Our copper tube ranges in sizessize from 1/8 inch to 8 1/8 inch diameter and is sold in various straight lengths and coils. We are a market leader in the air-conditioning and refrigeration service tube markets and we also supply a variety of water tube in straight lengths and coils used for plumbing applications in virtually every type of construction project. Our copper and plastic fittings, line sets, and related components are produced for the plumbing and heating industry to be used in water distribution systems, heating systems, air-conditioning, and refrigeration applications, and drainage, waste, and vent systems.
Canadian OperationsGreat Lakes manufactures copper tube and line sets in Canada and sells the products primarily in the U.S. and Canada. Heatlink Group manufactures a complete line of products for PEX plumbing and radiant systems in Canada and sells these products in Canada and the U.S. Die-Mold manufactures PEX and other plumbing-related fittings and plastic injection tooling in Canada and sells these products in Canada and the U.S. European Operations manufactures copper tube in the United Kingdom, which is sold throughout Europe. The Trading Group manufactures steel pipe nipples and resells imported brass and plastic plumbing valves, malleable iron fittings, faucets, and plumbing specialty products to plumbing wholesalers, distributors to the manufactured housing and recreational vehicle industries, and building materials retailers in North America.
Mueller-Xingrong, our Chinese joint venture, manufactures engineered copper tube primarily for air-conditioning applications; these products are sold primarily to OEMs located in China. Jungwoo-Mueller, our South Korean joint venture, manufactures copper-based joining products that are sold worldwide.
We acquired Howell Metal Company (Howell) on October 17, 2013, Yorkshire Copper Tube (Yorkshire) on February 28, 2014, Great Lakes Copper (Great Lakes) on July 31, 2015, and a 60 percent equity interest in Jungwoo-Mueller on April 26, 2016. Howell manufactures copper tube2016, Heatlink Group on May 31, 2017, and line sets for U.S. distribution while Yorkshire produces European standard copper distribution tubes. Great Lakes manufactures copper tube and line sets for distribution in Canada and the U.S.Die-Mold on March 31, 2018. These acquisitions complement our existing copper tube, line sets, and copper fittings, and plastics businesses in the Piping Systems segment.
We disposed of Mueller PrimaflowJiangsu Mueller-Xingrong Copper Industries Limited (Primaflow)(Mueller-Xingrong), our U.K. based plumbing and heating systems import distribution business,the Company’s Chinese joint venture, on NovemberJune 21, 2014.2017. This business was part of European Operationsmanufactured engineered copper tube primarily for air-conditioning applications in the Piping Systems segment.China.
The segment sells products to wholesalers in the plumbing and refrigeration markets, distributors to the manufactured housing and recreational vehicle industries, building material retailers, and air-conditioning OEMs.original equipment manufacturers (OEMs). It markets primarily through its own sales and distribution organization, which maintains sales offices and distribution centers throughout the United States and in Canada, Mexico, Europe, China, and South Korea. Additionally, products are sold and marketed through a complement of agents, which, when combined with our sales organization, provide the Company broad geographic market representation.
The total amount of order backlog for the Piping Systems segment as of December 31, 201628, 2019 was not significant.
We compete with various companies, depending on the product line. In the U.S. copper tube business, domestic competition includes Cerro Flow Products LLC, Cambridge-Lee Industries LLC (a subsidiary of Industrias Unidas S.A. de C.V.), and Wieland Copper Products LLC, as well as many actual and potential foreign competitors. In the European copper tube business, we compete with several European-based manufacturers of copper tube as well as other foreign-based manufacturers. In the Canadian copper tube business, our competitors include foreign-based manufacturers. In the copper fittings market, our domestic competitors include Elkhart Products Company (a subsidiary of Aalberts Industries N.V.) and NIBCO, Inc. We also compete with several foreign manufacturers. Additionally, our copper tube and fittings businesses compete with a large number of manufacturers of substitute products made from other metals and plastic. The plastic fittings competitors include NIBCO, Inc., Charlotte Pipe & Foundry, and other companies.
Industrial Metals Segment
The Industrial Metals segment is composed of Brass Rod & Copper Bar Products, Impacts & Micro Gauge, and Brass Value-Added Products.
Brass Rod & Copper Bar Products manufactures a broad range of brass rod, copper bar, and copper alloy shapes, as well as a wide variety of end products including plumbing brass, valves, and fittings sold primarily to OEMs in the industrial, HVAC, plumbing, and refrigeration industries. We extrude brass, bronze, and copper alloy rod in sizes ranging from 3/8 inches to 4 inches in diameter. These alloys are used in applications that require a high degree of machinability, wear and corrosion resistance, as well as electrical conductivity.
Impacts & Micro Gauge manufactures cold-form aluminum and copper products for automotive, industrial, and recreational components, as well as high-volume machining of aluminum, steel, brass, and cast iron impacts and castings for automotive applications. It sells its products primarily to OEMs in the U.S., serving the automotive, military ordnance, aerospace, and general manufacturing industries. Typical applications for impacts are high strength ordnance, high-conductivity electrical components, builders'builders’ hardware, hydraulic systems, automotive parts, and other uses where toughness must be combined with varying complexities of design and finish.
Brass Value-Added Products manufactures brass and aluminum forgings; brass, aluminum, and stainless steel valves; fluid control solutions; and gas train assembles. Our forgings are used in a wide variety of products, including automotive components, brass fittings, industrial machinery, valve bodies, gear blanks, and computer hardware. Our valves, fluid control systems, and gas train assemblesassemblies are used in the compressed gas, pharmaceutical, construction, and gas appliance markets.
On June 18, 2015, we acquired Sherwood Valve Products, LLC (Sherwood), which manufactures valves and fluid control solutions for the HVAC, refrigeration, and compressed gas markets. The acquisition of Sherwood complements our existing brass businesses in the Industrial Metals segment.
The segment sells its products primarily to domestic OEMs in the industrial, construction, HVAC, plumbing, and refrigeration markets. The total amount of order backlog for the Industrial Metals segment as of December 31, 201628, 2019 was not significant.
Competitors, primarily in the brass rod market, include Chase Brass and Copper Company LLC, a subsidiary of Global Brass and Copper Holdings, Inc., and others, both domestic and foreign.
Climate Segment
The Climate segment is composed of Refrigeration Products, Fabricated Tube Products, Westermeyer Industries, Inc. (Westermeyer), and Turbotec Products, Inc. (Turbotec)., ATCO Rubber Products, Inc. (ATCO), and Linesets, Inc.
Refrigeration Products designs and manufactures valves, protection devices, and brass fittings for various OEMs in the commercial HVAC and refrigeration markets. Fabricated Tube Products manufactures tubular assemblies and fabrications for OEMs in the
HVAC and refrigeration markets. Westermeyer designs, manufactures, and distributes high-pressure components and accessories for the air-conditioning and refrigeration markets. Turbotec manufactures coaxial heat exchangers and twisted tubes for the HVAC, geothermal, refrigeration, swimming pool heat pump, marine, ice machine, commercial boiler, and heat reclamation markets. ATCO manufactures and distributes insulated HVAC flexible duct systems.
We acquired Westermeyer on August 16, 2012 and Turbotec on March 30, 2015. The2015 and ATCO on July 2, 2018. These acquisitions of Westermeyer and Turbotec complement our existing refrigeration businessbusinesses in the Climate segment.
The segment sells its products primarily to OEMs in the HVAC and refrigeration markets in the U.S. The total amount of order backlog for the Climate segment as of December 31, 201628, 2019 was not significant.
Labor Relations
At December 31, 2016,28, 2019, the Company employed approximately 4,2444,964 employees, of which approximately 1,6161,579 were represented by various unions. Those union contracts will expire as follows:
Location
|
|
|
| Location | Expiration Date |
| Port Huron, Michigan (Local 218 IAM) | May 5, 20197, 2023 |
| Wynne, Arkansas (MCTP) | November 30, 2024 |
| Port Huron, Michigan (Local 44 UAW) | July 21, 2019 |
Port Huron, Michigan (Local 119 SPFPA) | April 1, 2018 |
Belding, Michigan | September 14, 2018June 26, 2022 |
| Wynne, Arkansas (B&K LLC) | June 28, 2018 |
Fulton, Mississippi | September 30, 20182021 |
| North Wales, Pennsylvania | July 31, 20182021 |
Washington, PennsylvaniaBelding, Michigan | July 25, 2017September 17, 2021 |
| Fulton, Mississippi | October 2, 2021 |
| Waynesboro, Tennessee | November 2, 20183, 2021 |
The union agreements at the Company'sCompany’s U.K. and Mexico operations are renewed annually. The Company expects to renew its union contracts without material disruption ofto its operations.
Raw Material and Energy Availability
A substantial portion of our base metal requirements (primarily copper) is normally obtained through short-term supply contracts with competitive pricing provisions (for cathode) and the open market (for scrap). Other raw materials used in the production of brass, including brass scrap, zinc, tin, and lead are obtained from zinc and lead producers, open-market dealers, and customers with brass process scrap. Raw materials used in the fabrication of aluminum and plastic products are purchased in the open market from major producers.
Adequate supplies of raw material have historically been available to us from primary producers, metal brokers, and scrap dealers. Sufficient energy in the form of natural gas, fuel oils, and electricity is available to operate our production facilities. While temporary shortages of raw material and fuels may occur occasionally, to date they have not materially hampered our operations.
Our copper tube facilities can accommodate both refined copper and certain grades of copper scrap as the primary feedstock. The Company has commitments from refined copper producers for a portion of its metal requirements for 2017.2020. Adequate quantities of copper are currently available. While we will continue to react to market developments, resulting pricing volatility or supply disruptions, if any, could nonetheless adversely affect the Company.
Environmental Proceedings
Compliance with environmental laws and regulations is a matter of high priority for the Company. Mueller'sMueller’s provision for environmental matters related to all properties was $0.9$1.7 million for 2016, $0.12019, $2.0 million for 2015,2018, and $1.2$7.5 million for 2014.2017. The reserve for environmental matters was $21.9$20.9 million at December 31, 201628, 2019 and $21.7$23.6 million at December 26, 2015.29, 2018. Environmental costsexpenses related to non-operating properties are classified as a componentpresented below operating income in the Consolidated Statements of other income, netIncome, and costs related to operating properties are included in cost of goods sold. We do not currently anticipate that we will need to make material expenditures of approximately $2.1 million for compliance activities related to existing environmental matters during the next three fiscal years.
Other Business Factors
Our business is not materially dependent on patents, trademarks, licenses, franchises, or concessions held. In addition, expenditures for Company-sponsored research and development activities were not material during 2016, 2015,2019, 2018, or 2014.2017. No material portion of our business involves governmental contracts.
Seasonality
Our net sales typically moderate in the fourth quarter as a result of the Company's sales is not significant.seasonal construction markets and customer shutdowns for holidays, year-end plant maintenance, and physical inventory counts. Also, our working capital typically increases in the first quarter in preparation for the construction season.
SEC Filings
We make available through our internet website our annual reports on Form 10-K, quarterly reports on Form 10-Q, current reports on Form 8-K, and amendments to those reports filed or furnished pursuant to Section 13(a) or 15(d) of the Exchange Act as soon as reasonably practicable after we electronically file such material with, or furnish it to, the Securities and Exchange Commission (SEC). To retrieve any of this information, you may access our internet home page at www.muellerindustries.com, select Investors, and then select SEC Filings.
The Company is exposed to risk as it operates its businesses. To provide a framework to understand our operating environment, we are providing a brief explanation of the more significant risks associated with our businesses. Although we have tried to identify and discuss key risk factors, others could emerge in the future. These risk factors should be considered carefully when evaluating the Company and its businesses.
Increases in costs and the availability of energy and raw materials used in our products could impact our cost of goods sold and our distribution expenses, which could have a material adverse impact on our operating margins.
Both the costs of raw materials used in our manufactured products (copper, brass, zinc, aluminum, and PVC and ABSplastic resins) and energy costs (electricity, natural gas and fuel) have been volatile during the last several years, which has resulted in changes in production and distribution costs. For example, recent and pending climate change regulation and initiatives on the state, regional, federal, and international levels that have focused on reducing greenhouse gas (GHG) emissions from the energy and utility sectors may affect energy availability and costs in the near future. While we typically attempt to pass costs through to our customers or to modify or adapt our activities to mitigate the impact of increases, we may not be able to do so successfully. Failure to fully pass increases to our customers or to modify or adapt our activities to mitigate the impact could have a material adverse impact on our operating margins. Additionally, if we are for any reason unable to obtain raw materials or energy, our ability to manufacture our products would be impacted, which could have a material adverse impact on our operating margins.
The unplanned departure of key personnel could disrupt our business.
We depend on the continued efforts of our senior management. The unplanned loss of key personnel, or the inability to hire and retain qualified executives, could negatively impact our ability to manage our business.
Economic conditions in the housing and commercial construction industries, as well as changes in interest rates, could have a material adverse impact on our business, financial condition, and results of operations.
Our business is sensitive to changes in general economic conditions, particularly in the housing and commercial construction industries. Prices for our products are affected by overall supply and demand in the market for our products and for our competitors'competitors’ products. In particular, market prices of building products historically have been volatile and cyclical, and we may be unable to control the timing and extent of pricing changes for our products. Prolonged periods of weak demand or excess supply in any of our businesses could negatively affect our revenues and margins and could result in a material adverse impact on our business, financial condition, and results of operations.
The markets that we serve, including, in particular, the housing and commercial construction industries, are significantly affected by movements in interest rates and the availability of credit. Significantly higher interest rates could have a material adverse effect on our business, financial condition, and results of operations. Our businesses are also affected by a variety of other factors beyond our control, including, but not limited to, employment levels, foreign currency exchange rates, unforeseen inflationary pressures, and consumer confidence. Since we operate in a variety of geographic areas, our businesses are subject to the economic conditions in each such area. General economic downturns or localized downturns in the regions where we have operations could have a material adverse effect on our business, financial condition, and results of operations.
The impact of economic conditions on the operations or liquidity of any party with which we conduct our business, including our suppliers and customers, may adversely impact our business.
Competitive conditions, including the impact of imports and substitute products and technologies, could have a material adverse effect on the demand for our products as well as our margins and profitability.
The markets we serve are competitive across all product lines. Some consolidation of customers has occurred and may continue, which could shift buying power to customers. In some cases, customers have moved production to low-cost countries such as China, or sourced components from there, which has reduced demand in North America for some of the products we manufacture. These conditions could have a material adverse impact on our ability to maintain margins and profitability. The potential threat of imports and substitute products is based upon many factors, including raw material prices, distribution costs, foreign exchange rates, production costs, and the development of emerging technologies and applications. The end use of alternative import and/or substitute products could have a material adverse effect on our business, financial condition, and results of operations. Likewise, the development of new technologies and applications could result in lower demand for our products and have a material adverse effect on our business.
Our exposure to exchange rate fluctuations on cross border transactions and the translation of local currency results into U.S. dollars could have an adverse impact on our results of operations or financial position.
We conduct our business through subsidiaries in several different countries and export our products to many countries. Fluctuations in currency exchange rates could have a significant impact on the competitiveness of our products as well as the reported results of our operations, which are presented in U.S. dollars. A portion of our products are manufactured in or acquired from suppliers located in lower cost regions. Cross border transactions, both with external parties and intercompany relationships, result in increased exposure to foreign exchange fluctuations. The strengthening of the U.S. dollar could expose our U.S. based businesses to competitive threats from lower cost producers in other countries such as China. Lastly, our sales are translated into U.S. dollars for reporting purposes. The strengthening of the U.S. dollar could result in unfavorable translation effects when the results of foreign operations are translated into U.S. dollars. Accordingly, significant changes in exchange rates, particularly the British pound sterling, Mexican peso, Canadian dollar, and South Korean won, and Chinese renminbi, could have an adverse impact on our results of operations or financial position.
The vote by the United Kingdom (U.K.) to leave the European Union (EU) and implementation of Brexit could adversely affect us.
The June 2016
As of January 31, 2020, the U.K. referendum on its membership inis no longer a member of the EU resulted in a majority of U.K. voters voting to exit the EU ("Brexit")(Brexit). As a result, we face risks associated withand uncertainty regarding the potential uncertaintyform and consequences that may followof the implementation of Brexit, including with respectthe possibility that the U.K. and the EU could fail to come to an agreement on the terms of the U.K. exit. The U.K. and the EU are currently in negotiations on the terms. Finalized terms are due on December 31, 2020. During this eleven month period, the U.K. will continue to follow all EU rules, and their trading relationship will remain the same. As a result of Brexit, we may be negatively impacted by increased volatility in exchange rates and interest rates and disruptions affecting our relationships with our existing and future customers, suppliers and employees. Brexit and its implementation could also adversely affect European or worldwide political, regulatory, economic or market conditions and could contribute to instability in global political institutions, regulatory agencies and financial markets. Any of these effects of Brexit, and others we cannot anticipate, could adversely affect our business, results of operations and financial condition.
We are subject to claims, litigation, and regulatory proceedings that could have a material adverse effect on us.
We are, from time-to-time, involved in various claims, litigation matters, and regulatory proceedings. These matters may include contract disputes, personal injury claims, environmental claims and administrative actions, Occupational Safety and Health Administration inspections or proceedings, other tort claims, employment and tax matters and other litigation including class actions that arise in the ordinary course of our business. Although we intend to defend these matters vigorously, we cannot predict with certainty the outcome or effect of any claim or other litigation matter, and there can be no assurance as to the ultimate outcome
of any litigation or regulatory proceeding. Litigation and regulatory proceedings may have a material adverse effect on us because of potential adverse outcomes, defense costs, the diversion of our management'smanagement’s resources, availability of insurance coverage and other factors.
A strike, other work stoppage or business interruption, or our inability to renew collective bargaining agreements on favorable terms, could impact our cost structure and our ability to operate our facilities and produce our products, which could have an adverse effect on our results of operations.
AsWe have a number of December 31, 2016, approximately 1,616 of our 4,244 employees werewho are covered by collective bargaining or similar agreements. If we are unable to negotiate acceptable new agreements with the unions representing our employees upon expiration of existing contracts, we could experience strikes or other work stoppages. Strikes or other work stoppages could cause a significant disruption of operations at our facilities, which could have an adverse impact on us. New or renewal agreements with unions representing our employees could call for higher wages or benefits paid to union members, which would increase our operating costs and could adversely affect our profitability. Higher costs and/or limitations on our ability to operate our facilities and manufacture our products resulting from increased labor costs, strikes or other work stoppages could have a material adverse effect on our results of operations.
In addition, unexpected interruptions in our operations or those of our customers or suppliers due to such causes as weather-related events or acts of God, such as earthquakes, could have an adverse effect on our results of operations. For example, the Environmental Protection Agency has found that global climate change would be expected to increase the severity and possibly the frequency of severe weather patterns such as hurricanes. Although the financial impact of such future events is not reasonably estimable at this time, should they occur, our operations in certain coastal and flood-prone areas or operations of our customers and suppliers could be adversely affected.
We are subject to environmental, health, and safety laws and regulations and future compliance may have a material adverse effect on our results of operations, financial position, or cash flows.
The nature of our operations exposes us to the risk of liabilities and claims with respect to environmental, health, and safety matters. While we have established accruals intended to cover the cost of environmental remediation at contaminated sites, the actual cost is difficult to determine and may exceed our estimated reserves. Further, changes to, or more rigorous enforcement or stringent interpretation of environmental or health and safety laws could require significant incremental costs to maintain compliance. Recent and pending climate change regulation and initiatives on the state, regional, federal, and international levels may require certain of our facilities to reduce GHG emissions. While not reasonably estimable at this time, this could require capital expenditures for environmental control facilities and/or the purchase of GHG emissions credits in the coming years. In addition, with respect to environmental matters, future claims may be asserted against us for, among other things, past acts or omissions at locations operated by predecessor entities, or alleging damage or injury or seeking other relief in connection with environmental matters associated with our operations. Future liabilities, claims, and compliance costs may have a material adverse effect on us because of potential adverse outcomes, defense costs, diversion of our resources, availability of insurance coverage, and other factors. The overall impact of these requirements on our operations could increase our costs and diminish our ability to compete with products that are produced in countries without such rigorous standards; the long run impact could negatively impact our results and have a material adverse effect on our business.
If we do not successfully execute or effectively operate, integrate, leverage and grow acquired businesses, our financial results may suffer.
Our strategy for long-term growth, productivity and profitability depends in part on our ability to make prudent strategic acquisitions and to realize the benefits we expect when we make those acquisitions. In furtherance of this strategy, over the past several years, we have acquired businesses in Europe, Canada, South Korea, the Middle East, and the United States.
While we currently anticipate that our past and future acquisitions will enhance our value proposition to customers and improve our long-term profitability, there can be no assurance that we will realize our expectations within the time frame we have established, if at all, or that we can continue to support the value we allocate to these acquired businesses, including their goodwill or other intangible assets.
We may be subject to risks relating to our information technology systems.
We rely on information technology systems to process, transmit and store electronic information and manage and operate our business. The incidence of cyber attacks, computer hacking, computer viruses, worms, and other disruptive software, denial of service attacks, and other malicious cyber activities are on the rise worldwide. A breach of our information technology systems or those of our commercial partnerscould expose us, our customers, our suppliers, and our employees to risks of misuse or improper
disclosure of data, business information (including intellectual property) and other confidential information. We operate globally, and the legal rules governing data storage and transfers are often complex, unclear, and changing. A breach could also result in manipulation and destruction of data, production downtimes and operations disruptions. Any such breaches or events could expose us to legal liability and adversely affect our reputation, competitive position, business or results of operations.
|
| |
| ITEM 1B. | UNRESOLVED STAFF COMMENTS |
None.
Information pertaining to our major operating facilities is included below. Except as noted, we own all of the principal properties. In addition, we own and/or lease other properties used as distribution centers and corporate offices. Our plants are in satisfactory condition and are suitable for the purpose for which they were designed and are now being used.
|
| | | | | | |
| Location of Facility | | Building Space (Sq. (Sq. Ft.) | | Primary Use | | Owned or Leased |
| |
| | | | | |
Piping Systems Segment | |
| Fulton, MS | | 649,500778,065 | | Manufacturing, Packaging, & Packaging | | 579,500 Owned; 70,000 Leased | |
New Market, VA | | 413,120 | | ManufacturingDistribution | | Owned | |
| Wynne, AR | | 400,000 | | Manufacturing & Distribution | | Owned | |
Ontario, CANew Market, VA | | 211,000 | | Manufacturing & Distribution | | Leased | |
Ansonia, CT | | 89,396413,120 | | Manufacturing & Distribution | | Owned | |
Location of Facility | | Building Space (Sq. Ft.) | | Primary Use | | Owned or Leased | |
| | | | | | | |
Piping Systems Segment (cont.)
| | | | | | | |
Covington, TN | | 159,500 | | Manufacturing | | Owned | |
Phoenix, AZ | | 61,000 | | Manufacturing | | Leased | |
Lawrenceville, GA | | 56,000 | | Manufacturing | | Leased | |
North Wales, PA | | 174,000 | | Manufacturing | | Owned | |
| Cedar City, UT | | 260,000 | | Manufacturing & Distribution | | Owned |
| North Wales, PA | | 174,000 | | Manufacturing | | Owned |
| Covington, TN | | 159,500 | | Manufacturing | | Owned |
| Ansonia, CT | | 89,396 | | Manufacturing & Distribution | | Owned |
| Phoenix, AZ | | 61,000 | | Manufacturing | | Leased |
| Lawrenceville, GA | | 42,000 | | Manufacturing | | Leased |
| Kansas City, MO | | 30,500 | | Manufacturing | | Leased |
| Bilston, England | | 402,500 | | Manufacturing | | Owned | |
| London, Ontario, Canada | | 200,400 | | Manufacturing | | LeasedOwned |
| Georgetown, Ontario, Canada | | 20,000 | | Manufacturing | | Leased |
| Calgary, Alberta, Canada | | 21,117 | | Manufacturing | | Leased |
| Calgary, Alberta, Canada | | 20,000 | | Manufacturing | | Leased |
| Calgary, Alberta, Canada | | 6,600 | | Manufacturing | | Leased |
| Monterrey, Mexico | | 152,000 | | Manufacturing | | Leased | |
Jintan City, Jiangsu Province,
China
Monterrey, Mexico | | 322,580132,000 | | Manufacturing | | Owned | Leased |
Yangju City, Gyeonggi Province, South Korea | | 343,909 | | Manufacturing | | Owned | |
| | | | | | | | |
Industrial Metals Segment | | | | | | |
| Port Huron, MI | | 450,000 | | Manufacturing | | Owned | |
| Belding, MI | | 293,068 | | Manufacturing | | Owned | |
Brighton, MI | | 65,000 | | Machining | | Leased | |
| Marysville, MI | | 81,500 | | Manufacturing | | Owned | |
| Brooklyn, OH | | 75,000 | | Manufacturing | | Leased | |
| Valley View, OH | | 65,400 | | Manufacturing & Distribution | | Leased | |
Middleton, OHBrighton, MI | | 55,00065,000 | | ManufacturingMachining | | Owned | |
Washington, PA | | 108,275 | | Manufacturing | | Owned | Leased |
| Waynesboro, TN | | 57,000 | | Manufacturing | | Leased |
| Middletown, OH | | 55,000 | | Manufacturing | | Owned |
| | | | | | | | |
Climate Segment | | | | | | |
| Plainville, GA | | 313,835 | | Manufacturing & Distribution | | Owned |
| Fort Worth, TX | | 266,485 | | Manufacturing | | Owned |
| Cartersville, GA | | 260,924 | | Manufacturing | | Owned |
| Phoenix, AZ | | 250,250 | | Manufacturing & Distribution | | Owned |
| Tampa , FL | | 202,614 | | Manufacturing & Distribution | | Owned |
| Crawsfordville, IN | | 153,600 | | Manufacturing & Distribution | | Owned |
| Fort Worth, TX | | 153,374 | | Manufacturing | | Owned |
| Vineland, NJ | | 136,000 | | Manufacturing & Distribution | | Owned |
| Sacramento, CA | | 121,240 | | Manufacturing & Distribution | | Owned |
|
| | | | | | |
| Location of Facility | | Building Space (Sq. Ft.) | | Primary Use | | Owned or Leased |
| Bluffs, IL | | 107,000 | | Manufacturing | | Owned |
| Fort Worth, TX | | 103,125 | | Manufacturing & Distribution | | Owned |
| Hickory, NC | | 100,000 | | Manufacturing | | Owned |
| Hartsville, TN | | 78,000 | | Manufacturing | | Owned |
| Houston, TX | | 72,000 | | Manufacturing & Distribution | | Owned |
| Carthage, TN | | 67,520 | | Manufacturing | | Owned | |
Bluffs, ILBaltimore, MD | | 107,00062,500 | | Manufacturing & Distribution | | Owned |
| Springdale, AR | | 57,600 | | Manufacturing & Distribution | | Owned |
| Gordonsville, TN | | 54,000 | | Manufacturing | | Leased | |
Bloomfield, CT | | 26,900 | | Manufacturing | | Leased | |
Carrolton,Carrollton, TX | | 9,230 | | Manufacturing | | Leased | |
Hickory, NC | | 100,000 | | Manufacturing | | Owned | |
| Guadalupe, Mexico | | 130,110 | | Manufacturing | | Leased | |
Xinbei District, Changzhou, China | | 33,940 | | Manufacturing | | Leased |
The Company is involved in certain litigation as a result of claims that arose in the ordinary course of business. Additionally, we may realize the benefit of certain legal claims and litigation in the future; these gain contingencies are not recognized in the Consolidated Financial Statements.
|
| |
| ITEM 4. | MINE SAFETY DISCLOSURES |
Not applicable.
PART II
|
| |
| ITEM 5. | MARKET FOR REGISTRANT'SREGISTRANT’S COMMON EQUITY, RELATED STOCKHOLDER MATTERS AND ISSUER PURCHASES OF EQUITY SECURITIES |
Our common stock is listed on the New York Stock Exchange (NYSE) under the symbol "MLI."“MLI.” As of February 24, 2017,21, 2020, the number of holders of record of Mueller'sMueller’s common stock was 770. The following table sets forth, for the periods indicated, the high674.
During fiscal 2018 and low sales prices as reported by the NYSE and the2019, we paid a quarterly cash dividends paiddividend of $0.10 per share of common stock.
| | | Sales Prices | | | | |
| | | High | | | Low | | | Dividend | |
| 2016 | | | | | | | | | |
| | | | | | | | | | |
| Fourth quarter | | $ | 41.27 | | | $ | 29.52 | | | $ | 0.100 | |
| Third quarter | | | 35.52 | | | | 31.38 | | | | 0.100 | |
| Second quarter | | | 32.74 | | | | 28.01 | | | | 0.100 | |
| First quarter | | | 29.86 | | | | 23.09 | | | | 0.075 | |
| | | | | | | | | | | | | |
| 2015 | | | | | | | | | | | | |
| | | | | | | | | | | | | |
| Fourth quarter | | $ | 33.04 | | | $ | 26.86 | | | $ | 0.075 | |
| Third quarter | | | 35.65 | | | | 28.94 | | | | 0.075 | |
| Second quarter | | | 37.18 | | | | 34.57 | | | | 0.075 | |
| First quarter | | | 36.47 | | | | 31.34 | | | | 0.075 | |
Payment of dividends in the future is dependent upon the Company'sCompany’s financial condition, cash flows, capital requirements, earnings, and other factors.
Issuer Purchases of Equity Securities
The Company'sCompany’s Board of Directors has extended, until October 2017,August 2020, the authorization to repurchase up to 20 million shares of the Company'sCompany’s common stock through open market transactions or through privately negotiated transactions. The Company has no obligation to purchase any shares and may cancel, suspend, or extend the time period for the purchase of shares at any time. Any purchasesrepurchases will be funded primarily through existing cash and cash from operations. The Company may hold any shares purchasedrepurchased in treasury or use a portion of the repurchased shares for its stock-based compensation plans, as well as for other corporate purposes. From its initial authorization in 1999 through December 31, 2016,28, 2019, the Company hadhas repurchased approximately 4.76.2 million shares under this authorization. Below is a summary of the Company'sCompany’s stock repurchases for the quarter ended December 31, 2016.28, 2019.
|
| | | | | | | | | | | | |
| | | (a) Total Number of Shares Purchased (1) | | (b) Average Price Paid per Share | | (c) Total Number of Shares Purchased as Part of Publicly Announced Plans or Programs | | (d) Maximum Number of Shares That May Yet Be Purchased Under the Plans or Programs (2) |
| | | | | | | | | |
| September 28, 2019 – October 26, 2019 | | — |
| | — |
| | — |
| | 13,822,567 |
|
| October 27, 2019 – November 23, 2019 | | 10,109 |
| | 32.09 |
| | — |
| | 13,822,567 |
|
| November 24, 2019 – December 28, 2019 | | 5,128 |
| | 32.34 |
| | — |
| | 13,822,567 |
|
| Total | | 15,237 |
| | | | — |
| | |
(1) Includes shares tendered to the Company by holders of stock-based awards in payment of the purchase price and/or withholding taxes upon exercise and/or vesting.
(2) Shares available to be purchased under the Company’s 20 million share repurchase authorization until August 2020. The extension of the authorization was announced on October 23, 2019.
| | | (a) | | | | | (b) | | | (c) | | | (d) | | | |
| | | Total Number of Shares Purchased | | | | | Average Price Paid per Share | | | Total Number of Shares Purchased as Part of Publicly Announced Plans or Programs | | | Maximum Number of Shares That May Yet Be Purchased Under the Plans or Programs | | | |
| | | | | | | | | | | | | | | 15,287,060 | | (1 | ) |
| October 2 – October 29, 2016 | | | — | | | | | $ | — | | | | — | | | | | | | |
| | | | | | | | | | | | | | | | | | | | | |
| October 30 – November 26, 2016 | | | — | | | | | | — | | | | — | | | | | | | |
| | | | | | | | | | | | | | | | | | | | | |
| November 27 – December 31, 2016 | | | 17,036 | | (2 | ) | | | 37.93 | | | | — | | | | | | | |
| | | | | | | | | | | | | | | | | | | | | |
(1) Shares available to be purchased under the Company's 20 million share repurchase authorization until October 2017. The extension of the authorization was announced on October 27, 2016. | |
| | |
| (2) Shares tendered to the Company by holders of stock-based awards in payment of purchase price and/or withholding taxes upon exercise and/or vesting. Also includes shares resulting from restricted stock forfeitures. | |
Company Stock Performance
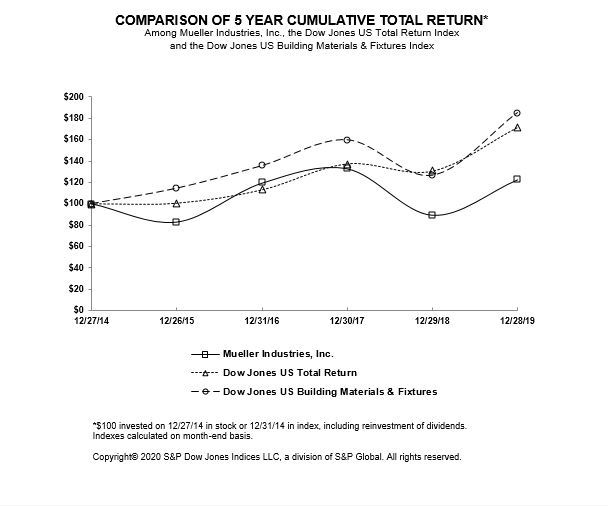
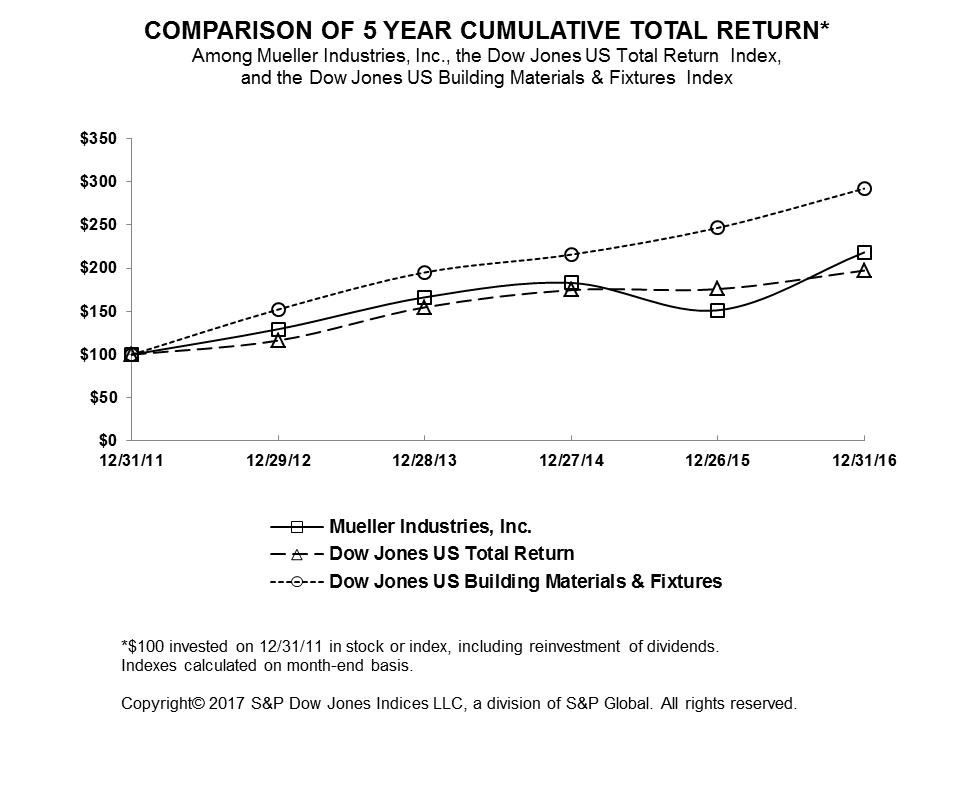
The following graph compares total stockholder return since December 31, 201127, 2014 to the Dow Jones U.S. Total Return Index (Total Return Index) and the Dow Jones U.S. Building Materials & Fixtures Index (Building Materials Index). Total return values for the Total Return Index, the Building Materials Index and the Company were calculated based on cumulative total return values assuming reinvestment of dividends.(i) regular quarterly dividends paid by the Company, (ii) the cash paid by the Company in conjunction with the special dividend and (iii) the proceeds of an assumed sale at par of the Debentures paid by the Company in connection with the special dividend.
| | | 2011 | | | 2012 | | | 2013 | | | 2014 | | | 2015 | | | 2016 | |
| Mueller Industries, Inc. | | | 100.00 | | | | 129.43 | | | | 166.33 | | | | 183.01 | | | | 151.28 | | | | 218.39 | |
| Dow Jones U.S. Total Return Index | | | 100.00 | | | | 116.32 | | | | 154.68 | | | | 174.71 | | | | 175.81 | | | | 197.35 | |
| Dow Jones U.S. Building Materials & Fixtures Index | | | 100.00 | | | | 152.21 | | | | 195.14 | | | | 215.75 | | | | 246.75 | | | | 292.28 | |
|
| | | | | | | | | | | | | | | | | | |
| | | 2014 | | 2015 | | 2016 | | 2017 | | 2018 | | 2019 |
| Mueller Industries, Inc. | | 100.00 |
| | 82.67 |
| | 119.33 |
| | 132.90 |
| | 89.09 |
| | 122.49 |
|
| Dow Jones U.S. Total Return Index | | 100.00 |
| | 100.63 |
| | 112.96 |
| | 137.24 |
| | 130.42 |
| | 171.04 |
|
| Dow Jones U.S. Building Materials & Fixtures Index | | 100.00 |
| | 114.37 |
| | 135.47 |
| | 159.65 |
| | 126.50 |
| | 185.11 |
|
|
| |
| ITEM 6. | SELECTED FINANCIAL DATA |
| (In thousands, except per share data) | 2016 | | | 2015 | | | 2014 | | | 2013 | | | 2012 | | |
| | | | | | | | | | | | | | | | | | |
For the fiscal year: (1) | | | | | | | | | | | | | | | |
| | | | | | | | | | | | | | | | | | |
| | | Net sales | $ | 2,055,622 | | | $ | 2,100,002 | | | $ | 2,364,227 | | | $ | 2,158,541 | | | $ | 2,189,938 | | |
| | | | | | | | | | | | | | | | | | | | | | | |
| | | Operating income | | 152,713 | | | | 137,268 | | | | 153,996 | | | | 270,937 | (5 | ) | | 126,705 | (6 | ) |
| | | | | | | | | | | | | | | | | | | | | | | |
| | | Net income attributable to Mueller Industries, Inc. | | 99,727 | (2 | ) | | 87,864 | (3 | ) | | 101,560 | (4 | ) | | 172,600 | | | | 82,395 | | |
| | | | | | | | | | | | | | | | | | | | | | | |
| | | Diluted earnings per share (8) | | 1.74 | | | | 1.54 | | | | 1.79 | | | | 3.06 | | | | 1.16 | (7 | ) |
| | | | | | | | | | | | | | | | | | | | | | | |
| | | Cash dividends per share (8) | | 0.375 | | | | 0.30 | | | | 0.30 | | | | 0.25 | | | | 0.2125 | | |
| | | | | | | | | | | | | | | | | | | | | | | |
| At year-end: | | | | | | | | | | | | | | | | | | | | |
| | | | | | | | | | | | | | | | | | | | | | | |
| | | Total assets | | 1,447,476 | | | | 1,338,801 | | | | 1,328,096 | | | | 1,247,767 | | | | 1,104,155 | | |
| | | | | | | | | | | | | | | | | | | | | | | |
| | | Long-term debt | | 213,709 | | | | 204,250 | | | | 205,250 | | | | 206,250 | | | | 207,300 | | |
| | | | | | | | | | | | | | | | | | | | | | | |
| | | | | | | | | | | | | | | | | | | | | | | |
| | (1 | ) | Includes activity of acquired businesses from the following purchase dates: Jungwoo Metal Ind. Co., LTD, April 26, 2016; Great Lakes Copper Ltd., July 31, 2015; Sherwood Valve Products, LLC, June 18, 2015; Turbotec Products, Inc., March 30, 2015; Yorkshire Copper Tube, February 28, 2014; Howell Metal Company, October 17, 2013; and Westermeyer Industries, Inc., August 16, 2012. | |
| | | | | |
| | (2 | ) | Includes pre-tax impairment charges of $6.8 million on fixed assets. | |
| | | | | |
| | (3 | ) | Includes $15.4 million pre-tax gain from the sale of certain assets, severance charges of $3.4 million and a permanent adjustment to a deferred tax liability of $4.2 million. | |
| | | | | |
| | (4 | ) | Includes $6.3 million pre-tax gain on sale of assets, reversal of valuation allowance of $5.7 million, and $7.3 million of pre-tax charges related to severance. | |
| | | | | |
| | (5 | ) | Includes $106.3 million pre-tax gain from settlement of insurance claims, $39.8 million pre-tax gain from the sale of the Company's Schedule 40 pressure plastic fittings business along with the sale of certain other plastic fittings manufacturing assets, and pre-tax impairment charges of $4.3 million primarily related to real property associated with the aforementioned plastics sale transaction. | |
| | | | | |
| | (6 | ) | Includes deferred recognition of $8.0 million gain from liquidation of LIFO inventory layers, $4.1 million net gain from settlement of litigation, $1.5 million gain from settlement of insurance claims, and severance charges of $3.4 million. | |
| | | | | |
| | (7 | ) | Includes the impact of 10.4 million shares repurchased from Leucadia National Corporation in September 2012. | |
| | | | | |
| | (8 | ) | Adjusted retroactively to reflect the two-for-one stock split that occurred on March 14, 2014. | |
|
| | | | | | | | | | | | | | | | | | | | |
| (In thousands, except per share data) | 2019 | | 2018 | | 2017 | | 2016 | | 2015 | |
| | | | | | | | | | | |
For the fiscal year: (1) | | | | | | | | | | |
| | | | | | | | | | | |
| Net sales | $ | 2,430,616 |
| | $ | 2,507,878 |
| | $ | 2,266,073 |
| | $ | 2,055,622 |
| | $ | 2,100,002 |
| |
| | | | | | | | | | | |
Operating income (2) | 191,403 |
| | 172,969 |
| | 150,807 |
| | 154,401 |
| | 138,704 |
| |
| | | | | | | | | | | |
| Net income attributable to Mueller Industries, Inc. | 100,972 |
| (3) | 104,459 |
| (4) | 85,598 |
| | 99,727 |
| (5) | 87,864 |
| (6) |
| | | | | | | | | | | |
Diluted earnings per share | 1.79 |
| | 1.82 |
| | 1.49 |
| | 1.74 |
| | 1.54 |
| |
| | | | | | | | | | | |
Cash dividends per share | 0.40 |
| | 0.40 |
| | 3.40 |
| | 0.375 |
| | 0.30 |
| |
| | | | | | | | | | | |
| At year-end: | | | | | | | |
| | |
| |
| | | | | | | | | | | |
| Total assets | 1,370,940 |
| | 1,369,549 |
| | 1,320,173 |
| | 1,447,476 |
| | 1,338,801 |
| |
| | | | | | | | | | | |
| Long-term debt | 378,724 |
| | 489,597 |
| | 448,592 |
| | 213,709 |
| | 204,250 |
| |
| | | | | | | | | | | |
| |
(1) | Includes activity of acquired businesses from the following purchase dates: ATCO Rubber Products, Inc., July 2, 2018; Die-Mold Tool Limited, March 31, 2018; Pexcor Manufacturing Company Inc. and Heatlink Group Inc., May 31, 2017; Jungwoo Metal Ind. Co., LTD, April 26, 2016; Great Lakes Copper Ltd., July 31, 2015; Sherwood Valve Products, LLC, June 18, 2015; and Turbotec Products, Inc., March 30, 2015. |
| |
(2) | Adjusted retroactively to reflect adoption of ASU 2017-07 that occurred during 2018. The components of net periodic benefit cost (income) other than the service cost component are included in other income (expense), net in the Consolidated Statements of Income. |
| |
(3) | Includes net expense of $3.6 million resulting from the change in fair value of contingent consideration. |
| |
(4) | Includes a pre-tax insurance recovery gain of $3.7 million related to the losses incurred due to the 2017 fire at the brass rod mill in Port Huron, Michigan. |
| |
(5) | Includes pre-tax impairment charges of $6.8 million on fixed assets. |
| |
(6) | Includes $15.4 million pre-tax gain from the sale of certain assets, severance charges of $3.4 million and a permanent adjustment to a deferred tax liability of $4.2 million. |
|
| |
| ITEM 7. | MANAGEMENT'SMANAGEMENT’S DISCUSSION AND ANALYSIS OF FINANCIAL CONDITION AND RESULTS OF OPERATIONS |
Management'sManagement’s discussion and analysis of financial condition and results of operations is contained under the caption "Financial Review"“Financial Review” submitted as a separate section of this Annual Report on Form 10-K commencing on page F-2.F-2.
|
| |
| ITEM 7A. | QUANTITATIVE AND QUALITATIVE DISCLOSURES ABOUT MARKET RISK |
Quantitative and qualitative disclosures about market risk are contained under the caption "Financial Review"“Financial Review” submitted as a separate section of this Annual Report on Form 10-K commencing on page F-2.F-2.
|
| |
| ITEM 8. | FINANCIAL STATEMENTS AND SUPPLEMENTARY DATA |
Financial Statements required by this item are contained in a separate section of this Annual Report on Form 10-K commencing on page F-18.F-17.
|
| |
| ITEM 9. | CHANGES IN AND DISAGREEMENTS WITH ACCOUNTANTS ON ACCOUNTING AND FINANCIAL DISCLOSURE |
None.
|
| |
| ITEM 9A. | CONTROLS AND PROCEDURES |
Evaluation of Disclosure Controls and Procedures
The Company maintains disclosure controls and procedures designed to ensure information required to be disclosed in Company reports filed under the Securities Exchange Act of 1934, as amended (the Exchange Act), is recorded, processed, summarized, and reported within the time periods specified in the SEC'sSEC’s rules and forms. Disclosure controls and procedures are designed to provide reasonable assurance that information required to be disclosed in Company reports filed under the Exchange Act is accumulated and communicated to management, including the Company'sCompany’s Chief Executive Officer and Chief Financial Officer, as appropriate, to allow timely decisions regarding required disclosure.
The Company'sCompany’s management, with the participation of the Company'sCompany’s Chief Executive Officer and Chief Financial Officer, has evaluated the effectiveness of the Company'sCompany’s disclosure controls and procedures pursuant to Rule 13a-15(e) of the Exchange Act as of December 31, 2016.28, 2019. Based on that evaluation, the Company'sCompany’s Chief Executive Officer and Chief Financial Officer have concluded that the Company'sCompany’s disclosure controls and procedures are effective as of December 31, 201628, 2019 to ensure that information required to be disclosed in Company reports filed under the Exchange Act is (i) recorded, processed, summarized and reported within the time periods specified in the SEC rules and forms and (ii) accumulated and communicated to management, including the Company'sCompany’s principal executive officer and principal financial officer, as appropriate to allow timely decisions regarding required disclosure.
Management'sManagement’s Report on Internal Control over Financial Reporting
The Company'sCompany’s management is responsible for establishing and maintaining adequate internal control over financial reporting as defined in Rules 13a-15(f) and 15d-15(f) under the Securities Exchange Act of 1934.Act. Pursuant to the rules and regulations of the SEC, internal control over financial reporting is a process designed by, or under the supervision of, the Company'sCompany’s principal executive and principal financial officers, and effected by the Company'sCompany’s Board of Directors, management and other personnel, to provide reasonable assurance regarding the reliability of financial reporting and the preparation of financial statements for external purposes in accordance with accounting principles generally accepted in the United States and includes those policies and procedures that (i) pertain to the maintenance of records that in reasonable detail accurately and fairly reflect the transactions and dispositions of the Company'sCompany’s assets; (ii) provide reasonable assurance that transactions are recorded as necessary to permit preparation of financial statements in accordance with generally accepted accounting principles, and that receipts and expenditures of the issuer are being made only in accordance with authorizations of the Company'sCompany’s management and directors; and (iii) provide reasonable assurance regarding prevention or timely detection of unauthorized acquisition, use or disposition of the Company'sCompany’s assets that could have a material effect on the financial statements. Due to inherent limitations, internal control over financial reporting may not prevent or detect misstatements. Further, because of changes in conditions, effectiveness of internal control over financial reporting may vary over time.
The Company acquired a 60 percent equity interest in Jungwoo Metal Ind. Co., LTD during 2016 and has excluded this business from management's assessment of internal controls. The total value of assets for this business at year-end was $49.7 million, which represents 3.4 percent of the Company's consolidated total assets at December 31, 2016. Net sales from the date of acquisition represents 1.1 percent of the consolidated net sales of the Company for 2016. Operating income from the date of acquisition represents 0.1 percent of the consolidated operating income of the Company for 2016. Accordingly, this acquired business is not included in the scope of this report.
As required by Rule 13a-15(c) under the Exchange Act, the Company'sCompany’s management, with the participation of the Company'sCompany’s Chief Executive Officer and Chief Financial Officer, has evaluated the effectiveness of the Company'sCompany’s internal control over financial reporting as of December 31, 201628, 2019 based on the control criteria established in a report entitled Internal Control—Integrated Framework, (2013 Framework) issued by the Committee of Sponsoring Organizations of the Treadway Commission (COSO). Based on such evaluation, management has concluded that our internal control over financial reporting was effective as of December 31, 2016.28, 2019.
Ernst & Young LLP, the independent registered public accounting firm that audited the Company'sCompany’s financial statements included in this Annual Report on Form 10-K, has issued an attestation report on the Company'sCompany’s internal control over financial reporting, which is included herein.
Changes in Internal Control Over Financial Reporting
There were no changes in the Company'sCompany’s internal control over financial reporting during the Company'sCompany’s fiscal quarter ended December 31, 2016,28, 2019, that have materially affected, or are reasonably likely to materially affect, the Company'sCompany’s internal control over financial reporting.
Report of Independent Registered Public Accounting Firm
TheTo the Stockholders and the Board of Directors and Stockholders of Mueller Industries, Inc.
Opinion on Internal Control over Financial Reporting
We have audited Mueller Industries, Inc.'s’s internal control over financial reporting as of December 31, 2016,28, 2019, based on criteria established in Internal Control—IntegratedControl-Integrated Framework issued by the Committee of Sponsoring Organizations of the Treadway Commission (2013 Framework)framework) (the COSO criteria). In our opinion, Mueller Industries, Inc.'s (the Company) maintained, in all material respects, effective internal control over financial reporting as of December 28, 2019, based onthe COSO criteria.
We also have audited, in accordance with the standards of the Public Company Accounting Oversight Board (United States) (PCAOB), the consolidated balance sheets of the Company as of December 28, 2019 and December 29, 2018, the related consolidated statements of income, comprehensive income, changes in equity and cash flows for each of the three years in the period ended December 28, 2019, and the related notes and financial statement schedule listed in the Index at Item 15(a) and our report dated February 26, 2020 expressed an unqualified opinion thereon.
Basis for Opinion
The Company’s management is responsible for maintaining effective internal control over financial reporting and for its assessment of the effectiveness of internal control over financial reporting included in the accompanying Management'sManagement’s Report on Internal Control over Financial Reporting. Our responsibility is to express an opinion on the company'sCompany’s internal control over financial reporting based on our audit. We are a public accounting firm registered with the PCAOB and are required to be independent with respect to the Company in accordance with the U.S. federal securities laws and the applicable rules and regulations of the Securities and Exchange Commission and the PCAOB.
We conducted our audit in accordance with the standards of the Public Company Accounting Oversight Board (United States).PCAOB. Those standards require that we plan and perform the audit to obtain reasonable assurance about whether effective internal control over financial reporting was maintained in all material respects.
Our audit included obtaining an understanding of internal control over financial reporting, assessing the risk that a material weakness exists, testing and evaluating the design and operating effectiveness of internal control based on the assessed risk, and performing such other procedures as we considered necessary in the circumstances. We believe that our audit provides a reasonable basis for our opinion.
Definition and Limitations of Internal Control Over Financial Reporting
A company'scompany’s internal control over financial reporting is a process designed to provide reasonable assurance regarding the reliability of financial reporting and the preparation of financial statements for external purposes in accordance with generally accepted accounting principles. A company'scompany’s internal control over financial reporting includes those policies and procedures that (1) pertain to the maintenance of records that, in reasonable detail, accurately and fairly reflect the transactions and dispositions of the assets of the company; (2) provide reasonable assurance that transactions are recorded as necessary to permit preparation of financial statements in accordance with generally accepted accounting principles, and that receipts and expenditures of the company are being made only in accordance with authorizations of management and directors of the company; and (3) provide reasonable assurance regarding prevention or timely detection of unauthorized acquisition, use, or disposition of the company'scompany’s assets that could have a material effect on the financial statements.
Because of its inherent limitations, internal control over financial reporting may not prevent or detect misstatements. Also, projections of any evaluation of effectiveness to future periods are subject to the risk that controls may become inadequate because of changes in conditions, or that the degree of compliance with the policies or procedures may deteriorate.
As indicated in the accompanying Management's Report on Internal Control over Financial Reporting, management's assessment of and conclusion on the effectiveness of internal control over financial reporting did not include the internal controls of Jungwoo Metal Ind. Co., LTD, which is included in the 2016 consolidated financial statements of Mueller Industries, Inc. and constituted $49.7 million and $32.7 million of total and net assets, respectively, as of December 31, 2016, and $22.0 million and $0.2 million of net sales and operating income, respectively, for the year then ended. Our audit of internal control over financial reporting of Mueller Industries, Inc. also did not include an evaluation of the internal control over financial reporting of Jungwoo Metal Ind. Co., LTD.
In our opinion, Mueller Industries, Inc. maintained, in all material respects, effective internal control over financial reporting as of December 31, 2016, based on the COSO criteria.
We also have audited, in accordance with the standards of the Public Company Accounting Oversight Board (United States), the consolidated balance sheets of Mueller Industries, Inc. as of December 31, 2016 and December 26, 2015, and the related consolidated statements of income, comprehensive income, changes in equity and cash flows for each of the three years in the period ended December 31, 2016 and our report dated March 1, 2017 expressed an unqualified opinion thereon.
|
| |
| Memphis, Tennessee | |
| March 1, 2017February 26, 2020 | |
|
| |
| ITEM 9B. | OTHER INFORMATION |
None.
PART III
|
| |
| ITEM 10. | DIRECTORS, EXECUTIVE OFFICERS, AND CORPORATE GOVERNANCE |
The information required by Item 10 is contained under the captions "Ownership“Ownership of Common Stock by Directors and Executive Officers and Information about Director Nominees," "Corporate” “Corporate Governance," "Report” “Report of the Audit Committee of the Board of Directors,"” and "Section“Section 16(a) Beneficial Ownership Compliance Reporting"Reporting” in the Company'sCompany’s Proxy Statement for its 20172020 Annual Meeting of Stockholders to be filed with the SEC on or about March 30, 2017,26, 2020, which is incorporated herein by reference.
The Company has adopted a Code of Business Conduct and Ethics that applies to its chief executive officer, chief financial officer, and other financial executives. We have also made the Code of Business Conduct and Ethics available on the Company'sCompany’s website at www.muellerindustries.com.
|
| |
| ITEM 11. | EXECUTIVE COMPENSATION |
The information required by Item 11 is contained under the caption "Compensation“Compensation Discussion and Analysis," "Summary” “Summary Compensation Table for 2016," "20162019,” “2019 Grants of Plan Based Awards Table," "Outstanding” “Outstanding Equity Awards at Fiscal 20162019 Year-End," "2016” “2019 Option Exercises and Stock Vested," "Potential” “Potential Payments Upon Termination of Employment or Change in Control as of the End of 2016," "20162019,” “2019 Director Compensation," "Report” “Report of the Compensation Committee of the Board of Directors on Executive Compensation"Compensation” and "Corporate Governance"“Corporate Governance” in the Company'sCompany’s Proxy Statement for its 20172020 Annual Meeting of Stockholders to be filed with the SEC on or about March 30, 2017,26, 2020, which is incorporated herein by reference.
|
| |
| ITEM 12. | SECURITY OWNERSHIP OF CERTAIN BENEFICIAL OWNERS AND MANAGEMENT AND RELATED STOCKHOLDER MATTERS |
Equity Compensation Plan Information
The following table discloses information regarding the securities to be issued and the securities remaining available for issuance under the Registrant'sRegistrant’s stock-based incentive plans as of December 31, 201628, 2019 (shares in thousands):
| | (a) | | (b) | | (c) | |
| Plan category | Number of securities to be issued upon exercise of outstanding options, warrants, and rights | | Weighted average exercise price of outstanding options, warrants, and rights | | Number of securities remaining available for future issuance under equity compensation plans (excluding securities reflected in column (a)) | |
| | | | | | | |
| Equity compensation plans approved by security holders | | | 1,034 | | | $ | 21.24 | | | | 1,017 | |
| | | | | | | | | | | | | |
| Equity compensation plans not approved by security holders | | | — | | | | — | | | | — | |
| | | | | | | | | | | | | |
| Total | | | 1,034 | | | $ | 21.24 | | | | 1,017 | |
|
| | | | | | | | | | |
| | | (a) | | (b) | | (c) |
| Plan category | | Number of securities to be issued upon exercise of outstanding options, warrants, and rights | | Weighted average exercise price of outstanding options, warrants, and rights | | Number of securities remaining available for future issuance under equity compensation plans (excluding securities reflected in column (a)) |
| | | | | | | |
| Equity compensation plans approved by security holders | | 939 |
| | $ | 25.05 |
| | 1,900 |
|
| | | | | | | |
| Equity compensation plans not approved by security holders | | — |
| | — |
| | — |
|
| | | | | | | |
| Total | | 939 |
| | $ | 25.05 |
| | 1,900 |
|
Other information required by Item 12 is contained under the captions "Principal Stockholders"“Principal Stockholders” and "Ownership“Ownership of Common Stock by Directors and Executive Officers and Information about Director Nominees"Nominees” in the Company'sCompany’s Proxy Statement for its 2017
2020 Annual Meeting of Stockholders to be filed with the SEC on or about March 30, 2017,26, 2020, which is incorporated herein by reference.
|
| |
| ITEM 13. | CERTAIN RELATIONSHIPS AND RELATED TRANSACTIONS, AND DIRECTOR INDEPENDENCE |
The information required by Item 13 is contained under the caption "Corporate Governance"“Corporate Governance” in the Company'sCompany’s Proxy Statement for its 20172020 Annual Meeting of Stockholders to be filed with the SEC on or about March 30, 2017,26, 2020, which is incorporated herein by reference.
|
| |
| ITEM 14. | PRINCIPAL ACCOUNTING FEES AND SERVICES |
The information required by Item 14 is contained under the caption "Appointment“Appointment of Independent Registered Public Accounting Firm"Firm” in the Company'sCompany’s Proxy Statement for its 20172020 Annual Meeting of Stockholders to be filed with the SEC on or about March 30, 2017,26, 2020, which is incorporated herein by reference.
PART IV
|
| |
| ITEM 15. | EXHIBITS, FINANCIAL STATEMENT SCHEDULES |
| |
| (a) | The following documents are filed as part of this report: | |
| | |
| 1. | Financial Statements: the financial statements, notes, and report of independent registered public accounting firm described in Item 8 of this Annual Report on Form 10-K are contained in a separate section of this Annual Report on Form 10-K commencing on page F-1.F-1. |
| |
| | |
| 2. | Financial Statement Schedule: the financial statement schedule described in Item 8 of this report is contained in a separate section of this Annual Report on Form 10-K commencing on page F-1.F-1. |
Certificate of Incorporation and Bylaws
Long-Term Debt Instruments
| |
| 4.3 | Certain instruments with respect to long-term debt of the Registrant have not been filed as Exhibits to this Report since the total amount of securities authorized under any such instruments does not exceed 10 percent of the total assets of the Registrant and its subsidiaries on a consolidated basis. The Registrant agrees to furnish a copy of each such instrument upon request of the SEC. |
Consulting, Employment, and Compensatory Plan Agreements
| | |
| 10.1 | Amended and Restated Consulting Agreement, dated October 25, 2007, by and between the Registrant and Harvey Karp (Incorporated herein by reference to Exhibit 10.2 of the Registrant's Current Report on Form 8-K, dated October 25, 2007). | |
| | | |
| 10.2 | Amendment No. 1, dated December 2, 2008, to the Amended and Restated Consulting Agreement, dated October 25, 2007, by and between the Registrant and Harvey Karp (Incorporated herein by reference to Exhibit 10.7 of the Registrant's Annual Report on Form 10-K, dated February 24, 2009, for the fiscal year ended December 27, 2008). | |
| | | |
| 10.3 | Letter Agreement with Harvey Karp, dated as of May 11, 2011 (Incorporated herein by reference to Exhibit 10.1 of the Registrant's Current Report on Form 8-K, dated May 16, 2011). | |
| | | |
| 10.4 | Amended and Restated Employment Agreement, effective October 30, 2008, by and between the Registrant and Gregory L. Christopher (Incorporated herein by reference to Exhibit 10.1 of the Registrant's Current Report on Form 8-K, dated December 26, 2008). | |
| | | |
| 10.5 | Amendment No. 1 to Amended and Restated Employment Agreement by and between the Registrant and Gregory L. Christopher, dated February 14, 2013 (Incorporated herein by reference to Exhibit 10.1 of the Registrant's Current Report on Form 8-K, dated February 14, 2013). | |
| 10.6
| | |
| Amendment No. 2 to Amended and Restated Employment Agreement by and between the Registrant and Gregory L. Christopher, dated July 26, 2016 (Incorporated herein by reference to Exhibit 10.2 of the Registrant's Quarterly Report on Form 10-Q, for the period ended July 2, 2016, dated July 28, 2016). | |
| |
| 10.9 | | | |
| 10.14 | Amended CreditChange in Control Agreement, dated as of March 7, 2011, amongeffective July 26, 2016 by and between the Registrant (as Borrower) and Bank of America, N.A. (as agent), and certain lenders named therein, following adoption of Amendment No. 2 dated December 11, 2012Brian K. Barksdale (Incorporated herein by reference to Exhibit 10.2010.3 of the Registrant's Annual Report on Form 10-K, dated February 27, 2013, for the fiscal year ended December 29, 2012). | |
| | | |
| 10.15 | Amendment No. 1 to Credit Agreement among the Registrant (as borrower), Bank of America, N.A. (as agent), and certain lenders named therein dated August 12, 2011 (Incorporated herein by reference to Exhibit 10.1 of the Registrant's Quarterly Report on Form 10-Q, for the Quarterly period ended October 1, 2011, dated October 27, 2011). | |
| | | |
| 10.16 | Amendment No. 2 to Credit Agreement among the Registrant (as borrower), Bank of America, N.A. (as agent), and certain lenders named therein dated December 11, 2012 (Incorporated herein by reference to Exhibit 10.22 of the Registrant's Annual Report on Form 10-K, dated February 27, 2013, for the fiscal year ended December 29, 2012). | |
| | | |
| 10.17 | Amendment No. 3 to Credit Agreement among the Registrant (as borrower), Bank of America, N.A. (as agent), and certain lenders named therein dated July 26, 2016 (Incorporated herein by reference to Exhibit 10.1 of the Registrant'sRegistrant’s Quarterly Report on Form 10-Q, for the period ended July 2, 2016, dated July 28, 2016). |
Financing Agreements
Other Exhibits
| | |
| 10.19 | Change in Control Agreement, effective July 26, 2016 by and between the Registrant and Brian K. Barksdale (Incorporated herein by reference to Exhibit 10.3 of the Registrant's Quarterly Report on Form 10-Q, for the period ended July 2, 2016, dated July 28, 2016). | |
| | | |
| 10.20 | Change in Control Agreement, effective July 26, 2016 by and between the Registrant and Daniel R. Corbin (Incorporated herein by reference to Exhibit 10.4 of the Registrant's Quarterly Report on Form 10-Q, for the period ended July 2, 2016, dated July 28, 2016). | |
| | | |
| 10.21 | Change in Control Agreement, effective July 26, 2016 by and between the Registrant and Jeffrey A. Martin (Incorporated herein by reference to Exhibit 10.5 of the Registrant's Quarterly Report on Form 10-Q, for the period ended July 2, 2016, dated July 28, 2016). | |
| | | |
| 10.22 | Change in Control Agreement, effective July 26, 2016 by and between the Registrant and Mark Millerchip (Incorporated herein by reference to Exhibit 10.6 of the Registrant's Quarterly Report on Form 10-Q, for the period ended July 2, 2016, dated July 28, 2016). | |
| | | |
| 10.23 | Change in Control Agreement, effective July 26, 2016 by and between the Registrant and Nicholas W. Moss (Incorporated herein by reference to Exhibit 10.7 of the Registrant's Quarterly Report on Form 10-Q, for the period ended July 2, 2016, dated July 28, 2016). | |
| | | |
| 10.24 | Change in Control Agreement, effective July 26, 2016 by and between the Registrant and Steffen Sigloch (Incorporated herein by reference to Exhibit 10.8 of the Registrant's Quarterly Report on Form 10-Q, for the period ended July 2, 2016, dated July 28, 2016). | |
| | | |
| 10.25 | Change in Control Agreement, effective January 3, 2017 by and between the Registrant and Christopher J. Miritello. | |
| | | |
| 21.0 | |
| |
| | | |
| 101.CAL | XBRL Taxonomy Extension Calculation Linkbase |
| |
| | | |
| 101.DEF | XBRL Taxonomy Extension Definition Linkbase |
| |
| | | |
| 101.INS | XBRL Instance Document |
| |
| | | |
| 101.LAB | XBRL Taxonomy Extension Label Linkbase |
| |
| | | |
| 101.PRE | XBRL Presentation Linkbase Document |
| |
| | | |
| 101.SCH | XBRL Taxonomy Extension Schema | |
|
| |
| ITEM 16. | Form 10-K Summary |
None.
Pursuant to the requirements of Section 13 or 15(d) of the Securities Exchange Act of 1934, the Registrant has duly caused this report to be signed on its behalf by the undersigned, thereunto duly authorized, on March 1, 2017.February 26, 2020.
MUELLER INDUSTRIES, INC.
|
| | |
| | /s/Gregory L. Christopher | |
| | Gregory L. Christopher, Chief Executive Officer (Principal Executive Officer) and Chairman of the Board | |
Pursuant to the requirements of the Securities Exchange Act of 1934, this report has been signed below by the following persons on behalf of the Registrant and in the capacities and on the date indicated.
Signature
|
| Title
|
|
| Signature | Title | Date |
| | | |
/s/Gregory L. Christopher Gregory L. Christopher | Chief Executive Officer (Principal Executive Officer) and Chairman of the Board | March 1, 2017February 26, 2020 |
| | | |
/s/Terry Hermanson | Lead Independent Director | February 26, 2020 |
| Terry Hermanson | | |
| | | |
/s/Elizabeth Donovan | Director | February 26, 2020 |
| Elizabeth Donovan | | |
| | |
/s/Gary S. Gladstein | Lead Independent Director | March 1, 2017February 26, 2020 |
| Gary S. Gladstein | | |
| | | |
/s/Paul J. Flaherty | Director | March 1, 2017February 26, 2020 |
| Paul J. Flaherty | | |
| | | |
/s/Gennaro J. Fulvio | Director | March 1, 2017February 26, 2020 |
| Gennaro J. Fulvio | | |
| | | |
/s/Scott J. Goldman | Director | March 1, 2017February 26, 2020 |
| Scott J. Goldman | | |
| | | |
/s/John B. Hansen | Director | March 1, 2017February 26, 2020 |
| John B. Hansen | | |
| | | |
/s/Terry HermansonCharles P. Herzog, Jr. | Director | March 1, 2017February 26, 2020 |
Terry Hermanson | | |
| Charles P. Herzog, Jr. | | |
Pursuant to the requirements of the Securities Exchange Act of 1934, this report has been signed below by the following persons on behalf of the Registrant and in the capacities and on the date indicated.
|
|
| |
| Signature and Title | Date |
| | | |
| | /s/Jeffrey A. Martin | March 1, 2017February 26, 2020 |
| | Jeffrey A. Martin | |
| | Chief Financial Officer and Treasurer | |
| | (Principal Financial and Accounting Officer) | |
| | | |
| | /s/Anthony J. Steinriede | March 1, 2017February 26, 2020 |
| | Anthony J. Steinriede | |
| | Vice President – Corporate Controller | |
MUELLER INDUSTRIES, INC.
INDEX TO CONSOLIDATED FINANCIAL STATEMENTS
|
| |
| | |
| |
| | |
| |
for the years ended December 31, 2016,28, 2019, December 26, 2015,29, 2018, and December 27, 201430, 2017 | |
| |
| |
| |
| | |
| |
| |
| | |
| |
| |
| |
| |
| |
| | |
| |
| | |
| |
| |
| |
| |
| |
| | |
FINANCIAL STATEMENT SCHEDULE
|
| |
| |
Schedule for the years ended December 31, 2016,28, 2019, December 26, 2015,29, 2018, and December 27, 2014 30, 2017 |
| | |
| |
| |
The Financial Review section of our Annual Report on Form 10-K consists of the following: Management'sManagement’s Discussion and Analysis of Results of Operations and Financial Condition (MD&A), the Consolidated Financial Statements, and Other Financial Information, all of which include information about our significant accounting policies, practices, and the transactions that impact our financial results. The following MD&A describes the principal factors affecting the results of operations, liquidity and capital resources, contractual cash obligations, and the critical accounting estimates of the Company. The discussion in the Financial Review section should be read in conjunction with the other sections of this Annual Report, particularly "Item“Item 1: Business"Business” and our other detailed discussion of risk factors included in this MD&A.
OverviewOVERVIEW
We are a leading manufacturer of copper, brass, aluminum, and plastic products. The range of these products we manufacture is broad: copper tube and fittings; line sets; brass and copper alloy rod, bar, and shapes; aluminum and brass forgings; aluminum impact extrusions; PEX plastic fittingstube and valves;fittings; refrigeration valves and fittings; compressed gas valves; fabricated tubular products; pressure vessels; steel nipples; and steel nipples.insulated flexible duct systems. We also resell imported brass and plastic plumbing valves, plastic fittings, malleable iron fittings, faucets and plumbing specialty products. Mueller'sMueller’s operations are located throughout the United States and in Canada, Mexico, Great Britain, South Korea, the Middle East, and China.
During the first quarter of 2016, we made changes to our management reporting structure as a result of a change in the way the Chief Executive Officer, who serves as the Chief Operating Decision Maker, manages and evaluates the business, makes key operating decisions, and allocates resources. Previously, we had two reportable segments: Plumbing & Refrigeration and OEM. During the first quarter, we realigned our operating segments into three reportable segments: Piping Systems, Industrial Metals, and Climate. The changes to the reporting structure resulted from management's decision to operationally separate certain businesses in order to enhance the level of focus on those businesses. This included the appointment of separate management teams. In addition, as a result of several acquisitions, we separated certain businesses with similar characteristics to create the Climate and Industrial Metals segments. These businesses were previously aggregated within the OEM segment. Management has recast certain prior year amounts to conform to the current year presentation. Each of the reportable segments is composed of certain operating segments that are aggregated primarily by the nature of products offered as follows:
· | Piping Systems: The Piping Systems segment is composed of Domestic Piping Systems Group, Canadian Operations,Piping Systems: The Piping Systems segment is composed of Domestic Piping Systems Group, Great Lakes Copper, Heatlink Group, Die-Mold, European Operations, Trading Group, Mueller-Xingrong (our Chinese joint venture), and Jungwoo-Mueller (our South Korean joint venture). The Domestic Piping Systems Group manufactures copper tube, fittings, and line sets. These products are manufactured in the U.S., sold in the U.S., and exported to markets worldwide. Great Lakes Copper manufactures copper tube and line sets in Canada and sells the products primarily in the U.S. and Canada. Heatlink Group manufactures a complete line of products for PEX plumbing and radiant systems in Canada and sells these products in Canada and the U.S. Die-Mold manufactures PEX and other plumbing-related fittings and plastic injection tooling in Canada and sells these products in Canada and the U.S. European Operations manufacture copper tube in the United Kingdom, which is sold throughout Europe. The Trading Group manufactures pipe nipples and sources products for import distribution in North America. Jungwoo-Mueller manufactures copper-based joining products that are sold worldwide. The Piping Systems segment sells products to wholesalers in the plumbing and refrigeration markets, distributors to the manufactured housing and recreational vehicle industries, building material retailers, and air-conditioning original equipment manufacturers (OEMs). The Domestic Piping Systems Group manufactures copper tube and fittings, plastic fittings, and line sets. These products are manufactured in the U.S., sold in the U.S., and exported to markets worldwide. The Canadian Operations manufacture copper tube and line sets in Canada and sell the products primarily in the U.S. and Canada. European Operations manufacture copper tube in the United Kingdom, which is sold throughout Europe. The Trading Group manufactures pipe nipples and sources products for import distribution in North America. Mueller-Xingrong manufactures engineered copper tube primarily for air-conditioning applications; these products are sold primarily to OEMs located in China. Jungwoo-Mueller manufactures copper-based joining products that are sold worldwide. The Piping Systems segment sells products to wholesalers in the plumbing and refrigeration markets, distributors to the manufactured housing and recreational vehicle industries, building material retailers, and air-conditioning OEMs.
|
· | Industrial Metals: The Industrial Metals segment is composed of Brass Rod & Copper Bar Products, Impacts & Micro Gauge, and Brass Value-Added Products. The segment manufactures and sells brass and copper alloy rod, bar, and shapes; aluminum and brass forgings; aluminum impact extrusions; and gas valves and assemblies. The segment manufactures and sells its products primarily to domestic OEMs in the industrial, construction, heating, ventilation, and air-conditioning, plumbing, and refrigeration markets. |
The Company disposed of Mueller-Xingrong (the Company’s Chinese joint venture) on June 21, 2017. This business manufactured engineered copper tube primarily for air-conditioning applications in China.
· | Climate: The Climate segment is composed of Refrigeration Products, Fabricated Tube Products, Westermeyer, and Turbotec. The segment manufactures and sells refrigeration valves and fittings and fabricated tubular products. The segment sells its products primarily to the heating, ventilation, air-conditioning, and refrigeration markets in the U.S. |
Industrial Metals: The Industrial Metals segment is composed of Brass Rod & Copper Bar Products, Impacts & Micro Gauge, and Brass Value-Added Products. The segment manufactures and sells brass and copper alloy rod, bar, and shapes; aluminum and brass forgings; aluminum impact extrusions; and gas valves and assemblies. The segment manufactures and sells its products primarily to domestic OEMs in the industrial, transportation, construction, heating, ventilation, and air-conditioning, plumbing, refrigeration, and energy markets.
Climate: The Climate segment is composed of Refrigeration Products, Fabricated Tube Products, Westermeyer, Turbotec, ATCO, and Linesets, Inc. The segment manufactures and sells refrigeration valves and fittings, line sets, fabricated tubular products, high pressure components, coaxial heat exchangers, and insulated HVAC flexible duct systems. The segment sells its products primarily to the heating, ventilation, air-conditioning, and refrigeration markets in the U.S.
New housing starts and commercial construction are important determinants of the Company'sour sales to the heating, ventilation, and air-conditioning, refrigeration, and plumbing markets because the principal end use of a significant portion of our products is in the construction of single and multi-family housing and commercial buildings. Repairs and remodeling projects are also important drivers of underlying demand for these products. In addition, our products are used in various transportation, automotive, and industrial applications.
Residential construction activity has shown improvement in recent years, but remains at levels below long-term historical averages. Continued improvement is expected, but may be tempered by continuing low labor participation rates, the pace of household formations, and tighter lending standards. Per the U.S. Census Bureau, actual housing starts in the U.S. were 1.21.29 million in 2016,2019, which compares to 1.11.25 million in 2015 2018
and 1.01.20 million in 2014.2017. Mortgage rates remain at historically low levels, as the average 30-year fixed mortgage rate was approximately 3.653.94 percent in 20162019 and 3.854.54 percent in 2015.
2018. The private nonresidential construction sector, which includes offices, industrial, health care, and retail projects, has also shown improvement in recent years. Per the U.S. Census Bureau, the value of private nonresidential construction put in place was $420.1$450.5 billion in 2016, $389.92019, $450.9 billion in 2015,2018, and $359.7$444.0 billion in 2014. We expect that most of these conditions will continue to improve.2017.
Profitability of certain of our product lines depends upon the "spreads"“spreads” between the cost of raw material and the selling prices of our products. The open market prices for copper cathode and copper and brass scrap, for example, influence the selling price of copper tube aand brass rod, two principal productproducts manufactured by the Company. We attempt to minimize the effects on profitability from fluctuations in material costs by passing through these costs to our customers. Our earnings and cash flow are dependent upon these spreads that fluctuate based upon market conditions.
Earnings and profitability are also impacted by unit volumes that are subject to market trends, such as substitute products, imports, technologies, and market share. In our core product lines, we intensively manage our pricing structure while attempting to maximize profitability. From time-to-time, this practice results in lost sales opportunities and lower volume. For plumbing systems, plastics are the primary substitute product; these products represent an increasing share of consumption. U.S. consumption of copper tube is still predominantly supplied by U.S. manufacturers. For certain air-conditioning and refrigeration applications, aluminum based systems are the primary substitution threat. We cannot predict the acceptance or the rate of switching that may occur. U.S. consumption of copper tube and brass rod is still predominantly supplied by U.S. manufacturers. In the last decade,recent years, brass rod consumption in the U.S. has declined due to the outsourcing of many manufactured products from offshore regions.
Results of OperationsRESULTS OF OPERATIONS
Consolidated Results
The following table compares summary operating results for 2016, 2015,2019, 2018, and 2014:2017:
| | | | | | | | | Percent Change | |
| (In thousands) | | 2016 | | 2015 | | 2014 | | 2016 vs. 2015 | | 2015 vs. 2014 | |
| | | | | | | | | | | | |
| Net sales | | $ | 2,055,622 | | | $ | 2,100,002 | | | $ | 2,364,227 | | | | (2.1 | )% | | | (11.2 | )% |
| Operating income | | | 152,713 | | | | 137,268 | | | | 153,996 | | | | 11.3 | | | | (10.9 | ) |
| Net income | | | 99,727 | | | | 87,864 | | | | 101,560 | | | | 13.5 | | | | (13.5 | ) |
|
| | | | | | | | | | | | | | | | | | |
| | | | | | | | | Percent Change |
| (In thousands) | | 2019 | | 2018 | | 2017 | | 2019 vs. 2018 | | 2018 vs. 2017 |
| | | | | | | | | | | |
| Net sales | | $ | 2,430,616 |
| | $ | 2,507,878 |
| | $ | 2,266,073 |
| | (3.1 | )% | | 10.7 | % |
| Operating income | | 191,403 |
| | 172,969 |
| | 150,807 |
| | 10.7 |
| | 14.7 |
|
| Net income | | 100,972 |
| | 104,459 |
| | 85,598 |
| | (3.3 | ) | | 22.0 |
|
The following are components of changes in net sales compared to the prior year:
| | | 2016 vs. 2015 | | | 2015 vs. 2014 | | |
| | | | | | | | |
| Net selling price in core product lines | | (9.0 | ) | % | | | (9.4 | ) | % |
| Unit sales volume in core product lines | | (1.6 | ) | | | | (3.4 | ) | |
| Acquisitions and new products | | 9.0 | | | | | 5.8 | | |
| Dispositions | | — | | | | | (2.6 | ) | |
| Other | | (0.5 | ) | | | | (1.6 | ) | |
| | | | | | | | | | |
| | | (2.1 | ) | % | | | (11.2 | ) | % |
|
| | | | | | |
| | | 2019 vs. 2018 | | 2018 vs. 2017 |
| | | | | |
| Net selling price in core product lines | | (3.7 | )% | | 4.4 | % |
| Unit sales volume in core product lines | | (4.4 | ) | | 3.6 |
|
| Acquisitions | | 4.2 |
| | 4.7 |
|
| Dispositions | | — |
| | (3.0 | ) |
| Other | | 0.8 |
| | 1.0 |
|
| | | | | |
| | | (3.1 | )% | | 10.7 | % |
The decrease in net sales in 20162019 was primarily due to (i) lower unit sales volume of $110.3 million in our core product lines, primarily brass rod and copper tube, and (ii) lower net selling prices of $189.0$91.7 million in our core product lines. These decreases were partially offset by (i) incremental sales of $100.1 million recorded by ATCO, acquired in July 2018, (ii) an increase in sales in our non-core product lines of $22.4 million, and (iii) incremental sales of $4.0 million recorded by Die-Mold, acquired in March 2018.
The increase in net sales in 2018 was primarily due to (i) higher unit sales volume of $126.2 million in our domestic core product lines, primarily copper tube and brass rod, (ii) higher net selling prices of $99.8 million in our core product lines, (iii) sales of $90.0 million recorded by ATCO, acquired in July 2018, (iv) an increase in sales in our non-core product lines of $21.2 million,
(v) incremental sales of $9.6 million of recorded by Heatlink Group, acquired in May 2017, and (vi) sales of $6.8 million recorded by Die-Mold, acquired in March 2018. These increases were partially offset by (i) the absence of sales of $67.3 million recorded by Mueller-Xingrong, a business we sold during June 2017, and (ii) lower unit sales volume of $33.0$44.5 million in our non-domestic core product lines. The decrease in net sales resulting from lower net selling prices also reflects the impact of translating net sales of the Company's foreign operations to U.S. dollars, which was approximately $43.6 million. These decreases were partially offset by (i) $139.4 million of incremental sales recorded by Great Lakes Copper Ltd. (Great Lakes), acquired in July 2015, (ii) $22.0 million of sales recorded by Jungwoo-Mueller, acquired in April 2016, (iii) $19.2 million of incremental sales recorded by Sherwood Valve LLC (Sherwood), acquired in June 2015, and (iv) $3.5 million of incremental sales recorded by Turbotec Products, Inc. (Turbotec), acquired in March 2015.
The decrease in net sales in 2015 was primarily due to (i) lower net selling prices of $218.3 million in our core product lines, primarily copper tube and brass rod, (ii) lower unit sales volume of $79.9 million in our core product lines, primarily in the Industrial Metals segment, and (iii) the absence of sales of $57.5 million recorded by Primaflow, a business we sold during November 2014. These decreases were offset by (i) $90.5 million of sales recorded by Great Lakes, (ii) $20.8 million of sales recorded by Sherwood, and (iii) $16.8 million of sales recorded by Turbotec, all of which were businesses acquired during 2015.
Net selling prices generally fluctuate with changes in raw material costs. Changes in raw material costs are generally passed through to customers by adjustments to selling prices. The following graph shows the Comex average copper price per pound by quarter for the most recent three-year period:
The following tables compare cost of goods sold and operating expenses as dollar amounts and as a percent of net sales for 2016, 2015,2019, 2018, and 2014:2017:
|
| | | | | | | | | | | | |
| (In thousands) | | 2019 | | 2018 | | 2017 |
| | | | | | | |
| Cost of goods sold | | $ | 2,035,610 |
| | $ | 2,150,400 |
| | $ | 1,940,617 |
|
| Depreciation and amortization | | 42,693 |
| | 39,555 |
| | 33,944 |
|
| Selling, general, and administrative expense | | 162,358 |
| | 148,888 |
| | 140,730 |
|
| Gain on sale of assets, net | | (963 | ) | | (253 | ) | | (1,491 | ) |
| Impairment charges | | — |
| | — |
| | 1,466 |
|
| Insurance recovery | | (485 | ) | | (3,681 | ) | | — |
|
| | | | | | | |
| Operating expenses | | $ | 2,239,213 |
| | $ | 2,334,909 |
|
| $ | 2,115,266 |
|
|
| | | | | | | | | |
| | | 2019 | | 2018 | | 2017 |
| | | | | | | |
| Cost of goods sold | | 83.7 | % | | 85.7 | % | | 85.6 | % |
| Depreciation and amortization | | 1.8 |
| | 1.6 |
| | 1.5 |
|
| Selling, general, and administrative expense | | 6.6 |
| | 5.9 |
| | 6.2 |
|
| Gain on sale of assets, net | | — |
| | — |
| | (0.1 | ) |
| Impairment charges | | — |
| | — |
| | 0.1 |
|
| Insurance recovery | | — |
| | (0.1 | ) | | — |
|
| | | | | | | |
| Operating expenses | | 92.1 | % | | 93.1 | % | | 93.3 | % |
| (In thousands) | | 2016 | | | 2015 | | | 2014 | |
| | | | | | | | | | |
| Cost of goods sold | | $ | 1,723,499 | | | $ | 1,809,702 | | | $ | 2,043,719 | |
| Depreciation and amortization | | | 35,133 | | | | 34,608 | | | | 33,735 | |
| Selling, general, and administrative expense | | | 137,499 | | | | 130,358 | | | | 131,740 | |
| Gain on sale of assets | | | — | | | | (15,376 | ) | | | (6,259 | ) |
| Impairment charges | | | 6,778 | | | | — | | | | — | |
| Severance | | | — | | | | 3,442 | | | | 7,296 | |
| | | | | | | | | | | | | |
| Operating expenses | | $ | 1,902,909 | | | $ | 1,962,734 | | | $ | 2,210,231 | |
| | | Percent of Net Sales | |
| | | 2016 | | | 2015 | | | 2014 | |
| | | | | | | | | | | | | |
| Cost of goods sold | | | 83.9 | % | | | 86.2 | % | | | 86.4 | % |
| Depreciation and amortization | | | 1.7 | | | | 1.6 | | | | 1.4 | |
| Selling, general, and administrative expense | | | 6.7 | | | | 6.2 | | | | 5.7 | |
| Gain on sale of assets | | | — | | | | (0.7 | ) | | | (0.3 | ) |
| Impairment charges | | | 0.3 | | | | — | | | | — | |
| Severance | | | — | | | | 0.2 | | | | 0.3 | |
| | | | | | | | | | | | | |
| Operating expenses | | | 92.6 | % | | | 93.5 | % | | | 93.5 | % |
The decrease in cost of goods sold in 2016 and 20152019 was primarily due to the decrease in sales volume in our core product lines and the decrease in the average cost of copper, our principal raw material, largelymaterial. This was partially offset by the increase in sales volume resulting from the acquisition of ATCO. The increase in cost of goods sold in 2018 was primarily due to the increase in the average cost of copper, as well as the increase in sales volume in our domestic core product lines and related to businesses acquired during 2015acquired. This was partially offset by the decrease in sales volume resulting from the sale of Mueller-Xingrong and 2016. lower sales volume in our non-domestic core product lines.
Depreciation and amortization increased in 2016 and 2015 primarily2019 as a result of depreciationlong-lived assets of businesses acquired. Depreciation and amortization increased in 2018 as a result of long-lived assets forof businesses acquired.acquired as well as several new long-lived assets being placed into service, partially offset by the impact of the sale of long-lived assets at Mueller-Xingrong.
Selling, general, and administrative expenses increased in 2016,2019 primarily due to (i) expense recognized for contingent consideration arrangements associated with businesses acquired of $5.7 million, (ii) an increase in employment costs, including employee healthcare, of $4.9 million, (iii) incremental expenses of $4.7 million associated with ATCO and Die-Mold, (iv) a reduction of $3.5 million in fees received for services provided under certain third-party sales and distribution arrangements, and (v) an increase in product liability costs of $1.6 million. These increases were partially offset by (i) income of $2.1 million recognized as a result of the reduction of contingent consideration arrangements associated with businesses acquired, (ii) a decrease in legal and professional fees of $1.4 million, (iii) higher foreign currency transaction gains of $1.4 million, (iv) a reduction of $0.8 million in fees received for services provided under certain equipment transfer and licensing agreements, and (v) a decrease in supplies and utilities of $0.5 million. The increase in selling, general, and administrative expenses in 2018 was primarily due to (i) incremental expenses of $8.9$9.8 million associated with businesses acquired in 2015ATCO, Heatlink Group, and 2016Die-Mold and (ii) an increase in employment costs, including incentive compensation, and net periodic pension costs, of $1.6$4.7 million. This wasThese increases were partially offset by (i) fees of $3.5 million received for services provided under certain third-party sales and distribution arrangements in 2018 (fees from these arrangements are classified as a component of net sales in 2019), (ii) a reduction in foreign currency exchange lossesproduct liability costs of $0.9$2.1 million, and (iii) the absence of expenses associated with Mueller-Xingrong of $1.2 million. In addition, there was $1.9
During 2019, we recognized a net gain of $1.0 million of equipment relocation costs and losses on the sale of assets related to the rationalizationreal property. We also recognized an insurance recovery gain of Yorkshire Copper Tube (Yorkshire) in 2015. The decrease in 2015 was primarily due to (i) a decrease of $10.2 million in selling, general, and administrative expenses related to the sale of Primaflow, (ii) lower employment costs, including incentive compensation, of $5.4 million, and (iii) a decrease of $1.6 million in agent commissions as a result of lower sales. These decreases were offset by (i) selling, general, and administrative expenses of $6.6 million associated with businesses acquired in 2015, (ii) higher net periodic pension costs of $5.1 million, and (iii) increased professional fees of $1.6$0.5 million related to the upgradelosses incurred due to the 2017 fire at our brass rod mill in Port Huron, Michigan.
During 2018, we recognized a gain of our ERP system. Lastly, during 2014 there was$2.7 million on the sale of real property and a reduction in accrualsgain of $0.7 million on the sale of manufacturing equipment, which were offset by a loss of $3.1 million on the sale of a corporate aircraft. We also recognized an insurance recovery gain of $3.7 million related to legal matters of $0.5 million. the losses incurred due to the 2017 fire at our brass rod mill in Port Huron, Michigan.
During 2016,2017, we recognized fixed asset impairment charges for certain copper fittings manufacturing equipment of $6.8 million.
During 2015, our operating results were positively impacted by$1.5 million and a net gain of $15.4$1.5 million recorded on the sale of certain assets. This was offset by $3.4 million of severance charges related to the rationalization of Yorkshire.our interest in Mueller-Xingrong.
Our operating results in 2014 were positively impacted by a net gain of $6.3 million recorded for the sale of our plastic pipe manufacturing assets, the land and building in Portage, Michigan, and our United Kingdom based import distribution business. This was offset by $7.3 million in severance charges related to the rationalization of Yorkshire.
Interest expense decreased slightlyincreased in 20162019 primarily as a result of decreased borrowing costs at Mueller-Xingrong. This was offset by (i) increased borrowing costs and the amortization of debt issuance costs on our Credit Agreement, (ii) borrowing costs associated with our unsecured $350.0 million revolving credit arrangements at Jungwoo-Mueller, and (iii) lower capitalized interest.facility. The increase of $1.9 million in 20152018 was primarily as a result of additionalinterest associated with the 6% Subordinated Debentures issued during the first quarter of 2017 as part of our special dividend, as well as increased borrowing costs associated with our unsecured $350.0 million revolving credit facility.
Environmental expense for our non-operating properties was significantly higher in 2017 than in 2019 or 2018 primarily as a result of $2.3 million dueongoing remediation activities related to the terms of our interest rate swap agreements that became effective in January 2015, offset by decreased borrowing costs of $0.3 million at Mueller-Xingrong to fund working capital.Lead Refinery site.
Other income, net, was $0.7 millionlower in 2016 compared to other2019 primarily as a result of lower net periodic benefit income net, of $2.2 million in 2015 and other expense, net, of $0.2 million in 2014. The change in 2016 was primarily attributable to higher environmental costs of $1.2 million. The change in 2015 was primarily related to lower postretirementfor our benefit costs of $1.4 million, lower environmental costs of $0.8 million,plans, and higher interestin 2018 primarily as a result of higher net periodic benefit income of $0.5 million.for our benefit plans.
Income tax expense was $48.1$35.3 million in 2016, for2019, representing an effective tax rate of 33.021.2 percent. This rate was higher than what would be computed using the U.S. statutory federal rate primarily due to (i) the provision for state and local income taxes, net of the federal benefit, of $3.2 million, and (ii) the impact of investments in unconsolidated affiliates of $0.5 million. These increases were partially offset by other adjustments of $3.3 million.
Income tax expense was $31.0 million in 2018, representing an effective tax rate of 20.6 percent. This rate was lower than what would be computed using the U.S. statutory federal rate primarily due to reductions(i) a reduction of the calculation of federal tax on the Company’s accumulated foreign earnings under the Tax Cuts and Jobs Act (the Act) of $4.4 million and (ii) a reduction for the effectimpact of foreign tax rates lower than the U.S. statutory rate and other foreign adjustmentsinvestments in unconsolidated affiliates of $4.1 million, and the U.S. production activities deduction of $3.1$2.8 million. These reductions were partially offset by (i) the provision for state and local income taxes, net of the federal benefit, of $2.0$3.5 million and $2.2 million(ii) other adjustments of other adjustments.$3.1 million.
Income tax expense was $43.4$37.9 million in 2015, for2017, representing an effective tax rate of 32.929.8 percent. This rate was lower than what would be computed using the U.S. statutory federal rate primarily due to (i) reductions for the effect of lower foreign tax rates when compared to the Company's deferred tax liabilitiesU.S. statutory rate and other foreign adjustments of $4.2$6.0 million, resulting from the acquisition of a foreign subsidiary and(ii) the U.S. production activities deduction of $3.5$1.6 million, (iii) the benefit of stock-based compensation deductions of $2.2 million, and (iv) the impact of the change in the federal tax rate under the Act on deferred taxes of $12.1 million. These reductions were partially offset by (i) the accrual of federal tax on the Company’s accumulated foreign earnings under the Act of $12.9 million, (ii) the provision for state and local income taxes, net of the federal benefit, of $2.7$1.1 million, and $2.3(iii) other adjustments of $1.2 million.
During 2019, we recognized losses of $24.6 million on our investments in unconsolidated affiliates, net of other adjustments.
Incomeforeign tax, expense was $45.5compared to losses of $12.6 million in 2014,2018. The loss on these investments for an effective tax rate2019 included net losses of 30.7 percent. This rate was lower than what would be computed using the U.S. statutory federal rate primarily due to decreases in valuation allowances of $5.7 million; the U.S. production activities deduction benefit of $4.0 million; and the effect of lower foreign tax rates and other foreign adjustments of $1.1 million. These decreases were partially offset by the provision$22.0 million for state income taxes, net of federal benefit, of $3.3 million and $1.2 million of other adjustments.
During 2016, we recognized $1.9 million of income on our investment in unconsolidated affiliates. This included a gain that resulted from the allocation of the purchase price recorded by our equity method investees, which was offset by restructuring and impairment chargesTecumseh and net losses duringof $2.6 million for Mueller Middle East. Included in the year.losses for Tecumseh are $6.4 million of severance and restructuring expenses and a product liability settlement of $3.4 million. These expenses were offset by a gain on the sale of land of $1.8 million.
During 2018, we recognized losses of $12.6 million on our investments in unconsolidated affiliates, net of foreign tax, compared to losses of $2.1 million in 2017. The loss on these investments for 2018 included net losses of $14.0 million and charges of $3.0 million related to certain labor claim contingencies, offset by a gain of $7.0 million related to a settlement with the Brazilian Federal Revenue Agency for Tecumseh. It also includes net losses of $2.6 million for Mueller Middle East.
During 2017, the loss on these investments included net losses of $2.1 million for Tecumseh.
Piping Systems Segment
The following table compares summary operating results for 2016, 2015,2019, 2018, and 20142017 for the businesses comprising our Piping Systems segment:
| | | | | | | | Percent Change | |
| (In thousands) | 2016 | | 2015 | | 2014 | | 2016 vs. 2015 | | 2015 vs. 2014 | |
| | | | | | | | | | | | |
| Net sales | | $ | 1,429,589 | | | $ | 1,436,689 | | | $ | 1,622,921 | | | | (0.5 | )% | | | (11.5 | )% |
| Operating income | | | 103,886 | | | | 113,232 | | | | 118,558 | | | | (8.3 | ) | | | (4.5 | ) |
|
| | | | | | | | | | | | | | | | | | |
| | | | | | | | | Percent Change |
| (In thousands) | | 2019 | | 2018 | | 2017 | | 2019 vs. 2018 | | 2018 vs. 2017 |
| | | | | | | | | | | |
| Net sales | | $ | 1,542,456 |
| | $ | 1,645,633 |
| | $ | 1,564,950 |
| | (6.3 | )% | | 5.2 | % |
| Operating income | | 131,879 |
| | 122,829 |
| | 99,596 |
| | 7.4 |
| | 23.3 |
|
The following are components of changes in net sales compared to the prior year:
| | | 2016 vs. 2015 | | | 2015 vs. 2014 | |
| | | | | | | |
| Net selling price in core product lines | | (10.0 | ) | % | | (9.8 | ) | % |
| Unit sales volume in core product lines | | (1.3 | ) | | | (1.4 | ) | |
| Acquisitions | | 11.5 | | | | 5.6 | | |
| Dispositions | | — | | | | (3.9 | ) | |
| Other | | (0.7 | ) | | | (2.0 | ) | |
| | | | | | | | | |
| | | (0.5 | ) | % | | (11.5 | ) | % |
TABLE OF CONTENTS |
| | | | | | |
| | | 2019 vs. 2018 | | 2018 vs. 2017 |
| | | | | |
| Net selling price in core product lines | | (4.4 | )% | | 4.5 | % |
| Unit sales volume in core product lines | | (2.3 | ) | | 3.4 |
|
| Acquisitions | | 0.3 |
| | 1.1 |
|
| Dispositions | | — |
| | (4.3 | ) |
| Other | | 0.1 |
| | 0.5 |
|
| | | | | |
| | | (6.3 | )% | | 5.2 | % |
The decrease in net sales in 20162019 was primarily attributable to (i) lower net selling prices of $144.4$70.6 million in the segment'ssegment’s core product lines, primarily copper tube, and (ii) lower unit sales volume of $37.3 million in the segment’s core product lines. These decreases were partially offset by incremental sales of $4.0 million recorded by Die-Mold.
The increase in net sales in 2018 was primarily attributable to (i) higher unit sales volume of $96.6 million in the segment’s domestic core product lines, primarily copper tube, (ii) higher net selling prices of $69.7 million in the segment’s core product lines, (iii) an increase in sales of $13.3 million in the segment’s non-core product lines, (iv) incremental sales of $9.6 million recorded by Heatlink Group, and (v) sales of $6.8 million recorded by Die-Mold. These increases were partially offset by (i) the absence of sales of $67.3 million recorded by Mueller-Xingrong and (ii) lower unit sales volume of $18.8$44.5 million in the segment'ssegment’s non-domestic core product lines, and (iii) a decrease in sales of $5.3 million in the segment's non-core product lines. The decrease in net sales resulting from lower net selling prices also reflects the impact of translating net sales of the segment's foreign operations to U.S. dollars, which was approximately $43.6 million. These decreases were partially offset by (i) $139.4 million of incremental sales recorded by Great Lakes and (ii) $22.0 million of sales recorded by Jungwoo-Mueller.
The decrease in net sales during 2015 was primarily due to (i) lower net selling prices of $158.4 million in the segment's core product lines, primarily copper tube, (ii) the absence of sales of $57.5 million recorded by Primaflow, (iii) lower unit sales volume of $23.4 million in the segment's core product lines, and (iv) a decrease in sales of $37.4 million in the segment's non-core product lines. These decreases were offset by $90.5 million of sales recorded by Great Lakes.
The following tables compare cost of goods sold and operating expenses as dollar amounts and as a percent of net sales for 2016, 2015,2019, 2018, and 2014:2017:
| (In thousands) | | 2016 | | | 2015 | | | 2014 | |
| | | | | | | | | | |
| Cost of goods sold | | $ | 1,228,949 | | | $ | 1,245,929 | | | $ | 1,409,581 | |
| Depreciation and amortization | | | 22,421 | | | | 22,559 | | | | 22,221 | |
| Selling, general, and administrative expense | | | 68,218 | | | | 66,903 | | | | 71,524 | |
| Gain on sale of assets | | | — | | | | (15,376 | ) | | | (6,259 | ) |
| Impairment charges | | | 6,115 | | | | — | | | | — | |
| Severance | | | — | | | | 3,442 | | | | 7,296 | |
| | | | | | | | | | | | | |
| Operating expenses | | $ | 1,325,703 | | | $ | 1,323,457 | | | $ | 1,504,363 | |
|
| | | | | | | | | | | | |
| (In thousands) | | 2019 | | 2018 | | 2017 |
| | | | | | | |
| Cost of goods sold | | $ | 1,313,980 |
| | $ | 1,426,729 |
| | $ | 1,369,161 |
|
| Depreciation and amortization | | 22,621 |
| | 23,304 |
| | 21,777 |
|
| Selling, general, and administrative expense | | 75,170 |
| | 74,864 |
| | 74,441 |
|
| Gain on sale of assets, net | | (1,194 | ) | | (2,093 | ) | | (1,491 | ) |
| Impairment charges | | — |
| | — |
| | 1,466 |
|
| | | | | | | |
| Operating expenses | | $ | 1,410,577 |
| | $ | 1,522,804 |
| | $ | 1,465,354 |
|
| | | Percent of Net Sales | |
| | | 2016 | | | 2015 | | | 2014 | |
| | | | | | | | | | | | | |
| Cost of goods sold | | | 86.0 | % | | | 86.7 | % | | | 86.9 | % |
| Depreciation and amortization | | | 1.5 | | | | 1.6 | | | | 1.4 | |
| Selling, general, and administrative expense | | | 4.8 | | | | 4.7 | | | | 4.4 | |
| Gain on sale of assets | | | — | | | | (1.1 | ) | | | (0.4 | ) |
| Impairment charges | | | 0.4 | | | | — | | | | — | |
| Severance | | | — | | | | 0.2 | | | | 0.4 | |
| | | | | | | | | | | | | |
| Operating expenses | | | 92.7 | % | | | 92.1 | % | | | 92.7 | % |
|
| | | | | | | | | |
| | | 2019 | | 2018 | | 2017 |
| | | | | | | |
| Cost of goods sold | | 85.2 | % | | 86.7 | % | | 87.5 | % |
| Depreciation and amortization | | 1.5 |
| | 1.4 |
| | 1.4 |
|
| Selling, general, and administrative expense | | 4.9 |
| | 4.5 |
| | 4.7 |
|
| Gain on sale of assets, net | | (0.1 | ) | | (0.1 | ) | | (0.1 | ) |
| Impairment charges | | — |
| | — |
| | 0.1 |
|
| | | | | | | |
| Operating expenses | | 91.5 | % | | 92.5 | % | | 93.6 | % |
The decrease in cost of goods sold in 2016 was primarily due to the decrease in the average cost of copper, largely offset by the increase in sales volume related to businesses acquired during 2015 and 2016. The decrease in 20152019 was primarily due to the decrease in the average cost of copper and the decrease in unit sales volume relatedin the segment’s core product lines. The increase in cost of goods sold in 2018 was primarily due to businesses disposed, slightly offset bythe increase in the average cost of copper and the increase in sales volume in the segment’s domestic core product lines and related to businesses acquired during 2015. the acquisitions of Heatlink Group and Die-Mold, partially offset by the decrease in sales volume resulting from the sale of Mueller-Xingrong.
Depreciation and amortization decreased in 2016, 2015, and 2014 was consistent. This2019 as a result of several long-lived assets becoming fully depreciated. The increase in 2018 was a result of several new long-lived assets becoming fully depreciated,being placed into service as well as long-lived assets of Heatlink Group and Die-Mold, partially offset by depreciation and amortizationthe impact of the sale of long-lived assets acquired at Great Lakes and Jungwoo-Mueller.Mueller-Xingrong.
Selling, general, and administrative expenses increased slightly for 2016,2019, primarily due to (i) a reduction of $3.5 million in fees received for services provided under certain third-party sales and distribution arrangements, (ii) higher employment costs, including employee healthcare, of $0.9 million, and (iii) incremental expenses associated with Great Lakes and Jungwoo-MuellerDie-Mold of $5.7$0.6 million. This wasThese increases were partially offset by (i) income of $2.1 million recognized as a result of the reduction in (i)of contingent consideration arrangements associated with businesses acquired, (ii) higher foreign currency exchange lossestransaction gains of $0.8$1.4 million, and (ii)(iii) a decrease in employment costs, including incentive compensation,supplies and utilities of $0.3$0.6 million. In addition, there was $1.9 million of equipment relocation costs and losses on the sale of assets related to the rationalization of Yorkshire recognizedThe increase in 2015. The decrease in 20152018 was primarily due to (i) incremental expenses associated with Die-Mold and Heatlink Group of $2.5 million, (ii) an increase in legal and professional fees of $1.6 million, (iii) an increase in foreign currency exchange rate losses of $0.6 million, and (iv) an increase in agent commissions of $0.5 million. These increases were partially offset by (i) fees of $3.5 million received for services provided under certain third-party sales and distribution arrangements in 2018 (fees from these arrangements are classified as a decreasecomponent of $10.2net sales in 2019) and (ii) the absence of expenses associated with Mueller-Xingrong of $1.2 million.
During 2019, we recognized a gain of $1.2 million in selling, general, and administrative expenses related toon the sale of Primaflow and (ii) a decrease of $1.5 million in agent commissions as a result of lower sales. These decreases were offset by (i) selling, general, and administrative expenses of $3.6 million associated with Great Lakes and (ii) higher net periodic pension costs of $1.9 million. Lastly, during 2014 there was a reduction in accruals related to legal matters of $0.5 million. real property.
During 2016,2018, we recognized a gain of $1.4 million on the sale of real property and a gain of $0.7 million on the sale of manufacturing equipment.
During 2017, we recognized fixed asset impairment charges for certain copper fittings manufacturing equipment of $6.1 million.
During 2015, our operating results were positively impacted by$1.5 million and a net gain of $15.4$1.5 million recorded on the sale of certain assets. This was offset by $3.4 million of severance charges related to the rationalization of Yorkshire.our interest in Mueller-Xingrong.
Our operating results in 2014 were positively impacted by a net gain of $6.3 million recorded for the sale of our plastic pipe manufacturing assets, the land and building in Portage, Michigan, and our United Kingdom based import distribution business. This was offset by $7.3 million in severance charges related to the rationalization of Yorkshire.
Industrial Metals Segment
The following table compares summary operating results for 2016, 2015,2019, 2018, and 20142017 for the businesses comprising our Industrial Metals segment:
| | | | | | | | Percent Change | |
| (In thousands) | 2016 | | 2015 | | 2014 | | 2016 vs. 2015 | | 2015 vs. 2014 | |
| | | | | | | | | | | | |
| Net sales | | $ | 521,060 | | | $ | 567,467 | | | $ | 659,847 | | | | (8.2 | )% | | | (14.0 | )% |
| Operating income | | | 78,168 | | | | 57,442 | | | | 72,210 | | | | 36.1 | | | | (20.5 | ) |
|
| | | | | | | | | | | | | | | | | | |
| | | | | | | | | Percent Change |
| (In thousands) | | 2019 | | 2018 | | 2017 | | 2019 vs. 2018 | | 2018 vs. 2017 |
| | | | | | | | | | | |
| Net sales | | $ | 554,372 |
| | $ | 651,061 |
| | $ | 602,131 |
| | (14.9 | )% | | 8.1 | % |
| Operating income | | 61,724 |
| | 75,607 |
| | 74,364 |
| | (18.4 | ) | | 1.7 |
|
The following are components of changes in net sales compared to the prior year:
| | | 2016 vs. 2015 | | | 2015 vs. 2014 | | |
| | | | | | | | |
| Net selling price in core product lines | | (8.0 | ) | % | | | (9.3 | ) | % |
| Unit sales volume in core product lines | | (2.6 | ) | | | | (8.8 | ) | |
| Acquisitions & new products | | 3.5 | | | | | 4.7 | | |
| Other | | (1.1 | ) | | | | (0.6 | ) | |
| | | | | | | | | | |
| | | (8.2 | ) | % | | | (14.0 | ) | % |
|
| | | | | | |
| | | 2019 vs. 2018 | | 2018 vs. 2017 |
| | | | | |
| Net selling price in core product lines | | (3.3 | )% | | 5.2 | % |
| Unit sales volume in core product lines | | (11.4 | ) | | 5.1 |
|
| Other | | (0.2 | ) | | (2.2 | ) |
| | | | | |
| | | (14.9 | )% | | 8.1 | % |
The decrease in net sales during 2016 was primarily due to (i) lower net selling prices of $44.5 million in the segment's core product lines, primarily brass rod, and (ii) lower unit sales volume of $14.2 million in the segment's core product lines. These decreases were partially offset by $19.2 million of incremental sales recorded by Sherwood.
The decrease in net sales in 20152019 was primarily due to (i) lower unit sales volume of $73.0 million and (ii) lower net selling prices of $60.0$21.0 million in the segment'ssegment’s core product lines, primarily brass rod and forgings,rod.
The increase in net sales during 2018 was primarily due to higher net selling prices of $30.0 million and (ii) lowerhigher unit sales volume of $56.5$29.6 million in the segment'ssegment’s core product lines. These decreases were offset by and $20.8 million of sales recorded by Sherwood.
The following tables compare cost of goods sold and operating expenses as dollar amounts and as a percent of net sales for 2016, 2015,2019, 2018, and 2014:2017:
|
| | | | | | | | | | | | |
| (In thousands) | | 2019 | | 2018 | | 2017 |
| | | | | | | |
| Cost of goods sold | | $ | 473,010 |
| | $ | 559,367 |
| | $ | 506,973 |
|
| Depreciation and amortization | | 7,489 |
| | 7,568 |
| | 7,516 |
|
| Selling, general, and administrative expense | | 12,359 |
| | 13,501 |
| | 13,278 |
|
| Loss (gain) on sale of assets, net | | 275 |
| | (1,301 | ) | | — |
|
| Insurance recovery | | (485 | ) | | (3,681 | ) | | — |
|
| | | | | | | |
| Operating expenses | | $ | 492,648 |
| | $ | 575,454 |
| | $ | 527,767 |
|
|
| | | | | | | | | |
| | | 2019 | | 2018 | | 2017 |
| | | | | | | |
| Cost of goods sold | | 85.3 | % | | 85.9 | % | | 84.2 | % |
| Depreciation and amortization | | 1.4 |
| | 1.2 |
| | 1.2 |
|
| Selling, general, and administrative expense | | 2.3 |
| | 2.1 |
| | 2.2 |
|
| Loss (gain) on sale of assets, net | | — |
| | (0.2 | ) | | — |
|
| Insurance recovery | | (0.1 | ) | | (0.6 | ) | | — |
|
| | | | | | | |
| Operating expenses | | 88.9 | % | | 88.4 | % | | 87.6 | % |
| (In thousands) | | 2016 | | | 2015 | | | 2014 | |
| | | | | | | | | | |
| Cost of goods sold | | $ | 420,905 | | | $ | 491,567 | | | $ | 572,979 | |
| Depreciation and amortization | | | 8,162 | | | | 7,503 | | | | 6,998 | |
| Selling, general, and administrative expense | | | 13,162 | | | | 10,955 | | | | 7,660 | |
| Impairment charges | | | 663 | | | | — | | | | — | |
| | | | | | | | | | | | | |
| Operating expenses | | $ | 442,892 | | | $ | 510,025 | | | $ | 587,637 | |
| | | Percent of Net Sales | |
| | | 2016 | | | 2015 | | | 2014 | |
| | | | | | | | | | | | | |
| Cost of goods sold | | | 80.8 | % | | | 86.6 | % | | | 86.8 | % |
| Depreciation and amortization | | | 1.6 | | | | 1.3 | | | | 1.1 | |
| Selling, general, and administrative expense | | | 2.5 | | | | 2.0 | | | | 1.2 | |
| Impairment charges | | | 0.1 | | | | — | | | | — | |
| | | | | | | | | | | | | |
| Operating expenses | | | 85.0 | % | | | 89.9 | % | | | 89.1 | % |
The decrease in cost of goods sold in 20162019 was primarily relateddue to the decrease in sales volume in the segment’s core product lines and the decrease in the average cost of copper. The decreaseincrease in cost of goods sold in 20152018 was primarily duerelated to the decreaseincrease in the average cost of copper and the decreaseincrease in sales volume in the segment'ssegment’s core product lines, partially offset by the increase in sales volume related to the acquisition of Sherwood. A sharp decline in copper prices during 2015 put pressure on margins of our businesses accounting for inventory on a FIFO basis. lines..
Depreciation and amortization increased in 20162019 was consistent with 2018 and 2015 as a result of depreciation and amortization of long-lived assets for the Sherwood business and recent capital expenditures. 2017.
Selling, general, and administrative expenses increaseddecreased slightly in 20162019 primarily due to incremental expenses associated with Sherwood of $2.7 million, offset by a decrease in net periodic pension costs of $0.7 million. The increase in 2015 was a result of higher net periodic pension costs of $3.0 million, as well as incremental selling, general, and administrative expenses of $1.2 million for Sherwood. This was offset by lower employment costs, including incentive compensation, of $0.4$0.7 million. The increase in 2018 was primarily due to an increase in legal fees of $0.2 million.
During 2016,2019, we recognized fixed asset impairment charges for certain manufacturing equipmenta loss of $0.7 million.$0.3 million on the sale of real property and an insurance recovery gain of $0.5 million related to the losses incurred due to the 2017 fire at our brass rod mill in Port Huron, Michigan.
During 2018, we recognized a gain of $1.3 million on the sale of real property and an insurance recovery gain of $3.7 million related to the losses incurred due to the 2017 fire at our brass rod mill in Port Huron, Michigan.
Climate Segment
The following table compares summary operating results for 2016, 2015,2019, 2018, and 20142017 for the businesses comprising our Climate segment:
| | | | | | | | Percent Change | |
| (In thousands) | 2016 | | 2015 | | 2014 | | 2016 vs. 2015 | | 2015 vs. 2014 | |
| | | | | | | | | | | | |
| Net sales | | $ | 119,758 | | | $ | 110,727 | | | $ | 99,336 | | | | 8.2 | % | | | 11.5 | % |
| Operating income | | | 17,733 | | | | 12,459 | | | | 11,029 | | | | 42.3 | | | | 13.0 | |
|
| | | | | | | | | | | | | | | | | | |
| | | | | | | | | Percent Change |
| (In thousands) | | 2019 | | 2018 | | 2017 | | 2019 vs. 2018 | | 2018 vs. 2017 |
| | | | | | | | | | | |
| Net sales | | $ | 356,216 |
| | $ | 229,069 |
| | $ | 131,448 |
| | 55.5 | % | | 74.3 | % |
| Operating income | | 42,727 |
| | 24,118 |
| | 20,325 |
| | 77.2 |
| | 18.7 |
|
Net sales for 20162019 increased primarily as a result of incremental sales of $100.1 million recorded by TurbotecATCO. Net sales for 2018 increased primarily as a result of $3.5sales of $90.0 million andrecorded by ATCO, as well as an increase in volume in the segment's other businesses. Net sales for 2015 increased due to $16.8 million of sales recorded by Turbotec, offset by lower volumes for Refrigeration Products and Fabricated Tube Products.improved product mix.
The following tables compare cost of goods sold and operating expenses as dollar amounts and as a percent of net sales for 2016, 2015,2019, 2018, and 2014:2017:
| (In thousands) | | 2016 | | | 2015 | | | 2014 | |
| | | | | | | | | | |
| Cost of goods sold | | $ | 89,927 | | | $ | 86,894 | | | $ | 79,099 | |
| Depreciation and amortization | | | 2,437 | | | | 2,257 | | | | 1,845 | |
| Selling, general, and administrative expense | | | 9,661 | | | | 9,117 | | | | 7,363 | |
| | | | | | | | | | | | | |
| Operating expenses | | $ | 102,025 | | | $ | 98,268 | | | $ | 88,307 | |
TABLE OF CONTENTS |
| | | | | | | | | | | | |
| (In thousands) | | 2019 | | 2018 | | 2017 |
| | | | | | | |
| Cost of goods sold | | $ | 273,850 |
| | $ | 182,456 |
| | $ | 98,851 |
|
| Depreciation and amortization | | 9,298 |
| | 5,569 |
| | 2,513 |
|
| Selling, general, and administrative expense | | 30,385 |
| | 16,926 |
| | 9,759 |
|
| Gain on sale of assets, net | | (44 | ) | | — |
| | — |
|
| | | | | | | |
| Operating expenses | | $ | 313,489 |
| | $ | 204,951 |
| | $ | 111,123 |
|
|
| | | | | | | | | |
| | | 2019 | | 2018 | | 2017 |
| | | | | | | |
| Cost of goods sold | | 76.9 | % | | 79.7 | % | | 75.2 | % |
| Depreciation and amortization | | 2.6 |
| | 2.4 |
| | 1.9 |
|
| Selling, general, and administrative expense | | 8.5 |
| | 7.4 |
| | 7.4 |
|
| Gain on sale of assets, net | | — |
| | — |
| | — |
|
| | | | | | | |
| Operating expenses | | 88.0 | % | | 89.5 | % | | 84.5 | % |
| | | Percent of Net Sales | |
| | | 2016 | | | 2015 | | | 2014 | |
| | | | | | | | | | | | | |
| Cost of goods sold | | | 75.1 | % | | | 78.5 | % | | | 79.6 | % |
| Depreciation and amortization | | | 2.0 | | | | 2.0 | | | | 1.9 | |
| Selling, general, and administrative expense | | | 8.1 | | | �� | 8.2 | | | | 7.4 | |
| | | | | | | | | | | | | |
| Operating expenses | | | 85.2 | % | | | 88.7 | % | | | 88.9 | % |
Cost of goods sold increased in 2019 due to the increase in volume and change in product mix within the segment primarily resulting from the ATCO acquisition. The changesincrease in cost of goods sold in 2016 and 2015 were2018 was related to factors consistent with those noted regarding changesthe increase in net sales.volume and change
in product mix within the segment primarily resulting from the ATCO acquisition. In addition, it included additional expense of $2.2 million to adjust ATCO’s inventory to fair value as part of purchase price accounting during 2018. Depreciation and amortization increased in 20162019 and 20152018 primarily as a result of depreciation and amortization of the long-lived assets for the business acquired at Turbotec. ATCO. Selling, general, and administrative expenses increased in 20162019 as a result of (i) expense of $5.7 million recognized for a contingent consideration arrangement associated with an acquired business, (ii) incremental expenses of $4.6 million associated with ATCO, (iii) an increase in employment costs of $1.7 million, (iv) an increase in agent commissions of $0.5 million, and 2015 primarily due to(v) an increase in supplies, utilities, and rent costs of $0.4 million. Selling, general, and administrative expenses increased in 2018 as a result of incremental expenses associated with Turbotec of $0.5 million and $1.8 million, respectively. ATCO.
Liquidity and Capital ResourcesLIQUIDITYAND CAPITAL RESOURCES
The following table presents selected financial information for 2016, 2015,2019, 2018, and 2014:2017:
| (In thousands) | | 2016 | | | 2015 | | | 2014 | |
| | | | | | | | | | |
| Increase (decrease) in: | | | | | | | | | |
| Cash and cash equivalents | | $ | 76,473 | | | $ | (77,290 | ) | | $ | 40,334 | |
| Property, plant, and equipment, net | | | 15,007 | | | | 34,314 | | | | 1,453 | |
| Total debt | | | 11,354 | | | | (25,434 | ) | | | 6,111 | |
| Working capital, net of cash and current debt | | | 9,781 | | | | (59,316 | ) | | | 14,460 | |
| | | | | | | | | | | | | |
| Cash provided by operating activities | | | 157,777 | | | | 159,609 | | | | 90,605 | |
| Cash used in investing activities | | | (53,057 | ) | | | (190,807 | ) | | | (38,424 | ) |
| Cash used in financing activities | | | (22,561 | ) | | | (41,258 | ) | | | (10,551 | ) |
|
| | | | | | | | | | | | |
| (In thousands) | | 2019 | | 2018 | | 2017 |
| | | | | | | |
| Increase (decrease) in: | | | | | | |
| Cash, cash equivalents, and restricted cash | | $ | 20,904 |
| | $ | (49,425 | ) | | $ | (233,906 | ) |
| Property, plant, and equipment, net | | (7,505 | ) | | 66,312 |
| | 9,090 |
|
| Total debt | | (110,444 | ) | | 31,626 |
| | 237,708 |
|
| Working capital, net of cash and current debt | | (35,231 | ) | | 11,228 |
| | 55,405 |
|
| | | | | | | |
| Net cash provided by operating activities | | 200,544 |
| | 167,892 |
| | 43,995 |
|
| Net cash used in investing activities | | (40,457 | ) | | (187,096 | ) | | (36,280 | ) |
| Net cash used in financing activities | | (139,694 | ) | | (28,269 | ) | | (244,566 | ) |
Cash Provided by Operating Activities
During 2016,2019, net cash provided by operating activities was primarily attributable to (i) consolidated net income of $99.8$106.2 million, plus the addition(ii) depreciation and amortization of non-cash charges$43.0 million, (iii) a decrease in inventories of $39.6 million, (iv) losses from unconsolidated affiliates of $24.6 million, (v) stock-based compensation expense of $8.7 million, and (vi) a decrease in accounts receivable of $6.5 million. These cash increases were partially offset by (i) an increase in other assets of $15.6 million, (ii) a decrease in other liabilities of $7.9 million, and (iii) a decrease in current liabilities of $7.1 million. The fluctuations in accounts receivable and inventories were primarily due to income.decreased selling prices and sales volume in certain businesses and changes working capital needs in 2019.
During 2015,2018, net cash provided by operating activities was primarily attributable to (i) consolidated net income of $88.4$106.8 million, (ii) depreciation and amortization of $34.6$39.9 million, a decrease in receivables of $51.7 million, and(iii) a decrease in inventories of $41.1$27.5 million, (iv) a decrease in other assets of $14.4 million, (v) losses from unconsolidated affiliates of $12.6 million, and (vi) stock-based compensation expense of $8.0 million. These cash increases were offset by (i) a decrease in current liabilities of $54.2$15.7 million, (ii) a decrease in other liabilities of $14.8 million, and (iii) an increase in accounts receivable of $11.3 million. These changesThe decrease in inventories was primarily driven by the use of excess inventory built at the end of 2017 due to a casting outage in our brass rod mill that impaired our ability to melt scrap returns. The fluctuations in accounts receivable and current liabilities were primarily due to decreasesincreased selling prices and sales volume in the price of coppercertain businesses and an overall decrease inadditional working capital needs.needs in 2018. The changes in other assets and liabilities are primarily attributable to the change in estimate of the one-time transition tax liability on accumulated foreign earnings under the the Act.
During 2014,2017, net cash provided by operating activities was primarily attributable to (i) consolidated net income of $102.5$87.0 million, and(ii) depreciation and amortization of $34.1$34.2 million, and (iii) an increase in current liabilities of $10.7 million. These cash increases were offset by increased receivables of $21.4 million, an increase in other assetsinventories of $23.7$86.3 million, primarily driven by the increase in the price of copper and a decrease in other liabilitiesan excess inventory build of $2.2 million. These changes were primarily$38.9 million at the end of 2017 due to increased sales volumea casting outage in certain businesses and additional working capital needs of acquired businesses.our brass rod mill that impaired our ability to melt scrap returns.
Cash Used in Investing Activities
The major components of net cash used in investing activities in 20162019 included (i) capital expenditures of $37.5$31.2 million and $20.5 million for the purchase(ii) investments in our unconsolidated affiliates, Tecumseh and Mueller Middle East, of a 60.0 percent equity interest in Jungwoo-Mueller, net$16.0 million. These uses of cash acquired, and net deposits into restricted cash balances of $5.3 million. These were offset by $10.3(i) the $3.5 million inworking capital settlement received from the previous owners for the ATCO acquisition and (ii) proceeds fromon the sale of assets.properties of $3.2 million.
The major components of net cash used in investing activities in 20152018 included $105.9(i) $167.7 million for the acquisitionpurchases of Turbotec, Sherwood,ATCO and Great Lakes, $65.9 million for our investment in MA Industrial JV LLC, the joint venture thatDie-Mold, net of cash acquired, Tecumseh Products Company, and (ii) capital expenditures of $28.8$38.5 million. These uses of cash decreases were offset by $5.5 million in proceeds fromon the sale of certain assets and net withdrawals from restricted cash balancesproperties of $4.3$18.7 million.
The major components of net cash used in investing activities in 20142017 included $30.1(i) capital expenditures of $46.1 million, (ii) $18.4 million for the acquisitionpurchase of Yorkshire, capital expendituresHeatlink Group, net of $39.2 million,cash acquired, and deposits into restricted cash(iii) investments in our joint venture in Bahrain of $2.9$3.3 million. These decreasesuses of cash were partially offset by $33.8(i) $17.5 million of proceeds from the salessale of assets.our 50.5 percent equity interest in Mueller-Xingrong, net of cash sold, (ii) proceeds from the sale of properties of $12.3 million, and (iii) proceeds from the sale of securities of $1.8 million.
Cash Used in Financing Activities
For 2016,2019, net cash used in financing activities consisted primarily of $21.2(i) $205.0 million used to reduce the debt outstanding under our Credit Agreement, (ii) $22.3 million used for the payment of regular quarterly dividends to stockholders of the Company, (iii) $4.3 million used for repayment of debt by Jungwoo-Mueller, (iv) $3.2 million used for payment of contingent consideration related to ATCO, and (v) $1.8 million used to repurchase common stock. These uses of cash were offset by the issuance of debt under our Credit Agreement of $100.0 million.
For 2018, net cash used in financing activities consisted primarily of (i) $165.0 million used to reduce the debt outstanding under our Credit Agreement, (ii) $33.6 million used to repurchase common stock, (iii) $22.7 million used for the payment of regular quarterly dividends to stockholders of the Company, and $3.8(iv) $2.9 million used for repayment of debt by Jungwoo-Mueller. These uses of cash were offset by the issuance of debt under our Credit Agreement of $200.0 million.
For 2017, net cash used in financing activities consisted primarily of (i) $196.9 million used for the payment of the special dividend and the regular quarterly dividends to stockholders of the Company, (ii) $110.0 million used to reduce the debt outstanding under our Credit Agreement, (iii) $3.4 million used for repayment of debt by Jungwoo-Mueller and Mueller-Xingrong, and (iv) $2.9 million used for payment of dividends to noncontrolling interests. This wasThese uses of cash were partially offset by the issuance of debt of $3.5 million.$70.0 million under our Credit Agreement.
For 2015, net cash used in financing activities consisted primarily of $23.6 million used for the repayment of debt by Mueller-Xingrong and $16.9 million used for payment of regular quarterly dividends to stockholders of the Company.
For 2014, net cash used in financing activities consisted primarily of $16.8 million for payment of regular quarterly dividends to stockholders of the Company, offset by $7.3 million received for the issuance of debt by Mueller-Xingrong.
Liquidity and Outlook
Management believesWe believe that cash provided by operations, funds available under the credit agreement,Credit Agreement, and cash and cash equivalents on hand will be adequate to meet our liquidity needs, including working capital, capital expenditures, and debt payment obligations. Our current ratio was 4.13.0 to 1 as of December 31, 2016.28, 2019.
As of December 31, 2016, $73.928, 2019, $65.3 million of our cash and cash equivalents were held by foreign subsidiaries. AllThe undistributed earnings of most of the foreign subsidiaries are considered to be permanently reinvested, and it is not practicablereinvested. These earnings could be remitted to compute the potential deferredU.S. with a minimal tax cost. Accordingly, no additional income tax liability associatedhas been accrued with respect to these undistributed foreign earnings.earnings or on any additional outside basis differences that may exist with respect to these entities.
We expect the reduction in the U.S. federal tax rate from 35 percent to 21 percent under the Act to provide ongoing benefits to liquidity. For 2020, we expect our effective tax rate on consolidated earnings to be in the range of 22 to 26 percent. We believe that cash held domestically, funds available through the credit agreement,Credit Agreement, and cash generated from U.S. based operations will be adequate to meet the future needs of our U.S. based operations.
Fluctuations in the cost of copper and other raw materials affect the Company'sCompany’s liquidity. Changes in material costs directly impact components of working capital, primarily inventories, accounts receivable, and accounts payable. The price of copper has fluctuated significantly and averaged approximately $2.20$2.72 in 2016, $2.512019, $2.93 in 2015,2018, and $3.12$2.80 in 2014.2017.
We have significant environmental remediation obligations which we expect to pay over future years. Approximately $0.7$4.4 million was spent during 20162019 for environmental matters. As of December 31, 2016,28, 2019, we expect to spend $0.7 million in 2017, $0.6 million in 2018, $0.6 million in 2019, $0.7$0.8 million in 2020, $0.7 million in 2021, $0.6 million in 2022, $0.8 million in 2023, $0.7 million in 2024, and $18.6$17.3 million thereafter for ongoing projects.
Cash used to fund pension and other postretirement benefit obligations was $3.4$0.8 million in 20162019 and $2.6$1.9 million in 2015.2018. We anticipate making contributions of approximately $2.1$1.0 million to these plans in 2017.2020.
The Company declared and paid a quarterly cash dividend of 10.0 cents per common share in the second, third,during each quarter of 2017, 2018, and fourth quarters of 2016, and 7.5 cents per share for2019. Additionally, during the first quarter of 20162017 the Company distributed a special dividend composed of $3.00 in cash and $5.00 in principal amount of the Company’s 6% Subordinated Debentures (Debentures) due 2027 for each quartershare of fiscal 2015 and 2014.common stock outstanding. Payment of dividends in the future is dependent upon our financial condition, cash flows, capital requirements, and other factors.
On January 25, 2017, we announced a special dividend on our common stock payable on March 9, 2017 to stockholders of record on February 28, 2017. The special dividend will consist of $3.00 in cash and $5.00 in principal amount of the Company's 6% Subordinated Debentures due 2027 for each share of common stock (less any applicable withholding tax).
The Debentures will be subordinated to all other funded debt of the Company and will be callable, in whole or in part, at any time at the option of the Company, subject to declining call premiums during the first five years. The Debentures will also grant each holder of the Debentures the right to require the Company to repurchase such holder's Debentures in the event of a change of control, at declining repurchase premiums during the first five years. Interest will be payable semiannually on September 1 and March 1, commencing September 1, 2017.
The effect of the special dividend will be to decrease stockholders' equity by approximately $460.0 million, increase long-term debt by approximately $287.0 million, and decrease cash by approximately$173.0 million.
Capital Expenditures
During 20162019 our capital expenditures were $37.5$31.2 million and related primarily to upgrading equipment and implementing new manufacturing technologies in our copper tube mills and the acquisition of a copper tube mill in Cedar City, Utah.. We anticipate investing approximately $25.0-35.0$45.0 million to $50.0 million for capital expenditures in 2017.2020.
Long-Term Debt
On December 6, 2016, the Company entered into a credit agreement (Credit Agreement) providingThe Company’s Credit Agreement provides for an unsecured $350.0 million revolving credit facility which matures on December 6, 2021. Funds borrowed under the Credit Agreement may be used for working capital purposes and other general corporate purposes. In addition, the Credit Agreement provides a sublimit of $50.0 million for the issuance of letters of credit, a sublimit of $25.0 million for loans and letters of credit made in certain foreign currencies, and a swing line loan sublimit of $15.0 million. Outstanding letters of credit and foreign currency loans reduce borrowing availability under the Credit Agreement. Total borrowings under the Credit Agreement were $200.0$90.0 million at December 31, 2016.28, 2019.
On March 23, 2016, Mueller-Xingrong entered into a new secured revolving credit arrangement with a total borrowing capacityThe Debentures distributed as part of RMB 150 million (or approximately $21.7 million). In addition, Mueller-Xingrong occasionally finances working capital through various accounts receivableour special dividend are subordinated to all other funded debt of the Company and bank draft discount arrangements. Borrowings are secured by the real property and equipment and bank draft receivables of Mueller-Xingrong and bear interestcallable, in whole or in part, at any time at the latest base-lending rate published byoption of the People's BankCompany, subject to declining call premiums during the first five years. The Debentures also grant each holder the right to require the Company to repurchase such holder’s Debentures in the event of China, which was 4.35 percenta change in control at declining repurchase premiums during the first five years. Interest is payable semiannually on September 1 and March 1. Total Debentures outstanding as of December 31, 2016. Total borrowings at Mueller-Xingrong28, 2019 were $7.9 million as of December 31, 2016.$284.5 million.
Jungwoo-Mueller has several secured revolving credit arrangements with a total borrowing capacity of KRW 35.725.8 billion (or approximately $30.3$21.9 million). Borrowings are secured by the real property and equipment of Jungwoo-Mueller and were bearing interest at an averagea rate of 3.052.55 percent as of December 31, 2016.28, 2019. Total borrowings at Jungwoo-Mueller were $12.7$5.8 million as of December 31, 2016.28, 2019.
As of December 31, 2016,28, 2019, the Company'sCompany’s total debt was $227.4$386.3 million or 19.536.8 percent of its total capitalization.
Covenants contained in the Company'sCompany’s financing obligations require, among other things, the maintenance of minimum levels of tangible net worth and the satisfaction of certain minimum financial ratios. As of December 31, 2016,28, 2019, we were in compliance with all of our debt covenants.
Share Repurchase Program
The Company'sCompany’s Board of Directors has extended, until October 2017,August 2020, its authorization to repurchase up to 20 million shares of the Company'sCompany’s common stock through open market transactions or through privately negotiated transactions. The Company has no obligation to repurchase any shares andWe may cancel, suspend, or extend the time period for the repurchase of shares at any time. Any repurchases will be funded primarily through existing cash and cash from operations. The Company may hold any shares repurchased in treasury or use a portion of the repurchased shares for stock-based compensation plans, as well as for other corporate purposes. From its initial authorization in 1999 through December 31, 2016,28, 2019, the Company had repurchased approximately 4.76.2 million shares under this authorization.
F-12
CONTRACTUAL CASH OBLIGATIONSContractual Cash Obligations
The following table presents payments due by the Company under contractual obligations with minimum firm commitments as of December 31, 2016:28, 2019:
| | | | | | Payments Due by Year | |
(In millions) | | Total | | | 2017 | | | | 2018-2019 | | | | 2020-2021 | | | Thereafter | |
| | | | | | | | | | | | | | | | | | |
Total debt | | | $ | 228.3 | | | $ | 13.7 | | | $ | 10.4 | | | $ | 201.7 | | | $ | 2.5 | |
Consulting agreement | | | | 0.7 | | | | 0.7 | | | | — | | | | — | | | | — | |
Operating leases | | | | 31.0 | | | | 7.4 | | | | 8.9 | | | | 5.2 | | | | 9.5 | |
Heavy machinery and equipment commitments | | | | 1.7 | | | | 1.7 | | | | — | | | | — | | | | — | |
Purchase commitments (1) | | | | 598.4 | | | | 597.8 | | | | 0.3 | | | | 0.3 | | | | — | |
Interest payments (2) | | | | 28.5 | | | | 5.8 | | | | 10.6 | | | | 12.1 | | | | — | |
| | | | | | | | | | | | | | | | | | | | | | |
Total contractual cash obligations | | | $ | 888.6 | | | $ | 627.1 | | | $ | 30.2 | | | $ | 219.3 | | | $ | 12.0 | |
| | | | | | | | | | | | | | | | | | | | | | |
| (1) The Company has contractual supply commitments for raw materials totaling $572.6 million at year-end prices; these contracts contain variable pricing based on Comex and the London Metals Exchange. These commitments are for purchases of raw materials that are expected to be consumed in the ordinary course of business. |
| | | | |
(2) These payments represent interest on variable-rate debt based on rates in effect at December 31, 2016. | |
|
| | | | | | | | | | | | | | | | | | | | |
| | | | | Payments Due by Year |
| (In millions) | | Total | | 2020 | | 2021-2022 | | 2023-2024 | | Thereafter |
| | | | | | | | | | | |
| Total debt | | $ | 386.8 |
| | $ | 7.5 |
| | $ | 91.0 |
| | $ | 1.4 |
| | $ | 286.9 |
|
| Operating and capital leases | | 35.7 |
| | 6.6 |
| | 10.0 |
| | 5.3 |
| | 13.8 |
|
| Heavy machinery and equipment | | 13.7 |
| | 11.1 |
| | 2.6 |
| | — |
| | — |
|
| Buildings | | 10.6 |
| | 10.6 |
| | — |
| | — |
| | — |
|
Purchase commitments (1) | | 687.5 |
| | 686.4 |
| | 0.8 |
| | 0.3 |
| | — |
|
| Transition tax on accumulated foreign earnings | | 1.9 |
| | — |
| | — |
| | — |
| | 1.9 |
|
Interest payments (2) | | 129.5 |
| | 20.0 |
| | 37.0 |
| | 34.1 |
| | 38.4 |
|
| | | | | | | | | | | |
| Total contractual cash obligations | | $ | 1,265.7 |
| | $ | 742.2 |
| | $ | 141.4 |
| | $ | 41.1 |
| | $ | 341.0 |
|
| | | | | | | | | | | |
| |
(1) | This includes contractual supply commitments totaling $634.3 million at year-end prices; these contracts contain variable pricing based on Comex and the London Metals Exchange quoted prices. These commitments are for purchases of raw materials, primarily copper cathode and brass scrap, that are expected to be consumed in the ordinary course of business. |
| |
(2) | These payments represent interest on long-term debt based on balances and rates in effect at December 28, 2019. |
The above obligations will be satisfied with existing cash, funds available under the credit agreement,Credit Agreement, and cash generated by operations. The Company has no off-balance sheet financing arrangements except for the operating leases identified above.arrangements.
Market RisksMARKET RISKS
The Company is exposed to market risks from changes in raw material and energy costs, interest rates, and foreign currency exchange rates. To reduce such risks, we may periodically use financial instruments. Hedging transactions are authorized and executed pursuant to policies and procedures. Further, we do not buy or sell financial instruments for trading purposes. A discussion of the Company'sCompany’s accounting for derivative instruments and hedging activities is included in "Note“Note 1 - Summary of Significant Accounting Policies"Policies” in the Notes to Consolidated Financial Statements.
Cost and Availability of Raw Materials and Energy
Raw materials, primarily copper and brass, represent the largest component of the Company'sCompany’s variable costs of production. The cost of these materials is subject to global market fluctuations caused by factors beyond our control. Significant increases in the cost of metal, to the extent not reflected in prices for our finished products, or the lack of availability could materially and adversely affect our business, results of operations and financial condition.
The Company occasionally enters into forward fixed-price arrangements with certain customers. We may utilize futures contracts to hedge risks associated with these forward fixed-price arrangements. We may also utilize futures contracts to manage price risk associated with inventory. Depending on the nature of the hedge, changes in the fair value of the futures contracts will either be offset against the change in fair value of the inventory through earnings or recognized as a component of accumulated other comprehensive income (AOCI) in equity and reflected in earnings upon the sale of inventory. Periodic value fluctuations of the contracts generally offset the value fluctuations of the underlying fixed-price transactions or inventory. At December 31, 2016,28, 2019, we held open futures contracts to purchase approximately $10.2$21.3 million of copper over the next 12 months related to fixed-price sales orders and to sell approximately $28.7$1.9 million of copper over the next threeseven months related to copper inventory.
We may enter into futures contracts or forward fixed-price arrangements with certain vendors to manage price risk associated with natural gas purchases. The effective portion of gains and losses with respect to positions are deferred in equity as a component of AOCI and reflected in earnings upon consumption of natural gas. Periodic value fluctuations of the futures contracts generally offset the value fluctuations of the underlying natural gas prices. There were no open futures contracts to purchase natural gas at December 31, 2016.28, 2019.
Interest Rates
The Company had variable-rate debt outstanding of $212.2$97.0 million at December 31, 201628, 2019 and $216.0$202.6 million at December 26, 2015.29, 2018. At thesethis borrowing levels,level, a hypothetical 10 percent increase in interest rates would have had an insignificant unfavorable impact on our pre-tax earnings and cash flows. The primary interest rate exposuresexposure on floating-ratevariable-rate debt areis based on LIBOR and the base-lending rate published by the People's Bank of China. There was $15.2 million of fixed-rate debt outstanding as of December 31, 2016, and no fixed-rate debt outstanding as of December 26, 2015.LIBOR.
Included in the variable-rate debt outstanding is the Company's $200.0 million Credit Agreement which bears interest based on LIBOR. We have reduced our exposure to increases in LIBOR by entering into interest rate swap contracts. The fair value of these contracts has been recorded in the Consolidated Balance Sheets, and a portion of the related gains and losses on the contracts are deferred in stockholders' equity as a component of AOCI. Deferred gains or losses on the contracts will be recognized in interest expense in the period in which the related interest payment being hedged is expensed. The interest rate swap agreement had an effective date of January 12, 2015.
Foreign Currency Exchange Rates
Foreign currency exposures arising from transactions include firm commitments and anticipated transactions denominated in a currency other than an entity'sentity’s functional currency. The Company and its subsidiaries generally enter into transactions denominated in their respective functional currencies. We may utilize certain futures or forward contracts with financial institutions to hedge foreign currency transactional exposures. Gains and losses with respect to these positions are deferred in equity as a component of AOCI and reflected in earnings upon collection of receivables or payment of commitments. At December 31, 2016,28, 2019, we had open forward contracts with a financial institution to sell approximately 3.20.1 million euros, 15.621.7 million Swedish kronor, 7.6and 8.1 million Norwegian kroner and 1.2 million U.S. dollars through April 2017.2020.
The Company'sCompany’s primary foreign currency exposure arises from foreign-denominated revenues and profits and their translation into U.S. dollars. The primary currencies to which we are exposed include the Canadian dollar, the British pound sterling, the Mexican peso, and the South Korean won, and the Chinese renminbi.won. The Company generally views its investments in foreign subsidiaries with a functional currency other than the U.S. dollar as long-term. As a result, we generally do not hedge these net investments. The net investment in foreign subsidiaries translated into U.S. dollars using the year-end exchange rates was $271.6$397.1 million at December 31, 201628, 2019 and $249.5$376.6 million at December 26, 2015.29, 2018. The potential loss in value of the Company'sCompany’s net investment in foreign subsidiaries resulting from a hypothetical 10 percent adverse change in quoted foreign currency exchange rates at December 31, 201628, 2019 and December 26, 201529, 2018 amounted to $27.2$39.7 million and $25.0$37.7 million, respectively. This change would be reflected in the foreign currency translation component of AOCI in the equity section of our Consolidated Balance Sheets until the foreign subsidiaries are sold or otherwise disposed.
We have significant investments in foreign operations whose functional currency is the British pound sterling, the Mexican peso, the Canadian dollar, the Chinese renminbi, and the South Korean won. During 2016,2019, the value of the British pound decreasedincreased approximately 17three percent, the Mexican peso decreasedincreased approximately 164 percent, the Canadian dollar increased approximately three percent, the Chinese renminbi decreased approximately sevenfour percent, and the South Korean won remained consistent,decreased approximately four percent, relative to the U.S. dollar. The resulting net foreign currency translation lossesgains were included in calculating net other comprehensive loss for the year ended December 28, 2019 and were recorded as a component of AOCI.
CRITICAL ACCOUNTING POLICIES AND ESTIMATES
Critical Accounting Policies and Estimates
The Company'sCompany’s accounting policies are more fully described in "Note“Note 1 - Summary of Significant Accounting Policies"Policies” in the Notes to Consolidated Financial Statements. As disclosed in Note 1, the preparation of financial statements in conformity with general accepted accounting principles in the United States requires management to make estimates and assumptions about future events that affect amounts reported in the financial statements and accompanying notes. Actual results could differ significantly from those estimates. Management believes the following discussion addresses our most critical accounting policies, which are those that are most important to the portrayal of the Company'sCompany’s financial condition and results of operations and require management'smanagement’s most difficult, subjective, and complex judgments.
Inventory Valuation Reserves
Our inventories are valued at the lower-of-cost-or-market. The market price of copper cathode and scrap are subject to volatility. During periods when open market prices decline below net realizable value, the Company may need to provide an allowance to reduce the carrying value of its inventory. In addition, certain items in inventory may be considered excess or obsolete and, as such, we may establish an allowance to reduce the carrying value of those items to their net realizable value. Changes in these estimates related to the value of inventory, if any, may result in a materially adverse impact on our reported financial position or results of operations. The Company recognizes the impact of any changes in estimates, assumptions, and judgments in income in the period in which they are determined.
As of December 31, 201628, 2019 and December 26, 2015,29, 2018, our inventory valuation reserves were $6.9$6.3 million and $6.2$7.0 million, respectively. The expense recognized in each of these periods was immaterial to our Consolidated Financial Statements.
Impairment of Goodwill
As of December 31, 2016,28, 2019, we had $124.0$153.3 million of recorded goodwill from our business acquisitions, representing the excess of the purchase price over the fair value of the net assets we have acquired. During 20162019 we recorded $0.4$1.5 million in additional goodwill associated with our Jungwoo-Mueller acquisitionATCO and $4.1 millionDie-Mold acquisitions in additional goodwill associatedconjunction with a deferred tax liability resulting from a basis difference in the long-lived assets acquired from Great Lakes.finalization of the purchase price allocations.
Goodwill is subject to impairment testing, which is performed annually as of the first day of the fourth quarter unless circumstances indicate the need to accelerate the timing of the tests. These circumstances include a significant change in the business climate, operating performance indicators, competition, or sale or disposition of a significant portion of one of our businesses. In our evaluation of goodwill impairment, we perform a qualitative assessment at the reporting unit level that requires management judgment and the use of estimates to determine if it is more likely than not that the fair value of a reporting unit is less than its carrying amount. If the qualitative assessment is not conclusive, we proceed to a two-step process to test goodwill for impairment. The first step is to comparemanagement compares the fair value of a reporting unit with its carrying amount and will recognize an impairment charge for the amount by which the carrying amount exceeds the reporting unit to its carrying value (including attributable goodwill). If this process indicates that theunit’s fair value, is less thannot to exceed the carrying value, a second step of impairment testing is performed to measure the potentialtotal amount of goodwill impairment loss. In step two, we allocate the fair value ofallocated to the reporting unit determined in step one to its assets and liabilities as if it had just been acquired in a business combination and the purchase price was equivalent to the fair value of the reporting unit. The excess of the fair value of the reporting unit over the amount assigned to its assets and liabilities is referred to as the implied fair value of goodwill. The implied fair value of goodwill is then compared to the actual carrying value of goodwill. If the implied fair value is less than the carrying value, we would be required to recognize an impairment loss for that excess.
We identify reporting units by evaluating components of our operating segments and combining those components with similar economic characteristics. Reporting units with significant recorded goodwill include Domestic Piping Systems, Canadian Operations,B&K LLC, Great Lakes, Heatlink Group, Die-Mold, European Operations, Jungwoo-Mueller, Westermeyer, Turbotec, and Turbotec.ATCO.
The fair value of each reporting unit is estimated using a combination of the income and market approaches, incorporating market participant considerations and management'smanagement’s assumptions on revenue growth rates, operating margins, discount rates and expected capital expenditures. Estimates used by management can significantly affect the outcome of the impairment test. Changes in forecasted operating results and other assumptions could materially affect these estimates.
We evaluated each reporting unit during the fourth quarters of 20162019 and 2015,2018, as applicable. The estimated fair value of each of these reporting units exceeded its carrying values in 20162019 and 2015,2018, and we do not believe that any of these reporting units were at risk of impairment as of December 31, 2016.28, 2019.
Pension and Other Postretirement Benefit Plans
We sponsor several qualified and nonqualified pension and other postretirement benefit plans in the U.S. and certain foreign locations. We recognize the overfunded or underfunded status of the plans as an asset or liability in the Consolidated Balance Sheets with changes in the funded status recorded through comprehensive income in the year in which those changes occur. The obligations for these plans are actuarially determined and affected by assumptions, including discount rates, expected long-term return on plan assets for defined benefit pension plans, and certain employee-related factors, such as retirement age and mortality. We evaluate the assumptions periodically and makes adjustments as necessary.
The expected return on plan assets is determined using the market value of plan assets. Differences between assumed and actual returns are amortized to the market value of assets on a straight-line basis over the average remaining service period of the plan participants using the corridor approach. The corridor approach defers all actuarial gains and losses resulting from variances between actual results and actuarial assumptions. These unrecognized gains and losses are amortized when the net gains and losses exceed 10 percent of the greater of the market value of the plan assets or the projected benefit obligation. The amount in excess of the corridor is amortized over the average remaining service period of the plan participants. For 2019, the average remaining service period for the pension plans was nine years.
Environmental Reserves
We recognize an environmental reserve when it is probable that a loss is likely to occur and the amount of the loss is reasonably estimable. We estimate the duration and extent of our remediation obligations based upon reports of outside consultants;consultants, internal and third party estimates and analyses of cleanup costs;costs and ongoing monitoring costs, communications with regulatory agencies;agencies, and changes in environmental law. If we were to determine that our estimates of the duration or extent of our environmental obligations were no longer accurate, we would adjust our environmental reserve accordingly in the period that such determination is made. Estimated future expenditures for environmental remediation are not discounted to their present value. Accrued environmental liabilities are not reduced by potential insurance reimbursements.
Environmental expenses that relate to ongoing operations are included as a component of cost of goods sold. Environmental expenses related to non-operating properties are included in otherpresented below operating income net in the Consolidated Statements of Income.
Income Taxes
We estimate total income tax expense based on domestic and international statutory income tax rates in the tax jurisdictions where we operate, permanent differences between financial reporting and tax reporting, and available credits and incentives.
Deferred income tax assets and liabilities are recognized for the future tax effects of temporary differences between the treatment of certain items for financial statement and tax purposes using tax rates in effect for the years in which the differences are expected to reverse. Realization of certain components of deferred tax assets is dependent upon the occurrence of future events.
Valuation allowances are recorded when, in the opinion of management, it is more likely than not that all or a portion of the deferred tax assets will not be realized. These valuation allowances can be impacted by changes in tax laws, changes to statutory tax rates, and future taxable income levels, and are based on our judgment, estimates, and assumptions. In the event we were to determine that we would not be able to realize all or a portion of the net deferred tax assets in the future, we would increase the valuation allowance through a charge to income tax expense in the period that such determination is made. Conversely, if we were to determine that we would be able to realize our deferred tax assets in the future, in excess of the net carrying amounts, we would decrease the recorded valuation allowance through a decrease to income tax expense in the period that such determination is made.
We record liabilities for known or anticipated tax issues based on our analysis of whether, and the extent to which, additional taxes will be due. These unrecognized tax benefits are retained until the associated uncertainty is resolved. Tax benefits for uncertain tax positions that are recognized in the Consolidated Financial Statements are measured as the largest amount of benefit, determined on a cumulative probability basis, that is more likely than not to be realized upon ultimate settlement. To the extent we prevail in matters for which a liability for an uncertain tax position is established or are required to pay amounts in excess of the liability, our effective tax rate in a given period may be materially affected.
New Accounting Pronouncements
Cautionary Statement Regarding Forward-Looking InformationCAUTIONARY STATEMENT REGARDING FORWARD-LOOKING INFORMATION
This Annual Report contains various forward-looking statements and includes assumptions concerning the Company'sCompany’s operations, future results, and prospects. These forward-looking statements are based on current expectations and are subject to risk and uncertainties, and may be influenced by factors that could cause actual outcomes and results to be materially different from those predicted. The forward-looking statements reflect knowledge and information available as of the date of preparation of the Annual Report, and the Company undertakes no obligation to update these forward-looking statements. We identify the forward-looking statements by using the words "anticipates," "believes," "expects," "intends"“anticipates,” “believes,” “expects,” “intends” or similar expressions in such statements.
In connection with the "safe harbor"“safe harbor” provisions of the Private Securities Litigation Reform Act of 1995, the Company provides the following cautionary statement identifying important economic, political, and technological factors, among others, which could cause actual results or events to differ materially from those set forth in or implied by the forward-looking statements and related assumptions. In addition to those factors discussed under "Risk Factors"“Risk Factors” in this Annual Report on Form 10-K, such factors include: (i) the current and projected future business environment, including interest rates and capital and consumer spending; (ii) the domestic housing and commercial construction industry environment; (iii) availability and price fluctuations in commodities (including copper, natural gas, and other raw materials, including crude oil that indirectly affects plastic resins); (iv) competitive factors and competitor responses to the Company'sCompany’s initiatives; (v) stability of government laws and regulations, including taxes; (vi) availability of financing; and (vii) continuation of the environment to make acquisitions, domestic and foreign, including regulatory requirements and market values of candidates.
MUELLER INDUSTRIES, INC.
CONSOLIDATED STATEMENTS OF INCOME
Years Ended December 31, 2016,28, 2019, December 26, 2015,29, 2018, and December 27, 201430, 2017
| (In thousands, except per share data) | | 2016 | | | 2015 | | | 2014 | |
| | | | | | | | | | |
| Net sales | | $ | 2,055,622 | | | $ | 2,100,002 | | | $ | 2,364,227 | |
| | | | | | | | | | | | | |
| Cost of goods sold | | | 1,723,499 | | | | 1,809,702 | | | | 2,043,719 | |
| Depreciation and amortization | | | 35,133 | | | | 34,608 | | | | 33,735 | |
| Selling, general, and administrative expense | | | 137,499 | | | | 130,358 | | | | 131,740 | |
| Gain on sale of assets | | | — | | | | (15,376 | ) | | | (6,259 | ) |
| Impairment charges | | | 6,778 | | | | — | | | | — | |
| Severance | | | — | | | | 3,442 | | | | 7,296 | |
| | | | | | | | | | | | | |
| Operating income | | | 152,713 | | | | 137,268 | | | | 153,996 | |
| | | | | | | | | | | | | |
| Interest expense | | | (7,387 | ) | | | (7,667 | ) | | | (5,740 | ) |
| Other income (expense), net | | | 704 | | | | 2,188 | | | | (243 | ) |
| | | | | | | | | | | | | |
| Income before income taxes | | | 146,030 | | | | 131,789 | | | | 148,013 | |
| | | | | | | | | | | | | |
| Income tax expense | | | (48,137 | ) | | | (43,382 | ) | | | (45,479 | ) |
| Income from unconsolidated affiliates, net of tax | | | 1,861 | | | | — | | | | — | |
| | | | | | | | | | | | | |
| Consolidated net income | | | 99,754 | | | | 88,407 | | | | 102,534 | |
| | | | | | | | | | | | | |
| Less net income attributable to noncontrolling interests | | | (27 | ) | | | (543 | ) | | | (974 | ) |
| | | | | | | | | | | | | |
| Net income attributable to Mueller Industries, Inc. | | $ | 99,727 | | | $ | 87,864 | | | $ | 101,560 | |
| | | | | | | | | | | | | |
| Weighted average shares for basic earnings per share | | | 56,572 | | | | 56,316 | | | | 56,042 | |
| Effect of dilutive stock-based awards | | | 597 | | | | 652 | | | | 726 | |
| | | | | | | | | | | | | |
| Adjusted weighted average shares for diluted earnings per share | | | 57,169 | | | | 56,968 | | | | 56,768 | |
| | | | | | | | | | | | | |
| Basic earnings per share | | $ | 1.76 | | | $ | 1.56 | | | $ | 1.81 | |
| | | | | | | | | | | | | |
| Diluted earnings per share | | $ | 1.74 | | | $ | 1.54 | | | $ | 1.79 | |
| | | | | | | | | | | | | |
| Dividends per share | | $ | 0.375 | | | $ | 0.300 | | | $ | 0.300 | |
| | | | | | | | | | | | | |
| See accompanying notes to consolidated financial statements. | |
|
| | | | | | | | | | | | |
| (In thousands, except per share data) | | 2019 | | 2018 | | 2017 (1) |
| | | | | | | |
| Net sales | | $ | 2,430,616 |
| | $ | 2,507,878 |
| | $ | 2,266,073 |
|
| | | | | | | |
| Cost of goods sold | | 2,035,610 |
| | 2,150,400 |
| | 1,940,617 |
|
| Depreciation and amortization | | 42,693 |
| | 39,555 |
| | 33,944 |
|
| Selling, general, and administrative expense | | 162,358 |
| | 148,888 |
| | 140,730 |
|
| Gain on sale of assets, net | | (963 | ) | | (253 | ) | | (1,491 | ) |
| Impairment charges | | — |
| | — |
| | 1,466 |
|
| Insurance recovery | | (485 | ) | | (3,681 | ) | | — |
|
| | | | | | | |
| Operating income | | 191,403 |
| | 172,969 |
| | 150,807 |
|
| | | | | | | |
| Interest expense | | (25,683 | ) | | (25,199 | ) | | (19,502 | ) |
| Environmental expense | | (1,321 | ) | | (1,320 | ) | | (7,284 | ) |
| Other income, net | | 1,684 |
| | 3,967 |
| | 2,951 |
|
| | | | | | | |
| Income before income taxes | | 166,083 |
| | 150,417 |
| | 126,972 |
|
| | | | | | | |
| Income tax expense | | (35,257 | ) | | (30,952 | ) | | (37,884 | ) |
| Loss from unconsolidated affiliates, net of foreign tax | | (24,594 | ) | | (12,645 | ) | | (2,077 | ) |
| | | | | | | |
| Consolidated net income | | 106,232 |
| | 106,820 |
| | 87,011 |
|
| | | | | | | |
| Net income attributable to noncontrolling interests | | (5,260 | ) | | (2,361 | ) | | (1,413 | ) |
| | | | | | | |
| Net income attributable to Mueller Industries, Inc. | | $ | 100,972 |
| | $ | 104,459 |
| | $ | 85,598 |
|
| | | | | | | |
| Weighted average shares for basic earnings per share | | 55,798 |
| | 56,782 |
| | 56,925 |
|
| Effect of dilutive stock-based awards | | 545 |
| | 487 |
| | 559 |
|
| | | | | | | |
| Adjusted weighted average shares for diluted earnings per share | | 56,343 |
| | 57,269 |
| | 57,484 |
|
| | | | | | | |
| Basic earnings per share | | $ | 1.81 |
| | $ | 1.84 |
| | $ | 1.50 |
|
| | | | | | | |
| Diluted earnings per share | | $ | 1.79 |
| | $ | 1.82 |
| | $ | 1.49 |
|
| | | | | | | |
| Dividends per share | | $ | 0.40 |
| | $ | 0.40 |
| | $ | 8.40 |
|
See accompanying notes to consolidated financial statements.
(1) The Consolidated Statement of Income for 2017 has been adjusted to reflect the adoption of ASU 2017-07, Compensation - Retirement Benefits (Topic 715): Improving the Presentation of Net Periodic Pension Cost and Net Periodic Postretirement Benefit Cost in 2018. The components of net periodic benefit cost (income) other than the service cost component are included in other income, net in the Consolidated Statements of Income.
MUELLER INDUSTRIES, INC.
CONSOLIDATED STATEMENTS OF COMPREHENSIVE INCOME
Years Ended December 31, 2016,28, 2019, December 26, 2015,29, 2018, and December 27, 201430, 2017
| (In thousands) | | 2016 | | | 2015 | | | 2014 | |
| | | | | | | | | | |
| Consolidated net income | | $ | 99,754 | | | $ | 88,407 | | | $ | 102,534 | |
| | | | | | | | | | | | | |
| Other comprehensive (loss) income, net of tax: | | | | | | | | | | | | |
| Foreign currency translation | | | (27,767 | ) | | | (19,108 | ) | | | (6,766 | ) |
Net change with respect to derivative instruments and hedging activities (1) | | | 1,709 | | | | (1,056 | ) | | | (2,499 | ) |
Net change in minimum pension and postretirement obligation adjustments (2) | | | 5,383 | | | | 6,735 | | | | (23,006 | ) |
Attributable to unconsolidated affiliates (3) | | | 5,975 | | | | — | | | | — | |
| Other, net | | | 159 | | | | (49 | ) | | | 15 | |
| | | | | | | | | | | | | |
| Total other comprehensive loss | | | (14,541 | ) | | | (13,478 | ) | | | (32,256 | ) |
| | | | | | | | | | | | | |
| Consolidated comprehensive income | | | 85,213 | | | | 74,929 | | | | 70,278 | |
| Comprehensive loss (income) attributable to noncontrolling interests | | | 2,548 | | | | 867 | | | | (822 | ) |
| | | | | | | | | | | | | |
| Comprehensive income attributable to Mueller Industries, Inc. | | $ | 87,761 | | | $ | 75,796 | | | $ | 69,456 | |
| | | | | | | | | | | | | |
| See accompanying notes to consolidated financial statements. | |
| | |
(1) Net of taxes of $(917) in 2016, $575 in 2015, and $1,362 in 2014 | |
| | |
(2) Net of taxes of $(2,606) in 2016, $(3,221) in 2015, and $10,180 in 2014 | |
| | |
(3) Net of taxes of $(3,375) in 2016 | |
|
| | | | | | | | | | | | |
| (In thousands) | | 2019 | | 2018 | | 2017 |
| | | | | | | |
| Consolidated net income | | $ | 106,232 |
| | $ | 106,820 |
| | $ | 87,011 |
|
| | | | | | | |
| Other comprehensive income (loss), net of tax: | | |
| | |
| | |
|
| Foreign currency translation | | 7,409 |
| | (16,876 | ) | | 13,174 |
|
| Net change with respect to derivative instruments and hedging activities, net of tax of $(195), $318, and $(541) | | 690 |
| | (1,173 | ) | | 1,147 |
|
| Net change in pension and postretirement obligation adjustments, net of tax of $(671), $670, and $(1,071) | | 3,112 |
| | (3,339 | ) | | 2,436 |
|
| Attributable to unconsolidated affiliates, net of tax of $244, $2,522, and $(505) | | (839 | ) | | (8,686 | ) | | 895 |
|
| Other, net | | — |
| | — |
| | (380 | ) |
| | | | | | | |
| Total other comprehensive income (loss), net | | 10,372 |
| | (30,074 | ) | | 17,272 |
|
| | | | | | | |
| Consolidated comprehensive income | | 116,604 |
| | 76,746 |
| | 104,283 |
|
| Comprehensive income attributable to noncontrolling interests | | (4,610 | ) | | (1,579 | ) | | (2,785 | ) |
| | | | | | | |
| Comprehensive income attributable to Mueller Industries, Inc. | | $ | 111,994 |
| | $ | 75,167 |
| | $ | 101,498 |
|
See accompanying notes to consolidated financial statements.
MUELLER INDUSTRIES, INC.
CONSOLIDATED BALANCE SHEETS
As of December 31, 201628, 2019 and December 26, 201529, 2018 |
| | | | | | | | |
| (In thousands, except share data) | | 2019 | | 2018 |
| Assets | | | | |
| Current assets: | | | | |
| Cash and cash equivalents | | $ | 97,944 |
| | $ | 72,616 |
|
| Accounts receivable, less allowance for doubtful accounts of $770 in 2019 and $836 in 2018 | | 269,943 |
| | 273,417 |
|
| Inventories | | 292,107 |
| | 329,795 |
|
| Other current assets | | 33,778 |
| | 26,790 |
|
| | | | | |
| Total current assets | | 693,772 |
| | 702,618 |
|
| | | | | |
| Property, plant, and equipment, net | | 363,128 |
| | 370,633 |
|
| Operating lease right-of-use assets | | 26,922 |
| | — |
|
| Goodwill, net | | 153,276 |
| | 150,335 |
|
| Intangible assets, net | | 60,082 |
| | 61,971 |
|
| Investment in unconsolidated affiliates | | 48,363 |
| | 58,042 |
|
| Other noncurrent assets | | 25,397 |
| | 25,950 |
|
| | | | | |
| Total Assets | | $ | 1,370,940 |
| | $ | 1,369,549 |
|
| | | | | |
| Liabilities | | | | |
| Current liabilities: | | | | |
| Current portion of debt | | $ | 7,530 |
| | $ | 7,101 |
|
| Accounts payable | | 85,644 |
| | 103,754 |
|
| Accrued wages and other employee costs | | 41,673 |
| | 38,549 |
|
| Current portion of operating lease liabilities | | 5,250 |
| | — |
|
| Other current liabilities | | 94,190 |
| | 83,397 |
|
| | | | | |
| Total current liabilities | | 234,287 |
| | 232,801 |
|
| | | | | |
| Long-term debt, less current portion | | 378,724 |
| | 489,597 |
|
| Pension liabilities | | 9,126 |
| | 14,237 |
|
| Postretirement benefits other than pensions | | 13,082 |
| | 14,818 |
|
| Environmental reserves | | 19,972 |
| | 20,009 |
|
| Deferred income taxes | | 21,094 |
| | 16,615 |
|
| Noncurrent operating lease liabilities | | 22,388 |
| | — |
|
| Other noncurrent liabilities | | 10,131 |
| | 18,212 |
|
| | | | | |
| Total liabilities | | 708,804 |
| | 806,289 |
|
| | | | | |
| Equity | | |
| | |
|
| Mueller Industries, Inc. stockholders' equity: | | |
| | |
|
| Preferred stock - $1.00 par value; shares authorized 5,000,000; none outstanding | | — |
| | — |
|
| Common stock - $.01 par value; shares authorized 100,000,000; issued 80,183,004; outstanding 56,949,246 in 2019 and 56,702,997 in 2018 | | 802 |
| | 802 |
|
| Additional paid-in capital | | 278,609 |
| | 276,849 |
|
| Retained earnings | | 903,070 |
| | 824,737 |
|
| Accumulated other comprehensive loss | | (68,770 | ) | | (79,792 | ) |
| Treasury common stock, at cost | | (470,243 | ) | | (474,240 | ) |
| | | | | |
| Total Mueller Industries, Inc. stockholders' equity | | 643,468 |
| | 548,356 |
|
| Noncontrolling interests | | 18,668 |
| | 14,904 |
|
| | | | | |
| Total equity | | 662,136 |
| | 563,260 |
|
| | | | | |
| Commitments and contingencies | | — |
| | — |
|
| | | | | |
| Total Liabilities and Equity | | $ | 1,370,940 |
| | $ | 1,369,549 |
|
| (In thousands, except share data) | 2016 | | 2015 | |
| Assets | | | | |
| Current assets: | | | | |
| Cash and cash equivalents | | | $ | 351,317 | | | | $ | 274,844 | |
| Accounts receivable, less allowance for doubtful accounts of $637 in 2016 and $623 in 2015 | | | | 256,291 | | | | | 251,571 | |
| Inventories | | | | 242,013 | | | | | 239,378 | |
| Other current assets | | | | 44,702 | | | | | 34,608 | |
| | | | | | | | | | | |
| Total current assets | | | | 894,323 | | | | | 800,401 | |
| | | | | | | | | | | |
| Property, plant, and equipment, net | | | | 295,231 | | | | | 280,224 | |
| Goodwill, net | | | | 123,993 | | | | | 120,252 | |
| Intangible assets, net | | | | 36,168 | | | | | 40,636 | |
| Investment in unconsolidated affiliates | | | | 77,110 | | | | | 65,900 | |
| Other noncurrent assets | | | | 20,651 | | | | | 31,388 | |
| | | | | | | | | | | |
| Total Assets | | | $ | 1,447,476 | | | | $ | 1,338,801 | |
| | | | | | | | | | | |
| Liabilities | | | | | | | | | | |
| Current liabilities: | | | | | | | | | | |
| Current portion of debt | | | $ | 13,655 | | | | $ | 11,760 | |
| Accounts payable | | | | 103,175 | | | | | 88,051 | |
| Accrued wages and other employee costs | | | | 35,121 | | | | | 35,636 | |
| Other current liabilities | | | | 67,041 | | | | | 73,982 | |
| | | | | | | | | | | |
| Total current liabilities | | | | 218,992 | | | | | 209,429 | |
| | | | | | | | | | | |
| Long-term debt, less current portion | | | | 213,709 | | | | | 204,250 | |
| Pension liabilities | | | | 14,890 | | | | | 17,449 | |
| Postretirement benefits other than pensions | | | | 16,383 | | | | | 17,427 | |
| Environmental reserves | | | | 21,208 | | | | | 20,943 | |
| Deferred income taxes | | | | 19,573 | | | | | 7,161 | |
| Other noncurrent liabilities | | | | 6,284 | | | | | 2,440 | |
| | | | | | | | | | | |
| Total liabilities | | | | 511,039 | | | | | 479,099 | |
| | | | | | | | | | | |
| Equity | | | | | | | | | | |
| Mueller Industries, Inc. stockholders' equity: | | | | | | | | | | |
| Preferred stock - $1.00 par value; shares authorized 5,000,000; none outstanding | | | | — | | | | | — | |
| Common stock - $.01 par value; shares authorized 100,000,000; issued 80,183,004; outstanding 57,395,209 in 2016 and 57,158,608 in 2015 | | | | 802 | | | | | 802 | |
| Additional paid-in capital | | | | 273,345 | | | | | 271,158 | |
| Retained earnings | | | | 1,141,831 | | | | | 1,063,543 | |
| Accumulated other comprehensive loss | | | | (66,956 | ) | | | | (54,990 | ) |
| Treasury common stock, at cost | | | | (450,338 | ) | | | | (453,228 | ) |
| | | | | | | | | | | |
| Total Mueller Industries, Inc. stockholders' equity | | | | 898,684 | | | | | 827,285 | |
| Noncontrolling interests | | | | 37,753 | | | | | 32,417 | |
| | | | | | | | | | | |
| Total equity | | | | 936,437 | | | | | 859,702 | |
| | | | | | | | | | | |
| Commitments and contingencies | | | | — | | | | | — | |
| | | | | | | | | | | |
| Total Liabilities and Equity | | | $ | 1,447,476 | | | | $ | 1,338,801 | |
| | | | | | | | | | | |
| See accompanying notes to consolidated financial statements. | |
MUELLER INDUSTRIES, INC.
CONSOLIDATED STATEMENTS OF CASH FLOWS
Years Ended December 31, 2016,28, 2019, December 26, 2015,29, 2018, and December 27, 2014
| (In thousands) | | 2016 | | | 2015 | | | 2014 | |
| Operating activities: | | | | | | | | | |
| Consolidated net income | | $ | 99,754 | | | $ | 88,407 | | | $ | 102,534 | |
| Reconciliation of net income to net cash provided by operating activities: | | | | | | | | | | | | |
| Depreciation | | | 30,827 | | | | 30,556 | | | | 30,205 | |
| Amortization of intangibles | | | 4,306 | | | | 4,052 | | | | 3,530 | |
| Amortization of debt issuance costs | | | 569 | | | | 432 | | | | 341 | |
| Equity in earnings of unconsolidated affiliates | | | (1,861 | ) | | | — | | | | — | |
| Stock-based compensation expense | | | 6,387 | | | | 6,244 | | | | 6,265 | |
| Gain on disposal of assets | | | (651 | ) | | | (14,815 | ) | | | (5,405 | ) |
| Impairment charges | | | 6,778 | | | | — | | | | — | |
| Income tax benefit from exercise of stock options | | | — | | | | (972 | ) | | | (837 | ) |
| Deferred income taxes | | | 6,998 | | | | (15,818 | ) | | | (6,495 | ) |
| Recovery of doubtful accounts receivable | | | (50 | ) | | | (130 | ) | | | (500 | ) |
| Changes in assets and liabilities, net of businesses acquired and sold: | | | | | | | | | | | | |
| Receivables | | | (16,502 | ) | | | 51,660 | | | | (21,432 | ) |
| Inventories | | | 6,662 | | | | 41,086 | | | | 1,381 | |
| Other assets | | | 5,808 | | | | 12,449 | | | | (23,652 | ) |
| Current liabilities | | | 5,646 | | | | (45,585 | ) | | | 5,849 | |
| Other liabilities | | | 1,518 | | | | 436 | | | | (2,223 | ) |
| Other, net | | | 1,588 | | | | 1,607 | | | | 1,044 | |
| | | | | | | | | | | | | |
| Net cash provided by operating activities | | | 157,777 | | | | 159,609 | | | | 90,605 | |
| | | | | | | | | | | | | |
| Investing activities: | | | | | | | | | | | | |
| Proceeds from sale of assets, net of cash transferred | | | 10,304 | | | | 5,538 | | | | 33,788 | |
| Acquisition of businesses, net of cash acquired | | | (20,533 | ) | | | (105,944 | ) | | | (30,137 | ) |
| Capital expenditures | | | (37,497 | ) | | | (28,834 | ) | | | (39,173 | ) |
| Investment in unconsolidated affiliates | | | — | | | | (65,900 | ) | | | — | |
| Net (deposits into) withdrawals from restricted cash balances | | | (5,331 | ) | | | 4,333 | | | | (2,902 | ) |
| | | | | | | | | | | | | |
| Net cash used in investing activities | | | (53,057 | ) | | | (190,807 | ) | | | (38,424 | ) |
| | | | | | | | | | | | | |
| Financing activities: | | | | | | | | | | | | |
| Dividends paid to stockholders of Mueller Industries, Inc. | | | (21,224 | ) | | | (16,903 | ) | | | (16,819 | ) |
| Dividends paid to noncontrolling interests | | | (3,765 | ) | | | — | | | | — | |
| Issuance of long-term debt | | | 3,500 | | | | — | | | | — | |
| Repayments of long-term debt | | | (1,074 | ) | | | (1,000 | ) | | | (1,050 | ) |
| Issuance (repayment) of debt by joint ventures, net | | | 2,265 | | | | (23,567 | ) | | | 7,258 | |
| Net cash used to settle stock-based awards | | | (1,306 | ) | | | (760 | ) | | | (777 | ) |
| Income tax benefit from exercise of stock options | | | — | | | | 972 | | | | 837 | |
| Debt issuance costs | | | (957 | ) | | | — | | | | — | |
| | | | | | | | | | | | | |
| Net cash used in financing activities | | | (22,561 | ) | | | (41,258 | ) | | | (10,551 | ) |
| | | | | | | | | | | | | |
| Effect of exchange rate changes on cash | | | (5,686 | ) | | | (4,834 | ) | | | (1,296 | ) |
| | | | | | | | | | | | | |
| Increase (decrease) in cash and cash equivalents | | | 76,473 | | | | (77,290 | ) | | | 40,334 | |
| Cash and cash equivalents at the beginning of the year | | | 274,844 | | | | 352,134 | | | | 311,800 | |
| | | | | | | | | | | | | |
| Cash and cash equivalents at the end of the year | | $ | 351,317 | | | $ | 274,844 | | | $ | 352,134 | |
| | | | | | | | | | | | | |
| | |
| See accompanying notes to consolidated financial statements. | |
30, 2017
|
| | | | | | | | | | | | |
| (In thousands) | | 2019 | | 2018 | | 2017 (1) |
| | | | | | | |
| Operating activities: | | | | | | |
| Consolidated net income | | $ | 106,232 |
| | $ | 106,820 |
| | $ | 87,011 |
|
| Reconciliation of consolidated net income to net cash provided by operating activities: | | |
| | |
| | |
|
| Depreciation | | 37,337 |
| | 35,118 |
| | 30,800 |
|
| Amortization of intangibles | | 5,356 |
| | 4,437 |
| | 3,144 |
|
| Amortization of debt issuance costs | | 318 |
| | 318 |
| | 303 |
|
| Loss from unconsolidated affiliates | | 24,594 |
| | 12,645 |
| | 2,077 |
|
| Insurance proceeds - noncapital related | | 485 |
| | 2,306 |
| | 500 |
|
| Change in the fair value of contingent consideration | | 3,625 |
| | — |
| | — |
|
| Insurance recovery | | (485 | ) | | (3,681 | ) | | — |
|
| Stock-based compensation expense | | 8,744 |
| | 8,035 |
| | 7,450 |
|
| Gain on sale of business | | — |
| | — |
| | (1,491 | ) |
| Gain on disposals of assets | | (963 | ) | | (253 | ) | | (624 | ) |
| Impairment charges | | — |
| | — |
| | 1,466 |
|
| Deferred income tax (benefit) expense | | (428 | ) | | 170 |
| | (3,160 | ) |
| Changes in assets and liabilities, net of effects of businesses acquired and sold: | | |
| | |
| | |
|
| Receivables | | 6,505 |
| | (11,342 | ) | | (1,779 | ) |
| Inventories | | 39,561 |
| | 27,512 |
| | (86,286 | ) |
| Other assets | | (15,639 | ) | | 14,353 |
| | (5,325 | ) |
| Current liabilities | | (7,076 | ) | | (15,680 | ) | | 10,678 |
|
| Other liabilities | | (7,944 | ) | | (14,769 | ) | | 64 |
|
| Other, net | | 322 |
| | 1,903 |
| | (833 | ) |
| | | | | | | |
| Net cash provided by operating activities | | 200,544 |
| | 167,892 |
| | 43,995 |
|
| | | | | | | |
| Investing activities: | | |
| | |
| | |
|
| Proceeds from sale of assets, net of cash transferred | | 3,240 |
| | 18,703 |
| | 31,564 |
|
| Acquisition of businesses, net of cash acquired | | 3,465 |
| | (167,677 | ) | | (18,396 | ) |
| Capital expenditures | | (31,162 | ) | | (38,481 | ) | | (46,131 | ) |
| Insurance proceeds - capital related | | — |
| | 1,968 |
| | — |
|
| Investments in unconsolidated affiliates | | (16,000 | ) | | (1,609 | ) | | (3,317 | ) |
| | | | | | | |
| Net cash used in investing activities | | (40,457 | ) | | (187,096 | ) | | (36,280 | ) |
| | | | | | | |
| Financing activities: | | |
| | |
| | |
|
| Dividends paid to stockholders of Mueller Industries, Inc. | | (22,325 | ) | | (22,705 | ) | | (196,944 | ) |
| Dividends paid to noncontrolling interests | | (846 | ) | | (592 | ) | | (2,909 | ) |
| Issuance of long-term debt | | 100,658 |
| | 204,233 |
| | 71,475 |
|
| Repayments of long-term debt | | (206,718 | ) | | (172,002 | ) | | (111,224 | ) |
| Repayment of debt by consolidated joint ventures, net | | (4,305 | ) | | (2,915 | ) | | (3,369 | ) |
| Repurchase of common stock | | (1,763 | ) | | (33,562 | ) | | — |
|
| Payment of contingent consideration | | (3,170 | ) | | — |
| | — |
|
| Net cash used to settle stock-based awards | | (1,225 | ) | | (726 | ) | | (1,595 | ) |
| | | | | | | |
| Net cash used in financing activities | | (139,694 | ) | | (28,269 | ) | | (244,566 | ) |
| | | | | | | |
| Effect of exchange rate changes on cash | | 511 |
| | (1,952 | ) | | 2,945 |
|
| | | | | | | |
| Increase (decrease) in cash, cash equivalents, and restricted cash | | 20,904 |
| | (49,425 | ) | | (233,906 | ) |
| Cash, cash equivalents, and restricted cash at the beginning of the year | | 77,138 |
| | 126,563 |
| | 360,469 |
|
| | | | | | | |
| Cash, cash equivalents, and restricted cash at the end of the year | | $ | 98,042 |
| | $ | 77,138 |
| | $ | 126,563 |
|
See accompanying notes to consolidated financial statements. Refer to Note 12 for discussion of significant noncash financing activities. (1) The Consolidated Statements of Cash Flows for prior periods have been adjusted to reflect the adoption of ASU 2016-18, Statement of Cash Flows (Topic 230): Restricted Cash. The Consolidated Statements of Cash Flows reflect the changes during the periods in the total of cash, cash equivalents, and restricted cash. Therefore, restricted cash activity is included with cash when reconciling the beginning-of-period and end-of-period total amounts shown.
MUELLER INDUSTRIES, INC.
CONSOLIDATED STATEMENTS OF CHANGES IN EQUITY
Years Ended December 31, 2016,28, 2019, December 26, 2015,29, 2018, and December 27, 201430, 2017
|
| | | | | | | | | | | | | | | | | | | | | |
| | | 2019 | | 2018 | | 2017 |
| (In thousands) | | Shares | | Amount | | Shares | | Amount | | Shares | | Amount |
| Common stock: | | | | | | | | | | | | |
| Balance at beginning of year | | 80,183 |
| | $ | 802 |
| | 80,183 |
| | $ | 802 |
| | 80,183 |
| | $ | 802 |
|
| | | | | | | | | | | | | |
| Balance at end of year | | 80,183 |
| | $ | 802 |
| | 80,183 |
| | $ | 802 |
| | 80,183 |
| | $ | 802 |
|
| | | | | | | | | | | | | |
| Additional paid-in capital: | | |
| | |
| | |
| | |
| | |
| | |
|
| Balance at beginning of year | | |
| | $ | 276,849 |
| | |
| | $ | 274,585 |
| | |
| | $ | 273,345 |
|
| Issuance of shares under incentive stock option plans | | |
| | (644 | ) | | |
| | (278 | ) | | |
| | (2,118 | ) |
| Stock-based compensation expense | | |
| | 8,744 |
| | |
| | 8,035 |
| | |
| | 7,450 |
|
| Issuance of restricted stock | | |
| | (6,340 | ) | | |
| | (5,493 | ) | | |
| | (4,092 | ) |
| | | | | | | | | | | | | |
| Balance at end of year | | |
| | $ | 278,609 |
| | |
| | $ | 276,849 |
| | |
| | $ | 274,585 |
|
| | | | | | | | | | | | | |
| Retained earnings: | | |
| | |
| | |
| | |
| | |
| | |
|
| Balance at beginning of year | | |
| | $ | 824,737 |
| | |
| | $ | 743,503 |
| | |
| | $ | 1,141,831 |
|
| Net income attributable to Mueller Industries, Inc. | | |
| | 100,972 |
| | |
| | 104,459 |
| | |
| | 85,598 |
|
| Dividends paid or payable to stockholders of Mueller Industries, Inc. | | |
| | (22,639 | ) | | |
| | (23,009 | ) | | |
| | (483,926 | ) |
| Reclassification of stranded effects of the Act | | | | — |
| | | | (556 | ) | | | | — |
|
| Other adjustments | | | | — |
| | | | 340 |
| | | | — |
|
| | | | | | | | | | | | | |
| Balance at end of year | | |
| | $ | 903,070 |
| | |
| | $ | 824,737 |
| | |
| | $ | 743,503 |
|
| | | | | | | | | | | | | |
| Accumulated other comprehensive loss: | | |
| | |
| | |
| | |
| | |
| | |
|
| Balance at beginning of year | | |
| | $ | (79,792 | ) | | |
| | $ | (51,056 | ) | | |
| | $ | (66,956 | ) |
| Total other comprehensive income (loss) attributable to Mueller Industries, Inc. | | |
| | 11,022 |
| | |
| | (29,292 | ) | | |
| | 15,900 |
|
| Reclassification of stranded effects of the Act | | | | — |
| | | | 556 |
| | | | — |
|
| | | | | | | | | | | | | |
| Balance at end of year | | |
| | $ | (68,770 | ) | | |
| | $ | (79,792 | ) | | |
| | $ | (51,056 | ) |
| | | 2016 | | | 2015 | | | 2014 | |
| (In thousands) | | Shares | | | Amount | | | Shares | | | Amount | | | Shares | | | Amount | |
| Common stock: | | | | | | | | | | | | | | | | | | |
| Balance at beginning of year | | | 80,183 | | | $ | 802 | | | | 80,183 | | | $ | 802 | | | | 80,183 | | | $ | 401 | |
| Issuance of shares under two-for-one stock split | | | — | | | | — | | | | — | | | | — | | | | — | | | | 401 | |
| | | | | | | | | | | | | | | | | | | | | | | | | |
| Balance at end of year | | | 80,183 | | | $ | 802 | | | | 80,183 | | | $ | 802 | | | | 80,183 | | | $ | 802 | |
| | | | | | | | | | | | | | | | | | | | | | | | | |
| Additional paid-in capital: | | | | | | | | | | | | | | | | | | | | | | | | |
| Balance at beginning of year | | | | | | $ | 271,158 | | | | | | | $ | 268,575 | | | | | | | $ | 267,142 | |
| Issuance of shares under incentive stock option plans | | | | | | | (419 | ) | | | | | | | (1,074 | ) | | | | | | | (1,646 | ) |
| Stock-based compensation expense | | | | | | | 6,387 | | | | | | | | 6,244 | | | | | | | | 6,265 | |
| Income tax benefit from exercise of stock options | | | | | | | — | | | | | | | | 972 | | | | | | | | 837 | |
| Issuance of shares under two-for-one stock split | | | | | | | — | | | | | | | | — | | | | | | | | (401 | ) |
| Issuance of restricted stock | | | | | | | (3,781 | ) | | | | | | | (3,559 | ) | | | | | | | (3,622 | ) |
| | | | | | | | | | | | | | | | | | | | | | | | | |
| Balance at end of year | | | | | | $ | 273,345 | | | | | | | $ | 271,158 | | | | | | | $ | 268,575 | |
| | | | | | | | | | | | | | | | | | | | | | | | | |
| Retained earnings: | | | | | | | | | | | | | | | | | | | | | | | | |
| Balance at beginning of year | | | | | | $ | 1,063,543 | | | | | | | $ | 992,798 | | | | | | | $ | 908,274 | |
| Net income attributable to Mueller Industries, Inc. | | | | | | | 99,727 | | | | | | | | 87,864 | | | | | | | | 101,560 | |
| Dividends paid or payable to stockholders of Mueller Industries, Inc. | | | | | | | (21,439 | ) | | | | | | | (17,119 | ) | | | | | | | (17,036 | ) |
| | | | | | | | | | | | | | | | | | | | | | | | | |
| Balance at end of year | | | | | | $ | 1,141,831 | | | | | | | $ | 1,063,543 | | | | | | | $ | 992,798 | |
| | | | | | | | | | | | | | | | | | | | | | | | | |
| Accumulated other comprehensive (loss) income: | | | | | | | | | | | | | | | | | | | | | | | | |
| Balance at beginning of year | | | | | | $ | (54,990 | ) | | | | | | $ | (42,923 | ) | | | | | | $ | (10,819 | ) |
| Total other comprehensive (loss) income attributable to Mueller Industries, Inc. | | | | | | | (11,966 | ) | | | | | | | (12,067 | ) | | | | | | | (32,104 | ) |
| | | | | | | | | | | | | | | | | | | | | | | | | |
| Balance at end of year | | | | | | $ | (66,956 | ) | | | | | | $ | (54,990 | ) | | | | | | $ | (42,923 | ) |
| | | | | | | | | | | | | | | | | | | | | | | | | |
MUELLER INDUSTRIES, INC.
CONSOLIDATED STATEMENTS OF CHANGES IN EQUITY
(continued)
Years Ended December 31, 2016,28, 2019, December 26, 2015,29, 2018, and December 27, 201430, 2017
| | | 2016 | | | 2015 | | | 2014 | |
| (In thousands) | | Shares | | | Amount | | | Shares | | | Amount | | | Shares | | | Amount | |
| Treasury stock: | | | | | | | | | | | | | | | | | | |
| Balance at beginning of year | | | 23,024 | | | $ | (453,228 | ) | | | 23,282 | | | $ | (457,102 | ) | | | 23,578 | | | $ | (461,593 | ) |
| Issuance of shares under incentive stock option plans | | | (178 | ) | | | 3,499 | | | | (149 | ) | | | 2,930 | | | | (208 | ) | | | 4,504 | |
| Repurchase of common stock | | | 133 | | | | (4,389 | ) | | | 84 | | | | (2,840 | ) | | | 107 | | | | (3,832 | ) |
| Issuance of restricted stock | | | (191 | ) | | | 3,780 | | | | (193 | ) | | | 3,784 | | | | (195 | ) | | | 3,819 | |
| | | | | | | | | | | | | | | | | | | | | | | | | |
| Balance at end of year | | | 22,788 | | | $ | (450,338 | ) | | | 23,024 | | | $ | (453,228 | ) | | | 23,282 | | | $ | (457,102 | ) |
| | | | | | | | | | | | | | | | | | | | | | | | | |
| Noncontrolling interests: | | | | | | | | | | | | | | | | | | | | | | | | |
| Balance at beginning of year | | | | | | $ | 32,417 | | | | | | | $ | 33,284 | | | | | | | $ | 32,462 | |
| Purchase of Jungwoo-Mueller | | | | | | | 11,649 | | | | | | | | — | | | | | | | | — | |
| Dividends paid to noncontrolling interests | | | | | | | (3,765 | ) | | | | | | | — | | | | | | | | — | |
| Net income attributable to noncontrolling interests | | | | | | | 27 | | | | | | | | 543 | | | | | | | | 974 | |
| Foreign currency translation | | | | | | | (2,575 | ) | | | | | | | (1,410 | ) | | | | | | | (152 | ) |
| | | | | | | | | | | | | | | | | | | | | | | | | |
| Balance at end of year | | | | | | $ | 37,753 | | | | | | | $ | 32,417 | | | | | | | $ | 33,284 | |
| | | | | | | | | | | | | | | | | | | | | | | | | |
| See accompanying notes to consolidated financial statements. | |
|
| | | | | | | | | | | | | | | | | | | | | |
| | | 2019 | | 2018 | | 2017 |
| (In thousands) | | Shares | | Amount | | Shares | | Amount | | Shares | | Amount |
| Treasury stock: | | | | | | | | | | | | |
| Balance at beginning of year | | 23,480 |
| | $ | (474,240 | ) | | 22,373 |
| | $ | (445,723 | ) | | 22,788 |
| | $ | (450,338 | ) |
| Issuance of shares under incentive stock option plans | | (94 | ) | | 1,908 |
| | (57 | ) | | 1,136 |
| | (395 | ) | | 7,828 |
|
| Repurchase of common stock | | 162 |
| | (4,251 | ) | | 1,437 |
| | (35,146 | ) | | 188 |
| | (7,305 | ) |
| Issuance of restricted stock | | (314 | ) | | 6,340 |
| | (273 | ) | | 5,493 |
| | (208 | ) | | 4,092 |
|
| | | | | | | | | | | | | |
| Balance at end of year | | 23,234 |
| | $ | (470,243 | ) | | 23,480 |
| | $ | (474,240 | ) | | 22,373 |
| | $ | (445,723 | ) |
| | | | | | | | | | | | | |
| Noncontrolling interests: | | |
| | |
| | |
| | |
| | |
| | |
|
| Balance at beginning of year | | |
| | $ | 14,904 |
| | |
| | $ | 13,917 |
| | |
| | $ | 37,753 |
|
| Sale of Mueller-Xingrong | | | | — |
| | | | — |
| | | | (23,712 | ) |
| Dividends paid to noncontrolling interests | | |
| | (846 | ) | | |
| | (592 | ) | | |
| | (2,909 | ) |
| Net income attributable to noncontrolling interests | | |
| | 5,260 |
| | |
| | 2,361 |
| | |
| | 1,413 |
|
| Foreign currency translation | | |
| | (650 | ) | | |
| | (782 | ) | | |
| | 1,372 |
|
| | | | | | | | | | | | | |
| Balance at end of year | | |
| | $ | 18,668 |
| | |
| | $ | 14,904 |
| | |
| | $ | 13,917 |
|
See accompanying notes to consolidated financial statements.
Notes to Consolidated Financial Statements
Note 1 – Summary of Significant Accounting Policies
Nature of Operations
The principal business of Mueller Industries, Inc. is the manufacture and sale of copper tube and fittings; line sets; brass and copper alloy rod, bar, and shapes; aluminum and brass forgings; aluminum impact extrusions; PEX plastic fittingstube and valves;fittings; refrigeration valves and fittings; compressed gas valves; fabricated tubular products; pressure vessels; steel nipples; and steel nipples.insulated flexible duct systems. The Company also resells imported brass and plastic plumbing valves, plastic fittings, malleable iron fittings, faucets, and plumbing specialty products. The Company markets its products to the HVAC, plumbing, refrigeration, hardware, and other industries. Mueller'sMueller’s operations are located throughout the United States and in Canada, Mexico, Great Britain, South Korea, the Middle East, and China.
Fiscal Years
The Company'sCompany’s fiscal year endsconsists of 52 weeks ending on the last Saturday of December, and consisted of 53 weeks in 2016 and 52 weeks in 2015 and 2014.December. These dates were December 31, 2016,28, 2019, December 26, 2015,29, 2018, and December 27, 2014.30, 2017.
Reclassifications
Certain reclassifications have been made to the prior years’ Consolidated Financial Statements to conform to the current year’s presentation.
Basis of Presentation
The Consolidated Financial Statements include the accounts of Mueller Industries, Inc. and its majority-owned subsidiaries. The noncontrolling interests represent separate private ownership interests of 49.5 percent of Jiangsu Mueller-Xingrong Copper Industries Limited (Mueller-Xingrong) and 40 percent of Jungwoo Metal Ind. Co., LTD (Jungwoo-Mueller).
Common Stock Split
On February 21, 2014, and 49.5 percent of Jiangsu Mueller-Xingrong Copper Industries Limited (Mueller-Xingrong), which the Company
announcedsold during 2017. See “Note 2 – Acquisitions and Dispositions” for additional information.
Revenue Recognition
Given the nature of the Company’s business and product offerings, sales transactions with customers are generally comprised of a two-for-one stock splitsingle performance obligation that involves delivery of its common stock effectedthe products identified in the formcontracts with customers. Performance obligations are generally satisfied at the point in time of a stock dividend of one share for each outstanding share. The record date for the stock split was March 14, 2014,shipment and the additional shares were distributed on March 28, 2014. Accordingly, all references to share and per share amounts presented in the Consolidated Financial Statements and this Annual Report on Form 10-K have been adjusted retroactively to reflect the stock split.
Revenue Recognition
Revenuepayment is recognized when title and risk of loss pass to the customer, provided collectiongenerally due within sixty days. Variable consideration is determined to be probable and no significant obligations remain for the Company. Estimatesestimated for future rebates on certain product lines and product returns are recognizedreturns. The Company records variable consideration as an adjustment to the transaction price in the period in whichit is incurred. Since variable consideration is settled within a short period of time, the revenuetime value of money is recorded.not significant. The cost of shipping product to customers is expensed as incurred as a component of cost of goods sold.
The Company’s Domestic Piping Systems Group engages in certain transactions where it acts as an agent. Revenue from these transactions is recorded on a net basis.
Acquisitions
Accounting for acquisitions requires the Company to recognize separately from goodwill the assets acquired and liabilities assumed at their acquisition date fair values. Goodwill is measured as the excess of the purchase price over the net amount allocated to the identifiable assets acquired and liabilities assumed. While management uses its best estimates and assumptions to accurately value assets acquired and liabilities assumed at the acquisition date, the estimates are inherently uncertain and subject to refinement. As a result, during the measurement period, which may be up to one year from the acquisition date, the Company may record adjustments to the assets acquired and liabilities assumed with the corresponding offset to goodwill. The operating results generated by the acquired businesses are included in the Consolidated Statements of Income from their respective dates of acquisition. Acquisition related costs are expensed as incurred. See "Note“Note 2 – Acquisitions and Dispositions"Dispositions” for additional information.
Cash Equivalents and Restricted Cash
Temporary investments with original maturities of three months or less are considered to be cash equivalents. These investments are stated at cost. At December 31, 201628, 2019 and December 26, 2015,29, 2018, temporary investments consisted of money market mutual
funds, commercial paper, bank repurchase agreements, and U.S. and foreign government securities totaling $40.9approximately $0.5 million and $106.4$0.6 million, respectively. Included
Amounts included in other current assets is restricted cash of $9.0 million and $3.7 million at December 31, 2016 and December 26, 2015, respectively. These amounts representrelate to required deposits intoin brokerage accounts that facilitate the Company'sCompany’s hedging activities deposits that secure certain short-term notes issued under Mueller-Xingrong's credit facility, andas well as imprest funds for the year ended December 31, 2016, funds received in conjunction with the New Markets Tax Credit transaction; see "Note 10Company’s self-insured workers’ compensation program. See “Note 4 – New Markets Tax Credit Transaction"Cash, Cash Equivalents, and Restricted Cash” for additional information.
Allowance for Doubtful Accounts
The Company provides an allowance for receivables that may not be fully collected. In circumstances where the Company is aware of a customer'scustomer’s inability to meet their financial obligations (e.g., bankruptcy filings or substantial credit rating downgrades), it records an allowance for doubtful accounts against amounts due to reduce the net recognized receivable to the amount it believes most likely will be collected. For all other customers, the Company recognizes an allowance for doubtful accounts based on its historical collection experience. If circumstances change (e.g., greater than expected defaults or an unexpected material change in a major customer'scustomer’s ability to meet their financial obligations), the Company could change its estimate of the recoverability of amounts due by a material amount.
Inventories
The Company'sCompany’s inventories are valued at the lower-of-cost-or-market. The material component of its U.S. copper tube and copper fittings inventories is valued on a LIFO basis. Other manufactured inventories, includingbasis and the non-material components of U.S. copper tube and copper fittings inventories are valued on a FIFO basis. The material component of its U.K. and Canadian copper tube inventories are valued on a FIFO basis. The material component of its brass rod and forgings inventories are valued on a FIFO basis. Certain inventories purchased for resale are valued on an average cost basis. Elements of cost in finished goods inventory in addition to the cost of material include depreciation, amortization, utilities, maintenance, production wages, and transportation costs.
The market price of copper cathode and scrap is subject to volatility. During periods when open market prices decline below net book value, the Company may need to provide an allowance to reduce the carrying value of its inventory. In addition, certain items in inventory may be considered obsolete and, as such, the Company may establish an allowance to reduce the carrying value of those items to their net realizable value. Changes in these estimates related to the value of inventory, if any, may result in a materially adverse impact on the Company'sCompany’s reported financial position or results of operations. The Company recognizes the impact of any changes in estimates, assumptions, and judgments in income in the period in which it is determined. See "Note 4“Note 5 – Inventories"Inventories” for additional information.
Leases
The Company leases certain manufacturing facilities, distribution centers, office space, and equipment. Leases with an initial term of twelve months or less are not recorded on the balance sheet; expense for these leases is recognized on a straight line-basis over the term of the lease. Most of the Company’s leases include one or more options to renew up to five years and have remaining terms of one to fifteen years. These options are not included in the Company’s valuation of the right-of-use assets as the Company is not reasonably certain to exercise the options.
The Company has certain vehicle leases that are financing; however, these leases are deemed immaterial for disclosure. See “Note 8 – Leases” for additional information.
Property, Plant, and Equipment
Property, plant, and equipment is stated at cost less accumulated depreciation. Expenditures for major additions and improvements are capitalized, while minor replacements, maintenance, and repairs are charged to expense as incurred. Depreciation of buildings, machinery, and equipment is provided on the straight-line method over the estimated useful lives ranging from 20 to 40 years for buildings and five to 20 years for machinery and equipment. Leasehold improvements are amortized over the lesser of their useful life or the remaining lease term.
The Company continually evaluates these assets to determine whether events or changes in circumstances have occurred that may warrant revision of the estimated useful life or whether the remaining balance should be evaluated for possible impairment. See "Note 7“Note 9 – Property, Plant, and Equipment, Net"Net” for additional information.
Goodwill
Goodwillis recognized for the excess of the purchase price over the fair value of tangible and identifiable intangible net assets of businesses acquired. Several factors give rise to goodwill in business acquisitions, such as the expected benefit from synergies of the combination and the existing workforce of the acquired business. Goodwill is evaluated annually for possible impairment as of the first day of the fourth quarter unless circumstances indicate the need to accelerate the timing of the evaluation. In the evaluation of goodwill impairment, management performs a qualitative assessment to determine if it is more likely than not that the fair value of a reporting unit is less than its carrying amount. If the qualitative assessment is not conclusive, management proceeds to a two-step process to test goodwill for impairment, including comparingcompares the fair value of a reporting unit with its carrying amount and will recognize an impairment charge for the amount by which the carrying amount exceeds the reporting unit to its carrying value (including attributable goodwill). If this process indicates that theunit’s fair value, is less thannot to exceed the carrying value, a second step of impairment testing is performed to measure the potentialtotal amount of goodwill impairment loss.allocated to the reporting unit.
Fair value for the Company'sCompany’s reporting units is determined using a combination of the income and market approaches (level 3 within the fair value hierarchy), incorporating market participant considerations and management'smanagement’s assumptions on revenue growth rates, operating margins, discount rates and expected capital expenditures. The market approach measures the fair value of a business through the analysis of publicly traded companies or recent sales of similar businesses. The income approach uses a discounted cash flow model to estimate the fair value of reporting units based on expected cash flows (adjusted for capital investment required to support operations) and a terminal value. This cash flow stream is discounted to its present value to arrive at a fair value for each reporting unit. Future earnings are estimated using the Company'sCompany’s most recent annual projections, applying a growth rate to future periods. Those projections are directly impacted by the condition of the markets in which the Company'sCompany’s businesses participate. The discount rate selected for the reporting units is generally based on rates of return available for comparable companies at the date of valuation. Fair value determinations may include both internal and third-party valuations. See "Note 8“Note 10 – Goodwill and Other Intangible Assets"Assets” for additional information.
InvestmentInvestments in Unconsolidated Affiliates
The Company owns a 50 percent interest in Tecumseh Products Holding LLC (Joint Venture), an unconsolidated affiliate that acquired Tecumseh Products Company (Tecumseh). The Company also owns a 50 percent interest in a second unconsolidated affiliate that providedprovides financing to Tecumseh in conjunction with the acquisition.Tecumseh. These investments are recorded using the equity method of accounting, as the Company can exercise significant influence but does not own a majority equity interest or otherwise control the respective entities. Under the equity method of accounting, these investments are stated at initial cost and are adjusted for subsequent additional investments and the Company'sCompany’s proportionate share of earnings or losses and distributions.
The Company records itsproportionate share of the investee'sinvestees’ net income or loss, net of foreign taxes, one quarter in arrears as income (loss) from unconsolidated affiliates, net of foreign tax, in the Consolidated Statements of Income. The Company'sCompany’s proportionate share of the investees'investees’ other comprehensive income (loss), net of income taxes, is recorded in the Consolidated Statements of Comprehensive Income and Consolidated Statements of Changes in Equity. The U.S. tax effect of the Company’s proportionate share of Tecumseh’s income or loss is recorded in income tax expense in the Consolidated Statements of Income. In general, the equity investment in the unconsolidated affiliates is equal to the current equity investment plus that entity's undistributed earnings.the investees’ net accumulated losses.
The investmentCompany also owns a 40 percent interest in Mueller Middle East BSC.
Self-Insurance Accruals
The Company is primarily self-insured for workers'workers’ compensation claims and benefits paid under certain employee health care programs. Accruals are primarily based on estimated undiscounted cost of claims, which includes incurred but not reported claims, and are classified as accrued wages and other employee costs.
Pension and Other Postretirement Benefit Plans
The Company sponsors several qualified and nonqualified pension and other postretirement benefit plans in the U.S. and certain foreign locations. The Company recognizes the overfunded or underfunded status of the plans as an asset or liability in the Consolidated Balance SheetSheets with changes in the funded status recorded through comprehensive income in the year in which those changes occur. The obligations for these plans are actuarially determined and affected by assumptions, including discount rates,
expected long-term return on plan assets for defined benefit pension plans, and certain employee-related factors, such as retirement age and mortality. The Company evaluates its assumptions periodically and makes adjustments as necessary.
The expected return on plan assets is determined using the market value of plan assets. Differences between assumed and actual returns are amortized to the market value of assets on a straight-line basis over the average remaining service period of the plan participants using the corridor approach. The corridor approach defers all actuarial gains and losses resulting from variances between actual results and actuarial assumptions. These unrecognized gains and losses are amortized when the net gains and losses exceed 10 percent of the greater of the market value of the plan assets or the projected benefit obligation. The amount in excess of the corridor is amortized over the average remaining service period of the plan participants. For 2016,2019, the average remaining service period for the pension plans was nine years. See "Note 12 –Benefit Plans"“Note 13 – Benefit Plans” for additional information.
Environmental Reserves and Environmental Expenses
The Company recognizes an environmental liability when it is probable the liability exists and the amount is reasonably estimable. The Company estimates the duration and extent of its remediation obligations based upon reports of outside consultants;consultants, internal and third party estimates and analyses of cleanup costs and ongoing monitoring costs;costs, communications with regulatory agencies;agencies, and changes in environmental law. If the Company were to determine that its estimates of the duration or extent of its environmental obligations were no longer accurate, it would adjust environmental liabilities accordingly in the period that such determination is made. Estimated future expenditures for environmental remediation are not discounted to their present value. Accrued environmental liabilities are not reduced by potential insurance reimbursements.
Environmental expenses that relate to ongoing operations are included as a component of cost of goods sold. Environmental expenses related to non-operating properties are includedpresented below operating income in other income, net on the Consolidated Statements of Income. See "Note 13“Note 14 – Commitments and Contingencies"Contingencies” for additional information.
Earnings Per Share
Basic earnings per share is computed based on the weighted average number of common shares outstanding. Diluted earnings per share reflects the increase in weighted average common shares outstanding that would result from the assumed exercise of outstanding stock options and vesting of restricted stock awards calculated using the treasury stock method. Approximately 190 thousand and 427 thousand stock-basedThere were 0 awards were excluded from the computation of diluted earnings per share for the yearsyear ended December 31, 201628, 2019, and approximately 54 thousand stock-based awards excluded from the computation of diluted earnings per share for the year ended December 26, 2015, respectively,29, 2018, because they were antidilutive.
Income Taxes
Deferred income tax assets and liabilities are recognized when differences arise between the treatment of certain items for financial statement and tax purposes. Realization of certain components of deferred tax assets is dependent upon the occurrence of future events. The Company records valuation allowances to reduce its deferred tax assets to the amount it believes is more likely than not to be realized. These valuation allowances can be impacted by changes in tax laws, changes to statutory tax rates, and future taxable income levels and are based on the Company'sCompany’s judgment, estimates, and assumptions regarding those future events. In the event the Company was to determine that it would not be able to realize all or a portion of the net deferred tax assets in the future, it would increase the valuation allowance through a charge to income tax expense in the period that such determination is made. Conversely, if it werewas to determine that it would be able to realize its deferred tax assets in the future, in excess of the net carrying amounts, the Company would decrease the recorded valuation allowance through a decrease to income tax expense in the period that such determination is made.
The Company provides for uncertain tax positions and the related interest and penalties, if any, based upon management'smanagement’s assessment of whether a tax benefit is more likely than not to be sustained upon examination by tax authorities. Tax benefits for uncertain tax positions that are recognized in the financial statements are measured as the largest amount of benefit, determined on a cumulative probability basis, that is more likely than not to be realized upon ultimate settlement. To the extent the Company prevails in matters for which a liability for an uncertain tax position is established or is required to pay amounts in excess of the liability, the Company'sCompany’s effective tax rate in a given financial statement period may be affected.
These estimates are highly subjective and could be affected by changes in business conditions and other factors. Changes in any of these factors could have a material impact on future income tax expense. See "Note 14“Note 15 – Income Taxes"Taxes” for additional information.
Taxes Collected from Customers and Remitted to Governmental Authorities
Taxes assessed by a governmental authority that are directly imposed on a revenue producing transaction between the Company and its customers, primarily value added taxes in foreign jurisdictions, are accounted for on a net (excluded from revenues and costs) basis.
Stock-Based Compensation
The Company has in effect stock incentive plans under which stock-based awards have been granted to certain employees and members of its Board of Directors. Stock-based compensation expense is recognized in the Consolidated Statements of Income as a component of selling, general, and administrative expense based on the grant date fair value of the awards. See "Note 16“Note 17 – Stock-Based Compensation"Compensation” for additional information.
Concentrations of Credit and Market Risk
Concentrations of credit risk with respect to accounts receivable are limited due to the large number of customers comprising the Company'sCompany’s customer base, and their dispersion across different geographic areas and different industries, including HVAC, plumbing, refrigeration, hardware, automotive, OEMs, and others.
The Company minimizes its exposure to base metal price fluctuations through various strategies. Generally, it prices an equivalent amount of copper raw material, under flexible pricing arrangements it maintains with its suppliers, at the time it determines the selling price of finished products to its customers.
Derivative Instruments and Hedging Activities
The Company'sCompany’s earnings and cash flows are subject to fluctuations due to changes in commodity prices, foreign currency exchange rates, and interest rates. The Company uses derivative instruments such as commodity futures contracts, foreign currency forward contracts, and interest rate swaps to manage these exposures.
All derivatives are recognized in the Consolidated Balance Sheets at their fair value. On the date the derivative contract is entered into, it is either a) designated as a hedge of (i) a forecasted transaction or the variability of cash flow to be paid (cash flow hedge) or (ii) the fair value of a recognized asset or liability (fair value hedge), or b) not designated in a hedge accounting relationship, even though the derivative contract was executed to mitigate an economic exposure (economic hedge), as the Company does not enter into derivative contracts for trading purposes (economic hedge).purposes. Changes in the fair value of a derivative that is qualified, designated, and highly effective as a cash flow hedge are recorded in stockholders'stockholders’ equity within accumulated other comprehensive income (AOCI), to the extent effective, until they are reclassified to earnings in the same period or periods during which the hedged transaction affects earnings. Changes in the fair value of a derivative that is qualified, designated, and highly effective as a fair value hedge, along with the gain or loss on the hedged recognized asset or liability that is attributable to the hedged risk, are recorded in current earnings. Changes in the fair value of undesignated derivative instruments executed as economic hedges and the ineffective portion of designated derivative instrumentsderivatives are reported in current earnings.
The Company documents all relationships between derivative instruments and hedged items, as well as the risk-management objective and strategy for undertaking various hedge transactions. This process includes linking all derivativesderivative instruments that are designated as fair value hedges to specific assets and liabilities in the Consolidated Balance Sheets and linking cash flow hedges to specific forecasted transactions or variability of cash flow.
The Company also assesses, both at the hedge'shedge’s inception and on an ongoing basis, whether the designated derivative instruments that are used in hedging transactions are highly effective in offsetting changes in cash flow or fair values of hedged items. When a derivative instrument is determined not to be highly effective as a hedge or the underlying hedged transaction is no longer probable of occurring, hedge accounting is discontinued prospectively in accordance with the derecognition criteria for hedge accounting.
The Company primarily executes derivative contracts with major financial institutions. These counterparties expose the Company to credit risk in the event of non-performance. The amount of such exposure is limited to the fair value of the contract plus the unpaid portion of amounts due to the Company pursuant to terms of the derivative instruments, if any. If a downgrade in the credit rating of these counterparties occurs, management believes that this exposure is mitigated by provisions in the derivative arrangements which allow for the legal right of offset of any amounts due to the Company from the counterparties with any amounts payable to the counterparties by the Company. As a result, management considers the risk of loss from counterparty default to be minimal. See "Note 6“Note 7 – Derivative Instruments and Hedging Activities"Activities” for additional information.
Fair Value of Financial Instruments
The carrying amounts for cash and cash equivalents, accounts receivable, and accounts payable approximate fair value due to the short-term maturity of these instruments.
The fair value of long-term debt at December 31, 201628, 2019 approximates the carrying value on that date. The estimated fair values were determined based on quoted market prices and the current rates offered for debt with similar terms and maturities. The fair value of long-term debt is classified as level 2 within the fair value hierarchy. This classification is defined as a fair value determined using market-based inputs other than quoted prices that are observable for the liability, either directly or indirectly. Outstanding borrowings have variable interest rates that re-price frequently at current market rates.
Foreign Currency Translation
For foreign subsidiaries infor which the functional currency is not the U.S. dollar, balance sheet accounts are translated at exchange rates in effect at the end of the year and income statement accounts are translated at average exchange rates for the year. Translation gains and losses are included in equity as a component of AOCI. Transaction gains and losses that arise from exchange rate fluctuations on transactions denominated in a currency other than the functional currency are recognized in selling, general, and administrative expense in the Consolidated Statements of Income. Included in the Consolidated Statements of Income were net transaction gains of $0.2 million in 2019, losses of $1.0 million in 2018, and losses of $0.4 million in 2016, losses of $1.7 million in 2015, and gains of $0.1 million in 2014.2017.
Use of and Changes in Estimates
The preparation of financial statements in conformity with generally accepted accounting principles in the United States (U.S. GAAP) requires management to make estimates, assumptions, and judgments that affect the amounts reported in the financial statements and accompanying notes. Management makes its best estimate of the ultimate outcome for these items based on historical trends and other information available when the financial statements are prepared. Changes in estimates are recognized in accordance with the accounting rules for the estimate, which is typically in the period when new information becomes available to management. Areas where the nature of the estimate makes it reasonably possible that actual results could materially differ from amounts estimated include but are not limited to: pension and other postretirement benefit plan obligations, tax liabilities, loss contingencies, litigation claims, environmental reserves, and impairment assessments onof long-lived assets (including goodwill).
Change in Segment Reporting
At the beginning of fiscal year 2016, the Company made changes to its management reporting structure as a result of a change in the way the Chief Executive Officer, who serves as the Chief Operating Decision Maker, manages and evaluates the business, makes key operating decisions, and allocates resources. Previously, the Company had two reportable segments: Plumbing & Refrigeration and OEM. During 2016, the Company realigned its operating segments into three reportable segments: Piping Systems, Industrial Metals, and Climate. Management has recast certain prior year amounts to conform to the current year presentation. See "Note 3 - Segment Information" for additional information.
Recently Adopted Accounting StandardsStandard
In March 2016,July 2018, the Financial Accounting Standards Board (FASB) issued Accounting Standards Update (ASU) No. 2016-09, Compensation – Stock Compensation (Topic 718): Improvement to Employee Share-Based Payment Accounting. The ASU requires all income tax effects of awards to be recognized in the income statement when the awards vest or are settled. It also allows a company to make a policy election to account for forfeitures as they occur. The guidance is effective for public business entities in interim and fiscal periods beginning after December 15, 2016. Early adoption is permitted, but all of the guidance must be adopted in the same period.
The Company elected to adopt this standard effective December 27, 2015 on a prospective basis. The impact of the adoption of this standard was as follows:
· | Approximately $0.9 million of excess tax benefits were recorded through income tax expense as a discrete item for the year ended December 31, 2016. |
· | Excess tax benefits were combined with other income tax cash flows within operating cash flows rather than as a financing activity. |
· | The Company has elected to change its current policy of estimating forfeitures to a policy of recognizing forfeitures as they occur. |
In August 2014, the FASB issued ASU No. 2014-15, Presentation of Financial Statements – Going Concern (Topic 205-40): Disclosure of Uncertainties about an Entity's Ability to Continue as a Going Concern (ASU 2014-15). The ASU requires management to evaluate relevant conditions, events, and certain management plans that are known or reasonable knowable as of the evaluation date when determining whether substantial doubt about an entity's ability to continue as a going concern exists. If conditions or events raise substantial doubt about an entity's ability to continue as a going concern, the entity is required to make certain disclosures. The guidance is effective for annual periods ending after December 15, 2016. The Company adopted ASU 2014-15 effective December 31, 2016 and the adoption had no impact on the Consolidated Financial Statements and related disclosures.
Recently Issued Accounting Standards
In November 2016, the FASB issued ASU No. 2016-18, Statement of Cash Flows (Topic 230): Restricted Cash. The ASU requires entities to show the changes in the total of cash, cash equivalents, restricted cash, and restricted cash equivalents in the statement of cash flows. As a result, entities will no longer present transfers between cash and cash equivalents and restricted cash and restricted cash equivalents in the statement of cash flows. The guidance will be applied retrospectively and is effective for public business entities in interim and fiscal periods beginning after December 15, 2017. Early adoption is permitted. The Company does not expect the adoption of the standard to have a material impact on its Consolidated Financial Statements.
In October 2016, the FASB issued ASU No. 2016-16, Income Taxes (Topic 740): Intra-Entity Transfers of Assets Other Than Inventory (ASU 2016-16). The ASU requires companies to account for the income tax effects of intercompany transfers of assets other than inventory when the transfer occurs. Companies will still be required to defer the income tax effects of intercompany inventory transactions in an exception to the income tax accounting guidance. The guidance is effective for public business entities in annual periods beginning after December 15, 2017. Early adoption is permitted as of the beginning of an annual period. The Company is still evaluating the effects that the provisions of ASU 2016-16 will have on its Consolidated Financial Statements.
In February 2016, the FASB issued ASU No. 2016-02,2018-11, Leases (Topic 842)(: Targeted Improvements and ASU 2016-02)No. 2018-10, Codification Improvements to Topic 842, Leases. The ASUASUs clarify how to apply certain aspects of the new leasing standard, ASC 842. ASC 842 requires an entity to recognize a right-of-use asset and lease liability for all leaseseach lease with termsa term of more than 12 months. Recognition, measurement and presentation of expenses will depend on classification as a financing or operating lease. The amendmentsguidance also requirerequires certain quantitative and qualitative disclosures about leasing arrangements. The Company adopted the ASU during the first quarter of 2019 using a modified retrospective approach and applied the transition provisions at the beginning of the fiscal year. Financial results reported in periods prior to 2018 are unchanged. The Company elected a package of practical expedients, which, among other things, does not require the reassessment of lease classification. The Company does not separate lease and non-lease components of contracts. The Company implemented a system to identify its entire population of leases and tested the population for completeness. As of the effective date, the Company recognized noncurrent right-of-use assets of $29.5 million and corresponding current and noncurrent lease liabilities of $4.8 million and $25.4 million, respectively. As of the adoption date of ASC 842, discount rates for existing leases were based on an estimate of the Company’s incremental borrowing rate, adjusted for the term of the lease.
Recently Issued Accounting Standards
In June 2016, the FASB issued ASU No. 2016-13, Financial Instruments - Credit Losses (Topic 326): Disclosure Framework - Measurement of Credit Losses on Financial Instruments. The ASU significantly changes the current incurred credit loss model under U.S. GAAP, which delays recognizing credit losses until it is probable a loss has been incurred to a current expected credit losses model which requires immediate recognition of management estimates of credit losses. The ASU will be effective for the annual period beginning in 2020. The updated guidance requires retrospective adoption, and early adoption is permitted. The Company does not expect the adoption of the ASU to have a material impact on its Consolidated Financial Statements.
In August 2018, the FASB issued ASU No. 2018-14, Compensation - Retirement Benefits - Defined Benefit Plans - General (Subtopic 715-20): Disclosure Framework - Changes to the Disclosure Requirements for Defined Benefit Plans. For employers that sponsor defined benefit pension and/or other postretirement benefit plans, the ASU eliminates requirements for certain
disclosures that are no longer considered cost beneficial, requires new disclosures related to the weighted-average interest crediting rate for cash balance plans and explanations for significant gains and losses related to changes in benefit obligations, and clarifies the requirements for entities that provide aggregate disclosures for two or more plans. The ASU will be effective for the annual period beginning in 2020. The updated guidance requires retrospective adoption, and early adoption is permitted. The Company does not expect the adoption of the ASU to have a material impact on its Consolidated Financial Statements.
In August 2018, the FASB issued ASU No. 2018-13, Fair Value Measurement (Topic 820): Disclosure Framework - Changes to the Disclosure Requirements for Fair Value Measurement. The ASU eliminates requirements to disclose the amount and reasons for transfers between level 1 and level 2 of the fair value hierarchy, but requires public companies to disclose changes in unrealized gains and losses for the period included in other comprehensive income (OCI) for recurring level 3 fair value measurements or instruments held at the end of the reporting period and the range and weighted average used to develop significant unobservable inputs for level 3 fair value measurements. The ASU will be effective for interim and fiscalannual periods beginning after December 15, 2018. Early adoptionin 2020. An entity is permitted.permitted to early adopt either the entire standard or only the provisions that eliminate or modify requirements, and can elect to early adopt in interim periods. The updated guidance requires a modified retrospective adoption.on changes in unrealized gains and losses for the period included in OCI for recurring level 3 measurements, the range and weighted average of significant unobservable inputs used to develop level 3 fair value measurements, and the narrative description of measurement uncertainty is applied prospectively. All other amendments should be applied retrospectively. The Company is still evaluatingdoes not expect the effects thatadoption of the provision of ASU 2016-02 willto have a material impact on its Consolidated Financial Statements.
In May 2014, the FASB issued ASU No. 2014-09, Revenue from Contracts with Customers (Topic 606) (ASU 2014-09). The ASU will supersede virtually all existing revenue recognition guidance under U.S. GAAP and will be effective for annual reporting periods beginning after December 15, 2017. The fundamental principles of the new guidance are that companies should recognize revenue in a manner that reflects the timing of the transfer of services to customers and the amount of revenue recognized reflects the consideration that a company expects to receive for the goods and services provided. The new guidance establishes a five-step approach for the recognition of revenue. The Company is in the process of evaluating the impact of ASU 2014-09 on its Consolidated Financial Statements.
Note 2 – Acquisitions and Dispositions
2016 Acquisition
On April 26, 2016, the Company entered into an agreement providing for the purchase of a 60 percent equity interest in Jungwoo-Mueller for approximately $20.5 million in cash. Jungwoo-Mueller, which manufactures copper-based pipe joining products, is headquartered in Seoul, South Korea and serves markets worldwide. This business complements the Company's existing copper fittings businesses in the Piping Systems segment and is reported in the Company's Consolidated Financial Statements one month in arrears.
20152018 Acquisitions
Great Lakes CopperATCO
On July 31, 2015,2, 2018, the Company entered into a Share Purchase Agreement with Great Lakes Copper, Inc. providing for thestock purchase of all of the outstanding shares of Great Lakes Copper Ltd. (Great Lakes) for $70.0 million in cash, including a $1.5 million post-closing working capital adjustment. Great Lakes manufactures copper tube products in Canada. This acquisition complements the Company's existing copper tube businesses in the Piping Systems segment.
Sherwood Valve Products
On June 18, 2015,agreement pursuant to which the Company entered into a Membership Interest Purchase Agreement with Sherwood Valve Products, LLC (Sherwood) providing for the purchase of all of the outstanding equity interests of Sherwood for $21.8 million in cash, net of a post-closing working capital adjustment. Sherwood manufactures valves and fluid control solutions for the HVAC, refrigeration, and compressed gas markets. The acquisition of Sherwood complements our existing compressed gas business in the Industrial Metals segment.
Turbotec Products, Inc.
On March 30, 2015, the Company entered into a Stock Purchase Agreement with Turbotec Products, Inc. (Turbotec) providing for the purchase ofacquired all of the outstanding capital stock of TurbotecATCO Rubber Products, Inc. (ATCO) for approximately $14.1$158.1 million, net of the working capital adjustments. The total purchase price consisted of $151.8 million in cash net ofat closing and a post-closing working capital adjustment. Turbotec manufactures coaxial heat exchangers and twisted tubes forcontingent consideration arrangement which requires the heating, ventilation, and air-conditioning (HVAC), geothermal, refrigeration, swimming pool heat pump, marine, ice machine, commercial boiler, and heat reclamation markets. The acquisition of Turbotec complementsCompany to pay the Company's existing refrigeration business, a componentformer owner up to $12.0 million based on EBITDA growth of the acquired business. ATCO is an industry leader in the manufacturing and distribution of insulated HVAC flexible duct systems and will support the Company’s strategy to grow its Climate Products businesses to become a more valuable resource to its HVAC customers. The acquired business is reported in the Company’s Climate segment.
2014 AcquisitionFor the year ended December 28, 2019, ATCO had net sales of approximately $190.1 million. For the year ended December 29, 2018, the Company’s total net sales included $90.0 million of revenue recognized by ATCO from the date of acquisition. ATCO had revenues of approximately $166.0 million in its fiscal year ending December 31, 2017 (unaudited).
The following table presents condensed pro forma consolidated results of operations as if the ATCO acquisition has occurred at the beginning of 2017. The pro forma information does not purport to be indicative of the results that would have been obtained if the operations had actually been combined during the periods presented and is not necessarily indicative of operating results to be expected in future periods. The most significant pro forma adjustments to the historical results of operations relate to the application of purchase accounting and the financing structure.
|
| | | | | | | | |
| | | For the Year Ended |
| (In thousands, except per share data) | | 2018 | | 2017 |
| | | | | |
| Net sales | | $ | 2,595,454 |
| | $ | 2,431,972 |
|
| Net income | | 111,482 |
| | 90,270 |
|
| | | | | |
| Basic earnings per share | | $ | 1.96 |
| | $ | 1.59 |
|
| Diluted earnings per share | | 1.95 |
| | 1.57 |
|
Yorkshire Copper Tube
Die-Mold
On February 28, 2014,March 31, 2018, the Company entered into a definitiveshare purchase agreement with KME Yorkshirepursuant to which the Company acquired all of the outstanding shares of Die-Mold Tool Limited to acquire certain assets and assume certain liabilities(Die-Mold) for approximately $13.6 million, net of its copper tube business. Yorkshire Copper Tube (Yorkshire) produces European standard copper distribution tubes.working capital adjustments. The total purchase price was approximately $30.1consisted of $12.4 million paid in cash.cash at closing and a contingent consideration arrangement which requires the Company to pay the former owner up to $2.3 million based on EBITDA growth of the acquired business. Die-Mold, based out of Ontario, Canada, is a manufacturer of plastic PEX and other plumbing-related fittings and an integrated designer and manufacturer of plastic injection tooling. The acquisition of Yorkshirebusiness complements the Company'sCompany’s existing copper tube businesses inwithin the Piping Systems segment.
2017 Acquisition
Heatlink Group
On May 31, 2017, the Company entered into a share purchase agreement pursuant to which the Company acquired all of the outstanding shares of Pexcor Manufacturing Company Inc. and Heatlink Group Inc. (collectively, Heatlink Group) for approximately $17.2 million, net of working capital adjustments. The total purchase price consisted of $16.3 million in cash at closing and a contingent consideration arrangement which requires the Company to pay the former owners up to $2.2 million based on EBITDA growth of the acquired business. Heatlink Group, based out of Calgary, Alberta, Canada, produces and sells a complete line of products for PEX plumbing and radiant systems. The business complements the Company’s existing businesses within the Piping Systems segment.
Purchase Price Allocations
These acquisitions were accounted for using the acquisition method of accounting whereby the total purchase price was allocated to tangible and intangible assets acquired and liabilities assumed based on respective fair values.
The following table summarizes the allocation of the purchase price to acquire these businesses, which waswere financed by available cash balances, as well as the assets acquired and liabilities assumed at the respective acquisition dates. The purchase price allocation for Jungwoo-Mueller is provisional as of December 31, 2016 and subject to change upon completion of the final valuation of the long-lived assets during the measurement period. During 2016,2019, the valuation of the Great LakesATCO acquisition was finalizedfinalized. Changes to the purchase price allocation from the amounts presented in the Company’s 2018 Annual Report on Form 10-K included the valuation of the contingent consideration, intangible assets, and working capital. These changes resulted in a decrease to goodwill of $0.5 million. During 2019, the valuation of the Die-Mold acquisition was finalized. Changes to the purchase price allocation from the amounts presented in the Company’s 2018 Annual Report on Form 10-K included the recognition of a deferred tax liability of $4.1$2.0 million was recorded that resulted from a basis difference in the long-lived assets acquired. This change resulted in an increase into goodwill.
| (in thousands) | | Jungwoo-Mueller | | | Great Lakes | | | Sherwood | | | Turbotec | | | Yorkshire | |
| | | | | | | | | | | | | | | | |
| Total consideration | | $ | 20,533 | | | $ | 70,011 | | | $ | 21,795 | | | $ | 14,138 | | | $ | 30,137 | |
| | | | | | | | | | | | | | | | | | | | | |
| Allocated to: | | | | | | | | | | | | | | | | | | | | |
| Accounts receivable | | | 5,551 | | | | 26,079 | | | | 6,490 | | | | 1,936 | | | | — | |
| Inventories | | | 17,616 | | | | 15,233 | | | | 11,892 | | | | 3,247 | | | | 17,579 | |
| Other current assets | | | 1,437 | | | | 22 | | | | 260 | | | | 72 | | | | 1,034 | |
| Property, plant, and equipment | | | 24,191 | | | | 22,771 | | | | 10,327 | | | | 9,080 | | | | 2,103 | |
| Goodwill | | | 442 | | | | 23,208 | (1) | | | — | | | | 2,088 | | | | 8,075 | (1) |
| Intangible assets | | | 756 | | | | 27,468 | | | | (38 | ) | | | 880 | | | | 16,937 | |
| Other assets | | | 58 | | | | 1,413 | | | | — | | | | 59 | | | | — | |
| Total assets acquired | | | 50,051 | | | | 116,194 | | | | 28,931 | | | | 17,362 | | | | 45,728 | |
| | | | | | | | | | | | | | | | | | | | | |
| Accounts payable | | | 7,252 | | | | 36,026 | | | | 6,022 | | | | 1,603 | | | | 10,188 | |
| Accrued wages & other employee costs | | | — | | | | — | | | | 471 | | | | 356 | | | | 1,167 | |
| Other current liabilities | | | 577 | | | | 381 | | | | 487 | | | | 51 | | | | 4,236 | |
| Long-term debt | | | 8,659 | | | | — | | | | — | | | | — | | | | — | |
| Pension and other postretirement liabilities | | | 799 | | | | 5,655 | | | | — | | | | — | | | | — | |
| Other noncurrent liabilities | | | 582 | | | | 4,121 | | | | 156 | | | | 1,214 | | | | — | |
| Total liabilities assumed | | | 17,869 | | | | 46,183 | | | | 7,136 | | | | 3,224 | | | | 15,591 | |
| | | | | | | | | | | | | | | | | | | | | |
| Noncontrolling interest | | | 11,649 | | | | — | | | | — | | | | — | | | | — | |
| | | | | | | | | | | | | | | | | | | | | |
| Net assets acquired | | $ | 20,533 | | | $ | 70,011 | | | $ | 21,795 | | | $ | 14,138 | | | $ | 30,137 | |
| | | | | | | | | | | | | | | | | | | | | |
(1) Tax-deductible goodwill | | | | | | | | | | | | | | | | | |
The fair value of the noncontrolling interest at Jungwoo-Mueller was determined based on the proportionate share of consideration transferred and adjusted for lack of control and marketability based on the average of the classic put option model and the Finnerty Formula.
|
| | | | | | | | | | | | |
| (in thousands) | | ATCO | | Die-Mold | | Heatlink Group |
| | | | | | | |
| Total consideration | | $ | 158,100 |
| | $ | 13,629 |
| | $ | 17,164 |
|
| | | | | | | |
| Allocated to: | | | | |
| | |
|
| Accounts receivable | | 21,829 |
| | 1,684 |
| | 2,809 |
|
| Inventories | | 31,666 |
| | 1,833 |
| | 4,648 |
|
| Other current assets | | 1,051 |
| | 267 |
| | 508 |
|
| Property, plant, and equipment | | 83,080 |
| | 3,278 |
| | 2,024 |
|
| Goodwill | | 17,236 |
| (1) | 4,239 |
| | 6,879 |
|
| Intangible assets | | 23,360 |
| | 5,209 |
| | 6,413 |
|
| Other assets | | 224 |
| | — |
| | — |
|
| Total assets acquired | | 178,446 |
| | 16,510 |
| | 23,281 |
|
| | | | | | | |
| Accounts payable | | 8,093 |
| | 710 |
| | 3,633 |
|
| Other current liabilities | | 10,187 |
| | 173 |
| | 593 |
|
| Long-term debt | | 2,066 |
| | — |
| | — |
|
| Other noncurrent liabilities | | — |
| | 1,998 |
| | 1,891 |
|
| Total liabilities assumed | | 20,346 |
| | 2,881 |
| | 6,117 |
|
| | | | | | | |
| Net assets acquired | | $ | 158,100 |
| | $ | 13,629 |
| | $ | 17,164 |
|
(1) Tax-deductible goodwill
The following details the total intangible assets identified in the allocation of the purchase price at the respective acquisition dates:
| (in thousands) | Estimated Useful Life | | Jungwoo-Mueller | | | Great Lakes | | | Turbotec | | | Yorkshire | |
| | | | | | | | | | | | | | |
| Intangible asset type: | | | | | | | | | | | | | |
| Customer relationships | 20 years | | $ | — | | | $ | 20,273 | | | $ | 350 | | | $ | 10,699 | |
| Non-compete agreements | 3-5 years | | | — | | | | 2,269 | | | | 90 | | | | 4,504 | |
| Patents and technology | 10-15 years | | | 756 | | | | 3,104 | | | | 220 | | | | — | |
| Trade names and licenses | 5-10 years | | | — | | | | 2,453 | | | | 220 | | | | 1,055 | |
| Other | 2-5 years | | | — | | | | (631 | ) | | | — | | | | 679 | |
| | | | | | | | | | | | | | | | | | |
| Total intangible assets | | | $ | 756 | | | $ | 27,468 | | | $ | 880 | | | $ | 16,937 | |
| | | | | | | | | | | | | | | | | | |
F-32 |
| | | | | | | | | | | | | | |
| (in thousands) | | Estimated Useful Life | | ATCO | | Die-Mold | | Heatlink Group |
| | | | | | | | | |
| Intangible asset type: | | | | | | | | |
| Customer relationships | | 20 years | | $ | 6,550 |
| | $ | 3,077 |
| | $ | 4,265 |
|
| Non-compete agreements | | 3-5 years | | — |
| | 70 |
| | 74 |
|
| Patents and technology | | 10-15 years | | 10,570 |
| | 1,512 |
| | 1,466 |
|
| Trade names, licenses, and other | | 5-10 years | | 4,770 |
| | 550 |
| | 608 |
|
| Supply contracts | | 5 years | | 1,470 |
| | — |
| | — |
|
| | | | | | | | | |
| Total intangible assets | | | | $ | 23,360 |
| | $ | 5,209 |
| | $ | 6,413 |
|
20152017 Disposition
Mueller-Xingrong
On June 1, 2015, the Company sold certain assets. Simultaneously,21, 2017, the Company entered into a leasedefinitive equity transfer agreement with Jiangsu Xingrong Hi-Tech Co. Ltd. and Jiangsu Baiyang Industries Co. Ltd. (Baiyang), together, the purchaser of the assets for their continued use for a period of approximately 22 months (Lease Period).
The total sales price was $20.2 million, ofminority partners in Mueller-Xingrong (the Company’s Chinese joint venture), pursuant to which $5.0 million was received on June 1, 2015 and $5.0 million was received on December 30, 2016; the remaining $10.2 million will be received at the end of the Lease Period. This transaction resulted in a pre-tax gain of $15.4 million in the second quarter of 2015, or 17 cents per diluted share after tax. This gain was recognized in the Piping Systems segment.
The net book value of the assets disposed was $2.3 million. For goodwill testing purposes, these assets were part of the Domestic Piping Systems (DPS) reporting unit, which is a component of the Company's Piping Systems segment. Because these assets met the definition of a business, $2.4 million of the DPS reporting unit's goodwill balance was allocated to the disposal group based on the relative fair values of the asset group that was disposed and the portion of the DPS reporting unit that was retained.
2014 Dispositions
On November 21, 2014, the Company entered into a Share Purchase Agreement with Travis Perkins PLCsold its 50.5 percent equity interest in Mueller-Xingrong to sell all of the outstanding capital stock of Mueller Primaflow Limited (Primaflow), the Company's United Kingdom based plumbing and heating systems import distribution business,Baiyang for approximately $24.9$18.3 million. Primaflow, which serves marketsMueller-Xingrong manufactured engineered copper tube primarily for air-conditioning applications in the United KingdomChina and Ireland, was included in the Piping Systems segment andsegment. Mueller-Xingrong reported net sales of $57.5$67.3 million and after-taxnet losses of $9 thousand in 2017, compared to net sales of $121.5 million and net income of $4.4 million for the 2014 fiscal year. $62 thousand in 2016. The carrying value of the assets disposed totaled $25.3$56.8 million, consisting primarily of accounts receivable, inventories, and inventories.long-lived assets. The carrying value of the liabilities disposed totaled $7.1 million, consisting(consisting primarily of current debt and accounts payablepayable), noncontrolling interest, and other current liabilities. In addition,amounts recognized in AOCI totaled $36.2 million. Since the disposal constituted a complete liquidation of the Company’s investment in a foreign entity, the Company removed from AOCI and recognized a cumulative translation gain of $3.8 million. As a result of the disposal, the Company recognized a cumulative translation loss of $6.0 million. The net gain on the sale of this business was immaterial toof $1.5 million in the Consolidated Financial Statements.
During November 2014, the Company sold its ABS plastic pipe manufacturing assets. These assets had a carrying value of approximately $1.9 million and were part of the DPS reporting unit, which is a component of the Piping Systems segment. The sales price was $6.0 million, which resulted in a pre-tax gain of $4.1 million.
Note 3 –Segment Information
The Company'sCompany’s reportable segments are Piping Systems, Industrial Metals, and Climate. Each of the reportable segments is composed of certain operating segments that are aggregated primarily by the nature of products offered as follows:
Piping Systems
Piping Systems is composed of the following operating segments: DPS, Canadian Operations,Domestic Piping Systems Group, Great Lakes Copper, Heatlink Group, Die-Mold, European Operations, Trading Group, Mueller-Xingrong (the Company's Chinese joint venture), and Jungwoo-Mueller (the Company'sCompany’s South Korean joint venture). DPSThe Domestic Piping Systems Group manufactures copper tube, and fittings, plastic fittings, and line sets. These products are manufactured in the U.S., sold in the U.S., and exported to markets worldwide. Outside the U.S., the Canadian Operations manufactureGreat Lakes Copper manufactures copper tube and line sets in Canada and sellsells the products primarily in the U.S. and Canada. Heatlink Group produces a complete line of products for PEX plumbing and radiant systems in Canada and sells these products in Canada and the U.S. Die-Mold manufactures PEX and other plumbing-related fittings and plastic injection tooling in Canada and sells these products in Canada and the U.S. European Operations manufacture copper tube in the U.K. which is sold primarily in Europe. The Trading Group manufactures pipe nipples and imports and resells brass and plastic plumbing valves, malleable iron fittings, faucets, and plumbing specialty products in the U.S. and Mexico. Mueller-Xingrong manufactures engineered copper tube primarily for air-conditioning applications in China. Jungwoo-Mueller manufactures copper-based joining products that are sold worldwide. The Piping Systems segment'ssegment’s products are sold primarily to plumbing, refrigeration, and air-conditioning wholesalers, hardware wholesalers and co-ops, building product retailers, and air-conditioning original equipment manufacturers (OEMs).OEMs.
During 2016,2019, the segment recognized a gain of $1.2 million on the sale of real property.
During 2018, the segment recognized a gain of $1.4 million on the sale of real property and a gain of $0.7 million on the sale of manufacturing equipment.
During 2017, the segment recognized a gain of $1.5 million on the sale of the Company’s interest in Mueller-Xingrong and impairment charges of $6.1$1.5 million on fixed assets used for product development.certain copper fittings manufacturing equipment.
The segment recognized approximately $3.4 million of severance costs related to the reorganization of Yorkshire during 2015, compared to $7.3 million in 2014. The Company does not expect to incur further severance costs for the rationalization of the business.
Industrial Metals
Industrial Metals is composed of the following operating segments: Brass Rod & Copper Bar Products, Impacts & Micro Gauge, and Brass Value-Added Products. These businesses manufacture brass rod, impact extrusions, and forgings, as well as a wide variety of end products including plumbing brass, automotive components, valves, fittings, and gas assemblies. These products are manufactured in the U.S. and sold primarily to OEMs in the U.S., many of which are in the industrial, transportation, construction, heating, ventilation, and air-conditioning, plumbing, refrigeration, and refrigerationenergy markets.
During 2016,2019, the segment recognized impairment chargesa loss of $0.7$0.3 million on fixed assetsthe sale of real property and an insurance recovery gain of $0.5 million related to the rationalizationlosses incurred due to the 2017 fire at the brass rod mill in Port Huron, Michigan.
During 2018, the segment recognized a gain of Sherwood.$1.3 million on the sale of real property and an insurance recovery gain of $3.7 million related to the losses incurred due to the 2017 fire at the brass rod mill in Port Huron, Michigan.
Climate
Climate is composed of the following operating segments: Refrigeration Products, Fabricated Tube Products, Westermeyer, Turbotec, ATCO, and Turbotec.Linesets, Inc. These domestic businesses manufacture and fabricate valves, assemblies, high pressure components, and coaxial heat exchangers, insulated HVAC flexible duct systems, and line sets primarily for the heating, ventilation, air-conditioning, and refrigeration markets in the U.S.
Performance of segments is generally evaluated by their operating income. Summarized product line, geographic, and segment information is shown in the following tables. Geographic sales data indicates the location from which products are shipped. Unallocated expenses include general corporate expenses, plus certain charges or credits not included in segment activity.
During 2016, 2015,2019, 2018, and 2014,2017, no single customer exceeded 10 percent of worldwide sales.
Net Sales by Major Product Line:
| (In thousands) | | 2016 | | | 2015 | | | 2014 | |
| | | | | | | | | | |
| Tube and fittings | | $ | 1,072,242 | | | $ | 1,053,761 | | | $ | 1,143,164 | |
| Brass rod and forgings | | | 371,237 | | | | 436,456 | | | | 556,985 | |
| OEM components, tube & assemblies | | | 327,327 | | | | 342,651 | | | | 345,991 | |
| Valves and plumbing specialties | | | 209,217 | | | | 198,012 | | | | 262,504 | |
| Other | | | 75,599 | | | | 69,122 | | | | 55,583 | |
| | | | | | | | | | | | | |
| | | $ | 2,055,622 | | | $ | 2,100,002 | | | $ | 2,364,227 | |
| | | | | | | | | | | | | |
Geographic Information:The following tables represent a disaggregation of revenue from contracts with customers, along with the reportable segment for each category:
|
| | | | | | | | | | | | | | | | |
| | | For the Year Ended December 28, 2019 |
| (In thousands) | | Piping Systems | | Industrial Metals | | Climate | | Total |
| | | | | | | | | |
| Tube and fittings | | $ | 1,271,558 |
| | $ | — |
| | $ | — |
| | $ | 1,271,558 |
|
| Brass rod and forgings | | — |
| | 425,573 |
| | — |
| | 425,573 |
|
| OEM components, tube & assemblies | | 29,103 |
| | 48,104 |
| | 133,651 |
| | 210,858 |
|
| Valves and plumbing specialties | | 241,795 |
| | — |
| | — |
| | 241,795 |
|
| Other | | — |
| | 80,695 |
| | 222,565 |
| | 303,260 |
|
| | | | | | | | | |
| | | $ | 1,542,456 |
| | $ | 554,372 |
| | $ | 356,216 |
| | $ | 2,453,044 |
|
| | | | | | | | | |
| Intersegment sales | | | | | | | | (22,428 | ) |
| | | | | | | | | |
| Net sales | | | | | | | | $ | 2,430,616 |
|
|
| | | | | | | | | | | | | | | | |
| | | For the Year Ended December 29, 2018 |
| (In thousands) | | Piping Systems | | Industrial Metals | | Climate | | Total |
| | | | | | | | | |
| Tube and fittings | | $ | 1,352,875 |
| | $ | — |
| | $ | — |
| | $ | 1,352,875 |
|
| Brass rod and forgings | | — |
| | 501,472 |
| | — |
| | 501,472 |
|
| OEM components, tube & assemblies | | 29,578 |
| | 53,581 |
| | 139,113 |
| | 222,272 |
|
| Valves and plumbing specialties | | 263,180 |
| | — |
| | — |
| | 263,180 |
|
| Other | | — |
| | 96,008 |
| | 89,956 |
| | 185,964 |
|
| | | | | | | | | |
| | | $ | 1,645,633 |
| | $ | 651,061 |
| | $ | 229,069 |
| | $ | 2,525,763 |
|
| | | | | | | | | |
| Intersegment sales | | | | | | | | (17,885 | ) |
| | | | | | | | | |
| Net sales | | | | | | | | $ | 2,507,878 |
|
| (In thousands) | | 2016 | | | 2015 | | | 2014 | |
| | | | | | | | | | |
| Net sales: | | | | | | | | | |
| United States | | $ | 1,400,893 | | | $ | 1,519,456 | | | $ | 1,752,548 | |
| United Kingdom | | | 197,039 | | | | 240,823 | | | | 326,832 | |
| Canada | | | 237,162 | | | | 97,967 | | | | 9,807 | |
| Asia | | | 149,875 | | | | 162,664 | | | | 194,495 | |
| Mexico | | | 70,653 | | | | 79,092 | | | | 80,545 | |
| | | | | | | | | | | | | |
| | | $ | 2,055,622 | | | $ | 2,100,002 | | | $ | 2,364,227 | |
| | | | | | | | | | | | | |
Geographic informationDisaggregation of revenue from contracts with customers (continued):
|
| | | | | | | | | | | | | | | | |
| | | For the Year Ended December 30, 2017 |
| (In thousands) | | Piping Systems | | Industrial Metals | | Climate | | Total |
| | | | | | | | | |
| Tube and fittings | | $ | 1,238,258 |
| | $ | — |
| | $ | — |
| | $ | 1,238,258 |
|
| Brass rod and forgings | | — |
| | 461,603 |
| | — |
| | 461,603 |
|
| OEM components, tube & assemblies | | 94,383 |
| | 51,707 |
| | 131,448 |
| | 277,538 |
|
| Valves and plumbing specialties | | 232,309 |
| | — |
| | — |
| | 232,309 |
|
| Other | | — |
| | 88,821 |
| | — |
| | 88,821 |
|
| | | | | | | | | |
| | | $ | 1,564,950 |
| | $ | 602,131 |
| | $ | 131,448 |
| | $ | 2,298,529 |
|
| | | | | | | | | |
| Intersegment sales | | | | | | | | (32,456 | ) |
| | | | | | | | | |
| Net sales | | | | | | | | $ | 2,266,073 |
|
Summarized geographic information is as follows:
|
| | | | | | | | | | | | |
| (In thousands) | | 2019 | | 2018 | | 2017 |
| | | | | | | |
| Net sales: | | | | | | |
| United States | | $ | 1,775,321 |
| | $ | 1,820,857 |
| | $ | 1,556,825 |
|
| United Kingdom | | 230,791 |
| | 245,458 |
| | 231,039 |
|
| Canada | | 285,720 |
| | 292,798 |
| | 280,140 |
|
| Asia | | 64,363 |
| | 59,730 |
| | 121,295 |
|
| Mexico | | 74,421 |
| | 89,035 |
| | 76,774 |
|
| | | | | | | |
| | | $ | 2,430,616 |
| | $ | 2,507,878 |
| | $ | 2,266,073 |
|
|
| | | | | | | | | | | | |
| (In thousands) | | 2019 | | 2018 | | 2017 |
| | | | | | | |
| Long-lived assets: | | | | | | |
| United States | | $ | 286,727 |
| | $ | 295,735 |
| | $ | 238,752 |
|
| United Kingdom | | 18,776 |
| | 16,313 |
| | 17,661 |
|
| Canada | | 31,429 |
| | 33,144 |
| | 21,327 |
|
| Asia | | 25,637 |
| | 24,930 |
| | 25,973 |
|
| Mexico | | 559 |
| | 511 |
| | 608 |
|
| | | | | | | |
| | | $ | 363,128 |
| | $ | 370,633 |
| | $ | 304,321 |
|
| (In thousands) | | 2016 | | | 2015 | | | 2014 | |
| | | | | | | | | | |
| Long-lived assets: | | | | | | | | | |
| United States | | $ | 223,099 | | | $ | 223,398 | | | $ | 203,522 | |
| United Kingdom | | | 15,978 | | | | 19,982 | | | | 21,766 | |
| Canada | | | 18,928 | | | | 20,460 | | | | — | |
| Asia | | | 36,722 | | | | 15,863 | | | | 19,765 | |
| Mexico | | | 504 | | | | 521 | | | | 857 | |
| | | | | | | | | | | | | |
| | | $ | 295,231 | | | $ | 280,224 | | | $ | 245,910 | |
| | | | | | | | | | | | | |
Summarized segment information is as follows:
| | | For the Year Ended December 31, 2016 | |
| (In thousands) | | Piping Systems | | | Industrial Metals | | | Climate | | | Corporate and Eliminations | | | Total | |
| | | | | | | | | | | | | | | | |
| Net sales | | $ | 1,429,589 | | | $ | 521,060 | | | $ | 119,758 | | | $ | (14,785 | ) | | $ | 2,055,622 | |
| | | | | | | | | | | | | | | | | | | | | |
| Cost of goods sold | | | 1,228,949 | | | | 420,905 | | | | 89,927 | | | | (16,282 | ) | | | 1,723,499 | |
| Depreciation and amortization | | | 22,421 | | | | 8,162 | | | | 2,437 | | | | 2,113 | | | | 35,133 | |
| Selling, general, and administrative expense | | | 68,218 | | | | 13,162 | | | | 9,661 | | | | 46,458 | | | | 137,499 | |
| Impairment charges | | | 6,115 | | | | 663 | | | | — | | | | — | | | | 6,778 | |
| | | | | | | | | | | | | | | | | | | | | |
| Operating income | | | 103,886 | | | | 78,168 | | | | 17,733 | | | | (47,074 | ) | | | 152,713 | |
| | | | | | | | | | | | | | | | | | | | | |
| Interest expense | | | | | | | | | | | | | | | | | | | (7,387 | ) |
| Other income, net | | | | | | | | | | | | | | | | | | | 704 | |
| | | | | | | | | | | | | | | | | | | | | |
| Income before income taxes | | | | | | | | | | | | | | | | | | $ | 146,030 | |
|
| | | | | | | | | | | | | | | | | | | | |
| | | For the Year Ended December 28, 2019 |
| (In thousands) | | Piping Systems | | Industrial Metals | | Climate | | Corporate and Eliminations | | Total |
| | | | | | | | | | | |
| Net sales | | $ | 1,542,456 |
| | $ | 554,372 |
| | $ | 356,216 |
| | $ | (22,428 | ) | | $ | 2,430,616 |
|
| | | | | | | | | | | |
| Cost of goods sold | | 1,313,980 |
| | 473,010 |
| | 273,850 |
| | (25,230 | ) | | 2,035,610 |
|
| Depreciation and amortization | | 22,621 |
| | 7,489 |
| | 9,298 |
| | 3,285 |
| | 42,693 |
|
| Selling, general, and administrative expense | | 75,170 |
| | 12,359 |
| | 30,385 |
| | 44,444 |
| | 162,358 |
|
| (Gain) loss on sale of assets, net | | (1,194 | ) | | 275 |
| | (44 | ) | | — |
| | (963 | ) |
| Insurance recovery | | — |
| | (485 | ) | | — |
| | — |
| | (485 | ) |
| | | | | | | | | | | |
| Operating income | | 131,879 |
| | 61,724 |
| | 42,727 |
| | (44,927 | ) | | 191,403 |
|
| | | | | | | | | | | |
| Interest expense | | |
| | |
| | |
| | |
| | (25,683 | ) |
| Environmental expense | | | | | | | | | | (1,321 | ) |
| Other income, net | | |
| | |
| | |
| | |
| | 1,684 |
|
| | | | | | | | | | | |
| Income before income taxes | | |
| | |
| | |
| | |
| | $ | 166,083 |
|
|
| | | | | | | | | | | | | | | | | | | | |
| | | For the Year Ended December 29, 2018 |
| (In thousands) | | Piping Systems | | Industrial Metals | | Climate | | Corporate and Eliminations | | Total |
| | | | | | | | | | | |
| Net sales | | $ | 1,645,633 |
| | $ | 651,061 |
| | $ | 229,069 |
| | $ | (17,885 | ) | | $ | 2,507,878 |
|
| | | | | | | | | | | |
| Cost of goods sold | | 1,426,729 |
| | 559,367 |
| | 182,456 |
| | (18,152 | ) | | 2,150,400 |
|
| Depreciation and amortization | | 23,304 |
| | 7,568 |
| | 5,569 |
| | 3,114 |
| | 39,555 |
|
| Selling, general, and administrative expense | | 74,864 |
| | 13,501 |
| | 16,926 |
| | 43,597 |
| | 148,888 |
|
| (Gain) loss on sale of assets, net | | (2,093 | ) | | (1,301 | ) | | — |
| | 3,141 |
| | (253 | ) |
| Insurance recovery | | — |
| | (3,681 | ) | | — |
| | — |
| | (3,681 | ) |
| | | | | | | | | | | |
| Operating income | | 122,829 |
| | 75,607 |
| | 24,118 |
| | (49,585 | ) | | 172,969 |
|
| | | | | | | | | | | |
| Interest expense | | |
| | |
| | |
| | |
| | (25,199 | ) |
| Environmental expense | | | | | | | | | | (1,320 | ) |
| Other income, net | | |
| | |
| | |
| | |
| | 3,967 |
|
| | | | | | | | | | | |
| Income before income taxes | | |
| | |
| | |
| | |
| | $ | 150,417 |
|
| | | For the Year Ended December 26, 2015 | |
| (In thousands) | | Piping Systems | | | Industrial Metals | | | Climate | | | Corporate and Eliminations | | | Total | |
| | | | | | | | | | | | | | | | |
| Net sales | | $ | 1,436,689 | | | $ | 567,467 | | | $ | 110,727 | | | $ | (14,881 | ) | | $ | 2,100,002 | |
| | | | | | | | | | | | | | | | | | | | | |
| Cost of goods sold | | | 1,245,929 | | | | 491,567 | | | | 86,894 | | | | (14,688 | ) | | | 1,809,702 | |
| Depreciation and amortization | | | 22,559 | | | | 7,503 | | | | 2,257 | | | | 2,289 | | | | 34,608 | |
| Selling, general, and administrative expense | | | 66,903 | | | | 10,955 | | | | 9,117 | | | | 43,383 | | | | 130,358 | |
| Gain on sale of assets | | | (15,376 | ) | | | — | | | | — | | | | — | | | | (15,376 | ) |
| Severance | | | 3,442 | | | | — | | | | — | | | | — | | | | 3,442 | |
| | | | | | | | | | | | | | | | | | | | | |
| Operating income | | | 113,232 | | | | 57,442 | | | | 12,459 | | | | (45,865 | ) | | | 137,268 | |
| | | | | | | | | | | | | | | | | | | | | |
| Interest expense | | | | | | | | | | | | | | | | | | | (7,667 | ) |
| Other income, net | | | | | | | | | | | | | | | | | | | 2,188 | |
| | | | | | | | | | | | | | | | | | | | | |
| Income before income taxes | | | | | | | | | | | | | | | | | | $ | 131,789 | |
Segment information (continued):
| | | | | For the Year Ended December 27, 2014 | | | For the Year Ended December 30, 2017 |
| (In thousands) | | Piping Systems | | | Industrial Metals | | | Climate | | | Corporate and Eliminations | | | Total | | | Piping Systems | | Industrial Metals | | Climate | | Corporate and Eliminations | | Total |
| | | | | | | | | | | | | | | | | | | | | | | | | | |
| Net sales | | $ | 1,622,921 | | | $ | 659,847 | | | $ | 99,336 | | | $ | (17,877 | ) | | $ | 2,364,227 | | | $ | 1,564,950 |
| | $ | 602,131 |
| | $ | 131,448 |
| | $ | (32,456 | ) | | $ | 2,266,073 |
|
| | | | | | | | | | | | | | | | | | | | | | | | | | | | | | | |
| Cost of goods sold | | | 1,409,581 | | | | 572,979 | | | | 79,099 | | | | (17,940 | ) | | | 2,043,719 | | | 1,369,161 |
| | 506,973 |
| | 98,851 |
| | (34,368 | ) | | 1,940,617 |
|
| Depreciation and amortization | | | 22,221 | | | | 6,998 | | | | 1,845 | | | | 2,671 | | | | 33,735 | | | 21,777 |
| | 7,516 |
| | 2,513 |
| | 2,138 |
| | 33,944 |
|
| Selling, general, and administrative expense | | | 71,524 | | | | 7,660 | | | | 7,363 | | | | 45,193 | | | | 131,740 | | | 74,441 |
| | 13,278 |
| | 9,759 |
| | 43,252 |
| | 140,730 |
|
| Gain on sale of assets | | | (6,259 | ) | | | — | | | | — | | | | — | | | | (6,259 | ) | |
| Severance | | | 7,296 | | | | — | | | | — | | | | — | | | | 7,296 | | |
| Gain on sale of assets, net | | | (1,491 | ) | | — |
| | — |
| | — |
| | (1,491 | ) |
| Impairment charges | | | 1,466 |
| | — |
| | — |
| | — |
| | 1,466 |
|
| | | | | | | | | | | | | | | | | | | | | | | | | | | | | | | |
| Operating income | | | 118,558 | | | | 72,210 | | | | 11,029 | | | | (47,801 | ) | | | 153,996 | | | 99,596 |
| | 74,364 |
| | 20,325 |
| | (43,478 | ) | | 150,807 |
|
| | | | | | | | | | | | | | | | | | | | | | | | | | | | | | | |
| Interest expense | | | | | | | | | | | | | | | | | | | (5,740 | ) | | |
| | |
| | |
| | |
| | (19,502 | ) |
| Other expense, net | | | | | | | | | | | | | | | | | | | (243 | ) | |
| Environmental expense | | | | | | | | | | | (7,284 | ) |
| Other income, net | | | |
| | |
| | |
| | |
| | 2,951 |
|
| | | | | | | | | | | | | | | | | | | | | | | | | | | | | | | |
| Income before income taxes | | | | | | | | | | | | | | | | | | $ | 148,013 | | | |
| | |
| | |
| | |
| | $ | 126,972 |
|
| (In thousands) | | 2016 | | | 2015 | | | 2014 | |
| | | | | | | | | | |
| Expenditures for long-lived assets (including those resulting from business acquisitions): | | | | | | | | | |
| Piping Systems | | $ | 56,286 | | | $ | 41,900 | | | $ | 30,727 | |
| Industrial Metals | | | 3,302 | | | | 16,603 | | | | 7,965 | |
| Climate | | | 2,045 | | | | 12,373 | | | | 2,183 | |
| General Corporate | | | 55 | | | | 136 | | | | 401 | |
| | | | | | | | | | | | | |
| | | $ | 61,688 | | | $ | 71,012 | | | $ | 41,276 | |
| | | | | | | | | | | | | |
| Segment assets: | | | | | | | | | | | | |
| Piping Systems | | $ | 826,663 | | | $ | 811,343 | | | $ | 786,229 | |
| Industrial Metals | | | 160,478 | | | | 153,102 | | | | 159,572 | |
| Climate | | | 66,968 | | | | 61,672 | | | | 38,268 | |
| General Corporate | | | 393,367 | | | | 312,684 | | | | 344,027 | |
| | | | | | | | | | | | | |
| | | $ | 1,447,476 | | | $ | 1,338,801 | | | $ | 1,328,096 | |
|
| | | | | | | | | | | | |
| (In thousands) | | 2019 | | 2018 | | 2017 |
| Expenditures for long-lived assets (including those resulting from business acquisitions): | | | | | | |
| Piping Systems | | $ | 15,505 |
| | $ | 31,362 |
| | $ | 18,124 |
|
| Industrial Metals | | 9,101 |
| | 8,066 |
| | 5,322 |
|
| Climate | | 3,845 |
| | 85,471 |
| | 2,191 |
|
| General Corporate | | 2,711 |
| | 37 |
| | 22,518 |
|
| | | | | | | |
| | | $ | 31,162 |
| | $ | 124,936 |
| | $ | 48,155 |
|
|
| | | | | | | | | | | | |
| Segment assets: | | |
| | |
| | |
|
| Piping Systems | | $ | 796,262 |
| | $ | 818,303 |
| | $ | 801,468 |
|
| Industrial Metals | | 161,904 |
| | 173,725 |
| | 212,638 |
|
| Climate | | 249,853 |
| | 246,851 |
| | 73,458 |
|
| General Corporate | | 162,921 |
| | 130,670 |
| | 232,609 |
|
| | | | | | | |
| | | $ | 1,370,940 |
| | $ | 1,369,549 |
| | $ | 1,320,173 |
|
Note 4 – Cash, Cash Equivalents, and Restricted Cash
|
| | | | | | | | |
| (In thousands) | | 2019 | | 2018 |
| | | | | |
| Cash & cash equivalents | | $ | 97,944 |
| | $ | 72,616 |
|
| Restricted cash included within other current assets | | — |
| | 4,414 |
|
| Restricted cash included within other assets | | 98 |
| | 108 |
|
| | | | | |
| Total cash, cash equivalents, and restricted cash | | $ | 98,042 |
| | $ | 77,138 |
|
Note 5 – Inventories
| | | (In thousands) | | 2016 | | | 2015 | | | 2019 | | 2018 |
| | | | | | | | | | | |
| Raw materials and supplies | | $ | 57,387 | | | $ | 58,987 | | | $ | 85,769 |
| | $ | 89,641 |
|
| Work-in-process | | | 42,227 | | | | 25,161 | | | 48,814 |
| | 58,643 |
|
| Finished goods | | | 149,288 | | | | 161,410 | | | 163,842 |
| | 188,506 |
|
| Valuation reserves | | | (6,889 | ) | | | (6,180 | ) | | (6,318 | ) | | (6,995 | ) |
| | | | | | | | | | | | | |
| Inventories | | $ | 242,013 | | | $ | 239,378 | | | $ | 292,107 |
| | $ | 329,795 |
|
Inventories valued using the LIFO method totaled $14.4$16.8 million at December 31, 201628, 2019 and $27.6$18.8 million at December 26, 2015.29, 2018. At December 31, 201628, 2019 and December 26, 2015,29, 2018, the approximate FIFO cost of such inventories was $76.6$87.8 million and $80.7$91.8 million, respectively. Additionally, the Company values certain inventories purchased for resale on an average cost basis. The value of those inventories was $43.8 million at December 31, 2016 and $48.8 million at December 26, 2015.
During 2016, inventory quantities valued using the LIFO method declined, which resulted in liquidation of LIFO inventory layers. This liquidation resulted primarily from intercompany sales; therefore $2.5 million of the $3.3 million loss related to the LIFO liquidation was deferred. The deferred loss will increase cost of goods sold in the first quarter of 2017 when the inventory is sold to third parties.
At the end of 20162019 and 2015,2018, the FIFO value of inventory consigned to others was $2.5$5.5 million and $3.7$5.1 million, respectively.
Note 56 – Consolidated Financial Statement Details
Other Current Liabilities
Included in other current liabilities as of December 28, 2019 and December 29, 2018 were the following: (i) accrued discounts, allowances, and allowancescustomer rebates of $40.4$53.9 million at December 31, 2016 and $46.6$48.6 million, at December 26, 2015respectively, (ii) accrued interest of $6.0 million and $5.8 million, respectively, (iii) current taxes payable of $4.6$4.7 million atand $5.0 million, respectively, and (iv) current environmental liabilities of $0.9 million and $3.6 million, respectively. In addition, as of December 31, 2016 and $10.3 million at December 26, 2015.28, 2019 this included accruals for contingent consideration arrangements associated with acquired businesses of $7.0 million.
Other (Expense) Income, Net
| | | (In thousands) | | 2016 | | | 2015 | | | 2014 | | | 2019 | | 2018 | | 2017 |
| | | | | | | | | | | | | | | | |
| Net periodic benefit income | | | $ | 465 |
| | $ | 2,914 |
| | $ | 1,150 |
|
| Interest income | | $ | 1,185 | | | $ | 1,029 | | | $ | 573 | | | 722 |
| | 624 |
| | 684 |
|
| Environmental expense, non-operating properties | | | (1,279 | ) | | | (46 | ) | | | (822 | ) | |
| Other | | | 798 | | | | 1,205 | | | | 6 | | | 497 |
| | 429 |
| | 1,117 |
|
| | | | | | | | | | | | | | | | | | | |
| Other income (expense), net | | $ | 704 | | | $ | 2,188 | | | $ | (243 | ) | |
| Other income, net | | | $ | 1,684 |
| | $ | 3,967 |
| | $ | 2,951 |
|
Note 67 – Derivative Instruments and Hedging Activities
The Company'sCompany’s earnings and cash flows are subject to fluctuations due to changes in commodity prices, foreign currency exchange rates, and interest rates. The Company uses derivative instruments such as commodity futures contracts, foreign currency forward contracts, and interest rate swaps to manage these exposures.
Commodity Futures Contracts
Copper and brass represent the largest component of the Company'sCompany’s variable costs of production. The cost of these materials is subject to global market fluctuations caused by factors beyond the Company'sCompany’s control. The Company occasionally enters into forward fixed-price arrangements with certain customers; the risk of these arrangements is generally managed with commodity futures contracts. These futures contracts have been designated as cash flow hedges.
At December 31, 2016,28, 2019, the Company held open futures contracts to purchase approximately $10.2$21.3 million of copper over the next 12 months related to fixed price sales orders. The fair value of those futures contracts was a $0.8$1.4 million net gain position, which was determined by obtaining quoted market prices (level 1 within the fair value hierarchy). In the next twelve12 months, the Company will reclassify into earnings realized gains or losses relating to cash flow hedges. At December 31, 2016,28, 2019, this amount was approximately $0.3 million of deferred net gains, net of tax.
The Company may also enter into futures contracts to protect the value of inventory against market fluctuations. At December 31, 2016,28, 2019, the Company held open futures contracts to sell approximately $28.7$1.9 million of copper over the next threefive months related to copper inventory. The fair value of those futures contracts was a $0.3$0.1 million net loss position, which was determined by obtaining quoted market prices (level 1 within the fair value hierarchy).
Interest Rate Swap
On February 20, 2013, the Company entered into a two-year forward-starting interest rate swap agreement with an effective date of January 12, 2015, and an underlying notional amount of $200.0 million, pursuant to which the Company receives variable interest payments based on one-month LIBOR and pays fixed interest at a rate of 1.4 percent. Based on the Company's current variable premium pricing on its revolving credit facility, the all-in fixed rate is 2.49 percent. The interest rate swap will mature on December 11, 2017, and is structured to offset the interest rate risk associated with the Company's floating-rate, LIBOR-based revolving credit facility. The swap was designated and accounted for as a cash flow hedge at inception. During the fourth quarter of 2016 the Company discontinued hedge accounting prospectively.
The fair value of the interest rate swap is estimated based on the present value of the difference between expected cash flows calculated at the contracted interest rate and the expected cash flows at the current market interest rate using observable benchmarks for LIBOR forward rates at the end of the period (level 2 within the fair value hierarchy). Interest payable and receivable under the swap agreement is accrued and recorded as an adjustment to interest expense. The fair value of the interest rate swap was a $0.8 million loss position recorded in other current liabilities at December 31, 2016, and there was $0.6 million of deferred net losses, net of tax, included in AOCI that are expected to be reclassified into interest expense over the term of the interest rate swap.
The Company presents its derivative assets and liabilities in the Consolidated Balance Sheets on a net basis by counterparty. The following table summarizes the location and fair value of the derivative instruments and disaggregates the net derivative assets and liabilities into gross components on a contract-by-contract basis:
| | Asset Derivatives | | Liability Derivatives | |
| | | | Fair Value | | | | Fair Value | |
| (In thousands) | Balance Sheet Location | | 2016 | | | 2015 | | Balance Sheet Location | | 2016 | | | 2015 | |
| Hedging instrument: | | | | | | | | | | | | | | |
| Commodity contracts - gains | Other current assets | | $ | 1,013 | | | $ | 60 | | Other current liabilities | | $ | 564 | | | $ | 238 | |
| Commodity contracts - losses | Other current assets | | | (148 | ) | | | — | | Other current liabilities | | | (920 | ) | | | (1,864 | ) |
| Interest rate swap | Other current assets | | | — | | | | | | Other current liabilities | | | (787 | ) | | | — | |
| Interest rate swap | Other assets | | | — | | | | — | | Other liabilities | | | — | | | | (1,692 | ) |
| | | | | | | | | | | | | | | | | | | |
Total derivatives (1) | | | $ | 865 | | | $ | 60 | | | | $ | (1,143 | ) | | $ | (3,318 | ) |
| | | | | | | | | | | | | | | | | | | |
(1) Does not include the impact of cash collateral provided to counterparties. | |
|
| | | | | | | | | | | | | | | | | | | | |
| | | Asset Derivatives | | Liability Derivatives |
| | | | | Fair Value | | | | Fair Value |
| (In thousands) | | Balance Sheet Location | | 2019 | | 2018 | | Balance Sheet Location | | 2019 | | 2018 |
| | | | | | | | | | | | | |
| Commodity contracts - gains | | Other current assets | | $ | 1,435 |
| | $ | 88 |
| | Other current liabilities | | $ | 50 |
| | $ | 103 |
|
| Commodity contracts - losses | | Other current assets | | (12 | ) | | (1 | ) | | Other current liabilities | | (159 | ) | | (1,382 | ) |
| | | | | | | | | | | | | |
Total derivatives (1) | | | | $ | 1,423 |
| | $ | 87 |
| | | | $ | (109 | ) | | $ | (1,279 | ) |
(1) Does not include the impact of cash collateral provided to counterparties.
The following tables summarizetable summarizes the effects of derivative instruments on the Consolidated Statements of Income:
| (In thousands) | Location | | 2016 | | 2015 | |
| Fair value hedges: | | | | | | |
| (Loss) gain on commodity contracts (qualifying) | Cost of goods sold | | $ | (420 | ) | | $ | 3,374 | |
| Gain (loss) on hedged item - Inventory | Cost of goods sold | | | 382 | | | | (3,665 | ) |
| Undesignated derivatives: | | | | | | | |
| Gain on commodity contracts (nonqualifying) | Cost of goods sold | | $ | 4,068 | | | $ | 3,474 | |
F-38 |
| | | | | | | | | | |
| (In thousands) | | Location | | 2019 | | 2018 |
| Fair value hedges: | | | | | | |
| Gain on commodity contracts (qualifying) | | Cost of goods sold | | $ | — |
| | $ | 391 |
|
| Gain (loss) on hedged item - inventory | | Cost of goods sold | | — |
| | (385 | ) |
| | | | | | | |
| Undesignated derivatives: | | | | | | |
| Gain on commodity contracts (nonqualifying) | | Cost of goods sold | | $ | 2,443 |
| | $ | 4,227 |
|
The following tables summarize amounts recognized in and reclassified from AOCI during the period:
| | | Year Ended December 31, 2016 | |
| (In thousands) | | Gain (Loss) Recognized in AOCI (Effective Portion), Net of Tax | | Classification Gains (Losses) | | Loss (Gain) Reclassified from AOCI (Effective Portion), Net of Tax | |
| Cash flow hedges: | | | | | | | |
| Commodity contracts | | $ | 308 | | Cost of goods sold | | $ | 1,078 | |
| Interest rate swap | | | 305 | | Interest expense | | | 231 | |
| Other | | | (213 | ) | Other | | | — | |
| Total | | $ | 400 | | Total | | $ | 1,309 | |
| | | Year Ended December 26, 2015 | |
| (In thousands) | | (Loss) Gain Recognized in AOCI (Effective Portion), Net of Tax | | Classification Gains (Losses) | | Loss (Gain) Reclassified from AOCI (Effective Portion), Net of Tax | |
| Cash flow hedges: | | | | | | | |
| Commodity contracts | | $ | (3,817 | ) | Cost of goods sold | | $ | 3,310 | |
| Interest rate swap | | | (727 | ) | Interest expense | | | 238 | |
| Other | | | (60 | ) | Other | | | — | |
| Total | | $ | (4,604 | ) | Total | | $ | 3,548 | |
|
| | | | | | | | | | |
| | | Year Ended December 28, 2019 |
| (In thousands) | | Gain Recognized in AOCI (Effective Portion), Net of Tax | | Classification Gains (Losses) | | Gain Reclassified from AOCI (Effective Portion), Net of Tax |
| Cash flow hedges: | | | | | | |
| Commodity contracts | | $ | 1,161 |
| | Cost of goods sold | | $ | (486 | ) |
| Other | | 15 |
| | Other | | — |
|
| | | | | | | |
| Total | | $ | 1,176 |
| | Total | | $ | (486 | ) |
|
| | | | | | | | | | |
| | | Year Ended December 29, 2018 |
| (In thousands) | | Loss Recognized in AOCI (Effective Portion), Net of Tax | | Classification Gains (Losses) | | Gain Reclassified from AOCI (Effective Portion), Net of Tax |
| Cash flow hedges: | | | | | | |
| Commodity contracts | | $ | (793 | ) | | Cost of goods sold | | $ | (371 | ) |
| Other | | (9 | ) | | Other | | — |
|
| | | | | | | |
| Total | | $ | (802 | ) | | Total | | $ | (371 | ) |
The Company enters into futures and forward contracts that closely match the terms of the underlying transactions. As a result, the ineffective portion of the qualifying open hedge contracts through December 31, 201628, 2019 was not material to the Consolidated Statements of Income.
The Company primarily enters into International Swaps and Derivatives Association master netting agreements with major financial institutions that permit the net settlement of amounts owed under their respective derivative contracts. Under these master netting agreements, net settlement generally permits the Company or the counterparty to determine the net amount payable for contracts due on the same date and in the same currency for similar types of derivative transactions. The master netting agreements generally also provide for net settlement of all outstanding contracts with the counterparty in the case of an event of default or a termination event. The Company does not offset fair value amounts for derivative instruments and fair value amounts recognized for the right to reclaim cash collateral. At December 31, 201628, 2019 and December 26, 2015,29, 2018, the Company had recorded restricted cash in other current assets of $1.4$0.2 million and $2.6$3.6 million, respectively, as collateral related to open derivative contracts under the master netting arrangements.
Note 8 – Leases
The Company leases certain facilities, vehicles, and equipment which expire on various dates through 2033. The following table includes supplemental information with regards to the Company’s operating leases:
|
| | | | |
| (In thousands, except lease term and discount rate) | | December 28, 2019 |
| | | |
| Operating lease right-of-use assets | | $ | 26,922 |
|
| | | |
| Current portion of operating lease liabilities | | 5,250 |
|
| Noncurrent operating lease liabilities | | 22,388 |
|
| | | |
| Total operating lease liabilities | | $ | 27,638 |
|
| | | |
| Weighted average discount rate | | 5.82 | % |
| Weighted average remaining lease term (in years) | | 8.35 |
|
Some of the Company’s leases include variable lease costs such as taxes, insurance, etc. These costs are immaterial for disclosure.
The following table presents certain information related to operating lease costs and cash paid during the period:
|
| | | | |
| (In thousands) | | For the Year Ended December 28, 2019 |
| | | |
| Operating lease costs | | $ | 6,818 |
|
| Short term lease costs | | 4,951 |
|
| | | |
| Total lease costs | | $ | 11,769 |
|
| | | |
| Cash paid for amounts included in the measurement of lease liabilities | | $ | 6,703 |
|
Maturities of the Company’s operating leases are as follows:
|
| | | | |
| (In thousands) | | Amount |
| | | |
| 2020 | | $ | 6,635 |
|
| 2021 | | 5,363 |
|
| 2022 | | 4,620 |
|
| 2023 | | 3,117 |
|
| 2024 | | 2,247 |
|
| 2025 and thereafter | | 13,750 |
|
| | | |
| Total lease payments | | 35,732 |
|
| Less imputed interest | | (8,094 | ) |
| | | |
| Total lease obligations | | 27,638 |
|
| Less current obligations | | (5,250 | ) |
| | | |
| Noncurrent lease obligations | | $ | 22,388 |
|
Note 79 – Property, Plant, and Equipment, Net
| (In thousands) | | 2016 | | | 2015 | |
| | | | | | | |
| Land and land improvements | | $ | 19,928 | | | $ | 13,046 | |
| Buildings | | | 144,914 | | | | 128,322 | |
| Machinery and equipment | | | 607,344 | | | | 597,209 | |
| Construction in progress | | | 30,344 | | | | 47,746 | |
| | | | | | | | | |
| | | | 802,530 | | | | 786,323 | |
| Less accumulated depreciation | | | (507,299 | ) | | | (506,099 | ) |
| | | | | | | | | |
| Property, plant, and equipment, net | | $ | 295,231 | | | $ | 280,224 | |
| | | | | | | | | |
During the fourth quarter of 2016, the Company acquired the land, building, and manufacturing equipment of an idled copper tube mill in Cedar City, Utah.
F-39 |
| | | | | | | | |
| (In thousands) | | 2019 | | 2018 |
| | | | | |
| Land and land improvements | | $ | 31,987 |
| | $ | 32,132 |
|
| Buildings | | 203,762 |
| | 201,176 |
|
| Machinery and equipment | | 640,642 |
| | 635,173 |
|
| Construction in progress | | 18,920 |
| | 22,618 |
|
| | | | | |
| | | 895,311 |
| | 891,099 |
|
| Less accumulated depreciation | | (532,183 | ) | | (520,466 | ) |
| | | | | |
| Property, plant, and equipment, net | | $ | 363,128 |
| | $ | 370,633 |
|
Depreciation expense for property, plant, and equipment was $37.3 million in 2019, $35.1 million in 2018, and $30.8 million in 2017.
Note 810 – Goodwill and Other Intangible Assets
Goodwill
The changes in the carrying amount of goodwill by segment were as follows:
| | | (In thousands) | | Piping Systems | | | Industrial Metals | | | Climate | | | Total | | | Piping Systems | | Industrial Metals | | Climate | | Total |
| | | | | | | | | | | | | | | | | | | | | |
| Goodwill | | $ | 141,132 | | | $ | 8,853 | | | $ | 2,329 | | | $ | 152,314 | | | $ | 166,428 |
| | $ | 8,854 |
| | $ | 4,416 |
| | $ | 179,698 |
|
| Accumulated impairment charges | | | (40,552 | ) | | | (8,853 | ) | | | — | | | | (49,405 | ) | | (40,552 | ) | | (8,853 | ) | | — |
| | (49,405 | ) |
| | | | | | | | | | | | | | | | | | | | | | | | | |
| Balance at December 27, 2014: | | | 100,580 | | | | — | | | | 2,329 | | | | 102,909 | | |
| | | | | | | | | | | | | | | | | | |
| Additions | | | 19,087 | | | | 1 | | | | 2,087 | | | | 21,175 | | |
| Disposition | | | (2,418 | ) | | | — | | | | — | | | | (2,418 | ) | |
| Currency translation | | | (1,414 | ) | | | — | | | | — | | | | (1,414 | ) | |
| | | | | | | | | | | | | | | | | | |
| Balance at December 26, 2015: | | | 115,835 | | | | 1 | | | | 4,416 | | | | 120,252 | | |
| Balance at December 30, 2017: | | | 125,876 |
| | 1 |
| | 4,416 |
| | 130,293 |
|
| | | | | | | | | | | | | | | | | | | | | | | | | |
Additions (1) | | | 4,601 | | | | — | | | | — | | | | 4,601 | | | 5,049 |
| | — |
| | 17,770 |
| | 22,819 |
|
| Currency translation | | | (860 | ) | | | — | | | | — | | | | (860 | ) | | (2,777 | ) | | — |
| | — |
| | (2,777 | ) |
| | | | | | | | | | | | | | | | | | | | | | | | | |
| Balance at December 31, 2016: | | | | | | | | | | | | | | | | | |
| Balance at December 29, 2018: | | | 128,148 |
| | 1 |
| | 22,186 |
| | 150,335 |
|
| | | | | | | | | | |
Additions (2) | | | 1,999 |
| | — |
| | — |
| | 1,999 |
|
Reductions (3) | | | — |
| | — |
| | (534 | ) | | (534 | ) |
| Currency translation | | | 1,476 |
| | — |
| | — |
| | 1,476 |
|
| | | | | | | | | | |
| Balance at December 28, 2019: | | | |
| | |
| | |
| | |
|
| Goodwill | | | 160,128 | | | | 8,854 | | | | 4,416 | | | | 173,398 | | | 172,175 |
| | 8,854 |
| | 21,652 |
| | 202,681 |
|
| Accumulated impairment charges | | | (40,552 | ) | | | (8,853 | ) | | | — | | | | (49,405 | ) | | (40,552 | ) | | (8,853 | ) | | — |
| | (49,405 | ) |
| | | | | | | | | | | | | | | | | | | | | | | | | |
| Goodwill, net | | $ | 119,576 | | | $ | 1 | | | $ | 4,416 | | | $ | 123,993 | | | $ | 131,623 |
| | $ | 1 |
| | $ | 21,652 |
| | $ | 153,276 |
|
| | | | | | | | | | | | | | | | | | |
(1) Includes finalization of the purchase price allocation adjustment for Great Lakes of $4.1 million | | |
(1) Includes finalization of the purchase price allocation adjustment for Heatlink Group of $2.8 million.
(2) Includes finalization of the purchase price allocation adjustment for Die-Mold of $2.0 million.
(3) Includes finalization of the purchase price allocation adjustment for ATCO of $0.5 million.
Reporting units with recorded goodwill include DPS,Domestic Piping Systems Group, B&K LLC, Great Lakes, Heatlink Group, Die-Mold, European Operations, Jungwoo-Mueller, Westermeyer, Turbotec, Sherwood, and Jungwoo-Mueller.ATCO. Several factors give rise to goodwill in the Company'sCompany’s acquisitions, such as the expected benefit from synergies of the combination and the existing workforce of the acquired businesses. There were no0 impairment charges resulting from the 2016, 2015,2019, 2018, or 20142017 annual impairment tests as the estimated fair value of each of the reporting units exceeded its carrying value.
Other Intangible Assets
The carrying amount of intangible assets at December 31, 201628, 2019 was as follows:
|
| | | | | | | | | | | | |
(In thousands) | | Gross Carrying Amount | | Accumulated Amortization | | Net Carrying Amount |
| | | | | | | |
| Customer relationships | | $ | 44,832 |
| | $ | (8,773 | ) | | $ | 36,059 |
|
| Non-compete agreements | | 2,499 |
| | (2,156 | ) | | 343 |
|
| Patents and technology | | 19,804 |
| | (4,060 | ) | | 15,744 |
|
| Trade names and licenses | | 10,155 |
| | (3,249 | ) | | 6,906 |
|
| Other | | 1,676 |
| | (646 | ) | | 1,030 |
|
| | | | | | | |
| Other intangible assets | | $ | 78,966 |
| | $ | (18,884 | ) | | $ | 60,082 |
|
(In thousands) | | Gross Carrying Amount | | | Accumulated Amortization | | | Net Carrying Amount | |
| | | | | | | | | | |
| Customer relationships | | $ | 29,833 | | | $ | (2,845 | ) | | $ | 26,988 | |
| Non-compete agreements | | | 5,926 | | | | (4,063 | ) | | | 1,863 | |
| Patents and technology | | | 5,922 | | | | (1,179 | ) | | | 4,743 | |
| Trade names and licenses | | | 4,087 | | | | (1,032 | ) | | | 3,055 | |
| Other | | | 213 | | | | (694 | ) | | | (481 | ) |
| | | | | | | | | | | | | |
| Other intangible assets | | $ | 45,981 | | | $ | (9,813 | ) | | $ | 36,168 | |
The carrying amount of intangible assets at December 26, 201529, 2018 was as follows:
| | (In thousands) | | Gross Carrying Amount | | | Accumulated Amortization | | | Net Carrying Amount | | | Gross Carrying Amount | | Accumulated Amortization | | Net Carrying Amount |
| | | | | | | | | | | | | | | | |
| Customer relationships | | $ | 30,882 | | | $ | (1,488 | ) | | $ | 29,394 | | | $ | 43,104 |
| | $ | (6,309 | ) | | $ | 36,795 |
|
| Non-compete agreements | | | 6,534 | | | | (2,838 | ) | | | 3,696 | | | 2,400 |
| | (1,582 | ) | | 818 |
|
| Patents and technology | | | 9,798 | | | | (5,323 | ) | | | 4,475 | | | 17,879 |
| | (2,595 | ) | | 15,284 |
|
| Trade names and licenses | | | 4,160 | | | | (574 | ) | | | 3,586 | | | 9,173 |
| | (2,188 | ) | | 6,985 |
|
| Other | | | 213 | | | | (728 | ) | | | (515 | ) | | 2,526 |
| | (437 | ) | | 2,089 |
|
| | | | | | | | | | | | | | | | | | | |
| Other intangible assets | | $ | 51,587 | | | $ | (10,951 | ) | | $ | 40,636 | | | $ | 75,082 |
| | $ | (13,111 | ) | | $ | 61,971 |
|
| | | | | | | | | | | | | | |
Amortization expense for intangible assets was $4.3$5.4 million in 2016, $4.12019, $4.4 million in 2015,2018, and $3.5$3.1 million in 2014.2017. Future amortization expense is estimated as follows:
| | | (In thousands) | | Amount | | | Amount |
| | | | | | |
| 2017 | | $ | 2,996 | | |
| 2018 | | | 2,735 | | |
| 2019 | | | 2,655 | | |
| 2020 | | | 2,458 | | | $ | 5,203 |
|
| 2021 | | | 2,272 | | | 4,916 |
|
| 2022 | | | 4,836 |
|
| 2023 | | | 4,525 |
|
| 2024 | | | 4,378 |
|
| Thereafter | | | 23,052 | | | 36,224 |
|
| | | | | | | |
|
| Expected amortization expense | | $ | 36,168 | | | $ | 60,082 |
|
| | | | | |
Note 911 – InvestmentInvestments in Unconsolidated Affiliates
During the third quarter of 2015, theTecumseh
The Company entered into a joint venture agreement with affiliates of Atlas Holdings LLC to form the Joint Venture, which simultaneously entered into a definitive merger agreement with MA Industrial Sub, Inc. and Tecumseh to commence a cash tender offer to acquire all of the outstanding shares of Tecumseh. On September 21, 2015, the tender offer and back-end merger was completed and Mueller contributed $65.9 million forowns a 50 percent ownership interest in the Joint Venture.an unconsolidated affiliate that acquired Tecumseh. The Company also owns a 50 percent interest in a second unconsolidated affiliate that provides financing to Tecumseh. Tecumseh is a global manufacturer of hermetically sealed compressors for residential and specialty air conditioning, household refrigerators and freezers, and commercial refrigeration applications, including air conditioning and refrigeration compressors, as well as condensing units, heat pumps, and complete refrigeration systems.
The following tables present summarized financial information derived from the Company'sCompany’s equity method investees'investees’ combined consolidated financial statements, which are prepared in accordance with U.S. GAAP. The income statement data is reflective of the period since the acquisition of the investees.
|
| | | | | | | | |
| (In thousands) | | 2019 | | 2018 |
| | | | | |
| Current assets | | $ | 198,559 |
| | $ | 228,214 |
|
| Noncurrent assets | | 87,218 |
| | 114,257 |
|
| Current liabilities | | 147,801 |
| | 175,371 |
|
| Noncurrent liabilities | | 51,219 |
| | 57,216 |
|
| | | | | |
| Net sales | | $ | 488,270 |
| | $ | 509,517 |
|
| Gross profit | | 58,494 |
| | 59,385 |
|
| Net loss | | (44,053 | ) | | (20,049 | ) |
| (In thousands) | | 2016 | | | 2015 | |
| | | | | | | |
| Balance sheet data: | | | | | | |
| Current assets | | $ | 244,323 | | | $ | 251,389 | |
| Noncurrent assets | | | 130,400 | | | | 112,156 | |
| Current liabilities | | | 148,806 | | | | 178,784 | |
| Noncurrent liabilities | | | 71,681 | | | | 63,643 | |
| | | | | | | | | |
| Income statement data: | | | | | | | | |
| Net sales | | $ | 579,400 | | | $ | — | |
| Gross profit | | | 79,600 | | | | — | |
| Net income | | | 3,720 | | | | — | |
F-41The Company’s loss from unconsolidated affiliates, net of foreign tax, for 2019 included net losses of $22.0 million for Tecumseh.
Included in the equity method investees'The Company’s loss from unconsolidated affiliates, net incomeof foreign tax, for the twelve months ended September 30, 2016 is2018 included net losses of $14.0 million and charges of $3.0 million related to certain labor claim contingencies, offset by a gain of $17.1$7.0 million that resulted fromrelated to a settlement with the allocation of the purchase price, which was finalized during the quarter ended December 31, 2015. That gain was offset by restructuring and impairment charges of $5.3 million and net losses of $8.1 million.Brazilian Federal Revenue Agency for Tecumseh.
Note 10 – New Markets Tax Credit TransactionMueller Middle East
On October 18, 2016,December 30, 2015, the Company entered into a financing transactionjoint venture agreement with Wells Fargo Community Investment Holdings, LLC (Wells Fargo) relatedCayan Ventures and Bahrain Mumtalakat Holding Company to an equipment modernization project at the Company'sbuild a copper tube mill in Bahrain. The business operates and line sets production facilitiesbrands its products under the Mueller Industries family of brands. The Company has invested approximately $5.0 million of cash to date and is the technical and marketing lead with a 40 percent ownership in Fulton, MS. Wells Fargo made a capital contributionthe joint venture.
The Company’s loss from unconsolidated affiliates, net of foreign tax, for 2019 and 2018 included net losses of $2.6 million for Mueller Middle East.
Note 12 – Debt
|
| | | | | | | | |
| (In thousands) | | 2019 | | 2018 |
| | | | | |
| Subordinated Debentures with interest at 6.00%, due 2027 | | $ | 284,479 |
| | $ | 284,479 |
|
| Revolving Credit Facility with interest at 3.20%, due 2021 | | 90,000 |
| | 195,000 |
|
| Jungwoo-Mueller credit facility with interest at 2.86%, due 2019 | | — |
| | 5,264 |
|
| Jungwoo-Mueller credit facility with interest at 2.55%, due 2020 | | 5,768 |
| | 5,104 |
|
| 2001 Series IRB's with interest at 3.03%, due 2021 | | 1,250 |
| | 2,250 |
|
| Other | | 5,295 |
| | 5,458 |
|
| | | 386,792 |
| | 497,555 |
|
| | | | | |
| Less debt issuance costs | | (538 | ) | | (857 | ) |
| Less current portion of debt | | (7,530 | ) | | (7,101 | ) |
| | | | | |
| Long-term debt | | $ | 378,724 |
| | $ | 489,597 |
|
Subordinated Debentures
On March 9, 2017, the Company madedistributed a loan to MCTC Investment Fund, LLC (Investment Fund) under a qualified New Markets Tax Credit (NMTC) program. The NMTC program was provided forspecial dividend of $3.00 in the Community Renewal Tax Relief Act of 2000 (Act)cash and is intended to induce capital investment$5.00 in qualified lower income communities. The Act permits taxpayers to claim credits against their Federal income taxes for up to 39% of qualified investments in the equity of community development entities (CDEs). CDEs are privately managed investment institutions that are certified to make qualified low-income community investments.
In connection with the financing, the Company loaned $13.7 million aggregate principal amount of a 1.0% loan (Leverage Loan)the Company’s 6% Subordinated Debentures (Debentures) due October 17, 2041,March 1, 2027 for each share of common stock outstanding. Interest on the Debentures is payable semiannually on September 1 and March 1.
The Debentures are subordinated to the Investment Fund. Additionally, Wells Fargo contributed $6.6 million to the Investment Fund, and as such, Wells Fargo is entitled to substantially all other funded debt of the benefits derived fromCompany and are callable, in whole or in part, at any time at the NMTCs. The Investment Fund then contributed the proceeds to certain CDEs, which, in turn, loaned the funds on similar terms as the Leverage Loan to Mueller Copper Tube Company, Inc. (MCTC) an indirect, wholly-owned subsidiaryoption of the Company. The proceeds of the loans from the CDEs, including loans representing the capital contribution made by Wells Fargo, net of syndication fees, are restricted for use on the modernization project. At December 31, 2016, after qualifying capital expenditures, MCTC held restricted cash of $6.6 million, which is included in other current assets in the accompanying Consolidated Balance Sheets.
The NMTC isCompany, subject to 100% recapture for a period of seven years as provided indeclining call premiums during the Internal Revenue Code.first five years. The Company is requiredDebentures also grant each holder the right to comply with various regulations and contractual provisions that apply to the NMTC arrangement. Non-compliance with applicable requirements could result in projected tax benefits not being realized and, therefore, require the Company to indemnify Wells Fargo for any loss or recapturerepurchase such holder’s Debentures in the event of NMTCs relateda change in control at declining repurchase premiums during the first five years. The Debentures may be redeemed, subject to the financing until such time as the Company's obligation to deliver tax benefits is relieved. The Company does not anticipate any credit recaptures will be required in connection with this arrangement. This transaction also includes a put/call provision whereby the Company may be obligated or entitled to repurchase Wells Fargo's interest in the Investment Fund. The Company believes that Wells Fargo will exercise the put option in October 2023,conditions set forth above, at the endfollowing redemption price (expressed as a percentage of principal amount) plus any accrued but unpaid interest to, but excluding, the recapture period. The value attributed to the put/call is negligible.redemption date:
The Company has determined that
If redeemed during the financing arrangement with the Investment Fund and CDEs is a variable interest entity (VIE), and that it is the primary beneficiary of the VIE. This conclusion was reached based on the following:12-month period beginning March 9:
· | The ongoing activities of the VIE, collecting and remitting interest and fees, and NMTC compliance were all considered in the initial design and are not expected to significantly affect economic performance throughout the life of the VIE; |
· | Contractual arrangements obligate the Company to comply with NMTC rules and regulations and provide various other guarantees to the Investment Fund and CDEs; |
· | Wells Fargo lacks a material interest in the underling economics of the project; and |
· | The Company is obligated to absorb losses of the VIE. |
Because the Company is the primary beneficiary of the VIE, it has been included in the Company's Consolidated Financial Statements. Wells Fargo's contribution of $6.6 million was initially recorded as restricted cash and its interest in the Investment Fund is included in other liabilities.
F-42 |
| | |
| Year | | Redemption Price |
| | | |
| 2019 | | 104% |
| 2020 | | 103 |
| 2021 | | 102 |
| 2022 and thereafter | | 100 |
Note 11 – Debt
| (In thousands) | | 2016 | | | 2015 | |
| | | | | | | |
| Revolving Credit Facility with interest at 2.49%, due 2021 | | $ | 200,000 | | | $ | — | |
| Term Loan Facility, due 2017 | | | — | | | | 200,000 | |
| Mueller-Xingrong credit facility with interest at 4.35%, due 2017 | | | 3,048 | | | | 5,275 | |
| Jungwoo-Mueller credit facility with interest at 2.82%, due 2017 | | | 4,724 | | | | — | |
| Jungwoo-Mueller credit facility with interest at 3.28%, due 2018 | | | 7,990 | | | | — | |
| 2001 Series IRB's with interest at 1.23%, due through 2021 | | | 4,250 | | | | 5,250 | |
| Debt Issuance Costs | | | (957 | ) | | | — | |
| Other | | | 8,309 | | | | 5,485 | |
| | | | | | | | | |
| | | | 227,364 | | | | 216,010 | |
| Less current portion of debt | | | (13,655 | ) | | | (11,760 | ) |
| | | | | | | | | |
| Long-term debt | | $ | 213,709 | | | $ | 204,250 | |
On December 6, 2016, the Company entered into a credit agreement (Credit Agreement) providingThe Company’s Credit Agreement provides for an unsecured $350.0 million revolving credit facility (Revolving Credit Facility) whichthat matures on December 6, 2021. The Company used the borrowings under the Revolving Credit Facility to replace the amounts previously advanced under the Term Loan Facility, the Company's previous credit facility. Borrowings under the Revolving Credit Facility bear interest, at the Company'sCompany’s option, at LIBOR or Base Rate as defined by the Credit Agreement, plus a variable premium. LIBOR advances may be based upon the one, three, or six-month LIBOR. The variable premium is based upon the Company'sCompany’s debt to total capitalization ratio, and can range from 112.5 to 162.5 basis points for LIBOR based loans and 12.5 to 62.5 basis points for Base Rate loans. At December 31, 2016,28, 2019, the premium was 115.0150.0 basis points for LIBOR loans and 15.050.0 basis points for Base Rate loans. Additionally, a commitment fee is payable quarterly on the total commitment less any outstanding loans or issued letters of credit, and varies from 15.0 to 30.0 basis points based upon the Company'sCompany’s debt to total capitalization ratio. Availability of funds under the Revolving Credit Facility is reduced by the amount of certain outstanding letters of credit, which are used to secure the Company'sCompany’s payment of insurance deductibles and certain retiree health benefits, totaling approximately $7.0$11.9 million at December 31, 2016.28, 2019. Terms of the letters of credit are generally renewable annually.
On March 23, 2016, Mueller-Xingrong entered into a secured revolving credit agreement with a total borrowing capacity of RMB 150 million (or approximately $21.7 million). In addition, Mueller-Xingrong occasionally finances working capital through various accounts receivable and bank draft discount arrangements. Borrowings are secured by the real property and equipment and bank draft receivables of Mueller-Xingrong and bear interest at the latest base-lending rate published by the People's Bank of China.Jungwoo-Mueller
Jungwoo-Mueller has several secured revolving credit arrangements with a total borrowing capacity of KRW 35.725.8 billion (or approximately $30.3$21.9 million). Borrowings are secured by the real property and equipment of Jungwoo-Mueller.
Covenants contained in the Company'sCompany’s financing obligations require, among other things, the maintenance of minimum levels of tangible net worth and the satisfaction of certain minimum financial ratios. At December 31, 2016,28, 2019, the Company was in compliance with all debt covenants.
Aggregate annual maturities of the Company'sCompany’s debt are as follows:
|
| | | | |
| (In thousands) | | Amount |
| | | |
| 2020 | | $ | 7,530 |
|
| 2021 | | 90,502 |
|
| 2022 | | 525 |
|
| 2023 | | 804 |
|
| 2024 | | 540 |
|
| Thereafter | | 286,891 |
|
| | | |
|
| Long-term debt | | $ | 386,792 |
|
| (In thousands) | | Amount | |
| | | | |
| 2017 | | $ | 13,655 | |
| 2018 | | | 9,212 | |
| 2019 | | | 1,222 | |
| 2020 | | | 1,222 | |
| 2021 | | | 200,472 | |
| Thereafter | | | 2,538 | |
| | | | | |
| Long-term debt | | $ | 228,321 | |
Net interest expense consisted of the following:
| | | (In thousands) | | 2016 | | | 2015 | | | 2014 | | | 2019 | | 2018 | | 2017 |
| | | | | | | | | | | | | | | | |
| Interest expense | | $ | 7,749 | | | $ | 8,335 | | | $ | 6,393 | | | $ | 25,957 |
| | $ | 25,349 |
| | $ | 19,716 |
|
| Capitalized interest | | | (362 | ) | | | (668 | ) | | | (653 | ) | | (274 | ) | | (150 | ) | | (214 | ) |
| | | | | | | | | | | | | | | | | | | |
| | | $ | 7,387 | | | $ | 7,667 | | | $ | 5,740 | | | $ | 25,683 |
| | $ | 25,199 |
| | $ | 19,502 |
|
Interest paid in 2016, 2015,2019, 2018, and 20142017 was $7.1$25.4 million, $8.1$25.2 million, and $5.7$13.8 million, respectively.
Note 1213 – Benefit Plans
Pension and Other Postretirement Plans
The Company sponsors several qualified and nonqualified pension plans and other postretirement benefit plans for certain employees. The following tables provide a reconciliation of the changes in the plans'plans’ benefit obligations and the fair value of the plans'plans’ assets for 20162019 and 2015,2018, and a statement of the plans'plans’ aggregate funded status:
|
| | | | | | | | | | | | | | | | |
| | | Pension Benefits | | Other Benefits |
| (In thousands) | | 2019 | | 2018 | | 2019 | | 2018 |
| | | | | | | | | |
| Change in benefit obligation: | | | | | | | | |
| Obligation at beginning of year | | $ | 166,739 |
| | $ | 186,766 |
| | $ | 14,382 |
| | $ | 16,407 |
|
| Service cost | | — |
| | 88 |
| | 260 |
| | 235 |
|
| Interest cost | | 5,972 |
| | 5,745 |
| | 609 |
| | 447 |
|
| Actuarial loss (gain) | | 17,061 |
| | (10,637 | ) | | (1,860 | ) | | (1,185 | ) |
| Benefit payments | | (9,883 | ) | | (10,368 | ) | | (832 | ) | | (892 | ) |
| Settlement charge | | — |
| | — |
| | (198 | ) | | (171 | ) |
| Foreign currency translation adjustment | | 2,275 |
| | (4,855 | ) | | 292 |
| | (459 | ) |
| | | | | | | | | |
| Obligation at end of year | | 182,164 |
| | 166,739 |
| | 12,653 |
| | 14,382 |
|
| | | | | | | | | |
| Change in fair value of plan assets: | | |
| | |
| | |
| | |
|
| Fair value of plan assets at beginning of year | | 164,603 |
| | 186,336 |
| | — |
| | — |
|
| Actual return on plan assets | | 26,734 |
| | (8,282 | ) | | — |
| | — |
|
| Employer contributions | | — |
| | 999 |
| | 832 |
| | 892 |
|
| Benefit payments | | (9,883 | ) | | (10,368 | ) | | (832 | ) | | (892 | ) |
| Foreign currency translation adjustment | | 2,032 |
| | (4,082 | ) | | — |
| | — |
|
| | | | | | | | | |
| Fair value of plan assets at end of year | | 183,486 |
| | 164,603 |
| | — |
| | — |
|
| | | | | | | | | |
| Funded (underfunded) status at end of year | | $ | 1,322 |
| | $ | (2,136 | ) | | $ | (12,653 | ) | | $ | (14,382 | ) |
| | | Pension Benefits | | | Other Benefits | |
| (In thousands) | | 2016 | | | 2015 | | | 2016 | | | 2015 | |
| Change in benefit obligation: | | | | | | | | | | | | |
| Obligation at beginning of year | | $ | 192,761 | | | $ | 207,738 | | | $ | 15,843 | | | $ | 19,307 | |
| Service cost | | | 532 | | | | 803 | | | | 232 | | | | 363 | |
| Interest cost | | | 7,553 | | | | 8,032 | | | | 594 | | | | 1,005 | |
| Actuarial loss (gain) | | | 9,399 | | | | (9,163 | ) | | | (249 | ) | | | 270 | |
| Plan amendments | | | — | | | | — | | | | 43 | | | | (9,094 | ) |
| Business acquisitions | | | — | | | | — | | | | — | | | | 5,655 | |
| Benefit payments | | | (17,572 | ) | | | (10,795 | ) | | | (1,023 | ) | | | (1,037 | ) |
| Foreign currency translation adjustment | | | (13,937 | ) | | | (3,854 | ) | | | (166 | ) | | | (626 | ) |
| | | | | | | | | | | | | | | | | |
| Obligation at end of year | | | 178,736 | | | | 192,761 | | | | 15,274 | | | | 15,843 | |
| | | | | | | | | | | | | | | | | |
| Change in fair value of plan assets: | | | | | | | | | | | | | | | | |
| Fair value of plan assets at beginning of year | | | 176,077 | | | | 190,016 | | | | — | | | | — | |
| Actual return on plan assets | | | 19,319 | | | | (1,682 | ) | | | — | | | | — | |
| Employer contributions | | | 2,377 | | | | 1,513 | | | | 1,023 | | | | 1,037 | |
| Benefit payments | | | (17,572 | ) | | | (10,795 | ) | | | (1,023 | ) | | | (1,037 | ) |
| Foreign currency translation adjustment | | | (11,061 | ) | | | (2,975 | ) | | | — | | | | — | |
| | | | | | | | | | | | | | | | | |
| Fair value of plan assets at end of year | | | 169,140 | | | | 176,077 | | | | — | | | | — | |
| | | | | | | | | | | | | | | | | |
| Underfunded status at end of year | | $ | (9,596 | ) | | $ | (16,684 | ) | | $ | (15,274 | ) | | $ | (15,843 | ) |
| | | | | | | | | | | | | | | | | |
During 2016, the Company offered a lump sum window to certain inactive participants in one of its pension plans, resulting in incremental benefit payments of $7.0 million and a settlement charge of $1.2 million.
During 2015, the Company amended one of its postretirement benefit plans to remove certain benefits, resulting in a $9.1 million reduction in the obligation.
The following represents amounts recognized in AOCI (before the effect of income taxes):
| | | | | Pension Benefits | | | Other Benefits | | | Pension Benefits | | Other Benefits |
| (In thousands) | | 2016 | | | 2015 | | | 2016 | | | 2015 | | | 2019 | | 2018 | | 2019 | | 2018 |
| | | | | | | | | | | | | | | | | | | | | |
| Unrecognized net actuarial loss | | $ | 39,986 | | | $ | 48,681 | | | $ | 614 | | | $ | 767 | | | $ | 36,195 |
| | $ | 39,101 |
| | $ | (1,609 | ) | | $ | 170 |
|
| Unrecognized prior service credit | | | — | | | | — | | | | (8,180 | ) | | | (9,087 | ) | | — |
| | — |
| | (5,485 | ) | | (6,387 | ) |
| | | | | | | | | | | | | | | | | | |
The Company sponsors one pension plan in the U.K. which comprised 4243 and 4145 percent of the above benefit obligation at December 31, 201628, 2019 and December 26, 2015,29, 2018, respectively, and 3639 and 3537 percent of the above plan assets at December 31, 201628, 2019 and December 26, 2015,29, 2018, respectively.
As of December 31, 2016, $2.228, 2019, $1.6 million of the actuarial net loss and $0.9 million of the prior service credit will, through amortization, be recognized as components of net periodic benefit cost in 2017.2020.
The aggregate status of all overfunded plans is recognized as an asset and the aggregate status of all underfunded plans is recognized as a liability in the Consolidated Balance Sheets. The amounts recognized as a liability are classified as current or long-term on a plan-by-plan basis. Liabilities are classified as current to the extent the actuarial present value of benefits payable within the next 12 months exceeds the fair value of plan assets, with all remaining amounts classified as long-term.
As of December 31, 201628, 2019 and December 26, 2015,29, 2018, the total funded status of the plans recognized in the Consolidated Balance Sheets was as follows:
| | | | | Pension Benefits | | | Other Benefits | | | Pension Benefits | | Other Benefits |
| (In thousands) | | 2016 | | | 2015 | | | 2016 | | | 2015 | | | 2019 | | 2018 | | 2019 | | 2018 |
| | | | | | | | | | | | | | | | | | | | | |
| Long-term asset | | $ | 4,442 | | | $ | 765 | | | $ | — | | | $ | — | | | $ | 8,592 |
| | $ | 10,580 |
| | $ | — |
| | $ | — |
|
| Current liability | | | — | | | | — | | | | (1,128 | ) | | | (1,221 | ) | | — |
| | — |
| | (1,013 | ) | | (1,080 | ) |
| Long-term liability | | | (14,038 | ) | | | (17,449 | ) | | | (14,146 | ) | | | (14,622 | ) | | (7,270 | ) | | (12,716 | ) | | (11,640 | ) | | (13,302 | ) |
| | | | | | | | | | | | | | | | | | | | | | | | | |
| Total underfunded status | | $ | (9,596 | ) | | $ | (16,684 | ) | | $ | (15,274 | ) | | $ | (15,843 | ) | |
| | | | | | | | | | | | | | | | | | |
| Total funded (underfunded) status | | | $ | 1,322 |
| | $ | (2,136 | ) | | $ | (12,653 | ) | | $ | (14,382 | ) |
The components of net periodic benefit cost (income) are as follows:
|
| | | | | | | | | | | | |
| (In thousands) | | 2019 | | 2018 | | 2017 |
| Pension benefits: | | | | | | |
| Service cost | | $ | — |
| | $ | 88 |
| | $ | 128 |
|
| Interest cost | | 5,972 |
| | 5,745 |
| | 6,344 |
|
| Expected return on plan assets | | (8,103 | ) | | (9,522 | ) | | (9,374 | ) |
| Amortization of net loss | | 1,950 |
| | 1,151 |
| | 2,206 |
|
| | | | | | | |
| Net periodic benefit income | | $ | (181 | ) | | $ | (2,538 | ) | | $ | (696 | ) |
| | | | | | | |
| Other benefits: | | |
| | |
| | |
|
| Service cost | | $ | 260 |
| | $ | 235 |
| | $ | 235 |
|
| Interest cost | | 609 |
| | 447 |
| | 599 |
|
| Amortization of prior service credit | | (902 | ) | | (902 | ) | | (901 | ) |
| Amortization of net (gain) loss | | (88 | ) | | 92 |
| | (42 | ) |
| Settlement charge | | (2 | ) | | 38 |
| | 17 |
|
| | | | | | | |
| Net periodic benefit income | | $ | (123 | ) | | $ | (90 | ) | | $ | (92 | ) |
| (In thousands) | | 2016 | | | 2015 | | | 2014 | |
| Pension benefits: | | | | | | | | | |
| Service cost | | $ | 532 | | | $ | 803 | | | $ | 973 | |
| Interest cost | | | 7,553 | | | | 8,032 | | | | 8,590 | |
| Expected return on plan assets | | | (9,615 | ) | | | (10,289 | ) | | | (13,669 | ) |
| Amortization of prior service cost | | | — | | | | — | | | | 1 | |
| Amortization of net loss | | | 2,898 | | | | 2,710 | | | | 752 | |
| Settlement charge | | | 1,214 | | | | — | | | | — | |
| | | | | | | | | | | | | |
| Net periodic benefit cost (income) | | $ | 2,582 | | | $ | 1,256 | | | $ | (3,353 | ) |
| | | | | | | | | | | | | |
| Other benefits: | | | | | | | | | | | | |
| Service cost | | $ | 232 | | | $ | 363 | | | $ | 348 | |
| Interest cost | | | 594 | | | | 1,005 | | | | 685 | |
| Amortization of prior service (credit) cost | | | (896 | ) | | | 6 | | | | 6 | |
| Amortization of net gain | | | (60 | ) | | | (28 | ) | | | (218 | ) |
| | | | | | | | | | | | | |
| Net periodic benefit (income) cost | | $ | (130 | ) | | $ | 1,346 | | | $ | 821 | |
| | | | | | | | | | | | | |
The components of net periodic benefit cost (income) other than the service cost component are included in other income, net in the Consolidated Statements of Income.
The weighted average assumptions used in the measurement of the Company'sCompany’s benefit obligations are as follows:
| | | Pension Benefits | | | Other Benefits | |
| | | 2016 | | | 2015 | | | 2016 | | | 2015 | |
| | | | | | | | | | | | | |
| Discount rate | | 3.61 | % | | 4.02 | % | | 4.21 | % | | 4.25 | % |
| Expected long-term return on plan assets | | 5.56 | % | | 5.59 | % | | N/A | | | N/A | |
| Rate of compensation increases | | N/A | | | N/A | | | 5.00 | % | | 5.00 | % |
| Rate of inflation | | 3.30 | % | | 3.20 | % | | N/A | | | N/A | |
TABLE OF CONTENTS |
| | | | | | | | | | | | |
| | | Pension Benefits | | Other Benefits |
| | | 2019 | | 2018 | | 2019 | | 2018 |
| | | | | | | | | |
| Discount rate | | 1.93 | % | | 3.72 | % | | 3.70 | % | | 4.56 | % |
| Expected long-term return on plan assets | | 3.84 | % | | 5.05 | % | | N/A |
| | N/A |
|
| Rate of compensation increases | | N/A |
| | N/A |
| | 5.00 | % | | 5.00 | % |
| Rate of inflation | | 3.20 | % | | 3.40 | % | | N/A |
| | N/A |
|
The weighted average assumptions used in the measurement of the Company'sCompany’s net periodic benefit cost are as follows:
| | | | | Pension Benefits | | | Other Benefits | | | Pension Benefits | | Other Benefits |
| | | 2016 | | | 2015 | | | 2014 | | | 2016 | | | 2015 | | | 2014 | | | 2019 | | 2018 | | 2017 | | 2019 | | 2018 | | 2017 |
| | | | | | | | | | | | | | | | | | | | | | | | | | | | | | | |
| Discount rate | | 4.02 | % | | 4.03 | % | | 4.82 | % | | 4.25 | % | | 4.33 | % | | 4.89 | % | | 3.72 | % | | 3.22 | % | | 3.61 | % | | 4.56 | % | | 3.89 | % | | 4.21 | % |
| Expected long-term return on plan assets | | 5.59 | % | | 5.58 | % | | 7.40 | % | | N/A | | | N/A | | | N/A | | | 5.05 | % | | 5.27 | % | | 5.56 | % | | N/A |
| | N/A |
| | N/A |
|
| Rate of compensation increases | | N/A | | | N/A | | | N/A | | | 5.00 | % | | 5.00 | % | | 5.50 | % | | N/A |
| | N/A |
| | N/A |
| | 5.00 | % | | 5.00 | % | | 5.00 | % |
| Rate of inflation | | 3.20 | % | | 3.10 | % | | 3.40 | % | | N/A | | | N/A | | | N/A | | | 3.40 | % | | 3.30 | % | | 3.30 | % | | N/A |
| | N/A |
| | N/A |
|
The Company'sCompany’s Mexican postretirement plans use the rate of compensation increase in the benefit formulas. Past service in the U.K. pension plan will be adjusted for the effects of inflation. All other pension and postretirement plans use benefit formulas based on length of service.
The annual assumed rate of increase in the per capita cost of covered benefits (i.e., health care cost trend rate) is assumed to range from 6.84.0 to 8.37.0 percent for 2017,2020, gradually decrease to 3.04.1 percent through 2036,2040, and remain at that level thereafter. The health care cost trend rate assumption does not have a significant effect on the amounts reported.
Pension Assets
The weighted average asset allocation of the Company'sCompany’s pension fund assets are as follows:
|
| | | | | | |
| | | Pension Plan Assets |
| Asset category | | 2019 | | 2018 |
| | | | | |
| Fixed income securities (includes fixed income mutual funds) | | 55 | % | | 54 | % |
| Equity securities (includes equity mutual funds) | | 25 |
| | 35 |
|
| Multi-asset securities | | 9 |
| | — |
|
| Cash and equivalents (includes money market funds) | | 7 |
| | 8 |
|
| Alternative investments | | 4 |
| | 3 |
|
| | | | | |
| Total | | 100 | % | | 100 | % |
| | | Pension Plan Assets | |
| Asset category | | 2016 | | | 2015 | |
| | | | | | | |
| Equity securities (includes equity mutual funds) | | 47 | % | | 51 | % |
| Fixed income securities (includes fixed income mutual funds) | | 48 | | | 37 | |
| Cash and equivalents (includes money market funds) | | 3 | | | 9 | |
| Alternative investments | | 2 | | | 3 | |
| | | | | | | |
| Total | | 100 | % | | 100 | % |
At December 31, 2016,28, 2019, the long-term target allocation, by asset category, of assets of the Company'sCompany’s defined benefit pension plans was: (i) fixed income securities – at least 60 percent; (ii) equity securities, including equity index funds – not more than 30 percent; and (iii) alternative investments – not more than 5 percent.
The pension plan obligations are long-term and, accordingly, the plan assets are invested for the long-term. Plan assets are monitored periodically. Based upon results, investment managers and/or asset classes are redeployed when considered necessary. None of the plans'plans’ assets are expected to be returned to the Company during the next fiscal year. The assets of the plans do not include investments in securities issued by the Company.
The estimated rates of return on plan assets are the expected future long-term rates of earnings on plan assets and are forward-looking assumptions that materially affect pension cost. Establishing the expected future rates of return on pension assets is a judgmental matter. The Company reviews the expected long-term rates of return on an annual basis and revises as appropriate. The expected long-term rate of return on plan assets was 5.563.84 percent for 20162019 and 5.595.05 percent in 2015.2018.
The Company'sCompany’s investments for its pension plans are reported at fair value. The following methods and assumptions were used to estimate the fair value of the Company'sCompany’s plan asset investments:
Cash and money market funds –Valued at cost, which approximates fair value.
Common stock – Valued at the closing price reported on the active market on which the individual securities are traded.
Mutual funds – Valued at the net asset value of shares held by the plans at December 31, 201628, 2019 and December 26, 2015,29, 2018, respectively, based upon quoted market prices.
Limited partnerships –Limited partnerships include investments in various Cayman Island multi-strategy hedge funds. The plans'plans’ investments in limited partnerships are valued at the estimated fair value of the class shares owned by the plans based upon the equity in the estimated fair value of those shares. The estimated fair values of the limited partnerships are determined by the investment managers. In determining fair value, the investment managers of the limited partnerships utilize the estimated net asset valuations of the underlying investment entities. The underlying investment entities value securities and other financial instruments on a mark-to-market or estimated fair value basis. The estimated fair value is determined by the investment managers based upon, among other things, the type of investments, purchase price, marketability, current financial condition, operating results, and other information. The estimated fair values of substantially all of the investments of the underlying investment entities, which may include securities for which prices are not readily available, are determined by the investment managers or management of the respective underlying investment entities and may not reflect amounts that could be realized upon immediate sale. Accordingly, the estimated fair values may differ significantly from the values that would have been used had a ready market existed for these investments.
The following table sets forth by level, within the fair value hierarchy, the assets of the plans at fair value:
| | Fair Value Measurements at December 31, 2016 | |
| (In thousands) | Level 1 | | Level 2 | | Level 3 | | Total | |
| | | | | | | | | |
| Cash and money market funds | | | $ | 4,245 | | | | $ | — | | | | $ | — | | | | $ | 4,245 | |
Common stock (1) | | | | 18,601 | | | | | — | | | | | — | | | | | 18,601 | |
Mutual funds (2) | | | | 5,572 | | | | | 136,027 | | | | | — | | | | | 141,599 | |
| Limited partnerships | | | | — | | | | | — | | | | | 4,695 | | | | | 4,695 | |
| | | | | | | | | | | | | | | | | | | | | |
| Total | | | $ | 28,418 | | | | $ | 136,027 | | | | $ | 4,695 | | | | $ | 169,140 | |
| | | | | | | | | | | | | | | | | | | | | |
|
| | | | | | | | | | | | | | | | |
| | | Fair Value Measurements at December 28, 2019 |
(In thousands) | | Level 1 | | Level 2 | | Level 3 | | Total |
| | | | | | | | | |
| Cash and money market funds | | $ | 12,318 |
| | $ | — |
| | $ | — |
| | $ | 12,318 |
|
Mutual funds (1) | | — |
| | 163,253 |
| | — |
| | 163,253 |
|
| Limited partnerships | | — |
| | — |
| | 7,915 |
| | 7,915 |
|
| | | | | | | | | |
| Total | | $ | 12,318 |
| | $ | 163,253 |
| | $ | 7,915 |
| | $ | 183,486 |
|
| | Fair Value Measurements at December 26, 2015 | |
| (In thousands) | Level 1 | | Level 2 | | Level 3 | | Total | |
| | | | | | | | | | | | | | | | | | | | | |
| Cash and money market funds | | | $ | 16,632 | | | | $ | — | | | | $ | — | | | | $ | 16,632 | |
Common stock (3) | | | | 25,229 | | | | | — | | | | | — | | | | | 25,229 | |
Mutual funds (4) | | | | 9,666 | | | | | 119,960 | | | | | — | | | | | 129,626 | |
| Limited partnerships | | | | — | | | | | — | | | | | 4,590 | | | | | 4,590 | |
| | | | | | | | | | | | | | | | | | | | | |
| Total | | | $ | 51,527 | | | | $ | 119,960 | | | | $ | 4,590 | | | | $ | 176,077 | |
|
| | | | | | | | | | | | | | | | |
| | | Fair Value Measurements at December 29, 2018 |
(In thousands) | | Level 1 | | Level 2 | | Level 3 | | Total |
| | | | | | | | | |
| Cash and money market funds | | $ | 12,984 |
| | $ | — |
| | $ | — |
| | $ | 12,984 |
|
Mutual funds (2) | | — |
| | 146,591 |
| | — |
| | 146,591 |
|
| Limited partnerships | | — |
| | — |
| | 5,028 |
| | 5,028 |
|
| | | | | | | | | |
| Total | | $ | 12,984 |
| | $ | 146,591 |
| | $ | 5,028 |
| | $ | 164,603 |
|
| |
(1) | Approximately 90 percent of common stock represents investments in U.S. companies primarily in the health care, utilities, financials, consumer staples, industrials, and information technology sectors. All investments in common stock are listed on U.S. stock exchanges. | |
| | |
(2) | Approximately 6880 percent of mutual funds are actively managed funds and approximately 3220 percent of mutual funds are index funds. Additionally, five10 percent of the mutual funds'funds’ assets are invested in U.S. equities, 38non-U.S. multi-asset securities, 28 percent in non-U.S. equities, 54and 62 percent in U.S. fixed income securities, and three percent in non-U.S. fixed income securities. |
| |
| | |
(3)(2) | Approximately 89 percent of common stock represents investments in U.S. companies primarily in the health care, utilities, financials, consumer staples, industrials, and information technology sectors. All investments in common stock are listed on U.S. stock exchanges. | |
| | |
(4) | Approximately 6761 percent of mutual funds are actively managed funds and approximately 3339 percent of mutual funds are index funds. Additionally, 125 percent of the mutual funds'funds’ assets are invested in U.S. equities, 3835 percent in non-U.S. equities, 4659 percent in U.S. fixed income securities, and 41 percent in non-U.S. fixed income securities. | |
The table below reflects the changes in the assets of the plan measured at fair value on a recurring basis using significant unobservable inputs (level 3 of fair value hierarchy) during the year ended December 31, 2016:28, 2019:
| | | (In thousands) | | Limited Partnerships | | | Limited Partnerships |
| | | | | | |
| Balance, December 26, 2015 | | $ | 4,590 | | |
| Balance, December 29, 2018 | | | $ | 5,028 |
|
| Redemptions | | | (196 | ) | | (3,825 | ) |
| Subscriptions | | | 196 | | | 6,846 |
|
| Net appreciation in fair value | | | 105 | | | (134 | ) |
| | | | | | | |
|
| Balance, December 31, 2016 | | $ | 4,695 | | |
| | | | | | |
| Balance, December 28, 2019 | | | $ | 7,915 |
|
Contributions and Benefit Payments
The Company expectsdoes not expect to contribute approximately $0.9 million to its pension plans, other than to reimburse expenses, and $1.2expects to contribute $1.0 million to its other postretirement benefit plans in 2017.2020. In November 2019, the Company’s Board of Directors approved the termination of the Mueller Pension Plan effective January 2020. The termination is expected to be complete by the end of 2020. The Company expects future benefits to be paid from the plans as follows:
| | | (In thousands) | (In thousands) | | | Pension Benefits | | | Other Benefits | | | Pension Benefits | | Other Benefits |
| | | | | | | | | | | | | |
| 2017 | | | $ | 10,496 | | | $ | 1,179 | | |
| 2018 | | | | 10,491 | | | | 1,100 | | |
| 2019 | | | | 10,496 | | | | 1,052 | | |
| 2020 | 2020 | | | | 10,431 | | | | 1,294 | | | $ | 107,864 |
| | $ | 1,014 |
|
| 2021 | 2021 | | | | 10,388 | | | | 1,102 | | | 2,815 |
| | 959 |
|
| 2022-2026 | | | | | 51,211 | | | | 5,902 | | |
| 2022 | | | 2,905 |
| | 953 |
|
| 2023 | | | 2,998 |
| | 1,053 |
|
| 2024 | | | 3,094 |
| | 1,062 |
|
| 2025-2029 | | | 17,020 |
| | 4,944 |
|
| | | | | | | | | | | | | | | |
| Total | Total | | | $ | 103,513 | | | $ | 11,629 | | | $ | 136,696 |
| | $ | 9,985 |
|
| | | | | | | | | | | | |
Multiemployer Plan
The Company contributes to the IAM National Pension Fund, National Pension Plan (IAM Plan), a multiemployer defined benefit plan. Participation in the IAM Plan was negotiated under the terms of two2 collective bargaining agreements in Port Huron, Michigan, the Local 218 IAM and Local 44 UAW that expire on May 5, 20197, 2023 and July 21, 2019,June 26, 2022, respectively. The Employer Identification Number for this plan is 51-6031295.
The risks of participating in multiemployer plans are different from single-employer plans in the following aspects: (i) assets contributed to the multiemployer plan by one employer may be used to provide benefits to employees of other participating employers; (ii) if a participating employer stops contributing to the plan, the underfunded obligations of the plan may be borne by the remaining participating employers; (iii) if the Company chooses to stop participating in the plan, the Company may be required to pay the plan an amount based on the underfunded status of the plan, referred to as a withdrawal liability.
The Company makes contributions to the IAM Plan trusts that cover certain union employees; contributions by employees are not permitted. Contributions to the IAM Plan were approximately $1.2 million in 2019, $1.3 million in 2018, and $1.1 million in 2016, $1.1 million in 2015, and $1.0 million in 2014.2017. The Company'sCompany’s contributions are less than five5 percent of total employer contributions made to the IAM Plan indicated in the most recently filed Form 5500.
Under the Pension Protection Act of 2006, the IAM Plan'sPlan’s actuary must certify the plan'splan’s zone status annually. Plans in the red zone are generally less than 65 percent funded, plans in the yellow zone are less than 80 percent funded, and plans in the green zone are at least 80 percent funded. If a plan is determined to be in endangered status, red zone or yellow zone, the plan'splan’s trustees must develop a formal plan of corrective action, a Financial Improvement Plan and/or a Rehabilitation Plan. While the IAM Plan remains well-funded at 89 percent, for 2019, it has been certified in the yellow zone due to a declining credit balance. However, as a result of a challenging investment environment and the decline of the IAM Plan’s credit balance, the IAM National Pension Plan Board of Trustees has voluntarily elected to place the IAM Plan in the red zone for 2019. The action was taken to protect the IAM Plan’s participants’ core retirement benefits and strengthen the IAM Plan’s financial health over the long term. For 2016 and 20152018, the IAM Plan was determined to have green zone status; therefore, no formal plan of corrective action is either pending or has been implemented.status.
401(k) Plans
The Company sponsors voluntary employee savings plans that qualify under Section 401(k) of the Internal Revenue Code of 1986. Compensation expense for the Company'sCompany’s matching contribution to the 401(k) plans was $5.2$5.4 million in 2016, $4.22019, $5.1 million in 2015,2018, and $4.1$5.1 million in 2014.2017. The Company match is a cash contribution. Participants direct the investment of their account balances by allocating among a range of asset classes including mutual funds (equity, fixed income, and balanced funds) and money market funds. The plans do not allow direct investment in securities issued by the Company.
UMWA Benefit Plans
In October 1992, the Coal Industry Retiree Health Benefit Act of 1992 (1992 Act) was enacted. The 1992 Act mandates a method of providing for postretirement benefits to the United Mine Workers of America (UMWA) current and retired employees, including some retirees who were never employed by the Company. In October 1993, beneficiaries were assigned to the Company and the Company began its mandated contributions to the UMWA Combined Benefit Fund, a multiemployer trust. Beginning in 1994, the Company was required to make contributions for assigned beneficiaries under an additional multiemployer trust created by the 1992 Act, the UMWA 1992 Benefit Plan. The ultimate amount of the Company'sCompany’s liability under the 1992 Act will vary due to factors which include, among other things, the validity, interpretation, and regulation of the 1992 Act, its joint and several obligation, the number of valid beneficiaries assigned, and the extent to which funding for this obligation will be satisfied by transfers of excess assets from the 1950 UMWA pension plan and transfers from the Abandoned Mine Reclamation Fund. Contributions to the plan were $197$223 thousand, $214$153 thousand, and $249$182 thousand for the years ended 2016, 2015,2019, 2018, and 2014,2017, respectively.
Note 1314 – Commitments and Contingencies
Environmental
The Company is subject to federal, state, local, and foreign environmental laws and regulations. For all properties, the Company has provided and charged to expense $0.9$1.7 million in 2016, $0.12019, $2.0 million in 2015,2018, and $1.2$7.5 million in 20142017 for pending environmental matters. Environmental reserves totaled $21.9$20.9 million at December 31, 201628, 2019 and $21.7$23.6 million at December 26, 2015.29, 2018. As of December 31, 2016,28, 2019, the Company expects to spend $0.7 million in 2017, $0.6 million in 2018, $0.6 million in 2019, $0.7$0.8 million in 2020, $0.7 million in 2021, $0.6 million in 2022, $0.8 million in 2023, $0.7 million in 2024, and $18.6$17.3 million thereafter for ongoing projects.
Non-operating Properties
Southeast Kansas Sites
The Kansas Department of Health and Environment (KDHE) has contacted the Company regarding environmental contamination at three3 former smelter sites in Kansas (Altoona, East La Harpe, and Lanyon). The Company is not a successor to the companies that operated these smelter sites, but is exploring possible settlement with KDHE and other potentially responsible parties (PRP) in order to avoid litigation.
Altoona. Another PRP conducted a site investigation of the Altoona site under a consent decree with KDHE and submitted a removal site evaluation report recommending a remedy. The remedial design plan, which covers both on-site and certain off-site cleanup costs, was approved by the KDHE in 2016. Construction of the remedy was completed in 2018.
East La Harpe.At the East La Harpe site, the Company and two2 other PRPs conducted a site study evaluation under KDHE supervision and prepared a site cleanup plan approved by KDHE. In 2016, the corporate parent (Peabody Energy) of a third party that the Company understands may owe indemnification obligations to one of the other PRPs (Blue Tee) in connection with the East La Harpe site filed for protection under Chapter 11 of the U.S. Bankruptcy Code. KDHE has extended the deadline for the PRPs to develop a repository design plan to allow for wetlands permitting to take place. In December 2018, KDHE provided a draft agreement which contemplates the use of funds KDHE obtained from two other parties (Peabody Energy and Blue Tee) to fund part of the remediation, and removes Blue Tee from the PRPs’ agreement with KDHE. The Company is currently negotiating the terms of the draft agreement.
Lanyon.With respect to the Lanyon Site, in 2016, the Company received a general notice letter from the United States Environmental Protection Agency (EPA) asserting that the Company is a PRP, which the Company has denied. EPA issued an interim record of decision in 2017 and has been remediating properties at the site.
The Company'sCompany’s reserve for its proportionate share of the remediation costs associated with thethese 3 Southeast Kansas sites is $5.6 million. EPA issued an interim record of decision in 2017 and has been remediating properties at the site.
Mining Remedial Recovery Company (MRRC), a wholly owned subsidiary, owns certain inactive mines in Shasta County, California. MRRC has continued a program, begun in the late 1980s, of implementing various remedial measures, including sealing mine portals with concrete plugs in portals whichthat were discharging water. The sealing program achieved significant reductions in the metal load in discharges from these adits; however, additional reductions are required pursuant to an order issued by the California Regional Water Quality Control Board (QCB). In response to a 1996 QCB Order, MRRC completed a feasibility study in 1997 describing measures designed to mitigate the effects of acid rock drainage. In December 1998, the QCB modified the 1996 order extending MRRC'sMRRC’s time to comply with water quality standards. In September 2002, the QCB adopted a new order requiring MRRC to adopt Best Management Practices (BMP) to control discharges of acid mine drainage, and again extended the time to comply with water quality standards until September 2007. During that time, implementation of BMP further reduced impacts of acid rock drainage; however, full compliance has not been achieved. The QCB is presently renewing MRRC'sMRRC’s discharge permit and will concurrently issue a new order. It is expected that the new ten-year10-year permit will include an order requiring continued implementation of BMP through 20252030 to address residual discharges of acid rock drainage. At this site, MRRC spent approximately $1.2$1.9 million from 20142017 through 20162019 for remediation, and currently estimates that it will spend between approximately $13.2$12.7 million and $20.9$17.7 million over the next 30 years.
Lead Refinery Site
U.S.S. Lead Refinery, Inc. (Lead Refinery), a non-operating wholly owned subsidiary of MRRC, has conducted corrective action and interim remedial activities (collectively, Site Activities) at Lead Refinery'sRefinery’s East Chicago, Indiana site pursuant to the Resource Conservation and Recovery Act since December 1996. Although the Site Activities have been substantially concluded, Lead Refinery is required to perform monitoring and maintenance-related activities pursuant to a post-closure permit issued by the Indiana Department of Environmental Management effective as of March 2, 2013. Lead Refinery spent approximately $0.5$0.7 million from 20142017 through 20162019 with respect to this site. Approximate costs to comply with the post-closure permit, including associated general and administrative costs, are estimated at between $2.1$1.8 million and $4.7$2.3 million over the next 2017 years.
On April 9, 2009, pursuant to the Comprehensive Environmental Response, Compensation, and Liability Act (CERCLA), the U.S. Environmental Protection Agency (EPA) added the Lead Refinery site and surrounding properties to the National Priorities List (NPL). On July 17, 2009, Lead Refinery received a written notice from the EPA indicating that it may be a PRP under CERCLA due to the release or threat of release of hazardous substances including lead into properties surrounding the Lead Refinery NPL site. The EPA identified two other PRPs in connection with that matter. In November 2012, the EPA adopted a remedy for the surrounding properties and in September 2014, the EPA announced that it had entered into a settlement with the two other PRPs whereby they will pay approximately $26.0 million to fund the cleanup of approximately 300 properties surrounding the Lead Refinery NPL site (zones 1 and 3 of operable unit 1) and perform certain remedial action tasks.
On November 8, 2016, the Company, its subsidiary Arava Natural Resources Company, Inc. (Arava), and Arava'sArava’s subsidiary MRRC each received general notice letters from the EPA asserting that they may be PRPs in connection with the Lead Refinery NPL site. The Company, Arava, and MRRC have denied liability for any remedial action and response costs associated with the Lead Refinery NPL site. In June 2017, the EPA requested that Lead Refinery conduct, and the Company fund, a remedial investigation and feasibility study of operable unit 2 of the Lead Refinery NPL site pursuant to a proposed administrative settlement agreement and order on consent. The Company and Lead Refinery entered into that agreement in September 2017. The Company
has made a capital contribution to Lead Refinery to conduct the remedial investigation and feasibility study with respect to operable unit 2 and has provided financial assurance in the amount of $1.0 million. The EPA has also asserted its position that Mueller is a responsible party for the Lead Refinery NPL site, and accordingly is responsible for a share of remedial action and response costs at the site and in the adjacent residential area.
In January 2018, the EPA issued 2 unilateral administrative orders (UAOs) directing the Company, Lead Refinery, and four other PRPs to conduct soil and interior remediation of certain residences at the Lead Refinery NPL site (zones 2 and 3 of operable unit 1). The Company and Lead Refinery have reached agreement with the four other PRPs to implement these two UAOs, with the Company agreeing to pay, on an interim basis, (i) an estimated $4.5 million (subject to potential change through a future reallocation process) of the approximately $25.0 million the PRPs currently estimate it will cost to implement the UAOs, which estimate is subject to change, and (ii) $2.0 million relating to past costs incurred by other PRPs for work conducted at the site, as well as the possibility of up to $0.7 million in further payments for ongoing work by those PRPs, $0.4 million of which has been incurred by those PRPs and paid for by the Company to date. As of year-end, the Company has made payments of approximately $7.0 million related to the aforementioned agreement with the other PRPs. The Company disputes that it was properly named in the UAOs, and has reserved its rights to petition the EPA for reimbursement of any costs incurred to comply with the UAOs upon the completion of the work required therein. In October 2017, a group of private plaintiffs sued the Company, Arava, MRRC, and Lead Refinery, along with other defendants, in a private tort action relating to the site; the Company, Arava, and MRRC were voluntarily dismissed from that litigation without prejudice in March 2018. A second civil action asserting similar claims was filed against the Company, Arava, MRRC, and Lead Refinery in September 2018. At this juncture, the Company is unable to determine the likelihood of a material adverse outcome or the amount or range of a potential loss in excess of the current reserve with respect to any remedial action or litigation relating to the Lead Refinery NPL site, either at Lead Refinery’s former operating site (operable unit 2) or the adjacent residential area (operable unit 1), including, but not limited to, EPA oversight costs for which EPA may attempt to seek reimbursement from the Company, and past costs for which other PRPs may attempt to seek contribution from the Company.
Bonita Peak Mining District
Following an August 2015 spill from the Gold King Mine into the Animas River near Silverton, Colorado, the EPA listed the Bonita Peak Mining District on the NPL. Said listing was finalized in September 2016. The Bonita Peak Mining District encompasses 48 mining sites within the Animas River watershed, including the Sunnyside Mine, the American Tunnel, and the Sunbank Group. On or about July 25, 2017, Washington Mining Company (Washington Mining) (a wholly-owned subsidiary of the Company’s wholly-owned subsidiary, Arava), received a general notice letter from the EPA stating that Washington Mining may be a PRP under CERCLA in connection with the Bonita Peak Mining District site and therefore responsible for the remediation of certain portions of the site, along with related costs incurred by the EPA. Shortly thereafter, the Company received a substantively identical letter asserting that it may be a PRP at the site and similarly responsible for the cleanup of certain portions of the site. The general notice letters identify one other PRP at the site, and do not require specific action by Washington Mining or the Company at this time. At this juncture, the Company is unable to determine the likelihood of a materially adverse outcome or the amount or range of a potential loss with respect to any remedial action related to the Lead RefineryBonita Peak Mining District NPL site.
Operating Properties
Mueller Copper Tube Products, Inc.
In 1999, Mueller Copper Tube Products, Inc. (MCTP), a wholly owned subsidiary, commenced a cleanup and remediation of soil and groundwater at its Wynne, Arkansas plant to remove trichloroethylene, a cleaning solvent formerly used by MCTP. On August 30, 2000, MCTP received approval of its Final Comprehensive Investigation Report and Storm Water Drainage Investigation Report addressing the treatment of soils and groundwater from the Arkansas Department of Environmental Quality (ADEQ). The Company established a reserve for this project in connection with the acquisition of MCTP in 1998. Effective November 17, 2008, MCTP entered into a Settlement Agreement and Administrative Order by Consent to submit a Supplemental Investigation Work Plan (SIWP) and subsequent Final Remediation Work Plan (RWP) for the site. By letter dated January 20, 2010, ADEQ approved the SIWP as submitted, with changes acceptable to the Company. On December 16, 2011, MCTP entered into an amended Administrative Order by Consent to prepare and implement a revised RWP regarding final remediation for the Site. The remediation system was activated in February 2014. Costs to implement the work plans, including associated general and administrative costs, are estimated to approximate $0.9$0.6 million to $1.4$0.9 million over the next ninesix years.
United States Department of Commerce Antidumping Review
On December 24, 2008, the Department of Commerce (DOC) initiated an antidumping administrative review of the antidumping duty order covering circular welded non-alloy steel pipe and tube from Mexico for the November 1, 2007 through October 31,
2008 period of review. The DOC selected Mueller Comercial as a respondent in the review. On April 19, 2010, the DOC published the final results of the review and assigned Mueller Comercial an antidumping duty rate of 48.33 percent. On May 25, 2010, the Company appealed the final results to the U.S. Court of International Trade (CIT). On December 16, 2011, the CIT issued a decision remanding the Department'sDepartment’s final results. While the matter was still pending, the Company and the United States reached an agreement to settle the appeal. Subject to the conditions of the agreement, the Company anticipated that certain of its subsidiaries willwould incur antidumping duties on subject imports made during the period of review and, as such, established a reserve for this matter. After the lapse of the statutory period of time during which U.S. Customs and Border Protection (CBP) was required, but failed, to liquidate the entries at the settled rate, the Company released the reserve. Between October 30, 2015 and November 27, 2015, CBP sent a series of invoices to Southland Pipe Nipples Co., Inc. (Southland), requesting payment of approximately $3.0 million in duties and interest in connection with 795 import entries made during the November 1, 2007 through October 31, 2008 period. On January 26, 2016 and January 27, 2016, Southland filed protests with CBP in connection with these invoices, noting that CBP'sCBP’s asserted claims were not made in accordance with applicable law, including statutory provisions governing deemed liquidation. The Company believes in the merits of the legal objections raised in Southland'sSouthland’s protests, and CBP'sCBP’s response to Southland'sSouthland’s protests is currently pending. Given the procedural posture of and issuedissues raised by this legal dispute, the Company cannot estimate the amount of potential duty liability, if any, that may result from CBP'sCBP’s asserted claims.
Equal Employment Opportunity Commission Matter
On October 5, 2016, the Company received a demand letter from the Los Angeles District Office of the United States Equal Employment Opportunity Commission (EEOC). The EEOC allegesalleged that between May 2011 and April 2015, various Company employees were terminated in violation of the Americans with Disabilities Act (ADA), and that certain of the Company'sCompany’s employee leave and attendance policies were discriminatory in nature. On that basis,Thereafter, the EEOC's letter includes a demand for monetary relief on behalf an identified class of 20 individuals, and an unidentified class of 150 individuals, in addition to injunctive relief.
The Company, believes the EEOC's allegations are without merit. Notwithstanding the Company's position, in consultation with its liability insurers, the Company has entered into a conciliation processand mediation efforts with the EEOC for purposes of resolving the claims and avoiding litigation. In connection with that conciliation effort,claims. At the conclusion of those efforts, the Company has communicated toand the EEOC reached agreement on a consensual resolution of the EEOC’s claims, which includes both monetary settlement proposaland equitable relief.
On June 28, 2018, the EEOC filed a complaint against the Company on behalf of a group of unidentified claimants in the United States District Court for the Central District of California alleging that the Company engaged in unlawful employment practices in violation of the ADA. On July 13, 2018, the District Court approved a Consent Decree between the Company and the EEOC to resolve the EEOC’s claims. The Consent Decree, which is currently set to expire in January 2021, provided that the Company pay up to $1.0 million in monetary relief to fund individual claims for discrimination under the ADA as approved by the EEOC. That amount was fully within itsthe limits of the Company’s applicable insurance limits.coverage, and has been paid to claimants designated as eligible by the EEOC. The conciliation process is ongoing. Due to the procedural stage of this matter,Consent Decree also required the Company is unable to determinetake a series of proactive measures to cultivate a work environment free from unlawful discrimination. Those measures have included, among others, assistance with the likelihoodidentification of a material adverse outcomepotential claimants, employee, supervisory and managerial training regarding employee rights under the ADA, revised practices and procedures concerning reasonable workplace accommodations as required by the ADA, and related reporting and recordkeeping.
Guarantees
Guarantees, in this matter, or the amount or rangeform of a potential loss in excessletters of any availablecredit, are issued by the Company generally to assure the payment of insurance coverage.deductibles, certain retiree health benefits, and debt at certain unconsolidated affiliates. The terms of the guarantees are generally one year but are renewable annually as required. These letters are primarily backed by the Company’s revolving credit facility. The maximum payments that the Company could be required to make under its guarantees at December 28, 2019 were $11.9 million.
Leases
The Company leases certain facilities, vehicles, and equipment under operating leases expiring on various dates through 2028. The lease payments under these agreements aggregate to approximately $7.4 million in 2017, $5.7 million in 2018, $3.3 million in 2019, $2.7 million in 2020, $2.5 million in 2021, and $9.5 million thereafter. Total lease expense amounted to $11.6 million in 2016, $9.7 million in 2015, and $9.8 million in 2014.
Other
The Company is involved in certain litigation as a result of claims that arose in the ordinary course of business, which management believes will not have a material adverse effect on the Company'sCompany’s financial position, results of operations, or cash flows. It may also realize the benefit of certain legal claims and litigation in the future; these gain contingencies are not recognized in the Consolidated Financial Statements.
F-52
The components of income before income taxes were taxed under the following jurisdictions:
| | | (In thousands) | | 2016 | | | 2015 | | | 2014 | | | 2019 | | 2018 | | 2017 |
| | | | | | | | | | | | | | | | |
| Domestic | | $ | 103,576 | | | $ | 121,614 | | | $ | 135,445 | | | $ | 112,812 |
| | $ | 105,455 |
| | $ | 76,876 |
|
| Foreign | | | 42,454 | | | | 10,175 | | | | 12,568 | | | 53,271 |
| | 44,962 |
| | 50,096 |
|
| | | | | | | | | | | | | | | | | | | |
| Income before income taxes | | $ | 146,030 | | | $ | 131,789 | | | $ | 148,013 | | | $ | 166,083 |
| | $ | 150,417 |
| | $ | 126,972 |
|
| | | | | | | | | | | | | | |
Income tax expense consists of the following:
| | | (In thousands) | | 2016 | | | 2015 | | | 2014 | | | 2019 | | 2018 | | 2017 |
| | | | | | | | | | | | | | | | |
| Current tax expense: | | | | | | | | | | | | | | | |
| Federal | | $ | 32,262 | | | $ | 50,272 | | | $ | 45,723 | | | $ | 19,066 |
| | $ | 17,974 |
| | $ | 28,584 |
|
| Foreign | | | 5,667 | | | | 4,042 | | | | 2,346 | | | 12,727 |
| | 9,650 |
| | 10,219 |
|
| State and local | | | 3,210 | | | | 4,886 | | | | 3,905 | | | 3,892 |
| | 3,158 |
| | 2,241 |
|
| | | | | | | | | | | | | | | | | | | |
| Current tax expense | | | 41,139 | | | | 59,200 | | | | 51,974 | | | 35,685 |
| | 30,782 |
| | 41,044 |
|
| | | | | | | | | | | | | | | | | | | |
| Deferred tax expense (benefit): | | | | | | | | | | | | | |
| Deferred tax (benefit) expense: | | | |
| | |
| | |
|
| Federal | | | 2,004 | | | | (13,739 | ) | | | (2,469 | ) | | 1,725 |
| | (1,381 | ) | | (1,764 | ) |
| Foreign | | | 5,099 | | | | (1,180 | ) | | | 890 | | | (2,311 | ) | | 551 |
| | 1,118 |
|
| State and local | | | (105 | ) | | | (899 | ) | | | (4,916 | ) | | 158 |
| | 1,000 |
| | (2,514 | ) |
| | | | | | | | | | | | | | | | | | | |
| Deferred tax (benefit) expense | | | 6,998 | | | | (15,818 | ) | | | (6,495 | ) | | (428 | ) | | 170 |
| | (3,160 | ) |
| | | | | | | | | | | | | | | | | | | |
| Income tax expense | | $ | 48,137 | | | $ | 43,382 | | | $ | 45,479 | | | $ | 35,257 |
| | $ | 30,952 |
| | $ | 37,884 |
|
| | | | | | | | | | | | | | |
No provision is made for U.S. income taxes applicable to undistributed earnings of foreign subsidiaries that are indefinitely reinvested in foreign operations. It is not practicable to compute the potential deferred tax liability associated with these undistributed foreign earnings. The Company has approximately $118.8 million of undistributed foreign earnings for which it has not recorded deferred tax liabilities.
The difference between the reported income tax expense and a tax determined by applying the applicable U.S. federal statutory income tax rate to income before income taxes is reconciled as follows:
| | | (In thousands) | | 2016 | | | 2015 | | | 2014 | | | 2019 | | 2018 | | 2017 |
| | | | | | | | | | | | | | | | |
| Expected income tax expense | | $ | 51,110 | | | $ | 46,126 | | | $ | 51,805 | | | $ | 34,892 |
| | $ | 31,588 |
| | $ | 44,440 |
|
| State and local income tax, net of federal benefit | | | 1,982 | | | | 2,673 | | | | 3,355 | | | 3,234 |
| | 3,495 |
| | 1,135 |
|
| Effect of foreign statutory rate different from U.S. and other foreign adjustments | | | (4,092 | ) | | | (654 | ) | | | (1,094 | ) | |
| Valuation allowance changes | | | — | | | | — | | | | (5,732 | ) | |
| Effect of foreign statutory rates different from U.S. and other foreign adjustments | | | (771 | ) | | 759 |
| | (6,026 | ) |
| U.S. production activities deduction | | | (3,063 | ) | | | (3,500 | ) | | | (4,025 | ) | | — |
| | — |
| | (1,575 | ) |
| Goodwill disposition | | | — | | | | 646 | | | | — | | |
| Investment in unconsolidated affiliates | | | 1,030 | | | | — | | | | — | | | 538 |
| | (2,776 | ) | | 216 |
|
| Permanent adjustment to deferred tax liabilities | | | — | | | | (4,218 | ) | | | — | | |
| Benefit of stock-based compensation deductions | | | (36 | ) | | (41 | ) | | (2,160 | ) |
| Effect of tax on accumulated foreign earnings | | | (111 | ) | | (4,415 | ) | | 12,893 |
|
| Effect of tax rate change on net deferred tax liability balance | | | — |
| | — |
| | (12,067 | ) |
| Other, net | | | 1,170 | | | | 2,309 | | | | 1,170 | | | (2,489 | ) | | 2,342 |
| | 1,028 |
|
| | | | | | | | | | | | | | | | | | | |
| Income tax expense | | $ | 48,137 | | | $ | 43,382 | | | $ | 45,479 | | | $ | 35,257 |
| | $ | 30,952 |
| | $ | 37,884 |
|
The Tax Cuts and Jobs Act (the Act) was enacted on December 22, 2017. The Act reduced the U.S. federal corporate income tax
During 2015,rate from 35 percent to 21 percent, required companies to pay a one-time transition tax on the accumulated earnings of certain foreign subsidiaries, and created new taxes on certain foreign-sourced earnings. The Company applied the guidance in Staff Accounting Bulletin No. 118 in accounting for the enactment date effects of the Act. At December 30, 2017, the Company
had an adjustment tomade a
reasonable estimate of the one-time transition tax on accumulated foreign earnings as well as the impact of the Act on its existing deferred tax
balances. During the fourth quarter of 2018, the Company completed its accounting for all of the enactment-date income tax effects of the Act.
The one-time transition tax is based on the Company’s total post-1986 earnings and profits (E&P) for which the accrual of U.S. income taxes had previously been deferred. The Company recorded a provisional amount for its one-time transition tax liability, resulting in an increase in income tax expense of $4.2$12.9 million, or seven22 cents per diluted share, resulting from the acquisition of a foreign subsidiary.
at December 30, 2017. During 2014,2018, the Company releasedcontinued to refine its calculation of the transition tax. Following the completion of this analysis, the Company recorded a valuation allowancereduction to income tax expense of $5.7$4.4 million, or 10eight cents per diluted share, to reduce this liability. During 2019, the Treasury Department finalized regulations related to the calculation of the transition tax, the impact of which was immaterial to the financial statements. The Company continues to assert that the undistributed earnings of most of its foreign subsidiaries are permanently reinvested. No taxes have been accrued with respect to these undistributed earnings or any outside basis differences.
On December 30, 2017, the Company remeasured certain statedeferred tax assets and liabilities based on the rates at which they are expected to reverse in the future, which is generally 21 percent, resulting in an income tax credits. Asbenefit of $12.1 million, or 21 cents per diluted share. The Company has concluded that no further adjustment is needed related to this remeasurement.
The global intangible low-taxed income (GILTI) provisions of the Act impose a result of legislative changes enactedtax on the GILTI earned by certain foreign subsidiaries. The FASB Staff Q&A, Topic 740, No. 5, Accounting for Global Intangible Low-Taxed Income, states that an entity can make an accounting policy election to either recognize deferred taxes for temporary basis differences expected to reverse as GILTI in 2014,future years or provide for the tax expense related to GILTI in the year the tax is incurred. The Company expectshas elected to be ableprovide for the tax expense related to use such credits withinGILTI in the foreseeable future.year the tax is incurred.
The Company includes interest and penalties related to income tax matters as a component of income tax expense. The income tax expense related to penalties and interest was immaterial in 2016, 2015,2019, 2018, and 2014.2017.
The Internal Revenue Service completed its audit of the Company's 2013 tax return in 2016 and completed its audit of the Company's 2012 tax return during 2014, the results of which were immaterial to the Consolidated Financial Statements. The Company is currently under audit in various other jurisdictions.
The statute of limitations is still open for the Company'sCompany’s federal tax return and most state income tax returns for 20132015 and all subsequent years. The statutes of limitations for certainmost state returns are open for 2016 and all subsequent years, and some state and foreign returns are also open for some earlier tax years due to differing statute periods. The Internal Revenue Service is currently auditing the Company’s 2015 and 2017 tax returns. While the Company believes that it is adequately reserved for possible audit adjustments, the final resolution of these examinations cannot be determined with certainty and could result in final settlements that differ from current estimates.
The tax effects of temporary differences that give rise to significant portions of the deferred tax assets and deferred tax liabilities are presented below:
| | | (In thousands) | | 2016 | | | 2015 | | | 2019 | | 2018 |
| | | | | | | | | | | |
| Deferred tax assets: | | | | | | | | | | |
| Inventories | | $ | 15,483 | | | $ | 14,802 | | | $ | 12,247 |
| | $ | 12,297 |
|
| Other postretirement benefits and accrued items | | | 13,180 | | | | 15,294 | | | 9,271 |
| | 9,213 |
|
| Pension | | | - | | | | 2,349 | | |
| Other reserves | | | 9,821 | | | | 9,823 | | | 6,834 |
| | 7,847 |
|
| Federal and foreign tax attributes | | | 5,813 | | | | 7,403 | | |
| Foreign tax attributes | | | 5,909 |
| | 6,252 |
|
| State tax attributes, net of federal benefit | | | 22,572 | | | | 21,716 | | | 22,395 |
| | 27,651 |
|
| Share-based compensation | | | 2,416 | | | | 3,397 | | |
| Stock-based compensation | | | 3,378 |
| | 2,949 |
|
| Right of Use Liability | | | 5,965 |
| | — |
|
| Basis difference in unconsolidated affiliates | | | 211 | | | | — | | | 6,547 |
| | 1,067 |
|
| | | | | | | | | | | | | |
| Total deferred tax assets | | | 69,496 | | | | 74,784 | | | 72,546 |
| | 67,276 |
|
| Less valuation allowance | | | (18,681 | ) | | | (17,650 | ) | | (23,130 | ) | | (25,311 | ) |
| | | | | | | | | | | | | |
| Deferred tax assets, net of valuation allowance | | | 50,815 | | | | 57,134 | | | 49,416 |
| | 41,965 |
|
| | | | | | | | | | | | | |
| Deferred tax liabilities: | | | | | | | | | | |
| | |
|
| Property, plant, and equipment | | | 52,319 | | | | 43,592 | | | 47,791 |
| | 44,910 |
|
| Pension | | | 4,633 | | | | — | | | 949 |
| | 250 |
|
| Other | | | — | | | | 1,546 | | |
| Right of Use Asset | | | 5,967 |
| | — |
|
| Other Liabilities | | | 311 |
| | — |
|
| | | | | | | | | | | | | |
| Total deferred tax liabilities | | | 56,952 | | | | 45,138 | | | 55,018 |
| | 45,160 |
|
| | | | | | | | | | | | | |
| Net deferred tax (liability) asset | | $ | (6,137 | ) | | $ | 11,996 | | |
| | | | | | | | | | |
| Net deferred tax liabilities | | | $ | (5,602 | ) | | $ | (3,195 | ) |
As of December 31, 2016,28, 2019, after consideration of the federal impact, the Company had state income tax credit carryforwards of $3.2$2.3 million, all of which expire by 2019,2022, and other state income tax credit carryforwards of $10.2$11.7 million with unlimited lives. The Company had state net operating loss (NOL) carryforwards with potential tax benefits of $9.3$8.4 million, after consideration of the federal impact, expiring between 20182020 and 2031.2034. The state tax credit and NOL carryforwards are offset by valuation allowances totaling $12.5$10.7 million.
As of December 31, 2016,28, 2019, the Company had other foreign tax attributes with potential tax benefits of $5.6$5.0 million whichthat have an unlimited life. These attributes were offset by a valuation allowancesallowance totaling $3.0 million. The Company also had other foreign tax attributes of $4.9 million.$0.9 million, which have limited lives expiring between 2025 and 2039.
Income taxes paid were approximately $40.1$41.8 million in 2016, $49.92019, $38.1 million in 2015,2018, and $47.3$42.5 million in 2014.2017.
The Company'sCompany’s Board of Directors has extended, until October 2017,August 2020, its authorization to repurchase up to 20 million shares of the Company'sCompany’s common stock through open market transactions or through privately negotiated transactions. The Company has no obligation to purchase any shares and may cancel, suspend, or extend the time period for the purchase of shares at any time. Any purchases will be funded primarily through existing cash and cash from operations. The Company may hold any shares purchased in treasury or use a portion of the repurchased shares for its stock-based compensation plans, as well as for other corporate purposes. From its initial authorization in 1999 through December 31, 2016,28, 2019, the Company has repurchased approximately 4.76.2 million shares under this authorization.
Note 1617 – Stock-Based Compensation
The Company has in effect stock incentive plans under which stock-based awards have been granted to certain employees and members of its Board of Directors. Under these existing plans, the Company may grant options to purchase shares of common stock at prices not less than the fair market value of the stock on the grant date, of grant, as well as restricted stock awards. Generally, the awards vest within five years from the date of grant.grant date. Any unexercised options expire after not more than ten years.
During the years ended December 31, 2016,28, 2019, December 26, 2015,29, 2018, and December 27, 2014,30, 2017, the Company recognized stock-based compensation, as a component of selling, general, and administrative expense, in its Consolidated Statements of Income of $6.4$8.7 million, $6.2$8.0 million, and $6.3$7.5 million, respectively.
Stock Options
The fair value of each option is estimated as a single award and amortized into compensation expense on a straight-line or accrual basis over its vesting period based on its vesting schedule. The weighted average grant-date fair value of options granted during 2016, 2015,2019, 2018, and 20142017 was $7.87, $7.58,$8.78, $9.64, and $9.00,$9.38, respectively.
The Company estimates the fair value of all stock option awards as of the grant date by applying the Black-Scholes-Merton option pricing model. The use of this valuation model in the determination of compensation expense involves certain assumptions that are judgmental and/or highly sensitive including the expected life of the option, stock price volatility, risk-free interest rate, and dividend yield. Additionally, forfeitures are not estimated at the time of valuation; they are recognized as they occur. The weighted average of key assumptions used in determining the fair value of options granted and a discussion of the methodology used to develop each assumption are as follows:
| | | | | 2016 | | 2015 | | 2014 | | | 2019 | | 2018 | | 2017 |
| | | | | | | | | | | | | | |
| Expected term | | 6.7 years | | | 5.5 years | | | 5.6 years | | | 7.8 years |
| | 7.6 years |
| | 7.7 years |
|
| Expected price volatility | | | 25.6% | | | | 26.2% | | | | 34.3% | | | 28.6 | % | | 27.2 | % | | 28.9 | % |
| Risk-free interest rate | | | 1.6% | | | | 1.7% | | | | 1.7% | | | 2.4 | % | | 2.9 | % | | 2.1 | % |
| Dividend yield | | | 1.0% | | | | 0.9% | | | | 1.0% | | | 1.4 | % | | 1.3 | % | | 1.3 | % |
Expected term – This is the period of time estimated based on historical experience over which the options granted are expected to remain outstanding. An increase in the expected term will increase compensation expense.
Expected price volatility – This is a measure of the amount by which a price has fluctuated or is expected to fluctuate. The Company uses actual historical changes in the market value of its stock to calculate the volatility assumption. Daily market value changes from the grant date of grant over a past period representative of the expected term of the options are used. An increase in the expected price volatility rate will increase compensation expense.
Risk-free interest rate – This is the U.S. Treasury rate for the week of the grant, having a term representative of the expected term of the options. An increase in the risk-free rate will increase compensation expense.
Dividend yield – This rate is the annual dividends per share as a percentage of the Company'sCompany’s stock price. An increase in the dividend yield will decrease compensation expense.
The total intrinsic value of options exercised was $2.5$1.6 million, $3.1$0.9 million, and $3.5$10.2 million in 2016, 2015,2019, 2018, and 2014,2017, respectively. The total fair value of options that vested was $0.3 million, $0.8 million, and $1.0 million each year in 2016, 2015,2019, 2018, and 2014, respectively.2017.
At December 31, 2016,28, 2019, the aggregate intrinsic value of all outstanding options was $19.5$6.3 million with a weighted average remaining contractual term of 5.05.5 years. Of the outstanding options, 655613 thousand are currently exercisable with an aggregate intrinsic value of $15.8$5.8 million, a weighted average exercise price of $16.02,$22.34, and a weighted average remaining contractual term of 3.24.5 years.
The total compensation expense not yet recognized related to unvested options at December 31, 201628, 2019 was $1.4$1.5 million, with an average expense recognition period of 2.33.0 years.
Restricted Stock Awards
The fair value of each restricted stock award equals the fair value of the Company'sCompany’s stock on the grant date and is amortized into compensation expense on a straight-line or accrual basis over its vesting period based on its vesting schedule. The weighted average grant-date fair value of awards granted during 2016, 2015,2019, 2018, and 20142017 was $34.04, $32.54,$28.82, $32.04, and $28.80,$30.97, respectively.
The aggregate intrinsic value of outstanding and unvested awards was $28.4$33.7 million at December 31, 2016.28, 2019. Total compensation expense for restricted stock awards not yet recognized was $15.9$18.7 million with an average expense recognition period of 3.43.2 years. The total fair value of awards that vested was $4.7$5.6 million, $4.8$3.7 million, and $4.2$3.5 million in 2016, 2015,2019, 2018, and 2014,2017, respectively.
The Company generally issues treasury shares when options are exercised or restricted stock awards are granted. A summary of the activity and related information follows:
| | | | | Stock Options | | | Restricted Stock Awards | | | Stock Options | | Restricted Stock Awards |
(Shares in thousands) | | Shares | | | Weighted Average Exercise Price | | | Shares | | | Weighted Average Grant Date Fair Value | | | Shares | | Weighted Average Exercise Price | | Shares | | Weighted Average Grant Date Fair Value |
| | | | | | | | | | | | | | | | | | | | | |
| Outstanding at December 26, 2015 | | | 1,198 | | | $ | 20.59 | | | | 705 | | | $ | 28.08 | | |
| Outstanding at December 29, 2018 | | | 1,014 |
| | $ | 23.90 |
| | 930 |
| | $ | 32.14 |
|
| Granted | | | 24 | | | | 30.86 | | | | 265 | | | | 34.04 | | | 34 |
| | 28.82 |
| | 316 |
| | 28.82 |
|
| Exercised | | | (178 | ) | | | 17.61 | | | | (188 | ) | | | 25.23 | | |
| Exercised/Released | | | (94 | ) | | 13.37 |
| | (182 | ) | | 31.06 |
|
| Forfeited | | | (10 | ) | | | 30.79 | | | | (73 | ) | | | 28.53 | | | (15 | ) | | 29.31 |
| | (2 | ) | | 34.12 |
|
| | | | | | | | | | | | | | | | | | | | | | | | | |
| Outstanding at December 31, 2016 | | | 1,034 | | | | 21.24 | | | | 709 | | | | 31.02 | | |
| | | | | | | | | | | | | | | | | | |
| Outstanding at December 28, 2019 | | | 939 |
| | 25.05 |
| | 1,062 |
| | 31.34 |
|
Approximately 1.01.9 million shares were available for future stock incentive awards at December 31, 2016.28, 2019.
Note 1718 – Accumulated Other Comprehensive Income (Loss)
AOCI includes certain foreign currency translation adjustments from those subsidiaries not using the U.S. dollar as their functional currency, net deferred gains and losses on certain derivative instruments accounted for as cash flow hedges, adjustments to pension and OPEB liabilities, unrealized gains and losses on marketable securities classified as available-for-sale, and other comprehensive income attributable to unconsolidated affiliates.
The following table provides changes in AOCI by component, net of taxes and noncontrolling interest (amounts in parentheses indicate debits to AOCI):
| | | (In thousands) | | Cumulative Translation Adjustment | | | Unrealized (Losses)/ Gains on Derivatives | | | Minimum Pension/ OPEB Liability Adjustment | | | Unrealized Gains on Equity Investments | | | Attributable to Unconsolidated Affiliates | | | Total | | | Cumulative Translation Adjustment | | Unrealized Gain (Loss) on Derivatives | | Pension/
OPEB Liability Adjustment | | Attributable to Unconsol. Affiliates | | Total |
| | | | | | | | | | | | | | | | | | | | | | | | | | | | | |
| Balance at December 27, 2014 | | $ | (7,076 | ) | | $ | (953 | ) | | $ | (35,164 | ) | | $ | 270 | | | $ | — | | | $ | (42,923 | ) | |
| Balance at December 30, 2017 | | | $ | (38,163 | ) | | $ | 847 |
| | $ | (20,610 | ) | | $ | 6,870 |
| | $ | (51,056 | ) |
| | | | | | | | | | | | |
| Other comprehensive loss before reclassifications | | | (16,094 | ) | | (802 | ) | | (3,642 | ) | | (8,686 | ) | | (29,224 | ) |
| Amounts reclassified from AOCI | | | — |
| | (371 | ) | | 303 |
| | — |
| | (68 | ) |
| | | | | | | | | | | | |
| Net current-period other comprehensive loss | | | (16,094 | ) | | (1,173 | ) | | (3,339 | ) | | (8,686 | ) | | (29,292 | ) |
| Reclassification of stranded effects of the Act | | | — |
| | 112 |
| | (1,018 | ) | | 1,462 |
| | 556 |
|
| | | | | | | | | | | | |
| Balance at December 29, 2018 | | | (54,257 | ) | | (214 | ) | | (24,967 | ) | | (354 | ) | | (79,792 | ) |
| | | | | | | | | | | | | | | | | | | | | | | | | | | | | | | | | | | |
| Other comprehensive income (loss) before reclassifications | | | (17,697 | ) | | | (4,604 | ) | | | 4,766 | | | | (49 | ) | | | — | | | | (17,584 | ) | | 8,059 |
| | 1,176 |
| | 2,315 |
| | (839 | ) | | 10,711 |
|
| Amounts reclassified from AOCI | | | — | | | | 3,548 | | | | 1,969 | | | | — | | | | — | | | | 5,517 | | | — |
| | (486 | ) | | 797 |
| | — |
| | 311 |
|
| | | | | | | | | | | | | | | | | | | | | | | | | | | | | | | | | | | |
| Balance at December 26, 2015 | | | (24,773 | ) | | | (2,009 | ) | | | (28,429 | ) | | | 221 | | | | — | | | | (54,990 | ) | |
| | | | | | | | | | | | | | | | | | | | | | | | | | |
| Other comprehensive income (loss) before reclassifications | | | (25,192 | ) | | | 400 | | | | 3,962 | | | | 159 | | | | 5,975 | | | | (14,696 | ) | |
| Amounts reclassified from AOCI | | | — | | | | 1,309 | | | | 1,421 | | | | — | | | | — | | | | 2,730 | | |
| | | | | | | | | | | | | | | | | | | | | | | | | | |
| Balance at December 31, 2016 | | $ | (49,965 | ) | | $ | (300 | ) | | $ | (23,046 | ) | | $ | 380 | | | $ | 5,975 | | | $ | (66,956 | ) | |
| Balance at December 28, 2019 | | | $ | (46,198 | ) | | $ | 476 |
| | $ | (21,855 | ) | | $ | (1,193 | ) | | $ | (68,770 | ) |
Reclassification adjustments out of AOCI were as follows:
| | | Amount reclassified from AOCI |
| (In thousands) | | 2016 | | | 2015 | | | 2014 | | Affected Line Item |
| | | | | | | | | | | |
| Unrealized losses on derivatives: | | | | | | | | | | |
| Commodity contracts | | $ | 1,061 | | | $ | 4,486 | | | $ | 328 | | Cost of goods sold |
| Interest rate swap | | | 361 | | | | 372 | | | | — | | Interest expense |
| | | | (113 | ) | | | (1,310 | ) | | | (61 | ) | Income tax expense |
| | | | | | | | | | | | | | |
| | | | 1,309 | | | | 3,548 | | | | 267 | | Net of tax |
| | | | — | | | | — | | | | — | | Noncontrolling interest |
| | | | | | | | | | | | | | |
| | | $ | 1,309 | | | $ | 3,548 | | | $ | 267 | | Net of tax and noncontrolling interest |
| | | | | | | | | | | | | |
Amortization of net loss and prior service cost on employee benefit plans | | $ | 1,942 | | | $ | 2,688 | | | $ | 541 | | Selling, general, and administrative expense |
| | | | (521 | ) | | | (719 | ) | | | (72 | ) | Income tax expense |
| | | | | | | | | | | | | | |
| | | | 1,421 | | | | 1,969 | | | | 469 | | Net of tax |
| | | | — | | | | — | | | | — | | Noncontrolling interest |
| | | | | | | | | | | | | | |
| | | $ | 1,421 | | | $ | 1,969 | | | $ | 469 | | Net of tax and noncontrolling interest |
| | | | | | | | | | | | | |
| Loss recognized upon sale of business | | $ | — | | | $ | — | | | $ | 5,999 | | Gain on sale of assets |
| | | | — | | | | — | | | | — | | Income tax benefit |
| | | | | | | | | | | | | | |
| | | | — | | | | — | | | | 5,999 | | Net of tax |
| | | | — | | | | — | | | | — | | Noncontrolling interest |
| | | | | | | | | | | | | | |
| | | $ | — | | | $ | — | | | $ | 5,999 | | Net of tax and noncontrolling interest |
| | | | | | | | | | | | | | |
F-58 |
| | | | | | | | | | | | | | |
| | | Amount reclassified from AOCI |
| (In thousands) | | 2019 | | 2018 | | 2017 | | Affected Line Item |
| | | | | | | | | |
| Unrealized losses (gains) on derivatives: | | | | | | | | |
| Commodity contracts | | $ | (587 | ) | | $ | (429 | ) | | $ | 1,309 |
| | Cost of goods sold |
| Interest rate swap | | — |
| | — |
| | 851 |
| | Interest expense |
| | | 101 |
| | 58 |
| | (624 | ) | | Income tax expense (benefit) |
| | | | | | | | | |
| | | $ | (486 | ) | | $ | (371 | ) | | $ | 1,536 |
| | Net of tax and noncontrolling interests |
| | | | | | | | | |
| Amortization of net loss and prior service cost on employee benefit plans | | $ | 960 |
| | $ | 341 |
| | $ | 1,263 |
| | Other income, net |
| | | (163 | ) | | (38 | ) | | (221 | ) | | Income tax benefit |
| | | | | | | | | |
| | | $ | 797 |
| | $ | 303 |
| | $ | 1,042 |
| | Net of tax and noncontrolling interests |
| | | | | | | | | |
| Gain recognized upon sale of business | | $ | — |
| | $ | — |
| | $ | (3,777 | ) | | Gain on sale of assets, net |
| | | — |
| | — |
| | — |
| | Income tax expense |
| | | | | | | | | |
| | | $ | — |
| | $ | — |
| | $ | (3,777 | ) | | Net of tax and noncontrolling interests |
| | | | | | | | | |
| Sale of available-for-sale securities | | $ | — |
| | $ | — |
| | $ | (611 | ) | | Other income, net |
| | | — |
| | — |
| | 232 |
| | Income tax expense |
| | | | | | | | | |
| | | $ | — |
| | $ | — |
| | $ | (379 | ) | | Net of tax and noncontrolling interests |
| | | | | | | | | |
Note 1819 – Quarterly Financial Information (Unaudited)(8)(1)
| | | First | | | Second | | | Third | | | Fourth | |
(In thousands, except per share data) | | Quarter | | | Quarter | | | Quarter | | | Quarter | |
| | | | | | | | | | | | | | |
| 2016 | | | | | | | | | | | | | |
| Net sales | | $ | 532,809 | | | $ | 544,071 | | | $ | 506,584 | | | | $ | 472,158 | | |
Gross profit (1) | | | 86,167 | | | | 88,011 | | | | 81,916 | | | | | 76,029 | | |
Consolidated net income (2) | | | 28,665 | | | | 28,259 | | | | 26,062 | (3 | ) | | | 16,768 | (4 | ) |
| Net income attributable to Mueller Industries, Inc. | | | 28,630 | | | | 27,797 | | | | 25,978 | | | | | 17,322 | | |
| Basic earnings per share | | | 0.51 | | | | 0.49 | | | | 0.46 | | | | | 0.31 | | |
| Diluted earnings per share | | | 0.50 | | | | 0.49 | | | | 0.45 | | | | | 0.30 | | |
| Dividends per share | | | 0.075 | | | | 0.10 | | | | 0.10 | | | | | 0.10 | | |
| | | | | | | | | | | | | | | | | | | |
| 2015 | | | | | | | | | | | | | | | | | | |
| Net sales | | $ | 537,242 | | | $ | 555,593 | | | $ | 535,184 | | | | $ | 471,983 | | |
Gross profit (1) | | | 76,408 | | | | 85,228 | | | | 68,017 | | | | | 60,647 | | |
Consolidated net income (7) | | | 22,340 | | | | 33,862 | (5 | ) | | 18,095 | (6 | ) | | | 14,110 | | |
| Net income attributable to Mueller Industries, Inc. | | | 21,978 | | | | 33,651 | | | | 17,800 | | | | | 14,435 | | |
| Basic earnings per share | | | 0.39 | | | | 0.60 | | | | 0.32 | | | | | 0.26 | | |
| Diluted earnings per share | | | 0.39 | | | | 0.59 | | | | 0.31 | | | | | 0.25 | | |
| Dividends per share | | | 0.075 | | | | 0.075 | | | | 0.075 | | | | | 0.075 | | |
|
| | | | | | | | | | | | | | | | | |
| (In thousands, except per share data) | | First Quarter | | Second Quarter | | Third Quarter | | Fourth Quarter | |
| | | | | | | | | | |
| 2019 | | | | | | | | | |
| Net sales | | $ | 611,781 |
| | $ | 666,394 |
| | $ | 608,602 |
| | $ | 543,839 |
| |
Gross profit (2) | | 100,388 |
| | 102,446 |
| | 97,814 |
| | 94,358 |
| |
| Consolidated net income | | 17,139 |
| | 28,676 |
| | 30,444 |
| | 29,973 |
| |
| Net income attributable to Mueller Industries, Inc. | | 15,723 |
| | 27,986 |
| | 29,093 |
| | 28,170 |
| |
| Basic earnings per share | | 0.28 |
| | 0.50 |
| | 0.52 |
| | 0.50 |
| |
| Diluted earnings per share | | 0.28 |
| | 0.50 |
| | 0.52 |
| | 0.50 |
| |
| Dividends per share | | 0.10 |
| | 0.10 |
| | 0.10 |
| | 0.10 |
| |
| | | | | | | | | | |
| 2018 | | |
| | |
| | |
| | |
| |
| Net sales | | $ | 640,060 |
| | $ | 662,773 |
| | $ | 645,958 |
| | $ | 559,087 |
| |
Gross profit (2) | | 94,390 |
| | 98,953 |
| | 79,002 |
| | 85,133 |
| |
Consolidated net income (3) | | 24,344 |
| | 33,882 |
| | 20,863 |
| | 27,731 |
| |
| Net income attributable to Mueller Industries, Inc. | | 24,128 |
| | 33,182 |
| | 20,292 |
| | 26,857 |
| |
| Basic earnings per share | | 0.42 |
| | 0.58 |
| | 0.36 |
| | 0.47 |
| |
| Diluted earnings per share | | 0.42 |
| | 0.58 |
| | 0.35 |
| | 0.47 |
| |
| Dividends per share | | 0.10 |
| | 0.10 |
| | 0.10 |
| | 0.10 |
| |
(1) Gross profit is net sales less cost of goods sold, which excludes depreciation and amortization. | |
| | |
(2) Includes income earned by Jungwoo-Mueller, acquired during Q2 2016. | |
| | |
(3) Includes $3.0 million of pre-tax charges related to asset impairments. | |
| | |
(4) Includes $3.8 million of pre-tax charges related to asset impairments. | |
| | |
(5) Includes $15.4 million pre-tax gain on sale of assets and $3.4 million of pre-tax charges related to severance. | |
| | |
(6) During Q3 2015, the Company recorded a permanent adjustment to a deferred tax liability of $4.2 million. | |
| | |
(7) Includes income earned by Turbotec, acquired during Q2 2015, Sherwood, acquired during Q2 2015, and Great Lakes, acquired during Q3
2015.(1)
| |
| | |
(8) The sum of quarterly amounts may not equal the annual amounts reported due to rounding. In addition, the earnings per share amounts are
computed independently for each quarter, while the full year is based on the weighted average shares outstanding. |
| |
(2) | Gross profit is net sales less cost of goods sold, which excludes depreciation and amortization. |
| |
(3) | Includes income earned by ATCO, acquired during Q3 2018, and Die-Mold, acquired during Q1 2018. |
Note 1920 – Subsequent EventEvents
On February 12, 2020, Mueller Copper Tube Company, a wholly owned subsidiary of the Company, collected approximately $21.9 million related to its claim under the Deepwater Horizon Economic and Property Damage Settlement Program, which as previously reported by the Company, was originally approved in November 2018, subject to appeal. The collected amount represents settlement proceeds received after the payment of fees and expenses.
On January 25, 2017,17, 2020, the Company announcedentered into a special dividend on its common stock payable on March 9, 2017purchase agreement pursuant to stockholders of record on February 28, 2017. The special dividend will consist of $3.00 in cash and $5.00 in principal amountwhich the Company acquired all of the Company's 6% Subordinated Debentures due 2027outstanding stock of Shoals Tubular, Inc. (STI) for each shareapproximately $15.4 million, net of common stock (less any applicable withholding tax).
The Debenturesworking capital adjustments. STI is a manufacturer of brazed manifolds, headers, and distributor assemblies used primarily by manufactures of residential heating and air conditioning units. STI will be subordinated to all other funded debtreported with and complements the Company’s existing business in its Climate segment.
In January 2020, the Company completed the purchase of its corporate headquarters located in Collierville, TN for $10.6 million. In 2019, the building was leased and was included in the operating lease right-of-use assets line item in the Consolidated Balance Sheet. In 2020, it will be included in property, plant, and equipment, net. The corporate headquarters lease represents $9.3 million and $9.5 million of the Companytotal operating lease right-of-use-assets and will be callable, in whole or in part,related lease liabilities at any timeyear-end. Remaining lease payments under the previous agreement were $14.5 million at the optionend of the Company, subject to declining call premiums during the first five years. The Debentures will also grant each holder of the Debentures the right to require the Company to repurchase such holder's Debentures2019 and are included in the event of a change of control, at declining repurchase premiums during the first five years. Interest will be payable semiannually on September 1 and March 1, commencing September 1, 2017.operating lease maturities table in “Note 8 – Leases.”
The effect of the special dividend will be to decrease stockholders' equity by approximately $460.0 million, increase long-term debt by approximately $287.0 million, and decrease cash by approximately $173.0 million.
Report of Independent Registered Public Accounting Firm
TheTo the Stockholders and the Board of Directors and Stockholders of Mueller Industries, Inc.
Opinion on the Financial Statements
We have audited the accompanying consolidated balance sheets of Mueller Industries, Inc. (the Company) as of December 31, 201628, 2019 and December 26, 2015, and29, 2018, the related consolidated statements of income, comprehensive income, changes in equity and cash flows for each of the three years in the period ended December 31, 2016. Our audits also included28, 2019, and the related notes and financial statement schedule listed in the Index at Item 15(a) (collectively referred to as the “consolidated financial statements”). In our opinion, the consolidated financial statements present fairly, in all material respects, the financial position of the Company at December 28, 2019 and December 29, 2018, and the results of its operations and its cash flows for each of the three years in the period ended December 28, 2019, in conformity with U.S. generally accepted accounting principles.
We also have audited, in accordance with the standards of the Public Company Accounting Oversight Board (United States) (PCAOB), the Company's internal control over financial reporting as of December 28, 2019, based on criteria established in Internal Control-Integrated Framework issued by the Committee of Sponsoring Organizations of the Treadway Commission (2013 framework), and our report dated February 26, 2020 expressed an unqualified opinion thereon.
Basis for Opinion
These financial statements and schedule are the responsibility of the Company's management. Our responsibility is to express an opinion on thesethe Company’s financial statements and schedule based on our audits. We are a public accounting firm registered with the PCAOB and are required to be independent with respect to the Company in accordance with the U.S. federal securities laws and the applicable rules and regulations of the Securities and Exchange Commission and the PCAOB.
We conducted our audits in accordance with the standards of the Public Company Accounting Oversight Board (United States).PCAOB. Those standards require that we plan and perform the audit to obtain reasonable assurance about whether the financial statements are free of material misstatement. An audit includesmisstatement, whether due to error or fraud. Our audits included performing procedures to assess the risks of material misstatement of the financial statements, whether due to error or fraud, and performing procedures that respond to those risks. Such procedures included examining, on a test basis, evidence supportingregarding the amounts and disclosures in the financial statements. An auditOur audits also includes assessingincluded evaluating the accounting principles used and significant estimates made by management, as well as evaluating the overall presentation of the financial statement presentation.statements. We believe that our audits provide a reasonable basis for our opinion.
In our opinion,Critical Audit Matters
The critical audit matters communicated below are matters arising from the current period audit of the financial statements referredthat were communicated or required to above present fairly, in allbe communicated to the audit committee and that: (1) relate to accounts or disclosures that are material respects,to the consolidated financial position of Mueller Industries, Inc. at December 31, 2016statements and December 26, 2015, and the consolidated results of its operations and its cash flows for each(2) involved our especially challenging, subjective or complex judgments. The communication of the three yearscritical audit matters does not alter in the period ended December 31, 2016, in conformity with U.S. generally accepted accounting principles. Also, inany way our opinion on the related financial statement schedule, when considered in relation to the basicconsolidated financial statements, taken as a whole, presents fairly in all material respectsand we are not, by communicating the information set forth therein.critical audit matters below, providing separate opinions on the critical audit matters or on the accounts or disclosures to which they relate.
We also have audited, in accordance with the standards of the Public Company Accounting Oversight Board (United States), Mueller Industries, Inc.'s internal control over financial reporting as of December 31, 2016, based on criteria established in Internal Control – Integrated Framework issued by the Committee of Sponsoring Organizations of the Treadway Commission (2013 Framework) and our report dated March 1, 2017 expressed an unqualified opinion thereon.
Memphis, Tennessee |
March 1, 2017 | | |
MUELLER INDUSTRIES, INC.
SCHEDULE II - VALUATION AND QUALIFYING ACCOUNTSYears Ended December 31, 2016, December 26, 2015, and December 27, 2014
| | | | Additions | | | | | | | | |
| | Balance at | | Charged to | | | | | | | | | Balance | |
| | beginning | | costs and | | Other | | | | | | | at end | |
| (In thousands) | of year | | expenses | | additions | | | | | Deductions | | of year | |
| | | | | | | | | | | | | | |
| 2016 | | | | | | | | | | | | | |
| Allowance for doubtful accounts | | | $ | 623 | | | | $ | 160 | | | | $ | 2 | | | | (1 | ) | | | $ | 148 | | | | $ | 637 | |
| | | | | | | | | | | | | | | | | | | | | | | | | | | | | | |
| Environmental reserves | | | $ | 21,667 | | | | $ | 894 | | | | $ | — | | | | | | | | $ | 697 | | | | $ | 21,864 | |
| | | | | | | | | | | | | | | | | | | | | | | | | | | | | | |
| Valuation allowance for deferred tax assets | | | $ | 17,650 | | | | $ | 3 | | | | $ | 1,028 | | | | | | | | $ | — | | | | $ | 18,681 | |
| | | | | | | | | | | | | | | | | | | | | | | | | | | | | | |
| 2015 | | | | | | | | | | | | | | | | | | | | | | | | | | | | | |
| Allowance for doubtful accounts | | | $ | 666 | | | | $ | (130 | ) | | | $ | 201 | | | | (1 | ) | | | $ | 114 | | | | $ | 623 | |
| | | | | | | | | | | | | | | | | | | | | | | | | | | | | | |
| Environmental reserves | | | $ | 22,661 | | | | $ | 76 | | | | $ | — | | | | | | | | $ | 1,070 | | | | $ | 21,667 | |
| | | | | | | | | | | | | | | | | | | | | | | | | | | | | | |
| Valuation allowance for deferred tax assets | | | $ | 17,119 | | | | $ | (5 | ) | | | $ | 536 | | | | | | | | $ | — | | | | $ | 17,650 | |
| | | | | | | | | | | | | | | | | | | | | | | | | | | | | | |
| 2014 | | | | | | | | | | | | | | | | | | | | | | | | | | | | | |
| Allowance for doubtful accounts | | | $ | 2,391 | | | | $ | (500 | ) | | | $ | 18 | | | | (1 | ) | | | $ | 1,243 | | | | $ | 666 | |
| | | | | | | | | | | | | | | | | | | | | | | | | | | | | | |
| Environmental reserves | | | $ | 23,637 | | | | $ | 1,187 | | | | $ | — | | | | | | | | $ | 2,163 | | | | $ | 22,661 | |
| | | | | | | | | | | | | | | | | | | | | | | | | | | | | | |
| Valuation allowance for deferred tax assets | | | $ | 22,544 | | | | $ | (5,630 | ) | | | $ | 2,282 | | | | | | | | $ | 2,077 | | | | $ | 17,119 | |
| | | | | | | | | | | | | | | | | | | | | | | | | | | | | | |
| (1) Other consists primarily of bad debt recoveries as well as the effect of fluctuating foreign currency exchange rates in all years presented. | |
| | |
| | |
| | |
| | |
EXHIBIT INDEX
Exhibits
| | Defined Benefit Pension Obligation |
| Description of the Matter | | DescriptionAt December 28, 2019, the aggregate defined benefit pension obligation was $182.2 million, and the fair value of pension plan assets was $183.5 million, resulting in an overfunded defined benefit pension obligation of $1.3 million. As disclosed in Notes 1 and 13 to the consolidated financial statements, the Company recognizes the overfunded or underfunded status of the plans as an asset or liability in the consolidated balance sheets with changes in the funded status recorded through comprehensive income in the year in which those changes occur. The obligations for these plans are actuarially determined and affected by assumptions, including discount rates, expected long-term return on plan assets, and certain employee-related factors such as mortality.
Auditing the defined benefit pension obligation is complex and required the involvement of our actuarial specialists due to the highly judgmental nature of actuarial assumptions (e.g., discount rate, expected return on plan assets, and mortality rate) used in the measurement process and the geographical differences of the plans, which require different considerations for the relevant assumptions based on the respective economic and demographic environments. These assumptions have a significant effect on the projected benefit obligation. |
| | |
| How We Addressed the Matter in Our Audit | | We obtained an understanding, evaluated the design and tested the operating effectiveness of controls that address the measurement and valuation of the defined benefit pension obligation. For example, we tested controls over management’s review of the defined benefit pension obligation, including the significant actuarial assumptions used by management and the related data inputs.
To test the defined benefit pension obligation, our audit procedures included, among others, evaluating the methodology used, the significant actuarial assumptions discussed above and testing the completeness and accuracy of the underlying data, including the participant data used by management.
We involved our actuarial specialist to assist with our procedures. For example, we compared the actuarial assumptions used by management to historical trends and evaluated the change in the defined benefit pension obligation from prior year due to the change in service cost, interest cost, actuarial gains and losses, benefit payments, contributions and other activities. In addition, we evaluated management’s methodology for determining the discount rate that reflects the maturity and duration of the benefit payments that is used to measure the defined benefit pension obligation. As part of this assessment, we compared management’s selected discount rate to an independently developed range of reasonable discount rates. To evaluate the mortality rate assumption, we assessed whether the information is consistent with publicly available information, and whether any market data adjusted for entity-specific factors were applied. Lastly, to evaluate the expected return on plan assets, we assessed whether management’s assumption was consistent with a range of returns for a portfolio of comparative investments. |
| | |
| | | Valuation of Goodwill - Heatlink Group Reporting Unit |
| Description of the Matter | | |
10.12 | | Summary descriptionAt December 28, 2019, the Company’s goodwill was $153.3 million, of which $131.6 million related to the Piping Systems segment which includes the Heatlink Group reporting unit. As disclosed in Notes 1 and 10 to the consolidated financial statements, goodwill is evaluated annually for possible impairment as of the Registrant's 2017 incentive plan for certain key employees. | | |
| | | | |
10.25 | | Change in Control Agreement, effective January 3, 2017 by and between the Registrant and Christopher J. Miritello. | | |
| | | | |
21.0 | | Subsidiariesfirst day of the Registrant. | | |
| | | | |
23.0 | | Consent of Independent Registered Public Accounting Firm. | | |
| | | | |
31.1 | | Certification of Chief Executive Officer pursuantfourth quarter unless circumstances indicate the need to Rule 13a-14(a) and Rule 15d-14(a)accelerate the timing of the Securities Exchange Act of 1934, as amended. | | |
| | | | |
31.2 | | Certification of Chief Financial Officer pursuantevaluation.
Auditing management’s annual goodwill impairment test for the Heatlink Group reporting unit was complex and highly judgmental due to Rule 13a-14(a) and Rule 15d-14(a)the significant estimates required to determine the fair value of the Securities Exchange Actreporting unit. Fair value for the Heatlink Group reporting unit is determined using the income approach, incorporating market participant considerations and management’s assumptions on revenue growth rates, operating margins, discount rates and a terminal value, among other factors. Fair value estimates of 1934, as amended. | | |
| | | | |
32.1 | | Certification of Chief Executive Officer pursuantreporting units with fair values that do not significantly exceed their carrying values are sensitive to 18 U.S.C. 1350, as adopted pursuant to Section 906these assumptions and are directly impacted by the condition of the Sarbanes-Oxley Act of 2002. | | markets in which the reporting unit operates. |
| | | | |
32.2 | | Certification of Chief Financial Officer pursuant to 18 U.S.C. 1350, as adopted pursuant to Section 906 of the Sarbanes-Oxley Act of 2002. | | |
| | | | |
101.CAL | | XBRL Taxonomy Extension Calculation Linkbase | | |
| | | | |
101.DEF | | XBRL Taxonomy Extension Definition Linkbase | | |
| | | | |
101.INS | | XBRL Instance Document | | |
| | | | |
101.LAB | | XBRL Taxonomy Extension Label Linkbase | | |
| | | | |
101.PRE | | XBRL Presentation Linkbase Document | | |
| | | | |
101.SCH | | XBRL Taxonomy Extension Schema | | |
| | | | |
|
| | |
| How We Addressed the Matter in Our Audit | | We obtained an understanding, evaluated the design and tested the operating effectiveness of the controls over the goodwill impairment process. For example, we tested controls over management’s review of the significant assumptions used in the reporting unit valuations as well as management’s review around the reasonableness of the data used in these valuations.
To test the estimated fair value of the Heatlink Group reporting unit, we performed audit procedures that included, among others, evaluating methodologies used, involving our valuation specialists in testing the significant assumptions and valuation methodology described above and testing the underlying data used by the Company in its analysis for completeness and accuracy. We compared the significant assumptions used by management to current industry and economic trends, historical results and other guideline companies within the same industry, as well as other relevant factors. We assessed the historical accuracy of management’s estimates and performed sensitivity analyses of significant assumptions to evaluate the change in the fair value of the reporting unit resulting from changes in the inputs and assumptions. We evaluated the incorporation of the applicable assumptions into the model and tested the model’s computational accuracy. |
|
| |
| |
| |
| We have served as the Company’s auditor since 1991. | |
| |
| Memphis, Tennessee | |
| February 26, 2020 | |
MUELLER INDUSTRIES, INC.
SCHEDULE II - VALUATION AND QUALIFYING ACCOUNTS
Years Ended December 28, 2019, December 29, 2018, and December 30, 2017
|
| | | | | | | | | | | | | | | | | | | | |
| | | | | Additions | | | | |
| (In thousands) | | Balance at beginning of year | | Charged to costs and expenses | | Other additions | | Deductions | | Balance at end of year |
| | | | | | | | | | | |
| 2019 | | | | | | | | | | |
| Allowance for doubtful accounts | | $ | 836 |
| | $ | (81 | ) | | $ | 263 |
| | $ | 248 |
| | $ | 770 |
|
| | | | | | | | | | | |
| Environmental reserves | | $ | 23,619 |
| | $ | 1,659 |
| | $ | — |
| | $ | 4,412 |
| | $ | 20,866 |
|
| | | | | | | | | | | |
| Valuation allowance for deferred tax assets | | $ | 25,311 |
| | $ | 2,919 |
| | $ | 290 |
| | $ | 5,390 |
| | $ | 23,130 |
|
|
| | | | | | | | | | | | | | | | | | | | |
| 2018 | | | | | | | | | | |
| Allowance for doubtful accounts | | $ | 980 |
| | $ | (286 | ) | | $ | 220 |
| | $ | 78 |
| | $ | 836 |
|
| | | | | | | | | | | |
| Environmental reserves | | $ | 28,004 |
| | $ | 1,981 |
| | $ | — |
| | $ | 6,366 |
| | $ | 23,619 |
|
| | | | | | | | | | | |
| Valuation allowance for deferred tax assets | | $ | 30,316 |
| | $ | 1,209 |
| | $ | 150 |
| | $ | 6,364 |
| | $ | 25,311 |
|
|
| | | | | | | | | | | | | | | | | | | | |
| 2017 | | |
| | |
| | |
| | |
| | |
|
| Allowance for doubtful accounts | | $ | 637 |
| | $ | 422 |
| | $ | (61 | ) | | $ | 18 |
| | $ | 980 |
|
| | | | | | | | | | | |
| Environmental reserves | | $ | 21,864 |
| | $ | 7,491 |
| | $ | — |
| | $ | 1,351 |
| | $ | 28,004 |
|
| | | | | | | | | | | |
| Valuation allowance for deferred tax assets | | $ | 18,681 |
| | $ | 7 |
| | $ | 11,628 |
| (1) | $ | — |
| | $ | 30,316 |
|
| |
(1) | The valuation allowance increased by $11.6 million during 2017 to a balance of $30.3 million as of December 30, 2017. The change to the valuation allowance was attributable to the recording of valuation allowances against tax attributes generated in 2017 primarily resulting from the Act and increased interest expense in state tax jurisdictions where the Company has no tax liability. |