UNITED STATES
SECURITIES AND EXCHANGE COMMISSION
Washington, D.C. 20549
FORM 10-K
(Mark One)
| | | | | |
| ☒ | ANNUAL REPORT PURSUANT TO SECTION 13 OR 15(d) OF THE SECURITIES EXCHANGE ACT OF 1934 |
For the fiscal year ended December 31, 20222023
| | | | | |
| ☐ | TRANSITION REPORT PURSUANT TO SECTION 13 OR 15(d) OF THE SECURITIES EXCHANGE ACT OF 1934 |
For the transition period from to
Commission file number 001-02658
STEWART INFORMATION SERVICES CORPORATION
(Exact name of registrant as specified in its charter)
| | | | | | | | | | | |
| Delaware | | 74-1677330 |
(State or other jurisdiction of
incorporation or organization) | | (I.R.S. Employer
Identification No.) |
| 1360 Post Oak Blvd., | Suite 100 | | |
| Houston, | Texas | | 77056 |
| (Address of principal executive offices) | | (Zip Code) |
Registrant’s telephone number, including area code: (713) 625-8100
Securities registered pursuant to Section 12(b) of the Act:
| | | | | | | | |
| Common Stock, $1 par value per share | STC | New York Stock Exchange |
| (Title of each class of stock) | Trading Symbol(s) | (Name of each exchange on which registered) |
Securities registered pursuant to Section 12(g) of the Act: None
Indicate by check mark if the registrant is a well-known seasoned issuer, as defined in Rule 405 of the Securities Act. Yes ☑ No ☐
Indicate by check mark if the registrant is not required to file reports pursuant to Section 13 or Section 15(d) of the Act. Yes ☐ No ☑
Indicate by check mark whether the registrant (1) has filed all reports required to be filed by Section 13 or 15(d) of the Securities Exchange Act of 1934 during the preceding 12 months (or for such shorter period that the registrant was required to file such reports), and (2) has been subject to such filing requirements for the past 90 days. Yes ☑ No ☐
Indicate by check mark whether the registrant has submitted electronically every Interactive Data File required to be submitted pursuant to Rule 405 of Regulation S-T (§232.405 of this chapter) during the preceding 12 months (or for such shorter period that the registrant was required to submit such files). Yes ☑ No ☐
Indicate by check mark whether the registrant is a large accelerated filer, an accelerated filer, a non-accelerated filer, a smaller reporting company or an emerging growth company. See the definitions of “large accelerated filer,” “accelerated filer”, “smaller reporting company” and “emerging growth company” in Rule 12b-2 of the Exchange Act. | | | | | | | | | | | | | | | | | | | | | | | | | | | | | |
| ☑ | Large accelerated filer | ☐ | Accelerated filer | ☐ | Non-accelerated filer | ☐ | Smaller reporting company | ☐ | Emerging growth company |
If an emerging growth company, indicate by check mark if the registrant has elected not to use the extended transition period for complying with any new or revised financial accounting standards provided pursuant to Section 13(a) of the Exchange Act. ¨
Indicate by check mark whether the registrant has filed a report on and attestation to its management’s assessment of the effectiveness of its internal control over financial reporting under Section 404(b) of the Sarbanes-Oxley Act (15 U.S.C. 7262(b)) by the registered public accounting firm that prepared or issued its audit report. ☑
If securities are registered pursuant to Section 12(b) of the Act, indicate by check mark whether the financial statements of the registrant included in the filing reflect the correction of an error to previously issued financial statements. ¨
Indicate by check mark whether any of those error corrections are restatements that required a recovery analysis of incentive-based compensation received by any of the registrant's executive officers during the relevant recovery period pursuant to §240.10D-1(b). ¨
Indicate by check mark whether the registrant is a shell company (as defined in Rule 12b-2 of the Exchange Act). Yes ☐ No ☑
The aggregate market value of the Common Stock (based upon the closing stock price of the Common Stock of Stewart Information Services Corporation, as reported by the NYSE on June 30, 2022)2023) held by non-affiliates of the Registrant was approximately $1.3$1.1 billion.
On February 17, 2023,16, 2024, there were 27,193,45727,464,157 outstanding shares of the Registrant's Common Stock.
Documents Incorporated by Reference
Portions of the definitive proxy statement (the Proxy Statement), in connection with the Registrant's 20232024 Annual Meeting of Stockholders, are incorporated herein by reference in Part III of this document.
FORM 10-K ANNUAL REPORT
YEAR ENDED DECEMBER 31, 20222023
TABLE OF CONTENTS
| | Item | Item | | Page | Item | | Page |
| | |
| | | |
| 1 | |
| | 1 | |
| | 1 | 1 | | | | |
| 1A. | 1A. | | | 1A. | | |
| 1B. | 1B. | | | 1B. | | |
| 1C. | | 1C. | | |
| 2 | 2 | | | 2 | | |
| 3 | 3 | | | 3 | | |
| 4 | 4 | | | 4 | | |
| | | |
| | |
| | |
| | | |
| 5 | |
| | 5 | |
| | 5 | 5 | | | | |
| 7 | 7 | | | 7 | | |
| 7A. | 7A. | | | 7A. | | |
| 8 | 8 | | | 8 | | |
| 9 | 9 | | | 9 | | |
| 9A. | 9A. | | | 9A. | | |
| 9B. | 9B. | | | 9B. | | |
| 9C. | | 9C. | | |
| | | |
| | |
| | |
| | | |
| 10 | |
| | 10 | |
| | 10 | 10 | | | | |
| 11 | 11 | | | 11 | | |
| 12 | 12 | | | 12 | | |
| 13 | 13 | | | 13 | | |
| 14 | 14 | | | 14 | | |
| | | |
| | |
| | |
| | | |
| 15 | |
| | 15 | |
| | 15 | 15 | | | | |
| 16 | 16 | | | 16 | | |
| | | |
| | |
| | |
| | | |
As used in this report, “we,” “us,” “our,” the “Company” and “Stewart” mean Stewart Information Services Corporation and our subsidiaries, unless the context indicates otherwise.
PART I
Item 1. Business
Founded in 1893, Stewart Information Services Corporation (NYSE:STC) (Stewart) is a customer-focused, global title insurance and real estate services company offering products and services through our direct operations, network of approved agencies and other companies within the Stewart family. One of the largest title companies in the industry, Stewart provides services to homebuyers and sellers, residential and commercial real estate professionals, mortgage lenders and servicers, title agencies, real estate attorneys and home builders. Stewart also provides appraisal management services, online notarization and closing services, search and valuation services, credit and real estate data services, home and personal insurance services, tax-deferred exchanges, and technology services to streamline the real estate process. Stewart is headquartered in Houston, Texas and operates primarily throughout the United States (U.S.) and has regional offices in Australia, Canada, the Caribbean, Europe, Mexico and the United Kingdom.
Our companies are industry leaders in the spaces they operate in and while each is unique in service offerings, they all share a common belief in providing highest level of services through team focus and customer-centric mindset. For more information on various Stewart companies and brands, refer to our website, www.stewart.com/en/about-stewart/stewart-brands.html.
Title Segment
Title insurance and related services include the functions of searching, examining, closing and insuring the condition of the title to real property. The title segment also includes home and personal insurance services, Internal Revenue Code Section 1031 tax-deferred (Section 1031) exchanges, and digital customer engagement platform services.
Examination and closing. The purpose of a title examination is to ascertain the ownership of the property being transferred, debts that are owed on it and the scope of the title policy coverage. This involves searching for and examining documents such as deeds, mortgages, wills, divorce decrees, court judgments, liens, assessments and tax records.
At the closing or settlement of a sale transaction, the seller executes and delivers a deed to the new owner. The buyer typically signs new mortgage documents and closing funds are disbursed to the seller, the prior lender, real estate brokers, the title company and others. Certain documents, such as the deed and mortgage or deed of trust, are then recorded in the public records. A title insurance policy is generally issued to both the new lender and the owner at the closing of the transaction.
At the closing or settlement of a refinance transaction, the borrower executes and delivers a mortgage or deed of trust to the lender. The borrower typically signs the mortgage documents and closing funds are ordinarily disbursed to the prior lender, the title company and others. Certain documents are then recorded in the public records. A title insurance policy is generally issued to the new lender at the closing or recording of the transaction.
Title insurance policies. Lenders in the United States generally require title insurance as a condition to making a loan on real estate, including securitized lending, as this assures lenders of the priority of their lien position on the real estate property. Also, the purchasers of the real estate property want insurance to protect against claims that may arise against the title to the property. The face amount of the owner's policy is normally the purchase price in a purchase transaction, while the face amount of the lender's policy is the amount of the related loan when financing is involved in either purchase or refinance transaction.
Title insurance is substantially different from other types of insurance. Fire, auto, health and life insurance policies protect against future losses and events. In contrast, title insurance generally insures against losses from past events and seeks to protect the policyholder or lender by eliminating covered risks through the examination and settlement process. In essence, subject to its exceptions, conditions and exclusions, an owner's title insurance policy provides a warranty to the policyholder that the title to the property is free from defects that might impair ownership rights, or in the case of a lender's policy, that there is priority of lien position. Most other forms of insurance provide protection for a limited period of time and, hence the policy must be periodically renewed. Title insurance, however, is issued for a one-time premium and the owner's policy provides protection for as long as the owner owns the property, or has liability in connection with the property, or a lender under its policy has its insured lien on the property. Also, a title insurance policy does not have a finite contract term, whereas most other lines of insurance have definite beginning and ending dates for coverage. Although an owner's title insurance policy provides protection for as long as the owner owns the property being covered, the title insurance company generally does not have information about which policies are still effective. Most other lines of insurance receive periodic premium payments and policy renewals thereby allowing the insurance company to know which policies are effective. In certain circumstances, we may provide post-policy coverage and we may provide coverage against certain known risks after analyzing the underwriting risks.
Losses. Losses on policies occur when a title defect is not discovered during the examination and settlement process. Reasons for losses include, but are not limited to, forgeries, misrepresentations, unrecorded or undiscovered liens, the failure to pay off existing liens, mortgage lending fraud, mishandling or defalcation of settlement funds, issuance by independent agencies of unauthorized coverage and defending policyholders when covered claims are filed against an owner's or lender's interest in the property. Losses may also occur for coverage that we may provide under Closing Protection Letters.closing protection letters.
Some claimants seek damages in excess of policy limits. Those claims are based on various legal theories. We vigorously defend against spurious claims and provide protection for covered claims up to the limits set forth in the policy. We have from time-to-time incurred losses in excess of policy limits. Experience shows that most policy claims and claim payments are made in the first eight years after the policy has been issued, although claims can also be reported and paid many years later. By their nature, claims are often complex, vary greatly in dollar amounts and are affected by economic and market conditions, the specific facts of the individual claim and the legal environment existing at the time claims are processed.
Our liability for estimated title losses comprises estimates of both known claims and incurred but unreported claims expected to be paid in the future for policies issued as of the balance sheet date. The amount of our loss reserve represents the aggregate future payments (net of recoveries) that we expect to make on policy losses and in costs to settle claims. In accordance with industry practice, these amounts have not been discounted to their present values. Estimating future title loss payments is difficult due to the complex nature of title claims, the length of time over which claims are paid, the significant variance in dollar amounts of individual claims and other factors. The amounts provided for policy losses are based on reported claims, historical loss payment experience and the current legal and economic environment. Estimated provisions for current year policy losses are charged to income in the same year the related premium revenues are recognized. Annual provisions for policy losses also include changes in the estimated aggregate liability on policies issued in prior years.
Amounts shown as our estimated liability for future loss payments are continually reviewed by us for reasonableness and adjusted as appropriate. We have consistently followed the same basic method of estimating and recording our loss reserves for more than 30 years. As part of our process, we also obtain input from third-party actuaries regarding our methodology and resulting reserve calculations. While we are responsible for determining our loss reserves, we utilize this actuarial input to assess the overall reasonableness of our estimated reserves.
Factors affecting revenues. Title insurance revenues are closely related to the level of activity in the real estate markets we serve and the prices at which real estate sales are made. Real estate sales are directly affected by the availability and cost of money to finance purchases. Other factors include consumer confidence, demand by buyers, foreign currency exchange rates, supply chains, inventory and weather. In periods of low interest rates, loan refinancing transactions are also an important contributor to revenues. These factors may override the seasonal nature of the title business. Generally, our first quarter is the least active and our second and third quarters are the most active in terms of title insurance revenues. Refer to Item 7 - MD&A, Results of Operations - Industry Data for comparative information on home sales, mortgage interest rates and loan activity, and Critical Accounting Estimates - Factors Affecting Revenues for additional details on principal factors affecting revenues.
Customers. The primary sources of title insurance business are attorneys, builders, developers, home buyers and home sellers, lenders, mortgage brokers, and real estate brokers and agents. Titles insured include residential and various asset classes of commercial properties, including but not limited to, energy-related projects, office, hotel, multi-family, industrial, retail, undeveloped acreage, farms ranches, wind and solar power installations and other energy-related projects.ranches.
Service, location, financial strength, company size and related factors affect customer orders. Increasing market share is accomplished primarily by providing superior service. The parties to a closing are concerned with accuracy, expertise, responsiveness, timeliness and cost. The rates charged to customers vary from state to state, and are regulated, to varying degrees and in different ways, in most states.
The financial strength and stability of the title underwriter are important factors in maintaining and increasing our business, particularly commercial business. We are rated as investment grade by the title industry’s leading rating agencies. Our wholly-owned and principal underwriter, Stewart Title Guaranty Company (Guaranty), is currently rated “A Double Prime” by Demotech Inc., "A-" by Fitch Ratings Ltd., and "A- " by A.M. Best. Similarly, our wholly-owned and second largest underwriter, Stewart Title Insurance Company (STIC), is also highly rated by such rating companies. These ratings are not credit ratings. Instead, the ratings are based on quantitative, and in some cases qualitative, information and reflect the conclusions of the rating agencies with respect to our financial strength, results of operations and ability to pay policyholder claims. Additionally, our parent company's outstanding senior unsecured debt is rated "BBB" by Fitch Ratings Ltd. These ratings are not a recommendation to buy, sell or hold securities and may be subject to revision or withdrawal at any time by the assigning rating agency.
Market share. Title insurance statistics are compiled quarterly by the American Land Title Association (ALTA), the title industry’s national trade association. Based on 20222023 statutory premiums written through the nine months ended September 30, 2022,2023, Guaranty is one of the leading title insurers in the United States. Our largest competitors are Fidelity National Financial, Inc. (FNF)(Fidelity National Financial) whose principal underwriters are ChicagoFidelity National Title Insurance Company and Fidelity NationalChicago Title Insurance Company, First American Financial Corporation (First American) which includes First American Title Insurance Company, and Old Republic Title Insurance Group (Old Republic) which includes Old Republic National Title Insurance Company. We also compete with other title insurer companies, as well as abstractors, attorneys who issue title opinions and attorney-owned title insurance funds. A number of homebuilders, financial institutions, real estate brokers and others own or control title insurance agencies, some of which issue policies underwritten by Guaranty.
During 2022, continuing with our strategy of investing opportunistically to build a stronger and more resilient company, we acquired FNC Title Services, LLC, which specializes in providing title insurance and settlement services to reverse mortgage, conventional and commercial closings nationwide, and BCHH, LLC, a national provider of title and settlement services to individual and institutional investors and lenders.
Refer to "Title revenues by geographic location" within the Results of Operations discussion under Item 7 - MD&A for the breakdown of title revenues by major geographic location.
Regulations. Title insurance companies are subject to comprehensive state regulations covering premium rates, agency licensing, policy forms, trade practices, reserve requirements, investments and the transfer of funds between an insurer and its parent or its subsidiaries and any similar related party transactions. Kickbacks and similar practices are prohibited by most state and federal laws. See Item 1A - Risk Factors: Our Insurance Subsidiaries Must Comply With Extensive Government Regulations.
Real Estate Solutions Segment
The real estate solutions segment supports the real estate mortgage industry by primarily providing appraisal management services, online notarization and closing solutions, credit and real estate information services, and search and valuation services. We provide these services through Stewart Valuation Intelligence (formerly,(composed of formerly separate companies United States Appraisals and Pro-Teck Services Ltd.), NotaryCam, Inc., Signature Closers, LLC, Informative Research, and Equimine (which operates as PropStream). These companies are integral to our goal of streamlining the real estate and loan transaction lifecycle through end-to-end, customer-focused and technology-based solutions.
Factors affecting revenues. As in the title segment, real estate solutions revenues are closely related to the level of activity in the real estate market, including interest rates, new or refinancing origination activity, and home sales volumes. Companies that compete with our real estate solutions businesses vary across a wide range of industries and include the major title insurance underwriters mentioned under “Title Segment - Market share” as well as other title agents, appraisal management companies, and real estate technology and business process outsourcing providers.
Customers. Customers for our real estate solutions products and services primarily include mortgage lenders and servicers, mortgage brokers, realtors, and mortgage and real estate investors. Many of the services and products offered by our real estate solutions business are used by professionals and intermediaries who have been retained to assist consumers with the sale, purchase, mortgage, transfer, recording and servicing of real estate transactions. To that end, timely, accurate and compliant services are critical to our customers since these factors directly affect the service they provide to their customers. Financial strength, scale, robust processes to ensure legal and regulatory compliance, marketplace presence, high quality customer support, and reputation as a reliable, compliant solution are important factors in attracting new business.
Corporate and Other Segment
The corporate and other segment is primarily comprised of the parent holding company and our centralized administrativesupport services departments. During 2022, the corporate and other segment included results of a real estate brokerage company that was acquired in late 2021 and subsequently sold during the second quarter 2022.
General
Investment policies. Our investment portfolios primarily reside in Guaranty and STIC, both of which are domestic underwriters, and two of our other international regulated insurance underwriters. These underwriters maintain investments in accordance with certain statutory requirements for the funding of premium reserves and deposits, or, in the case of our international operations, for the maintenance of certain capital ratios required by regulators. The activities of the portfolios are overseen by investment committees comprised of certain senior executives. Their oversight includes such activities as policy setting, determining appropriate asset classes with different and distinct risk/return profiles so as to prudently diversify the portfolio, and approving and managing service vendors (investment managers and custodians). We also utilize the expertise of third-party investment advisors to maximize returns while managing risk. Our investment policies are designed to comply with regulatory requirements as applicable law imposes restrictions upon the types and amounts of investments that may be made by our regulated insurance subsidiaries. Further, our investment policies require that investments are managed with a view to balancing profitability, liquidity, and risk (interest rate risk, credit risk, currency rate risk and liquidity risk) and consideration of negative impacts to earnings per share and income taxes.
As of December 31, 2022,2023, approximately 86%90% of our combined debt and equity securities investment portfolios consisted of fixed income securities. Also as of that date, approximately 95%94% of the fixed income investments are held in securities that are A-rated or higher, and substantially all of the fixed income portfolios are rated investment grade (percentages are based on the fair value of the securities). In addition to our debt and equity securities investment portfolios, we maintain certain money-market and other short-term investments. For more details on market risks related to our investment securities portfolio, refer to Part II, Item 7A, Quantitative and Qualitative Disclosures About Market Risk.
TrademarksTrademarks. We have developed and acquired numerous automated products and processes that are crucial to both our title and real estate solutions operations. These systems automate most facets of the real estate transaction. Among these trademarked products and processes are AIM+®, AgencySecure®, PropertyInfo®, SureClose®, TitleSearch®, eTitleSearch®, Virtual Underwriter®, StewartNow®, Valuation Intelligence®, NotaryCam®, Cloudvirga® and PropStream®. We consider these trademarks, which can be renewed every ten years, to be important to our business.
Human capital resources. As of December 31, 2022,2023, we employed approximately 7,1006,800 people, with approximately 6,1005,450 employees located in the U. S. and approximately 1,0001,330 employees located internationally. We consider our relationship with our employees to be critical to both our operations and performance. We are committed to attracting, developing, retaining, and motivating a diverse and inclusive group of employees, and we do so in a variety of ways.
For additional information about our workforce, sustainability efforts, human capital programs and initiatives, specificallyincluding our Culture of Caring, visit our website (www.stewart.com) and review our 2021 Environmental, Social and Governance (ESG)published Sustainability Report.
Recruiting
Stewart is committed to recruiting strategies – policies, practices, decision-making and more – grounded in fairness, equity, and inclusivity. Stewart is an equal employment opportunity employer, and our commitment extends to all facets of employment.
Inclusion and diversity
Stewart is committed to an inclusive workplace that values all employees equally regardless of age, race, ethnicity, sexual orientation, or gender identification and committed toby providing a supportive diverse professional work environment that is free of unlawful harassment and prohibits discrimination against any applicant or employee as protected by federal, state or applicant for employment as defined by applicable laws as well as best practices in corporate governance.local laws. All phases of employment, including, but not limited to, recruiting, selection, employment, placement, promotion, transfer, demotion, reduction of force and termination, benefits, training, rates of pay or other forms of compensation, and compensationother terms and conditions of employment are guided by the Company policies regarding conduct, including, but not limited to, Stewart’s Equal Opportunity Employer statement, Anti-Harassment policy, Human Rights policy and our Code of Business Conduct and Ethics. Stewart's Code of Business Conduct and Ethics is reviewed and acknowledged annually by our employees and by our Board of Directors.
We continue our journey and commitment to inclusion and belonging throughwith strategic oversight from our Diversity, Equity, and Inclusion (DE&I) Council, which introduces practices and programs that benefit our workplaceemployees and drive systemic change within the workplace and the communities in which we live and work. Stewart’s DE&I Council meets frequentlyregularly to discuss critical topics, weigh inadvise on important challenges our employees are facing, and ensure we are focused on strategic priorities grounded in our overall DE&I commitment.
Learning and development
Stewart’s approach to talent development encourages continuous learning and professional development for all employees across the organization createsthrough transparency around job expectations, through asupported by deliberate goal setting, performance, coaching and feedback, process,which allows Stewart employees to take ownership of their career and provides them with the resources needed to be successful in their current as well asand future roles.
Compensation, benefits and well-being
Stewart cares about the health, safety, and well-being of our employees and their families, and provides a variety of valuable programs to improve and maintain their overall health, including physical, mental, social, emotional and financial wellness. Highlights of the key programs include, but are not limited to, health and welfare benefits, including but not limited to, medical, dental and vision coverage, life and disability insurance, 401(k) plan match, participation in an employee stock purchase plan (ESPP), health savings account, flexible spending account, an employee assistance program, emotional health with a discount, wellness initiatives, paid sick, vacation, holidays and wellness programs,volunteer time off, local community based charitable programs, including employee volunteer opportunities, through the Stewart Title Foundation, and global employee appreciation and recognition programs.recognition.
Employee engagement and recognition
In partnership with an outside firm, we conducted a U.S. employee engagement survey in early 2022 and a U.S. employee pulse survey in 2023 to better and more formally understand employee sentiment and gain actionable feedback on culture and engagement. The results have helpedcontinued to guide our path forward onin keeping employees engaged, feeling valued, ensuring Stewart is a place where our employees are proud to work, and strengthening our relationship with the communities we serve. Additionally, based on the survey feedback received from our employees, we have beenwere recognized in the Top Workplaces program as a 2023 Top Workplace USA and for Employee Appreciation, Employee Well-Being, as well as several regional Top Workplaces awards.
Cybersecurity. While Stewart regularly defends against, responds to and mitigates risks from information technology (IT) systems and software vulnerabilities, broader cybersecurity threats and data security incidents, we experienced no known material cyber breaches during the three-year period ended December 31, 2022. In the event a material breach or an IT disruption takes place in the future, we have an incident response team in place to take immediate actions, work with local and national law enforcement, and notify the appropriate regulators, our Board of Directors and impacted parties. In addition, we would work with the NYSE to disclose the scope and effect of the breach or disruption through an appropriate Form 8-K filing, without providing information that could affect any law enforcement investigation. Stewart utilizes considerable resources in its cybersecurity efforts, both in network, system and application security as well as in the protection of personal, private and confidential information. Firewalls, application security, encryption, access control, vulnerability management and intrusion detection systems are some, but not all, of the resources used in the Company’s efforts to prevent cybersecurity breaches.
Stewart is regularly assessed against the cybersecurity frameworks of the National Institute of Standards and Technology (NIST CSF), and also evaluated for compliance with the SSAE-18 Systems and Organization Controls (SOC) standards of the American Institute of Certified Public Accountants (AICPA). In addition, the Company has a comprehensive and continuous information security awareness program that includes function and behavior-based training. Finally, vendor risk management is an essential part of the Company’s Enterprise Governance Risk and Compliance (GRC) program. All vendors are assessed and measured against standard security frameworks. Approved vendors are continuously monitored for performance and compliance, and vendor security requirements are well defined and included with all master service agreements and contracts. Vendor performance and compliance is continuously monitored throughout the calendar year and reassessed or audited annually. Our Chief Information Security Officer updates the Company’s Audit Committee quarterly on our cybersecurity preparedness, as well as providing ad hoc updates as needed.company.
Available information. We electronically file annual, quarterly and other reports and information with the Securities and Exchange Commission (SEC) under the Securities Exchange Act of 1934, as amended (Exchange Act). Our electronic filings can be accessed at the SEC's website at www.sec.gov. We also make available upon written request, free of charge, or through our website, our annual reports on Form 10-K, quarterly reports on Form 10-Q, current reports on Form 8-K, Code of Ethics and, if applicable, amendments to those reports filed or furnished pursuant to Section 13(a) or 15(d) of the Exchange Act, as soon as reasonably practicable after we electronically file such material with, or furnish it to, the SEC.
The references in this annual report on Form 10-K to our website address or any third party’s website address, including the SEC’s website, do not constitute incorporation by reference of the information contained in those websites and should not be considered part of this document unless otherwise expressly stated.
Transfer agent. Our transfer agent is Computershare, which can be contacted via regular mail at P.O. Box 43006,43078, Providence, RI 02940-300602940-3078 and via its website (https://www-us.computershare.com/investor)investor).
CEO and CFO certifications. The CEO and CFO certifications required under Section 302 of the Sarbanes-Oxley Act are filed as exhibits to our 20222023 Form 10-K. During 2023, Stewart submitted during 2022completed its annual CEO Certification under Section 303A.12(a) of the New York Stock Exchange (NYSE) Listed Company Manual.
Item 1A. Risk Factors
You should consider the following risk factors, as well as the other information presented in this report and our other filings with the SEC, in evaluating our business and any investment in Stewart. These risks could materially and adversely affect our business, financial condition and results of operations. In that event, the trading price of our Common Stock could decline materially.
Strategic Risk Factors
Acquisitions or strategic investments we have made or may make could turn out to be unsuccessful.
As part of our investment and growth strategy, we frequently monitor and analyze opportunities to acquire or make a strategic investment in new or other businesses where we believe we can have sustained success and improve Stewart’s scale and profitability. The negotiation of potential acquisitions or strategic investments as well as the integration of an acquired business or new personnel, could result in a substantial diversion of management resources. Future acquisitions could likewise involve numerous additional risks such as potential losses from unanticipated litigation or levels of claims and inability to generate sufficient revenue to offset acquisition costs. Additionally, certain of the investments that we frequently make are in regulated entities that are required to comply with various governmental regulatory requirements, which may impose significant costs on such entities or otherwise impact the value of our investments therein. As we pursue or consummate a strategic transaction or investment, we may value the acquired or funded company or operations incorrectly, fail to integrate the acquired operations appropriately into our own operations, fail to successfully manage our operations as our product and geographical diversity increases, expend unforeseen costs during the acquisition or integration process, or encounter other unanticipated risks or challenges. If we succeed in consummating a strategic investment, we may fail to value it accurately or divest it or otherwise realize the value which we originally invested or have subsequently reflected in our consolidated financial statements. Any failure by us to effectively limit such risks or implement our acquisitions or strategic investment strategies could have a material adverse effect on our business, financial condition or results of operations.
Innovations and title insurance alternatives introduced by real estate industry participants, including Stewart and our competitors, lenders and investors may be potentially disruptive and could adversely affect Stewart
Various initiatives and alternatives to traditional title insurance and settlement products and services are or may be introduced by real estate industry participants, including Stewart and our competitors, utilizing innovative technologies, processeslenders and techniques in order to improve the manner and timeliness of delivering products and services, increase efficiency, improve the quality of products and services and customer experience, and enhance risk management. These efforts include implementing advanced technologies to automate and streamline certain manual processes during, but not limited to, search and examination, title insurance policy issuance, and real estate transaction settlement. Innovations by our competitorsinvestors, which may change the demand for our products and services, the manner our products and services are ordered or fulfilled, and the revenue or profitability derived from our products and services. Innovation initiatives include implementing advanced technologies, processes and techniques to automate and streamline certain manual processes during title search, insurance policy issuance and real estate transaction settlement to improve the manner and timeliness of delivering products and services, increase efficiency, reduce costs, improve product and service quality and customer experience, and enhance risk management. Alternatives to title insurance policies, such as an attorney opinion letter which may not provide the same level of protection as traditional title policies but may be a more cost-effective option, may become widely used and accepted which can affect the demand for our products and services.
Further, in developing and implementing our own innovation initiatives, we have made and will likely continue to make significant investments. Depending on factors relating to our operations, the real estate industry and the macroeconomic environment, these innovative investments may not be successful, may result in increased claims, reputational damage to our reputation or other material impactimpacts on Stewart, or could disrupt our business operations by significantly diverting management's attention.
Rapid changes in our industry require secure, timely and cost-effective technological responses. Our earnings may be adversely affected if we are unable to effectively use technology to address regulatory changes and increase productivity.
We believe that our future success depends, in part, on our ability to anticipate changes in the industry and to offer products and services that meet evolving standards on a timely and cost-effective basis. To do so requires a flexible and secure technology architecture, such as title production systems, which can continuously comply with changing regulations, improve productivity, lower costs, reduce risk and enhance the customer experience. Inability to meet these requirements and any unanticipated downtime in our technology may have a material adverse effect on our earnings.
Operational Risk Factors
Adverse changes in economic conditions, especially those affecting the levels of real estate and mortgage activity, may reduce our revenues.
Our financial condition and results of operations are affected by changes in economic conditions, particularly mortgage interest rates, credit availability, real estate prices and consumer confidence. Our revenues and earnings have fluctuated in the past due to the cyclical nature of the housing industry, and we expect them to continue to fluctuate in the future.
The demand for our title insurance-related and real estate solutions offerings is dependent primarily on the volume of residential and commercial real estate transactions. The volume of these transactions historically has been influenced by such factors as mortgage interest rates, inventory, affordability, availability of financing and the overall state of the economy. Typically, when interest rates are increasing or when the economy is experiencing a downturn, real estate activity declines. As a result, the title insurance industry tends to experience decreased revenues and earnings, and potentially increased claims experience.
Our revenues and results of operations have been and may in the future be adversely affected by a decline in home prices, real estate activity and the availability of financing alternatives. Deterioration in the macroeconomic environment generally causes weakness or adverse changes in the level of real estate activity, which could have a material adverse effect on our consolidated financial condition or results of operations, including impairment of our goodwill and long-lived assets. Also, we may not be able to accurately predict the effects of periods or expectations of high or rapidly rising inflation rates, and governmental responses thereto, and may not respond in a timely or adequate manner to mitigate the negative effects of such inflation, such as decreases in the demand for our products and services and higher labor and other expenses.
Our claims experience may require us to increase our provision for title losses or to record additional reserves, either of which would adversely affect our earnings.
We estimate our future loss payments, and our assumptions about future losses may prove inaccurate. Provisions for policy losses on policies written within a given year are charged to income in the same year the related premium revenues are recognized. The amounts provided are based on reported claims, historical loss payment experience and the current legal and economic environment. Losses that are higher than anticipated are an indication that total losses for a given policy year may be higher than originally calculated. Changes in the total estimated future loss for prior policy years are recorded in the period in which the estimate changes. Claims are often complex and involve uncertainties as to the dollar amount and timing of individual payments. Claims are often paid many years after a policy is issued. From time-to-time, we experience large losses, including losses from independent agency defalcations, wire fraud, title policies that have been issued or worsening loss payment experience, any of which may require us to increase our title loss reserves. These events are unpredictable and may have a material adverse effect on our earnings.
The issuance of our title insurance policies and related activities by title agents, which operate with substantial independence from us, could adversely affect our operations.
Our title insurance subsidiaries issue a significant portion of their policies through independent title agents. There is no guarantee that these title agents will fulfill their contractual obligations to us as contemplated, although such contracts include limitations that are designed to limit our risk with respect to their activities. In addition, regulators are increasingly seeking to hold title companies responsible for the actions of these title agents and, under certain circumstances, the Company may be held liable directly to third parties for actions (including defalcations) or omissions of these agents. Case law in certain states also suggests that the Company is liable for the actions or omissions of its agents in those states, regardless of contractual limitations. As a result, the Company’s use of title agents could result in increased claims on the Company’s policies issued through agents and an increase in other costs and expenses.
Competition in the title insurance industry may affect our revenues.
Competition in the title insurance industry is intense, particularly with respect to price, service and expertise. Larger commercial customers and mortgage originators also look to the size and financial strength of a title insurer. Although we are one of the leading title insurance underwriters based on market share, FNF,Fidelity National Financial, First American and Old Republic each has substantially greater gross revenues than we do and their holding companies have significantly greater capital. Further, other title insurance companies, collectively, hold a considerable share of the market. Although we are not aware of any current initiatives to reduce regulatory barriers to entering our industry, any such reduction could result in new competitors, including financial services firms or institutions, entering the title insurance business. From time-to-time, new entrants enter the marketplace with alternative products to traditional title insurance, although many of these alternative products have been disallowed by title insurance regulators. Further, advances in technologies could, over time, significantly disrupt the traditional business model of financial services and real estate-related companies, including title insurance. These alternative products or disruptive technologies, if permitted by regulators, could have a material adverse effect on our revenues and earnings.
Information technology (IT) systems present potential targets for cybersecurity attacks.
Our operations are reliant on technology and data. Our IT systems and our vendors' IT systems are used to store and process sensitive information regarding our operations and financial position as well as any information pertaining to our customers and vendors. While we take the utmoststrong precautions, we cannot guarantee safety from all cyber threats, IT system or software vulnerabilities, wire fraud and attacks to our systems.systems, or our ability to timely detect cyber incidents. Any successful breach of security could result in loss of sensitive data, spread of inaccurate or confidential information, disruption of operations, theft of escrowed funds, endangerment of employees, damage to our assets and increased costs to respond. Although we maintain cyber liability insurance to help protect us financially, there is no assurance that the instances noted above would not have a negative impact on cash flows, litigation status and/or our reputation, which could have a material adverse effect on our business, financial condition and results of operations. In the event of a material cybersecurity breach, we have an incident response teamRefer to Part I, Item 1C. Cybersecurity for our policies and procedures in place to take immediate actions, work with local and national law enforcement, notify impacted parties as well as appropriate state regulators and the NYSE.address cybersecurity risks.
Climate change and extreme weather events could adversely affect our operations and financial performance
Our operations and financial performance could be adversely impacted by climate change and extreme weather events, especially if these occurrences negatively impact the overall real estate market and the broader economy. With respect to our investment portfolio, both individual corporate securities, as well as securities issued by municipalities could also see their value affected by such events. Given the unpredictable and uncertain nature of climate change and weather with respect to size, severity, frequency, geography, and duration, we are unable to quantify the true impact these events would have on our business and operations. As a result of the growing importance that climate change has on both the Company’s operations as well as society in general, Stewart has made a formal statement on its commitment to the health of the global environment. The Company will also continue to update investors on the progress it is making to positively contribute to environmental preservation through its annual ESG reports. These and other environmental-related documents can be found in the Investor Relations - Governance section of the Company's website.
Errors and fraud relating to fund transfers may adversely affect us
The Company relies on its systems, employees and banks to transfer its own funds and the funds of third parties. These transfers are susceptible to user input error, fraud, system interruptions and other similar errors that, from time to time, result in lost funds or delayed transactions. Our email and computer systems, and systems used by other parties involved in a transaction have been subject to and are likely to continue to be the target of, fraudulent attacks, including attempts to cause us or the other parties to improperly transfer funds. Funds transferred to a fraudulent recipient are often not recoverable and in certain instances, we may be liable for those unrecovered funds. Our controls and procedures in place to prevent transfer errors and fraud may prove inadequate and may result in financial losses, reputational harm to our reputation, loss of customers or other adverse consequences which could be material to Stewart.
Climate change and extreme weather events could adversely affect our operations and financial performance
Our operations and financial performance could be adversely impacted by climate change and extreme weather events, especially if these occurrences negatively impact the overall real estate market and the broader economy. With respect to our investment portfolio, both individual corporate securities, as well as securities issued by municipalities could also see their value affected by such events. Given the unpredictable and uncertain nature of climate change and weather with respect to size, severity, frequency, geography, and duration, we are unable to quantify the true impact these events would have on our business and operations. As part of our emergency response management, we have an enterprise-wide business continuity program and disaster recovery plan to ensure continued operations of critical services in the event of a disruption to regular operations. Also, as a result of the growing importance that climate change has on both the Company’s operations as well as society in general, Stewart is committed to caring for the health of the global environment. The Company will also continue to update investors on the progress it is making to positively contribute to environmental preservation through its annual sustainability reports. These and other environmental-related documents can be found in the Investor Relations - Governance section of the Company's website.
Widespread health crises could adversely impact our business operations
Widespread health crises and responses to such events could adversely affect the Company. Although the title insurance industry has been deemed essential in the United States, health crises and measures to address them may cause disruptions in the real estate market and on our business operations. These disruptions, which may include, among others, decreased volume of orders and other business activity, delayed closing of real estate transactions, office closures, and decreased value of investments and other assets, may significantly impact our future results of operations and financial position.
Regulatory and Compliance Risk Factors
A downgrade of our underwriters by rating agencies may reduce our revenues.
Ratings are a significant component in determining the competitiveness of insurance companies with respect to commercial title policies. Our domestic underwriters, Guaranty and STIC, have historically been highly rated by the rating agencies that cover us. These ratings are not credit ratings. Instead, the ratings are based on quantitative, and in some cases qualitative, information and reflect the conclusions of the rating agencies with respect to our financial strength, results of operations and ability to pay policyholder claims. Our ratings are subject to continual review by the rating agencies, and we cannot be assured that our current ratings will be maintained. If our ratings are downgraded from current levels by the rating agencies, our ability to retain existing customers and develop new customer relationships may be negatively impacted, which could result in a material adverse impact on our consolidated financial condition or results of operations.
Our insurance subsidiaries must comply with extensive government regulations. These regulations and the enforcement environment could adversely affect our ability to increase our revenues and operating results.
The Consumer Financial Protection Bureau (CFPB) is charged with protecting consumers by enforcing federal consumer protection laws and regulations. The CFPB is an independent agency and funded by the United States Federal Reserve System. Its jurisdiction includes banks, credit unions, securities firms, payday lenders, mortgage servicing operations, foreclosure relief services, debt collectors and other financial companies. The nature and extent of these regulations include, but are not limited to: conducting rule-making, supervision, and enforcement of federal consumer protection laws; restricting unfair, deceptive, or abusive acts or practices; marshalling consumer complaints; promoting financial education; researching consumer behavior; monitoring financial markets for new risks to consumers; and enforcing laws that outlaw discrimination and other unfair treatment in consumer finance.
Governmental authorities regulate our insurance subsidiaries in the various states and international jurisdictions in which we do business. These regulations generally are intended for the protection of policyholders rather than stockholders. The nature and extent of these regulations vary from jurisdiction to jurisdiction, but typically involve:
•approving or setting of insurance premium rates;
•setting standards of solvency and minimum amounts of statutory capital and surplus that must be maintained;
•limitationsplacing limits on types and amounts of investments;
•establishing reserves, including statutory premium reserves, for losses and loss adjustment expenses;
•regulating underwriting and marketing practices;
•regulating dividend payments and other transactions among affiliates;
•prior approval forapproving the acquisition and control of an insurance company or of any company controlling an insurance company;
•licensing of insurers, agencies and, in certain states, escrow officers;
•regulation ofregulating reinsurance;
•restrictions onrestricting the size of risks that may be insured by a single company;
•requiring deposits of securities for the benefit of policyholders;
•approval ofapproving policy forms;
•approving and prescribing methods of accounting; and
•filing of annual and other reports with respect to financial condition and other matters.
These regulations may impede or impose burdensome conditions on rate increases or other actions that we might want to take to enhance our operating results. In addition, state regulators perform periodic examinations of insurance companies, which could result in increased compliance or legal expenses.
We may also be subject to additional state or federal regulations prescribed by legislation such as the Dodd-Frank Act or by regulations issued by the CFPB, Department of Labor, Office of the Comptroller of the Currency, Occupational Safety and Health Administration, Department of the Treasury or other agencies. Additionally, we have in the past and may in the future be subject to investigations or inquiries from regulators, including state attorneys general. We incur costs as a result of such investigations or inquiries, including increased compliance costs, which may impact our operating results.
Finally, changes in regulations or new regulations in our industry may be introduced that wouldcould have a material adverse effect on our business or result in increased costs of compliance.
Dividends from our insurance underwriting subsidiaries are an important source for capital planning.
We are a holding company and we receive dividends from our insurance subsidiaries and unregulated subsidiaries to pay our parent company's operating expenses, debt service obligations and dividends to our common stockholders. While we may have adequate cash available in our parent company and unregulated subsidiaries to fund these obligations, we may depend on dividends from our insurance underwriting subsidiaries to meet cash requirements for acquisitions and other strategic investments. In regard to our insurance subsidiaries, which include Guaranty and STIC, the insurance statutes and regulations of some states require us to maintain a minimum amount of statutory capital and restrict the amount of dividends that our insurance subsidiaries may pay to us. Refer to Note 3 to our audited consolidated financial statements and Item 7 - MD&A - Liquidity and Capital Resources for details on statutory surplus and dividend restrictions.
Financial Risk Factors
Availability and cost of credit may reduce our liquidity and negatively impact our ability to fund operations.
We expect that cash flows from operations and cash available from our underwriters, subject to regulatory restrictions, will be sufficient to fund our operations, pay our claims and fund operational initiatives. To the extent that these funds are not sufficient, we may be required to borrow funds on less than favorable terms or seek funding from the equity market, which may be on terms that are dilutive to existing shareholders. Increases in interest rates also increase the costs associated with borrowing on our floating rate line of credit facility. As of December 31, 2023, we have an available $197.5 million borrowing capacity on our existing line of credit facility.
Unfavorable economic or other business conditions could cause us to record an impairment of all or a portion of our goodwill, other intangible assets and other long-lived assets.
We perform annual impairment tests of the carrying values of our goodwill, other intangible assets and other long-lived assets. We may also perform an evaluation whenever events may indicate an impairment has occurred. In assessing whether an impairment has occurred, we consider whether the performance of our reporting units may be below projections, unexpected declines in our market capitalization, negative macroeconomic trends or negative industry and company-specific trends. We also perform reviews, at the asset group level, if carrying values of our long-lived assets are not recoverable. If we conclude that the carrying values of these assets exceed the fair value or are not recoverable, we may be required to record a noncash impairment of these assets. Any substantial impairment that may be required in the future could have a material adverse effect on our results of operations or financial condition.
Our investment portfolio is subject to interest rate and other risks and could experience losses.
We maintain a substantial investment portfolio, primarily consisting of fixed income debt securities and, to a lesser extent, equity securities. Our portfolio holdings are subject to certain economic and financial market risks, including credit risk, interest rate risk, foreign exchange rate risk and liquidity risk. Instability in credit markets and economic conditions can increase the risk of loss in our portfolio. Periodically, we assess the recoverability of the amortized cost of our debt securities investments. If the amortized cost of such investments exceeds the fair value, and we conclude the decline is other-than-temporary, we are required to record an impairment. The impairment could have a material adverse effect on our results of operations or financial condition.
Claims by large classes of claimants may impact our financial condition or results of operations.
We are involved in litigation arising in the ordinary course of business. In addition, we may be, and have been in the past, subject to claims and litigation from large classes of claimants seeking substantial damages not arising in the ordinary course of business. Material pending legal proceedings not in the ordinary course of business, if any, would be disclosed in Part I, Item 3—Legal Proceedings. To date, the impact of the outcome of these proceedings has not been material to our consolidated financial condition or results of operations. However, an unfavorable outcome in any litigation, claim or investigation against us could have a material adverse effect on our consolidated financial condition or results of operations.
Failures at financial institutions at which we deposit funds could adversely affect us.
We deposit substantial fiduciary funds, which are third-party funds, and operating funds in many financial institutions in excess of insured deposit limits. In relation to fiduciary funds, we perform appropriate account titling and management which leaves the majority of accounts within insured limits. Those above the limits, which typically relate to large residential or commercial settlement transactions, are generally placed in well-capitalized financial institutions. In the event that one or more of these financial institutions fail, there is no guarantee that we could recover the deposited funds in excess of federal deposit insurance, and, as such, we could be held liable for the funds owned by third parties. Under these circumstances, our liability could have a material adverse effect on our results of operations or financial condition.
General Risk Factor
Our business could be disrupted as a result of a threatened proxy contest and other actions of activist stockholders.
We have previously been the subject of actions taken by activist stockholders. When activist activities occur, our business could be adversely affected because we may have difficulty in attracting and retaining customers, agents, mortgage lenders, servicers, employees and board members due to perceived uncertainties as to our future direction and negative public statements about our business; such activities may materially harm our relationships with current and potential customers, investors, lenders, and others; may otherwise materially harm our business, may adversely affect our operating results and financial condition; responding to proxy contests and other similar actions by stockholders is likely to result in our incurring substantial additional costs, including, but not limited to, legal fees, fees for financial advisors, fees for investor relations advisors, and proxy solicitation fees; significantly divert the attention of management, our Board of Directors and our employees; and changes in the composition of our Board of Directors due to activist campaigns may adversely affect our current strategic plan.
We cannot predict, and no assurances can be given as to, the outcome or timing of any matters relating to actions by activist stockholders or the ultimate impact on our business, liquidity, financial condition or results of operations.
Item 1B. Unresolved Staff Comments
None.
Item 1C. Cybersecurity
Stewart recognizes the importance of protecting our customers', employees' and partners’ confidentiality and data integrity. To that end, we continuously and methodically evaluate cyber risks, how they evolve and how they may affect us. We utilize considerable resources in our cybersecurity efforts, and we are committed to continuous cybersecurity education and training across our entire organization as well as our partners and customers. We continuously evaluate and monitor third-party risk relating to the protection of sensitive data. Our program focuses on a broad area of security domains, including, but not limited to: risk management, data protection, incident response, identity and access management, threat and vulnerability management, disaster recovery, business resiliency, and continuity.
Risk assessment and management
Stewart has an enterprise risk management (ERM) program to assess, identify, and manage risks. Cybersecurity risks are evaluated alongside other critical business risks under the ERM program to align cybersecurity efforts with Stewart’s broader business goals and objectives. The cybersecurity risk is assigned to the Vice President, Information Technology (IT), who is a member of the ERM committee, for monitoring. The cybersecurity risk is also under the management oversight of Stewart's Senior Leadership Team.
Stewart takes a risk-based approach to cybersecurity, which begins with the identification and evaluation of cybersecurity risks that could affect Stewart’s operations, finances, legal or regulatory compliance, or reputation. Once identified, cybersecurity risks and related mitigation efforts are prioritized based upon their potential impact and likelihood. Risk mitigation strategies are developed and implemented based upon the specific nature of each cybersecurity risk. These strategies include the application of cybersecurity policies, procedures, and technologies, and employee training, education, and awareness. Additionally, Stewart’s cybersecurity program provides mechanisms for employees to report any unusual or potentially malicious activity.
Stewart is regularly assessed against the cybersecurity frameworks of the National Institute of Standards and Technology (NIST CSF) and also evaluated for compliance with the SSAE-18 Systems and Organization Controls (SOC) standards of the American Institute of Certified Public Accountants (AICPA).
Stewart receives certain confidential or personal information related to its customers and employees. Stewart’s operations depend upon the secure collection, processing, retention and transmission of such information by and through Stewart and its vendors. Therefore, the performance, reliability, and security of Stewart’s technology infrastructure and information systems, and those of its vendors, are critical to Stewart’s operations and initiatives.
Vendor risk management is an essential part of Stewart’s Enterprise Governance Risk and Compliance (GRC) program. Critical vendors, which includes vendors that have access to personal information, are assessed and measured against standard security frameworks. Critical vendors are monitored for performance and compliance, and vendor security requirements are well defined and included with all master service agreements and contracts.
Incident response
In the event of a material breach or an information technology disruption, management has an incident response team in place to take immediate action, work with local and national law enforcement, and notify the appropriate regulators, our Board of Directors and impacted parties. In addition, we would work with the NYSE to disclose the scope and effect of the breach or disruption through an appropriate Form 8-K filing, without providing information that could affect any law enforcement investigation.
Cybersecurity governance and board oversight
The Board is responsible for overseeing management’s assessment of significant risks facing Stewart. The Board approves management’s strategy to manage these risks and monitors management’s performance in implementing the strategy. The Board’s oversight of cybersecurity risks occurs at both the full Board level and at the Board committee level through the Audit Committee.
The Board receives, at each regularly scheduled meeting, a risk report which includes an updated cybersecurity risk exposure assessment, a summary of existing cybersecurity controls and risk mitigations, and further planned controls and risk mitigation activities.
Our Chief Information Security Officer (CISO) reports quarterly to the Audit Committee concerning Stewart’s cybersecurity program, operations, and other ad hoc updates. On a regular basis, management conducts a third-party assessment of Stewart's cybersecurity controls, the results of which are reported to the Audit Committee.
Management’s role
Stewart’s cybersecurity function is led by Stewart’s CISO, who reports to the Group President, Technology and Operations. The Group President, Technology and Operations, is responsible for all areas of Stewart’s digital business strategy, enterprise technology solutions, innovation, and global information technology. The CISO leads a holistic security program to defend enterprises against emerging threats. He has served in various roles in information technology and security leadership for over 30 years.
Management uses third party consultants, as necessary, to assist in assessing, identifying and managing risks from cybersecurity threats. Annually, senior management participates in tabletop exercises to assess its readiness responding to cybersecurity incidents. Our cybersecurity team routinely challenges our employees and the effectiveness of existing controls.
Risk from cybersecurity threats
While Stewart regularly defends against, responds to and mitigates risks from IT systems and software vulnerabilities, broader cybersecurity threats and data security incidents, as of the date of this report, Stewart has not identified any cybersecurity threats that have materially affected or are reasonably anticipated to have a material effect on the organization, however, there can be no guarantee that we will not experience such an incident in the future. Stewart experienced no known material cyber breaches during the three-year period ended December 31, 2023. For additional information concerning Stewart’s risks related to cybersecurity, see Item 1A. Risk Factors.
Item 2. Properties
We currently leasesub-lease under a non-cancelable operating lease that expires in year 2025, approximately 150,000110,000 square feet of space in an office building in Houston, Texas,Texas, which is used for our corporate offices and for offices of several of our subsidiaries. Additionally, we executed during 2023 a lease agreement with the owner of the building that extends our occupancy of such office space through the year 2036. We also lease space at approximately 560510 locations for business operations, administrative and technology centers. These additional locations include significant leased facilities in Arizona (Phoenix Scottsdale and Tucson)Scottsdale), New York (New York), Colorado (Denver), California (Irvine, San Diego, Anaheim and Glendale), Texas (Houston), California (Irvine and San Diego) and Canada (Toronto), and Massachusetts (Boston).
Our current leases expire through 20332036 and we believe we will not have any difficulty obtaining renewals of leases as they expire or, alternatively, leasing comparable properties. The aggregate annual rent expense under all office leases was approximately $51.2$47.7 million in 2022.2023.
We also own office buildings inin Arizona, Texas, New Mexico, California, New York, Florida and the United Kingdom. These owned properties are not material to our consolidated financial condition. We consider all buildings and equipment that we own or lease to be well maintained, adequately insured and generally sufficient for our purposes.
Item 3. Legal Proceedings
Information regarding our legal proceedings can be found in Note 16 to our audited consolidated financial statements, included in Part IV, Item 15 of this annual report on Form 10-K and is incorporated herein by reference.
Item 4. Mine Safety Disclosures
None.
PART II
Item 5. Market for Registrant’s Common Equity, Related Stockholder Matters and Issuer Purchases of Equity Securities
Market and Holders Information. Our Common Stock is listed on the NYSE under the symbol “STC”. As of February 17, 2023,16, 2024, the number of stockholders of record was approximately 4,8004,700 and the closing price of one share of our Common Stock was $45.68.$62.15.
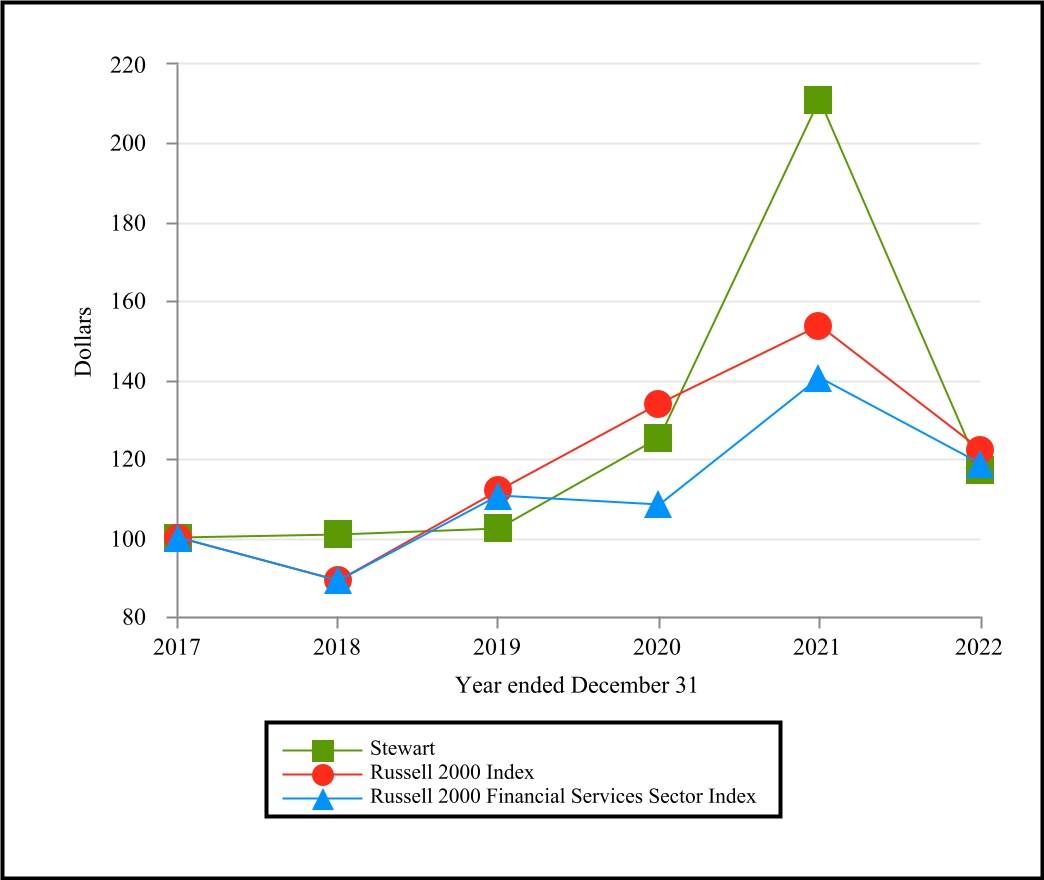
Stock Performance Graph. The following table and graph compares the yearly percentage change in our cumulative total stockholder return on Common Stock with the cumulative total return of the Russell 2000 Index and the Russell 2000 Financial Services Sector Index for the five years ended December 31, 2022.2023. The presented information assumes that the value of the investment in our Common Stock and each index was $100 at December 31, 20172018 and that all dividends were reinvested.
| | 2017 | 2018 | 2019 | 2020 | 2021 | 2022 |
| | 2018 | | | | 2018 | 2019 | 2020 | 2021 | 2022 | 2023 |
| Stewart | Stewart | | 100.00 | | 100.61 | | 102.09 | | 125.15 | | 210.92 | | 117.00 | |
| Russell 2000 Index | Russell 2000 Index | | 100.00 | | 89.03 | | 111.72 | | 133.92 | | 153.72 | | 122.27 | |
| Russell 2000 Financial Services Sector Index | Russell 2000 Financial Services Sector Index | | 100.00 | | 89.13 | | 110.60 | | 108.36 | | 140.61 | | 118.69 | |
The performance graph above and the related information shall not be deemed “soliciting material” or to be “filed” with the SEC, nor shall such information be incorporated by reference into any future filing under the Securities Act of 1933, as amended, or the Exchange Act, as amended, except to the extent that the Company specifically incorporates it by reference into such filing.
Dividends policy.Dividend Policy. Our current dividend policy anticipates the payment of quarterly dividends in the future. The declaration and payment of dividends will be at the discretion of our Board of Directors and will be dependent upon our future earnings, financial condition and capital requirements. Refer to Liquidity and Capital Resources.
Stock Repurchases. There were no stock repurchases during 2022,2023, except for repurchases of approximately 51,00041,700 shares (aggregate purchase price of approximately $3.3$1.8 million) related to statutory income tax withholding on the annual vesting of employee restricted share grants.
Item 7. Management’s Discussion and Analysis of Financial Condition and Results of Operations (MD&A)
MANAGEMENT'S OVERVIEW
On a full year basis, 2022 netNet income attributable to Stewart for the year 2023 was $30.4 million, or $1.11 per diluted share, compared to $162.3 million, or $5.94 per diluted share, compared to $323.2 million, or $11.90 per diluted share, in 2021.2022. Pretax income before noncontrolling interests in 20222023 was $60.9 million (2.7% pretax margin) compared to $232.7 million (7.6% pretax margin) compared to $434.0 million (13.1% pretax margin) in 2021. Total 20222022. During 2023, total operating revenues decreased 7%27% to $2.2 billion compared to $3.0 billion compared to $3.3 billion in 2021,2022, while total 2022 operating expenses decreased 1%23% to $2.2 billion compared to $2.8 billion compared to $2.9 billion in 2021,2022, primarily due to lower title transaction volumes which were partially offsetdriven by full year results of acquisitions from 2021.the elevated interest rate environment during 2023. Refer to "Results of Operations" for detailed year-to-year income statement discussions, and "Liquidity and Capital Resources" for an analysis of Stewart's financial condition.
For the fourth quarter 2022,2023, we reported net income attributable to Stewart of $8.8 million ($0.32 per diluted share), compared to net income attributable to Stewart of $13.3 million ($0.49 per diluted share), compared to net income attributable to Stewart of $85.5 million ($3.12 per diluted share) for the fourth quarter 2021.2022. Fourth quarter 20222023 pretax income before noncontrolling interests was $20.8$18.8 million compared to pretax income before noncontrolling interests of $114.1$20.8 million for the fourth quarter 2021.prior year quarter.
Fourth quarter 2023 included $4.8 million of pretax net realized and unrealized gains primarily driven by net unrealized gains on fair value changes of equity securities investments and net gains from acquisition liability adjustments, offset by $6.4 million of combined office closures and severance expenses. Fourth quarter 2022 results included $12.7 million of pretax net realized and unrealized gains, primarily composed of net unrealized gains on fair value changes of equity securities investments and gains related to settlements of company-owned insurance policies, offset by $16.7 million of combined office closure, severance and regulatory settlement and litigation expenses. Fourth quarter 2021 results included $6.5 million of pretax net realized and unrealized gains, primarily composed of net unrealized gains on fair value changes of equity securities investments and net gains related to acquisition contingent liability adjustments, partially offset by net realized losses primarily related to sale of securities investments and other assets and $4.1 million of office closure costs.
Title segment. Summary results of the title segment are as follows (in $ millions, except pretax margin and % change):
| | For the Three Months
Ended December 31, | |
| For the Three Months
Ended December 31, | |
| For the Three Months
Ended December 31, | |
| | | For the Three Months
Ended December 31, | |
| | | 2022 | | 2021 | | % Change | |
| | Operating revenues | Operating revenues | 581.6 | | | 836.4 | | | (30) | % | |
| | Operating revenues | |
| | Operating revenues | |
| Investment income | |
| Investment income | |
| Investment income | Investment income | 6.9 | | | 3.7 | | | 85 | % | |
| Net realized and unrealized gains | Net realized and unrealized gains | 10.3 | | | 4.9 | | | 110 | % | |
| Net realized and unrealized gains | |
| Net realized and unrealized gains | |
| Pretax income | |
| Pretax income | |
| Pretax income | Pretax income | 26.9 | | | 118.6 | | | (77) | % | |
| Pretax margin | Pretax margin | 4.5 | % | | 14.0 | % | | |
| Pretax margin | |
| Pretax margin | |
OperatingSegment operating revenues for the title segment decreased $254.8$78.6 million, or 30%14%, compared to the prior year quarter, as a result of transaction volume declines in our direct and agency title operations. Total segment operating expenses in the fourth quarter 2023 decreased $78.1 million, or 14%, consistent with lower operating revenues. Agency retention expenses decreased $39.7 million, or 15%, in the fourth quarter 2022 compared to the fourth quarter 2021,2023 primarily due to volume declines in our direct title and agency operations, while total segment operating expenses decreased $154.6$49.2 million, or 21%16%, primarily as a result of lower revenues. Agency retention expenses in the fourth quarter 2022 decreased $107.8 million, or 30%, consistent with the 30% decline in gross agency revenues, while therevenues. The average independent agency remittance rate in the fourth quarter 20222023 was 17.6%17.3%, compared to 18.0% in17.6% during the fourth quarter 2021.2022.
Total employee costs and other operating expenses in the fourth quarter 2022 decreased $36.22023 were lower by $37.6 million, or 11%13%, compared to the prior year quarter, andwhile as a percentage of operating revenues, these expenses were 48.9%49.1% in the fourth quarter 20222023 compared to 38.3%48.9% in the fourthprior year quarter. Fourth quarter 2021, primarily due to lower revenues in the fourth quarter 2022. Titletitle loss expense in the fourth quarter 2022 decreased $11.9$1.1 million, or 36%5%, primarily as a result of lower title revenues compared to the prior year quarter, primarily due to lower title revenues.quarter. As a percentage of title revenues, title loss expense was 4.1% in the fourth quarter 2023 compared to 3.7% in the fourth quarter 2022, compared to 4.0% in the fourth quarter 2021.which benefited from last year’s favorable claims experience.
The title segment’s net realized and unrealized gains in the fourth quarters 2022 and 2021 included net unrealized gains of $11.2 million and $8.1 million, respectively, related to fair value changes of equity securities investments and net realized losses of $0.6 million and $0.8 million, respectively, on sale of investment securities. Additionally, the segment recorded $2.0 million of net losses related to acquisition contingent liability adjustments during the fourth quarter 2021. Investment income in the fourth quarter 20222023 increased $6.1 million, compared to the prior year quarter, primarily as a result ofdue to higher interest income resulting from increasedearned interest rates and higher short-term investmentsfrom eligible escrow balances in the fourth quarter 2022.2023. Net realized and unrealized gains of $5.1 million and $10.3 million for the fourth quarters 2023 and 2022, respectively, were primarily driven by net unrealized gains on fair value changes on equity securities investments.
Direct title revenue information is presented below (in $ millions, except % change):
| | | |
| | |
| | |
| | | | For the Three Months
Ended December 31, | |
| | | 2022 | | 2021 | | % Change | |
| Non-commercial | Non-commercial | | |
| Non-commercial | |
| Non-commercial | |
| Domestic | |
| Domestic | |
| Domestic | Domestic | 171.3 | | | 251.0 | | | (32) | % | |
| International | International | 24.0 | | | 38.3 | | | (37) | % | |
| 195.3 | | | 289.3 | | | (32) | % | |
| International | |
| International | |
| 177.8 | |
| 177.8 | |
| 177.8 | |
| Commercial: | |
| Commercial: | |
| Commercial: | Commercial: | | |
| Domestic | Domestic | 66.9 | | | 93.1 | | | (28) | % | |
| Domestic | |
| Domestic | |
| International | International | 7.7 | | | 9.4 | | | (18) | % | |
| 74.6 | | | 102.5 | | | (27) | % | |
| International | |
| International | |
| 62.6 | |
| 62.6 | |
| 62.6 | |
| Total direct title revenues | Total direct title revenues | 269.9 | | | 391.8 | | | (31) | % | |
| Total direct title revenues | |
| Total direct title revenues | |
Total non-commercial domestic revenues decreased $94.0in the fourth quarter 2023 declined $17.5 million, or 32%9%, primarily resulting fromdue to a 55%5% decline in total residential purchase and refinancing transactions duringand a lower average fee per file compared to the fourth quarter 20222022. Fourth quarter domestic commercial revenues decreased $10.8 million, or 16%, primarily driven by 14% lower commercial transactions compared to the prior year quarter. Domestic commercial revenues in the fourth quarter 2022 decreased $26.2 million, or 28%, primarily due to lower transaction volume and size compared to the fourth quarter 2021. Average domestic commercial fee per file in the fourth quarter 20222023 was $15,100, which was 23% lower$14,800 compared to $19,700$15,100 in the fourth quarter 2021,2022, while average residential fee per file in the fourth quarter 2022 increased 45%2023 was $3,200, which was 9% lower compared to $3,500 compared to $2,400 in the prior year quarter primarily due to a higher purchasetransaction mix in the fourth quarter 2022.2023. Total international revenues in the fourth quarter 2022 declined2023 decreased by $16.0$1.2 million, or 34%4%, primarily as a result ofdue to lower transaction volumes in our Canadian operations.compared to the prior year quarter.
Real estate solutions segment. Summary results of the real estate solutions segment are as follows (in $ millions, except pretax margin and % change):
| | For the Three Months
Ended December 31, | |
| For the Three Months
Ended December 31, | |
| For the Three Months
Ended December 31, | |
| | | For the Three Months
Ended December 31, | |
| | | 2022 | | 2021 | | % Change | |
| | Operating revenues | Operating revenues | 54.7 | | | 83.7 | | | (35) | % | |
| Net realized and unrealized gains | — | | | 3.3 | | | (100) | % | |
| | Operating revenues | |
| | Operating revenues | |
| | Pretax income | |
| | Pretax income | |
| | Pretax income | Pretax income | 0.4 | | | 5.3 | | | (93) | % | |
| Pretax margin | Pretax margin | 0.7 | % | | 6.1 | % | | |
| Pretax margin | |
| Pretax margin | |
Operating revenues for the real estate solutions segment decreased in theThe segment’s fourth quarter 2022operating revenues improved $6.7 million, or 12%, compared to last year’s fourththe prior year quarter, primarily due to increased credit information services revenues, partially offset by lower valuation services revenues from lower transaction volumes influenced by the current high interest rate environment.volumes. Combined segment employee costs and other operating expenses decreased 36% in the fourth quarter 2022,2023 increased $5.4 million, or 11%, consistent with the reducedhigher operating revenue. Net realized and unrealized gains during the fourth quarter 2021 were primarily driven by net gains related to acquisition contingent liability adjustments. Included in therevenues. The segment's pretax income were total acquiredincluded acquisition intangible asset amortization expenses of $5.8$6.0 million and $5.6$6.6 million in the fourth quarters 20222023 and 2021,2022, respectively.
Corporate and other segment. The corporate and other segment's results for the fourth quarter 2023 and 2022 were primarily driven by net expenses attributable to corporate operations which were $9.7 million and $9.0 million, respectively. During the fourth quarter 2022, the segment recorded $2.5 million of net realized and unrealized gains in the fourth quarter 2022, primarily related to a settlement of a company-owned life insurance policy, compared to $1.6 million of net realized losses in the fourth quarter 2021, primarily driven by losses on asset disposals. Segment results for the fourth quarter 2021 included a real estate brokerage company that was acquired in late 2021 and sold in early 2022. Net expenses attributable to corporate operations increased to $9.0 million in the fourth quarter 2022 compared to $7.9 million in the prior year quarter, primarily as a result of higher interest expense resulting from debt.policy.
CRITICAL ACCOUNTING ESTIMATES
Actual results can differ from our accounting estimates. While we do not anticipate significant changes in our estimates, there is a risk that such changes could have a material impact on our consolidated financial condition or results of operations for future periods. The discussion of critical accounting estimates below should be read in conjunction with the related accounting policies disclosed within Note 1 to our audited consolidated financial statements in Part IV of this annual report.
Title loss reserves
Provisions for title losses, as a percentage of title operating revenues, were 3.8%4.1%, 4.2%3.8% and 5.3%4.2% for the years ended December 31, 2023, 2022 2021 and 2020,2021, respectively. Actual loss payment experience, including the impact of large losses, is the primary reason for increases or decreases in our loss provision. A 100 basis point change in the loss provisioning percentage, a reasonable scenario based on our historical loss experience, would have increased or decreased our provision for title losses, and affected pretax operating results by approximately $27.1$19.5 million for the year ended December 31, 2022.2023.
We consider our actual claims payments and incurred loss experience, including the frequency and severity of claims, compared to our actuarial estimates of claims payments and incurred losses in determining whether our overall loss experience has improved or worsened relative to prior periods. We also consider the impact of economic or market factors on particular policy years to determine whether the results of those policy years are indicative of future expectations. In addition, large claims (those exceeding $1.0 million on a single claim), including large title losses due to independent agency defalcations, are analyzed and reserved for separately due to the potential higher dollar amount of loss, lower volume of claims reported and sporadic reporting of such claims. We evaluate the frequency and severity of large losses in determining whether our experience has improved or worsened. Our method for recording the reserves for title losses on both an interim and annual basis begins with the calculation of our current loss provision rate which is applied to our current premium revenues, resulting in a title loss expense for the period, except for large claims and escrow losses. This loss provision rate is set to provide for losses on current year policies and is primarily determined using moving average ratios of recent actual policy loss payment experience (net of recoveries) to premium revenues.
Due to the inherent uncertainty in predicting future title policy losses, significant judgment is required by our management and our third-party actuaries in estimating reserves. As a consequence, our ultimate liability may be materially greater or lower than current reserves and/or our third-party actuary’s calculated estimates.
Provisions for known claims arise primarily from prior policy years as claims are not typically reported until years after policies are issued. Provisions - Incurred But Not Reported (IBNR) are estimates of claims expected to be incurred over the next 20 years; therefore, it is not unusual or unexpected to experience changes to those estimated provisions in both current and prior policy years as additional loss experience on policy years is obtained. This loss experience may result in changes to our estimate of total ultimate losses expected (i.e., the IBNR policy loss reserve). Current year provisions - IBNR are recorded on policies issued in the current year as a percentage of premiums earned (loss provisioning rate). As claims become known, provisions are reclassified from IBNR to known claims. Adjustments relating to large claims may impact provisions either for known claims or for IBNR.
| | | | | | | | | | | | | | | | | | | | |
| | 2022 | | 2021 | | 2020 |
| | | (in $ millions) |
| Provisions – Known Claims: | | | | | | |
| Current year | | 20.2 | | | 22.8 | | | 14.3 | |
| Prior policy years | | 84.2 | | | 55.7 | | | 68.8 | |
| | 104.4 | | | 78.5 | | | 83.1 | |
| Provisions – IBNR | | | | | | |
| Current year | | 75.2 | | | 98.3 | | | 84.5 | |
| Prior policy years | | 7.3 | | | 5.1 | | | 16.4 | |
| | 82.5 | | | 103.4 | | | 100.9 | |
| Transferred IBNR to Known Claims | | (84.2) | | | (55.7) | | | (68.8) | |
| Total provisions | | 102.7 | | | 126.2 | | | 115.2 | |
| | | | | | | | | | | | | | | | | | | | |
| | 2023 | | 2022 | | 2021 |
| | | (in $ millions) |
| Provisions – Known Claims: | | | | | | |
| Current year | | 16.9 | | | 20.2 | | | 22.8 | |
| Prior policy years | | 70.4 | | | 84.2 | | | 55.7 | |
| | 87.3 | | | 104.4 | | | 78.5 | |
| Provisions – IBNR | | | | | | |
| Current year | | 49.9 | | | 75.2 | | | 98.3 | |
| Prior policy years | | 13.5 | | | 7.3 | | | 5.1 | |
| | 63.4 | | | 82.5 | | | 103.4 | |
| Transferred IBNR to Known Claims | | (70.4) | | | (84.2) | | | (55.7) | |
| Total provisions | | 80.3 | | | 102.7 | | | 126.2 | |
In 2023, total provisions for known claims decreased by $17.1 million, or 16%, compared to 2022, primarily as a result of changes to existing large and non-large claims related to prior policy years, while total provisions - IBNR decreased $19.1 million, or 23%, primarily due to lower title premiums compared to 2022. In 2022, total known claims provisions increased by $25.9 million, or 33%, primarily due to an increase in reported new and existing large claims relating to prior policy years compared to 2021. Total 2022 provisions - IBNR decreased $20.9 million, or 20%, compared to the prior year, primarily due to lower title premiums and lower provisioning rates from an overall favorable claims experience in 2022. In 2021, total known claims provisions decreased by $4.6 million, or 6%, to $78.5 million primarily due to lower reported claims relating to prior year policies compared to 2020. Total 2021 provisions - IBNR increased by $2.5 million, or 3%, to $103.4 million compared to the prior year, primarily due to increased title premiums in 2021, partially offset by the effect of lower provisioning rates due to favorable claims experience. As a percentage of title operating revenues, current year provisions - IBNR were 2.8%2.6%, 2.8% and 3.3% in 2023, 2022 and 3.9% in 2022, 2021, and 2020, respectively.
In addition to title policy claims, we incur losses in our direct operations from escrow, closing and disbursement functions. Escrow losses typically relate to errors or other miscalculations of amounts to be paid at closing, including timing or amount of a mortgage payoff, payment of property or other taxes and payment of homeowners’ association fees, and wire fraud. In those cases, the title insurer incurs the loss under its obligation to ensure that an unencumbered title is conveyed. These losses are recognized as expenses when discovered or when contingencies associated with them (such as litigation) are resolved and are typically paid less than 12 months after the loss is recognized.
Large title losses due to independent agency defalcations typically occur when the independent agency misappropriates funds from escrow accounts under its control. Such losses are usually discovered when the independent agency fails to pay off an outstanding mortgage loan at closing (or immediately thereafter) from the proceeds of the new loan. These incurred losses are typically more severe in terms of dollar value compared with traditional title policy claims since the independent agency is often able, over time, to conceal misappropriation of escrow funds relating to more than one transaction through the constant volume of funds moving through its escrow accounts. In declining real estate markets, lower transaction volumes result in a lower incoming volume of funds, making it more difficult to cover up the misappropriation with incoming funds. Thus, when the defalcation is discovered, it often relates to several transactions. In addition, the overall decline in an independent agency’s revenues, profits and cash flows increases the agency’s incentive to improperly utilize the escrow funds from real estate transactions. For each of the three years ended December 31, 2022,2023, our net title losses due to independent agency defalcations were not material.
Internal controls relating to independent agencies include, but are not limited to, periodic audits, site visits and reconciliations of policy inventories and premiums. The audits and site visits cover examination of the escrow account bank reconciliations and an examination of a sample of closed transactions. In some instances, the scope of our review is limited by attorney agencies that cite client confidentiality. Certain states have mandated annual reviews of agencies by their underwriter. We also determine whether our independent agencies have appropriate internal controls as defined by ALTA's best practices and us. However, even with adequate internal controls in place, their effectiveness can be circumvented by collusion or improper override of the controls by management at the independent agencies. To aid in the selection of independent agencies to review, we have developed an agency risk model that aggregates data from different areas to identify possible issues. This is not a guarantee that all independent agencies with deficiencies will be identified. In addition, we are typically not the only underwriter for which an independent agency issues policies, and independent agencies may not always provide complete financial records for our review.
Goodwill impairment
Goodwill is not amortized, but is reviewed for impairment annually and whenever occurrences of events indicate a potential impairment at the reporting unit level. Refer to Note 1-L and Note 8 to our audited consolidated financial statements for details about our goodwill impairment review process and goodwill balances, respectively.
The valuation techniques performed in our quantitative analysis make use of our estimates and assumptions related to critical factors, which include revenue and operating margin growth rates, future market conditions, determination of market multiples and comparative companies, assignment of a control premium, and determination of risk-adjusted discount rates. Forecasts of future operations are based, in part, on actual operating results and our expectations as to future market conditions, which are inherently uncertain and difficult to project. In performing our analysis, we make assumptions and apply judgments to estimate industry economic factors and the future profitability of our businesses. Due to the uncertainty and complexity of performing the goodwill impairment analysis, future results related to market conditions and our business operations and other inputs to the analysis may be worse than estimated or assumed. In such cases, we may be exposed to future material impairments of goodwill.
For our annual goodwill impairment test for all our reporting units, we utilized the quantitative approach during 2022, while we used the qualitative approach during 2021. Additionally, due to the deterioration of the macroeconomic environment during the second half of2023 and 2022 and its impact on the real estate market, we performed an updated quantitative analysis using a valuation date of December 31, 2022 and concluded that there is no impairment of goodwill for any of our reporting units.
RESULTS OF OPERATIONS
We discuss in this section the consolidated results of operations for the years 20222023 and 2021,2022, as compared to each corresponding prior year. Factors contributing to fluctuations in our results of operations are presented in the order of their monetary significance, and significant changes are quantified, when necessary. Segment results are included in the discussions and are discussed separately, when relevant.
Industry data. Published U.S. mortgage interest rates and other selected residential housing data for the three years ended December 31, 20222023 are shown below (amounts shown for 20222023 are preliminary and subject to revision). The amounts below may not relate directly to or provide accurate data for forecasting our operating revenues or order counts. Our statements on home sales, mortgage interest rates and loan activity are based on averaged published industry data as of December 31, 20222023 from sources including Fannie Mae Freddie Mac, and the Mortgage Bankers Association (MBA), when available.
| | 2022 | | 2021 | | 2020 |
| | 2023 | | | | 2023 | | 2022 | | 2021 |
| Mortgage interest rates (30-year, fixed-rate) – % | Mortgage interest rates (30-year, fixed-rate) – % | | | | | | |
| Averages for the year | |
| Averages for the year | |
| Averages for the year | Averages for the year | | 5.33 | | | 2.96 | | | 3.11 | |
| First quarter | First quarter | | 3.79 | | | 2.88 | | | 3.51 | |
| Second quarter | Second quarter | | 5.24 | | | 3.00 | | | 3.23 | |
| Third quarter | Third quarter | | 5.58 | | | 2.87 | | | 2.95 | |
| Fourth quarter | Fourth quarter | | 6.69 | | | 3.08 | | | 2.76 | |
| Mortgage originations – $ billions | Mortgage originations – $ billions | | 2,296 | | | 4,504 | | | 4,241 | |
| Refinancings – % of originations | Refinancings – % of originations | | 29 | | | 58 | | | 64 | |
| Existing home sales – in millions | |
| Existing home median sales price – in $ thousands | |
| New home sales – in millions | New home sales – in millions | | 0.65 | | | 0.77 | | | 0.83 | |
| New home median sales price – in $ thousands | New home median sales price – in $ thousands | | 453 | | | 396 | | | 335 | |
| Existing home sales – in millions | | 5.11 | | | 5.90 | | | 5.66 | |
| Existing home median sales price – in $ thousands | | 385 | | | 348 | | | 295 | |
Interest rates significantly increased during 2022 compared to the prior year, primarily driven byfurther in 2023 as a result of government actions to curbaddress the elevatedhigh inflation rate.rate, which started in the late 2022. The highelevated interest rate environment negatively impacted transactions in the real estate market. Mortgagemarket, where 2023 mortgage originations during 2022 fell 49%declined 33% from the prior year, with total refinancing transactions decreasing by 74%61%. Refinancing share from total mortgage originations declined to 29%18% in 20222023 compared to 58%31% in 2021.2022. Existing and new home sales activity declined 13%19% in 2023, primarily due to the high interest rate environment, while new homeowner demand and 16%, respectively, while elevated existing andmaterials supply improvement contributed to new median home prices continued, increasing 11% and 15%, respectively,sales improving by 7% in 20222023 compared to 2021.the prior year.
With the government pausing interest rate hikes during the second half of 2023 and encouraging economic data, Fannie Mae and the MBA expect the housing market softening to continue into 2023, with total mortgage originations in 2023 expected to decline 22% from 2022. Existing and new homes sales in 2023 are anticipated to be lower by 17% and 9%, respectively, from the prior year. While the average 30-year mortgage interest rate is expected to be 5.8% for the full year 2023, it is expected to begin decreasing starting in the third quarter 2023 and anticipated to average lower at 5.0%slowly recover beginning in 2024. As a result, a market recovery is forecasted forinterest rates are expected to gradually decline, total loan originations are forecast to improve 23% in 2024 with total mortgage lendingpurchase and refinancing originations expected to improve 22%increase 13% and both total67%, respectively, compared to 2023. Additionally, existing and new homeshome sales anticipatedare estimated to increase by 15%3% and 4%, respectively, in 2024 compared to 2023.
Factors affecting revenues. Our primary business is title insurance and settlement-related services. We close transactions and issue title policies on homes, commercial and other real properties located in all 50 states, the District of Columbia and international markets through policy-issuing offices, agencies and centralized title services centers. Our real estate solutions operations include appraisal management services, online notarization and closing services, credit and real estate information services, and search and valuation services. The corporate and other segment includes our parent holding company expenses and certain enterprise-wide overhead costs, along with other businesses not related to title or real estate solutions operations. Refer to Item 1. Business for details.
The principal factors that contribute to changes in our operating revenues include:
•mortgage interest rates;
•availability of mortgage loans;
•number and average value of mortgage loan originations;
•ability of potential purchasers to qualify for loans;
•inventory of existing homes available for sale;
•ratio of purchase transactions compared with refinance transactions;
•ratio of closed orders to open orders;
•home prices;
•consumer confidence, including employment trends;
•demand by buyers;
•premium rates;
•foreign currency exchange rates;
•market share;
•ability to attract and retain highly productive sales associates;
•independent agency remittance rates;
•opening and integration of new offices and acquisitions;
•office closures;
•number and value of commercial transactions, which typically yield higher premiums;
•government or regulatory initiatives, including tax incentives and the implementation of the integrated disclosure requirements;
•acquisitions or divestitures of businesses;
•volume of distressed property transactions;
•seasonality and/or weather; and
•outbreaks of diseases and related quarantine orders and restrictions on travel, trade and business operations.
Premiums are determined in part by the values of the transactions we handle. To the extent inflation or market conditions cause increases in the prices of homes and other real estate, premium revenues are also increased. Conversely, falling home prices cause premium revenues to decline. As an overall guideline, a 5% change in median home prices results in an approximately 3.7% change in title premiums. Home price changes may override the seasonal nature of the title insurance business. Historically, our first quarter is the least active in terms of title insurance revenues as home buying is generally depressed during winter months. Our second and third quarters are typically the most active as the summer is the traditional home buying season, and while commercial transaction closings are skewed to the end of the year, individually large commercial transactions can occur any time of year. On average, refinance title premium rates are 60% of the premium rates for a similarly priced sale transaction.
Title revenues. Direct title revenue information is presented below:
| | Year Ended December 31 | | Change | | Percent Change |
| Year Ended December 31 | | | Year Ended December 31 | | Change | | Percent Change |
| | | 2022 | 2021 | 2020 | | 2022 vs 2021 | 2021 vs 2020 | | 2022 vs 2021 | 2021 vs 2020 | | 2023 | 2022 | 2021 | | 2023 vs 2022 | 2022 vs 2021 | | 2023 vs 2022 | 2022 vs 2021 |
| | | (in $ millions) | | (in $ millions) | | |
| Non-commercial | Non-commercial | |
| Non-commercial | |
| Non-commercial | |
| Domestic | |
| Domestic | |
| Domestic | Domestic | 830.5 | | 960.1 | | 743.7 | | | (129.6) | | 216.4 | | | (13) | % | 29 | % | 656.3 | | 830.5 | 830.5 | | 960.1 | 960.1 | | | (174.2) | | (174.2) | | (129.6) | (129.6) | | | (21) | | (21) | % | (13) | % |
| International | International | 130.5 | | 157.1 | | 106.1 | | | (26.6) | | 51.0 | | | (17) | % | 48 | % | International | 98.1 | | 130.5 | 130.5 | | 157.1 | 157.1 | | | (32.4) | | (32.4) | | (26.6) | (26.6) | | | (25) | | (25) | % | (17) | % |
| 961.0 | | 1,117.2 | | 849.8 | | | (156.2) | | 267.4 | | | (14) | % | 31 | % |
| 754.4 | | | 754.4 | | 961.0 | | 1,117.2 | | | (206.6) | | (156.2) | | | (21) | % | (14) | % |
| Commercial: | Commercial: | |
| Domestic | Domestic | 251.3 | | 242.3 | | 166.7 | | | 9.0 | | 75.6 | | | 4 | % | 45 | % |
| Domestic | |
| Domestic | | 182.2 | | 251.3 | | 242.3 | | | (69.1) | | 9.0 | | | (27) | % | 4 | % |
| International | International | 34.0 | | 31.4 | | 21.4 | | | 2.6 | | 10.0 | | | 8 | % | 47 | % | International | 26.1 | | 34.0 | 34.0 | | 31.4 | 31.4 | | | (7.9) | | (7.9) | | 2.6 | 2.6 | | | (23) | | (23) | % | 8 | % |
| 285.3 | | 273.7 | | 188.1 | | | 11.6 | | 85.6 | | | 4 | % | 46 | % |
| 208.3 | | | 208.3 | | 285.3 | | 273.7 | | | (77.0) | | 11.6 | | | (27) | % | 4 | % |
| Total direct title revenues | Total direct title revenues | 1,246.3 | | 1,390.9 | | 1,037.9 | | | (144.6) | | 353.0 | | | (10) | % | 34 | % | Total direct title revenues | 962.7 | | 1,246.3 | 1,246.3 | | 1,390.9 | 1,390.9 | | | (283.6) | | (283.6) | | (144.6) | (144.6) | | | (23) | | (23) | % | (10) | % |
Direct title revenues in 2023 decreased 23% compared to 2022, primarily due to reduced transaction volumes driven by the elevated interest rate market environment. Total non-commercial domestic revenues in 2023 declined 21%, primarily due to 20% and 51% lower residential purchase and refinancing transactions, respectively, compared to 2022. Domestic commercial revenues decreased 27% in 2023, primarily driven by 19% lower commercial transactions and smaller transaction sizes compared to 2022. Average domestic commercial fee per file in 2023 was $12,200, which was 11% lower compared to 2022, while average residential fee per file in 2023 was $3,200, which was 6% higher compared to 2022, primarily due to transaction mix in 2023. Total international revenues decreased $40.3 million, or 24%, in 2023 primarily due to lower transaction volumes in our Canadian and United Kingdom operations compared to the prior year.
Direct title revenues declined 10% in 2022 compared to 2021 primarily due to lower non-commercial revenues driven by lower residential transactions, partially offset by increased commercial revenues. Non-commercial revenues declined as a result of 15% and 61% lower purchase and refinancing closed orders, respectively, which were primarily influenced by the high interest rate market environment in 2022 compared to 2021. Domestic commercial revenues improved 4% primarily due to a 6% increase in commercial transactions in 2022 compared to the prior year. Average domestic commercial fee per file in 2022 was approximately $13,600 compared to $14,000 in 2021, while average residential fee per file in 2022 was approximately $3,000 compared to $2,200 due to a higher purchase mix in 2022. Total international revenues decreased $24.1 million, or 13%, primarily due to lower transaction volumes in our Canadian operations and overall weaker average foreign currency exchange rates against the U.S. dollar in 2022 compared to the prior year.
Direct title revenues in 2021 grew 34% compared to the prior year, as a result of overall revenue improvements in both non-commercial and commercial operations. Non-commercial revenues increased in 2021, primarily driven by increased residential transactions and scale compared to 2020. Domestic commercial revenues increased 45% in 2021 compared to 2020, primarily due to improved commercial transaction size and volume. Total purchase and refinancing closed orders improved 12%, while commercial closed orders increased 15% in 2021 compared to the prior year. Domestic commercial and residential fees per file in 2021 were approximately $14,000 and $2,200, respectively, which respectively were 26% and 18% higher compared to 2020. Total international revenues grew $61.0 million, or 48%, in 2021 compared to 2020, primarily due to increased residential and commercial transaction volumes in our Canadian operations.
Closed and opened orders information is as follows:
| | Year Ended December 31 | | Change | | % Change |
| 2022 | 2021 | 2020 | | 2022 vs 2021 | 2021 vs 2020 | | 2022 vs 2021 | 2021 vs 2020 |
| Year Ended December 31 | | | Year Ended December 31 | | Change | | % Change |
| 2023 | | | 2023 | 2022 | 2021 | | 2023 vs 2022 | 2022 vs 2021 | | 2023 vs 2022 | 2022 vs 2021 |
| Opened Orders: | Opened Orders: | | | | | |
| Commercial | |
| Commercial | |
| Commercial | Commercial | 20,202 | | 18,113 | | 15,748 | | | 2,089 | | 2,365 | | | 12 | % | 15 | % | 14,203 | | 20,202 | 20,202 | | 18,113 | 18,113 | | | (5,999) | | (5,999) | | 2,089 | 2,089 | | | (30) | | (30) | % | 12 | % |
| Purchase | Purchase | 241,781 | | 283,350 | | 250,058 | | | (41,569) | | 33,292 | | | (15) | % | 13 | % | Purchase | 202,947 | | 241,781 | 241,781 | | 283,350 | 283,350 | | | (38,834) | | (38,834) | | (41,569) | (41,569) | | | (16) | | (16) | % | (15) | % |
| Refinance | Refinance | 98,663 | | 256,621 | | 304,064 | | | (157,958) | | (47,443) | | | (62) | % | (16) | % | Refinance | 64,418 | | 98,663 | 98,663 | | 256,621 | 256,621 | | | (34,245) | | (34,245) | | (157,958) | (157,958) | | | (35) | | (35) | % | (62) | % |
| Other | Other | 9,037 | | 6,753 | | 3,868 | | | 2,284 | | 2,885 | | | 34 | % | 75 | % | Other | 27,328 | | 9,037 | 9,037 | | 6,753 | 6,753 | | | 18,291 | | 18,291 | | 2,284 | 2,284 | | | 202 | | 202 | % | 34 | % |
| Total | Total | 369,683 | | 564,837 | | 573,738 | | | (195,154) | | (8,901) | | | (35) | % | (2) | % | Total | 308,896 | | 369,683 | 369,683 | | 564,837 | 564,837 | | | (60,787) | | (60,787) | | (195,154) | (195,154) | | | (16) | | (16) | % | (35) | % |
| | Closed Orders: | Closed Orders: | |
| Closed Orders: | |
| Closed Orders: | |
| Commercial | |
| Commercial | |
| Commercial | Commercial | 18,448 | | 17,334 | | 15,035 | | | 1,114 | | 2,299 | | | 6 | % | 15 | % | 14,971 | | 18,448 | 18,448 | | 17,334 | 17,334 | | | (3,477) | | (3,477) | | 1,114 | 1,114 | | | (19) | | (19) | % | 6 | % |
| Purchase | Purchase | 184,652 | | 217,895 | | 178,935 | | | (33,243) | | 38,960 | | | (15) | % | 22 | % | Purchase | 147,528 | | 184,652 | 184,652 | | 217,895 | 217,895 | | | (37,124) | | (37,124) | | (33,243) | (33,243) | | | (20) | | (20) | % | (15) | % |
| Refinance | Refinance | 81,755 | | 211,109 | | 203,763 | | | (129,354) | | 7,346 | | | (61) | % | 4 | % | Refinance | 40,151 | | 81,755 | 81,755 | | 211,109 | 211,109 | | | (41,604) | | (41,604) | | (129,354) | (129,354) | | | (51) | | (51) | % | (61) | % |
| Other | Other | 8,071 | | 4,736 | | 2,594 | | | 3,335 | | 2,142 | | | 70 | % | 83 | % | Other | 17,612 | | 8,071 | 8,071 | | 4,736 | 4,736 | | | 9,541 | | 9,541 | | 3,335 | 3,335 | | | 118 | | 118 | % | 70 | % |
| Total | Total | 292,926 | | 451,074 | | 400,327 | | | (158,148) | | 50,747 | | | (35) | % | 13 | % | Total | 220,262 | | 292,926 | 292,926 | | 451,074 | 451,074 | | | (72,664) | | (72,664) | | (158,148) | (158,148) | | | (25) | | (25) | % | (35) | % |
Gross revenues from independent agency operations (agency revenues) decreased $480.3 million, or 33%, in 2023 and $116.4 million, or 7%, in 2022 and increased $431.6 million, or 38%, in 2021, compared to corresponding prior years, which were consistent with the trends of our direct title operations and the overall real estate market and our direct title operations during 20222023 and 2021. As a result of2022. In line with changes in gross agency revenues, our net agency revenues (which are net of agency retention) decreased $85.5 million, or 33%, and $24.3 million, or 9%, in 2023 and 2022, and increased $75.7 million, or 37%, in 2021,respectively, compared to respective prior periods. Refer further to the "Retention by agencies" discussion under Expenses below.
Title revenues by geographic location. The approximate amounts and percentages of consolidated title operating revenues for the last three years ended December 31, 20212023 were as follows:
| | | | | Year Ended December 31 | | Percentages | | | Year Ended December 31 | | Percentages |
| | | | 2022 | 2021 | 2020 | | 2022 | 2021 | 2020 | | | 2023 | 2022 | 2021 | | 2023 | 2022 | 2021 |
| (in $ millions) | | |
| | (in $ millions) | |
| Texas | |
| Texas | |
| Texas | Texas | | 448 | | 469 | | 359 | | | 17 | % | 16 | % | 16 | % | | 305 | | 448 | 448 | | 469 | 469 | | | 16 | | 16 | % | 17 | % | 16 | % |
| New York | New York | | 284 | | 263 | | 187 | | | 10 | % | 9 | % | 9 | % | New York | | 195 | | 284 | 284 | | 263 | 263 | | | 10 | | 10 | % | 10 | % | 9 | % |
| International | International | | 176 | | 198 | | 134 | | | 6 | % | 7 | % | 6 | % | International | | 131 | | 176 | 176 | | 198 | 198 | | | 7 | | 7 | % | 7 | % | 7 | % |
| Ohio | | Ohio | | 96 | | 105 | | 92 | | | 5 | % | 4 | % | 3 | % |
| California | | California | | 89 | | 133 | | 192 | | | 5 | % | 5 | % | 6 | % |
| Florida | Florida | | 135 | | 150 | | 102 | | | 5 | % | 5 | % | 5 | % | Florida | | 85 | | 135 | 135 | | 150 | 150 | | | 4 | | 4 | % | 5 | % | 5 | % |
| California | | 133 | | 192 | | 163 | | | 5 | % | 6 | % | 7 | % |
| All others | All others | | 1,537 | | 1,733 | | 1,244 | | | 57 | % | 57 | % | 57 | % | All others | | 1,048 | | 1,432 | 1,432 | | 1,610 | 1,610 | | | 53 | | 53 | % | 52 | % | 54 | % |
| 2,713 | | 3,005 | | 2,189 | | | 100 | % | 100 | % | 100 | % |
| | 1,949 | | | | 1,949 | | 2,713 | | 2,974 | | | 100 | % | 100 | % | 100 | % |
Real estate solutions and other revenues. Real estate solutions and other revenues are primarily comprised of revenues generated by our real estate solutions operations and, for the fourth quarter 2021 and first four months of 2022,operations. These revenues also included revenues generated by a real estate brokerage company which we operated from the fourth quarter 2021 to the mid-second quarter 2022 before being sold in 2022. Excluding the real estate brokerage company, real estate solutions revenues decreased $33.1 million, or 11%, in 2023 compared to 2022, primarily due to the slow market activity influenced by higher interest rates, while these revenues improved $37.0 million, or 14%, and $177.1 million, or 214%, duringin 2022 and 2021, respectively, compared to corresponding prior periods,2021, primarily due to revenues generated by acquisitions.
Investment income. Investment income increased $22.7 million, or 101%, in 2023 compared to the prior year, primarily due to higher interest income resulting from earned interest from eligible escrow balances and increased interest rates in 2023. Investment income in 2022 improved $5.6 million, or 33%, due to higher interest income driven by increased interest rates and higher dividend income from investments in 2022 compared to 2021. Investment income in 2021 decreased $1.8 million, or 9%, primarily due to reduced interest income on investments resulting from the lower interest rates environment compared to 2020. Refer to Note 6 to our audited consolidated financial statements for additional details.
Net realized and unrealized gains. Refer to Note 6 to our audited consolidated financial statements for details.
Expenses. Our employee costs and certain other operating expenses are sensitive to inflation. An analysis of expenses is shown below: | | | | Year Ended December 31 | | Change* | | % Change | | Year Ended December 31 | | Change* | | % Change |
| | | 2022 | 2021 | 2020 | | 2022 vs 2021 | 2021 vs 2020 | | 2022 vs 2021 | 2021 vs 2020 | | 2023 | 2022 | 2021 | | 2023 vs 2022 | 2022 vs 2021 | | 2023 vs 2022 | 2022 vs 2021 |
| | | (in $ millions) | | (in $ millions) | | |
| Amounts retained by independent agencies | Amounts retained by independent agencies | 1,208.3 | | 1,300.4 | | 944.5 | | | (92.1) | | 355.9 | | | (7) | % | 38 | % |
| Amounts retained by independent agencies | |
| Amounts retained by independent agencies | | 813.5 | | 1,208.3 | | 1,300.4 | | | (394.8) | | (92.1) | | | (33) | % | (7) | % |
| As a % of agency revenues | As a % of agency revenues | 82.4 | % | 82.2 | % | 82.1 | % | |
| Employee costs | |
| Employee costs | |
| Employee costs | Employee costs | 802.0 | | 777.0 | | 613.2 | | | 25.0 | | 163.8 | | | 3 | % | 27 | % | 712.8 | | 802.0 | 802.0 | | 777.0 | 777.0 | | | (89.2) | | (89.2) | | 25.0 | 25.0 | | | (11) | | (11) | % | 3 | % |
| As a % of operating revenues | As a % of operating revenues | 26.3 | % | 23.8 | % | 27.0 | % | |
| Other operating expenses | Other operating expenses | 648.0 | | 626.8 | | 375.2 | | | 21.2 | | 251.6 | | | 3 | % | 67 | % |
| Other operating expenses | |
| Other operating expenses | | 507.7 | | 648.0 | | 626.8 | | | (140.3) | | 21.2 | | | (22) | % | 3 | % |
| As a % of operating revenues | As a % of operating revenues | 21.3 | % | 19.2 | % | 16.5 | % | |
| Title losses and related claims | Title losses and related claims | 102.7 | | 126.2 | | 115.2 | | | (23.5) | | 11.0 | | | (19) | % | 10 | % |
| Title losses and related claims | |
| Title losses and related claims | | 80.3 | | 102.7 | | 126.2 | | | (22.5) | | (23.5) | | | (22) | % | (19) | % |
| As a % of title revenues | As a % of title revenues | 3.8 | % | 4.2 | % | 5.3 | % | |
*Amounts change may not add due to rounding.
Retention by agencies. Amounts retained by title agencies are based on agreements between agencies and our title underwriters. Amounts retained by independent agencies, as a percentage of revenues generated by them, averaged 82.4%82.5%, 82.2%82.4% and 82.1%82.2% during the three years ended December 31, 2022.2023. The average retention percentage may vary from period to period due to the geographical mix of agency operations, the volume of title revenues and, in some states, laws or regulations. Due to the variety of such laws or regulations, as well as competitive factors, the average retention rate can differ significantly from state to state. In addition, a high proportion of our independent agencies are in states with retention rates greater than 80%. We continue to focus on increasing profit margins in every state, increasing premium revenue in states where remittance rates are above 20%, and maintaining the quality of our agency network, which we believe to be the industry’s best, in order to mitigate claims risk and drive consistent future performance. While market share is important in our agency operations channel, it is not as important as margins, risk mitigation and profitability.
Selected cost ratios (by selected segment). The following table shows employee costs and other operating expenses as a percentage of operating revenues for each of the title and real estate solutions segments for the years ended December 31:
| | | | | Employee Costs | | Other Operating Expenses | | | Employee Costs | | Other Operating Expenses |
| | | | 2022 | 2021 | 2020 | | 2022 | 2021 | 2020 | | | 2023 | 2022 | 2021 | | 2023 | 2022 | 2021 |
| Title | Title | | 27.1 | % | 24.5 | % | 26.8 | % | | 14.8 | % | 13.0 | % | 13.5 | % | Title | | 33.3 | % | 27.1 | % | 24.5 | % | | 16.4 | % | 14.8 | % | 13.0 | % |
| Real estate solutions | Real estate solutions | | 17.0 | % | 13.3 | % | 16.4 | % | | 68.8 | % | 78.5 | % | 81.9 | % | Real estate solutions | | 18.7 | % | 17.0 | % | 13.3 | % | | 68.2 | % | 68.8 | % | 78.5 | % |
|
Employee costs. Consolidated employee costs in 2023 decreased $89.2 million, or 11%, compared to 2022, primarily driven by lower salaries and benefits expenses, temporary labor and overtime costs, and incentive compensation resulting from lower average employee count and transaction volumes in 2023. Consolidated employee costs increased $25.0 million, or 3%, in 2022 compared to 2021, primarily due to higher salaries and employee benefits driven by 16% higher average employee count, as we integrateintegrated our acquisitions, partially offset by reduced incentive compensation, temporary labor and overtime costs resulting from lower operating results and volumes during 2022. Consolidated employee costs increased $163.8 million, or 27%, in 2021 compared to 2020, primarily due to increased salaries and employee benefits on a 20% higher average employee count driven by acquisitions, higher incentive compensation on improved overall operating results, and increased temporary labor and overtime costs on increased transaction volumes.
Our total employee counts at December 31, 2023, 2022 2021 and 20202021 were approximately 6,800, 7,100 7,400 and 5,800,7,400, respectively. Average cost per employee for 2023 and 2022 decreased 10% compared to 2021, while average cost per employee in 2021 increased 5% compared to 2020.
Employee costs for the title segment increased $7.4 million, or 1%,2% and $143.7 million, or 24%10%, in 2022 and 2021, respectively, compared to corresponding prior years, primarily due to acquisitions, while higherlower incentive compensation, on increased title revenues also contributed to the increase in employeetemporary labor and overtime costs in 2021. driven by reduced 2023 and 2022 transaction volumes.
Employee costs in 2023 for the title and real estate solutions segmentsegments decreased $86.9 million, or 12%, and $1.1 million, or 2%, respectively, compared to 2022, primarily driven by lower average employee counts and transaction volumes in 2023. Employee costs in 2022 for the title and real estate solutions segments increased $7.4 million, or 1%, and $15.9 million, or 46%, and $20.0 million, or 77%, in 2022 and 2021, respectively, compared to corresponding prior years,2021, primarily due to higher salaries and employee benefits resulting from acquisitions.
Other operating expenses. Other operating expenses include costs that are primarily fixed in nature, costs that follow, to varying degrees, changes in transaction volumes and revenues (variable costs) and costs that fluctuate independently of revenues (independent costs). Costs that are primarily fixed in nature include rent and other occupancy expenses, equipment rental, insurance, repairs and maintenance, technology costs, telecommunications and title plant expenses. Variable costs include appraiser and service expenses related to real estate solutions operations, outside search and valuation fees, attorney fee splits, credit losses (on receivables), copy supplies, delivery fees, postage, premium taxes and title plant maintenance expenses. Independent costs include general supplies, litigation defense, business promotion and marketing and travel.
Consolidated other operating expenses in 2023 decreased $140.3 million, or 22%, compared to 2022, primarily due to reduced transaction volumes in 2023, while other operating expenses in 2022 increased $21.3 million, or 3%, and $251.6 million, or 67%, in 2022 and 2021, respectively, compared to corresponding prior years, while total2021. Total other operating expenses, as a percentage of total operating revenues (other operating expenses ratio), were 21.3%22.9%, 21.3% and 19.2% during 2023, 2022 and 16.5% during 2022, 2021, and 2020, respectively. Therespectively, with the higher other operating expenses ratios in 2023 and 2022 and 2021 were primarily influenceddriven by lower operating revenues and the increased size of our real estate solutions operations which typically have higher other operating expenses.
During 2023, total variable costs decreased $109.6 million, or 29%, compared to 2022, primarily due to lower appraisal and outside search expenses tied to lower overall operating revenues. Costs that are primarily fixed in nature decreased $11.8 million, or 6%, primarily driven by reduced outsourcing and rent and other occupancy expenses, while independent costs decreased $19.0 million, or 25%, primarily due to lower litigation settlement, business promotion and marketing, and office closures expenses.
During 2022, costs that are primarily fixed in nature increased $29.0 million, or 18%, compared to 2021, primarily due to additional rent and other occupancy and other expenses related to acquisitions, and increased insurance and technology expenses from existing businesses. Variable costs decreased $25.4 million, or 6%, primarily due to lower title and appraisal management transactions, partially offset by service costs related to increased revenues from our credit and real estate data services businesses. Independent costs increased $24.2 million, or 47%, primarily due to regulatory settlement and litigation expenses, increased office closure costs, and higher marketing and travel expenses.
During 2021, costs fixed in nature increased $29.0 million, or 21%, compared to 2020, primarily due to acquisitions, (which added technology costs, professional fees, and rent and other occupancy expenses), higher third-party outsourcing provider fees and increased consulting fees related to business acquisition and integration. Variable costs increased $206.5 million, or 101%, primarily due to increased appraiser and service expenses on higher real estate solutions revenues, increased outside title search, attorney fee splits and premium taxes on improved title revenues, and state sales tax assessments. Independent costs increased $16.1 million, or 46%, primarily due to office consolidation costs, higher marketing and travel expenses, and increased bank service fees.
Title losses. Provisions for title losses, as a percentage of title operating revenues, were 3.8%4.1%, 3.8% and 4.2% in 2023, 2022 and 5.3% in 2022, 2021, and 2020, respectively. The title loss ratio in any given year can be significantly influenced by changes in new large claims incurred, escrow losses and adjustments to reserves for existing large claims. We continue to manage and resolve large claims prudently and in keeping with our commitments to our policyholders.
Title losses in 2023 decreased $22.5 million, or 22%, compared to 2022, primarily as a result of lower title premiums in 2023. Title losses in 2022 decreased $23.5 million, or 19%, compared to the prior year, primarily due to lower title premiums and overall favorable claims experience in 2022. Title losses in 2021 increased $11.0 million, or 10%, compared to the prior year, primarily due to increased title premiums, partially offset by favorable claims experience. Title losses paid were $104.3 million, $93.1 million $71.5 million and $82.0$71.5 million in 2022, 2021 and 2020, respectively. Total claims payments in 2023 increased $11.2 million, or 12%, compared to 2022, primarily due to increase in payments for non-large claims related to prior policy years, while total claims in 2022 increased $21.6 million, or 30%, compared to 2021, primarily as a result of increased payments on large claims, while claims payments in 2021 decreased $10.5 million, or 12.8%, compared to the prior year, due to lower payments on large and non-large claims. Claims payments made on large title claims, net of insurance recoveries, during 2023, 2022 and 2021 and 2020 were $18.3$26.3 million, $2.8$23.1 million and $8.7$2.8 million, respectively.
Our liability for estimated title losses as of December 31, 20222023 and 20212022 comprises both known claims and our IBNR. Known claims reserves are reserves related to actual losses reported to us. Our reserve for known claims comprises both claims related to title insurance policies as well as losses arising from escrow closing and funding operations due to fraud or error (which are recognized as expense when discovered). The amount of the reserve represents the aggregate, non-discounted future payments (net of recoveries) that we expect to incur on policy and escrow losses and in costs to settle claims.
Total title policy loss reserve balances at December 31 were as follows:
| | | | 2022 | 2021 | | 2023 | 2022 |
| | | (in $ millions) | | (in $ millions) |
| Known claims | Known claims | 87.3 | | 75.9 | |
| IBNR | IBNR | 462.1 | | 473.7 | |
| Total estimated title losses | Total estimated title losses | 549.4 | | 549.6 | |
|
The actual timing of estimated title loss payments may vary since claims, by their nature, are complex and paid over long periods of time. Based on historical payment patterns, 87%approximately 86% of the outstanding loss reserves are paid out within eight years. As a result, the estimate of the ultimate amount to be paid on any claim may be modified over that time period. Due to the inherent uncertainty in predicting future title policy losses, significant judgment is required by both our management and our third party actuaries in estimating reserves. As a consequence, our ultimate liability may be materially greater or less than current reserves and/or our third party actuary’s calculated estimates. As of December 31, 20222023 and 2021,2022, our reserve balance was above the actuarial midpoint of total estimated policy loss reserves. Refer to Note 10 (Estimated title losses) to our audited consolidated financial statements for details.
Depreciation and amortization. Depreciation and amortization expense increased $5.3 million, or 9%, in 2023 compared to 2022, primarily due to increased depreciation expenses related to internal-use technology systems placed into operation starting in late 2022. Depreciation and amortization expense in 2022 increased $20.8 million, or 57%, and $17.2 million, or 89%, in 2022 and 2021, respectively, compared to corresponding prior years,2021, primarily due to acquisitions' intangible asset amortization. Acquisition intangible amortization which totaledexpenses in 2023, 2022 and 2021 were $34.6 million, $33.0 million and $19.0 million, respectively.
Income taxes. Our effective tax rates for 2023, 2022 and 2021 were 33.4%, 23.9% and 2020 were 23.9%, 22.5% and 24.0%, respectively, based on income before taxes (after deducting noncontrolling interests) of $45.7 million, $213.2 million and $417.2 million, respectively. The higher effective tax rate for 2023 was primarily due to the effect of non-deductible expenses on lower pretax income and $203.7 million, respectively.higher foreign income contribution, which is taxed at a higher rate than domestic income. Refer to Note 7 to our audited consolidated financial statements for details on the effective tax rates and income tax accounts.
LIQUIDITY AND CAPITAL RESOURCES
Our liquidity and capital resources reflect our ability to generate cash flow to meet our obligations to shareholders, customers (payments to satisfy claims on title policies), vendors, employees, lenders and others. As of December 31, 2022,2023, our total cash and investments, including amounts reserved pursuant to statutory requirements, aggregated $982.8$952.3 million. Of our total cash and investments at December 31, 2022, $594.92023, $531.0 million ($310.4283.3 million, net of statutory reserves) was held in the United States (U.S.) and the rest internationally, principally in Canada.
As a holding company, the parent company is funded principally by cash from its subsidiaries' earnings in the form of dividends, operating and other administrative expense reimbursements and pursuant to intercompany tax sharing agreements. Cash held at the parent company and its unregulated subsidiaries (which totaled $56.8$30.6 million at December 31, 2022)2023) is available for funding the parent company's operating expenses, interest payments on debt and dividend payments to common stockholders. The parent company also receives distributions from Guaranty, its regulated title insurance underwriter, to meet cash requirements for acquisitions and other strategic investments.
A substantial majority of our consolidated cash and investments as of December 31, 20222023 was held by Guaranty and its subsidiaries. The use and investment of these funds, dividends to the parent company, and cash transfers between Guaranty and its subsidiaries and the parent company are subject to certain legal and regulatory restrictions. In general, Guaranty uses its cash and investments in excess of its legally-mandated statutory premium reserve (established in accordance with requirements under Texas law) to fund its insurance operations, including claims payments. Guaranty may also, subject to certain limitations, provide funds to its subsidiaries (whose operations consist principally of field title offices and real estate solutions operations) for their operating and debt service needs.
We maintain investments in accordance with certain statutory requirements for the funding of statutory premium reserves. Statutory premium reserves are required to be fully funded and invested in high-quality securities and short-term investments. Statutory reserve funds are not available for current claims payments, which must be funded from current operating cash flow. Included in investments in debt and equity securities are statutory reserve funds of approximately $544.0$527.4 million at December 31, 2022.2023. In addition, included within cash and cash equivalents are statutory reserve funds of approximately $8.6$10.0 million at December 31, 2022.2023. Although these cash statutory reserve funds are not restricted or segregated in depository accounts, they are required to be held pursuant to state statutes. If the Company fails to maintain minimum investments or cash and cash equivalents sufficient to meet statutory requirements, the Company may be subject to fines or other penalties, including potential revocation of its business license. As of December 31, 2022,2023, our known claims reserve totaled $87.3$70.2 million and our estimate of claims that may be reported in the future, under U.S. generally accepted accounting principles, totaled $462.1$458.1 million. In addition to this, we had cash and investments (excluding equity method investments) of $198.8$339.2 million which are available for underwriter operations, including claims payments.
The ability of Guaranty to pay dividends to its parent is governed by Texas insurance law. The Texas Department of Insurance (TDI) must be notified of any dividend declared, and any dividend in excess of the greater of the statutory net operating income or 20% of surplus (which was approximately $158.1$168.7 million as of December 31, 2022)2023) would be, by regulation, considered extraordinary and subject to pre-approval by the TDI (see Note 3 to our audited consolidated financial statements for details). Also, the Texas Insurance Commissioner may raise an objection to a planned distribution during the notification period. Guaranty’s actual ability or intent to pay dividends to its parent may be constrained by business and regulatory considerations, such as the impact of dividends on surplus and liquidity, which could affect its ratings and competitive position, the amount of insurance it can write and its ability to pay future dividends. Guaranty paid no dividends to its parent ofduring 2023, while it paid $150.0 million and $293.9 million (including an extraordinary dividend of $135.0 million) during 2022 and 2021, respectively.2022.
Contractual obligations. Our material contractual obligations at December 31, 20222023 are composed primarily of our unsecured senior notes (and the related semi-annual interest payments), other notes payable, operating leases, and reserves for estimated title losses. Refer to Note 9 (Notes payable) and Note 14 (Leases) to our audited consolidated financial statements for details on the unsecured senior notes and other notes payable, and operating leases, respectively. Refer to the Note 10 (Estimated title losses) to our audited consolidated financial statements and the Title losses section under Results of Operations for details on title losses.
Cash flows. As the parent company conducts no operations apart from its wholly-owned subsidiaries, the discussion below focuses on consolidated cash flows. Refer to the consolidated statements of cash flows in the audited consolidated financial statements. | | 2022 | | 2021 | | 2020 |
| | 2023 | | | | 2023 | | 2022 | | 2021 |
| | | | (in $ millions) | | | (in $ millions) |
| Net cash provided by operating activities | Net cash provided by operating activities | | 191.9 | | | 390.3 | | | 275.8 | |
| Net cash used by investing activities | Net cash used by investing activities | | (300.7) | | | (645.3) | | | (231.4) | |
| Net cash provided (used) by financing activities | Net cash provided (used) by financing activities | | (123.2) | | | 310.4 | | | 54.3 | |
Operating activities. Our principal sources of cash from operations are premiums on title policies and revenue from title service-related transactions, real estate solutions and other operations. Our independent agencies remit cash to us net of their contractual retention. Our principal cash expenditures for operations are employee costs, operating costs and title claims payments.
Net cash provided by operations in 2023 declined by $108.8 million compared to 2022, primarily due to the lower net income and higher payments on claims, while net cash provided by operations in 2022 decreased by $198.4 million from 2021,compared to the prior year, primarily due to the lower net income and higher payments related to claims and interest on debt in 2022. Net cash provided by operations improved by $114.5 million in 2021 compared to 2020, primarily as a result of the higher net income and lower claims payments in 2021. Although our business is labor intensive, we are focused on a cost-effective, scalable business model which includes utilization of technology, centralized back and middle office functions and business process outsourcing. We are continuing our emphasis on cost management,continue to thoughtfully manage expenses, especially in light of the current economic environment due to elevated mortgage interest rates, specifically focusing on lowering unit costs of production and improving operating margins in all our businesses, while continuing to invest in capabilities that we expect will have a positive impact on our business over the long term.direct title and real estate solutions operations. Our plans to improve margins include additional automation of manual processes, and further consolidation of our various systems and production operations.operations, and full integration of acquisitions. We continue to investare investing in the technology necessary to accomplish these goals.
Investing activities. Cash used and provided by investing activities is primarily driven by proceeds from matured and sold investments, purchases of investments, capital expenditures and acquisition of title offices and other businesses. During 2023, 2022 2021 and 2020,2021, total proceeds from securities investments sold and matured were $132.2 million, $103.8 million $143.8 million and $96.0$143.8 million, respectively; while cash used for purchases of securities investments was $78.0 million, $207.5 million $143.9 million and $118.3$143.9 million, respectively. During 2021, we also invested $16.1 million in equity method investments in title offices.
We used $25.1 million, $142.9 million $600.0 million and $200.0$600.0 million of cash during 2023, 2022 2021 and 2020,2021, respectively, for acquisitions of various title and real estate solutions businesses, consistent withrelated to our strategy of increasing scale, growth in key markets and broader technology and service offerings. We used $37.8 million, $47.9 million $39.8 million and $15.0$39.8 million of cash for purchases of property and equipment during 2023, 2022 2021 and 2020,2021, respectively, while we generated cash proceeds of $10.7 million in 2021 primarily from the sale of our Colorado buildings. We maintain investment in capital expenditures at a level that enables us to implement technologies for increasing our operational and back-office efficiencies and pursuing market growth.to pursue growth in key markets.
Financing activities and capital resources. Total debt and stockholders’ equity were $447.0$445.3 million and $1.4 billion, respectively, as of December 31, 2022.2023. As of December 31, 2022,2023, our total debt-to-equity and debt-to-capitalization ratios, excluding short-term loan agreements in connection with our Section 1031 tax-deferred property exchange (Section 1031) business, were approximately 32% and 25%, respectively.
During 2021, we had the following debt transactions related to the parent company (refer to Note 9 to our audited consolidated financial statements for details of our debt transactions):company: •During the first and third quarters of 2021, we drew a total of $175.0 million on our previous line of credit facility.
•In October 2021, we entered into an unsecured credit agreement which included a new $200.0 million line of credit facility and a $400.0 million short-term loan facility. We drew $370.0 million from the short-term loan facility and used a portion of the proceeds to payoff the $273.9 million balance on the previous line of credit facility.
•In November 2021, we completed an offering of $450.0 million unsecured ten-year senior notes (Senior Notes) and generated proceeds, net of underwriting discounts and issuance costs, of $444.0 million. We used a portion of the proceeds to payoff the $370.0 million balance of our short-term loan.
During 2023, 2022 2021 and 2020,2021, payments on notes payable of $5.7 million, $74.3 million $165.0 million and $23.8$165.0 million, respectively, and notes payable additions of $3.5 million, $39.5 million $201.4 million and $16.5$201.4 million, respectively, were related to our Section 1031 business, which had an outstanding balance of $2.3$0.2 million at December 31, 2022.2023. As of December 31, 2022,2023, the outstanding balance of our Senior Notes was $444.6$445.1 million, while we have an unused $197.5 million borrowing capacity on our existing line of credit facility.facility (refer to Note 9 to our audited consolidated financial statements for details).
During 2022,2023, we paid dividends of $1.65$1.85 per common share, compared to $1.365$1.65 and $1.20$1.365 per common share paid during 20212022 and 2020,2021, respectively. In aggregate, we paid total dividends of $50.5 million, $44.7 million and $36.6 million in 2023, 2022 and $30.2 million in 2022, 2021, and 2020, respectively. During 2020, we generated net proceeds of approximately $109.0 million from an issuance of new shares of Common Stock, which we used primarily for the acquisition of several title offices.
Effect of changes in foreign currency rates. The effect of changes in foreign currency rates on the consolidated statements of cash flows was a net increase (decrease) increase in cash and cash equivalents of $1.0 million, ($5.5 million) and $(2.2 million) in 2023, 2022 and $3.3 million in 2022, 2021, and 2020, respectively. Our primary foreign currencies are the Canadian dollar and British pound, and, relative to the U.S. dollar, the value of the Canadian dollar and British pound generally appreciated in 2023 and declined during 2022 and 2021, while both foreign currencies appreciated during 2020.2021.
***********
We believe we have sufficient liquidity and capital resources to meet the cash needs of our ongoing operations, including inconsideration of the current economic and real estate environment created by the increasing mortgage interest and inflation rates. However, we may determine that additional debt or equity funding is warranted to provide liquidity for achievement of strategic goals or acquisitions or for unforeseen circumstances. Other than scheduled maturities of debt, operating lease payments and anticipated claims payments, we have no material contractual commitments. We expect that cash flows from operations and cash available from our underwriters, subject to regulatory restrictions, will be sufficient to fund our operations, including claims payments. However, to the extent that these funds are not sufficient, we may be required to borrow funds on terms less favorable than we currently have or seek funding from the equity market, which may not be successful or may be on terms that are dilutive to existing stockholders.
Other comprehensive income (loss) income.. Unrealized gains and losses on available-for-sale securities investments and changes in foreign currency exchange rates are reported net of deferred taxes in accumulated other comprehensive income (loss) income,, a component of stockholders’ equity, until realized. Refer to Note 1-H and Note 19 to our audited consolidated financial statements for details.
In 2023, net unrealized investment gains of $10.9 million, net of taxes, which increased our other comprehensive income, were primarily related to net increases in the fair values of our corporate and foreign bond securities investments, primarily influenced by inflation improvements and expected government actions to lower interest rates. Also in 2023, we recorded foreign currency translation gains which increased our other comprehensive income by $5.3 million, net of taxes, which was primarily driven by the appreciation in value of the Canadian dollar and British pound against the U.S. dollar.
In 2022, net unrealized investment losses of $36.7 million, net of taxes, which increased our other comprehensive loss, were primarily related to overall decreases in the fair values of our bond securities, primarily driven by the effect of higher interest rates. The five-year U.S. treasury yield applicable on our investments increased approximately 270 basis points in 2022 compared to 2021. Also in 2022, we recorded foreign currency translation losses which increased our other comprehensive loss by $14.9 million, net of taxes, which was primarily driven by the depreciation in value of the Canadian dollar and British pound against the U.S. dollar.
In 2021, net unrealized investment losses of $16.1 million, net of taxes, which increased our other comprehensive loss, were primarily related to decreases in the fair values of our corporate and foreign bond securities, primarily resulting from higher interest rates. The five-year U.S. treasury yield applicable on our investments increased approximately 90 basis points in 2021 versus 2020. Also in 2021, we recorded foreign currency translation losses which increased our other comprehensive loss by $0.7 million, net of taxes, which was primarily driven by the depreciation in value of the British pound against the U.S. dollar in 2021.
Off-balance sheet arrangements. We do not have any material source of liquidity or financing that involves off-balance sheet arrangements, other than our contractual obligations under operating leases. We also routinely hold funds in segregated escrow accounts pending the closing of real estate transactions and have qualified intermediaries in tax-deferred property exchanges for customers pursuant to Section 1031 of the Internal Revenue Code. The Company holds the proceeds from these transactions until a qualifying exchange can occur. In accordance with industry practice, these segregated accounts are not included on the balance sheet. See Note 15 to our audited consolidated financial statements included in Item 15 of Part IV of this report for details.
Cautionary statements regarding forward-looking statements. Certain statements in this report are "forward-looking statements" within the meaning of the Private Securities Litigation Reform Act of 1995. Such forward-looking statements relate to future, not past, events and often address our expected future business and financial performance. These statements often contain words such as “may,” "expect," "anticipate," "intend," "plan," "believe," "seek," "will," "foresee" or other similar words. Forward-looking statements by their nature are subject to various risks and uncertainties that could cause our actual results to be materially different than those expressed in the forward-looking statements. These risks and uncertainties include, among other things, the following:
•the volatility of economic conditions;
•adverse changes in the level of real estate activity;
•changes in mortgage interest rates, existing and new home sales, and availability of mortgage financing;
•our ability to respond to and implement technology changes, including the completion of the implementation of our enterprise systems;
•our ability to prevent and mitigate cyber risks;
•the impact of unanticipated title losses or the need to strengthen our policy loss reserves;
•any effect of title losses on our cash flows and financial condition;
•the ability to attract and retain highly productive sales associates;
•the impact of vetting our agency operations for quality and profitability;
•independent agency remittance rates;
•changes to the participants in the secondary mortgage market and the rate of refinancing that affects the demand for title insurance products;
•regulatory non-compliance, fraud or defalcations by our title insurance agencies or employees;
•our ability to timely and cost-effectively respond to significant industry changes and introduce new products and services;
•our ability to realize anticipated benefits of our previous acquisitions;
•the outcome of pending litigation;
•our ability to manage risks associated with potential cybersecurity or other privacy or data security breaches;
•the impact of changes in governmental and insurance regulations, including any future reductions in the pricing of title insurance products and services;
•our dependence on our operating subsidiaries as a source of cash flow;
•our ability to access the equity and debt financing markets when and if needed;
•effects of seasonality and weather; and
•our ability to respond to the actions of our competitors.
All forward-looking statements included in this report are expressly qualified in their entirety by such cautionary statements. We expressly disclaim any obligation to update, amend or clarify any forward-looking statements contained in this report to reflect events or circumstances that may arise after the date hereof, except as may be required by applicable law.
Item 7A. Quantitative and Qualitative Disclosures About Market Risk
The discussion below about our risk management strategies includes forward-looking statements that are subject to risks and uncertainties. Management’s projections of hypothetical net losses in the fair values of our market rate-sensitive financial instruments, should certain potential changes in market rates occur, are presented below. While we believe that the potential market rate changes are possible, actual rate changes could differ from our projections. Although we are exposed to a currency exchange rate risk for our foreign operations, this risk is not material to Stewart’s financial condition or results of operations.
The material market risk in our investments in financial instruments is related to our debt securities investments, which represent approximately 86%90% of our total securities investment portfolio at December 31, 2022,2023, with the remainder invested in equity securities. We invest primarily in corporate, foreign, municipal and U.S. government debt securities. We do not invest in financial instruments of a derivative or hedging nature. We have established policies and procedures to minimize our exposure to changes in the fair values of our investments. These policies include retaining an investment advisory firm, an emphasis upon credit quality, management of portfolio duration, maintaining or increasing investment income through high coupon rates and actively managing our risk profile and security mix depending upon market conditions. We have classified all of our debt securities investments as available-for-sale.
Investments in debt securities at December 31, 20222023 mature, according to their contractual terms, as follows (actual maturities may differ because of call or prepayment rights):
| | Amortized
costs | | Fair
values |
| | Amortized
costs | | | | Amortized
costs | | Fair
values |
| | | | (in $ thousands) | | | (in $ thousands) |
| In one year or less | In one year or less | | 79,070 | | | 78,241 | |
| After one year through two years | After one year through two years | | 105,800 | | | 102,569 | |
| After two years through three years | After two years through three years | | 68,276 | | | 65,604 | |
| After three years through four years | After three years through four years | | 109,389 | | | 101,981 | |
| After four years through five years | After four years through five years | | 75,688 | | | 70,544 | |
| After five years | After five years | | 208,505 | | | 192,995 | |
| 646,728 | | | 611,934 | |
| | 631,294 | |
We believe our investment portfolios are diversified and do not expect any material loss to result from the failure to perform by issuers of the debt securities we hold. Our investments are not collateralized. Foreign debt securities primarily include Canadian government and corporate bonds, United Kingdom treasury and corporate bonds and Mexican government bonds. Refer to Note 4 to our audited consolidated financial statements for details.
Based on our foreign debt securities portfolio and foreign currency exchange rates at December 31, 2022,2023, a 100 basis-point increase (decrease) in foreign currency exchange rates would result in an increase (decrease) of approximately $2.9$3.1 million in the fair value of our foreign debt securities portfolio. We do not currently employ hedging strategies with respect to foreign currency risk as we do not consider this risk as material to the Company. In addition, our international businesses conduct substantially all of their operations in their respective local currencies. Changes in foreign currency exchange rates may affect the fair value of the debt securities portfolio and may result in unrealized gains or losses.
Based on our debt securities portfolio and interest rates at December 31, 2022,2023, a 100 basis-point increase (decrease) in interest rates would result in a decrease (increase) of approximately $20.6$19.8 million, or 3.4%3.2%, in the fair value of our debt securities portfolio. Changes in interest rates may affect the fair value of the debt securities portfolio and may result in unrealized gains or losses.
Unrealized gains or losses on investments from changes in foreign currency exchange rates or interest rates would only be realized upon the sale of such investments. Fair value changes relating to equity securities and other-than-temporary declines in fair values of debt securities are charged to operations.
Item 8. Financial Statements and Supplementary Data
The information required to be provided in this item is included in our audited consolidated financial statements, including the Notes thereto, beginning on page F-1 of this report, and such information is incorporated in this report by reference.
Item 9. Changes in and Disagreements With Accountants on Accounting and Financial Disclosure
None.
Item 9A. Controls and Procedures
Management's annual report on internal control over financial reporting. Our principal executive officer and principal financial officer are responsible for establishing and maintaining disclosure controls and procedures. They evaluated the effectiveness of our disclosure controls and procedures (as defined in Exchange Act Rules 13a-15(e) and 15d-15(e)) as of December 31, 20222023 and have concluded that, as of such date, our disclosure controls and procedures are adequate and effective to ensure that information we are required to disclose in the reports that we file or submit under the Exchange Act is (i) recorded, processed, summarized and reported within the time periods specified in the SEC’s rules and forms, and (ii) accumulated and communicated to our management, including our principal executive officer and principal financial officer, as appropriate to allow timely decisions regarding required disclosure.
Our management is responsible for establishing and maintaining adequate internal control over financial reporting (as defined in Exchange Act Rule 13a-15(f) and 15d-15(f)). Our internal control over financial reporting is a process, under the supervision of our principal executive officer and principal financial officer, designed to provide reasonable assurance regarding the reliability of financial reporting and the preparation of financial statements for external purposes in accordance with generally accepted accounting principles. Our management, with the participation of our principal executive officer and principal financial officer, assessed the effectiveness of our internal control over financial reporting as of December 31, 2022.2023. In making this assessment, our management used the criteria set forth by the Committee of Sponsoring Organizations of the Treadway Commission (COSO) in Internal Control - Integrated Framework (2013). Based on this assessment, management believes that, as of December 31, 2022,2023, our internal control over financial reporting is effective based on those criteria.
All internal control systems, no matter how well designed, have inherent limitations. Therefore, even those systems determined to be effective can provide only reasonable assurance with respect to financial statement preparation and presentation. Internal control over financial reporting is a process that involves human diligence and compliance and is subject to lapses in judgment and breakdowns resulting from human failures. Internal control over financial reporting also can be circumvented by collusion or improper management override. Due to such limitations, there is a risk that material misstatements may not be prevented or detected on a timely basis by internal control over financial reporting. However, these inherent limitations are known features of the financial reporting process. Therefore, it is possible to design into the process safeguards to reduce, though not eliminate, this risk.
See page F-4 for the Report of Independent Registered Public Accounting Firm on our effectiveness of internal control over financial reporting.
Changes in internal control over financial reporting. There has been no change in our internal control over financial reporting during the quarter ended December 31, 20222023 that has materially affected, or is reasonably likely to materially affect, our internal control over financial reporting. As a result, no corrective actions were required or undertaken.
Item 9B. Other Information
None.
Item 9C. Disclosure Regarding Foreign Jurisdictions that Prevent Inspections
Not applicable.
PART III
Item 10. Directors, Executive Officers and Corporate Governance
Information regarding our directors and management team will be included in our proxy statement for our 20232024 Annual Meeting of Stockholders which will be filed within 120 days after December 31, 20222023 (Proxy Statement), and is incorporated in this report by reference.
Item 11. Executive Compensation
Information regarding compensation for our executive officers will be included in the Proxy Statement and is incorporated in this report by reference.
Item 12. Security Ownership of Certain Beneficial Owners and Management and Related Stockholder Matters
Information regarding security ownership of certain beneficial owners and management and related stockholder matters will be included in the Proxy Statement and is incorporated in this report by reference.
Item 13. Certain Relationships and Related Transactions, and Director Independence
Information regarding certain relationships and related transactions and director independence will be included in the Proxy Statement and is incorporated in this report by reference.
Item 14. Principal Accountant Fees and Services
Information regarding fees paid to and services provided by our independent registered public accounting firm (KPMG LLP, PCAOB ID 185) will be included in the Proxy Statement and is incorporated in this report by reference.
PART IV
Item 15. Exhibits and Financial Statement Schedules
(a)Financial Statements and Financial Statement Schedules
(b)Exhibits required to be filed by Item 601 of Regulation S-K are listed below.
| | | | | | | | | |
| Exhibit | | | |
| | | |
| 3.1 | — | | |
| 3.2 | — | | |
| | | |
| 4.1* | — | | |
| 4.2 | — | | |
| 4.3 | — | First Amendment to Amended and Restated Credit Agreement, dated effective as of May 7, 2020, by and among the Registrant, the guarantors named therein, BBVA USA, f/k/a Compass Bank, N.A., as administrative agent for the lenders, and the Lenders party thereto (incorporated by reference in this report from Exhibit 10.1 of the Current Report on Form 8-K filed May 11, 2020) | |
| 4.4 | — | Second Amendment to Amended and Restated Credit Agreement, dated effective as of March 23, 2021, by and among the Registrant, the guarantors named therein, BBVA USA, f/k/a Compass Bank, N.A., as administrative agent for the lenders, and the Lenders party thereto (incorporated by reference in this report from Exhibit 10.1 of the Current Report on Form 8-K filed March 25, 2021) | |
| 4.5 | — | | |
| 4.6 | — | | |
| 4.7 | — | | |
| 4.8 | — | | |
| 4.9 | — | | |
| 10.1† | — | | |
| 10.2† | — | | |
| 10.3† | — | | |
| | | | | | | | | |
| Exhibit | | | |
| | | |
10.3† | — | |
| 10.4† | — | |
10.5† | — | |
10.6† | — | |
10.7† | — | |
10.8† | — | |
10.9† | — | |
10.10† | — | |
10.11† | — | |
10.12† | — | |
10.13† | — | |
10.14† | — | | |
10.15†10.5† | — | | |
| 10.6† | — | | |
| 10.7†* | — | | |
| 10.8† | — | | |
| 10.9 | — | | |
| 14.1 | — | | |
| 21.1* | — | | |
| 23.1* | — | | |
| 31.1* | — | | |
| 31.2* | — | | |
| 32.1* | — | | |
| 32.2* | — | | |
| 97.1* | — | | |
| 101.INS* | — | XBRL Instance Document - the instance document does not appear in the Interactive Data File because its XBRL tags are embedded within the Inline XBRL document. | |
| 101.SCH* | — | XBRL Taxonomy Extension Schema Document | |
| 101.CAL* | — | XBRL Taxonomy Extension Calculation Linkbase Document | |
| 101.DEF* | — | XBRL Taxonomy Extension Definition Linkbase Document |
| | | | | | | | |
Exhibit | | |
| | |
| 101.LAB* | — | XBRL Taxonomy Extension Label Linkbase Document | |
| 101.PRE* | — | XBRL Taxonomy Extension Presentation Linkbase Document | |
| 104* | — | Cover Page Interactive Data File (formatted as Inline XBRL and contained in Exhibit 101) | |
| | | | | |
* | Filed herewith |
† |
* Filed herewith † Management contract or compensatory plan |
Item 16. Form 10-K Summary
None.
SIGNATURES
Pursuant to the requirements of Section 13 or 15(d) of the Securities Exchange Act of 1934, we have duly caused this report to be signed on our behalf by the undersigned, thereunto duly authorized.
STEWART INFORMATION SERVICES CORPORATION
(Registrant)
| | | | | |
| By: | /s/ Frederick H. Eppinger |
| Frederick H. Eppinger, Chief Executive Officer |
| |
| By: | /s/ David C. Hisey |
| David C. Hisey, Chief Financial Officer and Treasurer |
| |
| By: | /s/ Brian K. Glaze |
| Brian K. Glaze, Controller and
Principal Accounting Officer |
Date: February 28, 20232024
Pursuant to the requirements of the Securities Exchange Act of 1934, this report has been signed on our behalf by the following Directors:
| | | | | | | | | | | | | | | | | | | | |
| /s/ Thomas G. Apel | | /s/ William S. Corey, Jr. | | /s/ Matthew W. Morris | | /s/ Helen Vaid |
| (Thomas G. Apel) | | (William S. Corey, Jr.) | | (Matthew W. Morris) | | (Helen Vaid) |
| | | | | | |
| /s/ Clifford Allen Bradley Jr. | | /s/ Frederick H. Eppinger | | /s/ Karen R. Pallotta | | |
| (Clifford Allen Bradley) | | (Frederick H. Eppinger) | | (Karen R. Pallotta) | | |
| | | | | | |
| /s/ Robert L. Clarke | | /s/ Deborah J. Matz | | /s/ Manuel Sanchez | | |
| (Robert L. Clarke) | | (Deborah J. Matz) | | (Manuel Sanchez) | | |
| | | | | | |
Date: February 28, 20232024
INDEX TO CONSOLIDATED FINANCIAL STATEMENTS
AND FINANCIAL STATEMENT SCHEDULES
| | | | | | | | |
| Stewart Information Services Corporation and Subsidiaries’ Consolidated Financial Statements: | | |
| | |
| | |
| | |
| | |
| | |
| | |
| | |
| Financial Statement Schedules: | | |
| | |
| | |
Report of Independent Registered Public Accounting Firm
To the Stockholders and Board of Directors
Stewart Information Services Corporation:
Opinion on the Consolidated Financial Statements
We have audited the accompanying consolidated balance sheets of Stewart Information Services Corporation and subsidiaries (the Company) as of December 31, 20222023 and 2021,2022, the related consolidated statements of income and comprehensive income, cash flows, and equity for each of the years in the three-year period ended December 31, 2022,2023, and the related notes and financial statement schedules I andto II (collectively, the consolidated financial statements). In our opinion, the consolidated financial statements present fairly, in all material respects, the financial position of the Company as of December 31, 20222023 and 2021,2022, and the results of its operations and its cash flows for each of the years in the three-year period ended December 31, 2022,2023, in conformity with U.S. generally accepted accounting principles.
We also have audited, in accordance with the standards of the Public Company Accounting Oversight Board (United States) (PCAOB), the Company’s internal control over financial reporting as of December 31, 2022,2023, based on criteria established in Internal Control – Integrated Framework (2013) issued by the Committee of Sponsoring Organizations of the Treadway Commission, and our report dated February 28, 20232024 expressed an unqualified opinion on the effectiveness of the Company’s internal control over financial reporting.
Basis for Opinion
These consolidated financial statements are the responsibility of the Company’s management. Our responsibility is to express an opinion on these consolidated financial statements based on our audits. We are a public accounting firm registered with the PCAOB and are required to be independent with respect to the Company in accordance with the U.S. federal securities laws and the applicable rules and regulations of the Securities and Exchange Commission and the PCAOB.
We conducted our audits in accordance with the standards of the PCAOB. Those standards require that we plan and perform the audit to obtain reasonable assurance about whether the consolidated financial statements are free of material misstatement, whether due to error or fraud. Our audits included performing procedures to assess the risks of material misstatement of the consolidated financial statements, whether due to error or fraud, and performing procedures that respond to those risks. Such procedures included examining, on a test basis, evidence regarding the amounts and disclosures in the consolidated financial statements. Our audits also included evaluating the accounting principles used and significant estimates made by management, as well as evaluating the overall presentation of the consolidated financial statements. We believe that our audits provide a reasonable basis for our opinion.
Critical Audit Matters
The critical audit matters communicated below are matters arising from the current period audit of the consolidated financial statements that were communicated or required to be communicated to the audit committee and that: (1) relate to accounts or disclosures that are material to the consolidated financial statements and (2) involved our especially challenging, subjective, or complex judgments. The communication of critical audit matters does not alter in any way our opinion on the consolidated financial statements, taken as a whole, and we are not, by communicating the critical audit matters below, providing separate opinions on the critical audit matters or on the accounts or disclosures to which they relate.
Evaluation of the liability for estimated title losses
As discussed in notes 1E and 10 to the consolidated financial statements, the liability for estimated title losses represents the aggregate future payments (net of recoveries) that the Company expects to make on title insurance policy losses and certain costs to settle claims that have been incurred as of the balance sheet date. The Company calculates the liability for estimated title losses by adjusting the prior period’s ending reserve balance for the current year provision for estimated title losses and actual claim payments. The Company calculates the current year provision for estimated title losses by determining current period loss provision rates and applying them to the Company’s current premiums, except for large claims and escrow losses, which are considered separately. Management analyzes the difference between the internally-calculated liability for estimated title losses and a third-party actuarially-derived liability. Factors considered as part of this analysis include actual claim payments and incurred loss experience, including the frequency and severity of claims, compared to actuarial estimates of claim payments and incurred losses, as well as the impact of the economic and real estate market environment on particular policy years. As of December 31, 2022,2023, the balance of the liability for estimated title losses was $549$528 million.
We identified the evaluation of the liability for estimated title losses for certain lines of business as a critical audit matter. Specifically, the evaluation of the selection of loss provision rates used in the valuation of the liability for estimated title losses required subjective auditor judgment. The significant judgment was primarily due to the subjectivity of management’s estimates in relation to recent historical loss trends and the economic and real estate market environment.
The following are the primary procedures we performed to address the critical audit matter. We evaluated the design and tested the operating effectiveness of certain internal controls over the Company’s estimation of title losses. This included controls related to (1) the Company’s assessment of estimated losses based on selected loss provision rates used in determining the liability for estimated title losses; and (2) the Company’s assessment of the recorded liability for estimated title losses in relation to the estimate developed by the third-party actuary. We involved actuarial professionals with specialized skills and knowledge, who assisted in:
•assessing loss provision rates selected by the Company in relation to recent historical loss payment/premium trends and the economic and real estate market environment;
•comparing the third-party actuary reserving methodologies to generally accepted actuarial standards and assessing the actuarial methods and assumptions used, in relation to recent historical loss payment/premium trends and the economic and real estate market environment;
•developing a range of estimates of the liability for estimated title losses using the Company’s underlying historical claims data for certain lines of business, and comparing the liability for estimated title losses recorded by the Company to our independent range; and
•assessing the year-over-year movements of the Company’s liability for estimated title losses within our range.
Valuation of goodwill for certain reporting units
As discussed in notes 1L and 8 to the consolidated financial statements, the goodwill balance as of December 31, 2022,2023, was $1,073$1,072 million. The Company reviews goodwill for impairment annually and whenever occurrences of events indicate a potential impairment at the reporting unit level. Reporting unit fair values are determined using a combination of an income approach (discounted cash flow model) and a market approach (guideline public company method and, where available, precedent transaction analyses).
We identified the assessment of goodwill impairment for certain reporting units as a critical audit matter because a high degree of subjective auditor judgment was required to evaluate certain assumptions used in the fair value determinations of certain reporting units. Specifically, evaluation of the forecasted revenue growth rates and the discount rate assumptions used to estimate fair values of certain reporting units were challenging to test as they involved subjective projections of future market and economic conditions that were sensitive to variation. Minor changes to those assumptions could have had a significant effect on the Company’s assessment of the carrying value of the goodwill. Additionally, the audit effort associated with these assumptions required specialized skills and knowledge.
The following are the primary procedures we performed to address this critical audit matter. We evaluated the design and tested the operating effectiveness of certain internal controls related to the Company’s goodwill impairment evaluation, including controls over the Company’s determination of the forecasted revenue growth rates and the discount rates. We performed sensitivity analysesanalysis over the Company’s forecasted revenue growth rates for certain reporting units by comparing the Company’s growth assumptions to the forecasted growth rates from external industry and market data. We evaluated the Company’s forecasted revenue growth rates by comparing them to projected revenue growth rates for guideline companies. In addition, we involved valuation professionals with specialized skills and knowledge, who assisted in:
•evaluating the discount rates used by management in the valuation by comparing them against discount rate ranges that were independently developed using publicly available market data for comparable entities;
•developing, for one of the reporting units, an estimate of fair value using the Company’s cash flow forecasts and an independently developed discount rate, and comparing the results of our estimate to the Company’s fair value estimate; and
•developing, for the other reporting unit, an estimate of fair value using the cash flow forecasts resulting from our sensitivity analysis and an independently developed discount rate, and comparing the results of our estimate to the Company’s fair value estimate.
/s/ KPMG LLP
We have served as the Company’s auditor since 1980.
Houston, Texas
February 28, 20232024
Report of Independent Registered Public Accounting Firm
To the Stockholders and Board of Directors
Stewart Information Services Corporation:
Opinion on Internal Control Over Financial Reporting
We have audited Stewart Information Services Corporation and subsidiaries’ (the Company) internal control over financial reporting as of December 31, 2022,2023, based on criteria established in Internal Control - Integrated Framework (2013) issued by the Committee of Sponsoring Organizations of the Treadway Commission. In our opinion, the Company maintained, in all material respects, effective internal control over financial reporting as of December 31, 2022,2023, based on criteria established in Internal Control - Integrated Framework (2013) issued by the Committee of Sponsoring Organizations of the Treadway Commission.
We also have audited, in accordance with the standards of the Public Company Accounting Oversight Board (United States) (PCAOB), the consolidated balance sheets of the Company as of December 31, 20222023 and 2021,2022, the related consolidated statements of income and comprehensive income, cash flows, and equity for each of the years in the three-year period ended December 31, 2022,2023, and the related notes and financial statement schedules I andto II (collectively, the consolidated financial statements), and our report dated February 28, 20232024 expressed an unqualified opinion on those consolidated financial statements.
Basis for Opinion
The Company’s management is responsible for maintaining effective internal control over financial reporting and for its assessment of the effectiveness of internal control over financial reporting, included in the accompanying Management’s annual report on internal control over financial reporting included in Item 9A. Our responsibility is to express an opinion on the Company’s internal control over financial reporting based on our audit. We are a public accounting firm registered with the PCAOB and are required to be independent with respect to the Company in accordance with the U.S. federal securities laws and the applicable rules and regulations of the Securities and Exchange Commission and the PCAOB.
We conducted our audit in accordance with the standards of the PCAOB. Those standards require that we plan and perform the audit to obtain reasonable assurance about whether effective internal control over financial reporting was maintained in all material respects. Our audit of internal control over financial reporting included obtaining an understanding of internal control over financial reporting, assessing the risk that a material weakness exists, and testing and evaluating the design and operating effectiveness of internal control based on the assessed risk. Our audit also included performing such other procedures as we considered necessary in the circumstances. We believe that our audit provides a reasonable basis for our opinion.
Definition and Limitations of Internal Control Over Financial Reporting
A company’s internal control over financial reporting is a process designed to provide reasonable assurance regarding the reliability of financial reporting and the preparation of financial statements for external purposes in accordance with generally accepted accounting principles. A company’s internal control over financial reporting includes those policies and procedures that (1) pertain to the maintenance of records that, in reasonable detail, accurately and fairly reflect the transactions and dispositions of the assets of the company; (2) provide reasonable assurance that transactions are recorded as necessary to permit preparation of financial statements in accordance with generally accepted accounting principles, and that receipts and expenditures of the company are being made only in accordance with authorizations of management and directors of the company; and (3) provide reasonable assurance regarding prevention or timely detection of unauthorized acquisition, use, or disposition of the company’s assets that could have a material effect on the financial statements.
Because of its inherent limitations, internal control over financial reporting may not prevent or detect misstatements. Also, projections of any evaluation of effectiveness to future periods are subject to the risk that controls may become inadequate because of changes in conditions, or that the degree of compliance with the policies or procedures may deteriorate.
/s/ KPMG LLP
Houston, Texas
February 28, 20232024
CONSOLIDATED STATEMENTS OF INCOME AND COMPREHENSIVE INCOME
| | | | For the Years Ended December 31, | | For the Years Ended December 31, |
| | | 2022 | | 2021 | | 2020 | | 2023 | | 2022 | | 2021 |
| | | (in $ thousands, except per share amounts) | | (in $ thousands, except per share amounts) |
| Revenues | Revenues | |
| Title revenues: | Title revenues: | |
| Title revenues: | |
| Title revenues: | |
| Direct operations | |
| Direct operations | |
| Direct operations | Direct operations | 1,246,258 | | | 1,390,921 | | | 1,037,852 | |
| Agency operations | Agency operations | 1,466,243 | | | 1,582,640 | | | 1,151,030 | |
| Real estate solutions and other | Real estate solutions and other | 335,850 | | | 291,055 | | | 82,621 | |
| Operating revenues | Operating revenues | 3,048,351 | | | 3,264,616 | | | 2,271,503 | |
| Investment income | Investment income | 22,421 | | | 16,855 | | | 18,607 | |
| Net realized and unrealized (losses) gains | Net realized and unrealized (losses) gains | (1,476) | | | 24,321 | | | (1,678) | |
| 3,069,296 | | | 3,305,792 | | | 2,288,432 | |
| 2,257,341 | |
| Expenses | Expenses | |
| Amounts retained by agencies | |
| Amounts retained by agencies | |
| Amounts retained by agencies | Amounts retained by agencies | 1,208,307 | | | 1,300,431 | | | 944,480 | |
| Employee costs | Employee costs | 802,001 | | | 776,968 | | | 613,195 | |
| Other operating expenses | Other operating expenses | 648,022 | | | 626,762 | | | 375,188 | |
| Title losses and related claims | Title losses and related claims | 102,733 | | | 126,243 | | | 115,224 | |
| Depreciation and amortization | Depreciation and amortization | 57,178 | | | 36,386 | | | 19,216 | |
| Interest | Interest | 18,403 | | | 5,031 | | | 2,624 | |
| 2,836,644 | | | 2,871,821 | | | 2,069,927 | |
| 2,196,480 | |
| Income before taxes and noncontrolling interests | Income before taxes and noncontrolling interests | 232,652 | | | 433,971 | | | 218,505 | |
| Income tax expense | Income tax expense | (50,864) | | | (93,989) | | | (48,833) | |
| Net income | Net income | 181,788 | | | 339,982 | | | 169,672 | |
| Less net income attributable to noncontrolling interests | Less net income attributable to noncontrolling interests | 19,483 | | | 16,766 | | | 14,767 | |
| Net income attributable to Stewart | Net income attributable to Stewart | 162,305 | | | 323,216 | | | 154,905 | |
| | Net income | Net income | 181,788 | | | 339,982 | | | 169,672 | |
| Other comprehensive (loss) income, net of taxes: | |
| Net income | |
| Net income | |
| Other comprehensive income (loss), net of taxes: | |
| Foreign currency translation adjustments | |
| Foreign currency translation adjustments | |
| Foreign currency translation adjustments | Foreign currency translation adjustments | (14,939) | | | (679) | | | 4,789 | |
| Change in net unrealized gains and losses on investments | Change in net unrealized gains and losses on investments | (35,416) | | | (13,650) | | | 15,443 | |
| Reclassification adjustment for realized gains and losses on investments | Reclassification adjustment for realized gains and losses on investments | (1,241) | | | (2,440) | | | (511) | |
| Other comprehensive (loss) income, net of taxes | (51,596) | | | (16,769) | | | 19,721 | |
| Other comprehensive income (loss), net of taxes | |
| Comprehensive income | Comprehensive income | 130,192 | | | 323,213 | | | 189,393 | |
| Less comprehensive income attributable to noncontrolling interests | Less comprehensive income attributable to noncontrolling interests | 19,483 | | | 16,766 | | | 14,767 | |
| Comprehensive income attributable to Stewart | Comprehensive income attributable to Stewart | 110,709 | | | 306,447 | | | 174,626 | |
| | Basic average shares outstanding (000) | Basic average shares outstanding (000) | 27,055 | | | 26,822 | | | 24,793 | |
| Basic average shares outstanding (000) | |
| Basic average shares outstanding (000) | |
| Basic earnings per share attributable to Stewart | Basic earnings per share attributable to Stewart | 6.00 | | | 12.05 | | | 6.25 | |
| Diluted average shares outstanding (000) | Diluted average shares outstanding (000) | 27,347 | | | 27,168 | | | 24,913 | |
| Diluted earnings per share attributable to Stewart | Diluted earnings per share attributable to Stewart | 5.94 | | | 11.90 | | | 6.22 | |
See notes to consolidated financial statements.
CONSOLIDATED BALANCE SHEETS | | | | As of December 31, | | As of December 31, |
| | | 2022 | | 2021 | | 2023 | | 2022 |
| | | (in $ thousands) | | (in $ thousands except share amounts) |
| Assets | Assets | |
| Cash and cash equivalents | Cash and cash equivalents | 248,367 | | | 485,919 | |
| Cash and cash equivalents | |
| Cash and cash equivalents | |
| Short-term investments | Short-term investments | 24,318 | | | 17,650 | |
| Investments in debt and equity securities, at fair value: | Investments in debt and equity securities, at fair value: | |
| Debt securities (amortized cost of $646,728 and $578,165, respectively) | 611,934 | | | 589,772 | |
| Debt securities (amortized cost of $631,294 and $646,728, respectively) | |
| Debt securities (amortized cost of $631,294 and $646,728, respectively) | |
| Debt securities (amortized cost of $631,294 and $646,728, respectively) | |
| Equity securities | Equity securities | 98,149 | | | 89,442 | |
| 710,083 | | | 679,214 | |
| 679,936 | |
| Receivables: | Receivables: | |
| Premiums from agencies | |
| Premiums from agencies | |
| Premiums from agencies | Premiums from agencies | 39,921 | | | 45,428 | |
| Trade and other | Trade and other | 67,348 | | | 75,079 | |
| Income taxes | Income taxes | 10,281 | | | 5,420 | |
| Notes | Notes | 7,482 | | | 1,124 | |
| Allowance for credit losses | Allowance for credit losses | (7,309) | | | (7,711) | |
| 117,723 | | | 119,340 | |
| 124,904 | |
| Property and equipment, at cost: | Property and equipment, at cost: | |
| Land | |
| Land | |
| Land | Land | 2,545 | | | 2,545 | |
| Buildings | Buildings | 18,761 | | | 19,303 | |
| Furniture and equipment | Furniture and equipment | 213,707 | | | 216,261 | |
| Accumulated depreciation | Accumulated depreciation | (153,474) | | | (165,653) | |
| 81,539 | | | 72,456 | |
| 82,335 | |
| Operating lease assets | Operating lease assets | 127,830 | | | 134,578 | |
| Title plants, at cost | Title plants, at cost | 73,358 | | | 76,859 | |
| Investments in investees, on an equity method basis | Investments in investees, on an equity method basis | 4,575 | | | 4,754 | |
| Goodwill | Goodwill | 1,072,982 | | | 924,837 | |
| Intangible assets, net of amortization | Intangible assets, net of amortization | 199,084 | | | 229,804 | |
| Deferred tax assets, net | Deferred tax assets, net | 2,590 | | | 3,846 | |
| Other assets | Other assets | 75,430 | | | 64,105 | |
| 2,737,879 | | | 2,813,362 | |
| 2,702,861 | |
| Liabilities | Liabilities | | | |
| Notes payable | |
| Notes payable | |
| Notes payable | Notes payable | 447,006 | | | 483,491 | |
| Accounts payable and accrued liabilities | Accounts payable and accrued liabilities | 196,541 | | | 287,326 | |
| Operating lease liabilities | Operating lease liabilities | 148,003 | | | 149,417 | |
| Estimated title losses | Estimated title losses | 549,448 | | | 549,614 | |
| Deferred tax liabilities, net | Deferred tax liabilities, net | 26,616 | | | 48,779 | |
| 1,367,614 | | | 1,518,627 | |
| 1,324,312 | |
| Contingent liabilities and commitments | Contingent liabilities and commitments | | Contingent liabilities and commitments | | | |
| Stockholders’ equity | Stockholders’ equity | |
| Common Stock – $1 par, authorized 51,500,000; issued 27,482,573 and 27,245,591; outstanding 27,130,412 and 26,893,430, respectively | 27,483 | | | 27,246 | |
| Common Stock – $1 par, authorized 51,500,000; issued 27,722,388 and 27,482,573; outstanding 27,370,227 and 27,130,412, respectively | |
| Common Stock – $1 par, authorized 51,500,000; issued 27,722,388 and 27,482,573; outstanding 27,370,227 and 27,130,412, respectively | |
| Common Stock – $1 par, authorized 51,500,000; issued 27,722,388 and 27,482,573; outstanding 27,370,227 and 27,130,412, respectively | |
| Additional paid-in capital | Additional paid-in capital | 296,861 | | | 282,376 | |
| Retained earnings | Retained earnings | 1,091,816 | | | 974,800 | |
| Accumulated other comprehensive (loss) income: | |
| Accumulated other comprehensive loss: | |
| Foreign currency translation adjustments | Foreign currency translation adjustments | (23,856) | | | (8,917) | |
| Net unrealized (losses) gains on debt securities investments | (27,487) | | | 9,170 | |
| Treasury stock – 352,161 common shares, at cost, for both 2022 and 2021 (including 145,820 shares held by a subsidiary) | (2,666) | | | (2,666) | |
| Foreign currency translation adjustments | |
| Foreign currency translation adjustments | |
| Net unrealized losses on debt securities investments | |
| Treasury stock – 352,161 common shares, at cost, for both 2023 and 2022 (including 145,820 shares held by a subsidiary) | |
| Total stockholders’ equity attributable to Stewart | Total stockholders’ equity attributable to Stewart | 1,362,151 | | | 1,282,009 | |
| Noncontrolling interests | Noncontrolling interests | 8,114 | | | 12,726 | |
| Total stockholders’ equity | Total stockholders’ equity | 1,370,265 | | | 1,294,735 | |
| 2,737,879 | | | 2,813,362 | |
| 2,702,861 | |
See notes to consolidated financial statements.
CONSOLIDATED STATEMENTS OF CASH FLOWS | | | | For the Years Ended December 31, | | For the Years Ended December 31, |
| | | 2022 | | 2021 | | 2020 | | 2023 | | 2022 | | 2021 |
| | | (in $ thousands) | | (in $ thousands) |
| Reconciliation of net income to cash provided by operating activities: | Reconciliation of net income to cash provided by operating activities: | |
| Net income | Net income | 181,788 | | | 339,982 | | | 169,672 | |
| Net income | |
| Net income | |
| Adjustments for: | Adjustments for: | |
| Depreciation and amortization | |
| Depreciation and amortization | |
| Depreciation and amortization | Depreciation and amortization | 57,178 | | | 36,386 | | | 19,216 | |
| Provision for credit losses on receivables | Provision for credit losses on receivables | 824 | | | 3,023 | | | 649 | |
| Net realized and unrealized losses (gains) | Net realized and unrealized losses (gains) | 1,476 | | | (24,321) | | | 1,678 | |
| Amortization of net premium on debt securities investments | Amortization of net premium on debt securities investments | 2,162 | | | 3,624 | | | 4,261 | |
| Payments for title losses less than provisions | 9,635 | | | 54,744 | | | 33,229 | |
| Payments for title losses (in excess of) less than provisions | |
| Adjustments for insurance recoveries of title losses | Adjustments for insurance recoveries of title losses | 220 | | | (220) | | | 228 | |
| Decrease (increase) in receivables – net | 10,154 | | | (18,822) | | | (6,598) | |
| (Increase) decrease in receivables – net | |
| Decrease (increase) in other assets – net | Decrease (increase) in other assets – net | 2,503 | | | (5,931) | | | (5,380) | |
| (Decrease) increase in payables and accrued liabilities – net | (87,502) | | | (22,316) | | | 62,738 | |
| Decrease in payables and accrued liabilities – net | |
| Change in net deferred income taxes | Change in net deferred income taxes | 293 | | | 12,721 | | | (9,747) | |
| Net income from equity investees | Net income from equity investees | (3,257) | | | (9,488) | | | (3,504) | |
| Dividends received from equity investees | Dividends received from equity investees | 3,659 | | | 9,180 | | | 3,704 | |
| Stock-based compensation expense | Stock-based compensation expense | 12,282 | | | 11,966 | | | 5,751 | |
| Other – net | Other – net | 445 | | | (237) | | | (91) | |
| Cash provided by operating activities | Cash provided by operating activities | 191,860 | | | 390,291 | | | 275,806 | |
| Investing activities: | Investing activities: | |
| Proceeds from sales of investments in securities | |
| Proceeds from sales of investments in securities | |
| Proceeds from sales of investments in securities | Proceeds from sales of investments in securities | 66,695 | | | 69,293 | | | 37,240 | |
| Proceeds from matured investments in debt securities | Proceeds from matured investments in debt securities | 37,089 | | | 74,528 | | | 58,729 | |
| Purchases of investments in securities | Purchases of investments in securities | (207,512) | | | (143,925) | | | (118,301) | |
| Net (purchases) sales of short-term investments | Net (purchases) sales of short-term investments | (7,220) | | | 2,358 | | | 3,894 | |
| Purchases of property and equipment | Purchases of property and equipment | (47,948) | | | (39,799) | | | (14,992) | |
| Proceeds from the sale of property and equipment, and other assets | Proceeds from the sale of property and equipment, and other assets | 644 | | | 10,682 | | | 230 | |
| Net cash paid for acquisition of businesses | Net cash paid for acquisition of businesses | (142,859) | | | (599,984) | | | (199,537) | |
| Other – net | Other – net | 446 | | | (18,429) | | | 1,367 | |
| Cash used by investing activities | Cash used by investing activities | (300,665) | | | (645,276) | | | (231,370) | |
| Financing activities: | Financing activities: | |
| Proceeds from notes payable | Proceeds from notes payable | 39,499 | | | 1,197,351 | | | 16,456 | |
| Proceeds from notes payable | |
| Proceeds from notes payable | |
| Payments on notes payable | Payments on notes payable | (76,486) | | | (809,816) | | | (25,581) | |
| Purchase of remaining interest of consolidated subsidiaries | Purchase of remaining interest of consolidated subsidiaries | (3,838) | | | (5,616) | | | — | |
| Cash dividends paid | Cash dividends paid | (44,672) | | | (36,637) | | | (30,226) | |
| Distributions to noncontrolling interests | Distributions to noncontrolling interests | (20,640) | | | (16,407) | | | (13,944) | |
| Payment of acquisition contingent consideration | Payment of acquisition contingent consideration | (19,764) | | | (11,560) | | | — | |
| Issuance of Common Stock | — | | | — | | | 108,961 | |
| | Repurchases of Common Stock | |
| Repurchases of Common Stock | |
| Repurchases of Common Stock | Repurchases of Common Stock | (3,262) | | | (2,252) | | | (1,054) | |
| Proceeds from stock option and employee stock purchase plan exercises | Proceeds from stock option and employee stock purchase plan exercises | 5,828 | | | 2,715 | | | — | |
| Other - net | Other - net | 115 | | | (7,404) | | | (311) | |
| Cash (used) provided by financing activities | Cash (used) provided by financing activities | (123,220) | | | 310,374 | | | 54,301 | |
| Effects of changes in foreign currency exchange rates | Effects of changes in foreign currency exchange rates | (5,527) | | | (2,153) | | | 3,337 | |
| (Decrease) increase in cash and cash equivalents | (Decrease) increase in cash and cash equivalents | (237,552) | | | 53,236 | | | 102,074 | |
| Cash and cash equivalents at beginning of year | Cash and cash equivalents at beginning of year | 485,919 | | | 432,683 | | | 330,609 | |
| Cash and cash equivalents at end of year | Cash and cash equivalents at end of year | 248,367 | | | 485,919 | | | 432,683 | |
CONSOLIDATED STATEMENTS OF CASH FLOWS
| | | | | For the Years Ended December 31, | | | For the Years Ended December 31, |
| | | | 2022 | | 2021 | | 2020 | | | 2023 | | 2022 | | 2021 |
| (in $ thousands) |
| | (in $ thousands) | | | | (in $ thousands) |
| Supplemental information: | Supplemental information: | |
| | Net changes in financial statement amounts due to acquisition of businesses: | |
| Goodwill acquired | | 149,436 | | | 493,383 | | | 182,587 | |
| Net changes in financial statement amounts due to acquisition of businesses and purchase accounting adjustments: | |
| | Net changes in financial statement amounts due to acquisition of businesses and purchase accounting adjustments: | |
| | Net changes in financial statement amounts due to acquisition of businesses and purchase accounting adjustments: | |
| Goodwill (adjusted) acquired | |
| Goodwill (adjusted) acquired | |
| Goodwill (adjusted) acquired | |
| Intangible assets acquired | Intangible assets acquired | | 12,621 | | | 211,591 | | | 37,835 | |
| Receivables and other assets acquired | Receivables and other assets acquired | | 8,038 | | | 5,316 | | | 13,677 | |
| Fixed assets and title plants acquired | | 669 | | | 14,277 | | | — | |
| Fixed assets and title plants (adjusted) acquired | |
| Liabilities recognized | Liabilities recognized | | (27,760) | | | (102,047) | | | (34,562) | |
| Deferred tax liabilities, net recognized | Deferred tax liabilities, net recognized | | — | | | (16,587) | | | — | |
| Noncontrolling interests recognized | Noncontrolling interests recognized | | (145) | | | (5,949) | | | — | |
| Net cash paid for acquisition of businesses | Net cash paid for acquisition of businesses | | 142,859 | | | 599,984 | | | 199,537 | |
| | Income taxes paid, net | Income taxes paid, net | | 60,088 | | | 106,101 | | | 44,756 | |
| Income taxes paid, net | |
| Income taxes paid, net | |
| Interest paid | Interest paid | | 17,398 | | | 2,828 | | | 2,604 | |
See notes to consolidated financial statements.
CONSOLIDATED STATEMENTS OF EQUITY | | Common Stock | | | Common Stock | | Additional
paid-in
capital | | Accumulated
other
comprehensive
(loss) income | | Retained
Earnings | | Treasury
stock | | Noncontrolling
interests | | Total |
| | Common Stock | | Additional
paid-in
capital | | Accumulated
other
comprehensive
(loss) income | | Retained
Earnings | | Treasury
stock | | Noncontrolling
interests | | Total |
| | (in $ thousands) | | |
| Balances at January 1, 2020 | 24,062 | | | 164,217 | | | (2,699) | | | 564,392 | | | (2,666) | | | 6,453 | | | 753,759 | |
| Balances at January 1, 2021 | |
| Balances at January 1, 2021 | |
| Balances at January 1, 2021 | |
| | Net income attributable to Stewart | Net income attributable to Stewart | — | | | — | | | — | | | 154,905 | | | — | | | — | | | 154,905 | |
| Dividends on Common Stock ($1.20 per share) | — | | | — | | | — | | | (30,478) | | | — | | | — | | | (30,478) | |
| Issuance of Common Stock | 3,026 | | | 105,935 | | | — | | | — | | | — | | | — | | | 108,961 | |
| Stock-based compensation | 18 | | | 5,733 | | | — | | | — | | | — | | | — | | | 5,751 | |
| | Stock repurchases | (26) | | | (1,028) | | | — | | | — | | | — | | | — | | | (1,054) | |
| | Change in net unrealized gains and losses on investments, net of taxes | — | | | — | | | 15,443 | | | — | | | — | | | — | | | 15,443 | |
| Reclassification adjustment for realized gains and losses on investments, net of taxes | — | | | — | | | (511) | | | — | | | — | | | — | | | (511) | |
| Foreign currency translation adjustments (net of tax) | — | | | — | | | 4,789 | | | — | | | — | | | — | | | 4,789 | |
| Net income attributable to noncontrolling interests | — | | | — | | | — | | | — | | | — | | | 14,767 | | | 14,767 | |
| Distributions to noncontrolling interests | — | | | — | | | — | | | — | | | — | | | (13,944) | | | (13,944) | |
| Net effect of changes in ownership and other | — | | | — | | | — | | | — | | | — | | | 18 | | | 18 | |
| Balances at December 31, 2020 | 27,080 | | | 274,857 | | | 17,022 | | | 688,819 | | | (2,666) | | | 7,294 | | | 1,012,406 | |
| | Net income attributable to Stewart | |
| Net income attributable to Stewart | Net income attributable to Stewart | — | | | — | | | — | | | 323,216 | | | — | | | — | | | 323,216 | |
| Dividends on Common Stock ($1.37 per share) | Dividends on Common Stock ($1.37 per share) | — | | | — | | | — | | | (37,235) | | | — | | | — | | | (37,235) | |
| | Stock-based compensation | |
| Stock-based compensation | |
| Stock-based compensation | Stock-based compensation | 144 | | | 11,822 | | | — | | | — | | | — | | | — | | | 11,966 | |
| Stock option and employee stock purchase plan exercises | Stock option and employee stock purchase plan exercises | 64 | | | 2,651 | | | — | | | — | | | — | | | — | | | 2,715 | |
| Stock repurchases | Stock repurchases | (42) | | | (2,210) | | | — | | | — | | | — | | | — | | | (2,252) | |
| Purchase of remaining interest of consolidated subsidiary | Purchase of remaining interest of consolidated subsidiary | — | | | (4,744) | | | — | | | — | | | — | | | (872) | | | (5,616) | |
| Change in net unrealized gains and losses on investments, net of taxes | Change in net unrealized gains and losses on investments, net of taxes | — | | | — | | | (13,650) | | | — | | | — | | | — | | | (13,650) | |
| Reclassification adjustment for realized gains and losses on investments, net of taxes | Reclassification adjustment for realized gains and losses on investments, net of taxes | — | | | — | | | (2,440) | | | — | | | — | | | — | | | (2,440) | |
| Foreign currency translation adjustments (net of tax) | Foreign currency translation adjustments (net of tax) | — | | | — | | | (679) | | | — | | | — | | | — | | | (679) | |
| Net income attributable to noncontrolling interests | Net income attributable to noncontrolling interests | — | | | — | | | — | | | — | | | — | | | 16,766 | | | 16,766 | |
| Distributions to noncontrolling interests | Distributions to noncontrolling interests | — | | | — | | | — | | | — | | | — | | | (16,407) | | | (16,407) | |
| Net effect of changes in ownership and other | Net effect of changes in ownership and other | — | | | — | | | — | | | — | | | — | | | 5,945 | | | 5,945 | |
| Balances at December 31, 2021 | Balances at December 31, 2021 | 27,246 | | | 282,376 | | | 253 | | | 974,800 | | | (2,666) | | | 12,726 | | | 1,294,735 | |
| | Net income attributable to Stewart | Net income attributable to Stewart | — | | | — | | | — | | | 162,305 | | | — | | | — | | | 162,305 | |
| Net income attributable to Stewart | |
| Net income attributable to Stewart | |
| Dividends on Common Stock ($1.65 per share) | Dividends on Common Stock ($1.65 per share) | — | | | — | | | — | | | (45,289) | | | — | | | — | | | (45,289) | |
| | Stock-based compensation | |
| Stock-based compensation | |
| Stock-based compensation | Stock-based compensation | 164 | | | 12,118 | | | — | | | — | | | — | | | — | | | 12,282 | |
| Stock option and employee stock purchase plan exercises | Stock option and employee stock purchase plan exercises | 124 | | | 5,704 | | | — | | | — | | | — | | | — | | | 5,828 | |
| Stock repurchases | Stock repurchases | (51) | | | (3,211) | | | — | | | — | | | — | | | — | | | (3,262) | |
| Purchase of remaining interest of consolidated subsidiary | Purchase of remaining interest of consolidated subsidiary | — | | | (126) | | | — | | | — | | | — | | | (3,712) | | | (3,838) | |
| Change in net unrealized gains and losses on investments, net of taxes | Change in net unrealized gains and losses on investments, net of taxes | — | | | — | | | (35,416) | | | — | | | — | | | — | | | (35,416) | |
| Reclassification adjustment for realized gains and losses on investments, net of taxes | Reclassification adjustment for realized gains and losses on investments, net of taxes | — | | | — | | | (1,241) | | | — | | | — | | | — | | | (1,241) | |
| Foreign currency translation adjustments (net of tax) | Foreign currency translation adjustments (net of tax) | — | | | — | | | (14,939) | | | — | | | — | | | — | | | (14,939) | |
| Net income attributable to noncontrolling interests | Net income attributable to noncontrolling interests | — | | | — | | | — | | | — | | | — | | | 19,483 | | | 19,483 | |
| Distributions to noncontrolling interests | Distributions to noncontrolling interests | — | | | — | | | — | | | — | | | — | | | (20,640) | | | (20,640) | |
| Net effect of changes in ownership and other | Net effect of changes in ownership and other | — | | | — | | | — | | | — | | | — | | | 257 | | | 257 | |
| Balances at December 31, 2022 | Balances at December 31, 2022 | 27,483 | | | 296,861 | | | (51,343) | | | 1,091,816 | | | (2,666) | | | 8,114 | | | 1,370,265 | |
| | Net income attributable to Stewart | |
| Net income attributable to Stewart | |
| Net income attributable to Stewart | |
| Dividends on Common Stock ($1.85 per share) | |
| | Stock-based compensation | |
| Stock-based compensation | |
| Stock-based compensation | |
| Stock option and employee stock purchase plan exercises | |
| Stock repurchases | |
| | Change in net unrealized gains and losses on investments, net of taxes | |
| Change in net unrealized gains and losses on investments, net of taxes | |
| Change in net unrealized gains and losses on investments, net of taxes | |
| Reclassification adjustment for realized gains and losses on investments, net of taxes | |
| Foreign currency translation adjustments (net of tax) | |
| Net income attributable to noncontrolling interests | |
| Distributions to noncontrolling interests | |
| | Balances at December 31, 2023 | |
| Balances at December 31, 2023 | |
| Balances at December 31, 2023 | |
See notes to consolidated financial statements.
NOTES TO CONSOLIDATED FINANCIAL STATEMENTS
Three Years Ended December 31, 20222023
NOTE 1
General. Stewart Information Services Corporation, through its subsidiaries (collectively, the Company), is primarily engaged in the business of providing title insurance and real estate transaction related services. The Company is a global real estate services company, offering products and services through its directly owned policy-issuing offices,direct operations, network of independent agencies and other businesses within the Company. The Company provides its title products and services to homebuyers and sellers; residential and commercial real estate professionals; mortgage lenders and servicers; title agencies and real estate attorneys; and home builders. The Company also provides appraisal management services, online notarization and closing services, credit and real estate information services, and search and valuation services (referred to as real estate solutions services). The Company operates in the United States (U.S.) and internationally, primarily in Canada, the United Kingdom and Australia. Approximately 51%50% of consolidated title revenues for the year ended December 31, 20222023 were generated in Texas, New York, Florida,Ohio, California, Ohio,Florida, Pennsylvania and international markets (principally Canada).
A. Management’s responsibility. The accompanying consolidated financial statements were prepared by management, who is responsible for their integrity and objectivity. The financial statements have been prepared in conformity with U.S. generally accepted accounting principles (GAAP), including management’s best judgments and estimates. Actual results could differ from those estimates.
B. Consolidation. The consolidated financial statements include all subsidiaries in which the Company owns more than 50% voting rights in electing directors. All significant intercompany amounts and transactions have been eliminated and provisions have been made for noncontrolling interests. Unconsolidated investees, in which the Company typically owns 20% through 50% of the entity, are accounted for using the equity method.
C. Statutory accounting. Stewart Title Guaranty Company (Guaranty) and other title insurance underwriters owned by the Company prepare financial statements in accordance with statutory accounting practices prescribed or permitted by regulatory authorities. In conforming the statutory financial statements to GAAP, statutory premium reserves and reserves for known title losses are eliminated and, in substitution, amounts are established for estimated title losses (Note 1-E), for which the net effect, after providing for income taxes, is included in the consolidated statements of income and comprehensive income. Additionally, investments in debt securities, which are carried at amortized cost for statutory accounting, are reported at fair value and the net unrealized gains and losses, net of applicable deferred taxes, on the investments are included as a component of accumulated other comprehensive income (loss) (AOCI) within stockholders’ equity.
D. Revenues. Direct premiums - Premiums from title insurance policies directly issued or issued by affiliate offices are recognized at the time of the closing of the related real estate transaction.
Agency premiums - Premiums from title insurance policies written by independent agencies are recognized when the policies are reported to the Company. In addition, where reasonable estimates can be made, the Company accrues for policies issued but not reported until after period end. The Company believes that reasonable estimates can be made when recent and consistent policy issuance information is available. Estimates are based on historical reporting patterns and other information obtained about independent agencies, as well as current trends in direct operations and in the title industry. In this accrual, future transactions are not being estimated. The Company is estimating revenues on policies that have already been issued by independent agencies but not yet reported to or received by the Company.
Escrow fees - An escrow is a transaction pursuant to an agreement of a buyer, seller, borrower, or lender wherein an impartial third party, such as the Company, acts in a fiduciary capacity on behalf of the parties in accordance with the terms of such agreement in order to accomplish the directions stated therein. Services provided include, among others, acting as escrow or other fiduciary agent, obtaining releases, and conducting the actual closing or settlement. Escrow fees are recognized upon closing of the escrow, which is generally at the same time of the closing of the related real estate transaction.
Real estate solutions and abstract fees revenues - These revenues consist primarily of revenues from appraisal management services, online notarization and closing services, credit and real estate information services, and abstract services. Appraisal management and abstract services are primarily related to establishing the ownership, legal status and valuation of the property in a real estate transaction. In these cases, the Company does not issue a title insurance policy or perform duties of an escrow agent. Online notarization and closing services provide customers with streamlined, secure and paperless experience for notarization, signing and closing transactions. Respectively, credit and real estate information services provide customers with credit data-driven solutions that facilitate an efficient loan origination process, and comprehensive and real-time property data that benefits various real estate market stakeholders. Revenues from these services are recognized upon delivery of the service to the customer.
Other revenues - These revenues consist primarily of fees related to tax-deferred property exchange services, income from equity investees, and other title settlement-related services. For those products and services that are delivered at a point in time, the related revenue is recognized upon delivery based on the unit price of the product or service. For those products and services where delivery occurs over time, the related revenue is recognized ratably over the duration of the subscription.
Refer to Note 17 and Note 18 for the breakdown of the Company's operating revenues by type and by segment, respectively.
E. Title losses and related claims. The Company's liability for estimated title losses comprises estimates of both known claims and incurred but unreported claims expected to be paid in the future for policies issued as of the balance sheet date. This liability represents the aggregate future payments, net of recoveries, that the Company expects to make related to policy claims. The Company’s method for recording reserves for title losses on both an interim and annual basis begins with the calculation of its current loss provision rate, which is applied to the Company’s current premiums resulting in a title loss expense for the period, except for large claims and escrow losses. This loss provision rate is set to provide for estimated losses on current year policies and is determined using moving average ratios of recent actual policy loss payment experience (net of recoveries) to premium revenues.
At each quarter end, the Company’s recorded reserve for title losses is based on the prior period’s reserve balance for claim losses, increased by the current period provision and reduced by actual paid claims. The resulting reserve balance is compared by management to its actuarially-based calculation of the ending reserve balance necessary to provide for future reported title losses. The actuarially-based calculation is a paid loss development calculation where loss development factors are selected based on Company data and input from the Company’s third-party actuaries. Semi-annually, the Company also obtains input from third-party actuaries in the form of a reserve analysis utilizing generally accepted actuarial methods. While the Company is responsible for determining its loss reserves, it utilizes this actuarial input to assess the overall reasonableness of its reserve estimation.
If the Company’s recorded reserve amount is not at the third-party actuarial point estimate, but is within a reasonable range (+7.0%/-4.0%) of its actuarially-based reserve calculation and the actuary’s point estimate, the Company’s management assesses the major factors contributing to the different reserve estimates in order to determine the overall reasonableness of its recorded reserve, as well as the position of the recorded reserves relative to the point estimate and the estimated range of reserves. The major factors considered can change from period to period and include items such as current trends in the real estate industry (which management can assess although there is a time lag in the development of this data for use by the actuary), the size and types of claims reported and changes in the Company’s claims management process. If the recorded amount is not within a reasonable range of the Company’s third-party actuary’s point estimate, the Company will adjust the recorded reserves in the current period and reassess the provision rate on a prospective basis. Once the Company’s reserve for title losses is recorded, it is reduced in future periods as a result of claims payments and may be increased or reduced by revisions to the Company’s estimate of the overall level of required reserves.
Large claims (those exceeding $1.0 million on a single claim), including large title losses due to independent agency defalcations, are analyzed and reserved for separately due to the higher dollar amount of loss, lower volume of claims reported and sporadic reporting of such claims. Due to the inherent uncertainty in predicting future title policy losses, significant judgment is required by both the Company’s management and its third-party actuaries in estimating reserves. As a consequence, the Company’s ultimate liability may be materially greater or less than its current reserves and/or its third-party actuary’s calculated estimate.
F. Cash equivalents. Cash equivalents are highly liquid investments with insignificant interest rate risks and maturities of three months or less at the time of acquisition.
G. Short-term investments. Short-term investments comprise time deposits with banks, federal government obligations and other investments maturing in less than one year.
H. Investments in debt and equity securities. Investments in debt and equity securities are carried at fair value. Investments in debt securities are classified as available-for-sale and the net unrealized gains and losses on such investments, net of applicable deferred taxes, are included as a component of AOCI within stockholders' equity. Realized gains and losses on sales of investments are determined using the specific identification method. At the time unrealized gains and losses become realized, they are reclassified from AOCI using the specific identification method. Credit losses related to investments in debt securities are recognized through an allowance account, which is charged through income but may be reversed in future periods if no longer required. Fair value changes relating to investments in equity securities are recognized as part of net realized and unrealized gains and losses in the consolidated statements of income and comprehensive incomeincome.
I. Property and equipment. Depreciation is principally computed using the straight-line method using the following estimated useful lives: buildings – 30 to 40 years and furniture and equipment – 3 to 5 years. Maintenance and repairs are expensed as incurred while improvements are capitalized. Gains and losses are recognized at disposal.
J. Title plants. Title plants include compilations of a county’s official land records, prior title examination files, copies of prior title policies, maps and related materials that are geographically indexed to a specific property. The costs of acquiring existing title plants and creating new ones, prior to the time such plants are placed in operation, are capitalized. Title plants are not amortized since there is no indication of any loss of value over time but are subject to review for impairment. The costs of maintaining and operating title plants are expensed as incurred. Gains and losses on sales of copies of title plants or interests in title plants are recognized at the time of sale.
K. Impairment of long-lived assets. The Company reviews the carrying values of title plants and other long-lived assets if certain events occur that may indicate impairment. An impairment of these long-lived assets is indicated when, at the asset group level, projected undiscounted cash flows over the estimated lives of the assets are less than carrying values. If impairment is indicated, the recorded amounts are written down to fair values and charged to current operations.
L. Goodwill. Goodwill is not amortized, but is reviewed annually during the third quarter using June 30 balances, and whenever occurrences of events indicate a potential impairment at the reporting unit level. The Company evaluates goodwill based on four reporting units with goodwill balances - direct operations, agency operations, international operations and real estate solutions.
Under GAAP, the Company has an option to assess qualitative factors to determine whether it is more-likely-than-not that the fair value of a reporting unit is less than its carrying amount. In performing the qualitative assessment, the Company considers factors that include macroeconomic conditions, industry and market considerations, overall actual and expected financial performance, market perspective on the Company, as well as other relevant events and circumstances determined by management. The Company evaluates the weight of each factor to determine whether an impairment more-likely-than-not exists. If the Company decides not to use a qualitative assessment or if the reporting unit fails the qualitative assessment, the quantitative impairment analysis is performed.
The quantitative analysis involves the comparison of the fair value of each reporting unit to its carrying amount. Goodwill impairment, if any, is calculated as the excess of the reporting unit's carrying amount over the estimated fair value and is charged to current operations. While the Company is responsible for assessing whether an impairment of goodwill exists, inputs from third-party appraisers are utilized in performing the quantitative analysis. The Company estimates the fair value using a combination of the income approach (discounted cash flow (DCF) technique) and the market approach (guideline public company method and, where available, precedent transaction analyses). The DCF model utilizes historical and projected operating results and cash flows, initially driven by estimates of changes in future revenue levels, and risk-adjusted discount rates. Projected operating results are primarily driven by internal operating budgets and anticipated mortgage originations, which are obtained from projections by industry experts, for the title reporting units and expected contractual revenues for the real estate solutions reporting unit. Fluctuations in revenues, followed by the ability to appropriately adjust employee count and other operating expenses, or large and unanticipated adjustments to title loss reserves, are the primary reasons for increases or decreases in the projected operating results. Market-based valuation methodologies utilize (i) market multiples of earnings and/or other operating metrics of comparable companies and (ii) the Company's market capitalization and a control premium based on market data.
Due to the uncertainty and complexity of performing the goodwill impairment analysis, future actual results related to market conditions, the Company's business operations and other inputs to the analysis may be worse than estimated or assumed. In such cases, the Company may be exposed to future material impairments of goodwill.
Goodwill is assigned to the reporting units at the time the goodwill is initially recorded. Once assigned to a reporting unit, the goodwill is pooled and no longer attributable to a specific acquisition. All activities within a reporting unit are available to support the carrying value of the goodwill. When a business component within a reporting unit is disposed, goodwill is allocated to the component based on the ratio of the component's fair value over the total fair value of the reporting unit.
For its annual goodwill impairment test, the Company utilized the quantitative approach in 20222023 and the qualitative assessment in 2021,2022, and determined that goodwill related to each of its reporting units was not impaired. Additionally, due to the deterioration of the macroeconomic environment during the second half of 2022 and its impact on the real estate market, the Company performed an updated quantitative analysis using a valuation date of December 31, 2022 and concluded there is no impairment of goodwill for any of its reporting units.
M. Other intangibles. Other intangible assets are comprised principally of customer relationships, acquired technology, acquired trademarks, non-compete agreements and underwriting agreements. Intangible assets are amortized over their estimated lives: 10 to 20 years for customer relationships, 5 to 7 years for acquired technology, 3 years to indefinite for acquired trademarks, 3 years for non-compete agreements and 5 to 25 years for underwriting agreements. These intangible assets are reviewed for impairment when certain events or changes in circumstances occur that indicate that the carrying amount of an asset may not be recoverable - refer to Note 1-K.
N. Fair values. The fair values of financial instruments, including cash and cash equivalents, short-term investments, notes receivable, notes payable and accounts payable, are determined by the exchange price that would be received for an asset or paid to transfer a liability (an exit price) in the principal, or most advantageous, market for the asset or liability in an orderly transaction between market participants at the measurement date. The net fair values of these financial instruments approximate their carrying values. Investments in debt and equity securities and certain financial instruments are carried at their fair values.
O. Leases. The Company primarily leases office space, storage units, data centers and equipment, and determines if an arrangement is a lease at inception. Operating leases are included in operating lease assets and operating lease liabilities on the consolidated balance sheets. Operating lease assets represent the right to use the underlying leased assets over the corresponding lease terms. Finance leases are included in furniture and equipment and notes payable on the consolidated balance sheets. Operating lease assets and operating lease liabilities are recognized based on the present value of the future minimum lease payments over the lease term at the commencement date. The discount rate used in determining the present value of the future lease payments is based on the Company's incremental borrowing rate and is applied using a portfolio approach. Lease options to extend or terminate that the Company is reasonably certain to exercise are considered in the present value calculation. Leasehold improvements are depreciated over the lease term or the useful life of the asset, whichever is shorter.
Operating lease expense, which is calculated on a straight-line basis over the lease term and presented as part of other operating expenses in the statement of income and comprehensive income, is composed of the amortization of the lease asset and the accretion of the lease liability. Finance lease expense is composed of the depreciation of
the lease asset and accretion of the lease liability and presented as part of depreciation and amortization and interest expense, respectively, in the consolidated statements of income and comprehensive income.
The Company accounts for the lease and non-lease fixed payment components of a lease agreement as a single lease component for all its classes of assets. Variable lease payments are not capitalized and are recorded as lease expense when incurred or paid. Operating leases with initial terms of 12 months or less (short-term leases), which are not reasonably certain to be extended at the commencement date, are not capitalized on the balance sheet. Additionally, operating leases of equipment are not recorded on the balance sheet on the basis that they are relatively short-term in nature and considered as not material to the consolidated balance sheet.
P. Income taxes. Deferred tax assets and liabilities are recognized for future tax consequences attributable to differences between the tax basis and the book carrying values of certain assets and liabilities. To the extent that the Company does not believe its deferred tax assets meet the more-likely-than-not realization criteria, it establishes a valuation allowance. When it establishes a valuation allowance, or increases (decreases) the allowance during the year, it records a tax expense (benefit) in its consolidated statements of operations and comprehensive income (loss). Enacted tax rates are used in calculating amounts.
The Company provides for uncertainties in income taxes by prescribing a recognition threshold and measurement attribute for the financial statement recognition and measurement of a tax position taken or expected to be taken in a tax return. Interest and penalties, if any, are included in income tax expense.
Q. Business combinations. Amounts paid for acquisitions are allocated to the tangible and intangible assets acquired and liabilities assumed and are based on their estimated fair values at the date of acquisition. The excess of the fair value of the purchase consideration over the fair values of the identifiable assets and liabilities is recorded as goodwill. Acquisition-related costs are expensed in the periods in which the costs are incurred. The results of operations of acquired businesses are included in the consolidated financial statements from the date of acquisition. If the initial purchase accounting for an acquisition is incomplete by the end of the reporting period in which the acquisition occurred, provisional amounts are recorded. The measurement period for an acquisition ends the sooner of one year from the acquisition date or when management obtains acquisition-date information necessary to complete the purchase accounting. Adjustments to provisional amounts initially recorded are recognized in the reporting period in which the adjustment amounts are determined.
R. Recently enacted Inflation Reduction Act. On August 16, 2022, the U.S. government enacted the Inflation Reduction Act of 2022 (the Act) that includes, among other provisions, changes to the U.S. corporate income tax system, including a 15% minimum tax based on book income of certain large corporations for tax years beginning after December 31, 2022 and a 1% excise tax on net repurchases of stock starting in 2023. Management is still evaluating the Act and its requirements, however it does not believe that the Act will have a material impact on the Company's consolidated financial statements.
NOTE 2
Restrictions on cash and investments. The Company maintains investments in accordance with certain statutory requirements in the states of domicile of our underwriters for the funding of statutory premium reserves. Statutory reserve funds are required to be fully funded and invested in high-quality securities and short-term investments. Statutory reserve funds are not available for current claim payments, which must be funded from current operating cash flow. Included in investments in debt and equity securities are statutory reserve funds of approximately $544.0$527.4 million and $523.5$544.0 million at December 31, 20222023 and 2021,2022, respectively. In addition, included within cash and cash equivalents are statutory reserve funds of approximately $8.6$10.0 million and $41.4$8.6 million at December 31, 20222023 and 2021,2022, respectively. Although these cash statutory reserve funds are not restricted or segregated in depository accounts, they are required to be held pursuant to state statutes. If the Company fails to maintain minimum investments or cash and cash equivalents sufficient to meet statutory requirements, the Company may be subject to fines or other penalties, including potential revocation of its business license. These funds are not available for any other purpose. In the event that insurance regulators adjust the determination of the statutory premium reserves of the Company’s title insurers, these restricted funds as well as statutory surplus would correspondingly increase or decrease.
A substantial majority of consolidated cash and investments at each year end was held by the Company’s title insurance subsidiaries. Generally, the types of investments a title insurer can make are subject to legal restrictions. Furthermore, the transfer of funds by a title insurer to its parent or subsidiary operations, as well as other related party transactions, is restricted by law and generally requires the approval of state insurance authorities (see Note 3).
NOTE 3
Statutory surplus and dividend restrictions. A substantial portion of the consolidated retained earnings at each year end was related to Guaranty, which owns a majority of all the subsidiaries included in the consolidation. Guaranty cannot pay a dividend to its parent in excess of certain limits without the approval of the Texas Insurance Commissioner (TIC). Guaranty paid no dividends ofto its parent during 2023, while it paid $150.0 million and $293.9 million (including an extraordinary dividend of $135.0 million) in 2022 and 2021, respectively.2022. The maximum dividend that can be paid, on a rolling twelve-month period and subject to the timing of 2023 dividends paid, in 2022, without the TIC's approval in 20232024 is approximately $158.1$168.7 million, based on the greater of 20222023 net operating income or 20% of statutory surplus as December 31, 2022.2023.
Dividends from Guaranty are also voluntarily restricted primarily to maintain statutory surplus and liquidity at competitive levels and to demonstrate significant claims payment ability. The ability of a title insurer to pay claims can significantly affect the decision of lenders and other customers when buying a policy from a particular insurer. Surplus as regards policyholders (total statutory capital and surplus) for Guaranty was $790.4$843.3 million and $826.9$790.4 million at December 31, 20222023 and 2021,2022, respectively. Statutory net income for Guaranty was $76.1 million, $144.9 million and $188.8 million in 2023, 2022 and $133.2 million in 2022, 2021, and 2020, respectively.
The amount of statutory capital and surplus necessary to satisfy regulatory requirements for Guaranty was $2.0 million (and in the aggregate less than $2.0 million for all of the Company’s underwriter subsidiaries) at December 31, 2022,2023, and each of its underwriter entities was in compliance with such requirements as of December 31, 2022.2023.
NOTE 4
Investments in debt and equity securities. The total fair values of the Company's investments in debt and equity securities as of December 31 are detailed below:
| | | | 2022 | | 2021 | | 2023 | | 2022 |
| (in $ thousands) |
| (in $ thousands) | | | (in $ thousands) |
| Investments in: | Investments in: | |
| Debt securities | Debt securities | 611,934 | | | 589,772 | |
| Debt securities | |
| Debt securities | |
| Equity securities | Equity securities | 98,149 | | | 89,442 | |
| 710,083 | | | 679,214 | |
| 679,936 | |
As of December 31, 20222023 and 2021,2022, included in the above fair values of investments in equity securities were net unrealized investment gains of $19.2$11.2 million and $21.1$19.2 million, respectively.
The amortized costs and fair values of investments in debt securities as of December 31, are as follows:
| | | | 2022 | | 2021 | | 2023 | | 2022 |
| | | Amortized
costs | | Fair
values | | Amortized
costs | | Fair
values | | Amortized
costs | | Fair
values | | Amortized
costs | | Fair
values |
| | | (in $ thousands) | | (in $ thousands) |
| Municipal | Municipal | 30,104 | | | 29,835 | | | 34,739 | | | 36,323 | |
| Corporate | Corporate | 272,362 | | | 254,316 | | | 249,757 | | | 258,102 | |
| Foreign | Foreign | 315,184 | | | 299,137 | | | 287,240 | | | 288,883 | |
| U.S. Treasury Bonds | U.S. Treasury Bonds | 29,078 | | | 28,646 | | | 6,429 | | | 6,464 | |
| 646,728 | | | 611,934 | | | 578,165 | | | 589,772 | |
| 631,294 | |
The Company believes its investment portfolio is diversified and expects no material loss to result from the failure to perform by issuers of the debt securities it holds. Investments made by the Company are not collateralized. Foreign debt securities primarily include Canadian government and corporate bonds, with aggregate fair values of $261.8$282.4 million and $257.9$261.8 million as of December 31, 20222023 and 2021,2022, respectively, and United Kingdom treasury and corporate bonds with aggregate fair values of $28.0$31.7 million and $24.2$28.0 million as of December 31, 20222023 and 2021,2022, respectively.
Gross unrealized gains and losses on investments in debt securities at December 31, were:
| | | | 2022 | | 2021 | | 2023 | | 2022 |
| | | Gains | | Losses | | Gains | | Losses | | Gains | | Losses | | Gains | | Losses |
| | | (in $ thousands) | | (in $ thousands) |
| Municipal | Municipal | 3 | | | 272 | | | 1,585 | | | 1 | |
| Corporate | Corporate | 489 | | | 18,535 | | | 9,389 | | | 1,044 | |
| Foreign | Foreign | 165 | | | 16,212 | | | 3,285 | | | 1,642 | |
| U.S. Treasury Bonds | U.S. Treasury Bonds | 21 | | | 453 | | | 60 | | | 25 | |
| 678 | | | 35,472 | | | 14,319 | | | 2,712 | |
| 2,635 | |
Debt securities at December 31, 20222023 mature, according to their contractual terms, as follows (actual maturities may differ due to call or prepayment rights):
| | Amortized
costs | | Fair
values |
| Amortized
costs | | | Amortized
costs | | Fair
values |
| | | (in $ thousands) | | (in $ thousands) |
| In one year or less | In one year or less | 79,070 | | | 78,241 | |
| After one year through five years | After one year through five years | 359,153 | | | 340,698 | |
| After five years through ten years | After five years through ten years | 183,456 | | | 171,360 | |
| After ten years | After ten years | 25,049 | | | 21,635 | |
| 646,728 | | | 611,934 | |
| 631,294 | |
Gross unrealized losses on investments in debt securities and the fair values of the related securities, aggregated by investment category and length of time that individual securities have been in a continuous unrealized loss position at December 31, 2022,2023, were:
| | | | Less than 12 months | | More than 12 months | | Total | | Less than 12 months | | More than 12 months | | Total |
| | | Losses | | Fair values | | Losses | | Fair values | | Losses | | Fair values | | Losses | | Fair values | | Losses | | Fair values | | Losses | | Fair values |
| | | (in $ thousands) | | (in $ thousands) |
| Municipal | Municipal | 262 | | | 27,491 | | | 10 | | | 67 | | | 272 | | | 27,558 | |
| Corporate | Corporate | 12,935 | | | 193,239 | | | 5,600 | | | 44,342 | | | 18,535 | | | 237,581 | |
| Foreign | Foreign | 7,608 | | | 186,221 | | | 8,604 | | | 101,294 | | | 16,212 | | | 287,515 | |
| U.S. Treasury Bonds | U.S. Treasury Bonds | 413 | | | 25,102 | | | 40 | | | 445 | | | 453 | | | 25,547 | |
| 21,218 | | | 432,053 | | | 14,254 | | | 146,148 | | | 35,472 | | | 578,201 | |
| 917 | |
The number of specific debt securities investment holdings in an unrealized loss position as of December 31, 20222023 was 360.321. Of these securities, 86261 were in unrealized loss positions for more than 12 months. months. Gross unrealized investment losses at December 31, 2022 increased2023 decreased compared to December 31, 2021,2022, primarily due to the gradual market volatilityrecovery influenced by higherthe pause in government-initiated interest ratesrate hikes during 2022. the second half of 2023 and expectations of future interest rate reductions. Since the Company does not intend to sell and will more likelylikely than not maintain each investment security until its maturity or anticipated recovery, and no significant credit risk is deemed to exist, these investments are not considered as credit-impaired. The Company believes its investment portfolio is diversified and expects no material loss to result from the failure to perform by issuers of the debt securities it holds. Investments made by the Company are not collateralized.
Gross unrealized losses on investments in debt securities and the fair values of the related securities, aggregated by investment category and length of time that individual securities have been in a continuous unrealized loss position at December 31, 2021,2022, were:
| | | | Less than 12 months | | More than 12 months | | Total | | Less than 12 months | | More than 12 months | | Total |
| | | Losses | | Fair values | | Losses | | Fair values | | Losses | | Fair values | | Losses | | Fair values | | Losses | | Fair values | | Losses | | Fair values |
| | | (in $ thousands) | | (in $ thousands) |
| Municipal | Municipal | 1 | | | 130 | | | — | | | — | | | 1 | | | 130 | |
| Corporate | Corporate | 588 | | | 42,231 | | | 456 | | | 12,014 | | | 1,044 | | | 54,245 | |
| Foreign | Foreign | 1,502 | | | 118,943 | | | 140 | | | 3,394 | | | 1,642 | | | 122,337 | |
| U.S. Treasury Bonds | U.S. Treasury Bonds | 8 | | | 477 | | | 17 | | | 508 | | | 25 | | | 985 | |
| 2,099 | | | 161,781 | | | 613 | | | 15,916 | | | 2,712 | | | 177,697 | |
| 21,218 | |
NOTE 5
Fair value measurements. Fair value is the exchange price that would be received for an asset or paid to transfer a liability (an exit price) in the principal, or most advantageous, market for the asset or liability in an orderly transaction between market participants at the measurement date. U.S. GAAP establishes a three-level fair value hierarchy that prioritizes the inputs used to measure fair value. This hierarchy requires entities to maximize the use of observable inputs when possible. The three levels of inputs used to measure fair value are as follows:
•Level 1 – quoted prices in active markets for identical assets or liabilities;
•Level 2 – observable inputs other than quoted prices included in Level 1, such as quoted prices for similar assets and liabilities in active markets; quoted prices for identical or similar assets and liabilities in markets that are not active; or other inputs that are observable or can be corroborated by observable market data; and
•Level 3 – unobservable inputs that are supported by little or no market activity and that are significant to the fair values of the assets or liabilities, including certain pricing models, discounted cash flow methodologies and similar techniques that use significant unobservable inputs.
At December 31, 2023, financial instruments measured at fair value on a recurring basis are summarized below:
| | | | | | | | | | | | | | | | | | | | | | | |
| Level 1 | | Level 2 | | Level 3 | | Fair value
measurements |
| | (in $ thousands) |
| Investments in securities: | | | | | | | |
| Debt securities: | | | | | | | |
| Municipal | — | | | 22,031 | | | — | | | 22,031 | |
| Corporate | — | | | 231,474 | | | — | | | 231,474 | |
| Foreign | — | | | 323,391 | | | — | | | 323,391 | |
| U.S. Treasury Bonds | — | | | 33,340 | | | — | | | 33,340 | |
| Equity securities: | 69,700 | | | — | | | — | | | 69,700 | |
| 69,700 | | | 610,236 | | | — | | | 679,936 | |
At December 31, 2022, financial instruments measured at fair value on a recurring basis are summarized below:
| | | | | | | | | | | | | | | | | | | | | | | |
| Level 1 | | Level 2 | | Level 3 | | Fair value
measurements |
| | (in $ thousands) |
| Investments in securities: | | | | | | | |
| Debt securities: | | | | | | | |
| Municipal | — | | | 29,835 | | | — | | | 29,835 | |
| Corporate | — | | | 254,316 | | | — | | | 254,316 | |
| Foreign | — | | | 299,137 | | | — | | | 299,137 | |
| U.S. Treasury Bonds | — | | | 28,646 | | | — | | | 28,646 | |
| Equity securities: | 98,149 | | | — | | | — | | | 98,149 | |
| 98,149 | | | 611,934 | | | — | | | 710,083 | |
At December 31, 2021, financial instruments measured at fair value on a recurring basis are summarized below:
| | | | | | | | | | | | | | | | | | | | | | | |
| Level 1 | | Level 2 | | Level 3 | | Fair value
measurements |
| | (in $ thousands) |
| Investments in securities: | | | | | | | |
| Debt securities: | | | | | | | |
| Municipal | — | | | 36,323 | | | — | | | 36,323 | |
| Corporate | — | | | 258,102 | | | — | | | 258,102 | |
| Foreign | — | | | 288,883 | | | — | | | 288,883 | |
| U.S. Treasury Bonds | — | | | 6,464 | | | — | | | 6,464 | |
| Equity securities: | 89,442 | | | — | | | — | | | 89,442 | |
| 89,442 | | | 589,772 | | | — | | | 679,214 | |
At December 31, 2022,2023, Level 1 financial instruments consist of equity securities. Level 2 financial instruments consist of municipal, governmental, and corporate bonds, both U.S. and foreign. In accordance with the Company’s policies and guidelines which incorporate relevant statutory requirements, the Company’s third-party registered investment manager invests only in securities rated as investment grade or higher by the major rating services, where observable valuation inputs are significant. The fair value of the Company's investments in debt and equity securities is primarily determined using a third-party pricing service provider. The third-party pricing service provider calculates the fair values using both market approach and model valuation methods, as well as pricing information obtained from brokers, dealers and custodians. Management ensures the reasonableness of the third-party service valuations by comparing them with pricing information from the Company's investment manager.
NOTE 6
Investment income and net realized and unrealized gains. Investment income and net realized and unrealized gains for the years ended December 31 are detailed below:
| | 2022 | | 2021 | | 2020 |
| 2023 | | | 2023 | | 2022 | | 2021 |
| | | (in $ thousands) | | (in $ thousands) |
| Investment income: | Investment income: | |
| Debt securities | Debt securities | 14,483 | | | 13,313 | | | 15,026 | |
| Debt securities | |
| Debt securities | |
| Equity securities, short-term investments, cash equivalents and other | Equity securities, short-term investments, cash equivalents and other | 7,938 | | | 3,542 | | | 3,581 | |
| 22,421 | | | 16,855 | | | 18,607 | |
| Net realized and unrealized gains (losses): | | | | | |
| 45,135 | |
| Net realized and unrealized (losses) gains: | |
| Realized gains | |
| Realized gains | |
| Realized gains | Realized gains | 6,212 | | | 13,015 | | | 2,231 | |
| Realized losses | Realized losses | (5,142) | | | (6,414) | | | (1,598) | |
| Net unrealized investment gains (losses) recognized on equity securities still held | Net unrealized investment gains (losses) recognized on equity securities still held | (2,546) | | | 17,720 | | | (2,311) | |
| (1,476) | | | 24,321 | | | (1,678) | |
| (34) | |
In 2023, net realized and unrealized losses included a $3.2 million contingent receivable loss adjustment related to a previous disposition of a business and $0.9 million of net gains resulting from contingent liability adjustments related to two title company acquisitions. Total investment income in 2023 was significantly higher compared to 2022 and 2021, primarily due to higher interest income resulting from earned interest from eligible escrow balances and increased interest rates in 2023.
In 2022, net realized and unrealized gainslosses included $2.6 million of gains from settlements of company-owned insurance policies, a $1.0 million gain from an acquisition contingent liability adjustment and a $1.0 million realized gain related to a sale of a title plant copy, partially offset by $3.6 million of realized losses from disposals of businesses.
In 2021, net realized and unrealized gains included $6.1 million of net realized gains from sale of buildings and other fixed assets and $3.8 million of net gains from acquisition contingent liability adjustments, partially offset by $2.7 million of net realized losses related to disposals of equity method investments.
In 2020, net realized and unrealized losses included $2.3 million of net unrealized investment losses on equity securities held at year-end and $0.6 million of net realized losses from sales of securities investments, partially offset by $1.2 million of realized gains from settlements of equity investments with no previously readily determinable fair values (cost-basis investments).
Net investment gains and losses recognized for the years ended December 31 related to investments in equity securities are follows:
| | | | | | | | | | | | | | | | | |
| 2022 | | 2021 | | 2020 |
| (in $ thousands) |
| Total net investment (losses) gains recognized on equity securities during the period | (2,151) | | | 19,351 | | | (3,137) | |
| Less: Net realized gains (losses) on equity securities sold during the period | 395 | | | 1,631 | | | (826) | |
| Net unrealized investment (losses) gains recognized on equity securities still held at December 31 | (2,546) | | | 17,720 | | | (2,311) | |
| | | | | | | | | | | | | | | | | |
| 2023 | | 2022 | | 2021 |
| (in $ thousands) |
| Total net investment gains (losses) recognized on equity securities during the period | 3,044 | | | (2,151) | | | 19,351 | |
| Less: Net realized gains on equity securities sold during the period | 975 | | | 395 | | | 1,631 | |
| Net unrealized investment gains (losses) recognized on equity securities still held at December 31 | 2,069 | | | (2,546) | | | 17,720 | |
Proceeds from sales of investments in securities for the years ended December 31 are as follows:
| | 2022 | | 2021 | | 2020 |
| 2023 | | | 2023 | | 2022 | | 2021 |
| | | (in $ thousands) | | (in $ thousands) |
| Proceeds from sales of debt securities | Proceeds from sales of debt securities | 65,827 | | | 68,450 | | | 36,449 | |
| Proceeds from sales of equity securities | Proceeds from sales of equity securities | 868 | | | 843 | | | 791 | |
| Total proceeds from sales of investments in securities | Total proceeds from sales of investments in securities | 66,695 | | | 69,293 | | | 37,240 | |
NOTE 7
Income taxes. Income tax expense consists of the following:
| | 2022 | | 2021 | | 2020 |
| 2023 | | | 2023 | | 2022 | | 2021 |
| | | (in $ thousands) | | (in $ thousands) |
| Current income tax expense: | Current income tax expense: | |
| Federal | Federal | 37,723 | | | 57,274 | | | 47,778 | |
| State | 3,051 | | | 7,600 | | | 3,235 | |
| Foreign | 9,797 | | | 16,508 | | | 7,567 | |
| 50,571 | | | 81,382 | | | 58,580 | |
| Deferred income tax expense (benefit): | |
| Federal | |
| Federal | Federal | (4,025) | | | 13,175 | | | (10,429) | |
| State | State | 254 | | | 2,197 | | | 388 | |
| Foreign | Foreign | 4,064 | | | (2,765) | | | 294 | |
| 293 | | | 12,607 | | | (9,747) | |
| 22,047 | |
| Deferred income tax expense (benefit): | |
| Federal | |
| Federal | |
| Federal | |
| State | |
| Foreign | |
| (6,784) | |
| Total income tax expense | Total income tax expense | 50,864 | | | 93,989 | | | 48,833 | |
The following reconciles income tax expense computed at the federal statutory rate with income tax expense as reported (in $ thousands, except for income tax rates):
| | 2022 | | 2021 | | 2020 |
| 2023 | | | 2023 | | 2022 | | 2021 |
Expected income tax expense at 21% (1) | Expected income tax expense at 21% (1) | 44,766 | | | 87,613 | | | 42,785 | |
| Valuation allowance | |
| Nondeductible expenses | Nondeductible expenses | 4,731 | | | 4,090 | | | 2,399 | |
| Foreign income tax rate differential | Foreign income tax rate differential | 2,955 | | | 3,549 | | | 1,465 | |
| Return-to-provision and true-up adjustments | |
Net benefit for the Canadian branch (2) | |
| Research and development credits | |
| State income tax expense - net of Federal impact | State income tax expense - net of Federal impact | 2,664 | | | 8,201 | | | 2,944 | |
| Return-to-provision and true-up adjustments | (1,971) | | | (1,617) | | | (438) | |
| Valuation allowance | 1,569 | | | (4,427) | | | 2,427 | |
Net (benefit) expense for the Canadian branch (2) | (1,199) | | | (2,130) | | | (1,478) | |
| Research and development credits | (1,136) | | | (398) | | | (1,055) | |
| Other – net | Other – net | (1,515) | | | (892) | | | (216) | |
| Income tax expense | Income tax expense | 50,864 | | | 93,989 | | | 48,833 | |
Effective income tax rate (1) | Effective income tax rate (1) | 23.9 | % | | 22.5 | % | | 24.0 | % | Effective income tax rate (1) | 33.4 | % | | 23.9 | % | | 22.5 | % |
(1) Calculated using income before taxes and after noncontrolling interests.
(2) For U.S. income tax purposes, the Company’s Canadian operation is a branch of Guaranty. As a result, the Canadian net deferred tax liability is offset in the U.S. as a deferred tax asset but not in an equal amount given differing tax rates in Canada and the U.S.
Deferred tax assets and liabilities resulting from the same tax jurisdiction are netted and presented as either an asset or liability on the consolidated balance sheets. Deferred tax assets and liabilities resulting from different tax jurisdictions are not netted. Deferred tax assets and liabilities as of December 31 are detailed below.
| | 2022 | | 2021 |
| 2023 | | | 2023 | | 2022 |
| | | (in $ thousands) | | (in $ thousands) |
| Deferred tax assets: | Deferred tax assets: | |
| Net operating loss (NOL) carryforwards | Net operating loss (NOL) carryforwards | 24,992 | | | 22,615 | |
| Net operating loss (NOL) carryforwards | |
| Net operating loss (NOL) carryforwards | |
| Accrued expenses | Accrued expenses | 22,837 | | | 20,922 | |
| Tax credit carryforwards | |
| Capitalized research and development costs | |
| Federal offset to Canadian deferred tax liability | Federal offset to Canadian deferred tax liability | 10,339 | | | 7,591 | |
| Capitalized research and development costs | 5,959 | | | — | |
| Tax credit carryforwards | 4,173 | | | 2,816 | |
| Foreign currency translation adjustments | Foreign currency translation adjustments | 3,641 | | | 707 | |
| Net unrealized losses on investments in securities | Net unrealized losses on investments in securities | 3,045 | | | 361 | |
| Capital loss carryforward | 1,691 | | | — | |
| Allowance for credit losses | Allowance for credit losses | 1,642 | | | 1,719 | |
| Title loss provisions | Title loss provisions | 1,081 | | | 1,191 | |
| Investments | Investments | 1,017 | | | 1,161 | |
| Deferred payroll taxes | — | | | 1,782 | |
| Capital loss carryforward | |
| Other | Other | 680 | | | 821 | |
| Deferred tax assets – gross | Deferred tax assets – gross | 81,097 | | | 61,686 | |
| Valuation allowance | Valuation allowance | (6,202) | | | (2,279) | |
| Deferred tax assets – net | Deferred tax assets – net | 74,895 | | | 59,407 | |
| | | | | | | | | | | |
| 2022 | | 2021 |
| | (in $ thousands) |
| Deferred tax liabilities: | | | |
| Amortization – goodwill and other intangibles | (35,807) | | | (30,307) | |
| Title loss provisions | (21,133) | | | (18,233) | |
| Other intangible assets from acquisitions | (20,990) | | | (34,180) | |
| Fixed assets | (11,072) | | | (10,074) | |
| Net unrealized gains on investments in securities | (4,325) | | | (7,131) | |
| Investments | (2,423) | | | (989) | |
| Deferred compensation on life insurance policies | (2,157) | | | (2,517) | |
| Other | (1,014) | | | (909) | |
| Deferred tax liabilities - gross | (98,921) | | | (104,340) | |
| | | |
| Net deferred income tax liability | (24,026) | | | (44,933) | |
| | | | | | | | | | | |
| 2023 | | 2022 |
| | (in $ thousands) |
| Deferred tax liabilities: | | | |
| Amortization – goodwill and other intangibles | (43,279) | | | (35,807) | |
| Title loss provisions | (17,667) | | | (21,133) | |
| Other intangible assets from acquisitions | (15,518) | | | (20,990) | |
| Fixed assets | (8,828) | | | (11,072) | |
| Deferred compensation on life insurance policies | (2,628) | | | (2,157) | |
| Net unrealized gains on investments in securities | (1,898) | | | (4,325) | |
| Investments | (1,067) | | | (2,423) | |
| Other | (380) | | | (1,014) | |
| Deferred tax liabilities - gross | (91,265) | | | (98,921) | |
| | | |
| Net deferred income tax liability | (21,269) | | | (24,026) | |
At December 31, 2022,2023, the Company's deferred tax assets related to NOL carryforwards are composed of a $19.6$17.7 million U.S. federal NOL carryforward from a 2021 acquisition with no expiration, various state NOL carryforwards which will expire in varying amounts from 20232024 through 2042,2043, and foreign NOL carryforwards which will expire in varying amounts from 20232024 through 20262027 or have unlimited carryforward periods. The future utilization of all NOL carryforwards is subject to various limitations. At December 31, 2022,2023, the Company had $1.6$8.9 million of foreign tax credit carryforwards that will begin to expire in 2028.2029. The future utilization of these credit carryforwards is subject to various limitations. Foreign jurisdictions where the Company makes tax payments include Canada, Australia, Costa Rica, Italy, Mexico, Puerto Rico and the United Kingdom.
The Company's valuation allowance at December 31, 20222023 relates primarily to all foreign tax credit carryforwards, all capital loss carryforwards, certain research and development credits acquired in 2021 and certain state and foreign NOL carryforwards which the Company believes are not more-likely-than-not to be utilized prior to expiration.
The Company’s income tax returns are routinely subject to examinations by U.S. federal, foreign, and state and local tax authorities. At December 31, 2022,2023, the Company’s 20192020 through 20212022 U.S. federal income tax returns and 20172018 through 20212022 Canadian income tax returns remain subject to examination. The Company is subject to routine examinations by state tax jurisdictions and remains subject to examination for 20172018 through 20212022 tax returns. The Company expects no material adjustments from any ongoing tax return examinations.
NOTE 8
Goodwill and other intangibles. The summary of changes in goodwill is as follows:
| | Title | | | Title | | Real Estate Solutions | | Corporate and Other | | Total |
| | Title | | Real Estate Solutions | | Corporate and Other | | Total | | (in $ thousands) |
| Balances at January 1, 2022 | |
| | | (in $ thousands) |
| Balances at January 1, 2021 | 361,433 | | | 70,044 | | | — | | | 431,477 | |
| | Acquisitions | |
| Acquisitions | |
| Acquisitions | Acquisitions | 226,134 | | | 258,069 | | | 15,350 | | | 499,553 | |
| Purchase accounting adjustments | Purchase accounting adjustments | (3,600) | | | (2,570) | | | — | | | (6,170) | |
| | Disposals | Disposals | (23) | | | — | | | — | | | (23) | |
| Balances at December 31, 2021 | 583,944 | | | 325,543 | | | 15,350 | | | 924,837 | |
| Disposals | |
| Disposals | |
| Balances at December 31, 2022 | |
| | Acquisitions | |
| Acquisitions | |
| Acquisitions | Acquisitions | 134,225 | | | — | | | — | | | 134,225 | |
| Purchase accounting adjustments | Purchase accounting adjustments | 2,701 | | | 26,961 | | | (14,450) | | | 15,212 | |
| | Disposals | Disposals | (392) | | | — | | | (900) | | | (1,292) | |
| Balances at December 31, 2022 | 720,478 | | | 352,504 | | | — | | | 1,072,982 | |
| Disposals | |
| Disposals | |
| Balances at December 31, 2023 | |
An aggregate of $128.9$18.0 million and $172.6$128.9 million of the goodwill recognized in 20222023 and 2021,2022, respectively, related to acquisitions is tax-deductible over a period of 15 years from the corresponding acquisition date. In connection with its acquisitions, the Company recorded during 20222023 and 20212022 other intangible assets of $12.6$28.7 million and $211.6$12.6 million, respectively, while it wrote off $10.5 million of other intangible assets related to the disposal of a business in 2022. ThePurchase accounting adjustments for goodwill in 2023 and 2022 were adjustments recorded within the one-year measurement period to provisional purchase accounting related to respective prior year acquisitions. These adjustments primarily resulted in the recognition of other intangible assets recognized from these acquisitions were primarily related to customer relationships and internally-developed technology and trade names.technology.
The summary of other intangibles by major class (refer to Note 1-M) is as follows: | | Customer Relationships | | | Customer Relationships | | Technology | | Others | | Total |
| | Customer Relationships | | Technology | | Others | | Total | | (in $ thousands) |
| | (in $ thousands) |
| Balances at December 31, 2022: | |
| Balances at December 31, 2023: | |
| Gross | |
| Gross | |
| Gross | Gross | 136,027 | | | 78,627 | | | 48,957 | | | 263,611 | |
| Accumulated amortization | Accumulated amortization | (17,879) | | | (23,744) | | | (22,904) | | | (64,527) | |
| Net | Net | 118,148 | | | 54,883 | | | 26,053 | | | 199,084 | |
| | Balances at December 31, 2021: | |
| Balances at December 31, 2022: | |
| Balances at December 31, 2022: | |
| Balances at December 31, 2022: | |
| Gross | |
| Gross | |
| Gross | Gross | 125,727 | | | 92,962 | | | 42,837 | | | 261,526 | |
| Accumulated amortization | Accumulated amortization | (6,564) | | | (9,155) | | | (16,003) | | | (31,722) | |
| Net | Net | 119,163 | | | 83,807 | | | 26,834 | | | 229,804 | |
Total amortization expense recorded for other intangible assets was $34.6 million and $33.0 million in 2023 and $19.2 million in 2022, and 2021, respectively. The annual amortization expense expected to be recognized in the next five years relating to other intangible assets is approximately $32.7 million in 2023, $30.1$31.2 million in 2024, $28.0$27.4 million in 2025, $20.3$21.3 million in 2026, and $11.4$12.8 million in 2027.2027 and $11.3 million in 2028.
NOTE 9
Notes payable. A summary of notes payable is as follows:
| | | | | | | | | | | |
| 2022 | | 2021 |
| | (in $ thousands) |
| 3.6% Senior Notes | 444,608 | | | 444,106 | |
| | | |
| Other notes payable | 2,398 | | | 39,385 | |
| 447,006 | | | 483,491 | |
Included within other notes payable are $0.1 million and $1.0 million of capital lease obligations at December 31, 2022 and 2021, respectively. The entire balance of other notes payable at December 31, 2022 is due in 2023. | | | | | | | | | | | |
| 2023 | | 2022 |
| | (in $ thousands) |
| 3.6% Senior Notes | 445,130 | | | 444,608 | |
| | | |
| Other notes payable | 160 | | | 2,398 | |
| 445,290 | | | 447,006 | |
In November 2021, the Company completed an underwritten offering of $450 million aggregate principal amount of unsecured 3.6% Senior Notes due on November 15, 2031 (Senior Notes). The proceeds from the issuance of the Senior Notes, net of underwriting discounts and issuance costs, were $444.0 million, which were used to repay thean outstanding balance of the Term Loan (see below)on a previous term loan and for general corporate purposes. Interest on the Senior Notes is paid semi-annually in May and November at a fixed rate of 3.6% per annum. At any time prior to August 15, 2031, the Senior Notes are subject to redemption, at the Company's option, upon not less than 15 days' notice, in whole or in part, at a redemption price equal to the greater of: 100% of the principal amount of the Senior Notes to be redeemed, or the sum of the present values of the remaining scheduled payments of principal and interest to be redeemed. The Senior Notes are the Company’s general senior unsecured obligations, are not guaranteed by any of the Company’s subsidiaries, rank equally in right of payment with the Company’s existing and future senior unsecured indebtedness, and are effectively subordinated to all liabilities of the Company’s subsidiaries and to all of the Company’s secured indebtedness to the extent of the value of the collateral securing such indebtedness.
Previously, the Company had an available $150.0 million unsecured line of credit commitment (Existing Credit Agreement) for general corporate and acquisitions purposes which was previously scheduled to expire in November 2023. In May 2020, the Company entered into an amended agreement with the lenders (First Amendment) which increased the available unsecured line of credit commitment to $200.0 million and extended the maturity of the line of credit to May 2025. In March 2021, the Company entered into a second amendment and restated credit agreement (Second Amendment) which increased the available unsecured line of credit commitment to $350 million and extended the maturity to March 2026.
In October 2021, the Company entered into a new senior unsecured credit agreement (New(the Credit Agreement) comprising of a $200.0 million unsecured revolving credit facility (maturing in October 2026) and a $400.0 million unsecured delayed-draw term loan commitment (364-day term) (Term Loan), withthat was paid off and extinguished in 2021. The Credit Agreement includes an option to increase the revolving credit facility by up to $125.0 million. Simultaneously, the Company drew $370.0 million from the Term Loan and paid off the remaining balance of its prior line of credit commitment, which was subsequently extinguished. The New Credit Agreement is guaranteed by the Company's wholly-owned subsidiaries. In November 2021, upon issuance of its Senior Notes, the Company paid off and extinguished its Term Loan.
At the Company’s election, borrowings under the New Credit Agreement will bear interest at either (a) the Base Rate plus the Applicable Margin (each as defined in the agreement) or (b) the LIBOR Rateadjusted Term SOFR (as defined in the agreement) plus the applicable margin. The applicable margin, based on the Company's Debt to Capitalization Ratio (as defined in the agreement), for revolving loans ranges from 0.25% to 0.625% per annum for base rate borrowings and 1.25% to 1.625% per annum for LIBOR rateTerm SOFR borrowings. Further, a commitment fee accrues, based on the Company's debt to capitalization Ratio, ranging from 0.15% to 0.30% per annum on the average daily unused portion of the commitments. The New Credit Agreement also contains certain consolidated financial covenants which, as detailed in the agreement, limit the Company's maximum debt to total capitalization ratio and minimum consolidated net worth.
As of December 31, 2022,2023, the remaining balance of the line of credit available for use was $197.5 million, net of an unused $2.5 million letter of credit. The Company was in compliance with all covenants as of December 31, 20222023 and 20212022 under the related line of credit agreements.Credit Agreement.
The Company's qualified intermediary in tax-deferred property exchanges pursuant to Section 1031 of the Internal Revenue Code (Section 1031) enters into short-term loan agreements with parties to an exchange in the ordinary course of its business. The outstanding balances pursuant to these loans, as included within other notes payable in the above table, were $2.3$0.2 million and $37.1$2.3 million as of December 31, 20222023 and 2021,2022, respectively, and are secured by cash that is included in cash and cash equivalents on the Company's consolidated balance sheet. Borrowings and repayments on these short-term loans are reflected as financing activities in the consolidated statements of cash flows.
NOTE 10
Estimated title losses. A summary of estimated title losses is as follows:
| | 2022 | | 2021 | | 2020 |
| 2023 | | | 2023 | | 2022 | | 2021 |
| | | (in $ thousands, except for loss ratios) | | (in $ thousands, except for loss ratios) |
| Balances at January 1 | Balances at January 1 | 549,614 | | | 496,275 | | | 459,053 | |
| Provisions: | Provisions: | |
| Current year | Current year | 95,442 | | | 121,164 | | | 98,823 | |
| Current year | |
| Current year | |
| Previous policy years | Previous policy years | 7,291 | | | 5,079 | | | 16,401 | |
| Total provisions | Total provisions | 102,733 | | | 126,243 | | | 115,224 | |
| Payments, net of recoveries: | Payments, net of recoveries: | |
| Current year | |
| Current year | |
| Current year | Current year | (20,966) | | | (16,727) | | | (15,455) | |
| Previous policy years | Previous policy years | (72,132) | | | (54,772) | | | (66,540) | |
| Total payments, net of recoveries | Total payments, net of recoveries | (93,098) | | | (71,499) | | | (81,995) | |
| Effects of changes in foreign currency exchange rates | Effects of changes in foreign currency exchange rates | (9,801) | | | (1,405) | | | 3,993 | |
| Balances at December 31 | Balances at December 31 | 549,448 | | | 549,614 | | | 496,275 | |
| Loss ratios as a percentage of title operating revenues: | Loss ratios as a percentage of title operating revenues: | | | | | |
| Current year provisions | Current year provisions | 3.5 | % | | 4.0 | % | | 4.5 | % |
| Current year provisions | |
| Current year provisions | | 3.4 | % | | 3.5 | % | | 4.0 | % |
| Total provisions | Total provisions | 3.8 | % | | 4.2 | % | | 5.3 | % | Total provisions | 4.1 | % | | 3.8 | % | | 4.2 | % |
Total title loss provisions during 2023 decreased compared to 2022, primarily due to lower 2023 title premiums, while total title loss provisions in 2022 decreased compared to 2021,the prior year, primarily due to lower title premiums and an overall favorable claims experience in 2022. Total title loss provisions in 2021 increased compared to 2020, primarily due to increased title premiums, partially offset by favorable claims experience.
NOTE 11
Share-based payments. As part of its incentive compensation program for executives and senior management employees, the Company provides share-based awards, which usually include a combination of time-based restricted stock units, performance-based restricted stock units, and stock options. Each restricted stock unit represents a contractual right to receive a share of the Company's common stock.Common Stock. The time-based units generally vest on each of the first three anniversaries of the grant date, while the performance-based units vest upon achievement of certain financial objectives and employee service requirements over a period of approximately three years. The stock options vest on each of the first three anniversaries of the grant date at a rate of 20%, 30% and 50%, chronologically, and expire 10 years after the grant date. Each vested stock option can be exercised to purchase a share of the Company's common stockCommon Stock at the strike price set by the Company at the grant date. The compensation expense associated with the share-based awards, calculated based on the fair value of the related award and recognized over the corresponding vesting period, is presented as part of employee costs in the consolidated statement of income and comprehensive income. Award forfeitures are recorded as credits against employee costs in the period in which they occur.
The aggregate grant-date fair value of restricted stock unit awards to employees during 2023, 2022 and 2021 and 2020 was $12.3 million (299,000 stock units with an average grant price of $41.09), $11.9 million (188,300 stock units with an average grant price of $62.99), and $13.1 million (240,800 stock units with an average grant price of $54.45) and $4.1 million (104,200 stock units with an average grant price of $39.78), respectively. The In 2021, the Company granted stock option awards with aggregate grant-date fair value of stock option awards during 2021 and 2020 was $1.3 million (140,600 options with an average grant price of $9.24 and exercise strike price of $53.24) and $3.4 million (647,800 options with an average grant price of $5.32 and exercise strike price of $39.76), respectively..
A summary of the restricted stock unit activity during the year ended December 31, 20222023 is presented below: | | Units | | | Units | | Weighted-Average Grant-Date Fair Value per Share ($) |
| | Units | | Weighted-Average Grant-Date Fair Value per Share ($) |
| | Outstanding at January 1, 2022 | 338,700 | | | 49.89 | |
| Outstanding at January 1, 2023 | |
| Outstanding at January 1, 2023 | |
| Outstanding at January 1, 2023 | |
| Granted | Granted | 188,302 | | | 62.99 | |
| | Converted | Converted | (147,074) | | | 45.90 | |
| Converted | |
| Converted | |
| Forfeited | Forfeited | (15,651) | | | 59.43 | |
| Outstanding at December 31, 2022 | 364,277 | | | 57.86 | |
| Nonvested at December 31, 2022 | 364,089 | | | 57.86 | |
| Outstanding at December 31, 2023 | |
| Unvested at December 31, 2023 | |
A summary of the stock option activity during the year ended December 31, 20222023 is presented below: | | | | | | | | | | | |
| Units | | Weighted-Average Exercise Price ($) |
| |
| Outstanding at January 1, 2022 | 726,529 | | | 42.25 | |
| | | |
| Exercised | (11,248) | | | 39.76 | |
| Forfeited | (21,940) | | | 39.76 | |
| Outstanding at December 31, 2022 | 693,341 | | | 42.37 | |
| Nonvested at December 31, 2022 | 391,515 | | | 43.46 | |
| | | | | | | | | | | |
| Units | | Weighted-Average Exercise Price ($) |
| |
| Outstanding at January 1, 2023 | 693,341 | | | 42.37 | |
| | | |
| Exercised | (9,051) | | | 39.76 | |
| Forfeited | (9,272) | | | 47.79 | |
| Outstanding at December 31, 2023 | 675,018 | | | 42.33 | |
| Unvested at December 31, 2023 | 61,565 | | | 53.24 | |
As of December 31, 2022,2023, the aggregate intrinsic value and weighted average remaining contractual term related to outstanding options was $1.7$11.1 million and 7.36.3 years, respectively.
The fair value of grants that vested in 20222023 and 20212022 aggregated to $9.6$5.6 million and $6.9$9.6 million, respectively. For the years ended December 31, 2023, 2022 2021 and 2020,2021, compensation costs recognized related to share-based awards to employees were approximatelwere approximatelyy $10.1 million, $11.5 million $12.0 million and $5.8$12.0 million, respectively. The total tax benefits recognized in the consolidated statements of income and comprehensive income from tax deductions relating to vesting of equity awards in 2023, 2022 and 2021 and 2020 were$0.9 million, $1.2 million $0.8 million and $0.6$0.8 million, respectively. As of December 31, 2022,2023, compensation costs not yet recognized related to all employee nonvested awards was $10.1$9.8 million, which is expected to be recognized over a weighted average period of 1.9 years.
NOTE 12
Earnings per share. Basic earnings per share (EPS) attributable to Stewart is calculated by dividing net income attributable to Stewart by the weighted-average number of shares of Common Stock outstanding during the reporting periods. Any outstanding shares of Common Stock granted to employees that are not yet vested are excluded from the calculation of the weighted-average number of shares outstanding for calculating basic EPS. To calculate diluted EPS, the number of shares is adjusted to include the number of additional shares that would have been outstanding if restricted units and shares were vested and stock options were exercised. In periods of loss, dilutive shares are excluded from the calculation of the diluted EPS and diluted EPS is computed in the same manner as basic EPS.
The calculation of the basic and diluted EPS is as follows:
| | | | For the Years Ended December 31, | | For the Years Ended December 31, |
| | | 2022 | | 2021 | | 2020 | | 2023 | | 2022 | | 2021 |
| Numerator (in $ thousands): | Numerator (in $ thousands): | | | | | |
| Net income attributable to Stewart | |
| Net income attributable to Stewart | |
| Net income attributable to Stewart | Net income attributable to Stewart | 162,305 | | | 323,216 | | | 154,905 | |
| | | Denominator (in thousands): | Denominator (in thousands): | |
| | Denominator (in thousands): | |
| | Denominator (in thousands): | |
| Basic average shares outstanding | |
| Basic average shares outstanding | |
| Basic average shares outstanding | Basic average shares outstanding | 27,055 | | | 26,822 | | | 24,793 | |
| Average number of dilutive shares relating to options | Average number of dilutive shares relating to options | 159 | | | 197 | | | — | |
| | Average number of dilutive shares relating to restricted units and shares | Average number of dilutive shares relating to restricted units and shares | 133 | | | 149 | | | 120 | |
| Average number of dilutive shares relating to restricted units and shares | |
| Average number of dilutive shares relating to restricted units and shares | |
| Diluted average shares outstanding | Diluted average shares outstanding | 27,347 | | | 27,168 | | | 24,913 | |
| | Basic earnings per share attributable to Stewart ($) | Basic earnings per share attributable to Stewart ($) | 6.00 | | | 12.05 | | | 6.25 | |
| Basic earnings per share attributable to Stewart ($) | |
| Basic earnings per share attributable to Stewart ($) | |
| Diluted earnings per share attributable to Stewart ($) | Diluted earnings per share attributable to Stewart ($) | 5.94 | | | 11.90 | | | 6.22 | |
NOTE 13
Reinsurance. As is industry practice, the Company cedes risks to other title insurance underwriters and reinsurers on certain transactions. However, the Company remains liable if the reinsurer should fail to meet its obligations. The Company also assumes risks from other underwriters on a transactional basis as well as on certain reinsurance treaties. Payments and recoveries on reinsured losses were insignificant during each of the years ended December 31, 2023, 2022, 2021, and 2020.2021. The total amount of premiums for assumed and ceded risks was less than 1.0% of consolidated title revenues in each of the last three years and there were no outstanding amounts of reinsurance recoverable or payable at December 31, 20222023 and 2021.2022.
NOTE 14
Leases. Total operating lease expense was $49.6 million, $53.2 million and $46.5 million in 2023, 2022 and $41.1 million in 2022, 2021, and 2020, respectively, which included $3.3 million, $4.8 million $3.6 million and $3.4$3.6 million, respectively, of lease expense related to short-term leases and equipment. Total finance lease expense was $0.6 million, $0.9 million and $1.0 million in 2023, 2022 and $1.4 million in 2022, 2021, and 2020, respectively.
Lease-related assets and liabilities as of December 31 are as follows: | | 2022 | | 2021 |
| (in $ thousands) |
| 2023 | | | 2023 | | 2022 |
| (in $ thousands) | | | (in $ thousands) |
| Assets: | Assets: | |
| Operating lease assets, net of accumulated amortization | |
| Operating lease assets, net of accumulated amortization | |
| Operating lease assets, net of accumulated amortization | Operating lease assets, net of accumulated amortization | 127,830 | | | 134,578 | |
| Finance lease assets, net of accumulated depreciation | Finance lease assets, net of accumulated depreciation | 1,291 | | | 2,116 | |
| Total lease assets | Total lease assets | 129,121 | | | 136,694 | |
| | Liabilities: | Liabilities: | |
| Liabilities: | |
| Liabilities: | |
| Operating lease liabilities | |
| Operating lease liabilities | |
| Operating lease liabilities | Operating lease liabilities | 148,003 | | | 149,417 | |
| Finance lease liabilities | Finance lease liabilities | 80 | | | 1,013 | |
| Total lease liabilities | Total lease liabilities | 148,083 | | | 150,430 | |
Other information related to operating and finance leases during the years ended December 31 is as follows: | | 2023 | | | 2023 | | 2022 |
| Operating | | | Operating | Finance | | Operating | Finance |
| | 2022 | | 2021 |
| Operating | Finance | | Operating | Finance |
| | Cash paid for amounts included in the measurement of lease liabilities (in $ thousands) | |
| Cash paid for amounts included in the measurement of lease liabilities (in $ thousands) | |
| Cash paid for amounts included in the measurement of lease liabilities (in $ thousands) | Cash paid for amounts included in the measurement of lease liabilities (in $ thousands) | 51,501 | 957 | | 43,933 | 957 | 48,747 | 80 | | 51,501 | 957 |
| Lease assets obtained in exchange for lease obligations (in $ thousands) | Lease assets obtained in exchange for lease obligations (in $ thousands) | 55,861 | — | | 69,894 | — | Lease assets obtained in exchange for lease obligations (in $ thousands) | 31,849 | — | | 55,861 | — |
| Weighted average remaining lease term (years): | Weighted average remaining lease term (years): | 4.5 | 0.1 | | 4.3 | 1.1 | Weighted average remaining lease term (years): | 4.1 | 0.0 | | 4.5 | 0.1 |
| Weighted average discount rate | Weighted average discount rate | 3.7 | % | 4.0 | % | | 3.0 | % | 4.0 | % | Weighted average discount rate | 4.4 | % | 4.0 | % | | 3.7 | % | 4.0 | % |
Future minimum lease payments under operating leases as of December 31, 20222023 are as follows:
| | | | (in $ thousands) | |
| | (in $ thousands) |
| 2023 | | 47,459 | | | |
| | (in $ thousands) | |
| | | (in $ thousands) | |
| 2024 | 2024 | | 40,484 | | | |
| 2025 | 2025 | | 30,331 | | | |
| 2025 | |
| 2025 | |
| 2026 | |
| 2026 | |
| 2026 | 2026 | | 21,919 | | | |
| 2027 | 2027 | | 14,515 | | | |
| 2027 | |
| 2027 | |
| 2028 | |
| 2028 | |
| 2028 | |
| Thereafter | |
| Thereafter | |
| Thereafter | Thereafter | | 16,806 | | | |
| Total future minimum lease payments | Total future minimum lease payments | | 171,514 | | | |
| Total future minimum lease payments | |
| Total future minimum lease payments | |
| Less: imputed interest | |
| Less: imputed interest | |
| Less: imputed interest | Less: imputed interest | | (23,511) | | | |
| Net future minimum lease payments | Net future minimum lease payments | | 148,003 | | | |
| Net future minimum lease payments | |
| Net future minimum lease payments | |
NOTE 15
Contingent liabilities and commitments. The Company routinely holds third-party funds in segregated escrow accounts pending the closing of real estate transactions resulting in a contingent liability to the Company of approximately $1.5$1.9 billion at December 31, 2022.2023. In addition, the Company is contingently liable for disbursements of escrow funds held by independent agencies in those cases where specific insured closing guarantees have been issued. The Company owns a qualified intermediary engaged in Section 1031 tax-deferred property exchanges. The Company holds the proceeds from these transactions until a qualifying exchange can occur. This resulted in a contingent liability to the Company of approximately $1.6 billion$770.1 million at December 31, 2022.2023. As with industry practice, escrow and Section 1031 exchanger fund accounts are not included in the consolidated balance sheets.
In the ordinary course of business, the Company guarantees the third-party indebtedness of certain of its consolidated subsidiaries. As of December 31, 2022,2023, the maximum potential future payments on the guarantees are not more than the related notes payable recorded in the consolidated balance sheets (refer to Note 9). The Company also guarantees the indebtedness related to lease obligations of certain of its consolidated subsidiaries. The maximum future obligations arising from these lease-related guarantees are not more than the Company’s future lease obligations (refer to Note 14) plus lease operating expenses. As of December 31, 2022,2023, the Company also had unused letters of credit aggregating $4.9 million related to workers’ compensation coverage and other insurance. The Company does not expect to make any payments on these guarantees.
NOTE 16
Regulatory and legal developments. The Company is subject to claims and lawsuits arising in the ordinary course of its business, most of which involve disputed policy claims. In some of these lawsuits, the plaintiffs seek exemplary or treble damages in excess of policy limits. The Company does not expect that any of these ordinary course proceedings will have a material adverse effect on its consolidated financial condition or results of operations. The Company believes that it has adequate reserves for the various litigation matters and contingencies referred to in this paragraph and that the likely resolution of these matters will not materially affect its consolidated financial condition or results of operations.
The Company is subject to non-ordinary course of business claims or lawsuits from time to time. To the extent the Company is currently the subject of these types of lawsuits, the Company has determined either that a loss is not reasonably possible or that the estimated loss or range of loss, if any, will not have a material adverse effect on the Company’s financial condition, results of operations or cash flows.
Additionally, the Company occasionally receives various inquiries from governmental regulators concerning practices in the insurance industry. Many of these practices do not concern title insurance. To the extent the Company is in receipt of such inquiries, it believes that, where appropriate, it has adequately reserved for these matters and does not anticipate that the outcome of these inquiries will materially affect its consolidated financial condition or results of operations.
The Company is subject to various other administrative actions, investigations and inquiries into its business conduct in certain of the states in which it operates. While the Company cannot predict the outcome of the various regulatory and administrative matters, it believes that it has adequately reserved for these matters and does not anticipate that the outcome of any of these matters will materially affect its consolidated financial condition or results of operations.
Note 17
Revenues. The Company's operating revenues, summarized by type, are as follows:
| | 2022 | | 2021 | | 2020 |
| 2023 | | | 2023 | | 2022 | | 2021 |
| | | (in $ thousands) | | (in $ thousands) |
| Title insurance premiums: | Title insurance premiums: | |
| Direct | |
| Direct | |
| Direct | Direct | 831,391 | | | 960,118 | | | 716,779 | |
| Agency | Agency | 1,466,243 | | | 1,582,640 | | | 1,151,030 | |
| Escrow fees | Escrow fees | 204,217 | | | 248,426 | | | 190,930 | |
| Real estate solutions and abstract fees | Real estate solutions and abstract fees | 372,498 | | | 340,463 | | | 134,304 | |
| Other revenues | Other revenues | 174,002 | | | 132,969 | | | 78,460 | |
| 3,048,351 | | | 3,264,616 | | | 2,271,503 | |
| 2,212,240 | |
NOTE 18
Segment information. Prior to 2022, the Company reported two operating segments: the title insurance and related services (title) segment, and the ancillary services and corporate segment. In 2022, the Company began reporting three operating segments: the title segment, the real estate solutions segment, and the corporate and other segment. The new segment presentation is primarily due to the increased size of the real estate solutions operations (formerly, ancillary services operations) resulting from strategic acquisitions. Previously, the real estate solutions operations were combined in one segment with the Company's corporate operations, which consist of expenses of the parent holding company and other centralized administrativesupport services departments. Amounts for 2021 were recast in the following table to conform with the new segment presentation.
Under the revised segment presentation, the composition of each of the title and real estate solutions segments is substantially unchanged, while the corporate and other segment primarily includes corporate operations and other businesses not related to title or real estate solutions operations. The title segment provides services needed to transfer title to property in a real estate transaction and includes services such as searching, abstracting, examining, closing and insuring the condition of the title to the property. In addition, the title segment includes home and personal insurance services, Internal Revenue Code Section 1031 tax-deferred exchanges, and digital customer engagement platform services. The real estate solutions segment supports the real estate industry and primarily includes appraisalcredit and real estate information services, valuation management services, online notarization and closing services, credit and real estate information services, and search services. The corporate and valuation services. Amounts for 2021 and 2020 were recast in the following tableother segment is primarily related to conform with the new segment presentation.corporate operations.
Selected statement of income information related to these segments for the years ended December 31 is as follows: | | | | 2022 | | 2021 | | 2020 | | 2023 | | 2022 | | 2021 |
| | | (in $ thousands) | | (in $ thousands) |
| Title | Title | |
| Revenues | Revenues | 2,733,744 | | | 3,002,949 | | | 2,205,301 | |
| Revenues | |
| Revenues | |
| Depreciation and amortization | Depreciation and amortization | 29,715 | | | 21,227 | | | 15,230 | |
| Interest | |
| Income before taxes and noncontrolling interest | Income before taxes and noncontrolling interest | 255,132 | | | 440,462 | | | 246,878 | |
| | Real estate solutions | Real estate solutions | |
| Real estate solutions | |
| Real estate solutions | |
| Revenues | |
| Revenues | |
| Revenues | Revenues | 296,702 | | | 265,497 | | | 82,632 | |
| Depreciation and amortization | Depreciation and amortization | 25,563 | | | 14,071 | | | 2,995 | |
| Income (loss) before taxes and noncontrolling interest | 16,624 | | | 12,951 | | | (1,594) | |
| Interest | |
| Income before taxes | |
| | Corporate and other | Corporate and other | |
| Corporate and other | |
| Corporate and other | |
| Revenues (net realized losses) | |
| Revenues (net realized losses) | |
| Revenues (net realized losses) | |
| Depreciation and amortization | |
| Interest | |
| Loss before taxes | |
| | Consolidated Stewart | |
| Consolidated Stewart | |
| Consolidated Stewart | |
| Revenues | |
| Revenues | |
| Revenues | Revenues | 38,850 | | | 37,346 | | | 499 | |
| Depreciation and amortization | Depreciation and amortization | 1,900 | | | 1,088 | | | 991 | |
| Loss before taxes and noncontrolling interest | (39,104) | | | (19,442) | | | (26,779) | |
| | Consolidated Stewart | |
| Revenues | 3,069,296 | | | 3,305,792 | | | 2,288,432 | |
| Depreciation and amortization | 57,178 | | | 36,386 | | | 19,216 | |
| Interest | |
| Income before taxes and noncontrolling interest | Income before taxes and noncontrolling interest | 232,652 | | | 433,971 | | | 218,505 | |
The Company does not provide asset information by reportable operating segment as it does not routinely evaluate the asset position by segment. During 2022 and 2021, the corporate and other segment included results of a real estate brokerage company that was sold during the second quarter 2022.
Revenues for the years ended December 31 in the United States and all international operations are as follows:
| | 2022 | | 2021 | | 2020 |
| 2023 | | | 2023 | | 2022 | | 2021 |
| | | (in $ thousands) | | (in $ thousands) |
| United States | United States | 2,893,169 | | | 3,107,817 | | | 2,154,672 | |
| International | International | 176,127 | | | 197,975 | | | 133,760 | |
| 3,069,296 | | | 3,305,792 | | | 2,288,432 | |
| 2,257,341 | |
NOTE 19
Other comprehensive income (loss). Changes in the balances of each component of other comprehensive income (loss) and the related tax effects are as follows (in $ thousands):
| | | | | | | | | | | | | | | | | | | | | | | | | | | | | | | | | | | |
| | For the Year Ended December 31, 2022 | | For the Year Ended December 31, 2021 | | For the Year Ended December 31, 2020 |
| | Before-Tax Amount | Tax Expense (Benefit) | Net-of-Tax Amount | | Before-Tax Amount | Tax Expense (Benefit) | Net-of Tax Amount | | Before-Tax Amount | Tax Expense (Benefit) | Net-of-Tax Amount |
| Foreign currency translation adjustments | (18,634) | | (3,695) | | (14,939) | | | (298) | | 381 | | (679) | | | 5,777 | | 988 | | 4,789 | |
| Net unrealized gains and losses on investments: | | | | | | | | | | | |
| Change in net unrealized gains and losses on investments | (44,830) | | (9,414) | | (35,416) | | | (17,279) | | (3,629) | | (13,650) | | | 19,548 | | 4,105 | | 15,443 | |
| Reclassification adjustment for realized gains and losses on investments | (1,571) | | (330) | | (1,241) | | | (3,088) | | (648) | | (2,440) | | | (647) | | (136) | | (511) | |
| (46,401) | | (9,744) | | (36,657) | | | (20,367) | | (4,277) | | (16,090) | | | 18,901 | | 3,969 | | 14,932 | |
| Other comprehensive (loss) income | (65,035) | | (13,439) | | (51,596) | | | (20,665) | | (3,896) | | (16,769) | | | 24,678 | | 4,957 | | 19,721 | |
NOTE 20
Common Stock. During 2020, the Company issued an aggregate of 3,026,340 new shares of its Common Stock ($1 par value), which included shares purchased by the underwriters to the transaction. Proceeds from the Common Stock issuance, net of issuance costs, amounted to $109.0 million. | | | | | | | | | | | | | | | | | | | | | | | | | | | | | | | | | | | |
| | For the Year Ended December 31, 2023 | | For the Year Ended December 31, 2022 | | For the Year Ended December 31, 2021 |
| | Before-Tax Amount | Tax Expense (Benefit) | Net-of-Tax Amount | | Before-Tax Amount | Tax Expense (Benefit) | Net-of Tax Amount | | Before-Tax Amount | Tax Expense (Benefit) | Net-of-Tax Amount |
| Foreign currency translation adjustments | 6,407 | | 1,130 | | 5,277 | | | (18,634) | | (3,695) | | (14,939) | | | (298) | | 381 | | (679) | |
| Net unrealized gains and losses on investments: | | | | | | | | | | | |
| Change in net unrealized gains and losses on investments | 13,242 | | 2,781 | | 10,461 | | | (44,830) | | (9,414) | | (35,416) | | | (17,279) | | (3,629) | | (13,650) | |
| Reclassification adjustment for realized gains and losses on investments | 494 | | 104 | | 390 | | | (1,571) | | (330) | | (1,241) | | | (3,088) | | (648) | | (2,440) | |
| 13,736 | | 2,885 | | 10,851 | | | (46,401) | | (9,744) | | (36,657) | | | (20,367) | | (4,277) | | (16,090) | |
| Other comprehensive income (loss) | 20,143 | | 4,015 | | 16,128 | | | (65,035) | | (13,439) | | (51,596) | | | (20,665) | | (3,896) | | (16,769) | |
SCHEDULE I
STEWART INFORMATION SERVICES CORPORATION
(Parent Company)
STATEMENTS OF INCOME AND RETAINED EARNINGS
| | | | | For the Years Ended December 31, | | | For the Years Ended December 31, |
| | | | 2022 | | 2021 | | 2020 | | | 2023 | | 2022 | | 2021 |
| | | | (in $ thousands) | | | (in $ thousands) |
| Revenues | Revenues | |
| Interest income and other net realized (losses) gains | | (1,639) | | | (281) | | | 1,182 | |
| Net realized losses, net of interest and other income | |
| Net realized losses, net of interest and other income | |
| Net realized losses, net of interest and other income | |
| | | Expenses | Expenses | |
| | Expenses | |
| | Expenses | |
| Interest | |
| Interest | |
| Interest | Interest | | 18,276 | | | 5,101 | | | 2,511 | |
| Other operating expenses | Other operating expenses | | 8,161 | | | 6,924 | | | 9,262 | |
| 26,437 | | | 12,025 | | | 11,773 | |
| | 26,842 | |
| Loss before taxes and income from investments in subsidiaries | Loss before taxes and income from investments in subsidiaries | | (28,076) | | | (12,306) | | | (10,591) | |
| Income tax expense | Income tax expense | | (8) | | | — | | | (15) | |
| Income from investments in subsidiaries | Income from investments in subsidiaries | | 190,389 | | | 335,522 | | | 165,511 | |
| Net income | Net income | | 162,305 | | | 323,216 | | | 154,905 | |
| | Retained earnings at beginning of year | Retained earnings at beginning of year | | 974,800 | | | 688,819 | | | 564,392 | |
| Retained earnings at beginning of year | |
| Retained earnings at beginning of year | |
| Cash dividends on Common Stock | Cash dividends on Common Stock | | (45,289) | | | (37,235) | | | (30,478) | |
| | Retained earnings at end of year | Retained earnings at end of year | | 1,091,816 | | | 974,800 | | | 688,819 | |
| Retained earnings at end of year | |
| Retained earnings at end of year | |
See accompanying notes to financial statement information.
See accompanying Report of Independent Registered Public Accounting Firm.
STEWART INFORMATION SERVICES CORPORATION
(Parent Company)
BALANCE SHEETS
| | | | | As of December 31, | | | As of December 31, |
| | | | 2022 | | 2021 | | | 2023 | | 2022 |
| | | | (in $ thousands) | | | (in $ thousands) |
| Assets | Assets | |
| Cash and cash equivalents | Cash and cash equivalents | | 31,912 | | | 15,527 | |
| Cash and cash equivalents | |
| Cash and cash equivalents | |
| Receivables from affiliates | Receivables from affiliates | | 49,055 | | | 21,519 | |
| Property and equipment, at cost: | Property and equipment, at cost: | |
| Furniture and equipment | Furniture and equipment | | 21 | | | 47 | |
| Furniture and equipment | |
| Furniture and equipment | |
| Accumulated depreciation | Accumulated depreciation | | (21) | | | (46) | |
| — | | | 1 | |
| | 1,523 | |
| Investments in subsidiaries, on an equity-method basis | Investments in subsidiaries, on an equity-method basis | | 1,736,570 | | | 1,698,280 | |
| Operating lease assets | Operating lease assets | | 4,180 | | | 5,859 | |
| Goodwill | Goodwill | | 8,068 | | | 8,068 | |
| Other assets | Other assets | | 16,730 | | | 19,659 | |
| 1,846,515 | | | 1,768,913 | |
| | 1,856,185 | |
| Liabilities | Liabilities | | | | |
| Accounts payable and other liabilities | |
| Accounts payable and other liabilities | |
| Accounts payable and other liabilities | Accounts payable and other liabilities | | 24,036 | | | 24,829 | |
| Operating lease liabilities | Operating lease liabilities | | 5,720 | | | 7,961 | |
| Notes payable | Notes payable | | 454,608 | | | 454,106 | |
| 484,364 | | | 486,896 | |
| | 484,774 | |
| Contingent liabilities and commitments | Contingent liabilities and commitments | | — | | | — | |
| Stockholders’ equity | Stockholders’ equity | |
| Common Stock – $1 par, authorized 51,500,000; issued 27,482,573 and 27,245,591; outstanding 27,130,412 and 26,893,430, respectively | | 27,483 | | | 27,246 | |
| Common Stock – $1 par, authorized 51,500,000; issued 27,722,388 and 27,482,573; outstanding 27,370,227 and 27,130,412, respectively | |
| Common Stock – $1 par, authorized 51,500,000; issued 27,722,388 and 27,482,573; outstanding 27,370,227 and 27,130,412, respectively | |
| Common Stock – $1 par, authorized 51,500,000; issued 27,722,388 and 27,482,573; outstanding 27,370,227 and 27,130,412, respectively | |
| Additional paid-in capital | Additional paid-in capital | | 296,861 | | | 282,383 | |
| Retained earnings | Retained earnings | | 1,091,816 | | | 974,800 | |
| Accumulated other comprehensive income (loss) (AOCI): | Accumulated other comprehensive income (loss) (AOCI): | |
| Foreign currency translation adjustments | Foreign currency translation adjustments | | (23,856) | | | (8,917) | |
| Foreign currency translation adjustments | |
| Foreign currency translation adjustments | |
| Net unrealized investment gains | Net unrealized investment gains | | (27,487) | | | 9,171 | |
| Treasury stock – 352,161 common shares, at cost | Treasury stock – 352,161 common shares, at cost | | (2,666) | | | (2,666) | |
| Total stockholders’ equity | Total stockholders’ equity | | 1,362,151 | | | 1,282,017 | |
| 1,846,515 | | | 1,768,913 | |
| | 1,856,185 | |
See accompanying notes to financial statement information.
See accompanying Report of Independent Registered Public Accounting Firm.
STEWART INFORMATION SERVICES CORPORATION
(Parent Company)
STATEMENTS OF CASH FLOWS
| | | | | For the Years Ended December 31, | | | For the Years Ended December 31, |
| | | | 2022 | | 2021 | | 2020 | | | 2023 | | 2022 | | 2021 |
| | | | (in $ thousands) | | | (in $ thousands) |
| Reconciliation of net income to cash provided by operating activities: | Reconciliation of net income to cash provided by operating activities: | |
| Net income | Net income | | 162,305 | | | 323,216 | | | 154,905 | |
| Net income | |
| Net income | |
| Add (deduct): | Add (deduct): | |
| Depreciation | |
| Depreciation | |
| Depreciation | Depreciation | | — | | | — | | | 4 | |
| | Increase in receivables – net | Increase in receivables – net | | (27,536) | | | (19,261) | | | (1,998) | |
| Decrease (increase) in other assets – net | | 2,925 | | | (1,574) | | | (529) | |
| (Decrease) increase in payables and accrued liabilities – net | | (1,963) | | | (297) | | | 2,978 | |
| | Increase in receivables – net | |
| | Increase in receivables – net | |
| (Increase) decrease in other assets – net | |
| Increase (decrease) in payables and accrued liabilities – net | |
| Income from and other adjustments for subsidiaries | Income from and other adjustments for subsidiaries | | 31,886 | | | (31,841) | | | (140,816) | |
| | Cash provided by operating activities | |
| Cash provided by operating activities | |
| Cash provided by operating activities | Cash provided by operating activities | | 167,617 | | | 270,243 | | | 14,544 | |
| Investing activities: | Investing activities: | |
| | Investments in and contributions to subsidiaries | Investments in and contributions to subsidiaries | | (109,126) | | | (615,147) | | | (85,470) | |
| | Investments in and contributions to subsidiaries | |
| | Investments in and contributions to subsidiaries | |
| Purchase of property and equipment | |
| Collections on notes receivables | Collections on notes receivables | | — | | | 45,193 | | | 40,000 | |
| Increases in notes receivables | | — | | | — | | | (80,000) | |
| | Cash used by investing activities | |
| Cash used by investing activities | |
| Cash used by investing activities | Cash used by investing activities | | (109,126) | | | (569,954) | | | (125,470) | |
| Financing activities: | Financing activities: | |
| Dividends paid | |
| Dividends paid | |
| Dividends paid | Dividends paid | | (44,672) | | | (36,637) | | | (30,226) | |
| Repurchases of Common Stock | Repurchases of Common Stock | | (3,262) | | | (2,252) | | | (1,054) | |
| Proceeds from stock option and employee stock purchase plan exercises | Proceeds from stock option and employee stock purchase plan exercises | | 5,828 | | | 2,715 | | | — | |
| Proceeds from notes payable | Proceeds from notes payable | | — | | | 1,004,703 | | | — | |
| Payments on notes payable | Payments on notes payable | | — | | | (643,875) | | | — | |
| Purchase of remaining interest of consolidated subsidiary | Purchase of remaining interest of consolidated subsidiary | | — | | | (5,616) | | | — | |
| Issuance of new Common Stock | | — | | | — | | | 108,961 | |
| | Payment for debt issuance costs | |
| Payment for debt issuance costs | |
| Payment for debt issuance costs | Payment for debt issuance costs | | — | | | (7,404) | | | — | |
| Cash (used) provided by financing activities | Cash (used) provided by financing activities | | (42,106) | | | 311,634 | | | 77,681 | |
| Increase (decrease) in cash and cash equivalents | | 16,385 | | | 11,923 | | | (33,245) | |
| (Decrease) increase in cash and cash equivalents | |
| Cash and cash equivalents at beginning of year | Cash and cash equivalents at beginning of year | | 15,527 | | | 3,604 | | | 36,849 | |
| Cash and cash equivalents at end of year | Cash and cash equivalents at end of year | | 31,912 | | | 15,527 | | | 3,604 | |
| Supplemental information: | Supplemental information: | | | | | | |
| Income taxes paid, net | Income taxes paid, net | | — | | | 5 | | | 180 | |
| Income taxes paid, net | |
| Income taxes paid, net | |
| Interest paid | Interest paid | | 17,271 | | | 2,795 | | | 2,490 | |
See accompanying notes to financial statement information.
See accompanying Report of Independent Registered Public Accounting Firm.
STEWART INFORMATION SERVICES CORPORATION
(Parent Company)
NOTES TO FINANCIAL STATEMENT INFORMATION
The Parent Company operates as a holding company, transacting substantially all of its business through its subsidiaries. Its consolidated financial statements are included in Part II, Item 8 of Form 10-K. The Parent Company financial statements should be read in conjunction with the aforementioned consolidated financial statements and notes thereto and financial statement schedules.
Dividends received. During 2022 2021 and 2020,2021, Stewart Title Guaranty Company, a wholly-owned subsidiary, paid to the Parent Company dividends of $150.0 million and $293.9 million, respectively, and $30.0 million, respectively.none in 2023. Also, during 2023, 2022 and 2021, the Parent Company received dividends of $62.0 million, $58.7 million and $2.0 million, respectively, from its unregulated subsidiaries, primarily related to real estate solutions operations.
SCHEDULE II
STEWART INFORMATION SERVICES CORPORATION AND SUBSIDIARIES
VALUATION AND QUALIFYING ACCOUNTS
December 31, 20222023
| | Col. A | |
| Col. A | |
| Col. A | Col. A | | Col. B | | Col. C
Additions | | | | Col. D
Deductions | | Col. E | | Col. B | | Col. C
Additions | | | | | Col. D
Deductions | | Col. E |
| Description | Description | | Balance
at
beginning
of period | | Charged to
costs
and
expenses | | | | (Describe) | | Balance
At
end
of period | Description | | Balance
at
beginning
of period | | Charged to
costs
and
expenses | | | | | (Describe) | | Balance
At
end
of period |
| | | | (in $ thousands) | | | (in $ thousands) |
| Year ended December 31, 2023: | |
| Estimated title losses | |
| Estimated title losses | |
| Estimated title losses | |
| Valuation allowance for deferred tax assets | |
| Allowance for credit losses | |
| Year ended December 31, 2022: | Year ended December 31, 2022: | | | | | |
| Estimated title losses | |
| Estimated title losses | |
| Estimated title losses | Estimated title losses | | 549,614 | | | 102,733 | | | | | 102,899 | | | (A) | | 549,448 | |
| Valuation allowance for deferred tax assets | Valuation allowance for deferred tax assets | | 2,279 | | | 7,958 | | | | | 4,035 | | | 6,202 | |
| Allowance for credit losses | Allowance for credit losses | | 7,711 | | | 825 | | | | | 1,227 | | | (B) | | 7,309 | |
| Year ended December 31, 2021: | Year ended December 31, 2021: | | | | | |
| Estimated title losses | Estimated title losses | | 496,275 | | | 126,243 | | | | | 72,904 | | | (A) | | 549,614 | |
| Valuation allowance for deferred tax assets | | 6,471 | | | 398 | | | | | 4,590 | | | 2,279 | |
| Allowance for credit losses | | 4,807 | | | 3,023 | | | | | 119 | | | (B) | | 7,711 | |
| Year ended December 31, 2020: | | | | | |
| Estimated title losses | |
| Estimated title losses | Estimated title losses | | 459,053 | | | 115,224 | | | | | 78,002 | | | (A) | | 496,275 | |
| Valuation allowance for deferred tax assets | Valuation allowance for deferred tax assets | | 4,056 | | | 2,532 | | | | | 117 | | | 6,471 | |
| Allowance for credit losses | Allowance for credit losses | | 4,469 | | | 649 | | | | | 311 | | | (B) | | 4,807 | |
(A)Represents primarily payments of policy and escrow losses and loss adjustment expenses.
(B)Represents uncollectible accounts written off.
See accompanying Report of Independent Registered Public Accounting Firm.