UNITED STATES
SECURITIES AND EXCHANGE COMMISSION
Washington, D.C. 20549
FORM 10-K
(Mark One)
|
| |
[ü]
☑ | ANNUAL REPORT PURSUANT TO SECTION 13 OR 15(d) OF THE SECURITIES EXCHANGE ACT OF 1934 |
For the fiscal year ended December 31, 2019
OR
For the fiscal year ended December 31, 2018
|
OR | |
[]
☐ | TRANSITION REPORT PURSUANT TO SECTION 13 OR 15(d) OF THE SECURITIES EXCHANGE ACT OF 1934
For the transition period from __________ to __________.
|
Commission File Number001-16191
TENNANT COMPANY
(Exact name of registrant as specified in its charter)
|
| | |
| Minnesota | | 41-0572550 |
| State or other jurisdiction of | | (I.R.S. Employer |
| incorporation or organization | | Identification No.) |
|
|
701 North Lilac Drive, P.O. Box 1452
Minneapolis, Minnesota 55440
|
(Address of principal executive offices) (Zip Code) |
701 North Lilac Drive
P.O. Box 1452
Minneapolis, Minnesota55440
(Address of principal executive offices)
(Zip Code)
Registrant’s telephone number, including area code 763-540-1200code: 763-540-1200
Securities registered pursuant to Section 12(b) of the Act:
|
| | | | |
| Title of each class | | Trading Symbol(s) | | Name of exchange on which registered |
| Common Stock, par value $0.375 per share | | TNC | | New York Stock Exchange |
|
| | | | |
Securities registered pursuant to Section 12(g) of the Act: None |
| | | | | |
| Indicate by check mark if the registrant is a well-known seasoned issuer, as defined by Rule 405 of the Securities Act. | ü☑ | Yes | | No |
| Indicate by check mark if the registrant is not required to file reports pursuant to Section 13 or Section 15(d) of the Act. | | Yes | ü☑ | No |
| Indicate by check mark whether the registrant (1) has filed all reports required to be filed by Section 13 or 15(d) of the Securities Exchange Act of 1934 during the preceding 12 months (or for such shorter period that the registrant was required to file such reports), and (2) has been subject to such filing requirements for the past 90 days. | ü☑ | Yes | | No |
| Indicate by check mark whether the registrant has submitted electronically every Interactive Data File required to be submitted pursuant to Rule 405 of Regulation S-T (§232.405 of this chapter) during the preceding 12 months (or for such shorter period that the registrant was required to submit such files). | ü☑ | Yes | | No |
Indicate by check mark if disclosure of delinquent filers pursuant to Item 405 of Regulation S-K (§229.405 of this chapter) is not contained herein, and will not be contained, to the best of registrant’s knowledge, in definitive proxy or information statements incorporated by reference in Part III of this Form 10-K or any amendment to this Form 10-K. | | | [ ] | |
|
| | | | | |
| Indicate by check mark whether the registrant is a large accelerated filer, an accelerated filer, a non-accelerated filer, a smaller reporting company, or emerging growth company. See definitions of “large accelerated filer,” "accelerated filer," "smaller reporting company," and "emerging growth company" in Rule 12b-2 of the Exchange Act. |
| Large accelerated filer | ü☑ | | Accelerated filer | ☐ | |
| Non-accelerated filer | ☐ | | Smaller reporting company | ☐ | |
| | | | Emerging growth company | ☐ | |
|
| | | | |
| If an emerging growth company, indicate by check mark if the registrant has elected not to use the extended transition period for complying with any new or revised financial accounting standards provided pursuant to Section 13(a) of the Exchange Act. | | | [ ]☐ | |
| Indicate by check mark whether the registrant is a shell company (as defined in Rule 12b-2 of the Act). | ☐ | Yes | ü☑ | No |
The aggregate market value of the voting and non-voting common equity held by non-affiliates as of June 29, 2018, was $1,404,892,960. |
As of January 31, 2019, there were 18,119,093 |
The aggregate market value of the voting and non-voting common equity held by non-affiliates as of June 28, 2019, was $1,094,534,460.
As of January 31, 2020, there were 18,349,518 shares of Common Stock outstanding.
DOCUMENTS INCORPORATED BY REFERENCE
Portions of the registrant’s Proxy Statement for its 20192020 annual meeting of shareholders (the “2019“2020 Proxy Statement”) are incorporated by reference in Part III.
Tennant Company
Form 10–K
| | | PART I | | Page | | Page |
| | | | | | | |
| | | | | | | |
| | | | | | | |
| | | | | | | |
| | | | | | | |
| | | | | | | |
| PART II | | |
| | | | | | | |
| | | | | | | |
| | | | | | | |
| | | | | | | |
| | | | | | | |
| | | | | | | |
| | | | | | | |
| | | | | | | |
| | | | | | | |
| | | | | | | |
| | | | | | | |
| | | | | | | |
| | | | | | | |
| | | | | | | | | |
| | | | | | | | | |
| | | | | | | | | |
| | | | | | | | | |
| | | | | | | | | |
| | | | | | | | | |
| | | | | | | | | |
| | | | | | | | | |
| | | | | | | | | |
| | | | | | | | | |
| | | | | | | | | |
| | | | | | | | | |
| | | | | | | | | |
| | | | | | | | | |
| | | | | | | | | |
| | | | | | | | | |
| | | | | | | | | |
| | | | | | | | | |
| | | | | | | | | |
| | | | | | | | | |
| | | | | | | | | |
| | | | | | | | | |
| | | | | | | | |
| | | | | | | | |
| | | | | | | |
| | | | | |
| | | | | |
| PART III | | |
| | | | | | | |
| | | | | | | |
| | | | | | | |
| | | | | | | |
| | | | | | | |
| PART IV | | |
| | | | | | | |
| | | | | | | |
| | | | | | | |
TENNANT COMPANY
20182019
ANNUAL REPORT
Form 10–K
(Pursuant to Securities Exchange Act of 1934)
PART I
ITEM 1 – Business
General Development of Business
Founded in 1870 by George H. Tennant, Tennant Company, ("the Company, we, us, or our"), a Minnesota corporation incorporated in 1909, began as a one-man woodworking business, evolved into a successful wood flooring and wood products company, and eventually into a manufacturer of floor cleaning equipment. Throughout its history, Tennantthe Company has remained focused on advancing our industry by aggressively pursuing new technologies and creating a culture that celebrates innovation.
Today, Tennantthe Company is a recognized leader of the cleaning industry. We are passionate about developing innovative and sustainable solutions that help our customers clean spaces more effectively, addressing indoor and outdoorvarious cleaning challenges. TennantThe Company operates in three geographic business units including the Americas, Europe, Middle East and Africa (EMEA) and Asia Pacific (APAC).
TennantThe Company is committed to empowering our customers to create a cleaner, safer and healthier world with high-performance solutions that minimize waste, reduce costs, improve safety and further sustainability goals.
Principal Products, Markets and Distribution
The Company offers products and solutions consisting of mechanized cleaning equipment, detergent-free and other sustainable cleaning technologies, aftermarket parts and consumables, equipment maintenance and repair service, specialty surface coatings, and business solutions such as financing, rental and leasing programs, and machine-to-machine asset management solutions.
The Company's products are used in many types of environments including: Retail establishments, distribution centers, factories and warehouses, public venues such as arenas and stadiums, office buildings, schools and universities, hospitals and clinics, parking lots and streets, and more. The Company markets its offerings under the following brands: Tennant®, Nobles®, Alfa Uma Empresa Tennant™, IRIS®, VLX™, Superior Anodes, Orbio®,, IPC brands and private-label brands. Orbio-branded products and solutions are part of the emerging category of On-Site Generation (OSG). OSG technologies create and dispense effective cleaning and antimicrobial solutions on site within a facility. The Company's customers include contract cleaners to whom organizations outsource facilities maintenance, as well as businesses that perform facilities maintenance themselves. The Company reaches these customers through the industry's largest direct sales and service organization and through a strong and well-supported network of authorized distributors worldwide.
Raw Materials
The Company has not experienced any significant or unusual problems in the availability of raw materials or other product components. The Company has sole-source vendors for certain components. A disruption in supply from such vendors may disrupt the Company’s operations. However, the Company believes that it can find alternate sources in the event there is a disruption in supply from such vendors.
Intellectual Property
Although the Company considers that its patents, proprietary technologies and trade secrets, customer relationships, licenses, trademarks, trade names and brand names in the aggregate constitute a valuable asset, it does not regard its business as being materially dependent upon any single item or category of intellectual property. We take appropriate measures to protect our intellectual property to the extent such intellectual property can be protected.
Seasonality
Although the Company’s business is not seasonal in the traditional sense, the percentage of revenues in each quarter typically ranges from 22% to 28% of the total year. The first quarter tends to be at the low end of the range reflecting customers’ initial slow ramp up of capital purchases and the Company’s efforts to close out orders at the end of each year. The second and fourth quarters tend to be toward the high end of the range and the third quarter is typically in the middle of the range.
Working Capital
The Company primarily funds operations through a combination of cash and cash equivalents and cash flows from operations. Wherever possible, cash management is centralized and intercompany financing is used to provide working capital to subsidiaries as needed. In addition, credit facilities are available for additional working capital needs or investment opportunities.
Major Customers
The Company sells its products to a wide variety of customers, none of which are of material importance in relation to the business as a whole. The customer base includes several governmental entities which generally have terms similar to other customers.
Backlog
The Company processes orders within two weeks, on average. Therefore, no significant backlogs existed at December 31, 20182019 and 2017.2018.
Competition
Public industry data concerning global market share is limited; however, through an assessment of validated third-party sources and sponsored third-party market studies, the Company is confident in its position as a world-leading manufacturer of floor maintenance and cleaning equipment. Several global competitors compete with Tennantthe Company in virtually every geography of the world. However, small regional competitors are also significant competitors who vary by country, vertical market, product category or channel. The Company competes primarily on the basis of offering a broad line of high-quality, innovative products supported by an extensive sales and service network in major markets.
Research and Development
TennantThe Company has a history of developing innovative technologies to create a cleaner, safer, healthier world. The Company is committed to its innovation leadership position through fulfilling its goal to annually invest approximately 3% of annual sales to research and development. The Company’s innovation efforts arefocused on solving our customers’ needs
holistically by addressing a
broad array of issues, such as managing labor costs, enhancing productivity, and making cleaning processes more efficient and sustainable. Through core product development, partnerships and technology enablement, we are creating new growth avenues for Tennant.the Company. These new avenues for growth go beyond cleaning equipment into business insights and service solutions.
Environmental Compliance
Compliance with Federal, State and local provisions which have been enacted or adopted regulating the discharge of materials into the environment, or otherwise relating to the protection of the environment, has not had, and the Company does not expect it to have, a material effect upon the Company’s capital expenditures, earnings or competitive position.
Employees
The Company employed approximately 4,3004,400 people in worldwide operations as of December 31, 2018.2019.
Available Information
The Company's internet address is www.tennantco.com. The Company makes available free of charge, through the Investor Relations website at investors.tennantco.com, its annual report on Form 10-K, quarterly reports on Form 10-Q, current reports on Form 8-K and amendments to those reports filed or furnished pursuant to Section 13(a) or 15(d) of the Exchange Act as soon as reasonably practicable when such material is filed electronically with, or furnished to, the Securities and Exchange Commission (“SEC”). The SEC also maintains an internet site that contains reports, proxy and information statements, and other information, which can be accessed at sec.gov.
Information About Our Executive Officers of the Registrant
The list below identifies those persons designated as executive officers of the Company, including their age, positions held with the Company and their business experience during the past five or more years.
Andrew Cebulla, Vice President of Finance and Corporate Controller; Interim Chief Financial Officer and Interim Principal Accounting Officer
Andrew Cebulla (49) joined the Company in 2017 as Vice President of Finance and Corporate Controller, and is serving as Interim Chief Financial Officer and Interim Principal Accounting Officer as Mr. Woodward is on a short-term medical leave of absence. Prior to joining the Company, Mr. Cebulla served in a variety of accounting and finance leadership roles, including Treasurer and Director of Investor Relations, Corporate Controller, and most recently Vice President of Finance supporting the Test Vehicles and Structures business, of MTS Systems Corporation, a global supplier of test systems and industrial position sensors, since 2007.
David W. Huml, Senior Vice President, EMEA, APAC, Global Marketing and Operations
David W. Huml (50)(51) joined the Company in November 2014 as Senior Vice President, Global Marketing. In January 2016, he also assumed oversight for the Company's APAC business unit. In January 2017, he assumed oversight for the Company's EMEA business and in June 2018 he assumed responsibility for Global Operations. From 2006 to October 2014, he held various positions with Pentair plc, a global manufacturer of water and fluid solutions, valves and controls, equipment protection and thermal management products, most recently as Vice President, Applied Water Platform. From 1992 to 2006, he held various positions with Graco Inc., a designer, manufacturer and marketer of systems and equipment to move, measure, control, dispense and spray fluid and coating materials, including Worldwide Director of Marketing, Contractor Equipment Division.
H. Chris Killingstad, President and Chief Executive Officer
H. Chris Killingstad (63)(64) joined the Company in April 2002 as Vice President, North America and was named President and CEO in 2005. From 1990 to 2002, he was employed by The Pillsbury Company, a consumer foods manufacturer. From 1999 to 2002 he served as Senior Vice President and General Manager of Frozen Products for Pillsbury North America; from 1996 to 1999 he served as Regional Vice President and Managing Director of Pillsbury Europe, and from 1990 to 1996 was Regional Vice President of Häagen-Dazs Asia Pacific. He held the position of International Business Development Manager at PepsiCo Inc., from 1982-19901982 to 1990 and Financial Manager for General Electric, from 1978-1980.1978 to 1980.
Carol E. McKnight, Senior Vice President, Chief Administrative Officer
Carol E. McKnight (51)(52) joined the Company in June 2014 as Senior Vice President of Global Human Resources. In 2017, Carolshe was named SVP and Chief Administrative Officer. Prior to joining Tennant,the Company, she was Vice President of Human Resources at ATK (Alliant Techsystems) where she held divisional
and corporate leadership positions in the areas of compensation, talent management, talent acquisition and general human resource management from 2002 to 2014. Prior to ATK, she was with New Jersey-based NRG Energy, Inc.
Mary E. Talbott, Senior Vice President, General Counsel and Corporate Secretary
Mary E. Talbott (50)(51) joined the Company in January 2019 as Senior Vice President, General Counsel and Corporate Secretary. Prior to joining Tennant,the Company, from 2017 to 2018, she was Vice President, Assistant General Counsel and Assistant Corporate Secretary for General Cable Corporation, a global manufacturer in the development, design, manufacture, marketing and distribution of copper, aluminum and fiber optic wire and cable products for use in the energy, industrial, construction, automotive, specialty and communications markets. From 2016 to 2017, she was Vice President of Law at Macy’s, Inc., and from 2006 to 2015, she held corporate leadership positions with Scripps Networks Interactive, Inc. (which was spun off from The E.W. Scripps Company in 2008), a developer of lifestyle-oriented content for linear and interactive video platforms including television and the internet, most recently as Senior Vice President, Deputy General Counsel and Corporate Secretary.
Keith A. Woodward, Senior Vice President and Chief Financial Officer
Keith A. Woodward (54)(55) joined the Company in December 2018 as Senior Vice President and Chief Financial Officer. As previously announced, Mr. Woodward is currently taking a short-term medical leave of absence. Prior to joining Tennant,the Company, he was at General Mills, Inc,Inc., a global manufacturer and marketer of branded consumer foods, for over 26 years holding various finance and corporate leadership roles, most recently as Senior Vice President, Global Treasurer. Prior to General Mills, Inc., he was with PriceWaterhouseCoopers.
Richard H. Zay, Senior Vice President, The Americas and R&D
Richard H. Zay (48)(49) joined the Company in June 2010 as Vice President, Global Marketing and was named Senior Vice President, Global Marketing in October 2013. In 2014, he was named Senior Vice President of the Americas business unit for Tennantthe Company and in 2018 he assumed responsibility for Tennant Research and Development as well. From 2006 to 2010, he held various positions with Whirlpool Corporation, a manufacturer of major home appliances, most recently as General Manager, KitchenAid Brand. From 1993 to 2006, he held various positions with Maytag Corporation, including Vice President, Jenn-Air Brand, Director of Marketing, Maytag Brand, and Director of Cooking Category Management.
ITEM 1A – Risk Factors
The following are significant factors known to us that could materially adversely affect our business, financial condition or operating results.
We may not be able to develop or manage strategic planning and growth processes or the related operational plans to deliver on our strategies and establish a broad organization alignment, thereby impairing our ability to achieve future performance expectations.
We are continuing to refine our global company strategy to guide our next phase of performance as our structure has become more complex due to recent acquisitions. We continue to consolidate and reallocate resources as part of our ongoing efforts to optimize our cost structure and to drive synergies and growth. Our operating results may be negatively impacted if we are unable to implement new processes and manage organizational changes, which includes changes to our go-to-market strategy, systems and processes; simultaneous focus on expense control and growth; and introduction of alternative cleaning methods. In addition, if we do not effectively realize and sustain the benefits that these transformations are designed to produce, we may not fully realize the anticipated savings of these actions or they may negatively impact our ability to serve our customers or meet our strategic objectives.
We may not be able to upgrade and evolve our information technology systems as quickly as we wish and we may encounter difficulties as we upgrade and evolve these systems to support our growth strategy and business operations, which could adversely impact our abilities to accomplish anticipated future cost savings and better serve our customers.
We have many information technology systems that are important to the operation of our business and are in need of upgrading in order to effectively implement our growth strategy. Given our greater emphasis on customer-facing technologies, we may not have adequate resources to upgrade our systems at the pace which the current business environment demands. Additionally, significantly upgrading and evolving the capabilities of our existing systems could lead to inefficient or ineffective use of our technology due to lack of training or expertise in these evolving technology systems. These factors, among other things, could lead to significant expenses, adversely impacting our results of operations and hindering our ability to offer better technology solutions to our customers.
Increases in the cost of, quality, or disruption in the availability of, raw materials and components that we purchase or labor required to manufacture our products could negatively impact our operating results or financial condition.
Our sales growth, expanding geographical footprint and continued use of sole-source vendors, coupled with suppliers’ potential credit issues, could lead to an increased risk of a breakdown in our supply chain. Our use of sole-source vendors creates a concentration risk. There is an increased risk of defects due to the highly configured nature of our purchased component parts that could result in quality issues, returns or production slow downs.slowdowns. In addition, modularization may lead to more sole-sourced products and as we seek to outsource the design of certain key components, we risk loss of proprietary control and becoming more reliant on a sole source. There is also a risk that the vendors we choose to supply our parts and equipment fail to comply with our quality expectations, thus damaging our reputation for quality and negatively impacting sales.
We have and may continue to experience higher than normal wage inflation due to skilled labor shortages. In addition, we have incurred costs associated with tariffs on certain raw materials used on our manufacturing processes. The labor shortages and tariff costs have unfavorably impacted our gross profit margins and could continue to do so if actions we are taking are not effective at offsetting these rising costs. Changes and uncertainties related to government fiscal and tax policies, including increased duties, tariffs,
or other restrictions, could adversely affect demand for our products, the cost of the products we manufacture or our ability to cost-effectively source raw materials, all of which could have a negative impact on our financial results.
We may encounter financial difficulties if the United States or other global economies experience an additional or continued long-term economic downturn, decreasing the demand for our products and negatively affecting our sales growth.
Our product sales are sensitive to declines in capital spending by our customers. Decreased demand for our products could result in decreased revenues, profitability and cash flows and may impair our ability to maintain our operations and fund our obligations to others. In the event of a continued long-term economic downturn in the U.S. or other global economies, our revenues could decline to the point that we may have to take cost-saving measures, such as restructuring actions. In addition, other fixed costs would have to be reduced to a level that is in line with a lower level of sales. A long-term economic downturn that puts downward pressure on sales could also negatively affect investor perception relative to our publicly stated growth targets.
Our ability to effectively operate our Company could be adversely affected if we are unable to attract and retain key personnel and other highly skilled employees, provide employee development opportunities and create effective succession planning strategies.
Our growth strategy, expanding global footprint, changing workforce demographics and increased improvements in technology and business processes designed to enhance the customer experience are putting increased pressure on human capital strategies designed to recruit, retain and develop top talent.
Our continued success will depend on, among other things, the skills and services of our executive officers and other key personnel. Our ability to attract and retain highly qualified managerial, technical, manufacturing, research, sales and marketing personnel also impacts our ability to effectively operate our business. As companies grow and increase their hiring activities, there is an inherent risk of increased employee turnover and the loss of valuable employees in key positions, especially in emerging markets. We believe the increased loss of key personnel within a concentrated region could adversely affect our sales growth.
In addition, there is a risk that we may not have adequate talent acquisition resources and employee development resources to support our future hiring needs and provide training and development opportunities to all employees. This, in turn, could impede our workforce from embracing change and leveraging the improvements we have made in technology and other business process enhancements.
Inadequate funding or insufficient innovation of new technologies may result in an inability to develop and commercialize new innovative products and services.
We strive to develop new and innovative products and services to differentiate ourselves in the marketplace. New product development relies heavily on our financial and resource investments in both the short term and long term. If we fail to adequately fund product development projects or fund a project which ultimately does not gain the market acceptance we anticipated, we risk not meeting our customers' expectations, which could result in decreased revenues, declines in margin and loss of market share.
We may consider acquisition of suitable candidates to accomplish our growth objectives. We may not be able to successfully integrate the businesses we acquire to achieve operational efficiencies, including synergistic and other benefits of acquisition.
We may consider, as part of our growth strategy, supplementing our organic growth through acquisitions of complementary businesses or products. We have engaged in acquisitions in the past such as the acquisition
of the IPC Group, and we believe future acquisitions may provide meaningful opportunities to grow our business and improve profitability. Acquisitions allow us to enhance the breadth of our product offerings and expand the market and geographic participation of our products and services.
However, our success in growing by acquisition is dependent upon identifying businesses to acquire, integrating the newly acquired businesses with our existing businesses and complying with the terms of our credit facilities. We may incur difficulties in the realignment and integration of business activities when assimilating the operations and products of an acquired business or in realizing projected efficiencies, cost savings, revenue synergies and profit margins. Acquired businesses may not achieve the levels of revenue, profit, productivity or otherwise perform as expected. We are also subject to incurring unanticipated liabilities and contingencies associated with an acquired entity that are not identified or fully understood in the due diligence process. Current or future acquisitions may not be successful or accretive to earnings if the acquired businesses do not achieve expected financial results.
In addition, we may record significant goodwill or other intangible assets in connection with an acquisition. We are required to perform impairment tests at least annually and whenever events indicate that the carrying value may not be recoverable from future cash flows. If we determine that any intangible asset values need to be written down to their fair values, this could result in a charge that may be material to our operating results and financial condition.
Our ability to effectively operate our Company could be adversely affected if we are unable to attract and retain key personnel and other highly skilled employees, provide employee development opportunities and create effective succession planning strategies.
Our growth strategy, expanding global footprint, changing workforce demographics and increased improvements in technology and business processes designed to enhance the customer experience are putting increased pressure on human capital strategies designed to recruit, retain and develop top talent.
Our continued success will depend on, among other things, the skills and services of our executive officers and other key personnel. Our ability to attract and retain highly qualified managerial, technical, manufacturing, research, sales and marketing personnel also impacts our ability to effectively
operate our business. As companies grow and increase their hiring activities, there is an inherent risk of increased employee turnover and the loss of valuable employees in key positions, especially in emerging markets. We believe the increased loss of key personnel within a concentrated region could adversely affect our sales growth.
In addition, there is a risk that we may not have adequate talent acquisition resources and employee development resources to support our future hiring needs and provide training and development opportunities to all employees. This, in turn, could impede our workforce from embracing change and leveraging the improvements we have made in technology and other business process enhancements.
We may encounter risks to our IT infrastructure, such as access and security, that may not be adequately designed to protect critical data and systems from theft, corruption, unauthorized usage, viruses, sabotage or unintentional misuse.
Global cybersecurity threats and incidents can range from uncoordinated individual attempts to gain unauthorized access to IT systems to sophisticated and targeted measures known as advanced persistent threats, directed at the Company, its products and its customers. We seek to deploy comprehensive measures to deter, prevent, detect, react to and mitigate these threats, including identity and access controls, data protection, vulnerability assessments, continuous monitoring of our IT networks and systems and maintenance of backup and protective systems.
Despite these efforts, cybersecurity incidents, depending on their nature and scope, could potentially result in the misappropriation, destruction, corruption or unavailability of critical data and confidential or proprietary information (our own or that of third parties) and the disruption of business operations. The potential consequences of a material cybersecurity incident include financial loss, reputational damage, litigation with third parties, theft of intellectual property, diminution in the value of our investment in research, development and engineering, and increased cybersecurity protection and remediation costs due to the increasing sophistication and proliferation of threats, which in turn could adversely affect our competitiveness and results of operations.
Inadequate funding or insufficient innovation of new technologies may result in an inability to develop and commercialize new innovative products and services.
We strive to develop new and innovative products and services to differentiate ourselves in the marketplace. New product development relies heavily on our financial and resource investments in both the short term and long term. If we fail to adequately fund product development projects or fund a project which ultimately does not gain the market acceptance we anticipated, we risk not meeting our customers' expectations, which could result in decreased revenues, declines in margin and loss of market share.
We are subject to competitive risks associated with developing innovative products and technologies, including, but not limited to, not expanding as rapidly or aggressively in the global market as our competitors, our customers not continuing to pay for innovation and competitive challenges to our products, technology and the underlying intellectual property.
Our products are sold in competitive markets throughout the world. Competition is based on product features and design, brand recognition, reliability, durability, technology, breadth of product offerings, price, customer relationships and after-sale service. Although we believe that the performance and price characteristics of our products will produce competitive solutions for our customers’ needs, our products are generally priced higher than our competitors’ products. This is due to our dedication to innovation and continued investments in research and development. We believe that customers will pay for the innovations and quality in our products. However, it may be difficult for us to compete with lower priced products offered by our competitors and there can be no assurance that our customers will continue
to choose our products over products offered by our competitors. If our products, markets and services are not competitive, we may experience a decline in sales volume, an increase in price discounting and a loss of market share, which adversely impacts revenues, margin and the success of our operations.
Competitors may also initiate litigation to challenge the validity of our patents or claims, allege that we infringe upon their patents, violate our patents or they may use their resources to design comparable products that avoid infringing our patents. Regardless of whether such litigation is successful, such litigation could significantly increase our costs and divert management’s attention from the operation of our business, which could adversely affect our results of operations and financial condition.
We may encounter risks to our IT infrastructure, such as access and security, that may not be adequately designed to protect critical data and systems from theft, corruption, unauthorized usage, viruses, sabotage or unintentional misuse.
Global cybersecurity threats and incidents can range from uncoordinated individual attempts to gain unauthorized access to IT systems to sophisticated and targeted measures known as advanced persistent threats, directed at the Company, its products and its customers. We seek to deploy comprehensive measures to deter, prevent, detect, react to and mitigate these threats, including identity and access controls, data protection,
vulnerability assessments, continuous monitoring of our IT networks and systems and maintenance of backup and protective systems.
Despite these efforts, cybersecurity incidents, depending on their nature and scope, could potentially result in the misappropriation, destruction, corruption or unavailability of critical data and confidential or proprietary information (our own or that of third parties) and the disruption of business operations. The potential consequences of a material cybersecurity incident include financial loss, reputational damage, litigation with third parties, theft of intellectual property, diminution in the value of our investment in research, development and engineering, and increased cybersecurity protection and remediation costs due to the increasing sophistication and proliferation of threats, which in turn could adversely affect our competitiveness and results of operations.
Actions of activist investors or others could disrupt our business.
Public companies have been the target of activist investors. One investor which owns approximately 5% of our outstanding common stock filed a Schedule 13D with the Securities and Exchange Commission in December 2017 which stated its belief that we should undertake a strategic review process regarding a consolidation transaction with a third party. In the event such investor or another third party, such as an activist investor, continues to pursue such belief or proposes to change our governance policies, board of directors, or other aspects of our operations, our review and consideration of such proposals may create a significant distraction for our management and employees. This could negatively impact our ability to execute our business plans and may require our management to expend significant time and resources. Such proposals may also create uncertainties with respect to our financial position and operations and may adversely affect our ability to attract and retain key employees.
We may be unable to conduct business if we experience a significant business interruption in our computer systems, manufacturing plants or distribution facilities for a significant period of time.
We rely on our computer systems, manufacturing plants and distribution facilities to efficiently operate our business. If we experience an interruption in the functionality in any of these items for a significant period of time for any reason, we may not have adequate business continuity planning contingencies in place to allow us to continue our normal business operations on a long-term basis.
The spread of contagious diseases, such as the coronavirus outbreak which originated in China at the beginning of 2020, could adversely affect our customers, employees, manufacturing operations, and global supply chain. Also, government actions to prevent further outbreaks could adversely affect our business operations and/or our financial results.
In addition, the increase in customer-facing technology raises the risk of a lapse in business operations. Therefore, significant long-term interruption in our business could cause a decline in sales, an increase in expenses and could adversely impact our financial results.
Our global operations are subject to laws and regulations that impose significant compliance costs and create reputational and legal risk.
Due to the international scope of our operations, we are subject to a complex system of commercial, tax and trade regulations around the world. Recent years have seen an increase in the development and enforcement of laws regarding trade, tax compliance, labor and safety and anti-corruption, such as the U.S. Foreign Corrupt Practices Act, and similar laws from other countries. Our numerous foreign subsidiaries and affiliates are governed by laws, rules and business practices that differ from those of the U.S., but because we are a U.S.-based company, oftentimes they are also subject to U.S. laws which can create a conflict. Despite our due diligence, there is a risk that we do not have adequate resources or comprehensive processes to stay current on changes in laws or regulations applicable to us worldwide and maintain compliance with those changes. Increased compliance requirements may lead to increased costs and erosion of desired profit margin. As a result, it is possible that the activities of these entities may not comply with U.S. laws or business practices or our Business Ethics Guide. Violations of the U.S. or local laws may result in severe criminal or civil sanctions, could disrupt our business, and result in an adverse effect on our reputation, business and
results of operations or financial condition. We cannot predict the nature, scope or effect of future regulatory requirements to which our operations might be subject or the manner in which existing laws might be administered or interpreted.
In addition to the foregoing, the European Union adopted a comprehensive General Data Privacy Regulation (the "GDPR") in May 2016 that has replaced the EU Data Protection Directive and related country-specific legislation. The GDPR became effective in May 2018. GDPR requires companies to satisfy new requirements regarding the handling of personal and sensitive data, including its use, protection and the ability of persons
whose data is stored to correct or delete such data about themselves. Failure to comply with GDPR requirements could result in penalties of up to 4% of worldwide revenue.
The SEC has adopted rules regarding disclosure of the use of “conflict minerals” (commonly referred to as tin, tantalum, tungsten and gold) which are mined from the Democratic Republic of the Congo in products we manufacture or contract to manufacture. These rules have required and will continue to require due diligence and disclosure efforts.
Actions of activist investors or others could disrupt our business.
Public companies have been the target of activist investors. One investor which owns approximately 5% of our outstanding common stock filed a Schedule 13D with the Securities and Exchange Commission in December 2017 which stated its belief that we should undertake a strategic review process regarding a consolidation transaction with a third party. In the event such investor or another third party, such as an activist investor, continues to pursue such belief or proposes to change our governance policies, board of directors, or other aspects of our operations, our review and consideration of such proposals may create a significant distraction for our management and employees. This could negatively impact our ability to execute our business plans and may require our management to expend significant time and resources. Such proposals may also create uncertainties with respect to our financial position and operations and may adversely affect our ability to attract and retain key employees.
We are subject to product liability claims and product quality issues that could adversely affect our operating results or financial condition.
Our business exposes us to potential product liability risks that are inherent in the design, manufacturing and distribution of our products. If products are used incorrectly by our customers, injury may result leading to product liability claims against us. Some of our products or product improvements may have defects or risks that we have not yet identified that may give rise to product quality issues, liability and warranty claims. Quality issues may also arise due to changes in parts or specifications with suppliers and/or changes in suppliers. If product liability claims are brought against us for damages that are in excess of our insurance coverage or for uninsured liabilities and it is determined we are liable, our business could be adversely impacted. Any losses we suffer from any liability claims, and the effect that any product liability litigation may have upon the reputation and marketability of our products, may have a negative impact on our business and operating results. We could experience a material design or manufacturing failure in our products, a quality system failure, other safety issues, or heightened regulatory scrutiny that could warrant a recall of some of our products. Any unforeseen product quality problems could result in loss of market share, reduced sales and higher warranty expense.
We may not be able to generate sufficient cash to service all of our indebtedness and may be forced to take other actions to satisfy our obligations under our indebtedness, which may not be successful.
In April 2017, in connection with the acquisition of IPC Cleaning S.p.A., we entered into a new senior credit facility and indenture, and issued debt totaling approximately $400,000,000 consisting of a $100,000,000 term loan and $300,000,000 of senior notes, which funded the acquisition and replaced our current debt facility. The new senior credit facility also includes a revolving facility in an amount up to $200,000,000. We cannot provide assurance that our business will generate sufficient cash flow from operations to meet all our debt service requirements, to pay dividends, to repurchase shares of our common stock, and to fund our general corporate and capital requirements.
Our ability to satisfy our debt obligations will depend upon our future operating performance. We do not have complete control over our future operating performance because it is subject to prevailing economic conditions,
and financial, business and other factors.
Our current and future debt service obligations and covenants could have important consequences. These consequences include, or may include, the following:
our ability to obtain financing for future working capital needs or acquisitions or other purposes may be limited;
our funds available for operations, expansions, dividends or other distributions, or stock repurchases may be reduced because we dedicate a significant portion of our cash flow from operations to the payment of principal and interest on our indebtedness;
our ability to conduct our business could be limited by restrictive covenants; and
our vulnerability to adverse economic conditions may be greater than less leveraged competitors and, thus, our ability to withstand competitive pressures may be limited.
Restrictive covenants in our senior credit facility and in our indenture place limits on our ability to conduct our business. Covenants in our senior credit facility and indenture include those that restrict our ability to make acquisitions, incur debt, encumber or sell assets, pay dividends, engage in mergers and consolidations, enter into transactions with affiliates, make investments and permit our subsidiaries to enter into certain restrictive agreements. The senior credit facility additionally contains certain financial covenants. We cannot provide assurance that we will be able to comply with these covenants in the future.
Foreign currency exchange rate fluctuations, particularly the strengthening of the U.S. dollar against other major currencies, could result in declines in our reported net sales and net earnings.
We earn revenues, pay expenses, own assets and incur liabilities in countries using functional currencies other than the U.S. dollar. Because our consolidated financial statements are presented in U.S. dollars, we translate revenues and expenses into U.S. dollars at the average exchange rate during each reporting period, as well as assets and liabilities into US. dollars at exchange rates in effect at the end of each reporting period. Therefore, increases or decreases in the value of the U.S. dollar against other major currencies will affect our net revenues, net earnings, earnings per share and the value of balance sheet items denominated in foreign currencies as we translate them into the U.S. dollar reporting currency. We use derivative financial instruments to hedge our estimated transactional or translational exposure to certain foreign currency-denominated assets and liabilities as well as our foreign currency denominatedcurrency-denominated revenue. While we actively manage the exposure of our foreign currency market risk in the normal course of business by utilizing various foreign exchange financial instruments, these instruments involve risk and may not effectively limit our underlying exposure from foreign currency exchange rate fluctuations or minimize the effects on our net earnings and the cash volatility associated with foreign currency exchange rate changes. Fluctuations in foreign currency exchange rates, particularly the strengthening of the U.S. dollar against major currencies, could materially affect our financial results.
ITEM 1B – Unresolved Staff Comments
None.
ITEM 2 – Properties
The Company’s corporate offices are owned by the Company and are located in the Minneapolis, Minnesota, metropolitan area. Manufacturing facilities located in Minneapolis, Minnesota; Holland, Michigan; Chicago, Illinois; Uden, theThe Netherlands and the Italian cities of Venice, Cremona and Reggio Emilia and in the Province of Padua are owned by the Company. Manufacturing facilities located in Louisville, Kentucky; São Paulo, Brazil; Shanghai, China; Hefei, China, and another facility in the Province of Padua are leased to the Company. In addition, IPC uses a dedicated, third-party plant
in Germany that specially manufactures heavy–duty stainless steel scrubbers and sweepers to IPC designs. IPC also owns a minor tools and supplies assembly operation in China to service local customers. The facilities are in good operating condition, suitable for their respective uses and adequate for current needs.
Sales offices, warehouse and storage facilities are leased in various locations in the United States, Canada, Mexico, Portugal, Spain, Italy, Germany, France, theThe Netherlands, Belgium, Norway, the United Kingdom, Japan, China, India, Australia, New Zealand and Brazil. The Company’s facilities are in good operating condition, suitable for their respective uses and adequate for current needs.
Further information regarding the Company’s property and lease commitments is included in the Contractual Obligations section of Item 7 and in Note 1715 to the Consolidated Financial Statements.
ITEM 3 – Legal Proceedings
There are no material pending legal proceedings other than ordinary routine litigation incidental to the Company’s business.
ITEM 4 – Mine Safety Disclosures
Not applicable.
PART II
ITEM 5 – Market for Registrant’s Common Equity, Related Shareholder Matters and Issuer Purchases of Equity Securities
MARKET INFORMATION – Tennant's common stock is traded on the New York Stock Exchange, under the ticker symbol TNC. As of February 14, 2019,2020, there were 312291 shareholders of record.
DIVIDEND INFORMATION – Cash dividends on Tennant’s common stock have been paid for 7475 consecutive years. Tennant’s annual cash dividend payout increased for the 4748th consecutive year to $0.85$0.88 per share in 2018,2019, an increase of $0.01$0.03 per share over 2017.2018. Dividends are generally declared each quarter. On February 14, 2019,19, 2020, the Company announced a quarterly cash dividend of $0.22 per share payable March 15, 2019,16, 2020, to shareholders of record on February 28, 2019.2020.
DIVIDEND REINVESTMENT OR DIRECT DEPOSIT OPTIONS – Shareholders have the option of reinvesting quarterly dividends in additional shares of Company stock or having dividends deposited directly to a bank account. The Transfer Agent should be contacted for additional information.
TRANSFER AGENT AND REGISTRAR – Shareholders with a change of address or questions about their account may contact:
Equiniti Trust Company
Shareowner Services
P.O. Box 64874
St. Paul, MN 55164-0854
(800) 468-9716
EQUITY COMPENSATION PLAN INFORMATION – The following table provides information about shares of the Company's Common Stock that may be issued under the Company's equity compensation plans, as of December 31, 2018.
|
| | | | | | |
| Plan Category | | (a) Number of securities to be issued upon exercise of outstanding options, warrants and rights(1) | | (b) Weighted-average exercise price of outstanding options, warrants and rights(2) | | (c) Number of securities remaining available for future issuance under equity compensation plans (excluding securities reflected in column (a)) |
| Equity compensation plans approved by security holders | | 1,313,569 | | $47.47 | | 761,382 |
| Equity compensation plans not approved by security holders | | — | | — | | — |
| Total | | 1,313,569 | | $47.47 | | 761,382 |
| |
(1)
| Amount includes outstanding awards under the 1997 Non-Employee Director Stock Option Plan, the 2007 Stock Incentive Plan, the Amended and Restated 2010 Stock Incentive Plan, each as amended, and the 2017 Stock Incentive Plan (the "Plans"). Amount includes shares of Common Stock that may be issued upon exercise of outstanding stock options under the Plans. Amount also includes shares of Common Stock that may be paid in cash upon exercise of outstanding stock appreciation rights under the Plans. Amount also includes shares of Common Stock that may be issued upon settlement of restricted stock units and deferred stock units (phantom stock) under the Plans. Stock appreciation rights, restricted stock units and deferred stock units may be settled in cash, stock or a combination of both. Column (a) includes the number of shares that could be issued upon a complete distribution of all outstanding stock options and stock appreciation rights (1,084,567) and restricted stock units and deferred stock units (230,554). |
(2)Column (b) includes the weighted-average exercise price for outstanding stock options and stock appreciation rights.
SHARE REPURCHASES – On October 31, 2016, the Board of Directors authorized the repurchase of an additional 1,000,000 shares of our common stock. This is in addition to the 392,892 shares remaining under our prior repurchase program. Share repurchases are made from time to time in the open market or through privately negotiated transactions, primarily to offset the dilutive effect of shares issued through our share-based compensation programs.transactions. As of December 31, 2018,2019, our 2017 Credit Agreement restricts the payment of dividends or repurchasing of stock if, after giving effect to such payments and assuming no default exists or would result from such payment, our leverage ratio is greater than 2.50 to 1, in such case limiting such payments to an amount ranging from $50.0 million to $75.0 million during any fiscal year based on our leverage ratio after giving effect to such payment. Our Senior Notes due 2025 also contain certain restrictions, which are generally less restrictive than those contained in the 2017 Credit Agreement.
|
| | | | | | | |
For the Quarter Ended December 31, 2018 | Total Number of Shares Purchased(1) | | Average Price Paid Per Share | | Total Number of Shares Purchased as Part of Publicly Announced Plans or Programs | | Maximum Number of Shares that May Yet Be Purchased Under the Plans or Programs |
| October 1–31, 2018 | 86 | | $75.95 | | — | | 1,392,892 |
| November 1–30, 2018 | 267 | | 63.89 | | — | | 1,392,892 |
| December 1–31, 2018 | 407 | | 78.09 | | — | | 1,392,892 |
| Total | 760 | | $72.86 | | — | | 1,392,892 |
|
| | | | | | | |
For the Quarter Ended December 31, 2019 | Total Number of Shares Purchased(1) | | Average Price Paid Per Share | | Total Number of Shares Purchased as Part of Publicly Announced Plans or Programs | | Maximum Number of Shares that May Yet Be Purchased Under the Plans or Programs |
| October 1–31, 2019 | 18 | | $70.70 | | — | | 1,392,263 |
| November 1��30, 2019 | 1,352 | | 77.96 | | — | | 1,392,263 |
| December 1–31, 2019 | — | | — | | — | | 1,392,263 |
| Total | 1,370 | | $77.86 | | — | | 1,392,263 |
| |
(1) | Includes 7601,370 shares delivered or attested to in satisfaction of the exercise price and/or tax withholding obligations by employees who exercised stock options or restricted stock under employee share-based compensation plans. |
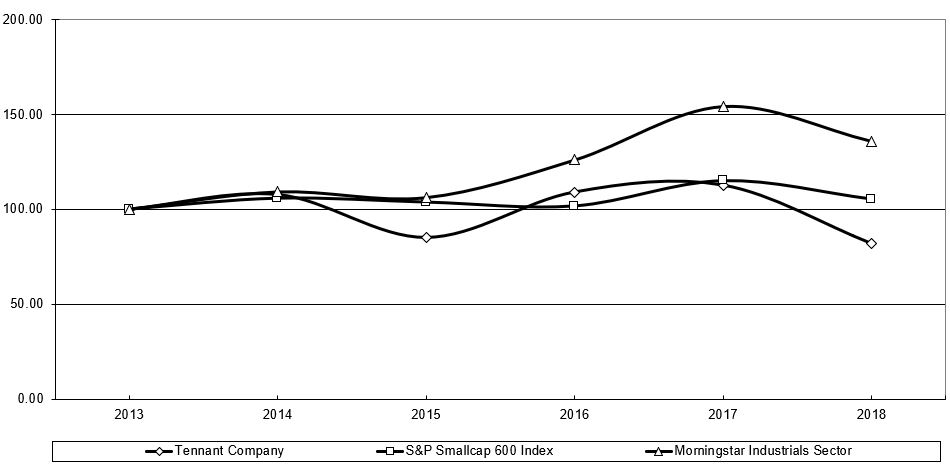
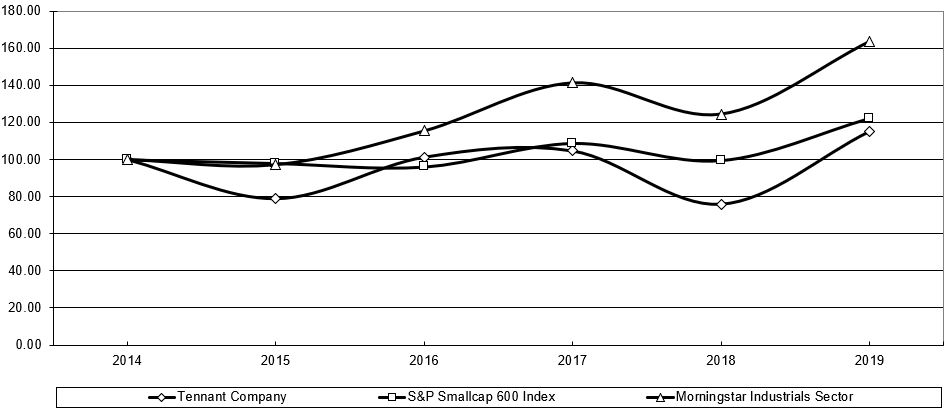
STOCK PERFORMANCE GRAPH – The following graph compares the cumulative total shareholder return on Tennant’s common stock to two indices: S&P SmallCap 600 and Morningstar Industrials Sector. The graph below compares the performance for the last five fiscal years, assuming an investment of $100 on December 31, 2013,2014, including the reinvestment of all dividends.
5-YEAR CUMULATIVE TOTAL RETURN COMPARISON
| | | | 2013 | | 2014 | | 2015 | | 2016 | | 2017 | | 2018 | 2014 | | 2015 | | 2016 | | 2017 | | 2018 | | 2019 |
| Tennant Company | $100 | | $108 | | $85 | | $109 | | $113 | | $82 | $100 | | $79 | | $101 | | $105 | | $76 | | $115 |
| S&P SmallCap 600 | $100 | | $106 | | $104 | | $102 | | $115 | | $105 | $100 | | $98 | | $96 | | $109 | | $100 | | $122 |
| Morningstar Industrials Sector | $100 | | $109 | | $106 | | $126 | | $154 | | $136 | $100 | | $97 | | $115 | | $141 | | $124 | | $164 |
ITEM 6 – Selected Financial Data
(In thousands,millions, except shares, and per share, ratio, and employee data)
| | | Years Ended December 31 | 2018 | | 2017 | | 2016 | | 2015 | | 2014 | | 2019 | | 2018 | | 2017 | | 2016 | | 2015 | |
| Financial Results: | | | | | | | | | | | | | | | | | | | | |
| Net Sales | $ | 1,123,511 |
| | $ | 1,003,066 |
| | $ | 808,572 |
| | $ | 811,799 |
| | $ | 821,983 |
| | $ | 1,137.6 |
| | $ | 1,123.5 |
| (6) | $ | 1,003.1 |
| | $ | 808.6 |
| | $ | 811.8 |
| |
| Cost of Sales | 678,478 |
| | 603,253 |
| (2), (5) | | 456,977 |
| | 462,739 |
| | 469,556 |
| | 675.9 |
| (1) | 678.5 |
| | 603.3 |
| (3) | 457.0 |
| | 462.7 |
| |
| Gross Margin - % | 39.6 |
|
| 39.9 |
|
| 43.5 |
|
| 43.0 |
|
| 42.9 |
| | 40.6 | % |
| 39.6 | % |
| 39.9 | % |
| 43.5 | % |
| 43.0 | % | |
| Research and Development Expense | 30,739 |
| | 32,013 |
| | 34,738 |
| | 32,415 |
| | 29,432 |
| | 32.7 |
| | 30.7 |
| | 32.0 |
| | 34.7 |
| | 32.4 |
| |
| % of Net Sales | 2.7 |
|
| 3.2 |
|
| 4.3 |
|
| 4.0 |
|
| 3.6 |
| | 2.9 | % |
| 2.7 | % |
| 3.2 | % |
| 4.3 | % |
| 4.0 | % | |
| Selling and Administrative Expense | 356,316 |
| (1), (4) | | 334,782 |
| (2), (4), (5) | | 248,592 |
| (4) | | 251,670 |
| (3), (4) | | 250,695 |
| (4) | 357.2 |
| (1) | 356.3 |
| (2), (5) | 334.8 |
| (3),(5) | 248.6 |
| (5) | 251.7 |
| (4), (5) |
| % of Net Sales | 31.7 |
|
| 33.4 |
|
| 30.7 |
|
| 31.0 |
|
| 30.5 |
| | 31.4 | % |
| 31.7 | % |
| 33.4 | % |
| 30.7 | % |
| 31.0 | % | |
| Profit from Operations | 57,978 |
| (1), (4) | | 33,018 |
| (2), (4), (5) | | 68,265 |
| (4) | | 52,576 |
| (3), (4) | | 71,894 |
| (4) | 71.8 |
| (1) | 58.0 |
| (2), (5) | 33.0 |
| (3),(5) | 68.3 |
| (5) | 52.6 |
| (4), (5) |
| % of Net Sales | 5.2 |
|
| 3.3 |
|
| 8.4 |
|
| 6.6 |
|
| 8.8 |
| | 6.3 | % |
| 5.2 | % |
| 3.3 | % |
| 8.4 | % |
| 6.6 | % | |
| Income Tax Expense | 2,304 |
| (1) | | 4,913 |
| (2) | | 19,877 |
| | 18,336 |
| (3) | | 18,887 |
| | 8.1 |
| (1) | 2.3 |
| (2) | 4.9 |
| (3) | 19.9 |
| | 18.3 |
| (4) |
| Effective Tax Rate - % | 6.4 |
|
| (380.2 | ) |
| 29.9 |
|
| 36.4 |
|
| 27.2 |
| | 15.1 |
|
| 6.4 |
|
| (380.2 | ) |
| 29.9 |
|
| 36.4 |
| |
| Net Earnings (Loss) Attributable to Tennant Company | 33,412 |
| (1) | | (6,195 | ) | (2) | | 46,614 |
| | 32,088 |
| | 50,651 |
| | 45.8 |
| (1) | 33.4 |
| (2) | (6.2 | ) | (3) | 46.6 |
| | 32.1 |
| |
| % of Net Sales | 3.0 |
| | (0.6 | ) | | 5.8 |
| | 4.0 |
| | 6.2 |
| | 4.0 | % | | 3.0 | % | | (0.6 | )% | | 5.8 | % | | 4.0 | % | |
| Per Share Data: | | | | | | | | | | | | | | | | | | | | |
| Basic Net Earnings (Loss) Attributable to Tennant Company | $ | 1.86 |
| (1) | | $ | (0.35 | ) | (2) | | $ | 2.66 |
| | $ | 1.78 |
| (3) | | $ | 2.78 |
| | $ | 2.53 |
| | $ | 1.86 |
| (2) | $ | (0.35 | ) | | $ | 2.66 |
| | $ | 1.78 |
| (4) |
| Diluted Net Earnings (Loss) Attributable to Tennant Company | $ | 1.82 |
| (1) | | $ | (0.35 | ) | (2) | | $ | 2.59 |
| | $ | 1.74 |
| (3) | | $ | 2.70 |
| | $ | 2.48 |
| | $ | 1.82 |
| (2) | $ | (0.35 | ) | | $ | 2.59 |
| | $ | 1.74 |
| (4) |
| Diluted Weighted Average Shares | 18,338,569 |
| | 17,695,390 |
| | 17,976,183 |
| | 18,493,447 |
| | 18,740,858 |
| | 18,453,145 |
| | 18,338,569 |
| | 17,695,390 |
| | 17,976,183 |
| | 18,493,447 |
| |
| Cash Dividends | $ | 0.85 |
| | $ | 0.84 |
| | $ | 0.81 |
| | $ | 0.80 |
| | $ | 0.78 |
| | $ | 0.88 |
| | $ | 0.85 |
| | $ | 0.84 |
| | $ | 0.81 |
| | $ | 0.80 |
| |
| Financial Position: | | | | | | | | | | | | | | | | | | | | |
| Total Assets | $ | 992,544 |
| | $ | 993,977 |
| | $ | 470,037 |
| | $ | 432,295 |
| | $ | 486,932 |
| | $ | 1,062.9 |
| (7) | $ | 992.5 |
| (6) | $ | 994.0 |
| | $ | 470.0 |
| | $ | 432.3 |
| |
| Total Debt | 355,065 |
| | 376,839 |
| | 36,194 |
| | 24,653 |
| | 28,137 |
| | 338.8 |
| | 355.1 |
| | 376.8 |
| | 36.2 |
| | 24.7 |
| |
| Total Tennant Company Shareholders’ Equity | 314,422 |
| | 296,503 |
| | 278,543 |
| | 252,207 |
| | 280,651 |
| | 359.9 |
| | 314.4 |
| | 296.5 |
| | 278.5 |
| | 252.2 |
| |
| Current Ratio | 1.9 |
| | 1.8 |
| | 2.2 |
| | 2.2 |
| | 2.4 |
| | 1.7 |
| | 1.9 |
| | 1.8 |
| | 2.2 |
| | 2.2 |
| |
| Debt-to-Capital Ratio | 53.0 | % | | 56.0 | % | | 11.5 | % | | 8.9 | % | | 9.1 | % | | 48.5 | % | | 53.0 | % | | 56.0 | % | | 11.5 | % | | 8.9 | % | |
| Cash Flows: | | | | | | | | | | | | | | | | | | | | |
| Net Cash Provided by Operations | $ | 79,970 |
| | $ | 54,174 |
| | $ | 57,878 |
| | $ | 45,232 |
| | $ | 59,362 |
| | $ | 71.9 |
| | $ | 80.0 |
| | $ | 54.2 |
| | $ | 57.9 |
| | $ | 45.2 |
| |
| Capital Expenditures, Net of Disposals | (18,668 | ) | | (17,926 | ) | | (25,911 | ) | | (24,444 | ) | | (19,292 | ) | | (38.3 | ) | | (18.7 | ) | | (17.9 | ) | | (25.9 | ) | | (24.4 | ) | |
| Free Cash Flow | 61,302 |
| | 36,248 |
| | 31,967 |
| | 20,788 |
| | 40,070 |
| | |
| Other Data: | | | | | | | | | | | | | | | | | | | | |
| Depreciation and Amortization | $ | 54,420 |
| | $ | 43,253 |
| | $ | 18,300 |
| | $ | 18,031 |
| | $ | 20,063 |
| | $ | 54.4 |
| | $ | 54.4 |
| | $ | 43.3 |
| | $ | 18.3 |
| | $ | 18.0 |
| |
| Number of employees at year-end | 4,341 |
| | 4,297 |
| | 3,236 |
| | 3,164 |
| | 3,164 |
| | 4,373 |
| | 4,341 |
| | 4,297 |
| | 3,236 |
| | 3,164 |
| |
The results of operations from our 2017 acquisition of the IPC Group have been included in the Selected Financial Data presented above since its acquisition date on April 6, 2017.
(1 ) 2019 includes pre-tax discontinuation of product lines, a fair value step-up adjustment to acquired inventory, and restructuring charges in cost of sales of $3.3 million, $0.9 million, and $0.3 million, respectively ($2.7 million, $0.7 million, and $0.2 million after-tax, respectively, or $0.15, $0.04, and $0.01 per diluted share, respectively). Additionally, 2019 includes pre-tax acquisition and integration costs, professional services, restructuring charges, a write-down on note receivable, and an adjustment to acquisition contingent consideration in sales and administrative expense of $3.0 million, $0.1 million, $4.5 million, $2.7 million, and $(2.3) million, respectively ($2.4 million, $0.1 million, $3.2 million, $2.7 million, and $(2.3) million after-tax, respectively, or $0.12, $0.00, $0.17, $0.15, and $(0.12) per diluted share, respectively). Furthermore, 2019 includes pre- and post-tax acquisition and integration costs in other income of $(1.8) million, or $(0.10) per diluted share.
| |
(1)(2)
| 2018 includes pre-tax acquisition and integration costs, restructuring charges, professional services, building design costs, and a gain on a sale of business, professional services, restructuring charges, and building design costs in selling and administrative expense of $6,869, $1,032, $1,914, $1,556,$6.9 million, ($1.0) million, $1.9 million, $1.0 million, and $(955),$1.6 million, respectively ($5,363, $874, $1,445, $1,175,5.5 million, $(0.8) million, $1.4 million, $0.8 million and $(721)$1.2 million after-tax, respectively, or $0.29, $(0.04), $0.08, $0.05, $0.08,and $0.06 $(0.04) per diluted share, respectively). Additionally, 2018 included a pre-taxpre- and post-tax pension curtailment gain in other expense of $(165) ($(134) after-tax$(0.1) million or $(0.01) per diluted share).share. In addition, 2018 net earnings attributable to Tennant Company includes an acquisition-related tax adjustment of $883 and a mandatory repatriation tax expense of $362 ($0.05 and $0.02 per diluted share, respectively). |
2018 net earnings attributable to Tennant Company includes an acquisition-related tax adjustment of $0.9 million and a mandatory repatriation tax expense of $0.3 million ($(0.05) and $(0.02) per diluted share, respectively).
| |
(2)(3)
| 2017 includes a fair value step-up adjustment to acquired inventory in cost of sales of $7,245$7.2 million pre-tax ($5,2375.2 million after-tax, or $0.30 per diluted share), pre-tax acquisition costs, restructuring charges and a pension settlement charge in selling and administrative expense of $10,560, $10,519$10.6 million, $10.5 million and $6,373,$6.4 million, respectively ($9,748, $7,5599.7 million, $7.6 million and $4,020$4.0 million after-tax, or $0.55, $0.43 and $0.23 per diluted share, respectively). 2017 also includes pre-tax acquisition-related financing costs and acquisition costs in total other expense, net of $7,378$7.4 million and $814,$0.8 million, respectively ($4,6194.6 million and $660$0.7 million after-tax, or $0.26 and $0.04 per diluted share, respectively). In addition, 2017 net loss attributable to Tennant Company includes a $2.4 million net income tax expense ($0.14 per diluted share) as a result of the impacts of the 2017 tax reform legislation. |
$0.26 and $0.04 per diluted share, respectively). In addition, 2017 net loss attributable to Tennant Company includes a $2,388 net income tax expense ($0.14 per diluted share) as a result of the impacts of the 2017 tax reform legislation.
| |
(3)(4)
| 2015 includes restructuring charges of $3,744$3.7 million pre-tax ($3,0953.1 million after-tax or $0.17 per diluted share) and a non-cash impairment of long-lived assets of $11,199$11.2 million pre-tax ($10,82210.8 million after-tax or $0.58 per diluted share). |
| |
(4)(5)
| On January 1, 2018, we adopted ASUAccounting Standards Update (ASU) No. 2017-07, Compensation—Retirement Benefits (Topic 715): Improving the Presentation of Net Periodic Pension Cost and Net Periodic Postretirement Benefit Cost. The components of net pension and postretirement benefit costs, except for service costs, are required to be presented in the Condensed Consolidated Statements of Operations separately from the service cost component in nonoperating expenses. See Note 2. |
| |
(5)(6)
| 2017 was revisedOn January 1, 2018, we adopted ASU No. 2014-9, Revenue from Contracts with Customers,(Topic 606) using the modified retrospective adoption approach. Our adoption of this ASU did not have a material impact to Net Sales. However, the adoption did result in an increase in Total Assets of $1.3 million at December 31, 2018. Periods prior to 2018 have not been restated for misclassifications as discussedthe adoption of this standards update. |
| |
(7) | On January 1, 2019, we adopted ASU No. 2016-02, Leases (Topic 842), using the modified retrospective adoption approach. Our adoption of this ASU resulted in an increase to Total Assets. The impact at December 31, 2019 is disclosed in Note 3.15 to the Consolidated Financial Statements. Periods prior to 2019 have not been restated for the adoption of this standards update. |
ITEM 7 – Management’s Discussion and Analysis of Financial Condition and Results of Operations
Overview
TennantThe Company is a world leader in designing, manufacturing and marketing solutions that empower customers to achieve quality cleaning performance, reduce environmental impact and help create a cleaner, safer, healthier world. TennantThe Company is committed to creating and commercializing breakthrough, sustainable cleaning innovations to enhance its broad suite of products, including floor maintenance and outdoor cleaning equipment, detergent-free and other sustainable cleaning technologies, aftermarket parts and consumables, equipment maintenance and repair service, specialty surface coatings and asset management solutions. TennantOur products are used in many types of environments, including retail establishments, distribution centers, factories and warehouses, public venues such as arenas and stadiums, office buildings, schools and universities, hospitals and clinics, parking lots and streets, and more. Customers include contract cleaners to whom organizations outsource facilities maintenance, as well as businesses that perform facilities maintenance themselves. The companyCompany reaches these customers through the industry's largest direct sales and service organization and through a strong and well-supported network of authorized distributors worldwide.
Historical Results
The following table compares the historical results of operations for the years ended December 31, 2019, 2018 2017 and 20162017 in dollars and as a percentage of Net Sales (in thousands,millions, except per share amounts and percentages):
| | | | 2018 | | % | | 2017 | | % | | 2016 | | % | 2019 | | % | | 2018 | | % | | 2017 | | % |
| Net Sales | $ | 1,123,511 |
| | 100.0 |
| | $ | 1,003,066 |
| | 100.0 |
| | $ | 808,572 |
| | 100.0 |
| $ | 1,137.6 |
| | 100.0 |
| | $ | 1,123.5 |
| | 100.0 |
| | $ | 1,003.1 |
| | 100.0 |
|
| Cost of Sales | 678,478 |
| | 60.4 |
| | 603,253 |
| | 60.1 |
| | 456,977 |
| | 56.5 |
| 675.9 |
| | 59.4 |
| | 678.5 |
| | 60.4 |
| | 603.3 |
| | 60.1 |
|
| Gross Profit | 445,033 |
| | 39.6 |
| | 399,813 |
| | 39.9 |
| | 351,595 |
| | 43.5 |
| 461.7 |
| | 40.6 |
| | 445.0 |
| | 39.6 |
| | 399.8 |
| | 39.9 |
|
| Operating Expense: | | | | | | | | | | | | | | | | | | | | | | |
| Research and Development Expense | 30,739 |
| | 2.7 |
| | 32,013 |
| | 3.2 |
| | 34,738 |
| | 4.3 |
| 32.7 |
| | 2.9 |
| | 30.7 |
| | 2.7 |
| | 32.0 |
| | 3.2 |
|
| Selling and Administrative Expense | 356,316 |
| | 31.7 |
| | 334,782 |
| | 33.4 |
| | 248,592 |
| | 30.7 |
| 357.2 |
| | 31.4 |
| | 356.3 |
| | 31.7 |
| | 334.8 |
| | 33.4 |
|
| Total Operating Expense | 387,055 |
| | 34.5 |
| | 366,795 |
| | 36.6 |
| | 283,330 |
| | 35.0 |
| 389.9 |
| | 34.3 |
| | 387.0 |
| | 34.5 |
| | 366.8 |
| | 36.6 |
|
| Profit from Operations | 57,978 |
| | 5.2 |
| | 33,018 |
| | 3.3 |
| | 68,265 |
| | 8.4 |
| 71.8 |
| | 6.3 |
| | 58.0 |
| | 5.2 |
| | 33.0 |
| | 3.3 |
|
| Other Income (Expense): | | | | | | | | | | | | | | | | | | | | | | |
| Interest Income | 3,035 |
| | 0.3 |
| | 2,405 |
| | 0.2 |
| | 330 |
| | — |
| 3.3 |
| | 0.3 |
| | 3.0 |
| | 0.3 |
| | 2.4 |
| | 0.2 |
|
| Interest Expense | (23,342 | ) | | (2.1 | ) | | (25,394 | ) | | (2.5 | ) | | (1,279 | ) | | (0.2 | ) | (21.1 | ) | | (1.9 | ) | | (23.3 | ) | | (2.1 | ) | | (25.4 | ) | | (2.5 | ) |
| Net Foreign Currency Transaction Losses | (1,100 | ) | | (0.1 | ) | | (3,387 | ) | | (0.3 | ) | | (392 | ) | | — |
| (0.7 | ) | | (0.1 | ) | | (1.1 | ) | | (0.1 | ) | | (3.4 | ) | | (0.3 | ) |
| Other Expense, Net | (729 | ) | | (0.1 | ) | | (7,934 | ) | | (0.8 | ) | | (433 | ) | | (0.1 | ) | 0.7 |
| | 0.1 |
| | (0.8 | ) | | (0.1 | ) | | (7.9 | ) | | (0.8 | ) |
| Total Other Expense, Net | (22,136 | ) | | (2.0 | ) | | (34,310 | ) | | (3.4 | ) | | (1,774 | ) | | (0.2 | ) | (17.8 | ) | | (1.6 | ) | | (22.2 | ) | | (2.0 | ) | | (34.3 | ) | | (3.4 | ) |
| Profit (Loss) Before Income Taxes | 35,842 |
| | 3.2 |
| | (1,292 | ) | | (0.1 | ) | | 66,491 |
| | 8.2 |
| 54.0 |
| | 4.7 |
| | 35.8 |
| | 3.2 |
| | (1.3 | ) | | (0.1 | ) |
| Income Tax Expense | 2,304 |
| | 0.2 |
| | 4,913 |
| | 0.5 |
| | 19,877 |
| | 2.5 |
| 8.1 |
| | 0.7 |
| | 2.3 |
| | 0.2 |
| | 4.9 |
| | 0.5 |
|
| Net Earnings (Loss) Including Noncontrolling Interest | 33,538 |
| | 3.0 |
| | (6,205 | ) | | (0.6 | ) | | 46,614 |
| | 5.8 |
| 45.9 |
| | 4.0 |
| | 33.5 |
| | 3.0 |
| | (6.2 | ) | | (0.6 | ) |
| Net Earnings (Loss) Attributable to Noncontrolling Interest | 126 |
| | — |
| | (10 | ) | | — |
| | — |
| | — |
| 0.1 |
| | — |
| | 0.1 |
| | — |
| | — |
| | — |
|
| Net Earnings (Loss) Attributable to Tennant Company | $ | 33,412 |
| | 3.0 |
| | $ | (6,195 | ) | | (0.6 | ) | | $ | 46,614 |
| | 5.8 |
| $ | 45.8 |
| | 4.0 |
| | $ | 33.4 |
| | 3.0 |
| | $ | (6.2 | ) | | (0.6 | ) |
| Net Earnings (Loss) Attributable to Tennant Company per Share - Diluted | $ | 1.82 |
| | | | $ | (0.35 | ) | | |
| | $ | 2.59 |
| | |
| $ | 2.48 |
| | | | $ | 1.82 |
| | |
| | $ | (0.35 | ) | | |
|
Net Sales
Net Sales in 20182019 totaled $1,123.5$1,137.6 million, a 12.0%1.3% increase as compared to Net Sales of $1,003.1$1,123.5 million in 2017.2018.
The components of the consolidated Net Sales change for 2019 as compared to 2018, and 2018 as compared to 2017, and 2017 as compared to 2016, were as follows:
|
| | | |
| Growth Elements | 2018 v. 2017 | | 2017 v. 2016 |
| Organic Growth: | | | |
| Volume | 3.9% | | (0.1%) |
| Price | 1.6% | | 1.5% |
| Organic Growth | 5.5% | | 1.4% |
| Foreign Currency | 0.3% | | 0.5% |
| Acquisitions | 6.2% | | 22.2% |
| Total | 12.0% | | 24.1% |
|
| | | |
| | 2019 v. 2018 | | 2018 v. 2017 |
| Organic Net Sales | 2.2% | | 5.5% |
| Foreign Currency | (2.2%) | | 0.3% |
| Acquisitions | 1.3% | | 6.2% |
| Total | 1.3% | | 12.0% |
The 1.3% increase in consolidated Net Sales for 2019 as compared to 2018 was driven by:
| |
| • | Organic sales increased approximately 2.2% which excludes the effects of foreign currency translation exchange and acquisitions. The organic sales increase was primarily driven by growth in the Americas in the strategic account channel, industrial equipment, service and parts and consumables in North America and broad-based growth in Latin America. The organic sales increases were partially offset by a decrease in our EMEA region from general market weakness across the entire region and a decline in the APAC region due to broad-based distribution softness in China. |
1.3% from the acquisition of Gaomei.
An unfavorable impact from foreign currency exchange of approximately (2.2%).
The 12.0% increase in consolidated Net Sales for 2018 as compared to 2017 was driven by:
Organic sales increased approximately 5.5% which excludes the effects of foreign currency translation exchange and acquisitions,primarily due to an approximate 3.9% volume increase and a 1.6% price increase.The volume increase was driven by growth in all geographic regions, with particular strength in the Americas from higher sales of commercial equipment in the strategic account channel. Strong organic sales in Germany and France and strength in China and Australia also contributed to the strong organic sales growth. The price increase was the result of selling price increases in most geographies, with an effective date of February 1, 2018. The impact to gross margin is estimated to be minimal as these selling price increases were taken to offset inflation.following:
| |
| • | Organic sales increased approximately 5.5% which excludes the effects of foreign currency translation exchange and acquisitions.The organic sales increase was driven by growth in all geographic regions, with particular strength in the Americas from higher sales of commercial equipment in the strategic account channel. Strong organic sales in Germany and France and strength in China and Australia also contributed to the strong organic sales growth. |
6.2% from the full year impact of the April 2017 acquisition of the IPC Group.
A favorable impact from foreign currency exchange of approximately 0.3%.
The 24.1% increase in consolidated Net Sales for 2017 as compared to 2016 was primarily due to the following:
| |
• | 22.2% from the April 2017 acquisition of the IPC Group and the expansion of our commercial floor coatings business through the August 2016 acquisition of the Florock® brand.
|
An organic sales increase of approximately 1.4% which excludes the effects of foreign currency exchange and acquisitions, due to an approximate 1.5% price increase, partially offset by a volume decrease of 0.1%. The price increase was the result of selling price increases, typically in the range of 2% to 4% in most geographies, with an effective date of February 1, 2017. The impact to gross margin was minimal as these selling price increases were taken to offset inflation. The slight volume decrease was primarily due to increased sales in Latin America and EMEA being more than offset by volume decreases in North America. Sales of new products introduced from 2015 to 2017 totaled 48% of equipment revenue in 2017. This compares to 37% of equipment revenue in 2016 from sales of new products introduced from 2014 to 2016.
A favorable impact from foreign currency exchange of approximately 0.5%.
The following table sets forth annual Net Sales by geographic area and the related percentage change from the prior year (in thousands,millions, except percentages):
|
| | | | | | | | | | | | | | | | | |
| | 2019 | | % | | 2018 | | % | | 2017 |
| Americas | $ | 722.4 |
| | 4.5 |
| | $ | 691.0 |
| | 7.9 |
| | $ | 640.3 |
|
| Europe, Middle East and Africa | 307.6 |
| | (8.3 | ) | | 335.6 |
| | 22.6 |
| | 273.7 |
|
| Asia Pacific | 107.6 |
| | 11.0 |
| | 96.9 |
| | 8.8 |
| | 89.1 |
|
| Total | $ | 1,137.6 |
| | 1.3 |
| | $ | 1,123.5 |
| | 12.0 |
| | $ | 1,003.1 |
|
Americas – In 2019, Americas Net Sales increased 4.5% to $722.4 million as compared with $691.0 million in 2018. The divestiture of our Waterstar business in the second half of 2018 had an unfavorable impact of 0.3% on Net Sales. In addition, an unfavorable impact of foreign currency translation exchange effects within the Americas impacted Net Sales by approximately 0.8% in 2019. As a result, organic sales growth in the Americas favorably impacted Net Sales by approximately 5.6% due to higher strategic
|
| | | | | | | | | | | | | | | | | |
| | 2018 | | % | | 2017 | | % | | 2016 |
| Americas | $ | 690,996 |
| | 7.9 |
| | $ | 640,274 |
| | 5.5 |
| | $ | 607,026 |
|
| Europe, Middle East and Africa | 335,603 |
| | 22.6 |
| | 273,738 |
| | 112.1 |
| | 129,046 |
|
| Asia Pacific | 96,912 |
| | 8.8 |
| | 89,054 |
| | 22.8 |
| | 72,500 |
|
| Total | $ | 1,123,511 |
| | 12.0 |
| | $ | 1,003,066 |
| | 24.1 |
| | $ | 808,572 |
|
Americas – In 2018, Americas Net Sales increased 7.9% to $691.0 million as compared with $640.3 million in 2017. The direct impact of the second quarter 2017 acquisition of the IPC Group favorably impacted Net Sales by approximately 1.1%. In addition, an unfavorable impact of foreign currency translation exchange effects within the Americas impacted Net Sales by approximately 0.7% in 2018. As a result, organic sales growth in the Americas favorably impacted Net Sales by approximately 7.5% due to strong equipment sales in North America resulting from increases in all channels, particularly strategic accounts and the distribution channel. The Americas also experienced increased parts and service sales in 2018 as well as strong sales in Latin America, particularly Brazil.
In 2017, AmericasEurope, Middle East and Africa – EMEA Net Sales increased 5.5%in 2019 decreased 8.3% to $640.3$307.6 million as compared with $607.0 million in 2016. The direct impact of the IPC Group and Florock acquisitions favorably impactedto 2018 Net Sales by approximately 4.4%.of $335.6 million. In addition, a favorable direct2019,the unfavorable impact of foreign currency translation exchange effects within the AmericasEMEA impacted Net Sales by approximately 0.4% in 2017.4.5%. As a result, organic sales growthin EMEA decreased by approximately 3.8% due to general market weakness in the Americas favorably impacted Net Salesregion, primarily driven by approximately 0.7% due to strong sales performancedeclines in Latin America, particularly BrazilFrance, the United Kingdom, Germany and Mexico, from focused go-to-market strategies in our direct channel. This was partially offset by lower sales in North America, where sales growth through the distribution channel were more than offset by service sales.Central Europe and Middle Eastern markets.
Europe, Middle East and Africa – EMEA Net Sales in 2018 increased 22.6% to $335.6 million as compared to 2017 Net Sales of $273.7 million. In 2018,the direct impact of the second quarter 2017 acquisition of the IPC Group favorably impacted Net Sales by approximately 18.2%. In addition, a favorable impact of foreign currency translation exchange effects within EMEA impacted Net Sales by approximately 3.0% in 2018. As a result, organic sales growth in EMEA favorably impacted Net Sales by approximately 1.3% due to strong growth in Germany and France, partially offset by challenging comparable sales performance in Italy.
EMEAAsia Pacific – APAC Net Sales in 20172019 increased 112.1%11.0% to $273.7$107.6 million as compared to 20162018 Net Sales of $129.0$96.9 million. In 2017, the2019, the direct impact of the IPC Group acquisition of Gaomei favorably impacted Net Sales by approximately 105.3%16.3%. In addition, a favorablean unfavorable direct impact of foreign currency translation exchange effects within EMEAAPAC impacted Net Sales by approximately 1.3%3.5% in 2017.2019. As a result, organic sales growth in EMEA favorably impacted Net Sales in 2017APAC decreased by approximately 5.5%1.7% primarily due to strong sales growthdeclines in most European countries from strong demand in both the direct and distributor channels beingChina distribution business, partially offset by lower sales ingrowth across the UK.other APAC markets.
Asia Pacific – APAC Net Sales in 2018 increased 8.8% to $96.9 million as compared to 2017 Net Sales of $89.1 million. In 2018,, the direct impact of the second quarter 2017 acquisition of the IPC Group favorably impacted Net Sales by approximately 6.3%. In addition, an unfavorable direct impact of foreign currency translation exchange effects within APAC impacted Net Sales by approximately 0.6% in 2018. As a result, organic sales growth in APAC favorably impacted Net Sales by approximately 3.2% primarily due to sales growth in China, India and Australia from strong commercial and industrial product sales through the direct and strategic account channels slightly offset by sales declines in Japan and Korea.
APAC Net Sales in 2017 increased 22.8% to $89.1 million as compared to 2016 Net Sales of $72.5 million. In 2017, the direct impact of the IPC Group acquisition favorably impacted Net Sales by approximately 22.7%. In addition, a favorable direct impact of foreign currency translation exchange effects within APAC impacted Net Sales by approximately 0.1% in 2017. As a result, organic sales growth in APAC was essentially flat due to sales growth in China from strong sales through the direct and distributor channels being offset by sales declines primarily in Korea and Singapore resulting from a challenging economic environment.
Gross Profit
Gross Profit margin was 40.6%, or 100 basis points higher in 2019 compared to 2018. Gross Profit margin was favorably impacted by pricing actions during the year in addition to cost reduction initiatives and favorable product mix. The favorable impacts were partially offset by higher material and labor costs, including the impact from higher tariffs, as well as an impact of $3.3 million from the discontinuation of the Green Machines, Orbio and outdoor product lines and a $0.9 million fair value inventory step-up related to our acquisition of Gaomei in 2019.
Gross Profit margin was 39.6%, or 2530 basis points lower in 2018 compared to 2017. Gross Profit margin was unfavorably impacted by manufacturing productivity issues associated with raw material and labor
shortages, robust strategic account sales which negatively impacted our mix, higher freight costs and negative impacts from tariffs. The unfavorable Gross Profit margin impacts were partially offset by improved operational performance in both manufacturing and service as well as favorable pricing in North America and EMEA. In addition, Gross Profit margin was favorably impacted by a $7.2 million or approximately 70 basis points, fair value inventory step-up flow through related to our acquisition of the IPC Group in 2017 that did not repeat in 2018.
Gross Profit margin was 390 basis points lower in 2017 compared to 2016 due primarily to the $7.2 million, or approximately 70 basis points, fair value inventory step-up flow through related to our acquisition of the IPC Group and field service productivity challenges related to a high number of open service trucks of $5.1 million, or approximately 50 basis points. In addition, Gross Profit margin was unfavorably impacted by mix of sales by channel and region, primarily resulting from higher sales through the distribution in North America and lower gross margins from the IPC Group. The near-term unfavorable impacts from investments in manufacturing automation initiatives and high levels of raw material cost inflation also contributed to lower Gross Profit margin in 2017.
Operating Expenses
Research and Development Expense – TennantThe Company continues to invest in innovative product development with 2.7%2.9% of 20182019 Net Sales spent on Research and Development ("R&D"). We continue to invest in developing innovative new products and technologies and the advancement of detergent-free products, fleet management, autonomous vehicles and other sustainable technologies. New products and product variants launched in 20182019 included the T600 seriesM17 sweeper-scrubber and T17 scrubber.
R&D Expense increased $2.0 million, or 6.4%, in 2019 as compared to 2018. As a percentage of scrubbersNet Sales, 2019 R&D Expense increased 14 basis points compared to the prior year. The increase in R&D as a percentage of sales reflects the timing of project spend in 2019 and headcount additions to continue to support our first autonomous floor care machine.initiatives in order to propel our clear technology leadership position.
R&D Expense decreased $1.3 million, or 4.0%, in 2018 as compared to 2017. As a percentage of Net Sales, 2018 R&D Expense decreased 46 basis points compared to the prior year. The decrease in R&D as a percentage of sales reflects the impact of higher revenue in 2018 and the timing of anticipated project spend in 2018, including investment in our strategic relationship with Brain Corp., to accelerate development of our autonomous floor cleaning technology. We continue to invest in R&D at levels necessary to propel our clear technology leadership position.
R&D Expense decreased $2.7 million, or 7.8%, in 2017 as compared to 2016. As a percentage of Net Sales, 2017 R&D Expense decreased 110 basis points compared to the prior year. The decrease in R&D spending was primarily due to headcount reduction related to the first quarter 2017 restructuring action.
Selling and Administrative Expense – Selling and Administrative Expense ("S&A Expense") increased by $0.9 million, or 0.3%, in 2019 compared to 2018. As a percentage of Net Sales, 2019 S&A Expense decreased 30 basis points to 31.4% from 31.7% in 2018. The primary drivers of the increase from 2018 were approximately $5.9 million of Gaomei-related S&A Expense, a $3.5 million increase in restructuring costs and a $3.4 million increase in compensation-related expenses. These increases were mostly offset by $3.9 million lower acquisition and integration expenses as well as cost containment efforts, including a $7.0 million decrease in professional services.
S&A Expense increased by $21.5 million, or 6.4%, in 2018 compared to 2017. As a percentage of Net Sales, 2018 S&A Expense decreased 170 basis points to 31.7% from 33.4% in 2017. The primary drivers of the increase in spending were approximately $18.3 million of IPC-related S&A expenseExpense due to an additional quarter in 2018 and $12.6 million in compensation-related expenses. These increases were partially offset by a decrease of $9.5 million in restructuring costs from 2017 to 2018.
Selling and Administrative Expense ("S&A Expense") increased by $86.2 million, or 34.7%, in 2017 compared to 2016. As a percentage of Net Sales, 2017 S&A Expense increased 270 basis points to 33.4% from 30.7% in 2016. S&A Expense was unfavorably impacted by $15.7 million and $10.6 million of amortization expense and acquisition costs, respectively, related to our acquisition of the IPC Group. In addition, S&A Expense was unfavorably impacted by $10.5 million of restructuring charges taken in the 2017 first and fourth quarters.
Total Other Expense, Net
Interest Income – Interest Income was $3.3 million in 2019, an increase of $0.3 million from 2018. The increase between 2019 and 2018 was primarily due to interest income related to foreign currency swap activities.
Interest Income was $3.0 million in 2018, an increase of $0.6 million from 2017. The increase between 2018 and 2017 was primarily due to an extra quarter of interest income related to foreign currency swap activities.
Interest IncomeExpense – Interest Expense was $2.4$21.1 million in 2017, an increase of $2.12019, as compared to $23.3 million from 2016.in 2018. The increase between 2017 and 2016lower Interest Expense in 2019 was primarily due to interest income relatedcarrying a lower level of debt on our Consolidated Balance Sheets due to foreign currency swap activities.debt paydowns, as further described in the Liquidity and Capital Resources section that follows.
Interest Expense – Interest Expense was $23.3 million in 2018, as compared to $25.4 million in 2017. The lower Interest Expense in 2018 was primarily due to carrying a lower level of debt on our Consolidated Balance Sheets due to debt paydowns, as further described in the Liquidity and Capital Resources section that follows.
Interest Expense was $25.4 million in 2017, as compared to $1.3 million in 2016. The higher Interest Expense in 2017 was primarily due to carrying a higher level of debt on our Consolidated Balance Sheets related to our acquisition activities, as well as a $6.2 million charge to expense the debt issuance costs for loans which were refinanced or repaid, as further described in the Liquidity and Capital Resources section that follows.
Net Foreign Currency Transaction Losses –Net Foreign Currency Transaction Losses were $0.7 million in 2019 as compared to $1.1 million of losses in 2018. The favorable change in the impact from foreign currency transactions in 2019 was primarily due to fluctuations in foreign currency rates, specifically between the Canadian dollar, Mexican peso and the U.S. dollar, and settlements of transactional hedging activity in the normal course of business.
Net Foreign Currency Transaction Losses were $1.1 million in 2018 as compared to losses of $3.4 million in 2017. The favorable change in the impact from foreign currency transactions in 2018 was primarily due to fluctuations in foreign currency rates, specifically between the Euro,euro, Brazilian real and the U.S. dollar, and settlements of transactional hedging activity in the normal course of business. Additionally an unfavorable $1.1 million mark-to-market adjustment of a foreign exchange call option was recorded in 2017 that did not recur in 2018. This instrument was held in connection with our acquisition of the IPC Group in April 2017.
Other Income (Expense), Net Foreign Currency Transaction Losses were $3.4– Other Income (Expense), Net was $0.7 million income in 20172019 as compared to $0.4$0.8 million expense in 2016.2018. The unfavorablefavorable change in the impact from foreign currency transactions in 2017 was primarily due to fluctuations in foreign currency rates, specifically between the Euro and U.S. dollar, settlements of transactional hedging activity in the normal course of business and a $1.1 million mark-to-market adjustment of a foreign exchange call option, an instrument held in connection with our acquisition of the IPC Group in April 2017.
Other Expense, Net – Other Expense,Income (Expense), Net was $0.7due primarily to a $1.8 million acquisition-related indemnification settlement that occurred in 2019.
Other Income (Expense), Net was $0.8 million expense in 2018 as compared to $7.9 million expense in 2017. The favorableunfavorable change in Other Expense,Income (Expense), Net was due primarily to a pension settlement loss of $6.4 million in 2017 that did not recur in 2018.
Other Expense, Net was $7.9 million in 2017 as compared to $0.4 million in 2016. The unfavorable change in Other Expense, Net was due primarily to a pension settlement loss of $6.4 million and additional expense recorded as a result of the acquisition of the IPC Group.16
Income Taxes
The overall effective income tax rate was 15.1%, 6.4%, and (380.2)% in 2019, 2018 and 29.9% in 2018, 2017, and 2016, respectively.
The expense for 20182019 included a $1.5$2.8 million tax benefit associated with $6.9$10.7 million of acquisition and integration-related costs associated with our integration of the IPC Group and pending acquisition of Gaomei Cleaning Equipment Company, a $0.2 million tax benefit associated with $1.0 million of restructuring charge, a $0.4 million tax benefit associated with $1.6 million of building design costs, a $0.5 million tax benefit associated with $1.9 million of costs related to non-operational professional service fees, a $0.2 million tax expense associated with a $1.0 million gain on the sale of assets of our Waterstar business, a $0.9 million benefit associated with an acquisition tax adjustment, and a $0.4 million benefit related to finalizing the income tax effect of the one-time transition tax on certain unrepatriated earnings. These special itemsnon-recurring expenses, which impacted the 2018 effective tax rate by (6.2%)(2.1)%.
Our effective tax rate fluctuates from year to year due to the global nature of our operations. The effective tax rate changeincreased to 15.1% in 2019 from 2017 was6.4% in 2018 primarily due to the lower corporate tax rate provided by the Tax Act beginning in the first quarter of 2018, the mix in full year taxable earnings by country, the tax expense benefit related to the exercise of soon-to-expire stock options and a favorable tax ruling from the Italian tax authorities related to the deductibility of interest expense in Italy.
On December 22, 2017, legislation popularly referredItaly received in 2018, and fewer tax benefits related to as the Tax Act was enacted, resulting in significant changes from previous tax law, including, but not limited to, requiring a one-time transition tax on certain unrepatriated earningsexercise of foreign subsidiaries and a reduction in the U.S. federal corporatesoon-to-expire stock options, partially offset by income tax rate from 35%benefits related to 21% and established new laws that impacted 2018.
ASC 740 requires a company to record the effects of a tax law change in valuation allowances in The Netherlands and the period of enactment. ASU 2018-05 allowed a company to record a provisional amount when it did not have the necessary information available, prepared or analyzed in reasonable detail to complete its accounting for the change in the law. The measurement period ends when the company has obtained, prepared and analyzed the information necessary to finalize its accounting, but cannot extend beyond one year.
During the third quarter of 2018, the accounting for the remeasurement of the deferred taxes and transition tax was finalized. Adjustments to the provisional amounts were not material to the consolidated financial statements. The accounting for the income tax effects of the Tax Act is complete as of December 31, 2018.U.S.
The tax expense for 20172018 included a $3.7$3.5 million tax benefit associated with $18.8$10.3 million of acquisition and financing costs related to the IPC Group acquisition, a $3.0 million tax benefit associated with a $10.5 million restructuring charge, a $2.4 million tax benefit associated with a $6.2 million pension settlement, a $2.0 million tax benefit associated with $7.2 million of expense related to inventory step-up amortization, a $2.0 million tax expense related to the write-down of net U.S. deferred tax assets at the lower enacted tax rates and $0.4 million tax expense related to the transition tax on cash and cash equivalent balances related to accumulated earnings associated with our international operations as a result of Tax Legislation. These special itemsnon-recurring expenses, which impacted the 2017 year-to-date overall effective tax rate by 412.9%(6.2)%.
Excluding the 2017 special items and the effect of the Tax Act, the tax rate increased from 29.9% in 2016 due primarily to the mix in full year taxable earnings by country.
There were no special items that affected the tax rate in 2016.
Other Comprehensive Income (Loss)
Foreign Currency Translation Adjustments– For the years ended December 31, 20182019 and 2017,2018, we recorded a pre-tax foreign currency translation loss of $16.2$4.5 million and a gainloss of $28.4$16.2 million, respectively. For the year ended December 31, 2016, we recorded pre-tax foreign currency translation gains of $0.1 million in Other Comprehensive Income (Loss). These adjustments resulted from translating the financial statements of our non-U.S. dollar functional currency subsidiaries into our reporting currency, which is the U.S. dollar, as well as other adjustments permitted by ASC 830 –Foreign Currency Matters.foreign currency accounting rules.
During 2019, we recorded a pre-tax currency translation loss of $4.5 million. These adjustments were caused primarily by the strengthening of the U.S. dollar to most currencies. In 2019, the U.S. dollar strengthened by approximately 2% to the euro, 1% to the Chinese renminbi, and approximately 3% to the Brazilian real.
During 2018, we recorded a pre-tax currency translation loss of $16.2 million.$16.2 million. These adjustments were caused primarily by the strengthening of the U.S. dollar to most currencies. In 2018, the U.S. dollar strengthened by approximately 5% to the Euroeuro and approximately 15% to the Brazilian Real.real.
During 2017, we recorded pre-tax currency translation gains of $28.4 million. These adjustments were caused primarily by the appreciation of the Euro against the U.S. dollar. In 2017, the Euro appreciated against the U.S. dollar by approximately 14%.
During 2016, we recorded translation gains of $3.4 million relating to the Brazilian real, and translation losses of $1.3 million for the Euro, $1.0 million for the Chinese renminbi, $0.9 million for the British pound and $0.1 million for various other currencies. These adjustments were caused by the appreciation of the U.S. dollar against these currencies of between 3% and 17%, and the strengthening of the Brazilian real of 22% in 2016.
Pension and RetireePostretirement Medical Benefits – The summarized changes in Accumulated Other Comprehensive Loss for the three years ended December 31 were as follows:
| | | | Pension and Postretirement Medical Benefits | Pension and Postretirement Medical Benefits |
| | 2018 | 2017 | 2016 | 2019 | 2018 | 2017 |
| Prior Service Costs | $ | 109 |
| $ | — |
| $ | — |
| $ | — |
| $ | 0.1 |
| $ | — |
|
| Net actuarial (gain) loss | (1,699 | ) | 622 |
| 2,357 |
| 0.4 |
| (1.7 | ) | 0.6 |
|
| Amortization of prior service cost | (19 | ) | — |
| (41 | ) | |
| Amortization of net actuarial loss | (87 | ) | (117 | ) | (68 | ) | 0.1 |
| (0.1 | ) | (0.1 | ) |
| Settlement Charge | (49 | ) | (6,373 | ) | — |
| — |
| — |
| (6.4 | ) |
| Total recognized in other comprehensive (income) loss | $ | (1,745 | ) | $ | (5,868 | ) | $ | 2,248 |
| $ | 0.5 |
| $ | (1.7 | ) | $ | (5.9 | ) |
The $0.5 million loss in 2019 was primarily due to a $0.4 million actuarial loss relating to an annual actuarial analysis resulting from a 94 basis point decrease in the U.S. pension discount rate, a 69 basis point decrease in the non-U.S. discount rate and an 89 basis point increase in the postretirement discount rate.
The $1.7 million gain in 2018 was primarily due to a $1.7 millionan actuarial gain relating to an annual actuarial analysis resulting from a 67 basis point increase in the U.S. pension discount rate, a 27 basis point increase in the non-U.S. discount rate and a 69 basis point increase in the postretirement discount rate.
The $5.9 million gain in 2017 was primarily due to a $6.4 million settlement charge related to the termination of the U.S. Pension Plan and a $0.1 million credit related to amortization of accumulated actuarial losses. These gains were partially offset by $0.6 million of net actuarial losses relating to an increase of $1.2 million in the pension benefit obligation in 2017 due to changes in demographic experience and other changes, a $0.6 million increase in the pension benefit obligation resulting from a 64 basis point decrease in the U.S. pension discount rate, a 19 basis point decrease in the non-U.S. discount rate and a 32 basis point decrease in the postretirement discount rates and a $1.0 million decrease in the pension benefit obligation due to a higher than expected actual return on assets.
The $2.2 million loss in 2016 was primarily due to a $2.4 net actuarial loss relating to an increase of $3.2 million in the projected benefit obligation resulting from a 16 basis point decrease in the U.S. pension discount rate, a 95 basis point decrease in the non-U.S. discount rate and a 12 basis point
decrease in the postretirement discount rate. There was an approximate $0.6 million decrease in the pension benefit obligation in 2016 relating to demographic experience and other changes, as well as a $0.2 million decrease due to a higher than expected actual return on assets. The net actuarial loss was partially offset by a $0.1 million credit relating to amortization of accumulated actuarial losses and prior service costs.
Cash Flow Hedging – For the years ended December 31, 20182019 and 2017,2018, we recorded pre-tax adjustments on cash flow hedge financial instruments of a gain of $1.3$4.6 million and a lossgain of $7.7$1.3 million, respectively, in Other Comprehensive Income (Loss) as further disclosed in Note 13 11 to the Company's Consolidated Financial Statements. For
The $4.6 million gain in 2019 was primarily due to the year endedDecember 31, 2016, we recordedstrengthening of the U.S. dollar relative to the euro, partially offset by a pre-tax lossweakening of $0.3 million in Other Comprehensive Income (Loss) for these items.the U.S. dollar relative to the Canadian dollar. During 2019, the U.S. dollar strengthened approximately 2% to the euro and weakened approximately 5% to the Canadian dollar.
The $1.3 million gain in 2018 was primarily due to the strengthening of the U.S. dollar relative to the Canadian dollar and Euro. During 2018, the U.S. dollar strengthened approximately 8% to the Canadian dollar and approximately 5% to the Euro.
The $7.7 million loss in 2017 was primarily due to $26.2 million of losses recognized primarily as a result of our Euro to U.S. dollar foreign exchange cross currency swaps to mitigate our Euro exposure on our cash flows associated with an intercompany loan from a wholly-owned European subsidiary. The loss was partially offset by $18.5 of losses reclassified from Accumulated Other Comprehensive Loss to the Consolidated Statements of Earnings.
The $0.3 million pre-tax loss in 2016 was driven by our cash flow exposure to the Canadian dollar resulting from changes in this currency relative to the U.S. dollar.
euro.
Liquidity and Capital Resources
Liquidity – Cash, and Cash Equivalents and Restricted Cash totaled $85.6$74.6 million at December 31, 2018,2019, as compared to $58.4$86.1 million as of December 31, 2017.2018. Cash, and Cash Equivalents and Restricted Cash held by our foreign subsidiaries totaled $45.7 million as of December 31, 2019, as compared to $59.2 million as of December 31, 2018, as compared to $39.1 million as of December 31, 2017.2018. Wherever possible, cash management is centralized and intercompany financing is used to provide working capital to subsidiaries as needed. Our current ratio was 1.7 as of December 31, 2019, and 1.9 as of December 31, 2018, and 1.8 as of December 31, 2017, and our working capital was $206.1 million and $219.8 million, and $186.6 million, respectively.
Our Debt-to-Capital ratio was 48.5% as of December 31, 2019, compared with 53.0% as of December 31, 2018, compared with 56.0% as of December 31, 2017.2018. Our capital structure was comprised of $355.1$338.8 million of Debt and $314.4$359.9 million of Tennant Company Shareholders’ Equity as of December 31, 2018.2019.
Operating Activities – Cash provided by operating activities was $80.0$71.9 million in 2019, $80.0 million in 2018 and $54.2 million in 20172017. In 2019, cash provided by operating activities was driven primarily by net earnings, after adding back non-cash items, and $57.9a $4.5 million increase in 2016. Employee Compensation and Benefits liabilities. These cash inflows were partially offset by cash outflows from a $21.1 million increase in Inventories to support future sales growth, an increase in Accounts Receivable of $8.5 million resulting from higher sales levels, the variety of payment terms offered and mix of business as well as a decrease in Accounts Payable of $7.5 million due to timing of payments.
In 2018, cash provided by operating activities was driven primarily by net earnings, after adding back non-cash items, a $12.6 million increase in Employee Compensation and Benefits liabilities and an increase in Accounts Payable of $4.6 million due to timing of payments. These cash inflows were partially offset by cash outflows resulting from an increase in Accounts Receivable of $7.6 million resulting from higher sales levels, the variety of payment terms offered and mix of business as well as a $16.6 million increase in Inventories to support future sales growth.
In 2017, cash provided by operating activities was driven primarily by net earnings, after adding back non-cash items, an increase in Other Current Liabilities of $14.6 million due to additional accruals recorded as a result of the IPC Group consolidation and the fourth quarter 2017 restructuring action and an increase in Accounts Payable of $10.8 million due to timing of payments. These cash inflows were partially offset by cash outflows resulting from an increase in Accounts Receivable of $14.4 million resulting from higher sales levels, the variety of payment terms offered and mix of business.
In 2016, cash provided by operating activities was driven primarily by net earnings, after adding back non-cash items, partially offset by an increase in Accounts Receivable of $9.3 million resulting from higher sales levels, particularly in December 2016, the variety of payment terms offered and mix of business.
Investing Activities – Net cash used in investing activities was $16.0$55.6 million in 2019, $16.1 million in 2018 and $375.3 million in 20172017. In 2019, we used $38.3 million for net capital expenditures. Net capital expenditures included investments in a new administrative building, information technology process improvement projects, tooling related to new product development and $40.6manufacturing equipment. In addition, we used $19.7 million in 2016. for the acquisition of the Gaomei, net of cash acquired.
In 2018, we used $18.7 million for net capital expenditures. Net capital expenditures included investments in information technology process improvement projects, tooling related to new product development and manufacturing equipment. We also used $2.8 million for the purchase of a technology license and other intangibles. In addition, we received $4.0 million in proceeds from the sale of assets of our Waterstar business.
In 2017, we used $354.1 million, net of cash acquired, in relation to our acquisition of the IPC Group and the final installment payment for the acquisition of the Florock brand and $17.9 million for net capital expenditures. Net capital expenditures included investments in information technology process improvement projects, tooling related to new product development and manufacturing equipment. We also used $2.5 million for the purchase of the distribution rights to sell the i-mop and $1.5 million as a result of a loan to i-team North America B.V., a joint venture that operates as a distributor of the i-mop in North America. The details regarding the joint venture and our distribution of the i-mop are described further in Note 5 to the Consolidated Financial Statements.
In 2016, we used $25.9 million for net capital expenditures. Net capital expenditures included investments in information technology process improvement projects, tooling related to new product development and manufacturing equipment. In addition, our acquisition of the Florock brand and the assets of Dofesa Barrdio Mecanizado, a long-time distributor based in Central Mexico, used $12.9 million, net of cash acquired. We also used $2.0 million as a result of a non-interest bearing cash advance to TCS EMEA GmbH, the master distributor of our products in Central Eastern Europe, Middle East and Africa.
Financing Activities – Net cash used in financing activities was $27.4 million in 2019. Net cash used in financing activities was $32.8 million in 2018.
Net cash provided by financing activities was $319.5$319.4 million in 2017. NetIn 2019, we made $41.8 million of Debt payments and dividend payments of $16.0 million. Our annual cash useddividend payout increased for the 48th consecutive year to $0.88 per share in financing activities was $9.6 million in 2016. In 2018,2019, an increase of $0.03 per share over 2018. These cash outflows were partially offset by proceeds from the incurrencecredit facility borrowings of Long-Term Debt associated with the pending Gaomei acquisition$25.0 million and proceeds from the issuance of Common Stock provided $11.0 million and $5.9 million, respectively. These cash inflows were partially offset byof $6.1 million.
In 2018, cash outflows resultingresulted from $38.3 million of Long-Term Debt payments and dividend payments of $15.3 million. Our annual cash dividend payout increased for the 47th consecutive year to $0.85 per share in 2018, an increase of $0.01 per share over 2017.
In 2017, These cash outflows were partially offset by proceeds from the incurrence of Long-Term Debt associated with the IPCGaomei acquisition, and the issuance of Common Stock provided $440.0of $11.0 million and $6.9$5.9 million, respectively. These cash inflows were partially offset by cash outflows resulting from $96.2 million of Long-Term Debt payments, $16.5 million related to payments of debt issuance costs and dividend payments of $15.0 million.
In 2016, dividend payments used $14.3 million, the purchases of our common stock per our authorized repurchase program used $12.8 million and the payment of Long-Term Debt used $3.5 million. These cash ouflows were partially offset by proceeds resulting from the incurrence of Long-Term Debt of $15.0 million, the issuance of Common Stock of $5.3 million and the excess tax benefit on stock plans of $0.7 million.
On October 31, 2016, the Board of Directors authorized the repurchase of an additional 1,000,000 shares of our common stock. At December 31, 2018,2019, there were 1,392,8921,392,263 remaining shares authorized for repurchase.
There were no shares repurchased in 2019, 2018 in the open market, no shares repurchased in 2017 and 246,474 shares repurchased during 2016, at average repurchase prices of $51.78 during 2016 .or 2017. Our 2017 Credit Agreement, as defined below, restricts
the payment of dividends or repurchasing of stock if, after giving effect to such payments and assuming no default exists or would result from such payment, our leverage ratio is greater than 2.50 to 1, in such case limiting such payments to an amount ranging from $50.0 million to $75.0 million during any fiscal year based on our leverage ratio after giving effect to such payment. Our Senior Notes due 2025 (the "Notes") also contain certain restrictions, which are generally less restrictive than those contained in the 2017 Credit Agreement.
Indebtedness – In order to finance the acquisition of the IPC Group, on April 4,During 2017, the Company and certain of our foreign subsidiaries entered into a Credit Agreement (the “2017 Credit Agreement”) with JPMorgan, as administrative agent, Goldman Sachs Bank USA, as syndication agent, Wells Fargo, National Association, U.S. Bank National Association, and HSBC Bank USA, National Association, as co-documentation agents, and the lenders (including JPMorgan) from time to time party thereto.
On April 18,Borrowings denominated in U.S. dollars under the 2017 we issuedCredit Agreement bear interest at a rate per annum equal to the adjusted London interbank offered rate ("LIBOR") for a one month period and sold $300,000,000 in aggregate principal amountdo not have fallback language for when LIBOR is no longer available. Uncertainty related to the LIBOR phase out at the end of 2021 may adversely impact the value of, and our 5.625% Senior Notes due 2025 (the “Notes”), pursuantobligations under, the 2017 Credit Agreement. We may need to an Indenture, dated as of April 18, 2017, amongrenegotiate our financial obligations that utilize LIBOR. The Company continues to assess and monitor regulatory developments during the company, the Guarantors (as defined therein), and Wells Fargo Bank, National Association, a national banking association, as trustee. The Notes are guaranteed by Tennant Coatings, Inc., and Tennant Sales and Service Company (collectively, the “Guarantors”), which are wholly-owned subsidiaries of the company.transition period.
For further details regarding our indebtedness, see Note 119 to the Consolidated Financial Statements.
Contractual Obligations – Our contractual obligations as of December 31, 2018,2019, are summarized by period due in the following table (in thousands)millions):
|
| | | | | | | | | | | | | | | | | | | |
| | Total | | Less Than 1 Year | | 1 - 3 Years | | 3 - 5 Years | | More Than 5 Years |
Long-term debt(1) | $ | 359,789 |
| | $ | 12,066 |
| | $ | 16,552 |
| | $ | 31,171 |
| | $ | 300,000 |
|
Interest payments on long-term debt(1) | 113,992 |
| | 19,234 |
| | 37,432 |
| | 34,545 |
| | 22,781 |
|
| Capital leases | 2,862 |
| | 1,264 |
| | 1,427 |
| | 171 |
| | — |
|
| Interest payments on capital leases | 210 |
| | 127 |
| | 80 |
| | 3 |
| | — |
|
Retirement benefit plans(2) | 1,319 |
| | 1,319 |
| | — |
| | — |
| | — |
|
Deferred compensation arrangements(3) | 5,120 |
| | 1,189 |
| | 1,532 |
| | 638 |
| | 1,761 |
|
Operating leases(4) | 40,151 |
| | 15,200 |
| | 14,508 |
| | 6,228 |
| | 4,215 |
|
Purchase obligations(5) | 53,844 |
| | 53,844 |
| | — |
| | — |
| | — |
|
Other(6) | 8,404 |
| | 8,404 |
| | — |
| | — |
| | — |
|
| Total contractual obligations | $ | 585,691 |
| | $ | 112,647 |
| | $ | 71,531 |
| | $ | 72,756 |
| | $ | 328,757 |
|
(1)Long-term debt represents borrowings through our Notes and the 2017 Credit Agreement with JPMorgan. Interest on the Notes accrues at the rate of 5.625% per annum and is payable semiannually in cash on each May 1 and November 1, commencing on November 1, 2017. Repayment of the principal amount of the Senior Notes is due upon expiration of the agreement in 2025. Interest payments on our 2017 Credit Agreement with JPMorgan were calculated using the December 31, 2017 30-day LIBOR rate plus a spread.
(2)Our retirement benefit plans, as described in Note 15 |
| | | | | | | | | | | | | | | | | | | |
| | Total | | Less Than 1 Year | | 1 - 3 Years | | 3 - 5 Years | | More Than 5 Years |
Long-term debt(1) | $ | 342.6 |
| | $ | 31.3 |
| | $ | 11.1 |
| | $ | 0.2 |
| | $ | 300.0 |
|
Interest payments on long-term debt(1) | 92.9 |
| | 18.1 |
| | 35.4 |
| | 33.8 |
| | 5.6 |
|
| Finance leases | 0.2 |
| | 0.2 |
| | — |
| | — |
| | — |
|
| Secured borrowings payment | 2.6 |
| | 1.1 |
| | 1.3 |
| | 0.2 |
| | — |
|
| Interest payments on secured borrowings | 0.2 |
| | 0.1 |
| | 0.1 |
| | — |
| | — |
|
Retirement benefit plans(2) | 1.2 |
| | 1.2 |
| | — |
| | — |
| | — |
|
Deferred compensation arrangements(3) | 2.8 |
| | 1.1 |
| | 1.0 |
| | 0.5 |
| | 0.2 |
|
Operating leases(4) | 50.7 |
| | 18.2 |
| | 21.6 |
| | 8.7 |
| | 2.2 |
|
Purchase obligations(5) | 52.0 |
| | 52.0 |
| | — |
| | — |
| | — |
|
| Total contractual obligations | $ | 545.2 |
| | $ | 123.3 |
| | $ | 70.5 |
| | $ | 43.4 |
| | $ | 308.0 |
|
| |
(1) | Long-term debt represents borrowings through the Notes and the 2017 Credit Agreement with JPMorgan. Interest on the Notes accrues at the rate of 5.625% per annum and is payable semiannually in cash on each May 1 and November 1. Repayment of the principal amount of the Senior Notes is due upon expiration of the agreement in 2025. Interest payments on our 2017 Credit Agreement with JPMorgan were calculated using the December 31, 2019 30-day LIBOR rate plus a spread. |
| |
(2) | Our retirement benefit plans, as described in Note 13 to the Consolidated Financial Statements, require us to make contributions to the plans from time to time. Contributions to the various plans are dependent upon a number of factors including the market performance of plan assets, if any, and future changes in interest rates, which impact the actuarial measurement of plan obligations. As a result, we have only included our 2020 expected contribution in the contractual obligations table. |
| |
(3) | The unfunded deferred compensation arrangements covering certain current and retired management employees totaled $2.8 million as of December 31, 2019. Our estimated distributions in the contractual obligations table are based upon a number of assumptions including termination dates and participant distribution elections. |
| |
(4) | Operating lease commitments consist primarily of office and warehouse facilities, vehicles and office equipment as well as the estimated liability for residual value guarantee as discussed in Note 15 to the Consolidated Financial Statements. |
| |
(5) | Purchase obligations include all known open purchase orders, contractual purchase commitments and contractual obligations as of December 31, 2019. |
(3)The unfunded deferred compensation arrangements covering certain current and retired management employees totaled $5.1 million as of December 31, 2018. Our estimated distributions in the contractual obligations table are based upon a number of assumptions including termination dates and participant distribution elections.
(4)Operating lease commitments consist primarily of office and warehouse facilities, vehicles and office equipment as discussed in Note 17 to the Consolidated Financial Statements.
(5)Purchase obligations include all known open purchase orders, contractual purchase commitments and contractual obligations as of December 31, 2018.
(6)Other obligations include residual value guarantees as discussed in Note 17 to the Consolidated Financial Statements.
Total contractual obligations exclude our gross unrecognized tax benefits of $5.7$7.5 million and accrued interest and penalties of $0.4$0.6 million as of December 31, 2018.2019. We expect to make cash outlays in the future related to uncertain tax positions. However, due to the uncertainty of the timing of future cash flows, we are unable to make reasonably reliable estimates of the period of cash settlement, if any, with the respective taxing authorities. For further information related to unrecognized tax benefits, see Note 1817 to the Consolidated Financial Statements.
Newly Issued Accounting Guidance
Leases
In February 2016, the Financial Accounting Standards Board ("FASB") issued Accounting Standards Update ("ASU") No. 2016-02, Leases (Topic 842). This ASU changes current U.S. GAAP for lessees to recognize lease assets and lease liabilities on the balance sheet for those leases classified as operating leases under previous U.S. GAAP. Under the new guidance, lessor accounting is largely unchanged. The amendments in this ASU are effective for annual periods beginning after December 15, 2018, including interim periods within that reporting period, which is our fiscal 2019. We expect the adoption of this standard will have a material impact on the consolidated balance sheets for recognition of operating lease related assets and liabilities. We do not expect a material impactSee Note 1 to the consolidated statements of operations. See FN 1Consolidated Financial Statements for further discussion.
Derivatives and Hedging
In August 2017, the FASB issued ASU No. 2017-12, Derivatives and Hedging (Topic 815): Targeted Improvements to Accounting for Hedging Activities, which better alignsinformation on new accounting rules with a company's risk management activities, better reflects the economic results of hedging in financial statements and simplifies hedge accounting treatment. This ASU is effective for fiscal years beginning after December 15, 2018, including interim periods within those fiscal years, which is our fiscal 2019. We have determined that the adoption of this standard will not have a material impact on our consolidated financial statements and related disclosures.pronouncements.
No other new accounting pronouncements issued but not yet effective have had, or are expected to have, a material impact on our results of operations or financial position.
Critical Accounting Policies and Estimates
Our Consolidated Financial Statements are based on the selection and application of accounting principles generally accepted in the United States
of America, which require us to make estimates and assumptions about future events that affect the amounts reported in our Consolidated Financial Statements and the accompanying notes. Our significant accounting policies are described in Note 1 to the Consolidated Financial Statements. Future events and their effects cannot be determined with absolute certainty. Therefore, the determination of estimates requires the exercise of judgment. Actual results could differ from those estimates, and any such differences may be material to the Consolidated Financial Statements. We believe that the following policies may involve a higher degree of judgment and complexity in their application and represent the critical accounting policies used in the preparation of our Consolidated Financial Statements. If different assumptions or conditions were to prevail, the results could be materially different from our reported results.
Goodwill – Goodwill represents the excess of cost over the fair value of net assets of businesses acquired and is allocated to our reporting units at the time of the acquisition. We analyze Goodwillgoodwill on an annual basis and when an event occurs or circumstances change that may reduce the fair value of a reporting unit below its carrying amount. An entity should recognize an impairment charge for the amount by which the carrying amount exceeds the reporting unit's fair value.
We performed an analysis of qualitative factors to determine whether it is more likely than not that the fair value of a reporting unit is less than its carrying amount as a basis for determining whether it is necessary to perform the quantitative goodwill impairment test. The qualitative test is used as an indicator to identify if there is potential goodwill impairment. If the qualitative test indicates there may be an impairment, we perform the quantitative test, which measures the amount of the goodwill impairment, if any. We perform our goodwill impairment analysis as of year-end or when an event occurs or circumstances change that may reduce the fair value of a reporting unit below its carrying amount, and use our judgment to develop assumptions for the discounted cash flow model that we use, if necessary. Management assumptions include forecasting revenues and margins, estimating capital expenditures, depreciation, amortization and discount rates.
If our goodwill impairment testing resulted in one or more of our reporting units’ carrying amount exceeding its fair value, we would write down our reporting units’ carrying amount to its fair value and would record an impairment charge in our results of operations in the period such determination is made. Subsequent reversal of goodwill impairment charges is not permitted. Based on our analysis of qualitative factors, we determined that it was not more likely than not that the fair value of the North America, Latin America, EMEA and APACour reporting units was less than its respective carrying amount. We elected to perform a quantitative analysisamount as of the Coatings reporting unit. Based on the quantitative analysis of that reporting unit, it was determined there was no goodwill impairment at December 31, 2018.2019. We had Goodwillgoodwill of $182.7$195.1 million as of December 31, 2018.2019.
Income Taxes – We are required to estimate our income taxes in each of the jurisdictions in which we operate. This process involves estimating our actual current tax obligations based on expected income, statutory tax rates and tax planning opportunities in the various jurisdictions. We also establish reserves for uncertain tax matters that are complex in nature and uncertain as to the ultimate outcome. Although we believe that our tax return positions are fully supportable, we consider our ability to ultimately prevail in defending these matters when establishing these reserves. We adjust our reserves in light of changing facts and circumstances, such as the closing of a tax audit. We believe that our current reserves are adequate. However, the ultimate outcome may differ from our estimates and assumptions and could impact the income tax expense reflected in our Consolidated Statements of Operations.
Tax law requires certain items to be included in our tax return at different times than the items are reflected in our results of operations. Some of these differences are permanent, such as expenses that are not deductible in our tax returns, and some differences will reverse over time, such as depreciation
expense on property, plant and equipment. These temporary differences result in deferred tax assets and liabilities, which are included within our Consolidated Balance Sheets. Deferred tax assets generally represent items that can be used as a tax deduction or credit in our tax returns in future years but have already been recorded as an expense in our Consolidated Statements of Operations. We assess the likelihood that our deferred tax assets will be recovered from future taxable income, and, based on management’s judgment, to the extent we believe that recovery is not more likely than not, we establish a valuation reserve against those deferred tax assets. The deferred tax asset valuation allowance could be materially different from actual results because of changes in the mix of future taxable income, the relationship between book and taxable income and our tax planning strategies. As of December 31, 2018,2019, a valuation allowance of $11.5$6.2 million was recorded against foreign tax loss carryforwards, foreign tax credit carryforwards and state credit carryforwards.
Cautionary Factors Relevant to Forward-Looking Information
This annual report on Form 10-K, including “Management’s Discussion and Analysis of Financial Condition and Results of Operations” in Item 7, contains certain statements that are considered “forward-looking statements” within the meaning of the Private Securities Litigation Reform Act of 1995. Forward-looking statements generally can be identified by the use of forward-looking terminology such as “may,” “will,” “expect,” “intend,” “estimate,” “anticipate,” “believe,” “project,” or “continue” or similar words or the negative thereof. These statements do not relate to strictly historical or current facts and provide current expectations of forecasts of future events. Any such expectations or forecasts of future events are subject to a variety of factors. Particular risks and uncertainties presently facing us include:
Ability to effectively manage strategic plans or growth processes.
Ability to successfully upgrade and evolve our information technology systems.
Fluctuations in the cost, quality or availability of raw materials and purchased components.
Geopolitical and economic uncertainty throughout the world.
Ability to integrate acquisitions.
Ability to attract, retain and develop key personnel and create effective succession planning strategies.
Ability to successfully protect our information technology systems from cybersecurity risks.
Ability to develop and commercialize new innovative products and services.
Ability to integrate acquisitions, including IPC.
Competition in our business.
Ability to successfully protect our information technology systems from cyber security risks.
Potential disruption of our business from actions of activist investors or others.
Occurrence of a significant business interruption.
Ability to comply with global laws and regulations.
Potential disruption of our business from actions of activist investors or others.
Unforeseen product liability claims or product quality issues.
Ability to generate sufficient cash to satisfy our debt obligations.
Internal control over financial reporting risks resulting from our acquisition of IPC.Foreign currency fluctuations.
We caution that forward-looking statements must be considered carefully and that actual results may differ in material ways due to risks and uncertainties both known and unknown. Information about factors that could materially affect our results can be found in Part I, Item 1A - Risk Factors. Shareholders, potential investors and other readers are urged to consider
these factors in evaluating forward-looking statements and are cautioned not to place undue reliance on such forward-looking statements.
We undertake no obligation to update or revise any forward-looking statement, whether as a result of new information, future events or otherwise, except as required by law. Investors are advised to consult any further disclosures by us in our filings with the Securities and Exchange Commission and in other written statements on related subjects. It is not possible to anticipate or foresee all risk factors, and investors should not consider any list of such factors to be an exhaustive or complete list of all risks or uncertainties.
ITEM 7A – Quantitative and Qualitative Disclosures About Market Risk
Commodity Risk –We are subject to exposures resulting from potential cost increases related to our purchase of raw materials or other product components. We do not use derivative commodity instruments to manage our exposures to changes in commodity prices such as steel, oil, gas, lead and other commodities.
Various factors beyond our control affect the price of oil and gas, including, but not limited to, worldwide and domestic supplies of oil and gas, political instability or armed conflict in oil-producing regions, the price and level of foreign imports, the level of consumer demand, the price and availability of alternative fuels, domestic and foreign governmental regulation, weather-related factors and the overall economic environment. We purchase petroleum-related component parts for use in our manufacturing operations. In addition, our freight costs associated with shipping and receiving product and sales and service vehicle fuel costs are impacted by fluctuations in the cost of oil and gas.
Fluctuations in worldwide demand and other factors affect the price for lead, steel and related products. We do not maintain an inventory of raw or fabricated steel or batteries in excess of near-term production requirements. As a result, increases in the price of lead or steel can significantly increase the cost of our lead- and steel-based raw materials and component parts.
During 2018, we experienced inflation on our raw materials and other purchased component costs. We continue to focus on mitigating the risk of future raw material or other product component cost increases through supplier negotiations, ongoing optimization of our supply chain, the continuation of cost reduction actions and product pricing. The success of these efforts will depend upon our ability to leverage our commodity spend in the current global economic environment. If the commodity prices increase significantly and we are not able to offset the increases with higher selling prices, our results may continue to be unfavorably impacted in 2019.2020.
Foreign Currency Exchange Rate Risk –Due to the global nature of our operations, we are subject to exposures resulting from foreign currency exchange fluctuations in the normal course of business. Our primary exchange rate exposures are with the Euro,euro, Australian and Canadian dollars, British
pound, Japanese yen, Chinese renminbi, Brazilian real and Mexican peso against the U.S. dollar. The direct financial impact of foreign currency exchange includes the effect of translating profits from local currencies to U.S. dollars, the impact of currency fluctuations on the transfer of goods between our operations in the United States and our international operations and transaction gains and losses. In addition to the direct financial impact, foreign currency exchange has an indirect financial impact on our results, including the effect on sales volume within local economies and the impact of pricing actions taken as a result of foreign exchange rate fluctuations.
In the normal course of business, we actively manage the exposure of our foreign currency exchange rate market risk by entering into various hedging instruments with counterparties that are highly rated financial institutions. We may use foreign exchange purchased options or forward contracts to hedge our foreign currency denominated forecasted revenues or forecasted sales to wholly-owned foreign subsidiaries. Additionally, we hedge
our net recognized foreign currency assets and liabilities with foreign exchange forward contracts. We hedge these exposures to reduce the risk that our net earnings and cash flows will be adversely affected by changes in foreign exchange rates. We do not enter into any of these instruments for speculative or trading purposes to generate revenue.
These contracts are carried at fair value and have maturities between one and 12 months. The gains and losses on these contracts generally approximate changes in the value of the related assets, liabilities or forecasted transactions. Some of the derivative instruments we enter into do not meet the criteria for cash flow hedge accounting treatment; therefore, changes in fair value are recorded in Foreign Currency Transaction Losses on our Consolidated Statements of Operations.
We use foreign currency exchange rate derivatives to hedge our exposure to fluctuations in exchange rates for anticipated intercompany cash transactions between Tennantthe Company and its subsidiaries. During 2017, we entered into Euroeuro to U.S. dollar foreign exchange cross currency swaps for all of the anticipated cash flows associated with an intercompany loan from a wholly-owned European subsidiary. We entered into these foreign exchange cross currency swaps to hedge the foreign currency denominatedcurrency-denominated cash flows associated with this intercompany loan, and accordingly, they are not speculative in nature. We designated these cross currency swaps as cash flow hedges. The hedged cash flows as of December 31, 20182019 included €174,000€166.8 million of total notional value. As of December 31, 2018,2019, the aggregate scheduled interest payments over the course of the loan and related swaps amounted to €24,000.€16.8 million. The scheduled maturity and principal payment of the loan and related swaps of €150,000€150.0 million are due in April 2022. There were no new cross currency swaps designated as cash flow hedges as of December 31, 2018.2019.
For further information regarding our foreign currency derivatives and hedging programs, see Note 1311 to the Consolidated Financial Statements.
For details of the estimated effects of currency translation on the operations of our operating segments, see Item 7 – Management's Discussion and Analysis of Financial Condition and Results of Operations.
Other Matters –Management regularly reviews our business operations with the objective of improving financial performance and maximizing our return on investment. As a result of this ongoing process to improve financial performance, we may incur additional restructuring charges in the future which, if taken, could be material to our financial results.
ITEM 8 – Financial Statements and Supplementary Data
REPORT OF INDEPENDENT REGISTERED PUBLIC ACCOUNTING FIRM
To the shareholdersShareholders and boardBoard of directorsDirectors
Tennant Company:
Opinions on the Consolidated Financial Statements and Internal Control Over Financial Reporting
We have audited the accompanying consolidated balance sheets of Tennant Company and subsidiaries (the Company) as of December 31, 20182019 and 2017,2018, the related consolidated statements of operations, comprehensive income, equity, and cash flows for each of the years in the three-year period ended December 31, 2018,2019, and the related notes and financial statement schedules included in Item 15.A.2Schedule II - Valuation and Qualifying Accounts (collectively, the consolidated financial statements). We also have audited the Company’s internal control over financial reporting as of December 31, 2018,2019, based on criteria established inInternal Control - Integrated Framework(2013) issued by the Committee of Sponsoring Organizations of the Treadway Commission.
In our opinion, the consolidated financial statements referred to above present fairly, in all material respects, the financial position of the Company as of December 31, 20182019 and 2017,2018, and the results of its operations and its cash flows for each of the years in the three-year period ended December 31, 2018,2019, in conformity with U.S. generally accepted accounting principles. Also in our opinion, the Company maintained, in all material respects, effective internal control over financial reporting as of December 31, 20182019 based on criteria established in Internal Control - Integrated Framework (2013) issued by the Committee of Sponsoring Organizations of the Treadway Commission.
The Company acquired Gaomei during 2019, and management excluded from its assessment of the effectiveness of the Company’s internal control over financial reporting as of December 31, 2019, Gaomei’s internal control over financial reporting associated with total assets of $41.3 million and total revenues of $15.8 million included in the consolidated financial statements of the Company as of and for the year ended December 31, 2019. Our audit of internal control over financial reporting of the Company also excluded an evaluation of the internal control over financial reporting of Gaomei.
Change in Accounting Principle
As discussed in Note 2 to the consolidated financial statements, the Company has changed its method of accounting for revenueleases as of January 1, 2019 due to the adoption of Accounting Standards Update 2016-02, Leases (Topic 842), and related amendments, and as discussed in Note 1 to the consolidated financial statements, the Company has changed its method of accounting for revenues as of January 1, 2018 due to the adoption of FASB Accounting Standards Codification (Topic 606), Update 2014-09, Revenue from Contracts with Customers. (Topic 606), and related amendments.
Basis for OpinionOpinions
The Company’s management is responsible for these consolidated financial statements, for maintaining effective internal control over financial reporting, and for its assessment of the effectiveness of internal control over financial reporting, included in the accompanying Management’s Report on Internal Control over Financial Reporting. Our responsibility is to express an opinion on the Company’s consolidated financial statements and an opinion on the Company’s internal control over financial reporting based on our audits. We are a public accounting firm registered with the Public Company Accounting Oversight Board (United States) (PCAOB) and are required to be independent with respect to the Company in accordance with the U.S. federal securities laws and the applicable rules and regulations of the Securities and Exchange Commission and the PCAOB.
We conducted our audits in accordance with the standards of the PCAOB. Those standards require that we plan and perform the audits to obtain reasonable assurance about whether the consolidated financial statements are free of material misstatement, whether due to error or fraud, and whether effective internal control over financial reporting was maintained in all material respects.
Our audits of the consolidated financial statements included performing procedures to assess the risks of material misstatement of the consolidated financial statements, whether due to error or fraud, and performing procedures that respond to those risks. Such procedures included examining, on a test basis, evidence regarding the amounts and disclosures in the consolidated financial statements. Our audits also included evaluating the accounting principles used and significant estimates made by management, as well as evaluating the overall presentation of the consolidated financial statements. Our audit of internal control over financial reporting included obtaining an understanding of internal control over financial reporting, assessing the risk that a material weakness exists, and testing and evaluating the design and operating effectiveness of internal control based on the assessed risk. Our audits also included performing such other procedures as we considered necessary in the circumstances. We believe that our audits provide a reasonable basis for our opinions.
Definition and Limitations of Internal Control Over Financial Reporting
A company’s internal control over financial reporting is a process designed to provide reasonable assurance regarding the reliability of financial reporting and the preparation of financial statements for external purposes in accordance with generally accepted accounting principles. A company’s internal control over financial reporting includes those policies and procedures that (1) pertain to the maintenance of records that, in reasonable detail, accurately and fairly reflect the transactions and dispositions of the assets of the company; (2) provide reasonable assurance that transactions are recorded as necessary to permit preparation of financial statements in accordance with generally accepted accounting principles, and that receipts and expenditures of the company are being made only in accordance with authorizations of management and directors of the company; and (3) provide reasonable assurance regarding prevention or timely detection of unauthorized acquisition, use, or disposition of the company’s assets that could have a material effect on the financial statements.
Because of its inherent limitations, internal control over financial reporting may not prevent or detect misstatements. Also, projections of any evaluation of effectiveness to future periods are subject to the risk that controls may become inadequate because of changes in conditions, or that the degree of compliance with the policies or procedures may deteriorate.
Critical Audit Matter
The critical audit matter communicated below is a matter arising from the current period audit of the consolidated financial statements that was communicated or required to be communicated to the audit committee and that: (1) relates to accounts or disclosures that are material to the consolidated financial statements and (2) involved our especially challenging, subjective, or complex judgments. The communication of a critical audit matter does not alter in any way our opinion on the consolidated financial statements, taken as a whole, and we are not, by communicating the critical audit matter below, providing a separate opinion on the critical audit matter or on the accounts or disclosures to which it relates.
Evaluation of the acquisition-date fair value of contingent consideration
As discussed in Note 5 to the consolidated financial statements, on January 4, 2019, the Company acquired Gaomei for a total purchase price of $27.1 million, including $4.7 million representing the estimated fair value of contingent consideration at the acquisition date. The acquisition-date fair value was based on probability-weighted scenario analyses of achieving certain levels of gross profit growth over a three-year period. Consideration ranging from zero to $42.4 million will be paid in March 2021 if the gross profit growth targets are met.
We identified the evaluation of the acquisition-date fair value of contingent consideration as a critical audit matter. A high degree of auditor judgment was required in assessing the valuation method, forecasted annual gross profit growth rates, gross profit volatility rate, and discount rate, as the fair value determination is sensitive to minor changes in these assumptions.
The primary procedures we performed to address this critical audit matter included the following. We tested certain internal controls over the Company’s fair value determination process, including controls over the development of the forecasted annual gross profit growth rates, gross profit volatility rate, and discount rate. We analyzed the forecasted gross profit growth rates by comparing the Gaomei forecasted gross profit growth rates to historical results to assess the Company’s ability to accurately forecast. We performed sensitivity analyses to assess the impact of changes in these assumptions on the Company’s fair value determination of the contingent consideration. We involved valuation professionals with specialized skills and knowledge who assisted in:
evaluating the valuation method used by the Company to determine the acquisition-date fair value of contingent consideration,
evaluating the Company’s gross profit volatility rate by comparing the Company’s inputs to amounts calculated from publicly available data for comparable entities and assessing the resulting rates,
evaluating the Company’s discount rate by comparing the Company’s inputs to publicly available data for comparable entities and assessing the resulting rates, and
performing independent simulation analyses to assess the accuracy of the Company’s resulting fair value of contingent consideration.
/s/ KPMG LLP
We have served as the Company's auditor since 1954.
Minneapolis, Minnesota
February 28, 201927, 2020
Consolidated Statements of Operations
TENNANT COMPANY AND SUBSIDIARIES
(In thousands,millions, except shares and per share data)
| | | Years ended December 31 | 2018 | | 2017 | | 2016 | 2019 | | 2018 | | 2017 |
| Net Sales | $ | 1,123,511 |
| | $ | 1,003,066 |
| | $ | 808,572 |
| $ | 1,137.6 |
| | $ | 1,123.5 |
| | $ | 1,003.1 |
|
| Cost of Sales | 678,478 |
| | 603,253 |
| | 456,977 |
| 675.9 |
| | 678.5 |
| | 603.3 |
|
| Gross Profit | 445,033 |
| | 399,813 |
| | 351,595 |
| 461.7 |
| | 445.0 |
| | 399.8 |
|
| Operating Expense: | |
| | |
| | |
| |
| | |
| | |
|
| Research and Development Expense | 30,739 |
| | 32,013 |
| | 34,738 |
| 32.7 |
| | 30.7 |
| | 32.0 |
|
| Selling and Administrative Expense | 356,316 |
| | 334,782 |
| | 248,592 |
| 357.2 |
| | 356.3 |
| | 334.8 |
|
| Total Operating Expense | 387,055 |
| | 366,795 |
| | 283,330 |
| 389.9 |
| | 387.0 |
| | 366.8 |
|
| Profit from Operations | 57,978 |
| | 33,018 |
| | 68,265 |
| 71.8 |
| | 58.0 |
| | 33.0 |
|
| Other Income (Expense): | |
| | |
| | |
| |
| | |
| | |
|
| Interest Income | 3,035 |
| | 2,405 |
| | 330 |
| 3.3 |
| | 3.0 |
| | 2.4 |
|
| Interest Expense | (23,342 | ) | | (25,394 | ) | | (1,279 | ) | (21.1 | ) | | (23.3 | ) | | (25.4 | ) |
| Net Foreign Currency Transaction Losses | (1,100 | ) | | (3,387 | ) | | (392 | ) | (0.7 | ) | | (1.1 | ) | | (3.4 | ) |
| Other Expense, Net | (729 | ) | | (7,934 | ) | | (433 | ) | |
| Other Income (Expense), Net | | 0.7 |
| | (0.8 | ) | | (7.9 | ) |
| Total Other Expense, Net | (22,136 | ) | | (34,310 | ) | | (1,774 | ) | (17.8 | ) | | (22.2 | ) | | (34.3 | ) |
| Profit (Loss) Before Income Taxes | 35,842 |
| | (1,292 | ) | | 66,491 |
| 54.0 |
| | 35.8 |
| | (1.3 | ) |
| Income Tax Expense | 2,304 |
| | 4,913 |
| | 19,877 |
| 8.1 |
| | 2.3 |
| | 4.9 |
|
| Net Earnings (Loss) Including Noncontrolling Interest | 33,538 |
| | (6,205 | ) | | 46,614 |
| 45.9 |
| | 33.5 |
| | (6.2 | ) |
| Net Earnings (Loss) Attributable to Noncontrolling Interest | 126 |
| | (10 | ) | | — |
| 0.1 |
| | 0.1 |
| | — |
|
| Net Earnings (Loss) Attributable to Tennant Company | $ | 33,412 |
| | $ | (6,195 | ) | | $ | 46,614 |
| $ | 45.8 |
| | $ | 33.4 |
| | $ | (6.2 | ) |
| | | | | | | | | | | |
| Net Earnings (Loss) Attributable to Tennant Company per Share: | |
| | |
| | |
| |
| | |
| | |
|
| Basic | $ | 1.86 |
| | $ | (0.35 | ) | | $ | 2.66 |
| $ | 2.53 |
| | $ | 1.86 |
| | $ | (0.35 | ) |
| Diluted | $ | 1.82 |
| | $ | (0.35 | ) | | $ | 2.59 |
| $ | 2.48 |
| | $ | 1.82 |
| | $ | (0.35 | ) |
| | | | | | | | | | | |
| Weighted Average Shares Outstanding: | | | |
| | |
| | | |
| | |
|
| Basic | 17,940,438 |
| | 17,695,390 |
| | 17,523,267 |
| 18,118,486 |
| | 17,940,438 |
| | 17,695,390 |
|
| Diluted | 18,338,569 |
| | 17,695,390 |
| | 17,976,183 |
| 18,453,145 |
| | 18,338,569 |
| | 17,695,390 |
|
| | | | | | | |
| Cash Dividends Declared per Common Share | $ | 0.85 |
| | $ | 0.84 |
| | $ | 0.81 |
| |
See accompanying Notes to Consolidated Financial Statements.
Consolidated Statements of Comprehensive Income
TENNANT COMPANY AND SUBSIDIARIES
(In thousands)millions)
| | | Years ended December 31 | 2018 | | 2017 | | 2016 | 2019 | | 2018 | | 2017 |
| Net Earnings (Loss) Including Noncontrolling Interest | $ | 33,538 |
| | $ | (6,205 | ) | | $ | 46,614 |
| $ | 45.9 |
| | $ | 33.5 |
| | $ | (6.2 | ) |
| Other Comprehensive (Loss) Income: | |
| | |
| | |
| |
| | |
| | |
|
| Foreign currency translation adjustments | (16,221 | ) | | 28,356 |
| | 109 |
| (4.5 | ) | | (16.2 | ) | | 28.3 |
|
| Pension and retiree medical benefits | 1,745 |
| | 5,868 |
| | (2,248 | ) | (0.5 | ) | | 1.7 |
| | 5.9 |
|
| Cash flow hedge | 1,341 |
| | (7,731 | ) | | (305 | ) | 4.6 |
| | 1.3 |
| | (7.7 | ) |
| Income Taxes: | | | | | | | | | | |
| Foreign currency translation adjustments | 168 |
| | 310 |
| | 32 |
| 0.1 |
| | 0.2 |
| | 0.3 |
|
| Pension and retiree medical benefits | (467 | ) | | (2,087 | ) | | 504 |
| 0.1 |
| | (0.5 | ) | | (2.1 | ) |
| Cash flow hedge | (1,437 | ) | | 2,884 |
| | 114 |
| (1.1 | ) | | (1.4 | ) | | 2.9 |
|
| Total Other Comprehensive (Loss) Income, net of tax | (14,871 | ) | | 27,600 |
| | (1,794 | ) | (1.3 | ) | | (14.9 | ) | | 27.6 |
|
| Total Comprehensive Income Including Noncontrolling Interest | 18,667 |
| | 21,395 |
| | 44,820 |
| 44.6 |
| | 18.6 |
| | 21.4 |
|
| Comprehensive Income (Loss) Attributable to Noncontrolling Interest | 126 |
| | (10 | ) | | — |
| |
| Comprehensive Income Attributable to Noncontrolling Interest | | 0.1 |
| | 0.1 |
| | — |
|
| Comprehensive Income Attributable to Tennant Company | $ | 18,541 |
| | $ | 21,405 |
| | $ | 44,820 |
| $ | 44.5 |
| | $ | 18.5 |
| | $ | 21.4 |
|
See accompanying Notes to Consolidated Financial Statements.
Consolidated Balance Sheets
TENNANT COMPANY AND SUBSIDIARIES
(In thousands,millions, except shares and per share data)
| | | December 31 | 2018 | | 2017 | 2019 | | 2018 |
| ASSETS | | | | | | |
| Current Assets: | | | | | | |
| Cash and Cash Equivalents | $ | 85,609 |
| | $ | 58,398 |
| |
| Restricted Cash | 525 |
| | 653 |
| |
| Cash, Cash Equivalents, and Restricted Cash | | $ | 74.6 |
| | $ | 86.1 |
|
| Receivables: | |
| | |
| |
| | |
|
| Trade, less Allowances of $2,516 and $3,241, respectively | 207,948 |
| | 203,280 |
| |
| Trade, less Allowances of $3.6 and $2.5, respectively | | 216.5 |
| | 208.0 |
|
| Other | 8,222 |
| | 6,236 |
| 6.8 |
| | 8.2 |
|
| Net Receivables | 216,170 |
| | 209,516 |
| 223.3 |
| | 216.2 |
|
| Inventories | 135,133 |
| | 127,694 |
| 150.1 |
| | 135.1 |
|
| Prepaid Expenses | 22,141 |
| | 19,351 |
| |
| Other Current Assets | 9,066 |
| | 7,503 |
| |
| Prepaid and Other Current Assets | | 33.0 |
| | 31.2 |
|
| Total Current Assets | 468,644 |
| | 423,115 |
| 481.0 |
| | 468.6 |
|
| Property, Plant and Equipment | 386,641 |
| | 382,768 |
| 412.5 |
| | 386.6 |
|
| Accumulated Depreciation | (223,194 | ) | | (202,750 | ) | (239.2 | ) | | (223.2 | ) |
| Property, Plant and Equipment, Net | 163,447 |
| | 180,018 |
| 173.3 |
| | 163.4 |
|
| Deferred Income Taxes | 15,489 |
| | 11,134 |
| |
| Operating Lease Assets | | 46.6 |
| | — |
|
| Goodwill | 182,671 |
| | 186,044 |
| 195.1 |
| | 182.7 |
|
| Intangible Assets, Net | 146,546 |
| | 172,347 |
| 137.7 |
| | 146.5 |
|
| Other Assets | 15,747 |
| | 21,319 |
| 29.2 |
| | 31.3 |
|
| Total Assets | $ | 992,544 |
| | $ | 993,977 |
| $ | 1,062.9 |
| | $ | 992.5 |
|
| LIABILITIES AND TOTAL EQUITY | |
| | |
| |
| | |
|
| Current Liabilities: | |
| | |
| |
| | |
|
| Current Portion of Long-Term Debt | $ | 27,005 |
| | $ | 30,883 |
| $ | 31.3 |
| | $ | 27.0 |
|
| Accounts Payable | 98,398 |
| | 96,082 |
| 94.1 |
| | 98.4 |
|
| Employee Compensation and Benefits | 49,453 |
| | 37,257 |
| 63.5 |
| | 56.1 |
|
| Income Taxes Payable | 2,123 |
| | 2,838 |
| |
| Other Current Liabilities | 71,895 |
| | 69,447 |
| 86.0 |
| | 67.4 |
|
| Total Current Liabilities | 248,874 |
| | 236,507 |
| 274.9 |
| | 248.9 |
|
| Long-Term Liabilities: | |
| | |
| |
| | |
|
| Long-Term Debt | 328,060 |
| | 345,956 |
| 307.5 |
| | 328.1 |
|
| Long-Term Operating Lease Liability | | 30.3 |
| | — |
|
| Employee-Related Benefits | 21,110 |
| | 23,867 |
| 19.4 |
| | 21.1 |
|
| Deferred Income Taxes | 46,018 |
| | 53,225 |
| 41.7 |
| | 46.0 |
|
| Other Liabilities | 32,130 |
| | 35,948 |
| 27.8 |
| | 32.1 |
|
| Total Long-Term Liabilities | 427,318 |
| | 458,996 |
| 426.7 |
| | 427.3 |
|
| Total Liabilities | 676,192 |
| | 695,503 |
| 701.6 |
| | 676.2 |
|
| Commitments and Contingencies (Note 17) |
|
| |
|
| |
| Commitments and Contingencies (Note 16) | |
|
| |
|
|
| Equity: | |
| | |
| |
| | |
|
| Common Stock, $0.375 par value per share, 60,000,000 shares authorized; 18,125,201 and 17,881,177 issued and outstanding, respectively | 6,797 |
| | 6,705 |
| |
| Common Stock, $0.375 par value per share, 60,000,000 shares authorized; 18,336,010 and 18,125,201 issued and outstanding, respectively | | 6.9 |
| | 6.8 |
|
| Additional Paid-In Capital | 28,550 |
| | 15,089 |
| 45.5 |
| | 28.5 |
|
| Retained Earnings | 316,269 |
| | 297,032 |
| 346.0 |
| | 316.3 |
|
| Accumulated Other Comprehensive Loss | (37,194 | ) | | (22,323 | ) | (38.5 | ) | | (37.2 | ) |
| Total Tennant Company Shareholders' Equity | 314,422 |
| | 296,503 |
| 359.9 |
| | 314.4 |
|
| Noncontrolling Interest | 1,930 |
| | 1,971 |
| 1.4 |
| | 1.9 |
|
| Total Equity | 316,352 |
| | 298,474 |
| 361.3 |
| | 316.3 |
|
| Total Liabilities and Total Equity | $ | 992,544 |
| | $ | 993,977 |
| $ | 1,062.9 |
| | $ | 992.5 |
|
See accompanying Notes to Consolidated Financial Statements.
Consolidated Statements of Cash Flows
TENNANT COMPANY AND SUBSIDIARIES
(In thousands)millions)
| | | Years ended December 31 | 2018 | | 2017 | | 2016 | 2019 | | 2018 | | 2017 |
| OPERATING ACTIVITIES | | | | | | | | | | |
| Net Earnings (Loss) Including Noncontrolling Interest | $ | 33,538 |
| | $ | (6,205 | ) | | $ | 46,614 |
| $ | 45.9 |
| | $ | 33.5 |
| | $ | (6.2 | ) |
| Adjustments to Reconcile Net Earnings (Loss) to Net Cash Provided by Operating Activities: | |
| | |
| | |
| |
| | |
| | |
|
| Depreciation | 32,291 |
| | 26,199 |
| | 17,891 |
| 32.2 |
| | 32.3 |
| | 26.2 |
|
| Amortization of Intangible Assets | 22,129 |
| | 17,054 |
| | 409 |
| 22.2 |
| | 22.1 |
| | 17.1 |
|
| Amortization of Debt Issuance Costs | 2,353 |
| | 1,779 |
| | — |
| 1.3 |
| | 2.4 |
| | 1.8 |
|
| Debt Issuance Cost Charges Related to Short-Term Financing | — |
| | 6,200 |
| | — |
| — |
| | — |
| | 6.2 |
|
| Fair Value Step-Up Adjustment to Acquired Inventory | — |
| | 7,245 |
| | — |
| 0.9 |
| | — |
| | 7.2 |
|
| Deferred Income Taxes | (10,862 | ) | | (6,095 | ) | | (1,172 | ) | (9.6 | ) | | (10.9 | ) | | (6.1 | ) |
| Share-Based Compensation Expense | 8,314 |
| | 5,891 |
| | 3,875 |
| 11.4 |
| | 8.3 |
| | 5.9 |
|
| Allowance for Doubtful Accounts and Returns | 768 |
| | 1,602 |
| | 468 |
| 2.5 |
| | 0.8 |
| | 1.6 |
|
| Acquisition Contingent Consideration Adjustment | | (2.3 | ) | | — |
| | — |
|
| Note Receivable Write-down | | 2.7 |
| | — |
| | — |
|
| Discontinuation of Product Lines | | 3.3 |
| | — |
| | — |
|
| Other, Net | (436 | ) | | 364 |
| | (196 | ) | 1.1 |
| | (0.4 | ) | | 0.4 |
|
| Changes in Operating Assets and Liabilities, Net of Assets Acquired: | |
| | |
| | |
| |
| | |
| | |
|
| Receivables, Net | (7,618 | ) | | (14,381 | ) | | (9,278 | ) | (8.5 | ) | | (7.6 | ) | | (14.4 | ) |
| Inventories | (16,557 | ) | | (2,898 | ) | | 23 |
| (21.1 | ) | | (16.6 | ) | | (2.9 | ) |
| Accounts Payable | 4,569 |
| | 10,849 |
| | (3,904 | ) | (7.5 | ) | | 4.6 |
| | 10.8 |
|
| Employee Compensation and Benefits | 12,649 |
| | (7,780 | ) | | 124 |
| 4.5 |
| | 12.7 |
| | (4.0 | ) |
| Other Current Liabilities | 722 |
| | 14,560 |
| | (185 | ) | (1.4 | ) | | (0.7 | ) | | 11.1 |
|
| Income Taxes | (1,383 | ) | | 285 |
| | 5,427 |
| |
| Other Assets and Liabilities | (507 | ) | | (495 | ) | | (2,218 | ) | (5.7 | ) | | (0.5 | ) | | (0.5 | ) |
| Net Cash Provided by Operating Activities | 79,970 |
| | 54,174 |
| | 57,878 |
| 71.9 |
| | 80.0 |
| | 54.2 |
|
| INVESTING ACTIVITIES | |
| | |
| | |
| |
| | |
| | |
|
| Purchases of Property, Plant and Equipment | (18,780 | ) | | (20,437 | ) | | (26,526 | ) | (38.4 | ) | | (18.8 | ) | | (20.4 | ) |
| Proceeds from Disposals of Property, Plant and Equipment | 112 |
| | 2,511 |
| | 615 |
| 0.1 |
| | 0.1 |
| | 2.5 |
|
| Proceeds from Principal Payments Received on Long-Term Note Receivable | 1,416 |
| | 667 |
| | — |
| 2.9 |
| | 1.4 |
| | 0.7 |
|
| Issuance of Long-Term Note Receivable | — |
| | (1,500 | ) | | (2,000 | ) | — |
| | — |
| | (1.5 | ) |
| Acquisitions of Businesses, Net of Cash Acquired | — |
| | (354,073 | ) | | (12,933 | ) | |
| Acquisitions of Businesses, Net of Cash, Cash Equivalents and Restricted Cash Acquired | | (19.7 | ) | | — |
| | (354.1 | ) |
| Purchase of Intangible Asset | (2,775 | ) | | (2,500 | ) | | — |
| (0.5 | ) | | (2.8 | ) | | (2.5 | ) |
| Proceeds from Sale of Business | 4,000 |
| | — |
| | 285 |
| — |
| | 4.0 |
| | — |
|
| Net Cash Used in Investing Activities | (16,027 | ) | | (375,332 | ) | | (40,559 | ) | (55.6 | ) | | (16.1 | ) | | (375.3 | ) |
| FINANCING ACTIVITIES | |
| | |
| | |
| |
| | |
| | |
|
| Proceeds from Short-Term Debt | 3,926 |
| | 303,000 |
| | — |
| |
| Repayments of Short-Term Debt | — |
| | (303,000 | ) | | — |
| |
| Proceeds from Issuance of Long-Term Debt | 11,000 |
| | 440,000 |
| | 15,000 |
| |
| Payments of Long-Term Debt | (38,255 | ) | | (96,248 | ) | | (3,460 | ) | |
| Proceeds from Debt | | 25.0 |
| | 14.9 |
| | 743.0 |
|
| Repayments of Debt | | (41.8 | ) | | (38.3 | ) | | (399.3 | ) |
| Change in Finance Lease Obligations | | (0.2 | ) | | — |
| | 0.3 |
|
| Payments of Debt Issuance Costs | — |
| | (16,482 | ) | | — |
| — |
| | — |
| | (16.5 | ) |
| Change in Capital Lease Obligations | 14 |
| | 311 |
| | — |
| |
| Purchases of Common Stock | — |
| | — |
| | (12,762 | ) | |
| Proceeds from Issuances of Common Stock | 5,880 |
| | 6,875 |
| | 5,271 |
| 6.1 |
| | 5.9 |
| | 6.9 |
|
| Excess Tax Benefit on Stock Plans | — |
| | — |
| | 686 |
| |
| Purchase of Noncontrolling Owner Interest | — |
| | (30 | ) | | — |
| (0.5 | ) | | — |
| | — |
|
| Dividends Paid | (15,343 | ) | | (14,953 | ) | | (14,293 | ) | (16.0 | ) | | (15.3 | ) | | (15.0 | ) |
| Net Cash (Used in) Provided by Financing Activities | (32,778 | ) | | 319,473 |
| | (9,558 | ) | (27.4 | ) | | (32.8 | ) | | 319.4 |
|
| Effect of Exchange Rate Changes on Cash, Cash Equivalents and Restricted Cash | (4,082 | ) | | 2,186 |
| | (1,150 | ) | (0.4 | ) | | (4.0 | ) | | 2.2 |
|
| NET INCREASE IN CASH, CASH EQUIVALENTS AND RESTRICTED CASH | 27,083 |
| | 501 |
| | 6,611 |
| |
| NET (DECREASE) INCREASE IN CASH, CASH EQUIVALENTS AND RESTRICTED CASH | | (11.5 | ) | | 27.1 |
| | 0.5 |
|
| Cash, Cash Equivalents and Restricted Cash at Beginning of Year | 59,051 |
| | 58,550 |
| | 51,939 |
| 86.1 |
| | 59.0 |
| | 58.5 |
|
| CASH, CASH EQUIVALENTS AND RESTRICTED CASH AT END OF YEAR | $ | 86,134 |
| | $ | 59,051 |
| | $ | 58,550 |
| $ | 74.6 |
| | $ | 86.1 |
| | $ | 59.0 |
|
| | | SUPPLEMENTAL CASH FLOW INFORMATION | | | | | | | | | | |
| Cash Paid During the Year for: | | | | | | |
| Years ended December 31 | | 2019 | | 2018 | | 2017 |
| Cash Paid for: | | | | | | |
| Income Taxes | $ | 11,132 |
| | $ | 13,542 |
| | $ | 14,172 |
| $ | 21.7 |
| | $ | 11.1 |
| | $ | 13.5 |
|
| Interest | $ | 22,367 |
| | $ | 14,228 |
| | $ | 1,135 |
| $ | 19.7 |
| | $ | 22.4 |
| | $ | 14.2 |
|
| Supplemental Non-Cash Investing and Financing Activities: | | | | | | | | | | |
| Long-Term Note Receivable from Sale of Business | $ | — |
| | $ | — |
| | $ | 5,489 |
| |
| Capital Expenditures in Accounts Payable | $ | 2,311 |
| | $ | 2,167 |
| | $ | 2,045 |
| $ | 3.9 |
| | $ | 2.3 |
| | $ | 2.2 |
|
See accompanying Notes to Consolidated Financial Statements.
Consolidated Statements of Equity
TENNANT COMPANY AND SUBSIDIARIES
(In thousands,millions, except shares and per share data)
| | | | Tennant Company Shareholders | | Tennant Company Shareholders | |
| | Common Shares | Common Stock | Additional Paid-in Capital | Retained Earnings | Accumulated Other Comprehensive Loss | Tennant Company Shareholders' Equity | Noncontrolling Interest | Total Equity | Common Shares | Common Stock | Additional Paid-in Capital | Retained Earnings | Accumulated Other Comprehensive Loss | Tennant Company Shareholders' Equity | Noncontrolling Interest | Total Equity |
| Balance, December 31, 2015 | 17,744,381 |
| $ | 6,654 |
| $ | — |
| $ | 293,682 |
| $ | (48,129 | ) | $ | 252,207 |
| $ | — |
| $ | 252,207 |
| |
| Net Earnings | — |
| — |
| — |
| 46,614 |
| — |
| 46,614 |
| — |
| 46,614 |
| |
| Other Comprehensive Loss | — |
| — |
| — |
| — |
| (1,794 | ) | (1,794 | ) | — |
| (1,794 | ) | |
| Issue Stock for Directors, Employee Benefit and Stock Plans, net of related tax withholdings of 23,113 shares | 190,443 |
| 71 |
| 3,939 |
| — |
| — |
| 4,010 |
| — |
| 4,010 |
| |
| Share-Based Compensation | — |
| — |
| 3,875 |
| — |
| — |
| 3,875 |
| — |
| 3,875 |
| |
| Dividends paid $0.81 per Common Share | — |
| — |
| — |
| (14,293 | ) | — |
| (14,293 | ) | — |
| (14,293 | ) | |
| Tax Benefit on Stock Plans | — |
| — |
| 686 |
| — |
| — |
| 686 |
| — |
| 686 |
| |
| Purchases of Common Stock | (246,474 | ) | (92 | ) | (4,847 | ) | (7,823 | ) | — |
| (12,762 | ) | — |
| (12,762 | ) | |
| Balance, December 31, 2016 | 17,688,350 |
| $ | 6,633 |
| $ | 3,653 |
| $ | 318,180 |
| $ | (49,923 | ) | $ | 278,543 |
| $ | — |
| $ | 278,543 |
| 17,688,350 |
| $ | 6.6 |
| $ | 3.6 |
| $ | 318.2 |
| $ | (49.9 | ) | $ | 278.5 |
| $ | — |
| $ | 278.5 |
|
| Net Loss | — |
| — |
| — |
| (6,195 | ) | — |
| (6,195 | ) | (10 | ) | (6,205 | ) | — |
| — |
| — |
| (6.2 | ) | — |
| (6.2 | ) | — |
| (6.2 | ) |
| Other Comprehensive Income | — |
| — |
| — |
| — |
| 27,600 |
| 27,600 |
| — |
| 27,600 |
| — |
| — |
| — |
| — |
| 27.6 |
| 27.6 |
| — |
| 27.6 |
|
| Issue Stock for Directors, Employee Benefit and Stock Plans, net of related tax withholdings of 16,990 shares | 192,827 |
| 72 |
| 5,545 |
| — |
| — |
| 5,617 |
| — |
| 5,617 |
| 192,827 |
| 0.1 |
| 5.6 |
| — |
| — |
| 5.7 |
| — |
| 5.7 |
|
| Share-Based Compensation | — |
| — |
| 5,891 |
| — |
| — |
| 5,891 |
| — |
| 5,891 |
| — |
| — |
| 5.9 |
| — |
| — |
| 5.9 |
| — |
| 5.9 |
|
| Dividends paid $0.84 per Common Share | — |
| — |
| — |
| (14,953 | ) | — |
| (14,953 | ) | — |
| (14,953 | ) | — |
| — |
| — |
| (15.0 | ) | — |
| (15.0 | ) | — |
| (15.0 | ) |
| Recognition of Noncontrolling Interests | — |
| — |
| — |
| — |
| — |
| — |
| 2,028 |
| 2,028 |
| |
| Purchase of Noncontrolling Shareholder Interest | — |
| — |
| — |
| — |
| — |
| — |
| (30 | ) | (30 | ) | |
| Other | — |
| — |
| — |
| — |
| — |
| — |
| (17 | ) | (17 | ) | |
| Recognition of Noncontrolling Interest | | — |
| — |
| — |
| — |
| — |
| — |
| 2.0 |
| 2.0 |
|
| Balance, December 31, 2017 | 17,881,177 |
| $ | 6,705 |
| $ | 15,089 |
| $ | 297,032 |
| $ | (22,323 | ) | $ | 296,503 |
| $ | 1,971 |
| $ | 298,474 |
| 17,881,177 |
| $ | 6.7 |
| $ | 15.1 |
| $ | 297.0 |
| $ | (22.3 | ) | $ | 296.5 |
| $ | 2.0 |
| $ | 298.5 |
|
| Net Earnings | — |
| — |
| — |
| 33,412 |
| — |
| 33,412 |
| 126 |
| 33,538 |
| — |
| — |
| — |
| 33.4 |
| — |
| 33.4 |
| 0.1 |
| 33.5 |
|
| Other Comprehensive Loss | — |
| — |
| — |
| — |
| (14,871 | ) | (14,871 | ) | — |
| (14,871 | ) | — |
| — |
| — |
| — |
| (14.9 | ) | (14.9 | ) | — |
| (14.9 | ) |
| Issue Stock for Directors, Employee Benefit and Stock Plans, net of related tax withholdings of 9,598 shares | 244,024 |
| 92 |
| 5,147 |
| — |
| — |
| 5,239 |
| — |
| 5,239 |
| 244,024 |
| 0.1 |
| 5.1 |
| — |
| — |
| 5.2 |
| — |
| 5.2 |
|
| Share-Based Compensation | — |
| — |
| 8,314 |
| — |
| — |
| 8,314 |
| — |
| 8,314 |
| — |
| — |
| 8.3 |
| — |
| — |
| 8.3 |
| — |
| 8.3 |
|
| Dividends paid $0.85 per Common Share | — |
| — |
| — |
| (15,343 | ) | — |
| (15,343 | ) | — |
| (15,343 | ) | — |
| — |
| — |
| (15.3 | ) | — |
| (15.3 | ) | — |
| (15.3 | ) |
| Recognition of Noncontrolling Interests | — |
| — |
| — |
| — |
| — |
| — |
| (132 | ) | (132 | ) | — |
| — |
| — |
| — |
| — |
| — |
| (0.2 | ) | (0.2 | ) |
| Adjustments to beginning Retained Earnings resulting from newly adopted accounting pronouncements (see FN 2) | — |
| — |
| — |
| 1,168 |
| — |
| 1,168 |
| — |
| 1,168 |
| |
| Adjustments to beginning Retained Earnings resulting from newly adopted accounting pronouncements | | — |
| — |
| — |
| 1.2 |
| — |
| 1.2 |
| — |
| 1.2 |
|
| Balance, December 31, 2018 | | 18,125,201 |
| $ | 6.8 |
| $ | 28.5 |
| $ | 316.3 |
| $ | (37.2 | ) | $ | 314.4 |
| $ | 1.9 |
| $ | 316.3 |
|
| Net Earnings | | — |
| — |
| — |
| 45.8 |
| — |
| 45.8 |
| 0.1 |
| 45.9 |
|
| Other Comprehensive Loss | | — |
| — |
| — |
| — |
| (1.3 | ) | (1.3 | ) | — |
| (1.3 | ) |
| Issue Stock for Directors, Employee Benefit and Stock Plans, net of related tax withholdings of 12,198 shares | | 210,809 |
| 0.1 |
| 5.1 |
| — |
| — |
| 5.2 |
| — |
| 5.2 |
|
| Share-Based Compensation | | — |
| — |
| 11.4 |
| — |
| — |
| 11.4 |
| — |
| 11.4 |
|
| Dividends paid $0.88 per Common Share | | — |
| — |
| — |
| (16.0 | ) | — |
| (16.0 | ) | — |
| (16.0 | ) |
| Purchase of Noncontrolling Interests | | — |
| — |
| 0.5 |
| — |
| — |
| 0.5 |
| (0.5 | ) | — |
|
| Other | — |
| — |
| — |
| — |
| — |
| — |
| (35 | ) | (35 | ) | — |
| — |
| — |
| (0.1 | ) | — |
| (0.1 | ) | (0.1 | ) | (0.2 | ) |
| Balance, December 31, 2018 | 18,125,201 |
| $ | 6,797 |
| $ | 28,550 |
| $ | 316,269 |
| $ | (37,194 | ) | $ | 314,422 |
| $ | 1,930 |
| $ | 316,352 |
| |
| Balance, December 31, 2019 | | 18,336,010 |
| $ | 6.9 |
| $ | 45.5 |
| $ | 346.0 |
| $ | (38.5 | ) | $ | 359.9 |
| $ | 1.4 |
| $ | 361.3 |
|
NOTES TO THE CONSOLIDATED FINANCIAL STATEMENTS
(In thousands,Tables in millions, except shares and per share data)
| |
| 1. | Summary of Significant Accounting Policies |
Nature of Operations – Tennant Company isWe are a world leader in designing, manufacturing and marketing solutions that empower customers to achieve quality cleaning performance, significantly reduce environmental impact and help create a cleaner, safer, healthier world. Tennant offersWe offer products and solutions consisting of mechanized cleaning equipment, detergent-free and other sustainable cleaning technologies, aftermarket parts and consumables, equipment maintenance and repair service, specialty surface coatings, and business solutions such as financing, rental and leasing programs, and machine-to-machine asset management solutions. TennantOur products are used in many types of environments including: Retail establishments, distribution centers, factories and warehouses, public venues such as arenas and stadiums, office buildings, schools and universities, hospitals and clinics, parking lots and streets, and more. Customers include contract cleaners to whom organizations outsource facilities maintenance, as well as businesses that perform facilities maintenance themselves. The Company reaches these customers through the industry's largest direct sales and service organization and through a strong and well-supported network of authorized distributors worldwide.
Reclassification –We reclassified $6.6 million of payroll tax accruals from Other Current Liabilities to Employee Compensation and Benefits in the Consolidated Balance Sheet at December 31, 2018 to conform to the current year presentation. This reclassification is also reflected in the Consolidated Statement of Cash Flows for the years ended December 31, 2018 and 2017.
Consolidation – The Consolidated Financial Statements include the accounts of Tennantthe Company and its subsidiaries. All intercompany transactions and balances have been eliminated. In these Notes to the Consolidated Financial Statements, Tennant Company is referred to as “Tennant,” “we,” “us,” or “our.”
Translation of Non-U.S. Currency – Foreign currency-denominated assets and liabilities have been translated to U.S. dollars at year-end exchange rates, while income and expense items are translated at average exchange rates prevailing during the year. Gains or losses resulting from translation are included as a separate component of Accumulated Other Comprehensive Loss. The balance of cumulative foreign currency translation adjustments recorded within Accumulated Other Comprehensive Loss as of December 31, 20182019, 20172018 and 20162017 was a net loss of $31,831, $15,778$36.3 million, $31.9 million and $44,444,$15.8 million, respectively. The majority of translation adjustments are not adjusted for income taxes as substantially all translation adjustments relate to permanent investments in non-U.S. subsidiaries. Net Foreign Currency Transaction Losses are included in Other Income (Expense)., Net.
Use of Estimates – In preparing the consolidated financial statements in conformity with U.S. generally accepted accounting principles ("U.S. GAAP"), management must make decisions that impact the reported amounts of assets, liabilities, revenues, expenses and the related disclosures, including disclosures of contingent assets and liabilities. Such decisions include the selection of the appropriate accounting principles to be applied and the assumptions on which to base accounting estimates. Estimates are used in determining, among other items, sales promotions and incentives accruals, inventory valuation, warranty reserves, allowance for doubtful accounts, pension and postretirement accruals, useful lives for intangible assets, and future cash flows associated with impairment testing for Goodwill and other long-lived assets. These estimates and assumptions are based on management’s best estimates and judgments. Management evaluates its estimates and assumptions on an ongoing basis using historical experience and other factors that management believes to be reasonable under the circumstances. We adjust such estimates and assumptions when facts and circumstances dictate. A number of these factors include, among others, economic conditions, credit markets, foreign currency, commodity cost volatility and consumer spending and confidence, all of which have combined to increase the uncertainty inherent in such estimates and assumptions. As future events and their effects cannot be determined with precision, actual amounts could differ significantly from those estimated at the time the consolidated financial statements are prepared. Changes in those estimates resulting from continuing changes in the economic environment will be reflected in the financial statements in future periods.
Cash and Cash Equivalents – We consider all highly liquid investments with original maturities of three months or less from the date of purchase to be cash equivalents.
Restricted Cash – We have a total of $525$0.5 million as of December 31, 2019 and 2018 that serves as collateral backing certain bank guarantees and is therefore restricted. This money is invested in time deposits.
Receivables – Credit is granted to our customers in the normal course of business. Receivables are recorded at original carrying value less reserves for estimated uncollectible accounts and sales returns. To assess the collectability of these receivables, we perform ongoing credit evaluations of our customers’ financial condition. Through these evaluations, we may become aware of a situation where a customer may not be able to meet its financial obligations due to deterioration of its financial viability, credit ratings or bankruptcy. The reserve requirements are based on the best facts available to us and are reevaluated and adjusted as additional information becomes available. Our reserves are also based on amounts determined by using percentages applied to trade receivables. These percentages are determined by a variety of factors including, but not limited to, current economic trends, historical payment and bad debt write-off experience. An account is considered past-due or delinquent when it has not been paid within the contractual terms. Uncollectible accounts are written off against the reserves when it is deemed that a customer account is uncollectible.
Inventories – Inventories are valued at the lower of cost or net realizable value. Cost is determined on a first-in, first-out (“FIFO”) basis except for Inventories in North America, which are determined on a last-in, first-out (“LIFO”) basis.
Property, Plant and Equipment – Property, plant and equipment is carried at cost. Additions and improvements that extend the lives of the assets are capitalized, while expenditures for repairs and maintenance are expensed as incurred. We generally depreciate buildings and improvements by the straight-line method over a life of 30 years. Other property, plant and equipment are generally depreciated using the straight-line method based on lives of 3 years to 15 years.
Leases –We assess whether an arrangement is a lease at inception.
Operating leases with an initial term of 12 months or less are expensed as incurred as short-term lease cost. We have elected the practical expedient to not separate lease and non-lease components for all asset classes. Operating lease assets and operating lease liabilities are calculated based on the present value of the future lease payments over the lease term at the lease commencement date. When future lease payments are based on an index or rate, operating lease assets and operating lease liabilities are calculated using the prevailing index or rate at the lease commencement date. As the implicit rate is not readily determinable, we use our incremental borrowing rate based on the information available at the lease start date in determining the present value of future
NOTES TO THE CONSOLIDATED FINANCIAL STATEMENTS
(In thousands,Tables in millions, except shares and per share data)
Equity Method Investment – Investmentspayments. Information used in determining the incremental borrowing rates for the Company's leases includes: (1) the market yield on the Company's traded bond, adjusted for the presence of collateral and the difference in terms of the bond and the leases, (2) consideration of the currency in which each lease was denominated, and (3) the lease term. The operating lease asset is increased by any lease payments made at or before the lease start date, increased by initial direct costs incurred, and reduced by lease incentives. The lease term includes options to renew or terminate the lease when it is reasonably certain that we havewill exercise that option. The exercise of lease renewal options is at our sole discretion. The useful life of lease assets and leasehold improvements are limited by the abilitylease term, unless there is a transfer of title or purchase option reasonably certain of exercise. Certain leases also include options to exercise significant influence, but dopurchase the leased asset. Lease expense for operating leases is recognized on a straight-line basis over the lease term. Certain leases contain variable lease payments for items such as index-based changes in rent, fuel and common area maintenance, which we expense as incurred as variable lease cost.
Finance leases are not control,material to our Consolidated Financial Statements.
Further details regarding leases are accounted for under the equity method of accountingdiscussed in Notes 2 and are included in Other Assets on the Consolidated Balance Sheets. Under this method of accounting, our share of the net earnings or losses of the investee are presented as a component of Other Expense, Net on the Consolidated Statements of Operations. The detail regarding our equity method investment in i-team North America B.V., a joint venture that operates as the distributor of the i-mop in North America, is further described in Note 5.15.
Goodwill – Goodwill represents the excess of cost over the fair value of net assets of businesses acquired. We analyze Goodwill on an annual basis as of year-end and when an event occurs or circumstances change that may reduce the fair value of one of our reporting units below its carrying amount. A goodwill impairment occurs if the carrying amount of a reporting unit exceeds its fair value. In assessing the recoverability of Goodwill, we use an analysis of qualitative factors to determine whether it is more likely than not that the fair value of a reporting unit is less than its carrying amount as a basis for determining whether it is necessary to perform the quantitative impairment test.
Intangible Assets – Intangible Assets consist of definite lived customer lists, trade names and technology. Generally, intangible assets classified as trade names are amortized on a straight-line basis and intangible assets classified as customer lists or technology are amortized using an accelerated method of amortization.
Impairment of Long-lived Assets and Assets Held for Sale – We periodically review our intangible and long-lived assets for impairment and assess whether events or circumstances indicate that the carrying amount of the assets may not be recoverable. We generally deem an asset group to be impaired if an estimate of undiscounted future operating cash flows is less than its carrying amount. If impaired, an impairment loss is recognized based on the excess of the carrying amount of the individual asset group over its fair value.
Assets held for sale are measured at the lower of their carrying value or fair value less costs to sell. Upon retirement or disposition, the asset cost and related accumulated depreciation or amortization are removed from the accounts and a gain or loss is recognized based on the difference between the fair value of proceeds received and carrying value of the assets held for sale.
Purchase of Common Stock – We repurchase our Common Stock under 2016 and 2015 repurchase programs authorized by our Board of Directors. These programs allow us to repurchase up to an aggregate of 1,392,892 shares of our Common Stock. Upon repurchase, the par value is charged to Common Stock and the remaining purchase price is charged to Additional Paid-in Capital. If the amount of the remaining purchase price causes the Additional Paid-in Capital account to be in a debitnegative position, this amount is then reclassified to Retained Earnings. Common Stock repurchased is included in shares authorized but is not included in shares outstanding.
Warranty – We record a liability for estimated warranty claims at the time of sale. The amount of the liability is based on the trend in the historical ratio of claims to sales, the historical length of time between the sale and resulting warranty claim, new product introductions and other factors. In the event we determine that our current or future product repair and replacement costs exceed our estimates, an adjustment to these reserves would be charged to earnings in the period such determination is made. Warranty terms on machines range from one1 to four4 years. However, the majority of our claims are paid out within the first six to nine months following a sale. The majority of the liability for estimated warranty claims represents amounts to be paid out in the near term for qualified warranty issues, with immaterial amounts reserved to be paid out for older equipment warranty issues. Warranty costs are recorded as a component of Selling and Administrative Expense in the Consolidated Statements of Operations.
Debt Issuance Costs – We record all applicable debt issuance costs related to a recognized debt liability in the Consolidated Balance Sheets as a direct deduction from the carrying amount of the debt liability, if not a line-of-credit arrangement. All debt issuance costs related to line-of-credit arrangements are recorded as part of Other Assets in the Consolidated Balance Sheets and subsequently amortized over the term of the line-of-credit arrangement.Sheets. We amortize our debt issuance costs using the effective interest method over the term of the debt instrument or line-of-credit arrangement. Amortization of these costs is included as part of Interest Expense in the Consolidated Statements of Operations.
Environmental – We record a liability for environmental clean-up on an undiscounted basis when a loss is probable and can be reasonably estimated.
Pension and Profit Sharing Plans – Substantially all U.S. employees are covered by various retirement benefit plans, including postretirement medical plans, defined benefit pension plans and defined contribution savings plans. Pension plan costs are accrued based on actuarial estimates with the required pension cost funded annually, as needed. No new participants have entered the defined benefit pension plan since 2000 and no new participants have entered the postretirement medical plan since 1998. Retirement benefits for eligible employees in foreign locations are funded principally through defined benefit plans, annuity or government programs. For further details regarding our pension and profit sharing plans, see Note 15.13.
Postretirement Benefits – We accrue and recognize the cost of retiree health benefits over the employees’ period of service based on actuarial estimates. Benefits are only available for U.S. employees hired before January 1, 1999.
Derivative Financial Instruments – In countries outside the U.S., we transact business in U.S. dollars and in various other currencies. We hedge our net recognized foreign currency denominatedcurrency-denominated assets and liabilities with foreign exchange forward contracts to reduce the risk that the value of these assets and liabilities will be adversely affected by changes in exchange rates. We may also use foreign exchange option contracts or forward contracts to hedge certain cash flow exposures resulting from changes in foreign currency exchange rates. We enter into these foreign exchange contracts to hedge a portion of our forecasted currency denominatedcurrency-denominated revenue in the normal course of business, and accordingly, they are not speculative in nature.
NOTES TO THE CONSOLIDATED FINANCIAL STATEMENTS
(In thousands,Tables in millions, except shares and per share data)
We account for our foreign currency hedging instruments as either assets or liabilities on the balance sheet and measure them at fair value. Gains and losses resulting from changes in fair value are accounted for depending on the use of the derivative and whether it is designated and qualifies for hedge accounting. Gains and losses from foreign exchange forward contracts that hedge certain balance sheet positions are recorded each period to Net Foreign Currency Transaction Losses in our Consolidated Statements of Operations. Foreign exchange option contracts or forward contracts hedging forecasted foreign currency revenue are designated as cash flow hedges under accounting for derivative instruments and hedging activities, with gains and losses recorded each period to Accumulated Other Comprehensive Loss in our Consolidated Balance Sheets, until the forecasted transaction occurs. When the forecasted transaction occurs, we reclassify the related gain or loss on the cash flow hedge to Net Sales. In the event the underlying forecasted transaction does not occur, or it becomes probable that it will not occur, we reclassify the gain or loss on the related cash flow hedge from Accumulated Other Comprehensive Loss to Net Foreign Currency Transaction Losses in our Consolidated Statements of Operations at that time. If we do not elect hedge accounting, or the contract does not qualify for hedge accounting treatment, the changes in fair value from period to period are recorded in Net Foreign Currency Transaction Losses in our Consolidated Statements of Operations. See Note 1311 for additional information regarding our hedging activities.
Revenue Recognition – Revenue is recognized upon transfer of control of promised products or services to customers in an amount that reflects the consideration we expect to receive in exchange for those products and services. Generally, these criteria are met at the time the product is shipped.
We also enter into contracts that can include combinations of products and services, which are generally capable of being distinct and are accounted for as separate performance obligations. Revenue is recognized net of allowances for returns and any taxes collected from customers, which are subsequently remitted to governmental authorities.
Further details regarding revenue recognition are discussed in Notes 2 and 4.
Share-based Compensation – We account for employee share-based compensation using the fair value based method. Our share-based compensation plans are more fully described in Note 19.
Research and Development – Research and development costs are expensed as incurred.
Advertising Costs –We advertise products, technologies and solutions to customers and prospective customers through a variety of marketing campaign and promotional efforts. These efforts include tradeshows, online advertising, e-mail marketing, mailings, sponsorships and telemarketing. Advertising costs are expensed as incurred. In 2018, 2017 and 2016, such activities amounted to $8,767, $8,228 and $7,269, respectively.
Income Taxes – Deferred tax assets and liabilities are recognized for the expected future tax consequences of temporary differences between the book and tax bases of existing assets and liabilities. A valuation allowance is provided when, in management’s judgment, it is more likely than not that some portion or all of the deferred tax asset will not be realized. We have established contingent tax liabilities using management’s best judgment. We follow guidance provided by Accounting Standards Codification ("ASC") 740, Income Taxes, regarding uncertainty in income taxes, to record these contingent tax liabilities (refer to Note 18 for additional information). We adjust these liabilities as facts and circumstances change. Interest Expense is recognized in the first period the interest would begin accruing. Penalties are recognized in the period we claim or expect to claim the position in our tax return. Interest and penalty expenses are classified as an income tax expense.
Sales Tax –Sales taxes collected from customers and remitted to governmental authorities are presented on a net basis.
Earnings per Share – Basic earnings (loss) per share is computed by dividing Net Earnings (Loss) Attributable to Tennant Company by the Weighted Average Shares Outstanding during the period. Diluted earnings per share assumes conversion of potentially dilutive stock options, performance shares, restricted shares and restricted stock units. These conversions are not included in our computation of diluted earnings per share if we have a net loss attributable to Tennant Company in a reporting period, as the effects are anti-dilutive.
New Accounting Pronouncements - In February 2016, the FASB issued ASU No. 2016-02, Leases (Topic 842). This ASU changes current U.S. GAAP for lessees to recognize lease assets and lease liabilities on the balance sheet for those leases classified as operating leases under previous U.S. GAAP. Under the new guidance, lessor accounting is largely unchanged. The amendments in this ASU are effective for annual periods beginning after December 15, 2018, including interim periods within that reporting period, which is our fiscal 2019.
We have elected to apply the standard on a prospective basis with an adjustment to retained earnings in the first period of adoption. We have also elected the package of practical expedients, which permits us not to reassess our prior conclusions about lease identification, lease classification and initial direct costs. In addition, we have elected the short-term lease recognition whereby we will not recognize operating lease related assets or liabilities for leases with a lease term less than one year. We have also elected to not separate lease and non-lease components for all of our leases. We will not be electing the hindsight practical expedient to determine the reasonably certain term of existing leases.
We are continuing to evaluate the impact of this amended guidance on our consolidated financial statements and related disclosures. We expect the adoption of this standard will have a material impact on the consolidated balance sheets for recognition of operating lease related assets and liabilities. We do not expect a material impact to the consolidated statements of operations. We are unable to quantify the impact at this time as the lease software required to calculate the impact due to the volume of our lease data has not yet been implemented. We are also in the process of implementing controls to ensure compliance with the new lease accounting standard. We expect to be complete with implementation activities by the end of the first quarter of 2019 and will provide appropriate disclosures at that time.
NOTES TO THE CONSOLIDATED FINANCIAL STATEMENTS
(In thousands, except shares and per share data)
| |
2. | Newly Adopted Accounting Pronouncements |
Revenue from Contracts with Customers
On January 1, 2018, we adopted Accounting Standards Update ("ASU") No. 2014-09, Revenue from Contracts with Customers (Topic 606) and all the related amendments ("new revenue standard") to all contracts not completed at the date of initial application using the modified retrospective method. The cumulative effect of initially applying the new revenue standard as an adjustment to the opening balance of retained earnings was not material to the company. The comparative information has not been restated and continues to be reported under the accounting standards in effect for those periods, and there are no material differences between the reported results under the new revenue standard and those that would have been reported under legacy U.S. GAAP.
The new revenue standard also required us to record a refund liability and a corresponding asset for our right to recover products from customers upon settling the refund liability to account for the transfer of products with a right of return. The impact of this provision of the new revenue standard is immaterial to our financial statements. The new revenue standard also provided additional clarity that resulted in a reclassification from the Accounts Receivable to Other Current Liabilities to reflect a change in the presentation of our sales return reserves on the balance sheet, which were previously recorded net of Accounts Receivable. Provisions for estimated sales returns will continue to be recorded at the time the related revenue is recognized.
The reclassification from Accounts Receivable to Other Current Liabilities in accordance with the detail described above impacted the Condensed Consolidated Balance Sheet as of December 31, 2018, as follows (in thousands):
|
| | | | | | | | | | | |
| | As Reported | | Balance Without Adoption of ASC 606 | | Effect of Change Higher/(Lower) |
| ASSETS | | | | | |
| Accounts Receivable | $ | 216,170 |
| | $ | 214,858 |
| | $ | 1,312 |
|
| Total Current Assets | 468,644 |
| | 467,332 |
| | $ | 1,312 |
|
| Total Assets | $ | 992,544 |
| | $ | 991,232 |
| | $ | 1,312 |
|
| LIABILITIES | | | | | |
| Other Current Liabilities | $ | 71,895 |
| | $ | 70,583 |
| | $ | 1,312 |
|
| Total Current Liabilities | 248,874 |
| | 247,562 |
| | $ | 1,312 |
|
| Total Liabilities | $ | 676,192 |
| | $ | 674,880 |
| | $ | 1,312 |
|
Intra-Entity Transfers of Assets Other than Inventory
On January 1, 2018, we adopted ASU No. 2016-16, Income Taxes (Topic 740): Intra-Entity Transfers of Assets Other than Inventory. The ASU requires the tax effects of all intra-entity sales of assets other than inventory to be recognized in the period in which the transaction occurs. The adoption of this ASU resulted in a $94 cumulative effect adjustment recorded in Retained Earnings as of the beginning of 2018 that reflects a $1,281 reduction in a long-term deferred charge, mostly offset by the establishment of deferred tax assets of $1,187. The reduction in the long-term asset and establishment of the deferred tax asset impacted Other Assets and Deferred Income Taxes, respectively, on our Condensed Consolidated Balance Sheets.
Statement of Cash Flows – Restricted Cash
On January 1, 2018, we adopted ASU No. 2016-18, Statement of Cash Flows (Topic 230): Restricted Cash. The ASU requires companies to explain the changes in the combined total of restricted and unrestricted balances in the Condensed Consolidated Statements of Cash Flows. Therefore, amounts generally described as restricted cash or restricted cash equivalents should be combined with unrestricted cash and cash equivalents when reconciling the beginning and end of period balances on the Condensed Consolidated Statement of Cash Flows. In accordance with the ASU, we adopted the standard on a retrospective basis to all periods presented.
Compensation – Retirement Benefits
On January 1, 2018, we adopted ASU No. 2017-07, Compensation—Retirement Benefits (Topic 715): Improving the Presentation of Net Periodic Pension Cost and Net Periodic Postretirement Benefit Cost. The ASU requires employers to report the service cost component of net pension and postretirement benefit costs in the same line item or items as other compensation costs arising from services rendered by the pertinent employees during the period. The other components of net pension and postretirement benefit costs are required to be presented in the Condensed Consolidated Statements of Operations separately from the service cost component in nonoperating expenses. In accordance with the ASU, we adopted the standard on a retrospective basis to all periods presented. As a result, we reclassified $5,974 of net benefit costs and $233 of net benefit credits from Selling and Administrative Expense to Other Expense, Net on the Condensed Consolidated Statements of Operations for the twelve months ended December 31, 2017 and December 31, 2016, respectively. The reclassification represents the other components of net pension and postretirement benefit costs that are now presented in the Condensed Consolidated Statements of Operations separately from the service cost in Total Other Expense, Net. As a basis for the retrospective application of the ASU, we used the practical expedient that permits us to use the amounts disclosed for the various components of net benefit cost in Note 15.
Income Statement – Reporting Comprehensive Income
On January 1, 2018, we elected to adopt early ASU No. 2018-02, Income Statement—Reporting Comprehensive Income (Topic 220). The ASU gives companies the option to reclassify stranded tax effects caused by the newly enacted legislation referred to as the Tax Cuts and Jobs Act (the "Tax Act") from Accumulated Other Comprehensive Loss to Retained Earnings. The adoption resulted in a $1,262 cumulative effect adjustment which increased Retained
NOTES TO THE CONSOLIDATED FINANCIAL STATEMENTS
(In thousands, except shares and per share data)
Earnings as of the beginning of 2018 and reduced the deferred income tax benefits in Accumulated Other Comprehensive Loss relating to cash flow hedges and pension and retiree medical benefits.
Income Taxes
In March 2018, we adopted ASU No. 2018-05, Income Taxes (Topic 740): Amendments to SEC paragraphs Pursuant to SEC Staff Accounting Bulletin No. 118. The ASUupdates the income tax accounting in U.S. GAAP to reflect the SEC interpretive guidance released on December 22, 2017, when the Tax Act was signed into law. Additional information regarding the adoption of this standard is contained in Note 18.
| |
3. | Revision of Prior Period Financial Statements |
Subsequent to the issuance of our consolidated financial statements for the quarter and year-to-date periods ended September 30, 2018, management identified misclassifications between Cost of Sales and Selling and Administrative Expense in our Consolidated Statements of Operations. As a result of revising prior period financial statement amounts for these misclassifications, Cost of Sales increased $4,608 and Selling and Administrative Expense decreased $4,608 for the year ended December 31, 2017. There were no misclassifications identified for the year ended December 31, 2016. These revisions had no impact on Profit (Loss) Before Income Taxes. The revisions also had no impact on our Consolidated Statements of Comprehensive Income, Consolidated Statements of Equity, Consolidated Balance Sheets, or Consolidated Statements of Cash Flow. Management evaluated the materiality of the revisions from a quantitative and qualitative perspective and concluded that the revisions are immaterial to our consolidated financial statements.
Revisions to amounts in previously filed quarterly financial statements from 2018 and 2017 are reflected in Note 22.
| |
4. | Revenue from Contracts with Customers |
Under the new revenue standard, revenue is recognized when control transfers under the terms of the contract with our customers. Revenue is measured as the amount of consideration we expect to receive in exchange for transferring goods or providing services. Sales and other taxes we collect concurrent with revenue-producing activities are excluded from revenue. We do not account for shipping and handling as a distinct performance obligation as we generally perform shipping and handling activities after we transfer control of goods to the customer. We have elected to account for shipping and handling costs associated with outbound freight after control of goods has transferred to a customer as a fulfillment cost. Incidental items that are immaterial in the context of the contract are not recognized as a separate performance obligation. We do not have any significantly extended payment terms as payment is generally received within one year of the point of sale.
In general, we transfer control and recognize a sale at the point in time when products are shipped from our manufacturing facilities both direct to consumers and to distributors. Service revenue is recognized in the period the service is performed or ratably over the period of the related service contract. Consideration related to service contracts is deferred if the proceeds are received in advance of the satisfaction of the performance obligations and recognized over the contract period as the performance obligation is met. We use an output method to measure progress toward completion for certain prepaid service contracts, as this method appropriately depicts performance towardstoward satisfaction of the performance obligations.
For contracts with multiple performance obligations (i.e., a product and service component), we allocate the transaction price to the performance obligations in proportion to their stand-alone selling prices. We use an observable price to determine the stand-alone selling price for separate performance obligations. When allocating on a relative stand-alone selling price basis, any discounts contained within the contract are allocated proportionately to all of the performance obligations in the contract.
We generally expense the incremental costs of obtaining a contract when incurred because the amortization period would be less than one year. These costs relate primarily to sales commissions and are recorded in Selling and Administrative Expense in the Consolidated Statements of Operations.
We do not disclose the value of unsatisfied performance obligations for contracts with an original expected length of one year or less. In addition, we do not adjust the promised amount of consideration for the effects of a significant financing component if we expect, at contract inception, that the period between when we transfer a promised good or service to a customer and when the customer pays for that good or service will be one year or less.
We adopted ASU No. 2014-9, Revenue from Contracts with Customers,(Topic 606), in January 2018 using the modified retrospective method. Further details regarding revenue recognition are discussed in Note 3.
Share-based Compensation – We account for employee share-based compensation using the fair value based method. Our share-based compensation plans are more fully described in Note 18.
Research and Development – Research and development costs are expensed as incurred.
Advertising Costs –We advertise products, technologies and solutions to customers and prospective customers through a variety of marketing campaign and promotional efforts. These efforts include tradeshows, online advertising, e-mail marketing, mailings, sponsorships and telemarketing. Advertising costs are expensed as incurred. In 2019, 2018 and 2017, such activities amounted to $8.2 million, $8.8 million and $8.2 million, respectively.
Income Taxes – Deferred tax assets and liabilities are recognized for the expected future tax consequences of temporary differences between the book and tax bases of existing assets and liabilities. A valuation allowance is provided when, in management’s judgment, it is more likely than not that some portion or all of the deferred tax asset will not be realized. We have established uncertain tax position accruals using management’s best judgment. We follow guidance provided by Accounting Standards Codification (ASC) 740, Income Taxes, regarding uncertainty in income taxes, to record these uncertain tax position accruals (refer to Note 17 for additional information). We adjust these accruals as facts and circumstances change. Interest expense is recognized in the first period the interest would begin accruing. Penalties are recognized in the period we claim or expect to claim the position in our tax return. Interest and penalty expenses are classified as an income tax expense.
Earnings per Share – Basic earnings (loss) per share is computed by dividing Net Earnings (Loss) Attributable to Tennant Company by the Weighted Average Shares Outstanding during the period. Diluted earnings per share assumes conversion of potentially dilutive stock options, performance shares, restricted shares and restricted stock units. These conversions are not included in our computation of diluted earnings per share if we have a net loss attributable to the Company in a reporting period or if the instruments are out-of-the-money, as the effects are anti-dilutive.
New Accounting Pronouncements –In June 16, 2016, the FASB issued ASU No. 2016-13, Financial Instruments-Credit Losses (Topic 326): Measurement of Credit Losses on Financial Instruments. This ASU improves financial reporting by requiring more timely recording of credit losses on loans and other financial instruments held by financial institutions and other organizations. Under the new guidance, the ASU requires an organization to measure all expected credit losses for financial assets held at the reporting date based on historical experience, current conditions, and reasonable and supportable forecasts. The amendments in this ASU are effective for annual periods beginning after December 15, 2019, including interim periods within that reporting period, which is our
NOTES TO THE CONSOLIDATED FINANCIAL STATEMENTS
(Tables in millions, except shares and per share data)
fiscal 2020. Early application is permitted. We adopted this ASU in January 2020. We evaluated the impact of this amended guidance on our consolidated financial statements and related disclosures and concluded that it is immaterial.
In August 2018, the FASB issued ASU No. 2018-14, Compensation-Retirement Benefits- Defined Benefit Plans-General (Subtopic 715-20):Disclosure Framework-Changes to the Disclosure Requirements for Defined Benefit Plans which updates disclosure requirements for defined benefit pension and other postretirement plans. This ASU is effective for annual periods ending after December 15, 2020, which is our fiscal 2021. Early application is permitted. We will adopt this ASU in the fourth quarter of 2020. We expect the impact of this amended guidance on our disclosures to be immaterial.
In December 2019, the FASB issued ASU No. 2019-12, Income Taxes (Topic 740): Simplifying the Accounting for Income Taxes, which simplifies the accounting for income taxes by removing certain exceptions to the general principles in Topic 740. The amendment is effective for interim and annual periods beginning after December 15, 2020. Early adoption is permitted. We plan to adopt this ASU in the first quarter of 2021. We are still evaluating the impact of this amended guidance on our consolidated financial statements and related disclosures.
Further details regarding the adoption of new accounting standards are discussed in Note 2.
| |
| 2. | Newly Adopted Accounting Pronouncements |
Leases
On January 1, 2019, we adopted ASU No. 2016-02, Leases (Topic 842). This ASU requires lessees to recognize operating lease assets and operating lease liabilities on the balance sheet. Under the new guidance, lessor accounting is largely unchanged.
We have elected to adopt the standard on the modified retrospective basis. We have also elected the package of practical expedients, which permits us not to reassess our prior conclusions about lease identification, lease classification and initial direct costs. In addition, we have elected the short-term lease recognition whereby we will not recognize operating lease related assets or liabilities for leases with a lease term less than one year. We have also elected the practical expedient to not separate lease and non-lease components for our asset classes. We did not elect the hindsight practical expedient to determine the reasonably certain term of existing leases.
The impact of adopting the new lease standard was the recognition of $44.8 million of lease assets and lease liabilities related to our operating leases. The adoption of the new lease standard had no impact to our Consolidated Statements of Earnings, Consolidated Statements of Cash Flows or Consolidated Statements of Equity.
Derivatives and Hedging
On January 1, 2019, we adopted ASU No. 2017-12, Derivatives and Hedging, and all the related amendments to Accounting Standards Codification Topic 815 which aligns hedge accounting with risk management activities and simplifies the requirements to qualify for hedge accounting. Adoption did not have a material impact on our financial statements.
3.Revenue
Revenue is recognized upon transfer of control of promised products or services to customers in an amount that reflects the consideration we expect to receive in exchange for those products and services. Generally, these criteria are met at the time the product is shipped.
We also enter into contracts that can include combinations of products and services, which are generally capable of being distinct and are accounted for as separate performance obligations. Revenue is recognized net of allowances for returns and any taxes collected from customers, which are subsequently remitted to governmental authorities.
Further information on revenue recognition is described in Note 1.
Disaggregation of Revenue
The following tables illustrate the disaggregation of revenue by geographic area, groups of similar products and services and sales channels for the twelve monthsyears ended December 31, 2019, 2018 and 2017 and 2016 (in thousands)millions):
Net Sales by geographic area
| | | | | Twelve Months Ended | | Years Ended |
| | | December 31 | | December 31 |
| | | 2018 | | 2017 | | 2016 | | 2019 | | 2018 | | 2017 |
| Americas | | $ | 690,996 |
| | $ | 640,274 |
| | $ | 607,026 |
| | $ | 722.4 |
| | $ | 691.0 |
| | $ | 640.3 |
|
| Europe, Middle East and Africa | | 335,603 |
| | 273,738 |
| | 129,046 |
| | 307.6 |
| | 335.6 |
| | 273.7 |
|
| Asia Pacific | | 96,912 |
| | 89,054 |
| | 72,500 |
| | 107.6 |
| | 96.9 |
| | 89.1 |
|
| Total | | $ | 1,123,511 |
| | $ | 1,003,066 |
| | $ | 808,572 |
| | $ | 1,137.6 |
| | $ | 1,123.5 |
| | $ | 1,003.1 |
|
Net Sales are attributed to each geographic area based on the end user country and are net of intercompany sales.
NOTES TO THE CONSOLIDATED FINANCIAL STATEMENTS
(In thousands,Tables in millions, except shares and per share data)
Net Sales by groups of similar products and services
| | | | | Twelve Months Ended | | Years Ended |
| | | December 31 | | December 31 |
| | | 2018 | | 2017 | | 2016 | | 2019 | | 2018 | | 2017 |
| Equipment | | $ | 729,993 |
| | $ | 636,875 |
| | $ | 491,075 |
| | $ | 742.7 |
| | $ | 730.0 |
| | $ | 636.9 |
|
| Parts and Consumables | | 222,345 |
| | 202,452 |
| | 173,632 |
| | 221.0 |
| | 222.3 |
| | 202.5 |
|
| Specialty Surface Coatings | | 29,827 |
| | 31,407 |
| | 29,146 |
| | 25.7 |
| | 29.8 |
| | 31.4 |
|
| Service and Other | | 141,346 |
| | 132,332 |
| | 114,719 |
| | 148.2 |
| | 141.4 |
| | 132.3 |
|
| Total | | $ | 1,123,511 |
| | $ | 1,003,066 |
| | $ | 808,572 |
| | $ | 1,137.6 |
| | $ | 1,123.5 |
| | $ | 1,003.1 |
|
Net Sales by sales channel
|
| | | | | | | | | | | | |
| | | Years Ended |
| | | December 31 |
| | | 2019 | | 2018 | | 2017 |
| Sales Direct to Consumer | | $ | 750.9 |
| | $ | 735.2 |
| | $ | 674.5 |
|
| Sales to Distributors | | 386.7 |
| | 388.3 |
| | 328.6 |
|
| Total | | $ | 1,137.6 |
| | $ | 1,123.5 |
| | $ | 1,003.1 |
|
|
| | | | | | | | | | | | |
| | | Twelve Months Ended |
| | | December 31 |
| | | 2018 | | 2017 | | 2016 |
| Sales Direct to Consumer | | $ | 735,244 |
| | $ | 674,495 |
| | $ | 609,538 |
|
| Sales to Distributors | | 388,267 |
| | 328,571 |
| | 199,034 |
|
| Total | | $ | 1,123,511 |
| | $ | 1,003,066 |
| | $ | 808,572 |
|
Contract Liabilities
Sales Returns
The right of return may exist explicitly or implicitly with our customers. When the right of return exists, we adjust the transaction price for the estimated effect of returns. We estimate the expected returns using the expected value method by assessing historical sales levels and the timing and magnitude of historical sales return levels as a percent of sales and projecting this experience into the future.
Sales Incentives
Our sales contracts may contain various customer incentives, such as volume-based rebates or other promotions. We reduce the transaction price for certain customer programs and incentive offerings that represent variable consideration. Sales incentives given to our customers are recorded using the most likely amount approach for estimating the amount of consideration to which the companyCompany will be entitled. We forecast the most likely amount of the incentive to be paid at the time of sale, update this forecast quarterly, and adjust the transaction price accordingly to reflect the new amount of incentives expected to be earned by the customer. A majority of our customer incentives are settled within one year. We record our accruals for volume-based rebates and other promotions in Other Current Liabilities on our Condensed Consolidated Balance Sheets.
The change in our sales incentive accrual balance for the twelve monthsyears ended December 31, 2019 and 2018 was as follows:
|
| | | | | | | |
| | Years Ended |
| | December 31 |
| | 2019 | | 2018 |
| Beginning balance | $ | 16.7 |
| | $ | 13.5 |
|
| Additions to sales incentive accrual | 24.7 |
| | 30.5 |
|
| Contract payments | (27.7 | ) | | (27.0 | ) |
| Foreign currency fluctuations | — |
| | (0.3 | ) |
| Ending balance | $ | 13.7 |
| | $ | 16.7 |
|
|
| | | | | |
| | Twelve Months Ended |
| | December 31 |
| | 2018 |
| Beginning balance | $ | 13,466 | |
| Additions to sales incentive accrual | 30,458 | |
| Contract payments | (26,992 | ) |
| Foreign currency fluctuations | (280 | ) |
| Ending balance | $ | 16,652 | |
Deferred Revenue
We sell separately priced prepaid contracts to our customers where we receive payment at the inception of the contract and defer recognition of the consideration received because we have to satisfy future performance obligations. Our deferred revenue balance is primarily attributed to prepaid maintenance contracts on our machines ranging from 12 months to 60 months. In circumstances where prepaid contracts are sold simultaneously with machines, we use an observable price to determine stand-alone selling price for separate performance obligations.
NOTES TO THE CONSOLIDATED FINANCIAL STATEMENTS
(In thousands,Tables in millions, except shares and per share data)
The change in the deferred revenue balance for the twelve monthsyears ended December 31, 2019 and 2018 was as follows:
|
| | | | | | | |
| | Years Ended |
| | December 31 |
| | 2019 | | 2018 |
| Beginning balance | $ | 8.5 |
| | $ | 7.8 |
|
| Increase in deferred revenue representing our obligation to satisfy future performance obligations | 26.0 |
| | 14.7 |
|
| Deferred revenue acquired from acquisition of Gaomei Cleaning Equipment Company | 1.4 |
| | — |
|
| Decrease in deferred revenue for amounts recognized in Net Sales for satisfied performance obligations | (25.2 | ) | | (13.8 | ) |
| Foreign currency fluctuations | — |
| | (0.2 | ) |
| Ending balance | $ | 10.7 |
| | $ | 8.5 |
|
|
| | | | | |
| | Twelve Months Ended |
| | December 31 |
| | 2018 |
| Beginning balance | $ | 7,787 | |
| Increase in deferred revenue representing our obligation to satisfy future performance obligations | 14,650 | |
| Decrease in deferred revenue for amounts recognized in Net Sales for satisfied performance obligations | (13,755 | ) |
| Foreign currency fluctuations | (157 | ) |
| Ending balance | $ | 8,525 | |
AtAs of December 31, 2018, $5,0212019, $6.8 million and $3,504$3.9 million of deferred revenue was reported in Other Current Liabilities and Other Liabilities, respectively, on our Condensed Consolidated Balance Sheets. Of this, we expect to recognize the following approximate amounts in Net Sales in the following periods:
|
| | | |
| 2020 | $ | 6.8 |
|
| 2021 | 2.1 |
|
| 2022 | 1.1 |
|
| 2023 | 0.5 |
|
| 2024 | 0.2 |
|
| Thereafter | — |
|
| Total | $ | 10.7 |
|
|
| | | |
| 2019 | $ | 5,021 |
|
| 2020 | 1,865 |
|
| 2021 | 1,044 |
|
| 2022 | 442 |
|
| 2023 | 153 |
|
| Thereafter | — |
|
| Total | $ | 8,525 |
|
AtAs of December 31, 2017, $5,8152018, $5.0 million and $2,483$3.5 million of deferred revenue was reported in Other Current Liabilities and Other Liabilities, respectively, on our Condensed Consolidated Balance Sheets.
Practical Expedients and Exemptions
We generally expense the incremental costs of obtaining a contract when incurred because the amortization period would be less than one year. These costs relate primarily to sales commissions and are recorded in Selling and Administrative Expense in the Condensed Consolidated Statements of Operations.
We do not disclose the value of unsatisfied performance obligations for contracts with an original expected length of one year or less. In addition, we do not adjust the promised amount of consideration for the effects of a significant financing component if we expect, at contract inception, that the period between when we transfer a promised good or service to a customer and when the customer pays for that good or service will be one year or less.
| |
5. | Investment in Joint Venture |
On February 13, 2017, the Company, through a Dutch subsidiary, together with Future Cleaning Technologies, B.V., a company headquartered in the Netherlands, announced the January 1, 2017 formation of i-team North America B.V., a joint venture that operates as the distributor of the i-mop in North America. We began selling and servicing the i-mop in the second quarter of 2017. We own a 50% ownership interest in the joint venture, which is accounted for under the equity method of accounting, with our proportionate share of income or loss presented as a component of Other Expense, Net on the Consolidated Statements of Operations. In 2018, this amount was immaterial.4. Management Actions
As of December 31, 2018, the carrying value of the company's investment in the joint venture was $32. In March 2017, we issued a $1,500 loan to the joint venture and, as a result, recorded a long-term note receivable in Other Assets on the Consolidated Balance Sheets.
| |
6. | ManagementRestructuring Actions |
During the first quarter of 2017, we implemented a restructuring action to better align our global resources and expense structure with a lower growth global economic environment. The pre-tax charge of $8,018, including other associated costs of $961, consisted primarily of severance and was included within Selling and Administrative Expense in the Consolidated Statements of Operations. The charge impacted our Americas, Europe, Middle East and Africa ("EMEA") and Asia Pacific ("APAC") operating segments. We estimated the savings would offset the pre-tax charge approximately one year from the date of the action. No additional costs will be incurred related to this restructuring action.
During the fourth quarter of 2017, we implemented a restructuring action primarily driven by integration actions related to our acquisition of IP Cleaning S.p.A and its subsidiaries ("IPC Group"). See Note 7 for further details regarding our acquisition of the IPC Group. The restructuring action consisted primarily of severance and includes reductions in overall staffing to streamline and right-size the organization to support anticipated business requirements. The pre-tax charge of $2,501 was included within Selling and Administrative Expense in the Consolidated Statements of Operations. The charge impacted our Americas, EMEA and APAC operating segments. We estimated the savings would offset the pre-tax charge approximately one year from the date of the action.
NOTES TO THE CONSOLIDATED FINANCIAL STATEMENTS
(In thousands, except shares and per share data)
During the fourth quarter of 2018, we implemented a restructuring action consisting of severance to further our integration efforts related to the IPC Group. The pre-tax charge of $1,032$1.0 million was included within Selling and Administrative Expense in the Consolidated Statements of Operations. The charge impacted our EMEA and APAC operating segments. We estimate the savings will offset the pre-tax charge approximately one year from the date of the action.
During 2019, we implemented restructuring actions to further our integration efforts related to the IPC Group. The pre-tax charge of $4.8 million consisting of severance was included, with $0.3 million in Cost of Sales and $4.5 million in Selling and Administrative Expense in the Consolidated Statements of Earnings. The charge impacted our EMEA and Americas operating segments. We estimate the savings will offset the pre-tax charge approximately one year from the date of the action.
A reconciliation to the ending liability balance of severance and related costs as of December 31, 20182019 is as follows:
|
| | | |
| | Severance and Related Costs |
| December 31, 2017 Balance | $ | 3.4 |
|
| 2018 charges and utilization: | |
| New charges | 1.0 |
|
| Cash payments | (2.1 | ) |
| Foreign currency adjustments | (0.1 | ) |
| December 31, 2018 Balance | 2.2 |
|
| 2019 charges and utilization: | |
| New charges | 6.1 |
|
| Cash payments | (2.5 | ) |
| Adjustment to accrual | (1.3 | ) |
| December 31, 2019 Balance | $ | 4.5 |
|
NOTES TO THE CONSOLIDATED FINANCIAL STATEMENTS
(Tables in millions, except shares and per share data)
|
| | | |
| | Severance and Related Costs |
| 2017 restructuring actions | $ | 9,558 |
|
| Cash payments | (6,312 | ) |
| Foreign currency adjustments | 190 |
|
| December 31, 2017 Balance | 3,436 |
|
| 2018 charges and utilization: | |
| New charges | 1,032 |
|
| Cash payments | (2,123 | ) |
| Foreign currency adjustments | (97 | ) |
| December 31, 2018 Balance | $ | 2,248 |
|
Other Actions
During the second quarter of 2019, we recorded a $2.7 million write-down of a portion of a note receivable related to the divestiture of the Green Machine business to adjust the balance to net realizable value. This write-down was recorded in Selling and Administrative Expenses. In the third quarter of 2019, we collected the remaining balance of the note receivable.
In 2019, we made the decision to exit certain product lines and as a result recorded $3.3 million in Cost of Sales to reflect our estimate of inventory that will not be sold.
| |
7.5. | Acquisitions and Divestitures |
Gaomei
On January 4, 2019, we completed the acquisition of Hefei Gaomei Cleaning Machines Co., Ltd. and Anhui Rongen Environmental Protection Technology Co., Ltd. (collectively "Gaomei"), privately held designers and manufacturers of commercial cleaning solutions based in China. The financial results for Gaomei have been included in the consolidated financial results since the date of closing.
The following table summarizes the fair value measurement of the assets acquired and liabilities assumed as of the date of acquisition:
|
| | | | |
| ASSETS | | |
| Current Assets | | $ | 8.5 |
|
| Intangible Assets Subject to Amortization: | | |
| Trade Name | | 1.8 |
|
| Customer Lists | | 13.9 |
|
| Other Assets | | 1.3 |
|
| Total Identifiable Assets Acquired | | 25.5 |
|
| LIABILITIES | | |
| Current Liabilities | | (8.0 | ) |
| Long-Term Liabilities | | (6.0 | ) |
| Total Identifiable Liabilities Assumed | | (14.0 | ) |
| Goodwill | | 15.6 |
|
| Total Purchase Price | | $ | 27.1 |
|
The fair value measurements were final as of December 31, 2019.
The total purchase price includes the following:
•$11.3 million which was paid during the first quarter of 2019 upon close of the transaction;
•$11.3 million which was paid in the fourth quarter of 2019;
$4.7 million which represents the estimated fair value of contingent consideration at the acquisition date. The estimate is based on a probability-weighted scenario analysis of achieving certain levels of gross profit growth over a three year period. Consideration of $0.0 million to $42.4 million will be paid in March 2021 if the gross profit growth targets are met. As of December 31, 2019, the contingent consideration, which is recorded in Other Liabilities on our Consolidated Balance Sheet, had a fair value of $2.1 million; and
•$(0.2) million which represents a working capital purchase price adjustment.
NaN of the goodwill is expected to be deductible for income tax purposes. The expected lives of the acquired amortizable intangible assets range from 10 years to 15 years and are being amortized on a straight-line basis. The pro forma effects of this acquisition are not significant to the Company.
Waterstar
During the third quarter of 2018, we sold substantially all of the assets of our Waterstar business for $4,000$4.0 million in cash. The resulting gain was approximately $1,000$1.0 million and is reflected within Selling and Administrative Expense in operating profit in our Consolidated Statements of Operations.
NOTES TO THE CONSOLIDATED FINANCIAL STATEMENTS
(Tables in millions, except shares and per share data)
IP Cleaning S.p.A.
On April 6, 2017, we acquired nearly 100 percent of the outstanding capital stock of IPC Group for a purchase price of $353,769,$353.8 million, net of cash acquired of $8,804.$8.8 million. The primary seller was Ambienta SGR S.p.A., a European private equity fund. IPC Group, based in Italy, is a designer and manufacturer of innovative professional cleaning equipment, cleaning tools and supplies. The acquisition strengthens our presence and market share in Europe and will allow us to better leverage our EMEA cost structure. We funded the acquisition of IPC Group, along with related fees, including refinancing of existing debt, with funds raised through borrowings under a senior secured credit facility in an aggregate principal amount of $420,000.$420.0 million. Further details regarding our acquisition financing arrangementsarrangement are discussed in Note 11.
The following table summarizes the final fair value measurement of the assets acquired and liabilities assumed as of the date of acquisition:
NOTES TO THE CONSOLIDATED FINANCIAL STATEMENTS
(In thousands, except shares and per share data)
|
| | | |
| ASSETS | |
| Receivables | $ | 39,984 |
|
| Inventories | 46,442 |
|
| Other Current Assets | 7,456 |
|
| Assets Held for Sale | 2,247 |
|
| Property, Plant and Equipment | 63,890 |
|
| Intangible Assets Subject to Amortization: | |
| Trade Name | 26,753 |
|
| Customer Lists | 123,061 |
|
| Technology | 9,631 |
|
| Other Assets | 2,000 |
|
| Total Identifiable Assets Acquired | 321,464 |
|
| LIABILITIES | |
| Accounts Payable | 32,227 |
|
| Accrued Expenses | 18,130 |
|
| Deferred Income Taxes | 56,950 |
|
| Other Liabilities | 10,964 |
|
| Total Identifiable Liabilities Assumed | 118,271 |
|
| Net Identifiable Assets Acquired | 203,193 |
|
| Noncontrolling Interest | (1,896 | ) |
| Goodwill | 152,472 |
|
| Total Estimated Purchase Price, net of Cash Acquired | $ | 353,769 |
|
Based on the final fair value measurement of the assets acquired and liabilities assumed, we allocated $152,472 to goodwill for the expected synergies from combining IPC Group with our existing business. None of the goodwill is expected to be deductible for income tax purposes. In connection with the finalization of the fair value measurements in the first quarter of 2018, we recorded a measurement period adjustment, which increased goodwill by $4,627 with offsetting adjustments to various income tax assets and liabilities.
The final fair value of the acquired intangible assets is $159,445. The expected lives of the acquired amortizable intangible assets are approximately 15 years for customer lists, 10 years for trade names and 10 years for technology. Trade names are being amortized on a straight-line basis while the customer lists and technology are being amortized on an accelerated basis. We recorded amortization expense of $20,794 in Selling and Administrative Expense on our Consolidated Statements of Operations for these acquired intangible assets for the twelve months ended December 31, 2018.
9.
The following unaudited pro forma financial information presents the combined results of operations of Tennantthe Company as if the acquisition of IPC Group had occurred as of January 1, 2016:2017:
|
| | | |
| Years ended December 31 | 2017 |
| Net Sales | |
| Pro forma | $ | 1,057.1 |
|
| As reported | 1,003.1 |
|
| | |
| Net Earnings (Loss) Attributable to Tennant Company | |
| Pro forma | $ | 12.3 |
|
| As reported | (6.2 | ) |
| | |
| Net Earnings (Loss) Attributable to Tennant Company per Diluted Share | |
| Pro forma | $ | 0.68 |
|
| As reported | (0.35 | ) |
|
| | | | | | | |
| Years ended December 31 | 2017 | | 2016 |
| Net Sales | | | |
| Pro forma | $ | 1,057,127 |
| | $ | 1,013,710 |
|
| As reported | 1,003,066 |
| | 808,572 |
|
| | | | |
| Net Earnings (Loss) Attributable to Tennant Company | | | |
| Pro forma | $ | 12,288 |
| | $ | 30,412 |
|
| As reported | (6,195 | ) | | 46,614 |
|
| | | | |
| Net Earnings (Loss) Attributable to Tennant Company per Diluted Share | | | |
| Pro forma | $ | 0.68 |
| | $ | 1.69 |
|
| As reported | (0.35 | ) | | 2.59 |
|
NOTES TO THE CONSOLIDATED FINANCIAL STATEMENTS
(In thousands, except shares and per share data)
The unaudited pro forma financial information is presented for informational purposes only. It is not necessarily indicative of what our consolidated results of operations actually would have been had the acquisition occurred at the beginning of each year, nor does it attempt to project the future results of operations of the combined company.
The unaudited pro forma financial information above gives effect to the following:
• Incremental depreciation and amortization expense related to the fair value of the property, plant and equipment and identified intangible assets;
• Exclusion of the purchase accounting impact of the inventory step-up related to the sale of acquired inventory;
• Incremental interest expense related to additional debt used to finance the acquisition;
• Exclusion of non-recurring acquisition-related transaction and financing costs; and
• Pro forma adjustments tax affected based on the jurisdiction where the costs were incurred.
Inventories as of December 31 consisted of the following:
|
| | | | | | | |
| | 2019 | | 2018 |
| Inventories carried at LIFO: | | | |
| Finished goods | $ | 50.9 |
| | $ | 48.6 |
|
| Raw materials, production parts and work-in-process | 32.5 |
| | 28.6 |
|
Excess of FIFO over LIFO cost (a) | (33.4 | ) | | (31.2 | ) |
| Total LIFO inventories | $ | 50.0 |
| | $ | 46.0 |
|
| | | | |
| Inventories carried at FIFO: | | | |
| Finished goods | $ | 60.1 |
| | $ | 53.5 |
|
| Raw materials, production parts and work-in-process | 40.0 |
| | 35.6 |
|
| Total FIFO inventories | $ | 100.1 |
| | $ | 89.1 |
|
| Total inventories | $ | 150.1 |
| | $ | 135.1 |
|
|
| | | | | | | |
| | 2018 | | 2017 |
| Inventories carried at LIFO: | | | |
| Finished goods | $ | 48,607 |
| | $ | 43,439 |
|
| Raw materials, production parts and work-in-process | 28,581 |
| | 23,694 |
|
| Excess of FIFO over LIFO cost (a) | (31,199 | ) | | (28,429 | ) |
| Total LIFO inventories | $ | 45,989 |
| | $ | 38,704 |
|
| | | | |
| Inventories carried at FIFO: | | | |
| Finished goods | $ | 53,520 |
| | $ | 54,161 |
|
| Raw materials, production parts and work-in-process | 35,624 |
| | 34,829 |
|
| Total FIFO inventories | $ | 89,144 |
| | $ | 88,990 |
|
| Total inventories | $ | 135,133 |
| | $ | 127,694 |
|
(a) Inventories of $45,989$50.0 as of December 31, 2018,2019, and $38,704$46.0 as of December 31, 2017,2018, were valued at LIFO. The difference between replacement cost and the stated LIFO inventory value is not materially different from the reserve for the LIFO valuation method.
NOTES TO THE CONSOLIDATED FINANCIAL STATEMENTS
(Tables in millions, except shares and per share data)
| |
9.7. | Property, Plant and Equipment |
Property, Plant and Equipment and related Accumulated Depreciation, including equipment under capitalfinance leases, as of December 31, consisted of the following:
|
| | | | | | | |
| | 2019 | | 2018 |
| Property, Plant and Equipment: | | | |
| Land | $ | 19.2 |
| | $ | 17.9 |
|
| Buildings and improvements | 98.7 |
| | 93.7 |
|
| Machinery and manufacturing equipment | 165.2 |
| | 154.1 |
|
| Office equipment | 107.2 |
| | 111.2 |
|
| Construction in progress | 22.2 |
| | 9.7 |
|
| Total Property, Plant and Equipment | 412.5 |
| | 386.6 |
|
| Less: Accumulated Depreciation | (239.2 | ) | | (223.2 | ) |
| Property, Plant and Equipment, Net | $ | 173.3 |
| | $ | 163.4 |
|
|
| | | | | | | |
| | 2018 | | 2017 |
| Property, Plant and Equipment: | | | |
| Land | $ | 17,857 |
| | $ | 18,152 |
|
| Buildings and improvements | 93,729 |
| | 96,230 |
|
| Machinery and manufacturing equipment | 154,118 |
| | 151,645 |
|
| Office equipment | 111,219 |
| | 107,312 |
|
| Work in progress | 9,718 |
| | 9,429 |
|
| Total Property, Plant and Equipment | 386,641 |
| | 382,768 |
|
| Less: Accumulated Depreciation | (223,194 | ) | | (202,750 | ) |
| Property, Plant and Equipment, Net | $ | 163,447 |
| | $ | 180,018 |
|
Depreciation expense was $32,291$32.2 million in 2018, 2019, $26,19932.3 million in 20172018 and $17,89126.2 million in 20162017.
NOTES TO THE CONSOLIDATED FINANCIAL STATEMENTS
(In thousands, except shares and per share data)
| |
10.8. | Goodwill and Intangible Assets |
For purposes of performing our goodwill impairment analysis, we have identified our reporting units as North America, Latin America, Coatings, EMEA and APAC. As of December 31, 2018, 2017 and 2016, we performedWe perform an analysis of qualitative factors to determine whether it is more likely than not that the fair value of a reporting unit is less than its carrying amount as a basis for determining whether it is necessary to perform the quantitative goodwill impairment test. Based on our analysis, of qualitative factors, we determined that it was not more likely than not that the fair value of the North America, Latin America, EMEA and APAC reporting units was less than its respective carrying amount. We elected to perform a quantitative analysis of the Coatings reporting unit. Based on the quantitative analysis of that reporting unit, it was determined there was no goodwill impairment atas of December 31, 2019 and 2018.
The changes in the carrying amount of Goodwill are as follows:
|
| | | | | | | | | | | |
| | Goodwill | | Accumulated Impairment Losses | | Total |
| Balance as of December 31, 2017 | $ | 227.2 |
| | $ | (41.2 | ) | | $ | 186.0 |
|
| Additions | — |
| | — |
| | — |
|
| Purchase accounting adjustments | 4.6 |
| | — |
| | 4.6 |
|
| Foreign currency fluctuations | (10.1 | ) | | 2.2 |
| | (7.9 | ) |
| Balance as of December 31, 2018 | $ | 221.7 |
| | $ | (39.0 | ) | | $ | 182.7 |
|
| Additions | 15.6 |
| | — |
| | 15.6 |
|
| Foreign currency fluctuations | (2.2 | ) | | (1.0 | ) | | (3.2 | ) |
| Balance as of December 31, 2019 | $ | 235.1 |
| | $ | (40.0 | ) | | $ | 195.1 |
|
|
| | | | | | | | | | | |
| | Goodwill | | Accumulated Impairment Losses | | Total |
| Balance as of December 31, 2016 | $ | 58,397 |
| | $ | (37,332 | ) | | $ | 21,065 |
|
| Additions | 147,845 |
| | — |
| | 147,845 |
|
| Purchase accounting adjustments | (1,865 | ) | | — |
| | (1,865 | ) |
| Foreign currency fluctuations | 22,847 |
| | (3,848 | ) | | 18,999 |
|
| Balance as of December 31, 2017 | $ | 227,224 |
| | $ | (41,180 | ) | | $ | 186,044 |
|
| Additions | — |
| | — |
| | — |
|
| Purchase accounting adjustments | 4,627 |
| | — |
| | 4,627 |
|
| Foreign currency fluctuations | (10,141 | ) | | 2,142 |
| | (8,000 | ) |
| Balance as of December 31, 2018 | $ | 221,710 |
| | $ | (39,038 | ) | | $ | 182,671 |
|
The balances of acquired Intangible Assets, excluding Goodwill, as of December 31, are as follows: |
| | | | | | | | | | | | | | | |
| | Customer Lists | | Trade Names | | Technology | | Total |
| Balance as of December 31, 2019 | | | | | | | |
| Original cost | $ | 154.1 |
| | $ | 31.8 |
| | $ | 17.1 |
| | $ | 203.0 |
|
| Accumulated amortization | (49.8 | ) | | (8.2 | ) | | (7.3 | ) | | (65.3 | ) |
| Carrying amount | $ | 104.3 |
| | $ | 23.6 |
| | $ | 9.8 |
| | $ | 137.7 |
|
| Weighted-average original life (in years) | 15 |
| | 11 |
| | 11 |
| | |
|
| | | | | | | | |
| Balance as of December 31, 2018 | |
| | |
| | |
| | |
|
| Original cost | $ | 143.1 |
| | $ | 30.6 |
| | $ | 17.4 |
| | $ | 191.1 |
|
| Accumulated amortization | (33.8 | ) | | (5.3 | ) | | (5.5 | ) | | (44.6 | ) |
| Carrying amount | $ | 109.3 |
| | $ | 25.3 |
| | $ | 11.9 |
| | $ | 146.5 |
|
| Weighted-average original life (in years) | 15 |
| | 10 |
| | 10 |
| | |
|
NOTES TO THE CONSOLIDATED FINANCIAL STATEMENTS
(Tables in millions, except shares and per share data)
|
| | | | | | | | | | | | | | | |
| | Customer Lists | | Trade Names | | Technology | | Total |
| Balance as of December 31, 2018 | | | | | | | |
| Original cost | $ | 143,059 |
| | $ | 30,592 |
| | $ | 17,436 |
| | $ | 191,087 |
|
| Accumulated amortization | (33,714 | ) | | (5,327 | ) | | (5,500 | ) | | (44,541 | ) |
| Carrying amount | $ | 109,345 |
| | $ | 25,265 |
| | $ | 11,936 |
| | $ | 146,546 |
|
| Weighted-average original life (in years) | 15 |
| | 10 |
| | 10 |
| | |
|
| | | | | | | | |
| Balance as of December 31, 2017 | |
| | |
| | |
| | |
|
| Original cost | $ | 149,355 |
| | $ | 31,968 |
| | $ | 14,589 |
| | $ | 195,912 |
|
| Accumulated amortization | (17,870 | ) | | (2,436 | ) | | (3,259 | ) | | (23,565 | ) |
| Carrying amount | $ | 131,485 |
| | $ | 29,532 |
| | $ | 11,330 |
| | $ | 172,347 |
|
| Weighted-average original life (in years) | 15 |
| | 10 |
| | 11 |
| | |
|
The purchase accounting adjustments recorded during the first quarter ofin 2018 were based on the fair value adjustments related to our acquisition of the IPC Group, as described further in Note 7.5.
In 2018,2019, as part of our purchased intangible assets were $2,775, which was primarily due toacquisition of Gaomei, we acquired trade names and a technology license. The license was recordedcustomer list with a combined fair value of $15.7 million. Further details regarding the purchase price allocation of Gaomei are described in Intangible Assets, Net as technology on the Condensed Consolidated Balance Sheets as of December 31, 2018.Note 5.
Amortization expense on Intangible Assets was $22,129, $17,054$22.2 million, $22.1 million and $409$17.1 million for the years ended December 31, 2019, 2018 and 2017, and 2016, respectively.
NOTES TO THE CONSOLIDATED FINANCIAL STATEMENTS
(In thousands, except shares and per share data)
Estimated aggregate amortization expense based on the current carrying amount of amortizable Intangible Assets for each of the five succeeding years is as follows:
|
| | | |
| 2020 | $ | 20.6 |
|
| 2021 | 19.0 |
|
| 2022 | 16.9 |
|
| 2023 | 15.4 |
|
| 2024 | 13.9 |
|
| Thereafter | 51.9 |
|
| Total | $ | 137.7 |
|
|
| | | |
| 2019 | $ | 21,297 |
|
| 2020 | 19,873 |
|
| 2021 | 18,092 |
|
| 2022 | 15,913 |
|
| 2023 | 14,352 |
|
| Thereafter | 57,019 |
|
| Total | $ | 146,546 |
|
9.Debt
Credit Facility Borrowings
2017 Credit Agreement
In 2017, the Company and certain of our foreign subsidiaries entered into a secured Credit Agreement (the "2017 Credit Agreement") with JPMorgan, as administrative agent, Goldman Sachs Bank USA, as syndication agent, Wells Fargo, National Association, U.S. Bank National Association, and HSBC Bank USA, National Association, as co-documentation agents, and the lenders (including JPMorgan) from time to time party thereto.
The fee for committed funds under the revolving facility of the 2017 Credit Agreement ranges from an annual rate of 0.175% to 0.35%, depending on the company’s leverage ratio. Borrowings denominated in U.S. dollars under the 2017 Credit Agreement bear interest at a rate per annum equal to (a) the greatest of (i) the prime rate, (ii) the federal funds rate plus 0.50% and (iii) the adjusted LIBOR rate for a one month period, but in any case, not less than 0%, plus, in any such case, 1.00%, plus an additional spread of 0.075% to 0.90% for revolving loans and 0.25% to 1.25% for term loans, depending on the company’s leverage ratio, or (b) the LIBOR Rate, as adjusted for statutory reserve requirements for eurocurrency liabilities, but in any case, not less than 0%, plus an additional spread of 1.075% to 1.90% for revolving loans and 1.25% to 2.25% for term loans, depending on the company’s leverage ratio.
The 2017 Credit Agreement contains customary representations, warranties and covenants, including, but not limited to, covenants restricting the company’sCompany’s ability to incur indebtedness and liens and merge or consolidate with another entity. The 2017 Credit Agreement also contains financial covenants, requiring us to maintain a ratio of consolidated total indebtedness to consolidated earnings before income, taxes, depreciation and amortization, subject to certain adjustments ("Adjusted EBITDA") of not greater than 4.00 to 1, as well as requiring us to maintain a ratio of consolidated Adjusted EBITDA to consolidated interest expense of no less than 3.50 to 1 for the year ended December 31, 2018.2019. The 2017 Credit Agreement also contains a financial covenant requiring us to maintain a senior secured net indebtedness to Adjusted EBITDA ratio of not greater than 3.50 to 1. These financial covenants may restrict our ability to pay dividends and purchase outstanding shares of our common stock. In connection with the closing of the Gaomei acquisition, we elected an acquisition holiday as provided for under the 2017 Credit Agreement, which increased the net leverage ratio from 4.00 to 1 to 4.50 to 1 and the senior secured net leverage ratio from 3.50 to 1 to 4.00 to 1 during each quarter of 2019. We were in compliance with our financial covenants at December 31, 2018.2019.
In October 2018, the Company signed Amendment No. 1 to the 2017 Credit Agreement, which clarified that the adoption of the new lease accounting standard in 2019 would have no effect on any financial covenant calculations.
Effective with our fiscal year ended December 31, 2018, we are required to repay the senior credit agreement with 25% to 50% of our excess cash flow from the preceding fiscal year, as defined in the agreement, unless our net leverage ratio for such preceding fiscal year is less than or equal to 3.00 to 1. We were not required to repay any additional amount of the Notes (as defined below) due to this clause.
Our SeniorThe Notes also contain certain restrictions, which are generally less restrictive than those contained in the 2017 Credit Agreement.
Senior Unsecured Notes
On April 18, 2017, we issued and sold $300,000$300.0 million in aggregate principal amount of our 5.625% Senior Notes due 2025 (the “Notes”), pursuant to an Indenture, dated as of April 18, 2017, among the company,Company, the Guarantors (as defined therein), and Wells Fargo Bank, National Association, a national banking association, as trustee. The Notes are guaranteed by Tennant Coatings, Inc., and Tennant Sales and Service Company (collectively, the “Guarantors”), which are wholly-owned subsidiaries of the company.Company. Separate financial information of the Guarantors is presented in Note 23.22.
The Notes will mature on May 1, 2025.2025. Interest on the Notes accrues at the rate of 5.625% per annum and is payable semiannually in cash on each May 1 and November 1, commencing on November 1, 2017.2017.
NOTES TO THE CONSOLIDATED FINANCIAL STATEMENTS
(Tables in millions, except shares and per share data)
The Notes and the guarantees constitute senior unsecured obligations of the companyCompany and the Guarantors, respectively. The Notes and the guarantees, respectively, are: (a) equal in right of payment with all of the company’sCompany’s and the Guarantors’ senior debt, without giving effect to collateral arrangements; (b) senior in right of payment to all of the company’sCompany’s and the Guarantors’ future subordinated debt, if any; (c) effectively subordinated in right of payment to all of the company’s and the Guarantors’ debt and obligations that are secured, including borrowings under the company’sCompany’s senior secured credit facilities for so long as the senior secured credit facilities are secured, to the extent of the value of the assets securing such liens; and (d) structurally subordinated in right of payment to all liabilities (including trade payables) of the company’sCompany’s and the Guarantors’ subsidiaries that do not guarantee the Notes. The Notes also contain customary representations, warranties and covenants, and are less restrictive than those contained in the 2017 Credit Agreement.
We used the net proceeds from this offering to refinance a $300,000$300.0 million term loan under our 2017 Credit Agreement that we borrowed as part of the financing for the acquisition of the IPC Group and to pay related fees and expenses.
The Indenture governing the Notes contains covenants that limit, among other things, our ability and the ability of our restricted subsidiary to incur additional indebtedness (including guarantees thereof); incur or create liens on assets securing indebtedness; make certain restricted payments; make certain investments; dispose of certain assets; allow to exist certain restrictions on the ability of our restricted subsidiaries to pay dividends or make other payments to us; engage in certain transactions with affiliates; and consolidate or merge with or into other companies. If we experience certain kinds of changes of control, we may be required to repurchase the Notes at a price equal to 101% of the principal amount of the Notes, plus accrued and unpaid interest, if any, to, but excluding, the date of repurchase. If we make certain asset sales and do not use the net proceeds for specified purposes, we may be required to offer to repurchase the Notes at a price equal to 100% of the principal amount, plus accrued and unpaid interest, if any, to, but excluding, the date of repurchase.
NOTES TO THE CONSOLIDATED FINANCIAL STATEMENTS
(In thousands, except shares and per share data)
Registration Rights Agreement
In connection with the issuance and sale of the Notes, the companyCompany entered into a Registration Rights Agreement, dated April 18, 2017, among the company,Company, the Guarantors and Goldman, Sachs & Co. and J.P. Morgan Securities LLC (the “Registration Rights Agreement”). Pursuant to the Registration Rights Agreement, the companyCompany agreed (1) to use its commercially reasonable efforts to consummate an exchange offer to exchange the original Senior Notes for new registered notes (the "Exchange Notes"), with terms substantially identical in all material respects with the Original Notes (except that the Exchange Notes will not contain terms with respect to additional interest, registration rights or transfer restrictions) and (2) if required, to have a shelf registration statement declared effective with respect to resales of the Senior Notes.
On January 22,During the first quarter of 2018, we commenced the exchange offer required by the Registration Rights Agreement. The exchange offer closed on February 23,during the first quarter of 2018. We did not incur any additional indebtedness as a result of the exchange offer. As a result, we were not required to pay additional interest on the Senior Notes.
Capital Lease Obligations
Capital lease obligations outstanding are primarily related to sale-leaseback transactions with third-party leasing companies whereby we sell our manufactured equipment to the leasing company and lease it back. The equipment covered by these leases is rented to our customers over the lease term.
Debt outstanding atas of December 31 consisted of the following:
| | | | 2018 | | 2017 | 2019 | | 2018 |
| Bank Borrowings | $ | 3,926 |
| | $ | — |
| $ | — |
| | $ | 3.9 |
|
| Senior Unsecured Notes | 300,000 |
| | 300,000 |
| 300.0 |
| | 300.0 |
|
| Credit Facility Borrowings | 53,000 |
| | 80,000 |
| |
| Capital Lease Obligations | 2,863 |
| | 3,279 |
| |
| Secured Credit Facility Borrowings | | 40.0 |
| | 53.0 |
|
| Other Secured Borrowings | | 2.4 |
| | 2.4 |
|
| Finance Lease Liabilities | | 0.2 |
| | 0.5 |
|
| Unamortized Debt Issuance Costs | (4,724 | ) | | (6,440 | ) | (3.8 | ) | | (4.7 | ) |
| Total Debt | 355,065 |
| | 376,839 |
| 338.8 |
| | 355.1 |
|
Less: Current Maturities of Credit Facility Borrowings, Net of Debt Issuance Costs(1) | (27,005 | ) | | (30,883 | ) | |
Less: Current Portion of Long-Term Debt (1) | | (31.3 | ) | | (27.0 | ) |
| Long-term portion | $ | 328,060 |
| | $ | 345,956 |
| $ | 307.5 |
| | $ | 328.1 |
|
| |
(1) | Current maturitiesportion of long-term debt include $25,927includes a $30.0 million of current maturities, less $184 of unamortized debt issuance costs,anticipated repayment on Secured Credit Facility Borrowings under our 2017 Credit Agreement, and $1,262$1.1 million of current maturities of capitalother secured borrowings and $0.2 million of current maturities of finance lease obligations. |
As of December 31, 2018,2019, we had outstanding borrowings under our Senior Unsecured Notes of $300,000.$300.0 million. We had outstanding borrowings under our 2017 Credit Agreement totaling $22,000$40.0 million under our term loan facility and $31,000 under our revolving facility. In addition, we had letters of credit and bank guarantees outstanding in the amount of $3,279,$3.3 million, leaving approximately $165,721$156.7 million of unused borrowing capacity on our revolving facility. Although we are onlynot required to make a minimum principal payment of $6,875 during 2019,2020, we have both the intent and the ability to pay an additional $15,125$30.0 million during 2019.2020. As such, we have classified $22,000$30.0 million as current maturities of long-term debt. Commitment fees on unused lines of credit for the year ended December 31, 20182019 were $595.$0.5 million. The overall weighted average cost of debt is approximately 5.4%5.3%, and net of a related cross-currency swap instrument, is approximately 4.5%4.4%. Further details regarding the cross-currency swap instrument are discussed in Note 13.11.
NOTES TO THE CONSOLIDATED FINANCIAL STATEMENTS
(Tables in millions, except shares and per share data)
The aggregate maturities of our outstanding debt, excluding unamortized debt issuance costs, as of December 31, 20182019, are as follows:
|
| | | |
| 2020 | $ | 31.3 |
|
| 2021 | 0.7 |
|
| 2022 | 10.4 |
|
| 2023 | 0.2 |
|
| 2024 | — |
|
| Thereafter | 300.0 |
|
| Total aggregate maturities | $ | 342.6 |
|
|
| | | |
| 2019 | $ | 12,066 |
|
| 2020 | 10,297 |
|
| 2021 | 6,255 |
|
| 2022 | 31,171 |
|
| 2023 | — |
|
| Thereafter | 300,000 |
|
| Total aggregate maturities | $ | 359,789 |
|
NOTES TO THE CONSOLIDATED FINANCIAL STATEMENTS
(In thousands, except shares and per share data)
| |
12.10. | Other Current Liabilities |
Other Current Liabilities as of December 31 consisted of the following:
|
| | | | | | | |
| | 2019 | | 2018 |
| Other Current Liabilities: | | | |
| Taxes, other than income taxes | $ | 10.4 |
| | $ | 8.9 |
|
| Warranty | 12.7 |
| | 13.1 |
|
| Deferred revenue | 6.8 |
| | 5.0 |
|
| Customer sales incentives | 13.7 |
| | 16.6 |
|
| Freight | 4.9 |
| | 4.5 |
|
| Restructuring | 4.5 |
| | 2.2 |
|
| Operating leases | 16.7 |
| | — |
|
| Miscellaneous accrued expenses | 11.6 |
| | 13.1 |
|
| Other | 4.7 |
| | 4.0 |
|
| Total Other Current Liabilities | $ | 86.0 |
| | $ | 67.4 |
|
|
| | | | | | | |
| | 2018 | | 2017 |
| Other Current Liabilities: | | | |
| Taxes, other than income taxes | $ | 12,763 |
| | $ | 14,760 |
|
| Warranty | 13,062 |
| | 12,676 |
|
| Deferred revenue | 5,021 |
| | 5,815 |
|
| Rebates | 16,652 |
| | 13,466 |
|
| Freight | 4,475 |
| | 3,208 |
|
| Restructuring | 2,248 |
| | 4,267 |
|
| Miscellaneous accrued expenses | 13,117 |
| | 10,779 |
|
| Other | 4,557 |
| | 4,476 |
|
| Total Other Current Liabilities | $ | 71,895 |
| | $ | 69,447 |
|
The changes in warranty reserves for the three years ended December 31 were as follows:
|
| | | | | | | | | | | |
| | 2019 | | 2018 | | 2017 |
| Beginning balance | $ | 13.1 |
| | $ | 12.7 |
| | $ | 11.0 |
|
| Product warranty provision | 11.1 |
| | 13.2 |
| | 12.1 |
|
| Acquired warranty obligations | — |
| | — |
| | 1.2 |
|
| Foreign currency | — |
| | (0.2 | ) | | 0.3 |
|
| Claims paid | (11.5 | ) | | (12.6 | ) | | (11.9 | ) |
| Ending balance | $ | 12.7 |
| | $ | 13.1 |
| | $ | 12.7 |
|
|
| | | | | | | | | | | |
| | 2018 | | 2017 | | 2016 |
| Beginning balance | $ | 12,676 |
| | $ | 10,960 |
| | $ | 10,093 |
|
| Product warranty provision | 13,172 |
| | 12,124 |
| | 12,413 |
|
| Acquired warranty obligations | — |
| | 1,208 |
| | 42 |
|
| Foreign currency | (172 | ) | | 274 |
| | 82 |
|
| Claims paid | (12,614 | ) | | (11,890 | ) | | (11,670 | ) |
| Ending balance | $ | 13,062 |
| | $ | 12,676 |
| | $ | 10,960 |
|
Hedge Accounting and Hedging Programs
In 2015, we expanded our foreign currency hedging programs to include foreign exchange purchased options and forward contracts to hedge our foreign currency denominatedcurrency-denominated revenue. We recognize all derivative instruments as either assets or liabilities in our Consolidated Balance Sheets and measure them at fair value. Gains and losses resulting from changes in fair value are accounted for depending on the use of the derivative and whether it is designated and qualifies for hedge accounting.
We evaluate hedge effectiveness on our hedges that are designated and qualify for hedge accounting at the inception of the hedge prospectively, as well as retrospectively, and record any ineffective portion of the hedging instruments in Net Foreign Currency Transaction Losses on our Consolidated Statements of Operations. The time value of purchased contracts is recorded in Net Foreign Currency Transaction Losses in our Consolidated Statements of Operations.
Our hedging policy establishes maximum limits for each counterparty to mitigate any concentration of risk.
Balance Sheet Hedging
Hedges of Foreign Currency Assets and Liabilities
We hedge our net recognized foreign currency denominatedcurrency-denominated assets and liabilities with foreign exchange forward contracts to reduce the risk that the value of these assets and liabilities will be adversely affected by changes in exchange rates. These contracts hedge assets and liabilities that are denominated in foreign currencies and are carried at fair value as either assets or liabilities on the Consolidated Balance Sheets with changes in the fair value recorded to Net
NOTES TO THE CONSOLIDATED FINANCIAL STATEMENTS
(Tables in millions, except shares and per share data)
Foreign Currency Transaction Losses in our Consolidated Statements of Operations. These contracts do not subject us to material balance sheet risk due to exchange rate movements because gains and losses on these derivatives are intended to offset gains and losses on the assets and liabilities being hedged. At December 31, 20182019 and December 31, 2017,2018, the notional amounts of foreign currency forward exchange contracts outstanding not designated as hedging instruments were $63,410$41.9 million and $60,858,$63.4 million, respectively.
During the first quarter of 2017, in connection with our acquisition of IPC Group, we entered into a foreign currency option contract not designated as a hedging instrument for a notional amount of €180,000.€180.0 million. The option contract has since expired and there were no0 outstanding foreign currency option contracts not designated as hedging instruments as of December 31, 20182019 and December 31, 2017.2018.
NOTES TO THE CONSOLIDATED FINANCIAL STATEMENTS
(In thousands, except shares and per share data)
Cash Flow Hedging
Hedges of Forecasted Foreign Currency Transactions
In countries outside the U.S., we transact business in U.S. dollars and in various other currencies. We may use foreign exchange option contracts or forward contracts to hedge certain cash flow exposures resulting from changes in these foreign currency exchange rates. These foreign exchange contracts, carried at fair value, have maturities of up to one year. We enter into these foreign exchange contracts to hedge a portion of our forecasted foreign currency denominatedcurrency-denominated revenue in the normal course of business, and accordingly, they are not speculative in nature. The notional amount of outstanding foreign currency forward contracts designated as cash flow hedges were $0$3.0 million and $2,928$0.0 million as of December 31, 20182019 and December 31, 2017,2018, respectively. The notional amount of outstanding foreign currency option contracts designated as cash flow hedges was $8,436$9.8 million and $8,619$8.4 million as of December 31, 20182019 and December 31, 2017,2018, respectively.
Foreign Currency Derivatives
We use foreign currency exchange rate derivatives to hedge our exposure to fluctuations in exchange rates for anticipated intercompany cash transactions between Tennantthe Company and its subsidiaries. During 2017, we entered into Euroeuro to U.S. dollar foreign exchange cross currency swaps for all of the anticipated cash flows associated with an intercompany loan from a wholly-owned European subsidiary. We entered into these foreign exchange cross currency swaps to hedge the foreign currency denominatedcurrency-denominated cash flows associated with this intercompany loan, and accordingly, they are not speculative in nature. We designated these cross currency swaps as cash flow hedges. The hedged cash flows as of December 31, 20182019 included €174,000€166.8 million of total notional value. As of December 31, 2018,2019, the aggregate scheduled interest payments over the course of the loan and related swaps amounted to €24,000.€16.8 million. The scheduled maturity and principal payment of the loan and related swaps of €150,000€150.0 million are due in April 2022. There were no0 new cross currency swaps designated as cash flow hedges as of December 31, 2018.2019.
To receive hedge accounting treatment, all hedging relationships are formally documented at the inception of the hedge, and the hedges must be highly effective in offsetting changes to future cash flows on hedged transactions. We record changes in the fair value of these cash flow hedges in Accumulated Other Comprehensive Loss in our Consolidated Balance Sheets, until the forecasted transaction occurs. When the forecasted transaction occurs, we reclassify the related gain or loss on the cash flow hedge to Net Sales. In the event the underlying forecasted transaction does not occur, or it becomes probable that it will not occur, we reclassify the gain or loss on the related cash flow hedge from Accumulated Other Comprehensive Loss to Net Foreign Currency Transaction Losses in our Consolidated Statements of Operations at that time. If we do not elect hedge accounting, or the contract does not qualify for hedge accounting treatment, the changes in fair value from period to period are recorded in Net Foreign Currency Transaction Losses in our Consolidated Statements of Operations.
The fair value of derivative instruments on our Consolidated Balance Sheets as of December 31 consisted of the following:
| | | | | 2018 | | 2017 | Derivative Assets | | Derivative Liabilities |
| | | Fair Value Asset Derivatives | | Fair Value Liability Derivatives | | Fair Value Asset Derivatives | | Fair Value Liability Derivatives | Balance Sheet Location | December 31, 2019 | December 31, 2018 | | Balance Sheet Location | December 31, 2019 | December 31, 2018 |
| Derivatives designated as hedging instruments: | | | | | | | | | | | | |
Foreign currency option contracts(1) | | $ | 245 |
| | $ | — |
| | $ | 86 |
| | $ | — |
| Other Current Assets | $ | — |
| $ | 0.2 |
| | Other Current Liabilities | $ | — |
| $ | — |
|
Foreign currency option contracts(1) | | Other Assets | — |
| — |
| | Other Liabilities | — |
| — |
|
Foreign currency forward contracts(1) | | Other Current Assets | 2.5 |
| 2.3 |
| | Other Current Liabilities | — |
| — |
|
Foreign currency forward contracts(1) | | 6,987 |
| | 25,415 |
| | 7,218 |
| | 34,961 |
| Other Assets | — |
| — |
| | Other Liabilities | 12.6 |
| 20.7 |
|
| Derivatives not designated as hedging instruments: | | | | | | | | | | | | |
Foreign currency forward contracts(1) | | $ | 223 |
| | $ | — |
| | $ | 442 |
| | $ | 425 |
| Other Current Assets | 0.6 |
| 0.2 |
| | Other Current Liabilities | 0.3 |
| — |
|
Foreign currency forward contracts(1) | | Other Assets | $ | — |
| $ | — |
| | Other Liabilities | $ | — |
| $ | — |
|
| |
(1) | Contracts that mature within the next 12 months are included in Other Current Assets and Other Current Liabilities for asset derivatives and liabilities derivatives, respectively, on our Consolidated Balance Sheets. Contracts with maturities greater than 12 months are included in Other Assets and Other Liabilities for asset derivatives and liability derivatives, respectively, in our Consolidated Balance Sheets. Amounts included in our Consolidated Balance Sheets are recorded net where a right of offset exists with the same derivative counterparty. |
NOTES TO THE CONSOLIDATED FINANCIAL STATEMENTS
(Tables in millions, except shares and per share data)
As of December 31, 2018,2019, we anticipate reclassifying approximately $2,367$2.4 million of gains from Accumulated Other Comprehensive Loss to net earnings during the next 12 months.
The following tables include the amounts in the Consolidated Statements of Earnings in which the effects of cash flow hedges are recorded and the effects of cash flow hedge activity on these line items for the years ended December 31, 2019 and December 31, 2018:
NOTES TO THE CONSOLIDATED FINANCIAL STATEMENTS
(In thousands, except shares and per share data)
|
| | | | | | | | | | | |
| | Years Ended |
| | December 31 |
| | 2019 | | 2018 |
| | Total | Amount of Gain (Loss) on Cash Flow Hedge Activity | | Total | Amount of Gain (Loss) on Cash Flow Hedge Activity |
| Net Sales | $ | 1,137.6 |
| $ | (0.1 | ) | | 1,123.5 |
| (0.2 | ) |
| Interest Income | 3.3 |
| 2.9 |
| | 3.0 |
| 2.4 |
|
| Net Foreign Currency Transaction Losses | (0.7 | ) | 3.4 |
| | (1.1 | ) | 8.3 |
|
The effect of foreign currency derivative instruments designated as cash flow hedges and foreign currency derivative instruments not designated as hedges in our Consolidated Statements of Earnings for the three years ended December 31 were as follows:
| | | | | 2018 | | 2017 | | 2016 | | 2019 | | 2018 | | 2017 |
| | | Foreign Currency Option Contracts | | Foreign Currency Forward Contracts | | Foreign Currency Option Contracts | | Foreign Currency Forward Contracts | | Foreign Currency Option Contracts | Foreign Currency Forward Contracts | | Foreign Currency Option Contracts | | Foreign Currency Forward Contracts | | Foreign Currency Option Contracts | | Foreign Currency Forward Contracts | | Foreign Currency Option Contracts | Foreign Currency Forward Contracts |
| Derivatives in cash flow hedging relationships: | | | | | | | | | | | | | | | | | | | | |
Net gain (loss) recognized in Other Comprehensive Income (Loss), net of tax(1) | | $ | 100 |
| | $ | 9,025 |
| | $ | (193 | ) | | $ | (16,226 | ) | | $ | (259 | ) | $ | (73 | ) | | (0.3 | ) | | 8.6 |
| | 0.1 |
| | 9.0 |
| | (0.2 | ) | (16.2 | ) |
| Net (loss) gain reclassified from Accumulated Other Comprehensive Loss into earnings, net of tax, effective portion to Net Sales | | (110 | ) | | (18 | ) | | (178 | ) | | (37 | ) | | (148 | ) | 7 |
| | — |
| �� | — |
| | (0.1 | ) | | — |
| | (0.2 | ) | — |
|
| Net gain reclassified from Accumulated Other Comprehensive Loss in earnings, net of tax, effective portion to Interest Income | | — |
| | 1,870 |
| | — |
| | 1,198 |
| | — |
| — |
| | — |
| | 2.2 |
| | — |
| | 1.9 |
| | — |
| 1.2 |
|
| Net gain (loss) reclassified from Accumulated Other Comprehensive Loss into earnings, net of tax, effective portion to Net Foreign Currency Transaction Losses | | — |
| | 6,353 |
| | — |
| | (12,555 | ) | | — |
| — |
| | — |
| | 2.6 |
| | — |
| | 6.4 |
| | — |
| (12.6 | ) |
Net gain (loss) recognized in earnings(2) | | 8 |
| | 12 |
| | (13 | ) | | 10 |
| | (11 | ) | 2 |
| |
| Derivatives not designated as hedging instruments: | | | | | | | | | | | | | | | | | | | | |
Net loss recognized in earnings(3) | | $ | — |
| | $ | (2,518 | ) | | $ | — |
| | $ | (6,161 | ) | | $ | — |
| $ | (890 | ) | |
Net loss recognized in earnings(2) | | | — |
| | (1.3 | ) | | — |
| | (2.5 | ) | | — |
| (6.2 | ) |
| |
(1) | Net change in the fair value of the effective portion classified in Other Comprehensive Income (Loss). Income. |
| |
(2) | Ineffective portion and amount excluded from effectiveness testing classified in Net Foreign Currency Transaction Losses. |
| |
(3)
| Classified in Net Foreign Currency Transaction Losses. |
| |
14.12. | Fair Value Measurements |
Estimates of fair value for financial assets and financial liabilities are based on the framework established in the accounting guidance for fair value measurements. The framework defines fair value, provides guidance for measuring fair value and requires certain disclosures. The framework discusses valuation techniques, such as the market approach (comparable market prices), the income approach (present value of future income or cash flow) and the cost approach (cost to replace the service capacity of an asset or replacement cost). The framework utilizes a fair value hierarchy that prioritizes the inputs to valuation techniques used to measure fair value into three broad levels. The following is a brief description of those three levels:
Level 1: Observable inputs such as quoted prices (unadjusted) in active markets for identical assets or liabilities.
Level 2: Inputs other than quoted prices that are observable for the asset or liability, either directly or indirectly. These include quoted prices for similar assets or liabilities in active markets and quoted prices for identical or similar assets or liabilities in markets that are not active.
Level 3: Unobservable inputs that reflect the reporting entity’s own assumptions.
NOTES TO THE CONSOLIDATED FINANCIAL STATEMENTS
(Tables in millions, except shares and per share data)
Our population of assets and liabilities subject to fair value measurements at as of December 31, 20182019 is as follows:
|
| | | | | | | | | | | | | | |
| | Fair Value | | Level 1 | | Level 2 | | Level 3 |
| Assets: | | | | | | | |
| Foreign currency forward exchange contracts | $ | 6.4 |
| | — |
| | $ | 6.4 |
| | — |
|
| Total Assets | 6.4 |
| | — |
| | 6.4 |
| | — |
|
| Liabilities: | |
| | |
| | |
| | |
|
| Foreign currency forward exchange contracts | 16.2 |
| | — |
| | 16.2 |
| | — |
|
| Contingent Consideration | 2.1 |
| | — |
| | — |
| | 2.1 |
|
| Total Liabilities | $ | 18.3 |
| | — |
| | $ | 16.2 |
| | $ | 2.1 |
|
|
| | | | | | | | | | | | | | | |
| | Fair Value | | Level 1 | | Level 2 | | Level 3 |
| Assets: | | | | | | | |
| Foreign currency forward exchange contracts | $ | 7,210 |
| | $ | — |
| | $ | 7,210 |
| | $ | — |
|
| Foreign currency option contracts | 245 |
| | — |
| | 245 |
| | — |
|
| Total Assets | $ | 7,455 |
| | $ | — |
| | $ | 7,455 |
| | $ | — |
|
| Liabilities: | |
| | |
| | |
| | |
|
| Foreign currency forward exchange contracts | $ | 25,415 |
| | $ | — |
| | $ | 25,415 |
| | $ | — |
|
| Total Liabilities | $ | 25,415 |
| | $ | — |
| | $ | 25,415 |
| | $ | — |
|
NOTES TO THE CONSOLIDATED FINANCIAL STATEMENTS
(In thousands, except shares and per share data)
Our population of assets and liabilities subject to fair value measurements atas of December 31, 20172018 is as follows:
|
| | | | | | | | | | | | | |
| | Fair Value | | Level 1 | | Level 2 | | Level 3 |
| Assets: | | | | | | | |
| Foreign currency forward exchange contracts | $ | 7.2 |
| | — |
| | $ | 7.2 |
| | — |
|
| Foreign currency option contracts | 0.2 |
| | — |
| | 0.2 |
| | — |
|
| Total Assets | 7.4 |
| | — |
| | 7.4 |
| | — |
|
| Liabilities: | |
| | |
| | |
| | |
|
| Foreign currency forward exchange contracts | 25.4 |
| | — |
| | 25.4 |
| | — |
|
| Total Liabilities | $ | 25.4 |
| | — |
| | $ | 25.4 |
| | — |
|
|
| | | | | | | | | | | | | | | |
| | Fair Value | | Level 1 | | Level 2 | | Level 3 |
| Assets: | | | | | | | |
| Foreign currency forward exchange contracts | $ | 7,660 |
| | $ | — |
| | $ | 7,660 |
| | $ | — |
|
| Foreign currency option contracts | 86 |
| | — |
| | 86 |
| | — |
|
| Total Assets | $ | 7,746 |
| | $ | — |
| | $ | 7,746 |
| | $ | — |
|
| Liabilities: | |
| | |
| | |
| | |
|
| Foreign currency forward exchange contracts | $ | 35,386 |
| | $ | — |
| | $ | 35,386 |
| | $ | — |
|
| Total Liabilities | $ | 35,386 |
| | $ | — |
| | $ | 35,386 |
| | $ | — |
|
Our foreign currency forward exchange and option contracts are valued using observable Level 2 market expectations at the measurement date and standard valuation techniques to convert future amounts to a single present value amount. Further details regarding our foreign currency forward exchange and option contracts are discussed in Note 13.11.
The carrying amounts reported in the Consolidated Balance Sheets for Cash and Cash Equivalents, Restricted Cash, Receivables, Other Current Assets, Accounts Payable and Other Current Liabilities approximate fair value due to their short-term nature.
The fair marketvalue and carrying value of our Long-Term Debt approximates costtotal debt, including current portion, was $357.2 million and $338.8 million, respectively, as of December 31, 2019. The fair value was calculated based on the borrowing rates currently available to us for bank loans with similar terms and remaining maturities.maturities, which is a Level 2 in the fair value hierarchy.
From time to time, we measure certain assets at fair value on a non-recurring basis, including evaluation of long-lived assets, goodwill and other intangible assets, as part of a business acquisition. These assets are measured and recognized at amounts equal to the fair value determined as of the date of acquisition. Fair value valuations are based on the information available as of the acquisition date and the expectations and assumptions that have been deemed reasonable by us. There are inherent uncertainties and management judgment required in these determinations. The fair value measurements of assets acquired and liabilities assumed as part of a business acquisition are based on valuations involving significant unobservable inputs, or Level 3, in the fair value hierarchy.
These assets are also subject to periodic impairment testing by comparing the respective carrying value of each asset to the estimated fair value of the reporting unit or asset group in which they reside. In the event we determine these assets to be impaired, we would recognize an impairment loss equal to the amount by which the carrying value of the reporting unit, impaired asset or asset group exceeds its estimated fair value. These periodic impairment tests utilize company-specific assumptions involving significant unobservable inputs, or Level 3, in the fair value hierarchy.
| |
15.13. | Retirement Benefit Plans |
Substantially all U.S. employees are covered by various retirement benefit plans, including postretirement medical plans and defined contribution savings plans. Retirement benefits for eligible employees in foreign locations are funded principally through defined benefit plans, annuity or government programs. The total cost of benefits for our plans was $11,926, $13,253$13.7 million, $11.9 million and $12,10813.3 million in 20182019, 20172018 and 20162017, respectively.
We had a qualified, funded defined benefit retirement plan (the “U.S. Pension Plan”) covering certain current and retired employees in the U.S. During 2015, the plan was amended to freeze benefits for all participants effective January 31, 2017. On February 15, 2017, the Board of Directors approved the termination of the U.S. Pension Plan, effective May 15, 2017. Participants who elected an immediate lump sum distribution were paid out in December 2017. Assets for participants who elected or are currently receiving annuity payments and those who have elected to defer their benefits were transferred to the annuity company, Pacific Life, in December 2017. Excess assets were transferred from the Tennant Company Pension Trust to the Tennant Company Retirement Savings Plan to deliver future discretionary benefits to plan participants. As of December 31, 2018,2019, we held excess assets of $6,408$2.8 million for future discretionary benefit payments.
We have a U.S. postretirement medical benefit plan (the “U.S. Retiree Plan”) to provide certain healthcare benefits for U.S. employees hired before January 1, 1999. Eligibility for those benefits is based upon a combination of years of service with us and age upon retirement.
NOTES TO THE CONSOLIDATED FINANCIAL STATEMENTS
(Tables in millions, except shares and per share data)
Our defined contribution savings plan (“401(k)”) covers substantially all U.S. employees. Under this plan, we match up to 3% of the employee’s annual compensation in cash to be invested per their election. We also make a profit sharing contribution to the 401(k) plan for employees with more than one1 year of service in accordance with our Profit Sharing Plan. This contribution is based upon our financial performance and can be funded in the form of Tennant stock, cash or a combination of both. Expenses for the 401(k) plan were $8,073, $4,404$9.8 million, $8.1 million and $8,3594.4 million during 20182019, 20172018 and 20162017, respectively.
We have a U.S. nonqualified supplemental benefit plan (the “U.S. Nonqualified Plan”) to provide additional retirement benefits for certain employees whose benefits under our 401(k) plan or U.S. Pension Plan are limited by either the Employee Retirement Income Security Act or the Internal Revenue Code.
We also have defined benefit pension plans in the United Kingdom and Germany (the “U.K. Pension Plan” and the “German Pension Plan”). The U.K. Pension Plan and German Pension Plan cover certain current and retired employees and both plans are closed to new participants. In December 2018, the U.K. Pension Plan was amended to close all future accrual of benefits to existing active members, resulting in a curtailment gain of $165$0.1 million relating to past service benefits.
We expect to contribute approximately $146$0.2 million to our U.S. Nonqualified Plan, $779$0.7 million to our U.S. Retiree Plan, $360and $0.3 million to our U.K. Pension Plan and $34in 2020. We expect contributions to our German Pension Plan to be less than $0.1 million in 2019.2020.
NOTES TO THE CONSOLIDATED FINANCIAL STATEMENTS
(In thousands, except shares and per share data)
Weighted-average asset allocations by asset category of the U.K. Pension Plan and the Tennant Company Retirement Savings Plan as of December 31, 20182019 are as follows:
| | | Asset Category | Fair Value | | Quoted Prices in Active Markets for Identical Assets (Level 1) | | Significant Observable Inputs (Level 2) | | Significant Unobservable Inputs (Level 3) | Fair Value | | Quoted Prices in Active Markets for Identical Assets (Level 1) | | Significant Observable Inputs (Level 2) | | Significant Unobservable Inputs (Level 3) |
| Cash and Cash Equivalents | $ | 6,408 |
| | $ | 6,408 |
| | $ | — |
| | $ | — |
| $ | 2.8 |
| | $ | 2.8 |
| | $ | — |
| | $ | — |
|
Investment Account held by Pension Plan(1) | 10,842 |
| | — |
| | — |
| | 10,842 |
| 12.2 |
| | — |
| | — |
| | 12.2 |
|
| Total | $ | 17,250 |
| | $ | 6,408 |
| | $ | — |
| | $ | 10,842 |
| $ | 15.0 |
| | $ | 2.8 |
| | $ | — |
| | $ | 12.2 |
|
| |
(1) | This category is comprised of investments in insurance contracts. |
Weighted-average asset allocations by asset category of the U.K. Pension Plan and the Tennant Company Retirement Savings Plan as of December 31, 20172018 are as follows:
| | | Asset Category | Fair Value | | Quoted Prices in Active Markets for Identical Assets (Level 1) | | Significant Observable Inputs (Level 2) | | Significant Unobservable Inputs (Level 3) | Fair Value | | Quoted Prices in Active Markets for Identical Assets (Level 1) | | Significant Observable Inputs (Level 2) | | Significant Unobservable Inputs (Level 3) |
| Cash and Cash Equivalents | $ | 6,305 |
| | $ | 6,305 |
| | $ | — |
| | $ | — |
| $ | 6.4 |
| | $ | 6.4 |
| | $ | — |
| | $ | — |
|
Investment Account held by Pension Plan(1) | 11,163 |
| | — |
| | — |
| | 11,163 |
| 10.8 |
| | — |
| | — |
| | 10.8 |
|
| Total | $ | 17,468 |
| | $ | 6,305 |
| | $ | — |
| | $ | 11,163 |
| $ | 17.2 |
| | $ | 6.4 |
| | $ | — |
| | $ | 10.8 |
|
| |
(1) | This category is comprised of investments in insurance contracts. |
Estimates of the fair value of the U.K Pension Plan and the Tennant Company Retirement Savings Plan assets are based on the framework established in the accounting guidance for fair value measurements. A brief description of the three levels can be found in Note 14.12. The Investment Account held by the U.K. Pension Plan invests in insurance contracts for purposes of funding the U.K. Pension Plan and is classified as Level 3. The fair value of the Investment Account is the cash surrender values as determined by the provider which are the amounts the plan would receive if the contracts were cashed out at year end. The underlying assets held by these contracts are primarily invested in assets traded in active markets.
A reconciliation of the beginning and ending balances of the Level 3 investments of our U.K. Pension Plan during the years ended December 31 are as follows:
|
| | | | | | | |
| | 2019 | | 2018 |
| Fair value at beginning of year | $ | 10.8 |
| | $ | 11.2 |
|
| Purchases, sales, issuances and settlements, net | 0.2 |
| | (0.9 | ) |
| Net gain | 0.8 |
| | 1.1 |
|
| Foreign currency | 0.4 |
| | (0.6 | ) |
| Fair value at end of year | $ | 12.2 |
| | $ | 10.8 |
|
|
| | | | | | | |
| | 2018 | | 2017 |
| Fair value at beginning of year | $ | 11,163 |
| | $ | 9,562 |
|
| Purchases, sales, issuances and settlements, net | (856 | ) | | (535 | ) |
| Net gain | 1,138 |
| | 1,190 |
|
| Foreign currency | (603 | ) | | 946 |
|
| Fair value at end of year | $ | 10,842 |
| | $ | 11,163 |
|
The primary objective of our U.K. Pension Plan is to meet retirement income commitments to plan participants at a reasonable cost to us and to maintain a sound actuarially funded status. This objective is accomplished through growth of capital and safety of funds invested. Assets are invested in securities to achieve growth of capital over inflation through appreciation and accumulation and reinvestment of dividend and interest income. Investments are diversified to control risk. The U.K. Pension Plan is invested in insurance contracts with underlying investments primarily in equity and fixed income securities. Our German Pension Plan is unfunded, which is customary in that country.
NOTES TO THE CONSOLIDATED FINANCIAL STATEMENTS
(Tables in millions, except shares and per share data)
Weighted-average assumptions used to determine benefit obligations as of December 31 are as follows:
|
| | | | | | | | | | | | | | | | | |
| | U.S. Pension Benefits | | Non-U.S. Pension Benefits | | Postretirement Medical Benefits |
| | 2018 | | 2017 | | 2018 | | 2017 | | 2018 | | 2017 |
| Discount rate | 3.95 | % | | 3.28 | % | | 2.72 | % | | 2.45 | % | | 3.95 | % | | 3.26 | % |
| Rate of compensation increase | — | % | | — | % | | 3.50 | % | | 3.50 | % | | — |
| | — |
|
NOTES TO THE CONSOLIDATED FINANCIAL STATEMENTS
(In thousands, except shares and per share data)
|
| | | | | | | | | | | | | | | | | |
| | U.S. Nonqualified Plan | | Non-U.S. Pension Benefits | | Postretirement Medical Benefits |
| | 2019 | | 2018 | | 2019 | | 2018 | | 2019 | | 2018 |
| Discount rate | 3.01 | % | | 3.95 | % | | 2.03 | % | | 2.72 | % | | 3.06 | % | | 3.95 | % |
| Rate of compensation increase | — | % | | — | % | | — | % | | 3.50 | % | | — |
| | — |
|
Weighted-average assumptions used to determine net periodic benefit costs as of December 31 are as follows:
|
| | | | | | | | | | | | | | | | | | | | | | | | | | |
| | U.S. Pension Plans | | Non-U.S. Pension Benefits | | Postretirement Medical Benefits |
| | 2019 | | 2018 | | 2017 | | 2019 | | 2018 | | 2017 | | 2019 | | 2018 | | 2017 |
| Discount rate | 3.95 | % | | 3.28 | % | | 3.92 | % | | 2.72 | % | | 2.45 | % | | 2.64 | % | | 3.95 | % | | 3.26 | % | | 3.58 | % |
| Expected long-term rate of return on plan assets | — | % | | — | % | | 5.10 | % | | 3.80 | % | | 3.80 | % | | 3.90 | % | | — |
| | — |
| | — |
|
| Rate of compensation increase | — | % | | — | % | | — | % | | — | % | | 3.50 | % | | 3.50 | % | | — |
| | — |
| | — |
|
|
| | | | | | | | | | | | | | | | | | | | | | | | | | |
| | U.S. Pension Benefits | | Non-U.S. Pension Benefits | | Postretirement Medical Benefits |
| | 2018 | | 2017 | | 2016 | | 2018 | | 2017 | | 2016 | | 2018 | | 2017 | | 2016 |
| Discount rate | 3.28 | % | | 3.92 | % | | 4.08 | % | | 2.45 | % | | 2.64 | % | | 3.59 | % | | 3.26 | % | | 3.58 | % | | 3.70 | % |
| Expected long-term rate of return on plan assets | — | % | | 5.10 | % | | 5.20 | % | | 3.80 | % | | 3.90 | % | | 4.60 | % | | — |
| | — |
| | — |
|
| Rate of compensation increase | — | % | | — | % | | 3.00 | % | | 3.50 | % | | 3.50 | % | | 3.50 | % | | — |
| | — |
| | — |
|
The discount rate is used to discount future benefit obligations back to today’s dollars. Our discount rates were determined based on high-quality fixed income investments. The resulting discount rates are consistent with the duration of plan liabilities. The Mercer Above Mean Yield Curve for high-quality corporate bonds is used in determining the discount rate for the U.S. Nonqualified Plan in 2019. The Mercer Yield Curve is used in determining the discount rate for the Non-U.S. Plans in 2019. Before 2019, the FTSE (formerly known as Citigroup) Above Median Spot Ratesrates for high-quality corporate bonds arewere used in determining the discount rate for the U.S. Plans. The expected return on assets assumption on the investment portfolios for the pension plans is based on the long-term expected returns for the investment mix of assets currently in the portfolio. Management uses historic return trends of the asset portfolio combined with recent market conditions to estimate the future rate of return.
The accumulated benefit obligations as of December 31 for all defined benefit plans are as follows:
|
| | | | | | | |
| | 2019 | | 2018 |
| U.S. Nonqualified Plan | $ | 1.3 |
| | $ | 1.3 |
|
| U.K. Pension Plan | 10.4 |
| | 9.3 |
|
| German Pension Plan | 1.0 |
| | 0.9 |
|
|
| | | | | | | |
| | 2018 | | 2017 |
| U.S. Pension Plans | $ | 1,267 |
| | $ | 1,414 |
|
| U.K. Pension Plan | 9,264 |
| | 11,131 |
|
| German Pension Plan | 950 |
| | 1,013 |
|
Information for our plans with an accumulated benefit obligation in excess of plan assets as of December 31 is as follows:
|
| | | | | | | |
| | 2019 | | 2018 |
| Accumulated benefit obligation | $ | 2.3 |
| | $ | 2.2 |
|
| Fair value of plan assets | — |
| | — |
|
|
| | | | | | | |
| | 2018 | | 2017 |
| Accumulated benefit obligation | $ | 2,217 |
| | $ | 2,427 |
|
| Fair value of plan assets | — |
| | — |
|
As of December 31, 20182019 and 2017,2018, the U.S. Nonqualified and the German Pension Plans had an accumulated benefit obligation in excess of plan assets.
Information for our plans with a projected benefit obligation in excess of plan assets as of December 31 is as follows:
|
| | | | | | | |
| | 2019 | | 2018 |
| Projected benefit obligation | $ | 2.3 |
| | $ | 2.2 |
|
| Fair value of plan assets | — |
| | — |
|
|
| | | | | | | |
| | 2018 | | 2017 |
| Projected benefit obligation | $ | 2,217 |
| | $ | 2,427 |
|
| Fair value of plan assets | — |
| | — |
|
As of December 31, 20182019 and 2017,2018, the U.S. Nonqualified and the German Pension Plans had a projected benefit obligation in excess of plan assets.
Assumed healthcare cost trend rates as of December 31 are as follows:
|
| | | | | |
| | 2019 | | 2018 |
| Healthcare cost trend rate assumption for the next year | 6.22 | % | | 6.38 | % |
| Rate to which the cost trend rate is assumed to decline (the ultimate trend rate) | 5.00 | % | | 5.00 | % |
| Year that the rate reaches the ultimate trend rate | 2032 |
| | 2032 |
|
NOTES TO THE CONSOLIDATED FINANCIAL STATEMENTS
(Tables in millions, except shares and per share data)
|
| | | | | |
| | 2018 | | 2017 |
| Healthcare cost trend rate assumption for the next year | 6.38 | % | | 6.56 | % |
| Rate to which the cost trend rate is assumed to decline (the ultimate trend rate) | 5.00 | % | | 5.00 | % |
| Year that the rate reaches the ultimate trend rate | 2032 |
| | 2032 |
|
Assumed healthcare cost trend rates have a significant effect on the amounts reported for healthcare plans. To illustrate, a one-percentage-point change in assumed healthcare cost trends would have the following effects:
|
| | | | | | | |
| | 1-Percentage- Point Decrease | | 1-Percentage- Point Increase |
| Effect on total of service and interest cost components | $ | — |
| | $ | — |
|
| Effect on postretirement benefit obligation | $ | (0.5 | ) | | $ | 0.6 |
|
|
| | | | | | | |
| | 1-Percentage- Point Decrease | | 1-Percentage- Point Increase |
| Effect on total of service and interest cost components | $ | (26 | ) | | $ | 29 |
|
| Effect on postretirement benefit obligation | $ | (599 | ) | | $ | 672 |
|
NOTES TO THE CONSOLIDATED FINANCIAL STATEMENTS
(In thousands, except shares and per share data)
Summaries related to changes in benefit obligations and plan assets and to the funded status of our defined benefit and postretirement medical benefit plans are as follows:
|
| | | | | | | | | | | | | | | | | | | | | | | |
| | U.S. Nonqualified Plan | | Non-U.S. Pension Benefits | | Postretirement Medical Benefits |
| | 2019 | | 2018 | | 2019 | | 2018 | | 2019 | | 2018 |
| Change in benefit obligation: | | | | | | | | | | | |
| Benefit obligation at beginning of year | $ | 1.3 |
| | $ | 1.5 |
| | $ | 10.2 |
| | $ | 12.1 |
| | $ | 8.6 |
| | $ | 9.6 |
|
| Service cost | — |
| | — |
| | — |
| | 0.1 |
| | — |
| | 0.1 |
|
| Interest cost | 0.1 |
| | — |
| | 0.3 |
| | 0.3 |
| | 0.3 |
| | 0.3 |
|
| Plan amendments | — |
| | — |
| | — |
| | 0.1 |
| | — |
| | — |
|
| Actuarial loss (gain) | — |
| | — |
| | 0.8 |
| | (0.5 | ) | | (0.1 | ) | | (0.5 | ) |
| Foreign exchange | — |
| | — |
| | 0.3 |
| | (0.6 | ) | | — |
| | — |
|
| Benefits paid | (0.1 | ) | | (0.2 | ) | | (0.2 | ) | | (1.2 | ) | | (1.0 | ) | | (0.9 | ) |
| Settlement | — |
| | — |
| | — |
| | — |
| | — |
| | — |
|
| Curtailment | — |
| | — |
| | — |
| | (0.1 | ) | | — |
| | — |
|
| Benefit obligation at end of year | $ | 1.3 |
| | $ | 1.3 |
| | $ | 11.4 |
| | $ | 10.2 |
| | $ | 7.8 |
| | $ | 8.6 |
|
| Change in fair value of plan assets and net accrued liabilities: |
| Fair value of plan assets at beginning of year | $ | — |
| | $ | — |
| | $ | 10.8 |
| | $ | 11.2 |
| | $ | — |
| | $ | — |
|
| Actual return on plan assets | — |
| | — |
| | 0.8 |
| | 1.1 |
| | — |
| | — |
|
| Employer contributions | 0.1 |
| | 0.2 |
| | 0.4 |
| | 0.3 |
| | 1.0 |
| | 0.9 |
|
| Foreign exchange | — |
| | — |
| | 0.4 |
| | (0.6 | ) | | — |
| | — |
|
| Benefits paid | (0.1 | ) | | (0.2 | ) | | (0.2 | ) | | (1.2 | ) | | (1.0 | ) | | (0.9 | ) |
| Settlement | — |
| | — |
| | — |
| | — |
| | — |
| | — |
|
| Fair value of plan assets at end of year | — |
| | — |
| | 12.2 |
| | 10.8 |
| | — |
| | — |
|
| Funded status at end of year | $ | (1.3 | ) | | $ | (1.3 | ) | | $ | 0.8 |
| | $ | 0.6 |
| | $ | (7.8 | ) | | $ | (8.6 | ) |
| Amounts recognized in the Consolidated Balance Sheets consist of: |
| Noncurrent Other Assets | $ | — |
| | $ | — |
| | $ | 1.8 |
| | $ | 1.6 |
| | $ | — |
| | $ | — |
|
| Current Liabilities | (0.2 | ) | | (0.2 | ) | | — |
| | (0.1 | ) | | (0.7 | ) | | (0.8 | ) |
| Long-Term Liabilities | (1.1 | ) | | (1.1 | ) | | (1.0 | ) | | (0.9 | ) | | (7.1 | ) | | (7.8 | ) |
| Net accrued (liability) asset | $ | (1.3 | ) | | $ | (1.3 | ) | | $ | 0.8 |
| | $ | 0.6 |
| | $ | (7.8 | ) | | $ | (8.6 | ) |
| Amounts recognized in Accumulated Other Comprehensive Loss consist of: |
| Prior service cost | $ | — |
| | $ | — |
| | $ | (0.1 | ) | | $ | (0.1 | ) | | $ | — |
| | $ | — |
|
| Net actuarial (loss) gain | (0.9 | ) | | (0.9 | ) | | (0.4 | ) | | — |
| | 0.4 |
| | 0.4 |
|
| Accumulated Other Comprehensive (Loss) Income | $ | (0.9 | ) | | $ | (0.9 | ) | | $ | (0.5 | ) | | $ | (0.1 | ) | | $ | 0.4 |
| | $ | 0.4 |
|
|
| | | | | | | | | | | | | | | | | | | | | | | |
| | U.S. Pension Benefits | | Non-U.S. Pension Benefits | | Postretirement Medical Benefits |
| | 2018 | | 2017 | | 2018 | | 2017 | | 2018 | | 2017 |
| Change in benefit obligation: | | | | | | | | | | | |
| Benefit obligation at beginning of year | $ | 1,414 |
| | $ | 40,961 |
| | $ | 12,144 |
| | $ | 11,136 |
| | $ | 9,604 |
| | $ | 10,540 |
|
| Service cost | — |
| | — |
| | 126 |
| | 132 |
| | 45 |
| | 60 |
|
| Interest cost | 43 |
| | 1,538 |
| | 280 |
| | 298 |
| | 293 |
| | 363 |
|
| Plan participants' contributions | — |
| | — |
| | 13 |
| | 14 |
| | — |
| | — |
|
| Plan amendments | — |
| | — |
| | 109 |
| | — |
| | — |
| | — |
|
| Actuarial loss (gain) | 35 |
| | 1,811 |
| | (514 | ) | | 327 |
| | (485 | ) | | (524 | ) |
| Foreign exchange | — |
| | — |
| | (583 | ) | | 1,097 |
| | — |
| | — |
|
| Benefits paid | (149 | ) | | (1,950 | ) | | (1,196 | ) | | (860 | ) | | (844 | ) | | (835 | ) |
| Settlement | (76 | ) | | (40,946 | ) | | — |
| | — |
| | — |
| | — |
|
| Curtailment | — |
| | — |
| | (165 | ) | | — |
| | — |
| | — |
|
| Benefit obligation at end of year | $ | 1,267 |
| | $ | 1,414 |
| | $ | 10,214 |
| | $ | 12,144 |
| | $ | 8,613 |
| | $ | 9,604 |
|
| Change in fair value of plan assets and net accrued liabilities: |
| Fair value of plan assets at beginning of year | $ | — |
| | $ | 46,389 |
| | $ | 11,163 |
| | $ | 9,562 |
| | $ | — |
| | $ | — |
|
| Actual return on plan assets | — |
| | 2,536 |
| | 1,138 |
| | 1,189 |
| | — |
| | — |
|
| Employer contributions | 225 |
| | 276 |
| | 327 |
| | 313 |
| | 844 |
| | 835 |
|
| Plan participants' contributions | — |
| | — |
| | 13 |
| | 14 |
| | — |
| | — |
|
| Excess assets transferred to Defined Contribution Plan | — |
| | (6,305 | ) | | — |
| | — |
| | — |
| | — |
|
| Foreign exchange | — |
| | — |
| | (603 | ) | | 945 |
| | — |
| | — |
|
| Benefits paid | (149 | ) | | (1,950 | ) | | (1,196 | ) | | (860 | ) | | (844 | ) | | (835 | ) |
| Settlement | (76 | ) | | (40,946 | ) | | — |
| | — |
| | — |
| | — |
|
| Fair value of plan assets at end of year | — |
| | — |
| | 10,842 |
| | 11,163 |
| | — |
| | — |
|
| Funded status at end of year | $ | (1,267 | ) | | $ | (1,414 | ) | | $ | 628 |
| | $ | (981 | ) | | $ | (8,613 | ) | | $ | (9,604 | ) |
| Amounts recognized in the Consolidated Balance Sheets consist of: |
| Noncurrent Other Assets | $ | — |
| | $ | — |
| | $ | 1,578 |
| | $ | — |
| | $ | — |
| | $ | — |
|
| Current Liabilities | (146 | ) | | (140 | ) | | (34 | ) | | (36 | ) | | (779 | ) | | (771 | ) |
| Long-Term Liabilities | (1,121 | ) | | (1,274 | ) | | (916 | ) | | (945 | ) | | (7,834 | ) | | (8,833 | ) |
| Net accrued (liability) asset | $ | (1,267 | ) | | $ | (1,414 | ) | | $ | 628 |
| | $ | (981 | ) | | $ | (8,613 | ) | | $ | (9,604 | ) |
| Amounts recognized in Accumulated Other Comprehensive Loss consist of: |
| Prior service cost | $ | — |
| | $ | — |
| | $ | (109 | ) | | $ | — |
| | $ | — |
| | $ | — |
|
| Net actuarial (loss) gain | (852 | ) | | (915 | ) | | 42 |
| | (1,245 | ) | | 444 |
| | (41 | ) |
| Accumulated Other Comprehensive (Loss) Income | $ | (852 | ) | | $ | (915 | ) | | $ | (67 | ) | | $ | (1,245 | ) | | $ | 444 |
| | $ | (41 | ) |
NOTES TO THE CONSOLIDATED FINANCIAL STATEMENTS
(In thousands,Tables in millions, except shares and per share data)
The components of the net periodic benefit cost (credit) cost for the three years ended December 31 were as follows:
|
| | | | | | | | | | | | | | | | | | | | | | | | | | | | | | | | | | | |
| | U.S. Pension Plans | | Non-U.S. Pension Benefits | | Postretirement Medical Benefits |
| | 2019 | | 2018 | | 2017 | | 2019 | | 2018 | | 2017 | | 2019 | | 2018 | | 2017 |
| Service cost | $ | — |
| | $ | — |
| | $ | — |
| | $ | — |
| | $ | 0.1 |
| | $ | 0.1 |
| | $ | — |
| | $ | 0.1 |
| | $ | — |
|
| Interest cost | 0.1 |
| | — |
| | 1.5 |
| | 0.3 |
| | 0.3 |
| | 0.3 |
| | 0.3 |
| | 0.3 |
| | 0.4 |
|
| Expected return on plan assets | — |
| | — |
| | (2.3 | ) | | (0.4 | ) | | (0.4 | ) | | (0.4 | ) | | — |
| | — |
| | — |
|
| Amortization of net actuarial loss (gain) | — |
| | 0.1 |
| | — |
| | — |
| | — |
| | 0.1 |
| | (0.1 | ) | | — |
| | — |
|
| Net periodic benefit cost (credit) | 0.1 |
| | 0.1 |
| | (0.8 | ) | | (0.1 | ) | | — |
| | 0.1 |
| | 0.2 |
| | 0.4 |
| | 0.4 |
|
| Curtailment | — |
| | — |
| | — |
| | — |
| | (0.1 | ) | | — |
| | — |
| | — |
| | — |
|
| Settlement | — |
| | — |
| | 6.4 |
| | — |
| | — |
| | — |
| | — |
| | — |
| | — |
|
| Net benefit cost (credit) | $ | 0.1 |
| | $ | 0.1 |
| | $ | 5.6 |
| | $ | (0.1 | ) | | $ | (0.1 | ) | | $ | 0.1 |
| | $ | 0.2 |
| | $ | 0.4 |
| | $ | 0.4 |
|
|
| | | | | | | | | | | | | | | | | | | | | | | | | | | | | | | | | | | |
| | U.S. Pension Benefits | | Non-U.S. Pension Benefits | | Postretirement Medical Benefits |
| | 2018 | | 2017 | | 2016 | | 2018 | | 2017 | | 2016 | | 2018 | | 2017 | | 2016 |
| Service cost | $ | — |
| | $ | — |
| | $ | 354 |
| | $ | 126 |
| | $ | 132 |
| | $ | 103 |
| | $ | 45 |
| | $ | 60 |
| | $ | 76 |
|
| Interest cost | 43 |
| | 1,538 |
| | 1,659 |
| | 280 |
| | 298 |
| | 358 |
| | 293 |
| | 363 |
| | 396 |
|
| Expected return on plan assets | — |
| | (2,336 | ) | | (2,400 | ) | | (403 | ) | | (379 | ) | | (452 | ) | | — |
| | — |
| | — |
|
| Amortization of net actuarial loss | 49 |
| | 43 |
| | 41 |
| | 38 |
| | 74 |
| | 27 |
| | — |
| | — |
| | — |
|
| Amortization of prior service cost | — |
| | — |
| | 41 |
| | — |
| | — |
| | — |
| | — |
| | — |
| | — |
|
| Foreign currency | — |
| | — |
| | — |
| | 35 |
| | (1 | ) | | 97 |
| | — |
| | — |
| | — |
|
| Net periodic benefit cost (credit) | 92 |
| | (755 | ) | | (305 | ) | | 76 |
| | 124 |
| | 133 |
| | 338 |
| | 423 |
| | 472 |
|
| Curtailment | — |
| | — |
| | — |
| | (165 | ) | | — |
| | — |
| | — |
| | — |
| | — |
|
| Settlement | 49 |
| | 6,373 |
| | — |
| | — |
| | — |
| | — |
| | — |
| | — |
| | — |
|
| Net benefit cost (credit) | $ | 141 |
| | $ | 5,618 |
| | $ | (305 | ) | | $ | (89 | ) | | $ | 124 |
| | $ | 133 |
| | $ | 338 |
| | $ | 423 |
| | $ | 472 |
|
The changes in Accumulated Other Comprehensive Loss for the three years ended December 31 were as follows:
|
| | | | | | | | | | | | | | | | | | | | | | | | | | | | | | | | | | | |
| | U.S. Pension Plans | | Non-U.S. Pension Benefits | | Postretirement Medical Benefits |
| | 2019 | | 2018 | | 2017 | | 2019 | | 2018 | | 2017 | | 2019 | | 2018 | | 2017 |
| Prior service cost | $ | — |
| | $ | — |
| | $ | — |
| | $ | — |
| | $ | 0.1 |
| | $ | — |
| | $ | — |
| | $ | — |
| | $ | — |
|
| Net actuarial loss (gain) | 0.1 |
| | — |
| | 1.6 |
| | 0.4 |
| | (1.2 | ) | | (0.5 | ) | | (0.1 | ) | | (0.5 | ) | | (0.5 | ) |
| Amortization of net actuarial (loss) gain | — |
| | (0.1 | ) | | — |
| | — |
| | — |
| | (0.1 | ) | | 0.1 |
| | — |
| | — |
|
| Settlement | — |
| | — |
| | (6.4 | ) | | — |
| | — |
| | — |
| | — |
| | — |
| | — |
|
| Total recognized in other comprehensive (loss) income | $ | 0.1 |
| | $ | (0.1 | ) | | $ | (4.8 | ) | | $ | 0.4 |
| | $ | (1.1 | ) | | $ | (0.6 | ) | | $ | — |
| | $ | (0.5 | ) | | $ | (0.5 | ) |
| Total recognized in net benefit cost (credit) and other comprehensive loss (income) | $ | 0.2 |
| | $ | — |
| | $ | 0.8 |
| | $ | 0.3 |
| | $ | (1.2 | ) | | $ | (0.5 | ) | | $ | 0.2 |
| | $ | (0.1 | ) | | $ | (0.1 | ) |
|
| | | | | | | | | | | | | | | | | | | | | | | | | | | | | | | | | | | |
| | U.S. Pension Benefits | | Non-U.S. Pension Benefits | | Postretirement Medical Benefits |
| | 2018 | | 2017 | | 2016 | | 2018 | | 2017 | | 2016 | | 2018 | | 2017 | | 2016 |
| Prior service cost | $ | — |
| | $ | — |
| | $ | — |
| | $ | 109 |
| | $ | — |
| | $ | — |
| | $ | — |
| | $ | — |
| | $ | — |
|
| Net actuarial loss (gain) | 35 |
| | 1,611 |
| | 633 |
| | (1,249 | ) | | (465 | ) | | 1,718 |
| | (485 | ) | | (524 | ) | | 6 |
|
| Amortization of prior service cost | — |
| | — |
| | (41 | ) | | (19 | ) | | — |
| | — |
| | — |
| | — |
| | — |
|
| Amortization of net actuarial loss | (49 | ) | | (43 | ) | | (41 | ) | | (38 | ) | | (74 | ) | | (27 | ) | | — |
| | — |
| | — |
|
| Settlement | (49 | ) | | (6,373 | ) | | — |
| | — |
| | — |
| | — |
| | — |
| | — |
| | — |
|
| Total recognized in other comprehensive (income) loss | $ | (63 | ) | | $ | (4,805 | ) | | $ | 551 |
| | $ | (1,197 | ) | | $ | (539 | ) | | $ | 1,691 |
| | $ | (485 | ) | | $ | (524 | ) | | $ | 6 |
|
| Total recognized in net benefit cost (credit) and other comprehensive (income) loss | $ | 78 |
| | $ | 813 |
| | $ | 246 |
| | $ | (1,286 | ) | | $ | (415 | ) | | $ | 1,824 |
| | $ | (147 | ) | | $ | (101 | ) | | $ | 478 |
|
The following benefit payments, which reflect expected future service, are expected to be paid for our U.S. Nonqualified and Non-U.S. plans:
|
| | | | | | | | | | | |
| | U.S. Nonqualified Plan | | Non-U.S. Pension Benefits | | Postretirement Medical Benefits |
| 2020 | $ | 0.2 |
| | $ | 0.2 |
| | $ | 0.7 |
|
| 2021 | 0.1 |
| | 0.3 |
| | 0.7 |
|
| 2022 | 0.1 |
| | 0.3 |
| | 0.7 |
|
| 2023 | 0.1 |
| | 0.3 |
| | 0.7 |
|
| 2024 | 0.1 |
| | 0.3 |
| | 0.6 |
|
| 2025 to 2029 | 0.5 |
| | 1.6 |
| | 2.8 |
|
| Total | $ | 1.1 |
| | $ | 3.0 |
| | $ | 6.2 |
|
|
| | | | | | | | | | | |
| | U.S. Pension Benefits | | Non-U.S. Pension Benefits | | Postretirement Medical Benefits |
| 2019 | $ | 146 |
| | $ | 243 |
| | $ | 779 |
|
| 2020 | 138 |
| | 249 |
| | 830 |
|
| 2021 | 129 |
| | 257 |
| | 752 |
|
| 2022 | 121 |
| | 265 |
| | 755 |
|
| 2023 | 112 |
| | 275 |
| | 715 |
|
| 2024 to 2028 | 468 |
| | 1,511 |
| | 3,424 |
|
| Total | $ | 1,114 |
| | $ | 2,800 |
| | $ | 7,255 |
|
The following amounts are included in Accumulated Other Comprehensive Loss as of December 31, 20182019 and are expected to be recognized as components of net periodic benefit cost during 2019:2020:
|
| | | | | | | |
| | Pension Benefits | | Postretirement Medical Benefits |
| Net actuarial loss | $ | 0.1 |
| | $ | — |
|
|
| | | | | | | |
| | Pension Benefits | | Postretirement Medical Benefits |
| Net actuarial loss | $ | 104 |
| | $ | — |
|
| Transition obligation | 4 |
| | — |
|
NOTES TO THE CONSOLIDATED FINANCIAL STATEMENTS
(In thousands,Tables in millions, except shares and per share data)
| |
16.14. | Shareholders' Equity |
Authorized Shares
We are authorized to issue an aggregate of 60,000,000 shares, all of which are designated as Common Stock having a par value of $0.375 per share. The Board of Directors is authorized to establish one or more series of preferred stock, setting forth the designation of each such series, and fixing the relative rights and preferences of each such series.
Accumulated Other Comprehensive Loss
Components of Accumulated Other Comprehensive Loss, net of tax, within the Consolidated Balance Sheets and Consolidated Statements of Equity as of December 31 are as follows:
|
| | | | | | | | | | | |
| | 2019 | | 2018 | | 2017 |
| Foreign currency translation adjustments | $ | (36.3 | ) | | $ | (31.9 | ) | | $ | (15.8 | ) |
| Pension and retiree medical benefits | (0.7 | ) | | (0.3 | ) | | (1.6 | ) |
| Cash flow hedge | (1.5 | ) | | (5.0 | ) | | (4.9 | ) |
| Total Accumulated Other Comprehensive Loss | $ | (38.5 | ) | | $ | (37.2 | ) | | $ | (22.3 | ) |
|
| | | | | | | | | | | |
| | 2018 | | 2017 | | 2016 |
| Foreign currency translation adjustments | $ | (31,831 | ) | | $ | (15,778 | ) | | $ | (44,444 | ) |
| Pension and retiree medical benefits | (332 | ) | | (1,610 | ) | | (5,391 | ) |
| Cash flow hedge | (5,031 | ) | | (4,935 | ) | | (88 | ) |
| Total Accumulated Other Comprehensive Loss | $ | (37,194 | ) | | $ | (22,323 | ) | | $ | (49,923 | ) |
The changes in components of Accumulated Other Comprehensive Loss, net of tax, are as follows:
|
| | | | | | | | | | | | | | | |
| | Foreign Currency Translation Adjustments | | Pension and Postretirement Benefits | | Cash Flow Hedge | | Total |
| December 31, 2018 | $ | (31.9 | ) | | $ | (0.3 | ) | | $ | (5.0 | ) | | $ | (37.2 | ) |
| Other comprehensive (loss) income before reclassifications | (4.4 | ) | | (0.4 | ) | | 8.3 |
| | 3.5 |
|
| Amounts reclassified from Accumulated Other Comprehensive Loss | — |
| | — |
| | (4.8 | ) | | (4.8 | ) |
| Net current period other comprehensive (loss) income | (4.4 | ) | | (0.4 | ) | | 3.5 |
| | (1.3 | ) |
| December 31, 2019 | $ | (36.3 | ) | | $ | (0.7 | ) | | $ | (1.5 | ) | | $ | (38.5 | ) |
|
| | | | | | | | | | | | | | | |
| | Foreign Currency Translation Adjustments | | Pension and Postretirement Benefits | | Cash Flow Hedge | | Total |
| December 31, 2017 | $ | (15,778 | ) | | $ | (1,610 | ) | | $ | (4,935 | ) | | $ | (22,323 | ) |
| Other comprehensive (loss) income before reclassifications | (16,053 | ) | | 1,293 |
| | 9,125 |
| | (5,635 | ) |
| Amounts reclassified from Accumulated Other Comprehensive Loss | — |
| | 122 |
| | (8,095 | ) | | (7,973 | ) |
| Adjustments to Accumulated Other Comprehensive Loss for disproportionate income tax effects recognized from the adoption of ASU 2018-02 | — |
| | (137 | ) | | (1,126 | ) | | (1,263 | ) |
| Net current period other comprehensive (loss) income | (16,053 | ) | | 1,278 |
| | (96 | ) | | (14,871 | ) |
| December 31, 2018 | $ | (31,831 | ) | | $ | (332 | ) | | $ | (5,031 | ) | | $ | (37,194 | ) |
Accumulated Other Comprehensive Loss associated with pension and postretirement benefits and cash flow hedges are included in Notes 1513 and 13,11, respectively.
| |
17. | Commitments and Contingencies |
15.Leases
We lease office and warehouse facilities, vehicles and office equipment under the operating lease agreements, which include both monthly and longer-term arrangements. Leases with initial terms of one year or more expire at various dates through 2028 and generally provide for extension options. Rent expense under the leasing agreements (exclusive of real estate taxes, insurance and other expenses payable under the leases) amounted to $23,348, $21,566 and $18,640 in 2018, 2017 and 2016, respectively.
The minimum rentals for aggregate lease commitments as of December 31, 2018 were as follows:
|
| | | |
| 2019 | $ | 15,200 |
|
| 2020 | 8,973 |
|
| 2021 | 5,535 |
|
| 2022 | 3,592 |
|
| 2023 | 2,636 |
|
| Thereafter | 4,215 |
|
| Total | $ | 40,151 |
|
Certain operating leases for vehicles contain residual value guarantee provisions, which would become due at the expiration of the operating lease agreement if the fair value of the leased vehicles is less than the guaranteed residual value. TheAs of December 31, 2019, of those leases that contain residual value guarantees, the aggregate residual value at lease expiration of those leases is $14,043,was $13.7 million, of which we have guaranteed $8,404.$10.7 million. As of December 31, 2018,2019, we have recorded a liability for the estimated end-of-termend of term loss related to this residual value guarantee of $243$0.2 million for certain vehicles within our fleet. Our fleet also contains vehicles we estimate will settle at a gain. Gains on these vehicles will be recognized at the end of the lease term.
NOTES TO THE CONSOLIDATED FINANCIAL STATEMENTS
(In thousands,Tables in millions, except shares and per share data)
The lease assets and liabilities as of December 31, 2019 are as follows:
|
| | | | |
| | | December 31, |
| Leases | Classification | 2019 |
| Assets | | |
| Operating lease assets | Operating Lease Assets | $ | 46.6 |
|
| Finance lease assets | Property, Plant and Equipment(a) | 0.3 |
|
| Total leased assets | | $ | 46.9 |
|
| Liabilities | | |
| Current: | | |
| Operating | Other Current Liabilities | $ | 16.7 |
|
| Finance | Current Portion of Long-term Debt | 0.2 |
|
| Noncurrent: | | |
| Operating | Long-term Operating Lease Liabilities | 30.3 |
|
| Finance | Long-term Debt | — |
|
| Total lease liabilities | | $ | 47.2 |
|
(a) Finance lease assets are recorded net of accumulated amortization of $0.5 million as of December 31, 2019.
The lease cost for the years ended December 31, 2019 and 2018 was as follows:
|
| | | | | | | |
| | Years Ended |
| | December 31 |
| Lease Cost | 2019 | | 2018 |
| Operating lease cost | $ | 27.5 |
| (a) | $ | 23.3 |
|
Finance lease cost(b) | 0.3 |
| | 0.4 |
|
| Total lease cost | $ | 27.8 |
| | $ | 23.7 |
|
| |
(a) | Includes short-term lease costs of $3.1 million for the year ended December 31, 2019, and variable lease costs of $2.4 million for the year ended December 31, 2019. |
(b) Includes amortization of leased assets and interest on lease liabilities.
The maturity of lease liabilities as of December 31, 2019 was as follows:
|
| | | | | | | | | |
| Maturity of Lease Liabilities | Operating Leases |
| Finance Leases |
| Total |
|
| 2020 | $ | 18.0 |
| $ | 0.2 |
| $ | 18.2 |
|
| 2021 | 13.2 |
| — |
| 13.2 |
|
| 2022 | 8.4 |
| — |
| 8.4 |
|
| 2023 | 5.5 |
| — |
| 5.5 |
|
| 2024 | 3.2 |
| — |
| 3.2 |
|
| Thereafter | 2.2 |
| — |
| 2.2 |
|
| Total lease payments | $ | 50.5 |
| $ | 0.2 |
| $ | 50.7 |
|
| Less: Interest | (3.5 | ) | — |
| (3.5 | ) |
| Present value of lease liabilities | $ | 47.0 |
| $ | 0.2 |
| $ | 47.2 |
|
NOTES TO THE CONSOLIDATED FINANCIAL STATEMENTS
(Tables in millions, except shares and per share data)
The minimum rentals for aggregate lease commitments as of December 31, 2018 were as follows:
|
| | | |
| 2019 | $ | 15.2 |
|
| 2020 | 9.0 |
|
| 2021 | 5.5 |
|
| 2022 | 3.6 |
|
| 2023 | 2.6 |
|
| Thereafter | 4.2 |
|
| Total | $ | 40.1 |
|
The lease term and discount rate as of December 31, 2019 were as follows:
|
| | |
| December 31, |
| Lease Term and Discount Rate | 2019 |
| Weighted-average remaining lease term (years): | |
| Operating leases | 3.7 |
|
| Finance leases | 1.5 |
|
| Weighted-average discount rate: | |
| Operating leases | 3.7 | % |
| Finance leases | 2.5 | % |
Other information related to cash paid related to lease liabilities and lease assets obtained for the year ended December 31, 2019 was as follows:
|
| | | |
| Year Ended |
| December 31, |
| Other Information | 2019 |
| Cash paid for amounts included in the measurement of lease liabilities: | |
| Operating cash flows from finance leases | $ | — |
|
| Operating cash flows from operating leases | 22.7 |
|
| Financing cash flows from finance leases | 0.3 |
|
| Lease assets obtained in exchange for new finance lease liabilities | 0.1 |
|
| Lease assets obtained in exchange for new operating lease liabilities | 26.4 |
|
| |
| 16. | Commitments and Contingencies |
In the ordinary course of business, we may become liable with respect to pending and threatened litigation, tax, environmental and other matters. While the ultimate results of current claims, investigations and lawsuits involving us are unknown at this time, we do not expect that these matters will have a material adverse effect on our consolidated financial position or results of operations. Legal costs associated with such matters are expensed as incurred.
As of December 31, 2018, we hold a note receivable of $5,360, including accrued interest, on our Consolidated Balance Sheet. There is some uncertainty about the collectability of this note receivable; however, we are not able to determine an appropriate allowance, if any, as of December 31, 2018.
On December 22, 2017, the Tax Cuts and Jobs Act of 2017 (the "Tax Act") was signed into law. The Tax Act made broad and complex changes to the U.S. tax code which included a lowering of the U.S. federal corporate income tax rate from 35% to 21% effective January 1, 2018, accelerated expensing of qualified capital investments for a specific period, limitations of the deductibility of interest expense and executive compensation, and a transition from a worldwide to a territorial tax system, which required companies to pay a one-time transition tax on certain unrepatriated earnings from foreign subsidiaries.
ASC 740, Income Taxes, requires a company to record the effects of a tax law change in the period of enactment. ASU 2018-05 allowed a company to record a provisional amount when it did not have the necessary information available, prepared or analyzed in reasonable detail to complete its accounting for the change in the tax law. The measurement period ends when the company has obtained, prepared and analyzed the information necessary to finalize its accounting, but could not extend beyond one year. In the fourth quarter of 2017, we included a provisional amount for the one-time transition tax on certain unrepatriated earnings. The accounting for the income tax effect of the one-time transition tax on certain unrepatriated earnings was finalized in the third quarter of 2018, impacting the year-to-date overall effective tax rate by (1.3)%. In the fourth quarter of 2017, we remeasured our deferred taxes at the reduced corporate tax rate of 21% and recognized the change as a discrete income tax expense.
The accounting for the remeasurement of the deferred taxes and transition tax was finalized in the third quarter of 2018. Adjustments to the provisional amounts were not material to the consolidated financial statements. The accounting for the income tax effects of the Tax Act is complete as of December 31, 2018.
NOTES TO THE CONSOLIDATED FINANCIAL STATEMENTS
(Tables in millions, except shares and per share data)
Income from continuing operations for the three years ended December 31 was as follows:
|
| | | | | | | | | | | |
| | 2019 | | 2018 | | 2017 |
| U.S. operations | $ | 50.1 |
| | $ | 23.9 |
| | $ | 7.5 |
|
| Foreign operations | 3.9 |
| | 11.9 |
| | (8.8 | ) |
| Total | $ | 54.0 |
| | $ | 35.8 |
| | $ | (1.3 | ) |
|
| | | | | | | | | | | |
| | 2018 | | 2017 | | 2016 |
| U.S. operations | $ | 23,913 |
| | $ | 7,465 |
| | $ | 54,018 |
|
| Foreign operations | 11,929 |
| | (8,757 | ) | | 12,473 |
|
| Total | $ | 35,842 |
| | $ | (1,292 | ) | | $ | 66,491 |
|
Income tax expense (benefit) for the three years ended December 31 was as follows:
|
| | | | | | | | | | | |
| | 2019 | | 2018 | | 2017 |
| Current: | | | | | |
| Federal | $ | 9.6 |
| | $ | 3.7 |
| | $ | 2.6 |
|
| Foreign | 5.6 |
| | 7.0 |
| | 8.7 |
|
| State | 2.1 |
| | 1.0 |
| | 0.8 |
|
| | $ | 17.3 |
| | $ | 11.7 |
| | $ | 12.1 |
|
| Deferred: | |
| | |
| | |
|
| Federal | $ | (2.4 | ) | | $ | (3.1 | ) | | $ | 1.6 |
|
| Foreign | (6.7 | ) | | (6.0 | ) | | (8.7 | ) |
| State | (0.1 | ) | | (0.3 | ) | | (0.1 | ) |
| | $ | (9.2 | ) | | $ | (9.4 | ) | | $ | (7.2 | ) |
| Total: | |
| | |
| | |
|
| Federal | $ | 7.2 |
| | $ | 0.6 |
| | $ | 4.2 |
|
| Foreign | (1.1 | ) | | 1.0 |
| | — |
|
| State | 2.0 |
| | 0.7 |
| | 0.7 |
|
| Total Income Tax Expense | $ | 8.1 |
| | $ | 2.3 |
| | $ | 4.9 |
|
|
| | | | | | | | | | | |
| | 2018 | | 2017 | | 2016 |
| Current: | | | | | |
| Federal | $ | 3,731 |
| | $ | 2,590 |
| | $ | 15,962 |
|
| Foreign | 7,030 |
| | 8,701 |
| | 3,035 |
|
| State | 1,033 |
| | 812 |
| | 1,859 |
|
| | $ | 11,794 |
| | $ | 12,103 |
| | $ | 20,856 |
|
| Deferred: | |
| | |
| | |
|
| Federal | $ | (3,135 | ) | | $ | 1,640 |
| | $ | (472 | ) |
| Foreign | (6,012 | ) | | (8,699 | ) | | (434 | ) |
| State | (343 | ) | | (131 | ) | | (73 | ) |
| | $ | (9,490 | ) | | $ | (7,190 | ) | | $ | (979 | ) |
| Total: | |
| | |
| | |
|
| Federal | $ | 596 |
| | $ | 4,230 |
| | $ | 15,490 |
|
| Foreign | 1,018 |
| | 2 |
| | 2,601 |
|
| State | 690 |
| | 681 |
| | 1,786 |
|
| Total Income Tax Expense | $ | 2,304 |
| | $ | 4,913 |
| | $ | 19,877 |
|
In general, it is our practice and intention to permanently reinvest the earnings of our foreign subsidiaries and repatriate earnings only when the tax impact is zero or immaterial and that position has not changed following incurring the transition tax under the Tax Act.immaterial. Accordingly, no deferred taxes have been provided for withholding taxes or other taxes that would result upon repatriation of our approximately $1,572$64.8 million of undistributed earnings from foreign subsidiaries to the United States as those earnings continue to be permanently reinvested.
NOTES TO THE CONSOLIDATED FINANCIAL STATEMENTS
(In thousands,Tables in millions, except shares and per share data)
Our effective income tax rate varied from the U.S. federal statutory tax rate for the three years ended December 31 as follows:
|
| | | | | | | | |
| | 2019 | | 2018 | | 2017 |
| Tax at statutory rate | 21.0 | % | | 21.0 | % | | 35.0 | % |
| (Decreases) increases in the tax rate from: | | | |
| | |
|
| State and local taxes, net of federal benefit | 1.9 |
| | 1.4 |
| | (21.1 | ) |
| Effect of foreign operations | 3.5 |
| | (4.3 | ) | | (70.8 | ) |
| Transaction costs | 0.1 |
| | (4.2 | ) | | (226.3 | ) |
| Effect of 2017 deferred rate change | — |
| | (1.0 | ) | | (154.3 | ) |
| Transition Tax | — |
| | (1.0 | ) | | (28.0 | ) |
| Effect of changes in valuation allowances | (9.7 | ) | | 6.6 |
| | (126.5 | ) |
| Domestic production activities deduction | (0.3 | ) | | 0.4 |
| | 28.3 |
|
| Executive compensation over $1 million | 2.5 |
| | 1.0 |
| | (3.6 | ) |
| Share-based payments | (2.0 | ) | | (5.7 | ) | | 90.4 |
|
| Research & Development credit | (1.9 | ) | | (3.6 | ) | | 82.9 |
|
| Other, net | — |
| | (4.2 | ) | | 13.8 |
|
| Effective income tax rate | 15.1 | % | | 6.4 | % | | (380.2 | )% |
|
| | | | | | | | |
| | 2018 | | 2017 | | 2016 |
| Tax at statutory rate | 21.0 | % | | 35.0 | % | | 35.0 | % |
| (Decreases) increases in the tax rate from: | | | |
| | |
|
| State and local taxes, net of federal benefit | 1.4 |
| | (21.1 | ) | | 1.7 |
|
| Effect of foreign operations | (4.3 | ) | | (70.8 | ) | | (5.5 | ) |
| Transaction costs | (4.2 | ) | | (226.3 | ) | | — |
|
| Effect of 2017 deferred rate change | (1.0 | ) | | (154.3 | ) | | — |
|
| Transition Tax | (1.0 | ) | | (28.0 | ) | | — |
|
| Effect of changes in valuation allowances | 6.6 |
| | (126.5 | ) | | 1.9 |
|
| Domestic production activities deduction | 0.4 |
| | 28.3 |
| | (2.2 | ) |
| Share-based payments | (5.7 | ) | | 90.4 |
| | — |
|
| Research & Development credit | (3.6 | ) | | 82.9 |
| | (1.3 | ) |
| Other, net | (3.2 | ) | | 10.2 |
| | 0.3 |
|
| Effective income tax rate | 6.4 | % | | (380.2 | )% | | 29.9 | % |
Deferred tax assets and liabilities were comprised of the following as of December 31:
|
| | | | | | | |
| | 2019 | | 2018 |
| Deferred Tax Assets: | | | |
| Inventory costing and valuation methods | $ | 4.6 |
| | $ | 3.3 |
|
| Employee wages and benefits, principally due to accruals for financial reporting purposes | 13.7 |
| | 11.7 |
|
| Warranty reserves accrued for financial reporting purposes | 2.5 |
| | 2.6 |
|
| Receivables, principally due to allowance for doubtful accounts and tax accounting method for equipment rentals | 1.9 |
| | 1.7 |
|
| Operating lease liability | 11.4 |
| | — |
|
| Tax loss carryforwards | 6.6 |
| | 7.8 |
|
| Tax credit carryforwards | 3.2 |
| | 4.7 |
|
| Other | 3.2 |
| | 4.7 |
|
| Gross Deferred Tax Assets | $ | 47.1 |
| | $ | 36.5 |
|
| Less: valuation allowance | (6.2 | ) | | (11.5 | ) |
| Total Net Deferred Tax Assets | $ | 40.9 |
| | $ | 25.0 |
|
| Deferred Tax Liabilities: | |
| | |
|
| Lease Right of Use Assets | 11.4 |
| | — |
|
| Property, Plant and Equipment, principally due to differences in depreciation and related gains | 10.2 |
| | 9.9 |
|
| Goodwill and Intangible Assets | 43.4 |
| | 45.6 |
|
| Total Deferred Tax Liabilities | $ | 65.0 |
| | $ | 55.5 |
|
| Net Deferred Tax Liabilities | $ | (24.1 | ) | | $ | (30.5 | ) |
|
| | | | | | | |
| | 2018 | | 2017 |
| Deferred Tax Assets: | | | |
| Inventories, principally due to changes in inventory reserves | $ | 3,335 |
| | $ | 4,757 |
|
| Employee wages and benefits, principally due to accruals for financial reporting purposes | 11,642 |
| | 11,031 |
|
| Warranty reserves accrued for financial reporting purposes | 2,610 |
| | 2,578 |
|
| Receivables, principally due to allowance for doubtful accounts and tax accounting method for equipment rentals | 1,728 |
| | 2,138 |
|
| Tax loss carryforwards | 7,765 |
| | 11,383 |
|
| Tax credit carryforwards | 4,708 |
| | 1,575 |
|
| Other | 4,712 |
| | 3,630 |
|
| Gross Deferred Tax Assets | $ | 36,500 |
| | $ | 37,092 |
|
| Less: valuation allowance | (11,519 | ) | | (9,691 | ) |
| Total Net Deferred Tax Assets | $ | 24,981 |
| | $ | 27,401 |
|
| Deferred Tax Liabilities: | |
| | |
|
| Property, Plant and Equipment, principally due to differences in depreciation and related gains | 9,882 |
| | 9,042 |
|
| Goodwill and Intangible Assets | 45,628 |
| | 60,450 |
|
| Total Deferred Tax Liabilities | $ | 55,510 |
| | $ | 69,492 |
|
| Net Deferred Tax Liabilities | $ | (30,529 | ) | | $ | (42,091 | ) |
Tax credit carryforwards consist of $1,812 foreign tax credits, $1,268$1.7 million U.S. federal and state tax credits and $1,628$1.4 million of Netherlands tax credits. We have non-U.S. cumulative tax losses of $35,593$33.5 million in various countries. Cumulative losses can be used to offset the income tax liabilities on future income in these countries. $18,649$16.4 million of these losses have unlimited carryforward periods. $16,944$17.1 million of these losses have a limited carryforward period which must be utilized during 20192020 to 2026.
The valuation allowance atas of December 31, 20182019 principally applies to theThe Netherlands tax loss and tax credit carryforwards, a Sweden tax loss carryforward, and state tax credit carryforwards that, in the opinion of management, are more likely than not to expire unutilized. However, to the extent that tax benefits related to these carryforwards are realized in the future, the reduction in the valuation allowance will reduce income tax expense. A valuation allowance for the remaining tax loss carryforwards is not required since it is more likely than not that they will be realized through carryback to taxable income in prior years, future reversals of existing taxable temporary differences and future taxable income.
NOTES TO THE CONSOLIDATED FINANCIAL STATEMENTS
(In thousands,Tables in millions, except shares and per share data)
A reconciliation of the beginning and ending amount of unrecognized tax benefits is as follows:
|
| | | | | | | |
| | 2019 | | 2018 |
| Balance at January 1 | $ | 5.6 |
| | $ | 2.2 |
|
| Increases as a result of tax positions taken during a prior period | 0.1 |
| | 0.1 |
|
| Increases as a result of tax positions taken during the current year | 0.5 |
| | 0.4 |
|
| Increase related to prior period tax positions of acquired entities | 2.5 |
| | 3.8 |
|
| Decreases relating to settlement with tax authorities | (0.1 | ) | | — |
|
| Reductions as a result of a lapse of the applicable statute of limitations | (1.0 | ) | | (1.3 | ) |
| Increases as a result of foreign currency fluctuations | (0.1 | ) | | 0.4 |
|
| Balance at December 31 | $ | 7.5 |
| | $ | 5.6 |
|
|
| | | | | | | |
| | 2018 | | 2017 |
| Balance at January 1 | $ | 2,232 |
| | $ | 2,477 |
|
| Increases as a result of tax positions taken during a prior period | 74 |
| | — |
|
| Increases as a result of tax positions taken during the current year | 370 |
| | 329 |
|
| Increase related to prior period tax positions of acquired entities | 3,833 |
| | 236 |
|
| Decreases relating to settlement with tax authorities | — |
| | (68 | ) |
| Reductions as a result of a lapse of the applicable statute of limitations | (1,274 | ) | | (770 | ) |
| Increases as a result of foreign currency fluctuations | 418 |
| | 28 |
|
| Balance at December 31 | $ | 5,653 |
| | $ | 2,232 |
|
Included in the balance of unrecognized tax benefits atas of December 31, 20182019 and 20172018 are potential benefits of $5,473$7.4 million and $1,992,$5.5 million, respectively, that if recognized, would affect the effective tax rate from continuing operations.
We recognize potential accrued interest and penalties related to unrecognized tax benefits as a component of income tax expense. In addition to the liability of $5,653$7.5 million and $2,232$5.6 million for unrecognized tax benefits as of December 31, 20182019 and 2017,2018, there was approximately $416$0.6 million and $482,$0.4 million, respectively, for accrued interest and penalties. To the extent interest and penalties are not assessed with respect to uncertain tax positions, the amounts accrued will be revised and reflected as an adjustment to income tax expense.
We and our subsidiaries are subject to U.S. federal income tax as well as income tax of numerous state and foreign jurisdictions. We are generally no longer subject to U.S. federal tax examinations for taxable years before 20152016 and, with limited exceptions, state and foreign income tax examinations for taxable years before 2014.
The2015. We are currently under examination by the Internal Revenue Service completed its examinationfor the 2016 and 2017 tax years. Although the outcome of the U.S. income tax return for the 2015 tax year during the third quarter of 2018. The IRS's adjustments to certain tax positions were not material. We are currently undergoing income tax examinations in various state and foreign jurisdictions covering 2014 to 2016. Although the final outcome of these examinations cannot currently be currently determined, we believe that we have adequate reserves with respect to these examinations.
We do not anticipate that total unrecognized tax benefits will change significantly within the next 12 months.
provision has been made for any potential unfavorable financial statement impact.
| |
19.18. | Share-Based Compensation |
We have four4 plans under which we have awarded share-based compensation grants: The 1997 Non-Employee Directors Option Plan ("1997 Plan"), which provided for stock option grants to our non-employee Directors, the 2007 Stock Incentive Plan (“2007 Plan”), the Amended and Restated 2010 Stock Incentive Plan, as Amended (“2010 Plan”) and the 2017 Stock Incentive Plan ("2017 Plan"), which were adopted as a continuing step toward aggregating our equity compensation programs to reduce the complexity of our equity compensation programs.
The 2010 Plan, originally approved by our shareholders on April 28, 2010 and amended and restated by our shareholders on April 25, 2012, terminated our rights to grant awards under the 2007 Plan; however, any awards granted under the 2007 or 2010 Plans that do not result in the issuance of shares of Common Stock may again be used for an award under the 2010 Plan. The 2010 Plan was amended and restated by our shareholders on April 24, 2013, increasing the number of shares available under the amended 2010 Plan from 1,500,000 shares to 2,600,000 shares.
The 2017 Plan approved by our shareholders on April 26, 2017 terminated our rights to grant awards under previous plans; however, any awards granted under previous plans that do not result in the issuance of shares of Common Stock may again be used for an award under the 2017 Plan. There were 1,200,000 shares made available under the approved 2017 Plan.
As of December 31, 2018,2019, there were 897,315962,647 shares reserved for issuance under the 2007 Plan and the 2010 Plan for outstanding compensation awards. There were 761,382377,077 shares available for issuance under the 2017 Plan for current and future equity awards as of December 31, 2018.2019. The Compensation Committee of the Board of Directors determines the number of shares awarded and the grant date, subject to the terms of our equity award policy.
We recognized total Share-Based Compensation Expense of $8,314, $5,891$11.4 million, $8.3 million and $3,875,$5.9 million, respectively, during the years ended 2019, 2018 2017 and 2016.2017. The total excess tax benefit recognized for share-based compensation arrangements during the years ended 2019, 2018 and 2017 was $1.1 million, $2.1 millionand 2016 was $2,060, $1,168 and $6861.2 million, respectively.
NOTES TO THE CONSOLIDATED FINANCIAL STATEMENTS
(In thousands,Tables in millions, except shares and per share data)
Stock Option Awards
We determined the fair value of our stock option awards using the Black-Scholes valuation model that uses the assumptions noted in the table below. The expected term selected for stock options granted during the year represents the period of time that the stock options are expected to be outstanding based on historical data of stock option holder exercise and termination behavior of similar grants. The risk-free interest rate for periods within the contractual life of the stock option is based on the U.S. Treasury rate over the expected life at the time of grant. Expected volatilities are based upon historical volatility of our stock over a period equal to the expected life of each stock option grant. Dividend yield is estimated over the expected life based on our dividend policy and historical dividends paid. To determine the amount of compensation cost to be recognized in each period, we account for forfeitures as they occur.
The following table illustrates the valuation assumptions used for the 2019, 2018 2017 and 20162017 grants:
|
| | | | | | | | |
| | 2019 | | 2018 | | 2017 |
| Expected volatility | 26 - 27% |
| | 25 | % | | 25 - 26% |
|
| Weighted-average expected volatility | 26 | % | | 25 | % | | 26 | % |
| Expected dividend yield | 1.2 - 1.4% |
| | 1.2 | % | | 1.2 - 1.3% |
|
| Weighted-average expected dividend yield | 1.2 | % | | 1.2 | % | | 1.3 | % |
| Expected term, in years | 5 |
| | 5 |
| | 5 |
|
| Risk-free interest rate | 1.6 - 2.5% |
| | 2.6 - 2.9% |
| | 1.7 - 2.0% |
|
|
| | | | | |
| | 2018 | | 2017 | | 2016 |
| Expected volatility | 25% | | 25 - 26% | | 29 -32% |
| Weighted-average expected volatility | 25% | | 26% | | 32% |
| Expected dividend yield | 1.2% | | 1.2 - 1.3% | | 1.3 - 1.5% |
| Weighted-average expected dividend yield | 1.2% | | 1.3% | | 1.3% |
| Expected term, in years | 5 | | 5 | | 5 |
| Risk-free interest rate | 2.6 - 2.9% | | 1.7 - 2.0% | | 1.1 - 1.4% |
New stock option awards granted vest one-third each year over a three3 year period and have a ten10 year contractual term. Compensation expense equal to the grant date fair value is recognized for these awards on a straight-line basis over the awards' vesting period. Stock options granted to employees are subject to accelerated expensing if the option holder meets the retirement definition set forth in the 2017 and 2010 Plans.
The following table summarizes the activity during the year ended December 31, 20182019 for stock option awards:
|
| | | | | | |
| | Shares | | Weighted-Average Exercise Price |
| Outstanding at beginning of year | 1,084,567 |
| | $ | 55.11 |
|
| Granted | 210,664 |
| | 63.68 |
|
| Exercised | (182,433 | ) | | 33.52 |
|
| Forfeited | (29,223 | ) | | 66.76 |
|
| Expired | (11,798 | ) | | $ | 68.05 |
|
| Outstanding at end of year | 1,071,777 |
| | $ | 60.01 |
|
| Exercisable at end of year | 711,381 |
| | $ | 56.91 |
|
|
| | | | | | |
| | Shares | | Weighted-Average Exercise Price |
| Outstanding at beginning of year | 1,135,608 |
| | $ | 47.47 |
|
| Granted | 202,623 |
| | 67.85 |
|
| Exercised | (223,352 | ) | | 26.33 |
|
| Forfeited | (30,312 | ) | | 66.06 |
|
| Outstanding at end of year | 1,084,567 |
| | $ | 55.11 |
|
| Exercisable at end of year | 711,499 |
| | $ | 48.94 |
|
The weighted-average grant date fair value of stock options granted during the years ended December 31, 20182019, 20172018 and 20162017 was $15.37, $16.07 $16.39 and $13.61,$16.39, respectively. The total intrinsic value of stock options exercised during the years ended December 31, 2019, 2018 and 2017 was $6.8 million, $10.3 million and 2016 was $10,305, $4,450 and $3,408,$4.5 million, respectively. The aggregate intrinsic value of options outstanding and exercisable at December 31, 20182019 was $5,987.$19.2 million and $14.9 million, respectively. The weighted-average remaining contractual life for options outstanding and exercisable as of December 31, 20182019 was 5.96.2 years and 4.55.0 years, respectively. As of December 31, 20182019, there was unrecognized compensation cost for nonvested options of $1,944,$2.1 million, which is expected to be recognized over a weighted-average period of 1.3 years.
Restricted Share Awards
Restricted share awards for employees generally have a three year vesting period from the effective date of the grant. Restricted share awards to non-employee directors vest upon a change of control or upon termination of service as a director occurring at least six months after grant date of the award so long as termination is for one of the following reasons: death; disability; retirement in accordance with Tennant policy (e.g., age, term limits, etc.); resignation at request of Board (other than for gross misconduct); resignation following at least six months’ advance notice; failure to be renominated (unless due to unwillingness to serve) or reelected by shareholders; or removal by shareholders. We use the closing share price the day before the grant date to determine the fair value of our restricted share awards. Expenses on these awards are recognized over the vesting period.
NOTES TO THE CONSOLIDATED FINANCIAL STATEMENTS
(In thousands,Tables in millions, except shares and per share data)
The following table summarizes the activity during the year ended December 31, 20182019 for nonvested restricted share awards:
|
| | | | | | |
| | Shares | | Weighted-Average Grant Date Fair Value |
| Nonvested at beginning of year | 100,221 |
| | $ | 53.52 |
|
| Granted | 16,211 |
| | 63.65 |
|
| Vested | (18,025 | ) | | 54.45 |
|
| Forfeited | (4,808 | ) | | 69.57 |
|
| Nonvested at end of year | 93,599 |
| | $ | 54.27 |
|
|
| | | | | | |
| | Shares | | Weighted-Average Grant Date Fair Value |
| Nonvested at beginning of year | 99,789 |
| | $ | 53.11 |
|
| Granted | 16,377 |
| | 67.70 |
|
| Vested | (14,384 | ) | | 68.00 |
|
| Forfeited | (1,561 | ) | | 67.39 |
|
| Nonvested at end of year | 100,221 |
| | $ | 53.52 |
|
The total fair value of restricted stock unitsshares vested during the years ended December 31, 2019, 2018 and 2017 was $1.0 million, $1.0 million and 2016 was $978, $1,463 and $1,970,$1.5 million, respectively. As of December 31, 2018,2019, there was $1,196$1.1 million of total unrecognized compensation cost related to nonvested restricted stock unitsshares which is expected to be recognized over a weighted-average period of 1.61.8 years.
Performance Share Awards
We grant performance share awards to key employees as a part of our long-term management compensation program. These awards are earned based upon achievement of certain financial performance targets over a three year period. The number of shares of common stock a participant receives will be increased (up to 200 percent of target levels) or reduced (down to zero)0) based on the level of achievement of the financial performance targets. We use the closing share price the day before the grant date to determine the fair value of our performance share awards. Expenses on these awards are recognized over a three year performance period. Performance shares are granted in restricted stock units. They are payable in stock and vest solely upon achievement of certain financial performance targets during this three year period.
The following table summarizes the activity during the year ended December 31, 20182019 for nonvested performance share awards:
|
| | | | | | |
| | Shares | | Weighted-Average Grant Date Fair Value |
| Nonvested at beginning of year | 127,047 |
| | $ | 63.80 |
|
| Granted | 50,864 |
| | 63.68 |
|
| Forfeited | (57,197 | ) | | 55.97 |
|
| Nonvested at end of year | 120,714 |
| | $ | 67.45 |
|
|
| | | | | | |
| | Shares | | Weighted-Average Grant Date Fair Value |
| Nonvested at beginning of year | 123,024 |
| | $ | 63.09 |
|
| Granted | 47,997 |
| | 67.84 |
|
| Forfeited | (43,974 | ) | | 66.23 |
|
| Nonvested at end of year | 127,047 |
| | $ | 63.80 |
|
NaN performance shares vested during the year ended December 31, 2019and December 31, 2018. The total fair value of performance shares vested during the yearsyear ended December 31, 2017 and 2016 was $1,240 and $1,703, respectively. No performance shares vested during the year ended December 31, 2018.$1.2 million. As of December 31, 2018,2019, we expect to recognize $3,287$5.4 million of total compensation costs over a weighted-average period of 1.8 years.
Restricted Stock Units
We grant restricted stock units to employees and non-employee directors, which generally vest within three years from the date of the grant. Vested restricted stock units are paid out in stock. We use the closing share price the day before the grant date to determine the fair value of our restricted stock units. Expenses on these awards are recognized on a straight-line basis over the vesting period of the award.
The following table summarizes the activity during the year ended December 31, 20182019 for nonvested restricted stock units:
|
| | | | | | |
| | Shares | | Weighted-Average Grant Date Fair Value |
| Nonvested at beginning of year | 101,955 |
| | $ | 67.23 |
|
| Granted | 36,116 |
| | 64.06 |
|
| Vested | (29,905 | ) | | 72.73 |
|
| Forfeited | (4,879 | ) | | 63.23 |
|
| Nonvested at end of year | 103,287 |
| | $ | 64.72 |
|
|
| | | | | | |
| | Shares | | Weighted-Average Grant Date Fair Value |
| Nonvested at beginning of year | 43,125 |
| | $ | 64.67 |
|
| Granted | 83,380 |
| | 66.83 |
|
| Vested | (15,427 | ) | | 58.27 |
|
| Forfeited | (9,123 | ) | | 66.60 |
|
| Nonvested at end of year | 101,955 |
| | $ | 67.23 |
|
The total fair value of shares vested during the years ended December 31, 2019, 2018 and 2017 was $899$2.2 million, $0.9 million, and $962,$1.0 million , respectively. As of December 31, 2018,2019, there was $4,473$3.0 million of total unrecognized compensation cost related to nonvested shares which is expected to be recognized over a weighted-average period of 2.01.4 years.
NOTES TO THE CONSOLIDATED FINANCIAL STATEMENTS
(In thousands,Tables in millions, except shares and per share data)
Share-Based Liabilities
As of December 31, 20182019 and 20172018, we had $213 and $175$0.2 million in total share-based liabilities recorded on our Consolidated Balance Sheets, respectively. During the years ended December 31, 2018, 2017 and 2016, we paid out $32, $45 and $62 related to share-based liability awards, respectively.
Sheets.
| |
20.19. | Earnings (Loss) Attributable to Tennant Company Per Share |
The computations of Basic and Diluted Earnings (Loss) Attributable to Tennant Company per Share for the years ended December 31 were as follows:
|
| | | | | | | | | | | |
| | 2019 | | 2018 | | 2017 |
| Numerator: | | | | | |
| Net Earnings (Loss) Attributable to Tennant Company | $ | 45.8 |
| | $ | 33.4 |
| | $ | (6.2 | ) |
| Denominator: | |
| | |
| | |
|
| Basic - Weighted Average Shares Outstanding | 18,118,486 |
| | 17,940,438 |
| | 17,695,390 |
|
| Effect of dilutive securities | 334,659 |
| | 398,131 |
| | — |
|
| Diluted - Weighted Average Shares Outstanding | 18,453,145 |
| | 18,338,569 |
| | 17,695,390 |
|
| Basic Earnings (Loss) per Share | $ | 2.53 |
| | $ | 1.86 |
| | $ | (0.35 | ) |
| Diluted Earnings (Loss) per Share | $ | 2.48 |
| | $ | 1.82 |
| | $ | (0.35 | ) |
|
| | | | | | | | | | | |
| | 2018 | | 2017 | | 2016 |
| Numerator: | | | | | |
| Net Earnings (Loss) Attributable to Tennant Company | $ | 33,412 |
| | $ | (6,195 | ) | | $ | 46,614 |
|
| Denominator: | |
| | |
| | |
|
| Basic - Weighted Average Shares Outstanding | 17,940,438 |
| | 17,695,390 |
| | 17,523,267 |
|
| Effect of dilutive securities | 398,131 |
| | — |
| | 452,916 |
|
| Diluted - Weighted Average Shares Outstanding | 18,338,569 |
| | 17,695,390 |
| | 17,976,183 |
|
| Basic Earnings (Loss) per Share | $ | 1.86 |
| | $ | (0.35 | ) | | $ | 2.66 |
|
| Diluted Earnings (Loss) per Share | $ | 1.82 |
| | $ | (0.35 | ) | | $ | 2.59 |
|
Excluded from the dilutive securities shown above were options to purchase and shares to be paid out under share-based compensation plans of 552,402, 293,356 711,212 and 356,598711,212 shares of common stock during 2019, 2018 2017 and 2016,2017, respectively. These exclusions were made if the exercise prices of these options are greater than the average market price of our common stock for the period, if the number of shares we can repurchase under the treasury stock method exceeds the weighted shares outstanding in the options or if we have a net loss, as thethese effects are anti-dilutive.
We are organized into four4 operating segments: North America; Latin America; Europe, Middle East, Africa; and Asia Pacific. We combine our North America and Latin America operating segments into the "Americas" for reporting net sales by geographic area. In accordance with the objective and basic principles of the applicable accounting guidance, we aggregate our operating segments into one1 reportable segment that consists of the design, manufacture and sale of products used primarily in the maintenance of nonresidential surfaces.
The following table presents Net Sales by geographic area for the years ended December 31:
|
| | | | | | | | | | | |
| | 2019 | | 2018 | | 2017 |
| Net Sales: | | | | | |
| United States | $ | 609.6 |
| | $ | 579.8 |
| | $ | 543.7 |
|
| Other Americas | 112.8 |
| | 111.2 |
| | 96.6 |
|
| Americas | 722.4 |
| | 691.0 |
| | 640.3 |
|
| Europe, Middle East, Africa | 307.6 |
| | 335.6 |
| | 273.7 |
|
| Asia Pacific | 107.6 |
| | 96.9 |
| | 89.1 |
|
| Total | $ | 1,137.6 |
| | $ | 1,123.5 |
| | $ | 1,003.1 |
|
|
| | | | | | | | | | | |
| | 2018 | | 2017 | | 2016 |
| Net Sales: | | | | | |
| Americas | $ | 690,996 |
| | $ | 640,274 |
| | $ | 607,026 |
|
| Europe, Middle East, Africa | 335,603 |
| | 273,738 |
| | 129,046 |
|
| Asia Pacific | 96,912 |
| | 89,054 |
| | 72,500 |
|
| Total | $ | 1,123,511 |
| | $ | 1,003,066 |
| | $ | 808,572 |
|
The following table presents long-lived assets by geographic area as of December 31:
|
| | | | | | | | | | | |
| | 2018 | | 2017 | | 2016 |
| Long-lived assets: | | | | | |
| Americas | $ | 118,609 |
| | $ | 132,659 |
| | $ | 134,737 |
|
| Europe, Middle East, Africa | 385,659 |
| | 422,338 |
| | 19,606 |
|
| Asia Pacific | 4,145 |
| | 4,731 |
| | 4,334 |
|
| Total | $ | 508,413 |
| | $ | 559,728 |
| | $ | 158,677 |
|
Accounting policies of the operations in the various operating segments are the same as those described in Note 1. Net Sales are attributed to each operating segment based on the end user country and are net of intercompany sales. NoApart from the United States shown in the table above, there were no individual foreign locations which had Net Sales which represented more than 10% of our consolidated Net Sales. NaN single customer represents more than 10% of our consolidated Net Sales.
NOTES TO THE CONSOLIDATED FINANCIAL STATEMENTS
(Tables in millions, except shares and per share data)
The following table presents long-lived assets by geographic area as of December 31:
|
| | | | | | | | | | | |
| | 2019 | | 2018 | | 2017 |
| Long-lived assets: | | | | | |
| United States | $ | 114.5 |
| | $ | 107.3 |
| | $ | 108.0 |
|
| Other Americas | 12.8 |
| | 11.3 |
| | 24.7 |
|
| Americas | 127.3 |
| | 118.6 |
| | 132.7 |
|
| Italy | 325.2 |
| | 355.5 |
| | 393.9 |
|
| Other Europe, Middle East, Africa | 28.6 |
| | 30.2 |
| | 28.4 |
|
| Europe, Middle East, Africa | 353.8 |
| | 385.7 |
| | 422.3 |
|
| Asia Pacific | 36.6 |
| | 4.1 |
| | 4.7 |
|
| Total | $ | 517.7 |
| | $ | 508.4 |
| | $ | 559.7 |
|
Long-lived assets consist of Property, Plant and Equipment, Goodwill, Intangible Assets and certain other assets. Long-lived assets locatedApart from the United States and Italy shown in Italy totaled $355,460 and $393,917, respectively, at December 31, 2018 and 2017, as a result of our acquisition of IPC Group. We did not have long-lived assets located
NOTES TO THE CONSOLIDATED FINANCIAL STATEMENTS
(In thousands, except shares and per share data)
in Italy for 2016. Therethe table above, there are no other individual foreign locations which have long-lived assets which represent more than 10% of our consolidated long-lived assets.
The following table presents revenues for groups of similar products and services for the years ended December 31:
|
| | | | | | | | | | | |
| | 2018 | | 2017 | | 2016 |
| Net Sales: | | | | | |
| Equipment | $ | 729,993 |
| | $ | 636,875 |
| | $ | 491,075 |
|
| Parts and consumables | 222,345 |
| | 202,452 |
| | 173,632 |
|
| Service and other | 141,346 |
| | 132,332 |
| | 114,719 |
|
| Specialty surface coatings | 29,827 |
| | 31,407 |
| | 29,146 |
|
| Total | $ | 1,123,511 |
| | $ | 1,003,066 |
| | $ | 808,572 |
|
| |
22.21. | Consolidated Quarterly Data (Unaudited) |
| | | | 2018 | 2019 |
| | Q1 | | Q2 | | Q3 | | Q4 | Q1 | | Q2 | | Q3 | | Q4 |
| Net Sales | $ | 272,847 |
| | $ | 292,197 |
| | $ | 273,255 |
| | $ | 285,212 |
| $ | 262.5 |
| | $ | 299.7 |
| | $ | 280.7 |
| | $ | 294.8 |
|
| Gross Profit | 109,116 |
| (a) | 117,225 |
| (a) | 106,509 |
| (a) | 112,172 |
| 108.2 |
| | 120.8 |
| | 114.0 |
| | 118.6 |
|
| Net Earnings Attributable to Tennant Company | 3,274 |
| | 12,744 |
| | 9,676 |
| | 7,717 |
| 5.4 |
| | 14.8 |
| | 14.6 |
| | 10.9 |
|
| Basic Earnings Attributable to Tennant Company per Share | $ | 0.18 |
| | $ | 0.71 |
| | $ | 0.54 |
| | $ | 0.43 |
| $ | 0.30 |
| | $ | 0.82 |
| | $ | 0.81 |
| | $ | 0.60 |
|
| Diluted Earnings Attributable to Tennant Company per Share | $ | 0.18 |
| | $ | 0.69 |
| | $ | 0.52 |
| | $ | 0.42 |
| $ | 0.29 |
| | $ | 0.81 |
| | $ | 0.79 |
| | $ | 0.59 |
|
(a)Amounts have been revised for misclassifications between Cost of Sales and Selling and Administrative Expense. See Note 3 for further information. Gross Profit was reduced by $1,521, $1,574, and $1,576 for Q1 2018, Q2 2018 and Q3 2018, respectively, and Selling and Administrative Expense was decreased by the same amounts during those periods.
|
| | | | | | | | | | | | | | | | |
| | 2018 | |
| | Q1 | | Q2 | | Q3 | | Q4 | |
| Net Sales | $ | 272.8 |
| | $ | 292.2 |
| | $ | 273.3 |
| | $ | 285.2 |
| |
| Gross Profit | 109.1 |
| | 117.2 |
| | 106.5 |
| | 112.2 |
| |
| Net (Loss) Earnings Attributable to Tennant Company | 3.3 |
| | 12.7 |
| | 9.7 |
| | 7.7 |
| |
| Basic (Loss) Earnings Attributable to Tennant Company per Share | $ | 0.18 |
| | $ | 0.71 |
| | $ | 0.54 |
| | $ | 0.43 |
| |
| Diluted (Loss) Earnings Attributable to Tennant Company per Share | $ | 0.18 |
| | $ | 0.69 |
| | $ | 0.52 |
| | $ | 0.42 |
| |
|
| | | | | | | | | | | | | | | | |
| | 2017 | |
| | Q1 | | Q2 | | Q3 | | Q4 | |
| Net Sales | $ | 191,059 |
| | $ | 270,791 |
| | $ | 261,921 |
| | $ | 279,295 |
| |
| Gross Profit | 79,736 |
| | 103,130 |
| (a) | 103,081 |
| (a) | 113,866 |
| (a) |
| Net (Loss) Earnings Attributable to Tennant Company | (3,957 | ) | | (2,591 | ) | | 3,559 |
| | (3,206 | ) | |
| Basic (Loss) Earnings Attributable to Tennant Company per Share | $ | (0.22 | ) | | $ | (0.15 | ) | | $ | 0.20 |
| | $ | (0.18 | ) | |
| Diluted (Loss) Earnings Attributable to Tennant Company per Share | $ | (0.22 | ) | | $ | (0.15 | ) | | $ | 0.20 |
| | $ | (0.18 | ) | |
(a)Amounts have been revised for misclassifications between Cost of Sales and Selling and Administrative Expense. See Note 3 for further information. Gross Profit was reduced by $1,424, $1,523, and $1,661 for Q2 2017, Q3 2017 and Q4 2017, respectively, and Selling and Administrative Expense was decreased by the same amounts during those periods.
The summation of quarterly data may not equate to the calculation for the full fiscal year as quarterly calculations are performed on a discrete basis.
Regular quarterly dividends aggregated to $0.88 per share in 2019, or $0.22 per share per quarter, and $0.85 per share in 2018, or $0.21 per share for the first three quarters and $0.22 per share for the last quarter of 2018, and $0.84 per share in 2017, or $0.21 per share per quarter.
2018.
| |
23.22. | Separate Financial Information of Guarantor Subsidiaries |
The following condensed consolidated guarantor financial information is presented to comply with the requirements of Rule 3-10 of Regulation S-X.
On April 18, 2017, we issued and sold $300,000$300.0 million in aggregate principal amount of our 5.625% Senior Notes due 2025 (the “Notes”), pursuant to an Indenture, dated as of April 18, 2017, among the company,Company, the Guarantors (as defined below), and Wells Fargo Bank, National Association, a national banking association, as trustee. The Notes are unconditionally and jointly and severally guaranteed by Tennant Coatings, Inc., and Tennant Sales and Service Company (collectively, the “Guarantors” or "Guarantor Subsidiaries"), which are wholly-owned100% owned subsidiaries of the company.Company.
The Notes and the guarantees constitute senior unsecured obligations of the companyCompany and the Guarantors, respectively. The Notes and the guarantees, respectively, are: (a) equal in right of payment with all of the company’sCompany’s and the Guarantors’ senior debt, without giving effect to collateral arrangements; (b) senior in right of payment to all of the company’sCompany’s and the Guarantors’ future subordinated debt, if any; (c) effectively subordinated in right of payment to all of the
NOTES TO THE CONSOLIDATED FINANCIAL STATEMENTS
(In thousands, except shares and per share data)
company’s Company’s and the Guarantors’ debt and obligations that are secured, including borrowings under the company’sCompany’s senior secured credit facilities for so long as the senior secured credit facilities are secured, to the extent of the value of the assets securing such liens; and (d) structurally subordinated in right of payment to all liabilities (including trade payables) of the company’sCompany’s and the Guarantors’ subsidiaries that do not guarantee the Notes.
NOTES TO THE CONSOLIDATED FINANCIAL STATEMENTS
(Tables in millions, except shares and per share data)
The following condensed consolidated financial information presents the Condensed Consolidated Statements of Earnings, Comprehensive Income and Cash Flows for each of the years in the three year period ended December 31, 2018,2019, and the related Condensed Consolidated Balance Sheets as of December 31, 20182019 and 2017,2018, of Tennant Company ("Parent"), the Guarantor Subsidiaries on a combined basis, the Non-Guarantor Subsidiaries on a combined basis and elimination entries necessary to consolidate the Parent with the Guarantor and Non-Guarantor Subsidiaries. The following condensed consolidated financial statements should be read in conjunction with the consolidated financial statements of the companyCompany and notes thereto of which this note is an integral part.
| | Condensed Consolidated Statement of Earnings | | For the year ended December 31, 2018 | |
| (in thousands) | Parent | | Guarantor Subsidiaries | | Non-Guarantor Subsidiaries | | Eliminations | | Total Tennant Company | |
| For the year ended December 31, 2019 | | For the year ended December 31, 2019 |
| (in millions) | | Parent | | Guarantor Subsidiaries | | Non-Guarantor Subsidiaries | | Eliminations | | Total Tennant Company |
| Net Sales | $ | 494,341 |
| | $ | 634,341 |
| | $ | 570,627 |
| | $ | (575,798 | ) | | $ | 1,123,511 |
| $ | 529.6 |
| | $ | 666.2 |
| | $ | 554.6 |
| | $ | (612.8 | ) | | $ | 1,137.6 |
|
| Cost of Sales | 336,398 |
| | 533,800 |
| | 383,010 |
| | (574,730 | ) | | 678,478 |
| 347.2 |
| | 563.0 |
| | 376.1 |
| | (610.4 | ) | | 675.9 |
|
| Gross Profit | 157,943 |
| | 100,541 |
| | 187,617 |
| | (1,068 | ) | | 445,033 |
| 182.4 |
| | 103.2 |
| | 178.5 |
| | (2.4 | ) | | 461.7 |
|
| Operating Expense: | |
| | |
| | |
| | | | | |
| | |
| | |
| | | | |
| Research and Development Expense | 24,455 |
| | 1,090 |
| | 5,194 |
| | — |
| | 30,739 |
| 25.9 |
| | 1.1 |
| | 5.7 |
| | — |
| | 32.7 |
|
| Selling and Administrative Expense | 116,528 |
| | 76,623 |
| | 161,911 |
| | 1,254 |
| | 356,316 |
| 117.8 |
| | 76.4 |
| | 163.0 |
| | — |
| | 357.2 |
|
| Total Operating Expense | 140,983 |
| | 77,713 |
| | 167,105 |
| | 1,254 |
| | 387,055 |
| 143.7 |
| | 77.5 |
| | 168.7 |
| | — |
| | 389.9 |
|
| Profit (Loss) from Operations | 16,960 |
| | 22,828 |
| | 20,512 |
| | (2,322 | ) | | 57,978 |
| 38.7 |
| | 25.7 |
| | 9.8 |
| | (2.4 | ) | | 71.8 |
|
| Other Income (Expense): | |
| | |
| | |
| | | | | |
| | |
| | |
| | | | |
| Equity in Earnings of Affiliates | 27,409 |
| | 2,249 |
| | 5,374 |
| | (35,032 | ) | | — |
| 21.0 |
| | 2.0 |
| | 2.8 |
| | (25.8 | ) | | — |
|
| Interest (Expense) Income, Net | (20,466 | ) | | — |
| | 196 |
| | (37 | ) | | (20,307 | ) | (17.4 | ) | | — |
| | (0.4 | ) | | — |
| | (17.8 | ) |
| Intercompany Interest Income (Expense) | 14,597 |
| | (5,760 | ) | | (8,837 | ) | | — |
| | — |
| 13.9 |
| | (5.7 | ) | | (8.2 | ) | | — |
| | — |
|
| Net Foreign Currency Transaction Losses | (370 | ) | | (21 | ) | | (709 | ) | | — |
| | (1,100 | ) | 0.3 |
| | — |
| | (1.0 | ) | | — |
| | (0.7 | ) |
| Other (Expense) Income, Net | (2,288 | ) | | (2,434 | ) | | 2,862 |
| | 1,131 |
| | (729 | ) | (2.2 | ) | | (1.3 | ) | | 4.3 |
| | (0.1 | ) | | 0.7 |
|
| Total Other Income (Expense), Net | 18,882 |
| | (5,966 | ) | | (1,114 | ) | | (33,938 | ) | | (22,136 | ) | 15.6 |
| | (5.0 | ) | | (2.5 | ) | | (25.9 | ) | | (17.8 | ) |
| Profit (Loss) Before Income Taxes | 35,842 |
| | 16,862 |
| | 19,398 |
| | (36,260 | ) | | 35,842 |
| 54.3 |
| | 20.7 |
| | 7.3 |
| | (28.3 | ) | | 54.0 |
|
| Income Tax Expense (Benefit) | 2,304 |
| | 4,022 |
| | 388 |
| | (4,410 | ) | | 2,304 |
| 8.4 |
| | 4.9 |
| | (1.2 | ) | | (4.0 | ) | | 8.1 |
|
| Net Earnings (Loss) Including Noncontrolling Interest | 33,538 |
| | 12,840 |
| | 19,010 |
| | (31,850 | ) | | 33,538 |
| 45.9 |
| | 15.8 |
| | 8.5 |
| | (24.3 | ) | | 45.9 |
|
| Net Earnings Attributable to Noncontrolling Interest | 126 |
| | — |
| | 126 |
| | (126 | ) | | 126 |
| |
| Net Earnings (Loss) Attributable to Noncontrolling Interest | | 0.1 |
| | — |
| | 0.1 |
| | (0.1 | ) | | 0.1 |
|
| Net Earnings (Loss) Attributable to Tennant Company | $ | 33,412 |
| | $ | 12,840 |
| | $ | 18,884 |
| | $ | (31,724 | ) | | $ | 33,412 |
| $ | 45.8 |
| | $ | 15.8 |
| | $ | 8.4 |
| | $ | (24.2 | ) | | $ | 45.8 |
|
NOTES TO THE CONSOLIDATED FINANCIAL STATEMENTS
(In thousands,Tables in millions, except shares and per share data)
| | Condensed Consolidated Statement of Earnings | | For the year ended December 31, 2017 | |
| (in thousands) | Parent | | Guarantor Subsidiaries | | Non-Guarantor Subsidiaries | | Eliminations | | Total Tennant Company | |
| For the year ended December 31, 2018 | | For the year ended December 31, 2018 |
| (in millions) | | Parent | | Guarantor Subsidiaries | | Non-Guarantor Subsidiaries | | Eliminations | | Total Tennant Company |
| Net Sales | $ | 454,703 |
| | $ | 594,405 |
| | $ | 471,559 |
| | $ | (517,601 | ) | | $ | 1,003,066 |
| $ | 494.4 |
| | $ | 634.3 |
| | $ | 570.6 |
| | $ | (575.8 | ) | | $ | 1,123.5 |
|
| Cost of Sales | 311,897 |
| | 488,972 |
| | 321,759 |
| | (519,375 | ) | | 603,253 |
| 336.4 |
| | 533.8 |
| | 383.0 |
| | (574.7 | ) | | 678.5 |
|
| Gross Profit | 142,806 |
| | 105,433 |
| | 149,800 |
| | 1,774 |
| | 399,813 |
| 158.0 |
| | 100.5 |
| | 187.6 |
| | (1.1 | ) | | 445.0 |
|
| Operating Expense: | |
| | |
| | |
| | | | | |
| | |
| | |
| | | | |
| Research and Development Expense | 27,219 |
| | 315 |
| | 4,479 |
| | — |
| | 32,013 |
| 24.5 |
| | 1.0 |
| | 5.2 |
| | — |
| | 30.7 |
|
| Selling and Administrative Expense | 110,414 |
| | 78,516 |
| | 145,852 |
| | — |
|
| 334,782 |
| 116.5 |
| | 76.6 |
| | 161.9 |
| | 1.3 |
|
| 356.3 |
|
| Total Operating Expense | 137,633 |
| | 78,831 |
| | 150,331 |
| | — |
| | 366,795 |
| 141.0 |
| | 77.6 |
| | 167.1 |
| | 1.3 |
| | 387.0 |
|
| Profit (Loss) from Operations | 5,173 |
| | 26,602 |
| | (531 | ) | | 1,774 |
| | 33,018 |
| 17.0 |
| | 22.9 |
| | 20.5 |
| | (2.4 | ) | | 58.0 |
|
| Other Income (Expense): | |
| | |
| | |
| | | | | |
| | |
| | |
| | | | |
| Equity in Earnings of Affiliates | 12,754 |
| | 2,004 |
| | 28,855 |
| | (43,613 | ) | | — |
| 27.4 |
| | 2.2 |
| | 5.4 |
| | (35.0 | ) | | — |
|
| Interest Expense, Net | (22,659 | ) | | — |
| | (299 | ) | | (31 | ) | | (22,989 | ) | |
| Interest (Expense) Income, Net | | (20.5 | ) | | — |
| | 0.2 |
| | — |
| | (20.3 | ) |
| Intercompany Interest Income (Expense) | 12,519 |
| | (5,776 | ) | | (6,743 | ) | | — |
| | — |
| 14.6 |
| | (5.8 | ) | | (8.8 | ) | | — |
| | — |
|
| Net Foreign Currency Transaction Gains (Losses) | 857 |
| | — |
| | (4,244 | ) | | — |
| | (3,387 | ) | |
| Net Foreign Currency Transaction Losses | | (0.4 | ) | | — |
| | (0.7 | ) | | — |
| | (1.1 | ) |
| Other (Expense) Income, Net | (9,936 | ) | | (736 | ) | | 2,841 |
| | (103 | ) | | (7,934 | ) | (2.3 | ) | | (2.4 | ) | | 2.8 |
| | 1.1 |
| | (0.8 | ) |
| Total Other (Expense) Income, Net | (6,465 | ) | | (4,508 | ) | | 20,410 |
| | (43,747 | ) | | (34,310 | ) | |
| (Loss) Profit Before Income Taxes | (1,292 | ) | | 22,094 |
| | 19,879 |
| | (41,973 | ) | | (1,292 | ) | |
| Total Other Income (Expense), Net | | 18.8 |
| | (6.0 | ) | | (1.1 | ) | | (33.9 | ) | | (22.2 | ) |
| Profit (Loss) Before Income Taxes | | 35.8 |
| | 16.9 |
| | 19.4 |
| | (36.3 | ) | | 35.8 |
|
| Income Tax Expense (Benefit) | 4,913 |
| | 8,070 |
| | (98 | ) | | (7,972 | ) | | 4,913 |
| 2.3 |
| | 4.0 |
| | 0.4 |
| | (4.4 | ) | | 2.3 |
|
| Net (Loss) Earnings Including Noncontrolling Interest | $ | (6,205 | ) | | $ | 14,024 |
| | $ | 19,977 |
| | $ | (34,001 | ) | | $ | (6,205 | ) | |
| Net Loss Attributable to Noncontrolling Interest | $ | (10 | ) | | $ | — |
| | $ | (10 | ) | | $ | 10 |
| | $ | (10 | ) | |
| Net (Loss) Earnings Attributable to Tennant Company | $ | (6,195 | ) | | $ | 14,024 |
| | $ | 19,987 |
| | $ | (34,011 | ) | | $ | (6,195 | ) | |
| Net Earnings (Loss) Including Noncontrolling Interest | | 33.5 |
| | 12.9 |
| | 19.0 |
| | (31.9 | ) | | 33.5 |
|
| Net Earnings (Loss) Attributable to Noncontrolling Interest | | 0.1 |
| | — |
| | 0.1 |
| | (0.1 | ) | | 0.1 |
|
| Net Earnings (Loss) Attributable to Tennant Company | | $ | 33.4 |
| | $ | 12.9 |
| | $ | 18.9 |
| | $ | (31.8 | ) | | $ | 33.4 |
|
|
| | | | | | | | | | | | | | | | | | | |
| Condensed Consolidated Statement of Earnings |
| For the year ended December 31, 2017 |
| (in millions) | Parent | | Guarantor Subsidiaries | | Non-Guarantor Subsidiaries | | Eliminations | | Total Tennant Company |
| Net Sales | $ | 454.7 |
| | $ | 594.4 |
| | $ | 471.6 |
| | $ | (517.6 | ) | | $ | 1,003.1 |
|
| Cost of Sales | 311.9 |
| | 489.0 |
| | 321.8 |
| | (519.4 | ) | | 603.3 |
|
| Gross Profit | 142.8 |
| | 105.4 |
| | 149.8 |
| | 1.8 |
| | 399.8 |
|
| Operating Expense: | |
| | |
| | |
| | | | |
| Research and Development Expense | 27.2 |
| | 0.3 |
| | 4.5 |
| | — |
| | 32.0 |
|
| Selling and Administrative Expense | 110.4 |
| | 78.5 |
| | 145.9 |
| | — |
| | 334.8 |
|
| Total Operating Expense | 137.6 |
| | 78.8 |
| | 150.4 |
| | — |
| | 366.8 |
|
| Profit (Loss) from Operations | 5.2 |
| | 26.6 |
| | (0.6 | ) | | 1.8 |
| | 33.0 |
|
| Other Income (Expense): | |
| | |
| | |
| | | | |
| Equity in Earnings of Affiliates | 12.7 |
| | 2.0 |
| | 28.9 |
| | (43.6 | ) | | — |
|
| Interest Expense, Net | (22.7 | ) | | — |
| | (0.3 | ) | | — |
| | (23.0 | ) |
| Intercompany Interest Income (Expense) | 12.5 |
| | (5.8 | ) | | (6.7 | ) | | — |
| | — |
|
| Net Foreign Currency Transaction Gains (Losses) | 0.9 |
| | — |
| | (4.3 | ) | | — |
| | (3.4 | ) |
| Other (Expense) Income, Net | (9.9 | ) | | (0.7 | ) | | 2.8 |
| | (0.1 | ) | | (7.9 | ) |
| Total Other Income (Expense), Net | (6.5 | ) | | (4.5 | ) | | 20.4 |
| | (43.7 | ) | | (34.3 | ) |
| Profit (Loss) Before Income Taxes | (1.3 | ) | | 22.1 |
| | 19.8 |
| | (41.9 | ) | | (1.3 | ) |
| Income Tax Expense (Benefit) | 4.9 |
| | 8.1 |
| | (0.1 | ) | | (8.0 | ) | | 4.9 |
|
| Net Earnings (Loss) Attributable to Tennant Company | $ | (6.2 | ) | | $ | 14.0 |
| | $ | 19.9 |
| | $ | (33.9 | ) | | $ | (6.2 | ) |
|
| | | | | | | | | | | | | | | | | | | |
| Condensed Consolidated Statement of Earnings |
| For the year ended December 31, 2016 |
| (in thousands) | Parent | | Guarantor Subsidiaries | | Non-Guarantor Subsidiaries | | Eliminations | | Total Tennant Company |
| Net Sales | $ | 455,375 |
| | $ | 587,815 |
| | $ | 290,349 |
| | $ | (524,967 | ) | | $ | 808,572 |
|
| Cost of Sales | 299,459 |
| | 483,075 |
| | 199,336 |
| | (524,893 | ) | | 456,977 |
|
| Gross Profit | 155,916 |
| | 104,740 |
| | 91,013 |
| | (74 | ) | | 351,595 |
|
| Operating Expense: | |
| | |
| | |
| | | | |
| Research and Development Expense | 32,378 |
| | 429 |
| | 1,931 |
| | — |
| | 34,738 |
|
| Selling and Administrative Expense | 95,340 |
| | 74,643 |
| | 78,609 |
| | — |
| | 248,592 |
|
| Total Operating Expense | 127,718 |
| | 75,072 |
| | 80,540 |
| | — |
| | 283,330 |
|
| Profit from Operations | 28,198 |
| | 29,668 |
| | 10,473 |
| | (74 | ) | | 68,265 |
|
| Other Income (Expense): | |
| | |
| | |
| | | | |
| Equity in Earnings of Affiliates | 34,068 |
| | 2,192 |
| | — |
| | (36,260 | ) | | — |
|
| Interest (Expense) Income, Net | (1,204 | ) | | — |
| | 255 |
| | — |
| | (949 | ) |
| Intercompany Interest Income (Expense) | 7,157 |
| | (5,570 | ) | | (1,587 | ) | | — |
| | — |
|
| Net Foreign Currency Transaction Gains (Losses) | 648 |
| | (652 | ) | | (388 | ) | | — |
| | (392 | ) |
| Other (Expense) Income, Net | (2,376 | ) | | (573 | ) | | 2,516 |
| | — |
| | (433 | ) |
| Total Other Income (Expense), Net | 38,293 |
| | (4,603 | ) | | 796 |
| | (36,260 | ) | | (1,774 | ) |
| Profit Before Income Taxes | 66,491 |
| | 25,065 |
| | 11,269 |
| | (36,334 | ) | | 66,491 |
|
| Income Tax Expense | 19,877 |
| | 9,443 |
| | 2,427 |
| | (11,870 | ) | | 19,877 |
|
| Net Earnings (Loss) Attributable to Tennant Company | $ | 46,614 |
| | $ | 15,622 |
| | $ | 8,842 |
| | $ | (24,464 | ) | | $ | 46,614 |
|
NOTES TO THE CONSOLIDATED FINANCIAL STATEMENTS
(In thousands,Tables in millions, except shares and per share data)
| | Condensed Consolidated Statement of Comprehensive Income | | For the year ended December 31, 2018 | |
| (in thousands) | Parent | | Guarantor Subsidiaries | | Non-Guarantor Subsidiaries | | Eliminations | | Total Tennant Company | |
| For the year ended December 31, 2019 | | For the year ended December 31, 2019 |
| (in millions) | | Parent | | Guarantor Subsidiaries | | Non-Guarantor Subsidiaries | | Eliminations | | Total Tennant Company |
| Net Earnings (Loss) Including Noncontrolling Interest | $ | 33,538 |
| | $ | 12,840 |
| | $ | 19,010 |
| | $ | (31,850 | ) | | $ | 33,538 |
| $ | 45.9 |
| | $ | 15.8 |
| | $ | 8.5 |
| | $ | (24.3 | ) | | $ | 45.9 |
|
| Other Comprehensive Income (Loss): | | | | | | | | | | | | | | | | | | |
| Foreign currency translation adjustments | (16,221 | ) | | (961 | ) | | (21,422 | ) | | 22,383 |
| | (16,221 | ) | (4.5 | ) | | 0.5 |
| | (4.9 | ) | | 4.4 |
| | (4.5 | ) |
| Pension and retiree medical benefits | 1,745 |
| | — |
| | 1,197 |
| | (1,197 | ) | | 1,745 |
| (0.5 | ) | | — |
| | (0.4 | ) | | 0.4 |
| | (0.5 | ) |
| Cash flow hedge | 1,341 |
| | — |
| | — |
| | — |
| | 1,341 |
| 4.6 |
| | — |
| | — |
| | — |
| | 4.6 |
|
| Income Taxes: | | | | | | | | | | | | | | | | | | |
| Foreign currency translation adjustments | 168 |
| | — |
| | 168 |
| | (168 | ) | | 168 |
| 0.1 |
| | — |
| | 0.1 |
| | (0.1 | ) | | 0.1 |
|
| Pension and retiree medical benefits | (467 | ) | | — |
| | (205 | ) | | 205 |
| | (467 | ) | 0.1 |
| | — |
| | 0.1 |
| | (0.1 | ) | | 0.1 |
|
| Cash flow hedge | (1,437 | ) | | — |
| | — |
| | — |
| | (1,437 | ) | (1.1 | ) | | — |
| | — |
| | — |
| | (1.1 | ) |
| Total Other Comprehensive (Loss) Income, net of tax | (14,871 | ) | | (961 | ) | | (20,262 | ) | | 21,223 |
| | (14,871 | ) | |
| Total Other Comprehensive Income (Loss), net of tax | | (1.3 | ) | | 0.5 |
| | (5.1 | ) | | 4.6 |
| | (1.3 | ) |
| Total Comprehensive Income (Loss) Including Noncontrolling Interest | 18,667 |
| | 11,879 |
| | (1,252 | ) | | (10,627 | ) | | 18,667 |
| 44.6 |
| | 16.3 |
| | 3.4 |
| | (19.7 | ) | | 44.6 |
|
| Comprehensive Income Attributable to Noncontrolling Interest | 126 |
| | — |
| | 126 |
| | (126 | ) | | 126 |
| |
| Comprehensive Income (Loss) Attributable to Noncontrolling Interest | | 0.1 |
| | — |
| | 0.1 |
| | (0.1 | ) | | 0.1 |
|
| Comprehensive Income (Loss) Attributable to Tennant Company | $ | 18,541 |
| | $ | 11,879 |
| | $ | (1,378 | ) | | $ | (10,501 | ) | | $ | 18,541 |
| $ | 44.5 |
| | $ | 16.3 |
| | $ | 3.3 |
| | $ | (19.6 | ) | | $ | 44.5 |
|
| | Condensed Consolidated Statement of Comprehensive Income | | For the year ended December 31, 2017 | |
| (in thousands) | Parent | | Guarantor Subsidiaries | | Non-Guarantor Subsidiaries | | Eliminations | | Total Tennant Company | |
| Net (Loss) Earnings | $ | (6,205 | ) | | $ | 14,024 |
| | $ | 19,977 |
| | $ | (34,001 | ) | | $ | (6,205 | ) | |
| For the year ended December 31, 2018 | | For the year ended December 31, 2018 |
| (in millions) | | Parent | | Guarantor Subsidiaries | | Non-Guarantor Subsidiaries | | Eliminations | | Total Tennant Company |
| Net Earnings (Loss) Including Noncontrolling Interest | | $ | 33.5 |
| | $ | 12.9 |
| | $ | 19.0 |
| | $ | (31.9 | ) | | $ | 33.5 |
|
| Other Comprehensive Income (Loss): | | | | | | | | | | | | | | | | | | |
| Foreign currency translation adjustments | 28,356 |
| | 1,215 |
| | 2,960 |
| | (4,175 | ) | | 28,356 |
| (16.2 | ) | | (1.0 | ) | | (21.4 | ) | | 22.4 |
| | (16.2 | ) |
| Pension and retiree medical benefits | 5,868 |
| | — |
| | 538 |
| | (538 | ) | | 5,868 |
| 1.7 |
| | — |
| | 1.2 |
| | (1.2 | ) | | 1.7 |
|
| Cash flow hedge | (7,731 | ) | | — |
| | — |
| | — |
| | (7,731 | ) | 1.3 |
| | — |
| | — |
| | — |
| | 1.3 |
|
| Income Taxes: | | | | | | | | | | | | | | | | | | |
| Foreign currency translation adjustments | 310 |
| | — |
| | 310 |
| | (310 | ) | | 310 |
| 0.2 |
| | — |
| | 0.2 |
| | (0.2 | ) | | 0.2 |
|
| Pension and retiree medical benefits | (2,087 | ) | | — |
| | (99 | ) | | 99 |
| | (2,087 | ) | (0.5 | ) | | — |
| | (0.2 | ) | | 0.2 |
| | (0.5 | ) |
| Cash flow hedge | 2,884 |
| | — |
| | — |
| | — |
| | 2,884 |
| (1.4 | ) | | — |
| | — |
| | — |
| | (1.4 | ) |
| Total Other Comprehensive Income (Loss), net of tax | 27,600 |
| | 1,215 |
| | 3,709 |
| | (4,924 | ) | | 27,600 |
| (14.9 | ) | | (1.0 | ) | | (20.2 | ) | | 21.2 |
| | (14.9 | ) |
| Total Comprehensive Income Including Noncontrolling Interest | 21,395 |
| | 15,239 |
| | 23,686 |
| | (38,925 | ) | | 21,395 |
| |
| Comprehensive Loss Attributable to Noncontrolling Interest | (10 | ) | | — |
| | (10 | ) | | 10 |
| | (10 | ) | |
| Comprehensive Income | $ | 21,405 |
| | $ | 15,239 |
| | $ | 23,696 |
| | $ | (38,935 | ) | | $ | 21,405 |
| |
| Total Comprehensive Income (Loss) Including Noncontrolling Interest | | 18.6 |
| | 11.9 |
| | (1.2 | ) | | (10.7 | ) | | 18.6 |
|
| Comprehensive Income (Loss) Attributable to Noncontrolling Interest | | 0.1 |
| | — |
| | 0.1 |
| | (0.1 | ) | | 0.1 |
|
| Comprehensive Income (Loss) Attributable to Tennant Company | | $ | 18.5 |
| | $ | 11.9 |
| | $ | (1.3 | ) | | $ | (10.6 | ) | | $ | 18.5 |
|
NOTES TO THE CONSOLIDATED FINANCIAL STATEMENTS
(In thousands,Tables in millions, except shares and per share data)
|
| | | | | | | | | | | | | | | | | | | |
| Condensed Consolidated Statement of Comprehensive Income |
| For the year ended December 31, 2017 |
| (in millions) | Parent | | Guarantor Subsidiaries | | Non-Guarantor Subsidiaries | | Eliminations | | Total Tennant Company |
| Net Earnings (Loss) | $ | (6.2 | ) | | $ | 14.0 |
| | $ | 19.9 |
| | $ | (33.9 | ) | | $ | (6.2 | ) |
| Other Comprehensive Income (Loss): | | | | | | | | | |
| Foreign currency translation adjustments | 28.3 |
| | 1.2 |
| | 3.0 |
| | (4.2 | ) | | 28.3 |
|
| Pension and retiree medical benefits | 5.9 |
| | — |
| | 0.6 |
| | (0.6 | ) | | 5.9 |
|
| Cash flow hedge | (7.7 | ) | | — |
| | — |
| | — |
| | (7.7 | ) |
| Income Taxes: | | | | | | | | | |
| Foreign currency translation adjustments | 0.3 |
| | — |
| | 0.3 |
| | (0.3 | ) | | 0.3 |
|
| Pension and retiree medical benefits | (2.1 | ) | | — |
| | (0.1 | ) | | 0.1 |
| | (2.1 | ) |
| Cash flow hedge | 2.9 |
| | — |
| | — |
| | — |
| | 2.9 |
|
| Total Other Comprehensive Income (Loss), net of tax | 27.6 |
| | 1.2 |
| | 3.8 |
| | (5.0 | ) | | 27.6 |
|
| Comprehensive Income (Loss) | $ | 21.4 |
| | $ | 15.2 |
| | $ | 23.7 |
| | $ | (38.9 | ) | | $ | 21.4 |
|
|
| | | | | | | | | | | | | | | | | | | |
| Condensed Consolidated Statement of Comprehensive Income |
| For the year ended December 31, 2016 |
| (in thousands) | Parent | | Guarantor Subsidiaries | | Non-Guarantor Subsidiaries | | Eliminations | | Total Tennant Company |
| Net Earnings | $ | 46,614 |
| | $ | 15,622 |
| | $ | 8,842 |
| | $ | (24,464 | ) | | $ | 46,614 |
|
| Other Comprehensive (Loss) Income: | | | | | | | | | |
| Foreign currency translation adjustments | 109 |
| | 270 |
| | 3,534 |
| | (3,804 | ) | | 109 |
|
| Pension and retiree medical benefits | (2,248 | ) | | — |
| | (1,691 | ) | | 1,691 |
| | (2,248 | ) |
| Cash flow hedge | (305 | ) | | — |
| | — |
| | — |
| | (305 | ) |
| Income Taxes: | | | | | | | | | |
| Foreign currency translation adjustments | 32 |
| | — |
| | 32 |
| | (32 | ) | | 32 |
|
| Pension and retiree medical benefits | 504 |
| | — |
| | 296 |
| | (296 | ) | | 504 |
|
| Cash flow hedge | 114 |
| | — |
| | — |
| | — |
| | 114 |
|
| Total Other Comprehensive (Loss) Earnings, net of tax | (1,794 | ) | | 270 |
| | 2,171 |
| | (2,441 | ) | | (1,794 | ) |
| Comprehensive Income (Loss) | $ | 44,820 |
| | $ | 15,892 |
| | $ | 11,013 |
| | $ | (26,905 | ) | | $ | 44,820 |
|
NOTES TO THE CONSOLIDATED FINANCIAL STATEMENTS
(In thousands,Tables in millions, except shares and per share data)
| | Condensed Consolidated Balance Sheet | | As of December 31, 2018 | |
| (in thousands) | Parent | | Guarantor Subsidiaries | | Non-Guarantor Subsidiaries | | Eliminations | | Total Tennant Company | |
| As of December 31, 2019 | | As of December 31, 2019 |
| (in millions) | | Parent | | Guarantor Subsidiaries | | Non-Guarantor Subsidiaries | | Eliminations | | Total Tennant Company |
| ASSETS | | | | | | | | | | | | | | | | | | |
| Current Assets: | | | | | | | | | | | | | | | | | | |
| Cash and Cash Equivalents | $ | 24,779 |
| | $ | 1,610 |
| | $ | 59,220 |
| | $ | — |
| | $ | 85,609 |
| |
| Restricted Cash | — |
| | — |
| | 525 |
| | — |
| | 525 |
| |
| Cash and Cash Equivalents, and Restricted Cash | | $ | 27.7 |
| | $ | 1.3 |
| | $ | 45.6 |
| | $ | — |
| | $ | 74.6 |
|
| Net Receivables | 866 |
| | 94,763 |
| | 120,541 |
| | — |
| | 216,170 |
| 3.3 |
| | 99.7 |
| | 120.3 |
| | — |
| | 223.3 |
|
| Intercompany Receivables | 29,976 |
| | 148,961 |
| | — |
| | (178,937 | ) | | — |
| 35.7 |
| | 137.7 |
| | — |
| | (173.4 | ) | | — |
|
| Inventories | 37,154 |
| | 13,381 |
| | 94,680 |
| | (10,082 | ) | | 135,133 |
| 39.1 |
| | 16.9 |
| | 106.9 |
| | (12.8 | ) | | 150.1 |
|
| Prepaid Expenses | 12,565 |
| | 782 |
| | 9,282 |
| | (488 | ) | | 22,141 |
| |
| Other Current Assets | 4,935 |
| | 396 |
| | 3,735 |
| | — |
| | 9,066 |
| |
| Prepaid Expenses and Other Current Assets | | 17.8 |
| | 1.2 |
| | 14.0 |
| | — |
| | 33.0 |
|
| Total Current Assets | 110,275 |
| | 259,893 |
| | 287,983 |
| | (189,507 | ) | | 468,644 |
| 123.6 |
| | 256.8 |
| | 286.8 |
| | (186.2 | ) | | 481.0 |
|
| Property, Plant and Equipment | 229,826 |
| | 12,677 |
| | 144,138 |
| | — |
| | 386,641 |
| 246.7 |
| | 10.0 |
| | 155.8 |
| | — |
| | 412.5 |
|
| Accumulated Depreciation | (159,344 | ) | | (6,913 | ) | | (56,937 | ) | | — |
| | (223,194 | ) | (164.3 | ) | | (4.2 | ) | | (70.7 | ) | | — |
| | (239.2 | ) |
| Property, Plant and Equipment, Net | 70,482 |
| | 5,764 |
| | 87,201 |
| | — |
| | 163,447 |
| 82.4 |
| | 5.8 |
| | 85.1 |
| | — |
| | 173.3 |
|
| Deferred Income Taxes | 4,035 |
| | 3,072 |
| | 8,382 |
| | — |
| | 15,489 |
| |
| Operating Lease Assets | | 5.2 |
| | 10.3 |
| | 31.1 |
| | — |
| | 46.6 |
|
| Investment in Affiliates | 420,897 |
| | 12,142 |
| | 20,768 |
| | (453,807 | ) | | — |
| 420.7 |
| | 14.1 |
| | 39.2 |
| | (474.0 | ) | | — |
|
| Intercompany Loans | 301,555 |
| | — |
| | 3,205 |
| | (304,760 | ) | | — |
| 298.2 |
| | — |
| | — |
| | (298.2 | ) | | — |
|
| Goodwill | 12,870 |
| | 1,726 |
| | 168,075 |
| | — |
| | 182,671 |
| 12.9 |
| | 1.7 |
| | 180.5 |
| | — |
| | 195.1 |
|
| Intangible Assets, Net | 4,012 |
| | 2,684 |
| | 139,850 |
| | — |
| | 146,546 |
| 3.2 |
| | 2.5 |
| | 132.0 |
| | — |
| | 137.7 |
|
| Other Assets | 6,987 |
| | (2 | ) | | 8,762 |
| | — |
| | 15,747 |
| 4.9 |
| | 4.4 |
| | 19.9 |
| | — |
| | 29.2 |
|
| Total Assets | $ | 931,113 |
| | $ | 285,279 |
| | $ | 724,226 |
| | $ | (948,074 | ) | | $ | 992,544 |
| $ | 951.1 |
| | $ | 295.6 |
| | $ | 774.6 |
| | $ | (958.4 | ) | | $ | 1,062.9 |
|
| LIABILITIES AND TOTAL EQUITY | |
| | |
| | | | | | | |
| | |
| | | | | | |
| Current Liabilities: | |
| | |
| | | | | | | |
| | |
| | | | | | |
| Current Portion of Long-Term Debt | $ | 21,816 |
| | $ | — |
| | $ | 5,189 |
| | $ | — |
| | $ | 27,005 |
| $ | 30.0 |
| | $ | — |
| | $ | 1.3 |
| | $ | — |
| | $ | 31.3 |
|
| Accounts Payable | 40,991 |
| | 4,982 |
| | 52,425 |
| | — |
| | 98,398 |
| 39.4 |
| | 5.1 |
| | 49.6 |
| | — |
| | 94.1 |
|
| Intercompany Payables | 149,460 |
| | — |
| | 29,477 |
| | (178,937 | ) | | — |
| 137.5 |
| | — |
| | 35.9 |
| | (173.4 | ) | | — |
|
| Employee Compensation and Benefits | 13,947 |
| | 16,890 |
| | 18,616 |
| | — |
| | 49,453 |
| 19.3 |
| | 17.5 |
| | 26.7 |
| | — |
| | 63.5 |
|
| Income Taxes Payable | 806 |
| | — |
| | 1,984 |
| | (667 | ) | | 2,123 |
| |
| Other Current Liabilities | 22,387 |
| | 17,939 |
| | 31,390 |
| | 179 |
| | 71,895 |
| 24.9 |
| | 20.5 |
| | 40.6 |
| | — |
| | 86.0 |
|
| Total Current Liabilities | 249,407 |
| | 39,811 |
| | 139,081 |
| | (179,425 | ) | | 248,874 |
| 251.1 |
| | 43.1 |
| | 154.1 |
| | (173.4 | ) | | 274.9 |
|
| Long-Term Liabilities: | |
| | |
| | | | | | | |
| | |
| | | | | | |
| Long-Term Debt | 326,460 |
| | — |
| | 1,600 |
| | — |
| | 328,060 |
| 306.2 |
| | — |
| | 1.3 |
| | — |
| | 307.5 |
|
| Intercompany Loans | 3,205 |
| | 128,000 |
| | 173,555 |
| | (304,760 | ) | | — |
| 2.1 |
| | 128.0 |
| | 168.1 |
| | (298.2 | ) | | — |
|
| Long-Term Operating Lease Liabilities | | 4.0 |
| | 5.3 |
| | 21.0 |
| | — |
| | 30.3 |
|
| Employee-Related Benefits | 11,041 |
| | 2,015 |
| | 8,054 |
| | — |
| | 21,110 |
| 10.4 |
| | 1.4 |
| | 7.6 |
| | — |
| | 19.4 |
|
| Deferred Income Taxes | — |
| | — |
| | 46,018 |
| | — |
| | 46,018 |
| — |
| | — |
| | 41.7 |
| | — |
| | 41.7 |
|
| Other Liabilities | 24,648 |
| | 2,899 |
| | 4,583 |
| | — |
| | 32,130 |
| 16.0 |
| | 3.0 |
| | 8.8 |
| | — |
| | 27.8 |
|
| Total Long-Term Liabilities | 365,354 |
| | 132,914 |
| | 233,810 |
| | (304,760 | ) | | 427,318 |
| 338.7 |
| | 137.7 |
| | 248.5 |
| | (298.2 | ) | | 426.7 |
|
| Total Liabilities | 614,761 |
| | 172,725 |
| | 372,891 |
| | (484,185 | ) | | 676,192 |
| 589.8 |
| | 180.8 |
| | 402.6 |
| | (471.6 | ) | | 701.6 |
|
| Equity: | |
| | |
| | | | | | | |
| | |
| | | | | | |
| Common Stock | 6,797 |
| | — |
| | 11,131 |
| | (11,131 | ) | | 6,797 |
| 6.9 |
| | — |
| | 11.1 |
| | (11.1 | ) | | 6.9 |
|
| Additional Paid-In Capital | 28,550 |
| | 77,551 |
| | 399,459 |
| | (477,010 | ) | | 28,550 |
| 45.5 |
| | 77.6 |
| | 417.4 |
| | (495.0 | ) | | 45.5 |
|
| Retained Earnings | 316,269 |
| | 36,633 |
| | (2,532 | ) | | (34,101 | ) | | 316,269 |
| 346.0 |
| | 38.4 |
| | 6.0 |
| | (44.4 | ) | | 346.0 |
|
| Accumulated Other Comprehensive Loss | (37,194 | ) | | (1,630 | ) | | (58,653 | ) | | 60,283 |
| | (37,194 | ) | (38.5 | ) | | (1.2 | ) | | (63.9 | ) | | 65.1 |
| | (38.5 | ) |
| Total Tennant Company Shareholders’ Equity | 314,422 |
| | 112,554 |
| | 349,405 |
| | (461,959 | ) | | 314,422 |
| 359.9 |
| | 114.8 |
| | 370.6 |
| | (485.4 | ) | | 359.9 |
|
| Noncontrolling Interest | 1,930 |
| | — |
| | 1,930 |
| | (1,930 | ) | | 1,930 |
| 1.4 |
| | — |
| | 1.4 |
| | (1.4 | ) | | 1.4 |
|
| Total Equity | 316,352 |
| | 112,554 |
| | 351,335 |
| | (463,889 | ) | | 316,352 |
| 361.3 |
| | 114.8 |
| | 372.0 |
| | (486.8 | ) | | 361.3 |
|
| Total Liabilities and Total Equity | $ | 931,113 |
| | $ | 285,279 |
| | $ | 724,226 |
| | $ | (948,074 | ) | | $ | 992,544 |
| $ | 951.1 |
| | $ | 295.6 |
| | $ | 774.6 |
| | $ | (958.4 | ) | | $ | 1,062.9 |
|
NOTES TO THE CONSOLIDATED FINANCIAL STATEMENTS
(In thousands,Tables in millions, except shares and per share data)
|
| | | | | | | | | | | | | | | | | | | |
| Condensed Consolidated Balance Sheet |
| As of December 31, 2018 |
| (in millions) | Parent | | Guarantor Subsidiaries | | Non-Guarantor Subsidiaries | | Eliminations | | Total Tennant Company |
| ASSETS | | | | | | | | | |
| Current Assets: | | | | | | | | | |
| Cash, Cash Equivalents, and Restricted Cash | $ | 24.8 |
| | $ | 1.6 |
| | $ | 59.7 |
| | $ | — |
| | $ | 86.1 |
|
| Net Receivables | 0.9 |
| | 94.8 |
| | 120.5 |
| | — |
| | 216.2 |
|
| Intercompany Receivables | 30.0 |
| | 148.9 |
| | — |
| | (178.9 | ) | | — |
|
| Inventories | 37.1 |
| | 13.4 |
| | 94.7 |
| | (10.1 | ) | | 135.1 |
|
| Prepaid Expenses and Other Current Assets | 17.5 |
| | 1.2 |
| | 13.0 |
| | (0.5 | ) | | 31.2 |
|
| Total Current Assets | 110.3 |
| | 259.9 |
| | 287.9 |
| | (189.5 | ) | | 468.6 |
|
| Property, Plant and Equipment | 229.8 |
| | 12.7 |
| | 144.1 |
| | — |
| | 386.6 |
|
| Accumulated Depreciation | (159.4 | ) | | (6.9 | ) | | (56.9 | ) | | — |
| | (223.2 | ) |
| Property, Plant and Equipment, Net | 70.4 |
| | 5.8 |
| | 87.2 |
| | — |
| | 163.4 |
|
| Investment in Affiliates | 421.0 |
| | 12.1 |
| | 20.8 |
| | (453.9 | ) | | — |
|
| Intercompany Loans | 301.6 |
| | — |
| | 3.2 |
| | (304.8 | ) | | — |
|
| Goodwill | 12.9 |
| | 1.7 |
| | 168.1 |
| | — |
| | 182.7 |
|
| Intangible Assets, Net | 4.0 |
| | 2.7 |
| | 139.8 |
| | — |
| | 146.5 |
|
| Other Assets | 11.0 |
| | 3.1 |
| | 17.2 |
| | — |
| | 31.3 |
|
| Total Assets | $ | 931.2 |
| | $ | 285.3 |
| | $ | 724.2 |
| | $ | (948.2 | ) | | $ | 992.5 |
|
| LIABILITIES AND SHAREHOLDERS' EQUITY | |
| | |
| | | | | | |
| Current Liabilities: | |
| | |
| | | | | | |
| Current Portion of Long-Term Debt | $ | 21.8 |
| | $ | — |
| | $ | 5.2 |
| | $ | — |
| | $ | 27.0 |
|
| Accounts Payable | 41.0 |
| | 5.0 |
| | 52.4 |
| | — |
| | 98.4 |
|
| Intercompany Payables | 149.5 |
| | — |
| | 29.5 |
| | (179.0 | ) | | — |
|
| Employee Compensation and Benefits | 14.4 |
| | 17.2 |
| | 24.5 |
| | — |
| | 56.1 |
|
| Other Current Liabilities | 22.8 |
| | 17.6 |
| | 27.5 |
| | (0.5 | ) | | 67.4 |
|
| Total Current Liabilities | 249.5 |
| | 39.8 |
| | 139.1 |
| | (179.5 | ) | | 248.9 |
|
| Long-Term Liabilities: | |
| | |
| | | | | | |
| Long-Term Debt | 326.5 |
| | — |
| | 1.6 |
| | — |
| | 328.1 |
|
| Intercompany Loans | 3.3 |
| | 128.1 |
| | 173.5 |
| | (304.9 | ) | | — |
|
| Employee-Related Benefits | 11.0 |
| | 2.0 |
| | 8.1 |
| | — |
| | 21.1 |
|
| Deferred Income Taxes | — |
| | — |
| | 46.0 |
| | — |
| | 46.0 |
|
| Other Liabilities | 24.6 |
| | 2.9 |
| | 4.6 |
| | — |
| | 32.1 |
|
| Total Long-Term Liabilities | 365.4 |
| | 133.0 |
| | 233.8 |
| | (304.9 | ) | | 427.3 |
|
| Total Liabilities | 614.9 |
| | 172.8 |
| | 372.9 |
| | (484.4 | ) | | 676.2 |
|
| Shareholders' Equity: | |
| | |
| | | | | | |
| Common Stock | 6.8 |
| | — |
| | 11.1 |
| | (11.1 | ) | | 6.8 |
|
| Additional Paid-In Capital | 28.5 |
| | 77.5 |
| | 399.5 |
| | (477.0 | ) | | 28.5 |
|
| Retained Earnings | 316.3 |
| | 36.6 |
| | (2.5 | ) | | (34.1 | ) | | 316.3 |
|
| Accumulated Other Comprehensive Loss | (37.2 | ) | | (1.6 | ) | | (58.7 | ) | | 60.3 |
| | (37.2 | ) |
| Total Tennant Company Shareholders’ Equity | 314.4 |
| | 112.5 |
| | 349.4 |
| | (461.9 | ) | | 314.4 |
|
| Noncontrolling Interest | 1.9 |
| | — |
| | 1.9 |
| | (1.9 | ) | | 1.9 |
|
| Total Equity | 316.3 |
| | 112.5 |
| | 351.3 |
| | (463.8 | ) | | 316.3 |
|
| Total Liabilities and Total Equity | $ | 931.2 |
| | $ | 285.3 |
| | $ | 724.2 |
| | $ | (948.2 | ) | | $ | 992.5 |
|
|
| | | | | | | | | | | | | | | | | | | |
| Condensed Consolidated Balance Sheet |
| As of December 31, 2017 |
| (in thousands) | Parent | | Guarantor Subsidiaries | | Non-Guarantor Subsidiaries | | Eliminations | | Total Tennant Company |
| ASSETS | | | | | | | | | |
| Current Assets: | | | | | | | | | |
| Cash and Cash Equivalents | $ | 18,469 |
| | $ | 507 |
| | $ | 39,422 |
| | $ | — |
| | $ | 58,398 |
|
| Restricted Cash | — |
| | — |
| | 653 |
| | — |
| | 653 |
|
| Net Receivables | 683 |
| | 88,629 |
| | 120,204 |
| | — |
| | 209,516 |
|
| Intercompany Receivables | 53,444 |
| | 133,778 |
| | — |
| | (187,222 | ) | | — |
|
| Inventories | 29,450 |
| | 12,695 |
| | 94,542 |
| | (8,993 | ) | | 127,694 |
|
| Prepaid Expenses | 8,774 |
| | 1,172 |
| | 9,405 |
| | — |
| | 19,351 |
|
| Other Current Assets | 4,030 |
| | — |
| | 3,473 |
| | — |
| | 7,503 |
|
| Total Current Assets | 114,850 |
| | 236,781 |
| | 267,699 |
| | (196,215 | ) | | 423,115 |
|
| Property, Plant and Equipment | 225,064 |
| | 12,155 |
| | 145,549 |
| | — |
| | 382,768 |
|
| Accumulated Depreciation | (146,320 | ) | | (6,333 | ) | | (50,097 | ) | | — |
| | (202,750 | ) |
| Property, Plant and Equipment, Net | 78,744 |
| | 5,822 |
| | 95,452 |
| | — |
| | 180,018 |
|
| Deferred Income Taxes | 1,308 |
| | 2,669 |
| | 7,157 |
| | — |
| | 11,134 |
|
| Investment in Affiliates | 392,486 |
| | 11,273 |
| | 20,811 |
| | (424,570 | ) | | — |
|
| Intercompany Loans | 304,822 |
| | — |
| | 4,983 |
| | (309,805 | ) | | — |
|
| Goodwill | 12,869 |
| | 1,739 |
| | 171,436 |
| | — |
| | 186,044 |
|
| Intangible Assets, Net | 2,105 |
| | 2,898 |
| | 167,344 |
| | — |
| | 172,347 |
|
| Other Assets | 10,363 |
| | — |
| | 10,956 |
| | — |
| | 21,319 |
|
| Total Assets | $ | 917,547 |
| | $ | 261,182 |
| | $ | 745,838 |
| | $ | (930,590 | ) | | $ | 993,977 |
|
| LIABILITIES AND SHAREHOLDERS' EQUITY | |
| | |
| | | | | | |
| Current Liabilities: | |
| | |
| | | | | | |
| Current Portion of Long-Term Debt | $ | 29,413 |
| | $ | — |
| | $ | 1,470 |
| | $ | — |
| | $ | 30,883 |
|
| Accounts Payable | 39,927 |
| | 3,018 |
| | 53,137 |
| | — |
| | 96,082 |
|
| Intercompany Payables | 133,778 |
| | 1,963 |
| | 51,481 |
| | (187,222 | ) | | — |
|
| Employee Compensation and Benefits | 8,311 |
| | 10,355 |
| | 18,591 |
| | — |
| | 37,257 |
|
| Income Taxes Payable | 366 |
| | — |
| | 2,472 |
| | — |
| | 2,838 |
|
| Other Current Liabilities | 20,183 |
| | 15,760 |
| | 33,504 |
| | — |
| | 69,447 |
|
| Total Current Liabilities | 231,978 |
| | 31,096 |
| | 160,655 |
| | (187,222 | ) | | 236,507 |
|
| Long-Term Liabilities: | |
| | |
| | | | | | |
| Long-Term Debt | 344,147 |
| | — |
| | 1,809 |
| | — |
| | 345,956 |
|
| Intercompany Loans | — |
| | 128,000 |
| | 181,805 |
| | (309,805 | ) | | — |
|
| Employee-Related Benefits | 11,160 |
| | 3,992 |
| | 8,715 |
| | — |
| | 23,867 |
|
| Deferred Income Taxes | — |
| | — |
| | 53,225 |
| | — |
| | 53,225 |
|
| Other Liabilities | 31,788 |
| | 2,483 |
| | 1,677 |
| | — |
| | 35,948 |
|
| Total Long-Term Liabilities | 387,095 |
| | 134,475 |
| | 247,231 |
| | (309,805 | ) | | 458,996 |
|
| Total Liabilities | 619,073 |
| | 165,571 |
| | 407,886 |
| | (497,027 | ) | | 695,503 |
|
| Shareholders' Equity: | |
| | |
| | | | | | |
| Common Stock | 6,705 |
| | — |
| | 11,131 |
| | (11,131 | ) | | 6,705 |
|
| Additional Paid-In Capital | 15,089 |
| | 72,483 |
| | 384,460 |
| | (456,943 | ) | | 15,089 |
|
| Retained Earnings | 297,032 |
| | 23,797 |
| | (21,219 | ) | | (2,578 | ) | | 297,032 |
|
| Accumulated Other Comprehensive Loss | (22,323 | ) | | (669 | ) | | (38,391 | ) | | 39,060 |
| | (22,323 | ) |
| Total Tennant Company Shareholders’ Equity | 296,503 |
| | 95,611 |
| | 335,981 |
| | (431,592 | ) | | 296,503 |
|
| Noncontrolling Interest | 1,971 |
| | — |
| | 1,971 |
| | (1,971 | ) | | 1,971 |
|
| Total Equity | 298,474 |
| | 95,611 |
| | 337,952 |
| | (433,563 | ) | | 298,474 |
|
| Total Liabilities and Total Equity | $ | 917,547 |
| | $ | 261,182 |
| | $ | 745,838 |
| | $ | (930,590 | ) | | $ | 993,977 |
|
NOTES TO THE CONSOLIDATED FINANCIAL STATEMENTS
(In thousands,Tables in millions, except shares and per share data)
| | Condensed Consolidated Statement of Cash Flows | | For the year ended December 31, 2018 | |
| (in thousands) | Parent | | Guarantor Subsidiaries | | Non-Guarantor Subsidiaries | | Eliminations | | Total Tennant Company | |
| For the year ended December 31, 2019 | | For the year ended December 31, 2019 |
| (in millions) | | Parent | | Guarantor Subsidiaries | | Non-Guarantor Subsidiaries | | Eliminations | | Total Tennant Company |
| OPERATING ACTIVITIES | | | | | | | | | | | | | | | | | | |
| Net Cash Provided by Operating Activities | $ | 68,082 |
| | $ | 1,202 |
| | $ | 10,888 |
| | $ | (202 | ) | | $ | 79,970 |
| $ | 54.2 |
| | $ | 0.1 |
| | $ | 17.6 |
| | $ | — |
| | $ | 71.9 |
|
| INVESTING ACTIVITIES | | | | | | | | | | | | | | | | | | |
| Purchases of Property, Plant and Equipment | (6,832 | ) | | (99 | ) | | (11,849 | ) | | — |
| | (18,780 | ) | (27.5 | ) | | (0.4 | ) | | (10.5 | ) | | — |
| | (38.4 | ) |
| Proceeds from Disposals of Property, Plant and Equipment | 21 |
| | — |
| | 91 |
| | — |
| | 112 |
| 0.1 |
| | — |
| | — |
| | — |
| | 0.1 |
|
| Proceeds from Principal Payments Received on Long-Term Note Receivable | — |
| | — |
| | 1,416 |
| | — |
| | 1,416 |
| — |
| | — |
| | 2.9 |
| | — |
| | 2.9 |
|
| Proceeds from Sale of Business | — |
| | — |
| | 4,000 |
| | — |
| | 4,000 |
| |
| Acquisition of Business, Net of Cash Acquired | | — |
| | — |
| | (19.7 | ) | | — |
| | (19.7 | ) |
| Purchases of Intangible Asset | (2,500 | ) | | — |
| | (275 | ) | | — |
| | (2,775 | ) | — |
| | — |
| | (0.5 | ) | | — |
| | (0.5 | ) |
| Change in Investments in Subsidiaries | (15,622 | ) | | — |
| | — |
| | 15,622 |
| | — |
| |
| Loan Payments Received by Parent from Subsidiary | 1,218 |
| | — |
| | — |
| | (1,218 | ) | | — |
| |
| Loan Payments Received by Subsidiary from Parent | — |
| | — |
| | 1,778 |
| | (1,778 | ) | | — |
| — |
| | — |
| | 1.1 |
| | (1.1 | ) | | — |
|
| Net Cash Used in Investing Activities | (23,715 | ) | | (99 | ) | | (4,839 | ) | | 12,626 |
| | (16,027 | ) | (27.4 | ) | | (0.4 | ) | | (26.7 | ) | | (1.1 | ) | | (55.6 | ) |
| FINANCING ACTIVITIES | | | | | | | | | | | | | | | | | | |
| Proceeds from Short-Term Debt | — |
| | — |
| | 3,926 |
| | — |
| | 3,926 |
| |
| Loan Repayments made to Parent from Subsidiary | — |
| | — |
| | (1,218 | ) | | 1,218 |
| | — |
| |
| Proceed from Debt | | 25.0 |
| | — |
| | — |
| | — |
| | 25.0 |
|
| Loan Repayments made to Subsidiary from Parent | (1,778 | ) | | — |
| | — |
| | 1,778 |
| | — |
| (1.1 | ) | | — |
| | — |
| | 1.1 |
| | — |
|
| Change in Subsidiary Equity | — |
| | — |
| | 15,622 |
| | (15,622 | ) | | — |
| |
| Proceeds from Issuance of Long-Term Debt | 11,000 |
| | — |
| | — |
| | — |
| | 11,000 |
| |
| Payments of Long-Term Debt | (38,000 | ) | | — |
| | (255 | ) | | — |
| | (38,255 | ) | |
| Change in Capital Lease Obligations | — |
| | — |
| | 14 |
| | — |
| | 14 |
| |
| Repayments of Debt | | (37.7 | ) | | — |
| | (4.1 | ) | | — |
| | (41.8 | ) |
| Change in Finance Lease Obligations | | — |
| | — |
| | (0.2 | ) | | — |
| | (0.2 | ) |
| Proceeds from Issuances of Common Stock | 5,880 |
| | — |
| | — |
| | — |
| | 5,880 |
| 6.1 |
| | — |
| | — |
| | — |
| | 6.1 |
|
| Purchase of Noncontrolling Owner Interest | | — |
| | — |
| | (0.5 | ) | | — |
| | (0.5 | ) |
| Dividends Paid | (15,343 | ) | | — |
| | (202 | ) | | 202 |
| | (15,343 | ) | (16.0 | ) | | — |
| | — |
| | — |
| | (16.0 | ) |
| Net Cash (Used in) Provided by Financing Activities | (38,241 | ) | | — |
| | 17,887 |
| | (12,424 | ) | | (32,778 | ) | (23.7 | ) | | — |
| | (4.8 | ) | | 1.1 |
| | (27.4 | ) |
| Effect of Exchange Rate Changes on Cash, Cash Equivalents and Restricted Cash | 184 |
| | — |
| | (4,266 | ) | | — |
| | (4,082 | ) | (0.2 | ) | | — |
| | (0.2 | ) | | — |
| | (0.4 | ) |
| NET INCREASE IN CASH, CASH EQUIVALENTS AND RESTRICTED CASH | 6,310 |
| | 1,103 |
| | 19,670 |
| | — |
| | 27,083 |
| 2.9 |
| | (0.3 | ) | | (14.1 | ) | | — |
| | (11.5 | ) |
| Cash, Cash Equivalents and Restricted Cash at Beginning of Year | 18,469 |
| | 507 |
| | 40,075 |
| | — |
| | 59,051 |
| 24.8 |
| | 1.6 |
| | 59.7 |
| | — |
| | 86.1 |
|
| CASH, CASH EQUIVALENTS AND RESTRICTED CASH AT END OF YEAR | $ | 24,779 |
| | $ | 1,610 |
| | $ | 59,745 |
| | $ | — |
| | $ | 86,134 |
| $ | 27.7 |
| | $ | 1.3 |
| | $ | 45.6 |
| | $ | — |
| | $ | 74.6 |
|
NOTES TO THE CONSOLIDATED FINANCIAL STATEMENTS
(In thousands,Tables in millions, except shares and per share data)
| | Condensed Consolidated Statement of Cash Flows | | For the year ended December 31, 2017 | |
| (in thousands) | Parent | | Guarantor Subsidiaries | | Non-Guarantor Subsidiaries | | Eliminations | | Total Tennant Company | |
| For the year ended December 31, 2018 | | For the year ended December 31, 2018 |
| (in millions) | | Parent | | Guarantor Subsidiaries | | Non-Guarantor Subsidiaries | | Eliminations | | Total Tennant Company |
| OPERATING ACTIVITIES | | | | | | | | | | | | | | | | | | |
| Net Cash Provided by Operating Activities | $ | 26,992 |
| | $ | 280 |
| | $ | 27,711 |
| | $ | (809 | ) | | $ | 54,174 |
| $ | 68.1 |
| | $ | 1.2 |
| | $ | 10.9 |
| | $ | (0.2 | ) | | $ | 80.0 |
|
| INVESTING ACTIVITIES | | | | | | | | |
|
| | | | | | | | |
|
|
| Purchases of Property, Plant and Equipment | (9,558 | ) | | — |
| | (10,879 | ) | | — |
| | (20,437 | ) | (6.8 | ) | | (0.1 | ) | | (11.9 | ) | | — |
| | (18.8 | ) |
| Proceeds from Disposals of Property, Plant and Equipment | 23 |
| | 1 |
| | 2,487 |
| | — |
| | 2,511 |
| — |
| | — |
| | 0.1 |
| | — |
| | 0.1 |
|
| Proceeds from Principal Payments received on Long-Term Note Receivable | — |
| | — |
| | 667 |
| | — |
| | 667 |
| — |
| | — |
| | 1.4 |
| | — |
| | 1.4 |
|
| Acquisition of Businesses, Net of Cash Acquired | (304 | ) | | — |
| | (353,769 | ) | | — |
| | (354,073 | ) | |
| Issuance of Long-Term Note Receivable | — |
| | — |
| | (1,500 | ) | | — |
| | (1,500 | ) | |
| Proceeds from Sale of Business | | — |
| | — |
| | 4.0 |
| | — |
| | 4.0 |
|
| Purchase of Intangible Asset | (2,500 | ) | | — |
| | — |
| | — |
| | (2,500 | ) | (2.5 | ) | | — |
| | (0.3 | ) | | — |
| | (2.8 | ) |
| Change in Investments in Subsidiaries | (199,028 | ) | | — |
| | — |
| | 199,028 |
| | — |
| (15.6 | ) | | — |
| | — |
| | 15.6 |
| | — |
|
| Loan Borrowings (Payments) from Subsidiaries | (159,780 | ) | | — |
| | (4,983 | ) | | 164,763 |
| | — |
| |
| Loan Payments from Subsidiaries | | 1.2 |
| | — |
| | — |
| | (1.2 | ) | | — |
|
| Loan Payments from Parent | | — |
| | — |
| | 1.8 |
| | (1.8 | ) | | — |
|
| Net Cash (Used in) Provided by Investing Activities | (371,147 | ) | | 1 |
| | (367,977 | ) | | 363,791 |
| | (375,332 | ) | (23.7 | ) | | (0.1 | ) | | (4.9 | ) | | 12.6 |
| | (16.1 | ) |
| FINANCING ACTIVITIES | | | | | | | | | | | | | | | | | | |
| Proceeds from Short-Term Debt | 303,000 |
| | — |
| | — |
| | — |
| | 303,000 |
| |
| Repayments of Short-Term Debt | (303,000 | ) | | — |
| | — |
| | — |
| | (303,000 | ) | |
| Loan Borrowings (Payments) from Parent | 4,983 |
| | — |
| | 159,780 |
| | (164,763 | ) | | — |
| |
| Proceeds from Debt | | 11.0 |
| | — |
| | 3.9 |
| | — |
| | 14.9 |
|
| Loan Repayments to Subsidiary from Parent | | (1.8 | ) | | — |
| | — |
| | 1.8 |
| | — |
|
| Loan Repayments to Parent from Subsidiary | | — |
| | — |
| | (1.2 | ) | | 1.2 |
| | — |
|
| Change in Subsidiary Equity | — |
| | — |
| | 199,028 |
| | (199,028 | ) | | — |
| — |
| | — |
| | 15.6 |
| | (15.6 | ) | | — |
|
| Payments of Long-Term Debt | (96,142 | ) | | — |
| | (106 | ) | | — |
| | (96,248 | ) | |
| Proceeds from Issuance of Long-Term Debt | 440,000 |
| | — |
| | — |
| | — |
| | 440,000 |
| |
| Payments of Debt Issuance Costs | (16,482 | ) | | — |
| | — |
| | — |
| | (16,482 | ) | |
| Change in Capital Lease Obligations | — |
| | — |
| | 311 |
| | — |
| | 311 |
| |
| Payment of LongTerm Debt | | (38.0 | ) | | — |
| | (0.3 | ) | | — |
| | (38.3 | ) |
| Proceeds from Issuances of Common Stock | 6,875 |
| | — |
| | — |
| | — |
| | 6,875 |
| 5.9 |
| | — |
| | — |
| | — |
| | 5.9 |
|
| Purchase of Noncontrolling Owner Interest | — |
| | — |
| | (30 | ) | | — |
| | (30 | ) | |
| Dividends Paid | (14,953 | ) | | — |
| | (809 | ) | | 809 |
| | (14,953 | ) | (15.3 | ) | | — |
| | (0.2 | ) | | 0.2 |
| | (15.3 | ) |
| Net Cash Provided by Financing Activities | 324,281 |
| | — |
| | 358,174 |
| | (362,982 | ) | | 319,473 |
| |
| Net Cash (Used in) Provided by Financing Activities | | (38.2 | ) | | — |
| | 17.8 |
| | (12.4 | ) | | (32.8 | ) |
| Effect of Exchange Rate Changes on Cash and Cash Equivalents | (141 | ) | | — |
| | 2,327 |
| | — |
| | 2,186 |
| 0.2 |
| | — |
| | (4.2 | ) | | — |
| | (4.0 | ) |
| NET (DECREASE) INCREASE IN CASH, CASH EQUIVALENTS AND RESTRICTED CASH | (20,015 | ) | | 281 |
| | 20,235 |
| | — |
| | 501 |
| |
| NET INCREASE IN CASH, CASH EQUIVALENTS AND RESTRICTED CASH | | 6.4 |
| | 1.1 |
| | 19.6 |
| | — |
| | 27.1 |
|
| Cash, Cash Equivalents and Restricted Cash at Beginning of Year | 38,484 |
| | 226 |
| | 19,840 |
| | — |
| | 58,550 |
| 18.4 |
| | 0.5 |
| | 40.1 |
| | — |
| | 59.0 |
|
| CASH, CASH EQUIVALENTS AND RESTRICTED CASH AT END OF YEAR | $ | 18,469 |
| | $ | 507 |
| | $ | 40,075 |
| | $ | — |
| | $ | 59,051 |
| $ | 24.8 |
| | $ | 1.6 |
| | $ | 59.7 |
| | $ | — |
| | $ | 86.1 |
|
NOTES TO THE CONSOLIDATED FINANCIAL STATEMENTS
(In thousands,Tables in millions, except shares and per share data)
|
| | | | | | | | | | | | | | | | | | | |
| Condensed Consolidated Statement of Cash Flows |
| For the year ended December 31, 2017 |
| (in millions) | Parent | | Guarantor Subsidiaries | | Non-Guarantor Subsidiaries | | Eliminations | | Total Tennant Company |
| OPERATING ACTIVITIES | | | | | | | | | |
| Net Cash Provided by Operating Activities | $ | 27.0 |
| | $ | 0.3 |
| | $ | 27.7 |
| | $ | (0.8 | ) | | $ | 54.2 |
|
| INVESTING ACTIVITIES | | | | | | | | | |
| Purchases of Property, Plant and Equipment | (9.5 | ) | | — |
| | (10.9 | ) | | — |
| | (20.4 | ) |
| Proceeds from Disposals of Property, Plant and Equipment | — |
| | — |
| | 2.5 |
| | — |
| | 2.5 |
|
| Proceeds from Principal Payments Received on Long-Term Note Receivable | — |
| | — |
| | 0.7 |
| | — |
| | 0.7 |
|
| Acquisition of Businesses, Net of Cash Acquired | (0.3 | ) | | — |
| | (353.8 | ) | | — |
| | (354.1 | ) |
| Issuance of Long-Term Note Receivable | — |
| | — |
| | (1.5 | ) | | — |
| | (1.5 | ) |
| Purchase of Intangible Asset | (2.5 | ) | | — |
| | — |
| | — |
| | (2.5 | ) |
| Loan Borrowings (Payments) from Subsidiaries | (159.8 | ) | | — |
| | (5.0 | ) | | 164.8 |
| | — |
|
| Change in Investments in Subsidiaries | (199.0 | ) | | — |
| | — |
| | 199.0 |
| | — |
|
| Net Cash (Used in) Provided by Investing Activities | (371.1 | ) | | — |
| | (368.0 | ) | | 363.8 |
| | (375.3 | ) |
| FINANCING ACTIVITIES | | | | | | | | | |
| Proceeds from Debt | 743.0 |
| | — |
| | — |
| | — |
| | 743.0 |
|
| Loan Borrowings (Payments) from Parent | 5.0 |
| | — |
| | 159.8 |
| | (164.8 | ) | | — |
|
| Change in Subsidiary Entity | — |
| | — |
| | 199.0 |
| | (199.0 | ) | | — |
|
| Repayments of Debt | (399.2 | ) | | — |
| | (0.1 | ) | | — |
| | (399.3 | ) |
| Payments of Debt Issuance Costs | (16.5 | ) | | — |
| | — |
| | — |
| | (16.5 | ) |
| Change in Finance Lease Obligations | — |
| | — |
| | 0.3 |
| | — |
| | 0.3 |
|
| Proceeds from Issuances of Common Stock | 6.9 |
| | — |
| | — |
| | — |
| | 6.9 |
|
| Dividends Paid | (15.0 | ) | | — |
| | (0.8 | ) | | 0.8 |
| | (15.0 | ) |
| Net Cash Provided by (Used in) Financing Activities | 324.2 |
| | — |
| | 358.2 |
| | (363.0 | ) | | 319.4 |
|
| Effect of Exchange Rate Changes on Cash and Cash Equivalents | (0.1 | ) | | — |
| | 2.3 |
| | — |
| | 2.2 |
|
| NET (DECREASE) INCREASE IN CASH, CASH EQUIVALENTS AND RESTRICTED CASH | (20.0 | ) | | 0.3 |
| | 20.2 |
| | — |
| | 0.5 |
|
| Cash, Cash Equivalents and Restricted Cash at Beginning of Year | 38.4 |
| | 0.2 |
| | 19.9 |
| | — |
| | 58.5 |
|
| CASH, CASH EQUIVALENTS AND RESTRICTED CASH AT END OF YEAR | $ | 18.4 |
| | $ | 0.5 |
| | $ | 40.1 |
| | $ | — |
| | $ | 59.0 |
|
|
| | | | | | | | | | | | | | | | | | | |
| Condensed Consolidated Statement of Cash Flows |
| For the year ended December 31, 2016 |
| (in thousands) | Parent | | Guarantor Subsidiaries | | Non-Guarantor Subsidiaries | | Eliminations | | Total Tennant Company |
| OPERATING ACTIVITIES | | | | | | | | | |
| Net Cash Provided by Operating Activities | $ | 44,147 |
| | $ | 239 |
| | $ | 14,090 |
| | $ | (598 | ) | | $ | 57,878 |
|
| INVESTING ACTIVITIES | | | | | | | | | |
| Purchases of Property, Plant and Equipment | (21,507 | ) | | (13 | ) | | (5,006 | ) | | — |
| | (26,526 | ) |
| Proceeds from Disposals of Property, Plant and Equipment | 377 |
| | — |
| | 238 |
| | — |
| | 615 |
|
| Acquisition of Businesses, Net of Cash Acquired | — |
| | (11,539 | ) | | (1,394 | ) | | — |
| | (12,933 | ) |
| Issuance of Long-Term Note Receivable | — |
| | — |
| | (2,000 | ) | | — |
| | (2,000 | ) |
| Loan Borrowings (Payments) from Subsidiaries | 8,690 |
| | — |
| | — |
| | (8,690 | ) | | — |
|
| Proceeds from Sale of Business | — |
| | — |
| | 285 |
| | — |
| | 285 |
|
| Change in Investments in Subsidiaries | (19,594 | ) | | — |
| | — |
| | 19,594 |
| | — |
|
| Net Cash Used in Investing Activities | (32,034 | ) | | (11,552 | ) | | (7,877 | ) | | 10,904 |
| | (40,559 | ) |
| FINANCING ACTIVITIES | | | | | | | | | |
| Loan (Payments) Borrowings from Parent | — |
| | 7,969 |
| | (16,659 | ) | | 8,690 |
| | — |
|
| Change in Subsidiary Entity | — |
| | 3,570 |
| | 16,024 |
| | (19,594 | ) | | — |
|
| Payments of Long-Term Debt | (3,429 | ) | | — |
| | (31 | ) | | — |
| | (3,460 | ) |
| Proceeds from Issuance of Long-Term Debt | 15,000 |
| | — |
| | — |
| | — |
| | 15,000 |
|
| Purchases of Common Stock | (12,762 | ) | | — |
| | — |
| | — |
| | (12,762 | ) |
| Proceeds from Issuances of Common Stock | 5,271 |
| | — |
| | — |
| | — |
| | 5,271 |
|
| Excess Tax Benefit on Stock Plans | 686 |
| | — |
| | — |
| | — |
| | 686 |
|
| Dividends Paid | (14,293 | ) | | — |
| | (598 | ) | | 598 |
| | (14,293 | ) |
| Net Cash (Used in) Provided by Financing Activities | (9,527 | ) | | 11,539 |
| | (1,264 | ) | | (10,306 | ) | | (9,558 | ) |
| Effect of Exchange Rate Changes on Cash and Cash Equivalents | 63 |
| | — |
| | (1,213 | ) | | — |
| | (1,150 | ) |
| NET INCREASE IN CASH, CASH EQUIVALENTS AND RESTRICTED CASH | 2,649 |
| | 226 |
| | 3,736 |
| | — |
| | 6,611 |
|
| Cash, Cash Equivalents and Restricted Cash at Beginning of Year | 35,835 |
| | — |
| | 16,104 |
| | — |
| | 51,939 |
|
| CASH, CASH EQUIVALENTS AND RESTRICTED CASH AT END OF YEAR | $ | 38,484 |
| | $ | 226 |
| | $ | 19,840 |
| | $ | — |
| | $ | 58,550 |
|
On September 4, 2018, we signed a definitive agreement to acquire 100% of the outstanding capital stock of Hefei Gaomei Cleaning Machines Co., Ltd. and 99% of the outstanding capital stock of Anhui Rongen Environmental Protection Technology Co., Ltd. (collectively "Gaomei"), privately held designers and manufacturers of commercial cleaning solutions based in China. The acquisition closed on January 4, 2019. The purchase price includes cash and contingent consideration which will be paid out over the next few years. The purchase price and net assets acquired are not significant to our consolidated financial statements.
ITEM 9 – Changes in and Disagreements with Accountants on Accounting and Financial Disclosure
None.
ITEM 9A – Controls and Procedures
Disclosure Controls and Procedures
Our management, including our Chief Executive Officer and PrincipalInterim Chief Financial Officer and Interim Principal Accounting Officer, have conducted an evaluation of the effectiveness of the design and operation of our disclosure controls and procedures (as defined in Rule 13a-15(e) under the Securities Exchange Act of 1934, as amended (the Exchange Act)) as of December 31, 2018.2019. Based on that evaluation, our Chief Executive Officer and PrincipalInterim Chief Financial Officer and Interim Principal Accounting Officer concluded that, as of December 31, 2018,2019, our disclosure controls and procedures were effective.
For purposes of Rule 13a-15(e), the term disclosure controls and procedures means controls and other procedures of an issuer that are designed to ensure that information required to be disclosed by the issuer in the reports that it files or submits under the Exchange Act (15 U.S.C. 78a et
seq.) is recorded, processed, summarized and reported within the time periods specified in the SEC’s rules and forms. Disclosure controls and procedures include, without limitation, controls and procedures designed to ensure that information required to be disclosed by an issuer in the reports that it files or submits under the Exchange Act is accumulated and communicated to the issuer’s management, including its Chief Executive Officer and PrincipalInterim Chief Financial Officer and Interim Principal Accounting Officer, or persons performing similar functions, as appropriate to allow timely decisions regarding required disclosure.
Management’s Report on Internal Control over Financial Reporting
Our management is responsible for establishing and maintaining adequate internal control over financial reporting, as such term is defined in Rule 13a-15(f) under the Exchange Act.
The Company’s internal control over financial reporting is a process designed to provide reasonable assurance regarding the reliability of financial reporting and the preparation of financial statements for external purposes in accordance with generally accepted accounting principles. A company’s internal control over financial reporting includes those policies and procedures that:
| |
| (i) | Pertain to the maintenance of records that, in reasonable detail, accurately and fairly reflect the transactions and dispositions of the assets of the company; |
| |
| (ii) | Provide reasonable assurance that transactions are recorded as necessary to permit preparation of financial statements in accordance with generally accepted accounting principles, and that receipts and expenditures of the company are being made only in accordance with authorizations of management and directors of the company; and |
| |
| (iii) | Provide reasonable assurance regarding prevention or timely detection of unauthorized acquisition, use or disposition of the company’s assets that could have a material effect on the financial statements. |
Because of its inherent limitations, internal control over financial reporting may not prevent or detect misstatements. Also, projections of any evaluation of effectiveness to future periods are subject to the risk that controls may become inadequate because of changes in conditions, or that the degree of compliance with the policies or procedures may deteriorate.
A material weakness is a deficiency, or combination of deficiencies, in internal control over financial reporting such that there is a reasonable possibility that a material misstatement of the Company’s annual or interim financial statements will not be prevented or detected on a timely basis.
Under the supervision of the Audit Committee of the Board of Directors and with the participation of our management, including our Chief Executive Officer and PrincipalInterim Financial Officer and Interim Principal Accounting Officer, we conducted an evaluation of the effectiveness of our internal control over financial reporting using the criteria established in Internal Control - Integrated Framework (2013) issued by the Committee of Sponsoring Organizations of the Treadway Commission (COSO). Based on our assessment and those criteria, our Chief Executive Officer and PrincipalInterim Chief Financial Officer and Interim Principal Accounting Officer concluded that our internal control over financial reporting was effective as of December 31, 2018.2019.
We acquired Gaomei in January 2019, which was accounted for as a business combination. Management excluded from its assessment of the effectiveness of our internal control over financial reporting as of and for the year ended December 31, 2019 Gaomei's internal control over financial reporting associated with $41.3 million of total assets and $15.8 million of total revenues included in the consolidated financial statements of the Company as of and for the year ended December 31, 2019. This exclusion is in accordance with the SEC's guidance, which permits companies to omit an acquired business's internal control over financial reporting from management's assessment for up to one year after the date of the acquisition.
KPMG, LLP, an independent registered public accounting firm, has audited the effectiveness of the Company's internal control over financial reporting as of December 31, 20182019 and has issued a report which is included in Item 8 of this Annual Report on Form 10-K.
Changes in Internal Control Over Financial Reporting
We have completed our testing of the operating effectiveness of internal control over financial reporting of our acquired entity, IPC Group. There were no significant changes in the Company's internal control over financial reporting during the quarter ended December 31, 20182019 that have materially affected, or are reasonably likely to materially affect, the Company's internal control over financial reporting.
ITEM 9B – Other Information
None.
PART III
ITEM 10 – Directors, Executive Officers and Corporate Governance
Information required under this item with respect to directors is contained in the sections entitled “Board of Directors” and “Section“Delinquent Section 16(a) Beneficial Ownership Reporting Compliance”Reports” as part of our 20192020 Proxy Statement and is incorporated herein by reference. See also Item 1, Information About Our Executive Officers of the Registrant in Part I hereof.
Business Ethics Guide
We have adopted the Tennant Company Business Ethics Guide, which applies to all of our employees, directors, consultants, agents and anyone else acting on our behalf. The Business Ethics Guide includes particular provisions applicable to our senior financial management, which includes our Chief Executive Officer, Chief Financial Officer, Controller and other employees performing similar functions. A copy of our Business Ethics Guide is available on the Investor Relations website at investors.tennantco.com. We intend to post on our website any amendment to, or waiver from, a provision of our Business Ethics Guide that applies to our Principal Executive Officer, Principal Financial Officer, Principal Accounting Officer, Controller and other persons performing similar functions promptly following the date of such amendment or waiver. In addition, we have also posted copies of our Corporate Governance Principles and the Charters for our Audit, Compensation, Governance and Executive Committees on our website.
ITEM 11 – Executive Compensation
Information required under this item is contained in the sections entitled “Director Compensation," “Executive Compensation Information,” and "Pay Ratio" as part of our 20192020 Proxy Statement and is incorporated herein by reference.
ITEM 12 – Security Ownership of Certain Beneficial Owners and Management and Related Shareholder Matters
Information required under this item is contained in the section entitled “Security Ownership of Certain Beneficial Owners and Management” as part of our 20192020 Proxy Statement and is incorporated herein by reference. The section entitled "Equity Compensation Plan Information" can be found within Item 5, Market for Registrant's Common Equity, Related Shareholder Matters and Issuer Purchases of Equity Securities in Part II hereof.
ITEM 13 – Certain Relationships and Related Transactions, and Director Independence
Information required under this item is contained in the sections entitled “Director Independence” and “Related-Person Transaction Approval Policy” as part of our 20192020 Proxy Statement and is incorporated herein by reference.
ITEM 14 – Principal Accountant Fees and Services
Information required under this item is contained in the section entitled “Fees Paid to Independent Registered Public Accounting Firm” as part of our 20192020 Proxy Statement and is incorporated herein by reference.
PART IV
ITEM 15 – Exhibits and Financial Statement Schedules
| |
| A. | The following documents are filed as a part of this report: |
Consolidated Financial Statements filed as part of this report are contained in Item 8 of this annual report on Form 10-K.
| |
| 2. | Financial Statement Schedule |
Schedule II - Valuation and Qualifying Accounts
| | | (In thousands) | 2018 | | 2017 | | 2016 | | |
| (In millions) | | 2019 | | 2018 | | 2017 | |
| Allowance for Doubtful Accounts: | | | | | | | | | | | | |
| Balance at beginning of year | $ | 2,428 |
| | $ | 2,570 |
| | $ | 2,929 |
| | $ | 2.5 |
| | $ | 2.4 |
| | $ | 2.5 |
| |
| Charged to costs and expenses | 375 |
| | 1,183 |
| | 649 |
| | 2.5 |
| | 0.4 |
| | 1.2 |
| |
Reclassification(1) | 772 |
| | (526 | ) | | — |
| | 0.5 |
| | 0.8 |
| | (0.5 | ) | |
Charged to other accounts(2) | (222 | ) | | 80 |
| | (4 | ) | | — |
| | (0.2 | ) | | 0.1 |
| |
Deductions(3) | (837 | ) | | (879 | ) | | (1,004 | ) | | (1.9 | ) | | (0.9 | ) | | (0.9 | ) | |
| Balance at end of year | $ | 2,516 |
| | $ | 2,428 |
| | $ | 2,570 |
| | $ | 3.6 |
| | $ | 2.5 |
| | $ | 2.4 |
| |
| Sales Returns Reserve: | | | | | | | | | | | | |
| Balance at beginning of year | $ | 813 |
| | $ | 538 |
| (5) | $ | 686 |
| (5) | $ | 1.3 |
| | $ | 0.8 |
| | $ | 0.5 |
| (5) |
| Charged to costs and expenses | 688 |
| | 419 |
| (5) | (88 | ) | (5) | 0.1 |
| | 0.7 |
| | 0.4 |
| (5) |
Charged to other accounts(2) | 10 |
| | 31 |
| (5) | (15 | ) | (5) | — |
| | — |
| | — |
| (5) |
Deductions(3) | (198 | ) | | (175 | ) | (5) | (45 | ) | (5) | (0.2 | ) | | (0.2 | ) | | (0.1 | ) | (5) |
| Balance at end of year | $ | 1,313 |
| | $ | 813 |
| (5) | $ | 538 |
| (5) | $ | 1.2 |
| | $ | 1.3 |
| | $ | 0.8 |
| (5) |
| Inventory Reserves: | |
| | |
| | |
| | |
| Allowance for Excess and Obsolete Inventories: | | |
| | |
| | |
| |
| Balance at beginning of year | $ | 4,107 |
| | $ | 3,644 |
| | $ | 3,540 |
| | $ | 5.6 |
| | $ | 4.1 |
| | $ | 3.6 |
| |
| Charged to costs and expenses | 1,916 |
| | 1,698 |
| | 1,455 |
| | 4.6 |
| | 1.9 |
| | 1.7 |
| |
Charged to other accounts(2) | (139 | ) | | 183 |
| | (50 | ) | | — |
| | (0.1 | ) | | 0.2 |
| |
Deductions(4) | (246 | ) | | (1,418 | ) | | (1,301 | ) | | (0.4 | ) | | (0.3 | ) | | (1.4 | ) | |
| Balance at end of year | $ | 5,638 |
| | $ | 4,107 |
| | $ | 3,644 |
| | $ | 9.8 |
| | $ | 5.6 |
| | $ | 4.1 |
| |
| Valuation Allowance for Deferred Tax Assets: | |
| | |
| | |
| | |
| | |
| | |
| |
| Balance at beginning of year | $ | 9,691 |
| | $ | 6,865 |
| | $ | 5,884 |
| | $ | 11.5 |
| | $ | 9.7 |
| | $ | 6.9 |
| |
| Charged to costs and expenses | 2,373 |
| | 1,634 |
| | 1,295 |
| | (5.2 | ) | | 2.4 |
| | 1.6 |
| |
Charged to other accounts(2) | (545 | ) | | 1,192 |
| | (314 | ) | | (0.1 | ) | | (0.6 | ) | | 1.2 |
| |
| Balance at end of year | $ | 11,519 |
| | $ | 9,691 |
| | $ | 6,865 |
| | $ | 6.2 |
| | $ | 11.5 |
| | $ | 9.7 |
| |
| |
(1) | Includes amount reclassified between Allowance for Doubtful Accounts and Other Receivables related to a customer's open receivables balance which was resolved in 2018, as well asfor proper classification and acquisition-related adjustments. |
| |
(2) | Primarily includes impact from foreign currency fluctuations. |
| |
(3) | Includes accounts determined to be uncollectible and charged against reserves, net of collections on accounts previously charged against reserves. |
| |
(4) | Includes inventory identified as excess, slow moving or obsolete and charged against reserves. |
| |
(5) | These balances were included in the Allowance for Doubtful Accounts in 2017 and 2016.2017. Due to the adoption of ASC 606, the Sales Returns Reserve is now included in Other Current Liabilities. Please see Note 2 for further discussion. |
All other schedules are omitted because they are not applicable or the required information is shown in the Consolidated Financial Statements or notes thereto.
|
| | | | |
| Item # | | Description | | Method of Filing |
| 2.1 | | | | Incorporated by reference to Exhibit 2.1 to the Company's Current Report on Form 8-K filed February 28, 2017. |
| 3.1 | | | | Incorporated by reference to Exhibit 3i to the Company’s Form 10-Q for the quarter ended June 30, 2006. |
| 3.2 | | | | Incorporated by reference to Exhibit 3iii to the Company’s Current Report on Form 8-K dated December 14, 2010. |
| 3.3 | | | | Incorporated by reference to Exhibit 3iii to the Company's Form 10-Q for the quarter ended March 31, 2018. |
| 4.1 | | | | Filed herewith electronically |
| 4.2 | | | | Incorporated by reference to Exhibit 4.1 to the Company's Current Report on Form 8-K filed April 24, 2017. |
4.24.3 | | | | Incorporated by reference to Exhibit 4.2 to the Company's Current Report on Form 8-K filed April 24, 2017. |
4.34.4 | | | | Incorporated by reference to Exhibit 4(b)(1) to the Company's Registration Statement on Form S-4 filed January 8, 2018. |
| 10.1 | | | | Incorporated by reference to Exhibit 10.1 to the Company’s Form 10-Q for the quarter ended September 30, 2012. |
| 10.2 | | | | Incorporated by reference to Exhibit 10.3 to the Company's Form 10-K for the year ended December 31, 2011. |
| 10.3 | | | | Filed herewith electronically.
|
| 10.4 | | | | Incorporated by reference to Exhibit 10.6 to the Company’s Form 10-Q for the quarter ended June 30, 2004. |
| 10.5 | | | | Incorporated by reference to Appendix A to the Company’s Proxy Statement for the 2006 Annual Meeting of Shareholders filed on March 15, 2006. |
| 10.6 | | | | Incorporated by reference to Appendix A to the Company’s Proxy Statement for the 2007 Annual Meeting of Shareholders filed on March 15, 2007. |
| 10.7 | | | | Incorporated by reference to Exhibit 10.17 to the Company's Form 10-K for the year ended December 31, 2007.
|
| 10.8 | | | | Incorporated by reference to Appendix B to the Company's Proxy Statement for the 2013 Annual Meeting of Shareholders filed on March 11, 2013. |
| 10.9 | | | | Incorporated by reference to Appendix A to the Company's Proxy Statement for the 2013 Annual Meeting of Shareholders filed on March 11, 2013. |
| 10.10 | | | | Incorporated by reference to Exhibit 10.1 to the Company's Current Report on Form 8-K filed April 5, 2017. |
| 10.11 | | | | Incorporated by reference to Appendix A on the Company's Proxy Statement for the 2017 Annual Meeting of Shareholders filed March 15, 2017.
|
| 10.12 | | | | Incorporated by reference to Exhibit 10.3 to the Company's Form 10-Q for the quarter ended June 30, 2017. |
| 10.13 | | | | Incorporated by reference to Exhibit 10.4 to the Company's Form 10-Q for the quarter ended June 30, 2017. |
| 10.14 | | | | Incorporated by reference to Exhibit 10.5 to the Company's Form 10-Q for the quarter ended June 30, 2017. |
|
| | | | |
| 10.15 | | | | Incorporated by reference to Exhibit 10.6 to the Company's Form 10-Q for the quarter ended June 30, 2017. |
| 10.16 | | | | Incorporated by reference to Exhibit 10.1 to the Company's Form 10-Q for the quarter ended June 30, 2018. |
|
| | | | |
| 10.17 | | | | Incorporated by reference to Exhibit 10.1 to the Company's Current Report on Form 8-K filed August 20, 2018. |
| 10.18 | | | | Incorporated by reference to Exhibit 10.1 to the Company's Current Report on Form 8-K filed October 10, 2018. |
| 21 | | | | Filed herewith electronically. |
| 23.1 | | | | Filed herewith electronically. |
| 24.1 | | Powers of Attorney | | Included on signature page. |
| 31.1 | | | | Filed herewith electronically. |
| 31.2 | | | | Filed herewith electronically. |
| 32.1 | | | | Filed herewith electronically. |
| 32.2 | | | | Filed herewith electronically. |
| 101 | | The following financial information from Tennant Company’s annual report on Form 10-K for the period ended December 31, 2018,2019, filed with the SEC on February 28, 2019,27, 2020, formatted in Inline Extensible Business Reporting Language (XBRL)(iXBRL): (i) the Consolidated Statements of Operations for the years ended December 31, 2019, 2018, 2017 and 2016,2017, (ii) the Consolidated Statements of Comprehensive Income for the years ended December 31, 2019, 2018, 2017 and 2016,2017, (iii) the Consolidated Balance Sheets as of December 31, 20182019 and 2017,2018, (iv) the Consolidated Statements of Cash Flows for the years ended December 31, 2019, 2018, 2017 and 2016,2017, (v) the Consolidated Statements of Equity for the years ended December 31, 2019, 2018, 2017 and 2016,2017, and (vi) Notes to the Consolidated Financial Statements. | | Filed herewith electronically. |
| 104 | | Inline Extensible Business Reporting language (iXBRL) for the cover page of this Annual Report on Form 10-K, included in Exhibit 101 | | Filed herewith electronically. |
* Management contract or compensatory plan or arrangement required to be filed as an exhibit to this annual report on Form 10-K.
ITEM 16 – Form 10-K Summary
None.
SIGNATURES
Pursuant to the requirements of Section 13 or 15(d) of the Securities Exchange Act of 1934, the Registrant has duly caused this report to be signed on its behalf by the undersigned, thereunto duly authorized.
|
| | | | | | |
| | | | | TENNANT COMPANY |
| | | | | By | | /s/ H. Chris Killingstad |
| | | | | | | H. Chris Killingstad |
| | | | | | | President, CEO and |
| | | | | | | Board of Directors |
| | | | | Date | | February 28, 201927, 2020 |
Each of the undersigned hereby appoints H. Chris Killingstad and Mary E. Talbott, and each of them (with full power to act alone), as attorneys and agents for the undersigned, with full power of substitution, for and in the name, place and stead of the undersigned, to sign and file with the Securities and Exchange Commission under the Securities Exchange Act of 1934, any and all amendments and exhibits to this annual report on Form 10-K and any and all applications, instruments, and other documents to be filed with the Securities and Exchange Commission pertaining to this annual report on Form 10-K or any amendments thereto, with full power and authority to do and perform any and all acts and things whatsoever requisite and necessary or desirable.
Pursuant to the requirements of Section 13 or 15(d) of the Securities Exchange Act of 1934, this report has been signed by the following persons on behalf of the Registrant and in the capacities and on the dates indicated.
|
| | | | | | |
| By | | /s/ H. Chris Killingstad | | By | | /s/ Donal L. MulliganMaria C. Green |
| | | H. Chris Killingstad | | | | Donal L. MulliganMaria C. Green |
| | | President, CEO and | | | | Board of Directors |
| | | Board of Directors | | Date | | February 28, 201927, 2020 |
| Date | | February 28, 201927, 2020 | | | | |
| | | | | | | |
| By | | /s/ Keith A. WoodwardAndrew Cebulla | | By | | /s/ Steven A. SonnenbergDonal L. Mulligan |
| | | Keith A. WoodwardAndrew Cebulla | | | | Steven A. SonnenbergDonal L. Mulligan |
| | | Senior Vice President, Finance and Corporate Controller; Interim Chief Financial Officer and Interim Principal Accounting Officer | | | | Board of Directors |
| Date | | February 28, 201927, 2020 | | Date | | February 28, 201927, 2020 |
| | | | | | | |
| By | | /s/ Azita Arvani | | By | | /s/ Steven A. Sonnenberg |
| | | Azita Arvani | | | | Steven A. Sonnenberg |
| | Board of Directors | | | | Board of Directors |
| Date | | February 27, 2020 | | Date | | February 27, 2020 |
| | | | | | |
| By | | /s/ William F. Austen | | By | | /s/ David S. Wichmann |
| | William F. Austen | | | | David S. Wichmann |
| | | Board of Directors | | | | David S. WichmannBoard of Directors |
| Date | | February 28, 201927, 2020 | | Date | | Board of DirectorsFebruary 27, 2020 |
| | | | | Date | | February 28, 2019 |
| By | | /s/ William F. Austen | | | | |
| | William F. AustenCarol S. Eicher | | By | | /s/ David Windley |
| | Carol S. Eicher | | | | David Windley |
| | | Board of Directors | | | | David WindleyBoard of Directors |
| Date | | February 28, 2019 | | | | Board of Directors |
| | 27, 2020 | | Date | | February 28, 2019 |
By | | /s/ Carol S. Eicher | | | | |
| | Carol S. Eicher | | | | |
| | Board of Directors | | | | |
Date | | February 28, 2019 | | | | 27, 2020 |
| | | | | | | |