UNITED STATES
SECURITIES AND EXCHANGE COMMISSION
Washington, D.C. 20549
FORM 10-K
(Mark One)
| | | | | |
| þ | ANNUAL REPORT PURSUANT TO SECTION 13 OR 15(d) OF THE SECURITIES EXCHANGE ACT OF 1934 |
For the fiscal year ended December 31, 20222023
OR
| | | | | |
| o | TRANSITION REPORT PURSUANT TO SECTION 13 OR 15(d) OF THE SECURITIES EXCHANGE ACT OF 1934 |
For the transition period from __________ to __________.
Commission File Number 001-16191
TENNANT COMPANY
(Exact name of registrant as specified in its charter)
| | | | | | | | |
| Minnesota | | 41-0572550 |
| State or other jurisdiction of | | (I.R.S. Employer |
| incorporation or organization | | Identification No.) |
10400 Clean Street
Eden Prairie, Minnesota 55344
(Address of principal executive offices)
(Zip Code)
763-540-1200
(Registrant's telephone number, including area code)
Securities registered pursuant to Section 12(b) of the Act:
| | | | | | | | | | | | | | |
| Title of each class | | Trading Symbol(s) | | Name of exchange on which registered |
| Common Stock, par value $0.375 per share | | TNC | | New York Stock Exchange |
| | | | | | | | | | | | | | |
Securities registered pursuant to Section 12(g) of the Act: None |
| Indicate by check mark if the registrant is a well-known seasoned issuer, as defined by Rule 405 of the Securities Act. | þ | Yes | | No |
| Indicate by check mark if the registrant is not required to file reports pursuant to Section 13 or Section 15(d) of the Act. | | Yes | þ | No |
| Indicate by check mark whether the registrant (1) has filed all reports required to be filed by Section 13 or 15(d) of the Securities Exchange Act of 1934 during the preceding 12 months (or for such shorter period that the registrant was required to file such reports), and (2) has been subject to such filing requirements for the past 90 days. | þ | Yes | | No |
| Indicate by check mark whether the registrant has submitted electronically every Interactive Data File required to be submitted pursuant to Rule 405 of Regulation S-T (§232.405 of this chapter) during the preceding 12 months (or for such shorter period that the registrant was required to submit such files). | þ | Yes | | No |
| | | | | | | | | | | | | | |
| Indicate by check mark whether the registrant is a large accelerated filer, an accelerated filer, a non-accelerated filer, a smaller reporting company, or emerging growth company. See definitions of “large accelerated filer,” "accelerated filer," "smaller reporting company," and "emerging growth company" in Rule 12b-2 of the Exchange Act. |
| Large accelerated filer | þ | Accelerated filer | o | |
| Non-accelerated filer | o | Smaller reporting company | o | |
| | Emerging growth company | o | |
| | | | | | | | | | | | | | |
| If an emerging growth company, indicate by check mark if the registrant has elected not to use the extended transition period for complying with any new or revised financial accounting standards provided pursuant to Section 13(a) of the Exchange Act. | | | o | |
| Indicate by check mark whether the registrant has filed a report on and attestation to its management's assessment of the effectiveness of its internal control over financial reporting under Section 404(b) of the Sarbanes-Oxley Act by the registered public accounting firm that prepared or issued its audit report. | | | þ | |
| If securities are registered pursuant to Section 12(b) of the Act, indicate by check mark whether the financial statements of the registrant included in the filing reflect the correction of an error to previously issued financial statements. | | | o | |
| Indicate by check mark whether any of those error corrections are restatements that required a recovery analysis of incentive-based compensation received by any of the registrant's executive officers during the relevant recovery period pursuant to §240.10D-1(b). | | | o | |
| Indicate by check mark whether the registrant is a shell company (as defined in Rule 12b-2 of the Act). | o | Yes | þ | No |
The aggregate market value of the voting and non-voting common equity held by non-affiliates as of June 30, 2022,2023, was $1,091,492,892.$1,486,501,585.
As of January 31, 2023,2024, there were 18,523,93418,620,098 shares of common stock outstanding.
DOCUMENTS INCORPORATED BY REFERENCE
Portions of the registrant’s Proxy Statement for its 2023 annual meeting of shareholders (the “2023 Proxy Statement”) are incorporated by reference in Part III.
Tennant Company
Form 10–K
Table of Contents
TENNANT COMPANY
20222023
ANNUAL REPORT
Form 10–K
PART I
ITEM 1 – Business
General Development of Business
Founded in 1870 by George H. Tennant, Tennant Company ("the Company, we, us, or our"), headquartered in Eden Prairie, Minnesota, is a world leader in designing, manufacturing and marketing of solutions that help create a cleaner, safer and healthier world. Tennant was incorporated as a Minnesota corporation in 1909 and began as a one-man woodworking business, eventually evolving into a successful wood flooring and wood products company, and finally into a manufacturer of floor cleaning equipment. Throughout its history, the Company has remained focused on advancing our industry by aggressively pursuing new technologies and creating a culture that celebrates innovation.
Today, the Company has 11 global manufacturing locations and operates in three geographic areas including the Americas, Europe, Middle East and Africa (EMEA) and Asia Pacific (APAC). We aggregate our operating segments into one reportable segment that consists of the design, manufacture, sale and servicing of products used primarily in the maintenance of nonresidential surfaces. The Company is committed to developing innovative and sustainable solutions that help our customers clean spaces more effectively with high-performance solutions that minimize waste, reduce costs, improve safety and further sustainability goals.
Principal Products, Markets and Distribution
The Company offers products and solutions consisting of manual and mechanized cleaning equipment for both industrial and commercial use, detergent-free and other sustainable cleaning technologies, aftermarket parts and consumables, equipment maintenance and repair services, and business solutions such as financing, rental and leasing programs, and machine-to-machine asset management solutions. The Company is committed to developing cleaning technologies, including autonomous solutions, which increase cleaning productivity. We have strong brand presence in the global markets we serve, offering both premium and mid-tier products for each region to meet customer needs.
The Company's products are used in many types of environments including: factories and warehouses, distribution centers, office buildings, public venues such as arenas and stadiums, office buildings, schools and universities, hospitals and clinics, and more. The Company markets its offerings under the following brands: Tennant®, Nobles®, Alfa Uma Empresa Tennant™, IRIS®, VLX™, IPC, brands, Gaomei and Rongen brands as well as private-label brands. The Company has a portfolio of differentiated technology solutions that includes IRIS® as an asset management solution, ec-H2O NanoClean® as a detergent-free cleaning solution, and ReadySource® as a rapid-drying carpet cleaning technology. The Company's more than 40,000 customers include contract cleaners to whom organizations outsource facilities maintenance, as well as businesses that perform facilities maintenance themselves. The Company reaches these customers through the industry's largest direct sales and service organization and through a strong and well-supported network of authorized distributors worldwide.
The Company'sCompany has an extensive global field service network. We sell products directly in 15 countries and through distributors in more than 100 countries.
Raw Materials and Component Parts
Steel, metal alloys and resin are the primary raw materials used to manufacture our mechanized cleaning equipment. We purchase various component parts, electronics and services used in production, logistics and product development processes from third parties. The Company has experienced cost inflation and constrained supply of certain raw materials and component parts. The Company continues work to minimize the impact of cost inflation and market supply challenges by employing local-for-local and region-for-region manufacturing and sourcing to allow us to manufacture our products closer to our customers. At the same time, our engineering teams are evaluating platform design to allow for available parts and to increase our sourcing flexibility. We expect cost inflation and market supply challenges to continue into 2023 which may negatively impact our financial results.
Intellectual Property
The Company owns a broad range of intellectual property rights in both the United States and a number of foreign countries. Our patents, proprietary technologies and trade secrets, customer relationships, licenses, trademarks, trade names and brand names in the aggregate constitute a valuable asset, but we do not regard our business as being materially dependent upon any single item or category of intellectual property. We take appropriate measures to protect our intellectual property to the extent such intellectual property can be protected.
Research and Development
Research and development expenses include scientific research costs such as salaries, prototypes, shop supplies, testing, technical information technology and administrative expenditures as well as an allocation of corporate costs. We conduct research and development activities to develop new products and to enhance the functionality, effectiveness, ease of use and reliability of our existing products. We believe that our research and development efforts have been, and continue to be, key drivers of our success in the marketplace.
Seasonality
Although the Company’s business is not seasonal in the traditional sense, the percentage of revenues in each quarter typically ranges from 22% to 28% of the total year. The first quarter tends to be at the low end of the range reflecting customers’ initial slow ramp up of capital purchases and the Company’s efforts to close out orders at the end of each year. The second and fourth quarters tend to be toward the high end of the range and the third quarter is typically in the middle of the range.
Major Customers
The Company sells a wide range of products to a diversified base of customers around the world and has no material concentration of credit risk or significant payment terms extended to customers.
Competition
Public industry data concerning global market share is limited; however, through an assessment of validated third-party sources and sponsored third-party market studies, the Company is confident in its position as a world-leading manufacturer of floor maintenance and cleaning equipment. Several global competitors compete with the Company in virtually every geography of the world. However,Additionally, small regional competitors are also significant competitors who vary by country, vertical market, product category or channel. The Company competes primarily on the basis of offering a broad line of high-quality, innovative products supported by an extensive sales and service network in major markets.
Human Capital
As of December 31, 2023, we employed approximately 4,457 employees who are guided by our vision to design, manufacture and market sustainable solutions that help create a cleaner, safer and healthier world.
Ethics and Employee Safety
Human Capital
Tennant Company has a commitment to our employees to foster and uphold a culture of integrity and stewardship as we managestewardship. We ensure that our business. This holds us accountableemployees are not only aware of ethical standards, but actively contribute to our colleagues to care for one another and work together to bring to market sustainable cleaning innovations that empower others to create a cleaner, safer, and healthier world. The following are key human capital measures and objectives that the Company currently focuses on:
Ethics and Employee Safety
maintaining them. As part of this commitment, Tennant conducts annual training and other engagement activities around our Code of Conduct. In 2022,Conduct training that empowers our staff with the knowledge and tools to make ethical decisions in their roles. We understand the importance of fostering an environment where concerns can be raised without fear of reprisal. To facilitate this, we provided anti-bribery and data privacy training to all employees. Tennant Company has multipleoffer various avenues for reporting concerns, including ana dedicated ethics hotline for employees to report concerns.accessible both via phone and online.
We prioritize the health and safety of all employees. We operate under our established safety programs and employ aan experienced team of employee health and safety specialists.specialists to provide support to employees globally. All locations work diligently to meet and/or exceed regulatory standards applicable to each site. Tennant employees are empowered to stop work anytime there is a potential hazard identified. Each site maintains public and confidential ways for employees to report safety concerns to ensure employees feel free to report their concerns.
Talent
We believe attraction, development, engagement, and retention of a diverse group of employees is key to achieving our organizational objectives. We focus on creating a high-performance culture, which includes our annual performance management process for all employees which aligns with our employee and leadership competency frameworks.
To support employee development, we have deployed a number of resources including our philosophy and development tools for all employees via our intranet. We also provide leaders access to on-demand eLearnings and targeted live training sessions. In 2022,addition, we continued enhancingengage in annual talent conversations to help identify, develop, and deploy talent to achieve our safety cultureobjectives and address talent risks.
We believe talent feedback is key to engagement and survey our employees regularly. Also, we provide other feedback and engagement avenues such as all employee quarterly town halls and leadership meetings. We take action to drive improvement in our corporate, manufacturingability to engage and distribution facilities, and in our sales and service organizations through continuous improvement initiatives. In addition to our established safety programs, our teams have continued to execute our enhanced COVID-19 safety protocols in our manufacturing, distribution and office facilities. We continue to meet or exceed our safety goals and initiatives.retain talent.
Diversity, Equity, and Inclusion (DE&I)
Tennant is proudCompany believes that an inclusive and diverse workforce contributes to our business success. The inclusion of diverse perspectives enables innovation and our ability to serve customers. We continue our DE&I focus through strategies which engage and educate our employees, promote inclusion, and drive effective governance.
Tennant Company proudly continues our commitment to be an equal opportunity employer where we foster and maintain an ethical work environment free of discrimination. Employmentemployer. We make employment decisions are madebased on the basis of individual skill, ability, reliability, productivity, and other factors important to performance. In 2022, we formally activated our enterprise-wide Diversity, Equity & Inclusion (DE&I) strategic initiative which is governed under our enterprise strategy office. This initiative is primarily focused on DE&I education, maturing our governance and growing our Employee Resources Group (ERG), which provides avenues for employee input around our strategy.
Diversity in Governance
As of December 31, 2022, women represented 67%Women represent 50% of our executive management team and 33% of our Board of Directors.Directors as of December 31, 2023.
Gender Equitable Pay
Tennant Company annually performs a gender wage gap for its United States employees that controls for title, grade and work location, which are legitimate and non-discretionary reasons for pay differences. The most recent assessment found that the median total income for females was 100.5%99.6% of the median total income for males, suggesting there is no evidence of a gender pay gap in the United States at Tennant Company.
The following table represents employees by gender and region as of December 31, 2022:
| | | | | | | | | | | |
| Female | Male | Total |
| Americas | 414 | 1,784 | 2,198 |
| Europe, Middle East, Africa | 431 | 1,208 | 1,639 |
| Asia Pacific | 147 | 315 | 462 |
| Total | 992 | 3,307 | 4,299 |
Talent
Attraction, development, engagement and retention of talent is key to achieving our organizational objectives. We focus on creating a high-performance culture through our annual performance management process, which aligns with our employee and leadership competency framework. We engage in annual talent conversations to identify, develop and deploy talent to achieve our objectives and address talent risks.
Employee Gender Statistics
The following table represents employees by region and gender as of December 31, 2023:
| | | | | | | | | | | |
| Female | Male | Total |
| Americas | 439 | 1,910 | 2,349 |
| Europe, Middle East, Africa | 446 | 1,195 | 1,641 |
| Asia Pacific | 140 | 327 | 467 |
| Total | 1,025 | 3,432 | 4,457 |
Total Rewards
Tennant Company’s philosophy is to reward employees competitively for the work they perform consistent with position, skill level, experience, knowledge and geographic location. WeEach year, we evaluate the competitiveness of our pay levels annually against relevant labor markets and adjust our programs as appropriate. We offer a comprehensive total rewards package to our employees that includes pay, benefits, recognition, and well-being programs which are tailored by geographic location, statutory requirements, and competitive practice as appropriate.practice.
Available Information
The Company's internet address is www.tennantco.com. The Company makes available free of charge, through the Investor Relations website at investors.tennantco.com, its annual report on Form 10-K, quarterly reports on Form 10-Q, current reports on Form 8-K and amendments to those reports filed or furnished pursuant to Section 13(a) or 15(d) of the Securities Exchange Act of 1934, as amended, as soon as reasonably practicable when such material is filed electronically with, or furnished to, the Securities and Exchange Commission (“SEC”). The SEC also maintains an internet site that contains reports, proxy and information statements, and other information, which can be accessed at sec.gov.
Information About Our Executive Officers
The list below identifies those persons designated as executive officers of the Company, including their age, positions held with the Company and their business experience during the past five or more years.
Barb Balinski, Senior Vice President, Innovation and Technology
Barb Balinski (59)(60) joined the Company in 2018 as Vice President of Engineering and in March 2021, she was named Senior Vice President, Innovation and Technology, leading Research & Development (R&D), Marketing, and Information Technology (IT) functions for Tennant Company. Prior to joining Tennant, BarbMs. Balinski held leadership positions of increasing responsibility with the engineering team for the Integrated Business Units at Whirlpool Corporation, a multinational manufacturer of home appliances, from 2005 to 2017, most recently as Director, Product Development, from 2013 to 2017. Prior to Whirlpool Corporation, she spent eleven years with Saturn Corporation, a subsidiary of General Motors.
David W. Huml, President and Chief Executive Officer
David W. Huml (54)(55) has served as the Company's President and Chief Executive Officer since March 2021, after serving as Chief Operating Officer from March 2020 to March 2021. Mr. Huml joined the Company in November 2014 as Senior Vice President, Global Marketing and was named President and Chief Executive Officer March 1, 2021. In January 2016, he also assumed oversight for the Company's APAC business unit, and in January 2017, he assumed oversight for the Company's EMEA business. From 2006 to October 2014, he held various positions with Pentair plc, a global manufacturer of water and fluid solutions, valves and controls, equipment protection and thermal management products, most recently as Vice President, Applied Water Platform. From 1992 to 2006, he held various positions with Graco Inc., a designer, manufacturer and marketer of systems and equipment to move, measure, control, dispense and spray fluid and coating materials, including Worldwide Director of Marketing, Contractor Equipment Division.
Carol E. McKnight, Senior Vice President, Chief Administrative Officer
Carol E. McKnight (55) joined the Company in June 2014 as Senior Vice President of Global Human Resources. In 2017, she was named Senior Vice President and Chief Administrative Officer. Prior to joining the Company, she was Vice President of Human Resources at Alliant Techsystems (ATK) where she held divisional and corporate leadership positions in the areas of compensation, talent management, talent acquisition and general human resource management from 2002 to 2014. Prior to ATK, she was with New Jersey-based NRG Energy, Inc.
Kristin A. Erickson, Senior Vice President, General Counsel and Corporate Secretary
Kristin A. Erickson (50)(51) has served as the Company's Senior Vice President, General Counsel and Corporate Secretary since December 2020. Ms. Erickson joined the Company's legal department in April 2008, serving in roles of increasing responsibility, including as Vice President, Deputy General Counsel and Chief Compliance Officer from 2019 to 2020, and as Interim General Counsel and Corporate Secretary in 2020. Prior to joining Tennant in 2008, she served as Senior Counsel and Assistant Secretary for MoneyGram International, Inc., from 2004 to 2008. She started her career as a corporate attorney for Lindquist & Vennum, PLLP (n/k/a Ballard Spahr LLP).
Fay West, Senior Vice President, Chief Financial Officer
Fay West (53)(54) joined the Company in April 2021 as Senior Vice President and Chief Financial Officer. Prior to joining Tennant, she was Senior Vice President and Chief Financial Officer of SunCoke Energy, Inc., a raw material processing and handling company, from 2014 to 2021. Before joining SunCoke Energy, Inc., in 2011, as Vice President and Controller, she was Assistant Controller at United Continental Holdings, Inc. Prior to that role, she served in several leadership roles at PepsiAmericas, Inc., including Vice President of Accounting and Financial Reporting, and Director of Financial Reporting. Prior to joining PepsiAmericas, Inc., she was Vice President and Controller of GATX Rail Company.
Richard H. Zay, Senior Vice President, Chief Commercial Officer
Richard H. Zay (52)(53) has served as the Company's Senior Vice President, Chief Commercial Officer since March 2021. Mr. Zay joined the Company in June 2010 as Vice President, Global Marketing and was named Senior Vice President, Global Marketing in October 2013 and Senior Vice President of the Americas business unit for the Company in 2014. In 2018, he assumed responsibility for Tennant Research and Development as well. From 2006 to June 2010, he held various positions with Whirlpool Corporation, most recently as General Manager, KitchenAid Brand. From 1993 to 2006, he held various positions with Maytag Corporation, including Vice President, Jenn-Air Brand, Director of Marketing, Maytag Brand, and Director of Cooking Category Management.
Brock R. Christianson, Senior Vice President, Chief Human Resources Officer
Brock R. Christianson (54) joined the Company in November 2023 as Senior Vice President, Chief Human Resources Officer. From 2017 to October 2023, Mr. Christianson served in various Human Resources Vice President roles at Thrivent, a Fortune 500 financial services company. He held senior positions at Honeywell International from 2011 to 2017, including global Vice President of HR for the Environmental, Combustion, and Controls business unit. From 1998 to 2011, he worked at Medtronic, a global healthcare technology leader, where he held HR leadership roles in corporate, business units, and EMEA. Prior to Medtronic, he held HR and consulting roles with Emerson Electric and Ernst & Young.
ITEM 1A – Risk Factors
The following are risk factors known to us that could materially adversely affect our business, financial condition or operating results.
Macroeconomic Risks
We may encounter financial difficulties if the United States or other global economies experience an additional or continued long-term economic downturn, decreasing the demand for our products and negatively affecting our sales growth.
Our product sales are sensitive to declines in capital spending by our customers. Decreased demand for our products could result in decreased revenues, profitability and cash flows and may impair our ability to maintain our operations and fund our obligations to others. In the event of a continued long-term economic downturn in the U.S. or other global economies, our revenues could decline to the point that we may have to take cost-saving measures, such as restructuring actions. In addition, other fixed costs would have to be reduced to a level that is in line with a lower level of sales. A long-term economic downturn that puts downward pressure on sales could also negatively affect investor perception relative to our publicly stated profit targets.
Uncertainty surrounding the impacts and duration of the COVID-19 pandemic.
The coronavirus ("COVID-19") pandemic continues to have a significant disruptive impact on global economies, supply chains and industrial production. We have effectively managed our global operations throughout the pandemic, implementing rigorous protocols focused on the health and safety of our employees and ensuring business continuity across our supplier, manufacturing and distribution networks. However, the impact of COVID-19, or any variant thereof, on our business and financial performance depends on evolving factors that we cannot accurately predict, including labor shortages, supply chain constraints, additional government mandated lockdowns or similar restrictions, and the pace of economic recovery stemming from the COVID-19 pandemic.
Our operations could be adversely affected by geopolitical tensions or health epidemics.
We may be adversely impacted by factors outside of our control, including geopolitical tensions or public health epidemics. Geopolitical tensions, acts of violence or war, or other international conflicts may also adversely impact our operations. Public health epidemics, such as the COVID-19 pandemic, have impacted economic markets, manufacturing operations, supply chains, employment and consumer behavior in nearly every geographic region and industry across the world, and we have been, and may in the future be, adversely affected as a result.
Our global operations are subject to laws and regulations that impose significant compliance costs and create reputational and legal risk.
Due to the international scope of our operations, we are subject to a complex system of commercial, tax, compliance and trade regulations around the world. Recent years have seen an increase in the development and enforcement of laws regarding trade, tax compliance, data-privacy, sustainability, labor and safety and anti-corruption, including the U.S. Foreign Corrupt Practices Act, and similar laws from other countries. Our numerous foreign subsidiaries and affiliates are governed by laws, rules and business practices that differ from those of the U.S., but because we are a U.S.-based company, oftentimes they are also subject to U.S. laws which can create a conflict. Despite our due diligence, there is a risk that we do not have adequate resources or comprehensive processes to stay current on changes in laws or regulations applicable to us worldwide and maintain compliance with those changes. Increased compliance requirements may lead to increased costs and erosion of desired profit margin. As a result, it is possible that the activities of these entities may not comply with U.S. laws or business practices or our Business Ethics Guide.Code of Conduct. Violations of the U.S. or local laws may result in severe criminal or civil sanctions, could disrupt our business, and result in an adverse effect on our reputation, business and results of operations or financial condition. We cannot predict the nature, scope or effect of future regulatory requirements to which our operations might be subject or the manner in which existing laws might be administered or interpreted.
Industry Risks
We may be unable to take advantage of product pricing due to the competitive marketplace and increased price sensitivity.
Simplification of our customer product pricing is a key initiative to reduce the complexity in which we operate. The current competitive landscape, coupled with macroeconomic factors such as inflation, could impact our ability to achieve our pricing targets and influence demand. These pressures, along with internal constraints, may limit our ability to sell our products at our expected prices and may result in a change to the mix of product offerings that affect gross margin rates. Increasing our prices in this competitive market, where customers are very price sensitive, could have an adverse effect on our financial condition or operating results.
We are subject to competitive risks associated with developing innovative products and technologies, including, but not limited to, our inability to expand as rapidly or aggressively in the global market as our competitors, our customers ceasing to pay for innovation and competitive challenges to our products, technology and the underlying intellectual property.
Our products are sold in competitive markets throughout the world. Competition is based on product features and design, brand recognition, reliability, durability, technology, breadth of product offerings, price, customer relationships and after-sale service. Although we believe that the performance and price of our products will produce competitive solutions for our customers’ needs, certain products are priced higher than our competitors’ products. This is due to our dedication to innovation and continued investments in research and development. We believe that customers will pay for the innovations and quality in our products. However, it may be difficult for us to compete with lower priced products offered by our competitors and there can be no assurance that our customers will continue to choose our products over products offered by our competitors. If our products, markets and services are not competitive, we may experience a decline in sales volume, an increase in price discounting and a loss of market share, which would adversely impact our revenues, margin and the success of our operations.
Third parties may also initiate litigation to challenge the validity of our patents or claims, allege that we infringe upon their patents, violate our patents or they may use their resources to design comparable products that avoid infringing our patents. Regardless of whether such litigation is successful, such litigation could
significantly increase our costs and divert management’s attention from the operation of our business, which could adversely affect our results of operations and financial condition.
Disruption in the availability of, quality, or increases in the cost of, raw materials and components that we purchase or labor required to manufacture our products could negatively impact our operating results or financial condition.
Our sales growth and expanding geographical footprint, coupled with suppliers’ potential credit issues, could lead to an increased risk of a breakdown in our supply chain. Our use of sole-source vendors for certain parts creates a concentration risk. There is an increased risk of defects due to the highly configured nature of our purchased component parts that could result in quality issues, returns or production slowdowns. In addition, modularization may lead to more sole-sourced products, and as we seek to outsource the design of certain key components, we risk loss of proprietary control and becoming more reliant on a sole source. There is also a risk that the vendors we choose to supply our parts and equipment fail to comply with our quality expectations, thus damaging our reputation for quality and negatively impacting sales.
Global supplier production for various component parts is limited. We have experienced significantmay experience disruption of the supply of key component parts. We expect costCost inflation and market supply challenges to continue which may negatively impact our financial results.
We have and may continue to experience higher than normal wage inflation due to skilled labor shortages. The labor shortages have unfavorably impacted our gross profit margins and could continue to do so if actions we are taking are not effective at offsetting these rising costs. Changes and uncertainties related to government fiscal and tax policies, including increased duties, tariffs, or other restrictions, could adversely affect demand for our products, the cost of the products we manufacture or our ability to cost-effectively source raw materials, all of which could have a negative impact on our financial results.
Increasing cost pressures could negatively impact our ability to achieve our strategic objectives and affect our financial results.
We are dependent on key suppliers to make certain materials available at a contracted price. Labor, overhead, and material costs have increased and we may not be able to offset these increased manufacturing costs with a higher finished product price. We also may not be able to push those direct cost increases onto our customers in a timely manner given the competitive environment. A decline in demand for our products may have a direct impact on our ability to achieve better pricing through volume discounts.
We are subject to product liability claims and product quality issues that could adversely affect our operating results or financial condition.
Our business exposes us to potential product liability risks that are inherent in the design, manufacturing and distribution of our products. If products are used incorrectly by our customers, injury may result leading to product liability claims against us. Some of our products or product improvements may have defects or risks that we have not yet identified that may give rise to product quality issues, liability and warranty claims. Quality issues may also arise due to changes in parts or specifications with suppliers and/or changes in suppliers. If product liability claims are brought against us for damages that are in excess of our insurance coverage or for uninsured liabilities and it is determined we are liable, our business could be adversely impacted. Any losses we suffer from any liability claims, and the effect that any product liability litigation may have upon the reputation and marketability of our products, may have a negative impact on our business and operating results. We could experience a material design or manufacturing failure in our products, a quality system failure, other safety issues, or heightened regulatory scrutiny that could warrant a recall of some of our products. Any unforeseen product quality problems could result in loss of market share, reduced sales and higher warranty expense.
Operational Risks
Our ability to effectively operate our Company could be adversely affected if we are unable to attract and retain key personnel and other highly skilled employees, provide employee development opportunities and create effective succession planning strategies.
Our growth strategy, expanding global footprint, changing workforce demographics and increased improvements in technology and business processes designed to enhance the customer experience are putting increased pressure on human capital strategies designed to attract, retain and develop top talent.
Our continued success will depend on, among other things, the skills and services of our executive officers and other key personnel. Our ability to attract and retain highly qualified managerial, technical, manufacturing, research, sales and marketing personnel also impacts our ability to effectively operate our business. As companies grow and increase their hiring activities, there is an inherent risk of increased employee turnover and the loss of valuable employees in key positions, especially in emerging markets. We believe the increased loss of key personnel within a concentrated region could adversely affect our sales performance.
We may not be able to develop or manage strategic planning and growth processes or the related operational plans to deliver on our strategies and establish a broad organization alignment, thereby impairing our ability to achieve future performance expectations.
We are continuing to refine our global company strategy to guide our next phase of performance as our structure has become more complex. We continue to consolidate and reallocate resources as part of our ongoing efforts to optimize our cost structure and to drive synergies. Our operating results may be negatively impacted if we are unable to implement new processes and manage organizational changes, which include changes to our go-to-market strategy, systems and processes; simultaneous focus on expense control and growth; and introduction of alternative cleaning methods. In addition, if we do not effectively realize and sustain the benefits that these transformations are designed to produce, we may not fully realize the anticipated savings of these actions or they may negatively impact our ability to serve our customers or meet our strategic objectives.
We may not be able to upgrade and evolve our information technology systems as quickly as we wish and we may encounter difficulties as we upgrade and evolve these systems to support our growth strategy and business operations, which could adversely impact our abilities to accomplish anticipated future cost savings and better serve our customers.
We have many information technology systems that are important to the operation of our business and are in need of upgrading in order to effectively implement our enterprise strategy. Given our greater emphasis on customer-facing technologies, we may not have adequate resources to upgrade our systems at the pace which the current business environment demands. Additionally, significantly upgrading and evolving the capabilities of our existing systems, including ERP modernization, could lead to inefficient or ineffective use of our technology due to lack of training or expertise in these evolving technology systems. These factors, among other things, could lead to significant expenses, adversely impacting our results of operations and hindering our ability to offer better technology solutions to our customers.
We may encounter risks to our IT infrastructure, such as access and security, that may not be adequately designed to protect critical data and systems from theft, corruption, unauthorized usage, viruses, sabotage or unintentional misuse.
Global cybersecurity threats and incidents can range from uncoordinated individual attempts to gain unauthorized access to IT systems to sophisticated and targeted measures known as advanced persistent threats, directed at the Company, its products and its customers. We experience cybersecurity threats and incidents from time to time; however, to date, none have been material. We seek to deploy comprehensive measures to deter, prevent, detect, react to and mitigate these threats, including identity and access controls, data protection, vulnerability assessments, continuous monitoring of our IT networks and systems and maintenance of backup and protective systems.
Despite these efforts, cybersecurity incidents, depending on their nature and scope, could potentially result in the misappropriation, destruction, corruption or unavailability of critical data and confidential or proprietary information (our own or that of third parties) and the disruption of business operations. The potential consequences of a material cybersecurity incident include financial loss, reputational damage, litigation with third parties, theft of intellectual property, diminution in the value of our investment in research, development and engineering, and increased cybersecurity protection and remediation costs due to the increasing sophistication and proliferation of threats, which in turn could adversely affect our competitiveness and results of operations.
We may be unable to conduct business if we experience a significant business interruption in our computer systems, manufacturing plants or distribution facilities for a significant period of time.
We rely on our computer systems, manufacturing plants and distribution facilities to efficiently operate our business. If we experience an interruption in the functionality in any of these items for a significant period of time for any reason, we may not have adequate business continuity planning contingencies in place to allow us to continue our normal business operations on a long-term basis. In addition, the increase in customer-facing technology raises the risk of a lapse in business operations. Therefore, significant long-term interruption in our business could cause a decline in sales, an increase in expenses and could adversely impact our financial results.
Our ability to manage the health and safety of our global workforce may lead to increased business disruption and financial penalties.
We remain focused on the health and safety measures that impact our business from a manufacturing perspective. The Company had to adjust quickly to new working conditions as a result of the COVID-19 pandemic, including making enhancements as new health information was received. In the future, the Company may not adapt to new health crises quickly enough, resulting in a decrease in resource capacity and overall health and wellness of our workforce that could cause fines, reputational damage, or business disruptions. Also, there may be further enhancements and costs to the Company related to any new health guidelines and protocols. Our manufacturing teams monitor the effectiveness of our wellness and safety programs, while theprograms. The Company continuesmay be required to implement more tailored health initiatives for those working from home. Managing additionalmake enhancements and incur costs related to any new health guidelines and protocols for theto adapt to new health and safety of our employeescrises, which may adversely affect our business, financial conditions, or operating results.
We may consider acquisitions of suitable candidates to accomplish our growth objectives. We may not be able to successfully integrate the businesses we acquire to achieve operational efficiencies, including synergistic and other benefits of acquisition.
We may consider, as part of our growth strategy, supplementing our organic growth through acquisitions of complementary businesses or products. We have engaged in acquisitions in the past and we may determine that future acquisitions may provide meaningful opportunities to grow our business and improve profitability. Acquisitions allow us to enhance the breadth of our product offerings and expand the market and geographic participation of our products and services.
However, our success in growing by acquisition is dependent upon identifying businesses to acquire, integrating the newly acquired businesses with our existing businesses and complying with the terms of our credit facilities. We may incur difficulties in the realignment and integration of business activities when assimilating the operations and products of an acquired business or in realizing projected efficiencies, cost savings, revenue synergies and profit margins. Acquired businesses may not achieve the levels of revenue, profit, productivity or otherwise perform as expected. We are also subject to incurring unanticipated liabilities and contingencies associated with an acquired entity that are not identified or fully understood in the due diligence process. Current or future acquisitions may not be successful or accretive to earnings if the acquired businesses do not achieve expected financial results.
In addition, we may record significant goodwill or other intangible assets in connection with an acquisition. We are required to perform impairment tests at least annually and whenever events indicate that the carrying value may not be recoverable from future cash flows. If we determine that any intangible asset values need to be written down to their fair values, this could result in a charge that may be material to our operating results and financial condition.
Inadequate funding or insufficient innovation of new technologies may result in an inability to develop and commercialize new innovative products and services.
We strive to develop new and innovative products and services to differentiate ourselves in the marketplace. New product development relies heavily on our financial and resource investments in both the
short-term and long-term. If we fail to adequately fund product development projects or fund a project which ultimately does not gain the market acceptance we anticipated, we risk not meeting our customers' expectations, which could result in decreased revenues, declines in margin and loss of market share.
ITEM 1B – Unresolved Staff Comments
None.
ITEM 1C – Cybersecurity
Risk Management and Strategy
We recognize the critical importance of developing, implementing, and maintaining robust cybersecurity processes to safeguard our information systems and protect the confidentiality, integrity, and availability of our data. Our approach to assessing, prioritizing, and effecting cybersecurity processes and projects is based on standards from the National Institute of Standards and Technology (NIST).
We have established an enterprise risk management (ERM) program that considers our enterprise strategy, information from internal stakeholders, and information from external sources (e.g., emerging risks and trends, evaluations by third parties, and best practices) to identify, assess, categorize, and monitor risks including cybersecurity risks. The ERM program develops enterprise risk profiles to address individual risk drivers, develop action plans, and monitor against key risk indicators. At least annually, the ERM program is presented to our Board, Audit Committee, and members of management.
We have strategically integrated cybersecurity risk management into our broader ERM program to promote a company-wide culture of cybersecurity risk management. This integration ensures that cybersecurity considerations are an integral part of our decision-making processes. Our strategy includes regular employee training and awareness on cybersecurity risks and related best practices, required password complexity, the use of multi-factor authentication, information security protocols, anti-virus and anti-ransomware software, a patch management program, the execution of table top exercises on a periodic basis, established policies and protocols for cyber incident response planning and reporting, and ongoing internal cybersecurity testing. Our risk management team works closely with our IT department to continuously evaluate and address cybersecurity risks in alignment with our business objectives and operational needs.
We test our ability to respond to cybersecurity incidents on a recurring basis. Additionally, we engage third-party service providers to assist with the ongoing monitoring for cybersecurity events and incidents, as well as to complete risk quantification analysis and perform penetration and vulnerability testing. If any gaps are identified, the third-party service providers also assist with incident assessment and response. We conduct thorough up-front security assessments of all third-party providers before engagement, led by our Vice President, Chief Information Office (CIO) and our cybersecurity team, and we maintain ongoing monitoring to ensure compliance with our cybersecurity standards. This approach is designed to mitigate risks related to security incidents originating from third-parties.
We have not encountered cybersecurity incidents or identified risks from cybersecurity threats that have materially impaired our operations or financial standing.
Governance
Within our organization, we have a management team responsible for assessing and managing cybersecurity risks. The team is led by our CIO and consists of the Cyber Security Incident Response Team (CSIRT) and internal audit personnel. The CSIRT is comprised of IT management and experienced cybersecurity personnel. The role of the CSIRT is to promptly handle an incident so that containment, investigation, and recovery can occur quickly. Where third-party services are leveraged, they ensure they are engaged as necessary. The CSIRT Leader oversees and prioritizes actions during an incident's detection, analysis, and containment. They are also responsible for conveying the special requirements of high severity incidents to the rest of the organization as well as communicating potential impacts to the CIO. Additionally, they are responsible for understanding the SLAs in place with third parties, and the role third parties may play in specific response scenarios. Our CIO has more than 30 years of experience in IT, enterprise security, and cyber risk management and has previously held global IT infrastructure and business solutions roles, including nearly 20 years in such positions in the manufacturing industry. In addition, our CSIRT Leader has 30 years of
technology and cybersecurity experience and has previously held data security and global IT infrastructure positions at risk management and asset protection services companies. Effective February 2, 2024, our CIO has retired from employment and continues to serve as our CIO as a contractor through April 2024. During this time, he will continue his existing duties including oversight and management of cybersecurity risks. An active search is underway for a new CIO.
The CIO and CSIRT, in combination with the Senior Vice President, Technology and Innovation and CEO, play a pivotal role in informing the Audit Committee of the Board of Directors on cybersecurity risks. The Audit Committee is central to the Board's oversight of cybersecurity risks and bears the primary responsibility for this domain. The Audit Committee is composed of board members with diverse expertise including risk management, technology, and finance, equipping them to oversee cybersecurity risks effectively.
The Vice President, CIO provides comprehensive quarterly briefings to the Audit Committee. These briefings encompass a broad range of topics, including:
•Current cybersecurity landscape and emerging threats;
•Status of ongoing cybersecurity initiatives and strategies;
•Incident reports and learnings from any cybersecurity events; and
•Compliance with regulatory requirements and industry standards.
In addition to our quarterly meetings, the Audit Committee, CIO and CEO maintain an ongoing dialogue regarding emerging or potential cybersecurity risks. The CIO and CEO provide updates on any significant developments in the cybersecurity domain, ensuring the Board's oversight is proactive and responsive. The Audit Committee actively participates in strategic decisions related to cybersecurity, as well as tabletop exercises for tactical response readiness. This involvement ensures that cybersecurity considerations are integrated into the broader strategic objectives of Tennant Company. The Audit Committee conducts an annual review of the Company's cybersecurity posture and the effectiveness of its risk management strategies. This review helps in identifying areas for improvement and ensuring the alignment of cybersecurity efforts with the overall risk management framework.
ITEM 2 – Properties
The Company’s corporate offices are owned by the Company and are located in the Minneapolis, Minnesota metropolitan area. Manufacturing facilities located in Minneapolis,Golden Valley, Minnesota; Holland, Michigan; Uden, The Netherlands; and the Italian cities of Venice, Cremona and Reggio Emilia and in the Province of Padua are owned by the Company. Manufacturing facilities located in Louisville, Kentucky; São Paulo, Brazil; Hefei, China; and another facility in the Province of Padua are leased to the Company. In addition, IPC Group (IPC) useswe use a dedicated, third-party plant in Germany that specially manufactures heavy–duty stainless steel scrubbers and sweepers to IPC designs. IPC also owns a minor tools and supplies assembly operation in China to service local customers. The facilities are in good operating condition, suitable for their respective uses and adequate for current needs.
Sales offices, warehouse and storage facilities are leased in various locations in the United States, Canada, Mexico, Brazil, Portugal, Spain, Italy, Germany, France, The Netherlands, Belgium, Norway, the United Kingdom, Japan, China, India, Australia, and New Zealand. The Company’s facilities are in good operating condition, suitable for their respective uses and adequate for current needs.
Further information regarding the Company’s property and lease commitments is included in Note 15 to the consolidated financial statements.
ITEM 3 – Legal Proceedings
There are no material pending legal proceedings other than ordinary litigation incidental to the Company’s business.
ITEM 4 – Mine Safety Disclosures
Not applicable.
PART II
ITEM 5 – Market for Registrant’s Common Equity, Related Shareholder Matters and Issuer Purchases of Equity Securities
MARKET INFORMATION – Tennant's common stock is traded on the New York Stock Exchange, under the ticker symbol TNC. As of February 10, 2023,2024, there were 269254 shareholders of record.
DIVIDEND INFORMATION – Cash dividends on Tennant’s common stock have been paid for 7879 consecutive years. Tennant’s annual cash dividend payout increased for the 5152stnd consecutive year to $1.015$1.075 per share in 2022,2023, an increase of $0.075$0.06 per share over 2021.2022. Dividends are generally declared each quarter. On February 14, 2023,13, 2024, the Company announced a quarterly cash dividend of $0.265$0.28 per share payable March 15, 2023,2024, to shareholders of record on March 3, 2023.February 29, 2024.
DIVIDEND REINVESTMENT OR DIRECT DEPOSIT OPTIONS – Shareholders have the option of reinvesting quarterly dividends in additional shares of Company stock or having dividends deposited directly to a bank account. The Transfer Agent should be contacted for additional information.
TRANSFER AGENT AND REGISTRAR – Shareholders with a change of address or questions about their account may contact:
Equiniti Trust Company
Shareowner Services
P.O. Box 64874
St. Paul, MN 55164-0854
(800) 468-9716
SHARE REPURCHASES – Share repurchases are made from time to time in the open market or through privately negotiated transactions. During the twelve months ended December 31, 2022,2023, the Company paid $5.0$21.7 million to repurchase 79,756290,920 shares of its common stock. The most recent share repurchase program approved by the Board of Directors on October 31, 2016 authorized the repurchase of 1,000,000 shares of our common stock. This is in addition to the 112,333 shares that remain authorized under the prior program that was authorized by the Board of Directors on June 22, 2015.
| | | | | | | | | | | | | | | | | | | | | | | |
For the Quarter Ended
December 31, 2022 | Total Number of Shares Purchased(a) | | Average Price Paid
Per Share | | Total Number of Shares Purchased as Part
of Publicly Announced Plans or
Programs | | Maximum Number of Shares that May
Yet Be Purchased Under the Plans or
Programs |
| October 1–31, 2022 | 18 | | $ | 56.56 | | | 0 | | 1,192,089 |
| November 1–30, 2022 | 50,067 | | $ | 62.80 | | | 49,907 | | 1,142,182 |
| December 1–31, 2022 | 29,849 | | $ | 62.46 | | | 29,849 | | 1,112,333 |
| Total | 79,934 | | $ | 62.67 | | | 79,756 | | 1,112,333 |
| | | | | | | | | | | | | | | | | | | | | | | |
For the Quarter Ended
December 31, 2023 | Total Number of Shares Purchased(a) | | Average Price Paid
Per Share | | Total Number of Shares Purchased as Part
of Publicly Announced Plans or
Programs | | Maximum Number of Shares that May
Yet Be Purchased Under the Plans or
Programs |
| October 1–31, 2023 | 69,447 | | $ | 75.19 | | | 69,447 | | 877,788 |
| November 1–30, 2023 | 53,979 | | $ | 84.66 | | | 53,332 | | 824,456 |
| December 1–31, 2023 | 3,043 | | $ | 86.06 | | | 3,043 | | 821,413 |
| Total | 126,469 | | $ | 79.50 | | | 125,822 | | 821,413 |
(a)Includes 178647 shares delivered or attested to in satisfaction of the exercise price and/or tax withholding obligations by employees who exercised stock options or restricted stock under employee share-based compensation plans.
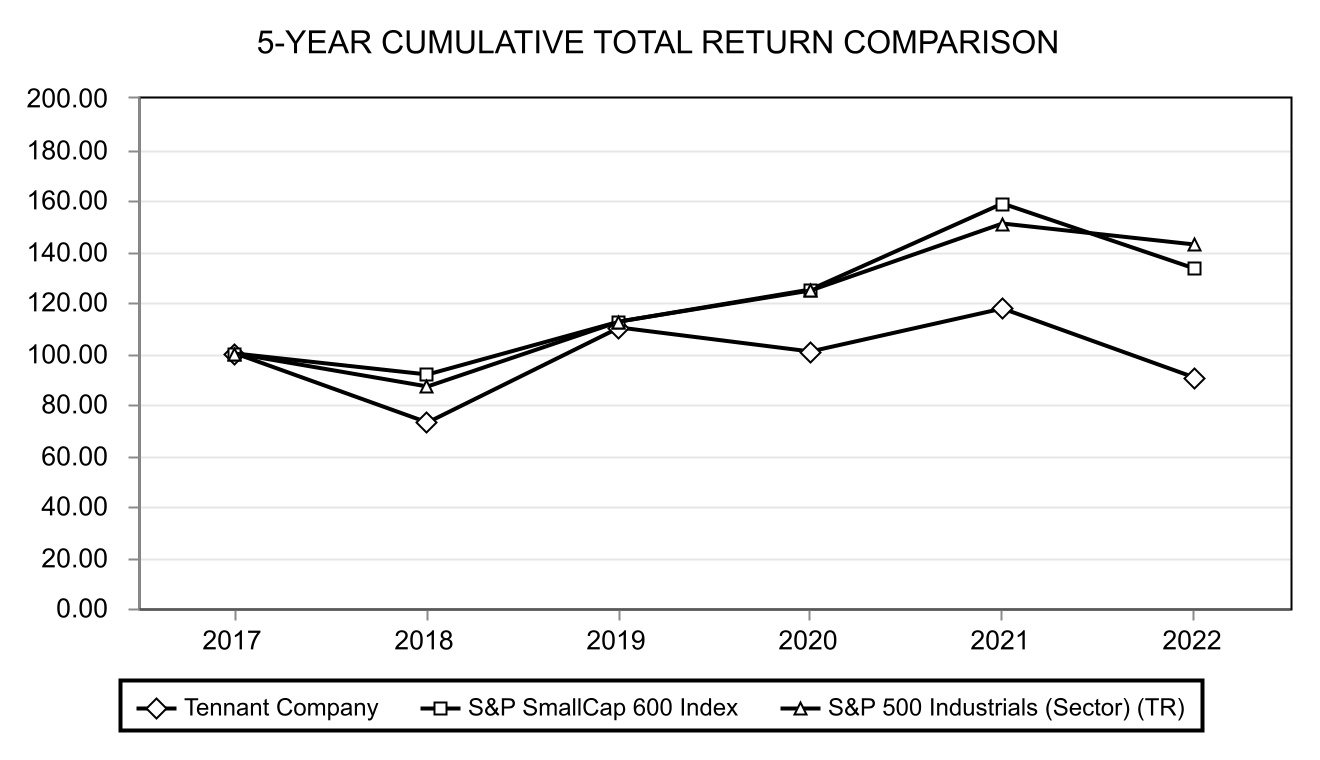
2017,2018, including the reinvestment of all dividends.
| | 2017 | | 2018 | | 2019 | | 2020 | | 2021 | | 2022 |
| 2018 | | | 2018 | | 2019 | | 2020 | | 2021 | | 2022 | | 2023 |
| Tennant Company | Tennant Company | $ | 100 | | | $ | 73 | | | $ | 110 | | | $ | 100 | | | $ | 117 | | | $ | 91 | |
| S&P SmallCap 600 | S&P SmallCap 600 | $ | 100 | | | $ | 92 | | | $ | 112 | | | $ | 125 | | | $ | 159 | | | $ | 133 | |
| S&P 500 Industrials (Sector) (TR) | S&P 500 Industrials (Sector) (TR) | $ | 100 | | | $ | 87 | | | $ | 112 | | | $ | 125 | | | $ | 151 | | | $ | 143 | |
Source: Zacks Investment Research, Inc.
ITEM 6 – [Reserved]
ITEM 7 – Management’s Discussion and Analysis of Financial Condition and Results of Operations
The following Management's Discussion and Analysis of Financial Condition and Results of Operations (MD&A) provides a comparison of the Company's results of operations, as well as liquidity and capital resources for the years ended December 31, 20222023 and 2021.2022. The MD&A should be read in conjunction with the Company's consolidated financial statements and notes included in Item 8 of this Annual Report. Throughout this MD&A, the Company refers to measures used by management to evaluate performance, including financial measures that are not defined under generally accepted accounting principles (GAAP) in the U.S. Net sales excluding foreign currency translation (i.e., organic sales) is not a measure of financial performance under GAAP; however, the Company believes it is useful in understanding its financial results and provides comparable measures for understanding the operating results of the Company between different periods.
The year-over-year comparisons in this MD&A are as of and for the years ended December 31, 20222023 and December 31, 2021,2022, unless stated otherwise. The discussion of 20202021 results and related year-over-year comparisons as of and for the years ended December 31, 20212022 and December 31, 20202021 are found in Part II, Item 7, "Management's Discussion and Analysis of Financial Condition and Results of Operations," of our Form 10-K for the year ended December 31, 2021.2022.
Overview
Tennant Company is a world leader in designing, manufacturing and marketing solutions that empower customers to achieve quality cleaning performance, reduce environmental impact and help create a cleaner, safer, healthier world. The Company is committed to creating and commercializing breakthrough, sustainable cleaning innovations to enhance its broad suite of products, including floor maintenance and cleaning equipment, detergent-free and other sustainable cleaning technologies, aftermarket parts and consumables, equipment maintenance and repair service, and asset management solutions. Our products are used in many types of environments, including factories and warehouses, distribution centers, office buildings, public venues such as arenas and stadiums, schools and universities, hospitals and clinics, and more. Customers include contract cleaners to whom organizations outsource facilities maintenance as well as businesses that perform facilities maintenance themselves. The Company reaches these customers through the industry's largest direct sales and service organization and through a strong and well-supported network of authorized distributors worldwide.
Macroeconomic Events
Supply chain challenges continue to impact the global economy. Our operating performance throughout 2023 has benefited from fewer supply chain disruptions enabling us to obtain key component parts, increase production and reduce backlog. We continue to actively manage our businessaddress and adapt to respond to the COVID-19 pandemic and related impacts. Governments across the world have taken actions, including stay-at-home orders, to limit the spread of COVID-19. These actions, specifically in China, have and may continue to reduce operating activities and negatively impact financial results.
We continue to experience disruption in the supply of key component parts, as well as inflation and inefficiencies as a result ofthese temporary supply chain issues. We have established frequent communications with suppliers to review, track and prioritize high-risk components. We have also identified and activated alternative suppliers, materials and components as needed. We continue to work closely with our suppliers to achieve a deeper integration into our suppliers' supply chains, including the procurement of sub-component parts. The Company continues work to minimize the impact of inflation on inputs and market supply challengesdisruptions by employing local-for-local and region-for-region manufacturing and sourcing to allowstrategies, which allows us to contain costs and manufacture our products closer to our customers. At the same time, our engineering teams are evaluating our platform design to increase our sourcing flexibility.
In February 2022,We are impacted by customer spend and global demand for our products. We have been able to successfully manage volatility in demand through our broad and expanding product offerings.
The global nature of our operations subjects us to exposures resulting from both foreign currency exchange fluctuations in the United States announced targeted economic sanctions on Russia in response to the military conflict in Ukraine.normal course of business and geopolitical risks stemming from global conflicts. While we do not have any direct operations or employees in Russia or Ukraine and have suspended sales to Russia and Belarus,areas experiencing conflict, our operating results have been and may continue to be negatively impacted by supply chain constraints and inflationary pressures stemming from this conflict. In addition to fully adhering to all sanctions, we will continue to monitor developments in the region, including the impact of rising commodity and energy prices.
Due to the global nature of our operations, we are subject to exposures resulting from foreign currency exchange fluctuations in the normal course of business. The direct financial impact of foreign currency exchange includes the effect of translating profits from local currencies to U.S. dollars, the impact of currency fluctuations on the transfer of goods between our operations in the United States and our international operations and transaction gains and losses. Volatility in the foreign exchange market has and may continue to negatively impact the financial results of our international operations.these conflicts.
As described in Part I, Item 1A - Risk Factors, we may encounter financial difficulties if the United States or other global economies experience an additional or continued long-term economic downturn as our product sales are sensitive to declines in capital spending by our customers. Any sustained adverse impacts to our business, the industries in which we operate, market demand for our products, and/or certain suppliers or customers may also affect our future results of operations, financial position, or cash flows. We are actively monitoring the macroeconomic environment, especially the potential impact of global supply chain constraints on cost inflation, and the potential decreased demand for our products.
Outlook
GlobalWhile global economic conditions continue to be highly volatileuncertain, including the ability to attract and uncertainty remains regarding the timing of a full recovery fromretain skilled labor, lingering and targeted supply chain challengesdisruptions, and inflationary trends. We continue to monitor costs in the current inflationary environment and will take pricing actions and manage costs accordingly. We anticipate thatevolving compliance regulations, we will need to remain agile as we continue to manage evolving challenges.conditions. We remainare confident in the long-term growth trends for all our products and services in the markets we serve.
Historical Results
The following table compares the historical results of operations for the years ended December 31, 2022,2023, and 20212022 in dollars and as a percentage of net sales (in millions, except per share amounts and percentages):
| | 2022 | | % | | 2021 | | % |
| 2023 | | | 2023 | | % | | 2022 | | % |
| Net sales | Net sales | $ | 1,092.2 | | | 100.0 | | | $ | 1,090.8 | | | 100.0 | |
| Cost of sales | Cost of sales | 671.3 | | | 61.5 | | | 652.8 | | | 59.8 | |
| Gross profit | Gross profit | 420.9 | | | 38.5 | | | 438.0 | | | 40.2 | |
| Selling and administrative expense | Selling and administrative expense | 306.3 | | | 28.0 | | | 321.9 | | | 29.5 | |
| Research and development expense | Research and development expense | 31.1 | | | 2.8 | | | 32.2 | | | 3.0 | |
| Gain on sale of assets | Gain on sale of assets | (3.7) | | | (0.3) | | | (9.8) | | | (0.9) | |
| Operating income | Operating income | 87.2 | | | 8.0 | | | 93.7 | | | 8.6 | |
| Interest expense, net | Interest expense, net | (7.1) | | | (0.7) | | | (7.3) | | | (0.7) | |
| Net foreign currency transaction loss | (1.2) | | | (0.1) | | | (0.7) | | | (0.1) | |
| Loss on extinguishment of debt | — | | | — | | | (11.3) | | | (1.0) | |
| Other income (expense), net | 0.6 | | | 0.1 | | | (0.3) | | | — | |
| Net foreign currency transaction gain (loss) | |
| Other (expense) income, net | |
| Income before income taxes | Income before income taxes | 79.5 | | | 7.3 | | | 74.1 | | | 6.8 | |
| Income tax expense | Income tax expense | 13.2 | | | 1.2 | | | 9.2 | | | 0.8 | |
| Net income | Net income | 66.3 | | | 6.1 | | | 64.9 | | | 5.9 | |
| Net income per share - diluted | Net income per share - diluted | $ | 3.55 | | | $ | 3.44 | | |
Net Sales
Consolidated net sales in 20222023 totaled $1,092.2$1,243.6 million, a 0.1%13.9% increase as compared to consolidated net sales of $1,090.8$1,092.2 million in 2021.2022.
The 0.1%13.9% increase in consolidated net sales was driven by:
•Organic sales increase of approximately 4.2%13.6% primarily due to the impact of higher selling prices across all regions partially offset byand volume declines due mostly to supply chain constraints impacting the availability of key component parts;increases; and
•A net unfavorablefavorable impact from foreign currency exchange across all business units of approximately 4.0%; and0.3%.
•An unfavorable impact fromOur strong organic sales increase was mainly supported by our ability to reduce backlog through the divestitureprocurement of our Coatings business in 2021 of 0.1%.key component parts to facilitate increased production output.
The following table sets forth annual net sales by geographic area and the related percentage change from the prior year (in millions, except percentages):
| | 2022 | | % | | 2021 |
| 2023 | | | 2023 | | % | | 2022 | | % |
| Americas | Americas | $ | 705.9 | | | 7.2 | | | $ | 658.3 | |
| Europe, Middle East and Africa (EMEA) | Europe, Middle East and Africa (EMEA) | 301.6 | | | (9.1) | | | 331.9 | |
| Asia Pacific (APAC) | Asia Pacific (APAC) | 84.7 | | | (15.8) | | | 100.6 | |
| Total | Total | $ | 1,092.2 | | | 0.1 | | | $ | 1,090.8 | |
Americas
Net sales in the Americas were $705.9$840.3 million in 2022,2023, an increase of 7.2%19.0% from 2021.2022. Organic sales grew 7.4%18.9%, mainly due to higher selling prices indriven equally by price realization and increased volume across all categories acrossgeographies. Foreign currency exchange within the region and volume increases in Latin America. Diminished parts availability on certain component parts due to supply chain constraints limited the Company’s ability to increase production and address elevated backlog levels in the region. The divestiture of the Coatings business resulted in a decline inAmericas favorably impacted net sales ofby approximately 0.2% in 2022.0.1%.
Europe, Middle East and Africa ("EMEA")
EMEA net sales were $301.6$314.4 million in 2022, a decrease2023, an increase of 9.1%4.2% from 2021.2022. Organic sales grew 2.6% in EMEA, driven by price realization in all product categories, partially offset by lower EMEA volumes that were impacted by weaker-than-expected market conditions. Foreign currency exchange within EMEA unfavorablyfavorably impacted net sales by approximately 11.6%1.6%. Organic sales grew 2.5% in EMEA, primarily driven by higher selling prices in equipment and parts and consumables across the region, partially offset by volume declines due to supply chain constraints and softening demand in the region.
Asia Pacific ("APAC")
APAC net sales were $84.7$88.9 million in 2022, a decrease2023, an increase of 15.8%5.0% from 2021.2022. Organic sales declined 11.4%grew 8.6% in APAC, primarily due todriven by price realization in Australia and volume declinesincreases in China as government shutdowns related to COVID-19 unfavorably impacted demand. This was partly offset by volume growth in Australian markets.Australia and China. Foreign currency exchange within APAC unfavorably impacted net sales by approximately 4.4%3.6% in 2023.
Backlog
Backlog is one of the many indicators of business conditions in the Company's markets. Our order backlog was approximately $186.2 million at December 31, 2023 compared to $326.4 million at December 31, 2022. The decrease in our order backlog is the result of the Company's ability to obtain key component parts and increase production levels. Backlog includes orders that can be cancelled or postponed at the option of the customer at any time without penalty.
Gross Profit
Gross profit margin of 38.5%42.4% was 170390 basis points lowerhigher in 20222023 compared to 2021.2022. The margin rate decreaseincrease was primarily attributable to the broad effectsresult of inflation on materials, labor,price realization and freight costs, partlycost saving initiatives, which more than offset by higher selling prices and favorable sales mix.the multi-year impact of inflation.
Operating Expenses
Selling and Administrative Expense
Selling and Administrative expense ("S&A expense") was $306.3$352.6 million in 2022, a decrease2023, an increase of $15.6$46.3 million compared to 2021.2022. As a percentage of net sales, S&A expense in 2022 decreased 1502023 increased 40 basis points to 28.4% from 28.0% from 29.5% in 2021.2022. The S&A expense decreaseincrease was driven by lowerhigher variable employee compensation expenses partially offset by increased costs relatedlinked to incremental consulting costs to address parts shortages.improved operating performance as well as strategic investments aimed at fostering future growth.
Research and Development Expense
Research and Development ("R&D") expense was $31.1$36.6 million, or 2.8%2.9% of net sales, in 2022,2023, nearly flat as a percentage of net sales compared to 2021.2022.
We conduct research and development activities to develop new products and to enhance the functionality, effectiveness, ease of use and reliability of our existing products. We believe that our research and development efforts have been, and continue to be, key drivers of our success in the marketplace.
Total Other Expense, Net
Interest Expense, Net
Interest expense, net was $7.1$13.5 million in 2022, a decrease2023, an increase of $0.2$6.4 million compared to 2021.2022. The decrease reflected lower average outstandingincrease was the result of rising interest rates on our variable interest rate debt, in 2022, partially offset by higher interest rates.lower debt levels.
Our debt portfolio as of December 31, 20222023 was comprised of debt predominately in U.S. dollars. The Company manages its floating rate debt exposure using fixed rate interest rate swaps to reduce the Company's risk of the possibility of increased interest costs. On December 1, 2022, the Company entered into an aggregate $120 million notional amount
Foreign Currency Transaction Gain/Loss
Net foreign currency transaction lossgain was $0.3 million in 2023, compared to a $1.2 million loss in 2022, compared to $0.7 million in 2021.2022. The unfavorablefavorable impact was primarily due to weakening of the Chinese Renminbi relative to the U.S. dollar on foreign U.S. dollar denominated receivables during 2023, compared to strengthening of the U.S. dollar relative to the Brazilian real on foreign denominated liabilities.liabilities in 2022.
Income Taxes
The effective tax rate for 20222023 was 16.6%11.6% compared to 12.5%16.6% in 2021.2022. The increasedecrease in the effective tax rate was primarily driven by certain nonrecurring tax items. TheBoth the 2023 and 2022 tax rate includesrates include benefits related to a reduction to a deferred tax liability on undistributed foreign earnings. The 2021 tax rate included benefits from a foreign tax basis step-up election and a valuation allowance related to net operating loss carryovers.earnings as those cumulative earnings were reduced by current year statutory book losses. These nonrecurring events had a one-time impactimpacts of (12.0%) in 2023 and (7.2%) in 20222022.
In December 2021, the Organization for Economic Cooperation and (11.5%Development (OECD), which is an international public policy setting organization comprised of member countries including the U.S., published a proposal for the establishment of a global minimum tax rate of 15% (the "Pillar Two rule"). The OECD has recommended that the Pillar Two rule become effective for fiscal years beginning on or after January 1, 2024. To date, member states are in 2021.various stages of implementing the rules through local legislation, and the OECD continues to refine the technical guidance. We are closely monitoring developments of the Pillar Two rule and are currently evaluating the potential effect in each of the countries we operate in.
In general, it is our practice and intention to permanently reinvest the earnings of our foreign subsidiaries and repatriate earnings only when the tax impact is zero or immaterial. No deferred taxes have been provided for withholding taxes or other taxes that would result in repatriation of our foreign investments to the U.S.
Backlog
Backlog is one of the many indicators of business conditions in the Company's markets. Our order backlog was approximately $326.4 million at December 31, 2022 compared to $169.7 million at December 31, 2021. The increase in our order backlog is primarily due to higher order rates coupled with persistent supply chain challenges that impacted our ability to obtain key component parts and increase production. We expect this level of backlog to continue in 2023. Backlog includes orders that can be cancelled or postponed at the option of the customer at any time without penalty.
Liquidity and Capital Resources
Liquidity
Our primary liquidity needs are to fund working capital, fund investments, service our debt, maintain cash reserves and invest in capital expenditures. Our sources of liquidity include cash generated from operations, borrowings under our revolving credit facility and from time to time, debt and equity offerings. We believe our current resources are sufficient to meet our working capital requirements for our current business for at least the next 12 months and thereafter for the foreseeable future.
Cash, cash equivalents and restricted cash totaled $77.4$117.1 million at December 31, 2022,2023, as compared to $123.6$77.4 million as of December 31, 2021.2022. Wherever possible, cash management is centralized and intercompany financing is used to provide working capital to subsidiaries as needed. Our current ratio was 2.1 as of December 31, 2023 and 2.2 as of December 31, 2022 and 1.8 as of December 31, 2021.2022. Our primary working capital, which is comprised of accounts receivable, inventories and accounts payable was $312.1 million as of December 31, 2023 and $332.0 million as of December 31, 2022 and $250.5 million2022. Our debt-to-capital ratio was 25.8% as of December 31, 2021. Our debt-to-capital ratio was2023, compared to 40.9% as of December 31, 2022, compared to 38.1% as of December 31, 2021.2022.
TheOn February 13, 2024, the Company's Board of Directors authorized a quarterly cash dividend of $0.265$0.28 per share payable on March 15, 2023,2024, to shareholders of record at the close of business on March 3, 2023.
Cash Flow from Operating Activities
Net cash used inprovided by operating activities in 20222023 was $25.1$188.4 million compared to net cash provided by operating activities of $69.4$25.1 million in 2021.2022. The increase in cash usedprovided was primarily driven by an increasethe result of strong operating performance and managed reductions in working capital attributable to investments in inventory required to support an anticipated ramp in production; higher accounts receivables due to increased sales to customers with extended payment terms; and increased cash payments for employee compensation and benefits and income taxes.investments.
Cash Flow from Investing Activities
Net cash used in investing activities in 20222023 was $24.5$23.2 million compared to net cash provided byused in investing activities of $1.7$24.5 million in 2021. In 2022, we used $25.0 million for2022. The decrease in cash outflows was primarily driven by reduced property, plant and equipment investments as the Company continues to deploy cash flow toward operational capital expenditures compared to $19.4 million in 2021. The prior year period included $24.7 millionneeds.
Cash Flow from Financing Activities
Net cash provided byused in financing activities in 20222023 was $8.1$122.6 million compared to net cash used inprovided by financing activities of $84.5$8.1 million in 2021.2022. The increase in cash providedused was primarily due to a decrease indriven by repayments of borrowingborrowings and share repurchases in 2022, partly offset by increased dividend payments.repurchases.
Cash Requirements
The companyCompany believes the liquidity available from the combination of expected cash generated by operating activities, existing cash and available credit under existing credit facilities will be sufficient to meet its short-term and long-term cash requirements. Significant contractual obligations include principal and interest payments on long-term debt (Note 9) and operating lease commitments (Note 15). We also have contractual purchase obligations of approximately $113$76 million for 2023.2024.
Newly Issued Accounting Guidance
See Note 2 to the consolidated financial statements for information on new accounting pronouncements.
In October 2023, the FASB issued ASU 2023-06 Disclosure Improvements: Codification Amendments in Response to the SEC's Disclosure Update and Simplification Initiative, which aims to clarify or improve disclosure and presentation requirements on a variety of topics and align the requirements in the FASB accounting standard with the Securities and Exchange Commission regulations. This guidance is effective for the Company no later than June 30, 2027. We do not expect the amendments in this update to have a material impact on our consolidated financial statements.
In November 2023, the FASB issued ASU 2023-07 Segment Reporting (Topic 280): Improvements to Reportable Segment Disclosures, which requires an entity to disclose significant segment expenses impacting profit and loss that are regularly provided to the chief operating decision maker. The amendments in this ASU are required to be adopted for fiscal years beginning after December 15, 2023, and interim periods within fiscal years beginning after December 15, 2024. Early adoption is permitted. We are currently evaluating the impact of adoption on our financial disclosures.
In December 2023, the FASB issued ASU 2023-09 Income Taxes (Topic 740): Improvements to Income Tax Disclosures, which is intended to enhance the transparency and decision usefulness of income tax disclosures. The amendments in ASU 2023-09 address investor requests for enhanced income tax information primarily through changes to the rate reconciliation and income taxes paid information. The amendments in this ASU are required to be adopted for fiscal years beginning after December 15, 2024. Early adoption is permitted for annual financial statements that have not yet been issued. The amendments should be applied on a prospective basis although retrospective application is permitted. We are currently evaluating the impact of adoption on our financial disclosures.
No other new accounting pronouncements issued but not yet effective have had, or are expected to have, a material impact on our results of operations or financial position.
Critical Accounting Policies and Estimates
Our consolidated financial statements are based on the selection and application of accounting principles generally accepted in the United States of America, which require us to make estimates and assumptions about future events that affect the amounts reported in our consolidated financial statements and the accompanying notes. Our significant accounting policies are described in Note 1 to the consolidated financial statements. Future events and their effects cannot be determined with absolute certainty. Therefore, the determination of estimates requires the exercise of judgment. Actual results could differ from those estimates, and any such differences may be material to the consolidated financial statements. We believe that the following policies may involve a higher degree of judgment and complexity in their application and represent the critical accounting policies used in the preparation of our consolidated financial statements. If different assumptions or conditions were to prevail, the results could be materially different from our reported results.
Goodwill – Goodwill represents the excess of cost over the fair value of net assets of businesses acquired and is allocated to our reporting units at the time of the acquisition. We analyze goodwill on an annual basis and when an event occurs or circumstances change that may reduce the fair value of a reporting unit below its
carrying amount. We have the option of first analyzing qualitative factors to determine whether it is more likely than not that the fair value of any reporting unit is less than its carrying amount. However, we may elect to perform a quantitative goodwill impairment test in lieu of the qualitative test. An entity must recognize an impairment charge for the amount by which the carrying amount exceeds the reporting unit’s fair value. Subsequent reversal of goodwill impairment charges is not permitted.
When we perform a qualitative goodwill test, we analyze qualitative factors to determine whether it is more likely than not that the fair value of a reporting unit is less than its carrying amount as a basis for determining whether it is necessary to perform the quantitative goodwill impairment test. If the qualitative test indicates there may be an impairment, we perform the quantitative test, which measures the amount of the goodwill impairment, if any. To perform the quantitative test, we calculate the fair value of each reporting unit, primarily utilizing the income approach. The income approach is based on discounted cash flow models that use reporting unit estimates for forecasted future financial performance, including revenues, margins, operating expenses, capital expenditures, depreciation, amortization, tax and discount rates. These estimates are developed as part of our planning process based on assumed growth rates, along with historical data and various internal estimates. Projected future cash flows are then discounted to a present value employing a discount rate that properly accounts for the estimated risk-adjusted weighted-average cost of capital relevant to each reporting unit.
We perform our annual goodwill impairment analysis as of October 1 and when an event occurs or circumstances change that may reduce the fair value of a reporting unit below its carrying amount. In 2020, we changed the goodwill impairment assessment date from December 31 to October 1 to better align with the timing of our annual planning process. The change did not result in any adjustments to our consolidated financial statements.
In 2022,2023, we elected to perform the quantitative goodwill test in lieu of the qualitative test on all reporting units. Our teststest indicated the fair value in each reporting unit was substantially in excess of its carrying value. There wasthat there is no goodwill impairment in any of our reporting units as of our annual assessment date.
We had goodwill of $182.0$187.4 million and $193.1$182.0 million at December 31, 20222023 and 2021,2022, respectively.
Income Taxes – We are required to estimate our income taxes in each of the jurisdictions in which we operate. This process involves estimating our actual current tax obligations based on expected income, statutory tax rates and tax planning opportunities in the various jurisdictions. We also establish reserves for uncertain tax matters that are complex in nature and uncertain as to the ultimate outcome. Although we believe that our tax return positions are fully supportable, we consider our ability to ultimately prevail in defending these matters when establishing these reserves. We adjust our reserves in light of changing facts and circumstances, such as the closing of a tax audit. We believe that our current reserves are adequate. However, the ultimate outcome may differ from our estimates and assumptions and could impact the income tax expense reflected in our consolidated statements of income.
Tax law requires certain items to be included in our tax return at different times than the items are reflected in our results of operations. Some of these differences are permanent, such as expenses that are not deductible in our tax returns, and some differences will reverse over time, such as depreciation expense on property, plant and equipment. These temporary differences result in deferred tax assets and liabilities, which are included within our consolidated balance sheets. Deferred tax assets generally represent items that can be used as a tax deduction or credit in our tax returns in future years but have already been recorded as an expense in our consolidated statements of income. We assess the likelihood that our deferred tax assets will be recovered from future taxable income, and, based on management’s judgment, to the extent we believe that recovery is not more likely than not, we establish a valuation allowance against those deferred tax assets. The deferred tax asset valuation allowance could be materially different from actual results because of changes in the mix of future taxable income, the relationship between book and taxable income and our tax planning strategies. As of December 31, 2022,2023, a valuation allowance of $3.3$3.2 million was recorded against foreign and state tax credit carryforwards.
Cautionary Factors Relevant to Forward-Looking Information
This Annual Report on Form 10-K, including “Management’s Discussion and Analysis of Financial Condition and Results of Operations” in Part II, Item 7, contains certain statements that are considered “forward-looking statements” within the meaning of the Private Securities Litigation Reform Act of 1995. Forward-looking statements generally can be identified by the use of forward-looking terminology such as “may,” “will,” “expect,” “intend,” “estimate,” “anticipate,” “believe,” “project,” or “continue” or similar words or the negative thereof. These statements do not relate to strictly historical or current facts and provide current expectations of forecasts of future events. Any such expectations or forecasts of future events are subject to a variety of factors. Particular risks and uncertainties presently facing us include:
•Geopolitical and economic uncertainty throughout the world.
•Uncertainty surrounding the COVID-19 pandemic.
•Ability to comply with global laws and regulations.
•Ability to adapt to price sensitivity.
•Competition in our business.
•Fluctuations in the cost, quality or availability of raw materials and purchased components.
•Ability to adjust pricing to respond to cost pressures.
•Unforeseen product liability claims or product quality issues.
•Ability to attract, retain and develop key personnel and create effective succession planning strategies.
•Ability to effectively manage strategic plan or growth processes.
•Ability to successfully upgrade and evolve our information technology systems.
•Ability to successfully protect our information technology systems from cybersecurity risks.
•Occurrence of a significant business interruption.
•Ability to maintain the health and safety of our workforce.
•Ability to complete and integrate acquisitions.
•Ability to develop and commercialize new innovative products and services.
We caution that forward-looking statements must be considered carefully and that actual results may differ in material ways due to risks and uncertainties both known and unknown. Information about factors that could materially affect our results can be found in Part I, Item 1A "Risk Factors" of this Form 10-K. Shareholders, potential investors and other readers are urged to consider these factors in evaluating forward-looking statements and are cautioned not to place undue reliance on such forward-looking statements.
We undertake no obligation to update or revise any forward-looking statement, whether as a result of new information, future events or otherwise, except as required by law. Investors are advised to consult any further disclosures by us in our filings with the SEC and in other written statements on related subjects. It is not possible to anticipate or foresee all risk factors, and investors should not consider any list of such factors to be an exhaustive or complete list of all risks or uncertainties.
ITEM 7A – Quantitative and Qualitative Disclosures About Market Risk
Commodity Risk – We are subject to exposures resulting from potential cost increases related to our purchase of raw materials or other product components. We do not use derivative commodity instruments to manage our exposures to changes in commodity prices such as steel, oil, gas, lead and other commodities.
Various factors beyond our control affect the price of oil and gas, including, but not limited to, worldwide and domestic supplies of oil and gas, political instability or armed conflict in oil-producing regions, the price and level of foreign imports, the level of consumer demand, the price and availability of alternative fuels, domestic and foreign governmental regulation, weather-related factors and the overall economic environment. We purchase petroleum-related component parts for use in our manufacturing operations. In addition, our freight costs associated with shipping and receiving product and sales and service vehicle fuel costs are impacted by fluctuations in the cost of oil and gas.
We continue to focus on mitigating the risk of future raw material or other product component cost increases through supplier negotiations, ongoing optimization of our supply chain, the continuation of cost-reduction actions and product pricing. The success of these efforts will depend upon our ability to leverage our commodity spend in the current global economic environment. If the commodity prices increase significantly and we are not able to offset the increases with higher selling prices, our results may be unfavorably impacted in the future.
Interest Rate Risk – Our debt portfolio as of December 31, 2022,2023, was comprised of debt predominately denominated in U.S. dollars. We are exposed to changes in interest rates as a result of borrowing activities with variable interest rates that impact interest incurred. The Company manages its floating rate debt exposure using interest rate swaps. Fixed rate swaps are used to reduce the Company's risk of the possibility of increased interest costs.
As of December 31, 2022,2023, the Company's financial liabilities subject to changes in interest rates are $205.0$110.0 million of our revolving credit facility borrowings and $95.0$90.0 million of our term loan facility. The Company entered into an aggregate $120 million notional amount of interest rate swaps effective December 1, 2022 that exchange a variable rate of interest for a fixed rate of interest of 4.076% over the term of the agreements, which mature on December 1, 2026. Assuming a hypothetical 50 basis point increase in short-term interest rates, with all other variables remaining constant, interest expense, net would have increased by approximately $1.4$0.75 million in 2022.2023.
Foreign Currency Exchange Rate Risk – Due to the global nature of our operations, we are subject to exposures resulting from foreign currency exchange fluctuations in the normal course of business. Our primary exchange rate exposures are with the Euro, Australian and Canadian dollars, British pound, Japanese yen, Chinese renminbi, Brazilian real and Mexican peso against the U.S. dollar. The direct financial impact of foreign currency exchange includes the effect of translating profits from local currencies to U.S. dollars, the impact of currency fluctuations on the transfer of goods between our operations in the United States and our international operations and transaction gains and losses. In addition to the direct financial impact, foreign currency exchange has an indirect financial impact on our results, including the effect on sales volume within local economies and the impact of pricing actions taken as a result of foreign exchange rate fluctuations.
In the normal course of business, we actively manage the exposure of our foreign currency exchange rate market risk by entering into various hedging instruments with counterparties that are highly rated financial institutions. We may use foreign exchange purchased options or forward contracts to hedge our foreign currency denominated forecasted revenues or forecasted sales to wholly-ownedwholly owned foreign subsidiaries. Additionally, we hedge our net recognized foreign currency assets and liabilities with foreign exchange forward contracts. We hedge these exposures to reduce the risk that our net earnings and cash flows will be adversely affected by changes in foreign exchange rates. We do not enter into any of these instruments for speculative or trading purposes to generate revenue.
These contracts are carried at fair value and have maturities between one and 12 months. The gains and losses on these contracts generally approximate changes in the value of the related assets, liabilities or forecasted transactions. Some of the derivative instruments we enter into do not meet the criteria for cash flow hedge accounting treatment; therefore, changes in fair value are recorded in foreign currency transaction losses on our consolidated statements of income.
We use foreign currency exchange rate derivatives to hedge our exposure to fluctuations in exchange rates for anticipated intercompany cash transactions between the Company and its subsidiaries.
On April 5, 2022, we entered into Euro to U.S. dollar foreign exchange cross-currency swaps associated with an intercompany loan from a wholly owned European subsidiary. We enter into these foreign exchange cross-currency swaps to hedge the foreign currency risk associated with this intercompany loan, and accordingly, they are not speculative in nature. These cross-currency swaps are designated as fair value hedges. As of December 31, 20222023, these cross-currency swaps included €84.8€75.0 million of total notional value. As of December 31, 2022,2023, the aggregated scheduled interest payments over the course of the loan and related swaps amounted to €9.8€7.5 million. The scheduled maturity and principal payment of the loan and related swapsinterest payments of €75.0€82.5 million are due in April 2027. Based on the fair value hedges outstanding as of December 31, 2022,2023, a 10% appreciation of the U.S. dollar compared to the Euro would result in a net gain of $8.0$8.3 million in the fair value of these contracts.
On April 5, 2022, we entered into Euro to U.S. dollar foreign exchange cross-currency swaps to hedge our exposure to adverse foreign currency exchange rate movements between Tennant Company and a wholly owned European subsidiary. We enter into these fixed-to-fixed cross-currency swap agreements to protect a designated monetary amount of the Company’s net investment in its Euro functional currency subsidiary against the risk of changes in the Euro to U.S. dollar foreign exchange rate. These cross-currency swaps are designated as net investment hedges. As of December 31, 2022,2023, the cross-currency swaps included €75.0 million of total notional values. These swaps are scheduled to mature in April 2027. Based on the net investment hedges outstanding as of December 31, 2022,2023, a 10% appreciation of the U.S. dollar compared to the Euro would result in a net gain of $8.0$8.3 million in the fair value of these contracts.
For further information regarding our foreign currency derivatives and hedging programs, see Note 11 to the consolidated financial statements.
For details of the estimated effects of currency translation on the operations of our operating segments, see Part II, Item 7 – "Management's Discussion and Analysis of Financial Condition and Results of Operations."
Other Matters – Management regularly reviews our business operations with the objective of improving and maximizing our financial performance. As a result of this ongoing process to improve financial performance, we may incur additional restructuring charges in the future which, if taken, could be material to our financial results.
ITEM 8 – Financial Statements and Supplementary Data
REPORT OF INDEPENDENT REGISTERED PUBLIC ACCOUNTING FIRM
To the shareholders and the Board of Directors of Tennant Company
Opinion on the Financial Statements
We have audited the accompanying consolidated balance sheet of Tennant Company and subsidiaries (the "Company") as of December 31, 20222023 and 2021,2022, the related consolidated statements of income, comprehensive income, cash flows, and equity, for each of the three years in period ended December 31, 2022,2023, and the related notes and the schedule listed in the Index at Item 15 (collectively referred to as the "financial statements"). In our opinion, the financial statements present fairly, in all material respects, the financial position of the Company as of December 31, 20222023 and 2021,2022, and the results of its operations and its cash flows for each of the three years in the period ended December 31, 2022,2023, in conformity with accounting principles generally accepted in the United States of America.
We have also audited, in accordance with the standards of the Public Company Accounting Oversight Board (United States) (PCAOB), the Company's internal control over financial reporting as of December 31, 2022,2023, based on criteria established in Internal Control — Integrated Framework (2013) issued by the Committee of Sponsoring Organizations of the Treadway Commission and our report dated February 23, 2023,22, 2024, expressed an unqualified opinion on the Company's internal control over financial reporting.
Basis for Opinion
These financial statements are the responsibility of the Company's management. Our responsibility is to express an opinion on the Company's financial statements based on our audits. We are a public accounting firm registered with the PCAOB and are required to be independent with respect to the Company in accordance with the U.S. federal securities laws and the applicable rules and regulations of the Securities and Exchange Commission and the PCAOB.
We conducted our audits in accordance with the standards of the PCAOB. Those standards require that we plan and perform the audit to obtain reasonable assurance about whether the financial statements are free of material misstatement, whether due to error or fraud. Our audits included performing procedures to assess the risks of material misstatement of the financial statements, whether due to error or fraud, and performing procedures that respond to those risks. Such procedures included examining, on a test basis, evidence regarding the amounts and disclosures in the financial statements. Our audits also included evaluating the accounting principles used and significant estimates made by management, as well as evaluating the overall presentation of the financial statements. We believe that our audits provide a reasonable basis for our opinion.
Critical Audit Matter
The critical audit matter communicated below is a matter arising from the current-period audit of the financial statements that was communicated or required to be communicated to the audit committee and that (1) relates to accounts or disclosures that are material to the financial statements and (2) involved our especially challenging, subjective, or complex judgments. The communication of critical audit matters does not alter in any way our opinion on the financial statements, taken as a whole, and we are not, by communicating the critical audit matter below, providing a separate opinion on the critical audit matter or on the accounts or disclosures to which it relates.
Goodwill – EMEA Reporting Unit - Refer to Notes 1 and 8 of the consolidated financial statements
Critical Audit Matter Description
The Company’s annual evaluation ofCompany performed a qualitative goodwill fortest on all reporting units. The tests indicated that there was no goodwill impairment involved the comparisonas of the EMEA reporting unit’s fair value to its carrying value.annual assessment date. The Company determinedanalyzed qualitative factors to determine whether it was more likely than not that the fair value of the reporting unit using the combination of an income andunits was less than their carrying amounts as a market approach. The income approach utilizesbasis for determining whether it is necessary to perform a discounted cash flow model which requires management to make significant estimates and assumptions related to forecasts of futurequantitative goodwill impairment test.
revenues, profit margins,Given the amount of goodwill within the EMEA reporting unit, the judgment used in the EMEA reporting unit’s qualitative assessment, and discount rates. The determination of the difference between the most recent fair value usingestimate and the market approach requires management to make significant assumptions related to earnings before interest, taxes, depreciation, and amortization (EBITDA) multiples.
The EMEA goodwill balance was $145.8 million as of December 31, 2022. The fair valuecarrying amount of the EMEA reporting unit, exceeded its carrying value as ofauditing management’s conclusions related to the measurement date and, therefore, no impairment was recognized. Changes in these estimates and related assumptions could have a significant impact on either the fair value, the amount of anyEMEA qualitative goodwill impairment charge, or both.
Given the significant judgments made by management to estimate the fair value of the EMEA reporting unit and the differences between its fair value and carrying value, performing audit procedures to evaluate the reasonableness of management’s estimates and assumptions related to forecasts of future revenues, profit margins, discount rates, and EBITDA multiples, required a high degree of auditorassessment involved subjective judgment and an increased extent of effort, including the need to involve our fair value specialists.
How the Critical Audit Matter Was Addressed in the Audit
Our audit procedures related to forecastsmanagement’s qualitative assessment of future revenues, reporting unit profit margins, selection of discount rates, and EBITDA multiplesgoodwill impairment for the EMEA reporting unit included the following, among others:
•We tested the effectiveness of controls over goodwill, including the underlying assumptionsthose over management’s judgments related to forecast future revenuemacroeconomic conditions, industry and profit margins,market considerations, overall financial performance, entity and the selection of the discount ratereporting unit specific events, and EBITDA multiples.
•We evaluated management’s ability to accurately forecast future revenues and profit margins by comparing actual results to management’s historical forecasts.capital markets pricing.
•We evaluated the reasonableness of management’s qualitative assessment of factors affecting forecasted revenue and profit margins by comparing the forecasts to (1) historical results, (2) internal communications between management and the Board of Directors, and (3) information included in Company press releases as well as in analyst and industry reports of the Company and companies in its peer group.releases.
•With the assistance of our fair value specialists, we evaluated the reasonableness of management’s qualitative assessment by performing the following: (1) evaluated GDP growth, inflation and other macroeconomic variables, as well as industry growth rates, (2) estimated industry discount rate, including testingrates, (3) analyzed growth, margin, and valuation multiple trends of guideline public companies, (4) compared recent fair value estimate and carrying amount, and (5) analyzed the underlying source information and the mathematical accuracytrend of market capitalization of the calculations,entity and developing a range of independent estimates and comparing those to the discount rate selected by management.public peer companies.
•WithAssessed for potential indicators of impairment such as macroeconomic and industry conditions, financial performance, and events affecting the assistancereporting unit such as a change in the carrying amount of our fair value specialists, weits net assets or asset impairments at components of the reporting unit.
•We evaluated the EBITDA multiples, including testing the underlying source information and mathematical accuracyfinancial results of the calculations, and comparingEMEA reporting unit compared to forecasts from the multiples selected by managementOctober 1, 2023 annual measurement date to its guideline companies.December 31, 2023.
/s/ Deloitte & Touche LLP
Minneapolis, Minnesota
February 23, 202322, 2024
We have served as the Company's auditor since 2019.
REPORT OF INDEPENDENT REGISTERED PUBLIC ACCOUNTING FIRM
To the shareholders and the Board of Directors of Tennant Company.Company
Opinion on Internal Control over Financial Reporting
We have audited the internal control over financial reporting of Tennant Company and subsidiaries (the “Company”) as of December 31, 2022,2023, based on criteria established in Internal Control — Integrated Framework (2013) issued by the Committee of Sponsoring Organizations of the Treadway Commission (COSO). In our opinion, the Company maintained, in all material respects, effective internal control over financial reporting as of December 31, 2022,2023, based on criteria established in Internal Control — Integrated Framework (2013) issued by COSO.
We have also audited, in accordance with the standards of the Public Company Accounting Oversight Board (United States) (PCAOB), the consolidated financial statements as of and for the year ended December 31, 2022,2023, of the Company and our report dated February 23, 2023,22, 2024, expressed an unqualified opinion on those financial statements.
Basis for Opinion
The Company’s management is responsible for maintaining effective internal control over financial reporting and for its assessment of the effectiveness of internal control over financial reporting, included in the accompanying Management’s Report on Internal Control over Financial Reporting. Our responsibility is to express an opinion on the Company’s internal control over financial reporting based on our audit. We are a public accounting firm registered with the PCAOB and are required to be independent with respect to the Company in accordance with the U.S. federal securities laws and the applicable rules and regulations of the Securities and Exchange Commission and the PCAOB.
We conducted our audit in accordance with the standards of the PCAOB. Those standards require that we plan and perform the audit to obtain reasonable assurance about whether effective internal control over financial reporting was maintained in all material respects. Our audit included obtaining an understanding of internal control over financial reporting, assessing the risk that a material weakness exists, testing and evaluating the design and operating effectiveness of internal control based on the assessed risk, and performing such other procedures as we considered necessary in the circumstances. We believe that our audit provides a reasonable basis for our opinion.
Definition and Limitations of Internal Control over Financial Reporting
A company’s internal control over financial reporting is a process designed to provide reasonable assurance regarding the reliability of financial reporting and the preparation of financial statements for external purposes in accordance with generally accepted accounting principles. A company’s internal control over financial reporting includes those policies and procedures that (1) pertain to the maintenance of records that, in reasonable detail, accurately and fairly reflect the transactions and dispositions of the assets of the company; (2) provide reasonable assurance that transactions are recorded as necessary to permit preparation of financial statements in accordance with generally accepted accounting principles, and that receipts and expenditures of the company are being made only in accordance with authorizations of management and directors of the company; and (3) provide reasonable assurance regarding prevention or timely detection of unauthorized acquisition, use, or disposition of the company’s assets that could have a material effect on the financial statements.
Because of its inherent limitations, internal control over financial reporting may not prevent or detect misstatements. Also, projections of any evaluation of effectiveness to future periods are subject to the risk that controls may become inadequate because of changes in conditions, or that the degree of compliance with the policies or procedures may deteriorate.
/s/ Deloitte & Touche LLP
Minneapolis, Minnesota
February 23, 202322, 2024
Consolidated Statements of Income
TENNANT COMPANY AND SUBSIDIARIES
(In millions, except shares and per share data)
| | Years ended December 31 | Years ended December 31 | 2022 | | 2021 | | 2020 | Years ended December 31 | 2023 | | 2022 | | 2021 |
| Net sales | Net sales | $ | 1,092.2 | | | $ | 1,090.8 | | | $ | 1,001.0 | |
| Cost of sales | Cost of sales | 671.3 | | | 652.8 | | | 593.2 | |
| Gross profit | Gross profit | 420.9 | | | 438.0 | | | 407.8 | |
| Selling and administrative expense | Selling and administrative expense | 306.3 | | | 321.9 | | | 314.0 | |
| Research and development expense | Research and development expense | 31.1 | | | 32.2 | | | 30.1 | |
| Gain on sale of assets | Gain on sale of assets | (3.7) | | | (9.8) | | | — | |
| Operating income | Operating income | 87.2 | | | 93.7 | | | 63.7 | |
| Interest expense, net | Interest expense, net | (7.1) | | | (7.3) | | | (17.4) | |
| Net foreign currency transaction loss | (1.2) | | | (0.7) | | | (5.3) | |
| Net foreign currency transaction gain (loss) | |
| Loss on extinguishment of debt | Loss on extinguishment of debt | — | | | (11.3) | | | — | |
| Other income (expense), net | 0.6 | | | (0.3) | | | 0.1 | |
| Other (expense) income, net | |
| Income before income taxes | Income before income taxes | 79.5 | | | 74.1 | | | 41.1 | |
| Income tax expense | Income tax expense | 13.2 | | | 9.2 | | | 7.4 | |
| Net income | Net income | $ | 66.3 | | | $ | 64.9 | | | $ | 33.7 | |
| | Net income per share | Net income per share | |
| Net income per share | |
| Net income per share | |
| Basic | |
| Basic | |
| Basic | Basic | $ | 3.58 | | | $ | 3.51 | | | $ | 1.84 | |
| Diluted | Diluted | $ | 3.55 | | | $ | 3.44 | | | $ | 1.81 | |
| | Weighted average shares outstanding: | Weighted average shares outstanding: | |
| Weighted average shares outstanding: | |
| Weighted average shares outstanding: | |
| Basic | |
| Basic | |
| Basic | Basic | 18,494,356 | | 18,499,674 | | 18,349,724 | 18,509,523 | | 18,494,356 | | 18,499,674 |
| Diluted | Diluted | 18,697,255 | | 18,849,217 | | 18,635,002 | Diluted | 18,783,633 | | 18,697,255 | | 18,849,217 |
See accompanying notes to consolidated financial statements.
Consolidated Statements of Comprehensive Income
TENNANT COMPANY AND SUBSIDIARIES
(In millions)
| | | | | | | | | | | | | | | | | |
| Years ended December 31 | 2022 | | 2021 | | 2020 |
| Net income | $ | 66.3 | | | $ | 64.9 | | | $ | 33.7 | |
| Other comprehensive (loss) income: | | | | | |
| Foreign currency translation adjustments (net of related tax (expense) benefit of $(1.2), $0.4, and $0.8, respectively) | (17.9) | | | (16.9) | | | 17.2 | |
| Pension and postretirement medical benefits (net of related tax (expense) benefit of $(1.6), $0.3, and $0.3, respectively) | 4.8 | | | (0.4) | | | (1.0) | |
| Derivative financial instruments (net of tax (expense) benefit of $(0.3), $0.1, and $(0.7), respectively) | 0.8 | | | (0.5) | | | 2.2 | |
| Total other comprehensive (loss) income, net of tax | (12.3) | | | (17.8) | | | 18.4 | |
| | | | | |
| Comprehensive income | $ | 54.0 | | | $ | 47.1 | | | $ | 52.1 | |
| | | | | | | | | | | | | | | | | |
| Years ended December 31 | 2023 | | 2022 | | 2021 |
| Net income | $ | 109.5 | | | $ | 66.3 | | | $ | 64.9 | |
| Other comprehensive income (loss): | | | | | |
| Foreign currency translation adjustments (net of related tax benefit (expense) of $0.8, $(1.2), and $0.4, respectively) | 8.3 | | | (17.9) | | | (16.9) | |
| Pension and postretirement medical benefits (net of related tax benefit (expense) of $(0.3), $(1.6), and $0.3, respectively) | 1.0 | | | 4.8 | | | (0.4) | |
| Derivative financial instruments (net of tax (expense) benefit of $0.4, $(0.3), and $0.1, respectively) | (1.4) | | | 0.8 | | | (0.5) | |
| Total other comprehensive income (loss), net of tax | 7.9 | | | (12.3) | | | (17.8) | |
| | | | | |
| Comprehensive income | $ | 117.4 | | | $ | 54.0 | | | $ | 47.1 | |
See accompanying notes to consolidated financial statements.
Consolidated Balance Sheets
TENNANT COMPANY AND SUBSIDIARIES
(In millions, except shares and per share data)
| | December 31 | December 31 | 2022 | | 2021 | December 31 | 2023 | | 2022 |
| ASSETS | ASSETS | |
| Cash, cash equivalents, and restricted cash | Cash, cash equivalents, and restricted cash | $ | 77.4 | | | $ | 123.6 | |
| Receivables, less allowances of $6.1 and $5.3, respectively | 251.5 | | | 211.4 | |
| Cash, cash equivalents, and restricted cash | |
| Cash, cash equivalents, and restricted cash | |
| Receivables, less allowances of $7.2 and $6.1, respectively | |
| Inventories | Inventories | 206.6 | | | 160.6 | |
| Prepaid and other current assets | Prepaid and other current assets | 39.8 | | | 31.2 | |
| Total current assets | Total current assets | 575.3 | | | 526.8 | |
| Property, plant and equipment, less accumulated depreciation of $279.3 and $258.4, respectively | 179.9 | | | 172.8 | |
| Property, plant and equipment, less accumulated depreciation of $304.0 and $279.3, respectively | |
| Operating lease assets | Operating lease assets | 31.8 | | | 41.3 | |
| Goodwill | Goodwill | 182.0 | | | 193.1 | |
| Intangible assets, net | Intangible assets, net | 76.4 | | | 98.0 | |
| Other assets | Other assets | 39.7 | | | 29.7 | |
| Total assets | Total assets | $ | 1,085.1 | | | $ | 1,061.7 | |
| LIABILITIES AND TOTAL EQUITY | LIABILITIES AND TOTAL EQUITY | |
| Current portion of long-term debt | |
| Current portion of long-term debt | |
| Current portion of long-term debt | Current portion of long-term debt | $ | 5.2 | | | $ | 4.2 | |
| Accounts payable | Accounts payable | 126.1 | | | 121.5 | |
| Employee compensation and benefits | Employee compensation and benefits | 44.0 | | | 60.6 | |
| Other current liabilities | Other current liabilities | 86.3 | | | 104.0 | |
| Total current liabilities | Total current liabilities | 261.6 | | | 290.3 | |
| Long-term debt | Long-term debt | 295.1 | | | 263.4 | |
| Long-term operating lease liabilities | Long-term operating lease liabilities | 17.1 | | | 25.4 | |
| Employee-related benefits | Employee-related benefits | 13.2 | | | 16.3 | |
| Deferred income taxes | Deferred income taxes | 11.5 | | | 20.6 | |
| Other liabilities | Other liabilities | 14.5 | | | 10.6 | |
| Total long-term liabilities | Total long-term liabilities | 351.4 | | | 336.3 | |
| Total liabilities | Total liabilities | 613.0 | | | 626.6 | |
| Commitments and contingencies (Note 16) | Commitments and contingencies (Note 16) | | Commitments and contingencies (Note 16) | | | |
| Common stock, $0.375 par value per share, 60,000,000 shares authorized; 18,521,485 and 18,535,116 issued and outstanding, respectively | 7.0 | | | 7.0 | |
| Common stock, $0.375 par value per share, 60,000,000 shares authorized; 18,631,384 and 18,521,485 issued and outstanding, respectively | |
| Additional paid-in capital | Additional paid-in capital | 56.0 | | | 54.1 | |
| Retained earnings | Retained earnings | 458.0 | | | 410.6 | |
| Accumulated other comprehensive loss | Accumulated other comprehensive loss | (50.2) | | | (37.9) | |
| Total Tennant Company shareholders' equity | Total Tennant Company shareholders' equity | 470.8 | | | 433.8 | |
| Noncontrolling interest | Noncontrolling interest | 1.3 | | | 1.3 | |
| Total equity | Total equity | 472.1 | | | 435.1 | |
| Total liabilities and total equity | Total liabilities and total equity | $ | 1,085.1 | | | $ | 1,061.7 | |
See accompanying notes to consolidated financial statementsstatements.
Consolidated Statements of Cash Flows
TENNANT COMPANY AND SUBSIDIARIES
(In millions) | | Years ended December 31 | Years ended December 31 | 2022 | | 2021 | | 2020 | Years ended December 31 | 2023 | | 2022 | | 2021 |
| OPERATING ACTIVITIES | OPERATING ACTIVITIES | |
| Net income | Net income | $ | 66.3 | | | $ | 64.9 | | | $ | 33.7 | |
| Adjustments to reconcile net income to net cash (used in) provided by operating activities: | |
| Net income | |
| Net income | |
| Adjustments to reconcile net income to net cash provided by (used in) operating activities: | |
| Depreciation expense | |
| Depreciation expense | |
| Depreciation expense | Depreciation expense | 32.8 | | | 33.1 | | | 32.6 | |
| Amortization expense | Amortization expense | 15.9 | | | 20.0 | | | 20.8 | |
| Deferred income tax benefit | Deferred income tax benefit | (15.6) | | | (15.0) | | | (4.0) | |
| Share-based compensation expense | Share-based compensation expense | 7.8 | | | 9.5 | | | 6.0 | |
| Bad debt and returns expense | Bad debt and returns expense | 2.3 | | | 1.5 | | | 2.0 | |
| Gain on sale of assets | Gain on sale of assets | (3.7) | | | (9.8) | | | — | |
| Acquisition contingent consideration adjustment | — | | | 0.7 | | | (0.4) | |
| Debt extinguishment cost | Debt extinguishment cost | — | | | 11.3 | | | — | |
| Other, net | Other, net | 1.0 | | | 1.6 | | | 2.6 | |
| Changes in operating assets and liabilities: | Changes in operating assets and liabilities: | |
| Receivables | |
| Receivables | |
| Receivables | Receivables | (46.3) | | | (20.3) | | | 26.0 | |
| Inventories | Inventories | (68.3) | | | (56.0) | | | 18.3 | |
| Accounts payable | Accounts payable | 7.7 | | | 19.1 | | | 8.5 | |
| Employee compensation and benefits | Employee compensation and benefits | (14.8) | | | 8.3 | | | (10.0) | |
| Other assets and liabilities | Other assets and liabilities | (10.2) | | | 0.5 | | | (2.3) | |
| Net cash (used in) provided by operating activities | (25.1) | | | 69.4 | | | 133.8 | |
| Net cash provided by (used in) operating activities | |
| INVESTING ACTIVITIES | INVESTING ACTIVITIES | |
| Purchases of property, plant and equipment | Purchases of property, plant and equipment | (25.0) | | | (19.4) | | | (29.9) | |
| Proceeds from disposals of property, plant and equipment | — | | | — | | | 0.1 | |
| Purchase of intangible asset | — | | | (0.1) | | | (0.1) | |
| Proceeds from sale of assets, net of cash divested | 4.1 | | | 24.7 | | | — | |
| Purchases of property, plant and equipment | |
| Purchases of property, plant and equipment | |
| Investment in leased assets | Investment in leased assets | (4.3) | | | (3.7) | | | — | |
| Cash received from leased assets | Cash received from leased assets | 0.6 | | | 0.2 | | | — | |
| Proceeds from sale of assets, net of cash divested | |
| Other, net | |
| Net cash (used in) provided by investing activities | Net cash (used in) provided by investing activities | (24.5) | | | 1.7 | | | (29.9) | |
| FINANCING ACTIVITIES | FINANCING ACTIVITIES | |
| Proceeds from borrowings | |
| Proceeds from borrowings | |
| Proceeds from borrowings | Proceeds from borrowings | 52.0 | | | 315.8 | | | 126.4 | |
| Repayments of borrowings | Repayments of borrowings | (19.1) | | | (362.0) | | | (157.5) | |
| Debt extinguishment payment | Debt extinguishment payment | — | | | (8.4) | | | — | |
| Contingent consideration payments | Contingent consideration payments | — | | | (2.5) | | | — | |
| Change in finance lease obligations | Change in finance lease obligations | — | | | 0.1 | | | (0.2) | |
| (Repurchases) proceeds from exercise of stock options, net of employee tax withholdings obligations | (0.9) | | | 5.0 | | | 4.9 | |
| Purchase of noncontrolling owner interest | — | | | — | | | (0.1) | |
| Proceeds (repurchases) from exercise of stock options, net of employee tax withholdings obligations | |
| Dividends paid | Dividends paid | (18.9) | | | (17.5) | | | (16.3) | |
| Repurchases of common stock | Repurchases of common stock | (5.0) | | | (15.0) | | | — | |
| Net cash provided by (used in) financing activities | 8.1 | | | (84.5) | | | (42.8) | |
| Net cash (used in) provided by financing activities | |
| Effect of exchange rate changes on cash, cash equivalents and restricted cash | Effect of exchange rate changes on cash, cash equivalents and restricted cash | (4.7) | | | (4.0) | | | 5.3 | |
| Net (decrease) increase in cash, cash equivalents and restricted cash | (46.2) | | | (17.4) | | | 66.4 | |
| Net increase (decrease) in cash, cash equivalents and restricted cash | |
| Cash, cash equivalents and restricted cash at beginning of year | Cash, cash equivalents and restricted cash at beginning of year | 123.6 | | | 141.0 | | | 74.6 | |
| Cash, cash equivalents and restricted cash at end of year | Cash, cash equivalents and restricted cash at end of year | $ | 77.4 | | | $ | 123.6 | | | $ | 141.0 | |
| | SUPPLEMENTAL CASH FLOW INFORMATION | SUPPLEMENTAL CASH FLOW INFORMATION | |
| Years ended December 31 | |
| Years ended December 31 | |
| Years ended December 31 | Years ended December 31 | 2022 | | 2021 | | 2020 | 2023 | | 2022 | | 2021 |
| Cash paid for income taxes | Cash paid for income taxes | $ | 34.1 | | | $ | 19.5 | | | $ | 12.0 | |
| Cash paid for interest | Cash paid for interest | $ | 7.6 | | | $ | 11.7 | | | $ | 18.3 | |
| Supplemental non-cash investing and financing activities: | Supplemental non-cash investing and financing activities: | |
| Capital expenditures in accounts payable | Capital expenditures in accounts payable | $ | 4.1 | | | $ | 3.7 | | | $ | 3.8 | |
| Capital expenditures in accounts payable | |
| Capital expenditures in accounts payable | |
See accompanying notes to consolidated financial statements.
Consolidated Statements of Equity
TENNANT COMPANY AND SUBSIDIARIES
| | (In millions, except shares and per share data) | (In millions, except shares and per share data) | Common Shares | | Common Stock | | Additional Paid-in
Capital | | Retained
Earnings | | Accumulated
Other
Comprehensive
Loss | | Tennant
Company
Shareholders'
Equity | | Noncontrolling
Interest | | Total Equity | (In millions, except shares and per share data) | Common Shares | | Common Stock | | Additional Paid-in
Capital | | Retained
Earnings | | Accumulated
Other
Comprehensive
Loss | | Tennant
Company
Shareholders'
Equity | | Noncontrolling
Interest | | Total Equity |
| Balance, December 31, 2019 | 18,336,010 | | $ | 6.9 | | | $ | 45.5 | | | $ | 346.0 | | | $ | (38.5) | | | $ | 359.9 | | | $ | 1.4 | | | $ | 361.3 | |
| Net income | — | | — | | | — | | | 33.7 | | | — | | | 33.7 | | | — | | | 33.7 | |
| Other comprehensive income | — | | — | | | — | | | — | | | 18.4 | | | 18.4 | | | — | | | 18.4 | |
| Issue stock for directors, employee benefit and stock plans, net of related tax withholdings of 20,494 shares | 167,795 | | — | | | 3.3 | | | — | | | — | | | 3.3 | | | — | | | 3.3 | |
| Share-based compensation | — | | — | | | 6.0 | | | — | | | — | | | 6.0 | | | — | | | 6.0 | |
| Dividends paid $0.89 per common share | — | | — | | | — | | | (16.3) | | | — | | | (16.3) | | | — | | | (16.3) | |
| Purchase of noncontrolling interests | — | | — | | | (0.1) | | | — | | | — | | | (0.1) | | | — | | | (0.1) | |
| Other | — | | — | | | — | | | (0.1) | | | — | | | (0.1) | | | (0.1) | | | (0.2) | |
| Balance, December 31, 2020 | Balance, December 31, 2020 | 18,503,805 | | $ | 6.9 | | | $ | 54.7 | | | $ | 363.3 | | | $ | (20.1) | | | $ | 404.8 | | | $ | 1.3 | | | $ | 406.1 | |
| Net income | Net income | — | | — | | | — | | | 64.9 | | | — | | | 64.9 | | | — | | | 64.9 | |
| Other comprehensive loss | Other comprehensive loss | — | | — | | | — | | | — | | | (17.8) | | | (17.8) | | | — | | | (17.8) | |
| Issue stock for directors, employee benefit and stock plans, net of related tax withholdings of 35,061 shares | Issue stock for directors, employee benefit and stock plans, net of related tax withholdings of 35,061 shares | 228,293 | | 0.1 | | | 4.9 | | | — | | | — | | | 5.0 | | | — | | | 5.0 | |
| Share-based compensation | Share-based compensation | — | | — | | | 9.5 | | | — | | | — | | | 9.5 | | | — | | | 9.5 | |
| Dividends paid $0.94 per common share | Dividends paid $0.94 per common share | — | | — | | | — | | | (17.5) | | | — | | | (17.5) | | | — | | | (17.5) | |
| Repurchases of common stock | Repurchases of common stock | (196,982) | | — | | | (15.0) | | | — | | | — | | | (15.0) | | | — | | | (15.0) | |
| Other | Other | — | | — | | | — | | | (0.1) | | | — | | | (0.1) | | | — | | | (0.1) | |
| Balance, December 31, 2021 | Balance, December 31, 2021 | 18,535,116 | | $ | 7.0 | | | $ | 54.1 | | | $ | 410.6 | | | $ | (37.9) | | | $ | 433.8 | | | $ | 1.3 | | | $ | 435.1 | |
| Net income | Net income | — | | — | | | — | | | 66.3 | | | — | | | 66.3 | | | — | | | 66.3 | |
| Other comprehensive loss | Other comprehensive loss | — | | — | | | — | | | — | | | (12.3) | | | (12.3) | | | — | | | (12.3) | |
| Issue stock for directors, employee benefit and stock plans, net of related tax withholdings of 27,653 shares | Issue stock for directors, employee benefit and stock plans, net of related tax withholdings of 27,653 shares | 66,125 | | — | | | (0.9) | | | — | | | — | | | (0.9) | | | — | | | (0.9) | |
| Share-based compensation | Share-based compensation | — | | — | | | 7.8 | | | — | | | — | | | 7.8 | | | — | | | 7.8 | |
| Dividends paid $1.015 per common share | Dividends paid $1.015 per common share | — | | — | | | — | | | (18.9) | | | — | | | (18.9) | | | — | | | (18.9) | |
| Repurchases of common stock | Repurchases of common stock | (79,756) | | — | | | (5.0) | | | — | | | — | | | (5.0) | | | — | | | (5.0) | |
| Balance, December 31, 2022 | Balance, December 31, 2022 | 18,521,485 | | $ | 7.0 | | | $ | 56.0 | | | $ | 458.0 | | | $ | (50.2) | | | $ | 470.8 | | | $ | 1.3 | | | $ | 472.1 | |
| Net income | |
| Other comprehensive income | |
| Issue stock for directors, employee benefit and stock plans, net of related tax withholdings of 23,622 shares | |
| Share-based compensation | |
| Dividends paid $1.075 per common share | |
| Repurchases of common stock | |
| Balance, December 31, 2023 | |
See accompanying notes to consolidated financial statements.
NOTES TO THE CONSOLIDATED FINANCIAL STATEMENTS
(Tables in millions, except shares and per share data)
1. Operations and Summary of Significant Accounting Policies
Nature of Operations – Tennant Company ("the Company", "we", "us", or "our") is a world leader in designing, manufacturing and marketing solutions that empower customers to achieve quality cleaning performance, reduce environmental impact and help create a cleaner, safer, healthier world. The Company is committed to creating and commercializing breakthrough, sustainable cleaning innovations to enhance its broad suite of products, including floor maintenance and cleaning equipment, detergent-free and other sustainable cleaning technologies, aftermarket parts and consumables, equipment maintenance and repair service, and asset management solutions.
Our products are used in many types of environments, including retail establishments, distribution centers, factories and warehouses, public venues such as arenas and stadiums, office buildings, schools and universities, hospitals and clinics, and more.
Customers include contract cleaners to whom organizations outsource facilities maintenance as well as businesses that perform facilities maintenance themselves. The Company reaches these customers through the industry's largest direct sales and service organization and through a strong and well-supported network of authorized distributors worldwide.
Consolidation – The consolidated financial statements include the accounts of the Company and its subsidiaries. All intercompany transactions and balances have been eliminated.
Translation of Non-U.S. Currency – Foreign currency-denominated assets and liabilities have been translated to U.S. dollars at year-end exchange rates, while income and expense items are translated at average exchange rates prevailing during the year. Gains or losses resulting from translation are included as a separate component of accumulated other comprehensive loss. The balance of cumulative foreign currency translation adjustments recorded within accumulated other comprehensive loss as of December 31, 2023, 2022 2021 and 20202021 was a net loss of $45.6 million, $53.9 million $36.0 million and $19.1$36.0 million, respectively. The majority of translation adjustments are not adjusted for income taxes as substantially all translation adjustments relate to permanent investments in non-U.S. subsidiaries. Net foreign currency transaction losses are included in income before income taxes on the consolidated statements of income.
Use of Estimates – The preparation of our consolidated financial statements in conformity with U.S. generally accepted accounting principles (“U.S. GAAP”) requires us to make estimates and assumptions that affect the amounts reported in these consolidated financial statements and accompanying notes, disclosures of contingent assets and liabilities at the date of the financial statements and the reported amounts of revenues and expenses during the reporting period. Estimates are used in determining, among other items, sales promotions and incentives accruals, inventory valuation, warranty reserves, allowance for doubtful accounts, pension and postretirement accruals, useful lives for intangible assets, and future cash flows associated with impairment testing for goodwill and other long-lived assets. Actual results could differ from our estimates.
Cash and Cash Equivalents – We consider all highly liquid investments with original maturities of three months or less from the date of purchase to be cash equivalents.
Restricted Cash – We have a total of $0.2 million and $0.5 million as of December 31, 20222023 and 20212022 that serves as collateral backing certain bank guarantees and is therefore restricted. This money is invested in time deposits. Restricted cash is recorded in cash, cash equivalents and restricted cash on the consolidated balance sheets.
Receivables – Credit is granted to our customers in the normal course of business. Receivables are recorded at original carrying value less reserves for estimated uncollectible accounts and sales returns. To assess the collectability of these receivables, we perform ongoing credit evaluations of our customers’ financial condition. Through these evaluations, we may become aware of a situation where a customer may not be able to meet its financial obligations due to deterioration of its financial viability, credit ratings or bankruptcy. The reserve requirements are based on the best facts available to us and are reevaluated and adjusted as additional information becomes available.
NOTES TO THE CONSOLIDATED FINANCIAL STATEMENTS
(Tables in millions, except shares and per share data)
Our reserves are also based on amounts determined by using percentages applied to trade receivables, using a loss rate method. We considered the following in determining the expected loss rate: (1) historical loss rate, (2) macroeconomic factors, and (3) creditworthiness of customers. The historical loss rate is calculated by taking the yearly write-off expense, net of collections, as a percentage of the annual average balance of trade receivables for each of the past three years. An account is considered past-due or delinquent when it has not been paid within the contractual terms. Uncollectible accounts are written off against the reserves when it is deemed that a customer account is uncollectible.
Inventories – Inventories are valued at the lower of cost or net realizable value. Cost is determined on a first-in, first-out (“FIFO”) basis except for inventories in North America, which are determined on a last-in, first-out (“LIFO”) basis.
Property, Plant and Equipment – Property, plant and equipment is carried at cost. Additions and improvements that extend the lives of the assets are capitalized, while expenditures for repairs and maintenance are expensed as incurred. We generally depreciate buildings and improvements by the straight-line method over a life of 30 years. Other property, plant and equipment are generally depreciated using the straight-line method based on lives of 3 years to 15 years.
Leases – We assess whether an arrangement is a lease at inception.
Operating leases with an initial term of 12 months or less are expensed as incurred as short-term lease cost. We have elected the practical expedient to not separate lease and non-lease components for all asset classes. Operating lease assets and operating lease liabilities are calculated based on the present value of the future lease payments over the lease term at the lease commencement date. When future lease payments are based on an index or rate, operating lease assets and operating lease liabilities are calculated using the prevailing index or rate at the lease commencement date. As the implicit rate is not readily determinable, we use our incremental borrowing rate based on the information available at the lease start date in determining the present value of future payments. Information used in determining the incremental borrowing rates for the Company's leases includes: (1) the market yield on the Company's traded bond, adjusted for the presence of collateral and the difference in terms of the bond and the leases, (2) consideration of the currency in which each lease was denominated, and (3) the lease term. The operating lease asset is increased by any lease payments made at or before the lease start date, increased by initial direct costs incurred, and reduced by lease incentives. The lease term includes options to renew or terminate the lease when it is reasonably certain that we will exercise that option. The exercise of lease renewal options is at our sole discretion. The useful life of lease assets and leasehold improvements are limited by the lease term, unless there is a transfer of title or purchase option reasonably certain of exercise. Certain leases also include options to purchase the leased asset. Lease expense for operating leases is recognized on a straight-line basis over the lease term. Certain leases contain variable lease payments for items such as index-based changes in rent, fuel and common area maintenance, which we expense as incurred as variable lease cost.
Finance leases are not material to our consolidated financial statements.
Goodwill – Goodwill represents the excess of cost over the fair value of net assets of businesses acquired and is allocated to our reporting units at the time of the acquisition. We analyze goodwill on an annual basis as of October 1 and when an event occurs or circumstances change that may reduce the fair value of one of our reporting units below its carrying amount. We have the option of first analyzing qualitative factors to determine whether it is more likely than not that the fair value of any reporting unit is less than its carrying amount. However, we may elect to perform a quantitative goodwill impairment test in lieu of the qualitative test.
In 2022,2023, we performed a quantitativequalitative goodwill test on all reporting units. Our tests indicated that there was no goodwill impairment in any of our reporting units as of our annual assessment date.
Intangible Assets – Intangible assets consist of definite lived customer lists, trade names and technology. Generally, intangible assets classified as trade names are amortized on a straight-line basis and intangible assets classified as customer lists or technology are amortized using an accelerated method of amortization.
NOTES TO THE CONSOLIDATED FINANCIAL STATEMENTS
(Tables in millions, except shares and per share data)
Impairment of Long-Lived Assets and Assets Held for Sale – We periodically review our intangible and long-lived assets for impairment and assess whether events or circumstances indicate that the carrying amount of the assets may not be recoverable. We generally deem an asset group to be impaired if an estimate of undiscounted future operating cash flows is less than its carrying amount. If impaired, an impairment loss is recognized based on the excess of the carrying amount of the individual asset group over its fair value.
Assets held for sale are measured at the lower of their carrying value or fair value less costs to sell. Upon retirement or disposition, the asset cost and related accumulated depreciation or amortization are removed from the accounts and a gain or loss is recognized based on the difference between the fair value of proceeds received and carrying value of the assets held for sale.
Purchase of Common Stock – We repurchase our common stock under 2016 and 2015 repurchase programsprogram authorized by our Board of Directors. These programs allowThis program allows us to repurchase up to an aggregate of 1,112,333821,413 shares of our common stock. Upon repurchase, the par value is charged to common stock and the remaining purchase price is charged to additional paid-in capital. If the amount of the remaining purchase price causes the additional paid-in capital account to be in a negative position, this amount is then reclassified to retained earnings. Common stock repurchased is included in shares authorized but is not included in shares outstanding.
Warranty – We record a liability for estimated warranty claims at the time of sale. The amount of the liability is based on the trend in the historical ratio of claims to sales, the historical length of time between the sale and resulting warranty claim, new product introductions and other factors. In the event we determine that our current or future product repair and replacement costs exceed our estimates, an adjustment to these reserves would be charged to earnings in the period such determination is made. Warranty terms on machines range from one to four years. Warranty costs are recorded as a component of selling and administrative expense in the consolidated statements of income.
Pension and Profit Sharing Plans – Substantially all U.S. employees are covered by various retirement benefit plans, including postretirement medical plans and defined contribution savings plans. Retirement benefits for eligible employees in foreign locations are funded principally through defined benefit plans, annuity or government programs.
Postretirement Benefits – We accrue and recognize the cost of retiree health benefits over the employees’ period of service based on actuarial estimates. Benefits are only available for U.S. employees hired before January 1, 1999.
Derivative Financial Instruments – The Company uses cross-currency swaps, interest rate swaps and foreign exchange forward and option contracts to manage risks generally associated with foreign exchange rate and interest rate volatility. We account for our hedging instruments as either assets or liabilities on the consolidated balance sheets and measure them at fair value. Gains and losses resulting from changes in fair value are accounted for depending on the use of the derivative and whether it is designated and qualifies for hedge accounting. Gains and losses for all instruments that do not qualify for hedge accounting are recorded each period to net foreign currency transaction loss in our consolidated statements of income. Changes in the fair value of designated hedges are reported in accumulated other comprehensive loss on the consolidated balance sheet until a related transaction occurs. If the underlying hedged transaction ceases to exist, all changes in fair value of the related derivatives that have not been settled are recorded in our consolidated statements of income.
NOTES TO THE CONSOLIDATED FINANCIAL STATEMENTS
(Tables in millions, except shares and per share data)
Revenue Recognition – Revenue is recognized when control transfers under the terms of the contract with our customers. Revenue is measured as the amount of consideration we expect to receive in exchange for transferring goods or providing services. Sales and other taxes we collect concurrent with revenue-producing activities are excluded from revenue. We do not account for shipping and handling as a distinct performance obligation as we generally perform shipping and handling activities after we transfer control of goods to the customer. We have elected to account for shipping and handling costs associated with outbound freight after control of goods has transferred to a customer as a fulfillment cost. Incidental items that are immaterial in the context of the contract are not recognized as a separate performance obligation. We do not have any significantly extended payment terms as payment is generally received within one year of the point of sale.
In general, we transfer control and recognize a sale at the point in time when products are shipped from our manufacturing facilities both direct to consumers and to distributors. Service revenue is recognized in the period the service is performed or ratably over the period of the related service contract. Consideration related to service contracts is deferred if the proceeds are received in advance of the satisfaction of the performance obligations and recognized over the contract period as the performance obligation is met. We use an output method to measure progress toward completion for certain prepaid service contracts, as this method appropriately depicts performance toward satisfaction of the performance obligations.
For contracts with multiple performance obligations (i.e., a product and service component), we allocate the transaction price to the performance obligations in proportion to their stand-alone selling prices. We use an observable price to determine the stand-alone selling price for separate performance obligations. When allocating on a relative stand-alone selling price basis, any discounts contained within the contract are allocated proportionately to all of the performance obligations in the contract.
We generally expense the incremental costs of obtaining a contract when incurred because the amortization period would be less than one year. These costs relate primarily to sales commissions and are recorded in selling and administrative expense in the consolidated statements of income.
We do not disclose the value of unsatisfied performance obligations for contracts with an original expected length of one year or less. In addition, we do not adjust the promised amount of consideration for the effects of a significant financing component if we expect, at contract inception, that the period between when we transfer a promised good or service to a customer and when the customer pays for that good or service will be one year or less.
Share-Based Compensation – We account for share-based compensation awards on a fair value basis. The estimated grant date fair value of each option award is recognized in income on a straight-line basis over the requisite service period (generally the vesting period). The estimated fair value of each option award is calculated using the Black-Scholes option-pricing model. From time to time, we have elected to modify the terms of the original grant. These modified grants are accounted for as a new award and measured using the fair value method, resulting in the inclusion of additional compensation expense in our consolidated statements of income.
Restricted share awards and units are recorded as compensation cost over the requisite service periods based on the market value on the date of grant. To determine the amount of compensation cost to be recognized in each period for these awards and for option awards, we account for forfeitures as they occur.
Performance share awards (PSUs) are stock awards where the ultimate number of shares issued will be contingent on the Company’s performance against certain performance goals. The Compensation Committee has the ability to adjust performance goals or modify the manner of measuring or evaluating a performance goal using its discretion. The fair value of each PSU is based on the market value on the date of grant. We recognize expense related to the estimated vesting of our PSUs granted. The estimated vesting of the PSUs is based on the probability of achieving certain performance metrics over the specified performance period. To determine the amount of compensation cost to be recognized in each period, we estimate forfeitures.
Research and Development – Research and development costs are expensed as incurred.
NOTES TO THE CONSOLIDATED FINANCIAL STATEMENTS
(Tables in millions, except shares and per share data)
Advertising Costs – We advertise products, technologies and solutions to customers and prospective customers through a variety of marketing campaign and promotional efforts. These efforts include tradeshows, online advertising, e-mail marketing, mailings, sponsorships and telemarketing. Advertising costs are expensed as incurred. In 2023, 2022 2021 and 2020,2021, such activities amounted to $4.6 million, $4.0 million $4.6 million and $5.0$4.6 million, respectively.
Income Taxes – Deferred tax assets and liabilities are recognized for the expected future tax consequences of temporary differences between the book and tax bases of existing assets and liabilities. A valuation allowance is provided when, in management’s judgment, it is more likely than not that some portion or all of the deferred tax asset will not be realized. We have established uncertain tax position accruals using management’s best judgment. We adjust these accruals as facts and circumstances change. Interest expense is recognized in the first period the interest would begin accruing. Penalties are recognized in the period we claim or expect to claim the position in our tax return. Interest and penalty expenses are classified as an income tax expense.
Earnings Per Share – Basic earnings per share is computed by dividing net earnings attributable to Tennant Company by the weighted average shares outstanding during the period. Diluted earnings per share assumes conversion of potentially dilutive stock options, performance shares, restricted shares and restricted stock units. These are not included in our computation of diluted earnings per share if we have a net loss attributable to the Company in a reporting period or if the instrument's effects are anti-dilutive.
NOTES TO THE CONSOLIDATED FINANCIAL STATEMENTS
(Tables in millions, except shares and per share data)
2. Newly Adopted Accounting Pronouncements
Income Taxes
OnIn January 1, 2021, we adopted Accounting Standards Update ("ASU") No. 2019-12, Income Taxes (Topic 740): Simplifying the Accounting for Income Taxes, which simplifies the accounting for income taxes by removing certain exceptions to the general principles in Topic 740. The impact of this amended guidance on our consolidated financial statements and related disclosures was immaterial.
Defined Benefit Plans
In December 2022, we adopted ASU No. 2018-14, Compensation-Retirement Benefits-Defined Benefit Plans-General (Subtopic 715-20): Disclosure Framework-Changes to the Disclosure Requirements for Defined Benefit Plans, which updates disclosure requirements for defined benefit pension and other postretirement plans. Adoption of this ASU did not have a material impact on our consolidated financial statements.
Reference Rate Reform
In March 2020, the Financial Accounting Standards Board ("FASB") issued ASU No. 2020-04, Reference Rate Reform (Topic 848). This ASU provides optional expedients to applying generally accepted accounting principles to certain contract modifications, hedging relationships, and other transactions affected by the reference rate reform, which affects the London Inter-bank Offered Rate ("LIBOR"), if certain criteria are met. The amendments were effective March 12, 2020 through December 31, 2022. There has been no material impact to our financial condition, results of operations, or cash flows from reference rate reform as of December 31, 2022. See Note 9 for information on the replacement of LIBOR with the Secured Overnight Financing Rate ("SOFR") in our Credit Agreements (defined below) on November 17, 2022.
Financial Instruments
On January 1, 2020, we adopted ASU No. 2016-13,Financial Instruments-Credit Losses (Topic 326): Measurement of Credit Losses on Financial Instruments, and all related amendments. This ASU improves financial reporting by requiring more timely recording of credit losses on loans and other financial instruments held by financial institutions and other organizations. Under the new guidance, the ASU requires an organization to measure all expected credit losses for financial assets held at the reporting date based on historical experience, current conditions, and reasonable supportable forecasts. We evaluated the impact of this amended guidance on our consolidated financial statements and related disclosures and concluded that it was immaterial.
NOTES TO THE CONSOLIDATED FINANCIAL STATEMENTS
(Tables in millions, except shares and per share data)
3. Revenue
Revenue is recognized upon transfer of control of promised products or services to customers in an amount that reflects the consideration we expect to receive in exchange for those products and services. Generally, these criteria are met at the time the product is shipped.
We also enter into contracts that can include combinations of products and services, which are generally capable of being distinct and are accounted for as separate performance obligations. Revenue is recognized net of allowances for returns and any taxes collected from customers, which are subsequently remitted to governmental authorities.
Disaggregation of Revenue
The following tables illustrate the disaggregation of revenue by geographic area, groups of similar products and services and sales channels for the years ended December 31:
Net sales by geographic area
| | 2022 | | 2021 | | 2020 |
| 2023 | | | 2023 | | 2022 | | 2021 |
| Americas | Americas | $ | 705.9 | | | $ | 658.3 | | | $ | 631.0 | |
| Europe, Middle East and Africa (EMEA) | Europe, Middle East and Africa (EMEA) | 301.6 | | | 331.9 | | | 278.2 | |
| Asia Pacific (APAC) | Asia Pacific (APAC) | 84.7 | | | 100.6 | | | 91.8 | |
| Total | Total | $ | 1,092.2 | | | $ | 1,090.8 | | | $ | 1,001.0 | |
Net sales are attributed to each geographic area based on the end user country and are net of intercompany sales.
NOTES TO THE CONSOLIDATED FINANCIAL STATEMENTS
(Tables in millions, except shares and per share data)
Net sales by groups of similar products and services
| | 2022 | | 2021 | | 2020 |
| 2023 | | | 2023 | | 2022 | | 2021 |
| Equipment | Equipment | $ | 664.0 | | | $ | 679.9 | | | $ | 629.7 | |
| Parts and consumables | Parts and consumables | 263.1 | | | 249.3 | | | 205.8 | |
Specialty surface coatings(a) | Specialty surface coatings(a) | — | | | 1.5 | | | 22.7 | |
| Service and other | Service and other | 165.1 | | | 160.1 | | | 142.8 | |
| Total | Total | $ | 1,092.2 | | | $ | 1,090.8 | | | $ | 1,001.0 | |
(a)On February 1, 2021, we sold our Coatings business. Further details regarding the sale are discussed in Note 5.
Net sales by sales channel
| | | | | | | | | | | | | | | | | |
| 2022 | | 2021 | | 2020 |
| Sales direct to consumer | $ | 712.6 | | | $ | 692.4 | | | $ | 664.9 | |
| Sales to distributors | 379.6 | | | 398.4 | | | 336.1 | |
| Total | $ | 1,092.2 | | | $ | 1,090.8 | | | $ | 1,001.0 | |
NOTES TO THE CONSOLIDATED FINANCIAL STATEMENTS
(Tables in millions, except shares and per share data)
| | | | | | | | | | | | | | | | | |
| 2023 | | 2022 | | 2021 |
| Sales direct to consumer | $ | 854.4 | | | $ | 712.6 | | | $ | 692.4 | |
| Sales to distributors | 389.2 | | | 379.6 | | | 398.4 | |
| Total | $ | 1,243.6 | | | $ | 1,092.2 | | | $ | 1,090.8 | |
Contract Liabilities
Sales Returns
The right of return may exist explicitly or implicitly with our customers. When the right of return exists, we adjust the transaction price for the estimated effect of returns. We estimate the expected returns using the expected value method by assessing historical sales levels and the timing and magnitude of historical sales return levels as a percent of sales and projecting this experience into the future.
Sales Incentives
Our sales contracts may contain various customer incentives, such as volume-based rebates or other promotions. We reduce the transaction price for certain customer programs and incentive offerings that represent variable consideration. Sales incentives given to our customers are recorded using the most likely amount approach for estimating the amount of consideration to which the Company will be entitled. We forecast the most likely amount of the incentive to be paid at the time of sale, update this forecast quarterly, and adjust the transaction price accordingly to reflect the new amount of incentives expected to be earned by the customer. A majority of our customer incentives are settled within one year. We record our accruals for volume-based rebates and other promotions in other current liabilities on our consolidated balance sheets.
The change in our sales incentive accrual balance for the years ended December 31, 20222023 and 20212022 was as follows:
| | 2022 | | 2021 |
| 2023 | | | 2023 | | 2022 |
| Beginning balance | Beginning balance | $ | 19.9 | | | $ | 12.1 | |
| Additions to sales incentive accrual | Additions to sales incentive accrual | 22.5 | | | 38.0 | |
| Contract payments | Contract payments | (21.8) | | | (30.0) | |
| Foreign currency fluctuations | Foreign currency fluctuations | (0.6) | | | (0.2) | |
| Ending balance | Ending balance | $ | 20.0 | | | $ | 19.9 | |
Deferred Revenue
We sell separately priced prepaid contracts to our customers where we receive payment at the inception of the contract and defer recognition of the consideration received because we have to satisfy future performance
NOTES TO THE CONSOLIDATED FINANCIAL STATEMENTS
(Tables in millions, except shares and per share data)
obligations. Our deferred revenue balance is primarily attributed to prepaid maintenance contracts on our machines ranging from 12 months to 60 months. In circumstances where prepaid contracts are sold simultaneously with machines, we use an observable price to determine stand-alone selling price for separate performance obligations.
The change in the deferred revenue balance for the years ended December 31, 20222023 and 20212022 was as follows:
| | | | | | | | | | | |
| 2022 | | 2021 |
| Beginning balance | $ | 11.2 | | | $ | 9.3 | |
| Increase in deferred revenue representing our obligation to satisfy future performance obligations | 24.2 | | | 34.5 | |
| Decrease in deferred revenue for amounts recognized in net sales for satisfied performance obligations | (25.5) | | | (32.5) | |
| Foreign currency fluctuations | (0.6) | | | (0.1) | |
| Ending balance | $ | 9.3 | | | $ | 11.2 | |
NOTES TO THE CONSOLIDATED FINANCIAL STATEMENTS
(Tables in millions, except shares and per share data)
| | | | | | | | | | | |
| 2023 | | 2022 |
| Beginning balance | $ | 9.3 | | | $ | 11.2 | |
| Increase in deferred revenue representing our obligation to satisfy future performance obligations | 21.7 | | | 24.2 | |
| Decrease in deferred revenue for amounts recognized in net sales for satisfied performance obligations | (20.8) | | | (25.5) | |
| Foreign currency fluctuations | 0.1 | | | (0.6) | |
| Ending balance | $ | 10.3 | | | $ | 9.3 | |
As of December 31, 2022, $6.62023, $7.9 million and $2.7$2.4 million of deferred revenue was reported in other current liabilities and other liabilities, respectively, on our consolidated balance sheets. Of this, we expect to recognize the following approximate amounts in net sales in the following periods:
| | 2023 | $ | 6.6 | |
| 2024 | 2024 | 1.7 | |
| 2025 | 2025 | 0.7 | |
| 2026 | 2026 | 0.2 | |
| 2027 | 2027 | 0.1 | |
| 2028 | |
| Thereafter | Thereafter | — | |
| Total | Total | $ | 9.3 | |
As of December 31, 2021, $7.72022, $6.6 million and $3.5$2.7 million of deferred revenue was reported in other current liabilities and other liabilities, respectively, on our consolidated balance sheets.
4. Management Actions
Restructuring Actions
In 20222023 and 2021,2022, we incurred restructuring expenses as part of our ongoing global reorganization efforts. The following pre-tax restructuring charges were included in the consolidated statements of income:
| | 2022 | | 2021 |
| 2023 | | | 2023 | | 2022 |
| Severance-related costs - Selling and administrative expense | Severance-related costs - Selling and administrative expense | $ | 2.2 | | | $ | 3.3 | |
| Severance-related costs - Cost of sales | Severance-related costs - Cost of sales | — | | | 0.8 | |
Other costs - Selling and administrative expense(a) | Other costs - Selling and administrative expense(a) | 1.6 | | | — | |
Other costs - Cost of sales(a) | Other costs - Cost of sales(a) | 0.3 | | | — | |
| Total pre-tax restructuring costs | Total pre-tax restructuring costs | $ | 4.1 | | | $ | 4.1 | |
(a)Includes facility exit costs associated with facility moves.
The charges in 20222023 impacted allthe Europe, Middle East (EMEA) and Asia Pacific (APAC) operating segments. The charges in 2021 primarily2022 impacted the EMEA and APACall operating segments. Our restructuring actions represent the
NOTES TO THE CONSOLIDATED FINANCIAL STATEMENTS
(Tables in millions, except shares and per share data)
continued execution of a multi-year enterprise strategy to drive increased productivity throughout our operations.
A reconciliation to the ending liability balance of severance and related costs as of December 31, 20222023 is as follows:
| | | | | | | | | | | |
| 2022 | | 2021 |
| Beginning balance | $ | 4.9 | | | $ | 4.5 | |
| New charges | 2.2 | | | 4.1 | |
| Cash payments | (2.9) | | | (2.9) | |
| Foreign currency adjustments | (0.5) | | | (0.2) | |
| Adjustment to accrual | (2.0) | | | (0.6) | |
| Ending balance | $ | 1.7 | | | $ | 4.9 | |
Other Actions
In 2019, we made the decision to exit certain product lines to reflect our estimate of inventory that would not be sold. During the year ended December 31, 2020, we recorded an additional $1.7 million in cost of sales in
NOTES TO THE CONSOLIDATED FINANCIAL STATEMENTS
(Tables in millions, except shares and per share data)
the consolidated statements of income to reflect our estimate of inventory that would not be sold, all of which was recorded in the first quarter of 2020. | | | | | | | | | | | |
| 2023 | | 2022 |
| Beginning balance | $ | 1.7 | | | $ | 4.9 | |
| New charges | 3.2 | | | 2.2 | |
| Cash payments | (1.9) | | | (2.9) | |
| Foreign currency adjustments | — | | | (0.5) | |
| Adjustment to accrual | (0.6) | | | (2.0) | |
| Ending balance | $ | 2.4 | | | $ | 1.7 | |
5. Acquisitions and Divestitures
Sale of buildingBuilding
During the second quarter of 2022, we sold a building located in Golden Valley, Minnesota. The resulting pre-tax gain was $3.7 million and is reflected within gain on sale of assets in the consolidated statements of income. Proceeds from sale of assets waswere $4.1 million.
Sale of Coatings businessBusiness
During the first quarter of 2021, we sold the Coatings business. The resulting pre-tax gain was $9.8 million and is reflected within gain on sale of business in the consolidated statements of income. Proceeds from sale of business, net of cash divested, waswere $24.7 million.
Acquisition of Gaomei
On January 4, 2019, we completed the acquisition of Hefei Gaomei Cleaning Machines Co., Ltd. and Anhui Rongen Environmental Protection Technology Co., Ltd. (collectively "Gaomei"), privately held designers and manufacturers of commercial cleaning solutions based in China. The financial results for Gaomei have been included in the consolidated financial results since the date of closing. The total purchase price included $22.4 million of payments and related adjustments paid in 2019 and contingent consideration payments totaling $2.5 million paid in 2021.
NOTES TO THE CONSOLIDATED FINANCIAL STATEMENTS
(Tables in millions, except shares and per share data)
6. Inventories
Inventories as of December 31 consisted of the following:
| | 2022 | | 2021 |
| 2023 | | | 2023 | | 2022 |
| Inventories carried at LIFO: | Inventories carried at LIFO: | |
Finished goods(a) | |
Finished goods(a) | |
Finished goods(a) | Finished goods(a) | $ | 85.0 | | | $ | 54.0 | |
| Raw materials and work-in-process | Raw materials and work-in-process | 46.4 | | | 42.4 | |
Excess of FIFO over LIFO cost(b) | Excess of FIFO over LIFO cost(b) | (49.7) | | | (43.0) | |
| Total LIFO inventories | Total LIFO inventories | $ | 81.7 | | | $ | 53.4 | |
| | Inventories carried at FIFO: | Inventories carried at FIFO: | |
| Inventories carried at FIFO: | |
| Inventories carried at FIFO: | |
Finished goods(a) | |
Finished goods(a) | |
Finished goods(a) | Finished goods(a) | $ | 68.9 | | | $ | 53.8 | |
| Raw materials and work-in-process | Raw materials and work-in-process | 56.0 | | | 53.4 | |
| Total FIFO inventories | Total FIFO inventories | $ | 124.9 | | | $ | 107.2 | |
| Total inventories | Total inventories | $ | 206.6 | | | $ | 160.6 | |
(a)Finished goods include machines, parts and consumables and component parts that are used in our products.
(b)The difference between replacement cost and the stated LIFO inventory value is not materially different from the reserve for the LIFO valuation method.
Our LIFO charge for the twelve months ended December 31, 2022 was $6.7 million compared to $10.6 million for the twelve months ended December 31, 2021. The increase in each period was attributable to the broad effects of inflation.
NOTES TO THE CONSOLIDATED FINANCIAL STATEMENTS
(Tables in millions, except shares and per share data)
7. Property, Plant and Equipment
Property, plant and equipment and related accumulated depreciation, including equipment under finance leases, as of December 31, consisted of the following:
| | 2022 | | 2021 |
| 2023 | | | 2023 | | 2022 |
| Property, plant and equipment: | Property, plant and equipment: | |
| Land | |
| Land | |
| Land | Land | $ | 22.0 | | | $ | 21.7 | |
| Buildings and improvements | Buildings and improvements | 149.0 | | | 125.7 | |
| Machinery and manufacturing equipment | Machinery and manufacturing equipment | 171.1 | | | 152.6 | |
| Office equipment | Office equipment | 107.7 | | | 125.2 | |
| Construction in progress | Construction in progress | 9.4 | | | 6.0 | |
| Total property, plant and equipment | Total property, plant and equipment | 459.2 | | | 431.2 | |
| Less: accumulated depreciation | Less: accumulated depreciation | (279.3) | | | (258.4) | |
| Property, plant and equipment, net | Property, plant and equipment, net | $ | 179.9 | | | $ | 172.8 | |
Depreciation expense was $36.4 million, $32.8 million in 2022,and $33.1 million in 2023, 2022 and 2021, respectively.
NOTES TO THE CONSOLIDATED FINANCIAL STATEMENTS
(Tables in millions, except shares and $32.6 million in 2020.per share data)
8. Goodwill and Intangible Assets
For purposes of performing our goodwill impairment analysis, we have identified our reporting units as North America, Latin America, EMEA and APAC. In 2021, the Coatings reporting unit was sold and is no longer considered a reporting unit.
We have the option of first analyzing qualitative factors to determine whether it is more likely than not that the fair value of any reporting unit is less than its carrying amount. We may elect to perform a quantitative goodwill impairment test in lieu of the qualitative test, and in 20222023 we performed the quantitativequalitative goodwill test on all reporting units. In 2021,2022, we elected to perform the quantitative goodwill test on our EMEA reporting unit and a qualitative test on our North America, Latin America and APACall reporting units. Based on our analysis, we determined that there was no impairment of goodwill as of December 31, 20222023 and 2021.2022.
The changes in the carrying amount of goodwill are as follows:
| | | | | | | | | | | | | | | | | |
| Goodwill | | Accumulated Impairment Losses | | Total |
| Balance as of December 31, 2022 | $ | 218.8 | | | $ | (36.8) | | | $ | 182.0 | |
| Foreign currency fluctuations | (15.1) | | | 4.0 | | | (11.1) | |
| Balance as of December 31, 2021 | $ | 233.9 | | | $ | (40.8) | | | $ | 193.1 | |
| Divestiture | $ | (1.7) | | | $ | — | | | $ | (1.7) | |
| Foreign currency fluctuations | (13.9) | | | 0.9 | | | (13.0) | |
| Balance as of December 31, 2020 | $ | 249.5 | | | $ | (41.7) | | | $ | 207.8 | |
NOTES TO THE CONSOLIDATED FINANCIAL STATEMENTS
(Tables in millions, except shares and per share data)
| | | | | | | | | | | | | | | | | |
| Goodwill | | Accumulated Impairment Losses | | Total |
| Balance as of December 31, 2023 | $ | 220.7 | | | $ | (33.3) | | | $ | 187.4 | |
| Foreign currency fluctuations | 1.9 | | | 3.5 | | | 5.4 | |
| Balance as of December 31, 2022 | $ | 218.8 | | | $ | (36.8) | | | $ | 182.0 | |
| Foreign currency fluctuations | (15.1) | | | 4.0 | | | (11.1) | |
| Balance as of December 31, 2021 | $ | 233.9 | | | $ | (40.8) | | | $ | 193.1 | |
The balances of acquired intangible assets, excluding goodwill, are as follows:
| | Customer
Lists | | Trade Names | | Technology | | Total |
| Balance as of December 31, 2022 | |
| Customer
Lists | | | Customer
Lists | | Trade Names | | Technology | | Total |
| Balance as of December 31, 2023 | |
| Original cost | |
| Original cost | |
| Original cost | Original cost | $ | 146.6 | | | $ | 28.6 | | | $ | 15.9 | | | $ | 191.1 | |
| Accumulated amortization | Accumulated amortization | (87.5) | | | (15.9) | | | (11.3) | | | (114.7) | |
| Carrying amount | Carrying amount | $ | 59.1 | | | $ | 12.7 | | | $ | 4.6 | | | $ | 76.4 | |
| Weighted-average original life (in years) | Weighted-average original life (in years) | 15 | | 11 | | 11 | |
| | Balance as of December 31, 2021 | |
| Balance as of December 31, 2022 | |
| | Balance as of December 31, 2022 | |
| | Balance as of December 31, 2022 | |
| Original cost | |
| Original cost | |
| Original cost | Original cost | $ | 155.4 | | | $ | 30.3 | | | $ | 17.0 | | | $ | 202.7 | |
| Accumulated amortization | Accumulated amortization | (80.0) | | | (13.9) | | | (10.8) | | | (104.7) | |
| Carrying amount | Carrying amount | $ | 75.4 | | | $ | 16.4 | | | $ | 6.2 | | | $ | 98.0 | |
| Weighted-average original life (in years) | Weighted-average original life (in years) | 15 | | 11 | | 11 | |
In 2021, we divested identified intangible assets, excluding goodwill, with a carrying value of $0.9 million and $1.4 million in the categories of customer lists and trade names, respectively, as a result of the sale of the Coatings business discussed in Note 5.
Amortization expense of intangible assets was $14.7 million, $15.9 million $20.0 million and $20.8$20.0 million for the years ended December 31, 2023, 2022 and 2021, respectively.
NOTES TO THE CONSOLIDATED FINANCIAL STATEMENTS
(Tables in millions, except shares and 2020, respectively.per share data)
Estimated aggregate amortization expense based on the current carrying amount of amortizable intangible assets for each of the five succeeding years is as follows:
| | 2023 | $ | 14.5 | |
| 2024 | 2024 | 13.1 | |
| 2025 | 2025 | 11.8 | |
| 2026 | 2026 | 10.5 | |
| 2027 | 2027 | 7.2 | |
| 2028 | |
| Thereafter | Thereafter | 19.3 | |
| Total | Total | $ | 76.4 | |
9. Debt
2021 Credit Agreement
On April 5, 2021, we and certain of our foreign subsidiaries entered into an Amended and Restated Credit Agreement (the “2021 Credit Agreement”) with JPMorgan Chase Bank, N.A. as administrative agent. The 2021 Credit Agreement provides us and certain of our foreign subsidiaries access to a senior secured credit facility until April 3, 2026, consisting of a term loan facility in an amount up to $100.0 million and a revolving facility in an amount up to $450.0 million with an option to expand the credit facility by up to $275.0 million, with the consent of the lenders willing to provide additional borrowings in the form of increases to their revolving facility commitment or funding of incremental term loans. Borrowings may be denominated in U.S. dollars or certain other currencies. The fee for committed funds under the revolving facility of the 2021 Credit Agreement ranges from an annual rate of 0.15% to 0.30%, depending on our leverage ratio.
On November 10, 2022, Tennant Company further amended the 2021 Credit Agreement (the "Amendment") to update the benchmark provisions to replace LIBOR with Term SOFR (as defined in the Amendment) as the reference rate for purposes of calculating interest under the 2021 Credit Agreement. Pursuant to the
NOTES TO THE CONSOLIDATED FINANCIAL STATEMENTS
(Tables in millions, except shares and per share data)
Amendment, borrowings denominated in U.S. dollars bear interest at a rate per annum equal to (a) the Term SOFR Rate (as defined in the Amendment) plus a credit spread adjustment of 0.10% per annum, but in any case, not less than 0%, plus an additional spread of 1.10% to 1.70%, depending on the Company’s leverage ratio, or (b) the Alternate Base Rate (as defined in the Amendement)Amendment), which is the greatest of (i) the prime rate, (ii) the federal funds rate plus 0.50% and (iii) the adjusted Term SOFR Rate for a one month period, but in any case, not less than 1.0%, plus, in any such case, 1.0%, plus an additional spread of 0.10% to 0.70%, depending on the Company’s leverage ratio. All other material terms included in the 2021 Credit Agreement remain unchanged as a result of the Amendment.
In connection with the 2021 Credit Agreement, we reaffirmed our security interest in favor of the lenders in substantially all our personal property and pledged the stock of our domestic subsidiaries and 65% of the stock of our first-tier foreign subsidiaries. The obligations under the 2021 Credit Agreement are also guaranteed by certain of our first-tier domestic subsidiaries, and those subsidiaries also provided a security interest in their similar personal property.
Our 2021 Credit Agreement restricts the payment of dividends or repurchasing of stock requiring that, after giving effect to such payments, no default exists or would result from such payment. Additionally, cash dividends are restricted to $7.5 million per quarter, and approved levels of other restricted payments range from $60.0 million to unlimited based on our net leverage ratio (not taking into account any acquisition holiday) after giving effect to such payment.
NOTES TO THE CONSOLIDATED FINANCIAL STATEMENTS
(Tables in millions, except shares and per share data)
The 2021 Credit Agreement contains customary representations, warranties and covenants, including but not limited to covenants restricting our ability to incur indebtedness and liens and merge or consolidate with another entity. Further, the 2021 Credit Agreement contains the following covenants:
| | | | | |
| • | a covenant requiring us to maintain an indebtedness to EBITDA ratio, determined as of the end of each of our fiscal quarters, of no greater than 3.50 to 1.00, with certain alternative requirements for permitted acquisitions greater than $50.0 million; |
| | | | | |
| • | a covenant requiring us to maintain an EBITDA to interest expense ratio for a period of four consecutive fiscal quarters as of the end of each quarter of no less than 3.00 to 1; and |
| | | | | |
| • | a covenant restricting us from paying dividends or repurchasing stock if, after giving effect to such payments and assuming no default exists or would result from such payment, our leverage ratio is greater than 2.50 to 1, in such case limiting such payments to $60.0 million during any fiscal year. |
Redemption of Senior Notes
In the second quarter of 2021, the Company redeemed $300.0 million principal amount outstanding of its 5.625% Senior Notes due 2025 ("Senior Notes"). We used the proceeds from the borrowings under the 2021 Credit Agreement to retire our Senior Notes and pay the $8.4 million call premium due upon redemption in the second quarter of 2021. In addition, we wrote off $2.9 million of unamortized debt issuance costs in the second quarter of 2021.
Debt outstanding as of December 31 consisted of the following:
| | | | | | | | | | | |
| 2023 | | 2022 |
| Credit facility borrowings: | | | |
| Revolving credit facility borrowings | $ | 110.0 | | | $ | 205.0 | |
| Term loan facility borrowings | 90.0 | | | 95.0 | |
| Finance lease liabilities | 0.6 | | | 0.3 | |
| Total debt | 200.6 | | | 300.3 | |
Less: current portion of long-term debt(a) | (6.4) | | | (5.2) | |
| Long-term debt | $ | 194.2 | | | $ | 295.1 | |
| | | | | |
| (a) | As of December 31, 2023, the Company is required to repay $6.3 million in outstanding credit facility borrowings and $0.1 million of current maturities of finance lease liabilities over the next 12 months. |
As of December 31, 2023, we had outstanding borrowings of $90.0 million and $110.0 million under our term loan facility and revolving facility, respectively. We had letters of credit and bank guarantees outstanding in the amount of $3.2 million, leaving approximately $336.8 million of unused borrowing capacity on our revolving facility. Commitment fees on unused lines of credit for the year ended December 31, 2023 were $0.5 million. The overall weighted average cost of debt is approximately 6.5% and net of a related cross-currency swap instrument is approximately 5.0%. Further details regarding the cross-currency swap instrument are discussed in Note 11.
NOTES TO THE CONSOLIDATED FINANCIAL STATEMENTS
(Tables in millions, except shares and per share data)
Debt outstanding as of December 31 consisted of the following:
| | | | | | | | | | | |
| 2022 | | 2021 |
| Credit facility borrowings: | | | |
| Revolving credit facility borrowings | $ | 205.0 | | | $ | 168.0 | |
| Term loan facility borrowings | 95.0 | | | 98.8 | |
| Secured borrowings | 0.2 | | | 0.7 | |
| Finance lease liabilities | 0.1 | | | 0.1 | |
| Total debt | 300.3 | | | 267.6 | |
Less: current portion of long-term debt(a) | (5.2) | | | (4.2) | |
| Long-term debt | $ | 295.1 | | | $ | 263.4 | |
| | | | | |
(a) | As of December 31, 2022, the Company is required to repay $5.0 million in outstanding credit facility borrowings and $0.2 million of current maturities of secured borrowings over the next 12 months. |
As of December 31, 2022, we had outstanding borrowings of $95.0 million and $205.0 million under our term loan facility and revolving facility, respectively. We had letters of credit and bank guarantees outstanding in the amount of $2.7 million, leaving approximately $242.2 million of unused borrowing capacity on our revolving facility. Commitment fees on unused lines of credit for the year ended December 31, 2022 were $0.8 million. The overall weighted average cost of debt is approximately 5.0% and net of a related cross-currency swap instrument is approximately 4.1%. Further details regarding the cross-currency swap instrument are discussed in Note 11.
The aggregate maturities of our outstanding debt, excluding unamortized debt issuance costs, as of December 31, 2022,2023, are as follows:
| | 2023 | $ | 5.2 | |
| 2024 | 2024 | 6.3 | |
| 2025 | 2025 | 8.8 | |
| 2026 | 2026 | 280.0 | |
| 2027 | 2027 | — | |
| 2028 | |
| Thereafter | Thereafter | — | |
| Total aggregate maturities | Total aggregate maturities | $ | 300.3 | |
NOTES TO THE CONSOLIDATED FINANCIAL STATEMENTS
(Tables in millions, except shares and per share data)
10. Other Current Liabilities
Other current liabilities as of December 31 consisted of the following:
| | 2022 | | 2021 |
| 2023 | | | 2023 | | 2022 |
| Other current liabilities: | Other current liabilities: | |
| Taxes | Taxes | $ | 11.1 | | | $ | 13.8 | |
| Warranty | 7.8 | | | 10.4 | |
| Taxes | |
| Taxes | |
| Warranty reserve | |
| Deferred revenue | Deferred revenue | 6.6 | | | 7.7 | |
| Customer sales incentives | Customer sales incentives | 20.0 | | | 19.9 | |
| Freight | Freight | 6.4 | | | 7.1 | |
| Restructuring | Restructuring | 1.7 | | | 4.9 | |
| Operating leases | Operating leases | 15.0 | | | 16.4 | |
| Cash flow hedge liabilities | — | | | 10.4 | |
| Miscellaneous accrued expenses | Miscellaneous accrued expenses | 17.7 | | | 13.4 | |
| Total other current liabilities | Total other current liabilities | $ | 86.3 | | | $ | 104.0 | |
11. Derivatives
Hedge Accounting and Hedging Programs
We recognize all derivative instruments as either assets or liabilities in our consolidated balance sheets and measure them at fair value. Gains and losses resulting from changes in fair value are accounted for depending on the use of the derivative and whether it is designated and qualifies for hedge accounting.
To receive hedge accounting treatment, all hedging relationships are formally documented at the inception of the hedge. We evaluate hedge effectiveness on our hedges that are designated and qualify for hedge accounting at the inception of the hedge prospectively, as well as retrospectively, and record any ineffective portion of the hedging instruments in net foreign currency transaction loss on our consolidated statements of income. The time value of purchased contracts is recorded in net foreign currency transaction loss in our consolidated statements of income. If we do not elect hedge accounting, or the contract does not qualify for hedge accounting treatment, the changes in fair value from period to period are recorded in net foreign currency transaction losses in our consolidated statements of income.
Our hedging policy establishes maximum limits for each counterparty to mitigate any concentration of risk.
NOTES TO THE CONSOLIDATED FINANCIAL STATEMENTS
(Tables in millions, except shares and per share data)
Balance Sheet Hedges
We hedge our net recognized foreign currency denominated assets and liabilities with foreign exchange forward contracts to reduce the risk that the value of these assets and liabilities will be adversely affected by changes in exchange rates. These contracts hedge assets and liabilities that are denominated in foreign currencies and are carried at fair value as either assets or liabilities on the consolidated balance sheets with changes in the fair value recorded to net foreign currency transaction gain in our consolidated statements of income. These contracts do not subject us to material balance sheet risk due to exchange rate movements because gains and losses on these derivatives are intended to offset gains and losses on the assets and liabilities being hedged. At December 31, 20222023 and December 31, 2021,2022, the notional amounts of foreign currency forward exchange contracts outstanding not designated as hedging instruments were $83.7$73.0 million and $45.0$83.7 million, respectively.
Cash Flow Hedges
We use foreign currency exchange rate derivatives to hedge our exposure to fluctuations in exchange rates for anticipated intercompany cash transactions between Tennant Company and its subsidiaries. We enter into these foreign exchange cross-currency swaps to hedge the foreign currency denominated cash flows
NOTES TO THE CONSOLIDATED FINANCIAL STATEMENTS
(Tables in millions, except shares and per share data)
associated with this intercompany loan, and accordingly, they are not speculative in nature. These cross-currency swaps are designated as cash flow hedges. The hedged cash flows as of December 31, 2021 included €152.4 million of total notional values. The loan and related swaps matured in April 2022.
The Company manages its floating rate debt exposure using interest rate swaps. Fixed rate swaps are used to reduce the Company's risk of the possibility of increased interest costs. The Company entered into an aggregate $120$120.0 million notional amount of interest rate swaps effective December 1, 2022, that exchange a variable rate of interest for a fixed rate of interest of 4.076%. These interest rate swaps are designated as cash flow hedges. These swaps are scheduled to mature on December 1, 2026.
Fair Value Hedges
On April 5, 2022, we entered into Euro to U.S. dollar foreign exchange cross-currency swaps associated with an intercompany loan from a wholly owned European subsidiary. We enter into these foreign exchange cross-currency swaps to hedge the foreign currency risk associated with this intercompany loan, and accordingly, they are not speculative in nature. These cross-currency swaps are designated as fair value hedges. As of December 31, 2022,2023, these cross-currency swaps included €84.8€75.0 million of total notional value. As of December 31, 2022,2023, the aggregated scheduled interest payments over the course of the loan and related swaps amounted to €9.8€7.5 million. The scheduled maturity and principal payment of the loan and related swapsinterest payments of €75.0€82.5 million are due in April 2027.
Net Investment Hedges
On April 5, 2022, we entered into Euro to U.S. dollar foreign exchange cross-currency swaps to hedge our exposure to adverse foreign currency exchange rate movements between Tennant Company and a wholly owned European subsidiary. We enter into these fixed-to-fixed cross-currency swap agreements to protect a designated monetary amount of the Company’s net investment in its Euro functional currency subsidiary against the risk of changes in the Euro to U.S. dollar foreign exchange rate. These cross-currency swaps are designated as net investment hedges. As of December 31, 2022,2023, the cross-currency swaps included €75.0 million of total notional values. These swaps are scheduled to mature in April 2027.
NOTES TO THE CONSOLIDATED FINANCIAL STATEMENTS
(Tables in millions, except shares and per share data)
The fair value of derivative instruments on our consolidated balance sheets as of December 31 consisted of the following:
| | Derivative Assets | | Derivative Liabilities |
| Balance Sheet Location | | December 31, 2022 | | December 31, 2021 | | Balance Sheet Location | | December 31, 2022 | | December 31, 2021 |
| Derivative Assets | | | Derivative Assets | | Derivative Liabilities |
| Balance Sheet Location | | | Balance Sheet Location | | December 31, 2023 | | December 31, 2022 | | Balance Sheet Location | | December 31, 2023 | | December 31, 2022 |
| Derivatives designated as cash flow hedges: | Derivatives designated as cash flow hedges: | |
| Foreign currency forward contracts | Other current assets | | $ | — | | | $ | — | | | Other current liabilities | | $ | — | | | $ | 10.4 | |
| Interest rate swaps | |
| Interest rate swaps | |
| Interest rate swaps | Interest rate swaps | Other current assets | | 0.8 | | | — | | | Other current liabilities | | — | | | — | |
| Interest rate swaps | Interest rate swaps | Other assets | | — | | | — | | | Other liabilities | | 1.8 | | | — | |
| Derivatives designated as fair value hedges: | Derivatives designated as fair value hedges: | |
| Cross-currency swaps | Cross-currency swaps | Other current assets | | 1.4 | | | — | | | Other current liabilities | | — | | | — | |
| Cross-currency swaps | Cross-currency swaps | Other assets | | 0.8 | | | — | | | Other liabilities | | — | | | — | |
| Cross-currency swaps | |
| Cross-currency swaps | |
| Derivatives designated as net investment hedges: | Derivatives designated as net investment hedges: | |
| Cross-currency swaps | |
| Cross-currency swaps | |
| Cross-currency swaps | Cross-currency swaps | Other current assets | | 1.2 | | | — | | | Other current liabilities | | — | | | — | |
| Cross-currency swaps | Cross-currency swaps | Other assets | | 0.5 | | | — | | | Other liabilities | | — | | | — | |
| Derivatives not designated as hedging instruments: | Derivatives not designated as hedging instruments: | |
Foreign currency forward contracts(a) | Foreign currency forward contracts(a) | Other current assets | | 0.1 | | | 0.3 | | | Other current liabilities | | 0.3 | | | 0.4 | |
Foreign currency forward contracts(a) | |
Foreign currency forward contracts(a) | |
(a)Contracts that mature within the next 12 months are included in other current assets and other current liabilities for asset derivatives and liabilities derivatives, respectively, on our consolidated balance sheets. Contracts with maturities greater than 12 months are included in other assets and other liabilities for asset derivatives and liability derivatives, respectively, in our consolidated balance sheets. Amounts included in our consolidated balance sheets are recorded net where a right of offset exists with the same derivative counterparty.
As of December 31, 2022,2023, we anticipate reclassifying approximately $3.2$3.0 million of gains from accumulated other comprehensive loss to net income during the next 12 months.
NOTES TO THE CONSOLIDATED FINANCIAL STATEMENTS
(Tables in millions, except shares and per share data)
The following tables include the amounts in the consolidated statements of income in which the effects of derivative instruments are recorded and the effects of derivative instruments activity on these line items for the years ended December 31, 20222023 and December 31, 2021:2022:
| | 2022 | | 2021 |
| Total | | Amount of Gain (Loss) on Cash Flow
Hedge Activity | | Total | | Amount of Gain (Loss) on Cash Flow
Hedge Activity |
| 2023 | | | 2023 | | 2022 |
| Total | | | Total | | Amount of Gain (Loss) on Cash Flow
Hedge Activity | | Total | | Amount of Gain (Loss) on Cash Flow
Hedge Activity |
| Derivatives designated as cash flow hedges: | Derivatives designated as cash flow hedges: | |
| Net sales | |
| Net sales | |
| Net sales | Net sales | $ | 1,092.2 | | | $ | — | | | $ | 1,090.8 | | | $ | (0.4) | |
| Interest expense, net | Interest expense, net | (7.1) | | | 0.7 | | | (7.3) | | | 2.4 | |
| Net foreign currency transaction loss | Net foreign currency transaction loss | (1.2) | | | 4.7 | | | (0.7) | | | 12.7 | |
| Derivatives designated as fair value hedges: | Derivatives designated as fair value hedges: | |
| Interest expense, net | Interest expense, net | (7.1) | | | 0.9 | | | (7.3) | | | — | |
| Net foreign currency transaction loss | (1.2) | | | 2.0 | | | (0.7) | | | — | |
| Derivatives designated as net investment hedges | |
| Interest expense, net | Interest expense, net | (7.1) | | | 0.7 | | | (7.3) | | | — | |
| Interest expense, net | |
| Net foreign currency transaction loss (gain) | |
| Derivatives designated as net investment hedges: | |
| Interest expense, net | |
| Interest expense, net | |
| Interest expense, net | |
The effect of derivative instruments designated as hedges and derivative instruments not designated as hedges in our consolidated statements of income for the three years ended December 31 were as follows:
| | 2022 | | 2021 | | 2020 |
| 2023 | | | 2023 | | 2022 | | 2021 |
| Derivatives designated as cash flow hedges: | Derivatives designated as cash flow hedges: | |
Net gain (loss) recognized in other comprehensive (loss) income, net of tax(a) | |
Net gain (loss) recognized in other comprehensive (loss) income, net of tax(a) | |
Net gain (loss) recognized in other comprehensive (loss) income, net of tax(a) | Net gain (loss) recognized in other comprehensive (loss) income, net of tax(a) | $ | 3.1 | | | $ | 10.8 | | | $ | (7.4) | |
| Net loss reclassified from accumulated other comprehensive loss into income, net of tax, effective portion to net sales | Net loss reclassified from accumulated other comprehensive loss into income, net of tax, effective portion to net sales | — | | | (0.3) | | | (0.1) | |
| Net gain reclassified from accumulated other comprehensive loss into income, net of tax, effective portion to interest income | Net gain reclassified from accumulated other comprehensive loss into income, net of tax, effective portion to interest income | 0.5 | | | 1.9 | | | 2.0 | |
| Net gain (loss) reclassified from accumulated other comprehensive loss into income, net of tax, effective portion to net foreign currency transaction losses | Net gain (loss) reclassified from accumulated other comprehensive loss into income, net of tax, effective portion to net foreign currency transaction losses | 3.6 | | 9.7 | | (11.6) | |
| Derivatives designated as fair value hedges: | Derivatives designated as fair value hedges: | |
| Net gain recognized in other comprehensive loss, net of tax | Net gain recognized in other comprehensive loss, net of tax | 2.7 | | | — | | | — | |
| Net gain recognized in other comprehensive loss, net of tax | |
| Net gain recognized in other comprehensive loss, net of tax | |
| Net gain reclassified from accumulated other comprehensive loss into income, net of tax, effective portion to interest expense, net | Net gain reclassified from accumulated other comprehensive loss into income, net of tax, effective portion to interest expense, net | 0.9 | | — | | | — | |
| Derivatives designated as net investment hedges: | Derivatives designated as net investment hedges: | |
| Net gain recognized in other comprehensive loss, net of tax | |
| Net gain recognized in other comprehensive loss, net of tax | |
| Net gain recognized in other comprehensive loss, net of tax | Net gain recognized in other comprehensive loss, net of tax | 4.2 | | — | | | — | |
| Net gain reclassified from accumulated other comprehensive loss into income, net of tax, effective portion to interest expense, net | Net gain reclassified from accumulated other comprehensive loss into income, net of tax, effective portion to interest expense, net | 0.7 | | — | | | — | |
| Derivatives not designated as hedging instruments: | Derivatives not designated as hedging instruments: | |
Net gain (loss) recognized in income(b) | Net gain (loss) recognized in income(b) | $ | 1.0 | | | $ | 2.5 | | | $ | (5.0) | |
Net gain (loss) recognized in income(b) | |
Net gain (loss) recognized in income(b) | |
(a)Net change in the fair value of the effective portion classified in other comprehensive (loss) income.
(b)Classified in net foreign currency transaction losses.
NOTES TO THE CONSOLIDATED FINANCIAL STATEMENTS
(Tables in millions, except shares and per share data)
12. Fair Value Measurements
Estimates of fair value for financial assets and financial liabilities are based on the framework established in the accounting guidance for fair value measurements. The framework defines fair value, provides guidance for measuring fair value and requires certain disclosures. The framework discusses valuation techniques, such as the market approach (comparable market prices), the income approach (present value of future income or cash flow) and the cost approach (cost to replace the service capacity of an asset or replacement cost). The framework utilizes a fair value hierarchy that prioritizes the inputs to valuation techniques used to measure fair value into three broad levels. The following is a brief description of those three levels:
•Level 1: Observable inputs such as quoted prices (unadjusted) in active markets for identical assets or liabilities.
•Level 2: Inputs other than quoted prices that are observable for the asset or liability, either directly or indirectly. These include quoted prices for similar assets or liabilities in active markets and quoted prices for identical or similar assets or liabilities in markets that are not active.
•Level 3: Unobservable inputs that reflect the reporting entity’s own assumptions.
Our population of assets and liabilities subject to fair value measurements as of December 31, 20222023 were as follows:
| | Fair Value | | Level 1 | | Level 2 | | Level 3 |
| Fair Value | | | Fair Value | | Level 1 | | Level 2 | | Level 3 |
| Assets: | Assets: | |
| Foreign currency forward exchange contracts | $ | 0.1 | | | — | | | $ | 0.1 | | | — | |
| Cross-currency swaps | |
| Cross-currency swaps | |
| Cross-currency swaps | Cross-currency swaps | 3.9 | | | — | | | 3.9 | | | — | |
| Interest rate swaps | Interest rate swaps | 0.8 | | | — | | | 0.8 | | | — | |
| Total assets | Total assets | 4.8 | | | — | | | 4.8 | | | — | |
| Liabilities: | Liabilities: | |
| Foreign currency forward exchange contracts | Foreign currency forward exchange contracts | 0.3 | | | — | | | 0.3 | | | — | |
| Foreign currency forward exchange contracts | |
| Foreign currency forward exchange contracts | |
| Cross-currency swaps | |
| Interest rate swaps | Interest rate swaps | 1.8 | | | — | | | 1.8 | | | — | |
| Total liabilities | Total liabilities | $ | 2.1 | | | — | | | $ | 2.1 | | | $ | — | |
Our population of assets and liabilities subject to fair value measurements as of December 31, 20212022 were as follows:
| | Fair Value | | Level 1 | | Level 2 | | Level 3 |
| Fair Value | | | Fair Value | | Level 1 | | Level 2 | | Level 3 |
| Assets: | Assets: | |
| Foreign currency forward exchange contracts | Foreign currency forward exchange contracts | $ | 0.9 | | | — | | | $ | 0.9 | | | — | |
| Foreign currency forward exchange contracts | |
| Foreign currency forward exchange contracts | |
| Cross-currency swaps | |
| Interest rate swaps | |
| Total assets | Total assets | 0.9 | | | — | | | 0.9 | | | — | |
| Liabilities: | Liabilities: | |
| Foreign currency forward exchange contracts | Foreign currency forward exchange contracts | 11.4 | | | — | | | 11.4 | | | — | |
| Foreign currency forward exchange contracts | |
| Foreign currency forward exchange contracts | |
| Interest rate swaps | |
| Total liabilities | Total liabilities | $ | 11.4 | | | — | | | $ | 11.4 | | | $ | — | |
Our foreign currency forward exchange contracts, cross-currency swaps and interest rate swaps are valued using observable Level 2 market expectations at the measurement date and standard valuation techniques to convert future amounts to a single present value amount. Further details regarding our foreign currency forward exchange and option contracts are discussed in Note 11.
NOTES TO THE CONSOLIDATED FINANCIAL STATEMENTS
(Tables in millions, except shares and per share data)
Contingent consideration is valued using a probability-weighted analysis of projected gross profit and integration milestones. Contingent consideration payments totaling $2.5 million were paid in 2021.
NOTES TO THE CONSOLIDATED FINANCIAL STATEMENTS
(Tables in millions, except shares and per share data)
The carrying amounts reported in the consolidated balance sheets for cash and cash equivalents, restricted cash, receivables, other current assets, accounts payable and other current liabilities approximate fair value due to their short-term nature.
The fair value and carrying value of total debt, including current portion, was $301.8$198.2 million and $300.3$200.6 million, respectively, as of December 31, 2022.2023. The fair value was calculated based on the borrowing rates currently available to us for bank loans with similar terms and remaining maturities, which is a Level 2 in the fair value hierarchy.
13. Retirement Benefit Plans
Substantially all U.S. employees are covered by various retirement benefit plans, including defined contribution savings plans and postretirement medical plans. Retirement benefits for eligible employees in foreign locations are funded principally through defined benefit plans, annuity or government programs. The total cost of benefits for our plans was $16.6 million, $11.6 million and $14.8 million in 2023, 2022 and $12.3 million in 2022, 2021, and 2020, respectively.
We had a qualified, funded defined benefit retirement plan (the “U.S. Pension Plan”) covering certain current and retired employees in the U.S. During 2015, the plan was amended to freeze benefits for all participants effective January 31, 2017. On February 15, 2017, the Board of Directors approved the termination of the U.S. Pension Plan, effective May 15, 2017. Participants who elected an immediate lump sum distribution were paid out in December 2017. Assets for participants who elected or are currently receiving annuity payments and those who have elected to defer their benefits were transferred to the annuity company, Pacific Life, in December 2017. Excess assets were transferred from the Tennant Company Pension Trust to the Tennant Company Retirement Savings Plan to deliver future discretionary benefits to plan participants. During 2021,2022, all remaining excess assets were utilized, and none remained outstanding as of December 31, 2021.2022.
We have a U.S. postretirement medical benefit plan (the “U.S. Retiree Plan”) to provide certain healthcare benefits for U.S. employees hired before January 1, 1999. Eligibility for those benefits is based upon a combination of years of service with us and age upon retirement.
Our defined contribution savings plan (“401(k) plan”) covers substantially all U.S. employees. Under this plan, we match up to 3% of the employee’s annual compensation in cash to be invested per their election. We also make a profit sharing contribution to the 401(k) plan for employees with more than one year of service in accordance with our Profit Sharing Plan. This contribution is based upon our financial performance and can be funded in the form of Tennant stock, cash or a combination of both. Expenses for the 401(k) plan were $10.5 million, $6.0 million and $8.7 million during 2023, 2022 and $7.2 million during 2022, 2021, and 2020, respectively.
We have a U.S. nonqualified supplemental benefit plan (the “U.S. Nonqualified Plan”) to provide additional retirement benefits for certain employees whose benefits under our 401(k) plan or U.S. Pension Plan are limited by either the Employee Retirement Income Security Act or the Internal Revenue Code.
We also have defined benefit pension plans in the United Kingdom, Germany, France and Italy (the “U.K. Pension Plan”, the “German Pension Plan,” "French Pension Plan" and the "Italian Pension Plan"). The U.K. Pension Plan, French Pension Plan, German Pension Plan and Italian Pension Plan cover certain current and retired employees and all plans are closed to new participants. In December 2019,2018, the U.K. Pension Plan was amended to close all future accrual of benefits to existing active members, resulting in a curtailment gain of $0.1 million relating to past service benefits. The Italian Plan is an employee termination indemnity mandated by Italian law to all employees employed prior to 2008. Benefits are paid out when employees covered under the plan are terminated for any reason. Due to changes in Italian law, such termination indemnities are no longer available to new participants. Prior year Non-U.S. Pension Benefits disclosures have been updated to include the Italian Pension Plan.
We expect to contribute approximately $0.1 million to our U.S. Nonqualified Plan and $0.7 million to our U.S. Retiree Plan in 2023. We expect contributions to our U.K. Pension Plan, German Pension Plan, French Pension Plan and Italian Pension Plans to be $0.2 million in 2023.
NOTES TO THE CONSOLIDATED FINANCIAL STATEMENTS
(Tables in millions, except shares and per share data)
We expect to contribute less than $0.1 million to our U.S. Nonqualified Plan and $0.6 million to our U.S. Retiree Plan in 2024. We expect contributions to our U.K. Pension Plan, German Pension Plan, French Pension Plan and Italian Pension Plans to be $0.2 million in 2024.
Weighted-average asset allocations by asset category of the U.K. Pension Plan as of December 31, 2022 is2023 are as follows:
| | Quoted Prices in Active Markets for
Identical Assets | | Significant Observable Inputs | | Significant Unobservable Inputs |
| | | Quoted Prices in Active Markets for
Identical Assets | | | | | Quoted Prices in Active Markets for
Identical Assets | | Significant Observable Inputs | | Significant Unobservable Inputs |
| Asset category | Asset category | Fair Value | | (Level 1) | | (Level 2) | | (Level 3) | Asset category | Fair Value | | (Level 1) | | (Level 2) | | (Level 3) |
Investment account held by pension plan(a) | Investment account held by pension plan(a) | $ | 11.3 | | | $ | — | | | $ | — | | | $ | 11.3 | |
| Total | Total | $ | 11.3 | | | $ | — | | | $ | — | | | $ | 11.3 | |
(a)This category is comprised of investments in insurance contracts.
Weighted-average asset allocations by asset category of the U.K. Pension Plan as of December 31, 2021 is2022 are as follows:
| | Quoted Prices in Active Markets for
Identical Assets | | Significant Observable Inputs | | Significant Unobservable Inputs |
| | | Quoted Prices in Active Markets for
Identical Assets | | | | | Quoted Prices in Active Markets for
Identical Assets | | Significant Observable Inputs | | Significant Unobservable Inputs |
| Asset category | Asset category | Fair Value | | (Level 1) | | (Level 2) | | (Level 3) | Asset category | Fair Value | | (Level 1) | | (Level 2) | | (Level 3) |
Investment account held by pension plan(a) | Investment account held by pension plan(a) | $ | 12.9 | | | — | | | — | | | $ | 12.9 | |
| Total | Total | $ | 12.9 | | | $ | — | | | $ | — | | | $ | 12.9 | |
(a)This category is comprised of investments in insurance contracts.
Estimates of the fair value of the U.K. Pension Plan and the Tennant Company Retirement Savings Plan assets are based on the framework established in the accounting guidance for fair value measurements. A brief description of the three levels can be found in Note 12. The Investment Account held by the U.K. Pension Plan invests in insurance contracts for purposes of funding the U.K. Pension Plan and is classified as Level 3. The fair value of the Investment Account is the cash surrender values as determined by the provider which are the amounts the plan would receive if the contracts were cashed out at year-end. The underlying assets held by these contracts are primarily invested in assets traded in active markets.
A reconciliation of the beginning and ending balances of the Level 3 investments of our U.K. Pension Plan during the years ended December 31 is as follows:
| | 2022 | | 2021 |
| 2023 | | | 2023 | | 2022 |
| Fair value at beginning of year | Fair value at beginning of year | $ | 12.9 | | | $ | 13.3 | |
| Purchases, sales, issuances and settlements, net | Purchases, sales, issuances and settlements, net | (0.3) | | | 0.2 | |
| Net (loss) gain | Net (loss) gain | 0.1 | | | (0.4) | |
| Foreign currency | Foreign currency | (1.4) | | | (0.2) | |
| Fair value at end of year | Fair value at end of year | $ | 11.3 | | | $ | 12.9 | |
The primary objective of our U.K. Pension Plan is to meet retirement income commitments to plan participants at a reasonable cost to us and to maintain a sound actuarially funded status. This objective is accomplished through growth of capital and safety of funds invested. Assets are invested in securities to
NOTES TO THE CONSOLIDATED FINANCIAL STATEMENTS
(Tables in millions, except shares and per share data)
achieve growth of capital over inflation through appreciation and accumulation and reinvestment of dividend and interest income. Investments are diversified to control risk. The U.K. Pension Plan is invested in insurance
NOTES TO THE CONSOLIDATED FINANCIAL STATEMENTS
(Tables in millions, except shares and per share data)
contracts with underlying investments primarily in equity and fixed income securities. Our German Pension Plan is unfunded, which is customary in that country.
Weighted-average assumptions used to determine benefit obligations as of December 31 are as follows:
| | U.S. Nonqualified Plan | | Non-U.S.
Pension Benefits | | Postretirement
Medical Benefits |
| 2022 | | 2021 | | 2022 | | 2021 | | 2022 | | 2021 |
| U.S. Nonqualified Plan | | | U.S. Nonqualified Plan | | Non-U.S.
Pension Benefits | | Postretirement
Medical Benefits |
| 2023 | | | 2023 | | 2022 | | 2023 | | 2022 | | 2023 | | 2022 |
| Discount rate | Discount rate | 5.37 | % | | 2.54 | % | | 1.05 | % | | 1.59 | % | | 5.37 | % | | 2.53 | % | Discount rate | 5.07 | % | | 5.37 | % | | 4.26 | % | | 1.05 | % | | 5.06 | % | | 5.37 | % |
| Rate of compensation increase | Rate of compensation increase | — | % | | — | % | | 2.25 | % | | — | % | | — | % | | — | % | Rate of compensation increase | — | % | | — | % | | 3.00 | % | | 2.25 | % | | — | % | | — | % |
Weighted-average assumptions used to determine net periodic benefit costs as of December 31 are as follows:
| | U.S. Nonqualified Plan | | Non-U.S.
Pension Benefits | | Postretirement
Medical Benefits |
| 2022 | | 2021 | | 2020 | | 2022 | | 2021 | | 2020 | | 2022 | | 2021 | | 2020 |
| U.S. Nonqualified Plan | | | U.S. Nonqualified Plan | | Non-U.S.
Pension Benefits | | Postretirement
Medical Benefits |
| 2023 | | | 2023 | | 2022 | | 2021 | | 2023 | | 2022 | | 2021 | | 2023 | | 2022 | | 2021 |
| Discount rate | Discount rate | 2.54 | % | | 2.06 | % | | 3.01 | % | | 1.55 | % | | 1.05 | % | | 1.42 | % | | 2.53 | % | | 2.07 | % | | 3.06 | % | Discount rate | 5.37 | % | | 2.54 | % | | 2.06 | % | | 4.68 | % | | 1.55 | % | | 1.05 | % | | 5.37 | % | | 2.53 | % | | 2.07 | % |
| Expected long-term rate of return on plan assets | Expected long-term rate of return on plan assets | — | % | | — | % | | — | % | | 3.20 | % | | 2.70 | % | | 3.30 | % | | — | % | | — | % | | — | % | Expected long-term rate of return on plan assets | — | % | | — | % | | — | % | | 6.10 | % | | 3.20 | % | | 2.70 | % | | — | % | | — | % | | — | % |
| Rate of compensation increase | Rate of compensation increase | — | % | | — | % | | — | % | | 1.50 | % | | — | % | | — | % | | — | % | | — | % | | — | % | Rate of compensation increase | — | % | | — | % | | — | % | | 2.25 | % | | 1.50 | % | | — | % | | — | % | | — | % | | — | % |
The discount rate is used to discount future benefit obligations back to today’s dollars. Our discount rates were determined based on high-quality fixed income investments. The resulting discount rates are consistent with the duration of plan liabilities. The Mercer Above Mean Yield Curve for high-quality corporate bonds is used in determining the discount rate for the U.S. Nonqualified Plan in 2022.2023. The Mercer Yield Curve is used in determining the discount rate for the Non-U.S. Plans in 2022.2023. Before 2020,2019, the FTSE (formerly known as Citigroup) Above Median Spot rates for high-quality corporate bonds were used in determining the discount rate for the U.S. Plans. Before 2022,2021, the iBoxx € Corporates AA 7-10 and iBoxx € Corporates AA 10+ Benchmark was used to determine the discount rate for the Italian Pension Plan. The expected return on assets assumption on the investment portfolios for the pension plans is based on the long-term expected returns for the investment mix of assets currently in the portfolio. Management uses historic return trends of the asset portfolio combined with recent market conditions to estimate the future rate of return.
The accumulated benefit obligations as of December 31 for all defined benefit plans are as follows:
| | | | | | | | | | | |
| 2022 | | 2021 |
| U.S. Nonqualified Plan | $ | 0.9 | | | $ | 1.1 | |
| U.K. Pension Plan | 6.5 | | | 11.4 | |
| German Pension Plan | 0.7 | | | 1.0 | |
| French Pension Plan | 0.5 | | | — | |
| Italian Pension Plan | 2.4 | | | 3.7 | |
Information for our plans with an accumulated benefit obligation in excess of plan assets as of December 31 is as follows:
| | | | | | | | | | | |
| 2022 | | 2021 |
| Accumulated benefit obligation | $ | 4.5 | | | $ | 5.8 | |
| Fair value of plan assets | — | | | — | |
| | | | | | | | | | | |
| 2023 | | 2022 |
| U.S. Nonqualified Plan | $ | 0.9 | | | $ | 0.9 | |
| U.K. Pension Plan | 6.2 | | | 6.5 | |
| German Pension Plan | 1.0 | | | 0.7 | |
| French Pension Plan | 0.4 | | | 0.5 | |
| Italian Pension Plan | 2.5 | | | 2.4 | |
NOTES TO THE CONSOLIDATED FINANCIAL STATEMENTS
(Tables in millions, except shares and per share data)
Information for our plans with an accumulated benefit obligation in excess of plan assets as of December 31 is as follows:
| | | | | | | | | | | |
| 2023 | | 2022 |
| Accumulated benefit obligation | $ | 4.8 | | | $ | 4.5 | |
| Fair value of plan assets | — | | | — | |
As of December 31, 20222023 and 2021,2022, the U.S. Nonqualified, the German Pension, the French Pension and the Italian Pension Plans had an accumulated benefit obligation in excess of plan assets.
Information for our plans with a projected benefit obligation in excess of plan assets as of December 31 is as follows:
| | 2022 | | 2021 |
| 2023 | | | 2023 | | 2022 |
| Projected benefit obligation | Projected benefit obligation | $ | 4.7 | | | $ | 5.8 | |
| Fair value of plan assets | Fair value of plan assets | — | | | — | |
As of December 31, 20222023 and 2021,2022, the U.S. Nonqualified, the German Pension, the French Pension and the Italian Pension Plans had a projected benefit obligation in excess of plan assets.
Assumed healthcare cost trend rates as of December 31 are as follows:
| | 2022 | | 2021 |
| 2023 | | | 2023 | | 2022 |
| Healthcare cost trend rate assumption for the next year Pre-65 | Healthcare cost trend rate assumption for the next year Pre-65 | 5.30 | % | | 5.40 | % | Healthcare cost trend rate assumption for the next year Pre-65 | 8.00 | % | | 5.30 | % |
| Healthcare cost trend rate assumption for the next year Post-65 | Healthcare cost trend rate assumption for the next year Post-65 | 5.80 | % | | 5.90 | % | Healthcare cost trend rate assumption for the next year Post-65 | 8.80 | % | | 5.80 | % |
| Rate to which the cost trend rate is assumed to decline (the ultimate trend rate) | Rate to which the cost trend rate is assumed to decline (the ultimate trend rate) | 4.00 | % | | 4.00 | % | Rate to which the cost trend rate is assumed to decline (the ultimate trend rate) | 4.00 | % | | 4.00 | % |
| Year that the rate reaches the ultimate trend rate | Year that the rate reaches the ultimate trend rate | 2045 | | 2045 | Year that the rate reaches the ultimate trend rate | 2047 | | 2045 |
NOTES TO THE CONSOLIDATED FINANCIAL STATEMENTS
(Tables in millions, except shares and per share data)
Summaries related to changes in benefit obligations and plan assets and to the funded status of our defined benefit and postretirement medical benefit plans are as follows:
| | U.S. Nonqualified Plan | | Non-U.S.
Pension Benefits | | Postretirement
Medical Benefits |
| 2022 | | 2021 | | 2022 | | 2021 | | 2022 | | 2021 |
| U.S. Nonqualified Plan | | | U.S. Nonqualified Plan | | Non-U.S.
Pension Benefits | | Postretirement
Medical Benefits |
| 2023 | | | 2023 | | 2022 | | 2023 | | 2022 | | 2023 | | 2022 |
| Change in benefit obligation: | Change in benefit obligation: | |
| Benefit obligation at beginning of year | |
| Benefit obligation at beginning of year | |
| Benefit obligation at beginning of year | Benefit obligation at beginning of year | $ | 1.1 | | | $ | 1.2 | | | $ | 16.2 | | | $ | 17.6 | | | $ | 7.0 | | | $ | 7.3 | |
| Plan combinations | Plan combinations | — | | | — | | | 1.0 | | | — | | | — | | | — | |
| Service cost | Service cost | — | | | — | | | 0.3 | | | — | | | — | | | 0.1 | |
| Interest cost | Interest cost | — | | | 0.1 | | | 0.2 | | | 0.2 | | | 0.2 | | | 0.1 | |
| Actuarial (gain) loss | Actuarial (gain) loss | (0.1) | | | — | | | (5.1) | | | (0.6) | | | (1.1) | | | 0.6 | |
| Foreign exchange | Foreign exchange | — | | | — | | | (1.6) | | | (0.4) | | | — | | | — | |
| Settlement | Settlement | — | | | — | | | — | | | (0.3) | | | — | | | — | |
| Benefits paid | Benefits paid | (0.1) | | | (0.2) | | | (0.7) | | | (0.3) | | | (0.7) | | | (1.1) | |
| Benefit obligation at end of year | Benefit obligation at end of year | $ | 0.9 | | | $ | 1.1 | | | $ | 10.3 | | | $ | 16.2 | | | $ | 5.4 | | | $ | 7.0 | |
| Change in fair value of plan assets and net accrued liabilities: | Change in fair value of plan assets and net accrued liabilities: | |
| Fair value of plan assets at beginning of year | Fair value of plan assets at beginning of year | $ | — | | | $ | — | | | $ | 12.9 | | | $ | 13.3 | | | $ | — | | | $ | — | |
| Fair value of plan assets at beginning of year | |
| Fair value of plan assets at beginning of year | |
| Actual return on plan assets | Actual return on plan assets | — | | | — | | | 0.1 | | | (0.4) | | | — | | | — | |
| Employer contributions | Employer contributions | 0.1 | | | 0.1 | | | 0.4 | | | 0.8 | | | 0.7 | | | 1.0 | |
| Foreign exchange | Foreign exchange | — | | | — | | | (1.4) | | | (0.2) | | | — | | | — | |
| Settlement | Settlement | — | | | — | | | — | | | (0.3) | | | — | | | — | |
| Benefits paid | Benefits paid | (0.1) | | | (0.1) | | | (0.7) | | | (0.3) | | | (0.7) | | | (1.0) | |
| Fair value of plan assets at end of year | Fair value of plan assets at end of year | — | | | — | | | 11.3 | | | 12.9 | | | — | | | — | |
| Funded status at end of year | Funded status at end of year | $ | (0.9) | | | $ | (1.1) | | | $ | 1.0 | | | $ | (3.3) | | | $ | (5.4) | | | $ | (7.0) | |
| Amounts recognized in the consolidated balance sheets consist of: | Amounts recognized in the consolidated balance sheets consist of: | |
| Noncurrent other assets | Noncurrent other assets | $ | — | | | $ | — | | | $ | 4.8 | | | $ | 1.4 | | | $ | — | | | $ | — | |
| Noncurrent other assets | |
| Noncurrent other assets | |
| Current liabilities | Current liabilities | (0.1) | | | (0.1) | | | (0.2) | | | (0.2) | | | (0.7) | | | (0.7) | |
| Long-term liabilities | Long-term liabilities | (0.8) | | | (1.0) | | | (3.6) | | | (4.5) | | | (4.7) | | | (6.3) | |
| Net accrued liability | Net accrued liability | $ | (0.9) | | | $ | (1.1) | | | $ | 1.0 | | | $ | (3.3) | | | $ | (5.4) | | | $ | (7.0) | |
| Amounts recognized in accumulated other comprehensive loss consist of: | Amounts recognized in accumulated other comprehensive loss consist of: | |
| Prior service cost | Prior service cost | $ | — | | | $ | — | | | $ | (0.1) | | | $ | (0.2) | | | $ | — | | | $ | — | |
| Prior service cost | |
| Prior service cost | |
| Net actuarial (loss) gain | Net actuarial (loss) gain | (0.7) | | | (0.9) | | | 2.8 | | | (2.1) | | | 1.3 | | | 0.2 | |
| Accumulated other comprehensive (loss) income | Accumulated other comprehensive (loss) income | $ | (0.7) | | | $ | (0.9) | | | $ | 2.7 | | | $ | (2.3) | | | $ | 1.3 | | | $ | 0.2 | |
NOTES TO THE CONSOLIDATED FINANCIAL STATEMENTS
(Tables in millions, except shares and per share data)
The components of the net periodic benefit cost (credit) for the three years ended December 31 were as follows:
| | U.S. Nonqualified Plan | | Non-U.S.
Pension Benefits | | Postretirement
Medical Benefits |
| 2022 | | 2021 | | 2020 | | 2022 | | 2021 | | 2020 | | 2022 | | 2021 | | 2020 |
| U.S. Nonqualified Plan | | | U.S. Nonqualified Plan | | Non-U.S.
Pension Benefits | | Postretirement
Medical Benefits |
| 2023 | | | 2023 | | 2022 | | 2021 | | 2023 | | 2022 | | 2021 | | 2023 | | 2022 | | 2021 |
| Service cost | Service cost | $ | — | | | $ | — | | | $ | — | | | $ | 0.3 | | | $ | — | | | $ | — | | | $ | — | | | $ | 0.1 | | | $ | 0.1 | |
| Interest cost | Interest cost | — | | | 0.1 | | | — | | | 0.2 | | | 0.2 | | | 0.2 | | | 0.2 | | | 0.1 | | | 0.2 | |
| Expected return on plan assets | Expected return on plan assets | — | | | — | | | — | | | (0.4) | | | (0.4) | | | (0.3) | | | — | | | — | | | — | |
| Amortization of net actuarial loss | Amortization of net actuarial loss | 0.1 | | | — | | | 0.1 | | | — | | | 0.1 | | | — | | | — | | | — | | | — | |
| Net periodic benefit cost (credit) | Net periodic benefit cost (credit) | $ | 0.1 | | | $ | 0.1 | | | $ | 0.1 | | | $ | 0.1 | | | $ | (0.1) | | | $ | (0.1) | | | $ | 0.2 | | | $ | 0.2 | | | $ | 0.3 | |
The changes in accumulated other comprehensive loss for the three years ended December 31 were as follows:
| | U.S. Nonqualified Plan | | Non-U.S.
Pension Benefits | | Postretirement
Medical Benefits |
| 2022 | | 2021 | | 2020 | | 2022 | | 2021 | | 2020 | | 2022 | | 2021 | | 2020 |
| U.S. Nonqualified Plan | | | U.S. Nonqualified Plan | | Non-U.S.
Pension Benefits | | Postretirement
Medical Benefits |
| 2023 | | | 2023 | | 2022 | | 2021 | | 2023 | | 2022 | | 2021 | | 2023 | | 2022 | | 2021 |
| Prior service cost | Prior service cost | $ | — | | | $ | — | | | $ | — | | | $ | — | | | $ | — | | | $ | 0.1 | | | $ | — | | | $ | — | | | $ | — | |
| Net actuarial (gain) loss | Net actuarial (gain) loss | (0.1) | | | — | | | — | | | (5.0) | | | 0.2 | | | 1.6 | | | (1.1) | | | 0.6 | | | (0.3) | |
| Amortization of net actuarial (loss) gain | Amortization of net actuarial (loss) gain | (0.1) | | | — | | | (0.1) | | | — | | | (0.1) | | | — | | | — | | | — | | | — | |
| Total recognized in other comprehensive (income) loss | Total recognized in other comprehensive (income) loss | $ | (0.2) | | | $ | — | | | $ | (0.1) | | | $ | (5.0) | | | $ | 0.1 | | | $ | 1.7 | | | $ | (1.1) | | | $ | 0.6 | | | $ | (0.3) | |
| Total recognized in net benefit (credit) cost and other comprehensive (income) loss | Total recognized in net benefit (credit) cost and other comprehensive (income) loss | $ | (0.1) | | | $ | 0.1 | | | $ | — | | | $ | (4.9) | | | $ | — | | | $ | 1.6 | | | $ | (0.9) | | | $ | 0.8 | | | $ | — | |
The following benefit payments, which reflect expected future service, are expected to be paid:
| | U.S.
Nonqualified Plan | | Non-U.S.
Pension Benefits | | Postretirement
Medical Benefits |
| 2023 | $ | 0.1 | | | $ | 0.5 | | | $ | 0.7 | |
| U.S.
Nonqualified Plan | | | U.S.
Nonqualified Plan | | Non-U.S.
Pension Benefits | | Postretirement
Medical Benefits |
| 2024 | 2024 | 0.1 | | | 0.6 | | | 0.6 | |
| 2025 | 2025 | 0.1 | | | 0.6 | | | 0.6 | |
| 2026 | 2026 | 0.1 | | | 0.6 | | | 0.6 | |
| 2027 | 2027 | 0.1 | | | 0.6 | | | 0.6 | |
| 2027 to 2030 | 0.4 | | | 3.7 | | | 2.3 | |
| 2028 | |
| 2028 to 2031 | |
| Total | Total | $ | 0.9 | | | $ | 6.6 | | | $ | 5.4 | |
NOTES TO THE CONSOLIDATED FINANCIAL STATEMENTS
(Tables in millions, except shares and per share data)
14. Shareholders' Equity
Authorized Shares
We are authorized to issue an aggregate of 60,000,000 shares, all of which are designated as Common Stock having a par value of $0.375 per share. The Board of Directors is authorized to establish one or more series of preferred stock, setting forth the designation of each such series, and fixing the relative rights and preferences of each such series.
Accumulated Other Comprehensive Loss
The changes in components of accumulated other comprehensive loss, net of tax, are as follows:
| | Foreign Currency Translation
Adjustments | | Pension and Postretirement
Medical Benefits | | Derivative Financial Instruments | | Total |
| December 31, 2020 | $ | (19.1) | | | $ | (1.7) | | | $ | 0.7 | | | $ | (20.1) | |
| Other comprehensive (loss) income before reclassifications | (16.9) | | | (0.4) | | | 10.8 | | | (6.5) | |
| Amounts reclassified from accumulated other comprehensive loss | — | | | — | | | (11.3) | | | (11.3) | |
| Net current period other comprehensive (loss) income | (16.9) | | | (0.4) | | | (0.5) | | | (17.8) | |
| Foreign Currency Translation
Adjustments | | | Foreign Currency Translation
Adjustments | | Pension and Postretirement
Medical Benefits | | Derivative Financial Instruments | | Total |
| December 31, 2021 | December 31, 2021 | $ | (36.0) | | | $ | (2.1) | | | $ | 0.2 | | | $ | (37.9) | |
| Other comprehensive (loss) income before reclassifications | Other comprehensive (loss) income before reclassifications | (17.2) | | | 4.8 | | | 5.8 | | | (6.6) | |
| Amounts reclassified from accumulated other comprehensive loss | Amounts reclassified from accumulated other comprehensive loss | (0.7) | | | — | | | (5.0) | | | (5.7) | |
| Net current period other comprehensive (loss) income | Net current period other comprehensive (loss) income | (17.9) | | | 4.8 | | | 0.8 | | | (12.3) | |
| December 31, 2022 | December 31, 2022 | $ | (53.9) | | | $ | 2.7 | | | $ | 1.0 | | | $ | (50.2) | |
| Other comprehensive (loss) income before reclassifications | |
| Amounts reclassified from accumulated other comprehensive loss | |
| Net current period other comprehensive (loss) income | |
| December 31, 2023 | |
Accumulated other comprehensive loss associated with pension and postretirement benefits and cash flow hedges is included in Notes 13 and 11, respectively.
Repurchase of Common Stock
TheOn October 31, 2016, the Board of Directors has authorized the repurchase of 1,112,3331,000,000 shares of our common stock. During the year ended December 31, 2022,2023, the Company paid $5.0$21.7 million to repurchase 79,756290,920 shares of its common stock at an average price of $62.67$74.57 per share. As of December 31, 2022, 1,112,3332023, 821,413 shares were available to be repurchased. The Company paid $15.0$5.0 million to repurchase 196,98279,756 share repurchases during the year ended December 31, 2021.2022.
15. Leases
We lease facilities, vehicles and equipment under the operating lease agreements, which include both monthly and longer-term arrangements.
Certain operating leases for vehicles contain residual value guarantee provisions, which would become due at the expiration of the operating lease agreement if the fair value of the leased vehicles is less than the guaranteed residual value. As of December 31, 2022,2023, of those leases that contain residual value guarantees, the aggregate residual value at lease expiration was $11.4$14.6 million, of which we have guaranteed $5.5$8.1 million.
NOTES TO THE CONSOLIDATED FINANCIAL STATEMENTS
(Tables in millions, except shares and per share data)
The lease assets and liabilities as of December 31 are as follows:
| | Leases | Leases | Classification | 2022 | | 2021 | Leases | Classification | 2023 | | 2022 |
| Assets | Assets | |
| Operating lease assets | |
| Operating lease assets | |
| Operating lease assets | Operating lease assets | $ | 31.8 | | | $ | 41.3 | |
| Finance lease assets | Finance lease assets | Property, plant and equipment(a) | 0.2 | | | 0.1 | |
| Total leased assets | Total leased assets | | $ | 32.0 | | | $ | 41.4 | |
| Liabilities | Liabilities | |
| Current: | Current: | |
| Current: | |
| Current: | |
| Operating | |
| Operating | |
| Operating | Operating | Other current liabilities | $ | 15.0 | | | $ | 16.4 | |
| Finance | Finance | Current portion of long-term debt | — | | | — | |
| Noncurrent: | Noncurrent: | |
| Operating | Operating | Long-term operating lease liabilities | 17.1 | | | 25.4 | |
| Operating | |
| Operating | |
| Finance | Finance | Long-term debt | 0.1 | | | 0.1 | |
| Total lease liabilities | Total lease liabilities | | $ | 32.2 | | | $ | 41.9 | |
| | | | | |
| (a) | Finance lease assets are recorded net of accumulated amortization of $0.1 million and less than $0.1 million as of December 31, 20222023 and December 31, 2021.2022, respectively. |
The lease cost for the three years ended December 31 was as follows:
| | Lease Cost | Lease Cost | 2022 | | 2021 | | 2020 | Lease Cost | 2023 | | 2022 | | 2021 |
Operating lease cost(a) | Operating lease cost(a) | $ | 26.2 | | | $ | 26.6 | | | $ | 25.1 | |
Finance lease cost(b) | Finance lease cost(b) | 0.1 | | | 0.1 | | | 0.2 | |
| Total lease cost | Total lease cost | $ | 26.3 | | | $ | 26.7 | | | $ | 25.3 | |
| | | | | |
| (a) | Includes short-term lease costs of $4.8$5.9 million and $4.0$4.8 million and variable lease costs of $3.3$4.2 million and $2.2$3.3 million for the years ended December 31, 20222023 and December 31, 2021,2022, respectively. |
| | | | | |
| (b) | Includes amortization of leased assets and interest on lease liabilities. |
The maturity of lease liabilities as of December 31, 20222023 was as follows:
| | Maturity of Lease Liabilities | Maturity of Lease Liabilities | Operating Leases | | Finance Leases | | Total | Maturity of Lease Liabilities | Operating Leases | | Finance Leases | | Total |
| 2023 | $ | 15.6 | | | $ | — | | | $ | 15.6 | |
| 2024 | 2024 | 9.5 | | | 0.1 | | | 9.6 | |
| 2025 | 2025 | 4.5 | | | — | | | 4.5 | |
| 2026 | 2026 | 1.8 | | | — | | | 1.8 | |
| 2027 | 2027 | 1.0 | | | — | | | 1.0 | |
| 2028 | |
| Thereafter | Thereafter | 1.2 | | | — | | | 1.2 | |
| Total lease payments | Total lease payments | $ | 33.6 | | | $ | 0.1 | | | $ | 33.7 | |
| Less: Interest | Less: Interest | (1.5) | | | — | | | (1.5) | |
| Present value of lease liabilities | Present value of lease liabilities | $ | 32.1 | | | $ | 0.1 | | | $ | 32.2 | |
NOTES TO THE CONSOLIDATED FINANCIAL STATEMENTS
(Tables in millions, except shares and per share data)
The lease term and discount rate as of December 31 were as follows:
| | Lease Term and Discount Rate | Lease Term and Discount Rate | 2022 | | 2021 | Lease Term and Discount Rate | 2023 | | 2022 |
| Weighted-average remaining lease term (years): | Weighted-average remaining lease term (years): | |
| Operating leases | Operating leases | 2.9 | | 3.0 |
| Operating leases | |
| Operating leases | | 3.8 | | 2.9 |
| Finance leases | Finance leases | 4.1 | | 4.2 | Finance leases | 4.7 | | 4.1 |
| Weighted-average discount rate: | Weighted-average discount rate: | |
| Operating leases | Operating leases | 3.9% | | 3.5% |
| Operating leases | |
| Operating leases | | 6.0% | | 3.9% |
| Finance leases | Finance leases | 2.5% | | 2.2% | Finance leases | 6.0% | | 2.5% |
Other information related to cash paid related to lease liabilities and lease assets obtained for the years ended December 31 was as follows:
| | Other Information | Other Information | 2022 | | 2021 | Other Information | 2023 | | 2022 |
| Cash paid for amounts included in the measurement of lease liabilities: | Cash paid for amounts included in the measurement of lease liabilities: | |
| Operating cash flows from operating leases | Operating cash flows from operating leases | $ | 18.2 | | | $ | 20.2 | |
| Operating cash flows from operating leases | |
| Operating cash flows from operating leases | |
| Financing cash flows from finance leases | Financing cash flows from finance leases | 0.1 | | | 0.1 | |
| Lease assets obtained in exchange for new finance lease liabilities | Lease assets obtained in exchange for new finance lease liabilities | 0.3 | | | 0.1 | |
| Lease assets obtained in exchange for new operating lease liabilities | Lease assets obtained in exchange for new operating lease liabilities | 11.4 | | | 15.7 | |
16. Commitments and Contingencies
In the ordinary course of business, we may become liable with respect to pending and threatened litigation, tax, environmental and other matters. While the ultimate results of current claims, investigations and lawsuits involving us are unknown at this time, we do not expect that these matters will have a material adverse effect on our consolidated financial position or results of operations. Legal costs associated with such matters are expensed as incurred.
17. Income Taxes
Income (loss) before income taxes for the three years ended December 31 was as follows:
| | 2022 | | 2021 | | 2020 |
| 2023 | | | 2023 | | 2022 | | 2021 |
| U.S. operations | U.S. operations | $ | 58.9 | | | $ | 47.5 | | | $ | 46.6 | |
| Foreign operations | Foreign operations | 20.6 | | | 26.6 | | | (5.5) | |
| Total | Total | $ | 79.5 | | | $ | 74.1 | | | $ | 41.1 | |
NOTES TO THE CONSOLIDATED FINANCIAL STATEMENTS
(Tables in millions, except shares and per share data)
Income tax expense (benefit) for the three years ended December 31 was as follows:
| | 2022 | | 2021 | | 2020 |
| 2023 | | | 2023 | | 2022 | | 2021 |
| Current: | Current: | |
| Federal | |
| Federal | |
| Federal | Federal | $ | 17.1 | | | $ | 11.1 | | | $ | 4.2 | |
| Foreign | Foreign | 7.9 | | | 11.2 | | | 3.8 | |
| State | State | 3.8 | | | 1.9 | | | 1.8 | |
| Total current | Total current | $ | 28.8 | | | $ | 24.2 | | | $ | 9.8 | |
| Deferred: | Deferred: | |
| Federal | Federal | $ | (6.3) | | | $ | 0.6 | | | $ | 4.4 | |
| Federal | |
| Federal | |
| Foreign | Foreign | (8.5) | | | (15.5) | | | (6.9) | |
| State | State | (0.8) | | | (0.1) | | | 0.1 | |
| Total deferred | Total deferred | $ | (15.6) | | | $ | (15.0) | | | $ | (2.4) | |
| Total: | Total: | |
| Federal | Federal | $ | 10.8 | | | $ | 11.7 | | | $ | 8.6 | |
| Federal | |
| Federal | |
| Foreign | Foreign | (0.6) | | | (4.3) | | | (3.1) | |
| State | State | 3.0 | | | 1.8 | | | 1.9 | |
| Total income tax expense | Total income tax expense | $ | 13.2 | | | $ | 9.2 | | | $ | 7.4 | |
In general, it is our practice and intention to permanently reinvest the earnings of our foreign subsidiaries and repatriate earnings only when the tax impact is zero or immaterial. Accordingly, no deferred taxes have been provided for withholding taxes or other taxes that would result upon repatriation of our approximately $92.3$102.5 million of undistributed earnings from foreign subsidiaries to the United States as those earnings continue to be permanently reinvested.
In December 2021, the Organization for Economic Cooperation and Development (OECD), which is an international public policy setting organization comprised of member countries including the U.S., published a proposal for the establishment of a global minimum tax rate of 15% (the "Pillar Two rule"). The OECD has recommended that the Pillar Two rule become effective for fiscal years beginning on or after January 1, 2024. To date member states are in various stages of implementing the rules through local legislation and the OECD continues to refine technical guidance. We are closely monitoring developments of the Pillar Two rule and are currently evaluating the potential effect in each of the countries we operate in. We do not expect this rule to have a material impact on our consolidated financial statements.
Our effective income tax rate varied from the U.S. federal statutory tax rate for the three years ended December 31 as follows:
| | 2022 | | 2021 | | 2020 |
| 2023 | | | 2023 | | 2022 | | 2021 |
| Tax at statutory rate | Tax at statutory rate | 21.0 | % | | 21.0 | % | | 21.0 | % | Tax at statutory rate | 21.0 | % | | 21.0 | % | | 21.0 | % |
| Increases (decreases) in the tax rate from: | Increases (decreases) in the tax rate from: | |
| State and local taxes, net of federal benefit | |
| State and local taxes, net of federal benefit | |
| State and local taxes, net of federal benefit | State and local taxes, net of federal benefit | 2.4 | | | 2.2 | | | 3.5 | |
| Effect of foreign operations | Effect of foreign operations | (4.9) | | | (6.3) | | | (3.7) | |
| Effect of changes in valuation allowances | Effect of changes in valuation allowances | (1.2) | | | (4.5) | | | 0.5 | |
| Excess tax benefits on share-based compensation | Excess tax benefits on share-based compensation | 1.1 | | | 1.8 | | | 2.1 | |
| Share-based payments | Share-based payments | (0.4) | | | (0.9) | | | (0.9) | |
| Research and development credit | Research and development credit | (1.5) | | | (1.4) | | | (3.3) | |
| Other, net | Other, net | 0.1 | | | 0.6 | | | (1.3) | |
| Effective income tax rate | Effective income tax rate | 16.6 | % | | 12.5 | % | | 17.9 | % | Effective income tax rate | 11.6 | % | | 16.6 | % | | 12.5 | % |
NOTES TO THE CONSOLIDATED FINANCIAL STATEMENTS
(Tables in millions, except shares and per share data)
The effect of foreign operations line item includes (12.0%) and (7.2%) benefits for 2023 and 2022, respectively, associated with reductions to deferred tax liabilities on undistributed foreign earnings as those cumulative earnings were reduced by current year statutory book losses.
Deferred tax assets and liabilities were comprised of the following as of December 31:
| | 2022 | | 2021 |
| 2023 | | | 2023 | | 2022 |
| Deferred tax assets: | Deferred tax assets: | |
| Inventory | |
| Inventory | |
| Inventory | Inventory | $ | 4.1 | | | $ | 3.7 | |
| Compensation and employee benefits | Compensation and employee benefits | 11.4 | | | 14.8 | |
| Warranty reserves | Warranty reserves | 2.3 | | | 2.2 | |
| Allowance for doubtful accounts and deferred revenue | Allowance for doubtful accounts and deferred revenue | 2.3 | | | 2.3 | |
| Operating lease liabilities | Operating lease liabilities | 5.9 | | | 8.2 | |
| Tax loss carryforwards | Tax loss carryforwards | 8.0 | | | 7.7 | |
| Tax credit carryforwards | Tax credit carryforwards | 3.6 | | | 4.5 | |
| Capitalized research and development costs | Capitalized research and development costs | 6.6 | | | — | |
| Goodwill and intangible assets | |
| Other | Other | (0.9) | | | 0.7 | |
| Gross deferred tax assets | Gross deferred tax assets | $ | 43.3 | | | $ | 44.1 | |
| Less: valuation allowance | Less: valuation allowance | (3.3) | | | (4.8) | |
| Total net deferred tax assets | Total net deferred tax assets | $ | 40.0 | | | $ | 39.3 | |
| Deferred tax liabilities: | Deferred tax liabilities: | |
| Operating lease assets | Operating lease assets | $ | 6.1 | | | $ | 8.1 | |
| Operating lease assets | |
| Operating lease assets | |
| Fixed assets | Fixed assets | 11.2 | | | 13.0 | |
| Goodwill and intangible assets | Goodwill and intangible assets | 13.8 | | | 23.0 | |
| Total deferred tax liabilities | Total deferred tax liabilities | $ | 31.1 | | | $ | 44.1 | |
| Net deferred tax assets (liabilities) | $ | 8.9 | | | $ | (4.8) | |
| Net deferred tax assets | |
Tax credit carryforwards consist of $2.9$3.0 million of U.S. federal and state tax credits and $1.2$1.3 million of Netherlands tax credits. We have non-U.S. cumulative tax losses of $30.7$26.0 million in various countries.countries ($6.9 million tax effected). Cumulative losses can be used to offset the income tax liabilities on future income in these countries. $30.7 million ofOf these losses, $26.0 million have unlimited carryforward periods. Less than $0.1 million of these losses have a limited carryforward period.
The valuation allowance as of December 31, 20222023 principally applies to tax credit carryforwards in the Netherlands and certain U.S. states which, in the opinion of management, are more likely than not to expire unutilized. However, to the extent that tax benefits related to these carryforwards are realized in the future, the reduction in the valuation allowance will reduce income tax expense. As of December 31, 2022,2023, we believe it is more likely than not that the remainder of our deferred tax assets are realizable. We recorded a net valuation allowance release in 20222023 of $1.5$0.1 million on the basis of management’s reassessment of the amount of its deferred tax assets that are more likely than not to be realized. The net decrease in the valuation allowance was primarily driven by a change in judgment regarding the expected utilization of tax credit carryovers in the U.S. and the Netherlands.
A reconciliation of the beginning and ending amount of unrecognized tax benefits is as follows:
| | | | | | | | | | | |
| 2022 | | 2021 |
| Beginning balance | $ | 4.7 | | | $ | 6.4 | |
| (Decreases) increases as a result of tax positions taken during a prior period | (0.1) | | | (0.1) | |
| Increases as a result of tax positions taken during the current year | 0.8 | | | 0.5 | |
| Decreases relating to settlement with tax authorities | — | | | — | |
| Decreases as a result of a lapse of the applicable statute of limitations | (1.0) | | | (2.1) | |
| Decreases as a result of foreign currency fluctuations | (0.2) | | | — | |
| Ending balance | $ | 4.2 | | | $ | 4.7 | |
NOTES TO THE CONSOLIDATED FINANCIAL STATEMENTS
(Tables in millions, except shares and per share data)
A reconciliation of the beginning and ending amount of unrecognized tax benefits is as follows:
| | | | | | | | | | | |
| 2023 | | 2022 |
| Beginning balance | $ | 4.2 | | | $ | 4.7 | |
| (Decreases) as a result of tax positions taken during a prior period | — | | | (0.1) | |
| Increases as a result of tax positions taken during the current year | 1.2 | | | 0.8 | |
| Decreases relating to settlement with tax authorities | (0.2) | | | — | |
| Decreases as a result of a lapse of the applicable statute of limitations | (1.1) | | | (1.0) | |
| Decreases as a result of foreign currency fluctuations | — | | | (0.2) | |
| Ending balance | $ | 4.1 | | | $ | 4.2 | |
Included in the balance of unrecognized tax benefits as of December 31, 20222023 and 20212022 are potential benefits of $3.9$3.7 million and $4.5$3.9 million, respectively, that if recognized, would affect the effective tax rate.
We recognize potential accrued interest and penalties related to unrecognized tax benefits as a component of income tax expense. In addition to the liability of $4.2$4.1 million and $4.7$4.2 million for unrecognized tax benefits as of December 31, 20222023 and 2021,2022, there was approximately $0.6$0.5 million and $0.7$0.6 million, respectively, for accrued interest and penalties. To the extent interest and penalties are not assessed with respect to uncertain tax positions, the amounts accrued will be revised and reflected as an adjustment to income tax expense.
We and our subsidiaries are subject to U.S. federal income tax as well as income tax of numerous state and foreign jurisdictions. We are generally no longer subject to U.S. federal tax examinations for taxable years before 2018. The number of years which remain open for audit for U.S. state or foreign tax purposes varies by jurisdiction but generally ranges from 3-5 years. We are currently undergoing income tax examinations in various foreign jurisdictions. Although the final outcome of these examinations cannot be currently determined, we believe that we have adequate reserves with respect to these examinations.
18. Share-Based Compensation
We have five plans under which we have awarded share-based compensation grants: The 1997 Non-Employee Directors Option Plan ("1997 Plan"), which provided for stock option grants to our non-employee Directors, the 2007 Stock Incentive Plan (“2007 Plan”), the Amended and Restated 2010 Stock Incentive Plan, as Amended (“2010 Plan”), the 2017 Stock Incentive Plan ("2017 Plan") and the 2020 Stock Incentive Plan ("2020 Plan").
As of December 31, 2022,2023, there were 1,130,3231,111,646 shares reserved for issuance under the 2007 Plan, the 2010 Plan and the 2017 Plan for outstanding compensation awards. There were 1,317,699975,475 shares available for issuance under the 2020 Plan for current and future equity awards as of December 31, 2022.2023. The Compensation Committee of the Board of Directors determines the number of shares awarded and the grant date, subject to the terms of our equity award policy.
We recognized total share-based compensation expense of $11.6 million, $7.8 million $9.5 million and $6.0$9.5 million, respectively, during the years ended 2023, 2022 2021 and 2020.2021. The total excess tax benefit recognized for share-based compensation arrangements during the years ended 2023, 2022 and 2021 and 2020 was $0.1 million, $0.3 million $0.7 million and $0.3$0.7 million, respectively.
Stock Option Awards
We determined the fair value of our stock option awards using the Black-Scholes valuation model that uses the assumptions noted in the table below. The expected term selected for stock options granted during the year represents the period of time that the stock options are expected to be outstanding based on historical data of stock option holder exercise and termination behavior of similar grants. The risk-free interest rate for periods within the contractual life of the stock option is based on the U.S. Treasury rate over the expected life at the time of grant. Expected volatilities are based upon historical volatility of our stock over a period equal to the expected
NOTES TO THE CONSOLIDATED FINANCIAL STATEMENTS
(Tables in millions, except shares and per share data)
life of each stock option grant. Dividend yield is estimated over the expected life based on our dividend policy and historical dividends paid. To determine the amount of compensation cost to be recognized in each period, we account for forfeitures as they occur.
NOTES TO THE CONSOLIDATED FINANCIAL STATEMENTS
(Tables in millions, except shares and per share data)
The following table illustrates the valuation assumptions used for the 2023, 2022 2021 and 20202021 grants:
| | 2022 | | 2021 | | 2020 |
| 2023 | | | 2023 | | 2022 | | 2021 |
| Expected volatility | Expected volatility | 34 | % | | 34 - 35% | | 27 - 32% | Expected volatility | 35 | % | | 34 | % | | 34 - 35% |
| Weighted-average expected volatility | Weighted-average expected volatility | 34 | % | | 35 | % | | 27 | % | Weighted-average expected volatility | 35 | % | | 34 | % | | 35 | % |
| Expected dividend yield | Expected dividend yield | 1.2 | % | | 1.3 - 1.4% | | 1.3 - 1.3% | Expected dividend yield | 1.6 | % | | 1.2 | % | | 1.3 - 1.4% |
| Weighted-average expected dividend yield | Weighted-average expected dividend yield | 1.2 | % | | 1.4 | % | | 1.3 | % | Weighted-average expected dividend yield | 1.6 | % | | 1.2 | % | | 1.4 | % |
| Expected term, in years | Expected term, in years | 5 | | 5 | | 5 | Expected term, in years | 5 | | 5 |
| Risk-free interest rate | Risk-free interest rate | 1.9 - 1.9% | | 0.8 - 0.9% | | 0.3 - 1.3% | Risk-free interest rate | 4.2 - 4.2% | | 1.9 - 1.9% | | 0.8 - 0.9% |
New stock option awards granted vest one-third each year over a three year period and have a ten year contractual term. Compensation expense equal to the grant date fair value is recognized for these awards on a straight-line basis over the awards' vesting period. Stock options granted to employees are subject to accelerated expensing if the option holder meets the retirement definition set forth in the 2020, 2017 and 2010 Plans.
The following table summarizes the activity during the year ended December 31, 20222023 for stock option awards:
| | Shares | | Weighted-Average Exercise
Price |
| Shares | | | Shares | | Weighted-Average Exercise
Price |
| Outstanding at beginning of year | Outstanding at beginning of year | 909,272 | | $ | 65.98 | |
| Granted | Granted | 63,724 | | 78.78 | |
| Exercised | Exercised | (21,807) | | 55.30 | |
| Forfeited | Forfeited | (8,107) | | 77.19 | |
| Expired | Expired | (11,239) | | 69.15 | |
| Outstanding at end of year | Outstanding at end of year | 931,843 | | $ | 66.97 | |
| Exercisable at end of year | Exercisable at end of year | 814,220 | | $ | 65.24 | |
The weighted-average grant date fair value of stock options granted during the years ended December 31, 2023, 2022 and 2021 was $24.21, $23.45 and 2020 was $23.45, $22.01, and $18.45, respectively. The total intrinsic value of stock options exercised during the years ended December 31, 2023, 2022 and 2021 and 2020 was $5.9 million, $0.4 million $3.9 million and $3.3$3.9 million, respectively. The aggregate intrinsic value of options outstanding and exercisable at December 31, 20222023 was $1.8$14.3 million and $1.8$12.5 million, respectively. The weighted-average remaining contractual life for options outstanding and exercisable as of December 31, 20222023 was 4.75.1 years and 4.24.3 years, respectively. As of December 31, 2022,2023, there was unrecognized compensation cost for nonvested options of $1.5 million, which is expected to be recognized over a weighted-average period of 1.3 years.
Restricted Share Awards
Restricted share awards for employees generally have a three year vesting period from the effective date of the grant. Restricted share awards to non-employee directors vest upon a change of control or upon termination of service as a director occurring at least six months after grant date of the award so long as termination is for one of the following reasons: death; disability; retirement in accordance with Tennant policy (e.g., age, term limits, etc.); resignation at request of Board (other than for gross misconduct); resignation following at least six months’ advance notice; failure to be renominated (unless due to unwillingness to serve) or reelected by shareholders; or removal by shareholders. We use the closing share price the day before the grant date to determine the fair value of our restricted share awards. Expenses on these awards are recognized over the vesting period.
NOTES TO THE CONSOLIDATED FINANCIAL STATEMENTS
(Tables in millions, except shares and per share data)
determine the fair value of our restricted share awards. Expenses for these awards are recognized over the vesting period.
The following table summarizes the activity during the year ended December 31, 20222023 for nonvested restricted share awards:
| | Shares | | Weighted-Average Grant Date Fair
Value |
| Shares | | | Shares | | Weighted-Average Grant Date Fair
Value |
| Nonvested at beginning of year | Nonvested at beginning of year | 91,574 | | $ | 59.30 | |
| Granted | Granted | 18,967 | | 78.78 | |
| Vested | Vested | (29,030) | | 58.32 | |
| Forfeited | Forfeited | (6,099) | | 79.45 | |
| Nonvested at end of year | Nonvested at end of year | 75,412 | | $ | 62.94 | |
The total fair value of restricted shares vested during the years ended December 31, 2023, 2022 and 2021 and 2020 was $0.4 million, $1.7 million $1.2 million and $0.7$1.2 million, respectively. As of December 31, 2022,2023, there was $1.5 million of total unrecognized compensation cost related to nonvested restricted shares which is expected to be recognized over a weighted-average period of 1.81.7 years.
Performance Share Awards
We grant performance share awards to key employees as a part of our long-term management compensation program. These awards are earned based upon achievement of certain financial performance targets over a three year period. The number of shares of common stock a participant receives will be increased (up to 200 percent of target levels) or reduced (down to zero) based on the level of achievement of the financial performance targets. We use the closing share price the day before the grant date to determine the fair value of our performance share awards. Expenses on these awards are recognized over a three year performance period. Performance shares are granted in restricted stock units. They are payable in stock and vest solely upon achievement of certain financial performance targets during this three year period.
The following table summarizes the activity during the year ended December 31, 20222023 for nonvested performance share awards:
| | Shares | | Weighted-Average Grant Date Fair
Value |
| Shares | | | Shares | | Weighted-Average Grant Date Fair
Value |
| Nonvested at beginning of year | Nonvested at beginning of year | 130,352 | | $ | 73.96 | |
| Granted | Granted | 63,849 | | 77.19 | |
| Vested | Vested | (43,198) | | 63.69 | |
| Forfeited | Forfeited | (16,240) | | 77.99 | |
| Nonvested at end of year | Nonvested at end of year | 134,763 | | $ | 78.29 | |
During the year ended December 31, 2021, 43,6212022, 43,198 performance shares vested. 29,595There were 43,621 performance shares vested during the year ended December 31, 2020.2021. As of December 31, 2022,2023, we expect to recognize $3.6$7.8 million of total compensation costs over a weighted-average period of 1.71.8 years.
Restricted Stock Units
We grant restricted stock units to employees and non-employee directors, which generally vest within three years from the date of the grant. Vested restricted stock units are paid out in stock. We use the closing share
NOTES TO THE CONSOLIDATED FINANCIAL STATEMENTS
(Tables in millions, except shares and per share data)
price the day before the grant date to determine the fair value of our restricted stock units. Expenses on these awards are recognized on a straight-line basis over the vesting period of the award.
NOTES TO THE CONSOLIDATED FINANCIAL STATEMENTS
(Tables in millions, except shares and per share data)
The following table summarizes the activity during the year ended December 31, 20222023 for nonvested restricted stock units:
| | Shares | | Weighted-Average Grant Date Fair
Value |
| Shares | | | Shares | | Weighted-Average Grant Date Fair
Value |
| Nonvested at beginning of year | Nonvested at beginning of year | 90,971 | | $ | 78.06 | |
| Granted | Granted | 52,477 | | 68.48 | |
| Vested | Vested | (15,673) | | 83.57 | |
| Forfeited | Forfeited | (13,071) | | 72.59 | |
| Nonvested at end of year | Nonvested at end of year | 114,704 | | $ | 73.55 | |
The total fair value of shares vested during the years ended December 31, 2023, 2022 and 2021 and 2020 was $3.0 million, $0.5 million $3.2 million and $2.6$3.2 million, respectively. As of December 31, 2022,2023, there was $3.1$3.8 million of total unrecognized compensation cost related to nonvested shares which is expected to be recognized over a weighted-average period of 1.41.5 years.
Share-Based Liabilities
As of December 31, 20222023 and 2021,2022, we had $0.3$0.4 million and $0.3 million in total share-based liabilities recorded on our consolidated balance sheets, respectively.
19. Income Attributable to Tennant Company Per Share
The computations of basic and diluted earnings attributable to Tennant Company per share for the years ended December 31 were as follows:
| | 2022 | | 2021 | | 2020 |
| 2023 | | | 2023 | | 2022 | | 2021 |
| Numerator: | Numerator: | |
| Net income | Net income | $ | 66.3 | | | $ | 64.9 | | | $ | 33.7 | |
| Net income | |
| Net income | |
| Denominator: | Denominator: | |
| Basic - weighted average shares outstanding | |
| Basic - weighted average shares outstanding | |
| Basic - weighted average shares outstanding | Basic - weighted average shares outstanding | 18,494,356 | | 18,499,674 | | 18,349,724 | 18,509,523 | | 18,494,356 | | 18,499,674 |
| Effect of dilutive securities | Effect of dilutive securities | 202,899 | | 349,543 | | 285,278 | Effect of dilutive securities | 274,110 | | 202,899 | | 349,543 |
| Diluted - weighted average shares outstanding | Diluted - weighted average shares outstanding | 18,697,255 | | 18,849,217 | | 18,635,002 | Diluted - weighted average shares outstanding | 18,783,633 | | 18,697,255 | | 18,849,217 |
| Basic earnings per share | Basic earnings per share | $ | 3.58 | | | $ | 3.51 | | | $ | 1.84 | |
| Diluted earnings per share | Diluted earnings per share | $ | 3.55 | | | $ | 3.44 | | | $ | 1.81 | |
Excluded from the dilutive securities shown above were options to purchase and shares to be paid out under share-based compensation plans of 249,690, 649,054 171,273 and 610,118171,273 shares of common stock during 2023, 2022 2021 and 2020,2021, respectively. These exclusions were made if the exercise prices of these options are greater than the average market price of our common stock for the period, if the number of shares we can repurchase under the treasury stock method exceeds the weighted shares outstanding in the options or if we have a net loss, as these effects are anti-dilutive.
NOTES TO THE CONSOLIDATED FINANCIAL STATEMENTS
(Tables in millions, except shares and per share data)
20. Segment Reporting
We are organized into four operating segments: North America; Latin America; Europe, Middle East, Africa; and Asia Pacific. We combine our North America and Latin America operating segments into the "Americas" for reporting net sales by geographic area. In accordance with the objective and basic principles of the applicable accounting guidance, we aggregate our operating segments into one reportable segment that consists of the design, manufacture and sale of products used primarily in the maintenance of nonresidential surfaces.
The following table presents net sales by geographic area for the three years ended December 31:
| | 2022 | | 2021 | | 2020 |
| 2023 | | | 2023 | | 2022 | | 2021 |
| Net Sales: | Net Sales: | |
| United States | |
| United States | |
| United States | United States | $ | 618.8 | | | $ | 566.4 | | | $ | 546.2 | |
| Other Americas | Other Americas | 87.1 | | | 91.9 | | | 84.8 | |
| Americas | Americas | 705.9 | | | 658.3 | | | 631.0 | |
| Europe, Middle East, Africa | Europe, Middle East, Africa | 301.6 | | | 331.9 | | | 278.2 | |
| Asia Pacific | Asia Pacific | 84.7 | | | 100.6 | | | 91.8 | |
| Total | Total | $ | 1,092.2 | | | $ | 1,090.8 | | | $ | 1,001.0 | |
Accounting policies of the operations in various operating segments are the same as those described in Note 1. Net sales are attributed to each operating segment based on the end user country and are net of intercompany sales. Apart from the United States shown in the table above, there were no individual foreign locations which had net sales which represented more than 10% of our consolidated net sales. No single customer represents more than 10% of our consolidated net sales.
The following table presents long-lived assets by geographic area as of December 31:
| | 2022 | | 2021 | | 2020 |
| 2023 | | | 2023 | | 2022 | | 2021 |
| Long-lived assets: | Long-lived assets: | |
| United States | |
| United States | |
| United States | United States | $ | 105.9 | | | $ | 106.6 | | | $ | 121.9 | |
| Other Americas | Other Americas | 26.4 | | | 18.8 | | | 14.7 | |
| Americas | Americas | 132.3 | | | 125.4 | | | 136.6 | |
| Italy | Italy | 223.5 | | | 280.4 | | | 321.5 | |
| Other Europe, Middle East, Africa | Other Europe, Middle East, Africa | 69.6 | | | 36.2 | | | 34.0 | |
| Europe, Middle East, Africa | Europe, Middle East, Africa | 293.1 | | | 316.6 | | | 355.5 | |
| Asia Pacific | Asia Pacific | 32.1 | | | 35.8 | | | 37.5 | |
| Total | Total | $ | 457.5 | | | $ | 477.8 | | | $ | 529.6 | |
Long-lived assets consist of property, plant and equipment, goodwill, intangible assets and certain other assets. Apart from the United States and Italy shown in the table above, there are no other individual foreign locations which have long-lived assets which represent more than 10% of our consolidated long-lived assets.
21. Subsequent Events
On February 21, 2024, we entered into an agreement to acquire a non-controlling preferred equity share investment in Brain Corp., a privately held autonomous technology company in San Diego, California. The investment will drive the development and adoption of the next generation of robotic and AI technologies. The purchase of the investment was completed on February 21, 2024 for $32.1 million. The Company is currently evaluating the accounting treatment and financial statement impact of the investment.
ITEM 9 – Changes in and Disagreements with Accountants on Accounting and Financial Disclosure
None.
ITEM 9A – Controls and Procedures
Disclosure Controls and Procedures
Our management, including our Chief Executive Officer and Chief Financial Officer and Principal Accounting Officer, have conducted an evaluation of the effectiveness of the design and operation of our disclosure controls and procedures (as defined in Rule 13a-15(e) under the Securities Exchange Act of 1934, as amended (the Exchange Act)) as of December 31, 2022.2023. Based on that evaluation, our Chief Executive Officer and Chief Financial Officer and Principal Accounting Officer concluded that, as of December 31, 2022,2023, our disclosure controls and procedures were effective.
For purposes of Rule 13a-15(e), the term disclosure controls and procedures means controls and other procedures of an issuer that are designed to ensure that information required to be disclosed by the issuer in the reports that it files or submits under the Exchange Act (15 U.S.C. 78a et seq.) is recorded, processed, summarized and reported within the time periods specified in the SEC’s rules and forms. Disclosure controls and procedures include, without limitation, controls and procedures designed to ensure that information required to be disclosed by an issuer in the reports that it files or submits under the Exchange Act is accumulated and communicated to the issuer’s management, including its Chief Executive Officer and Chief Financial Officer and Principal Accounting Officer, or persons performing similar functions, as appropriate to allow timely decisions regarding required disclosure.
Management’s Report on Internal Control over Financial Reporting
Our management is responsible for establishing and maintaining adequate internal control over financial reporting, as such term is defined in Rule 13a-15(f) under the Exchange Act.
The Company’s internal control over financial reporting is a process designed to provide reasonable assurance regarding the reliability of financial reporting and the preparation of financial statements for external purposes in accordance with generally accepted accounting principles. A company’s internal control over financial reporting includes those policies and procedures that:
(i)Pertain to the maintenance of records that, in reasonable detail, accurately and fairly reflect the transactions and dispositions of the assets of the company;
(ii)Provide reasonable assurance that transactions are recorded as necessary to permit preparation of financial statements in accordance with generally accepted accounting principles, and that receipts and expenditures of the company are being made only in accordance with authorizations of management and directors of the company; and
(iii)Provide reasonable assurance regarding prevention or timely detection of unauthorized acquisition, use or disposition of the company’s assets that could have a material effect on the financial statements.
Because of its inherent limitations, internal control over financial reporting may not prevent or detect misstatements. Also, projections of any evaluation of effectiveness to future periods are subject to the risk that controls may become inadequate because of changes in conditions, or that the degree of compliance with the policies or procedures may deteriorate.
A material weakness is a deficiency, or combination of deficiencies, in internal control over financial reporting such that there is a reasonable possibility that a material misstatement of the Company’s annual or interim financial statements will not be prevented or detected on a timely basis.
Under the supervision of the Audit Committee of the Board of Directors and with the participation of our management, including our Chief Executive Officer and Chief Financial Officer and Principal Accounting Officer, we conducted an evaluation of the effectiveness of our internal control over financial reporting using the criteria established in Internal Control - Integrated Framework (2013) issued by the Committee of Sponsoring
Organizations of the Treadway Commission (COSO). Based on our assessment and those criteria, our Chief Executive Officer and Chief Financial Officer and Principal Accounting Officer concluded that our internal control over financial reporting was effective as of December 31, 2022.2023.
Deloitte & Touche LLP, our independent registered public accounting firm, has audited the effectiveness of the Company's internal control over financial reporting as of December 31, 20222023 and has issued a report which is included in Item 8 of this Annual Report on Form 10-K.
Changes in Internal Control Over Financial Reporting
There were no significant changes in the Company's internal control over financial reporting during the quarter ended December 31, 20222023 that have materially affected, or are reasonably likely to materially affect, the Company's internal control over financial reporting.
ITEM 9B – Other Information
None.On November 20, 2023, Donal L. Mulligan, Board of Directors, adopted a Rule 10b5-1 trading arrangement that is intended to satisfy the affirmative defense of Rule 10b5-1(c) for the sale of up to 2,358 shares of the Company’s common stock until April 30, 2025.
ITEM 9C – Disclosure Regarding Foreign Jurisdictions that Prevent Inspections
None.
PART III
ITEM 10 – Directors, Executive Officers and Corporate Governance
Information required under this item with respect to directors is contained in the sectionssection entitled “Board of Directors” as part of our 20232024 Proxy Statement and is incorporated herein by reference. See also Item 1, Information About Our Executive Officers in Part I hereof.
Business Ethics GuideCode of Conduct
We have adopted the Tennant Company Business Ethics Guide,Code of Conduct, which applies to all of our employees, directors, consultants, agents and anyone else acting on our behalf. The Business Ethics GuideCode of Conduct includes particular provisions applicable to our senior financial management, which includes our Chief Executive Officer, Chief Financial Officer, Chief Accounting Officer and other employees performing similar functions. A copy of our Business Ethics GuideCode of Conduct is available on the Investor Relations website at investors.tennantco.com. We intend to post on our website any amendment to, or waiver from, a provision of our Business Ethics GuideCode of Conduct that applies to our Principal Executive Officer, Principal Financial Officer, Principal Accounting Officer, Chief Accounting Officer and other persons performing similar functions promptly following the date of such amendment or waiver. In addition, we have also posted copies of our Corporate Governance Principles and the Charters for our Audit, Compensation, Governance and Executive Committees on our website.
ITEM 11 – Executive Compensation
Information required under this item is contained in the sections entitled “Director Compensation," “Executive Compensation Information” and "Pay Ratio" as part of our 20232024 Proxy Statement and is incorporated herein by reference.
ITEM 12 – Security Ownership of Certain Beneficial Owners and Management and Related Shareholder Matters
Information required under this item is contained in the sections entitled “Security Ownership of Certain Beneficial Owners and Management” and "Equity Compensation Plan Information" as part of our 20232024 Proxy Statement and areis incorporated herein by reference.
ITEM 13 – Certain Relationships and Related Transactions, and Director Independence
Information required under this item is contained in the sections entitled “Director Independence” and “Related-Person Transaction Approval Policy” as part of our 20232024 Proxy Statement and is incorporated herein by reference.
ITEM 14 – Principal Accountant Fees and Services
Information required under this item is contained in the section entitled “Fees Paid to Independent Registered Public Accounting Firm” as part of our 20232024 Proxy Statement and is incorporated herein by reference.
PART IV
ITEM 15 – Exhibits and Financial Statement Schedules
A.The following documents are filed as a part of this report:
1.Financial Statements
Consolidated financial statements and related notes, together with the reports of Deloitte & Touche LLP, Independent Registered Public Accounting Firm (PCAOB ID No. 34), appear in Part II Item 8. Financial Statements and Supplementary Data of this Form 10-K.
2.Financial Statement Schedule
Schedule II - Valuation and Qualifying Accounts
| | (In millions) | (In millions) | 2022 | | 2021 | | 2020 | (In millions) | 2023 | | 2022 | | 2021 |
| Allowance for doubtful accounts: | Allowance for doubtful accounts: | |
| Balance at beginning of year | |
| Balance at beginning of year | |
| Balance at beginning of year | Balance at beginning of year | $ | 5.3 | | | $ | 4.6 | | | $ | 3.6 | |
| Charged to costs and expenses | Charged to costs and expenses | 1.9 | | | 1.5 | | | 2.2 | |
| Reclassification | Reclassification | — | | | — | | | — | |
Charged to other accounts(a) | Charged to other accounts(a) | 0.1 | | | 0.3 | | | — | |
Deductions(b) | Deductions(b) | (1.2) | | | (1.1) | | | (1.2) | |
| Balance at end of year | Balance at end of year | $ | 6.1 | | | $ | 5.3 | | | $ | 4.6 | |
| Sales returns reserve: | Sales returns reserve: | |
| Balance at beginning of year | Balance at beginning of year | $ | 1.0 | | | $ | 1.0 | | | $ | 1.2 | |
| Balance at beginning of year | |
| Balance at beginning of year | |
| Charged to costs and expenses | Charged to costs and expenses | 0.9 | | | 0.1 | | | 0.2 | |
Deductions(b) | Deductions(b) | (0.5) | | | (0.1) | | | (0.4) | |
| Balance at end of year | Balance at end of year | $ | 1.4 | | | $ | 1.0 | | | $ | 1.0 | |
| Allowance for excess and obsolete inventories: | Allowance for excess and obsolete inventories: | |
| Balance at beginning of year | |
| Balance at beginning of year | |
| Balance at beginning of year | Balance at beginning of year | $ | 14.3 | | | $ | 13.6 | | | $ | 9.8 | |
| Charged to costs and expenses | Charged to costs and expenses | 0.5 | | | 1.7 | | | 4.4 | |
Charged to other accounts(a) | Charged to other accounts(a) | 0.2 | | | (0.3) | | | 0.2 | |
Deductions(c) | Deductions(c) | (0.8) | | | (0.7) | | | (0.8) | |
| Balance at end of year | Balance at end of year | $ | 14.2 | | | $ | 14.3 | | | $ | 13.6 | |
| Valuation allowance for deferred tax assets: | Valuation allowance for deferred tax assets: | |
| Balance at beginning of year | Balance at beginning of year | $ | 4.8 | | | $ | 7.5 | | | $ | 6.2 | |
| Balance at beginning of year | |
| Balance at beginning of year | |
| Charged to costs and expenses | Charged to costs and expenses | (1.4) | | | (2.6) | | | 0.9 | |
Charged to other accounts(a) | Charged to other accounts(a) | (0.1) | | | (0.1) | | | 0.4 | |
| Balance at end of year | Balance at end of year | $ | 3.3 | | | $ | 4.8 | | | $ | 7.5 | |
| Warranty reserve: | Warranty reserve: | |
| Balance at beginning of year | Balance at beginning of year | $ | 10.4 | | | $ | 11.1 | | | $ | 12.7 | |
| Balance at beginning of year | |
| Balance at beginning of year | |
| Charged to costs and expenses | Charged to costs and expenses | 9.9 | | | 8.5 | | | 11.9 | |
Charged to other accounts(a) | Charged to other accounts(a) | (0.1) | | | (0.2) | | | 0.1 | |
Deductions(d) | Deductions(d) | (9.3) | | | (9.0) | | | (13.6) | |
| Balance at end of year | Balance at end of year | $ | 10.9 | | | $ | 10.4 | | | $ | 11.1 | |
(a)Primarily includes impact from foreign currency fluctuations.
(b)Includes accounts determined to be uncollectible and charged against reserves, net of collections on accounts previously charged against reserves.
(c)Includes inventory identified as excess, slow moving or obsolete and charged against reserves.
(d)Includes warranty claims charged against reserves.
All other schedules are omitted because they are not applicable or the required information is shown in the consolidated financial statements or notes thereto.
3. Exhibits
| | | | | | | | | | | | | | |
| Item # | | Description | | Method of Filing |
| 3.1 | | | | Incorporated by reference to Exhibit 3i to the Company’s Form 10-Q for the quarter ended June 30, 2006. |
| 3.2 | | | | Incorporated by reference to Exhibit 3.2 to the Company’s Current Report on Form 8-K dated January 13, 2023. |
| 3.3 | | | | Incorporated by reference to Exhibit 3iii to the Company's Form 10-Q for the quarter ended March 31, 2018. |
| 4.1 | | | | Filed herewith electronically.Incorporated by reference to Exhibit 4.1 to the Company's Form 10-K for the year ended December 31, 2022. |
| 10.1 | | | | Incorporated by reference to Exhibit 10.1 to the Company’s Form 10-Q for the quarter ended September 30, 2012. |
| 10.2 | | | | Incorporated by reference to Exhibit 10.3 to the Company's Form 10-K for the year ended December 31, 2011. |
| 10.3 | | | | Filed herewith electronically. |
| 10.4 | | | | Incorporated by reference to Exhibit 10.6 to the Company’s Form 10-Q for the quarter ended June 30, 2004. |
| 10.5 | | | | Incorporated by reference to Appendix A to the Company’s Proxy Statement for the 2006 Annual Meeting of Shareholders filed on March 15, 2006. |
| 10.6 | | | | Incorporated by reference to Appendix A to the Company’s Proxy Statement for the 2007 Annual Meeting of Shareholders filed on March 15, 2007. |
| 10.7 | | | | Incorporated by reference to Appendix A to the Company's Proxy Statement for the 2013 Annual Meeting of Shareholders filed on March 11, 2013. |
| 10.8 | | | | Incorporated by reference to Appendix A on the Company's Proxy Statement for the 2017 Annual Meeting of Shareholders filed March 15, 2017. |
| 10.9 | | | | Incorporated by reference to Exhibit 10.3 to the Company's Form 10-Q for the quarter ended June 30, 2017. |
| 10.10 | | | | Incorporated by reference to Exhibit 10.4 to the Company's Form 10-Q for the quarter ended June 30, 2017. |
| 10.11 | | | | Incorporated by reference to Exhibit 10.5 to the Company's Form 10-Q for the quarter ended June 30, 2017. |
| 10.12 | | | | Incorporated by reference to Exhibit 10.6 to the Company's Form 10-Q for the quarter ended June 30, 2017. |
| | | | | | | | | | | | | | |
| 10.13 | | | | Incorporated by reference to Exhibit 10.1 to the Company's Form 10-Q for the quarter ended June 30, 2018. |
| | | | | | | | | | | | | | |
| 10.14 | | | | Incorporated by reference to Exhibit 10.1 to the Company's Current Report on Form 8-K filed August 20, 2018. |
| 10.15 | | | | Incorporated by reference to Exhibit 10.1 to the Company's Current Report on Form 8-K filed October 10, 2018. |
| 10.16 | | | | Incorporated by reference to Exhibit 10.3 to the Company’s Form 10-Q for the quarter ended June 30, 2020. |
| 10.17 | | | | Incorporated by reference to Exhibit 10.4 to the Company’s Form 10-Q for the quarter ended June 30, 2020. |
| 10.18 | | | | Incorporated by reference to Exhibit 10.5 to the Company’s Form 10-Q for the quarter ended June 30, 2020. |
| 10.19 | | | | Incorporated by reference to Exhibit 10.6 to the Company’s Form 10-Q for the quarter ended June 30, 2020. |
| 10.20 | | | | Incorporated by reference to Exhibit 10.7 to the Company’s Form 10-Q for the quarter ended June 30, 2020. |
| 10.21 | | | | Incorporated by reference to Exhibit 10.8 to the Company’s Form 10-Q for the quarter ended June 30, 2020. |
| 10.22 | | | | Incorporated by reference to Exhibit 10.9 to the Company’s Form 10-Q for the quarter ended June 30, 2020. |
| 10.23 | | | | Incorporated by reference to Exhibit 10.2 to the Company’s Form 10-Q for the quarter ended March 31, 2021. |
| 10.24 | | | | Incorporated by reference to Exhibit 99.1 to the Company’s Registration Statement on Form S-8 filed on May 10, 2021. |
| 10.25 | | | | Incorporated by reference to Exhibit 99.2 to the Company’s Registration Statement on Form S-8 filed on May 10, 2021. |
| 10.26 | | | | Incorporated by reference to Exhibit 99.3 to the Company’s Registration Statement on Form S-8 filed on May 10, 2021. |
| 10.27 | | | | Incorporated by reference to Exhibit 99.4 to the Company’s Registration Statement on Form S-8 filed on May 10, 2021. |
| 10.28 | | | | Incorporated by reference to Exhibit 10.1 to the Company’s Current Report on Form 8-K filed on April 7, 2021. |
| 10.29 | | | | Incorporated by reference to Exhibit 10.2 to the Company’s Form 10-Q for the quarter ended June 30, 2021. |
| 10.30 | | | | Incorporated by reference to Exhibit 10.01 to the Company's Current Report on Form 8-K filed on November 17, 2022. |
| 21 | | | | Filed herewith electronically. |
| 23.1 | | | | Filed herewith electronically. |
| 24.1 | | Powers of Attorney | | Included on signature page. |
| | | | | | | | | | | | | | |
| 31.1 | | | | Filed herewith electronically. |
| 31.2 | | | | Filed herewith electronically. |
| | | | | | | | | | | | | | |
| 32.1 | | | | Filed herewith electronically. |
| 32.2 | | | | Filed herewith electronically. |
| 97 | | | | Filed herewith electronically. |
| 101 | | The following financial information from Tennant Company’s annual report on Form 10-K for the period ended December 31, 2022,2023, filed with the SEC on February 23, 2023,22, 2024, formatted in Inline Extensible Business Reporting Language (iXBRL): (i) the Consolidated Statements of Income for the years ended December 31, 2023, 2022, 2021, and 2020,2021, (ii) the Consolidated Statements of Comprehensive Income for the years ended December 31, 2023, 2022, 2021, and 2020,2021, (iii) the Consolidated Balance Sheets as of December 31, 20222023 and 2021,2022, (iv) the Consolidated Statements of Cash Flows for the years ended December 31, 2023, 2022, 2021, and 2020,2021, (v) the Consolidated Statements of Equity for the years ended December 31, 2023, 2022, 2021, and 2020,2021, and (vi) Notes to the Consolidated Financial Statements. | | Filed herewith electronically. |
| 104 | | Inline Extensible Business Reporting language (iXBRL) for the cover page of this Annual Report on Form 10-K, included in Exhibit 101 | | Filed herewith electronically. |
*Management contract or compensatory plan or arrangement required to be filed as an exhibit to this annual report on Form 10-K.
ITEM 16 – Form 10-K Summary
None.
SIGNATURES
Pursuant to the requirements of Section 13 or 15(d) of the Securities Exchange Act of 1934, the Registrant has duly caused this report to be signed on its behalf by the undersigned, thereunto duly authorized.
| | | | | | | | |
| TENNANT COMPANY |
| By | /s/ David W. Huml |
| | David W. Huml |
| | President, CEO and |
| | Board of Directors |
| Date | February 23, 202322, 2024 |
Each of the undersigned hereby appoints David W. Huml and Kristin A. Erickson, and each of them (with full power to act alone), as attorneys and agents for the undersigned, with full power of substitution, for and in the name, place and stead of the undersigned, to sign and file with the Securities and Exchange Commission under the Securities Exchange Act of 1934, any and all amendments and exhibits to this annual report on Form 10-K and any and all applications, instruments, and other documents to be filed with the Securities and Exchange Commission pertaining to this annual report on Form 10-K or any amendments thereto, with full power and authority to do and perform any and all acts and things whatsoever requisite and necessary or desirable.
Pursuant to the requirements of Section 13 or 15(d) of the Securities Exchange Act of 1934, this report has been signed by the following persons on behalf of the Registrant and in the capacities and on the dates indicated.
| | | | | | | | | | | | | | |
| By | /s/ David W. Huml | | By | /s/ Timothy R. Morse |
| David W. Huml | | | Timothy R. Morse |
| President, CEO and Board of Directors | | | Board of Directors |
| Date | February 23, 202322, 2024 | | Date | February 23, 202322, 2024 |
| | | | |
| By | /s/ Fay West | | By | /s/ Donal L. Mulligan |
| Fay West | | | Donal L. Mulligan |
| Chief Financial Officer and Principal Accounting Officer | | | Board of Directors |
| Date | February 23, 202322, 2024 | | Date | February 23, 202322, 2024 |
| | | | |
| By | /s/ Azita Arvani | | By | /s/ Steven A. Sonnenberg |
| Azita Arvani | | | Steven A. Sonnenberg |
| Board of Directors | | | Board of Directors |
| Date | February 23, 202322, 2024 | | Date | February 23, 202322, 2024 |
| | | | |
| By | /s/ Andrew P. Hider | | By | /s/ Maria C. Green |
| Andrew P. Hider | | | Maria C. Green |
| Board of Directors | | | Board of Directors |
| Date | February 23, 202322, 2024 | | Date | February 23, 202322, 2024 |
| | | | |
| By | /s/ Carol S. Eicher | | By | /s/ David Windley |
| Carol S. Eicher | | | David Windley |
| Board of Directors | | | Board of Directors |
| Date | February 23, 202322, 2024 | | Date | February 23, 202322, 2024 |
HIDDEN IXBRL