SECURITIES AND EXCHANGE COMMISSION
Washington, D.C. 20549
FORM 10-K
Annual report pursuant to Section 13 or 15 (d) of the Securities Exchange Act of 1934
For the fiscal year ended December 31, 20082010 | Commission File No. 0-3978 |
UNICO AMERICAN CORPORATION
(Exact name of registrant as specified in its charter)
| Nevada | 95-2583928 |
| (State or other jurisdiction of incorporation or organization) | (IRS Employer Identification No.) |
| | |
| 23251 Mulholland Drive, Woodland Hills, California | 91364 |
| (Address of Principal Executive Offices) | (Zip Code) |
Registrant's telephone number, including area code: (818) 591-9800
Securities registered pursuant to Section 12(b) of the Act:
| Common Stock, No Par Value | NASDAQ Stock Market LLC |
| (Title of each class) | Name Of Each Exchange On Which Registered |
Securities registered pursuant to section 12(g) of the Act:
None
(Title of Class)
Indicate by check mark if the registrant is a well-known seasoned issuer, as defined in Rule 405 of the Securities Act. Yes No X
Indicate by check mark if the registrant is not required to file reports pursuant to Section 13 or Section 15(d) of the Exchange Act. Yes No X
Indicate by check mark whether the registrant (1) has filed all reports required to be filed by Section 13 or 15 (d) of the Securities Exchange Act of 1934 during the preceding 12 months (or for such shorter period that the Registrant was required to file such reports), and (2) has been subject to such filing requirements for the past 90 days. Yes X No __
Indicate by check mark whether the registrant has submitted electronically and posted on its corporate Web site, if any, every Interactive Data File required to be submitted and posted pursuant to Rule 405 of Regulation S-T (§ 232.405 of this chapter) during the preceding 12 months (or for such shorter period that the registrant was required to submit and post such files). Yes__ No___
Indicate by check mark if disclosure of delinquent filers pursuant to Item 405 of Regulation S-K is not contained herein, and will not be contained, to the best of Registrant’s knowledge, in definitive proxy of information statements incorporated by reference as Part III of this Form 10-K or any amendment to this Form 10-K. X
Indicate by check mark whether the registrant is a large accelerated filer, an accelerated filer, a non-accelerated filer or a smaller reporting company. See the definitions of “large acceleratedaccelerator filer,” “accelerated“accelerator filer” and “smaller reporting company” in Rule 12b-2 of the Exchange Act. (Check one):
Large accelerated filer __ Accelerated filer __
Non-accelerated filer ___ Smaller reporting company X
(Do(Do not check if a smaller reporting company)
Indicate by check mark whether the registrant is a shell company (as defined in Rule 12b-2 of the Exchange Act).
Yes No X
The aggregate market value of registrant’s voting and non-voting common equity held by non-affiliates as of June 30, 2008,2010, the last business day of Registrant’s most recently completed second fiscal quarter was $28,473,038.$23,770,814.
5,567,627
NumberIndicate the number of shares outstanding of each of the issuer’s classes of common stock, outstanding as of March 26, 2009the latest practicable date.
| Class | Outstanding at March 25, 2011 |
| Common Stock, $0 Par value per share | 5,333,081 |
Portions of the definitive proxy statement that Registrant intends to file pursuant to Regulation 14(A) by a date no later than 120 days after December 31, 2008,2010, to be used in connection with the annual meeting of shareholders, are incorporated herein by reference into Part III hereof. If such definitive proxy statement is not filed in the 120-day period, the information called for by Part III will be filed as an amendment to this Form 10-K not later than the end of the 120-day period.
PART I
Item 1. Business.
Unico American Corporation is an insurance holding company that underwrites property and casualty insurance through its insurance company subsidiary; provides property, casualty, and health insurance through its agency subsidiaries; and through its other subsidiaries provides insurance premium financing and membership association services.services through its other subsidiaries. Unico American Corporation is referred to herein as the "Company" or "Unico" and such references include both the corporation and its subsidiaries, all of which are wholly owned.owned, unless otherwise indicated. Unico was incorporated under the laws of Nevada in 1969.
Descriptions of the Company’s operations in the following paragraphs are categorized between the Company’s major segment its- insurance company operation, and all other revenues from insurance operations. The insurance company operation is conducted through Crusader Insurance Company (Crusader), Unico’s property and casualty insurance company. Insurance company revenues and other revenues from insurance operations for the years ended December 31, 2008,2010, December 31, 2007,2009, and December 31, 2006,2008, are as follows:
| | | Year ended December 31 | | | Year ended December 31 | |
| | | 2008 | | | 2007 | | | 2006 | | | 2010 | | | 2009 | | | 2008 | |
| | | Total Revenues | | | Percent of Total Company Revenues | | | Total Revenues | | | Percent of Total Company Revenues | | | Total Revenues | | | Percent of Total Company Revenues | | | Total Revenues | | | Percent of Total Company Revenues | | | Total Revenues | | | Percent of Total Company Revenues | | | Total Revenues | | | Percent of Total Company Revenues | |
| | | | | | | | | | | | | | | | | | | | | | | | | | | | | | | | | | | | | |
| Insurance company revenues | | $ | 40,527,988 | | | | 86.7 | % | | $ | 44,137,213 | | | | 87.6 | % | | $ | 48,942,568 | | | | 89.1 | % | | $ | 32,334,184 | | | | 87.1 | % | | $ | 35,936,552 | | | | 86.3 | % | | $ | 40,527,988 | | | | 86.7 | % |
| | | | | | | | | | | | | | | | | | | | | | | | | | | | | | | | | | | | | | | | | | | | | | | | | |
| Other revenues from insurance operations | | | | | | | | | | | | | | | | | | | | | | | | Other revenues from insurance operations | | | | | | | | | | | | | | | | | | | | | |
| Gross commissions and fees: | | | | | | | | | | | | | | | | | | | | | | | | | | | | | | | | | | | | | | | | | | | | | | | | |
Health insurance program commission income | | 2,754,293 | | | | 5.9 | % | | 2,320,161 | | | | 4.9 | % | | 1,634,438 | | | | 3.0 | % | | | 1,933,288 | | | | 5.2 | % | | | 2,526,772 | | | | 6.1 | % | | | 2,754,293 | | | | 5.9 | % |
| Policy fee income | | 2,239,306 | | | | 4.8 | % | | 2,482,006 | | | | 4.7 | % | | 2,837,810 | | | | 5.2 | % | | | 1,980,928 | | | | 5.3 | % | | | 2,109,681 | | | | 5.1 | % | | | 2,239,306 | | | | 4.8 | % |
Daily automobile rental insurance program: Commission | | 403,943 | | | | 0.9 | % | | 390,659 | | | | 0.8 | % | | 371,317 | | | | 0.7 | % | |
| Claim administration fees | | - | | | | - | | | - | | | | - | | | 4,035 | | | | - | | |
| Daily automobile rental insurance program commission | | | | 364,968 | | | | 1.0 | % | | | 401,829 | | | | 1.0 | % | | | 403,943 | | | | 0.9 | % |
Association operations membership and fee income | | 300,214 | | | | 0.6 | % | | 309,712 | | | | 0.6 | % | | 300,527 | | | | 0.5 | % | | | 212,215 | | | | 0.6 | % | | | 261,980 | | | | 0.6 | % | | | 300,214 | | | | 0.6 | % |
| Other commission and fee income | | | 8,315 | | | | - | | | | 13,095 | | | | - | | | | 38,030 | | | | 0.1 | % | | | 170 | | | | - | | | | 787 | | | | - | | | | 8,315 | | | | - | |
Total gross commission and fee income | | 5,706,071 | | | | 12.2 | % | | 5,515,633 | | | | 11.0 | % | | 5,186,157 | | | | 9.5 | % | | | 4,491,569 | | | | 12.1 | % | | | 5,301,049 | | | | 12.8 | % | | | 5,706,071 | | | | 12.2 | % |
| Investment income | | 61,434 | | | | 0.1 | % | | 152,002 | | | | 0.3 | % | | 100,955 | | | | 0.2 | % | | | 3,432 | | | | - | | | | 1,350 | | | | - | | | | 61,434 | | | | 0.1 | % |
| Finance charges and fees earned | | 460,422 | | | | 1.0 | % | | 553,997 | | | | 1.1 | % | | 678,740 | | | | 1.2 | % | | | 276,737 | | | | 0.8 | % | | | 369,285 | | | | 0.9 | % | | | 460,422 | | | | 1.0 | % |
| Other income | | | 13,529 | | | | - | | | | 14,050 | | | | - | | | | 7,786 | | | | - | | | | 14,829 | | | | - | | | | 8,870 | | | | - | | | | 13,529 | | | | - | |
Total other revenues from insurance operations | | | 6,241,456 | | | | 13.3 | % | | | 6,235,682 | | | | 12.4 | % | | | 5,973,638 | | | | 10.9 | % | | | 4,786,567 | | | | 12.9 | % | | | 5,680,554 | | | | 13.7 | % | | | 6,241,456 | | | | 13.3 | % |
| | | | | | | | | | | | | | | | | | | | | | | | | | | | | | | | | | | | | | | | | | | | | | | | | |
| Total revenues | | $ | 46,769,444 | | | | 100.0 | % | | $ | 50,372,895 | | | | 100.0 | % | | $ | 54,916,206 | | | | 100.0 | % | | $ | 37,120,751 | | | | 100.0 | % | | $ | 41,617,106 | | | | 100.0 | % | | $ | 46,769,444 | | | | 100.0 | % |
INSURANCE COMPANY OPERATION
General
The insurance company operation is conducted through Crusader Insurance Company.Crusader. Crusader is a multiple line property and casualty insurance company that began transacting business on January 1, 1985. Since 2004, all Crusader business washas been written in the state of California. During the year ended December 31, 2008,2010, approximately 98% of Crusader’s business was commercial multiple peril policies. Commercial multiple peril policies provide a combination of property and liability coverage for businesses. Commercial property coverage insures against loss or damage to buildings, inventory and equipment from natural disasters, including hurricanes, windstorms, hail, water, explosions, severe winter weather, and other events such as theft and vandalism, fires, storms, and financial loss due to business interruption resulting from covered property damage. However, Crusader does not write earthquake coverage. Commercial liability coverages insurecoverage insures against third party liability from accidents occurring on the insured’s premises or arising out of its operation. In addition to commercial multiple peril policies, Crusader also writes separate policies to insure commercial property and commercial liability riskrisks on a mono-line basis. AsCrusader is domiciled in California and as of December 31, 2008,2010, Crusader was licensed as an admitted insurance carrier in the states of Arizona, California, Nevada, Oregon, and Washington.
The insurance marketplace continues to be intensely competitive as more insurers are competing for the same customers. Many of Crusader’s competitors price their insurance at rates that the Company believes are inadequate to support anyan underwriting profit. While Crusader attempts to meet such competition with competitive prices, its emphasis is on service, promotion, and distribution. Crusader believes that rate adequacy is more important than premium growth and that underwriting profit (net earned premium less losses and loss adjustment expenses and policy acquisition costs) is its primary goal. Nonetheless, Crusader believes that it can grow its sales and profitability by continuing to focus upon three key areas of its operations: (1) product development, (2) improved service to retail brokers, and (3) appointment of captive and independent retail agents. During 2008,2010, Crusader begancontinued to introduce many product changes such as to its rates, eligibility guidelines, rules and coverage forms. Improved service to retail brokers is primarily focused upon transacting business through the internet, as well as providing more options to make the agents’ and brokers’ time more efficiently spent with usCrusader (i.e., as opposed to spending time with ourCrusader’s competitors). In an effort to increase sales, in October 2008 the Company hired a marketing manager, bringing the total number of employees dedicated exclusively to marketing to three. Those representatives are charged with the responsibility of identifying product development opportunities, with promoting the Company and its products to the insurance brokerage community, and with the duty to appoint retail agents so as to introduce the Crusader brand at the consumer’s level of distribution (i.e., retail). Crusader appointed twelve retail agents asAs of December 31, 2008, and plans to have approximately twenty-four by the end of year 2009.2010, Crusader had appointed 16 retail agents. Presently, it is expected that each such retail agent should be able to reach an annual sales volume of approximately one to two million dollars of Crusader’s products within three to five years of their appointment by Crusader. However, Crusader does not intend to substantially increase its number of retail agents appointed until such time as the Company.Company implements a new policy administration system.
All of Crusader’s business is produced by Unifax Insurance Systems, Inc. (Unifax), its sister corporation. Unifax has substantial experience with these classes of business. The commissions paid by Crusader to Unifax are eliminated as intercompany transactions and are not reflected in the previous table. Crusader is licensed in property and casualty and disability lines of insurance by the California Department of Insurance.
Reinsurance
A reinsurance transaction occurs when an insurance company transfers (cedes) a portion of its exposure on policies written by it to a reinsurer that assumes that risk for a premium (ceded premium). Reinsurance does not legally discharge the Company from primary liability under its policies. If the reinsurer fails to meet its obligations, the Company must nonetheless pay its policy obligations.
Crusader’s primary excess of loss reinsurance agreements since January 1, 1998, are as follows:
| Loss Year(s) | Reinsurer(s) | A.M. Best Rating | Retention | Annual Aggregate Deductible | Reinsurer(s) | A.M. Best Rating | Retention | Annual Aggregate Deductible |
| | | | | | | | | |
| 2005 – 2008 | Platinum Underwriters Reinsurance, Inc. & Hannover Ruckversicherungs AG | A A | $300,000 | $500,000 | |
2005 – 2010 | | Platinum Underwriters Reinsurance, Inc. & Hannover Ruckversicherungs AG | A A | $300,000 | $500,000 |
| | | | | | | | | |
| 2004 | Platinum Underwriters Reinsurance, Inc. & Hannover Ruckversicherungs AG | A A | $250,000 | $500,000 | Platinum Underwriters Reinsurance, Inc. & Hannover Ruckversicherungs AG | A A | $250,000 | $500,000 |
| | | | | | | | | |
| 2003 | Platinum Underwriters Reinsurance, Inc. & Hannover Ruckversicherungs AG & QBE Reinsurance Corporation | A A A | $250,000 | $500,000 | Platinum Underwriters Reinsurance, Inc. & Hannover Ruckversicherungs AG & QBE Reinsurance Corporation | A A A | $250,000 | $500,000 |
| | | | | | | | | |
| 2002 | Partner Reinsurance Company of the U.S. | A+ | $250,000 | $675,000 | Partner Reinsurance Company of the U.S. | A+ | $250,000 | $675,000 |
| | | | | | | | | |
| 2000 - 2001 | Partner Reinsurance Company of the U.S. | A+ | $250,000 | $500,000 | Partner Reinsurance Company of the U.S. | A+ | $250,000 | $500,000 |
| | | | | | | | | |
| 1998 - 1999 | General Reinsurance Corporation | A++ | $250,000 | $750,000 | General Reinsurance Corporation | A++ | $250,000 | $750,000 |
Prior to January 1, 1998, National Reinsurance Corporation (acquired by General Reinsurance Corporation in 1996) charged a provisional rate on exposures up to $500,000 that was subject to adjustment and was based on the amount of losses ceded, limited by a maximum percentage that could be charged. That provisionally rated treaty was cancelled on a runoff basis and replaced by a flat rated treaty on January 1, 1998.
In 2010, 2009 and 2008 Crusader retained a participation in its excess of loss reinsurance treaties of 20% in its 1st1st layer ($700,000 in excess of $300,000), 15% in its 2nd2nd layer ($1,000,000 in excess of $1,000,000), and 0% in its property and casualty clash treaty. In 2007 Crusader retained a participation in its excess of loss reinsurance treaties of 15% in its 1st 1st layer ($700,000 in excess of $300,000), 15% in its 2nd2nd layer ($1,000,000 in excess of $1,000,000), and 15% in its property clash treaty. In 2006 and 2005 Crusader retained a participation in its excess of loss reinsurance treaties of 10% in its 1st1st layer ($700,000 in excess of $300,000), 10% in its 2nd2nd layer ($1,000,000 in excess of $1,000,000), and 30% in its property and casualty clash treaties.treaty. In 2004 Crusader retained a participation in its excess of loss reinsurance treaties of 10% in its 1st1st layer ($750,000 in excess of $250,000), 10% in its 2nd2nd layer ($1,000,000 in excess of $1,000,000), and 30% in its property and casualty clash treaties.treaty. In 2003 Crusader retained a participation in its excess of loss reinsurance treaties of 5% in its 1st1st layer ($750,000 in excess of $250,000), 10% in its 2nd 2nd layer ($1,000,000 in excess of $1,000,000), and 30% in its property and casualty clash treaties.treaty.
The 2008 and 2007 through 2010 excess of loss reinsurance treaties do not provide for a contingent commission. Crusader’s 2006 1st layer primary excess of loss treaty provides for a contingent commission equal to 20% of the net profit, if any, accruing to the reinsurer. The first accounting period for the contingent commission covers the period from January 1, 2006, through December 31, 2006. The 2005 excess of loss reinsurance treaties do not provide for a contingent commission. Crusader’s 2004 and 2003 1st1st layer primary excess of loss treaties provide for a contingent commission to the Company equal to 45% of the net profit, if any, accruing to the reinsurer. The first accounting period for the contingent commission covers the period from January 1, 2003, through December 31, 2004. For each accounting period as described above, the Company will calculate and report to the reinsurers its net profit (excluding incurred but not reported losses), if any, within 90 days after 36 months following the end of the first accounting period, and within 90 days after the end of each 12 month12-month period thereafter until all losses subject to the agreement have been finally settled. Any contingent commission payment received is subject to return based on future development of ceded losses and loss adjustment expenses. In March 2007, the Company received an advance of $1 million from its reinsurer, and in February 2008, the Company received an additional $2,419,940 to be applied against future contingent commission earned, if any. Based on the Company’s ceded losses and loss adjustment expenses (including ceded incurred but not reported losses) asAs of December 31, 2008,2010, the Company recorded $2,500,211has received a total net contingent commission of these$3,668,199 for the years subject to contingent commission. Of this amount, the Company has recognized $2,323,858 of contingent commission income, of which $637,477 was recognized in the year ended December 31, 2010. The remaining balance of the net payments as an advance from its reinsurerreceived of $1,344,341 is currently unearned and it is included in “Accrued Expenses and Other Liabilities” in the consolidated balance sheets. Thus, the Company recognized $919,729 ofThe unearned contingent commission may be subsequently earned or returned to the reinsurer depending on the future development of which $666,174 was recognized in the year ended December 31, 2008, and $253,555 was recognized inceded IBNR for the year ended December 31, 2007.years subject to contingent commission.
Crusader also has catastrophe reinsurance from various highly rated California authorized and unauthorized reinsurance companies. These reinsurance agreements help protect Crusader against liabilities in excess of certain retentions, including major or catastrophic losses that may occur from any one or more of the property and/or casualty risks which Crusader insures. The Company has no reinsurance recoverable balances in dispute.
The Company evaluates each of its ceded reinsurance contracts at theirits inception to determine if there is a sufficient risk transfer to allow the contract to be accounted for as reinsurance under current accounting literature. As of December 31, 2008,2010, all such ceded contracts are accounted for as risk transfer reinsurance.
The aggregate amount of earned premium ceded to the reinsurers was $7,427,236 for the year ended December 31, 2010, $9,276,407 for the year ended December 31, 2009, and $8,771,069 for the year ended December 31, 2008, $11,532,308 for the year ended December 31, 2007, and $13,758,424 for the year ended December 31, 2006.2008.
On most of the premium that Crusader cedes to the reinsurer, the reinsurer pays a commission to Crusader that includes a reimbursement of the cost of acquiring the portion of the premium that is ceded. Crusader does not currently assume any reinsurance. The Company intends to continue obtaining reinsurance although the availability and cost may vary from time to time. The unpaid losses ceded to the reinsurer are recorded as an asset on the balance sheet.
Unpaid Losses and Loss Adjustment Expenses
Crusader maintains reserves for losses and loss adjustment expenses with respect to both reported and unreported losses. When a claim for loss is reported to the Company, a reserve is established for the expected cost to settle the claim, including estimates of any related legal expense and other costs associated with resolving the claim. These reserves are called “case based” reserves. In addition, the Company also sets up reserves at the end of each reporting period for losses that have occurred but have not yet been reported to the Company. These incurred but not reported losses are referred to as “IBNR” reserves.
Crusader establishes reserves for reported losses based on historical experience, upon case-by-case evaluation of facts surrounding each known loss, and the related policy provisions. The amount of reserves for unreported losses is estimated by analysis of historical and statistical information. The ultimate liability of Crusader may be greater or less than estimated reserves. Reserves are monitored and adjusted when appropriate and are reflected in the statement of operations in the period of adjustment. Reserves for losses and loss adjustment expenses are estimated to cover the future amounts needed to pay claims and related expenses with respect to insured events that have occurred.
The process of establishing loss and loss adjustment expense reserves involves significant judgment. The following table shows the development of the unpaid losses and loss adjustment expenses for fiscal years 19982000 through 2008.2010. The top line of the table shows the estimated liability for unpaid losses and loss adjustment expenses, net of reinsurance, recorded at the balance sheet date for each of the indicated years. This liability represents the estimated amount of losses and loss adjustment expenses for losses arising in the current and prior years that are unpaid at the balance sheet date. The table shows the reestimated amount of the previously recorded liability based on experience as of the end of each succeeding year. The estimate is increased or decreased,may change as more information becomes known. The Company believes that its loss and loss adjustment expense reserves are properly stated. When subsequent loss and loss adjustment expense development justifies changes in reserving practices, the Company responds accordingly.
The following table reflects redundancies and deficiencies in Crusader’s net loss and loss adjustment expense reserves. As of December 31, 2008, all periods stated inThe net reserves for the table prior to 2002 reflected a cumulative deficiency. The 2002 through 20072009 periods reflect a cumulative redundancy. The gross reserves also reflect a cumulative redundancy for the 2002 through 2009 periods. See discussion of losses and loss adjustment expenses in Item 7 - “Management’s Discussion and Analysis - Results of Operations - Insurance Company Operation.”
When evaluating the information in the following table, it should be noted that each amount includes the effects of all changes in amounts of prior periods; therefore, the cumulative redundancy or deficiency represents the aggregate change in the estimates over all prior years. Conditions and trends that have affected development of liability in the past may not necessarily occur in the future. Accordingly, it maywould not be appropriate to extrapolate future deficiencies or redundancies based on this table.
| | | CRUSADER INSURANCE COMPANY | |
| | | ANALYSIS OF LOSS AND LOSS ADJUSTMENT EXPENSE DEVELOPMENT | |
| | | Year Ended December 31 | |
| | | 1998 | | | 1999 | | | 2000 | | | 2001 | | | 2002 | | | 2003 | | | 2004 | | | 2005 | | | 2006 | | | 2007 | | | 2008 | |
| | | | | | | | | | | | | | | | | | | | | | | | | | | | | | | | | | |
| Reserve for Unpaid Losses and Loss Adjustment Expenses | | $ | 40,374,232 | | | $ | 37,628,165 | | | $ | 34,546,026 | | | $ | 49,786,215 | | | $ | 53,596,945 | | | $ | 58,883,861 | | | $ | 67,349,989 | | | $ | 76,235,467 | | | $ | 70,076,430 | | | $ | 66,305,287 | | | $ | 58,839,017 | |
| | | | | | | | | | | | | | | | | | | | | | | | | | | | | | | | | | | | | | | | | | | | | |
| Paid Cumulative as of | | | | | | | | | | | | | | | | | | | | | | | | | | | | | | | | | | | | | | | | | | | | |
| 1 Year Later | | | 15,393,167 | | | | 18,745,224 | | | | 20,841,417 | | | | 23,010,615 | | | | 21,326,688 | | | | 18,546,279 | | | | 14,626,446 | | | | 17,257,218 | | | | 18,136,958 | | | | 20,255,356 | | | | | |
| 2 Years Later | | | 28,570,117 | | | | 34,905,359 | | | | 37,976,277 | | | | 39,463,106 | | | | 35,883,729 | | | | 28,289,327 | | | | 26,374,067 | | | | 30,280,022 | | | | 32,708,859 | | | | | | | | | |
| 3 Years Later | | | 38,923,545 | | | | 46,072,688 | | | | 49,053,708 | | | | 46,256,431 | | | | 40,808,763 | | | | 35,508,898 | | | | 34,031,644 | | | | 39,459,338 | | | | | | | | | | | | | |
| 4 Years Later | | | 45,425,709 | | | | 53,153,491 | | | | 52,821,183 | | | | 49,157,040 | | | | 44,116,477 | | | | 39,577,949 | | | | 37,471,168 | | | | | | | | | | | | | | | | | |
| 5 Years Later | | | 50,526,164 | | | | 56,021,297 | | | | 54,919,573 | | | | 51,678,787 | | | | 46,382,760 | | | | 41,417,614 | | | | | | | | | | | | | | | | | | | | | |
| 6 Years Later | | | 52,588,830 | | | | 57,247,843 | | | | 56,715,300 | | | | 53,604,855 | | | | 47,272,911 | | | | | | | | | | | | | | | | | | | | | | | | | |
| 7 Years Later | | | 53,482,116 | | | | 58,801,974 | | | | 58,428,481 | | | | 53,834,453 | | | | | | | | | | | | | | | | | | | | | | | | | | | | | |
| 8 Years Later | | | 54,659,842 | | | | 60,000,165 | | | | 58,528,260 | | | | | | | | | | | | | | | | | | | | | | | | | | | | | | | | | |
| 9 Years Later | | | 55,763,935 | | | | 60,075,050 | | | | | | | | | | | | | | | | | | | | | | | | | | | | | | | | | | | | | |
| 10 Years Later | | | 55,842,233 | | | | | | | | | | | | | | | | | | | | | | | | | | | | | | | | | | | | | | | | | |
| | | | | | | | | | | | | | | | | | | | | | | | | | | | | | | | | | | | | | | | | | | | | |
| Reserves Reestimated as of | | | | | | | | | | | | | | | | | | | | | | | | | | | | | | | | | | | | | | | | | | | | |
| 1 Year Later | | | 39,132,945 | | | | 41,898,796 | | | | 53,872,376 | | | | 57,577,066 | | | | 56,348,531 | | | | 58,048,427 | | | | 63,525,526 | | | | 64,064,784 | | | | 65,958,329 | | | | 62,748,486 | | | | | |
| 2 Years Later | | | 43,164,627 | | | | 56,423,375 | | | | 59,746,880 | | | | 60,629,814 | | | | 57,237,770 | | | | 54,623,000 | | | | 51,981,027 | | | | 60,840,795 | | | | 61,135,905 | | | | | | | | | |
| 3 Years Later | | | 52,349,735 | | | | 59,486,543 | | | | 62,172,320 | | | | 60,974,567 | | | | 55,430,550 | | | | 50,602,947 | | | | 49,959,618 | | | | 57,688,373 | | | | | | | | | | | | | |
| 4 Years Later | | | 54,291,547 | | | | 61,791,428 | | | | 62,369,460 | | | | 59,745,610 | | | | 53,154,847 | | | | 49,959,618 | | | | 47,537,734 | | | | | | | | | | | | | | | | | |
| 5 Years Later | | | 56,619,057 | | | | 62,174,813 | | | | 61,894,587 | | | | 58,289,479 | | | | 53,047,154 | | | | 47,848,145 | | | | | | | | | | | | | | | | | | | | | |
| 6 Years Later | | | 57,151,258 | | | | 61,983,908 | | | | 61,192,597 | | | | 58,677,307 | | | | 51,628,155 | | | | | | | | | | | | | | | | | | | | | | | | | |
| 7 Years Later | | | 56,935,245 | | | | 61,875,465 | | | | 61,975,092 | | | | 57,039,089 | | | | | | | | | | | | | | | | | | | | | | | | | | | | | |
| 8 Years Later | | | 56,906,786 | | | | 62,659,129 | | | | 60,565,031 | | | | | | | | | | | | | | | | | | | | | | | | | | | | | | | | | |
| 9 Years Later | | | 57,572,353 | | | | 61,392,495 | | | | | | | | | | | | | | | | | | | | | | | | | | | | | | | | | | | | | |
| 10 Years Later | | | 56,668,561 | | | | | | | | | | | | | | | | | | | | | | | | | | | | | | | | | | | | | | | | | |
| | | | | | | | | | | | | | | | | | | | | | | | | | | | | | | | | | | | | | | | | | | | | |
| Cumulative Redundancy (Deficiency) | | $ | (16,294,329 | ) | | $ | (23,764,330 | ) | | $ | (26,019,005 | ) | | $ | (7,252,874 | ) | | $ | 1,968,790 | | | $ | 11,035,716 | | | $ | 19,812,255 | | | $ | 18,547,094 | | | $ | 8,940,525 | | | $ | 3,556,801 | | | | | |
| | | | | | | | | | | | | | | | | | | | | | | | | | | | | | | | | | | | | | | | | | | | | |
Gross Liability for Unpaid Losses and Loss Adjustment Expenses | | $ | 41,513,945 | | | $ | 41,592,489 | | | $ | 45,217,369 | | | $ | 60,534,295 | | | $ | 74,905,284 | | | $ | 78,139,090 | | | $ | 87,469,000 | | | $ | 101,914,548 | | | $ | 93,596,117 | | | $ | 94,730,711 | | | $ | 78,654,590 | |
| | | | | | | | | | | | | | | | | | | | | | | | | | | | | | | | | | | | | | | | | | | | | |
Ceded Liability for Unpaid Losses and Loss Adjustment Expenses | | | (1,139,713 | ) | | | (3,964,324 | ) | | | (10,671,343 | ) | | | (10,748,080 | ) | | | (21,308,339 | ) | | | (19,255,229 | ) | | | (20,119,011 | ) | | | (25,679,081 | ) | | | (23,519,687 | ) | | | (28,425,424 | ) | | | (19,815,573 | ) |
| | | | | | | | | | | | | | | | | | | | | | | | | | | | | | | | | | | | | | | | | | | | | |
Net Liability for Unpaid Losses and Loss Adjustment Expenses | | $ | 40,374,232 | | | $ | 37,628,165 | | | $ | 34,546,026 | | | $ | 49,786,215 | | | $ | 53,596,945 | | | $ | 58,883,861 | | | $ | 67,349,989 | | | $ | 76,235,467 | | | $ | 70,076,430 | | | $ | 66,305,287 | | | $ | 58,839,017 | |
| | | | | | | | | | | | | | | | | | | | | | | | | | | | | | | | | | | | | | | | | | | | | |
| Gross Liability Reestimated | | $ | 81,932,784 | | | $ | 89,440,233 | | | $ | 92,269,584 | | | $ | 87,966,882 | | | $ | 74,860,735 | | | $ | 69,189,276 | | | $ | 67,381,960 | | | $ | 78,646,420 | | | $ | 81,030,149 | | | $ | 85,453,563 | | | | | |
| Ceded Liability Reestimated | | | (25,264,223 | ) | | | (28,047,738 | ) | | | (31,704,553 | ) | | | (30,927,793 | ) | | | (23,232,580 | ) | | | (21,341,131 | ) | | | (19,844,226 | ) | | | (20,958,047 | ) | | | (19,894,244 | ) | | (22,705,077 | ) | | | | |
| Net Liability Reestimated | | $ | 56,668,561 | | | $ | 61,392,495 | | | $ | 60,565,031 | | | $ | 57,039,089 | | | $ | 51,628,155 | | | $ | 47,848,145 | | | $ | 47,537,734 | | | $ | 57,688,373 | | | $ | 61,135,905 | | | $ | 62,748,486 | | | | | |
| | | | | | | | | | | | | | | | | | | | | | | | | | | | | | | | | | | | | | | | | | | | | |
| Gross Reserve Redundancy (Deficiency) | | $ | (40,418,839 | ) | | $ | (47,847,744 | ) | | $ | (47,052,215 | ) | | $ | (27,432,587 | ) | | $ | 44,549 | | | $ | 8,949,814 | | | $ | 20,087,040 | | | $ | 23,268,128 | | | $ | 12,565,968 | | | $ | 9,277,148 | | | | | |
| | | CRUSADER INSURANCE COMPANY | |
| | | ANALYSIS OF LOSS AND LOSS ADJUSTMENT EXPENSE DEVELOPMENT | |
| | | Year Ended December 31 | |
| | | 2000 | | | 2001 | | | 2002 | | | 2003 | | | 2004 | | | 2005 | | | 2006 | | | 2007 | | | 2008 | | | 2009 | | | 2010 | |
| | | | | | | | | | | | | | | | | | | | | | | | | | | | | | | | | | |
| Reserve for Unpaid Losses and Loss Adjustment Expenses, Net | | $ | 34,546,026 | | | $ | 49,786,215 | | | $ | 53,596,945 | | | $ | 58,883,861 | | | $ | 67,349,989 | | | $ | 76,235,467 | | | $ | 70,076,430 | | | $ | 66,305,287 | | | $ | 58,839,017 | | | $ | 55,409,545 | | | $ | 49,743,381 | |
| | | | | | | | | | | | | | | | | | | | | | | | | | | | | | | | | | | | | | | | | | | | | |
| Paid Cumulative as of | | | | | | | | | | | | | | | | | | | | | | | | | | | | | | | | | | | | | | | | | | | | |
| 1 Year Later | | | 20,841,417 | | | | 23,010,615 | | | | 21,326,688 | | | | 18,546,279 | | | | 14,626,446 | | | | 17,257,218 | | | | 18,136,958 | | | | 20,255,356 | | | | 17,123,126 | | | | 15,809,062 | | | | | |
| 2 Years Later | | | 37,976,277 | | | | 39,463,106 | | | | 35,883,729 | | | | 28,289,327 | | | | 26,374,067 | | | | 30,280,022 | | | | 32,708,859 | | | | 34,175,791 | | | | 27,981,461 | | | | | | | | | |
| 3 Years Later | | | 49,053,708 | | | | 46,256,431 | | | | 40,808,763 | | | | 35,508,898 | | | | 34,031,644 | | | | 39,459,338 | | | | 40,477,741 | | | | 40,878,873 | | | | | | | | | | | | | |
| 4 Years Later | | | 52,821,183 | | | | 49,157,040 | | | | 44,116,477 | | | | 39,577,949 | | | | 37,471,168 | | | | 44,045,638 | | | | 43,803,412 | | | | | | | | | | | | | | | | | |
| 5 Years Later | | | 54,919,573 | | | | 51,678,787 | | | | 46,382,760 | | | | 41,417,614 | | | | 38,960,467 | | | | 45,490,105 | | | | | | | | | | | | | | | | | | | | | |
| 6 Years Later | | | 56,715,300 | | | | 53,604,855 | | | | 47,272,911 | | | | 42,384,891 | | | | 39,606,633 | | | | | | | | | | | | | | | | | | | | | | | | | |
| 7 Years Later | | | 58,428,481 | | | | 53,834,453 | | | | 47,994,346 | | | | 42,843,453 | | | | | | | | | | | | | | | | | | | | | | | | | | | | | |
| 8 Years Later | | | 58,528,260 | | | | 53,826,582 | | | | 48,289,708 | | | | | | | | | | | | | | | | | | | | | | | | | | | | | | | | | |
| 9 Years Later | | | 58,496,996 | | | | 53,954,614 | | | | | | | | | | | | | | | | | | | | | | | | | | | | | | | | | | | | | |
| 10 Years Later | | | 58,602,303 | | | | | | | | | | | | | | | | | | | | | | | | | | | | | | | | | | | | | | | | | |
| | | | | | | | | | | | | | | | | | | | | | | | | | | | | | | | | | | | | | | | | | | | | |
| Reserves Re-estimated as of | | | | | | | | | | | | | | | | | | | | | | | | | | | | | | | | | | | | | | | | | | | | |
| 1 Year Later | | | 53,872,376 | | | | 57,577,066 | | | | 56,348,531 | | | | 58,048,427 | | | | 63,525,526 | | | | 64,064,784 | | | | 65,958,329 | | | | 62,748,486 | | | | 54,883,464 | | | | 50,841,366 | | | | | |
| 2 Years Later | | | 59,746,880 | | | | 60,629,814 | | | | 57,237,770 | | | | 54,623,000 | | | | 51,981,027 | | | | 60,840,795 | | | | 61,135,905 | | | | 59,520,345 | | | | 51,044,229 | | | | | | | | | |
| 3 Years Later | | | 62,172,320 | | | | 60,974,567 | | | | 55,430,550 | | | | 50,602,947 | | | | 49,959,618 | | | | 57,688,373 | | | | 56,989,424 | | | | 56,548,186 | | | | | | | | | | | | | |
| 4 Years Later | | | 62,369,460 | | | | 59,745,610 | | | | 53,154,847 | | | | 49,959,618 | | | | 47,537,734 | | | | 55,381,880 | | | | 54,055,748 | | | | | | | | | | | | | | | | | |
| 5 Years Later | | | 61,894,587 | | | | 58,289,479 | | | | 53,047,154 | | | | 47,848,145 | | | | 46,539,900 | | | | 52,540,959 | | | | | | | | | | | | | | | | | | | | | |
| 6 Years Later | | | 61,192,597 | | | | 58,677,307 | | | | 51,628,155 | | | | 47,335,768 | | | | 44,229,362 | | | | | | | | | | | | | | | | | | | | | | | | | |
| 7 Years Later | | | 61,975,092 | | | | 57,039,089 | | | | 51,380,177 | | | | 45,793,998 | | | | | | | | | | | | | | | | | | | | | | | | | | | | | |
| 8 Years Later | | | 60,565,031 | | | | 56,156,091 | | | | 50,249,934 | | | | | | | | | | | | | | | | | | | | | | | | | | | | | | | | | |
| 9 Years Later | | | 59,879,760 | | | | 54,899,151 | | | | | | | | | | | | | | | | | | | | | | | | | | | | | | | | | | | | | |
| 10 Years Later | | | 59,041,794 | | | | | | | | | | | | | | | | | | | | | | | | | | | | | | | | | | | | | | | | | |
| | | | | | | | | | | | | | | | | | | | | | | | | | | | | | | | | | | | | | | | | | | | | |
| Cumulative Redundancy (Deficiency) | | $ | (24,495,768 | ) | | $ | (5,112,936 | ) | | $ | 3,347,011 | | | $ | 13,089,863 | | | $ | 23,120,627 | | | $ | 23,694,508 | | | $ | 16,020,682 | | | $ | 9,757,101 | | | $ | 7,794,788 | | | $ | 4,568,179 | | | | | |
| | | | | | | | | | | | | | | | | | | | | | | | | | | | | | | | | | | | | | | | | | | | | |
Gross Liability for Unpaid Losses and Loss Adjustment Expenses | | $ | 45,217,369 | | | $ | 60,534,295 | | | $ | 74,905,284 | | | $ | 78,139,090 | | | $ | 87,469,000 | | | $ | 101,914,548 | | | $ | 93,596,117 | | | $ | 94,730,711 | | | $ | 78,654,590 | | | $ | 71,585,408 | | | $ | 61,559,695 | |
| | | | | | | | | | | | | | | | | | | | | | | | | | | | | | | | | | | | | | | | | | | | | |
Ceded Liability for Unpaid Losses and Loss Adjustment Expenses | | | (10,671,343 | ) | | | (10,748,080 | ) | | | (21,308,339 | ) | | | (19,255,229 | ) | | | (20,119,011 | ) | | | (25,679,081 | ) | | | (23,519,687 | ) | | | (28,425,424 | ) | | | (19,815,573 | ) | | | (16,175,863 | ) | | | (11,816,314 | ) |
| | | | | | | | | | | | | | | | | | | | | | | | | | | | | | | | | | | | | | | | | | | | | |
Net Liability for Unpaid Losses and Loss Adjustment Expenses | | $ | 34,546,026 | | | $ | 49,786,215 | | | $ | 53,596,945 | | | $ | 58,883,861 | | | $ | 67,349,989 | | | $ | 76,235,467 | | | $ | 70,076,430 | | | $ | 66,305,287 | | | $ | 58,839,017 | | | $ | 55,409,545 | | | $ | 49,743,381 | |
| | | | | | | | | | | | | | | | | | | | | | | | | | | | | | | | | | | | | | | | | | | | | |
Gross Liability Re-estimated | | $ | 89,960,037 | | | $ | 84,409,959 | | | $ | 71,364,408 | | | $ | 63,838,358 | | | $ | 59,786,043 | | | $ | 71,022,923 | | | $ | 69,333,892 | | | $ | 73,483,604 | | | $ | 64,508,139 | | | $ | 62,400,744 | | | | | |
Ceded Liability Re-estimated | | | (30,918,243 | ) | | | (29,510,808 | ) | | | (21,114,474 | ) | | | (18,044,360 | ) | | | (15,556,681 | ) | | | (18,481,964 | ) | | | (15,278,144 | ) | | | (16,935,418 | ) | | | (13,463,910 | ) | | | (11,559,378 | ) | | | | |
| Net Liability Re-estimated | | $ | 59,041,794 | | | $ | 54,899,151 | | | $ | 50,249,934 | | | $ | 45,793,998 | | | $ | 44,229,362 | | | $ | 52,540,959 | | | $ | 54,055,748 | | | $ | 56,548,186 | | | $ | 51,044,229 | | | $ | 50,841,366 | | | | | |
| | | | | | | | | | | | | | | | | | | | | | | | | | | | | | | | | | | | | | | | | | | | | |
Gross Reserve Redundancy (Deficiency) | | $ | (44,742,668 | ) | | $ | (23,875,664 | ) | | $ | 3,540,876 | | | $ | 14,300,732 | | | $ | 27,682,957 | | | $ | 30,891,625 | | | $ | 24,262,225 | | | $ | 21,247,107 | | | $ | 14,146,451 | | | $ | 9,184,664 | | | | | |
Net Premium Written to Policyholders' Surplus Ratio
The following table shows, for the periods indicated, Crusader's statutory ratios of net premiumspremium written to statutory policyholders' surplus. Since each property and casualty insurance company has different capital needs, an "acceptable" ratio of net premium written to policyholders' surplus for one company may be inapplicable to another. While there is no statutory requirement applicable to Crusader that establishes a permissible net premium to surplus ratio, guidelines established by the National Association of Insurance Commissioners (NAIC) provide that such ratio should generally be no greater than 3 to 1.
| | | Twelve months ended December 31 | | | Twelve months ended December 31 | |
| Statutory: | | 2008 | | | 2007 | | | 2006 | | | 2005 | | | 2004 | | | 2010 | | | 2009 | | | 2008 | | | 2007 | | | 2006 | |
| | | | | | | | | | | | | | | | | | | | | | | | | | | | | | | |
| Net premiums written | | $ | 31,175,204 | | | $ | 33,412,745 | | | $ | 38,166,864 | | | $ | 46,030,707 | | | $ | 51,089,573 | | |
Net premium written | | | $ | 25,270,320 | | | $ | 29,635,898 | | | $ | 31,175,204 | | | $ | 33,412,745 | | | $ | 38,166,864 | |
| Policyholders’ surplus | | $ | 64,736,230 | | | $ | 57,862,334 | | | $ | 50,023,768 | | | $ | 36,586,441 | | | $ | 29,436,343 | | | $ | 62,520,958 | | | $ | 62,553,813 | | | $ | 64,736,230 | | | $ | 57,862,334 | | | $ | 50,023,768 | |
| Ratio | | 0.5 to 1 | | | 0.6 to 1 | | | 0.8 to 1 | | | 1.3 to 1 | | | 1.7 to 1 | | | 0.4 to 1 | | | 0.5 to 1 | | | 0.5 to 1 | | | 0.6 to 1 | | | 0.8 to 1 | |
Crusader’s results herein are reported in accordance with U.S. generally accepted accounting principles (GAAP). These results differ from its financial results reported in accordance with Statutory Accounting Principles (SAP) as prescribed or permitted by insurance regulatory authorities. Crusader is required to file financial statements with insurance regulatory authorities prepared on a SAP basis.
SAP differs in certain respects from GAAP. The more significant of these differences that apply to Crusader are:
| | · | Under GAAP, policy acquisition costs such as commissions, premium taxes and other variable costs incurred in connection with writing new and renewal business are capitalized and amortized on a pro rata basis over the period in which the related premiums are earned, rather than expensed as incurred as required by SAP. |
| | · | Certain assets included in balance sheets under GAAP are designated as “non-admitted assets” and are charged directly against statutory surplus under SAP. Non-admitted assets include primarily premium receivables that are outstanding over 90 days, federal deferred tax assets in excess of statutory limitations, furniture, equipment, leasehold improvements, and prepaid expenses. |
| | · | Under GAAP, amounts related to ceded reinsurance are shown gross as prepaid reinsurance premiums and reinsurance recoverable, rather than netted against unearned premium reserves and loss and loss adjustment expense reserves, respectively, as required by SAP. |
| | · | Under GAAP, fixed maturity securities that are classified as available-for-sale are reported at estimated fair values, rather than at amortized cost or the lower of amortized cost or market, depending on the specific type of security as required by SAP. |
| | · | The differing treatment of income and expense items results in a corresponding difference in federal income tax expense. Under GAAP reporting, changes in deferred income taxes are reflected as an item of income tax benefit or expense. As required by SAP, federal income taxes are recorded as income tax benefit or expense when payable and deferred taxes, subject to limitations, are recognized but only to the extent that they do not exceed 10%a specified percentage of statutory surplus. Changes in deferred taxes are recorded directly to statutory surplus. |
Regulation
The insurance company operation is subject to regulation by the California Department of Insurance (the insurance department) and by the department of insurance of other states in which Crusader is licensed. The insurance department has broad regulatory, supervisory, and administrative powers. These powers relate primarily to the standards of solvency which must be met and maintained; the licensing of insurers and their agents; the nature and limitation of insurers' investments; the prior approval of rates, rules and forms; the issuance of securities by insurers; periodic financial and market conduct examinations of the affairs of insurers; the annual and other reports required to be filed on the financial condition and results of operations of such insurers or for other purposes; and the establishment of reserves required to be maintained for unearned premiums, losses, and other purposes. The regulations and supervision by the insurance department are designed principally for the benefit of policyholders and not for the insurance company shareholders. The insurance department’s Market Conduct Division is responsible for conducting periodic examinations of companies to ensure compliance with California Insurance Code and California Code of Regulations with respect to rating, underwriting and claims handling practices. The most recent Market Conduct Examination of Crusader covered rating and underwriting practices in California during the period from December 15, 2005, through April 10, 2006. No significant issues were reported as a result of that examination. The insurance department also conducts periodic financial examinations of Crusader. TheDuring 2009, the insurance department completed a financial examination of Crusader’s December 31, 2004,2005, through December 31, 2008, statutory financial statements. A final report on the examination was issued by the insurance department on October 22, 2009. No significant issues were reported as a result of that examination.
In December 1993, the NAIC adopted a Risk-Based Capital (RBC) Model Law for property and casualty companies. The RBC Model Law is intended to provide standards for calculating a variable regulatory capital requirement related to a company's current operations and its risk exposures (asset risk, underwriting risk, credit risk and off-balance sheet risk). These standards are intended to serve as a diagnostic solvency tool for regulators that establishes uniform capital levels and specific authority levels for regulatory intervention when an insurer falls below minimum capital levels. The RBC Model Law specifies four distinct action levels at which a regulator can intervene with increasing degrees of authority over a domestic insurer if its RBC is equal to or less than 200% of its computed authorized control level RBC. A company's RBC is required to be disclosed in its statutory annual statement. The RBC is not intended to be used as a rating or ranking tool nor is it to be used in premium rate making or approval. Crusader’s adjusted capital at December 31, 2008,2010, was 849%875% of authorized control level risk-based capital.
The following table sets forth the different levels of risk-based capital that may trigger regulatory involvement and the corresponding actions that may result.
| LEVEL | TRIGGER | | CORRECTIVE ACTION |
| | | | |
| Company Action Level | Adjusted Capital less than 200% of Authorized Control Level | | The insurer must submit a comprehensive plan to the insurance commissionercommissioner. |
| | | | |
| Regulatory Action Level | Adjusted Capital less than 150% of Authorized Control Level | | In addition to above, insurer is subject to examination, analysis, and specific corrective action. |
| | | | |
| Authorized Control Level | Adjusted Capital less than 100% of Authorized Control Level | | In addition to both of the above, insurance commissioner may place insurer under regulatory control. |
| | | | |
| Mandatory Control Level | Adjusted Capital less than 70% of Authorized Control Level | | Insurer must be placed under regulatory control. |
Insurance Regulatory Information System (IRIS) was developed by a committee of state insurance regulators primarily to assist state insurance departments in executing their statutory mandate to oversee the financial condition of insurance companies. IRIS helps those companies that merit highest priority in the allocation of the regulators’ resources on the basis of 13 financial ratios that are calculated annually. The analytical phase is a review of annual statements and the financial ratios. The ratios and trends are valuable in pointing to companies likely to experience financial difficulties but are not themselves indicative of adverse financial condition. The ratio and benchmark comparisons are mechanically produced and are not intended to replace the state insurance departments’ own in-depth financial analysis or on-site examinations.
An unusual range of ratio results has been established from studies of the ratios of companies that have become insolvent or have experienced financial difficulties. In the analytical phase, companies that receive four or more financial ratio values outside the usual range are analyzed in order to identify those companies that appear to require immediate regulatory action. Subsequently, a more comprehensive review of the ratio results and an insurer’s annual statement is performed to confirm that an insurer’s situation calls for increased or close regulatory attention. In 2008,2010, the Company was not outside the usual values on anyvalue of one of the thirteen13 IRIS ratio tests. IRIS ratio test No. 6 considers the Company’s 2010 investment yield. An unusual value for that ratio is equal to or over 6.5% or equal to or less than 3%. Crusader’s 2010 investment yield was 2.7%.
California Insurance Guarantee Association
The California Insurance Guarantee Association (CIGA) was created to provide for payment of claims for which insolvent insurers of most casualty lines are liable but which cannot be paid out of such insurers’ assets. The Company is subject to assessment by CIGA for its pro-rata share of such claims based on premiums written in the particular line in the year preceding the assessment by insurers writing that line of insurance in California. Such assessments are based upon estimates of losses to be incurred in liquidating an insolvent insurer. Under the current California Insurance Code, in a particular year, the Company cannot be assessed an amount greater than 2% of its premiums written in the preceding year. Assessments are recouped through a mandated surcharge to policyholders the year after the assessment. No assessment was made by CIGA for the 2008, 2007,2010, 2009, or the 20062008 calendar years.
Holding Company Act
Crusader is subject to regulation by the insurance department pursuant to the provisions of the California Insurance Holding Company System Regulatory Act (the "Holding Company Act"). Pursuant to the Holding Company Act, the insurance department may examine the affairs of Crusader at any time. Certain transactions defined to be of an "extraordinary" type may not be effected without the prior approval of the insurance department. Such transactions include, but are not limited to, sales, purchases, exchanges, loans and extensions of credit, and investments made within the immediately preceding 12 months involving the lesser of 3% of admitted assets or 25% of policyholders’ surplus as of the preceding December 31. An extraordinary transaction also includes a dividend which, together with other dividends or distributions made within the preceding twelve12 months, exceeds the greater of 10% of the insurance company's policyholders' surplus as of the preceding December 31 or the insurance company's net income for the preceding calendar year. An insurance company is also required to notify the insurance department of any dividend after declaration, but prior to payment.
The Holding Company Act also provides that the acquisition or change of “control” of a California domiciled insurance company or of any person who controls such an insurance company cannot be consummated without the prior approval of the Insurance Commissioner.insurance commissioner. In general, a presumption of “control” arises from the ownership of voting securities and securities that are convertible into voting securities, which in the aggregate constitute 10% or more of the voting securities of a California insurance company or a person who controls a California insurance company, such as Crusader. A person seeking to acquire “control,” directly or indirectly, of the Company must generally file with the Insurance Commissionerinsurance commissioner an application for change of control containing certain information required by statute and published regulations and provide a copy of the application to the Company. The Holding Company Act also effectively restricts the Company from consummating certain reorganizationreorganizations or mergers without prior regulatory approval. The Company is in compliance with the Holding Company Act.
Rating
Insurance companies are rated to provide both industry participants and insurance consumers with meaningful information on specific insurance companies. Higher ratings generally indicate financial stability and a strong ability to pay claims. These ratings are based upon factors relevant to policyholders and are not directed toward protection of investors. Such ratings are neither a rating of securities nor a recommendation to buy, hold or sell any security and may be revised or withdrawn at any time. Ratings focus primarily on the following factors: capital resources, financial strength, demonstrated management expertise in the insurance business, credit analysis, systems development, market segment position and growth opportunities, marketing, sales conduct practices, investment operations, minimum policyholders’ surplus requirements and capital sufficiency to meet projected growth, as well as access to such traditional capital as may be necessary to continue to meet standards for capital adequacy.
The claims-paying abilities of insurers are rated to provide both insurance consumers and industry participants with comparative information on specific insurance companies. Claims-paying ratings are important for the marketing of certain insurance products. A higher rating generally indicates greater financial strength and a stronger ability to pay claims.
Effective January 27, 2009,In December of 2010, A.M. Best Company has upgradedreaffirmed Crusader’s financial strength rating toof A- (Excellent) from B++ (Good) and revised Crusader’sa rating outlook to stable from positive.of “stable.” In addition, Crusader’s Crusader was assigned an Issuer Credit Rating was upgraded toof a- (Excellent) from bbb+ (Good).
Terrorism Risk Insurance Act of 2002
On November 26, 2002, the Terrorism Risk Insurance Act of 2002 (The Act) was signed by President Bush. On December 22, 2005, the United States’ government extended The Act, which was set to expire on December 31, 2005, for two more years. On December 26, 2007, the United States government extended The Act again through December 31, 2014. The Act establishes a program within the Department of the Treasury in which the Federal Governmentfederal government will share the risk of loss from acts of terrorism with the insurance industry. Federal participation will be triggered when the Secretary of the Treasury, in concurrence with the Secretary of State and the Attorney General of the United States, certifies an act to be an act of terrorism. No act shall be certified as an act of terrorism unless the terrorist act results in aggregate losses in excess of $5 million.
Under The Act, the federal government will pay 85% of covered terrorism losses exceeding the statutorily established deductible. All property and casualty insurance companies are required to participate in the program to the extent that they must make available property and casualty insurance coverage for terrorism that does not differ materially from the terms, amounts, and other coverage limitations applicable to losses arising from events other than acts of terrorism.
The Company does not write policies on properties considered a target of terrorist activities such as airports, large hotels, large office structures, amusement parks, landmark defined structures, or other large scale public facilities. In addition, there is not a high concentration of policies in any one area where increased exposure to terrorist threats exist. Consequently, the Company believes its exposure relating to acts of terrorism is low. In 2008,2010, Crusader received $155,631$104,735 in terrorism coverage premium from approximately 9%6% of its policyholders. Crusader’s 20082010 terrorism deductible was $9,732,395.$8,010,176. Crusader’s 20092011 terrorism deductible is $8,544,153.$7,115,887.
OTHER INSURANCE OPERATIONS
General Agency Operations
Unifax primarily sells and services commercial multiple peril business insurance policies for Crusader in California.
Bedford Insurance Services, Inc. (Bedford), (Bedford) sells and services daily automobile rental policies in most states for a non-affiliated insurer.
As general agents, these subsidiaries market, rate, underwrite, inspect and issue policies, bill and collect insurance premiums, and maintain accounting and statistical data. Unifax is the exclusive general agent for Crusader. Unifax and Bedford areis a non-exclusive general agentsagent for non-affiliated insurance companies. The Company's marketing is conducted through advertising to independent insurance agents and brokers. For its services, the general agent receives a commission (based on the premium written) from the insurance company and, in some cases, a policy fee from the customer. These subsidiaries all hold licenses issued by the California Department of Insurance and other states where applicable.
Insurance Premium Finance Operation
The Company’s subsidiary, American Acceptance Corporation (AAC), is a licensed insurance premium finance company that provides insurance purchasers with the ability to pay their insurance premiums on an installment basis. The premium finance company pays the insurance premium to the insurance company in return for a premium finance note from the insured. These notes are paid off by the insured in nine monthly installments and are secured by the unearned premiums held by the insurance company. AAC provides premium financing solely for Crusader policies that are produced by Unifax in California.
Association Operation
The Company's subsidiary, Insurance Club, Inc., dba AAQHC, An Administrator (AAQHC) (formally American Association of Quality Health Care), is a membership association and a third party administrator. AAQHC provides various consumer benefits to its members, including participation in group medical and dental insurance policies that it negotiates. AAQHC also provides services as a third party administrator and is licensed by the California Department of Insurance. For these services, AAQHC receives membership and fee income from its members.
Health Insurance OperationsOperation
The Company's subsidiary, American Insurance Brokers, Inc. (AIB), markets health insurance in California through non-affiliated insurance companies for individuals and groups. The services provided consist of marketing, billing and collection, accounting, and customer service. For these services AIB receives commissions from insurance companies. Most of the business is produced through independent insurance agents and brokers. AIB holds licenses issued by the California Department of Insurance.
INVESTMENTS
The investments of the Company are made by the Company’s Chief Financial Officer under the supervision of an investment committee appointed by the Company’s Board of Directors. The Company’s investment guidelines on equity securities limit investments in equity securities to aan aggregate maximum of $2,000,000 in aggregate.$2,000,000. The Company’s investment guidelines on fixed maturities limit those investments to high-grade obligations with a maximum term of eight years. The maximum investment authorized in any one issuer is $2,000,000 and the maximum in any one U.S. government agency or U.S. government sponsored enterprise is $3,000,000.$2,000,000. This dollar limitation excludes bond premiums paid in excess of par value and U.S. government or U.S. government guaranteed issues. Investments in municipal securities are primarily pre-refunded and secured by U.S. treasury securities. The short-term investments are either U.S. government obligations, FDIC insured, or are in an institution with a Moody's rating of P2 and/or a Standard & Poor's rating of A1. All of the Company's fixed maturity investment securities are rated, and readily marketable, and could be liquidated without any materialmaterially adverse financial impact.
COMPETITION
General
The property and casualty insurance industry is highly competitive in the areas of price, coverage, and service. It is highly cyclical, characterized by periods of high premium rates and shortages of underwriting capacity followed by periods of severe price competition and excess capacity.
The profitability of insurers is affected by many factors including rate and coverage competition, the frequency of claims and their average cost, natural disasters, state regulations, interest rates, crime rates, general business conditions, and court decisions redefining and expanding the extent of coverage and granting higher compensation awards. One of the challenging and unique features of the property and casualty business is the fact that since premiums are collected before losses are paid, its products are normally priced before its costs are known.
Insurance Company and General Agency Operations (Property and Casualty)
The Company's property and casualty insurance business continues to experience a competitive marketplace. There are many substantial competitors who have larger resources, operate in more states, and insure coverages in more lines and in higher limits than the Company. In addition, Crusader competes not only with other insurance companies but also with other general agencies. Many of those general agencies offer more products than the Company. The principal method of competition among competitors is based on price. While the Company attempts to meet such competition with competitive prices, its emphasis is on service, promotion, and distribution. Additional information regarding competition in the insurance marketplace is discussed in the Item 7 -“Management’s- “Management’s Discussion and Analysis of Financial Condition and Results of Operations - Results of Operations.”
Insurance Premium Financing Operation
The insurance premium financing operation currently finances policies written only through its sister company, Unifax. Consequently, AAC’s growth is primarily dependent on the growth of Crusader and Unifax business. In addition,Effective July 20, 2010, AAC reduced the competitive pricing,interest rate charged on premiums financed to 0% in an effort to increase the qualitysales of its service,existing renewal and new business written by Unifax for Crusader. Due to the easelow interest rate environment, the cost of money to provide this incentive is not material. The Company monitors the cost of providing this incentive, and convenience ofdepending on the cost/benefit determination, the Company can continue to offer 0% financing with AAC have made its profitability possible.or withdraw it at any time.
Health Insurance OperationsOperation
CompetitionThere have been significant changes in the Company’s health insurance business is intense.operation in 2010. In 2008 and 20072010, approximately 82% and 80%61% of the Company’s health insurance businessincome was derived from the CIGNA HealthCare (CIGNA) medical and dental plan programs, respectively. CIGNA’s plans consist of small group medicalprograms. This represents a decline from 76% in 2009 and dental policies and individual dental policies.82% in 2008. In May 2006, CIGNA HealthCare began offering new small group medical insurance policies in the state of California. Currently, all new CIGNA small group medical insurance policies are written through AIB and all CIGNA small group medical insurance policyholders are members of AAQHC. In November 2008, AIB entered into a General Agent Contract with Blue Shield of California who will pay AIB override commissions for all business submitted to them. In JuneSeptember 2009, CIGNA plans to substantially reducereduced the medical plans offered to Small Group Employerssmall group employers in the state of California from sixteen current19 plans down to four. All new employer groups4 plans. Primarily as a result of CIGNA’s decision to reduce the number of plans offered, AIB decided to terminate its marketing and existing employer groups, on their anniversary date, will have the option to choose from the four available plans.administrative agreement with CIGNA effective August 31, 2010. On September 1, 2010, AIB will be assisting itsstopped marketing all CIGNA policyholders in obtaining new coverage in oneproducts. AAQHC, An Administrator, ceased administration of the four CIGNA dental plans or with other contracted carriers. This reduction ineffective November 1, 2010, and CIGNA medical plans offered to Small Group Employers ineffective December 1, 2010. The termination of the state of California may resultmarketing and administrative agreement with CIGNA has resulted in a decrease in AIB commission income and AAQHC fee income. AIB is assisting the AAQHC will continuemembers in obtaining medical and dental coverage with other contracted carriers. These carriers are paying AIB commissions for these members. AIB has developed a new partnership with Guardian Life Insurance Company of America (GLIC). Effective October 1, 2010, AIB has been marketing GLIC’s dental and group life products to underwriteboth brokers and administer all remaining CIGNA business, including dentalthe public. GLIC has created plans specifically for Individuals and Small Group Employers.
AIB.
EMPLOYEES
OnEMPLOYEES
As of March 6, 2009,25, 2011, the Company employed 10587 persons at its facility located in Woodland Hills, California. The Company has no collective bargaining agreements and believes its relations with its employees are excellent.
Item 1A. Risk Factors.
The Company is subject to numerous risks and uncertainties, the outcome of which may impact future results of operations and financial condition. These risks are as follows:
Changes andin general economic conditions may have an adverse effect on the Company’s revenues and profitability.profitability.
The Company’s revenues and profitability may be impacted by national and local economic conditions, particularly in the state of California. Unfavorable changes in economic conditions such as recessions, increased levels of unemployment and inflation may reduce the Company’s revenue through policy cancellations, modifications or non-renewals. The recent turmoil in the economy and the disruption in the financial markets may impair the ability of customers to pay premiums as they become due, reduce the amount of coverage that customers may seek and may limit the amount of premiums the Company may charge for insurance. The Company is not able to predict the duration and severity of the current disruption in the financial markets and adverse economic conditions, both nationally and in the state of California.
Loss and loss adjustment expense reserves are based on estimates and may not be sufficient to cover future losses.
Loss and loss adjustment expense reserves represent an estimate of amounts needed to pay and administer claims with respect to insured events that have occurred, including events that have incurred whichoccurred but have not yet been reported to the Company. There is a high level of uncertainty inherent in the evaluation of the required losses and loss adjustment expense reserves for the Company. The long-tailed nature of liability claims and the volatility of jury awards exacerbate that uncertainty. The Company sets loss and loss adjustment expense reserves at each balance sheet date atbased upon management’s best estimate of the ultimate payments that it anticipates will be made to settle all losses incurred and related loss adjustment expenses incurred as of that date for both reported and unreported losses. The ultimate cost of claims is dependent upon future events, the outcomes of which are affected by many factors. Company claim reserving procedures and settlement philosophy, current and perceived social and economic inflation, current and future court rulings and jury attitudes, improvements in medical technology, and many other economic, scientific, legal, political, and social factors all can have significant effects on the ultimate costs of claims. Changes in Company operations and management philosophy also may cause actual developments to vary from the past. Since the emergence and disposition of claims are subject to uncertainties, the net amounts that will ultimately be paid to settle claims may vary significantly from the estimated amounts provided for in the accompanying consolidated financial statements. Any adjustments to reserves are reflected in the operating results of the periods in which they are made.
The Company’s success depends on its ability to accurately underwrite risks and to charge adequate premiums to policyholders.
The Company’s financial condition, liquidity and results of operations largely depend in large part on the Company’s ability to underwrite and set premiums accurately for the risks it faces. Premium rate adequacy is necessary to generate sufficient premium to offset losses, loss adjustment expenses, underwriting expenses, and to earn a profit. In order to price its products accurately, the Company must collect and properly analyze a substantial volume of data; develop, test and apply appropriate rating formulas; closely monitor and timely recognize changes in trends; and project both severity and frequency of losses with reasonable accuracy. The Company’s ability to undertake these efforts successfully is subject to a number of risks and uncertainties, including, without limitation:
| | • | | Availability of sufficient reliable data. |
| | • | | Incorrect or incomplete analysis of available data. |
| | • | | Uncertainties inherent in estimates and assumptions. |
| | • | | Selection and application of appropriate rating formulae or other pricing methodologies. |
| | • | | Adoption of successful pricing strategies. |
| | • | | Prediction of policyholder retention (e.g., policy life expectancy). |
| | • | | Unanticipated court decisions, legislation or regulatory action. |
| | • | | Ongoing changes in the Company’s claim settlement practices. |
| | • | | Unexpected inflation. |
| | • | | Social changes, particularly those affecting litigiouslitigation inclinations. |
Such risks may result in the Company’s pricing being based on outdated, inadequate, or inaccurate data, or inappropriate analyses, assumptions, or methodologies, and may cause the Company to estimate incorrectly future changes in the frequency or severity of claims. As a result, the Company could under price risks, which would negatively affect the Company’s margins, or it could overprice risks, which could reduce the Company’s volume and competitiveness. In either event, the Company’s operating results, financial condition, and cash flow could be materially adversely affected.
Inability to obtain reinsurance or to collect on ceded reinsurancelosses and loss adjustment expenses could adversely affect the Company’s ability to write new policies.
The availability, amount and cost of reinsurance depend on market conditions and may vary significantly. Any decrease in the amount of the Company’s reinsurance will increase the risk of loss and could materially adversely affect its business and financial condition.�� Ceded reinsurance does not discharge the Company’s direct obligations under the policies it writes. The Company remains liable to its policyholders even if the Company is unable to make recoveries that it believes it’sit is entitled to under the reinsurance contracts. Losses may not be recovered from the reinsurers until claims are paid.
The insurance business is subject to extensive regulation and legislative changes, which may impact the manner in which the company operates its business.
The insurance business is subject to extensive regulation by the California Department of Insurance. The California Department of Insurance has broad regulatory powers implemented to protect policyholders, not stockholders or other investors. These powers include, among other things, the ability to:
| | • | | Place limitations on the Company’s investments and dividends. |
| | • | | Place limitations on the Company’s ability to transact business with its affiliates. |
| | • | | Establish standards of solvency including minimum reserves and capital surplus requirements. |
| | • | | Prescribe the form and content of, and to examine, the Company’s financial statements. |
Federal legislation currently does not directly impact the property and casualty business, but the business can be indirectly affected by changes in federal regulations. In addition, the U.S. Congress and other federal agencies from time to time consider whether federal regulation of U. S. insurers is necessary. The Company is unable to predict whether such laws will be enacted and how and to what extent this could affect our business.the Company.
This extensive regulation may affect the cost or demand for the Company’s products and may limit the ability to obtain rate increases or to take other actions that the Company might desire to do in order to increase its profitability.
A downgrade in the financial strength rating of the insurance company could reduce the amount of business it may be able to write.
Rating agencies rate insurance companies based on financial strength as an indication of an ability to pay claims. Effective January 27, 2009, A.M. Best Company has upgraded Crusader’s financial strength rating to A- (Excellent) from B++ (Good) and revised Crusader’s rating outlook to stable from positive. In addition, Crusader’s Issuer Credit Rating was upgraded to a- (Excellent) from bbb+ (Good). The financial strength rating of A.M. Best is subject to periodic review using, among other things, proprietary capital adequacy models, and is subject to revision or withdrawal at any time. Insurance financial strength ratings are directed toward the concerns of policyholders and insurance agents, and are not intended for the protection of investors. Any downgrade in the Company’s A.M. Best rating could cause a reduction in the number of policies it writes and could have a material adverse effect on the Company’s results of operations and financial position.
In December of 2010, A.M. Best Company reaffirmed Crusader’s financial strength rating of A- (Excellent) and a rating outlook of “stable.” In addition, Crusader was assigned an Issuer Credit Rating of a- (Excellent).
Intense competition could adversely affect the ability to sell policies at premium rates the Company deems adequate.
The Company faces significant competition which, at times, is intense. If the Company is unable to compete effectively, its business and financial condition could be materially adversely affected. Competition in the property and casualty marketplace is based on many factors including premiums charged, services provided, financial strength ratings assigned by independent rating agencies, speed of claims payments, reputation, perceived financial strength, and general experience. The Company competes with regional and national insurance companies. Some competitors have greater financial, marketing, and management resources than the Company. Intense competitive pressure on prices can result from the actions of even a single large competitor. The Company uses its own proprietary premium rates to determine the price it charges for its property and casualty policies.
The Company’s earnings may be affected by changes in interest rates.
Investment income is an important component of the Company’s revenues and net income. The ability to achieve investment objectives is affected by factors that are beyond the Company’s control. Interest rates are highly sensitive to many factors, including governmental monetary policies and domestic and international economic and political conditions. Any significant decline in investment income as a result of falling interest rates or general market conditions would have an adverse effect on net income and, as a result, on the Company’s stockholders' equity and policyholders' surplus.
The outlook offor the Company’s investment income is dependent on the future direction of interest rates and the amount of cash flows from operations that are available for investment. The fair values of fixed maturity investments that are "available-for-sale" fluctuate with changes in interest rates and cause fluctuations in the stockholders' equity.
The Company’s geographic concentration ties its performance to the business, economic, and regulatory conditions in California.
The Company relies on independent insurance agents and brokers.
The failure or inability of independent insurance agents and brokers to market the Company’s insurance programs successfully could have a material adverse effect on its business, financial condition and results of operations. Independent brokers are not obligated to promote the Company’s insurance programs and may sell competitors' insurance programs. The Company’s business largely depends on the marketing efforts of independent brokers and on the Company’s ability to offer insurance programs and services that meet the requirements of those brokers’ customers.
The Company’s reserve for doubtful accounts is based on estimates.
The Company may not be able to collect the premiums it estimates is collectible from its agents and brokers and, therefore, the Company’s reserve for doubtful accounts may not be sufficient.
Litigation may have an adverse effect on the Company’s business.
The insurance industry is the target of an increasing number of class action lawsuits and other types of litigation, some of which involve claims for substantial and/or indeterminate amounts and the outcomes of which are unpredictable. This litigation iscan be based on a variety of issues including insurance and claim settlement practices. Although the Company has not been the target of any specific class action lawsuits, it is possible that a suit of this type could have a negative impact on the Company’s business.
The Company relies on its information technology systems to manage many aspects of its businessbusiness; and any failure of these systems to function properly or any interruption in their operation could result in a material adverse effect on the Company’s business, financial condition and results of operations.
The Company depends on the accuracy, reliability, and proper functioning of its information technology systems. The Company relies on these information technology systems to effectively manage many aspects of its business, including underwriting, policy acquisition, claims processing and handling, accounting, reserving and actuarial processes and policies, and maintaining its policyholder data. The failure of hardware or software that supports the Company’s information technology systems or the loss of data contained in the systems could disrupt its business and could result in decreased premiums, increased overhead costs, and inaccurate reporting, all of which could have a material adverse effect on the Company’s business, financial condition, and results of operations. In addition, despite system redundancy, the implementation of security measures and the existence of a disaster recovery plan for the Company’s information technology systems, these systems are vulnerable to damage or interruption from events such as:
| | • | | Earthquake, fire, flood and other natural disasters. |
| | • | | Terrorist attacksTerrorism acts and attacks by computer viruses or hackers. |
| | • | | Power loss. |
| | • | | Unauthorized access. |
| | • | | Computer systems or data network failure. |
It is possible that a system failure, accident, or security breach could result in a material disruption to the Company’s business. In addition, substantial costs may be incurred to remedy the damages caused by these disruptions. To the extent that a critical system fails or is not properly implemented and the failure cannot be corrected in a timely manner, the Company may experience disruptions to the business that could have a material adverse effect on the Company’s results of operations.
The Company’s disclosure controls and procedures may not prevent or detect all acts of fraud.
The Company’s disclosure controls and procedures are designed to reasonably ensure that information required to be disclosed in reports filed or submitted under the Securities Exchange Act is accumulated and communicated to management and is recorded, processed, summarized, and reported within the time periods specified in the SEC’s rules and forms. The Company’s management believes that any disclosure controls and procedures or internal controls and procedures, no matter how well conceived and operated, can provide only reasonable, not absolute, assurance that the objectives of the control system are met. Because of the inherent limitations in all control systems, they cannot provide absolute assurance that all control issues and instances of fraud, if any, within the Company have been prevented or detected. These inherent limitations include the realities that judgments in decision making can be faulty and that breakdowns can occur because of a simple error or mistake. Additionally, controls can be circumvented by the individual acts of some persons, by collusion of two or more people, or by an unauthorized override of the controls. The design of any system of controls also is based in part upon certain assumptions about the likelihood of future events, and the Company cannot ensure that any design will succeed in achieving its stated goals under all potential future conditions. Accordingly, because of the inherent limitations in a cost effective control system, misstatements due to error or fraud may occur and may not be detected.
Failure to maintain an effective system of internal control over financial reporting may have an adverse effect on the Company’s stock price.
Section 404 of the Sarbanes-Oxley Act of 2002 and the related rules and regulations promulgated by the SEC require the Company to include in its Form 10-K a report by its management regarding the effectiveness of the Company’s internal control over financial reporting. The report includes, among other things, an assessment of the effectiveness of the Company’s internal control over financial reporting as of the end of its fiscal year, including a statement as to whether or not the Company’s internal control over financial reporting is effective. This assessment must include disclosure of any material weaknesses in the Company’s internal control over financial reporting identified by management. Areas of the Company’s internal control over financial reporting may require improvement from time to time. If management is unable to assert that the Company’s internal control over financial reporting is effective now or in any future period, investors may lose confidence in the accuracy and completeness of the Company’s financial reports, which could have an adverse effect on its stock price.
The ability of the Company to attract, develop and retain talented employees, managers, and executives, and to maintain appropriate staffing levels, is critical to the Company’s success.
The Company must hire and train new employees and retain current employees to handle its operations. The failure of the Company to successfully hire and retain a sufficient number of skilled employees could result in the Company having to slow the growth of its business. In addition, the failure to adequately staff its claims department could result in decreased quality of the Company’s claims operations. The Company’s success also depends heavily upon the continued contributions of its executive officers, both individually and as a group. The Company’s future performance will be substantially dependent on its ability to retain and motivate its management team. The loss of the services of any of the Company’s executive officers could prevent the Company from successfully implementing its business strategy, which could have a materialmaterially adverse effect on the Company’s business, financial condition, and results of operations.
Item 1B. Unresolved Staff Comments.
Not applicable.None.
Item 2. Properties.
The Company presently occupies aapproximately 46,000 square footfeet of an office building located at 23251 Mulholland Drive, Woodland Hills, California, under a master lease expiring March 31, 2012. Erwin Cheldin, the Company's former president chairman,and a current director and principal stockholder, is the owner of the building. The Company signed an extension to the lease with a 4% increase in rent effective April 1, 2007. The lease provides for an annual gross rent of $1,066,990 from April 1, 2007, through March 31, 2012. In addition, the lease extension provides for two, five-year options with a rent increase of 5% for each option period. The Company believes that at the inception of the lease agreement and at each subsequent extension, the terms of the lease were at least as favorable to the Company as could have been obtained from non-affiliated third parties. The Company utilizes for its own operations approximately 100% of the space it leases.
Item 3. Legal Proceedings.
The Company, by virtue of the nature of the business conducted by it, becomes involved in numerous legal proceedings in which it may be named as either plaintiff or defendant. Incidental actions are sometimes brought by customers or others that relate to disputes concerning the issuance or non-issuance of individual insurance policies or other matters. In addition, the Company resorts to legal proceedings from time to time in order to enforce collection of premiums, commissions, or fees for the services rendered to customers or to their agents. These routine items of litigation do not materially affect the Company’s operations and are handled on a routine basis through its counsel.
Item 4. Submission of Matters to a Vote of Security HoldersRemoved and Reserved.
None
PART II
Item 5. Market for Registrant's Common Equity, Related Stockholder Matters and
Issuer Purchases of Equity Securities.
The Company's common stock is traded on the NASDAQ Global Market under the symbol "UNAM." The high and low sales prices (by quarter) during the last two comparable twelve-month12 month periods are as follows:
| Quarter Ended | | High Price | | | Low Price | |
| | | | | | | |
| March 31, 2007 | | $ | 14.25 | | | $ | 11.55 | |
| June 30, 2007 | | $ | 13.45 | | | $ | 10.97 | |
| September 30, 2007 | | $ | 14.03 | | | $ | 9.93 | |
| December 31, 2007 | | $ | 11.90 | | | $ | 9.94 | |
| | | | | | | | | |
| March 31, 2008 | | $ | 10.34 | | | $ | 8.80 | |
| June 30, 2008 | | $ | 10.42 | | | $ | 8.57 | |
| September 30, 2008 | | $ | 9.29 | | | $ | 7.63 | |
| December 31, 2008 | | $ | 9.03 | | | $ | 6.63 | |
| | | High | | | Low | |
| Quarter Ended | | Price | | | Price | |
| | | | | | | |
| March 31, 2009 | | $ | 8.85 | | | $ | 6.59 | |
| June 30, 2009 | | $ | 8.22 | | | $ | 7.32 | |
| September 30, 2009 | | $ | 10.33 | | | $ | 7.50 | |
December 31, 2009 | | $ | 10.32 | | | $ | 8.04 | |
| | | | | | | | | |
| March 31, 2010 | | $ | 10.33 | | | $ | 9.35 | |
| June 30, 2010 | | $ | 9.79 | | | $ | 9.10 | |
| September 30, 2010 | | $ | 9.50 | | | $ | 8.85 | |
December 31, 2010 | | $ | 9.97 | | | $ | 8.57 | |
As of December 31, 2008,2010, the approximate number of shareholders of record of the Company's common stock was 353.350. In addition, the Company estimates beneficial owners of the Company’s common stock held in the name of nominees to be approximately 560.500. Total shareholders are estimated to be approximately 913.
The Board of Directors last declared a cash dividend on the Company’s common stock in 2002. On March 23, 2009,December 7, 2010, the Board of Directors declared a cash dividend of $0.18$0.36 per common share payable on May 1, 2009,December 29, 2010, to shareholders of record on April 10, 2009.December 21, 2010. Declaration of future cash dividends will be subject to the Company’s profitability and its cash requirements. Because the Company is a holding company and operates through its subsidiaries, its cash flow and, consequently, its ability to pay dividends are dependent upon the earnings and cash requirements of its subsidiaries and the distribution of those earnings to the Company. Also, the ability of Crusader to pay dividends to the Company is subject to certain regulatory restrictions under the Holding Company Act (see Item 1 – “Business - Insurance Company Operation - Holding Company Act”). Presently, without prior regulatory approval, Crusader may pay a dividend in any twelve (12) month12-month period to its parent equal to the greater of (a) 10% of Crusader's statutory policyholders' surplus or (b) Crusader's statutory net income for the preceding calendar year. Based on Crusader’s statutory net incomesurplus for the year ended December 31, 2008,2010, the maximum dividend that could be made by Crusader to Unico without prior regulatory approval in 20092011 is $7,067,715.
The following table sets forth certain information with respect to purchases of common stock of the Company during the quarter ended December 31, 2008, by the Company.
Period | | Total Number of Shares Purchased | | | Average Price Paid Per Share | | | Total Number of Shares Purchased as Part Of Publicly Announced Plans or Programs(1) | | | Maximum Number of Shares that May Yet Be Purchased Under the Plans or Programs(1) | |
| | | | | | | | | | | | | |
| October 1, 2008 through October 31, 2008 | | | 30,477 | | | $ | 8.21 | | | | 30,477 | | | | 24,483 | |
| November 1, 2008 through November 30, 2008 | | | 4,351 | | | $ | 7.58 | | | | 4,351 | | | | 20,132 | |
| December 1, 2008 through December 31, 2008 | | | 4,665 | | | $ | 7.50 | | | | 4,665 | | | | 515,467 | |
| Total | | | 39,493 | | | $ | 8.05 | | | | 39,493 | | | | 515,467 | |
(1) | In April 2000, the Company announced that its Board of Directors had authorized the purchase in the open market from time to time of up to an aggregate of 315,000 shares of the common stock of the Company. On August 8, 2000, the Board of Directors authorized the purchase of an additional 315,000 shares and on September 6, 2000, the Board of Directors authorized the purchase of another 315,000 shares of the common stock of the Company in the open market from time to time. On December 19, 2008, the Board of Directors authorized an additional stock repurchase program to acquire up to 500,000 shares of the Company’s common stock in the open market from time to time. This brought the total shares of the Company’s common stock authorized to be repurchased to 1,445,000 shares since the year 2000 (see Note 16 of “Notes to Consolidated Financial Statements”). The programs have no expiration date and may be terminated by the Board of Directors at any time. During the twelve months ended December 31, 2008, the Company repurchased 51,092 shares of the Company’s common stock at a cost of $416,583 of which $25,108 was allocated to capital and $391,475 was allocated to retained earnings. As of December 31, 2008, under the stock repurchase programs previously adopted by the Company, the Company had remaining authority to repurchase up to an aggregate of 515,467 shares of common stock. During the months of January and February 2009, the Company purchased and retired an additional 6,688 shares of its common stock at a total cost of $51,866. The Company has or will retire all stock purchased. |
$6,252,096.
On December 19, 2008, the Board of Directors authorized a stock repurchase program to acquire from time to time up to an aggregate of 500,000 shares of the Company’s common stock. This program has no expiration date and may be terminated by the Board of Directors at any time. During the year ended December 31, 2010, the Company did not repurchase any shares of common stock under this program. During the year ended December 31, 2009, the Company repurchased under this program and previously adopted programs an aggregate of 268,111 shares of the Company’s common stock at a cost of $2,447,948 of which $131,756 was allocated to capital and $2,316,192 was allocated to retained earnings. As of December 31, 2010, the Company had remaining authority under the 2008 program to repurchase up to an aggregate of 247,356 shares of its common stock. The 2008 program is the only program under which there is remaining authority to repurchase shares of the Company’s common stock. The Company has retired all stock repurchased.
Performance Graph
The following graph compares the cumulative total shareholder return on the Company's Common Stock with the cumulative total return of equity securities traded on the National Association of Securities Dealers Automated Quotation System (NASDAQ) and a peer group consisting of all NASDAQ property and casualty companies. The comparison assumes $100.00 was invested on December 31, 2003,2005, in the Company's Common Stock and in each of the comparison groups, and assumes reinvestment of dividends. It should be noted that this graph represents historical stock price performance and is not necessarily indicative of any future stock price performance.
| | | 12/31/03 | | | 12/31/04 | | | 12/31/05 | | | 12/31/06 | | | 12/31/07 | | | 12/31/08 | |
| Unico American Corp. | | | 100.00 | | | | 170.22 | | | | 167.51 | | | | 234.35 | | | | 183.67 | | | | 146.95 | |
| NASDAQ Market Index | | | 100.00 | | | | 108.84 | | | | 111.16 | | | | 122.11 | | | | 132.42 | | | | 63.80 | |
| Peer Group Index | | | 100.00 | | | | 117.23 | | | | 137.17 | | | | 151.77 | | | | 145.71 | | | | 123.42 | |
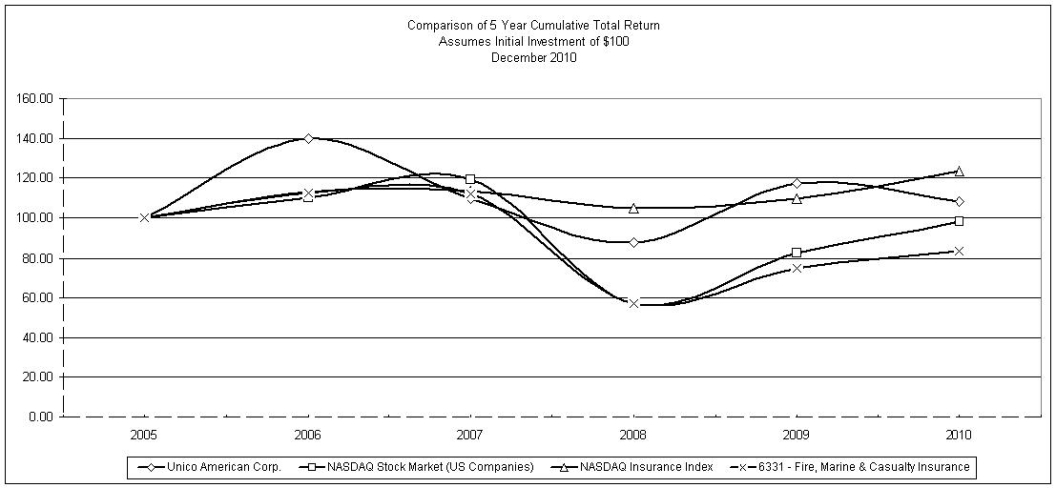
| | | 12/31/05 | | | 12/31/06 | | | 12/31/07 | | | 12/31/08 | | | 12/31/09 | | | 12/31/10 | |
| Unico American Corp. | | | 100.00 | | | | 139.90 | | | | 109.65 | | | | 87.72 | | | | 117.14 | | | | 108.06 | |
| NASDAQ Stock Market (US) | | | 100.00 | | | | 109.84 | | | | 119.14 | | | | 57.41 | | | | 82.53 | | | | 97.95 | |
| NASDAQ Insurance Index | | | 100.00 | | | | 113.07 | | | | 113.30 | | | | 104.95 | | | | 109.61 | | | | 123.40 | |
| 6331 - Fire, Marine & Casualty Insurance | | | 100.00 | | | | 112.23 | | | | 111.92 | | | | 56.95 | | | | 74.91 | | | | 83.79 | |
Item 6. Selected Financial Data.
During the first quarter of 2008, the Company identified an error associated with the Company’s policy fee income. The error arose from the recognition of non-refundable policy fee income at policy inception rather than over the policy term in accordance with the SEC’s Staff Accounting Bulletin (SAB) No. 104, “Revenue Recognition,” and EITF 00-21, “Revenue Arrangements with Multiple Deliverables.”
The Company made an assessment of the materiality of this item on the Company’s historical financial statements in accordance with SAB No. 99, “Materiality,” and concluded that the error was immaterial to all periods. The Company also concluded that had the error been adjusted when it was identified within the first quarter of 2008, the impact of such an adjustment would have been material to its first quarter 2008 financial statements and was expected to be material to its full year 2008 financial statements.
Accordingly, in accordance with SAB No. 108, “Considering the Effects of Prior Year Misstatements when Quantifying Misstatements in Current Year Financial Statements,” the prior year’s balance sheet, the consolidated statements of operations, comprehensive income, and cash flows have been revised to correct the immaterial error and to reflect the corrected balances as of that date (see Note 1 of “Notes to Consolidated Financial Statements”).| | | Year ended December 31 | |
| | | 2010 | | | 2009 | | | 2008 | | | 2007 | | | 2006 | |
| | | | | | | | | | | | | | | | |
| | | | | | | | | | | | | | | | |
| Total revenues | | $ | 37,120,751 | | | $ | 41,617,106 | | | $ | 46,769,444 | | | $ | 50,372,895 | | | $ | 54,916,206 | |
| Total costs and expenses | | | 33,900,170 | | | | 37,453,128 | | | | 38,784,978 | | | | 40,299,742 | | | | 36,563,395 | |
| Income before taxes | | $ | 3,220,581 | | | $ | 4,163,978 | | | $ | 7,984,466 | | | $ | 10,073,153 | | | $ | 18,352,811 | |
| Net income | | $ | 2,329,152 | | | $ | 2,927,375 | | | $ | 5,283,016 | | | $ | 6,712,444 | | | $ | 11,925,466 | |
| Basic earnings per share | | $ | 0.44 | | | $ | 0.53 | | | $ | 0.94 | | | $ | 1.20 | | | $ | 2.14 | |
| Diluted earnings per share | | $ | 0.44 | | | $ | 0.53 | | | $ | 0.93 | | | $ | 1.18 | | | $ | 2.11 | |
| Cash dividends per share | | $ | 0.36 | | | $ | 0.36 | | | | - | | | | - | | | | - | |
| Total assets | | $ | 157,674,720 | | | $ | 170,108,652 | | | $ | 184,602,976 | | | $ | 193,775,861 | | | $ | 188,244,584 | |
| Stockholders’ equity | | $ | 73,353,816 | | | $ | 73,315,340 | | | $ | 76,958,255 | | | $ | 69,103,103 | | | $ | 60,011,570 | |
| | | Year ended December 31 | |
| | | 2008 | | | 2007 | | | 2006 | | | 2005 | | | 2004 | |
| | | | | | | | | | | | | | | | |
| | | | | | | | | | | | | | | | |
| Total revenues | | $ | 46,769,444 | | | $ | 50,372,895 | | | $ | 54,916,206 | | | $ | 61,364,024 | | | $ | 62,006,124 | |
| Total costs and expenses | | | 38,784,978 | | | | 40,299,742 | | | | 36,563,395 | | | | 50,716,092 | | | | 53,230,852 | |
| Income before taxes | | $ | 7,984,466 | | | $ | 10,073,153 | | | $ | 18,352,811 | | | $ | 10,647,932 | | | $ | 8,775,272 | |
| Net income | | $ | 5,283,016 | | | $ | 6,712,444 | | | $ | 11,925,466 | | | $ | 6,834,795 | | | $ | 5,749,357 | |
| Basic earnings per share | | $ | 0.94 | | | $ | 1.20 | | | $ | 2.14 | | | $ | 1.24 | | | $ | 1.05 | |
| Diluted earnings per share | | $ | 0.93 | | | $ | 1.18 | | | $ | 2.11 | | | $ | 1.22 | | | $ | 1.03 | |
| Cash dividends per share | | | - | | | | - | | | | - | | | | - | | | | - | |
| Total assets | | $ | 184,602,976 | | | $ | 193,775,861 | | | $ | 188,244,584 | | | $ | 186,807,528 | | | $ | 173,142,336 | |
| Stockholders’ equity | | $ | 76,958,255 | | | $ | 69,103,103 | | | $ | 60,011,570 | | | $ | 48,086,104 | | | $ | 41,251,309 | |
Item 7. Management's Discussion and Analysis of Financial Condition and Results of Operations.
Overview
General
Unico American Corporation is an insurance holding company that underwrites property and casualty insurance through its insurance company subsidiary; provides property, casualty, health and life insurance through its agency subsidiaries; provides insurance premium financing; and provides membership association services.
The Company’s net income was $2,329,152 in 2010, $2,927,375 in 2009, and $5,283,016 in 2008, $6,712,444 in 2007, and $11,925,466 in 2006.2008.
This overview discusses some of the relevant factors that management considers in evaluating the Company's performance, prospects and risks. It is not all-inclusiveall inclusive and is meant to be read in conjunction with the entirety of the management discussion and analysis, the Company's financial statements and notes thereto, and all other items contained within the report on this Annual Report on Form 10-K.
Revenue and Income Generation
The Company receives its revenue primarily from earned premium derived from the insurance company operations, commission and fee income generated from the insurance agency operations, finance charges and fee income from the premium finance operations, and investment income from cash generated primarily from the insurance company operation. The insurance company operation generates approximately 87% of the Company’s total revenue. The Company’s remaining operations constitute a variety of specialty insurance services, each with unique characteristics and individually not material to consolidated revenues.
Insurance Company Operation
The property and casualty insurance industry is highly competitive and includes many insurers, ranging from large companies offering a wide variety of products worldwide to smaller, specialized companies in a single state or region offering only a single product. Many of the Company's existing or potential competitors have considerably greater financial and other resources, have a higher rating assigned by independent rating organizations such as A.M. Best Company, have greater experience in the insurance industry and offer a broader line of insurance products than the Company. As of December 31, 2008,2010, Crusader was licensed as an admitted insurance carrier in the states of Arizona, California, Nevada, Oregon, and Washington. However,Since 2004, all Crusaders’of Crusader’s business was written in the Statestate of California. During the year ended December 31, 2008,2010, 98% of Crusader’s business was commercial multiplemulti peril policies. Effective January 27, 2009,In December of 2010, A.M. Best Company upgradedreaffirmed Crusader’s financial strength rating toof A- (Excellent) from B++ (Good), and revised Crusader’sa rating outlook to stable from positive.of “stable.” In addition, Crusader’sCrusader was assigned an Issuer Credit Rating was upgraded toof a- (Excellent) from bbb+ (Good).
A primary challenge of the property and casualty insurance company operation is contending with the fact that the Company sells its products before the ultimate costs are actually known. That is, when pricing its products, the Company must forecast the ultimate claim and loss adjustment costs. In addition, factors such as changes in regulations and legal environment, among other things, can all impact the accuracy of such cost.
costs.
The property and casualty insurance industry is characterized by periods of soft market conditions, in which premium rates are stable or falling and insurance is readily available, and by periods of hard market conditions, in which premium rates rise, coverage may be more difficult to find, and insurers’ profits increase. The Company believes that the California property and casualty insurance market has transitionedcontinues to be a “soft market” in the last few years.market.” The Company cannot determine how long the existing market conditions will continue nor in which direction they might change. Despite the increased competition in the property and casualty marketplace, the Company believes that rate adequacy is more important than premium growth and that underwriting profit (net earned premium less losses and loss adjustment expenses and policy acquisition costs) is its primary goal. Nonetheless, Crusader believes that it can grow its sales and profitability by continuing to focus upon three key areas of its operations: (1) product development, (2) improved service to retail brokers, and (3) appointment of captive and independent retail agents.
In June 2010, the Company completed its search for a new policy administration software system to replace its existing legacy system, and the Company signed related contracts on July 8, 2010. The Company has concerns about the basis for the vendor’s delay in the implementation of the system and about the new system’s expected functionality. The Company is working with the vendor to resolve the issues and to renegotiate the contracts. As of December 31, 2010, the Company had capitalized work-in-progress software in the amount of $1,500,162 of which $1,431,917 remained unpaid.
Crusader’s underwriting profit (before income taxes) is as follows:
| | | Year ended December 31 | | | Year ended December 31 | |
| | | 2008 | | | 2007 | | | 2006 | | | 2010 | | | 2009 | | | 2008 | |
| | | | | | | | | | | | | | | | | | | |
| Net premium earned | | $ | 33,949,695 | | | $ | 37,129,665 | | | 42,933,789 | | | $ | 28,152,202 | | | $ | 30,774,471 | | | $ | 33,949,695 | |
| Less: | | | | | | | | | | | | | | | | | | | | | | | | |
| Losses and loss adjustment expenses | | 20,592,730 | | | 22,182,237 | | | 17,826,979 | | | | 18,470,115 | | | | 19,545,761 | | | | 20,592,730 | |
| Policy acquisition costs | | | 8,261,324 | | | | 8,465,047 | | | | 9,250,989 | | | | 7,282,546 | | | | 7,612,716 | | | | 8,261,324 | |
| Total | | | 28,854,054 | | | | 30,647,284 | | | | 27,077,968 | | | | 25,752,661 | | | | 27,158,477 | | | | 28,854,054 | |
| | | | | | | | | | | | | | | | | | | | | | | | | |
Underwriting profit (before income taxes) | | $ | 5,095,641 | | | $ | 6,482,381 | | | $ | 15,855,821 | | | $ | 2,399,541 | | | $ | 3,615,994 | | | $ | 5,095,641 | |
The following table provides an analysis of the losses and loss adjustment expenses:
| | | Year ended December 31 | | | Year ended December 31 | |
| | | 2008 | | | 2007 | | | 2006 | | | 2010 | | | 2009 | | | 2008 | |
| Losses and loss adjustment expenses | | | | | | | | | | | | | | | | | | |
| | | | | | | | | | | | | | | | | | | |
| Current accident year | | 24,149,531 | | | 26,300,338 | | | 29,997,662 | | | $ | 23,038,294 | | | $ | 23,501,314 | | | $ | 24,149,531 | |
| Favorable development of all prior accident years | | | 3,556,801 | | | | 4,118,101 | | | | 12,170,683 | | | | 4,568,179 | | | | 3,955,553 | | | | 3,556,801 | |
| | | | | | | | | | | | | | | | | | | | | | | | | |
| Total loss and loss adjustment expenses | | $ | 20,592,730 | | | $ | 22,182,237 | | | $ | 17,826,979 | | |
| Total losses and loss adjustment expenses | | | $ | 18,470,115 | | | $ | 19,545,761 | | | $ | 20,592,730 | |
Losses and loss adjustment expenses were 66% of net premium earned for the year ended December 31, 2010, compared to 64% of net premium earned for the year ended December 31, 2009, and compared to 61% of net premium earned for the year ended December 31, 2008, compared to 60% of net premium earned for the year ended December 31, 2007, and compared to 42% of net premium earned for the year ended December 31, 2006.2008.
Other Operations
The Company’s other operations generate commissions, fees, and finance charges from various insurance products. The events that have the most significant economic impact are as follows:
Unifax primarily sells and services insurance policies for Crusader. The commissions paid by Crusader to Unifax are eliminated as intercompany transactions and are not reflected as income in the financial statements. Policy fee income for the twelve12 months ended December 31, 2008,2010, decreased 10%6% as compared to the prior year. The decrease in policy fee income is a result of a decrease in the number of policies issued during the twelve12 months ended December 31, 2008,2010, as compared to 2007.2009.
There have been significant changes in the Company’s health insurance policies for individual/familyoperation in 2010. In 2010, approximately 61% of the Company’s health insurance income was derived from the CIGNA medical and small business groupsdental programs. This represents a decline from 76% in 2009 and receives commissions based on the premiums that it writes. Commission income increased 19% for the year ended December 31, 2008, compared to 2007. The increase is primarily due to the increase82% in sales of small group medical insurance offered through CIGNA HealthCare. All CIGNA small group medical insurance policyholders are members of AAQHC.2008. In November 2008, AIB entered into a General Agent Contract with Blue Shield of California who will pay AIB override commissions for all business submitted to them. In JuneSeptember 2009, CIGNA plans to substantially reducereduced the medical plans offered to Small Group Employerssmall group employers in the state of California from sixteen current19 plans down to four. All new employer groups4 plans. Primarily as a result of CIGNA’s decision to reduce the number of plans offered, AIB decided to terminate its marketing and existing employer groups, on their anniversary date, will haveadministrative agreement with CIGNA effective August 31, 2010. On September 1, 2010, AIB stopped marketing all CIGNA products. AAQHC, An Administrator, ceased administration of CIGNA dental plans effective November 1, 2010 and CIGNA medical plans effective December 1, 2010. AIB is assisting the option to choose from the four available plans. AIB will be assisting its CIGNA policyholdersAAQHC members in obtaining newmedical and dental coverage in one of the four CIGNA plans or with other contracted carriers. This reduction inThese carriers are paying AIB commissions for these members. AIB has developed a new partnership with Guardian Life Insurance Company of America (GLIC). Effective October 1, 2010, AIB has been marketing GLIC’s dental and group life products to both brokers and the public. GLIC has created plans specifically for AIB.
The termination of the marketing and administrative agreement with CIGNA medical plans offered to Small Group Employers in the state of California may resulthas resulted in a decrease in AIB commission income and AAQHC fee income. AAQHC will continueCommission income decreased approximately 24% for the year ended December 31, 2010, as compared to underwrite and administer all remaining CIGNA business, including dental plans for Individuals and Small Group Employers.
AAQHC provides various consumer benefits to its members, including participation in group health care insurance policies. For these services, AAQHC receives membership and fee income from its members. Membership and fee income decreased 3%19% in the year ended December 31, 2008,2010, compared to 2007. The decrease is a result of a decrease in the number of members.
AAC provides premium financing for Crusader policies that are produced by Unifax in California. Finance charges and fees earned by AAC during 2008 decreased 17% as compared to 2007.2009. The decrease is primarily a result of a 11% decreasethe termination of the administrative agreement with CIGNA as discussed above.
The insurance premium financing operation currently finances policies written only through its sister company, Unifax. Effective July 20, 2010, AAC reduced the interest rate charged on premiums financed to 0% in an effort to increase the numbersales of loans issuedexisting renewal and new business written by Unifax for Crusader. Due to the low interest rate environment, the cost of money to provide this incentive is not material. The Company monitors the cost of providing this incentive, and depending on the cost/benefit determination, can continue to offer it or withdraw it at any time. Primarily due to the interest rate reduction, finance charges and fees earned by AAC in 20082010 decreased 25% as compared to 2007. Average2009. The average premium financed by AAC decreased towas $2,304 in 2010, $2,309 in 2009 and $2,653 in 2008 from $2,769 in 2007.2008.
The daily automobile rental insurance program is produced by Bedford Insurance Services, Inc. Bedford receives a commission from a non-affiliated insurance company based on premium written. Commission in the daily automobile rental insurance program increased 3%decreased 9% as compared to 2007.2009. The decrease in commission income is a result of a decrease in the number of policies issued and in-force during the 12 months ended December 31, 2010, as compared to 2009.
Investments and LiquidityInsurance Company Operation
The property and casualty insurance industry is highly competitive and includes many insurers, ranging from large companies offering a wide variety of products worldwide to smaller, specialized companies in a single state or region offering only a single product. Many of the Company's existing or potential competitors have considerably greater financial and other resources, have a higher rating assigned by independent rating organizations such as A.M. Best Company, generates revenue from its investment portfolio, which consistedhave greater experience in the insurance industry and offer a broader line of approximately $145.0 million (at amortized cost) asinsurance products than the Company. As of December 31, 2008,2010, Crusader was licensed as an admitted insurance carrier in the states of Arizona, California, Nevada, Oregon, and $147.3 million (at amortized cost)Washington. Since 2004, all of Crusader’s business was written in the state of California. During the year ended December 31, 2010, 98% of Crusader’s business was commercial multi peril policies. In December of 2010, A.M. Best Company reaffirmed Crusader’s financial strength rating of A- (Excellent) and a rating outlook of “stable.” In addition, Crusader was assigned an Issuer Credit Rating of a- (Excellent).
A primary challenge of the property and casualty insurance company operation is contending with the fact that the Company sells its products before the ultimate costs are actually known. That is, when pricing its products, the Company must forecast the ultimate claim and loss adjustment costs. In addition, factors such as changes in regulations and legal environment, among other things, can all impact the accuracy of such costs.
The property and casualty insurance industry is characterized by periods of soft market conditions, in which premium rates are stable or falling and insurance is readily available, and by periods of hard market conditions, in which premium rates rise, coverage may be more difficult to find, and insurers’ profits increase. The Company believes that the California property and casualty insurance market continues to be a “soft market.” The Company cannot determine how long the existing market conditions will continue nor in which direction they might change. Despite the increased competition in the property and casualty marketplace, the Company believes that rate adequacy is more important than premium growth and that underwriting profit is its primary goal. Nonetheless, Crusader believes that it can grow its sales and profitability by continuing to focus upon three key areas of its operations: (1) product development, (2) improved service to retail brokers, and (3) appointment of captive and independent retail agents.
In June 2010, the Company completed its search for a new policy administration software system to replace its existing legacy system, and the Company signed related contracts on July 8, 2010. The Company has concerns about the basis for the vendor’s delay in the implementation of the system and about the new system’s expected functionality. The Company is working with the vendor to resolve the issues and to renegotiate the contracts. As of December 31, 2007. Investment2010, the Company had capitalized work-in-progress software in the amount of $1,500,162 of which $1,431,917 remained unpaid.
Crusader’s underwriting profit (before income taxes) is as follows:
| | | Year ended December 31 | |
| | | 2010 | | | 2009 | | | 2008 | |
| | | | | | | | | | |
| Net premium earned | | $ | 28,152,202 | | | $ | 30,774,471 | | | $ | 33,949,695 | |
| Less: | | | | | | | | | | | | |
| Losses and loss adjustment expenses | | | 18,470,115 | | | | 19,545,761 | | | | 20,592,730 | |
| Policy acquisition costs | | | 7,282,546 | | | | 7,612,716 | | | | 8,261,324 | |
| Total | | | 25,752,661 | | | | 27,158,477 | | | | 28,854,054 | |
| | | | | | | | | | | | | |
Underwriting profit (before income taxes) | | $ | 2,399,541 | | | $ | 3,615,994 | | | $ | 5,095,641 | |
The following table provides an analysis of the losses and loss adjustment expenses:
| | | Year ended December 31 | |
| | | 2010 | | | 2009 | | | 2008 | |
| Losses and loss adjustment expenses | | | | | | | | | |
| | | | | | | | | | |
| Current accident year | | $ | 23,038,294 | | | $ | 23,501,314 | | | $ | 24,149,531 | |
| Favorable development of all prior accident years | | | 4,568,179 | | | | 3,955,553 | | | | 3,556,801 | |
| | | | | | | | | | | | | |
| Total losses and loss adjustment expenses | | $ | 18,470,115 | | | $ | 19,545,761 | | | $ | 20,592,730 | |
Losses and loss adjustment expenses were 66% of net premium earned for the year ended December 31, 2010, compared to 64% of net premium earned for the year ended December 31, 2009, and compared to 61% of net premium earned for the year ended December 31, 2008.
Other Operations
The Company’s other operations generate commissions, fees, and finance charges from various insurance products. The events that have the most significant economic impact are as follows:
Unifax sells and services insurance policies for Crusader. The commissions paid by Crusader to Unifax are eliminated as intercompany transactions and are not reflected as income in the financial statements. Policy fee income for the twelve12 months ended December 31, 2008,2010, decreased $1.0 million (14%)6% as compared to the twelveprior year. The decrease in policy fee income is a result of a decrease in the number of policies issued during the 12 months ended December 31, 2007. 2010, as compared to 2009.
There have been significant changes in the Company’s health insurance operation in 2010. In 2010, approximately 61% of the Company’s health insurance income was derived from the CIGNA medical and dental programs. This represents a decline from 76% in 2009 and 82% in 2008. In September 2009, CIGNA substantially reduced the medical plans offered to small group employers in the state of California from 19 plans down to 4 plans. Primarily as a result of CIGNA’s decision to reduce the number of plans offered, AIB decided to terminate its marketing and administrative agreement with CIGNA effective August 31, 2010. On September 1, 2010, AIB stopped marketing all CIGNA products. AAQHC, An Administrator, ceased administration of CIGNA dental plans effective November 1, 2010 and CIGNA medical plans effective December 1, 2010. AIB is assisting the AAQHC members in obtaining medical and dental coverage with other contracted carriers. These carriers are paying AIB commissions for these members. AIB has developed a new partnership with Guardian Life Insurance Company of America (GLIC). Effective October 1, 2010, AIB has been marketing GLIC’s dental and group life products to both brokers and the public. GLIC has created plans specifically for AIB.
The decrease was primarily due totermination of the marketing and administrative agreement with CIGNA has resulted in a decrease in AIB commission income and AAQHC fee income. Commission income decreased approximately 24% for the Company’s annualized yield on average invested assetsyear ended December 31, 2010, as compared to 4.0% in 2008 from 4.6% in 2007. The decrease in the annualized yield on average invested assets is a result of lower yields in the marketplace on both new and reinvested assets. Due to the current interest rate environment, management believes it is prudent to purchase fixed maturity investments with maturities of five years or less and with minimal credit risk.2009.
As of December 31, 2008, the weighted average maturity of the Company’s fixed maturity investments was 2.1 years comparedAAQHC provides various consumer benefits to 2.0 yearsits members, including participation in group health care insurance policies. For these services, AAQHC receives membership and 1.3 years as of December 31, 2007,fee income from its members. Membership and December 31, 2006, respectively.
Liquidity and Capital Resources
Due to the nature of the Company's business (insurance and insurance services) and whereas Company growth does not normally require material reinvestments of profits into property or equipment, the cash flow generated from operations usually results in improved liquidity for the Company. Because the Company is a holding company and operates through its subsidiaries, its cash flow is dependent upon the earnings of its subsidiaries and the distributions of those earnings to the Company.
Cash flow used by operationsfee income decreased 19% in the year ended December 31, 2008,2010, compared to 2009. The decrease is primarily a result of the termination of the administrative agreement with CIGNA as discussed above.
The insurance premium financing operation currently finances policies written only through its sister company, Unifax. Effective July 20, 2010, AAC reduced the interest rate charged on premiums financed to 0% in an effort to increase the sales of existing renewal and new business written by Unifax for Crusader. Due to the low interest rate environment, the cost of money to provide this incentive is not material. The Company monitors the cost of providing this incentive, and depending on the cost/benefit determination, can continue to offer it or withdraw it at any time. Primarily due to the interest rate reduction, finance charges and fees earned by AAC in 2010 decreased 25% as compared to 2009. The average premium financed by AAC was $1,675,603,$2,304 in 2010, $2,309 in 2009 and $2,653 in 2008.
The daily automobile rental insurance program is produced by Bedford Insurance Services, Inc. Bedford receives a commission from a non-affiliated insurance company based on premium written. Commission in the daily automobile rental insurance program decreased 9% as compared to 2009. The decrease in commission income is a result of a decrease in cash flowthe number of $1,561,963 compared topolicies issued and in-force during the cash flow for the year ending December 31, 2007. In 2008 the Company primarily utilized the cash from the maturity of its fixed maturity investments to purchase $63.6 million of fixed maturity securities.
Cash flow used by operations in the year ended December 31, 2007, was $113,640, a decrease in cash flow of $6,411,534 compared to the cash flow for the year ending December 31, 2006. In 2007 the Company primarily utilized the cash from the maturity of its fixed maturity investments to purchase $69.7 million of fixed maturity securities.
The most significant liquidity risk faced by the Company is adverse development of the insurance company’s loss and loss adjustment expense reserves. Based on the Company’s current loss and loss expense reserves and expected current and future payments, the Company believes that there are no current liquidity issues. However, no assurance can be given that the Company’s estimate of ultimate loss and loss adjustment expense reserves will be sufficient.
Crusader generates a significant amount of cash as a result of its holdings of unearned premium reserves, its reserves for loss payments, and its capital and surplus. Crusader's loss and loss adjustment expense payments are the most significant cash flow requirement of the Company. These payments are continually monitored and projected to ensure that the Company has the liquidity to cover these payments without the need to liquidate its investments. Cash and investments (at amortized cost) at December 31, 2008, were $145,070,097 compared to $147,457,231 at December 31, 2007. Crusader's cash and investments at December 31, 2008, was 98% of the total held by the Company, compared to 97% of the total held by the Company at December 31, 2007.
The Company's investments are as follows:
| | | December 31, 2008 | | | December 31, 2007 | | | December 31, 2006 | |
| | | Amount | | | % | | | Amount | | | % | | | Amount | | | % | |
| | | | | | | | | | | | | | | | | | | |
| Fixed maturities (at amortized cost) | | | | | | | | | | | | | | | | | | |
| Certificates of deposit | | $ | 400,000 | | | | - | | | $ | 400,000 | | | | - | | | $ | 400,000 | | | | - | |
| U.S. treasury securities | | | 124,526,227 | | | | 92 | | | | 130,211,428 | | | | 93 | | | | 127,553,801 | | | | 91 | |
| Industrial and miscellaneous (taxable) | | | 10,614,127 | | | | 8 | | | | 9,365,735 | | | | 7 | | | | 12,523,393 | | | | 9 | |
| State and municipal (tax exempt) | | | - | | | | - | | | | 15,045 | | | | - | | | | 15,134 | | | | - | |
| Total fixed maturity investments | | | 135,540,354 | | | | 100 | | | | 139,992,208 | | | | 100 | | | | 140,492,328 | | | | 100 | |
| | | | | | | | | | | | | | | | | | | | | | | | | |
| Short-term cash investments (at cost) | | | | | | | | | | | | | | | | | | | | | | | | |
| Certificates of deposit | | | 200,000 | | | | 2 | | | | 200,000 | | | | 3 | | | | 200,000 | | | | 3 | |
| Commercial paper | | | - | | | | - | | | | 3,887,322 | | | | 53 | | | | 1,665,000 | | | | 25 | |
| Bank money market accounts | | | 3,312,140 | | | | 35 | | | | 444,781 | | | | 6 | | | | 210,270 | | | | 3 | |
| U.S. government money market fund | | | 5,585,395 | | | | 59 | | | | 2,425,807 | | | | 33 | | | | 411,206 | | | | 6 | |
| Short-term U.S. treasury bills | | | 399,953 | | | | 4 | | | | 393,768 | | | | 5 | | | | 4,322,048 | | | | 63 | |
| Bank savings accounts | | | 4,545 | | | | - | | | | 4,481 | | | | - | | | | 11,483 | | | | - | |
| Total short-term cash investments | | | 9,502,033 | | | | 100 | | | | 7,356,159 | | | | 100 | | | | 6,820,007 | | | | 100 | |
| | | | | | | | | | | | | | | | | | | | | | | | | |
| Total investments | | $ | 145,042,387 | | | | | | | $ | 147,348,367 | | | | | | | $ | 147,312,335 | | | | | |
In accordance with Statement of Financial Accounting Standards No. 115, “Accounting for Certain Investments in Debt and Equity Securities,” (SFAS No. 115), the Company is required to classify its investment securities into one of three categories: held-to-maturity, available-for-sale, or trading securities. Although all of the Company's investment in fixed maturity securities are classified as available-for-sale and the Company may sell investment securities from time to time in response to economic and market conditions, its investment guidelines place primary emphasis on buying and holding high-quality investments to maturity.
The Company’s investment guidelines on equity securities limit investments in equity securities to an aggregate maximum of $2,000,000. The Company’s investment guidelines on fixed maturities limit those investments to high-grade obligations with a maximum term of eight years. The maximum investment authorized in any one issuer is $2,000,000 and the maximum in any one U.S. government agency or U.S. government sponsored enterprise is $3,000,000. This dollar limitation excludes bond premiums paid in excess of par value and U.S. government or U.S. government guaranteed issues. Investments in municipal securities are primarily pre-refunded and secured by U.S. treasury securities. The short-term investments are either U.S. government obligations, FDIC insured, or are in an institution with a Moody's rating of P2 and/or a Standard & Poor's rating of A1. All of the Company's fixed maturity securities are rated and readily marketable and could be liquidated without any material adverse financial impact.
The investment marketplace in general, and in certain asset classes specifically, has been impacted by volatility as a result of uncertainty in the credit markets that began in 2007 and continued throughout 2008. The Company’s fixed maturity investment portfolio as of December 31, 2008, consisted of 92% U.S. treasury securities and 8% highly rated industrial and miscellaneous taxable issues bonds. As of December 31, 2008, the Company’s industrial and miscellaneous taxable bonds were all rated “A” or better by Standard & Poors.
Crusader's statutory capital and surplus as of December 31, 2008, was $64,736,230, an increase of $6,873,896 (12%) from December 31, 2007. Crusader's statutory capital and surplus as of December 31, 2007, was $57,862,334, an increase of $7,838,566 (16%) from December 31, 2006.
No dividends were declared or paid by Crusader to Unico in 2008, 2007, or 2006. Based on Crusader’s statutory net income for the year ended December 31, 2008, the maximum dividend that could be made by Crusader to Unico without prior regulatory approval in 2009 is $7,067,715.
In April 2000, the Company announced that its Board of Directors had authorized the purchase in the open market from time to time of up to an aggregate of 315,000 shares of the common stock of the Company. On August 8, 2000, the Board of Directors authorized the purchase of an additional 315,000 shares and on September 6, 2000, the Board of Directors authorized the purchase of another 315,000 shares of the common stock of the Company in the open market from time to time. On December 19, 2008, the Board of Directors authorized an additional stock repurchase program to acquire up to 500,000 shares of the Company’s common stock in the open market from time to time. This brought the total shares of the Company’s common stock authorized to be repurchased to 1,445,000 shares since the year 2000 (see Note 16 of “Notes to Consolidated Financial Statements”). The programs have no expiration date and may be terminated by the Board of Directors at any time. During the twelve12 months ended December 31, 2008, the Company repurchased 51,092 shares of the Company’s common stock at a cost of $416,583 of which $25,108 was allocated2010, as compared to capital and $391,475 was allocated to retained earnings. As of December 31, 2008, under the stock repurchase programs previously adopted by the Company, the Company had remaining authority to repurchase up to an aggregate of 515,467 shares of common stock. During the months of January and February 2009, the Company purchased and retired an additional 6,688 shares of its common stock at a total cost of $51,866. The Company has or will retire all stock purchased.2009.
Although material capital expenditures may also be funded through borrowings, the Company believes that its cash and short-term investments at year end, net of trust restrictions of $236,104, statutory deposits of $700,000, and California insurance company statutory dividend restrictions applicable to Crusader plus the cash to be generated from operations, should be sufficient to meet its operating requirements during the next twelve months without the necessity of borrowing funds.
As a California insurance company, Crusader is obligated to pay a premium tax on gross premiums written in all states that Crusader is admitted. Premium taxes are deferred and amortized as the related premiums are earned. The premium tax is in lieu of state franchise taxes and is not included in the provision for state taxes.
The Company has certain obligations to make future payments under contracts and credit-related financial instruments and commitments. At December 31, 2008, certain long-term aggregate contractual obligations and credit-related commitments are summarized as follows:
| Contractual Obligations | | Total | | | Within 1 Year | | | 1-3 Years | | | 3-5 Years | | | After 5 years | |
| | | | | | | | | | | | | | | | |
| Building lease | | $ | 3,467,717 | | | $ | 1,066,990 | | | $ | 2,133,980 | | | $ | 266,747 | | | | - | |
| Loss and loss adjustment expense reserves* | | | 78,654,590 | | | | 25,394,793 | | | | 31,233,425 | | | | 12,029,444 | | | $ | 9,996,928 | |
| Total | | $ | 82,122,307 | | | $ | 26,461,783 | | | $ | 33,367,405 | | | $ | 12,296,191 | | | $ | 9,996,928 | |
| * Unlike many other forms of contractual obligations, loss and loss adjustment expense reserves do not have definitive due dates and the ultimate payment dates are subject to a number of variables and uncertainties. As a result, the total loss and loss adjustment expense reserve payments to be made by period, as shown above, are estimates. |
Results of Operations
General
The Company had net income of $5,283,016 for the year ended December 31, 2008, compared to net income of $6,712,444 for the year ended December 31, 2007, and net income of $11,925,466 for the year ended December 31, 2006. Total revenue for the year ended December 31, 2008, was $46,769,444 compared to $50,372,895 for the year ended December 31, 2007, and $54,916,206 for the year ended December 31, 2006.
For the year ended December 31, 2008, the Company had income before taxes of $7,984,466 compared to income before taxes of $10,073,153 in the year ended December 31, 2007, a decrease of $2,088,687 (21%) in income before taxes. The decrease in income before taxes was primarily due to a decrease of $1,386,740 in the underwriting profit (net earned premium less losses and loss adjustment expenses and policy acquisition costs), and a decrease of $956,385 in investment income.
For the year ended December 31, 2007, the Company had income before taxes of $10,073,153 compared to income before taxes of $18,352,811 in the year ended December 31, 2006, a decrease in income before taxes of $8,279,658 (45%). The decrease in income before tax was primarily due to a decrease of $9,373,440 in the underwriting profit (net earned premium less losses and loss adjustment expenses and policy acquisition costs).
The effect of inflation on the net income of the Company during the years ended December 31, 2008, 2007, and 2006 was not significant.
The Company derives revenue from various sources as discussed below:
Insurance Company Operation
The property and casualty insurance industry is highly competitive and includes many insurers, ranging from large companies offering a wide variety of products worldwide to smaller, specialized companies in a single state or region offering only a single product. Many of the Company's existing or potential competitors have considerably greater financial and other resources, have a higher rating assigned by independent rating organizations such as A.M. Best Company, have greater experience in the insurance industry and offer a broader line of insurance products than the Company. As of December 31, 2010, Crusader was licensed as an admitted insurance carrier in the states of Arizona, California, Nevada, Oregon, and Washington. Since 2004, all of Crusader’s business was written in the state of California. During the year ended December 31, 2010, 98% of Crusader’s business was commercial multi peril policies. In December of 2010, A.M. Best Company reaffirmed Crusader’s financial strength rating of A- (Excellent) and a rating outlook of “stable.” In addition, Crusader was assigned an Issuer Credit Rating of a- (Excellent).
A primary challenge of the property and casualty insurance company operation is contending with the fact that the Company sells its products before the ultimate costs are actually known. That is, when pricing its products, the Company must forecast the ultimate claim and loss adjustment costs. In addition, factors such as changes in regulations and legal environment, among other things, can all impact the accuracy of such costs.
The property and casualty insurance industry is characterized by periods of soft market conditions, in which premium rates are stable or falling and insurance is readily available, and by periods of hard market conditions, in which premium rates rise, coverage may be more difficult to find, and insurers’ profits increase. The Company believes that the California property and casualty insurance market continues to be a “soft market.” The Company cannot determine how long the existing market conditions will continue nor in which direction they might change. Despite the increased competition in the property and casualty marketplace, the Company believes that rate adequacy is more important than premium growth and that underwriting profit is its primary goal. Nonetheless, Crusader believes that it can grow its sales and profitability by continuing to focus upon three key areas of its operations: (1) product development, (2) improved service to retail brokers, and (3) appointment of captive and independent retail agents.
In June 2010, the Company completed its search for a new policy administration software system to replace its existing legacy system, and the Company signed related contracts on July 8, 2010. The Company has concerns about the basis for the vendor’s delay in the implementation of the system and about the new system’s expected functionality. The Company is working with the vendor to resolve the issues and to renegotiate the contracts. As of December 31, 2010, the Company had capitalized work-in-progress software in the amount of $1,500,162 of which $1,431,917 remained unpaid.
Crusader’s underwriting profit (before income taxes) is as follows:
| | | Year ended December 31 | |
| | | 2010 | | | 2009 | | | 2008 | |
| | | | | | | | | | |
| Net premium earned | | $ | 28,152,202 | | | $ | 30,774,471 | | | $ | 33,949,695 | |
| Less: | | | | | | | | | | | | |
| Losses and loss adjustment expenses | | | 18,470,115 | | | | 19,545,761 | | | | 20,592,730 | |
| Policy acquisition costs | | | 7,282,546 | | | | 7,612,716 | | | | 8,261,324 | |
| Total | | | 25,752,661 | | | | 27,158,477 | | | | 28,854,054 | |
| | | | | | | | | | | | | |
Underwriting profit (before income taxes) | | $ | 2,399,541 | | | $ | 3,615,994 | | | $ | 5,095,641 | |
The following table provides an analysis of the losses and loss adjustment expenses:
| | | Year ended December 31 | |
| | | 2010 | | | 2009 | | | 2008 | |
| Losses and loss adjustment expenses | | | | | | | | | |
| | | | | | | | | | |
| Current accident year | | $ | 23,038,294 | | | $ | 23,501,314 | | | $ | 24,149,531 | |
| Favorable development of all prior accident years | | | 4,568,179 | | | | 3,955,553 | | | | 3,556,801 | |
| | | | | | | | | | | | | |
| Total losses and loss adjustment expenses | | $ | 18,470,115 | | | $ | 19,545,761 | | | $ | 20,592,730 | |
Losses and loss adjustment expenses were 66% of net premium earned for the year ended December 31, 2010, compared to 64% of net premium earned for the year ended December 31, 2009, and compared to 61% of net premium earned for the year ended December 31, 2008.
Other Operations
The Company’s other operations generate commissions, fees, and finance charges from various insurance products. The events that have the most significant economic impact are as follows:
Unifax sells and services insurance policies for Crusader. The commissions paid by Crusader to Unifax are eliminated as intercompany transactions and are not reflected as income in the financial statements. Policy fee income for the 12 months ended December 31, 2010, decreased 6% as compared to the prior year. The decrease in policy fee income is a result of a decrease in the number of policies issued during the 12 months ended December 31, 2010, as compared to 2009.
There have been significant changes in the Company’s health insurance operation in 2010. In 2010, approximately 61% of the Company’s health insurance income was derived from the CIGNA medical and dental programs. This represents a decline from 76% in 2009 and 82% in 2008. In September 2009, CIGNA substantially reduced the medical plans offered to small group employers in the state of California from 19 plans down to 4 plans. Primarily as a result of CIGNA’s decision to reduce the number of plans offered, AIB decided to terminate its marketing and administrative agreement with CIGNA effective August 31, 2010. On September 1, 2010, AIB stopped marketing all CIGNA products. AAQHC, An Administrator, ceased administration of CIGNA dental plans effective November 1, 2010 and CIGNA medical plans effective December 1, 2010. AIB is assisting the AAQHC members in obtaining medical and dental coverage with other contracted carriers. These carriers are paying AIB commissions for these members. AIB has developed a new partnership with Guardian Life Insurance Company of America (GLIC). Effective October 1, 2010, AIB has been marketing GLIC’s dental and group life products to both brokers and the public. GLIC has created plans specifically for AIB.
The termination of the marketing and administrative agreement with CIGNA has resulted in a decrease in AIB commission income and AAQHC fee income. Commission income decreased approximately 24% for the year ended December 31, 2010, as compared to 2009.
AAQHC provides various consumer benefits to its members, including participation in group health care insurance policies. For these services, AAQHC receives membership and fee income from its members. Membership and fee income decreased 19% in the year ended December 31, 2010, compared to 2009. The decrease is primarily a result of the termination of the administrative agreement with CIGNA as discussed above.
The insurance premium financing operation currently finances policies written only through its sister company, Unifax. Effective July 20, 2010, AAC reduced the interest rate charged on premiums financed to 0% in an effort to increase the sales of existing renewal and new business written by Unifax for Crusader. Due to the low interest rate environment, the cost of money to provide this incentive is not material. The Company monitors the cost of providing this incentive, and depending on the cost/benefit determination, can continue to offer it or withdraw it at any time. Primarily due to the interest rate reduction, finance charges and fees earned by AAC in 2010 decreased 25% as compared to 2009. The average premium financed by AAC was $2,304 in 2010, $2,309 in 2009 and $2,653 in 2008.
The daily automobile rental insurance program is produced by Bedford Insurance Services, Inc. Bedford receives a commission from a non-affiliated insurance company based on premium written. Commission in the daily automobile rental insurance program decreased 9% as compared to 2009. The decrease in commission income is a result of a decrease in the number of policies issued and in-force during the 12 months ended December 31, 2010, as compared to 2009.
Investments and Liquidity
The Company generates revenue from its investment portfolio, which consisted of approximately $129.8 million (at amortized cost) as of December 31, 2010, and $137.6 million (at amortized cost) as of December 31, 2009. Investment income for the 12 months ended December 31, 2010, decreased $833,543 (19%) as compared to the 12 months ended December 31, 2009. The decrease in investment income was primarily due to a decrease in the Company’s annualized yield on average invested assets to 2.6% in 2010 from 3.1% in 2009. The decrease in the annualized yield on average invested assets is a result of lower yields in the marketplace on both new and reinvested assets. Due to the current interest rate and financial market environment, management believes it is prudent to purchase fixed maturity investments with maturities of 5 years or less and with minimal credit risk.
As of December 31, 2010, the weighted average maturity of the Company’s fixed maturity investments was 1.3 years compared to 1.7 years and 2.1 years as of December 31, 2009, and December 31, 2008, respectively.
Liquidity and Capital Resources
Due to the nature of the Company's business (insurance and insurance services) and whereas Company growth does not normally require material reinvestments of profits into property or equipment, the cash flow generated from operations usually results in improved liquidity for the Company. Because the Company is a holding company and operates through its subsidiaries, its cash flow is dependent upon the earnings of its subsidiaries and the distributions of those earnings to the Company.
The increase in net cash used by operating activities for each of the years ended December 31, 2010, 2009 and 2008 was primarily due to declining written premium and declining commission and fee income. The decrease in written premium is primarily due to the competitive insurance marketplace. The Company believes that rate adequacy is more important than premium growth and that underwriting profit is its primary goal. The increase in net cash used from operating activities was also attributable to decreased investment income resulting from the lower yields in the marketplace on both new and reinvested assets. In addition, cash flows can change from period to period depending largely on the amount and the timing of claims payments. The variability of the Company’s losses and loss adjustment expenses is primarily due to its small population of claims which may result in greater fluctuations in claim frequency and/or severity. As of December 31, 2010, the Company had only 584 open claims. Although the consolidated statements of cash flows continue to reflect net cash used by operating activities, the Company continues to be profitable, well capitalized, and adequately reserved; and it does not anticipate future liquidity problems. As of December 31, 2010, all of the Company’s investments are in U.S. treasury securities, FDIC insured certificates of deposit and money market funds which are readily marketable. The weighted average maturity of the Company’s investments is approximately 1.3 years.
The most significant liquidity risk faced by the Company is adverse development of the insurance company’s loss and loss adjustment expense reserves. Based on the Company’s current loss and loss expense reserves and expected current and future payments, the Company believes that there are no current liquidity issues. However, no assurance can be given that the Company’s estimate of ultimate loss and loss adjustment expense reserves will be sufficient.
Crusader generates a significant amount of cash as a result of its holdings of unearned premium reserves, its reserves for loss payments, and its capital and surplus. Crusader's loss and loss adjustment expense payments are the most significant cash flow requirement of the Company. These payments are continually monitored and projected to ensure that the Company has the liquidity to cover these payments without the need to liquidate its investments. Cash and investments (at amortized cost) of the Company at December 31, 2010, were $129,812,139 compared to $137,717,039 at December 31, 2009. Crusader's cash and investments at December 31, 2010, and December 31, 2009, were 98% of the total cash and investments held by the Company.
The Company's investments are as follows:
| | | December 31, 2010 | | | December 31, 2009 | |
| | | Amount | | | % | | | Amount | | | % | |
| | | | | | | | | | | | | |
| Fixed maturities (at amortized cost) | | | | | | | | | | | | |
| Certificates of deposit | | $ | 27,464,998 | | | | 22 | | | $ | 21,034,997 | | | | 16 | |
| U.S. treasury securities | | | 95,836,282 | | | | 78 | | | | 103,361,652 | | | | 81 | |
| Industrial and miscellaneous (taxable) | | | - | | | | - | | | | 4,044,046 | | | | 3 | |
| Total fixed maturity investments | | | 123,301,280 | | | | 100 | | | | 128,440,695 | | | | 100 | |
| | | | | | | | | | | | | | | | | |
| Short-term cash investments (at cost) | | | | | | | | | | | | | | | | |
| Certificates of deposit | | | 450,000 | | | | 7 | | | | 3,245,000 | | | | 35 | |
| Bank money market accounts | | | 1,494,033 | | | | 23 | | | | 3,348,973 | | | | 37 | |
| U.S. government money market fund | | | 121,751 | | | | 2 | | | | 2,562,100 | | | | 28 | |
| Short-term U.S. treasury bills | | | 4,398,003 | | | | 68 | | | | - | | | | - | |
| Bank savings accounts | | | 1,861 | | | | - | | | | 1,759 | | | | - | |
| Total short-term cash investments | | | 6,465,649 | | | | 100 | | | | 9,157,832 | | | | 100 | |
| | | | | | | | | | | | | | | | | |
| Total investments | | $ | 129,766,929 | | | | | | | $ | 137,598,527 | | | | | |
The Company is required to classify its investment securities into one of three categories: held-to-maturity, available-for-sale, or trading securities. Although all of the Company's investment in fixed maturity securities are classified as available-for-sale and while the Company may sell investment securities from time to time in response to economic and market conditions, its investment guidelines place primary emphasis on buying and holding high-quality investments to maturity.
The Company’s investment guidelines on equity securities limit investments in equity securities to an aggregate maximum of $2,000,000. The Company’s investment guidelines on fixed maturities limit those investments to high-grade obligations with a maximum term of 8 years. The maximum investment authorized in any one issuer is $2,000,000. This dollar limitation excludes bond premiums paid in excess of par value and U.S. government or U.S. government guaranteed issues. When the Company invests in fixed maturity municipal securities, preference is given to issues that are pre-refunded and secured by U.S. treasury securities. The short-term investments are either U.S. government obligations, FDIC insured, or are in an institution with a Moody's rating of P2 and/or a Standard & Poor's rating of A1. All of the Company's fixed maturity investment securities are rated, readily marketable, and could be liquidated without any materially adverse financial impact.
The investment marketplace in general, and in certain asset classes specifically, has been impacted by volatility as a result of uncertainty in the credit markets that began in 2007 and continued throughout 2010. The Company’s fixed maturity (amortized cost) investment portfolio as of December 31, 2010, consisted of 78% U.S. treasury securities and 22% certificates of deposit.
Crusader's statutory capital and surplus as of December 31, 2010, was $62,520,958, a decrease of $32,855 (less than 1%) from December 31, 2009. Crusader's statutory capital and surplus as of December 31, 2009, was $62,553,813, a decrease of $2,182,417 (3%) from December 31, 2008. In the years ending December 31, 2010 and 2009, Crusader issued cash dividends of $4,250,000 and $7,000,000, respectively, to Unico, its parent and sole shareholder. These dividends were primarily used to fund the cash dividends paid by Unico to its shareholders, to repurchase and retire shares of Unico common stock and for general corporate purposes. No dividends were declared or paid by Crusader to Unico in 2008. Based on Crusader’s statutory surplus for the year ended December 31, 2010, the maximum dividend that could be made by Crusader to Unico without prior regulatory approval in 2011 is $6,252,096.
On December 7, 2010, the Board of Directors declared a cash dividend of $0.36 per common share payable on December 29, 2010, to shareholders of record on December 21, 2010. Declaration of future cash dividends will be subject to the Company’s profitability and its cash requirements.
On December 19, 2008, the Board of Directors authorized a stock repurchase program to acquire from time to time up to an aggregate of 500,000 shares of the Company’s common stock. This program has no expiration date and may be terminated by the Board of Directors at any time. During the year ended December 31, 2010, the Company did not repurchase any stock under this program. As of December 31, 2010, the Company had remaining authority under the 2008 program to repurchase up to an aggregate of 247,356 shares of its common stock. The 2008 program is the only program under which there is remaining authority to repurchase shares of the Company’s common stock. The Company has retired all stock repurchased.
Although material capital expenditures may also be funded through borrowings, the Company believes that its cash and short-term investments at year end, net of statutory deposits of $700,000, and California insurance company statutory dividend restrictions applicable to Crusader plus the cash to be generated from operations, should be sufficient to meet its operating requirements during the next 12 months without the necessity of borrowing funds. There were no trust restrictions on cash and short-term investments at December 31, 2010.
As a California insurance company, Crusader is obligated to pay a premium tax on gross premiums written in all states that Crusader is admitted. Premium taxes are deferred and amortized as the related premiums are earned. The premium tax is in lieu of state franchise taxes and is not included in the provision for state taxes.
The Company has certain obligations to make future payments under contracts and credit-related financial instruments and commitments. At December 31, 2010, certain long-term aggregate contractual obligations and credit-related commitments are summarized as follows:
| Contractual Obligations | | Total | | | Within 1 Year | | | 1-3 Years | | | 3-5 Years | | | After 5 years | |
| | | | | | | | | | | | | | | | |
| Building lease | | $ | 1,333,737 | | | $ | 1,066,990 | | | $ | 266,747 | | | | - | | | | - | |
| Loss and loss adjustment expense reserves* | | | 61,559,695 | | | | 20,431,459 | | | | 25,943,965 | | | $ | 9,492,376 | | | $ | 5,691,895 | |
| Total | | $ | 62,893,432 | | | $ | 21,498,449 | | | $ | 26,210,712 | | | $ | 9,492,376 | | | $ | 5,691,895 | |
| * Unlike many other forms of contractual obligations, loss and loss adjustment expense reserves do not have definitive due dates and the ultimate payment dates are subject to a number of variables and uncertainties. As a result, the total loss and loss adjustment expense reserve payments to be made by period, as shown above, are estimates. |
Results of Operations
General
Total revenue for the year ended December 31, 2010, was $37,120,751, $41,617,106 for the year ended December 31, 2009, and $46,769,444 for the year ended December 31, 2008. This represents a decrease of $4,496,355 (11%) for the 2010 year compared to the 2009 year and $5,152,338 (11%) for the 2009 year compared to the 2008 year. The Company had net income of $2,329,152 for the year ended December 31, 2010, $2,927,375, for the year ended December 31, 2009, and $5,283,016 for the year ended December 31, 2008. This represents a decrease of $598,223 (20%) for the 2010 year compared to the 2009 year, and a decrease of $2,355,641 (45%) for the 2009 year compared to the 2008 year.
For the year ended December 31, 2010, the Company had income before taxes of $3,220,581 compared to income before taxes of $4,163,978 for the year ended December 31, 2009, a decrease of $943,397 (23%) in income before taxes. The decrease in income before taxes was primarily due to a decrease of $1,216,453 in the underwriting profit, a decrease of $833,543 in investment income and a decrease in other insurance revenues of $893,987, which were partially offset by a reduction in operating expenses of $2,147,142.
For the year ended December 31, 2009, the Company had income before taxes of $4,163,978 compared to income before taxes of $7,984,466 for the year ended December 31, 2008, a decrease of $3,820,488 (48%) in income before taxes. The decrease in income before taxes was primarily due to a decrease of $1,479,647 in the underwriting profit, and a decrease of $1,564,265 in investment income.
The effect of inflation on the net income of the Company during the years ended December 31, 2010, 2009, and 2008 was not significant.
The Company derives revenue from various sources as discussed below:
Insurance Company Operation
Premium and loss information of Crusader are as follows:
| | | Year ended December 31 | | | Year ended December 31 | |
| | | 2008 | | | 2007 | | | 2006 | | | 2010 | | | 2009 | | | 2008 | |
| �� | | | | | | | | | | |
| | | | | | | | | | | |
| Gross written premium | | $ | 39,940,270 | | | $ | 44,970,399 | | | $ | 51,913,967 | | | $ | 32,697,971 | | | $ | 38,900,176 | | | $ | 39,940,270 | |
| Net written premium (net of reinsurance ceded) | | $ | 31,175,204 | | | $ | 33,412,745 | | | $ | 38,166,864 | | | $ | 25,270,320 | | | $ | 29,635,898 | | | $ | 31,175,204 | |
| Earned premium before reinsurance ceded | | $ | 42,720,764 | | | $ | 48,661,973 | | | $ | 56,692,213 | | | $ | 35,579,438 | | | $ | 40,050,878 | | | $ | 42,720,764 | |
| Earned premium (net of reinsurance ceded) | | $ | 33,949,695 | | | $ | 37,129,665 | | | $ | 42,933,789 | | | $ | 28,152,202 | | | $ | 30,774,471 | | | $ | 33,949,695 | |
| Losses and loss adjustment expenses | | $ | 20,592,730 | | | $ | 22,182,237 | | | $ | 17,826,979 | | | $ | 18,470,115 | | | $ | 19,545,761 | | | $ | 20,592,730 | |
| Gross unpaid losses and loss adjustment expenses | | $ | 78,654,590 | | | $ | 94,730,711 | | | $ | 93,596,117 | | | $ | 61,559,695 | | | $ | 71,585,408 | | | $ | 78,654,590 | |
| Net unpaid losses and loss adjustment expenses | | $ | 58,839,017 | | | $ | 66,305,287 | | | $ | 70,076,430 | | | $ | 49,743,381 | | | $ | 55,409,545 | | | $ | 58,839,017 | |
Crusader’s primary line of business is commercial multiplemulti peril policies. This line of business represented approximately 98% of Crusader’s total written premium for the yearyears ended December 31, 2008, 96% for the year ended December 31, 2007,2010, 2009, and 97% for the year ended December 31, 2006.2008.
As of December 31, 2008,2010, Crusader was licensed as an admitted insurance company in the states of Arizona, California, Nevada, Oregon, and Washington and is approved as a non-admitted surplus lines writer in other states.
Premiums
Premium written (before reinsurance) is a non-GAAP financial measure which is defined, under statutory accounting, as the contractually determined amount charged by the company to the policyholder for the effective period of the contract based on the expectation of risk, policy benefits, and expenses associated with the coverage provided by the terms of the policies. Premiums written is a required statutory measure designed to determine written premium production levels. Premium earned, the most directly comparable GAAP measure, represents the portion of premiums written that is recognized as income in the financial statements for the period presented and earned on a pro-rata basis over the terms of the policies. For the year ended December 31, 2008,2010, gross written premium decreased by $5,030,129 (11%as reported on the Company’s statutory statement was $32,697,971 compared to $38,900,176, for the year ended December 31, 2009, a decrease of $6,202,205 (16%) over 2007.. For the year ended December 31, 2007,2009, gross written premium decreased by $6,943,568 (13%was $38,900,176 compared to $39,940,270 for the year ended December 31, 2008, a decrease of $1,040,094 (3%) over 2006.. The decrease in written premium in both 20082010 and 20072009 reflected heightened competition, weak economic growth and management’s continued emphasis on rate adequacy and underwriting discipline. In addition to the increased competition in the market place and the effects of the slow economic recovery in California, the Company took corrective action in 2010 on two of its problematic programs that were contributing higher than expected losses. This action resulted in reducing the number of brokers authorized to write that particular program from 85 to 15. These two programs accounted for approximately 32% of the $6,202,205 decrease in written premium before reinsurance in the current year. This action reinforces the Company’s belief that rate adequacy is more important than premium growth and that underwriting profit is its primary goal.
The insurance marketplace continues to be intensely competitive as more insurers are competing for the same customers. The Company believes that California’s commercial property and casualty marketplace continues to be in a “soft market.” The Company cannot determine how long the existing market condition will continue, nor in which direction it might change.
The insurance marketplace continues While Crusader attempts to be intenselymeet such competition with competitive asprices, its emphasis is on service, promotion, and distribution. Crusader believes that rate adequacy is more insurers are competing for the same customers. Many of Crusader’s competitors price their insurance at ratesimportant than premium growth and that the Company believes are inadequate to support any profit.underwriting profit is its primary goal. Nonetheless, Crusader believes that it can grow its sales and profitability by continuing to focus upon three key areas of its operations: (1) product development, (2) improved service to retail brokers, and (3) appointment of captive and independent retail agents. During 2008,2010, Crusader begancontinued to introduce many product changes such as to its rates, eligibility guidelines, rules and coverage forms. Improved service to retail brokers is primarily focused upon transacting business through the internet, as well as providing more options to make the agents’ and brokers’ time more efficiently spent with usCrusader (i.e., as opposed to spending time with ourCrusader’s competitors). In October 2008, the Company hired a marketing manager, bringing the total number of employees dedicated exclusively to marketing to three. Those representatives are charged with the responsibility of identifying product development opportunities, promoting the Company and its products to the insurance brokerage community, and with the duty to appoint retail agents so as to introduce the Crusader brand at the consumer’s level of distribution (i.e., retail). Crusader appointed twelve retail agents asAs of December 31, 2008, and plans to have approximately twenty-four by the end of year 2009.2010, Crusader had appointed 16 retail agents. Presently, it is expected that each such retail agent should be able to reach an annual sales volume of approximately one to two million dollars of Crusader’s products within three to five years of their appointment by Crusader. However, Crusader does not intend to substantially increase its number of retail agents appointed until the Company.Company implements a new policy administration software system.
The Company writes annual policies and, therefore, earns written premium daily over the one-year policy term. Premium earned before reinsurance decreased $5,941,209 (12%) in
In the year ended December 31, 2008,2010, premium earned before reinsurance decreased $4,471,440 (11%) to $35,579,438 compared to $40,050,878 for the year ended December 31, 2007, and decreased $8,030,240 (14%) in2009. In the year ended December 31, 2007,2009, premium earned before reinsurance decreased $2,669,886 (6%) to $40,050,878 compared to $42,720,764 for the year ended December 31, 2006.2008. The decrease in earned premium before reinsurance in both 20082010 and 20072009 is a direct result of the decrease in written premium in 20082010 and 2007,2009, respectively.
Earned ceded premium for the 12 months ended December 31, 2008,2010, decreased $2,761,239 (24%$1,849,172 (20%) to $8,771,069$7,427,236 compared to $11,532,308$9,276,407 for the 12 months ended December 31, 2007.2009. Earned ceded premium for the 12 months ended December 31, 2007, decreased $2,226,116 (16%2009, increased $505,338 (6%) to $11,532,308$9,276,407 compared to $13,758,424$8,771,069 for the 12 months ended December 31, 2006.2008. Earned ceded premiums as a percentage of direct earned premiums were 21% in 2008,2010, 23% in 2009, and 24%21% for 2007 and 2006, respectively.
The Company evaluates each of its ceded reinsurance contracts at its inception to determine if there is a sufficient risk transfer to allow the contract to be accounted for as reinsurance under current accounting literature. As of December 31, 2008,2010, all such ceded contracts are accounted for as risk transfer reinsurance. The earned premium ceded consists of both premium ceded under the Company’s current reinsurance contracts and premium ceded to the Company’s provisionally rated reinsurance contracts.
In 2010, 2009 and 2008 Crusader retained a participation in its excess of loss reinsurance treaties of 20% in its 1st1st layer ($700,000 in excess of $300,000), 15% in its 2nd2nd layer ($1,000,000 in excess of $1,000,000), and 0% in its property and casualty clash treaty. In 2007 Crusader retained a participation in its excess of loss reinsurance treaties of 15% in its 1st 1st layer ($700,000 in excess of $300,000), 15% in its 2nd2nd layer ($1,000,000 in excess of $1,000,000), and 15% in its property clash treaty. In 2006 and 2005 Crusader retained a participation in its excess of loss reinsurance treaties of 10% in its 1st1st layer ($700,000 in excess of $300,000), 10% in its 2nd2nd layer ($1,000,000 in excess of $1,000,000), and 30% in its property and casualty clash treaties.treaty. In 2004 Crusader retained a participation in its excess of loss reinsurance treaties of 10% in its 1st1st layer ($750,000 in excess of $250,000), 10% in its 2nd2nd layer ($1,000,000 in excess of $1,000,000), and 30% in its property and casualty clash treaties.treaty. In 2003 Crusader retained a participation in its excess of loss reinsurance treaties of 5% in its 1st1st layer ($750,000 in excess of $250,000), 10% in its 2nd 2nd layer ($1,000,000 in excess of $1,000,000), and 30% in its property and casualty clash treaties.treaty.
The 2008 and 2007 through 2010 excess of loss treaties do not provide for a contingent commission. Crusader’s 2006 1st layer primary excess of loss treaty provides for a contingent commission equal to 20% of the net profit, if any, accruing to the reinsurer. The first accounting period for the contingent commission coverscovered the period from January 1, 2006, through December 31, 2006. The 2005 excess of loss treaties do not provide for a contingent commission. Crusader’s 2004 and 2003 1st1st layer primary excess of loss treaties provide for a contingent commission to the Company equal to 45% of the net profit, if any, accruing to the reinsurer. The first accounting period for the contingent commission covers the period from January 1, 2003, through December 31, 2004. For each accounting period as described above, the Company will calculate and report to the reinsurers its net profit (excluding incurred but not reported losses), if any, within 90 days after 36 months following the end of the first accounting period, and within 90 days after the end of each 12 month12-month period thereafter until all losses subject to the agreement have been finally settled. Any contingent commission payment received is subject to return based on future development of ceded losses and loss adjustment expenses. In March 2007, the Company received an advance of $1 million from its reinsurer and in February 2008, the Company received an additional $2,419,940 to be applied against future contingent commission earned, if any. Based on the Company’s ceded losses and loss adjustment expenses (including ceded incurred but not reported losses) asAs of December 31, 2008,2010, the Company recorded $2,500,211has received a total net contingent commission of these$3,668,199 for the years subject to contingent commission. Of this amount, the Company has recognized $2,323,858 of contingent commission income, of which $637,477 was recognized in the year ended December 31, 2010. The remaining balance of the net payments as an advance from its reinsurerreceived of $1,344,341 is currently unearned and it is included in “Accrued Expenses and Other Liabilities” in the consolidated balance sheets. Thus, the Company recognized $919,729 ofThe unearned contingent commission may be subsequently earned or returned to the reinsurer depending on the future development of which $666,174 was recognized in the year ended December 31, 2008, and $253,555 was recognized inceded IBNR for the year ended December 31, 2007.years subject to contingent commission.
Crusader’s direct, ceded and net earned premium earned ceded premium, and ceding commission are as follows:
| | | Year ended December 31 | | | Year ended December 31 | |
| | | 2008 | | | 2007 | | | 2006 | | | 2010 | | | 2009 | | | 2008 | |
| | | | | | | | | | | | | | | | | | | |
| Direct earned premium | | $ | 42,720,764 | | | $ | 48,661,973 | | | $ | 56,692,213 | | | $ | 35,579,438 | | | $ | 40,050,878 | | | $ | 42,720,764 | |
| | | | | | | | | | | | | | | | | | | | | | | | | |
| Earned ceded premium | | | | | | | | | | | | | | | | | | | | | | | | |
| Excluding provisionally rated ceded premium | | 8,850,878 | | | 11,560,877 | | | 13,825,061 | | | | 7,427,236 | | | | 9,284,534 | | | | 8,850,878 | |
| Provisionally rated ceded premium | | | (79,809 | ) | | | (28,569 | ) | | | (66,637 | ) | | | - | | | | (8,127 | ) | | | (79,809 | ) |
| Total earned ceded premium | | 8,771,069 | | | 11,532,308 | | | 13,758,424 | | | | 7,427,236 | | | | 9,276,407 | | | | 8,771,069 | |
| Ceding commission | | | 2,642,665 | | | | 3,547,595 | | | | 4,376,474 | | |
| Earned ceded premium, net of ceding commission | | $ | 6,128,404 | | | $ | 7,984,713 | | | $ | 9,381,950 | | |
| | | | | | | | | | | | | | | | | | | | | | | | | |
| Ratios to direct earned premium | | | | | | | | | | | | | |
| Direct ceded premium | | | 21 | % | | | 24 | % | | | 24 | % | |
| Earned ceded premium, net of ceding commission | | | 14 | % | | | 16 | % | | | 17 | % | |
| Net earned premium | | | $ | 28,152,202 | | | $ | 30,774,471 | | | $ | 33,949,695 | |
| | | | | | | | | | | | | | |
| Ratios of earned ceded premium to direct earned premium | | | | 21 | % | | | 23 | % | | | 21 | % |
The changes in the ratio of earned ceded premium to direct earned premium is primarily due to changes in ceded reinsurance rates charged by reinsurers and changes in the level of Crusader’s participation.
Losses and Loss Adjustment Expenses
Losses and loss adjustment expenses and loss ratio are as follows:
| | | Year Ended December 31 | | | Year ended December 31 | |
| | | 2008 | | | 2007 | | | 2006 | | | 2010 | | | 2009 | | | 2008 | |
| | | | | | | | | | | | | | | | | | | |
| Net earned premium | | $ | 33,949,695 | | | $ | 37,129,665 | | | $ | 42,933,789 | | | $ | 28,152,202 | | | $ | 30,774,471 | | | $ | 33,949,695 | |
| | | | | | | | | | | | | | | | | | | | | | | | | |
| Net losses and loss adjustment expenses | | | | | | | | | | | | | | | | | | | | | | | | |
| Provision for insured events of current year | | 24,149,531 | | | 26,300,338 | | | 29,997,662 | | | | 23,038,294 | | | | 23,501,314 | | | | 24,149,531 | |
| (Decrease) in provision for events of prior years | | | (3,556,801 | ) | | | (4,118,101 | ) | | | (12,170,683 | ) | |
| Decrease in provision for events of prior years | | | | 4,568,179 | | | | 3,955,553 | | | | 3,556,801 | |
| Total net losses and loss adjustment expenses | | $ | 20,592,730 | | | $ | 22,182,237 | | | $ | 17,826,979 | | | $ | 18,470,115 | | | $ | 19,545,761 | | | $ | 20,592,730 | |
| | | | | | | | | | | | | | | | | | | | | | | | | |
| Loss ratio | | 60.7 | % | | 59.7 | % | | 41.5 | % | | | 65.6 | % | | | 63.5 | % | | | 60.7 | % |
Expected losses and loss adjustment expenses are determined based on earned premiums. The portion of the premium dollar expected to pay claims costs is referred to as the expected loss and loss adjustment expense ratio. Accident years 2006 through 2008 had substantially the same expected loss and loss adjustment expense ratio. The Company’s emerging loss and loss adjustment expense ratios for each accident year are reviewed in detail at the end of each quarter as part of the reserve diagnostics testing.
The combined ratio is the sum of (1) the net ratio of losses and loss adjustment expenses incurred (including a provision for incurred-but-not-reported losses “IBNR”) to net premiums earned (loss ratio) and (2) the ratio of policy acquisition costs to net premiums earned (expense ratio). The following table shows the loss ratios, expense ratios, and combined ratios of Crusader as derived from data prepared in accordance with GAAP.
| | | Year ended December 31 | | | Year ended December 31 | |
| | | 2008 | | | 2007 | | | 2006 | | | 2010 | | | 2009 | | | 2008 | |
| | | | | | | | | | | | | | | | | | | |
| Loss ratio | | | 60.7 | % | | | 59.7 | % | | | 41.5 | % | | | 65.6 | % | | | 63.5 | % | | | 60.7 | % |
| Expense ratio | | | 24.3 | % | | | 22.8 | % | | | 21.5 | % | | | 25.9 | % | | | 24.7 | % | | | 24.3 | % |
| Combined ratio | | | 85.0 | % | | | 82.5 | % | | | 63.0 | % | | | 91.5 | % | | | 88.2 | % | | | 85.0 | % |
As indicated in the above table, the loss ratio for the year ended December 31, 2008,2010, increased to 65.6% from 63.5% in 2009 and 60.7% from 59.7% in 2007 and 41.5% in 2006.2008. The slight increase in the 20082010 loss ratio was primarily due to a slight decreasean increase in the amountprovision for insured events of favorable developmentthe current year as a percent of prior years’net earned premium. The increase in current accident year losses recognizedwas primarily a result of problems with one of the Company’s new programs. The Company’s sales in 2008that program, which include both property and liability coverages, began in July 2008. The Company took immediate corrective action on that program which included non renewal of a substantial number of policies written in that program and is reflected in the reduction of written premium in 2010. The Company took further action in the third quarter of 2010 by reducing the number of brokers authorized to write that particular program from 85 to 15. The Company will non-renew the annual polices written by the brokers that are no longer authorized to write that program. These actions are expected to ultimately improve the Company’s loss ratio for that program. For the year ended December 31, 2010, the provision for insured events of the current year as a percent of net earned premium was 82% as compared to 2007. During76% for the year ended December 31, 2009, and 71% for the year ended December 31, 2008, respectively. The Company’s net losses and loss adjustment expenses for the Company recognized $3,556,801 of favorable development of prior years’ losses as compared to $4,118,101 of favorable developments of prior years’ losses recognized during 2007.calendar years ended December 31, 2010, December 31, 2009 and December 31, 2008, were $18,470,115, $19,545,761 and $20,592,730, respectively. Generally, if the combined ratio is below 100%, an insurance company has an underwriting profit; if it is above 100%, a company has an underwriting loss.
The Company’s net losses and loss adjustment expenses for the calendar year ended December 31, 2008, were $20,592,730. This amount is comprised of accident year 2008 net losses and loss adjustment expenses of $24,149,531 less favorable development of prior accident years of $3,556,801. The Company’s net losses and loss adjustment expenses for the calendar year ended December 31, 2007, were $22,182,237. This amount is comprised of accident year 2007 net losses and loss adjustment expenses of $26,300,338 less favorable development of prior accident years of $4,118,101. The Company’s net losses and loss adjustment expenses for the calendar year ended December 31, 2006, were $17,826,979. This amount is comprised of accident year 2006 net losses and loss adjustment expenses of $29,997,662 less favorable development of prior accident years of $12,170,683.
The favorable (adverse) development by accident year is as follows:
| | | | Years ended | |
| | | Year ended December 31, 2008 | | | Year ended December 31, 2007 | | | Year ended December 31, 2006 | | | December 31, 2010 | | | December 31, 2009 | | | December 31, 2008 | |
| | | | | | | | | | | | | | | | | | | | | | | | | | | | | | | | | | | | | |
Accident Year | | Favorable (Adverse) Development | | | % of Total | | | Favorable (Adverse) Development | | | % of Total | | | Favorable Development | | | % of Total | | | Favorable (Adverse) Development | | | % of Total | | | Favorable (Adverse) Development | | | % of Total | | | Favorable (Adverse) Development | | | % of Total | |
| | | | | | | | | | | | | | | | | | | | | | | | | | | | | | | | | | | | | |
| Prior to 2001 | | $ | 1,409,873 | | | | 40 | % | | $ | (782,496 | ) | | | (19 | )% | | $ | 701,989 | | | | 6 | % | | $ | 837,966 | | | | 18 | % | | $ | 685,267 | | | | 17 | % | | $ | 1,409,873 | | | | 40 | % |
| 2001 | | | 228,157 | | | | 6 | % | | | 394,667 | | | | 10 | % | | | 754,141 | | | | 6 | % | | | 418,973 | | | | 9 | % | | | 197,729 | | | | 5 | % | | | 228,157 | | | | 6 | % |
| 2002 | | | (219,217 | ) | | | (6 | )% | | | 495,521 | | | | 12 | % | | | 819,572 | | | | 7 | % | | | (126,697 | ) | | | (3 | )% | | | (635,022 | ) | | | (16 | )% | | | (219,217 | ) | | | (6 | )% |
| 2003 | | | 106,459 | | | | 3 | % | | | 1,121,647 | | | | 27 | % | | | 1,744,350 | | | | 14 | % | | | 411,528 | | | | 9 | % | | | 264,402 | | | | 7 | % | | | 106,459 | | | | 3 | % |
| 2004 | | | 896,422 | | | | 25 | % | | | 792,070 | | | | 19 | % | | | 7,524,447 | | | | 62 | % | | | 768,768 | | | | 17 | % | | | 485,456 | | | | 12 | % | | | 896,422 | | | | 25 | % |
| 2005 | | | 730,534 | | | | 21 | % | | | 1,202,580 | | | | 29 | % | | | 626,184 | | | | 5 | % | | | 530,382 | | | | 12 | % | | | 1,308,662 | | | | 33 | % | | | 730,534 | | | | 21 | % |
| 2006 | | | 1,670,003 | | | | 47 | % | | | 894,112 | | | | 22 | % | | | - | | | - | | | | 92,755 | | | | 2 | % | | | 1,839,987 | | | | 47 | % | | | 1,670,003 | | | | 47 | % |
| 2007 | | | (1,265,430 | ) | | | (36 | )% | | | - | | | | - | | | | - | | | | - | | | | 38,478 | | | | 1 | % | | | (918,334 | ) | | | (23 | )% | | | (1,265,430 | ) | | | (36 | )% |
| 2008 | | | | 867,073 | | | | 19 | % | | | 727,406 | | | | 18 | % | | | - | | | | - | |
| 2009 | | | | 728,953 | | | | 16 | % | | | - | | | | - | | | | - | | | | - | |
| Total prior accident years | | $ | 3,556,801 | | | | 100 | % | | $ | 4,118,101 | | | | 100 | % | | $ | 12,170,683 | | | | 100 | % | | $ | 4,568,179 | | | | 100 | % | | $ | 3,955,553 | | | | 100 | % | | $ | 3,556,801 | | | | 100 | % |
As reflected in the above table, the amount of favorable development recognized during the year ended December 31, 2008, decreased $561,300 (14%2010, increased $612,626 (15%) to $3,556,801$4,568,179 from $4,118,101$3,955,553 in 2007.2009. The amount of favorable development recognized during the year ended December 31, 2007, decreased $8,052,582 (66%2009, increased $398,752 (11%) to $4,118,101$3,955,553 from $12,170,683$3,556,801 in 2006 primarily from the accident year 2004.
2008. The favorable development in the above table is not necessarily indicative of the results that may be expected in future periods.
Any reduction in losses and loss adjustment expenses from redundancies in the Company’s December 31, 2008,2010, reserves over actual future payments, and/or any additional losses and loss adjustment expenses from actual future payments that exceed the Company’s reserves, will be recognized in the consolidated statements of operations of future accounting periods. The Company’s current expected loss and loss adjustment expense ratio assumption closely approximates the Company’s historical average loss and loss adjustment expense ratio. AThe difference between the Company’s current expected loss and loss adjustment expense ratio assumption and the actual loss and loss adjustment expense ratio for a given accident year will ultimately result in a dollar change (either higher or lower) that is a multiple of the earned premium for that year. The actual loss and loss adjustment expense ratio has been within five percentage points of the current expected loss and loss adjustment expense ratio in four5 of the Company’s twenty-four26 years. Since the Company’s net earned premium in 20082010 was $33,949,695,$28,152,202, a difference between the accident year 20082010 actual and current expected loss and loss adjustment expense ratios of only five percentage points will ultimately impact losses and loss adjustment expenses by $1,697,485.$1,407,610. The actual loss and loss adjustment expense ratio has been within ten percentage points of the current expected loss and loss adjustment expense ratio in nine10 of the Company’s twenty-four26 years. A difference of ten percentage points on accident year 20082010 will ultimately impact losses and loss adjustment expenses by $3,394,970.$2,815,220. The actual loss and loss adjustment expense ratio has been within twenty percentage points of the current expected loss and loss adjustment expense ratio in seventeen19 of the Company’s twenty-four26 years. A twenty percentage point difference between the accident year 20082010 actual and the current expected loss and loss adjustment expense ratios will ultimately impact losses and loss adjustment expenses by $6,789,939.$5,630,440. In addition, accident years 20082009 and prior are also still developing. Future development on those years might either offset or add to any future development that emerges on accident year 2008.2010.
Reserves for Losses and Loss Adjustment Expenses
The Company's liability for unpaid loss and loss adjustment expense (reserves)reserves consists of case reserves and reserves for incurred but not reported (IBNR) claims. Case reserves are established by claims personnel based on a review of the facts known at the time the claim is reported and are subsequently revised as more information about a claim becomes known. IBNR is computed using various actuarial methods and techniques and includes (1) reserves for losses and loss adjustment expenses on claims that have occurred but for which claims have not yet been reported to the Company, and (2) a provision for expected future development on case reserves for information not currently known.
The Company’s loss and loss adjustment expense reserves are as follows:
| | | Year ended December 31 | | | Year ended December 31 | |
| | | 2008 | | | 2007 | | | 2006 | | | 2010 | | | 2009 | | | 2008 | |
| | | | | | | | | | | | | | | | | | | |
| Direct reserves | | | | | | | | | | | | | | | | | | |
| Case reserves | | $ | 18,720,695 | | | $ | 26,129,055 | | | $ | 21,796,117 | | | $ | 15,773,554 | | | $ | 18,072,709 | | | $ | 18,720,695 | |
| IBNR reserves | | | 59,933,895 | | | | 68,601,656 | | | | 71,800,000 | | | | 45,786,141 | | | | 53,512,699 | | | | 59,933,895 | |
| Total direct reserves | | $ | 78,654,590 | | | $ | 94,730,711 | | | $ | 93,596,117 | | | $ | 61,559,695 | | | $ | 71,585,408 | | | $ | 78,654,590 | |
| | | | | | | | | | | | | | | | | | | | | | | | | |
| Reserves net of reinsurance | | | | | | | | | | | | | | | | | | | | | | | | |
| Case reserves | | $ | 17,365,877 | | | $ | 21,450,234 | | | $ | 18,776,430 | | | $ | 13,461,606 | | | $ | 16,231,563 | | | $ | 17,365,877 | |
| IBNR reserves | | | 41,473,140 | | | | 44,855,053 | | | | 51,300,000 | | | | 36,281,775 | | | | 39,177,982 | | | | 41,473,140 | |
| Total net reserves | | $ | 58,839,017 | | | $ | 66,305,287 | | | $ | 70,076,430 | | | $ | 49,743,381 | | | $ | 55,409,545 | | | $ | 58,839,017 | |
Reserves for losses and loss adjustment expenses before reinsurance for each of Crusader’s lines of business were as follows:
| | | Year ended December 31 | | | Year ended December 31 | |
| Line of Business | | 2008 | | | 2007 | | | 2006 | | | 2010 | | | 2009 | | | 2008 | |
| | | | | | | | | | | | | | | | | | | | | | | | | | | | | | | | | | | | | |
| CMP | | $ | 73,339,513 | | | 93.2 | % | | $ | 90,126,649 | | | 95.1 | % | | $ | 90,604,178 | | | 96.8 | % | | $ | 58,665,420 | | | | 95.3 | % | | $ | 67,584,155 | | | | 94.4 | % | | $ | 73,339,513 | | | | 93.2 | % |
| Other Liability | | | 5,271,612 | | | 6.7 | % | | | 4,524,684 | | | 4.8 | % | | | 2,736,790 | | | 2.9 | % | | | 2,845,407 | | | | 4.6 | % | | | 3,929,320 | | | | 5.5 | % | | | 5,271,612 | | | | 6.7 | % |
| Other | | | 43,465 | | | | 0.1 | % | | | 79,378 | | | | 0.1 | % | | | 255,149 | | | | 0.3 | % | | | 48,868 | | | | 0.1 | % | | | 71,933 | | | | 0.1 | % | | | 43,465 | | | | 0.1 | % |
| Total | | $ | 78,654,590 | | | | 100.0 | % | | $ | 94,730,711 | | | | 100.0 | % | | $ | 93,596,117 | | | | 100.0 | % | | $ | 61,559,695 | | | | 100.0 | % | | $ | 71,585,408 | | | | 100.0 | % | | $ | 78,654,590 | | | | 100.0 | % |
The Company‘s consolidated financial statements include estimated reserves for unpaid lossesboth reported and related loss adjustment expensesunreported claims of the insurance company operation. The Company sets loss and loss adjustment expensethese reserves at each quarterly balance sheet date atbased upon management’s best estimate of the ultimate payments that it anticipates will be made to settle all losses incurred and all related loss adjustment expenses incurred as of that date, for both reported and unreported claims.
Analysis of the roll forward of reserves for losses and loss adjustment expenses.
The following table provides an analysis of the roll forward of Crusader’s losses and loss adjustment expenses, including a reconciliation of the ending balance sheet liability for the periods indicated:
| | | Year ended December 31 | |
| | | 2008 | | | 2007 | | | 2006 | |
| | | | | | | | | | |
Reserve for unpaid losses and loss adjustment expenses at beginning of year – net of reinsurance | | $ | 66,305,287 | | | $ | 70,076,430 | | | $ | 76,235,467 | |
| | | | | | | | | | | | | |
| Incurred losses and loss adjustment expenses | | | | | | | | | | | | |
| Provision for insured events of current year | | | 24,149,531 | | | | 26,300,338 | | | | 29,997,662 | |
| Decrease in provision for events of prior years | | | (3,556,801 | ) | | | (4,118,101 | ) | | | (12,170,683 | ) |
| Total losses and loss adjustment expenses | | | 20,592,730 | | | | 22,182,237 | | | | 17,826,979 | |
| | | | | | | | | | | | | |
| Payments | | | | | | | | | | | | |
Losses and loss adjustment expenses attributable to insured events of the current year | | | 7,803,644 | | | | 7,816,422 | | | | 6,728,798 | |
Losses and loss adjustment expenses attributable to insured events of prior years | | | 20,255,356 | | | | 18,136,958 | | | | 17,257,218 | |
| Total payments | | | 28,059,000 | | | | 25,953,380 | | | | 23,986,016 | |
| | | | | | | | | | | | | |
Reserve for unpaid losses and loss adjustment expenses at end of year – net of reinsurance | | | 58,839,017 | | | | 66,305,287 | | | | 70,076,430 | |
| | | | | | | | | | | | | |
Reinsurance recoverable on unpaid losses and loss adjustment expenses at end of year | | | 19,815,573 | | | | 28,425,424 | | | | 23,519,687 | |
Reserve for unpaid losses and loss adjustment expenses at end of year per balance sheet, gross of reinsurance * | | $ | 78,654,590 | | | $ | 94,730,711 | | | $ | 93,596,117 | |
*In accordance with Financial Accounting Standards Board Statement No. 113, “Accounting and Reporting for Reinsurance of Short-Duration and Long-Duration Contracts,” reinsurance recoverable on unpaid losses and loss adjustment expenses are reported for GAAP as assets rather than netted against the corresponding liability for such items on the consolidated balance sheet.| | | Year ended December 31 | |
| | | 2010 | | | 2009 | | | 2008 | |
| | | | | | | | | | |
| Reserve for unpaid losses and loss adjustment expenses at beginning of year – net of reinsurance | | $ | 55,409,545 | | | $ | 58,839,017 | | | $ | 66,305,287 | |
| | | | | | | | | | | | | |
| Incurred losses and loss adjustment expenses | | | | | | | | | | | | |
| Provision for insured events of current year | | | 23,038,294 | | | | 23,501,314 | | | | 24,149,531 | |
| Decrease in provision for events of prior years | | | (4,568,179 | ) | | | (3,955,553 | ) | | | (3,556,801 | ) |
| Total losses and loss adjustment expenses | | | 18,470,115 | | | | 19,545,761 | | | | 20,592,730 | |
| | | | | | | | | | | | | |
| Payments | | | | | | | | | | | | |
| Losses and loss adjustment expenses attributable to insured events of the current year | | | 8,327,215 | | | | 5,852,107 | | | | 7,803,644 | |
| Losses and loss adjustment expenses attributable to insured events of prior years | | | 15,809,064 | | | | 17,123,126 | | | | 20,255,356 | |
| Total payments | | | 24,136,279 | | | | 22,975,233 | | | | 28,059,000 | |
| | | | | | | | | | | | | |
| Reserve for unpaid losses and loss adjustment expenses at end of year – net of reinsurance | | | 49,743,381 | | | | 55,409,545 | | | | 58,839,017 | |
| | | | | | | | | | | | | |
Reinsurance recoverable on unpaid losses and loss adjustment expenses at end of year | | | 11,816,314 | | | | 16,175,863 | | | | 19,815,573 | |
| Reserve for unpaid losses and loss adjustment expenses at end of year per balance sheet, gross of reinsurance | | $ | 61,559,695 | | | $ | 71,585,408 | | | $ | 78,654,590 | |
The Company’s net loss and loss adjustment expense reserve was $58,839,017$49,743,381 as of December 31, 2008.2010. Since underwriting profit is a significant part of income, a small percentage change in reserve estimates may result in a substantial effect on future reported earnings. Such changes might result from a variety of factors, including claims costs emerging in a different pattern than the average historical development patterns. Considering the continuum of possible development patterns, none of which is necessarily more or less likely than the next, onethe Company must consider the varying probabilities that the development pattern is off in varying degrees. If future development ultimately ends up being five percent different than the Company’s 20082010 net reserve, approximately $2.9$2.5 million would be reflected in future periods as an increase or decrease in the provision for events of prior years and would be recognized in the Company’s consolidated statementConsolidated Statements of operationsOperations in future periods. A variance of five percent of net loss and loss adjustment expense reservesreserve is not an unlikely scenario. Similarly, a variance ofIf future development ultimately ends up being ten percent ofdifferent than the Company’s 2008 reserves2010 net reserve, approximately $5 million would be reflected in approximately $5.9 million in future periods as an increase or decrease in the provision for events of prior years and would be recognized in the Company’s consolidated statementsConsolidated Statements of operationsOperations in future periods. ThisA variance of ten percent of net loss and loss adjustment expense reserve is also not an unlikely scenario. Differences of more than ten percent are also possible, though not quite as likely as differences of ten percent or less.
Other Insurance Operations
Health Insurance Program
Commission income from the health insurance sales is as follows:
| | | Year ended December 31 | |
| | | 2008 | | | 2007 | | | 2006 | |
| | | | | | | | | | |
| Commission income | | $ | 2,754,293 | | | $ | 2,320,161 | | | $ | 1,634,438 | |
| | | Year ended December 31 | |
| | | 2010 | | | 2009 | | | 2008 | |
| | | | | | | | | | |
| Commission income | | $ | 1,933,288 | | | $ | 2,526,772 | | | $ | 2,754,293 | |
AIB markets health insurance in California through non-affiliated insurance companies for individuals and groups. For these services, AIB receives commission based on the premiums that it writes. Commission income for the year ended December 31, 2008, increased $434,132 (19%2010, decreased $593,484 (23%) compared to the year ended December 31, 2009. Commission income for the year ended December 31, 2009, decreased $227,521 (8%), compared to the year ended December 31, 2007. Commission2008. The decrease in commission income for the year ended December 31, 2007, increased $685,723 (42%), compared to the year ended December 31, 2006. The increasein 2010 and 2009 is primarily due to the increasedecrease in commission income from the sales of small groupCIGNA medical insurance offered through CIGNA HealthCare. In May 2006, CIGNA HealthCare began offering new small group medical insurance policiesand dental plans. There had been significant changes in the stateCompany’s health insurance operation in 2010. In 2010, approximately 61% of California. Allthe Company’s health insurance income was derived from the CIGNA small group medical insurance policyholders are members of AAQHC.and dental programs. This represents a decline from 76% in 2009 and 82% in 2008. In November 2008, AIB entered into a General Agent Contract with Blue Shield of California who will pay AIB override commissions for all business submitted to them. In JuneSeptember 2009, CIGNA plans to substantially reducereduced the medical plans offered to Small Group Employerssmall group employers in the state of California from sixteen current19 plans down to four. All new employer groups4 plans. Primarily as a result of CIGNA’s decision to reduce the number of plans offered, AIB decided to terminate its marketing and existing employer groups, on their anniversary date, will have the option to choose from the four available plans.administrative agreement with CIGNA effective August 31, 2010. On September 1, 2010, AIB will be assisting itsstopped marketing all CIGNA policyholders in obtaining new coverage in oneproducts. AAQHC, An Administrator, ceased administration of the four CIGNA dental plans or with other contracted carriers. This reduction ineffective November 1, 2010 and CIGNA medical plans offered to Small Group Employers ineffective December 1, 2010. The termination of the state of California may resultmarketing and administrative agreement with CIGNA has resulted in a decrease in AIB commission income and AAQHC fee income. AIB is assisting the AAQHC will continuemembers in obtaining medical and dental coverage with other contracted carriers. These carriers are paying AIB commissions for these members. AIB has developed a new partnership with Guardian Life Insurance Company of America (GLIC). Effective October 1, 2010, AIB has been marketing GLIC’s dental and group life products to underwriteboth brokers and administer all remaining CIGNA business, including dentalthe public. GLIC has created plans specifically for Individuals and Small Group Employers.AIB.
Association Operation
Membership and fee income from the association program of AAQHC is as follows:
| | | Year ended December 31 | |
| | | 2008 | | | 2007 | | | 2006 | |
| | | | | | | | | | |
| Membership and fee income | | $ | 300,214 | | | $ | 309,712 | | | $ | 300,527 | |
| | | Year ended December 31 | |
| | | 2010 | | | 2009 | | | 2008 | |
| | | | | | | | | | |
| Membership and fee income | | $ | 212,216 | | | $ | 261,980 | | | $ | 300,214 | |
Membership and fee income for the year ended December 31, 2008,2010, decreased $9,498 (3%$49,764 (19%), compared to the year ended December 31, 2007.2009. Membership and fee income for the year ended December 31, 2007, increased $9,185 (3%2009, decreased $38,234 (13%), compared to the year ended December 31, 2006.
2008. The decrease for each of the years is a result of a decrease in the number of members primarily as a result from the decrease in sales of CIGNA medical and dental plans previously discussed. The decrease in 2010 is also due to the termination of the administrative agreement with CIGNA also discussed above.
Policy Fee Income
Unifax sells and services insurance policies for Crusader. The commissions paid by Crusader to Unifax are eliminated as intercompany transactions and are not reflected as income in the financial statements. Unifax also receives non-refundable policy fee income that is directly related to the Crusader policies it sells. For financial statement reporting purposes, policy fees are earned ratably over the life of the related insurance policy. The unearned portion of the policy fee is recorded as a liability on the balance sheet under “Accrued Expenses and Other Liabilities.” The earned portion of the policy fee charged to the policyholder by Unifax is recognized as income in the consolidated financial statements. Unifax’s policy fee income is as follows:
| | | Year ended December 31 | | | Year ended December 31 | |
| | | 2008 | | | 2007 | | | 2006 | | | 2010 | | | 2009 | | | 2008 | |
| | | | | | | | | | | | | | | | | | | |
| Policy fee income | | $ | 2,239,306 | | | $ | 2,482,006 | | | $ | 2,837,810 | | | $ | 1,980,928 | | | $ | 2,109,681 | | | $ | 2,239,306 | |
| Policies issued | | | 12,539 | | | | 13,536 | | | | 15,186 | | | | 10,946 | | | | 11,901 | | | | 12,539 | |
Policy fee income for the year ended December 31, 2008,2010, decreased $242,700 (10%$128,753 (6%) as compared to the year ended December 31, 2007.2009. The 10%6% decrease in policy fee income is primarily a result of a 997 (7%955 (8%) decrease in the number of policies issued during 20082010 as compared to 2007.2009.
Policy fee income for the year ended December 31, 2007,2009, decreased $355,804 (13%$129,625 (6%) as compared to the year ended December 31, 2006.2008. The 13%6% decrease in policy fee income is primarily a result of a 1,650 (11%638 (5%) decrease in the number of policies issued during 20072009 as compared to 2006.2008.
Daily Automobile Rental Insurance Program
The daily automobile rental insurance program is produced by Bedford for a non-affiliated insurance company.
Commission and fee income from the daily automobile rental insurance program areis as follows:
| | | Year ended December 31 | |
| | | 2008 | | | 2007 | | | 2006 | |
| | | | | | | | | | |
| Rental program commission | | $ | 345,350 | | | $ | 344,120 | | | $ | 317,679 | |
| Contingent commission | | | 58,593 | | | | 46,539 | | | | 53,638 | |
| Total commission | | | 403,943 | | | | 390,659 | | | | 371,317 | |
| Claim administration fee | | | - | | | | - | | | | 4,035 | |
| Total commission and fee income | | $ | 403,943 | | | $ | 390,659 | | | $ | 375,352 | |
| | | Year ended December 31 | |
| | | 2010 | | | 2009 | | | 2008 | |
| | | | | | | | | | |
| Rental program commission | | $ | 297,095 | | | $ | 336,315 | | | $ | 345,350 | |
| Contingent commission | | | 67,873 | | | | 65,514 | | | | 58,593 | |
| Total commission income | | $ | 364,968 | | | $ | 401,829 | | | $ | 403,943 | |
The daily automobile rental insurance program commission and fee income for the year ended December 31, 2008, increased $13,284 (3%2010, decreased $36,861 (9%) compared to the year ended December 31, 2007.2009. For the year ended December 31, 2007,2009, commission and fee income increased $15,307 (4%decreased $2,114 (1%) compared to the year ended December 31, 2006.2008. The daily automobile rental insurance program commission and fee income, excluding claim administration fee and contingent commission, increased $1,230 (0%decreased $39,220 (12%) to $345,350$297,095 in 2008,2010 from $344,120$336,315 in 2007.2009. The daily automobile rental insurance program commission and fee income, excluding claim administration fee and contingent commission, increased $26,441 (8%decreased $9,035 (3%) to $344,120$336,315 in 20072009 from $317,679$345,350 in 2006.2008. Premium written in 2008 and 2007 remained comparable to premium written in 2007. Premium written in 2007 increased 8%2010 decreased 11% compared to premium written in 2006.2009. Premium written in 2009 and 2008 were comparable. The daily automobile rental insurance program is stillcontinues to be impacted by the intense price competition in the marketplace and the slow economic recovery during the periods covered by this report. The Company cannot determine how long the existing market conditions will continue, nor in which direction they might change. To avoid underwriting losses for the non-affiliated insurance company that it represents, Bedford continues to produce business only at rates that it believes to be adequate.
Primarily due to declining sales, in April 2006 Bedford hired a new general manager who had substantial experience in the daily automobile rental insurance business. Due to the fact that Bedford’s sales objectives were not achieved, it ended the employment of the general manager in January 2008. During 2007, the Company negotiated with the non-affiliated insurance company the need to approve and implement various product enhancements that Bedford recommended. The negotiations did not result in any significant enhancements.
Other Commission and Fee Income
Other commission and fee income are as follows:
| | | Year ended December 31 | | | Year ended December 31 | |
| | | 2008 | | | 2007 | | | 2006 | | | 2010 | | | 2009 | | | 2008 | |
| | | | | | | | | | | | | | | | | | | |
| Earthquake program commission income | | $ | 8,175 | | | $ | 13,018 | | | $ | 37,914 | | | $ | - | | | $ | 493 | | | $ | 8,175 | |
| Miscellaneous commission and fee income | | | 140 | | | | 77 | | | | 116 | | | | 170 | | | | 294 | | | | 140 | |
| Total other commission and fee income | | $ | 8,315 | | | $ | 13,095 | | | $ | 38,030 | | | $ | 170 | | | $ | 787 | | | $ | 8,315 | |
Unifax began producing commercial earthquake insurance policies in California for non-affiliated insurance companies in 1999. Unifax receivesreceived a commission from these insurance companies based on premium written. Commission income on the earthquake program for the year ended December 31, 2008, decreased $4,703 (36%) compared to 2007. Commission income on the earthquake program for the year ended December 31, 2007, decreased $24,896 (66%) compared to 2006. Effective February 1, 2009, this program was terminated.
The commissions paid by Crusader to Unifax are eliminated as intercompany transactions and are not reflected in commission income or commission expense.
Premium Finance Program
Premium finance charges and late fees earned from financing policies are as follows:
| | | Year ended December 31 | | | Year ended December 31 | |
| | | 2008 | | | 2007 | | | 2006 | | | 2010 | | | 2009 | | | 2008 | |
| | | | | | | | | | | | | | | | | | | |
| Premium finance charges and fees earned | | $ | 460,422 | | | $ | 553,997 | | | $ | 678,740 | | | $ | 276,737 | | | $ | 369,285 | | | $ | 460,422 | |
| New loans | | | 2,523 | | | | 2,835 | | | | 3,596 | | | | 2,429 | | | | 2,244 | | | | 2,523 | |
AAC providesThe insurance premium financing for Crusaderoperation currently finances policies produced by Unifax in California. Thewritten only through its sister company, Unifax. Consequently, AAC’s growth of this program is primarily dependent and directly related toon the growth of Crusader'sCrusader and Unifax business. Effective July 20, 2010, AAC reduced the interest rate charged on premiums financed to 0% in an effort to increase the sales of existing renewal and new business written by Unifax for Crusader. Due to the low interest rate environment, the cost of money to provide this incentive is not material. The Company monitors the cost of providing this incentive, and depending on the cost/benefit determination, can continue to offer it or withdraw it at any time. Primarily due to the 0% financing, premium finance charges and AAC’s abilityfees earned decreased $92,548 (25%) in the year ended December 31, 2010, compared to market its competitive rates and service.2009. Premium finance charges and fees earned decreased $93,575 (17%$91,137 (20%) in the year ended December 31, 2008,2009, compared to 20072008, primarily due to the fact that there were 312279 (11%) fewer loans issued during the 2009 year. The average premium financed by AAC was $2,304 in the current year. Premium finance charges2010, $2,309 in 2009 and fees earned decreased $124,743 (18%)$2,653 in the year ended December 31, 2007, compared to 2006 primarily due to the fact that there2008. During 2010, 33% of all Unifax policies were 761 (21%) fewer loans financed in the current year.and 67% of those policies were financed by AAC. During 2009, 32% of all Unifax policies were financed and 59% of those policies were financed by AAC. During 2008, 28% of all Unifax policies were financed and 81% of those policies were financed by AAC. During 2007, 28%
30 of all Unifax policies were financed and 72% of those policies were financed by AAC. During 2006, 32% of all Unifax policies were financed and 75% of those policies were financed by AAC.73
Investment Income and Net Realized Gains
Investment income and net realized gains are as follows:
| | | Year ended December 31 | | | Year ended December 31 | |
| | | 2008 | | | 2007 | | | 2006 | | | 2010 | | | 2009 | | | 2008 | |
| Average invested assets * – at amortized cost | | $ | 146,195,377 | | | $ | 147,330,351 | | | $ | 143,957,963 | | |
| | | | | | | | | | | |
| Average invested assets* – at amortized cost | | | $ | 133,682,728 | | | $ | 141,320,457 | | | $ | 146,195,377 | |
| | | | | | | | | | | | | | | | | | | | | | | | | |
| Interest income | | | | | | | | | | | | | | | | | | | | | | | | |
| Insurance company operations | | $ | 5,829,304 | | | $ | 6,695,121 | | | $ | 5,903,462 | | | $ | 3,489,498 | | | $ | 4,325,123 | | | $ | 5,829,304 | |
| Other operations | | 61,434 | | | 152,002 | | | 100,955 | | | | 3,432 | | | | 1,350 | | | | 61,434 | |
| Realized gains | | | 6,306 | | | | - | | | | 2,617 | | | | - | | | | - | | | | 6,306 | |
| Total investment income and realized gains | | $ | 5,897,044 | | | $ | 6,847,123 | | | $ | 6,007,034 | | | $ | 3,492,930 | | | $ | 4,326,473 | | | $ | 5,897,044 | |
| | | | | | | | | | | | | | | | | | | | | | | | | |
| Yield on average invested assets | | 4.03 | % | | 4.65 | % | | 4.17 | % | | | 2.61 | % | | | 3.06 | % | | | 4.03 | % |
* The average is based on the beginning and ending balance of the amortized cost of the invested assets for each respective year.
| * The average is based on the beginning and ending balance of the amortized cost of the invested assets for each respective year. |
In the year ended December 31, 2008,2010, the Company’s average invested assets (at amortized value) decreased $1,134,974 (1%$7,637,729 (5%) compared to the year ended December 31, 2007.2009. In the year ended December 31, 2008,2010, investment income earned, excluding realized gains, decreased $956,385 (14%$833,543 (19%) compared to the year ended December 31, 2007.2009. The yield on average invested assets decreased to 4.03%2.61% in 20082010 from 4.65%3.06% in 2007.2009. The decrease in the yield on average invested assets is primarily the result of a decrease in the average return on new and reinvested assets in the Company’s investment portfolio. Due to the current interest rate environment, management believes it is prudent to purchase fixed maturity investments with maturities of five5 years or less and with minimal credit risk. Thus, the weighted average maturity of the Company’s fixed maturity investments as of December 31, 2008,2010, was 2.11.3 years compared to 2.01.7 years as of December 31, 2007.2009. The Company’s invested assets (at amortized value) as of December 31, 2008,2010, were $145,042,387$129,766,929 as compared to $147,348,367$137,598,527 as of December 31, 2007.2009.
In the year ended December 31, 2007, while2009, the Company’s average invested assets (at amortized value) increased $3,372,388 (2%decreased $4,874,920 (3%) compared to the year ended December 31, 2006,2008. In the year ended December 31, 2009, investment income earned, excluding realized gains, increased $842,706 (14%decreased $1,564,265 (27%) compared to the year ended December 31, 2006.2008. The yield on average invested assets increaseddecreased to 4.65%3.06% in 20072009 from 4.17%4.03% in 2006.2008. The increasedecrease in the yield on average invested assets is primarily the result of an increasea decrease in the average return on new and reinvested assets in the Company’s investment portfolio. TheDue to the then current interest rate environment, management believed it was prudent to purchase fixed maturity investments with maturities of 5 years or less and with minimal credit risk. Thus, the weighted average maturity of the Company’s fixed maturity investments as of December 31, 2007,2009, was 2.01.7 years compared to 1.32.1 years as of December 31, 2006.2008. The Company’s invested assets (at amortized value) as of December 31, 2007,2009, were $147,348,367$137,598,527 as compared to $147,312,335$145,042,387 as of December 31, 2006. However, the average invested assets increased in the year ending December 31, 2007, as compared to 2006, primarily as a result of the significant increase in invested assets during the year ended December 31, 2006.2008.
The par value, amortized cost, estimated market value and weighted average yield of fixed maturity investments at December 31, 2008,2010, by contractual maturity are as follows. Expected maturities will differ from contractual maturities because borrowers may have the right to call or prepay obligations with or without penalties.
Maturities by Calendar Year | | Par Value | | | Amortized Cost | | | Fair Value | | | Weighted Average Yield | | | Par Value | | | Amortized Cost | | | Fair Value | | | Weighted Average Yield | |
| | | | | | | | | | | | | | | | | | | | | | | | | |
| December 31, 2009 | | $ | 42,700,000 | | | $ | 42,875,272 | | | $ | 43,496,590 | | | 4.14 | % | |
| December 31, 2010 | | 36,200,000 | | | 36,266,842 | | | 37,107,077 | | | 2.46 | % | |
| December 31, 2011 | | 9,250,000 | | | 9,340,981 | | | 10,182,031 | | | 4.15 | % | | $ | 48,038,998 | | | $ | 48,083,311 | | | $ | 48,445,951 | | | | 1.79 | % |
| December 31, 2012 | | 38,000,000 | | | 37,965,533 | | | 42,318,438 | | | 4.43 | % | | | 58,080,000 | | | | 58,185,190 | | | | 60,635,000 | | | | 3.29 | % |
| December 31, 2013 | | | 9,100,000 | | | | 9,091,726 | | | | 9,867,844 | | | | 3.26 | % | | | 16,846,000 | | | | 16,932,779 | | | | 17,531,031 | | | | 2.12 | % |
| December 31, 2015 | | | | 100,000 | | | | 100,000 | | | | 100,000 | | | | 1.90 | % |
| | | | | | | | | | | | | | | | | | | | | | | | | | | | | | | | | |
| Total | | $ | 135,250,000 | | | $ | 135,540,354 | | | $ | 142,971,980 | | | | 3.71 | % | | $ | 123,064,988 | | | $ | 123,301,280 | | | $ | 126,711,982 | | | | 2.54 | % |
The following table sets forth the composition of the investment portfolio of the Company at the dates indicated:
| | | (Amounts in Thousands) | | |
| | | As of December 31 | | | (Amounts in Thousands) | |
| | | 2008 | | | 2007 | | | 2006 | | | December 31, 2010 | | | December 31, 2009 | |
| | | Amortized | | | Fair | | | Amortized | | | Fair | | | Amortized | | | Fair | | | Amortized | | | Fair | | | Amortized | | | Fair | |
| Type of Security | | Cost | | | Value | | | Cost | | | Value | | | Cost | | | Value | | | Cost | | | Value | | | Cost | | | Value | |
| | | | | | | | | | | | | | | | | | | | | | | | | | | | | | | |
| Certificates of deposit | | $ | 400 | | | $ | 400 | | | $ | 400 | | | $ | 400 | | | $ | 400 | | | $ | 400 | | | $ | 27,465 | | | $ | 27,465 | | | $ | 21,035 | | | $ | 21,035 | |
| U.S. treasury securities | | 124,526 | | | 131,939 | | | 130,211 | | | 133,014 | | | 127,554 | | | 127,192 | | | | 95,836 | | | | 99,247 | | | | 103,362 | | | | 107,419 | |
Industrial and miscellaneous taxable bonds | | 10,614 | | | 10,633 | | | 9,366 | | | 9,467 | | | 12,523 | | | 12,558 | | |
| State and municipal tax-exempt bonds | | | - | | | | - | | | | 15 | | | | 15 | | | | 15 | | | | 15 | | |
| Industrial and miscellaneous | | | | | | | | | | | | | | | | | |
| taxable bonds | | | | - | | | | - | | | | 4,044 | | | | 4,141 | |
| Total fixed maturity investments | | 135,540 | | | 142,972 | | | 139,992 | | | 142,896 | | | 140,492 | | | 140,165 | | | | 123,301 | | | | 126,712 | | | | 128,441 | | | | 132,595 | |
| Short-term cash investments | | | 9,502 | | | | 9,502 | | | | 7,356 | | | | 7,356 | | | | 6,820 | | | | 6,820 | | | | 6,466 | | | | 6,466 | | | | 9,158 | | | | 9,158 | |
| Total investments | | $ | 145,042 | | | $ | 152,474 | | | $ | 147,348 | | | $ | 150,252 | | | $ | 147,312 | | | $ | 146,985 | | | $ | 129,767 | | | $ | 133,178 | | | $ | 137,599 | | | $ | 141,753 | |
The following table summarizes for all fixed maturities in an unrealized loss position atAt December 31, 2008,2010 and 2009 the aggregate fair value andCompany had no fixed maturity investments with a gross unrealized loss by length of time those fixed maturities have been continuously in an unrealized loss.
No securities were sold at a loss during 2008, 2007,2010 or 2006.
| Year Ended | | Amortized | | | | | | Gross | |
| December 31 | | Cost | | | Fair Value | | | Unrealized Loss | |
| | | | | | | | | | |
| 2008 | | | | | | | | | |
| 0-6 months | | $ | 5,590,110 | | | $ | 5,524,385 | | | $ | 65,725 | |
| 7-12 months | | | - | | | | - | | | | - | |
| Over 12 months | | | - | | | | - | | | | - | |
| Total | | $ | 5,590,110 | | | $ | 5,524,385 | | | $ | 65,725 | |
| 2007 | | | | | | | | | | | | |
| 0-6 months | | $ | 7,080,404 | | | $ | 7,071,870 | | | $ | 8,534 | |
| 7-12 months | | | - | | | | - | | | | - | |
| Over 12 months | | | 2,917,362 | | | | 2,909,775 | | | | 7,587 | |
| Total | | $ | 9,997,766 | | | $ | 9,981,645 | | | $ | 16,121 | |
At December 31, 2008, the fixed maturity investments with a gross unrealized loss for continuous periods of 0 to 6 months consisted of three investment grade industrial securities.
At December 31, 2007, the fixed maturity investments with a gross unrealized loss for continuous periods of 0 to 6 months consisted of U.S. treasury securities. The fixed maturity investments with a gross unrealized loss position for a continuous period over 12 months consisted of U.S. treasury securities, investment grade industrial securities, and pre-refunded municipal bonds.2009.
The Company monitors its investments closely. If an unrealized loss is determined to be other than temporary,other-than-temporary, it is written off as a realized loss through the Consolidated Statements of Operations. The Company’s methodology of assessing other-than-temporary impairments is based on security-specific analysis as of the balance sheet date and considers various factors including the length of time to maturity and the extent to which the fair value has been less than the cost, the financial condition and the near-term prospects of the issuer, and whether the debtor is current on its contractually obligated interest and principal payments. The Company hasdoes not have the ability and intent to holdsell its fixed maturity investments; and it is not likely that the Company would be required to sell any of its fixed maturity investments for a periodprior to recovery of time sufficient to allow the Company to recover its amortized costs. The Company has concluded thatdid not sell any fixed maturity investments in the gross unrealized losses of $65,725 atyears ended December 31, 2008, were temporary in nature. However, facts2010 and circumstances may change which could result in a decline in fair value considered to be other than temporary.2009. The Company sold one fixed maturity investment in the year ended December 31, 2008, with net realized gain in the amount of $6,306. The Company did not sell any fixed maturity investments in the year ended December 31, 2007.
Operating Expenses
Policy Acquisition Costs are as follows:
| | | Year ended December 31 | | | Year ended December 31 | |
| | | 2008 | | | 2007 | | | 2006 | | | 2010 | | | 2009 | | | 2008 | |
| | | | | | | | | | | | | | | | | | | |
| Policy acquisition costs | | $ | 8,261,324 | | | $ | 8,465,047 | | | $ | 9,250,989 | | | $ | 7,282,546 | | | $ | 7,612,716 | | | $ | 8,261,324 | |
| Ratio to net earned premium (GAAP ratio) | | 24 | % | | 23 | % | | 22 | % | | | 26 | % | | | 25 | % | | | 24 | % |
Policy acquisition costs consist of commissions, premium taxes, inspection fees, and certain other underwriting costs that are directly related to and vary with the production of Crusader insurance policies. These costs include both Crusader expenses and allocated expenses of other Unico subsidiaries. On certain reinsurance treaties, Crusader receives a ceding commission from its reinsurer that represents a reimbursement of the acquisition costs related to the premium ceded. No ceding commission is received on facultative, catastrophe, or provisionally rated ceded premium. Policy acquisition costs, net of ceding commission, are deferred and amortized as the related premiums are earned. No significant change in the ratio of policy acquisition cost to net earned premium were noted in the years ended December 31, 2008, 20072010, 2009 and 2006.
Salaries and Employee Benefits are as follows:
| | | Year ended December 31 | | | Year ended December 31 | |
| | | 2008 | | | 2007 | | | 2006 | | | 2010 | | | 2009 | | | 2008 | |
| | | | | | | | | | | | | | | | | | | |
| Total salaries and employee benefits incurred | | $ | 9,625,571 | | | $ | 9,785,770 | | | $ | 9,913,740 | | | $ | 7,783,272 | | | $ | 9,133,929 | | | $ | 9,625,571 | |
| Less: charged to losses and loss adjustment expenses | | | (1,418,031 | ) | | | (1,409,391 | ) | | | (1,320,508 | ) | | | (1,040,139 | ) | | | (1,414,259 | ) | | | (1,418,031 | ) |
| Less: capitalized to policy acquisition costs | | | (2,576,512 | ) | | | (2,666,816 | ) | | | (2,731,683 | ) | | | (2,426,069 | ) | | | (2,519,543 | ) | | | (2,576,512 | ) |
| Net amount charged to operating expenses | | $ | 5,631,028 | | | $ | 5,709,563 | | | $ | 5,861,549 | | | $ | 4,317,064 | | | $ | 5,200,127 | | | $ | 5,631,028 | |
Total salaries and employee benefits incurred for the year ended December 31, 2010, decreased $883,063 (17%) compared to the year ended December 31, 2009. The decrease in total salaries and employee benefits incurred is primarily the result of a decrease in the number of employees as compared to the prior year and the retirement of the former chief executive of the Company on April 1, 2009, and the effect of the adjustment on the quarter ended March 31, 2010, to reduce the Company’s annual contribution to the employee profit sharing plan for the plan year ending March 31, 2010, by approximately $249,000 (See Note 13).
Total salaries and employee benefits incurred for the year ended December 31, 2008,2009, decreased $160,199 (2%$491,642 (5%) compared to the year ended December 31, 2007.2008. The decrease in total salaries and employee benefits incurred is primarily a result of a lowerdecrease in the number of employees as compared to the prior yearperiod, the retirement of the former chief executive of the Company on April 1, 2009, and was offset by general salary increases and increases in general salaries and employee benefits costs.
Total salaries and employee benefits incurred for the year ended December 31, 2007, decreased $127,970 (1%) compared to the year ended December 31, 2006. The decrease in total salaries and employee benefits incurred is primarily a result of a lower number of employees as compared to the prior year offset by general salary increases and increases in employee benefits costs.
Commissions to Agents/Brokers are as follows:
| | | Year ended December 31 | |
| | | 2008 | | | 2007 | | | 2006 | |
| | | | | | | | | | |
| Commission to agents/brokers | | $ | 1,279,821 | | | $ | 1,002,771 | | | $ | 611,200 | |
| | | Year ended December 31 | |
| | | 2010 | | | 2009 | | | 2008 | |
| | | | | | | | | | |
| Commission to agents/brokers | | $ | 637,861 | | | $ | 1,089,787 | | | $ | 1,279,821 | |
Commissions to agents/brokers (not including commissions on Crusader policies that are reflected in policy acquisition costs) are generally related to gross commission income from the health insurance program, the daily automobile rental insurance program, and the earthquake program. Commissions to agents and brokers increased $277,050 (28%decreased $451,926 (41%) for the year ended December 31, 2008,2010, as compared to the year ended December 31, 2007.2009. The increasedecrease is primarily due to the result of the increasedecrease in written premium in the health insurance program and is related to the increasedecrease in commission income from that program.
Commissions to agents and brokers increased $391,571 (64%decreased $190,034 (15%) for the year ended December 31, 2007,2009, as compared to the year ended December 31, 2006.2008. The increasedecrease is primarily due to the result of the increasedecrease in written premium in the health insurance program and is related to the increasedecrease in commission income from that program.
Other Operating Expenses are as follows:
| | | Year ended December 31 | |
| | | 2008 | | | 2007 | | | 2006 | |
| | | | | | | | | | |
| Other operating expenses | | $ | 3,020,075 | | | $ | 2,940,124 | | | $ | 3,012,678 | |
| | | Year ended December 31 | |
| | | 2010 | | | 2009 | | | 2008 | |
| | | | | | | | | | |
| Other operating expenses | | $ | 3,192,584 | | | $ | 4,004,737 | | | $ | 3,020,075 | |
Other operating expenses generally do not change significantly with changes in production. This is true for both increases and decreases in production. Other operating expenses increased $79,951 (3%decreased $812,153 (20%) for the year ended December 31, 2008,2010, compared to the year ended December 31, 2007. 2009. The decrease in other operating expenses is primarily due to a decrease in the Company’s bad debt expense, general corporate legal expenses and costs related to the California Department of Insurance required tri-annual examination of the Company’s insurance subsidiary that was ongoing in 2009.
Other operating expenses decreased $72,554 (2%increased $984,662 (33%) for the year ended December 31, 2007,2009, compared to the year ended December 31, 2006.2008. The Company’s bad debt expense increased $649,358 for the year ended December 31, 2009, as compared to the year ended December 31, 2008, and legal fees increased $199,856 as compared to December 31, 2008, primarily due to a single agent’s failure to remit premiums due Unifax. See “Note 6, Premiums, Commissions and Notes Receivable, Net.”
Income Taxes
Income tax expense for the year ended December 31, 2008,2010, was $2,701,450$891,429 compared to an income tax expense of $3,360,709$1,236,603 for the year ended December 31, 2007.2009. The effective combined income tax rates for 20082010 and 20072009 were 34%28% and 33%30%, respectively. This decrease in income tax expense was primarily due to a decrease in pre-tax income to $3,220,581 in the year ended December 31, 2010, compared to pre-tax income of $4,163,978 in the year ended December 31, 2009, and to the recognition of a decrease in the percentage of undistributed dividends subject to California franchise tax that reduced the Company’s deferred tax liability by approximately $143,000. Excluding the adjustment to the deferred tax expense, the effective tax rate would have been 32% and 30% for the years ended December 31, 2010 and 2009, respectively.
Income tax expense for the year ended December 31, 2009, was $1,236,603 compared to income tax expense of $2,701,450 for the year ended December 31, 2008. The effective combined income tax rates for 2009 and 2008 were 30% and 34%, respectively. The decrease in the effective tax rate in 2009 was primarily due to tax adjustments, recorded in the 3 months ended December 31, 2009, related to prior periods which reduced the Company’s income tax expense in the current year by $97,161. The adjustment was the result of recognition of the tax effect of certain deferred items for state income tax purposes. The pre-tax income decreased $2,088,687 (21%$3,820,488 (48%) for the year ended December 31, 2008,2009, compared to the year ended December 31, 2007,2008, which resulted in a decreased income tax expense in 2008.
The income tax expense for the year ended December 31, 2007, was $3,360,709 compared to an income tax expense of $6,427,345 for the year ended December 31, 2006. The effective combined income tax rates for 2007 and 2006 were 33% and 35%, respectively. The pre-tax income decreased $8,279,658 for the year ended December 31, 2007, compared to the year ended December 31, 2006, which resulted in a decreased income tax expense in 2007.2009.
Recently Issued Accounting Standards
In May 2008,October 2010, the FASB issued Statementa new standard to address diversity in practice regarding the interpretation of Financial Accounting Standards (SFAS) No. 162, “The Hierarchywhich costs relating to the acquisition of Generally Accepted Accounting Principles” (SFAS No. 162). SFAS No. 162 identifiesnew or renewal insurance contracts qualify for deferral. Costs that meet the sources of accounting principles and the framework for selecting the principles to be useddefinition defined in the preparationnew standard are recognized as assets and referred to as deferred acquisition costs. Deferred acquisition costs are amortized over time using amortization methods dependent upon the nature of financial statementsthe underlying insurance product. Other costs that do not vary with and are not primarily related to the acquisition of nongovernmental entities thatnew and renewal insurance contracts are presented in conformity with GAAP (GAAP hierarchy).charged to expense as incurred. The current GAAP hierarchy, as set forthnew standard will be effective for fiscal years and interim periods within those fiscal years beginning after December 15, 2011. The Company is in the American Instituteprocess of Certified Public Accountants (AICPA) Statement on Auditing Standards No. 69, “The Meaningevaluating the impact of Present Fairly in Conformity With Generally Accepted Accounting Principles,” has been criticized because (1) it is directed to the auditor rather than the entity, (2) it is complex, and (3) it ranks FASB Statements of Financial Accounting Concepts, which are subject to the same level of due process as FASB Statements of Financial Accounting Standards, below industry practices that are widely recognized as generally accepted but that are not subject to due process. SFAS No. 162 shall be effective 60 days following the Securities and Exchange Commission’s approval of the Public Company Accounting Oversight Board amendments to U.S. Auditing Standards Section 411, “The Meaning of Present Fairly in Conformity With Generally Accepted Accounting Principles.” SFAS No. 162 is not expected to have a material impactadoption on the Company’s consolidated financial statements.
EffectiveIn January 1, 2008, the Company adopted Statement of Financial Accounting Standards No. 157 “Fair Value Measurements,” (SFAS No. 157) for financial assets and liabilities. In December 2007,2010, the FASB providedissued a one-year deferral of SFAS No. 157 for non-financial assets and non-financial liabilities, except those that are recognized or disclosed atnew standard related to fair value on a recurring basis, at least annually. SFAS No. 157 redefines fair values asmeasurements and disclosures, which amends the price that would be receivedearlier FASB standard to sell an asset or paid to transfer a liability in an orderly transaction between market participants at the measurement date, establishes a frameworkadd new requirements for measuringdisclosures about transfers into and out of Levels 1 and 2 fair value in GAAP,measurements and expandsrequires separate disclosures about purchases, sales, issuances, and settlements related to Level 3 fair value measurements. Specifically, SFAS No. 157 establishes a three-level hierarchy forThe new standard also clarifies existing fair value measurements based upondisclosures about the naturelevel of thedisaggregation and about inputs and valuation techniques used to the valuation of an asset or liability. SFAS No. 157 applies where other accounting pronouncements require or permit fair value measurements. In October 2008, the FASB issued FASB Staff Position No. 157-3 “Determining the Fair Value of a Financial Asset When the Market for That Asset Is Not Active” (FSP FAS 157-3), which clarifies the application of SFAS No. 157 in a market that is not active and provides an example to illustrate key considerations in determiningmeasure the fair valuevalue. The Company adopted the new accounting standard which became effective for the interim reporting period ended March 31, 2010, except for the requirement to provide the Level 3 activity of purchases, sales, issuances, and settlements on a financial asset when the marketgross basis, which will be effective for that financial asset is not active. Such considerations include inputs to broker quotes, assumptions regarding future cash flowsfiscal years beginning after December 15, 2010, and use of risk-adjusted discount rates.for interim periods within those fiscal years. The adoption of FSP FAS No. 157-3the new standard did not have a material impact on the Company’s consolidated financial statements.
In February 2007, the FASB issued SFAS No. 159, “The Fair Value Option for Financial Assets and Financial Liabilities - Including an Amendment of FASB Statement No. 115.” SFAS No. 159 permits an entity to measure certain financial assets and financial liabilities at fair value. The main objective of SFAS No. 159 is to improve financial reporting by allowing entities to mitigate volatility in reported earnings caused by the measurement of related assets and liabilities using different attributes, without having to apply complex hedge accounting provisions. Entities that elect the fair value option will report unrealized gains and losses in earnings at each subsequent reporting date. SFAS No. 159 establishes presentation and disclosure requirements to help financial statement users understand the effect of the entity’s election on its earnings but does not eliminate disclosure requirements of other accounting standards. SFAS No. 159 is expected to expand the use of fair value measurement, which is consistent with the FASB’s long-term measurement objectives for accounting for financial instruments. SFAS No. 159 is effective as of the beginning of the first fiscal year that begins after November 15, 2007. The Company adopted SFAS No. 159 as of the beginning of 2008 by not electing the fair value option for any of its financial assets or liabilities.
In December 2007, FASB Statements No. 141 (revised 2007), “Business Combinations” (SFAS No. 141R) was issued. SFAS No. 141R replaces FASB Statement No. 141, “Business Combinations.” SFAS No. 141R requires the acquiring entity in a business combination to recognize all (and only) the assets acquired and liabilities assumed in the transaction; establishes the acquisition-date fair value as the measurement objective for all assets acquired and liabilities assumed; and requires the acquirer to disclose additional information regarding the nature and financial effect of the business combination. The Company will adopt SFAS No. 141R for any business combinations initiated after December 31, 2008.
There werehave been no other accounting standards issued during 20082010 that are expected to have a material impact on the Company’s consolidated financial statements.
Significant Accounting Policies
The preparation of financial statements in conformity with GAAP requires management to make estimates and assumptions that affect the reported amounts of certain assets and liabilities and disclosure of contingent assets and liabilities at the date of the financial statements and the reported amounts of revenues and expenses during the reporting period. While every effort is made to ensure the integrity of such estimates, actual results could differ.
Management believes the Company’s current critical accounting policies comprise the following:
Losses and Loss Adjustment Expenses
The preparation of the Company’s consolidated financial statements requires judgments and estimates. The most significant is the estimate of loss reserves as required by SFAS No. 60, “Accounting and Reporting by Insurance Enterprises” and Statement of Financial Accounting Standards No. 5 (SFAS No. 5), “Accounting for Contingencies.”
reserves. Management makes its best estimate of the liability for unpaid claims costs as of the end of each fiscal quarter. Due to the inherent uncertainties in estimating the Company’s unpaid claims costs, actual loss and loss adjustment expense payments should be expected tomay vary, perhaps significantly, from any estimate made prior to the settling of all claims. Variability is inherent in establishing loss and loss adjustment expense reserves, especially for a small insurer like the Company. For any given line of insurance, accident year, or other group of claims, there is a continuum of possible reserve estimates, each having its own unique degree of propriety or reasonableness. Due to the complexity and nature of the insurance claims process, there are potentially an infinite number of reasonably likely scenarios. The Company does not specifically identify reasonably likely scenarios other than utilizing management’s best estimate. In addition to applying the various standard methods to the data, an extensive series of diagnostic tests ofare applied to the resultant reserve estimates are applied to determine management’s best estimate of the unpaid claims liability. Among the statistics reviewed for each accident year are loss and loss adjustment expense development patterns, frequencies (expected claim counts), severities (average cost per claim), loss and loss adjustment expense ratios to premium, and loss adjustment expense ratios to loss. When there is clear evidence that the actual claims costs emerged are different than expected for any prior accident year, the claims cost estimates for that year are revised accordingly.
Some lines of insurance are commonly referred to as "long-tail" lines because of the extended time required before claims are ultimately settled. Lines of insurance in which claims are settled relatively quickly are called "short-tail" lines. It is generally more difficult to estimate loss reserves for long-tail lines because of the long period of time that elapses between the occurrence of a claim and its final disposition and the difficulty of estimating the settlement value of the claim. The Company’s short-tail lines consist of its property coverages and its long-tail lines consist of its liability coverages. However, compared to other long-tail liability lines that are not underwritten by the Company, such as workers’ compensation, professional liability, umbrella liability, and medical malpractice, the Company’s liability claims tend to be settled relatively quicker.
The Company underwrites four statutory annual statement lines of business: (1) commercial multiplemulti peril, (2) liability other than automobile and products, (3) fire, and (4) allied lines. Commercial multiplemulti peril policies comprised 98% and 96% of the Company’s 2010, 2009 and 2008 and 2007 premium volume, respectively.volume. Commercial multiplemulti peril policies include both property and liability coverages. For all of the Company’s coverages and lines of business, the Company’s actuarial loss and loss adjustment expense reserving methods require assumptions that can be grouped into two key categories: (1) expected losslosses and loss adjustment expense,expenses required by the expected loss ratio and Bornhuetter-Ferguson methods, and (2) expected development patterns required by the loss development and Bornhuetter-Ferguson methods.
The Company also segregates most of its business into smaller homogeneous categories primarily for management’s internal detailed business review and analysis. These homogeneous categories used by the Company include various combinations and special groupings of its lines of business, programs types, states, and coverages. Some categories exclude certain items and/or others include certain items. Not all categories are defined in the same way. This analysis includes the tracking of historical claims costs and development patterns separately for each of these uniquely designed categories. Generally, neither the liability development patterns nor the property development patterns vary significantly by category.
The accurate establishment of loss and loss adjustment expense reserves is a difficult process as there are many factors that can ultimately affect the final settlement of a claim and, therefore, the reserve that is needed. Estimates are based on a variety of industry data and on the Company’s current and historical accident year claims data, including but not limited to reported claim counts, open claim counts, closed claim counts, closed claim counts with payments, paid losses, paid loss adjustment expenses, case loss reserves, case loss adjustment expense reserves, earned premiums and policy exposures, salvage and subrogation, and unallocated loss adjustment expenses paid. Many other factors, including changes in reinsurance, changes in pricing, changes in policy forms and coverage, changes in underwriting and risk selection, legislative changes, results of litigation and inflation are also taken into account.
At the end of each fiscal quarter, the Company’s reserves are re-evaluated for each accident year (i.e., for all claims incurred within each year) by a committee consisting of the Company’s executive vice president and the Company’s chief financial officer, andofficer. It is also reviewed by an independent consulting actuary. The Company uses the loss ratio method, Bornhuetter-Ferguson methods and loss development methods to estimate ultimate claims costs. In general the loss ratio method is more appropriate for the current accident year, the loss development methods are more appropriate for the older more mature accident years, and the Bornhuetter-Ferguson methods combine the other two methods. The estimates of the loss ratio method and the Bornhuetter-Ferguson incurred method have not been significantly different on the current accident year at recent valuation dates through 2009. During 2010 the actual emerged claims cost for the current accident year are higher than expected, hence the incurred but not reported (IBNR) estimate from Bornhuetter-Ferguson incurred method is greater than the IBNR estimate from the loss ratio method. Management reviews such differences to determine whether they are aberrations that are a normal part of the process or an indication that a change in reserve assumptions is appropriate. In this case management has recognized the adverse experience observed in 2010 as one of the normal differences between actual and expected claim costs that can emerge from time to time, particularly in an insurer the size of the Company and does not believe a that a change in assumptions to estimate the ultimate claims costs for the current accident year. The current accident year IBNR reserves are initially determined by multiplying earned premiums for the year by the expected loss and loss adjustment expense ratio, then subtracting the current accident year’s cumulative incurred (paid plus case reserves) to date. This method is subject to adjustment based upon actual results incurred during the reporting period. This initial IBNR reserve is adjusted as subsequent developmentbe appropriate.
35 of that accident year takes place.73
The Company also applies several additional standard actuarial methods to the historical claims costs data to estimate its unpaid claims liability for each accident year. The additional standard methods include loss development methods and Bornhuetter-Ferguson methods, both of which can be applied to paid loss and loss adjustment expense (claims costs), reported incurred (paid plus case reserve) claims costs, and/or claim counts. These methodologies do not vary by tail length; however, certain parameters do vary. In particular, loss development factors for short-tail property claims are different than for long-tail liability claims.
Development patterns generally do not tend to change materially over time. Generally, the Company has very little property claim development subsequent to the end of an accident year. Although liability claims may take ten10 or more years to fully develop, most of the development occurs in the first five5 to six6 years subsequent to the end of the accident year. However, liability claims are substantially developed by two2 years subsequent to the end of the accident year. Other than the change in the expected loss and loss adjustment expense ratio assumption discussed above, theThe Company’s reserving methodology assumptions have not changed in the years presentedpresented. The effect of losses and the only significant effectloss adjustment expenses on the Company’s financial statements has primarily resulted from estimated costs being adjusted as actual costs emerge. The estimate of the total ultimate loss and loss adjustment expense for a given accident year is revised over time as actual costs emerge. This is not, however a revision of the Company’s estimates, but a gradual replacement over time of the prior cost estimates with actual cost estimates with actual costs as they emerge. This is normal unfolding of loss development process, not a revision of cost estimates.
The Company’s actuarially based loss and loss adjustment expense reserve methodology does not include an implicit or explicit provision for uncertainty. Insurance claims costs are inherently uncertain. There is not a precise means of quantifying a provision for uncertainty when determining an appropriate liability for unpaid claims costs. Rather, the potential for claims costs being less than estimated and the potential for claims costs being more than estimated are considered when selecting the parameters to be used in the application of the actuarial methods and when testing the estimates for reasonableness. Management believes that its recorded loss and loss adjustment expense reserve makesreserves make reasonable provision for its liability for unpaid claims costs.
The information that management uses to arrive at its best reserve estimate comes from many sources within the Company, including its accounting, legal, claims, and underwriting departments. Informed managerial judgment is applied throughout the reserving process. In addition, time can be a critical part of reserving determinations since the longer the span between the incidence of a loss and the payment or settlement of the claim, the more variable the ultimate settlement amount can be. Accordingly, short-tail claims, such as property damage claims, tend to be more reasonably predictable than long-tail liability claims. The liability for unpaid losses and loss adjustment expenses is based upon the accumulation of individual case estimates for losses reported prior to the close of the accounting period plus estimates based on experience and industry data for development of case estimates and for unreported losses and loss adjustment expenses. Since the emergence and disposition of claims are subject to uncertainties, the net amounts that will ultimately be paid to settle claims may vary significantly from the estimated amounts provided for in the accompanying consolidated financial statements. Any adjustments to reserves are reflected in the operating results of the periods in which they are made. Management believes that the aggregate reserves for losses and loss adjustment expenses are reasonable and adequate to cover the cost of claims, both reported and unreported.
The Company must estimate its ultimate losses and loss adjustment expenses using a very small claim population size. At the beginning of 2008,2010, the Company had 739622 open claim files. During 2008, 9952010, 1,062 new claim files were opened and 1,0771,100 claim files were closed, leaving 657584 open claim files at the end of 2008.2010. Due to the small size of the Company and the related small population of claims, the Company’s losses and loss adjustment expenses for any accident year can vary significantly from the initial expectations. Due to the small number of claims, changes in claim frequency and/or severity can materially affect the Company’s reserve estimate. The potential variability from management’s best estimate cannot be measured from any meaningful statistical basis due to the numerous uncertainties in the claims reserving process and the small population of claims.
At each quarterly review, actual claims costs that emerge are compared with the claims costs that were expected to emerge during that development period. Sometimes the previous claims costs estimates prove to have been too high; sometimes they prove to have been too low. In the case of the Company, the estimates proved to be too high in each of the past three years.years reflected in the table. The favorable development in 20062008 through 20082010 underscores the inherent uncertainty in insurance claims costs, especially for a very small insurer.
| | | Calendar year ended December 31 | |
| | | 2008 | | | 2007 | | | 2006 | |
| Net reserves for unpaid losses and loss adjustment expenses at beginning of year | | $ | 66,305,287 | | | $ | 70,076,430 | | | $ | 76,235,467 | |
| Net (decrease) in provision for events of prior years | | $ | (3,556,801 | ) | | $ | (4,118,101 | ) | | $ | (12,170,683 | ) |
| Percent of development to beginning reserves | | | (5.4 | %) | | | (5.9 | %) | | | (16.0 | %) |
| | | Calendar year ended December 31 | |
| | | 2010 | | | 2009 | | | 2008 | |
| Net reserves for unpaid losses and loss adjustment expenses at beginning of year | | $ | 55,409,545 | | | $ | 58,839,017 | | | $ | 66,305,287 | |
| Net decrease in provision for events of prior years | | $ | 4,568,179 | | | $ | 3,955,553 | | | $ | 3,556,801 | |
| Percent of favorable development to beginning reserves | | | 8.2 | % | | | 6.7 | % | | | 5.4 | % |
The differences between actual and expected claims costs are typically not due to one specific factor but to a combination of many factors such as the period of time between the initial occurrence and the final settlement of the claim, current and perceived social and economic inflation, and many other economic, legal, political, and social factors. Because of these and other factors, actual loss and loss adjustment expense payments should be expected to vary, perhaps significantly, from any estimate made prior to the settling of all claims. Any adjustments to reserves are reflected in the operating results of the periods in which they are made. Management believes that the aggregate reserves for losses and loss adjustment expenses are reasonable and adequate to cover the cost of claims, both reported and unreported.
There have been no changes in key assumptions of estimating future loss and loss adjustment payments. The changes in estimates of prior accident year incurred losses and loss adjustment expenses are attributed to the passage of time and the greater amount of actual loss data available for each accident year.
Reinsurance
The Company’s recoverable from reinsurers represents an estimate of the amount of future loss and loss adjustment expense payments that will be recoverable from the Company’s reinsurers. These estimates are based upon estimates of the ultimate losses and loss adjustment expenses that the Company expects to incur and the portion of those losses that are expected to be allocable to reinsurers based upon the terms of the reinsurance agreements. Given the uncertainty of the ultimate amounts of losses and loss adjustment expenses, the estimates may vary significantly from the eventual outcome. The Company’s estimate of the amounts recoverable from reinsurers is regularly reviewed and updated by management as new data becomes available. The Company’s assessment of the collectibilitycollectability of the recorded amounts recoverable from reinsurers is based primarily upon public financial statements and rating agency data. Any adjustments necessary are reflected in the current operations. The Company evaluates each of its ceded reinsurance contracts at theirits inception to determine if there is sufficient risk transfer to allow the contract to be accounted for as reinsurance under current accounting literature. At December 31, 2008,2010, all such ceded contracts are accounted for as risk transfer reinsurance.
The following tables provide the effect of reinsurance on the Company’s financial statements:
The effect of ceded reinsurance on financial position is as follows:
| | | Year ended December 31 | |
| | | 2008 | | | 2007 | | | 2006 | |
| | | | | | | | | | |
Ceded loss and loss adjustment expense incurred on excess of loss treaties * | | | | | | | | | |
| | | | | | | | | | |
| Ceded paid loss and loss adjustment expense | | $ | 7,268,387 | | | $ | 3,287,750 | | | $ | 5,148,736 | |
| Change in ceded case loss reserves | | | (3,324,003 | ) | | | 1,659,134 | | | | (959,394 | ) |
| Change in ceded IBNR reserves | | | (5,285,848 | ) | | | 3,246,603 | | | | (1,200,000 | ) |
| Total ceded loss and loss adjustment expense incurred | | $ | (1,341,464 | ) | | $ | 8,193,487 | | | $ | 2,989,342 | |
| | | | | | | | | | | | | |
| Ceded loss and loss adjustment expense recoverable on excess of loss treaties | | | | | | | | | | | | |
| | | | | | | | | | | | | |
| Ceded case loss and loss adjustment expense reserves recoverable | | $ | 1,354,818 | | | $ | 4,678,821 | | | $ | 3,019,687 | |
| Ceded IBNR reserves recoverable | | | 18,460,755 | | | | 23,746,603 | | | | 20,500,000 | |
| Total ceded loss and loss adjustment expense reserves recoverable | | $ | 19,815,573 | | | $ | 28,425,424 | | | $ | 23,519,687 | |
| | | Year ended December 31 | |
| | | 2010 | | | 2009 | | | 2008 | |
| | | | | | | | | | |
| Ceded loss and loss adjustment expense recoverable on excess of loss treaties | | | | | | | | | |
| Ceded case loss and loss adjustment expense reserves recoverable | | $ | 2,311,947 | | | $ | 1,841,146 | | | $ | 1,354,818 | |
| Ceded IBNR reserves recoverable | | | 9,504,367 | | | | 14,334,717 | | | | 18,460,755 | |
| Total ceded loss and loss adjustment expense reserves recoverable | | $ | 11,816,314 | | | $ | 16,175,863 | | | $ | 19,815,573 | |
The effect of reinsurance on the results of operations is as follows:
The effect of reinsurance on earned premium is as follows:
| | | Year ended December 31 | |
| | | 2010 | | | 2009 | | | 2008 | |
| | | | | | | | | | |
| Direct earned premium | | $ | 35,579,438 | | | $ | 40,050,878 | | | $ | 42,720,764 | |
| | | | | | | | | | | | | |
| Earned ceded premium | | | | | | | | | | | | |
| Excluding provisionally rated ceded premium | | | 7,427,236 | | | | 9,284,534 | | | | 8,850,878 | |
| Provisionally rated ceded premium | | | - | | | | (8,127 | ) | | | (79,809 | ) |
| Total earned ceded premium | | | 7,427,236 | | | | 9,276,407 | | | | 8,771,069 | |
| | | | | | | | | | | | | |
| Net premiums earned | | $ | 28,152,202 | | | $ | 30,774,471 | | | $ | 33,949,695 | |
| Ratio of earned ceded premium to direct earned premium | | | 21 | % | | | 23 | % | | | 21 | % |
The effect of reinsurance on losses and loss adjustment expenses are as follows:
| | | Year ended December 31 | |
| | | 2010 | | | 2009 | | | 2008 | |
| | | | | | | | | | |
| Direct losses and loss adjustment expenses | | $ | 16,706,756 | | | $ | 19,221,640 | | | $ | 19,251,266 | |
| | | | | | | | | | | | | |
| Ceded losses and loss adjustment expenses incurred on excess of loss treaties | | | | | | | | | | | | |
| Ceded paid losses and loss adjustment expenses | | | 2,596,190 | | | | 3,315,589 | | | $ | 7,268,387 | |
| Change in ceded case loss reserves | | | 470,801 | | | | 486,328 | | | | (3,324,003 | ) |
| Change in ceded IBNR reserves | | | (4,830,350 | ) | | | (4,126,038 | ) | | | (5,285,848 | ) |
| Total ceded losses and loss adjustment expenses incurred | | | (1,763,359 | ) | | | (324,121 | ) | | | (1,341,464 | ) |
| | | | | | | | | | | | | |
| Net losses and loss adjustment expenses | | $ | 18,470,115 | | | $ | 19,545,761 | | | $ | 20,592,730 | |
Ceded premium and ceded losses and loss adjustment expenses are as follows:
| | | Year ended December 31 | |
| | | 2010 | | | 2009 | | | 2008 | |
| | | | | | | | | | |
| Earned ceded premium | | $ | 7,427,236 | | | $ | 9,276,407 | | | $ | 8,771,069 | |
| | | | | | | | | | | | | |
| Ceded losses and loss adjustment expenses incurred | | | (1,763,359 | ) | | | (324,121 | ) | | | (1,341,464 | ) |
| Ceded earned premium less ceded loss and loss adjustment expenses incurred | | $ | 9,190,595 | | | $ | 9,600,528 | | | $ | 10,112,533 | |
The effect of reinsurance on cash flow is as follows:
| | | Year ended December 31 | |
| | | 2010 | | | 2009 | | | 2008 | |
| | | | | | | | | | |
| Changes in reinsurance recoverable from statements of cash flows | | $ | 4,763,986 | | | $ | 3,301,130 | | | $ | 8,813,303 | |
*There were no catastrophe losses incurred during the period covered by this table.
There have been no changes in key assumptions of estimating future ceded losses and loss adjustment expenses. The effectchanges in estimates of prior accident year ceded reinsurance on resultsincurred losses and loss adjustment expenses are attributed to the passage of operations is as follows:time and greater amount of actual loss data available for each accident year.
| | | Year ended December 31 | |
| | | 2008 | | | 2007 | | | 2006 | |
| | | | | | | | | | |
| Direct earned premium | | $ | 42,720,764 | | | $ | 48,661,973 | | | $ | 56,692,213 | |
| | | | | | | | | | | | | |
| Earned ceded premium | | | | | | | | | | | | |
| Excluding provisionally rated ceded premium | | | 8,850,878 | | | | 11,560,877 | | | | 13,825,061 | |
| Provisionally rated ceded premium | | | (79,809 | ) | | | (28,569 | ) | | | (66,637 | ) |
| Total earned ceded premium | | | 8,771,069 | | | | 11,532,308 | | | | 13,758,424 | |
| Ceding commission | | | 2,642,665 | | | | 3,547,595 | | | | 4,376,474 | |
| Earned ceded premium, net of ceding commission | | $ | 6,128,404 | | | $ | 7,984,713 | | | $ | 9,381,950 | |
| | | | | | | | | | | | | |
| Ratios to direct earned premium | | | | | | | | | | | | |
| Direct ceded premium | | | 21 | % | | | 24 | % | | | 24 | % |
| Earned ceded premium, net of ceding commission | | | 14 | % | | | 16 | % | | | 17 | % |
The effect of ceded reinsurance on cash flow is as follows:| | | Year ended December 31 | |
| | | 2008 | | | 2007 | | | 2006 | |
| | | | | | | | | | |
| Changes in reinsurance recoverable from statements of cash flows | | $ | 8,813,303 | | | $ | (4,955,568 | ) | | $ | 3,602,749 | |
The Company’s reinsurance strategy is to reduce volatility in its expected loss and loss adjustment expense results by protecting the Company against liabilities in excess of certain retentions, including major or catastrophic losses that may occur from any one or more of the property and/or casualty risks which it insures. On an annual basis, or sooner if warranted, the Company evaluates whether any changes to its retention, participation, or retained limits are necessary. Loss and loss adjustment expense reserves are determined separately on both a direct basis and a net of reinsurance basis, and the ceded reserves are determined by subtraction. Therefore, reinsurance recoverable is determined in a manner consistent with the associated loss reserves. There have been no recent changes in key assumptions underlying the estimation of loss and loss adjustment expense reserves, and no changes are anticipated. Paid losses and loss adjustment expenses ceded are determined by the terms of the individual treaties. We continually monitor and evaluate the collectability of reinsurance recoverable to determine if any allowance is necessary.
The Company currently only writes business in the state of California. The types of businesses and the coverage limits written by the Company are not considered difficult lines for obtaining reinsurance. In addition, because the major catastrophe exposure is primarily from riots and from fire following earthquakes, the Company does not anticipate significant limitations on its ability to cede future losses on a basis consistent with its historical results.
Investments
In accordance with SFAS No. 115, the Company is required to classify its investments in debt and equity securities into one of three categories: held-to-maturity, available-for-sale or trading securities.
The Company’s fixed maturity investments are classified as available-for-sale and are stated at marketfair value. Although all of the Company's investments are classified as available-for-sale and the Company may sell investment securities from time to time in response to economic and market conditions, its investment guidelines place primary emphasis on buying and holding high-quality investments to maturity. Short-term investments are carried at cost, which approximates market value. Investments in equity securities are carried at marketfair value. The unrealized gains or losses from fixed maturities and equity securities are reported as “accumulated other comprehensive income (loss),” which is a separate component of stockholders’ equity, net of any deferred tax effect. When a decline in the value of a fixed maturity or equity security is considered other than temporary,other-than-temporary, a loss is recognized in the Consolidated Statements of Operations. Realized gains and losses are included in the Consolidated Statements of Operations based on the specific identification method.
Related Party Transactions
The Company presently occupies aapproximately 46,000 square footfeet of an office building located at 23251 Mulholland Drive, Woodland Hills, California, under a master lease expiring March 31, 2012. Erwin Cheldin, the Company's former president chairman,and current director and principal stockholder, is the owner of the building. The Company signed an extension to the lease with a 4% increase in rent effective April 1, 2007. The lease provides for an annual gross rent of $1,025,952 through March 31, 2007, and $1,066,990 from April 1, 2007, through March 31, 2012. In addition, the lease extension provides for two five-year5-year options with a rent increase of 5% for each option period. The Company believes that at the inception of the lease agreement and at each subsequent extension, the terms of the lease were at least as favorable to the Company as could have been obtained from non-affiliated third parties. The Company utilizes for its own operations approximately 100% of the space it leases.
Forward Looking Statements
Certain statements contained herein, including the sections entitled “Business,” “Legal Proceedings” and “Management’s Discussion and Analysis of Financial Condition and Results of Operations,” that are not historical facts are forward looking. These statements, which may be identified by forward looking words or phrases such as “anticipate,” “appear,” “believe,” “estimate,” “expect,” “intend,” “may,” plan,” “should,” and “would” involve risks and uncertainties, many of which are beyond the control of the Company. Such risks and uncertainties could cause actual results to differ materially from these forward looking statements. Factors which could cause actual results to differ materially include those described under Item 1 – “Business - Competition” and Item 1A – “Risk Factors”; premium rate adequacy relating to competition or regulation; actual versus estimated claim experience; the outcome of rate change filings with regulatory authorities; acceptance by insureds of rate changes; adequacy of rate changes; changes in Crusader’s A.M. Best rating; regulatory changes or developments; the outcome of regulatory proceedings; unforeseen calamities; general market conditions; and the Company’s ability to introduce new profitable products.
Item 7A. Quantitative and Qualitative Disclosures About Market Risk.
The Company’s consolidated balance sheet includes a substantial amount of invested assets whose fair values are subject to various market risk exposures including interest rate risk and equity price risk.
The Company’s invested assets at December 31, 20082010 and 2007,2009, consisted of the following:
| | | 2008 | | | 2007 | | | 2010 | | | 2009 | |
| | | | | | | | | | | | | |
| Fixed maturity bonds (at amortized cost) | | $ | 135,140,354 | | | $ | 139,592,208 | | | $ | 95,836,282 | | | $ | 107,405,698 | |
| Short-term cash investments (at cost) | | | 9,502,033 | | | | 7,356,159 | | | | 6,465,649 | | | | 9,157,832 | |
| Certificates of deposit - over 1 year (at cost) | | | 400,000 | | | | 400,000 | | |
| Certificates of deposit – over 1 year (at cost) | | | | 27,464,998 | | | | 21,034,997 | |
| Total invested assets | | $ | 145,042,387 | | | $ | 147,348,367 | | | $ | 129,766,929 | | | $ | 137,598,527 | |
The Company’s interest rate risk is primarily in its fixed maturity bond portfolio. As market interest rates decrease, the value of the portfolio increases with the opposite holding true in rising interest rate environments. In addition, the longer the maturity, the more sensitive the asset is to market interest rate fluctuations. The Company limits this risk by investing in securities with maturities no greater than eight8 years. In addition, although fixed maturity bonds are classified as available-for-sale, the Company’s investment guidelines place primary emphasis on buying and holding high-quality bonds to maturity. Because fixed maturity bonds are primarily held to maturity, the change in the market value of these bonds resulting from interest rate movements is unrealized and no gains or losses are recognized in the Consolidated Statements of Operations. Unrealized gains and losses are reported as separate components of stockholders’ equity, net of any deferred tax effect. As of December 31, 2008,2010, the Company’s unrealized gains (net of unrealized losses) before income taxes on its fixed maturity bond portfolio were $7,431,626$3,410,702 compared to unrealized gains (net of unrealized losses) before income taxes of $2,903,264$4,154,788 as of December 31, 2007.2009. Given a hypothetical parallel increase of 100 basis points in interest rates, the fair value of the fixed maturity bond portfolio as of December 31, 2008,2010, would decrease by approximately $4,052,000.$1,431,586. This decrease would not be reflected in the statements of operations except to the extent that the securities were sold or the decrease was deemed to be other than temporary.other-than-temporary.
The Company’s short-term investments and certificates of deposit have only minimal interest rate risk.
Item 8. Financial Statements and Supplementary Data.
INDEX TO
CONSOLIDATED FINANCIAL STATEMENTS
| | Page |
| | Number |
| | |
| Report of Independent Registered Public Accounting Firm | 4341 |
| | |
Consolidated Balance Sheets as of December 31, 2008,2010, and 20072009 | 4442 |
| | |
Consolidated Statements of Operations for the years ended December 31, 2008, 2007,2010, 2009, and 20062008 | 4543 |
| | |
Consolidated Statements of Comprehensive Income for the years ended December 31, 2008, 2007,2010, 2009, and 2006
2008 | 4644 |
| | |
Consolidated Statements of Changes in Stockholders' Equity for the years ended December 31, 2010, 2009, and 2008 2007, and 2006 | 4745 |
| | |
Consolidated Statements of Cash Flows for the years ended December 31, 2008, 2007,2010, 2009, and 20062008 | 4846 |
| | |
| Notes to Consolidated Financial Statements | 4947 |
REPORT OF INDEPENDENT REGISTERED PUBLIC ACCOUNTING FIRM
The Board of Directors and Stockholders
Unico American Corporation:
We have audited the accompanying consolidated balance sheets of Unico American Corporation and subsidiaries as of December 31, 20082010 and 2007,2009, and the related consolidated statements of operations, comprehensive income, changes in stockholders’ equity, and cash flows for each of the years in the three-year period ended December 31, 2008.2010. These consolidated financial statements are the responsibility of the Company’s management. Our responsibility is to express an opinion on these consolidated financial statements based on our audits.
We conducted our audits in accordance with the standards of the Public Company Accounting Oversight Board (United States). Those standards require that we plan and perform the audit to obtain reasonable assurance about whether the financial statements are free of material misstatement. An audit includes examining, on a test basis, evidence supporting the amounts and disclosures in the financial statements. An audit also includes assessing the accounting principles used and significant estimates made by management, as well as evaluating the overall financial statement presentation. We believe that our audits provide a reasonable basis for our opinion.
In our opinion, the consolidated financial statements referred to above present fairly, in all material respects, the financial position of Unico American Corporation and subsidiaries as of December 31, 20082010 and 2007,2009, and the results of their operations and their cash flows for each of the years in the three-year period ended December 31, 2008,2010, in conformity with U.S. generally accepted accounting principles.
KPMG LLP
Los Angeles, California
March 30, 20092010
UNICO AMERICAN CORPORATION
AND SUBSIDIARIES
CONSOLIDATED BALANCE SHEETS
| | | December 31 | | | December 31 | |
| | | 2010 | | | 2009 | |
| ASSETS | |
| Investments | | | | | | |
| Available for sale: | | | | | | |
Fixed maturities, at fair value (amortized cost: December 31, 2010 $123,301,280; December 31, 2009 $128,440,695) | | $ | 126,711,982 | | | $ | 132,595,483 | |
| Short-term investments, at cost | | | 6,465,649 | | | | 9,157,832 | |
| Total Investments | | | 133,177,631 | | | | 141,753,315 | |
| Cash | | | 45,210 | | | | 118,512 | |
| Accrued investment income | | | 690,718 | | | | 763,840 | |
| Premium and notes receivable, net | | | 4,364,393 | | | | 4,364,747 | |
| Reinsurance recoverable: | | | | | | | | |
| Paid losses and loss adjustment expenses | | | 48,877 | | | | 453,314 | |
| Unpaid losses and loss adjustment expenses | | | 11,816,314 | | | | 16,175,863 | |
| Deferred policy acquisition costs | | | 4,300,927 | | | | 4,955,636 | |
| Property and equipment (net of accumulated depreciation) | | | 1,630,574 | | | | 221,255 | |
| Deferred income taxes | | | 1,059,557 | | | | 633,191 | |
| Other assets | | | 540,519 | | | | 668,979 | |
| Total Assets | | $ | 157,674,720 | | | $ | 170,108,652 | |
| | | | | | | | | |
| LIABILITIES AND STOCKHOLDERS' EQUITY | |
| | |
| LIABILITIES | | | | | | | | |
| Unpaid losses and loss adjustment expenses | | $ | 61,559,695 | | | $ | 71,585,408 | |
| Unearned premiums | | | 15,929,948 | | | | 18,811,415 | |
| Advance premium and premium deposits | | | 829,746 | | | | 1,034,052 | |
| Income taxes payable | | | 1,175 | | | | - | |
| Accrued expenses and other liabilities | | | 6,000,340 | | | | 5,362,437 | |
| Total Liabilities | | $ | 84,320,904 | | | $ | 96,793,312 | |
| | | | | | | | | |
| Commitments and contingencies | | | | | | | | |
| | | | | | | | | |
| STOCKHOLDERS' EQUITY | | | | | | | | |
Common stock, no par – authorized 10,000,000 shares, issued and outstanding shares 5,333,081 at December 31, 2010, and 5,306,204 at December 31, 2009 | | $ | 3,554,973 | | | $ | 3,437,343 | |
| Accumulated other comprehensive income | | | 2,251,063 | | | | 2,742,160 | |
| Retained earnings | | | 67,547,780 | | | | 67,135,837 | |
| Total Stockholders’ Equity | | $ | 73,353,816 | | | $ | 73,315,340 | |
| | | | | | | | | |
| Total Liabilities and Stockholders' Equity | | $ | 157,674,720 | | | $ | 170,108,652 | |
| | |
| | | December 31 | | | December 31 | |
| | | 2008 | | | 2007 | |
| ASSETS | |
| Investments | | | | | | |
| Available for sale: | | | | | | |
| Fixed maturities, at fair value (amortized cost: December 31, 2008 $135,540,354; December 31, 2007 $139,992,208) | | $ | 142,971,980 | | | $ | 142,895,472 | |
| Short-term investments, at cost | | | 9,502,033 | | | | 7,356,159 | |
| Total Investments | | | 152,474,013 | | | | 150,251,631 | |
| Cash | | | 27,710 | | | | 108,864 | |
| Accrued investment income | | | 1,301,238 | | | | 1,554,741 | |
| Premiums and notes receivable, net | | | 4,680,779 | | | | 5,066,646 | |
| Reinsurance recoverable: | | | | | | | | |
| Paid losses and loss adjustment expenses | | | 114,734 | | | | 318,186 | |
| Unpaid losses and loss adjustment expenses | | | 19,815,573 | | | | 28,425,424 | |
| Deferred policy acquisition costs | | | 5,219,892 | | | | 5,722,847 | |
| Property and equipment (net of accumulated depreciation) | | | 359,553 | | | | 557,234 | |
| Deferred income taxes | | | - | | | | 686,910 | |
| Other assets | | | 609,484 | | | | 1,083,378 | |
| Total Assets | | $ | 184,602,976 | | | $ | 193,775,861 | |
| | | | | | | | | |
| LIABILITIES AND STOCKHOLDERS' EQUITY | |
| | |
| LIABILITIES | | | | | | | | |
| Unpaid losses and loss adjustment expenses | | $ | 78,654,590 | | | $ | 94,730,711 | |
| Unearned premiums | | | 19,962,118 | | | | 22,742,612 | |
| Advance premium and premium deposits | | | 1,192,553 | | | | 2,159,290 | |
| Income taxes payable | | | 558,604 | | | | - | |
| Deferred income taxes | | | 795,088 | | | | - | |
| Accrued expenses and other liabilities | | | 6,481,768 | | | | 5,040,145 | |
| Total Liabilities | | $ | 107,644,721 | | | $ | 124,672,758 | |
| | | | | | | | | |
| Commitments and contingencies | | | | | | | | |
| | | | | | | | | |
| STOCKHOLDERS' EQUITY | | | | | | | | |
| Common stock, no par – authorized 10,000,000 shares, issued and outstanding shares 5,574,315 at December 31, 2008, and 5,625,308 at December 31, 2007 | | $ | 3,569,099 | | | $ | 3,594,207 | |
| Accumulated other comprehensive income | | | 4,904,873 | | | | 1,916,154 | |
| Retained earnings | | | 68,484,283 | | | | 63,592,742 | |
| Total Stockholders’ Equity | | $ | 76,958,255 | | | $ | 69,103,103 | |
| | | | | | | | | |
| Total Liabilities and Stockholders' Equity | | $ | 184,602,976 | | | $ | 193,775,861 | |
See accompanying notes to consolidated financial statements.
UNICO AMERICAN CORPORATION
AND SUBSIDIARIES
CONSOLIDATED STATEMENTS OF OPERATIONS
FOR THE YEARS ENDED DECEMBER 31,
| | | 2010 | | | 2009 | | | 2008 | |
| REVENUES | | | | | | | | | |
| Insurance Company Revenues | | | | | | | | | |
| Premium earned | | $ | 35,579,438 | | | $ | 40,050,878 | | | $ | 42,720,764 | |
| Premium ceded | | | 7,427,236 | | | | 9,276,407 | | | | 8,771,069 | |
| Net premium earned | | | 28,152,202 | | | | 30,774,471 | | | | 33,949,695 | |
| Investment income | | | 3,489,498 | | | | 4,325,123 | | | | 5,829,304 | |
| Realized investment gains | | | - | | | | - | | | | 6,306 | |
| Other income | | | 692,484 | | | | 836,958 | | | | 742,683 | |
| Total Insurance Company Revenues | | | 32,334,184 | | | | 35,936,552 | | | | 40,527,988 | |
| | | | | | | | | | | | | |
| Other Revenues from Insurance Operations | | | | | | | | | | | | |
| Gross commissions and fees | | | 4,491,569 | | | | 5,301,049 | | | | 5,706,071 | |
| Investment income | | | 3,432 | | | | 1,350 | | | | 61,434 | |
| Finance charges and fees earned | | | 276,737 | | | | 369,285 | | | | 460,422 | |
| Other income | | | 14,829 | | | | 8,870 | | | | 13,529 | |
| Total Revenues | | | 37,120,751 | | | | 41,617,106 | | | | 46,769,444 | |
| | | | | | | | | | | | | |
| EXPENSES | | | | | | | | | | | | |
| Losses and loss adjustment expenses | | | 18,470,115 | | | | 19,545,761 | | | | 20,592,730 | |
| Policy acquisition costs | | | 7,282,546 | | | | 7,612,716 | | | | 8,261,324 | |
| Salaries and employee benefits | | | 4,317,064 | | | | 5,200,127 | | | | 5,631,028 | |
| Commissions to agents/brokers | | | 637,861 | | | | 1,089,787 | | | | 1,279,821 | |
| Other operating expenses | | | 3,192,584 | | | | 4,004,737 | | | | 3,020,075 | |
| Total Expenses | | | 33,900,170 | | | | 37,453,128 | | | | 38,784,978 | |
| | | | | | | | | | | | | |
| Income Before Taxes | | | 3,220,581 | | | | 4,163,978 | | | | 7,984,466 | |
| | | | | | | | | | | | | |
| Income Tax Expense | | | 891,429 | | | | 1,236,603 | | | | 2,701,450 | |
| | | | | | | | | | | | | |
| Net Income | | $ | 2,329,152 | | | $ | 2,927,375 | | | $ | 5,283,016 | |
| | | | | | | | | | | | | |
| | | | | | | | | | | | | |
| PER SHARE DATA: | | | | | | | | | | | | |
| Basic | | | | | | | | | | | | |
| Earnings Per Share | | $ | 0.44 | | | $ | 0.53 | | | $ | 0.94 | |
| Weighted Average Shares | | | 5,312,684 | | | | 5,507,371 | | | | 5,614,730 | |
| Diluted Earnings Per Share | | | | | | | | | | | | |
| Earnings Per Share | | $ | 0.44 | | | $ | 0.53 | | | $ | 0.93 | |
| Weighted Average Shares | | | 5,351,578 | | | | 5,547,999 | | | | 5,656,010 | |
| | | | | | | | | | | | | |
| | | | | | | | | | | | | |
| | | 2008 | | | 2007 | | | 2006 | |
| REVENUES | | | | | | | | | |
| Insurance Company Revenues | | | | | | | | | |
| Premium earned | | $ | 42,720,764 | | | $ | 48,661,973 | | | $ | 56,692,213 | |
| Premium (ceded) | | | (8,771,069 | ) | | | (11,532,308 | ) | | | (13,758,424 | ) |
| Net premium earned | | | 33,949,695 | | | | 37,129,665 | | | | 42,933,789 | |
| Investment income | | | 5,829,304 | | | | 6,695,121 | | | | 5,903,462 | |
| Realized investment gains | | | 6,306 | | | | - | | | | 2,617 | |
| Other income | | | 742,683 | | | | 312,427 | | | | 102,700 | |
| Total Insurance Company Revenues | | | 40,527,988 | | | | 44,137,213 | | | | 48,942,568 | |
| | | | | | | | | | | | | |
| Other Revenues from Insurance Operations | | | | | | | | | | | | |
| Gross commissions and fees | | | 5,706,071 | | | | 5,515,633 | | | | 5,186,157 | |
| Investment income | | | 61,434 | | | | 152,002 | | | | 100,955 | |
| Finance charges and fees earned | | | 460,422 | | | | 553,997 | | | | 678,740 | |
| Other income | | | 13,529 | | | | 14,050 | | | | 7,786 | |
| Total Revenues | | | 46,769,444 | | | | 50,372,895 | | | | 54,916,206 | |
| | | | | | | | | | | | | |
| EXPENSES | | | | | | | | | | | | |
| Losses and loss adjustment expenses | | | 20,592,730 | | | | 22,182,237 | | | | 17,826,979 | |
| Policy acquisition costs | | | 8,261,324 | | | | 8,465,047 | | | | 9,250,989 | |
| Salaries and employee benefits | | | 5,631,028 | | | | 5,709,563 | | | | 5,861,549 | |
| Commissions to agents/brokers | | | 1,279,821 | | | | 1,002,771 | | | | 611,200 | |
| Other operating expenses | | | 3,020,075 | | | | 2,940,124 | | | | 3,012,678 | |
| Total Expenses | | | 38,784,978 | | | | 40,299,742 | | | | 36,563,395 | |
| | | | | | | | | | | | | |
| Income Before Taxes | | | 7,984,466 | | | | 10,073,153 | | | | 18,352,811 | |
| | | | | | | | | | | | | |
| Income Tax Expense | | | 2,701,450 | | | | 3,360,709 | | | | 6,427,345 | |
| | | | | | | | | | | | | |
| Net Income | | $ | 5,283,016 | | | $ | 6,712,444 | | | $ | 11,925,466 | |
| | | | | | | | | | | | | |
| | | | | | | | | | | | | |
| PER SHARE DATA: | | | | | | | | | | | | |
| Basic | | | | | | | | | | | | |
| Earnings Per Share | | $ | 0.94 | | | $ | 1.20 | | | $ | 2.14 | |
| Weighted Average Shares | | | 5,614,730 | | | | 5,614,025 | | | | 5,567,883 | |
| Diluted Earnings Per Share | | | | | | | | | | | | |
| Earnings Per Share | | $ | 0.93 | | | $ | 1.18 | | | $ | 2.11 | |
| Weighted Average Shares | | | 5,656,010 | | | | 5,681,893 | | | | 5,652,901 | |
| | | | | | | | | | | | | |
| | | | | | | | | | | | | |
See accompanying notes to consolidated financial statements.
UNICO AMERICAN CORPORATION
AND SUBSIDIARIES
CONSOLIDATED STATEMENTS OF COMPREHENSIVE INCOME
FOR THE YEARS ENDED DECEMBER 31,
| | | 2008 | | | 2007 | | | 2006 | | | 2010 | | | 2009 | | | 2008 | |
| | | | | | | | | | | | | | | | | | | |
| Net income | | $ | 5,283,016 | | | $ | 6,712,444 | | | $ | 11,925,466 | | | $ | 2,329,152 | | | $ | 2,927,375 | | | $ | 5,283,016 | |
| Other changes in comprehensive income, net of tax: | | | | | | | | | | | | | | | | | | | | | | | | |
| Unrealized gains on securities classified as | | | | | | | | | | | | | |
| available-for-sale arising during the period | | | 2,988,719 | | | | 2,132,228 | | | | 166,150 | | |
| Unrealized (losses) gains on securities classified as available-for-sale arising during the period | | | | (491,097 | ) | | | (2,162,713 | ) | | | 2,988,719 | |
| Comprehensive Income | | $ | 8,271,735 | | | $ | 8,844,672 | | | $ | 12,091,616 | | | $ | 1,838,055 | | | $ | 764,662 | | | $ | 8,271,735 | |
See accompanying notes to consolidated financial statements.
UNICO AMERICAN CORPORATION
AND SUBSIDIARIES
CONSOLIDATED STATEMENTS OF CHANGES IN STOCKHOLDERS’ EQUITY
FOR THE YEARS ENDED DECEMBER 31, 2008, 20072010, 2009 and 20062008
| | | | | | Accumulated | | | | | | | | | | | | Accumulated | | | | | | | |
| | | | | | Other | | | | | | | | | | | | Other | | | | | | | |
| | | Common Shares | | | Comprehensive | | | | | | | | | Common Shares | | | Comprehensive | | | | | | | |
| | | Issued and | | | | | | Income | | | Retained | | | | | | Issued and | | | | | | Income | | | Retained | | | | |
| | | Outstanding | | | Amount | | | (Losses) | | | Earnings | | | Total | | | Outstanding | | | Amount | | | (Losses) | | | Earnings | | | Total | |
| | | | | | | | | | | | | | | | | | | | | | | | | | | | | | | |
Balance - December 31, 2005 | | 5,496,315 | | | $ | 2,720,487 | | | $ | (382,224 | ) | | $ | 45,065,433 | | | $ | 47,403,696 | | |
| | | | | | | | | | | | | | | | | | | | | | |
| Net shares issued for exercise of stock options | | 95,750 | | | 313,132 | | | - | | | - | | | 313,132 | | |
| Tax benefit from disqualified incentive stock options | | - | | | 203,126 | | | | | | | | | | | 203,126 | | |
| Shares canceled or adjusted | | 54 | | | - | | | - | | | - | | | - | | |
| Change in comprehensive income, net of deferred income tax | | - | | | - | | | 166,150 | | | - | | | 166,150 | | |
| Net income | | | - | | | | - | | | | - | | | | 11,925,466 | | | | 11,925,466 | | |
Balance - December 31, 2006 | | | 5,592,119 | | | $ | 3,236,745 | | | $ | (216,074 | ) | | $ | 56,990,899 | | | $ | 60,011,570 | | |
| | | | | | | | | | | | | | | | | | | | | | |
Net shares issued for exercise of stock options | | 42,672 | | | 301,336 | | | - | | | - | | | 301,336 | | |
| Tax benefit from disqualified incentive stock options | | - | | | 60,786 | | | - | | | - | | | 60,786 | | |
| Shares repurchased | | (9,483 | ) | | (4,660 | ) | | - | | | (110,601 | ) | | (115,261 | ) | |
| Change in comprehensive income, net of deferred income tax | | - | | | - | | | 2,132,228 | | | - | | | 2,132,228 | | |
| Net income | | | - | | | | - | | | | - | | | | 6,712,444 | | | | 6,712,444 | | |
Balance - December 31, 2007 | | | 5,625,308 | | | $ | 3,594,207 | | | $ | 1,916,154 | | | $ | 63,592,742 | | | $ | 69,103,103 | | | | 5,625,308 | | | $ | 3,594,207 | | | $ | 1,916,154 | | | $ | 63,592,742 | | | $ | 69,103,103 | |
| | | | | | | | | | | | | | | | | | | | | | | | | | | | | | | | | | | | | | | | | |
| Shares canceled or adjusted | | 99 | | | - | | | - | | | - | | | - | | | | 99 | | | | - | | | | - | | | | - | | | | - | |
| Shares repurchased | | (51,092 | ) | | (25,108 | ) | | - | | | (391,475 | ) | | (416,583 | ) | | | (51,092 | ) | | | (25,108 | ) | | | - | | | | (391,475 | ) | | | (416,583 | ) |
| Change in comprehensive income, net of deferred income tax | | - | | | - | | | 2,988,719 | | | - | | | 2,988,719 | | | | - | | | | - | | | | 2,988,719 | | | | - | | | | 2,988,719 | |
| Net income | | | - | | | | - | | | | - | | | | 5,283,016 | | | | 5,283,016 | | | | - | | | | - | | | | - | | | | 5,283,016 | | | | 5,283,016 | |
Balance - December 31, 2008 | | | 5,574,315 | | | $ | 3,569,099 | | | $ | 4,904,873 | | | $ | 68,484,283 | | | $ | 76,958,255 | | | | 5,574,315 | | | $ | 3,569,099 | | | $ | 4,904,873 | | | $ | 68,484,283 | | | $ | 76,958,255 | |
| | | | | | | | | | | | | | | | | | | | | | |
| Dividends paid to stockholders’ | | | | - | | | | - | | | | - | | | | (1,959,629 | ) | | | (1,959,629 | ) |
| Shares repurchased | | | | (268,111 | ) | | | (131,756 | ) | | | - | | | | (2,316,192 | ) | | | (2,447,948 | ) |
| Change in comprehensive income, net of deferred income tax | | | | - | | | | - | | | | (2,162,713 | ) | | | - | | | | (2,162,713 | ) |
| Net income | | | | - | | | | - | | | | - | | | | 2,927,375 | | | | 2,927,375 | |
Balance - December 31, 2009 | | | | 5,306,204 | | | $ | 3,437,343 | | | $ | 2,742,160 | | | $ | 67,135,837 | | | $ | 73,315,340 | |
| | | | | | | | | | | | | | | | | | | | | | |
| Net shares issued for exercise of stock options | | | | 26,877 | | | | 77,599 | | | | - | | | | - | | | | 77,599 | |
| Tax benefit from disqualified incentive stock options | | | | - | | | | 40,031 | | | | - | | | | - | | | | 40,031 | |
| Dividends paid to stockholders | | | | - | | | | - | | | | - | | | | (1,917,209 | ) | | | (1,917,209 | ) |
| Change in comprehensive income, net of deferred income tax | | | | - | | | | - | | | | (491,097 | ) | | | - | | | | (491,097 | ) |
| Net income | | | | - | | | | - | | | | - | | | | 2,329,152 | | | | 2,329,152 | |
Balance - December 31, 2010 | | | | 5,333,081 | | | $ | 3,554,973 | | | $ | 2,251,063 | | | $ | 67,547,780 | | | $ | 73,353,816 | |
See accompanying notes to consolidated financial statements.
UNICO AMERICAN CORPORATION
AND SUBSIDIARIES
CONSOLIDATED STATEMENTS OF CASH FLOWS
FOR THE YEARS ENDED DECEMBER 31,
| | | 2010 | | | 2009 | | | 2008 | |
| | | | | | | | | | |
| Cash flows from operating activities: | | | | | | | | | |
| Net income | | $ | 2,329,152 | | | $ | 2,927,375 | | | $ | 5,283,016 | |
| Adjustments to reconcile net income to net cash from operations | | | | | | | | | | | | |
| Depreciation | | | 127,371 | | | | 196,040 | | | | 212,028 | |
| Bond amortization, net | | | 114,924 | | | | 224,180 | | | | 286,907 | |
| Net realized gain on sale of fixed maturities | | | - | | | | - | | | | (6,306 | ) |
| Tax benefit from disqualified incentive stock options | | | (40,031 | ) | | | - | | | | - | |
| Changes in assets and liabilities | | | | | | | | | | | | |
| Premium, notes and investment income receivable | | | 73,476 | | | | 853,430 | | | | 639,370 | |
| Reinsurance recoverable | | | 4,763,986 | | | | 3,301,130 | | | | 8,813,303 | |
| Deferred policy acquisition costs | | | 654,709 | | | | 264,256 | | | | 502,955 | |
| Other assets | | | (61,542 | ) | | | 129,300 | | | | 47,984 | |
| Unpaid losses and loss adjustment expenses | | | (10,025,713 | ) | | | (7,069,182 | ) | | | (16,076,121 | ) |
| Unearned premium | | | (2,881,467 | ) | | | (1,150,703 | ) | | | (2,780,494 | ) |
| Advance premium and premium deposits | | | (204,306 | ) | | | (158,501 | ) | | | (966,737 | ) |
| Accrued expenses and other liabilities | | | (794,014 | ) | | | (1,119,331 | ) | | | 1,441,623 | |
| Income taxes current/deferred | | | 57,831 | | | | (1,061,553 | ) | | | 926,869 | |
| Net Cash (Used) by Operating Activities | | | (5,885,624 | ) | | | (2,663,559 | ) | | | (1,675,603 | ) |
| | | | | | | | | | | | | |
| Cash flows from investing activities: | | | | | | | | | | | | |
| Purchase of fixed maturity investments | | | (33,024,508 | ) | | | (36,074,521 | ) | | | (63,594,497 | ) |
| Proceeds from maturity of fixed maturity investments | | | 38,048,999 | | | | 42,950,000 | | | | 67,260,000 | |
| Proceeds from sale of fixed maturity investments | | | - | | | | - | | | | 505,750 | |
| Net decrease (increase) in short-term investments | | | 2,692,183 | | | | 344,201 | | | | (2,145,874 | ) |
| Additions to property and equipment | | | (104,773 | ) | | | (57,742 | ) | | | (14,347 | ) |
| Net Cash Provided by Investing Activities | | | 7,611,901 | | | | 7,161,938 | | | | 2,011,032 | |
| | | | | | | | | | | | | |
| Cash flows from financing activities: | | | | | | | | | | | | |
| Repurchase of common stock | | | - | | | | (2,447,948 | ) | | | (416,583 | ) |
| Dividends paid to stockholders | | | (1,917,209 | ) | | | (1,959,629 | ) | | | - | |
| Proceeds from exercise of stock options | | | 77,599 | | | | - | | | | - | |
| Tax benefit from disqualified incentive stock options | | | 40,031 | | | | - | | | | - | |
| Net Cash (Used) by Financing Activities | | | (1,799,579 | ) | | | (4,407,577 | ) | | | (416,583 | ) |
| | | | | | | | | | | | | |
Net increase (decrease) in cash | | | (73,302 | ) | | | 90,802 | | | | (81,154 | ) |
| Cash at beginning of year | | | 118,512 | | | | 27,710 | | | | 108,864 | |
| Cash at End of Year | | $ | 45,210 | | | $ | 118,512 | | | $ | 27,710 | |
| | | | | | | | | | | | | |
| Supplemental cash flow information | | | | | | | | | | | | |
| Cash paid during the period for: | | | | | | | | | | | | |
| Interest | | | - | | | | - | | | | - | |
| Income taxes | | $ | 833,931 | | | $ | 2,308,920 | | | $ | 1,800,240 | |
| | | | | | | | | | | | | |
| Supplemental Schedule of Non-Cash Investing Activities | | | | | | | | | | | | |
| Acquisition of fixed assets | | $ | 1,431,917 | | | | - | | | | - | |
| | | | | | | | | | | | | |
| | | 2008 | | | 2007 | | | 2006 | |
| | | | | | | | | | |
| Cash flows from operating activities: | | | | | | | | | |
| Net income | | $ | 5,283,016 | | | $ | 6,712,444 | | | $ | 11,925,466 | |
| Adjustments to reconcile net income to net cash from operations | | | | | | | | | | | | |
| Depreciation and amortization | | | 212,028 | | | | 238,876 | | | | 238,834 | |
| Bond amortization, net | | | 286,907 | | | | (34,171 | ) | | | (66,447 | ) |
| Net realized gain on sale of fixed maturities | | | (6,306 | ) | | | - | | | | (2,617 | ) |
| Changes in assets and liabilities | | | | | | | | | | | | |
| Premium, notes and investment income receivable | | | 639,370 | | | | 982,948 | | | | 343,736 | |
| Reinsurance recoverable | | | 8,813,303 | | | | (4,955,568 | ) | | | 3,602,749 | |
| Deferred policy acquisition costs | | | 502,955 | | | | 707,418 | | | | 925,914 | |
| Other assets | | | 47,984 | | | | 47,038 | | | | (53,261 | ) |
| Unpaid losses and loss adjustment expenses | | | (16,076,121 | ) | | | 1,134,594 | | | | (8,318,431 | ) |
| Unearned premium | | | (2,780,494 | ) | | | (3,691,575 | ) | | | (4,184,860 | ) |
| Advance premium and premium deposits | | | (966,737 | ) | | | 357,047 | | | | 341,453 | |
| Accrued expenses and other liabilities | | | 1,441,623 | | | | 245,062 | | | | (614,364 | ) |
| Tax benefit from disqualified incentive stock options | | | - | | | | (60,786 | ) | | | (203,126 | ) |
| Income taxes current/deferred | | | 926,869 | | | | (1,796,967 | ) | | | 2,362,848 | |
| Net Cash Provided (Used) by Operating Activities | | | (1,675,603 | ) | | | (113,640 | ) | | | 6,297,894 | |
| | | | | | | | | | | | | |
| Cash flows from investing activities: | | | | | | | | | | | | |
| Purchase of fixed maturity investments | | | (63,594,497 | ) | | | (69,740,710 | ) | | | (68,914,691 | ) |
| Proceeds from maturity of fixed maturity investments | | | 67,260,000 | | | | 70,275,000 | | | | 63,589,500 | |
| Proceeds from sale of fixed maturity investments | | | 505,750 | | | | - | | | | 1,004,000 | |
| Net increase in short-term investments | | | (2,145,874 | ) | | | (536,152 | ) | | | (2,318,488 | ) |
| Additions to property and equipment | | | (14,347 | ) | | | (57,030 | ) | | | (153,410 | ) |
| Net Cash Provided (Used) by Investing Activities | | | 2,011,032 | | | | (58,892 | ) | | | (6,793,089 | ) |
| | | | | | | | | | | | | |
| Cash flows from financing activities: | | | | | | | | | | | | |
| Repurchase of common stock | | | (416,583 | ) | | | (115,261 | ) | | | - | |
| Proceeds from exercise of stock options | | | - | | | | 301,336 | | | | 313,132 | |
| Tax benefit from disqualified incentive stock options | | | - | | | | 60,786 | | | | 203,126 | |
| Net Cash Provided (Used) by Financing Activities | | | (416,583 | ) | | | 246,861 | | | | 516,258 | |
| | | | | | | | | | | | | |
Net increase (decrease) in cash | | | (81,154 | ) | | | 74,329 | | | | 21,063 | |
| Cash at beginning of year | | | 108,864 | | | | 34,535 | | | | 13,472 | |
| Cash at End of Year | | $ | 27,710 | | | $ | 108,864 | | | $ | 34,535 | |
| | | | | | | | | | | | | |
| Supplemental cash flow information | | | | | | | | | | | | |
| Cash paid during the period for: | | | | | | | | | | | | |
| Interest | | | - | | | | - | | | | - | |
| Income taxes | | $ | 1,800,240 | | | $ | 5,150,701 | | | $ | 4,325,651 | |
See accompanying notes to consolidated financial statements.
NOTE 1 - SUMMARY OF SIGNIFICANT ACCOUNTING POLICIES
Nature of Business
Unico American Corporation is an insurance holding company that underwrites property and casualty insurance through its insurance company subsidiary; provides property, casualty, and health insurance through its agency subsidiaries; and provides insurance premium financing and membership association services through its other subsidiaries. Unico American Corporation is referred to herein as the "Company" or "Unico" and such references include both the corporation and its subsidiaries, all of which are wholly owned, unless otherwise indicated. Unico was incorporated under the laws of Nevada in 1969.
Principles of Consolidation
The accompanying consolidated financial statements include the accounts of Unico American Corporation and its subsidiaries. All significant intercompany accounts and transactions have been eliminated in consolidation.
Basis of Presentation
The consolidated financial statements have been prepared in conformity with U.S. generally accepted accounting principles (GAAP). As described in Note 13,15, the Company's insurance subsidiary also files financial statements with regulatory agencies prepared on a statutory basis of accounting that differs from GAAP.
Use of Estimates
in the Preparation of the Financial Statements
The preparation of financial statements in conformity with GAAP requires managementthe Company to make estimates and assumptions that affect its reported amounts of assets and liabilities and its disclosure of any contingent assets and liabilities at the date of its financial statements, as well as its reported amounts of revenues and expenses during the reporting period. The most significant assumptions in the preparation of these consolidated financial statements relate to losses and loss adjustment expenses. While every effort is made to ensure the integrity of such estimates, actual results may differ.
Immaterial Correction To Previously Reported AmountsInvestments
DuringAll of the first quarterCompany’s fixed maturity investments are classified as available-for-sale and are stated at fair value. Although all of 2008,the Company's investments are classified as available-for-sale and the Company identifiedmay sell investment securities from time to time in response to economic and market conditions, its investment guidelines place primary emphasis on buying and holding high-quality investments to maturity. Interest income on fixed maturity investments and short term investments are recognized on an error associated withaccrual basis at each measurement date and our included in net investment income in the Company’s policy fee income. The error arose from the recognitionconsolidated statements of non-refundable policy fee income at policy inception rather than over the policy term in accordance with the SEC’s Staff Accounting Bulletin (SAB) No. 104, Revenue Recognition, and EITF 00-21, “Revenue Arrangements with Multiple Deliverables.”operations.
The unrealized gains or losses from fixed maturities are reported as “accumulated other comprehensive income,” which is a separate component of stockholders’ equity, net of any deferred tax effect. For fixed maturity investments that the Company madedoes not intend to sell or for which it is more likely than not that the Company would not be required to sell before an assessmentanticipated recovery in value, the Company separates the credit loss component of the materialityimpairment, if any, from the amount related to all other factors and reports the credit loss component in net realized investment gains (losses). There was no credit loss component for any of this itemthe periods presented in the accompanying Consolidated Statements of Operations. The impairment related to all other factors is reported in “accumulated other comprehensive income.” Realized gains and losses, if any, are included in the Consolidated Statements of Operations based on the Company’s historical financial statements in accordance with SAB No. 99, “Materiality,” and concluded that the error was immaterial to all periods. The Company also concluded that had the error been adjusted when it was identified within the first quarter of 2008, the impact of such an adjustment would have been material to its first quarter 2008 financial statements and was expected to be material to its full year 2008 financial statements.specific identification method.
Accordingly, in accordance with SAB No. 108, “Considering the EffectsFair Value of Prior Year Misstatements when Quantifying Misstatements in Current Year Financial Statements,” the prior year’s consolidated balance sheets, consolidated statements of operations, consolidated statements of comprehensive income, consolidated statements of changes in stockholders’ equity , and the consolidated statements of cash flows herein have been revised to correct the immaterial error and to reflect the corrected balances as of that date.
The line items in the financial statements that are impacted by this error are detailed in the tables below.
| | | Consolidated Balance Sheets For the year ended December 31, 2007 | |
| | | As previously reported | | | Correction | | | As corrected | |
| | | | | | | | | | |
| Deferred income taxes | | $ | 295,026 | | | $ | 391,884 | | | $ | 686,910 | |
| Accrued expenses and other liabilities | | $ | 3,887,546 | | | $ | 1,152,599 | | | $ | 5,040,145 | |
| Retained earnings | | $ | 64,353,457 | | | $ | (760,715 | ) | | $ | 63,592,742 | |
| | | Consolidated Statements of Operations For the year ended December 31, 2007 | |
| | | As previously reported | | | Correction | | | As corrected | |
| | | | | | | | | | |
| Gross commission and fees | | $ | 5,366,031 | | | $ | 149,602 | | | $ | 5,515,633 | |
| Income tax provision | | $ | 3,309,844 | | | $ | 50,865 | | | $ | 3,360,709 | |
| Net income | | $ | 6,613,707 | | | $ | 98,737 | | | $ | 6,712,444 | |
| | | For the year ended December 31, 2006 | |
| | | As previously reported | | | Correction | | | As corrected | |
| | | | | | | | | | | | | |
| Gross commission and fees | | $ | 4,987,332 | | | $ | 198,825 | | | $ | 5,186,157 | |
| Income tax provision | | $ | 6,359,745 | | | $ | 67,600 | | | $ | 6,427,345 | |
| Net income | | $ | 11,794,241 | | | $ | 131,225 | | | $ | 11,925,466 | |
| | | Consolidated Statements of Comprehensive Income For the year ended December 31, 2007 | |
| | | As previously reported | | | Correction | | | As corrected | |
| | | | | | | | | | |
| Net income | | $ | 6,613,707 | | | $ | 98,737 | | | $ | 6,712,444 | |
| Comprehensive income | | $ | 8,745,935 | | | $ | 98,737 | | | $ | 8,844,672 | |
| | | For the year ended December 31, 2006 | |
| | | As previously reported | | | Correction | | | As corrected | |
| | | | | | | | | | | | | |
| Net income | | $ | 11,794,241 | | | $ | 131,225 | | | $ | 11,925,466 | |
| Comprehensive income | | $ | 11,960,391 | | | $ | 131,225 | | | $ | 12,091,616 | |
| | | Statement of Comprehensive Income For the year ended December 31, 2007 | |
| | | As previously reported | | | Correction | | | As corrected | |
| | | | | | | | | | |
| Retained Earnings - Balance as of 12/31/2006 | | $ | 57,850,351 | | | $ | (859,452 | ) | | $ | 56,990,899 | |
| Net income | | $ | 6,613,707 | | | $ | 98,737 | | | $ | 6,712,444 | |
| | | For the year ended December 31, 2006 | |
| | | As previously reported | | | Correction | | | As corrected | |
| | | | | | | | | | | | | |
| Retained Earnings - Balance as of 12/31/2005 | | $ | 48,394,373 | | | $ | (990,677 | ) | | $ | 47,403,696 | |
| Net income | | $ | 11,794,241 | | | $ | 131,225 | | | $ | 11,925,466 | |
| | | Consolidated Statements of Cash Flows For the year ended December 31, 2007 | |
| | | As previously reported | | | Correction | | | As corrected | |
| | | | | | | | | | |
| Net income | | $ | 6,613,707 | | | $ | 98,737 | | | $ | 6,712,444 | |
| Accrued expenses and other liabilities | | $ | 394,664 | | | $ | (149,602 | ) | | $ | 245,062 | |
| Income taxes current/deferred | | $ | (1,847,832 | ) | | $ | 50,865 | | | $ | (1,796,967 | ) |
| | | For the year ended December 31, 2006 | |
| | | As previously reported | | | Correction | | | As corrected | |
| | | | | | | | | | | | | |
| Net income | | $ | 11,794,241 | | | $ | 131,225 | | | $ | 11,925,466 | |
| Accrued expenses and other liabilities | | $ | (415,539 | ) | | $ | (198,825 | ) | | $ | (614,364 | ) |
| Income taxes current/deferred | | $ | 2,295,248 | | | $ | 67,600 | | | $ | 2,362,848 | |
Investments
Statement of Financial Accounting Standards No. 157 “Fair Value Measurements,” (SFAS No. 157) was adopted by theThe Company as of January 1, 2008. SFAS No. 157 establishesemploys a fair value hierarchy that prioritizes the inputs to valuation techniques used to measure fair value. The fair value of a financial instrument is the amount that would be received to sell an asset or paid to transfer a liability in an orderly transaction between market participants at the measurement date (the exit price). Financial assets and financial liabilities recorded on the consolidated balance sheets at fair value are categorized based on the reliability of inputs to the valuation techniques as follows:techniques. (See Note 4)
Level 1 - Financial assets and financial liabilities whose values are based on unadjusted quoted prices in active markets for identical assets.
Level 2 - Financial assets and financial liabilities whose values are based on quoted prices for similar assets or liabilities in active markets; quoted prices for identical or similar assets or liabilities in non-active markets; or valuation models whose inputs are observable, directly or indirectly, for substantially the full term of the asset or liability.
Level 3 - Financial assets and financial liabilities whose values are based on prices or valuation techniques that require inputs that are both unobservable and significant to the overall fair value measurement. These inputs reflect the Company’s estimates of the assumptions that market participants would use in valuing the financial assets and financial liabilities.
The hierarchy gives the highest priority to Level 1 inputs and the lowest priority to Level 3 inputs. In certain cases, the inputs used to measure fair value may fall into different levels of the fair value hierarchy. In such cases, the level in the fair value hierarchy within which the fair value measurement in its entirety falls has been determined based on the lowest level input that is significant to the fair value measurement in its entirety. The Company’s assessment of the significance of a particular input to the fair value measurement in its entirety requires judgment and considers factors specific to the asset or liability.
The Company’s fixed maturities investments are all classified within Level 1 of the fair value hierarchy because they are valued using quoted market prices, broker or dealer quotations, or alternative pricing sources in active markets for identical assets with reasonable levels of price transparency. Fair value measurements are not adjusted for transaction costs.
All of the Company’s fixed maturity investments are classified as available-for-sale and are stated at fair value. Although all of the Company's investments are classified as available-for-sale and the Company may sell investment securities from time to time in response to economic and market conditions, its investment guidelines place primary emphasis on buying and holding high-quality investments to maturity. Short-term investments are carried at cost, which approximates fair value. The unrealized gains or losses from fixed maturities are reported as “accumulated other comprehensive income (loss),” which is a separate component of stockholders’ equity, net of any deferred tax effect. When a decline in value of a fixed maturity or equity security is considered other than temporary, a loss is recognized in the Consolidated Statements of Operations. Realized gains and losses, if any, are included in the Consolidated Statements of Operations based on the specific identification method.
The Company had unrealized investment gain, net of deferred taxes of $4,904,873 as of December 31, 2008,has used the following methods and unrealized investment gains, net of deferred taxes of $1,916,154 as of December 31, 2007.assumptions in estimating its fair value disclosures:
| 1. | Investment securities, excluding long-term certificates of deposit - Fair values are obtained from a national quotation service. |
| 2. | Long-term certificates of deposit - The carrying amounts reported at cost in the balance sheet for these instruments approximate their fair values. |
| · | Cash and short-term investments - The carrying amounts reported at cost in the balance sheet approximate their fair values given the short term nature of these instruments. |
| · | Premiums and notes receivable - The carrying amounts reported at cost in the balance sheet approximate their fair values given the short term nature of these instruments. |
Property and Equipment
Property and equipment are stated at cost less accumulated depreciation. Depreciation is computed using straight line methods over three3 to seven7 years.
Income Taxes
The Company and its wholly owned subsidiaries file consolidated federal and state income tax returns. Pursuant to the tax allocation agreement, two of the Company’s subsidiaries, Crusader and American Acceptance Corporation are allocated taxes, or tax credits in the case of losses, at current corporate rates based on their own taxable income or loss. The Company is subject to examination by U.S. federal income tax authorities for tax returns filed starting at taxable year 2007 and California state income tax authorities for tax returns filed starting at taxable year 2006. There are no ongoing examinations of income tax returns by federal or state tax authorities.
As of December 31, 2010, the Company had no unrecognized tax benefits and no additional liabilities or reduction in deferred tax asset. In addition, the Company had not accrued interest and penalties related to unrecognized tax benefits. However, if interest and penalties would need to be accrued related to unrecognized tax benefits, such amounts would be recognized as a component of federal income tax expense.
The provision for federal income taxes is computed on the basis of income as reported for financial reporting purposes. Deferred income taxes reflect the net tax effects of temporary differences between the carrying amounts of assets and liabilities for financial reporting purposes and the amounts used for income tax purposes, and are measured using the enacted tax rates and laws expected to apply to taxable income in the years in which those temporary differences are expected to be recovered or settled. Income tax expense provisions increase or decrease in the same period in which a change in tax rates is enacted.
In June 2006, the Financial Accounting Standards Board (FASB) issued FASB Interpretation No. 48, “Accounting for Uncertainty in Income Taxes, an Interpretation of FASB Statement No. 109, Accounting for Income Taxes” (FIN 48). This interpretation clarifies the accounting for uncertainty in income taxes recognized in an enterprise’s financial statements in accordance with FASB Statement No. 109, “Accounting for Income Taxes.” FIN 48 prescribes a recognition threshold and measurement attribute for the financial statement recognition and measurement of a tax position taken or expected to be taken in a tax return. This interpretation also provides guidance on derecognition, classification, interest and penalties, accounting in interim periods, disclosure, and transition. This interpretation became effective January 1, 2007. The Company had no unrecognized tax benefits and recognized no additional liability or reduction in deferred tax assets as a result of the adoption of FIN 48 effective January 1, 2007. In addition, the Company had not accrued interest and penalties related to unrecognized tax benefits. However, if interest and penalties would need to be accrued related to unrecognized tax benefits, such amounts would be recognized as a component of federal income tax expense. As of December 31, 2008, the Company had no unrecognized tax benefits and no additional liabilities or reduction in deferred tax asset as a result of the adoption of FIN 48 effective January 1, 2007.
The Company and its subsidiaries file federal and state income tax returns. Management does not believe that the ultimate outcome of any future examinations of open tax years will have a material impact on the Company’s results of operations. Tax years that remain subject to examination by major taxing jurisdictions are 2007 through 2008 for federal income taxes and 2004 through 2008 for California state income taxes. On April 30, 2008, the Company was notified by the Internal Revenue Service that the Company’s consolidated federal income tax return on Form 1120 for the tax year ended December 31, 2006, was selected for examination. On December 18, 2008, the Company was notified by the Internal Revenue Service that its Form 1120 for the tax year ended December 31, 2006, was accepted with no change.
Fair Value of Financial Instruments
The Company has used the following methods and assumptions in estimating its fair value disclosures:
| · | Investment Securities - Fair values for fixed maturity securities are obtained from a national quotation service. The fair values for equity securities are based on quoted market prices.
|
| · | Cash and Short-Term Investments - The carrying amounts reported in the balance sheet for these instruments approximate their fair values. |
| · | Premiums and Notes Receivable - The carrying amounts reported in the balance sheet for these instruments approximate their fair values. |
Earnings Per Share
Basic earnings per share exclude the impact of common share equivalents and are based upon the weighted average common shares outstanding. Diluted earnings per share utilize the average market price per share when applying the treasury stock method in determining common share dilution. When dilutive, outstanding stock options are treated as common share equivalents for purposes of computing diluted earnings per share and represent the difference between basic and diluted weighted average shares outstanding. In loss periods, options are excluded from the calculation of diluted earnings per share, as the inclusion of such options would have an anti-dilutive effect.
Revenue Recognition
a. General Agency Operations
Commissions due the Company are recognized as income on the effective date of the insurance policies. Policy fee income is recognized on a pro-rata basis over the terms of the policies.
b. Insurance Company Operations
Premiums are earned on a pro-rata basis over the terms of the policies. Premiums applicable to the unexpired terms of policies in force are recorded as unearned premiums. The Company earnsreceives a commission on policies that are ceded to its reinsurers. This commission is considered earned on a pro-rata basis over the terms of the policies.
c. Insurance Premium Financing Operations
Premium finance interest is charged to policyholders who choose to finance insurance premiums. Interest is charged at rates that vary with the amount of premium financed. Premium finance interest is recognized using a method that approximates the interest (actuarial) method.
Losses and Loss Adjustment Expenses
The liability for unpaid losses and loss adjustment expenses is based upon the accumulation of individual case estimates for losses reported prior to the close of the accounting period plus estimates based on experience and industry data for development of case estimates and for incurred but unreported losses and loss adjustment expenses.
There is a high level of uncertainty inherent in the evaluation of the required loss and loss adjustment expense reserves for the Company. The long-tailed nature of liability claims and the volatility of jury awards exacerbate that uncertainty. The Company setsrecords loss and loss adjustment expense reserves at each balance sheet date atbased upon management’s best estimate of the ultimate payments that it anticipates will be made to settle all losses incurred and related expenses incurred as of that date for both reported and unreported losses. The ultimate cost of claims is dependent upon future events, the outcomes of which are affected by many factors. Company claim reserving procedures and settlement philosophy, current and perceived social and economic inflation, current and future court rulings and jury attitudes, improvements in medical technology, and many other economic, scientific, legal, political, and social factors all can have significant effects on the ultimate costs of claims. Changes in Company operations and management philosophy also may cause actual developments to vary from the past. Since the emergence and disposition of claims are subject to uncertainties, the net amounts that will ultimately be paid to settle claims may vary significantly from the estimated amounts provided for in the accompanying consolidated financial statements. Any adjustments to reserves are reflected in the operating results of the periods in which they are made. Management believes that the aggregate reserves for losses and loss adjustment expenses are reasonable and adequate to cover the cost of claims, both reported and unreported.
Restricted Funds
Restricted funds are as follows:
| | | Year ended December 31 | | | Year ended December 31 | |
| | | 2008 | | | 2007 | | | 2010 | | | 2009 | |
| | | | | | | | | | | | | |
| Premium trust funds (1) | | $ | 236,104 | | | $ | 1,172,913 | | | $ | - | | | $ | - | |
| Assigned to state agencies (2) | | | 700,000 | | | | 700,000 | | | | 700,000 | | | | 700,000 | |
| Total restricted funds | | $ | 936,104 | | | $ | 1,872,913 | | | $ | 700,000 | | | $ | 700,000 | |
| | (1) | As required by law, the Company segregates from its operating accounts the premiums collected from insureds which are payable to insurance companies into separate trust accounts. These amounts are included in cash and short-term investments. In the years ended December 31, 2010 and 2009, the Company’s receivables from insurance policies exceeded its premiums payable to insurance companies; therefore, there were no trust restrictions on cash and short-term investments. |
| | (2) | Included in fixed maturity investments are statutory deposits assigned to and held by the California State Treasurer and the Insurance Commissioner of the State of Nevada. These deposits are required for writing certain lines of business in California and for admission in states other than California. |
Deferred Policy Acquisition Costs
Policy acquisition costs consist of costs associated with the production of insurance policies such as commissions, premium taxes, and certain other underwriting expenses that vary with and are primarily related to the productionacquisition of thenew and renewal insurance policy.policies. Policy acquisition costs are deferred and amortized as the related premiums are earned and are limited to their estimated realizable value based on the related unearned premiums plus investment income less anticipated losses and loss adjustment expenses. Ceding commission applicable to the unexpired terms of policies in force is recorded as unearned ceding commission, which is included in deferred policy acquisition costs.
Reinsurance
The Company cedes reinsurance to provide for greater diversification of business to allowallowing management to control exposure to potential losses arising from large risks by reinsuring certain levels of risk in various areas of exposure, to reduce the loss that may arise from catastrophes, and to provide additional capacity for growth. Prepaid reinsurance premiums and reinsurance receivables are reported as assets and represent ceded unearned premiums and reinsurance recoverable on both paid and unpaid losses, respectively. Amounts recoverable from reinsurers are estimated in a manner consistent with the claim liability associated with the reinsured policies. The Company evaluates each of its ceded reinsurance contracts at theirits inception to determine if there is a sufficient risk transfer to allow the contract to be accounted for as reinsurance under current accounting literature. As of December 31, 2008,2010, all such ceded contracts are accounted for as risk transfer reinsurance.
The Company evaluates and monitors the financial condition of its reinsurers and factors such as collection periods, disputes, applicable coverage defenses and other factors to assess the need for any allowance against anticipated reinsurance recoveries. No such allowance was considered necessary at December 31, 2010 or 2009.
Segment Reporting
Statement of Financial Accounting Standards No. 131, “Disclosures about Segments of an Enterprise and Related Information,”ASC 280 establishes standards for the way information about operating segments isare reported in financial statements. The Company has identified its insurance company operation as its primary reporting segment. Revenues from this segment comprised 87% of consolidated revenues for the year ended December 31, 2008, 88%2010, 86% of consolidated revenues for the year ended December 31, 2007,2009, and 89%87% for the year ended December 31, 2006.2008. The Company’s remaining operations constitute a variety of specialty insurance services, each with unique characteristics and individually insignificant to consolidated revenues.
The insurance company operation is conducted through the Company’s wholly owned subsidiary Crusader Insurance Company (Crusader), which as of December 31, 2008,2010, was licensed as an admitted insurance carrier in the states of Arizona, California, Nevada, Oregon, and Washington. Crusader is a multiple-linemulti-line property and casualty insurance company, which began transacting business on January 1, 1985. For the year ended December 31, 2008,2010, 98% of Crusader’s business was commercial multiplemulti peril (CMP) insurance policies. CMP policies provide a combination of property and liability coverage for businesses. Commercial property coverages insure against loss or damage to buildings, inventory and equipment from natural disasters, including hurricanes, windstorms, hail, water, explosions, severe winter weather, and other events such as theft and vandalism, fires and storms and financial loss due to business interruption resulting from covered property damage. However, Crusader does not write earthquake coverage. Commercial liability coverages insure against third party liability from accidents occurring on the insured’s premises or arising out of its operations, such as injuries sustained from products sold or the operation of the insuredinsured’s premises. In addition to commercial multiple perilCommercial Multi Peril policies, Crusader also writes separate policies to insure commercial property and commercial liability risks on a mono-line basis.
Revenues, income before income taxes and assets by segment are as follows:
| | | Year ended December 31 | | | Year ended December 31 | |
| | | 2008 | | | 2007 | | | 2006 | | | 2010 | | | 2009 | | | 2008 | |
| Revenues | | | | | | | | | | | | | | | | | | |
| Insurance company operation | | $ | 40,527,988 | | | $ | 44,137,213 | | | $ | 48,942,568 | | | $ | 32,334,184 | | | $ | 35,936,552 | | | $ | 40,527,988 | |
| | | | | | | | | | | | | | | | | | | | | | | | | |
| Other insurance operations | | 17,315,124 | | | 18,673,945 | | | 20,294,473 | | | | 13,748,509 | | | | 16,345,676 | | | | 17,315,124 | |
| Intersegment elimination (1) | | | (11,073,668 | ) | | | (12,438,263 | ) | | | (14,320,835 | ) | |
| Intersegment eliminations (1) | | | | (8,961,942 | ) | | | (10,665,122 | ) | | | (11,073,668 | ) |
| Total other insurance operations | | | 6,241,456 | | | | 6,235,682 | | | | 5,973,638 | | | | 4,786,567 | | | | 5,680,554 | | | | 6,241,456 | |
| | | | | | | | | | | | | | | | | | | | | | | | | |
| Total revenues | | $ | 46,769,444 | | | $ | 50,372,895 | | | $ | 54,916,206 | | | $ | 37,120,751 | | | $ | 41,617,106 | | | $ | 46,769,444 | |
| | | | | | | | | | | | | | | | | | | | | | | | | |
| Income before income taxes | | | | | | | | | | | | | | | | | | | | | | | | |
| Insurance company operation | | $ | 10,369,791 | | | $ | 11,865,603 | | | $ | 19,589,474 | | | $ | 6,120,731 | | | $ | 7,176,928 | | | $ | 10,369,791 | |
| Other insurance operations | | | (2,385,325 | ) | | | (1,792,450 | ) | | | (1,236,663 | ) | | | (2,900,150 | ) | | | (3,012,950 | ) | | | (2,385,325 | ) |
| Total income before income taxes | | $ | 7,984,466 | | | $ | 10,073,153 | | | $ | 18,352,811 | | | $ | 3,220,581 | | | $ | 4,163,978 | | | $ | 7,984,466 | |
| | | | | | | | | | | | | | | | | | | | | | | | | |
| Assets | | | | | | | | | | | | | | | | | | | | | | | | |
| Insurance company operation | | $ | 171,700,199 | | | $ | 177,278,243 | | | $ | 167,475,047 | | | $ | 140,555,882 | | | $ | 157,271,019 | | | | | |
| Intersegment eliminations (2) | | | (1,658,771 | ) | | | (1,537,590 | ) | | | (1,711,026 | ) | | | (600,113 | ) | | | (824,887 | ) | | | | |
| Total insurance company operation | | 170,041,428 | | | 175,740,653 | | | 165,764,021 | | | | 139,955,769 | | | | 156,446,132 | | | | | |
| Other insurance operations | | | 14,561,548 | | | | 18,035,208 | | | | 22,480,563 | | | | 17,718,951 | | | | 13,662,520 | | | | | |
| Total assets | | $ | 184,602,976 | | | $ | 193,775,861 | | | $ | 188,244,584 | | | $ | 157,674,720 | | | $ | 170,108,652 | | | | | |
(1) Intersegment revenue eliminations reflect commissions paid by Crusader to Unifax.Unifax Insurance Systems, Inc., a wholly owned subsidiary of Unico (Unifax).
(2) Intersegment asset eliminations reflect the elimination of Crusader receivables and Unifax payables.
In 20082010 and 2007,2009, 100% of Crusader’s gross premium written was derived from California. In 20082010, approximately 82%61% of the $2,754,293$1,933,288 commission and fee income from the Company’s health insurance program was from CIGNA HealthCare (CIGNA) medical and dental plan programs. In 20072009, approximately 79%76% of the $2,320,161$2,526,772 commission and fee income from the Company’s health insurance program was from CIGNA HealthCare medical and dental plan programs.
At December 31, 2008,2010, the Company’s reinsurance recoverable on paid and unpaid losses and loss adjustment expenses of $19,930,307 were$11,865,191 was as follows:
Name of Reinsurer | | A.M. Best Rating | | | Amount Recoverable | | | A.M. Best Rating | | | Amount Recoverable | |
| | | | | | | | | | | | | |
| Platinum Underwriters Reinsurance, Inc. | | A | | | $ | 10,883,579 | | | | A | | | $ | 7,195,950 | |
| Hannover Ruckversicherungs AG | | A | | | 5,600,417 | | | | A | | | | 3,539,945 | |
| Partners Reinsurance Company of the U.S. | | A | + | | 2,526,231 | | | | A | + | | | 855,769 | |
| General Reinsurance Corporation | | A | ++ | | 488,671 | | | | A | ++ | | | 38,737 | |
| QBE Reinsurance Corporation | | | A | | | | 431,409 | | | | A | | | | 234,790 | |
| Total | | | | | | $ | 19,930,307 | | | | | | | $ | 11,865,191 | |
Stock-Based Compensation
Effective January 1, 2006, the Company adopted Statement of Financial Accounting Standards No. 123 (revised 2004), “Share-Based Payment” (SFAS No. 123R), using the modified prospective transition method and, therefore, has not restated results from prior periods. Under this transition method, share-based compensation expense for 2006 includes compensation expense for all share-based compensation awards granted but not vested prior to January 1, 2006, based on the grant-date fair value estimated in accordance with the original provisions of Statement of Financial Accounting Standards No. 123, “Accounting for Stock-Based Compensation.” Share-based compensation expense for all share-based payment awards granted or modified on or after January 1, 2006, is based on the grant-date fair value estimated in accordance with the provisions of SFAS No. 123R.
Prior to January 1, 2006,ASC 718, “Compensation - Stock Compensation” using the Company applied the intrinsic-value based method of accounting prescribed by Accounting Principles Board (APB) Opinion No. 25, “Accounting for Stock Issued to Employees,” and related interpretations including FASB Interpretation No. 44, “Accounting for Certain Transactions Involving Stock Compensation,” an interpretation of APB Opinion No. 25, to account for its fixed-plan stock options. Under this method, compensation expense was recorded on the date of grant only if the current market price of the underlying stock exceeded the exercise price. FASB Statement No. 123, “Accounting for Stock-Based Compensation,” (SFAS 123), and FASB Statement No. 148, “Accounting for Stock Based Compensation – Transition and Disclosure,” an amendment of SFAS 123, established accounting and disclosure requirements using a fair-value based method of accounting for stock-based employee compensation plans. As permitted by existing accounting standards, the Company elected to continue to apply the intrinsic-value based method of accounting described above and has adopted only the disclosure requirements of SFAS 123, as amended for applicable periods prior to 2006. In December 2004, FASB Statement No. 123R (SFAS 123R) which revised SFAS 123 was issued and was adopted by the Company in 2006 (see Note 14).
On December 30, 2005, the Company accelerated the vesting of all of its outstanding stock-based compensation awards granted under the Company’s 1999 Omnibus Stock Plan. All accelerated options were “in the money.” The number of shares covered by the options accelerated totaled 67,500 of which 37,500 were originally scheduled to vest on January 1, 2006, and 30,000 were originally scheduled to vest on January 1, 2007. The Company accelerated vesting of the options in order to minimize the compensation costs associated with the adoption of SFAS 123R. All accelerated options were granted to long-term management employees who were not expected to leave the Company prior to the originally scheduled vesting date. The estimated compensation cost which would be excluded from future periods as a result of the acceleration of the vesting of the options was approximately $89,100. There were no options granted during 2008 and 2007 and there were no unvested options as of January 1, 2006, on adoption of SFAS 123R; as a result, there were no compensation expenses recorded for the years ended December 31, 2007, and December 31, 2008.
Reinsurance
The Company cedes reinsurance to provide for greater diversification of business, to allow management to control exposure to potential losses arising from large risks by reinsuring certain levels of risk in various areas of exposure, to reduce the loss that may arise from catastrophes, and to provide additional capacity for growth. The Company evaluates each of its ceded reinsurance contracts at its inception to determine if there is a sufficient risk transfer to allow the contract to be accounted for as reinsurance under current accounting literature. As of December 31, 2008, all such ceded contracts are accounted for as risk transfer reinsurance. Prepaid reinsurance premiums and reinsurance receivables are reported as assets and represent ceded unearned premiums and reinsurance recoverable on both paid and unpaid losses, respectively. Amounts recoverable from reinsurers are estimated in a manner consistent with the claim liability associated with the reinsured policies.modified prospective transition method.
Recently Issued Accounting Standards
In May 2008,October 2010, the FASB issued SFAS No. 162, “The Hierarchya new standard to address diversity in practice regarding the interpretation of Generally Accepted Accounting Principles” (SFAS No. 162). SFAS No. 162 identifieswhich costs relating to the sourcesacquisition of accounting principles andnew or renewal insurance contracts qualify for deferral. Costs that meet the framework for selecting the principles to be useddefinition defined in the preparationnew standard are recognized as assets and referred to as deferred acquisition costs. Deferred acquisition costs are amortized over time using amortization methods dependent upon the nature of financial statementsthe underlying insurance product. Other costs that do not vary with and are not primarily related to the acquisition of nongovernmental entities thatnew and renewal insurance contracts are presented in conformity with GAAP (GAAP hierarchy).charged to expense as incurred. The current GAAP hierarchy, as set forthnew standard will be effective for fiscal years, and interim periods within those fiscal years, beginning after December 15, 2011. The Company is in the American Instituteprocess of Certified Public Accountants (AICPA) Statement on Auditing Standards No. 69, “The Meaningevaluating the impact of Present Fairly in Conformity With Generally Accepted Accounting Principles,” has been criticized because (1) it is directed to the auditor rather than the entity, (2) it is complex, and (3) it ranks FASB Statements of Financial Accounting Concepts, which are subject to the same level of due process as FASB Statements of Financial Accounting Standards, below industry practices that are widely recognized as generally accepted but that are not subject to due process. SFAS No. 162 shall be effective 60 days following the Securities and Exchange Commission’s approvaladoption of the Public Company Accounting Oversight Board amendments to U.S. Auditing Standards Section 411, “The Meaning of Present Fairly in Conformity With Generally Accepted Accounting Principles.” SFAS No. 162 is not expected to have a material impactnew standard on the Company’s consolidated financial statements.
EffectiveIn January 1, 2008, the Company adopted SFAS No. 157 for financial assets and liabilities. In December 2007,2010, the FASB providedissued a one-year deferral of SFAS No. 157 for non-financial assets and non-financial liabilities, except those that are recognized or disclosed atnew standard related to fair value on a recurring basis, at least annually. SFAS No. 157 redefines fair values asmeasurements and disclosures, which amends the price that would be receivedearlier FASB standard to sell an asset or paid to transfer a liability in an orderly transaction between market participants at the measurement date, establishes a frameworkadd new requirements for measuringdisclosures about transfers into and out of Levels 1 and 2 fair value in GAAP,measurements and expandsseparate disclosures about purchases, sales, issuances, and settlements related to Level 3 fair value measurements. Specifically, SFAS No. 157 establishes a three-level hierarchy forThe new standard also clarifies existing fair value measurements based upondisclosures about the naturelevel of thedisaggregation and about inputs and valuation techniques used to the valuation of an asset or liability. SFAS No. 157 applies where other accounting pronouncements require or permit fair value measurements. In October 2008, the FASB issued FASB Staff Position No. 157-3 “Determining the Fair Value of a Financial Asset When the Market for That Asset Is Not Active” (FSP FAS 157-3), which clarifies the application of SFAS No. 157 in a market that is not active and provides an example to illustrate key considerations in determiningmeasure the fair valuevalue. The Company adopted the new accounting standard which became effective for the interim reporting period ended March 31, 2010, except for the requirement to provide the Level 3 activity of purchases, sales, issuances, and settlements on a financial asset when the marketgross basis, which will be effective for that financial asset is not active. Such considerations include inputs to broker quotes, assumptions regarding future cash flowsfiscal years beginning after December 15, 2010, and use of risk-adjusted discount rates.for interim periods within those fiscal years. The adoption of FSP FAS No. 157-3the new standard did not have a material impact on the Company’s consolidated financial statements.
In February 2007, the FASB issued SFAS No. 159, “The Fair Value Option for Financial Assets and Financial Liabilities - Including an Amendment of FASB Statement No. 115.” SFAS No. 159 permits an entity to measure certain financial assets and financial liabilities at fair value. The main objective of SFAS No. 159 is to improve financial reporting by allowing entities to mitigate volatility in reported earnings caused by the measurement of related assets and liabilities using different attributes, without having to apply complex hedge accounting provisions. Entities that elect the fair value option will report unrealized gains and losses in earnings at each subsequent reporting date. SFAS No. 159 establishes presentation and disclosure requirements to help financial statement users understand the effect of the entity’s election on its earnings, but does not eliminate disclosure requirements of other accounting standards. SFAS No. 159 is expected to expand the use of fair value measurement, which is consistent with the FASB’s long-term measurement objectives for accounting for financial instruments. SFAS No. 159 is effective as of the beginning of the first fiscal year that begins after November 15, 2007. The Company adopted SFAS No. 159 as of the beginning of 2008 by not electing the fair value option for any of its financial assets or liabilities.
In December 2007, FASB Statements No. 141 (revised 2007), “Business Combinations” (SFAS No. 141R) was issued. SFAS No. 141R replaces FASB Statement No. 141, “Business Combinations.” SFAS No. 141R requires the acquiring entity in a business combination to recognize all (and only) the assets acquired and liabilities assumed in the transaction; establishes the acquisition-date fair value as the measurement objective for all assets acquired and liabilities assumed; and requires the acquirer to disclose additional information regarding the nature and financial effect of the business combination. The Company will adopt SFAS No. 141R for any business combinations initiated after December 31, 2008.
There werehave been no other accounting standards issued during 20082010 that are expected to have a material impact on the Company’s consolidated financial statements.
NOTE 2 –- ADVANCE PREMIUM AND PREMIUM DEPOSITS
The insurance company operation records a liability for advance premium that represents the written premium on policies that have been submitted to the Company and are bound, billed, and recorded prior to their effective date of coverage. These advance premiums are not included in written premium or in the liability for unearned premium.
Some of the Company’s health and life programs require payments of premium prior to the effective date of coverage; and, accordingly, invoices are sent out as early as two months prior to the coverage effective date. Insurance premiums received for coverage months effective after the balance sheet date are recorded as advance premiums. The Company received deposits to guarantee the payment of premiums for past coverage months on its daily automobile rental program. These deposits are required when information such as gross receipts or number of rental cars is required to compute the actual premium due but is not available until after the coverage month.
NOTE 3 - - INVESTMENTS
The amortized cost
A summary of net investment and estimated fair values of investments in fixed maturities by categories arerelated income is as follows:
| | | | | | Gross | | | Gross | | | Estimated | |
| | | Amortized | | | Unrealized | | | Unrealized | | | Fair | |
| | | Cost | | | Gains | | | Losses | | | Value | |
| December 31, 2008 | | | | | | | | | | | | |
| Available for sale: | | | | | | | | | | | | |
| Fixed maturities | | | | | | | | | | | | |
| Certificates of deposit | | $ | 400,000 | | | | - | | | | - | | | $ | 400,000 | |
| U.S. treasury securities | | | 124,526,227 | | | $ | 7,412,273 | | | | - | | | | 131,938,500 | |
| Industrial and miscellaneous taxable bonds | | | 10,614,127 | | | | 85,078 | | | $ | 65,725 | | | | 10,633,480 | |
| Total fixed maturities | | $ | 135,540,354 | | | $ | 7,497,351 | | | $ | 65,725 | | | $ | 142,971,980 | |
| | | | | | | | | | | | | | | | | |
| December 31, 2007 | | | | | | | | | | | | | | | | |
| Available for sale: | | | | | | | | | | | | | | | | |
| Fixed maturities | | | | | | | | | | | | | | | | |
| Certificates of deposit | | $ | 400,000 | | | | - | | | | - | | | $ | 400,000 | |
| U.S. treasury securities | | | 130,211,428 | | | $ | 2,811,090 | | | $ | 8,591 | | | | 133,013,927 | |
| State and municipal tax-exempt bonds | | | 15,045 | | | | - | | | | 5 | | | | 15,040 | |
| Industrial and miscellaneous taxable bonds | | | 9,365,735 | | | | 108,295 | | | | 7,525 | | | | 9,466,505 | |
| Total fixed maturities | | $ | 139,992,208 | | | $ | 2,919,385 | | | $ | 16,121 | | | $ | 142,895,472 | |
A summary of the unrealized appreciation (depreciation) on investments carried at fair value and the applicable deferred federal income taxes are shown below:
| | | Year ended December 31 | |
| | | 2008 | | | 2007 | | | 2006 | |
| | | | | | | | | | |
| Gross unrealized appreciation of fixed maturities: | | $ | 7,497,351 | | | $ | 2,919,385 | | | $ | 147,107 | |
| Gross unrealized (depreciation) of fixed maturities: | | | (65,725 | ) | | | (16,121 | ) | | | (474,493 | ) |
| Net unrealized appreciation (depreciation) on investments | | | 7,431,626 | | | | 2,903,264 | | | | (327,386 | ) |
| Deferred federal tax income (expense) | | | (2,526,753 | ) | | | (987,110 | ) | | | 111,312 | |
| Net unrealized appreciation (depreciation), net of deferred income taxes | | $ | 4,904,873 | | | $ | 1,916,154 | | | $ | (216,074 | ) |
| | | Year ended December 31 | |
| | | 2010 | | | 2009 | | | 2008 | |
| | | | | | | | | | |
| Fixed maturities | | $ | 3,467,801 | | | $ | 4,264,304 | | | $ | 5,730,182 | |
| Realized gains on fixed maturities | | | - | | | | - | | | | 6,306 | |
| Short-term investments | | | 25,129 | | | | 62,169 | | | | 160,556 | |
| Total investment income | | $ | 3,492,930 | | | $ | 4,326,473 | | | $ | 5,897,044 | |
The amortized cost and estimated fair value of fixed maturity investments at December 31, 2008,2010, by contractual maturity are as follows. Expected maturities will differ from contractual maturities because borrowers may have the right to call or prepay obligations with or without penalties.
| | | Amortized | | | Estimated | |
| | | Cost | | | Fair Value | |
| | | | | | | |
| Due in one year or less | | $ | 42,875,272 | | | $ | 43,496,590 | |
| Due after one year through five years | | | 92,665,082 | | | | 99,475,390 | |
| Due after five years through ten years | | | - | | | | - | |
| Total fixed maturities | | $ | 135,540,354 | | | $ | 142,971,980 | |
The following table illustrates the gross unrealized losses included in the Company’s investment portfolio and the fair value of those securities, aggregated by investment category. The table also illustrates the length of time that they have been in a continuous unrealized loss position as of December 31, 2008, and December 31, 2007.| | | Amortized | | | Estimated | |
| | | Cost | | | Fair Value | |
| | | | | | | |
| Due in one year or less | | $ | 48,083,311 | | | $ | 48,445,951 | |
| Due after one year through five years | | | 75,217,969 | | | | 78,266,031 | |
| Due after five years through ten years | | | - | | | | - | |
| Total fixed maturities | | $ | 123,301,280 | | | $ | 126,711,982 | |
| Year Ended | | Amortized | | | | | | Gross | |
| December 31 | | Cost | | | Fair Value | | | Unrealized Loss | |
| | | | | | | | | | |
| 2008 | | | | | | | | | |
| 0-6 months | | $ | 5,590,110 | | | $ | 5,524,385 | | | $ | 65,725 | |
| 7-12 months | | | - | | | | - | | | | - | |
| Over 12 months | | | - | | | | - | | | | - | |
| Total | | $ | 5,590,110 | | | $ | 5,524,385 | | | $ | 65,725 | |
| 2007 | | | | | | | | | | | | |
| 0-6 months | | $ | 7,080,404 | | | $ | 7,071,870 | | | $ | 8,534 | |
| 7-12 months | | | - | | | | - | | | | - | |
| Over 12 months | | | 2,917,362 | | | | 2,909,775 | | | | 7,587 | |
| Total | | $ | 9,997,766 | | | $ | 9,981,645 | | | $ | 16,121 | |
| | | | | | Gross | | | Gross | | | Estimated | |
| | | Amortized | | | Unrealized | | | Unrealized | | | Fair | |
| | | Cost | | | Gains | | | Losses | | | Value | |
| December 31, 2010 | | | | | | | | | | | | |
| Available for sale: | | | | | | | | | | | | |
| Fixed maturities | | | | | | | | | | | | |
| Certificates of deposit | | $ | 27,464,998 | | | | - | | | | - | | | $ | 27,464,998 | |
| U.S. treasury securities | | | 95,836,282 | | | $ | 3,410,702 | | | | - | | | | 99,246,984 | |
| Total fixed maturities | | $ | 123,301,280 | | | $ | 3,410,702 | | | | - | | | $ | 126,711,982 | |
| | | | | | | | | | | | | | | | | |
| December 31, 2009 | | | | | | | | | | | | | | | | |
| Available for sale: | | | | | | | | | | | | | | | | |
| Fixed maturities | | | | | | | | | | | | | | | | |
| Certificates of deposit | | $ | 21,034,997 | | | | - | | | | - | | | $ | 21,034,997 | |
| U.S. treasury securities | | | 103,361,652 | | | $ | 4,057,614 | | | | - | | | | 107,419,266 | |
| Industrial and miscellaneous taxable bonds | | | 4,044,046 | | | | 97,174 | | | | - | | | | 4,141,220 | |
| Total fixed maturities | | $ | 128,440,695 | | | $ | 4,154,788 | | | | - | | | $ | 132,595,483 | |
A summary of the unrealized appreciation (depreciation) on investments carried at fair value and the applicable deferred federal income taxes are shown below:
| | | Year ended December 31 | | |
| | | 2010 | | | 2009 |
| | | | | | |
| Gross unrealized appreciation of fixed maturities | | $ | 3,410,702 | | | $ | 4,154,788 | |
| Gross unrealized (depreciation) of fixed maturities | | | - | | | | - | |
| Net unrealized appreciation on investments | | | 3,410,702 | | | | 4,154,788 | |
| Deferred federal tax (expense) | | | (1,159,639 | ) | | | (1,412,628 | ) |
| Net unrealized appreciation, net of deferred income taxes | | $ | 2,251,063 | | | $ | 2,742,160 | |
At December 31, 2008,2010 and 2009, the Company had no fixed maturity investments with a gross unrealized loss for continuous periods of 0 to 6 months consisted of three investment grade industrial securities.loss.
At December 31, 2007, the fixed maturity investments withNo securities were sold at a gross unrealized loss for continuous periods of 0 to 6 months consisted of U.S. treasury securities. The fixed maturity investments with a gross unrealized loss position for a continuous period over 12 months consisted of U.S. treasury securities, investment grade industrial securities, and pre-refunded municipal bonds.during 2010 or 2009.
The Company monitors its investments closely. If an unrealized loss is determined to be other than temporary,other-than-temporary, it is written off as a realized loss through the Consolidated Statements of Operations. The Company’s methodology of assessing other-than-temporary impairments is based on security-specific analysis as of the balance sheet date and considers various factors including the length of time to maturity and the extent to which the fair value has been less than the cost, the financial condition and the near-term prospects of the issuer, and whether the debtor is current on its contractually obligated interest and principal payments. The Company hasdoes not have the ability and intent to holdsell its fixed maturity investments for a period of time sufficient to allowand it is not likely that the Company would be required to recoversell any of its fixed maturity investments prior to recovery of its amortized costs. The Company has concluded thatdid not sell any fixed maturity investments in the gross unrealized losses of $65,725 atyear ended December 31, 2008, were temporary in nature. However, facts2010 and circumstances may change, which could result in a decline in fair value considered to be other than temporary.2009. The Company sold one fixed maturity investment in the year ended December 31, 2008, with net realized gain in the amount of $6,306. The Company did not sell any fixed maturity investment in the year ended December 31, 2007.
Short-term investments have an initial maturity of one year or less and consist of the following:
| | | Year ended December 31 | | | Year ended December 31 | |
| | | 2008 | | | 2007 | | | 2010 | | | 2009 | |
| | | | | | | | | | | | | |
| U.S. government money market fund | | $ | 5,585,395 | | | $ | 2,425,807 | | | $ | 121,751 | | | $ | 2,562,100 | |
| Commercial paper | | - | | | 3,887,322 | | |
| Short-term U.S. treasury bills | | 399,953 | | | 393,768 | | | | 4,398,003 | | | | - | |
| Bank money market accounts | | 3,312,140 | | | 444,781 | | | | 1,494,033 | | | | 3,348,973 | |
| Certificates of deposit | | 200,000 | | | 200,000 | | | | 450,000 | | | | 3,245,000 | |
| Bank savings accounts | | | 4,545 | | | | 4,481 | | | | 1,862 | | | | 1,759 | |
| Total short-term investments | | $ | 9,502,033 | | | $ | 7,356,159 | | | $ | 6,465,649 | | | $ | 9,157,832 | |
NOTE 4 – FAIR VALUE OF FINANCIAL INSTRUMENTS
In determining the fair value of its financial instruments, the Company employs a fair value hierarchy that prioritizes the inputs to valuation techniques used to measure fair value. The Company manages its own investment portfolio. A summaryfair value of net investmenta financial instrument is the amount that would be received to sell an asset or paid to transfer a liability in an orderly transaction between market participants at the measurement date (the exit price). Financial assets and related income isfinancial liabilities recorded on the consolidated balance sheets at fair value are categorized based on the reliability of inputs to the valuation techniques as follows:
| | | Year ended December 31 | |
| | | 2008 | | | 2007 | | | 2006 | |
| | | | | | | | | | |
| Fixed maturities | | $ | 5,730,182 | | | $ | 6,448,349 | | | $ | 5,824,510 | |
| Realized gains on fixed maturities | | | 6,306 | | | | - | | | | 2,617 | |
| Short-term investments | | | 160,556 | | | | 398,774 | | | | 179,907 | |
| Total investment income | | $ | 5,897,044 | | | $ | 6,847,123 | | | $ | 6,007,034 | |
Level 2 - Financial assets and financial liabilities whose values are based on quoted prices for similar assets or liabilities in active markets; quoted prices for identical or similar assets or liabilities in non-active markets; or valuation models whose inputs are observable, directly or indirectly, for substantially the full term of the asset or liability.
Level 3 - Financial assets and financial liabilities whose values are based on prices or valuation techniques that require inputs that are both unobservable and significant to the overall fair value measurement. These inputs reflect the Company’s estimates of the assumptions that market participants would use in valuing the financial assets and financial liabilities.
The hierarchy gives the highest priority to Level 1 inputs and the lowest priority to Level 3 inputs. In certain cases, the inputs used to measure fair value may fall into different levels of the fair value hierarchy. In such cases, the level in the fair value hierarchy within which the fair value measurement in its entirety falls has been determined based on the lowest level input that is significant to the fair value measurement in its entirety. The Company’s assessment of the significance of a particular input to the fair value measurement in its entirety requires judgment and considers factors specific to the asset or liability.
The estimated carrying values of the Company’s financial instruments as of December 31, 2010 and 2009 allocated among the three levels mentioned above are as follows:
| | | Level 1 | | | Level 2 | | | Level 3 | | | Total | |
| December 31, 2010 | | | | | | | | | | | | |
| Available for sale: | | | | | | | | | | | | |
| Fixed maturities | | | | | | | | | | | | |
| U.S. treasury securities | | $ | 99,246,984 | | | $ | - | | | $ | - | | | $ | 99,246,984 | |
| Certificates of deposit | | | - | | | | 27,464,998 | | | | - | | | | 27,464,998 | |
| Total fixed maturities | | $ | 99,246,984 | | | $ | 27,464,998 | | | $ | - | | | $ | 126,711,982 | |
| | | | | | | | | | | | | | | | | |
| December 31, 2009 | | | | | | | | | | | | | | | | |
| Available for sale: | | | | | | | | | | | | | | | | |
| Fixed maturities | | | | | | | | | | | | | | | | |
| U.S. treasury securities | | $ | 107,419,266 | | | $ | - | | | $ | - | | | $ | 107,419,266 | |
| Certificates of deposit | | | | | | | 21,034,997 | | | | - | | | | 21,034,997 | |
| Industrial and miscellaneous taxable bonds | | | 4,141,220 | | | | - | | | | - | | | | 4,141,220 | |
| Total fixed maturities | | $ | 111,560,486 | | | $ | 21,034,997 | | | $ | - | | | $ | 132,595,483 | |
The Company’s fixed maturity investments, excluding long-term certificates of deposit, are all classified within Level 1 of the fair value hierarchy because they are valued using unadjusted quoted market prices, broker or dealer quotations, or alternative pricing sources in active markets for identical assets with reasonable levels of price transparency. Long-term certificates of deposit are classified within Level 2. Fair value measurements are not adjusted for transaction costs.
The Company’s fair value measurements are based on a combination of the market approach and the income approach. The market approach utilizes market transaction data for the same or similar instruments. The income approach is based on a discounted cash flow methodology, where expected cash flows are discounted to present value.
NOTE 45 - PROPERTY AND EQUIPMENT (NET OF ACCUMULATED DEPRECIATION)
Property and equipment consist of the following:
| | | Year ended December 31 | | | Year ended December 31 | |
| | | 2008 | | | 2007 | | | 2010 | | | 2009 | |
| | | | | | | | | | | | | |
| Furniture, fixtures, computer, and office equipment | | $ | 2,142,902 | | | $ | 2,407,480 | | |
| Furniture, fixtures, computer and office equipment | | | $ | 3,709,490 | | | $ | 2,178,578 | |
| Accumulated depreciation | | | 1,783,349 | | | | 1,850,246 | | | | 2,078,916 | | | | 1,957,323 | |
| Net property and equipment | | $ | 359,553 | | | $ | 557,234 | | | $ | 1,630,574 | | | $ | 221,255 | |
The above table includes work-in-process for software development of $1,500,162 of which $1,431,917 is unpaid.
Depreciation is computed using straight line methods over 3 to 7 years.
NOTE 56 - PREMIUMS, COMMISSIONS AND NOTES RECEIVABLE, NET
Premiums, commissions and notes receivable, net, are as follows:
| | | Year ended December 31 | | | Year ended December 31 | |
| | | 2008 | | | 2007 | | | 2010 | | | 2009 | |
| | | | | | | | | | | | | |
| Premiums and commission receivable | | $ | 2,278,608 | | | $ | 2,118,434 | | | $ | 2,938,037 | | | $ | 3,105,579 | |
| Premium finance notes receivable | | | 2,407,568 | | | | 2,957,604 | | | | 2,536,877 | | | | 1,916,496 | |
| Total premiums and notes receivable | | 4,686,176 | | | 5,076,038 | | | | 5,474,914 | | | | 5,022,075 | |
| Less allowance for doubtful accounts | | | 5,397 | | | | 9,392 | | | | (1,110,521 | ) | | | (657,328 | ) |
| Net premiums and notes receivable | | $ | 4,680,779 | | | $ | 5,066,646 | | | $ | 4,364,393 | | | $ | 4,364,747 | |
Premiums and notes receivable are substantially secured by unearned premiums and funds held as security for performance.
Bad debt expense for the year ended December 31, 2008, and the year ended December 31, 2007, were $6,439 and $15,253, respectively. Premium finance notes receivable represent the balance due to the Company's premium finance subsidiary from policyholders who elected to finance their premiums over the policya nine-month term. These notes are net of unearned finance charges.charges and credit loss reserves.
One of the Company’s agents that was appointed in 2008 to help the Company get its Trucking Program started failed to pay the net premium and policy fees due Unifax, the exclusive general agent for Crusader. The agent was initially late in paying its February 2009 production that was due to Unifax on April 15, 2009. In May 2009, as a result of the agent’s failure to timely pay its balance due to Unifax, the Company terminated its agency agreement and assumed ownership and control of that agent’s policy expirations written with the Company. The agent has not paid any subsequent premium to Unifax. The Company subsequently commenced legal proceedings against the agent corporation, its principals (who personally guaranteed the agent’s obligations), and another individual for the recovery of the balance due and any related recovery costs incurred. All related recovery costs have been expensed as incurred. As of December 31, 2010, the agent’s balance due to Unifax was $1,495,226. Based on the information presently available, the Company increased the bad debt reserve established by approximately $450,000 in the year ended December 31, 2010, from the reserve balance established at December 31, 2009, of approximately $651,835. Thus, the bad debt reserve for this agent as of December 31, 2010, is $1,101,835, which represents approximately 74% of the current balance due to Unifax. The Company’s bad debt reserve is subject to change as more information becomes available.
Bad debt expense for the year ended December 31, 2010, 2009 and 2008, was $460,068, $655,797 and $6,439, respectively.
NOTE 67 - UNPAID LOSSES AND LOSS ADJUSTMENT EXPENSES
The Company’s loss and loss adjustment expense reserves are as follows:
| | | Year ended December 31 | | | Year ended December 31 | |
| | | 2008 | | | 2007 | | | 2006 | | | 2010 | | | 2009 | |
| | | | | | | | | | | | | | | | |
| Direct reserves | | | | | | | | | | | | | | | |
| Case reserves | | $ | 18,720,695 | | | $ | 26,129,055 | | | $ | 21,796,117 | | | $ | 15,773,554 | | | $ | 18,072,709 | |
| IBNR reserves | | | 59,933,895 | | | | 68,601,656 | | | | 71,800,000 | | | | 45,786,141 | | | | 53,512,699 | |
| Total direct reserves | | $ | 78,654,590 | | | $ | 94,730,711 | | | $ | 93,596,117 | | | $ | 61,559,695 | | | $ | 71,585,408 | |
| | | | | | | | | | | | | | | | | | | | | |
| Reserves net of reinsurance | | | | | | | | | | | | | | | | | | | | |
| Case reserves | | $ | 17,365,877 | | | $ | 21,450,234 | | | $ | 18,776,430 | | | $ | 13,461,606 | | | $ | 16,231,563 | |
| IBNR reserves | | | 41,473,140 | | | | 44,855,053 | | | | 51,300,000 | | | | 36,281,775 | | | | 39,177,982 | |
| Total net reserves | | $ | 58,839,017 | | | $ | 66,305,287 | | | $ | 70,076,430 | | | $ | 49,743,381 | | | $ | 55,409,545 | |
Reserves for losses and loss adjustment expenses before reinsurance for each of Crusader’s lines of business were as follows:
| | | Year ended December 31 | | | Year ended December 31 | |
| Line of Business | | 2008 | | | 2007 | | | 2006 | | | 2010 | | | 2009 | |
| | | | | | | | | | | | | | |
| CMP | | $ | 73,339,513 | | | 93.2 | % | | $ | 90,126,649 | | | 95.1 | % | | $ | 90,604,178 | | | 96.8 | % | | $ | 58,665,420 | | | | 95.3 | % | | $ | 67,584,155 | | | | 94.4 | % |
| Other Liability | | | 5,271,612 | | | 6.7 | % | | | 4,524,684 | | | 4.8 | % | | | 2,736,790 | | | 2.9 | % | | | 2,845,407 | | | | 4.6 | % | | | 3,929,320 | | | | 5.5 | % |
| Other | | | 43,465 | | | | 0.1 | % | | | 79,378 | | | | 0.1 | % | | | 255,149 | | | | 0.3 | % | | | 48,868 | | | | 0.1 | % | | | 71,933 | | | | 0.1 | % |
| Total | | $ | 78,654,590 | | | | 100.0 | % | | $ | 94,730,711 | | | | 100.0 | % | | $ | 93,596,117 | | | | 100.0 | % | | $ | 61,559,695 | | | | 100.0 | % | | $ | 71,585,408 | | | | 100.0 | % |
The Company‘s consolidated financial statements include estimated reserves for unpaid losses and related loss adjustment expenses of the insurance company operation. The Company sets loss and loss adjustment expense reserves at each balance sheet date atbased upon management’s best estimate of the ultimate payments that it anticipates will be made to settle all losses incurred and all related loss adjustment expenses incurred as of that date for both reported and unreported claims.
The following table provides an analysis of the roll forward of Crusader’s losses and loss adjustment expenses, including a reconciliation of the ending balance sheet liability for the periods indicated:
| | | Year ended December 31 | |
| | | 2008 | | | 2007 | | | 2006 | |
| | | | | | | | | | |
| Reserve for unpaid losses and loss adjustment expenses at beginning of year – net of reinsurance | | $ | 66,305,287 | | | $ | 70,076,430 | | | $ | 76,235,467 | |
| | | | | | | | | | | | | |
| Incurred losses and loss adjustment expenses | | | | | | | | | | | | |
| Provision for insured events of current year | | | 24,149,531 | | | | 26,300,338 | | | | 29,997,662 | |
| Decrease in provision for events of prior years | | | (3,556,801 | ) | | | (4,118,101 | ) | | | (12,170,683 | ) |
| Total losses and loss adjustment expenses | | | 20,592,730 | | | | 22,182,237 | | | | 17,826,979 | |
| | | | | | | | | | | | | |
| Payments | | | | | | | | | | | | |
| Losses and loss adjustment expenses attributable to insured events of the current year | | | 7,803,644 | | | | 7,816,422 | | | | 6,728,798 | |
| Losses and loss adjustment expenses attributable to insured events of prior years | | | 20,255,356 | | | | 18,136,958 | | | | 17,257,218 | |
| Total payments | | | 28,059,000 | | | | 25,953,380 | | | | 23,986,016 | |
| | | | | | | | | | | | | |
| Reserve for unpaid losses and loss adjustment expenses at end of year – net of reinsurance | | | 58,839,017 | | | | 66,305,287 | | | | 70,076,430 | |
| | | | | | | | | | | | | |
Reinsurance recoverable on unpaid losses and loss adjustment expenses at end of year | | | 19,815,573 | | | | 28,425,424 | | | | 23,519,687 | |
| Reserve for unpaid losses and loss adjustment expenses at end of year per balance sheet, gross of reinsurance * | | $ | 78,654,590 | | | $ | 94,730,711 | | | $ | 93,596,117 | |
* In accordance with Financial Accounting Standards Board Statement No. 113, “Accounting and Reporting for Reinsurance of Short-Duration and Long-Duration Contracts,” reinsurance recoverable on unpaid losses and loss adjustment expenses are reported for GAAP as assets rather than netted against the corresponding liability for such items on the consolidated balance sheet.
The Company’s net loss and loss adjustment expense reserve was $58,839,017 as of December 31, 2008. Since underwriting profit is a significant part of income, a small percentage of change in reserve estimates may result in a substantial effect on future reported earnings. Such changes might result from a variety of factors, including claims costs emerging in a different pattern than the average historical development patterns. Considering the continuum of possible development patterns, none of which is necessarily more or less likely than the next, one must consider the varying probabilities that the development pattern is off in varying degrees. If future development ultimately ends up being five percent different than the Company’s 2008 reserve, approximately $2.9 million would be reflected in future periods as an increase or decrease in the provision for events of prior years and would be recognized in the Company’s Consolidated Statement of Operations in future periods. A variance of five percent of net loss and loss adjustment expense reserves is not an unlikely scenario. Similarly, a variance of ten percent of the Company’s 2008 reserves would be reflected in approximately $5.9 million in future periods as an increase or decrease in the provision for events of prior years and would be recognized in the Company’s Consolidated Statements of Operations in future periods. This is also not an unlikely scenario. Differences of more than ten percent are also possible, though not quite as likely as differences of ten percent or less.
| | | Year ended December 31 | |
| | | 2010 | | | 2009 | | | 2008 | |
| | | | | | | | | | |
| Reserve for unpaid losses and loss adjustment expenses at beginning of year – net of reinsurance | | $ | 55,409,545 | | | $ | 58,839,017 | | | $ | 66,305,287 | |
| | | | | | | | | | | | | |
| Incurred losses and loss adjustment expenses | | | | | | | | | | | | |
| Provision for insured events of current year | | | 23,038,294 | | | | 23,501,314 | | | | 24,149,531 | |
| Decrease in provision for events of prior years | | | (4,568,179 | ) | | | (3,955,553 | ) | | | (3,556,801 | ) |
| Total losses and loss adjustment expenses | | | 18,470,115 | | | | 19,545,761 | | | | 20,592,730 | |
| | | | | | | | | | | | | |
| Payments | | | | | | | | | | | | |
| Losses and loss adjustment expenses attributable to insured events of the current year | | | 8,327,215 | | | | 5,852,107 | | | | 7,803,644 | |
| Losses and loss adjustment expenses attributable to insured events of prior years | | | 15,809,064 | | | | 17,123,126 | | | | 20,255,356 | |
| Total payments | | | 24,136,279 | | | | 22,975,233 | | | | 28,059,000 | |
| | | | | | | | | | | | | |
| Reserve for unpaid losses and loss adjustment expenses at end of year – net of reinsurance | | | 49,743,381 | | | | 55,409,545 | | | | 58,839,017 | |
| | | | | | | | | | | | | |
Reinsurance recoverable on unpaid losses and loss adjustment expenses at end of year | | | 11,816,314 | | | | 16,175,863 | | | | 19,815,573 | |
| Reserve for unpaid losses and loss adjustment expenses at end of year per balance sheet, gross of reinsurance | | $ | 61,559,695 | | | $ | 71,585,408 | | | $ | 78,654,590 | |
As reflected in the above table, the amount of favorable development recognized during the year ended December 31, 2010, increased $612,626 (15%) to $4,568,179 from $3,955,553 in 2009. The amount of favorable development recognized during the year ended December 31, 2009, increased $398,752 (11%) to $3,955,553 from $3,556,801 in 2008. The favorable development in the above table is not necessarily indicative of the results that may be expected in future periods.
At each quarterly review, actual claims costs that emerge are compared with the claims costs that were expected to emerge during that development period. Sometimes the previous claims costs estimates prove to have been too high; sometimes they prove to have been too low. In the case of the Company, the estimates proved to be too high in each of the years reflected in the table. The favorable development in 2008 through 2010 underscores the inherent uncertainty in insurance claims costs, especially for a very small insurer.
NOTE 78 - DEFERRED POLICY ACQUISITION COSTS
The following table provides an analysis of the roll forward of Crusader’s deferred policy acquisition costs:
| | | Year ended December 31 | | | Year ended December 31 | |
| | | 2008 | | | 2007 | | | 2006 | | | 2010 | | | 2009 | | | 2008 | |
| | | | | | | | | | | | | | | | | | | |
| Deferred policy acquisition costs at beginning of year | | $ | 5,722,847 | | | $ | 6,430,265 | | | $ | 7,356,179 | | | $ | 4,955,636 | | | $ | 5,219,892 | | | $ | 5,722,847 | |
| Policy acquisition costs incurred during year | | 7,758,369 | | | 7,757,629 | | | 8,325,075 | | | | 6,627,837 | | | | 7,348,460 | | | | 7,758,369 | |
| Policy acquisition costs amortized during year | | | (8,261,324 | ) | | | (8,465,047 | ) | | | (9,250,989 | ) | | | (7,282,546 | ) | | | (7,612,716 | ) | | | (8,261,324 | ) |
| Deferred policy acquisition costs at end of year | | $ | 5,219,892 | | | $ | 5,722,847 | | | $ | 6,430,265 | | | $ | 4,300,927 | | | $ | 4,955,636 | | | $ | 5,219,892 | |
Deferred policy acquisition costs consist of commissions (net of ceding commission), premium taxes, inspection fees, and certain other underwriting costs, which are related to and vary with the production of Crusader policies. Policy acquisition costs are deferred and amortized as the related premiums are earned. Deferred acquisition costs are reviewed to determine if they are recoverable from future income, including investment income.
NOTE 89 - LEASE COMMITMENT TO RELATED PARTY
The lease commitment provides for the following minimum annual rental commitments:
| Year ending | | | | | | |
| December 31, 2009 | | $ | 1,066,990 | | |
| December 31, 2010 | | | 1,066,990 | | |
| December 31, 2011 | | | 1,066,990 | | | $ | 1,066,990 | |
| December 31, 2012 (through March 31, 2012) | | | 266,747 | | | | 266,747 | |
| Total minimum payments | | $ | 3,467,717 | | | $ | 1,333,737 | |
The Company presently occupies approximately 46,000 square feet of an office building located at 23251 Mulholland Drive, Woodland Hills, California, under a master lease expiring March 31, 2012. Erwin Cheldin, the Company's former president chairman,and a current director and principal stockholder, is the owner of the building. The Company signed an extension to the lease with a 4% increase in rent effective April 1, 2007. The lease provides for an annual gross rent of $1,066,990 from April 1, 2007, through March 31, 2012. In addition, the lease extension provides for two five-year5-year options with a rent increase of 5% for each option period. The Company believes that at the inception of the lease agreement and at each subsequent extension, the terms of the lease were at least as favorable to the Company as could have been obtained from non-affiliated third parties. The Company utilizes for its own operations approximately 100% of the space it leases. The total rent expense under this lease agreement was $1,066,990 for the yearyears ended December 31, 2008, $1,056,730 for the year ended December 31, 2007,2010, 2009, and $1,025,952 for the year ended December 31, 2006.2008.
NOTE 910 - ACCRUED EXPENSES AND OTHER LIABILITIES
Accrued expenses and other liabilities consist of the following:
| | | Year ended December 31 | | | Year ended December 31 | |
| | | 2008 | | | 2007 | | | 2010 | | | 2009 | |
| | | | | | | | | | | | | |
| Policy administration system | | | $ | 1,431,917 | | | $ | - | |
| Premium payable | | $ | 1,547,471 | | | $ | 1,757,368 | | | | 1,236,714 | | | | 1,534,219 | |
| Unearned contingent commission on reinsurance treaty | | 2,500,211 | | | 746,445 | | | | 1,344,341 | | | | 1,421,944 | |
| Unearned policy fee income | | 1,067,973 | | | 1,152,599 | | | | 932,930 | | | | 1,021,148 | |
| Profit sharing plan contributions | | 680,171 | | | 702,000 | | | | 393,000 | | | | 651,750 | |
| Accrued salaries | | 447,820 | | | 430,165 | | | | 425,428 | | | | 445,062 | |
| Commission payable | | 131,656 | | | 160,104 | | | | 77,031 | | | | 119,759 | |
| Other | | | 106,466 | | | | 91,464 | | | | 158,979 | | | | 168,555 | |
| Total accrued expenses and other liabilities | | $ | 6,481,768 | | | $ | 5,040,145 | | | $ | 6,000,340 | | | $ | 5,362,437 | |
NOTE 1011 - COMMITMENT AND CONTINGENCIES
The Company, by virtue of the nature of the business conducted by it, becomes involved in numerous legal proceedings as either plaintiff or defendant. The Company is also required to resort to legal proceedings from time to time in order to enforce collection of premiums, commissions, or fees for the services rendered to customers or to their agents. These routine items of litigation do not materially affect the Company and are handled on a routine basis by the Company through its general counsel.
Likewise, the Company is sometimes named as a cross-defendant in litigation, which is principally directed against an insurer who was issued a policy of insurance directly or indirectly through the Company. Incidental actions are sometimes brought by customers or others, which relate to disputes concerning the issuance or non-issuance of individual policies. These items are also handled on a routine basis by the Company's general counsel, and they do not materially affect the operations of the Company. Management is confident that the ultimate outcome of pending litigation should not have an adverse effect on the Company's consolidated results of operations or financial position.
NOTE 1112 - REINSURANCE
A reinsurance transaction occurs when an insurance company transfers (cedes) a portion of its exposure on policies written by it to a reinsurer that assumes that risk for a premium (ceded premium). Reinsurance does not legally discharge the Company from primary liability under its policies. If the reinsurer fails to meet its obligations, the Company must nonetheless pay its policy obligations.
Crusader’s primary excess of loss reinsurance agreements since January 1, 1998, are as follows:
Loss Year(s) | Reinsurer(s) | A.M. Best Rating | Retention | Annual Aggregate Deductible |
| | | | | |
| 2005 – 2010 | Platinum Underwriters Reinsurance, Inc. & Hannover Ruckversicherungs AG | A A | $300,000 | $500,000 |
| | | | | |
| 2004 | Platinum Underwriters Reinsurance, Inc. & Hannover Ruckversicherungs AG | A A | $250,000 | $500,000 |
| | | | | |
| 2003 | Platinum Underwriters Reinsurance, Inc. & Hannover Ruckversicherungs AG & QBE Reinsurance Corporation | A A A | $250,000 | $500,000 |
| | | | | |
| 2002 | Partner Reinsurance Company of the U.S. | A+ | $250,000 | $675,000 |
| | | | | |
| 2000 - 2001 | Partner Reinsurance Company of the U.S. | A+ | $250,000 | $500,000 |
| | | | | |
| 1998 - 1999 | General Reinsurance Corporation | A++ | $250,000 | $750,000 |
| | Loss Year(s) | | Reinsurer(s) | | A.M. Best Rating | | | Retention | | | Annual Aggregate Deductible | |
| | | | | | | | | | | | |
| | 2005 – 2008 | | Platinum Underwriters Reinsurance, Inc. & Hannover Ruckversicherungs AG | | A A | | | $ | 300,000 | | | $ | 500,000 | |
| | | | | | | | | | | | | | | |
| | 2004 | | Platinum Underwriters Reinsurance, Inc. & Hannover Ruckversicherungs AG | | A A | | | $ | 250,000 | | | $ | 500,000 | |
| | | | | | | | | | | | | | | |
| | 2003 | | Platinum Underwriters Reinsurance, Inc. & Hannover Ruckversicherungs AG & QBE Reinsurance Corporation | | A A A | | | $ | 250,000 | | | $ | 500,000 | |
| | | | | | | | | | | | | | | |
| | 2002 | | Partner Reinsurance Company of the U.S. | | | A | + | | $ | 250,000 | | | $ | 675,000 | |
| | | | | | | | | | | | | | | | |
| | 2000 - 2001 | | Partner Reinsurance Company of the U.S. | | | A | + | | $ | 250,000 | | | $ | 500,000 | |
| | | | | | | | | | | | | | | | |
| | 1998 - 1999 | | General Reinsurance Corporation | | | A | ++ | | $ | 250,000 | | | $ | 750,000 | |
Prior to January 1, 1998, National Reinsurance Corporation (acquired by General Reinsurance Corporation in 1996) charged a provisional rate on exposures up to $500,000 that was subject to adjustment and was based on the amount of losses ceded, limited by a maximum percentage that could be charged. That provisionally rated treaty was cancelled on a runoff basis and replaced by a flat rated treaty on January 1, 1998.
In 2010, 2009 and 2008 Crusader retained a participation in its excess of loss reinsurance treaties of 20% in its 1st1st layer ($700,000 in excess of $300,000), 15% in its 2nd2nd layer ($1,000,000 in excess of $1,000,000), and 0% in its property and casualty clash treaty. In 2007 Crusader retained a participation in its excess of loss reinsurance treaties of 15% in its 1st 1st layer ($700,000 in excess of $300,000), 15% in its 2nd2nd layer ($1,000,000 in excess of $1,000,000), and 15% in its property clash treaty. In 2006 and 2005 Crusader retained a participation in its excess of loss reinsurance treaties of 10% in its 1st1st layer ($700,000 in excess of $300,000), 10% in its 2nd2nd layer ($1,000,000 in excess of $1,000,000), and 30% in its property and casualty clash treaties.treaty. In 2004 Crusader retained a participation in its excess of loss reinsurance treaties of 10% in its 1st1st layer ($750,000 in excess of $250,000), 10% in its 2nd2nd layer ($1,000,000 in excess of $1,000,000), and 30% in its property and casualty clash treaties.treaty. In 2003 Crusader retained a participation in its excess of loss reinsurance treaties of 5% in its 1st1st layer ($750,000 in excess of $250,000), 10% in its 2nd 2nd layer ($1,000,000 in excess of $1,000,000), and 30% in its property and casualty clash treaties.treaty.
The 2008 and 2007 through 2010 excess of loss treaties do not provide for a contingent commission. Crusader’s 2006 1st layer primary excess of loss treaty provides for a contingent commission equal to 20% of the net profit, if any, accruing to the reinsurer. The first accounting period for the contingent commission covers the period from January 1, 2006, through December 31, 2006. The 2005 excess of loss treaties do not provide for a contingent commission. Crusader’s 2004 and 2003 1st1st layer primary excess of loss treaties provide for a contingent commission to the Company equal to 45% of the net profit, if any, accruing to the reinsurer. The first accounting period for the contingent commission covers the period from January 1, 2003, through December 31, 2004. For each accounting period as described above, the Company will calculate and report to the reinsurers its net profit (excluding incurred but not reported losses), if any, within 90 days after 36 months following the end of the first accounting period, and within 90 days after the end of each 12 month12-month period thereafter until all losses subject to the agreement have been finally settled. Any contingent commission payment received is subject to return based on future development of ceded losses and loss adjustment expenses. In March 2007, the Company received an advance of $1 million from its reinsurer; and in February 2008 the Company received an additional $2,419,940 to be applied against future contingent commission earned, if any. Based on the Company’s ceded losses and loss adjustment expenses (including ceded incurred but not reported losses) asAs of December 31, 2008,2010, the Company recorded $2,500,211has received a total net contingent commission of these$3,668,199 for the years subject to contingent commission. Of this amount, the Company has recognized $2,323,858 of contingent commission income, of which $637,477 was recognized in the year ended December 31, 2010. The remaining balance of the net payments as an advance from its reinsurerreceived of $1,344,341 is currently unearned and it is included in “Accrued Expenses and Other Liabilities” in the consolidated balance sheets. As of December 31, 2008, the Company recognized $919,729 ofThe unearned contingent commission may be subsequently earned or returned to the reinsurer depending on the future development of which $666,174 was recognized in the year ended December 31, 2008, and $253,555 was recognized inceded IBNR for the year ended December 31, 2007.years subject to contingent commission.
Crusader also has catastrophe reinsurance from various highly rated California authorized and unauthorized reinsurance companies. These reinsurance agreements help protect Crusader against liabilities in excess of certain retentions, including major or catastrophic losses that may occur from any one or more of the property and/or casualty risks which Crusader insures. The Company has no reinsurance recoverable balances in dispute.
The Company evaluates each of its ceded reinsurance contracts at its inception to determine if there is a sufficient risk transfer to allow the contract to be accounted for as reinsurance under current accounting literature. As of December 31, 2008, all such ceded contracts are accounted for as risk transfer reinsurance.
The aggregate amount of earned premium ceded to the reinsurers was $8,771,069 for the year ended December 31, 2008; $11,532,308 for the year ended December 31, 2007; and $13,758,424 for the year ended December 31, 2006.
On most of the premium that Crusader cedes to the reinsurer, the reinsurer pays a commission to Crusader that includes a reimbursement of the cost of acquiring the portion of the premium that is ceded. Crusader does not currently assume any reinsurance. The Company intends to continue obtaining reinsurance although the availability and cost may vary from time to time. The unpaid losses ceded to the reinsurer are recorded as an asset on the balance sheet.
The effect of reinsurance on premiums written, premiums earned, and incurred losses are as follows:
| | | Year ended December 31 | | | Year ended December 31 | |
| | | 2008 | | | 2007 | | | 2006 | | | 2010 | | | 2009 | | | 2008 | |
| Premiums written: | | | | | | | | | | | | | | | | | | |
| Direct business | | $ | 39,940,270 | | | $ | 44,970,399 | | | $ | 51,913,967 | | | $ | 32,697,971 | | | $ | 38,900,176 | | | $ | 39,940,270 | |
| Reinsurance assumed | | - | | | - | | | - | | | | - | | | | - | | | | - | |
| Reinsurance ceded | | | (8,765,066 | ) | | | (11,557,654 | ) | | | (13,747,103 | ) | | | (7,427,651 | ) | | | (9,264,278 | ) | | | (8,765,066 | ) |
| Net premiums written | | $ | 31,175,204 | | | $ | 33,412,745 | | | $ | 38,166,864 | | | $ | 25,270,320 | | | $ | 29,635,898 | | | $ | 31,175,204 | |
| | | | | | | | | | | | | | | | | | | | | | | | | |
| Premiums earned: | | | | | | | | | | | | | | | | | | | | | | | | |
| Direct business | | $ | 42,720,764 | | | $ | 48,661,973 | | | $ | 56,692,213 | | | $ | 35,579,438 | | | $ | 40,050,878 | | | $ | 42,720,764 | |
| Reinsurance assumed | | - | | | - | | | - | | | | - | | | | - | | | | - | |
| Reinsurance ceded | | | (8,771,069 | ) | | | (11,532,308 | ) | | | (13,758,424 | ) | | | (7,427,236 | ) | | | (9,276,407 | ) | | | (8,771,069 | ) |
| Net premiums earned | | $ | 33,949,695 | | | $ | 37,129,665 | | | $ | 42,933,789 | | | $ | 28,152,202 | | | $ | 30,774,471 | | | $ | 33,949,695 | |
| | | | | | | | | | | | | | | | | | | | | | | | | |
| Incurred losses and loss adjustment expenses: | | | | | | | | | | | | | | | | | | | | | | | | |
| Direct | | $ | 19,251,266 | | | $ | 30,375,724 | | | $ | 20,816,321 | | | $ | 16,706,756 | | | $ | 19,221,640 | | | $ | 19,251,266 | |
| Assumed | | - | | | - | | | - | | | | - | | | | - | | | | - | |
| Ceded | | | 1,341,464 | | | | (8,193,487 | ) | | | (2,989,342 | ) | | | 1,763,359 | | | | 324,121 | | | | 1,341,464 | |
| Net incurred losses and loss adjustment expenses | | $ | 20,592,730 | | | $ | 22,182,237 | | | $ | 17,826,979 | | | $ | 18,470,115 | | | $ | 19,545,761 | | | $ | 20,592,730 | |
Earned reinsurance ceded premium as a percentage of direct earned premium was 21% in 2008, 24%2010, 23% in 20072009 and 24%21% in 2006.2008.
NOTE 1213 - RETIREMENT PLANS
Profit Sharing Plan
During the fiscal year ended March 31, 1986, the Company adopted theThe Unico American Corporation Profit Sharing Plan.Plan covers Company employees who are at least 21 years of age and have been employed by the Company for at least two2 years are participants in this plan. Pursuant to the terms of this plan, the Company annually contributes to the account of each participant an amount equal to a percentage of the participant's eligible compensation as determined by the Board of Directors. Participants must be employed by the Company on the last day of the plan year to be eligible for contribution. Participants are entitled to receive distribution of benefits under this plan upon retirement, termination of employment, death, or disability.
Money Purchase Plan
During the year ended December 31, 1999, the Company adopted theThe Unico American Corporation Money Purchase Plan. This planPlan covers the present executive officers of the Company. Pursuant to the terms of this plan, the Company annually contributes to the account of each participant an amount equal to a percentage of the participant's eligible compensation as determined by the Board of Directors. However, amounts contributed to the Unico American Corporation Profit Sharing Plan will be considered first in determining the actual amount available under the Internal Revenue Service maximum contribution limits. Participants must be employed by the Company on the last day of the plan year to be eligible for contribution. Participants are entitled to receive distribution of benefits under this plan upon retirement, termination of employment, death, or disability.
Retirement planThe Company’s Profit Sharing Plan and Money Purchase Plan expenses were as follows:
| Year ended December 31, 2008 | | $ | 852,305 | |
| Year ended December 31, 2007 | | $ | 901,742 | |
| Year ended December 31, 2006 | | $ | 896,063 | |
| Year ended December 31, 2010 | $277,921 |
| Year ended December 31, 2009 | $876,208 |
| Year ended December 31, 2008 | $852,305 |
In the quarter ended March 31, 2010, the Company recorded an adjustment to correct an error that originated in the fourth quarter of 2009. The effect of the adjustment on the year ended December 31, 2010, was a reduction to salaries and employee benefit expenses of approximately $249,000 and an increase to net income of approximately $164,000. The correction was the result of a decision made in March 2010 to reduce the Company’s annual contribution to the employee profit sharing plan for the plan year ending March 31, 2010. Had this accrual adjustment been properly reflected in the fourth quarter of 2009, total stockholders’ equity as of December 31, 2009, and net income for the year ended December 31, 2009, would have increased approximately $164,000. The Company made an assessment of the materiality of this item on the Company’s historical consolidated financial statements in accordance with SAB No. 99, “Materiality,” and concluded that the error was immaterial to all periods.
NOTE 1314 - STATUTORY CAPITAL AND SURPLUS
Crusader is required to file an annual statement with insurance regulatory authorities prepared on an accounting basis prescribed or permitted by such authorities (statutory). Statutory accounting practices differ in certain respects from GAAP. The more significant of thesethe differences for statutory accounting are (a) premium income is taken into earnings over the periods covered by the policies, whereas the relatedpolicy acquisition and commission costs are expensed when incurred;incurred rather than over the periods covered by the policies; (b) fixed maturity securities are reported at amortized cost, or the lower of amortized cost or fair value, depending on the quality of the security as specified by the NAIC; (c) equity securities are valued by the NAIC as required by Statutory Accounting Principles; d) non-admitted assets are charged directly against surplus; (e)(d) loss reserves and unearned premium reserves are stated net of reinsurance; and (f)(e) federal income taxes are recorded when payable and deferred taxes, subject to limitations, are recognized but only to the extent that they do not exceed 10%a specified percentage of statutory surplus; changes in deferred taxes are recorded directly to surplus as regards policyholders. Additionally, the cash flow presentation is not consistent with U.S. generally accepted accounting principles and reconciliation from net income to cash provided by operations is not presented. Comprehensive income is not presented under statutory accounting.
Crusader Insurance Company statutory capital and surplus are as follows:
| As of December 31, 2008 | | $ | 64,736,230 | |
| As of December 31, 2007 | | $ | 57,862,334 | |
| As of December 31, 2010 | $62,520,958 |
| As of December 31, 2009 | $62,553,813 |
Crusader Insurance Company statutory net income is as follows:
| Year ended December 31, 2008 | | $ | 7,067,715 | |
| Year ended December 31, 2007 | | $ | 8,194,562 | |
| Year ended December 31, 2006 | | $ | 13,396,732 | |
| Year ended December 31, 2010 | $4,513,078 |
| Year ended December 31, 2009 | $4,942,935 |
| Year ended December 31, 2008 | $7,067,715 |
The California Department of Insurance (the Insurance Department)insurance department) conducts periodic financial examinations of Crusader. The Insurance Department hasinsurance department completed a financial examination of Crusader’s December 31, 2004,2008, statutory financial statements. A final report on the examination was issued by the Insurance Departmentinsurance department on May 10, 2006.October 22, 2009. No significant issues were reflectedreported in the final report.
The Company believes that Crusader's statutory capital and surplus wereare sufficient to support the insurance premiums written based on guidelines established by the NAIC.
Crusader is restricted in the amount of dividends it may pay to its parent in any twelve (12) month12-month period without prior approval of the California Department of Insurance.insurance department. Presently, without prior approval, Crusader may pay a dividend in any twelve (12) month12-month period to its parent equal to the greater of (a) 10% of Crusader's statutory policyholders' surplus or (b) Crusader's statutory net income for the preceding calendar year. Based on Crusader’s statutory net incomesurplus for the year ended December 31, 2008,2010, the maximum dividend that could be made by Crusader to Unico without prior regulatory approval in 2011 is $6,252,096. In the years ended December 31, 2010 and 2009, is $7,067,715.Crusader paid to Unico cash dividends in the amount of $4,250,000 and $7,000,000, respectively. There were no dividends paid by Crusader to Unico in 2008, 2007, or in 2006.2008.
In December 1993, the National Association of Insurance Commissioners (NAIC) adopted a Risk-Based Capital (RBC) Model Law for property and casualty companies. The RBC Model Law is intended to provide standards for calculating a variable regulatory capital requirement related to a company's current operations and its risk exposures (asset risk, underwriting risk, credit risk, and off-balance sheet risk). These standards are intended to serve as a diagnostic solvency tool for regulators that establishes uniform capital levels and specific authority levels for regulatory intervention when an insurer falls below minimum capital levels. The RBC Model Law specifies four distinct action levels at which a regulator can intervene with increasing degrees of authority over a domestic insurer if its RBC is equal to or less than 200% of its computed authorized control level RBC. A company's RBC is required to be disclosed in its statutory annual statement. The RBC is not intended to be used as a rating or ranking tool nor is it to be used in premium rate making or approval. Crusader’s adjusted capital at December 31, 2008,2010, was 849%875% of authorized control level risk-based capital.
Insurance Regulatory Information System (IRIS) was developed by a committee of state insurance regulators primarily to assist state insurance departments in executing their statutory mandate to oversee the financial condition of insurance companies. IRIS helps those companies that merit highest priority in the allocation of the regulators’ resources on the basis of 13 financial ratios that are calculated annually. The analytical phase is a review of annual statements and the financial ratios. The ratios and trends are valuable in pointing to companies likely to experience financial difficulties but the ratios are not themselves indicative of adverse financial condition. The ratio and benchmark comparisons are mechanically produced and are not intended to replace the state insurance department’s own in-depth financial analysis or on-site examinations.
An unusual range of ratio results has been established from studies of the ratios of companies that have become insolvent or have experienced financial difficulties. In the analytical phase, companies that receive four or more financial ratio values outside the usual range are analyzed in order to identify those companies that appear to require immediate regulatory action. Subsequently, a more comprehensive review of the ratio results and thean insurer’s annual statement is performed to confirm that an insurer’s situation calls for increased or close regulatory attention. In 2008,2010, the Company was not outside the usual values on anyvalue of one of the thirteen IRIS ratio tests. IRIS ratio test number six considers the Company’s 2010 investment yield. An unusual value for that ratio is equal to or over 6.5% or equal to or less than 3%. Crusader’s 2010 investment yield was 2.7%.
NOTE 1415 - STOCK PLANS
On December 30, 2005, the Company accelerated the vesting of all of its outstanding stock-based compensation awards granted under the Company’s 1999 Omnibus Stock Plan. All accelerated options were “in the money.” The number of shares covered by the options accelerated totaled 67,500 of which 37,500 were originally scheduled to vest on January 1, 2006, and 30,000 were originally scheduled to vest on January 1, 2007. The Company accelerated vesting of the options in order to minimize the compensation costs associated with the adoption of ASC 718. All accelerated options were granted to long-term management employees who were not expected to leave the Company prior to the originally scheduled vesting date. The estimated compensation cost which would have been excluded from future periods as a result of the acceleration of the vesting of the options was approximately $89,100. There were no options granted during 2010, 2009 and 2008 and there were no unvested options as of January 1, 2006. No compensation expenses were recorded for the years ended December 31, 2010, December 31, 2009, and December 31, 2008.
The Company’s 1999 Omnibus Stock Plan that coverscovered 500,000 shares of the Company’s common stock (subject to adjustment in the case of stock splits, reverse stock splits, stock dividends, etc.) was approved by shareholders on June 4, 1999. This plan terminated in accordance with its terms in March 2009. All then outstanding options continued in full force in accordance with the agreements under which those options were issued. On August 26, 1999, the Company granted 135,000 incentive stock options. Asoptions, of December 31, 2008, 60,000 of those options were outstanding and exercisable,which 30,000 options had been exercised, and 45,000 options had been terminated. Theseterminated and the remaining 60,000 options expire 10 years from the dateexpired on August 26, 2009.
On December 18, 2002, the Company granted 182,000 incentive stock options under the Company’s 1999 Omnibus Stock Plan. On December 30, 2005, the Company accelerated the vesting of 37,500 options that were originally scheduled to vest on January 1, 2006, and 30,000 options that were originally scheduled to vest on January 1, 2007 (see Note 1). As of December 31, 2008, 64,6502010, there were 36,773 of those options were outstanding and exercisable, 114,850142,727 options had been exercised, and 2,500 options had been terminated. These options expire 10 years from the date of the grant.
The changes in the number of common shares under option are summarized as follows:
| | | Options | | | Weighted Average Exercise Price | | | Options | | | Weighted Average Exercise Price | |
| Outstanding at December 31, 2005 | | 268,000 | | | $ | 5.286 | | |
| Options granted | | - | | | | - | | |
| Options exercised | | (95,750 | ) | | | 3.270 | | |
| Options terminated | | | - | | | | - | | |
| Outstanding at December 31, 2006 | | | 172,250 | | | | 6.407 | | |
| Options granted | | - | | | | - | | |
| Options exercised | | (42,600 | ) | | | 6.331 | | |
| Options terminated | | | (5,000 | ) | | | 9.250 | | |
| Outstanding at December 31, 2007 | | | 124,650 | | | | 6.065 | | | | 124,650 | | | $ | 6.065 | |
| Options granted | | - | | | | - | | | | - | | | | - | |
| Options exercised | | - | | | | - | | | | - | | | | - | |
| Options terminated | | | - | | | | - | | | | - | | | | - | |
| Outstanding at December 31, 2008 | | | 124,650 | | | $ | 6.065 | | | | 124,650 | | | | 6.065 | |
| Options granted | | | | - | | | | - | |
| Options exercised | | | | - | | | | - | |
| Options terminated | | | | - | | | | - | |
| Options expired | | | | 60,000 | | | | 9.250 | |
| Outstanding at December 31, 2009 | | | | 64,650 | | | | 3.110 | |
| Options granted | | | | - | | | | - | |
| Options exercised | | | | (26,877 | ) | | | 3.110 | |
| Options adjusted | | | | (1,000 | ) | | | 3.110 | |
| Options terminated | | | | - | | | | - | |
| Outstanding at December 31, 2010 | | | | 36,773 | | | $ | 3.110 | |
Options exercisable were 124,650 at December 31, 2008, at a weighted average exercise price of $6.065; 124,650 at December 31, 2007, at a weighted average exercise price of $6.065; 172,250 at December 31, 2006, at a weighted average exercise price of $6.407. Aggregate intrinsic value of outstanding and currently exercisable options at December 31, 2008,2010, was $266,069.$221,741.
The following table summarizes information regarding the stock options outstanding at December 31, 2008:2010:
Exercise Price | Exercise Price | | | Number of Options Outstanding | | | Weighted Average Remaining Contractual Life (Years) | | | Weighted Average Exercise Price of Outstanding Options | | | Number of Options Exercisable | | | Weighted Average Exercise Price of Exercisable Options | | Exercise Price | | | Number of Options Outstanding | | | Weighted Average Remaining Contractual Life (Years) | | | Weighted Average Exercise Price of Outstanding Options | | | Number of Options Exercisable | | | Weighted Average Exercise Price of Exercisable Options | |
| | | | | | | | | | | | | | | | | | | | | | | | | | | | | | | | | | | |
| $ | 9.25 | | | 60,000 | | | 0.65 | | | $ | 9.25 | | | 60,000 | | | $ | 9.25 | | 3.11 | | | | 36,773 | | | | 1.96 | | | $ | 3.11 | | | | 36,773 | | | $ | 3.11 | |
| $ | 3.11 | | | 64,650 | | | 3.96 | | | $ | 3.11 | | | 64,650 | | | $ | 3.11 | | |
NOTE 1516 - TAXES ON INCOME
The provision for taxes on income consists of the following:
| | | Year ended December 31 | | | Year ended December 31 | |
| | | 2008 | | | 2007 | | | 2006 | | | 2010 | | | 2009 | | | 2008 | |
| Current provision: | | | | | | | | | | | | | | | | | | |
| Federal | | $ | 2,750,054 | | | $ | 3,221,567 | | | $ | 6,137,538 | | | $ | 1,043,492 | | | $ | 1,541,835 | | | $ | 2,750,054 | |
| State | | | 9,040 | | | | 8,701 | | | | 11,537 | | | | 8,931 | | | | 8,920 | | | | 9,040 | |
| Total federal and state | | 2,759,094 | | | 3,230,268 | | | 6,149,075 | | | | 1,052,423 | | | | 1,550,755 | | | | 2,759,094 | |
| Deferred | | | (57,644 | ) | | | 130,441 | | | | 278,270 | | |
| Deferred tax benefit | | | | (160,994 | ) | | | (314,152 | ) | | | (57,644 | ) |
| Provision for taxes | | $ | 2,701,450 | | | $ | 3,360,709 | | | $ | 6,427,345 | | | $ | 891,429 | | | $ | 1,236,603 | | | $ | 2,701,450 | |
The income tax provision reflected in the consolidated statements of operations is different than the expected federal income tax on income as shown in the following table:
| | | Year ended December 31 | | | Year ended December 31 | |
| | | 2008 | | | 2007 | | | 2006 | | | 2010 | | | 2009 | | | 2008 | |
| | | | | | | | | | | | | | | | | | | |
| Computed income tax expense | | $ | 2,714,718 | | | $ | 3,424,872 | | | $ | 6,239,956 | | | $ | 1,094,997 | | | $ | 1,415,753 | | | $ | 2,714,718 | |
| Tax effect of: | | | | | | | | | | | | | | | | | | | | | | | | |
| State tax, net of federal tax benefit | | (40,524 | ) | | (40,339 | ) | | 90,623 | | | | (220,490 | ) | | | (297,887 | ) | | | (40,524 | ) |
| Federal tax in excess of 34% | | - | | | - | | | 173,196 | | |
| Tax exempt income | | (132 | ) | | (265 | ) | | (3,184 | ) | | | - | | | | - | | | | (132 | ) |
| Other | | | 27,388 | | | | (23,559 | ) | | | (73,246 | ) | | | 16,922 | | | | 118,737 | | | | 27,388 | |
| Income tax per financial statements | | $ | 2,701,450 | | | $ | 3,360,709 | | | $ | 6,427,345 | | |
| Income tax expense per consolidated statements of operations | | | $ | 891,429 | | | $ | 1,236,603 | | | $ | 2,701,450 | |
TheIn the quarter ended September 30, 2010, the Company recorded an immaterial adjustment to its deferred income tax liability to correct a prior period error in recording the decrease in the percentage of undistributed dividends of its insurance company subsidiary that is subject to California franchise tax. The effect of this adjustment reduced the Company’s deferred tax liability and corresponding income tax expense by approximately $143,000 in the year ended December 31, 2010. The Company concluded that the error was immaterial to all periods impacted.
In the quarter ended December 31, 2009, the Company recorded a tax adjustment to correct for an error that originated in a prior period. The cumulative effect of the adjustment as of December 31, 2009, was a reduction to income tax expense and an increase to 2009 net income of approximately $97,000, and was the result of recognition of the tax effect on certain deferred items for state income tax purposes. The Company concluded that the error was immaterial to all periods impacted.
The deferred tax benefit or expense related to the change in unrealized gains on securities classified as available-for-sale in the current period was $1,539,643a $252,989 deferred tax benefit for the year ended December 31, 2008, $1,098,4202010, a $1,114,125 deferred tax benefit for the year ended December 31, 20072009, and $85,592a $1,539,643 deferred tax expense for the year ended December 31, 2006.2008.
The components of the net federal income tax asset included in the financial statements as required by the assets and liability method are as follows:
| | | Year ended December 31 | | | Year ended December 31 | |
| | | 2008 | | | 2007 | | | 2010 | | | 2009 | |
| Deferred tax assets: | | | | | | | |
| Deferred tax assets | | | | | | | |
| Discount on loss reserves | | $ | 2,000,939 | | | $ | 1,989,844 | | | $ | 1,668,869 | | | $ | 1,893,993 | |
| Unearned premiums | | 1,382,477 | | | 1,562,626 | | | | 1,100,441 | | | | 1,299,276 | |
| Unearned commission income | | | | 386,019 | | | | 455,943 | |
| Unearned policy fee income | | 363,111 | | | 391,884 | | | | 399,667 | | | | 437,460 | |
| State income tax deductible in future periods | | 228,879 | | | 185,701 | | | | 361,514 | | | | 269,672 | |
| Bad debt reserve | | | | 475,747 | | | | 281,599 | |
| Other | | | 134,655 | | | | 348,101 | | | | 108,483 | | | | 127,566 | |
| Total deferred tax assets | | $ | 4,110,061 | | | $ | 4,478,156 | | | $ | 4,500,740 | | | $ | 4,765,509 | |
| | | | | | | | | | | | | | | | | |
| Deferred tax liabilities: | | | | | | | | | |
| Deferred tax liabilities | | | | | | | | | |
| Deferred acquisition costs | | $ | 1,774,763 | | | $ | 1,945,768 | | | $ | 1,809,424 | | | $ | 2,083,915 | |
| Unrealized gain on investments | | 2,526,753 | | | 987,110 | | | | 1,159,639 | | | | 1,412,628 | |
| State tax on undistributed insurance company earnings | | 515,692 | | | 659,821 | | | | 367,382 | | | | 490,226 | |
| Tax depreciation in excess of book depreciation | | 86,592 | | | 129,540 | | | | 26,761 | | | | 71,751 | |
| Other | | | 1,349 | | | | 69,007 | | | | 77,977 | | | | 73,798 | |
| Total deferred tax liabilities | | $ | 4,905,149 | | | $ | 3,791,246 | | | $ | 3,441,183 | | | $ | 4,132,318 | |
| | | | | | | | | | | | | | | | | |
| Net deferred tax assets (liabilities) | | $ | (795,088 | ) | | $ | 686,910 | | |
| Net deferred tax assets | | | $ | 1,059,557 | | | $ | 633,191 | |
Although realization is not assured, management believes it is more likely than not that all of the deferred tax assets will be realized. The amount of the deferred tax assets considered realizable could be reduced in the near term if estimates of future taxable income during the carryforward period are reduced.
The Company and its wholly owned subsidiaries file consolidated federal and state income tax returns. Pursuant to the tax allocation agreement, Crusader Insurance Company and American Acceptance Corporation are allocated taxes or tax credits in the case of losses, tax credits, at current corporate rates based on their own taxable income or loss. The Company files income tax returns under U.S. federal and various state jurisdictions. The Company is no longer subject to examination by U.S. federal income tax examination byauthorities for tax returns filed starting at taxable year 2007 and California state income tax authorities for years before 2007 and state income tax examination for years before 2004.returns filed starting at taxable year 2006. There are no ongoing examinations of income tax returns by federal or state tax authorities.
As a California insurance company, Crusader is obligated to pay a premium tax on gross premiums written in all states that Crusader is admitted. Premium taxes are deferred and amortized as the related premiums are earned. The premium tax is in lieu of state franchise taxes and is not included in the provision for state taxes.
As of December 31, 2010, the Company had no unrecognized tax benefits and no additional liabilities or reduction in deferred tax asset. In addition, the Company had not accrued interest and penalties related to unrecognized tax benefits. However, if interest and penalties would need to be accrued related to unrecognized tax benefits, such amounts would be recognized as a component of federal income tax expense.
NOTE 1617 – REPURCHASE OF COMMON STOCK - EFFECT ON STOCKHOLDERS’ EQUITY
In April 2000, the Company announced that its Board of Directors had authorized the purchase in the open market from time to time of up to an aggregate of 315,000 shares of the common stock of the Company. On August 8, 2000, the Board of Directors authorized the purchase of an additional 315,000 shares and on September 6, 2000, the Board of Directors authorized the purchase of another 315,000 shares of the common stock of the Company in the open market from time to time. On December 19, 2008, the Board of Directors authorized an additionala stock repurchase program to acquire from time to time up to an aggregate of 500,000 shares of the Company’s common stock in the open market from time to time.stock. This brought the total shares of the Company’s common stock authorized to be repurchased to 1,445,000 shares since the year 2000. The programs haveprogram has no expiration date and may be terminated by the Board of Directors at any time. During the twelve monthsyear ended December 31, 2008,2010, the Company did not repurchase any shares of common stock under this program. During the year ended December 31, 2009, the Company repurchased 51,092under this program and previously adopted programs an aggregate of 268,111 shares of the Company’s common stock at a cost of $416,583$2,447,948 of which $25,108$131,756 was allocated to capital and $391,475$2,316,192 was allocated to retained earnings. As of December 31, 2008, under the stock repurchase programs previously adopted by the Company,2010, the Company had remaining authority under the 2008 program to repurchase up to an aggregate of 515,467 shares of common stock. During the months of January and February 2009, the Company purchased and retired an additional 6,688247,356 shares of its common stock at a total coststock. The 2008 program is the only program under which there is remaining authority to repurchase shares of $51,866.the Company’s common stock. The Company has or will retireretired all stock purchased.repurchased.
NOTE 1718 - EARNINGS PER SHARE
A reconciliation of the numerator and denominator used in the basic and diluted earnings per share calculation is presented below:
| | | Year ended December 31 | | | Year ended December 31 | |
| | | 2008 | | | 2007 | | | 2006 | | | 2010 | | | 2009 | | | 2008 | |
| Basic Earnings Per Share | | | | | | | | | | | | | | | | | | |
| Net income numerator | | $ | 5,283,016 | | | $ | 6,712,444 | | | $ | 11,925,466 | | | $ | 2,329,152 | | | $ | 2,927,375 | | | $ | 5,283,016 | |
| Weighted average shares outstanding denominator | | | 5,614,730 | | | | 5,614,025 | | | | 5,567,883 | | | | 5,312,684 | | | | 5,507,371 | | | | 5,614,730 | |
| | | | | | | | | | | | | | | | | | | | | | | | | |
| Per share amount | | $ | 0.94 | | | $ | 1.20 | | | $ | 2.14 | | | $ | 0.44 | | | $ | 0.53 | | | $ | 0.94 | |
| | | | | | | | | | | | | | | | | | | | | | | | | |
| Diluted Earnings Per Share | | | | | | | | | | | | | | | | | | | | | | | | |
| Net income numerator | | $ | 5,283,016 | | | $ | 6,712,444 | | | $ | 11,925,466 | | | $ | 2,329,152 | | | $ | 2,927,375 | | | $ | 5,283,016 | |
| | | | | | | | | | | | | | | | | | | | | | | | | |
| Weighted average shares outstanding | | 5,614,730 | | | 5,614,025 | | | 5,567,883 | | | | 5,312,684 | | | | 5,507,371 | | | | 5,614,730 | |
| Effect of diluted securities | | | 41,280 | | | | 67,868 | | | | 85,018 | | | | 38,894 | | | | 40,628 | | | | 41,280 | |
| Diluted shares outstanding denominator | | | 5,656,010 | | | | 5,681,893 | | | | 5,652,901 | | | | 5,351,578 | | | | 5,547,999 | | | | 5,656,010 | |
| | | | | | | | | | | | | | | | | | | | | | | | | |
| Per share amount | | $ | 0.93 | | | $ | 1.18 | | | $ | 2.11 | | | $ | 0.44 | | | $ | 0.53 | | | $ | 0.93 | |
NOTE 1819 - SELECTED QUARTERLY FINANCIAL DATA (UNAUDITED)
Summarized unaudited quarterly financial data for each of the calendar years 20082010 and 20072009 is as follows.
| | | Comparable Period by Quarter Ended | |
| | | March 31 | | | June 30 | | | September 30 | | | December 31 | |
| Calendar Year 2008 | | | | | | | | | | | | |
| Total revenues | | $ | 12,268,120 | | | $ | 11,822,394 | | | $ | 11,529,132 | | | $ | 11,149,798 | |
| Income before taxes | | $ | 1,446,301 | | | $ | 1,166,186 | | | $ | 2,192,290 | | | $ | 3,179,689 | |
| Net income | | $ | 959,990 | | | $ | 780,960 | | | $ | 1,445,340 | | | $ | 2,096,726 | |
| Earnings per share:Basic | | $ | 0.17 | | | $ | 0.14 | | | $ | 0.26 | | | $ | 0.38 | |
Diluted | | $ | 0.17 | | | $ | 0.14 | | | $ | 0.26 | | | $ | 0.37 | |
| | | | | | | | | | | | | | | | | |
| Calendar Year 2007 | | | | | | | | | | | | | | | | |
| Total revenues originally reported | | $ | 12,845,975 | | | $ | 12,638,966 | | | $ | 12,480,249 | | | $ | 12,258,103 | |
| Immaterial error correction * | | | 51,077 | | | | 60,072 | | | | 18,467 | | | | 19,986 | |
| Total revenue, as adjusted | | $ | 12,897,052 | | | $ | 12,699,038 | | | $ | 12,498,716 | | | $ | 12,278,089 | |
| | | | | | | | | | | | | | | | | |
| Income before taxes originally reported | | $ | 2,525,361 | | | $ | 2,451,914 | | | $ | 2,172,297 | | | $ | 2,773,979 | |
| Immaterial error correction * | | | 51,077 | | | | 60,072 | | | | 18,467 | | | | 19,986 | |
| Income before taxes, as adjusted | | $ | 2,576,438 | | | $ | 2,511,986 | | | $ | 2,190,764 | | | $ | 2,793,965 | |
| | | | | | | | | | | | | | | | | |
| Net income originally reported | | $ | 1,688,588 | | | $ | 1,626,324 | | | $ | 1,534,251 | | | $ | 1,764,544 | |
| Immaterial error correction * | | | 33,711 | | | | 39,648 | | | | 12,188 | | | | 13,190 | |
| Net income, as adjusted | | $ | 1,722,299 | | | $ | 1,665,972 | | | $ | 1,546,439 | | | $ | 1,777,734 | |
| | | | | | | | | | | | | | | | | |
| Earnings per share:Basic | | | | | | | | | | | | | | | | |
| Earnings per share originally reported | | $ | 0.30 | | | $ | 0.29 | | | $ | 0.27 | | | $ | 0.32 | |
| Earnings per share: Basic, as adjusted | | $ | 0.31 | | | $ | 0.30 | | | $ | 0.27 | | | $ | 0.32 | |
| | | | | | | | | | | | | | | | | |
| Earnings per share: Diluted | | | | | | | | | | | | | | | | |
| Earnings per share originally reported | | $ | 0.30 | | | $ | 0.29 | | | $ | 0.27 | | | $ | 0.31 | |
| Earnings per share: Diluted, as adjusted | | $ | 0.30 | | | $ | 0.29 | | | $ | 0.27 | | | $ | 0.31 | |
| | | Comparable Period by Quarter Ended | |
| | | March 31 | | | June 30 | | | September 30 | | | December 31 | |
| Calendar Year 2010 | | | | | | | | | | | | |
| Total revenues | | $ | 9,897,813 | | | $ | 9,387,035 | | | $ | 9,088,814 | | | $ | 8,747,089 | |
| Income before taxes | | $ | 764,431 | | | $ | 634,671 | | | $ | 687,321 | | | $ | 1,134,158 | |
| Net income (1) (2) | | $ | 499,193 | | | $ | 448,223 | | | $ | 623,962 | | | $ | 757,774 | |
Earnings per share: Basic | | $ | 0.09 | | | $ | 0.08 | | | $ | 0.12 | | | $ | 0.14 | |
Diluted | | $ | 0.09 | | | $ | 0.08 | | | $ | 0.12 | | | $ | 0.14 | |
| | | | | | | | | | | | | | | | | |
| Calendar Year 2009 | | | | | | | | | | | | | | | | |
| Total revenues | | $ | 10,588,427 | | | $ | 10,653,244 | | | $ | 10,304,412 | | | $ | 10,071,023 | |
| Income before taxes | | $ | 1,547,579 | | | $ | 996,058 | | | $ | 898,953 | | | $ | 721,388 | |
| Net income (3) | | $ | 1,029,244 | | | $ | 684,066 | | | $ | 617,680 | | | $ | 596,385 | |
Earnings per share: Basic | | $ | 0.18 | | | $ | 0.12 | | | $ | 0.11 | | | $ | 0.11 | |
Diluted | | $ | 0.18 | | | $ | 0.12 | | | $ | 0.11 | | | $ | 0.11 | |
| 1. | As discussed in Note 13, the Company recorded an adjustment to correct an error that originated in the fourth quarter of 2009. The effect of the adjustment in the quarter ended March 31, 2010, was an increase to net income of approximately $164,000. |
| 2. | As discussed in Note 16, the Company recorded an adjustment to its deferred income tax liability to correct an error in recording the decrease in the percentage of undistributed dividends of its insurance company subsidiary that is subject to California franchise tax. The effect of this adjustment reduced the Company’s income tax expense by approximately $143,000 in the quarter ended September 30, 2010. |
* See Note 1
| 3. | As discussed in Note 16, the Company recorded a tax adjustment to correct for an error that originated in a prior period. This effect of the tax adjustment in the quarter ended December 31, 2009, was an increase to net income of approximately $97,000 and increased basic and diluted earnings per share by $.02. |
Item 9. Changes in and Disagreements with Accountants on Accounting and Financial Disclosure.
NoneDisclosure.
None
Item 9A(T).9A. Controls and Procedures.
Evaluation of Disclosure Controls and Procedures
The Company maintains disclosure controls and procedures designed to ensure that information required to be disclosed in the Company’s reports filed under the Securities Exchange Act of 1934, as amended, is recorded, processed, summarized and reported within the time periods specified in the Securities and Exchange Commission rules and forms, and that such information is accumulated and communicated to the Company’s management, including its Chief Executive Officer and Chief Financial Officer, as appropriate, to allow for timely decisions regarding required disclosure. In designing and evaluating the disclosure controls and procedures, management recognizes that any controls and procedures, no matter how well designed and operated, can provide only reasonable assurance of achieving the desired control objectives,objectives; and, therefore, management was required to apply its judgment in evaluating the cost benefit relationship of possible controls and procedures.
As required by Securities and Exchange Commission Rules,rules, the Company carried out an evaluation, under the supervision and with the participation of the Company’s management, including the Company’s Chief Executive Officer and the Company’s Chief Financial Officer, of the effectiveness of the design and operation of the Company’s disclosure controls and procedures as of the end of the period covered by this report. Based on the foregoing, the Company’s Chief Executive Officer and Chief Financial Officer concluded that the Company’s disclosure controls and procedures were effective at the reasonable assurance level.
Changes in Internal Control over Financial Reporting
There has been no change in the Company’s internal control over financial reporting during the Company’s most recent fiscal quarter that has materially affected, or is reasonably likely to materially affect, the Company’s internal control over financial reporting. The Company’s process for evaluating controls and procedures is continuous and encompasses constant improvement of the design and effectiveness of established controls and procedures and the remediation of any deficiencies that may be identified during this process.
Management’s Report on Internal Control over Financial Reporting
The management of the Company is responsible for establishing and maintaining adequate internal control over financial reporting. The Company’s internal control system was designed to provide reasonable assurance to the Company’s management and boardBoard of directorsDirectors regarding the preparation and fair presentation of published financial statements.
All internal control systems, no matter how well designed, have inherent limitations. Therefore, even those systems determined to be effective can provide only reasonable assurance with respect to financial statement preparation and presentation.
The Company’s management assessed the effectiveness of the Company’s internal control over financial reporting as of December 31, 2008.2010. In making this assessment, it used the criteria set forth by the Committee of Sponsoring Organizations of the Treadway Commission (COSO) in “Internal Control - - Integrated Framework.” Based upon its assessment, the Company’s management believes that as of December 31, 2008,2010, the Company’s internal control over financial reporting is effective based on these criteria. This annual report does not include an attestation report of the Company's registered public accounting firm regarding internal control over financial reporting. Management's report was not subject to attestation by the Company's registered public accounting firm pursuant to temporary rules of the Securities and Exchange Commission that permit the Company to provide only management's report in this annual report.
Item 9B. Other Information.
None
PART III
Item 10. Directors, Executive Officers and Corporate Governance.
Information in response to Item 10 is incorporated by reference from the Company's definitive proxy statement to be used in connection with the Company's Annual Meeting of Shareholders pursuant to Instruction G(3) of Form 10-K.
Item 11. Executive Compensation.
Information in response to Item 11 is incorporated by reference from the Company's definitive proxy statement to be used in connection with the Company's Annual Meeting of Shareholders pursuant to Instruction G(3) of Form 10-K.
Item 12. Security Ownership of Certain Beneficial Owners and Management and Related Stockholder Matters.
Information in response to Item 12 is incorporated by reference from the Company's definitive proxy statement to be used in connection with the Company's Annual Meeting of Shareholders pursuant to Instruction G(3) of Form 10-K.
Item 13. Certain Relationships and Related Transactions, and Director Independence.
Information in response to Item 13 is incorporated by reference from the Company's definitive proxy statement to be used in connection with the Company's Annual Meeting of Shareholders pursuant to Instruction G(3) of Form 10-K.
Item 14. Principal Accountant Fees and Services.
Information in response to Item 14 is incorporated by reference from the Company's definitive proxy statement to be used in connection with the Company's Annual Meeting of Shareholders pursuant to Instruction G(3) of Form 10-K.
PART IV
Item 15. Exhibits and Financial Statement Schedules.
(a) Financial Statements, Schedules and Exhibits:
1. Financial statements:
The consolidated financial statements for the fiscal year ended December 31, 2008,2010, are contained herein as listed in the Index to Consolidated Financial Statements on page 42.Page 40.
2. Financial schedules:
Index to Consolidated Financial Statements
Independent Registered Public Accounting Firms’Firm’s Report on Financial Statement Schedules
Schedule II - Condensed Financial Information of Registrant
Schedule III - Supplemental Insurance Information
Schedules other than those listed above are omitted, since they are not applicable, not required, or the information required being set forth is included in the consolidated financial statements or notes.
3. Exhibits:Exhibits
| | 3.1 | Articles of Incorporation of Registrant, as amended. (Incorporated herein by reference to Exhibit 3.1 to the Registrant's Annual Report on Form 10-K for the fiscal year ended March 31, 1984.) |
| | 3.2 | By-Laws of Registrant, as amendedamended. (Incorporated herein by reference to Exhibit 3.2 to Registrant's Annual Report on Form 10-K for the fiscal year ended December 31, 2008.) |
| 3.3 | Amended Section 1 of Article V of the Company’s Bylaws effective April 1, 2009 (Incorporated herein by reference to Exhibit 3.1 to Registrants Current Report on Form 8-K filed on March 26, 2009.) |
| | 10.1 | Unico American Corporation Profit Sharing Plan & Trust. (Incorporated herein by reference to Exhibit 10.1 to the Registrant's Annual Report on Form 10-K for the fiscal year ended March 31, 1985.)* |
| | 10.2 | The Lease dated July 31, 1986, between Unico American Corporation and Cheldin Management Company. (Incorporated herein by reference to Exhibit 10.5 to Registrant's Annual Report on Form 10-K for the fiscal year ended March 31, 1987.) |
| | 10.3 | The Lease Amendment #1 dated February 22, 1995, between Unico American Corporation and Cheldin Management Company amending the lease dated July 31, 1986. (Incorporated herein by reference to Exhibit 10.5 to Registrant's Annual Report on Form 10-K for the fiscal year ended March 31, 1995.) |
| | 10.4 | The Lease Amendment #2 dated March,23, 2007, between Unico American Corporation and Cheldin Management Company amending the lease dated July 31, 1986.1986 (Incorporated herein by reference to Exhibit 10.4 to Registrant’s Annual Report on Form 10-K filed on March 31, 2008.) |
| | 10.5 | 1999 Omnibus Stock Plan of Unico American Corporation (Incorporated herein by reference to Exhibit A to Registrant’s Proxy Statement for its Annual Meeting of Shareholders held June 4, 2000.)* |
| | 10.6 | Employment Agreement effective December 15, 2007, by and between the Registrant and Cary L. Cheldin. (Incorporated herein by reference to Exhibit 10.1 to Registrant's Current Report on Form 8-K filed on March 21, 2008)2008.)* |
| | 10.7 | Amendment to Employment Agreement effective May 15, 2006,April 1, 2009 by and between the Registrant and George C. Gilpatrick.Cary L. Cheldin (Incorporated herein by reference to Exhibit 10.210.1 to Registrant's CurrentAmendment to Registrant’s Quarterly Report on Form 8-K10-Q/A for the Quarter ended June 30, 2009 filed on May 31, 2006.November 30, 2009.)* |
| | 10.8 | Employment Agreement effective December 15, 2007, by and between the Registrant and Lester A. Aaron. (Incorporated herein by reference to Exhibit 10.2 to Registrant's Current Report on Form 8-K filed on March 21, 2008)2008.)* |
| 10.9 | Amendment to Employment Agreement effective April 1, 2009 by and between Registrant and Lester A. Aaron (Incorporated herein by reference to Exhibit 10.2 to Amendment to Registrant’s Quarterly Report on Form 10-Q/A for the Quarter ended June 30, 2009 filed on November 30, 2009.)* |
| 10.10 | Employment Agreement effective April 1, 2009 by and between Registrant and Terry L. Kinigstein (Incorporated herein by reference to Exhibit 10.3 to Amendment to Registrant’s Quarterly Report on Form 10-Q/A for the Quarter ended June 30, 2009 filed on November 30, 2009.)* |
| 10.11 | Unico American Corporation Money Purchase Plan & Trust. (Incorporated herein by reference to Exhibit 10.11 to the Registrant's Amendment No. 1 on Form 10-K/A to its Annual Report on Form 10-K for the fiscal year ended December, 31, 2009, filed on March 9, 2011.)* |
| | 21 | Subsidiaries of Registrant. (Incorporated herein by reference to Exhibit 22 to Registrant's Annual Report on Form 10-K for the fiscal year ended March 31, 1984.) |
| | 23 | Consent of Independent Registered Public Accounting Firm - KPMG LLP. |
| | 31.1 | Certificate of Chief Executive Officer pursuant to Rule 13a-14(a) or Rule 15d-14(a), as adopted pursuant to Section 302 of the Sarbanes-Oxley Act of 2002. |
| | 31.2 | Certificate of Chief Financial Officer pursuant to Rule 13a-14(a) or Rule 15d-14(a), as adopted pursuant to Section 302 of the Sarbanes-Oxley Act of 2002. |
| | 32.1 | Certification of Chief Executive Officer pursuant to 18 U.S.C. Section 1350, as adopted pursuant to Section 906 of the Sarbanes-Oxley Act of 2002. |
| | 32.2 | Certification of Chief Financial Officer pursuant to 18 U.S.C. Section 1350, as adopted pursuant to Section 906 of the Sarbanes-Oxley Act of 2002. |
| * Indicates management contract or compensatory plan or arrangement. |
* Indicates management contract or compensatory plan or arrangement
SIGNATURES
Pursuant to the requirements of Section 13 or 15(d) of the Securities Exchange Act of 1934, the Registrant has duly caused this report to be signed on its behalf by the undersigned, thereunto duly authorized.
Date: March 26, 200930, 2011
UUNICONICO AMERICAN CORPORATION
By: /s/ ErwinCary L. Cheldin
ErwinCary L. Cheldin
Chairman of the Board
Pursuant to the requirements of the Securities Exchange Act of 1934, this report has been signed below by the following persons on behalf of the Registrant and in the capacities and on the dates indicated.
| Signature | Title | Date |
| | | |
/s/ ErwinCary L. Cheldin ErwinCary L. Cheldin
| Chairman of the Board, President and Chief Executive Officer, (Principal Executive Officer) | March 26, 200930, 2011 |
| | | |
/s/ Lester A. Aaron Lester A. Aaron | Treasurer, Chief Financial Officer and Director (Principal (Principal Accounting and Principal Financial Officer) | |
| | | |
/s/ Cary L. Cheldin Cary L. Cheldin
| Executive Vice President and Director | March 26, 2009 |
| | |
/s/ Terry L. Kinigstein
Terry L. Kinigstein | Vice President, Secretary and Director | |
| | |
/s/ Erwin Cheldin Erwin Cheldin | Director | |
| | | |
| /s/ George C. Gilpatrick | Director | |
| George C. Gilpatrick | | |
| | |
/s/ Jon P. Kocourek
| Director | March 26, 2009 |
Jon P. Kocourek | | |
| | | |
| /s/ David A. Lewis | Director | March 26, 200930, 2011 |
| David A. Lewis | | |
| | | |
| /s/ Warren D. Orloff | Director | |
| Warren D. Orloff | | |
| | | |
| /s/ Donald B. Urfrig | Director | |
| Donald B. Urfrig | | |
REPORT OF INDEPENDENT REGISTERED PUBLIC ACCOUNTING FIRM
The Board of Directors and Stockholders
Unico American Corporation:
Under date of March 30, 2009,2011, we reported on the consolidated balance sheets of Unico American Corporation and subsidiaries as of December 31, 20082010 and 2007,2009, and the related consolidated statements of operations, comprehensive income, changes in stockholders’ equity, and cash flows for each of the years in the three-year period ended December 31, 2008,2010, as contained in the 2008 annual report to stockholders. These consolidated financial statements and our report thereon are incorporated by reference in the annual report on Form 10-K10K for the year 2008.2010. In connection with our audits of the aforementioned consolidated financial statements, we also audited the related financial statement schedules as listed under Item 15(a)2. These financial statement schedules are the responsibility of the Company’s management. Our responsibility is to express an opinion on these financial statement schedules based on our audits.
In our opinion, such financial statement schedules, when considered in relation to the basic consolidated financial statements taken as a whole, present fairly, in all material respects, the information set forth therein.
KPMG LLP
Los Angeles, California
March 30, 2009
2011
SCHEDULE II
UNICO AMERICAN CORPORATION
AND SUBSIDIARIES
CONDENSED FINANCIAL INFORMATION OF REGISTRANT
BALANCE SHEETS - PARENT COMPANY ONLY
| | | December 31 | | | December 31 | |
| | | 2008 | | | 2007 | |
| | |
| ASSETS | |
| | | | | | | |
| Investments | | | | | | |
| Short-term investments | | $ | 2,786 | | | $ | 2,725 | |
| Total investments | | | 2,786 | | | | 2,725 | |
| Cash | | | 12,982 | | | | 5,743 | |
| Investments in subsidiaries | | | 86,551,577 | | | | 83,407,324 | |
| Property and equipment (net of accumulated depreciation) | | | 359,553 | | | | 557,234 | |
| Other assets | | | 153,916 | | | | 509,170 | |
| Total Assets | | $ | 87,080,814 | | | $ | 84,482,196 | |
| | | | | | | | | |
| LIABILITIES AND STOCKHOLDERS’ EQUITY | |
| | | | | | | | | |
| LIABILITIES | | | | | | | | |
| | | | | | | | | |
| Accrued expenses and other liabilities | | $ | 86,969 | | | $ | 123,646 | |
| Payables to subsidiaries (net of receivables) (1) | | | 9,476,986 | | | | 15,255,447 | |
| Income taxes payable | | | 558,604 | | | | - | |
| Total Liabilities | | $ | 10,122,559 | | | $ | 15,379,093 | |
| | | | | | | | | |
| STOCKHOLDERS’ EQUITY | | | | | | | | |
| | | | | | | | | |
| Common stock | | $ | 3,569,099 | | | $ | 3,594,207 | |
| Accumulated other comprehensive | | | 4,904,873 | | | | 1,916,154 | |
| Retained earnings | | | 68,484,283 | | | | 63,592,742 | |
| Total Stockholders’ Equity | | $ | 76,958,255 | | | $ | 69,103,103 | |
| | | | | | | | | |
| Total Liabilities and Stockholders’ Equity | | $ | 87,080,814 | | | $ | 84,482,196 | |
| (1) The Company and its wholly owned subsidiaries file consolidated federal and combined California income tax returns. Pursuant to a tax allocation agreement, Crusader Insurance Company and American Acceptance Corporation are allocated taxes, or in the case of losses, tax credits at current corporate rates based on their own taxable income or loss. The payable to subsidiaries includes their income tax receivable or liability included in the consolidated return. |
The| | | December 31 | | | December 31 | |
| | | 2010 | | | 2009 | |
| | |
| ASSETS | |
| | | | | | | |
| Investments | | | | | | |
| Short-term investments | | $ | 1,861 | | | $ | 1,760 | |
| Total investments | | | 1,861 | | | | 1,760 | |
| Cash | | | 3,824 | | | | 68,499 | |
| Investments in subsidiaries | | | 76,017,316 | | | | 78,437,577 | |
| Property and equipment (net of accumulated depreciation) | | | 1,630,574 | | | | 221,255 | |
| Other assets | | | 151,345 | | | | 338,482 | |
| Total Assets | | $ | 77,804,920 | | | $ | 79,067,573 | |
| | | | | | | | | |
| LIABILITIES AND STOCKHOLDERS’ EQUITY | |
| | | | | | | | | |
| LIABILITIES | | | | | | | | |
| | | | | | | | | |
| Accrued expenses and other liabilities | | $ | 1,567,356 | | | $ | 131,776 | |
| Payables to subsidiaries (net of receivables) | | | 2,882,573 | | | | 5,620,457 | |
| Income taxes payable | | | 1,175 | | | | - | |
| Total Liabilities | | $ | 4,451,104 | | | $ | 5,752,233 | |
| | | | | | | | | |
| STOCKHOLDERS’ EQUITY | | | | | | | | |
| | | | | | | | | |
| Common stock | | $ | 3,554,973 | | | $ | 3,437,343 | |
| Accumulated other comprehensive income | | | 2,251,063 | | | | 2,742,160 | |
| Retained earnings | | | 67,547,780 | | | | 67,135,837 | |
| Total Stockholders’ Equity | | $ | 73,353,816 | | | $ | 73,315,340 | |
| | | | | | | | | |
| Total Liabilities and Stockholders’ Equity | | $ | 77,804,920 | | | $ | 79,067,573 | |
See accompanying notes to condensed financial information should be read in conjunction with the consolidated financial statements and notes.information. See accompanying report of independent registered accounting firm.
SCHEDULE II (continued)
UNICO AMERICAN CORPORATION
AND SUBSIDIARIES
CONDENSED FINANCIAL INFORMATION OF REGISTRANT
STATEMENTS OF OPERATIONS - PARENT COMPANY ONLY
FOR THE YEARS ENDED DECEMBER 31
| | | 2008 | | | 2007 | | | 2006 | | |
| | | | | | | | | | | | 2010 | | | 2009 | | | 2008 | |
| REVENUES | | | | | | | | | | | | | | | | | | |
| | | | | | | | | | | | | | | | | | | |
| Net investment income | | $ | 729 | | | $ | 1,735 | | | $ | 529 | | | $ | 718 | | | $ | 7 | | | $ | 729 | |
| Other income | | | 13,100 | | | | 14,078 | | | | 7,663 | | | | 13,827 | | | | 8,700 | | | | 13,100 | |
| Total Revenue | | | 13,829 | | | | 15,813 | | | | 8,192 | | | | 14,545 | | | | 8,707 | | | | 13,829 | |
| | | | | | | | | | | | | | | | | | | | | | | | | |
| EXPENSES | | | | | | | | | | | | | | | | | | | | | | | | |
| | | | | | | | | | | | | | | | | | | | | | | | | |
| General and administrative expenses | | | 3,333 | | | | 8,552 | | | | 1,818 | | | | 6,230 | | | | 2,118 | | | | 3,333 | |
| Income before equity in net income of subsidiaries | | | 10,496 | | | | 7,261 | | | | 6,374 | | | | 8,315 | | | | 6,589 | | | | 10,496 | |
| Equity in net income of subsidiaries | | | 5,272,520 | | | | 6,705,183 | | | | 11,919,092 | | | | 2,320,837 | | | | 2,920,786 | | | | 5,272,520 | |
| Net Income | | $ | 5,283,016 | | | $ | 6,712,444 | | | $ | 11,925,466 | | | $ | 2,329,152 | | | $ | 2,927,375 | | | $ | 5,283,016 | |
The Company and its subsidiaries file a consolidated federal income tax return.
Unico received cash dividends from American Acceptance Corporation of $1,000,000 and $400,000 in the years ended December 31, 2008 and December 31, 2007, respectively.
Unico was reimbursed certain expenses by its subsidiaries. These expenses included depreciation and amortization of $212,028, $238,876, and $238,833 for the years ended December 31, 2008, 2007, and 2006, respectively.
TheSee accompanying notes to condensed financial information should be read in conjunction with the consolidated financial statements and notes.information. See accompanying report of independent registered accounting firm.
SCHEDULE II (continued)
UNICO AMERICAN CORPORATION
AND SUBSIDIARIES
CONDENSED FINANCIAL INFORMATION OF REGISTRANT
STATEMENTS OF CASH FLOWS - PARENT COMPANY ONLY
FOR THE YEARS ENDED DECEMBER 31
| | | 2008 | | | 2007 | | | 2006 | | | 2010 | | | 2009 | | | 2008 | |
| Cash flows from operating activities: | | | | | | | | | | | | | | | | | | |
| Net income | | $ | 5,283,016 | | | $ | 6,712,444 | | | $ | 11,925,466 | | | $ | 2,329,152 | | | $ | 2,927,375 | | | $ | 5,283,016 | |
| | | | | | | | | | | | | | | | | | | | | | | | | |
Adjustments to reconcile net income to net cash from operations | | | | | | | | | | | | | | | | | | | | | | | | |
| Undistributed equity in net income of subsidiaries | | (5,272,520 | ) | | (6,705,183 | ) | | (11,919,092 | ) | | | (2,320,837 | ) | | | (2,920,786 | ) | | | (5,272,520 | ) |
| Depreciation and amortization | | 212,028 | | | 238,876 | | | 238,833 | | | | 127,371 | | | | 196,040 | | | | 212,028 | |
| Accrued expenses and other liabilities | | (36,677 | ) | | (41,974 | ) | | 9,268 | | | | 3,662 | | | | 44,807 | | | | (36,677 | ) |
| Accrued investment and other income | | - | | | 5,000 | | | 7,902 | | |
| Tax benefit from disqualified incentive stock options | | - | | | (60,785 | ) | | (203,126 | ) | | | (40,031 | ) | | | - | | | | - | |
| Other assets | | | 355,254 | | | | (319,826 | ) | | | 281,098 | | | | 187,138 | | | | (184,566 | ) | | | 355,254 | |
| Net cash provided (used) from operations | | | 541,101 | | | | (171,448 | ) | | | 340,349 | | |
| Net cash provided by operating activities | | | | 286,455 | | | | 62,870 | | | | 541,101 | |
| | | | | | | | | | | | | | | | | | | | | | | | | |
| Cash flows from investing activities | | | | | | | | | | | | | | | | | | | | | | | | |
| Decrease (increase) in short-term investments | | (61 | ) | | 7,016 | | | (383 | ) | | | (101 | ) | | | 1,026 | | | | (61 | ) |
| Additions to property and equipment | | | (14,347 | ) | | | (57,030 | ) | | | (153,409 | ) | | | (104,773 | ) | | | (57,742 | ) | | | (14,347 | ) |
| Net cash used by investing activities | | | (14,408 | ) | | | (50,014 | ) | | | (153,792 | ) | |
| Dividends received from subsidiaries | | | | 4,250,000 | | | | 8,650,000 | | | | 1,000,000 | |
| Net change in payables and receivables from subsidiaries | | | | (2,696,677 | ) | | | (4,193,060 | ) | | | (1,102,871 | ) |
| Net cash provided (used) by investing activities | | | | 1,448,449 | | | | 4,400,224 | | | | (117,279 | ) |
| | | | | | | | | | | | | | | | | | | | | | | | | |
| Cash flows from financing activities | | | | | | | | | | | | | | | | | | | | | | | | |
| Dividend paid to stockholders | | | | (1,917,209 | ) | | | (1,959,629 | ) | | | - | |
| Proceeds from exercise of stock options | | - | | | 301,336 | | | 313,132 | | | | 77,599 | | | | - | | | | - | |
| Tax benefit from disqualified incentive stock options | | - | | | 60,785 | | | 203,126 | | | | 40,031 | | | | - | | | | - | |
| Repurchase of common stock | | (416,583 | ) | | (115,261 | ) | | - | | | | - | | | | (2,447,948 | ) | | | (416,583 | ) |
| Net change in payables and receivables from subsidiaries | | | (102,871 | ) | | | (25,470 | ) | | | (704,017 | ) | |
| Net cash provided (used) by financing activities | | | (519,454 | ) | | | 221,390 | | | | (187,759 | ) | |
| Net cash (used) by financing activities | | | | (1,799,579 | ) | | | (4,407,577 | ) | | | (416,583 | ) |
| | | | | | | | | | | | | | | | | | | | | | | | | |
| Net (decrease) in cash | | 7,239 | | | (72 | ) | | (1,202 | ) | |
| Net increase (decrease) in cash | | | | (64,675 | ) | | | 55,517 | | | | 7,239 | |
| | | | | | | | | | | | | | | | | | | | | | | | | |
| Cash at beginning of year | | | 5,743 | | | | 5,815 | | | | 7,017 | | | | 68,499 | | | | 12,982 | | | | 5,743 | |
| | | | | | | | | | | | | | | | | | | | | | | | | |
| Cash at end of year | | $ | 12,982 | | | $ | 5,743 | | | $ | 5,815 | | | $ | 3,824 | | | $ | 68,499 | | | $ | 12,982 | |
| | | | | | | | | | | | | | |
| Supplemental Schedule of Non-Cash Investing Activities | | | | | | | | | | | | | |
| Acquisition of fixed assets | | | $ | 1,431,917 | | | | - | | | | - | |
| | | | | | | | | | | | | | |
See accompanying notes to condensed financial information. See accompanying report of independent registered accounting firm.
UNICO AMERICAN CORPORATION
AND SUBSIDIARIES
CONDENSED FINANCIAL INFORMATION OF REGISTRANT
NOTES TO CONDENSED FINANCIAL INFORMATION
The accompanying condensed financial information should be read in conjunction with the Consolidated Financial Statements and Notes to Consolidated Financial Statements included in this report.
Dividends
Unico received cash dividends from Crusader Insurance Company of $4,250,000 and $7,000,000 in the years ended December 31, 2010 and 2009, respectively. In addition, Unico received cash dividends from American Acceptance Corporation of $1,650,000 and $1,000,000 in the years ended December 31, 2009 and 2008, respectively.
Federal Income Taxes
The Company and its wholly owned subsidiaries file consolidated financial statementsfederal and notes. combined California income tax returns. Pursuant to a tax allocation agreement, Crusader Insurance Company and American Acceptance Corporation are allocated taxes, or tax credits in the case of losses, at current corporate rates based on their own taxable income or loss. The payable to subsidiaries includes their income tax receivable or liability included in the consolidated return.
Reimbursement of Expenses
Unico was reimbursed certain expenses by its subsidiaries. These expenses included depreciation and amortization of $127,371, $196,040, and $212,028 for the years ended December 31, 2010, 2009, and 2008, respectively.
Immaterial Correction to Previously Reported Amounts
The Company identified an error that arose primarily from the recording of dividends paid from the Company’s wholly owned subsidiaries to the parent company as reflected in the previously filed Condensed Balance Sheets- Parent Company Only on Schedule II. The error required a reduction of both Investment in subsidiaries and Payables to subsidiaries (net of receivables) of $13,210,677 as of December 31, 2009. The Company also determined that cash flows associated with these items were more appropriately classified as investing activities rather than financing activities in the Condensed Statements of Cash Flows – Parent Company Only on Schedule II. Therefore, for 2009, cash provided by investing activities and cash used in financing activities were both increased by $4,456,940 from amounts previously reported, and for 2008, cash used in investing activities increased by $102,871, with a corresponding decrease in cash used by financing activities. The Company made an assessment of the materiality of this item and concluded that it was immaterial. Accordingly, in accordance with SAB No. 108, “Considering the Effects of Prior Year Misstatements when Quantifying Misstatements in Current Year Financial Statements,” Schedule II has been revised to correct the immaterial error.
See accompanying report of independent registered accounting firm.
SCHEDULE III
UNICO AMERICAN CORPORATION| UNICO AMERICAN CORPORATION | |
| AND SUBSIDIARIES | |
| SUPPLEMENTARY INSURANCE INFORMATION | |
| | |
| | | | | | | | | | | | | | | | | | | | | | | | | | | | |
| | | | | | Future | | | | | | | | | | | | | | | | | | | | | | |
| | | | | | Benefits, | | | | | | | | | | | | Benefits, | | | Amortization | | | | | | | |
| | | Deferred | | | Losses, | | | | | | | | | | | | Claims, | | | of Deferred | | | | | | | |
| | | Policy | | | and Loss | | | | | | | | | Net | | | Losses and | | | Policy | | | Other | | | Net | |
| | | Acquisition | | | Adjustment | | | Unearned | | | Premium | | | Investment | | | Settlement | | | Acquisition | | | Operating | | | Premium | |
| | | Cost | | | Expenses | | | Premiums | | | Revenue | | | Income | | | Expenses | | | Costs | | | Costs | | | Written | |
| | | | | | | | | | | | | | | | | | | | | | | | | | | | |
| Year ended | | | | | | | | | | | | | | | | | | | | | | | | | | | |
| December 31, 2010 | | | | | | | | | | | | | | | | | | | | | | | | | | | |
| Property & | | | | | | | | | | | | | | | | | | | | | | | | | | | |
| Casualty | | $ | 4,300,927 | | | $ | 61,559,695 | | | $ | 15,929,948 | | | $ | 28,152,202 | | | $ | 3,489,498 | | | $ | 18,470,115 | | | $ | 7,282,546 | | | $ | 140,017 | | | $ | 25,270,320 | |
| | | | | | | | | | | | | | | | | | | | | | | | | | | | | | | | | | | | | |
| Year ended | | | | | | | | | | | | | | | | | | | | | | | | | | | | | | | | | | | | |
| December 31, 2009 | | | | | | | | | | | | | | | | | | | | | | | | | | | | | | | | | | | | |
| Property & | | | | | | | | | | | | | | | | | | | | | | | | | | | | | | | | | | | | |
| Casualty | | $ | 4,955,636 | | | $ | 71,585,408 | | | $ | 18,811,415 | | | $ | 30,774,471 | | | $ | 4,325,123 | | | $ | 19,545,761 | | | $ | 7,612,716 | | | $ | 663,632 | | | $ | 29,635,898 | |
| | | | | | | | | | | | | | | | | | | | | | | | | | | | | | | | | | | | | |
| Year ended | | | | | | | | | | | | | | | | | | | | | | | | | | | | | | | | | | | | |
| December 31, 2008 | | | | | | | | | | | | | | | | | | | | | | | | | | | | | | | | | | | | |
| Property & | | | | | | | | | | | | | | | | | | | | | | | | | | | | | | | | | | | | |
| Casualty | | $ | 5,219,892 | | | $ | 78,654,590 | | | $ | 19,962,118 | | | $ | 33,949,695 | | | $ | 5,829,304 | | | $ | 20,592,730 | | | $ | 8,261,324 | | | $ | 586,556 | | | $ | 31,175,204 | |
AND SUBSIDIARIES
SUPPLEMENTARY INSURANCE INFORMATION
| | | | | | Future | | | | | | | | | | | | | | | | | | | | | | |
| | | | | | Benefits, | | | | | | | | | | | | Benefits, | | | Amortization | | | | | | | |
| | | Deferred | | | Losses, | | | | | | | | | | | | Claims, | | | of Deferred | | | | | | | |
| | | Policy | | | and Loss | | | | | | | | | Net | | | Losses and | | | Policy | | | Other | | | Net | |
| | | Acquisition | | | Adjustment | | | Unearned | | | Premium | | | Investment | | | Settlement | | | Acquisition | | | Operating | | | Premium | |
| | | Cost | | | Expenses | | | Premiums | | | Revenue | | | Income | | | Expenses | | | Costs | | | Costs | | | Written | |
| | | | | | | | | | | | | | | | | | | | | | | | | | | | |
| | | | | | | | | | | | | | | | | | | | | | | | | | | | |
| Year Ended | | | | | | | | | | | | | | | | | | | | | | | | | | | |
December 31, 2008 | | | | | | | | | | | | | | | | | | | | | | | | | | | |
| Property & | | | | | | | | | | | | | | | | | | | | | | | | | | | |
| Casualty | | $ | 5,219,892 | | | $ | 78,654,590 | | | $ | 19,962,118 | | | $ | 33,949,695 | | | $ | 5,829,304 | | | $ | 20,592,730 | | | $ | 8,261,324 | | | $ | 586,556 | | | $ | 31,175,204 | |
| | | | | | | | | | | | | | | | | | | | | | | | | | | | | | | | | | | | | |
| Year Ended | | | | | | | | | | | | | | | | | | | | | | | | | | | | | | | | | | | | |
December 31, 2007 | | | | | | | | | | | | | | | | | | | | | | | | | | | | | | | | | | | | |
| Property & | | | | | | | | | | | | | | | | | | | | | | | | | | | | | | | | | | | | |
| Casualty | | $ | 5,722,847 | | | $ | 94,730,711 | | | $ | 22,742,612 | | | $ | 37,129,665 | | | $ | 6,695,121 | | | $ | 22,182,237 | | | $ | 8,465,047 | | | $ | 1,032,591 | | | $ | 33,412,745 | |
| | | | | | | | | | | | | | | | | | | | | | | | | | | | | | | | | | | | | |
| Year Ended | | | | | | | | | | | | | | | | | | | | | | | | | | | | | | | | | | | | |
December 31, 2006 | | | | | | | | | | | | | | | | | | | | | | | | | | | | | | | | | | | | |
| Property & | | | | | | | | | | | | | | | | | | | | | | | | | | | | | | | | | | | | |
| Casualty | | $ | 6,430,265 | | | $ | 93,596,117 | | | $ | 26,434,187 | | | $ | 42,933,789 | | | $ | 5,906,079 | | | $ | 17,826,979 | | | $ | 9,250,989 | | | $ | 1,691,629 | | | $ | 38,166,864 | |
