UNITED STATES SECURITIES AND EXCHANGE COMMISSION
Washington, D.C. 20549
_________________________
FORM 10-K
R Annual Report Pursuant to Section 13 or 15(d) of the Securities Exchange Act of 1934 for the fiscal year ended December 31, 20102011
OR
o Transition Report Pursuant to Section 13 or 15(d) of the Securities Exchange Act of 1934 for the transition period from ______ to ______
Commission File Number 001-34257
UNITED FIRE & CASUALTY COMPANYGROUP, INC.
(Exact name of registrant as specified in its charter)
|
| | |
| Iowa | | 42-064432745-2302834 |
| (State of Incorporation) | | (IRS Employer Identification No.) |
|
|
| 118 Second Avenue SE |
| PO Box 73909 |
| Cedar Rapids, Iowa 52407-3909 |
| (Address of principal executive offices) (Zip Code) |
Registrant’s telephone num ber,number, including area code: (319) 399-5700
Securities Registered Pursuant to Section 12(b) of the Act:
|
| | |
| Title of each class | | Name of each exchange on which registered |
Common Stock, $3.33 1/3$0.001 par value | | The NASDAQ StockGlobal Select Market LLC |
Securities Registered Pursuant to Section 12(g) of the Act: None
Indicate by check mark if the registrant is a well-known seasoned issuer, as defined in Rule 405 of the Securities Act. YES £ NO R
Indicate by check mark if the registrant is not required to file reports pursuant to Section 13 or Section 15(d) of the Act. YES £ NO R
Indicate by check mark whether the registrant (1) has filed all reports required to be filed by Section 13 or 15(d) of the Securities Exchange Act of 1934 during the preceding 12 months (or for such shorter period that the registrant was required to file such reports), and (2) has been subje ctsubject to such filing requirements for the past 90 days. YES R NO £
Indicate by check mark whether the registrant has submitted electronically and posted on its corporate website, if any, every Interactive Data File required to be submitted and posted pursuant to Rule 405 of Regulation S-T (§232.405 of this chapter) during the preceding 12 months (or for such shorter period that the registrant was required to submit and post such files). YES £R NO £
Indicate by check mark if disclosure of delinquent filers pursuant to Item 405 of Regulation S-K is not contained herein, and will not be contained, to the best of registrant’s knowledge, in definitive proxy or information statements incorporated by reference in Part III of this Form 10-K or any amendment to this Form 10-K. £
Indicate by check mark whether the registrant is a large accelerated filer, an accelerated filer, a non-accelerated filer, or a smaller reporting company. See the definitions of “large accelerated filer,” “accelerated filer” and “smaller reporting company” in Rule 12b-2 of the Exchange Act.
|
| | | | | | |
Large accelerated filer £ | | Accelerated filer R | | Non-accelerated filer £ | | Smaller reporting company £ |
Indicate by check mark whether the registrant is a shell company (as defined in Rule 12b-2 of the Act). YES £ NO R
The aggregate market value of voting stock held by nonaffiliates of the registrant as of June 30, 2010,2011, was approximately $433.0 million.$372.7 million. For purposes of this calculation, all directors and executive officers of the registrant are considered affiliates. As of February 24, 2011, 26,195,552March 13, 2012, 25,506,809 shares of common stock were outstanding.
DOCUMENTS INCORPORATED BY REFERENCE
Part III of this Form 10-K incorporates by reference certain information from the registrant’s definitive proxy statement to be filed with the Securities and Exchange Commission pursuant to Regulation 14A of the Securities Exchange Act of 1934, as amended, for its annual stockholders meeting to be held on May 18, 201116, 2012.
FORM 10-K TABLE OF CONTENTS
|
| |
| | PAGE |
| |
| | |
| |
| | |
| |
| | |
| |
| | |
| |
| | |
| |
| | |
| |
| | |
| |
| | |
| |
| | |
| |
| | |
| |
| | |
| |
| | |
| |
| | |
| |
| | |
| |
| | |
| |
| | |
| |
| | |
| |
| | |
| |
| | |
| |
| | |
| |
| | |
| |
| | |
| |
| | |
| |
| | |
| |
| | |
| Exhibit 12 |
| Exhibit 21 |
| Exhibit 23.1 |
| Exhibit 23.2 |
| Exhibit 23.3 |
| Exhibit 31.1 |
| Exhibit 31.2 |
| Exhibit 32.1 |
| Exhibit 32.2 |
United Fire & Casualty CompanyGroup, Inc. Form 10-K | 20102011
PART I.
ITEM 1. BUSINESS
|
|
| FORWARD-LOOKING INFORMATION |
It is important to note that our actual results could differ materially from those projected in forward-looking statements. Information concerning factors that could cause actual results to differ materially from those in the forward-looking statements is contained in Part I, Item 1A, “Risk Factors,” and Part II, Item 7, “Management’s Discussion and Analysis of Financial Condition and Results of Operations.”
The terms “United Fire,” “United Fire Group,“Company,” “we,” “us,” or “our” refer, as the context requires, to United Fire Group, Inc., United Fire & Casualty Company, United Fire Group, Inc. and its consolidated subsidiaries and affiliates, or to United Fire & Casualty Company and its consolidated subsidiaries and affiliate, as the context requires.affiliates. We are engaged in the business of writing property and casualty insurance and life insurance and selling annuities. United Fire & Casualty Company was incorporated in Iowa in January 1946. Our principal executive office is located at 118 Second Avenue SE, P.O. Box 73909, , Cedar Rapids, Iowa 52407-3909. Telephone: 319-399-5700.
Holding Company
On February 1, 2012, we completed a holding company reorganization (the "Reoganization") of United Fire Group, Inc., United Fire & Casualty Company, and UFC MergeCo, Inc., an Iowa corporation formed for the purpose of facilitating the Reorganization. The Reorganization Agreement was approved and adopted by United Fire & Casualty Company stockholders at a special meeting of stockholders, held on January 24, 2012.
The Reorganization Agreement provided for the merger of United Fire & Casualty Company with UFC MergeCo, Inc., with United Fire & Casualty Company surviving the Merger as a wholly owned subsidiary of United Fire Group, Inc.. Each share of common stock, par value $3.33 1/3 per share, of United Fire & Casualty Company issued and outstanding immediately prior to the effective time of the Merger into one duly issued, fully paid and nonassessable share of common stock, par value $0.001 per share, of United Fire Group, Inc. At the time of completion of the Reorganization, the separate existence of UFC MergeCo, Inc. terminated. In addition, each outstanding option to purchase or other right to acquire shares of United Fire & Casualty Company Common Stock was automatically converted into an option to purchase or right to acquire, upon the same terms and conditions, an identical number of shares of United Fire Group, Inc. Common Stock.
Upon completion of the Reorganization, United Fire Group, Inc., an Iowa corporation, replaced United Fire & Casualty Company, an Iowa corporation, as the publicly held corporation, and the holders of United Fire & Casualty Company Common Stock now hold the same number of shares and same ownership percentage of United Fire Group, Inc. as they held of United Fire & Casualty Company immediately prior to the Reorganization. On February 2, 2012, shares of United Fire Group, Inc. Common Stock commenced trading on the NASDAQ Global Select Market under the symbol “UFCS.”
The directors and executive officers of United Fire Group, Inc. immediately following the Reorganization are the same individuals who were directors and executive officers, respectively, of United Fire & Casualty Company immediately prior to the Reorganization.
Employees
As of December 31, 20102011, we employed 640868 full-time employees and 1426 part-time employees. We are not a party to any collective bargaining agreement.
United Fire Group, Inc. Form 10-K | 2011
Reportable Segments
We report our operations in two business segments: property and casualty insurance and life insurance. Our property and casualty insurance segment is comprised of commercial lines insurance, including surety bonds, personal lines insurance and assumed insurance. Our life insurance segment is comprised of deferred and immediate annuities, universal life insurance products and traditional life insurance products. in A table reflecting revenues, net income and assets attributable to our operating segments is included in Part II, Item 8, Note 1110 “Segment Information.” All intercompany balances have been eliminated in consolidation.
Our organizational structure is as follows:
United Fire & Casualty Company Form 10-K | 2010
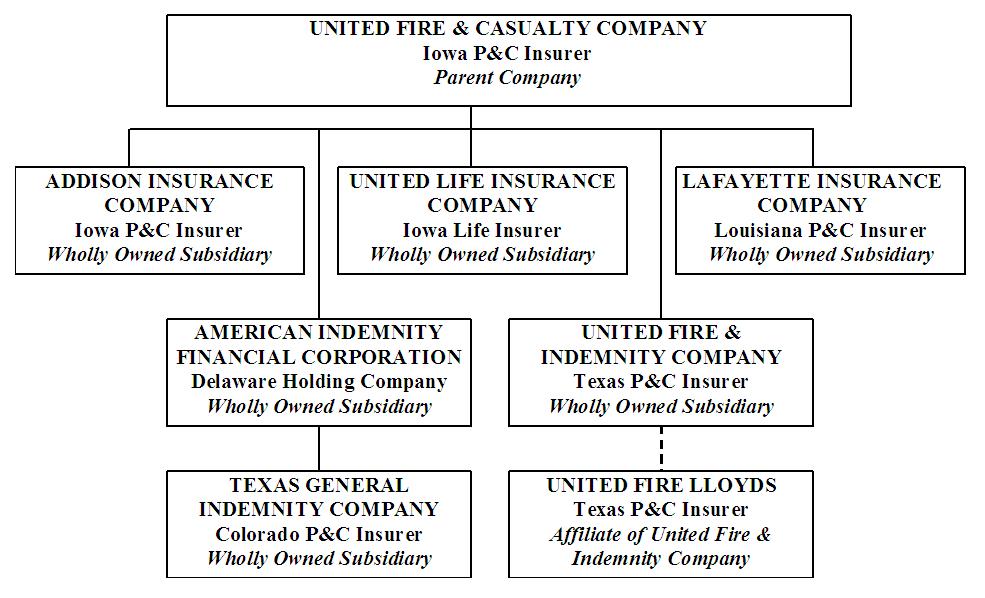
(1) United Fire is the sole shareholder of Red Oak Acquisition Corp. (“Red Oak”), a corporation formed under the laws of the Commonwealth of Pennsylvania on November 24, 2010. We formed Red Oak for the purpose of facilitating our planned acquisition of Mercer Insurance Group, Inc. (“Mercer”). In connection with our acquisition of Mercer, we expect that Red Oak will merge with and into Mercer and will then cease to exist as a separate corporation.All of our property and casualty insurance subsidiaries belong to one of two reinsurance pooling arrangement, with the exception of American Indemnity Financial Corporation and Te xasTexas General Indemnity Company, are members of an intercompany reinsurance pooling arrangement. The insurance entities of Mercer Insurance Group, Inc. ("Mercer Insurance Group") participated in their own pooling arrangement in 2011, which was in place when we acquired Mercer Insurance Group on March 28, 2011. Effective January 1, 2012, one pooling arrangement exists to cover all participating insurance subsidiaries of United Fire Group, Inc. Pooling arrangements permit the participating companies to rely on the capacity of the entire pool’s capital and surplus, rather than being limited to policy exposures of a size commensurate with each participant’s own surplus level. Under such arrangements, the members share substantially all of the insurance business that is written and allocate the combined premiums, losses and expenses based on percentages defined in the arrangement.
Our life insurance segment consists solely of the operations of United Life Insurance Company.
Available Information
United Fire Group provides free and timely access to all companyCompany reports filed with the Securities and Exchange Commission (“SEC”) in the Investor Relations section of our website at www.unitedfiregroup.com. Select “SEC Filings” to view the list of filings, which includes:
| |
• | Annual reports (Form 10-K) |
| |
• | Quarterly reports (Form 10-Q) |
| |
• | Current reports (Form 8-K) |
| |
• | Beneficial ownership reports (Forms 3, 4 and 5) |
| |
• | Amendments to reports filed or furnished pursuant to Section 13(a), 15(d) or 16(a) of the Exchange Act. |
Annual reports (Form 10-K)
Quarterly reports (Form 10-Q)
Current reports (Form 8-K)
Beneficial ownership reports (Forms 3, 4 and 5)
Amendments to reports filed or furnished pursuant to Section 13(a), 15(d) or 16(a) of the Exchange Act.
Such reports are made available as s oonsoon as reasonably practicable after they are filed with or furnished to the SEC.
United Fire &a mp; Casualty Company Form 10-K | 2010
Our Code of Ethics is also available at www.unitedfiregroup.com in the Investor Relations section. To view it, select “Corporate Governance” and then “Code of Ethics.”
Free paper copies of any materials that we file with or furnish to the SEC can also be obtained by writing to Investor Relations, United Fire Group, Inc., P.O. Box 73909, Cedar Rapids, Iowa 52407-3909. In addition, you may read and copy any materials we file with or furnish to the SEC at the SEC Public Reference Room, 100 F Street, NE, Washington, D.C. 20549. For obtainingmore information on the operation of the SEC Public Reference Room, call the SEC at 1-800-SEC-0330.
The SEC maintains a website at www.sec.gov that contains reports, proxy and information statements, and other information regarding issuers that file electronically with the SEC.
Pending PurchaseAcquisition of Mercer Insurance Group, Inc.
On November 30, 2010,March 28, 2011, we announced our entry into a definitive agreement to acquireacquired 100 percent of the outstanding common stock of Mercer Insurance Group Inc. (“Mercer”)for $191.5 million; the acquisition was funded through a combination of cash and $79.9 million of short-term debt. Accordingly, the results of operations for Mercer Insurance Group have been included in a transaction valued at approximately $191.0 million. The transaction is subject to customary conditions, including approval by the stockholdersaccompanying
United Fire stockholders is not required, and there is no financing cond ition to completeGroup, Inc. Form 10-K | 2011
Consolidated Financial Statements from that date forward. After the transaction.
Mercer offers commercial and personal lines of insurance to businesses and individuals principally in New Jersey, Pennsylvania, Arizona, California, Nevada and Oregonacquisition, we market our products through its insurance subsidiaries: Mercer Insurance Company, Mercer Insurance Company of New Jersey, Inc., Financial Pacific Insurance Company and Franklin Insurance Company.
There is no overlap between the agency networks of United Fire and Mercer, as Mercer primarily markets in six Western and Mid-Atlantic states in which we have no appointedover 1,300 independent property and casualty agencies. FollowingIn addition, the closing of the transaction, we will market through approximately 1,400 independent agents in 43 states plus the District of Columbia,acquisition allows us to diversify ing our exposure to weather and other catastrophe risks across our geographic markets. Also following
This transaction was accounted for under the completionacquisition method using Mercer Insurance Group historical financial information and applying fair value estimates to the acquired assets, liabilities and commitments as of the transaction, the combined company will be ableacquisition date. For additional information related to build on common conservative underwritingthis acquisition, see Note 16 “Business Combinations” contained in Part II, Item 8, “Financial Statements and investment cultures.Supplementary Data.”
United Fire Group, Inc. Form 10-K | 2011
Our organizational structure as of December 31, 2011 is as follows: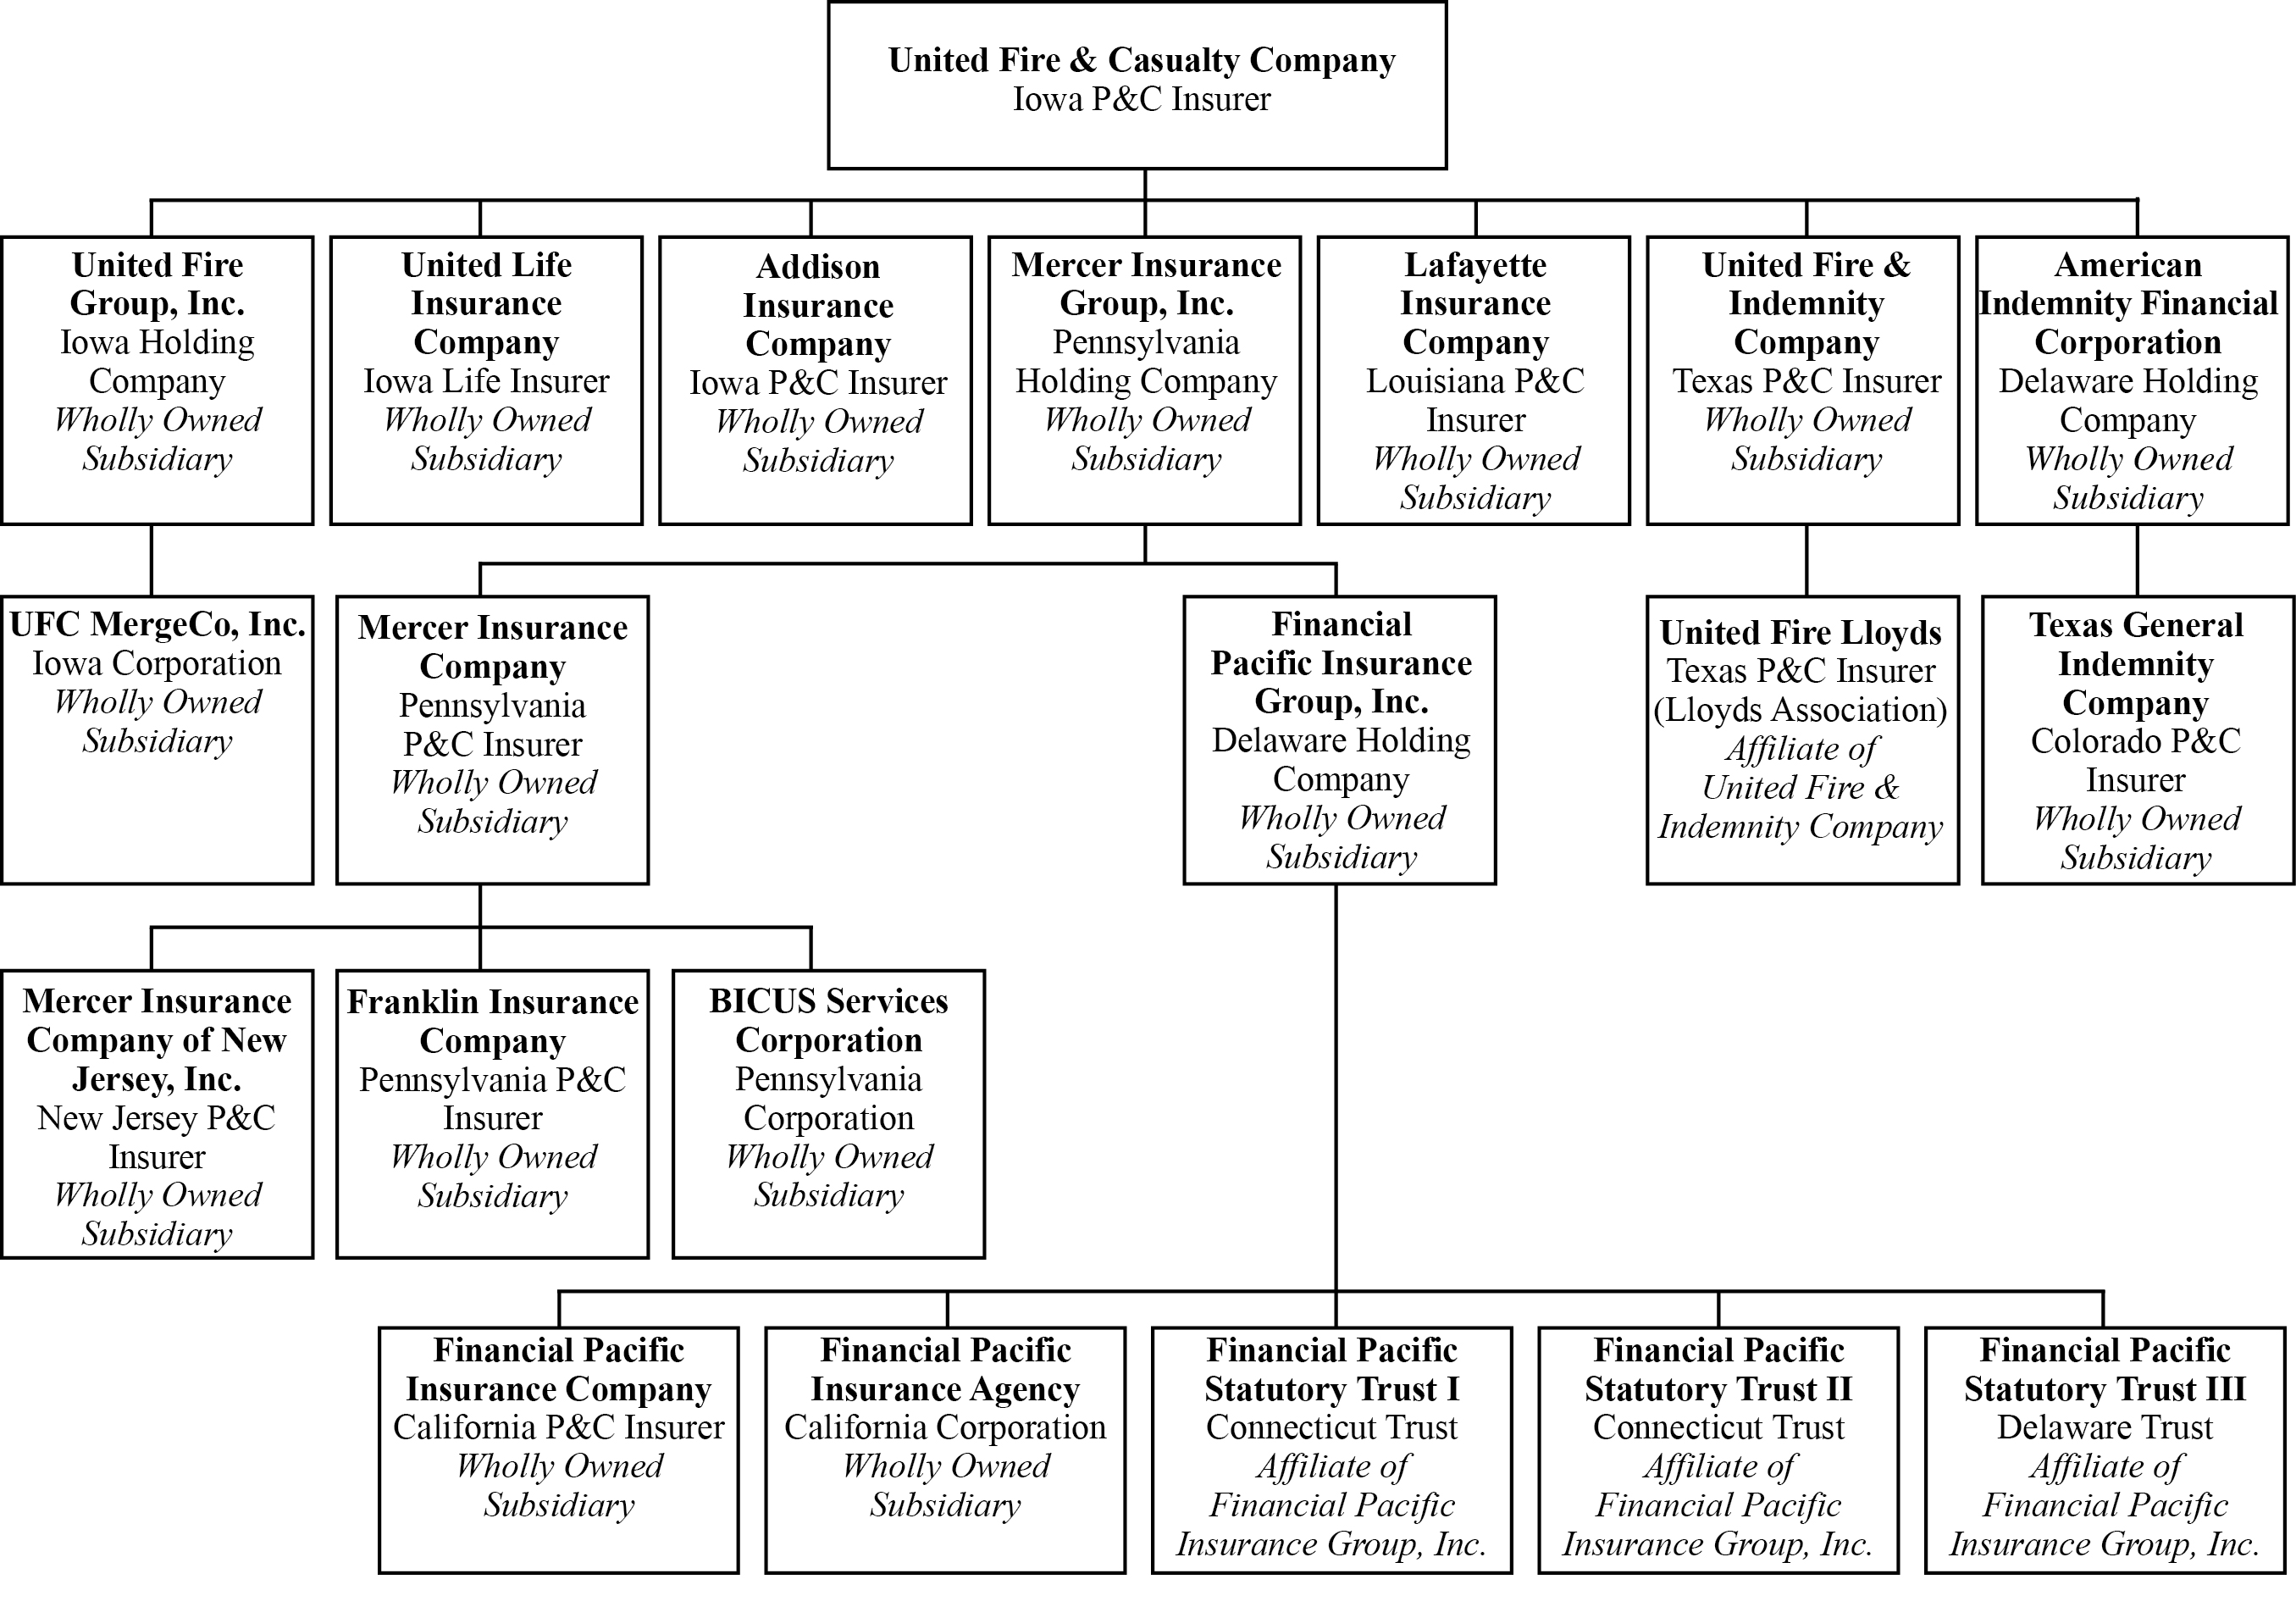
United Fire Group, Inc. Form 10-K | 2011
Our organizational structure as of February 1, 2012 is as follows:
United Fire Group, Inc. Form 10-K | 2011
We market our products through our home office in Cedar Rapids, Iowa, and twofour regional locations: Westminster, Colorado, a suburb of Denver,Denver; Galveston, Texas; Pennington, New Jersey; and Galveston, Texas.Rocklin, California.
We are licensed as a property and casualty insurer in 43 states, primarily in the Midwest, West and South, plus the District of Columbia. We have 7961,302 independent agencies representing us and our property and casualty insurance subsidiaries. In 2011, 2010 2009 and 20082009 the direct statutory premiums written forby our property and casualty insurance operations were distributed as follows:
| | | | Years Ended December 31, | % of Total | Years Ended December 31, | % of Total |
| (In Thousands) | 2010 | 2009 | 2008 | 2010 | 2009 | 2008 | 2011 | 2010 | 2009 | 2011 | 2010 | 2009 |
| Texas | $ | 68,655 | | $ | 69,900 | | $ | 70,301 | | 15.8 | % | 15.4 | % | 14.5 | % | $ | 74,845 |
| $ | 68,655 |
| $ | 69,900 |
| 12.9 | % | 15.8 | % | 15.4 | % |
| Iowa | 68,373 | | 69,515 | | 66,926 | | 15.7 | | 15.3 | | 13.8 | | 73,762 |
| 68,373 |
| 69,515 |
| 12.7 |
| 15.7 |
| 15.3 |
|
| California | | 61,500 |
| 13 |
| 6 |
| 10.6 |
| — |
| — |
|
| Missouri | 40,342 | | 41,185 | | 42,242 | | 9.3 | | 9.1 | | 8.7 | | 42,202 |
| 40,342 |
| 41,185 |
| 7.3 |
| 9.3 |
| 9.1 |
|
| Louisiana | 37,263 | | 41,743 | | 42,467 | | 8.6 | | 9.2 | &nb sp; | 8.8 | | 36,685 |
| 37,263 |
| 41,743 |
| 6.3 |
| 8.6 |
| 9.2 |
|
| New Jersey | | 33,793 |
| — |
| — |
| 5.8 |
| — |
| — |
|
| Illinois | 31,330 | &nbs p; | 33,465 | | 39,606 | | 7.2 | | 7.4 | | 8.2 | | 32,241 |
| 31,330 |
| 33,465 |
| 5.6 |
| 7.2 |
| 7.4 |
|
| Colorado | 28,775 | | 33,938 | | 46,763 | | 6.6 | | 7.5 | | 9.7 | | 29,250 |
| 28,775 |
| 33,938 |
| 5.0 |
| 6.6 |
| 7.5 |
|
| All Other States | 160,968 | | 164,300 | | 175,733 | | 36.8 | | 36.1 | | 36.3 | | 196,610 |
| 160,955 |
| 164,294 |
| 33.8 |
| 36.8 |
| 36.1 |
|
Direct Premiums Written (1) | $ | 435,706 | | $ | 454,046 | | $ | 484,038 | | 100.0 | % | 100.0 | % | 100.0 | % | $ | 580,888 |
| $ | 435,706 |
| $ | 454,046 |
| 100.0 | % | 100.0 | % | 100.0 | % |
| |
| (1) | The Statutory Financial MeasuresMeasurement of Results section of Part II, Item 7, defines data prepared in accordance with statutory accounting practices, which is a comprehensive basis of accounting other than U.S. GAAP. |
United Fire & Casualty Company Form 10-K | 2010
Our life insurance subsidiary is licensed in 2833 states, primarily in the Midwest and West, and is represented by 956950 independent agencies. In 2011, 2010 2009 and 20082009 the direct statutory premiums written forby our life insurance operations were distributed as follows:
| | | | Years Ended December 31 | % of Total | Years Ended December 31 | % of Total |
| (In Thousands) | 2010 | 2009 | 2008 | 2010 | 2009 | 2008 | 2011 | 2010 | 2009 | 2011 | 2010 | 2009 |
| Iowa | $ | 45,336 | | $ | 94,658 | | $ | 83,148 | | 32.6 | % | 36.8 | % | 41.9 | % | $ | 51,132 |
| $ | 45,336 |
| $ | 94,658 |
| 29.7 | % | 32.6 | % | 36.8 | % |
| Minnesota | | 20,409 |
| 11,875 |
| 23,128 |
| 11.9 |
| 8.5 |
| 9.0 |
|
| Illinois | | 17,643 |
| 13,629 |
| 17,720 |
| 10.2 |
| 9.8 |
| 6.9 |
|
| Nebraska | | 16,553 |
| 11,317 |
| 33,103 |
| 9.6 |
| 8.1 |
| 12.9 |
|
| Wisconsin | 13,942 | | 21,548 | | 21,026 | | 10.0 | | 8.4 | | 10.6 | | 16,507 |
| 13,942 |
| 21,548 |
| 9.6 |
| 10.0 |
| 8.4 |
|
| Illinois | 13,629 | | 17,720 | | 15,020 | | 9.8 | | 6.9 | | 7.6 | | |
| Minnesota | 11,875 | | 23,128 | | 15,675 | | 8.5 | | 9.0 | | 7.9 | | |
| Nebraska | 11,317 | | 33,103 | | 15,813 | | 8.1 | | 12.9 | | 8.0 | | |
| All Other States | 42,901 | | 67,083 | | 47,899 | | 31.0 | | 26.0 | | 24.0 | | 49,915 |
| 42,901 |
| 67,083 |
| 29.0 |
| 31.0 |
| 26.0 |
|
Direct Statutory Premium Written (1) | $ | 139,000 | | $ | 257,240 | | $ | 198,581 | | 100.0 | % | 100.0 | % | 100.0 | % | |
Direct Statutory Premiums Written (1) | | $ | 172,159 |
| $ | 139,000 |
| $ | 257,240 |
| 100.0 | % | 100.0 | % | 100.0 | % |
| |
| (1) | The Statutory Financial MeasuresMeasurement of Results section of Part II, Item 7, defines data prepared in accordance with statutory accounting practices, which is a comprehensive basis of accounting other than U.S. GAAP. |
We staff our regional offices with underwriting, claims and marketing representatives and administrative technicians, all of whom provide support and assistance to the independent agencies. Also, home office staff technicians and specialists provide support to our subsidiaries, regional offices and independent agencies. We use management reports to monitor subsidiary and regional offices for overall results and conformity to our business policies.
United Fire Group, Inc. Form 10-K | 2011
Incorporated by reference from Note 10 “Segment Information” contained in Part II, Item 8, “Financial Statements and Supplementary Data.”
Property and Casualty Insurance Segment
The property and casualty insurance industry is highly competitive. We com petecompete with numerous property and casualty insurance companies in the regional and national market, many of which are substantially larger and have considerably greater financial and other resources. Except for regulatory considerations, there are limited barriers to entry into the insurance industry. Our competitors may be domestic or foreign, as well as licensed or unlicensed. The exact number of competitors within the industry is not known. Insurers compete on the basis of reliability, financial strength and stability, ratings, underwriting consistency, service, business ethics, price, performance, capacity, policy terms and coverage conditions.
In addition, because our products are marketed exclusively through independent insurance agencies, most of which represent more than one company, we face competition wit hinwithin each agency.agency and, competition to retain qualified independent agents. Our competitors include companies that market their products through agents, as well as companies that sell insurance directly to their customers.
Because we rely solely on independent agencies, we offer a competitive commissions program and a rewarding profit-sharing plan as incentives for agents to place high-quality property and casualty insurance business with us. We estimate property and casualty insurance agencies will receive profit-sharing payments of $7.09.7 million in 20112012, based on business produced by the agencies in 20102011. In 20102011 for 20092010 business, agencies received $5.77.0 million in profit-sharing payments and in 20092010 for 20082009 business, agencies received $7.45.7 million in payments.
Our competitive advantages include our commitment to:
| |
• | Strong agency relationships — |
Strong agency relationships —
| |
| ◦ | The average tenure of our employees, is 14.0approximately 12.0 years, which allows our agents to work with the same, highly-experienced personnel each day. |
| |
| ◦ | Our organization is relatively flat, allowing our agents to be close to the highest levels of management and ensuring that our agents will receive answers quickly to their questions. |
United Fire & Casualty Company Form 10-K | 2010
| |
| ◦ | We have relatively fewer agents appointed to each state than our peers,competitors, which is valued by our agents, as they do not have to compete with other agents in their area to represent our company.the Company. |
| |
• | Exceptional service — our agents and policyholders always have the option to speak with a real person. |
| |
• | Fair and prompt claims handling — we view claims as an opportunity to prove to our customers that they have chosen the right insurance company. |
| |
• | Disciplined underwriting — we empower our underwriters with the knowledge and tools needed to make good decisions for our company. |
| |
• | Superior loss control services — our loss control representatives make multiple visits to businesses and job sites each year to ensure safety. |
| |
• | Effective and efficient use of technology — we use technology to provide enhanced service to our agents and policyholders, not to replace our personal relationships, but to reinforce them.
|
Exceptional service — our agents and policyholders always have the option to speak with a real person.
Fair and prompt claims handling — we view claims as an opportunity to prove to our customers that they have chosen the right insurance company.
Disciplined underwriting — we empower our underwriters with the knowledge and tools needed to make good decisions for the Company.
Superior loss control services — our loss control representatives make multiple visits to businesses and job sites each year to ensure safety.
Effective and efficient use of technology — we use technology to provide enhanced service to our agents and policyholders, not to replace our personal relationships, but to reinforce them.
United Fire Group, Inc. Form 10-K | 2011
Life Insurance Segment
We also encounter significant competition in all lines of our life and fixed annuity business from other life insurance companies and other providers of financial services. Since our products are marketed exclusively through independent life insurance agencies that typically represent more than one company, we face competition within our agencies. Competitors include companies that market their products through agents, as well as companies that sell directly to their customers. Given the nature of the insurance industry, the exact number of competitors within the industry is not known.
To attract and maintain relationships with our independent life insurance agencies, we offer competitive commission rates and other sales incentives. Our life insurance segment achieves a competitive advantage by offering products that are simple and straightforward, by providing outstanding customer service, by being accessible to our agents and customers, and by using technology in a variety of ways to assist our agents and improve the delivery of service to our policyholders.
Incorporated by reference from Note 1110 “Segment Information” contained in Part II, Item 8, “Financial Statements and Supplementary Data.” Additionally, for a detailed discussion of our operating results by segment, refer to the Results of Operations section in Part II, Item 7, “Management’s Discussion and Analysis of Financial Condition and Results of Operations.”
Incorporated by reference from Note 54 “Reinsurance” contained in Part II, Item 8, “Financial Statement sStatements and Supplementary Data.”
Property and Casualty Insurance Segment
Property insurance indemnifies an insured with an interest in physical property for loss of, or damage to, such property or the loss of its income-producing abilities. Casualty insurance primarily covers liability for damage to property of, or injury to, a person or entity other than the insured. In most cases, casualty insurance also obligates the insurance company to provide a defense for the insured in litigation, arising out of events covered by the policy.
United Fire & Casualty Company Form 10-K | 2010
We are required by applicable insurance laws and regulations to maintain reservesLiabilities for the payment of loss and loss settlement expenses (“loss reserves”). Loss reserves arereflect management’s best estimates at a given point in time of what we expect to pay for claims that have been reported and those that have been incurr edincurred but not reported (“IBNR”), based on facts, circumstances and historical trends then known.
The determination of reserves, particularly those relating to liability lines of insurance, reflects significant judgment factors. If, during the course of our regular monitoring of reserves, we determine that coverages previously written are incurring higher than expected losses, we will take action that may include, among other things, increasing the related reserves. Any adjustments we make to reserves are reflected in operating results in the year in which we make those adjustments. As required by state law, we engage an independent actuary, Regnier Consulting Group, Inc. (“Regnier”), to render an opinion as to the adequacy of the statutory reserves we establish annually. The actuarial opinion is filed in those states where we are licensed. On a quar terlyquarterly basis, Regnier reviews our direct loss reserves for adequacy.
We do not discount loss reserves based on the time value of money. However, we consider inflation in the reserving process by reviewing cost trends, loss settlement expenses, historical reserving results and likely future economic conditions. There are no material differences between our reserves established under U.S. generally accepted accounting principles (“GAAP”) and our statutory reserves.
United Fire Group, Inc. Form 10-K | 2011
The following table sets forth a reconciliation of our beginning and ending net reserves for unpaid losses and loss settlement expenses for 20102011, 20092010 and 20082009:
| | | (In Thousands) | | | | | | | | | | |
| Years Ended December 31 | 2010 | | 2009 | | 2008 | 2011 | | 2010 | | 2009 |
Gross liability for losses and loss settlement expenses
at beginning of year | $ | 606,045 | | | $ | 586,109 | | | $ | 496,083 | | $ | 603,090 |
| | $ | 606,045 |
| | $ | 586,109 |
|
| Ceded loss and loss settlement expenses | (33,754 | ) | | (52,508 | ) | | (38,800 | ) | (39,000 | ) | | (33,754 | ) | | (52,508 | ) |
Net liability for losses and loss settlement expenses
at beginning of year | $ | 572,291 | | | $ | 533,601 | | | $ | 457,283 | | $ | 564,090 |
| | $ | 572,291 |
| | $ | 533,601 |
|
| Reserves acquired in Mercer Insurance Group acquisition, net | | 252,598 |
| | — |
| | — |
|
| Beginning balance, as adjusted | | $ | 816,688 |
| | $ | 572,291 |
| | $ | 533,601 |
|
Losses and loss settlement expenses incurred
for claims occurring during | | | | | |
| |
| |
|
| Current year | $ | 335,315 | | | $ | 339,506 | | | $ | 392,801 | | $ | 468,926 |
| | $ | 335,315 |
| | $ | 339,506 |
|
| Prior years | (45,878 | ) | | 26,215 | | | 548 | | (61,095 | ) | | (45,878 | ) | | 26,215 |
|
| Total incurred | $ | 289,437 | | | $ | 365,721 | | | $ | 393,349 | | $ | 407,831 |
| | $ | 289,437 |
| | $ | 365,721 |
|
Losses and loss settlement expense payments
for claims occurring during | | | | | |
| |
| |
|
| Current year | $ | 132,592 | | | $ | 131,507 | | | $ | 176,882 | | $ | 253,175 |
| | $ | 132,592 |
| | $ | 131,507 |
|
| Prior years | 165,046 | | | 195,524 | | | 140,149 | | 146,653 |
| | 165,046 |
| | 195,524 |
|
| Total paid | $ | 297,638 | | | $ | 327,031 | | | $ | 317,031 | | $ | 399,828 |
| | $ | 297,638 |
| | $ | 327,031 |
|
Net liability for losses and loss settlement expenses
at end of year | $ | 564,090 | | | $ | 572,291 | | | $ | 533,601 | | $ | 824,692 |
| | $ | 564,090 |
| | $ | 572,291 |
|
| Ceded loss and loss settlement expenses | 39,000 | | | 33,754 | | | 52,508 | | |
Ceded loss and loss settlement expenses(1) | | 120,359 |
| | 39,000 |
| | 33,754 |
|
Gross liability for losses and loss settlement expenses
at end of year | $ | 603,090 | | | $ | 606,045 | | | $ | 586,109 | | $ | 945,051 |
| | $ | 603,090 |
| | $ | 606,045 |
|
(1) Reflects our acquisition of Mercer Insurance Group in 2011.
The table on the following page illustrates the change in our estimate of loss reserves for our property and casualty insurance companies for the years 20002001 through 2009.2010. The first section shows the amount of the liability, as originally reported, at the end of each calendar year in our Consolidated Financial Statements. These reserves represent the estimated amount of losses and loss settlement expenses for losses arising in that year and all prior years that are unpaid at the end of each year, including an estimate for our IBNR losses, net of applicable ceded reinsurance. The second section displays the cumulative amount of net losses and loss settlement expenses paid for each year with respect to that liability. The third secti onsection shows the re-estimated amount of the previously recorded liability based on experience as of the end of each succeeding year. The estimate is increased or decreased as more information
United Fire & Casualty Company Form 10-K | 2010
becomes known about the losses for individual years. The last section compares the latest re-estimated amount with the original estimate. Conditions and trends that have affected development of loss reserves in the past may not necessarily exist in the future. Accordingly, it would not be appropriate to extrapolateproject future redundancies or deficiencies based on this table.
Amounts shown in the 2011 column of the table include both 2011 and prior to 2011 accident year development for Mercer Insurance Group, which was acquired on March 28, 2011 and accounted for under the acquisition method.
United Fire Group, Inc. Form 10-K | 2011
| | | (In Thousands) | | | | | | | | |
| Years Ended December 31 | 2000 | 2001 | 2002 | 2003 | 2004 | 2005 | 2006 | 2007 | 2008 | 2009 | 2010 | 2001 | 2002 | 2003 | 2004 | 2005 | 2006 | 2007 | 2008 | 2009 | 2010 | 2011 |
| | | | | |
Gross liability for loss and loss
settlement expenses | $ | 358,032 | | $ | 363,819 | | $ | 392,649 | | $ | 427,049 | | $ | 464,889 | | $ | 620,100 | | $ | 518,886 | | $ | 496,083 | | $ | 586,109 | | $ | 606,045 | | $ | 603,090 | | $ | 363,819 |
| $ | 392,649 |
| $ | 427,049 |
| $ | 464,889 |
| $ | 620,100 |
| $ | 518,886 |
| $ | 496,083 |
| $ | 586,109 |
| $ | 606,045 |
| $ | 603,090 |
| $ | 945,051 |
|
Ceded loss and loss settlement
expenses | 37,526 | | 36,909 | | 35,760 | | 27,309 | | 28,609 | | 60,137 | | 40,560 | | 38,800 | | 52,508 | | 33,754 | | 39,000 | | 36,909 |
| 35,760 |
| 27,309 |
| 28,609 |
| 60,137 |
| 40,560 |
| 38,800 |
| 52,508 |
| 33,754 |
| 39,000 |
| 120,359 |
|
Net liability for loss and loss
settlement expenses | $ | 320,506 | | $ | 326,910 | | $ | 356,889 | | $ | 399,740 | | $ | 436,280 | | $ | 559,963 | | $ | 478,326 | | $ | 457,283 | | $ | 533,601 | | $ | 572,291 | | $ | 564,090 | | $ | 326,910 |
| $ | 356,889 |
| $ | 399,740 |
| $ | 436,280 |
| $ | 559,963 |
| $ | 478,326 |
| $ | 457,283 |
| $ | 533,601 |
| $ | 572,291 |
| $ | 564,090 |
| $ | 824,692 |
|
| Cumulative net paid as of: | | | |
| One year later | $ | 110,516 | | $ | 112,546 | | $ | 107,271 | | $ | 100,895 | | $ | 110,016 | | $ | 230,455 | | $ | 148,593 | | $ | 140,149 | | $ | 195,524 | | $ | 165,046 | | | $ | 112,546 |
| $ | 107,271 |
| $ | 100,895 |
| $ | 110,016 |
| $ | 230,455 |
| $ | 148,593 |
| $ | 140,149 |
| $ | 195,524 |
| $ | 165,046 |
| $ | 146,653 |
| |
| Two years later | 166,097 | | 172,538 | | 172,1 58 | | 167,384 | | 166,592 | | 321,110 | | 235,975 | | 265,361 | | 304,622 | | | 172,538 |
| 172,158 |
| 167,384 |
| 166,592 |
| 321,110 |
| 235,975 |
| 265,361 |
| 304,622 |
| 260,872 |
| |
| Three years later | 204,792 | | 215,002 | | 214,307 | | 203,861 | | 213,144 | | 380,294 | | 332,768 | | 345,092 | | | 215,002 |
| 214,307 |
| 203,861 |
| 213,144 |
| 380,294 |
| 332,768 |
| 345,092 |
| 373,765 |
| |
| Four years later | 230,889 | | 240,973 | | 237,150 | | 231,278 | | 242,579 | | 456,919 | | 390,763 | | | | | 240,973 |
| 237,150 |
| 231,278 |
| 242,579 |
| 456,919 |
| 390,763 |
| 392,676 |
| |
| Five years later | 245,677 | | 252,969 | | 253,026 | | 250,787 | | 264,015 | | 502,455 | | | 252,969 |
| 253,026 |
| 250,787 |
| 264,015 |
| 502,455 |
| 422,669 |
| |
| Six years later | 252,153 | | 264,311 | | 265,304 | | 263,631 | | 276,214 | | | ; | | 264,311 |
| 265,304 |
| 263,631 |
| 276,214 |
| 527,136 |
| |
| Seven years later | 259,621 | | 273,153 | | 273,066 | | 272,826 | | | | | | 273,153 |
| 273,066 |
| 272,826 |
| 282,654 |
| |
| Eight years later | 264,713 | | 277,868 | | 280,152 | | | | 277,868 |
| 280,152 |
| 277,645 |
| |
| ; Nine years later | 266,912 | | 282,970 | | | | | | | |
| Nine years later | | 282,970 |
| 283,635 |
| |
| Ten years later | 269,794 | | | | | | | 285,334 |
| |
| Net liability re-estimated as of: | | | | |
| End of year | $ | 320,506 | | $ | 326,910 | | $ | 356,889 | | $ | 399,740 | | $ | 436,280 | | $ | 559,963 | | $ | 478,326 | | $ | 457,283 | | $ | 533,601 | | $ | 572,291 | | $ | 564,090 | | $ | 326,910 |
| $ | 356,889 |
| $ | 399,740 |
| $ | 436,280 |
| $ | 559,963 |
| $ | 478,326 |
| $ | 457,283 |
| $ | 533,601 |
| $ | 572,291 |
| $ | 564,090 |
| $ | 824,692 |
|
| One year later | 273,469 | | 315,854 | | 344,590 | | 361,153 | | 358,796 | | 534,998 | | 433,125 | | 457,831 | | 559,816 | | 526,413 | | & nbsp; | 315,854 |
| 344,590 |
| 361,153 |
| 358,796 |
| 534,998 |
| 433,125 |
| 457,831 |
| 559,816 |
| 526,413 |
| 502,995 |
| |
| Two years later | 290,872 | | 323,354 | | 340,502 | | 331,693 | | 330,137 | | 508,774 | | 453,474 | | 502,177 | | 547,824 | | | 323,354 |
| 340,502 |
| 331,693 |
| 330,137 |
| 508,774 |
| 453,474 |
| 502,177 |
| 547,824 |
| 497,136 |
| |
| Three years later | 300,011 | | 321,168 | | 324,582 | | 317,187 | | 319,335 | | 538,451 | | 497,629 | | 503,992 | | | | 321,168 |
| 324,582 |
| 317,187 |
| 319,335 |
| 538,451 |
| 497,629 |
| 503,992 |
| 537,912 |
| |
| Four years later | 302,884 | | 318,125 | | 313,745 | | 309,146 | | 326,340 | | 574,484 | | 500,071 | | | 318,125 |
| 313,745 |
| 309,146 |
| 326,340 |
| 574,484 |
| 500,071 |
| 503,720 |
| |
| Fiv e years later | 298,428 | | 309,033 | | 308,304 | | 316,227 | | 327,626 | &nbs p; | 582,343 | | | | | |
| Five years later | | 309,033 |
| 308,304 |
| 316,227 |
| 327,626 |
| 582,343 |
| 507,507 |
| |
| Six years later | 296,296 | | 307,790 | | 312,188 | | 314,522 | | 327,741 | | | | | | 307,790 |
| 312,188 |
| 314,522 |
| 327,741 |
| 592,772 |
| |
| Seven years later | 293,579 | | 311,367 | | 314,680 | | 316,705 | | | 311,367 |
| 314,680 |
| 316,705 |
| 322,875 |
| |
| Eight years lat er | 297,844 | | 312,433 | | 316,378 | | | |
| Eight years later | | 312,433 |
| 316,378 |
| 311,385 |
| |
| Nine years later | 297,022 | | 313,953 | | | 313,953 |
| 310,478 |
| |
| Ten years later | 297,275 | | | | | | 309,044 |
| |
| Net redundancy (deficiency) | $ | 23,231 | | $ | 12,957 | | $ | 40,511 | | $ | 83,035 | | $ | 108,539 | | $ | (22,380 | ) | $ | (21,745 | ) | $ | (46,709 | ) | $ | (14,223 | ) | $ | 45,878 | | | $ | 17,866 |
| $ | 46,411 |
| $ | 88,355 |
| $ | 113,405 |
| $ | (32,809 | ) | $ | (29,181 | ) | $ | (46,437 | ) | $ | (4,311 | ) | $ | 75,155 |
| $ | 61,095 |
| |
| Net re-estimated liability | 297,275 | | 313,953 | | 316,378 | | 316,705 | | 327,741 | | 582,343 | | 500,071 | | 503,992 | | 547,824 | | 526,413 | | | 309,044 |
| 310,478 |
| 311,385 |
| 322,875 |
| 592,772 |
| 507,507 |
| 503,720 |
| 537,912 |
| 497,136 |
| 502,995 |
| |
Re-estimated ceded loss an d loss
settlement expenses | $ | 33,877 | | $ | 43,086 | | $ | 43,776 | | $ | 38,522 | | $ | 38,381 | | $ | 91,535 | | $ | 57,459 | | $ | 50,990 | | $ | 56,884 | | $ | 41,042 | | | |
Re-estimated ceded loss and loss
settlement expenses | | $ | 44,288 |
| $ | 44,980 |
| $ | 39,724 |
| $ | 39,582 |
| $ | 97,622 |
| $ | 63,562 |
| $ | 57,220 |
| $ | 64,209 |
| $ | 48,366 |
| $ | 49,198 |
| |
| Gross re-estimated liability | $ | 331,152 | | $ | 357,039 | | $ | 360,154 | | $ | 355,227 | | $ | 366,122 | | $ | 673,878 | | $ | 557,530 | | $ | 554,982 | | $ | 604,708 | | $ | 567,455 | | | $ | 353,333 |
| $ | 355,459 |
| $ | 351,109 |
| $ | 362,457 |
| $ | 690,394 |
| $ | 571,069 |
| $ | 560,940 |
| $ | 602,121 |
| $ | 545,502 |
| $ | 552,193 |
| |
| Gross redundancy (deficienc y) | $ | 26,880 | | $ | 6,780 | | $ | 32,495 | | $ | 71,822 | | $ | 98,767 | | $ | (53,778 | ) | $ | (38,644 | ) | $ | (58,899 | ) | $ | (18,599 | ) | $ | 38,590 | | | |
| Gross redundancy (deficiency) | | $ | 10,486 |
| $ | 37,190 |
| $ | 75,940 |
| $ | 102,432 |
| $ | (70,294 | ) | $ | (52,183 | ) | $ | (64,857 | ) | $ | (16,012 | ) | $ | 60,543 |
| $ | 50,897 |
| |
For a more detailed discussion of our loss reserves, refer to the “Critical Accounting Estimates” section in Part II, Item 7, “Management’s Discussion and Analysis of Financial Condition and Results of Operations” and Note 6,5, “Reserves for Loss and Loss Settlement Expenses” contained in Part II, Item 8, “Financial Statements and Supplementary Data.”
Life Insurance Segment
We calculate the policy reserves reported in our Consolidated Financial Statements in accordance with GAAP. For our fixed annuities and universal life policies, we establish a benefit reserve at the time of policy issuance in an amount equal to the deposits received. Subsequently, we adjust the benefit reserve for any additional deposits, interest credited and partial or complete withdrawals, as well as insurance and other expense charges. We base policy reserves for other life products on the projected contractual benefits and expenses and interest rates
United Fire & Casualty Company Form 10-K | 2010
appropriate to those products. We base reserves for accident and health products, which are a minor portion of our reserves, on appropriate morbidity tables.
We determine reserves for statutory purposes based upon mortality rates and interest rates specified by Iowa state law. Our life insurance subsidiary’s reserves meet or exceed the minimum statutory requirements. Griffith, Ballard &
United Fire Group, Inc. Form 10-K | 2011
Company (“Griffith”), an independent actuary, assists us in developing and analyzing our reserves on both a GAAP and statutory basis.
For further discussion of our life insurance segment’s reserves, seerefer to the “Critical Accounting Estimates” containedsection in Part II, Item 7, “Management’s Discussion and Analysis of Financial Condition and Results of Operations.”
Incorporated by reference from Part II, Item 7, “Management’s Discussion and Analysis of Financial Condition and Results of Operations, ,”” under the headings “Investments” and “Critical Accounting Estimates”; Part II, Item 7A, “Quantitative and Qualitative Disclosures about Market Risk”; and Note 1 “Significant Accounting Policies” under the headings “Investments” and “Securities Lending,“Investments,” Note 2 “Summary of Investments,” and Note 3 “Fair Value of Financial Instruments,” contained in Part II, Item 8, “Financial Statements and Supplementary Data.”
We are not aware of any currently proposed or recently enacted state or federal regulation that would have a material impact on our operations. Additionally, we cannot predict whether any specific state or federal measures will be adopted to change the nature or scope of the regulation of the insurance business or what effect any particular measures might have on us.
State Regulation
We are subject to extensive regulation, primarily at the state level. The method, extent and substance of such regulation varies by state, but generally has its source in statutes that establish standards and requirements for conducting the business of insurance and that delegate regulatory authority to a state regulatory agency. In general, such regulation is intended for the protection of those who purchase or use our insurance products, and not our stockholders. These rules have a substantial effect on our business and relate to a wide variety of matters including:
| |
• | insurance company licensing and examination and the licensing of agents and adjusters; |
| |
• | price setting or premium rates; |
| |
• | approval of policy forms; |
| |
• | the nature, quality and concentration of investments; |
| |
• | participation in shared markets and guaranty funds; |
| |
• | restrictions on transactions between our subsidiaries and their affiliates; |
insurance company licensing and examination and the licensing of agents and adjusters;
price setting or premium rates;
trade practices;
approval of policy forms;
accounting methods;
the nature, quality and concentration of investments;
claims practices;
participation in shared markets and guaranty funds;
reserve adequacy;
insurer solvency;
restrictions on transactions between our subsidiaries and their affiliates;
restrictions on the payment of dividends;
underwriting standards;
United Fire & Casualty CompanyGroup, Inc. Form 10-K | 20102011
| |
• | restrictions on the payment of dividends; |
| |
• | underwriting standards; |
| |
• | advertising and marketing practices; and |
| |
• | the collection, remittance and reporting of certain taxes and fees. |
advertising and marketing practices; and
the collection, remittance and reporting of certain taxes and fees.
The state laws and regulations that have the most significant effect on our insurance operations and financial reporting are discussed below.
Insurance Holding Company Regulation
We are regulated as an insurance holding company system in the states of domicile of our property and casualty insurance companies and life insurance subsidiary: Iowa (United Fire & Casualty Company, United Life Insurance Company, and Addison Insurance Company), California (Financial Pacific Insurance Company), Louisiana (Lafayette Insurance Company), New Jersey (Mercer Insurance Company of New Jersey, Inc.), Pennsylvania (Mercer Insurance Company and Franklin Insurance Company, Texas (United Fire & Indemnity Company and United Fire Lloyds), and Colorado (Texas General Indemnity Company). With the acquisition of Mercer, we will be regulated by three additional domicile states: Pennsylvania (Mercer Insurance Company and Franklin Insurance Company), New Jersey (Mercer Insurance Company of New Jersey, Inc.), and California (Financial Pacific Insurance Company). These regulations require that we annually furnish financial and other information about the operations of the individual companies within our holding company system. Generally, the insurance codes of these states provide that notice to the state insurance commissioner is required before finalizing any transaction affecting the ownership or control of an insurer and before finalizing certain material t ransactionstransactions between an insurer and any person or entity inwithin its holding company group.system. In addition, some of those transactions cannot be finalized without the commissioner’scommissioner's prior approval.
Stockholder Dividends
Our capacity to pay dividends, and that of our subsidiaries, is regulated by the laws of the applicable state of domicile. Under these laws, insurance companies must provide advance informational notice to the domicile state insurance regulatory authority prior to payment of any dividend or distribution to its stockholders. Prior approval from the state insurance regulatory authority must be obtained before payment of an extraordinary dividend as defined under the state’s insura nceinsurance code. In all cases, we may pay ordinary dividends only from our earned surplus. Refer to the Market Information section of Part II, Item 5, “Market for Registrant’s Common Equity, Related Stockholder Matters and Issuer Purchases of Equity Securities,” and Note 76 “Statutory Reporting, Capital Requirements and Dividends and Retained Earnings Restrictions,” contained in Part II, Item 8, “Financial Statements and Supplementary Data” for additional information about the dividends we paid during 20102011.
Price Regulation
Nearly all states have insurance laws requiring personal property and casualty insurersus to file rate schedules, policy or coverage forms, and other information withinwith the state’sstate's regulatory authority. In many cases,certain states, rate schedules, policy forms, or both, must be approved prior to use. While insurance laws vary from state to state, their objectives are generally the same: an insurance rate cannot be excessive, inadequate or unfairly discriminatory. The speed with which we can change our rates in response to competition or in response to increasing costs depends, in part, on the willingness of state regulators to allow adequate rates for the business that we write.
Investment Regulation
Insurance companiesWe are subject to various state regulations that requirerequiring investment portfolio diversification and that limitlimiting the concentration of investmentinvestments we may maintain in certain asset categories. Failure to comply with these regulations leads to the treatment of nonconforming investments as nonadmitted assets for purposes of measuring statutory surplus. Further, in some instances, thesestate regulations require us to sell certain nonconforming investments.
United Fire & Casualty Company Form 10-K | 2010
Exiting Geographic Markets; Canceling and Nonrenewing Policies
Most states regulate our ability to exit a market. For example, states limit, to varying degrees, our ability to cancel and nonrenew insurance policies. Some states prohibit us from withdrawing one or more types of insurance busines sbusiness from the state, except with stateupon prior regulatory approval. Regulations that limit policy cancellation and nonrenewal may restrict our ability to exit unprofitable markets.
United Fire Group, Inc. Form 10-K | 2011
Insurance Guaranty Associations
Each state has insurance guaranty association laws. Membership in a state’sstate's insurance guaranty association is generally mandatory for insurers wishing to do business in that state. Under these laws, associations may assess their members for certain obligations that insolvent insurance companies have to their policyholders and claimants. Typically, states assess each solvent member in an amount related to that member’smember's proportionate share of business written by all members within the stat e.state. Most state guaranty associations allow solvent insurers to recoup the assessments they are charged through future rate increases, surcharges or premium tax credits. However, there is no assurance that we will ultimately recover these assessments. We cannot predict the amount and timing of any future assessments or refunds under these laws.
Shared Market and Joint Underwriting Plans
State insurance regulations often require insurers to participate in assigned risk plans, reinsurance facilities and joint underwriting associations. These are mechanisms that generally provide applicants with various basic types of basic insurance coverage that may not otherwise be available to them inthrough voluntary markets. Such mechanisms ar eare most commonly instituted for automobile and workers’workers' compensation insurance, but many states also mandate participation in Fair Access to Insurance Requirements (“FAIR”) Plans or Windstorm Plans, which provide basic property coverage. Participation is based upon the amount of a company’scompany's voluntary market share in a particular state for the classes of insurance involved. Policies written through these mechanisms may require different underwriting standards and may pose greater risk than those written through our voluntary application process.
Statutory Accounting
For public reporting, insurance companies prepare financial statements in accordance with GAAP. However, state laws require us to calculate and report certain data according to statutory accounting rules as defined in the National Association of Insurance Commissioner’sCommissioner's (“NAIC”) Accounting Practices and Procedures Manual. While not a substitute for any GAAP measure of performance, statutory data frequently is used by industry analysts and other recognized reporting sources to facilitate comparisons of the performance of insurance companies.
Insurance Reserves
State insurance laws require that insurance companies analyze the adequacy of their reserves annually. Our appointed actuaries must submit an opinion that our reserves are adequate for policy claims-paying obligations and related expense s.expenses.
Financial Solvency Ratios
The NAIC annually calculates 13 financial ratios to assist state insurance regulators in monitoring the financial condition of insurance companies. A “usual range” of results for each of these ratios is used by insurance regulators as a benchmark. Departure from the usual range on four or more of the ratios could lead to inquiries from individual state insurance departments as to certain aspects of a company’scompany's business. In addition to the financial ratios, states also require us to calculate a minimum capital requirement for each of our insurance companies based on individual company insurance risk factors. These “risk-based capital” resul tsresults are used by state insurance regulators to identify companies that require regulatory attention or the initiation of regulatory action. At December 31, 20102011, all of our insurance companies had capital well in excess of the required levels.
United Fire & Casualty Company Form 10-K | 2010
Federal Regulation
Although the federal government and its regulatory agencies generally do not directly regulate the business of insurance, federal initiatives often have an impact on our business. Some of the current and proposed federal measures that may significantly affect our business are discussed below.
Dodd-Frank Act
In July 2010, the Dodd-Frank Wall Street Reform and Consumer Protection Act (the “Dodd-Frank Act”) was signed
United Fire Group, Inc. Form 10-K | 2011
into law. The Dodd-Frank Act marks a profound increase in the regulation of the financial services industry. Among other things, the Dodd-Frank Act forms within the Treasury Department a Federal Insurance Office that is charged with monitoring all aspects of the insurance industry, gathering data, and conducting a study on methods to modernize and improve the insurance regulatory system in the United States. A report on this study is required to be delivered to Congress within 18 months after enactment of the Dodd-Frank Act and could be influential in reshaping the current state-based insurance regulatory system and/or introducing a direct federal role in suchinsurance regulation. The Dodd-Frank Act also requires, among other things: (i) a nonbinding stockholder vote on executive compensation at least once every three years; (ii) a vote, at least once every six years, on the frequency of the nonbinding stockholder vote on executive compensation; and (iii) that all members of our compensation committee be independent.
In response to the Dodd-Frank Act, the SEC has issued, or is expected to issue proposedpropose, rules regarding a variety of disclosure and governance matters, including director independence, director and officer hedging andactivities, executive compensation clawback policies, compensation advisor independence, pay versus performance disclosures, internal pay comparison,equity disclosures, and shareholder proxy access.
Health Care Reform Acts
In March 2010, the Patient Protection and Affordable Care Act and the Health Care and Education Reconciliation Act of 2010 (collectively the “2010 Acts”) were signed into law. The 2010 Acts may have a material impact on health care providers and insurers, employers and individuals. The 2010 Acts will impact employers and businesses differently, depending on the size of the organization. Certain provisions of the 2010 Acts became effective during the open enrollment period for our employee benefit plans (November 2010), while other provisions of the 2010 Acts will become effective in future years. The 2010 Acts could require changes to, among other things, our current employee benefit plans, our information technology infrastructure, and our administrative and accounting processes. The ultimate extent and cost of these changes cannot be determined at this time and are being evaluated and updated as related regulations and interpretations of the 2010 Acts become available.
|
|
| FINANCIAL STRENGTH RATING |
Our financial strength, as measured by statutory accounting principles, is regularly reviewed by an independent rating agency that assigns a rating based upon criteria such as results of operations, capital resources and minimum policyholders’ surplus requirements.
Our family of property
United Fire & Casualty Company and casualty insurers hasMercer Insurance Group pooled groups have each received a group rating of “A” (Excellent) with a “negative” outlook from A.M. Best Company (“A.M. Best”). Within the group, allAll of our property and casualty insurers have an “A” (Excellent) rating, except one non-pooled insurance subsidiary that is in a runoff status, which A.M. Best has designated as NR-3NR (Rating Procedure Inapplicable). Our life insurance subsidiary has received an “A-” (Excellent) rati ngrating with a “stable” outlook from A.M. Best. According to A.M. Best, companies rated “A” and “A-” have “an excellent ability to meet their ongoing obligations to policyholders.”
An insurer’s financial strength rating is one of the primary factors evaluated by those in the market to purchase insurance. A poor rating indicates that there is an increased likelihood that the insurer could become insolvent and therefore not able to fulfill its obligations under the insurance policies it issues. This rating can also affect an insurer’s level of premium writings, the lines of business it can write and, for insurers like us that are also public registrants, the market value of its securities.
United Fire & Casualty Company Form 10-K | 2010
We provide the following discussion of risks and uncertainties relevant to our business. These are factors that we believe could cause our actual results to differ materially from expected and historical results. We could also be adversely affected by other factors, in addition to those listed here. We have set forth additional information concerning factors that could cause actual results to differ materially from those in the forward-looking statements in Part II, Item 7, “Management’s Discussion and Analysis of Financial Condition and Results of Operations.”
Risks Relating to Our Business
| |
• | The incidence, frequency and severity of catastrophe losses are unpredictable and may adversely affect the results of our operations, liq uidity and financial condition. |
The incidence, frequency and severity of catastrophe losses are unpredictable and may adversely affect the results of our operations, liquidity and financial condition.
Our property and casualty insurance operations expose us to claims arising from catastrophic events affecting multiple policyholders, which can be caused by various natural and man-made disasters, including, but not limited to, hurricanes, tornadoes, windstorms, hailstorms, fires, explosions, earthquakes, tropical storms and terrorist acts. Property damage resulting from catastrophes is the greatest risk of loss we face in the ordinary course of our
United Fire Group, Inc. Form 10-K | 2011
business. We have exposure for catastrophe losses under both our commercial insurance policies and our personal insurance policies. In addition, our automobile and inland marine business exposes us to losses arising from floods and other perils.
Longer-term weather trends may be changing and new types of catastrophe losses may be developing due to climate change,change; a phenomenon that has been associated with extreme weather events linked to rising temperatures, including effects on global weather patterns, greenhouse gases, sea, land and air temperature, sea levels, rain and snow. The emerging science regarding climate change and its connection to extreme weather events is far from conclusive. If a connection to increased extreme weather events related to climate change is ultimately proven true, this could increase the frequency and severity of catastrophe losses we experience in both coastal and non-coastal areas.
Because the occurrence and severity of catastrophes are inherently unpredictable and may vary significantly from year to year, hist oricalhistorical results of operations may not be indicative of future results of operations. In addition, as with catastrophe losses generally, it can take a long time for us to determine our ultimate losses associated with a particular catastrophic event. As our claims experience for a particular catastrophe develops, we may be required to adjust our reserves to reflect our revised estimates of the total cost of claims. Catastrophes may also negatively affect our ability to write new business. Increases in the value and geographic concentration of insured property could impact claims severity for future catastrophic events. In addition, severity may increase after catastrophic events, as the demand for resources such as building materials and labor to repair damaged structures may inflate costs, and the amount of salvage value received for damaged property may decline.
| |
• | Our reserves for property and casualty insurance losses and costs related to settlement of property and casualty losses and our life reserves for future policy benefits may be inadequate, which would have an unfavorable impact on our financial results. |
Our reserves for property and casualty insurance losses and costs related to settlement of property and casualty insurance losses and our life insurance reserves for future policy benefits may be inadequate, which would have an unfavorable impact on our financial results.
Our reserves for claims and future policy benefits may prove to be inadequate, which may result in future charges to earnings and/or a downgrade of our financial strength rating or the financial strength ratings of our insurance company subsidiaries.
We establish property and casualty insurance loss reserves based on assumptions and estimates of damages and liabilities incurred. On a quarterly basis, Regnier, the independent actuary for our property and casualty insurance segment, estimates property and casualty insurance product reserves based on many assumptions to validate the reasonableness of our claims reserves.
Our property and casualty insurance loss reserves are only estimates; we determine the amount of these loss reserves based on our best estimate and judgment of the losses and costs we will incur on existing insurance policies. Because of the uncertainties that surround estimating loss reserves, we cannot precisely determine the ultimate amounts of benefits
United Fire & Casualty Company Form 10-K | 2010
and claims that we will pay or the timing of payment of benefits and claims. For a detailed discussion of our reserving process and the factors we consider in estimating reserves, refer to the Critical Accounting Estimates section in Part II, Item 7, “Management’s“Management's Discussion and Analysis of Financial Condition and Results of Operations.”
Actual losses and loss settlement expenses paid might exceed our reserves. If our loss reserves are insufficient, or if we believe our loss reserves are insufficient to cover our actual loss and loss settlement expenses, we will have to increase our loss reserves and incur charges to our earnings, which could indicate that premium levels were insufficient. These charges may be material.
Griffith, the independent actuary for our life insurance segment, calculates life insurance product reserves based on our assumptions, including estimated premiums we will receive over the assumed life of the policy, the timing of the event covered by the insurance policy and the amount of benefits or claims to be paid. As such, deviations from one or more of these assumptions could result in a material adverse impact on our Consolidated Financial Statements.
| |
• | The cyclical nature of the property and casualty insurance business may affect our financial performance. |
United Fire Group, Inc. Form 10-K | 2011
The cyclical nature of the property and casualty insurance business may affect our financial performance.
The financial results of companies in the property and casualty insurance industry historically have been cyclical in nature, characterized by periods of severe price competition and excess underwriting capacity (commonly referred to as “soft” markets), followed by periods of high premium rates and shortages of underwriting capacity (commonly referred to as “hard” markets). We expect these cycles to continue. Premium rates for property and casualty insurance are influenced by factors that are outside of our control, including market and competitive conditions and regulatory issues. Soft market conditions could require u sus to reduce premiums, limit premium increases, or discontinue offering one or more of our insurance products in one or more states, resulting in a reduction in our premiums written and in our profit margins and revenues. The demand for property and casualty insurance can also vary significantly, rising as the overall level of economic activity increases and falling as that activity decreases. Fluctuations in demand and competition could produce underwriting results that would have a negative impact on the results of our operations and financial condition.
| |
• | We are subject to interest rate fluctuations and declines in the value of investments held in our investment portfolio due to various market factors that could negatively affect our profitability. |
We are subject to interest rate fluctuations and declines in the value of investments held in our investment portfolio due to various market factors that could negatively affect our profitability.
We are subject to the negative effects of interest rate fluctuations and to declines in the value of our investment portfolio, due to changes in market valuations and changes in credit quality related to individual investments. Some of our interest-sensitive products, principally our fixed annuities, expose us to the risk that changes in interest rates will reduce our “spread,” which is the difference between the rates we are required to pay under these contracts and the rate of return we are able to earn on our investments, intended to support our obligations under these contracts.
During periods when the interest rates paid on interest-sensitive insurance products are rising, we may not be able to reinvest our invested assets to achieve the higher rate of return necessary to compensate for the higher interest rates we must pay to keep these products competitive in the marketplace. Consequently, we may have to accept a lower spread and therefore lower profitability, or face a decline in sales of these products and a loss of related assets.
During periods of declining interest rates, we may be unable to achieve similar rates of return on our reinvested or maturing assets. Moreover, this risk may be exacerbated by borrowers prepaying fixed income securities, commercial mortgages, and mortgag e-backedmortgage-backed securities held in our investment portfolio in order to refinance at lower rates. Because we are only entitled to reset the interest rates on our annuities at limited, pre-established intervals, and because many of our annuity contracts have guaranteed interest rates, the profitability of these products could decrease or even become negative.
Due to the reinvestment risk described above, a decline in market interest rates available on investments could also reduce our return from investments of capital that do not support particular policy obligations, which could also have a material adverse effect on our results of operations. The adverse effect on us from fluctuations in interest
United Fire & Casualty Company Form 10-K | 2010
rates may be exacerbated b ecausebecause we currently maintain, and intend to continue to maintain, a large portion (92.5(93.4 percent at December 31, 2010)2011) of our investment portfolio in fixed income securities, particularly corporate bonds, including our portfolio of trading securities. The fair value of these investments generally increases or decreases in an inverse relationship with changes in interest rates. We classify the majority (99.2(99.4 percent, at December 31, 2010)2011) of our fixed income securities, including our entire portfolio of trading securities, as available-for-sale. We report the value of those investments at their current fair value. Accordingly, fluctuations in interest rates may result in fluctuations in the valuation of our fixed income investments, which would affect our stockholders’stockholders' equity.
Fluctuations in interest rates may cause increased surrenders and with drawalswithdrawals from our life insurance and annuity products. In periods of rising interest rates, surrenders and withdrawals of life insurance policies and annuity contracts, along with policy loans, may increase as policyholders seek to buy products with perceived higher returns. These surrenders, withdrawals and policy loans may also require us to accelerate the amortization of deferred policy acquisition costs, which would increase our expenses in the current period.
Terrorism and the threat of terrorism within the U.S. and abroad, ongoing military and other actions, and heightened
United Fire Group, Inc. Form 10-K | 2011
security measures, may cause significant volatility in the equity markets and in interest rates. Such activities may result in loss of life, property damage, disruptions to commerce and reduced economic activity. Some of the assets in our investment portfolio may be adversely affected by declines in the equity markets or changes in interest rates caused by these activities.
The fair value of securities in our investment portfolio may also fluctuate, depending on general economic and market conditions or events relating to a particular issuer of securities. Changes in the fair value of securities in our investment portfolio could result in realized or unrealized investment losses, thereby affecting our stockholders’stockholders' equity.
We are exposed to the chance that issuers of bonds that we hold will not be able to pay principal or interest when due. Defaults and other impairments may cause write-downs in the value of the bonds we hold. Pervasive deterioration in the c reditcredit quality of issuers, changes in interest rate levels and changes in interest rate spreads between types of investments could significantly affect the value of our invested assets and our earnings.
| |
• | Continued difficult conditions in the global capital markets and the economy generally may materially and adversely affect our business and results of operations. |
Continued difficult conditions in the global capital markets and the economy generally may materially and adversely affect our business and results of operations.
Our results of operations are materially affected by conditions in the global capital markets and the economy generally, both in the U.S. and elsewhere around the world. Recently, concerns over the slow economic recovery, level of U.S. national debt, the U.S. mortgage market, inflation levels, energy costs and geopolitical issues have contributed to increased volatility and diminished expectations for the economy and global capital markets going forward. These factors, combined with volatile oil prices, reduced business and consumer confidence and continued high unemployment, have negatively impacted the U.S. economy. These concerns expanded to include a broad range of mortgage- and asset-backed and other fixed income securities, including those rated investment grade. Although liquidity has improved, the market for fixed income instruments continues to experience some price volatility, credit downgrade events and elevated probabilities of default.
Factors such as consumer spending, business in vestment,investment, government spending, the volatility and strength of the capital markets, investor and consumer confidence and inflation levels all affect the business and economic environment and, ultimately, the amount and profitability of our business. In an economic downturn characterized by higher unemployment, lower family income, lower corporate earnings, lower business investment, negative investor sentiment and lower consumer spending, the demand for our insurance products could be adversely affected. Our policyholders may choose to defer paying insurance premiums or stop paying insurance premiums altogether. In addition, we may experience an elevated incidence of claims and lapses or surrenders of policies. Adverse changes in the economy could negatively affect our net income and could have a material adverse effect on our business, results of operations and financial condition.
Our investment portfolio contains various types of municipal bonds that expose us to the risk of default.
14
United Fire & Casualty Company Form 10-K | 2010
| |
• | Our investment portfolio contains various types of municipal bonds that expose us to the risk of default. |
At December 31, 2010, 25.22011, 25.3 percent of our total investment portfolio at fair market value, and 27.227.5 percent of our total fixed maturity securitiesinvestments at fair market value, were invested in tax-exempt municipal bonds.bonds that are primarily tax-exempt. During or following an economic downturn, our municipal bond portfolio could be subject to a higher risk of default or impairment due to declining municipal tax bases and revenue. The pr olongedprolonged economic downturn that began in 2008 has resulted in many states and local governments operating under deficits or projected deficits. The severity and duration of these deficits could adversely impact the collectability and valuation of our municipal bond portfolio.
| |
• | Unauthorized data access and other security breaches could have an adverse impact on our business and reputation. |
Unauthorized data access and other security breaches could have an adverse impact on our business and reputation.
Our business and operations rely on secure and efficient processing, storage and transmission of customer and companyCompany data, including personally identifiable information. Our ability to effectively operate our business depends upon our ability and the ability of certain third parties, including vendors and business partners, to access our computer systems to perform necessary business functions, such as providing quotes and product pricing, billing and
United Fire Group, Inc. Form 10-K | 2011
processing premiums, administering claims, and reporting our financial results. Our business and operations also depend upon our ability to safeguard personally identifiable information and other confidential and proprietary information belonging to us and our policyholders. Our systems may be vulnerable to unauthorized access and hackers, computer viruses, and other scenarios in which our data may be compromised.
Security breaches and other improper accessing of data in our facilities, networks or databases, or those of our vendors may occur, exposing us to liability and having an adverse impact on our business. Moreover, any compromise of the security of our data could harm our reputation, which could affect our business and results of operations. There can be no assurances that we will be able to implement security measures adequate to prevent every security breach.
| |
• | The effects of emerging claim and coverage iss ues and class action litigation on our business are uncertain. |
The effects of emerging claim and coverage issues and class action litigation on our business are uncertain.
As industry practices and legal, judicial, social and other environmental conditions change, unexpected and unintended issues related to claims and coverage may emerge. These issues may adversely affect our business by either extending coverage beyond our underwriting intent or by increasing the number and/or size of claims. Examples of these issues include:
| |
• | Judicial expansion of policy coverage and the impact of new theories of liability. |
| |
• | An increase of plaintiffs targeting property and casualty insurers, including us, in purported class action litigation regarding claims handling and other practices. |
| |
• | An increase in the variety, number and size of claims relating to liability losses, which often present complex coverage and damage valuation questions. |
| |
• | Adverse changes in loss cost trends, including, but not limited to, inflationary pressure in medical costs; auto repair costs; and labor a nd materials costs to rebuild damaged structures. |
In addition, we have been the target of a number of class action lawsuits arising from Hurricane Katrina, relating to allegations of improper claims settlement practices, misrepresentations in the scope of coverage and other matters. It is difficult to predict both the ultimate outcome of these lawsuits, and the impact if any, they will have on our businessof new theories of liability.
An increase of plaintiffs targeting property and financial condition. However, rulings adverse tocasualty insurers, including us, in pendingpurported class action litigation arising from Hurricane Katrina could have a material adverse effect onregarding claims handling and other practices.
An increase in the variety, number and size of claims relating to liability losses, which often present complex coverage and damage valuation questions.
Adverse changes in loss cost trends, including inflationary pressure in medical cost and auto and home repair costs.
We are exposed to credit risk in certain areas of our financial position, as well as on our results of operations.
United Fire & Casualty Company Form 10-K | 2010
| |
• | We are exposed to credit risk in certain areas of our operations. |
In addition to exposure to credit risk related to our investment portfolio, and reinsurance recovery, we are exposed to credit risk in several other areas of our business operations, including credit risk relating to policyholders, independent agents, brokers and brokers.reinsurers.
In accordance with industry practice, when policyholders purchase insurance policies from us throug hthrough independent agents and brokers, the premiums relating to those policies are often paid to the agents and brokers for payment to us. In most jurisdictions, the premiums will be deemed to have been paid to us whether or not actually received by us. Consequently, we assume a degree of credit risk associated with the amounts due from independent agents and brokers.
We are exposed to credit risk through our surety insurance operations, where we guarantee to a third party that our bonded principal will satisfy certain performance obligations (e.g., a construction contract) or certain financial obligations. If our policyholder defaults, we may suffer losses and be unable to be reimbursed by our policyholder.
We are exposed to credit risk with respect to our purchase of reinsurance. See the discussion in the risk factfactor titled “Market conditions may affect our access to and the cost of reinsurance and our reinsurers may not pay losses in a timely manner, or at all,” for a discussion of the credit risk associated with our reinsurance program.
To a large degree, the credit risk we face is a function of the economy; accordingly, we face a greater risk during a period of economic downturn. While we attempt to manage these risks through underwriting and investment guidelines, collateral requirements and other oversight mechanisms, our efforts may not be successful. For example, collateral obtained may subsequ entlysubsequently have little or no value. As a result, our exposure to credit risk could materially and adversely affect our results of operation and financial condition.
| |
• | We are subject to comprehensive state laws and regulations that pose particular risks to our ability to earn profits. |
United Fire Group, Inc. Form 10-K | 2011
We are subject to comprehensive state laws and regulations that pose particular risks to our ability to earn profits.
We are subject to extensive supervision and regulation by the states in which we operate. Our ability to comply with these laws and regulations and obtain necessary and timely regulatory action is, and will continue to be, critical to our success and ability to earn profits.
Examples of regulations that pose particular risks to our ability to earn profits include the following:
| |
• | Required licensing. Our insurance company subsidiaries, operate under licenses issued by various state insurance agencies. If a regulatory authority were to revoke an existing license or deny or delay granting a new license, our ability to continue to sell insurance or to enter or offer new insurance products in that market would be substantially impaired. Regulation of insurance rates and approval of policy forms. The insurance laws of most states in which we operate require insurance companies to file insurance premium rate schedules and policy forms for review and approval. When our loss ratio compares favorably to that of the industry, state regulatory authorities may resist or delay our efforts to raise premium rates in the future, even if the property and casualty industry generally is not experiencing regulatory resistance to premium rate increases. If premium rate increases we deem necessary are not approved, we may not be able to respond to market developments and increased costs in that state. State regulatory authorities may even impose premium rate rollbacks or require us to pay premium refunds to policyholders, affecting our profitability. If insurance policy forms we seek to use are not approved by a state insurance agency, our ability to offer new products and grow our business in that state could be substantially impaired. Required licensing. We, and our insurance company subsidiaries, operate under licenses issued by various state insurance agencies. If a regulatory authority were to revoke an existing license or deny or delay granting a new license, our ability to continue to sell insurance or to enter or offer new insurance products in that market would be substantially impaired.
|
| |
• | Regulation of insurance rates and approval of policy forms. The insurance laws of most states in which we operate require insurance companies to file insurance premium rate schedules and policy forms for review and approval. When our loss ratio compares favorably to that of the industry, state regulatory authorities may resist or delay our efforts to raise premium rates in the future, even if the property and casualty industry generally is not experiencing regulatory resistance to premium rate increases. If premium rate increases we deem necessary are not approved, we may not be able to respond to market developments and increased costs in that state. State regulatory authorities may even impose premium rate rollbacks or require us to pay premium refunds to policyholders, affecting our profitability. If insurance policy forms we seek to use are not approved by a state insurance agency, our ability to offer new products and grow our business in that state could be substantially impaired.
|
| |
• | Restrictions on cancellation, nonrenewal or withdrawal. Many states have laws and regulations restricting an insurance company's ability to cease or significantly reduce its sales of certain types of insurance in that state, except pursuant to a plan that is approved by the state insurance agencies. These laws and regulations restricting an insurance company’s ability to cease or significantly reduce its sales of certain types of insurance in that state, except pursuant to a plan that is approved by the state insurance department. These laws and |
United Fire & Casualty Company Form 10-K | 2010
regulations could limit our ability to exit or reduce our business in unprofitable markets or discontinue unprofitable products. For exam ple,example, the State of Louisiana has a law prohibiting the nonrenewal of homeowners policies written for longer than three years except under certain circumstances, such as for nonpayment of premium or fraud committed by the insured.
| |
• | Risk-based capital and capital adequacy requirements. We, and our
Risk-based capital and capital adequacy requirements. Our insurance company subsidiaries and affiliate, are subject to risk-based capital requirements that require us to report our results of risk-based capital calculations to state insurance departments and the NAIC. Any failure to meet applicable risk based capital requirements or minimum statutory capital requirements could subject us or our subsidiaries and affiliate to further examination or corrective action by state regulators, including limitations on our writing of additional business, state supervision or liquidation. Transactions between insurance companies and their affiliates. Transactions between us, our subsidiary insurance companies and our affiliates generally must be disclosed to, and in some cases approved by, state insurance agencies. State insurance agencies may refuse to approve or delay their approval of a transaction, which may impact our ability to innovate or operate efficiently. Required participation in guaranty funds and assigned risk pools. Certain states have enacted laws that require a property and casualty insurer conducting business in that state to participate in assigned risk plans, reinsurance facilities, and joint underwriting associations where participating insurers are required to provide coverage for assigned risks. The number of risks assigned to us by these plans is based on our share of total premiums written in the voluntary insurance market for that state. Pricing is controlled by the plan, often restricting our ability to charge the premium rate we might otherwise charge. Wherever possible, we utilize a designated servicing carrier to fulfill our obligations under these plans. Designated servicing carriers charge us fees to issue policies, adjust and settle claims and handle administrative reporting on our behalf. In these markets, we may be compelled to underwrite significant amounts of business at lower than desired premium rates, possibly leading to an unacceptable return on equity. While these facilities are |
| |
• | Transactions between insurance companies and their affiliates. Transactions between us, our subsidiary insurance compani es and our affiliate generally must be disclosed to, and in some cases approved by, state insurance agencies. State insurance agencies may refuse to approve or delay their approval of a transaction, which may impact our ability to innovate or operate efficiently.
|
| |
• | Required participation in guaranty funds and assigned risk pools. Certain states have enacted laws that require a property and casualty insurer conducting business in that state to participate in as signed risk plans, reinsurance facilities, and joint underwriting associations where participating insurers are required to provide coverage for assigned risks. The number of risks assigned to us by these plans is based on our share of total premiums written in the voluntary insurance market for that state. Pricing is controlled by the plan, often restricting our ability to charge the premium rate we might otherwise charge. Wherever possible, we utilize a designated servicing carrier to fulfill our obligations under these plans. Designated servicing carriers charge us fees to issue policies, adjust and settle claims and handle administrative reporting on our behalf. In these markets, we may be compelled to underwrite significant amounts of business at lower than desired premium rates, possibly leading to an unacceptable return on equity. While these facilities are generally designed so that the ultimate cost is borne by policyholders, the exposure to assessments and our ability to recoup these assessments th rough adequate premium rate increases may not offset each other in our financial statements. Moreover, even if they do offset each other, they may not offset each other in our financial statements for the same fiscal period, due to the ultimate timing of the assessments and recoupments or premium rate increases. Additionally, certain states require insurers to participate in guaranty funds for impaired or insolvent insurance companies. These state funds periodically assess losses against all insurance companies doing business in the state. Our operating results and financial condition could be adversely affected by any of these factors.
|
| |
• | Restrictions on the amount, type, nature, quality and concentration of investments. The various states in which we operate have certain restrictions on the amount, type, nature, quality and concentration of our investments. Generally speaking, these regulations require us to be conservative in the nature and quality of our investments and restrict our ability to invest in riskier, but often higher yield investments. These restrictions may make it more difficult for us to obtain our desired investment results.
|
| |
• | State and federal tax laws. Under current federal and state income tax law, our life insurance and annuity products receive favorable tax treatment. This favorable treatment may give these products a competitive advantage over other noninsurance products. Congress, from time to time, considers legislation that would reduce or eliminate the favorable policyholder tax treatment currently applicable to life insurance and annuities. Congress also considers proposals to reduce the taxation of certain products or investments that may compete with life insurance and annuities. Legislation that increases the taxation on insurance products or reduces the taxation on competing products could lessen the advantage or create a disadvantage for certain of our products, making them less comp etitive. Such proposals, if adopted, could have a material adverse effect on our financial position or ability to sell such products and could result in the surrender of some existing contracts and policies.
|
| |
• | Periodic financial and market conduct examinations. We are subject to periodic financial and market conduct examinations by the insurance departments in the various states in which we operate. Gene rally, it
|
United Fire & Casualty CompanyGroup, Inc. Form 10-K | 20102011
generally designed so that the ultimate cost is onlyborne by policyholders, the exposure to assessments and our ability to recoup these assessments through adequate premium rate increases may not offset each other in our financial statements. Moreover, even if they do offset each other, they may not offset each other in our financial statements for the same fiscal period, due to the ultimate timing of the assessments and recoupments or premium rate increases. Additionally, certain states require insurers to participate in guaranty funds for impaired or insolvent insurance companies. These state funds periodically assess losses against all insurance companies doing business in the state. Our operating results and financial condition could be adversely affected by any of these factors.
Restrictions on the amount, type, nature, quality and concentration of investments. The various states in which we operate have certain restrictions on the amount, type, nature, quality and concentration of our investments. Generally speaking, these regulations require us to be conservative in the nature and quality of our investments and restrict our ability to invest in riskier, but often higher yield investments. These restrictions may make it more difficult for us to obtain our desired investment results.
State and federal tax laws. Under current federal and state income tax law, our life insurance and annuity products receive favorable tax treatment. This favorable treatment may give these products a competitive advantage over other noninsurance products. Congress, from time to time, considers legislation that would reduce or eliminate the favorable policyholder tax treatment currently applicable to life insurance and annuities. Congress also considers proposals to reduce the taxation of certain products or investments that may compete with life insurance and annuities. Legislation that increases the taxation on insurance products or reduces the taxation on competing products could lessen the advantage or create a disadvantage for certain of our products, making them less competitive. Such proposals, if adopted, could have a company incorporated that performmaterial adverse effect on our financial position or ability to sell such examinations. Occasionally, however, we are examined by statesproducts and could result in which we do not have a company incorporated.the surrender of some existing contracts and policies.
Terrorism Risk Insurance. The costsTerrorism Risk Insurance Program Reauthorization Act of these examinations are borne by us2007 ("TRIPRA")requires the federal government and the insurance industry to share in any giveninsured losses up to $100 billion per year may contributeresulting from future terrorist attacks within the United States. For further information about TRIPRA and its effect on our operations, refer to our administrative expenses.the information in the Results of Operations section in Part II, Item 7, “Management's Discussion and Analysis of Financial Condition and Results of Operations.”
| |
• | Terrorism Risk Insurance. The Terrorism Risk Insurance Program Reauthorization Act of 2007 includes coverage for most direct commercial lines of business, including coverage for losses from nuclear, biological and chemical exposures if coverage was afforded by an insurer, with exclusions for commercial automobile insurance, burglary and theft insurance, surety, professional liability insurance and farm owners multiple peril insurance and provides marketplace stability. For further information about the Terrorism Acts, and their effect on our operations, refer to the information in the Results of Operations section in Part II, Item 7, “Management’s Discussion and Analysis of Financial Condition and Results of Operations.”
|
Compliance with these state laws and regulations requires us to incur administrative costs that decrease our profits. These l awslaws and regulations may also prevent or limit our ability to underwrite and price risks accurately, obtain timely premium rate increases necessary to cover increased costs, discontinue unprofitable relationships or exit unprofitable markets and otherwise continue to operate our business profitably. In addition, our failure to comply with these laws and regulations could result in actions by state or federal regulators, including the imposition of fines and penalties or, in an extreme case, revocation of our ability to do business in one or more states. Finally, we could face individual, group and class action lawsuits by our policyholders and others for alleged violations of certain state laws and regulations. Each of these regulatory risks could have a negative effect on our profitability.
| |
• | A reduction in our financial strength ratings could adversely affect our business and financial condition. |
A reduction in our financial strength ratings could adversely affect our business and financial condition.
Third-party rating agencies assess and rate the claims-paying ability of insurers and reinsurers based on criteria established by the agencies. Our property and casualty insurers have been assigned a financial strength rating of “A”"A" (Excellent) from A.M. Best since 1994 -1994; except for one insurance subsidiary that is in a run-off status, which A.M. Best has designated as NR-3 (Rating Procedure Inapplicable). Prior to Mercer Insurance Group's acquisition by us, it was rated "A" (Excellent) by A.M. Best since 2001. Our life insurance subsidiary has been assigned a financial strength rating of “A-” (Excellent) from A.M. Best since 1998. Our property and casualty insurance companies are rated on a group basis. Financial strength ratings are used by policyholders, insurers, reinsurers and insurance and reinsurance intermediaries as an important means of assessing the financial strength of insurers and reinsurers. These ratings are not evaluations directed to potential purchasers of our common stock and are not recommendations to buy, sell or hold our common stock. These ratings are subject to change at any time and could be revised downward or revoked at the sole discretion of the rating agency. Downgrades in our financial strength ratings could adversely affect our ability to access the capital markets or could lead to increased borrowing costs in
United Fire Group, Inc. Form 10-K | 2011
the future. Perceptions of our companythe Company by investors, producers, other businesses and consumers could also be significantly impaired.
We believe that the ratings assigned by A.M. Best are an important factor in marketing our products. Our ability to retain our existing business and to attract new business in our insurance operations depends on our ratings by this agency. Our failure to maintain our ratings, or any other adverse development with respect to our ratings, could cause our current and future independent agents and policyholders to choose to transact their business with more highly rated competitors. If A.M. Best downgrades our ratings or publicly indicates that our ratings are under review, it is likely that we will not be able to compete as effectively with our competitors and our ability to sell insurance policies could decline. If that happens, our premium revenue and earnings would decrease. For example, many of our agencies and policyholders have guidelines that require us to have an A.M. Best financial strength rating of “A-” or higher. A red uctionreduction of our A.M. Best ratings below “A-” would prevent us from issuing policies to a portion of our current policyholders or other potential policyholders with similar ratings requirements. In addition,
Market conditions may affect our access to and the cost of reinsurance and our reinsurers may not pay losses in a ratings downgrade for our property and casualty insurers by A.M. Best below “A” would constitute an event of default under our credit facility.timely manner, or at all.
| |
• | Market conditions may affect our access to and the cost of reinsurance and our reinsurers may not pay losses in a timely mann er, or at all. |
As part of our overall risk and capacity management strategy, we purchase reinsurance for significant amounts of the risk that we and our insurance company subsidiaries and affiliate underwrite. The availability and cost of
United Fire & Casualty Company Form 10-K | 2010
reinsurance is subject to market conditions that are beyond our control. The availability and cost of the reinsurance we purchase may affect the level of our business and profitability. Although we purposely work with several reinsurance intermediaries and reinsurers, we may be unable to maintain our current reinsurance facilities or obtain other reinsurance facilities in adequate amounts and at favorable premium rates. Moreover, there may be a situation in which we have more than two catastrophic events within one policy year. Because our current catastrophe reinsurance program only allows for one automatic reinstatement at an additional reinstatement premium, we would be required to obtain a new catastrophe reinsurance policy to maintain our current level of catastrophe reinsurance coverage. Such coverage may be difficult to obtain, particularly if it is necessary to do so during hurricane season following the second catastrophe. If we are unable to renew our expiring facilities or to obtain new reinsurance facilities, either our net exposure to risk will increase or, if we are unwilling to bear an increase in net risk exposures, we will have to reduce the amount of risk we underwrite.
Although reinsurance makes the reinsurer liable to us to the extent the risk is transferred, it does not relieve us of our l iabilityliability to our policyholders. Our ability to collect reinsurance recoverables may be subject to uncertainty. Our losses must meet the qualifying conditions of the reinsurance agreement. Reinsurers must also have the financial capacity and willingness to make payments under the terms of a reinsurance agreement or program. Particularly, following a major catastrophic event, our inability to collect a material recovery from a reinsurer on a timely basis, or at all, could have a material adverse effect on our liquidity, operating results and financial condition.
| |
• | Our geographic concentration in both our property and casualty insurance and life insurance segments ties our performance to the business, economic and regulatory conditions of certain states. |
Our geographic concentration in both our property and casualty insurance and life insurance segments ties our performance to the business, economic and regulatory conditions of certain states.
The following states provided 56.649.8 percent of the direct statutory premium written for the property and casualty insurance segment in 2010:2011: Texas (15.8(12.9 percent), Iowa (15.7(12.7 percent), California (10.6 percent), Missouri (9.3 percent), Louisiana (8.6(7.3 percent) and Illinois (7.2Louisiana (6.3 percent). The following states provided 69.071.0 percent of the direct statutory premium written for the life insurance segment in 2010:2011: Iowa (32.6 percent), Wisconsin (10.0 percent) and Illinois (9.8(29.7 percent), Minnesota (8.5(11.9 percent), Illinois (10.2 percent), Nebraska (8.1(9.6 percent), and Wisconsin (9.6 percent). Our revenues and profitability are subject to the prevailing regulatory, legal, economic, political, demographic, competitive, w eatherweather and other conditions in the principal states in which we do business. Changes in any of these conditions could make it less attractive for us to do business in such states and would have a more pronounced effect on us compared to companies that are more geographically diversified. In addition, our exposure to severe losses from localized natural perils, such as hurricanes or hailstorms, is increased in those areas where we have written a significant amount of property insurance policies.
| |
• | We face significant competitive pressur es in our business that could cause demand for our products to fall and reduce our revenue and profitability. |
United Fire Group, Inc. Form 10-K | 2011
We face significant competitive pressures in our business that could cause demand for our products to fall and reduce our revenue and profitability.
The insurance industry is highly competitive. In our property and casualty insurance business and in our life insurance business, we compete, and will continue to compete, with many major U.S. and non-U.S. insurers and smaller regional companies, as well as mutual companies, specialty insurance companies, underwriting agencies, and diversified financial services companies. Some of our competitors have far greater financial and marketing resources than we do. Our premium revenue and our profitability could decline if we lose business to competitors offering similar or better products at or below our prices. Our profitability could also be affected by the entry of new competitors into the market and the development of new pro ductsproducts by new and existing competitors.
We price our insurance products based on estimated profit margins, and we would not be able to significantly reduce our current estimated profit margins in the near future. Some of our competitors may be larger and have more capital than we do, and may be able to withstand significant reductions in their profit margins. If our competitors decide to target our policyholder base by offering lower-priced insurance, we may not be able to respond competitively, which could reduce our revenue and our profitability.
| |
• | Our business depends on the uninterrupted operations of our facilities, systems and business functions. |
Our business depends on the uninterrupted operations of our facilities, systems and business functions.
Our business depends on our employees’employees' ability to perform necessary business functions, such as processing new and renewal policies and claims. We increasingly rely on technology and systems to accomplish these business
United Fire & Casualty Company Form 10-K | 2010
functions in an efficient and uninterrupted fashion. Our inability to access our facilities or a failure of technology, telecommunications or other systems could significantly impair our ability to perfo rmperform such functions on a timely basis or affect the accuracy of transactions. If sustained or repeated, such a business interruption or system failure could result in a deterioration of our ability to write and process new and renewal business, serve our agents and policyholders, pay claims in a timely manner, collect receivables or perform other necessary business functions.
In the event that a natural disaster or a terrorist act occurs, our company and employees could be directly adversely affected, depending on the nature of the event. We have an emergency preparedness plan that consists of the information and procedures required to enable rapid recovery from an occurrence, such as natural disaster or business disruption, which could potentially disable us for an extended period of time. This plan was successfully tested during 2008, both by the Midwest flooding that affected our corporate headquarters in Cedar Rapids, Iowa, and by Hurricane Ike that affected our Gulf Coast regional office in Galveston, Texas.
| |
• | Adverse capital and credit market conditions may significantly affect our ability to meet liquidity needs, as well as our access to capital and cost of capital. |
Since mid 2007, the capital and credit markets have been experiencing extreme volatilitymarket conditions may significantly affect our ability to meet liquidity needs, as well as our access to capital and disruption. Beginning in the second halfcost of 2008, the volatility and disruption reached unprecedented levels and the markets exerted downward pressure on availability of liquidity and credit capacity for certain issuers. capital.
Although capital market conditions have improved, our results of operations, financial condition, cash flows and statutory capital position could be materially adversely affected by continued disruptions in the capital and credit markets.
We maintain a level of cash and securities which, combined with expected cash inflows from investments and operations, is believed adequate to meet anticipated short-term and long-term benefit and expense payment obligations. However, in the event our current internal sources of liquidity do not satisfy our needs, we may have to seek additional financing and, in such case,entered into a $100.0 million revolving unsecured credit facility that we may not be able to successfully obtain additional financing on favorable terms, or at all. The availability of additional financing will depend on a variety of factors such as market and economic conditions, the general availability of credit, our credit rating and credit capacity, as well as customers’ or lenders’ perception of our long- or short-term financial prospects. Similarly, our access to funds may be impaired if regulatory authorities or rating agencies take negative actions against us.can access.
Disruptions, uncertainty or volatility in the capital and credit markets may limit our access to capital required to operate our business. Such market conditions may limit our ability to replace, in a timely manner, maturing liabilities; satisfy statutory capital requirements; and access the capital necessary to grow our business. As such, we may be forced to delay raising capital, issue shorter term securities than we prefer, utilize available internal resources or bear an unattractive cost of capital, which could decrease our profitability and significantly reduce our financial flexibility and liquidity.
| |
• | If we are unable to successfully introduce new products or services or fail to keep pace with advances in technology, our business, financial condition and results of operations will be adversely affected. |
United Fire Group, Inc. Form 10-K | 2011
If we are unable to successfully introduce new products or services or fail to keep pace with advances in technology, our business, financial condition and results of operations will be adversely affected.
The successful implementation of our business model depends on our ability to adapt to evolving technologies and industry standards and introduce new products and services. We cannot assure you that we will be able to introduce new products, or that any new products will achieve market acceptance. Moreover, competitors may develop competitive products that could adversely affect our results of operations. A failure by us to introduce planned products or other new products could have an adverse effect on our business, financial condition and results of operations.
If we cannot adapt to changing technologies, our products and services may become obsolete, and our business could suffer. Our success will depend, in part, on ou rour ability to continue to enhance our existing products and services, develop new technology that addresses the increasingly sophisticated and varied needs of our prospective customers and respond to technological advances on a timely and cost-effective basis. We may not be successful in using new technologies effectively or adapting our proprietary technology to evolving customer requirements, and, as a result, our business could suffer.
United Fire & Casualty Company Form 10-K | 2010
| |
• | We are unable to predict the impact on us of the new federal financial regulatory reform. |
The Dodd-Frank Wall Street Reform and Consumer Protection Act (“Dodd-Frank Act”) enacted in July, 2010, expands the federal presence in insurance oversight. The Dodd-Frank Act’sAct's requirements include streamlining the state-based regulation of reinsurance and nonadmitted insurance (property or casualty insurance placed from insurers that are eligible to accept insurance, but are not licensed to write insurance in a particular state). The Dodd-Frank Act also establishes a new Federal Insurance Office within the U.S. Department of the Treasury with regulatory authority over all lines of insurance except health insurance, certain long-term care insurance and crop insurance. The Federal Insurance Office has the power to, among other things, monitor aspects of the insurance industry, identify issues in the regulation of insurers that could contribute to a systemic crisis in the insurance industry or the overall financial system, , coordinate federal policy on international insurance matters and preempt state insurance measures under certain circumstances.
The Dodd-Frank Act provides a framework for further regulation and governance initiatives. These regulations and initiatives will cover many aspects of public company governance including, but not limited to, new and enhanced executive compensation disclosures, nonbinding stockholder votes on executive compensation, new independence standards for compensation committee membership, and incentive compensation clawback policies. Because the SEC has not yet completed its required rulemaking under the Dodd-Frank Act, we are unable to predict with certainty the overall impact these new regulations and initiatives will have on us. However, the cost of compliance with new regulations and initiatives could be significant, and mater ially adversely impact our results of operations, equity, business, and insurer financial strength and debt ratings.
| |
• | We may face increased operating costs and underwriting losses arising from the federal health care reform legislation, as well as state health care reform proposals. |
The 2010 Acts, enacted in March 2010, may increase our operating costs and un derwriting losses. This landmark legislation may lead to numerous changes in the health care industry that could create additional operating costs for us, particularly with respect to our workers’ compensation and long-term care products. These costs might arise through the increased use of health care services by our claimants or the increased complexities in health care bills that could require additional levels of review. In addition, due to the expected number of new participants in the health care system and the potential for additional malpractice claims, we may experience increased underwriting risk in the lines of our business that provide management and professional liability insurance to individuals and businesses engaged in the health care industry. The lines of our business that provide professional liability insurance to attorneys, accountants and other professionals who advise clients regarding the health care reform legislation may also experience increased underwriting risk due to the c omplexity of the legislation. As a result, we may experience unanticipated underwriting losses with respect to these lines of business. Finally, we cannot predict with any certainty the impact upon us of the various state health care reform proposals. Consequently, our results of operations, equity, business, insurer financial strength and debt ratings could be materially adversely impacted.
Risks Relating to Our Proposed Acquisition of Mercer Insurance Group Inc.
On November 30, 2010,March 28, 2011, we entered into an Agreement and Plancompleted the acquisition of Merger to acquire 100 percent of the outstanding capital stock of Mercer Insurance Group for $28.25 per share in cash consideration (representing app roximately $191.0$191.5 million in total consideration).
We incurred significant costs and expenses in connection with the acquisition; the integration of Mercer Insurance Group into our business operations may result in significant expenses and accounting charges, all of which will adversely affect our operating results and financial condition.
During 2011, we incurred one-time transaction costs totaling $8.3 million in connection with the acquisition transaction. We expect the merger to close on or before March 31, 2011. The following risk factors relate specifically to risksincur additional costs associated with this planned merger, which may affectthe integration of Mercer Insurance Group into our financial condition, results of operations orbusiness operations. In addition to one-time transaction costs, we also incurred accounting charges related to the performance of our common stock.
| |
• | We may not realize all of the anticipated benefits of the merger or such benefits may take longer to realize than expected. |
Our ability to realize the anticipated benefitsamortization of the merger will depend, to a large extent, on our ability to integratevalue of business acquired ("VOBA") asset. VOBA is being amortized in the businessesfirst 12 months of Mercer with our existing business. The combination of two independent companies is a complex, costly and time-consuming process. As a result, we will be required to devote significant management attention and resources to integrating the business practices and operations of United Fire and Mercer. The integration process may disrupt the business of either or both of the companies and, if implemented ineffectively, would preclude
United Fire & Casualty CompanyGroup, Inc. Form 10-K | 20102011
operations subsequent to the acquisition. As of December 31, 2011, the VOBA asset was $1.7 million, which will be fully amortized in the first quarter of 2012.
We continue to integrate a large number of systems and functions, including management information, purchasing, accounting and finance, claims, underwriting, billing, payroll and benefits, fixed assets and lease administration, and regulatory compliance. Many of the expenses that will be incurred, by their nature, are impracticable to estimate. These expenses could, particularly in the near term, exceed the savings that we expect to achieve from the elimination of duplicative expenses, the realization of economies of scale, and cost savings and revenue synergies related to the fullintegration of the two companies.
To the extent that our financial results are materially affected by additional integration-related expenses and costs, the price of our common stock could decline.
Integrating Mercer Insurance Group into our existing operations involves considerable risks and may not be successful, and we may fail to realize the potential benefits expected by United Fire. Our failure to meetof the challenges involved in integrating successfully the operationsacquisition of Mercer or otherwiseInsurance Group.
The integration of Mercer Insurance Group into our existing operations has been a complex, time-consuming and expensive process and may disrupt our existing operations if not completed in a timely and efficient manner. If our management is unable to minimize the potential disruption to our business during the integration process, we may not realize the anticipated benefits of the merger could cause an interruptionacquisition. Realizing the benefits of the acquisition will depend, in part, on the successful integration of technology, operations, and personnel, while maintaining adequate focus on our core businesses. We may encounter substantial difficulties, costs and delays in integrating Mercer Insurance Group, including the following, any one or a losscombination of momentum in, our activities andwhich could seriously harm our results of operations. In addition,operations, business, financial condition and/or the overallprice of our common stock:
difficulties and delays in the integration of Mercer Insurance Group's operations, personnel, technologies, products, services, business relationships and information and other systems;
the diversion of management's attention from normal daily operations of our business;
difficulties associated with managing a larger, more complex, combined business;
the occurrence of adverse development of loss reserves;
contractual and/or intellectual property disputes;
lost agents, agencies or policyholders as a result of agents, agencies or policyholders of either of the two companies deciding not to do business with the combined companies;
conflicts in agency, marketing or other important relationships;
difficulties caused by entering geographic and business markets in which we have limited or no prior experience;
acquired products and services that may result in material unanticipated problems, expenses, liabilities, competitive responses, not attract policyholders;
loss of client relationships,key employees and diversiondisruptions among employees that may erode employee morale;
inability to implement uniform standards, controls, policies and procedures; and
failure to achieve anticipated levels of management’s attention,revenue, profitability or productivity.
Our operating expenses may increase significantly over the near term due to the increased number of employees, expanded operations and changes related to the acquisition. Our business, operating results and financial condition may causebe adversely affected to the extent that our stockexpenses increase but our revenues do not, there are unanticipated
United Fire Group, Inc. Form 10-K | 2011
expenses related to the integration process, or there are significant costs associated with presently unknown liabilities. Failure to minimize the numerous risks associated with the post-acquisition integration strategy also may adversely affect the price to decline. The difficulties of combining the operationsour common stock.
We incurred debt as part of the companies include, among others:acquisition transaction.
| |
• | managing a significantly larger company; |
| |
• | maintaining employee morale and retaining key management and other employees; |
| |
• | integrating two unique business cultures, which may prove to be incompatible; |
| |
• | the possibility of faulty assumptions underlying expectations regarding the integration process; |
| |
• | retaining existing clients and attracting new clients; |
| |
• | consolidating corporate and administrative infrastructures and eliminating duplicative operations; |
| |
• | the diversion of management’s attention from ongoing business concerns and performance shortfalls at one or both of the companies as a result of the diversion of management’s attention to the merger; |
| |
• | coordinating geographically separate organizations; |
| |
• | unanticipated issues in integrating information technology, communications and other systems; |
| |
• | unanticipated changes in applicable laws and regulations; |
| |
• | managing tax costs or inefficiencies associated with integrating the operations of the combined company; and |
| |
• | unforeseen expenses or delays associated with the merger. |
ManyAs of these factorsDecember 31, 2011, we had a $45.0 million loan outstanding. Our ability to meet our ongoing debt service obligations under this loan will depend on our future performance, which will be outsidesubject to financial, business, and other factors affecting our operations, many of which are beyond our controlcontrol. These debt arrangements, and any one of them could result in increased costs, dec reases in the amount of expected revenues and diversion of management’s time and energy, which could materially impact our business, financial condition and results of operations. In addition, even if the operations of Mercer are integrated successfully, werestrictions included therein, may not realize the full benefits of the merger, including the synergies, cost savings or growth opportunities that we expect. These benefits may not be achieved within the anticipated time frame, or at all.
| |
• | There is a risk that the business we acquire as part of the merger may not be adequately reserved. |
Mercer’s property and casualty loss reserves are only estimates. Because of the uncertainties that surround estimating loss reserves, we cannot precisely determine the adequacy of Mercer’s existing property and casualty loss reserves. Actual loss and loss settlement expenses paid following the merger might exceed currently established reserves. If the loss reserves on the business we acquire from Mercer prove to be insufficient, we will have to increase these reserves and incur charges against our earnings. These charges could have a materialan adverse impact on our business operations and financial condition and results of operations, and could adversely affect the value of our common stock.
| |
• | The need for regulatory approval may delay the date of completion of the merger or may diminish the benefits of the merger. |
We are required to obtain approval of the merger from the Pennsylvania Insurance Department, the New Jersey Department of Banking and Insurance, and the California Department of Insurance. Any or all of these state insurance departments may impose certain requirements or conditions as part of their approval of the merger. Satisfying any requirements or cond itions imposed by these state insurance departments may delay the date of
United Fire & C asualty Company Form 10-K | 2010
completion of the merger. Any requirements or conditions imposed by the state insurance departments may diminish the benefits of the merger to us. We are obligated to complete the merger unless the permits, authorizations, consents and approvals from these insurance departments:
| |
• | impose conditions that: |
| |
◦ | are materially inconsistent with any material terms contained in the merger agreement in a manner that adversely affects the economic value of the merger agreement to us, |
| |
◦ | would require us or Mercer to divest or hold separate or otherwise take or commit to take any action that limits our freedom of action with respect to, or our ability to retain Mercer or any of the businesses, product lines or assets of our company, Mercer, or any of Mercer’s respective affiliates or subsidiaries, |
| |
◦ | would otherwise individually or in the aggregate, result in a material negative impact on the business, assets, liabilities, propert ies or condition (financial or otherwise) of use and our subsidiaries, taken as a whole, or Mercer and its subsidiaries, taken as a whole, or |
| |
• | impose other conditions that would, individually or in the aggregate, have a material adverse effect with respect to Mercer. |
| |
• | The need for approval by Mercer’s stockholders may delay the date of completion of the merger, or may prevent the merger altogether. |
Holders of a majority of the shares of Mercer’s outstanding capital stock are required to vote in favor of the merger before the merger may be completed. Mercer has scheduled a special meeting on March 16, 2011, where Mercer stockholders will be asked to vote on the merger. If the scheduled special meetingIntegration of Mercer stockholders is delayed, or if a majority of Mercer’s stockholders do not vote in favor of the merger, the mergerInsurance Group's information technology systems with ours may not become effective wit hin the expected time frame or at all.
| |
• | Failure to complete the merger or delays in completing the merger could negatively affect our business operations, financial condition or stock price.
|
If the merger is not completed for any reason, we may be subject to a number of risks, including t he following:
| |
• | We may not realize the benefits expected from the merger, including a potentially enhanced financial and competitive position. |
| |
• | The current market price of our common stock may reflect a market assumption that the merger will occur, and a failure to complete the merger could result in a negative perception by the stock market about us, resulting in a decline in the market price of our common stock. |
| |
• | We must pay certain costs relating to the merger, including certain investment banking, financing, legal and accounting fees and expenses, even if the merger is not completed. |
Delays in completing the merger could exacerbate uncertainties concerning the effect of the merger, which may have an adverse effect on our business following the merger and could defer or detract from the realization of the benefits expected to result from the merger.
United Fire & Casualty Company Form 10-K | 2010
| |
• | We expect to take on debt as part of the merger. |
Prior to the completion of the merger, we expect to take on debt to complement our available cash and funds obtained through the sale of invested assets to our subsidiaries. The financial and other covenants to which we may agree in connection with the occurrence of such debt and our increased indebtedness and high debt-to-equity ratio in comparison to our recent historical ratio may have the effect, among other things, of reducing our flexibility to respond to changing business and economic conditions, thereby placing us at a competitive disadvantage compared to competitors that have less indebtedness and making us more vulnerable to general adverse economic and industry conditions. The increased indebtedness will also increase borrowing costs and the covenants pertaining to such indebtedness may also limit our ability to obtain additional financing to fund working capital, capital expenditures, additional acquisitions or general corporate requirements. We will also be required to dedicate a larger portion of our cash flow from operations to payments on our indebtedness, thereby reducing the availability of our cash flow for other purposes, including working capital, capital expenditures and general corporate purposes. In addition, the terms and conditions of such debt may not be favorable to us, and as such, could further increase the cost of the merger, as well as the overall burden of such debt upon us and our business flexibility. Further, if any portion of our borrowings is at variable rates of interest, we will be exposed to the risk of increased interest rates.
Our ability to make payments on and to refinance our debt obligations and to fund planned capital expenditures will depend on our ability to generate cash from the combined company’s operations. This, to a certain extent, is subject to general economic, financial, competitive, legislative, regulatory and other factors that are beyond our control.
We may not be able to refinance any of our indebtedness on commercially reasonable terms, or at all. If we cannot service our indebtedness, we may have to take actions such as selling assets, seeking additional equity or reducing or delaying capital expenditures, strategic acquisitions, investments and alliances, any of which could impede the implementation of our business strategy or prevent us from entering into transactions that would otherwise benefit our business. Additionally, we may not be able to effect such actions, if necessary, on commercially reasonable terms, or at all.
Any of the foregoing consequences cou ld adversely affect our financials results.
| |
• | Lawsuits have been filed against Mercer, the members of Mercer’s Board of Directors, and us challenging the merger, and an adverse judgment in such lawsuits or other lawsuits that may later be filed may prevent the merger from becoming effective or from becoming effective within the expected time frame. |
Two putative class action lawsuits relating to the merger have been filed in the Superior Court of New Jersey of Mercer County, Chancery Division. Each of the cases was filed as a class action on behalf of all of Mercer’s shareholders and, on February 23, 2011, plaintiffs filed a Consolidated Amended Class Action Complaint alleging, among other things, that the consideration that shareholders will receive in connection with the merger is inadequate, that Mercer and Mercer’s directors breached their fiduciary duties to shareholders in negotiating and approving the merger agreement, and that we aided and abetted the breach of fiduciary duty by Mercer’s directors. The Consolidated Amended Class Action Complaint seeks various forms of relief, including injunctive relief that would, if granted, prevent the merger from closing in accordance with the agreed-upon terms. See Note 1 “Significant Accounting Policies” under the heading “Contingent Liabilities” contained in Part II, Item 8, “Financial Statements and Supplementary Data,” for more information about these lawsuits.
One of the conditions to the closing of the merger is that no preliminary or permanent injunction or other order issued by any court of competent jurisdiction that prohibits, restrains or enjoins the completion of the merger shall be in effect. As such, if the plaintiffs in either of the above lawsuits are successful in obtaining an injunction prohibiting closing the merger on the agreed-upon terms, then such injunction may prevent the merger from becoming effective, or from becoming effective within the expected time frame.
United Fire & Casualty Company Form 10-K | 2010
| |
• | Factors related to the merger could result in a potential downgrade of our financial strength ratings from A.M. Best. |
Our property and casualty insurers have been assigned a financial strength rating of “A” (Excellent) from A.M. Best since 1994 - except for one insurance subsidiary that is in a runoff status, which A.M. Best has designated as NR-3 (Rating Procedure Inapplicable). Our life insurance subsidiary has been assigned a financial strength ratingloss of “A-” (Excellent)technical support from A.M. Best since 1998. Our property and casualty companiessome information technology vendors.
Since the acquisition we are rated on a group basis . For the last ten years, Mercer’s property and casualty insurers have also been assigned a financial strength rating of “A” (Excellent) from A.M. Best.
Financial strength ratings are used by policyholders, insurers, reinsurers and insurance and reinsurance intermediaries as an important means of assessing the financial strength of insurers and reinsurers. If the merger is not completed for any reason or within a reasonable time frame, or if the integration of Mercer’s business operations into ours does not occur as expected or does not achieve the desired results and economies of scale, we and/or Mercer could be subjectworking to a ratings downgrade by A.M. Best.
We believe that the ratings assigned by A.M. Best are an important factor in marketing our products. The ability to retain our existing business and to attract new business in our insurance operations depends on the ratings that we receive from this agency. The failure to maintain either our ratings, or any other adverse development with respect to these ratings, could cause current and future independent agents and policyholders to choose to transact their business with more highly rated competitors and adversely impact our business operations and financial results.
| |
• | Loss of key personnel could have a material adverse effect on our business and results of operations after the merger. |
Our success after the merger, if completed, will depend, in part, upon our ability to retain key employees of both companies. Competition for qualified personnel can be intense. In addition, key employees may depart because of issues relating to the uncertainty or difficulty of integration or a desire not to remain with us. Accordingly, we may not be able to retain key employees following the merger. Loss of key personnel could have a material adverse effect on our business and operations after completion of the merger.
| |
• | Loss of key agents or agencies could have a material adverse effect on our business and results of operations after the merger. |
Our success after the merger, if completed, will depend, in part, upon our ability to retain key agent and agency relationships of both companies. Key agents or agencies may decide to terminate their relationship with us after the merger because of issues relating to the uncertainty or difficulty of integration or a desire not to remain with the combined company. Accordingly, we may not be able to retai n key agents or agencies following the merger. Loss of key agents or agencies could have a material adverse effect on our business and operations after completion of the merger.
| |
• | Integration of Mercer’s information technology systems with ours may result in a loss of technical support from some information technology vendors. |
It is expected that followi ng the merger we will combine our data and Mercer’sMercer Insurance Group's data to a single, integrated information technology platform. This process has involved, and will likely continue to involve, terminating the existing relationship with one or more of our or Mercer’sMercer Insurance Group's current information technology vendors. If the integration process does not progress smoothly or within the time frame anticipated by management, we could have difficulty receiving adequate technical support from cancelled vendors who might have little incentive to continue cooperating with us. Lack of adequate vendor technical support could also delay the technology integration process and lead to increased costs which, in turn, could have a material adverse effect on our business and operations after completion of the merger.operations.
United Fire & Casualty Company Form 10-K | 2010
Risks Relating to Our Common Stock
| |
• | As an insurance company, ourThe ability to pay dividends is restricted by state law. |
We are an insurance company domiciled in the State of Iowa and, as a result, we are subject to Iowa insurance laws restricting our abilitysubsidiaries to pay dividends tomay affect our stockholders, including laws establishing minimum solvencyliquidity and liquidity standards and laws that prohibit us from paying dividends except from the earned profits arising from our busines s. Our ability to paymeet our obligations.
United Fire Group, Inc. is a holding company with no significant independent operations. Its principal asset is the stock of United Fire & Casualty Company and its subsidiaries. State insurance regulatory authorities limit the payment of dividends also depends upon the statutory capital and surplus levels and earnings of our subsidiaryby insurance companies. In addition, competitive pressures generally require insurance companies to maintain insurance financial strength ratings. These restrictions and other regulatory requirements affect the ability of our subsidiary insurance companiessubsidiaries to pay dividendsmake dividend payments to us. Payments of dividends by our subsidiary insurance companies are restricted by state insurance laws similar to those laws that restrict our payment of dividends. As a result of these restrictions, atAt times we may not be able to pay dividends on our common stock, or we may be required to seek prior approval from the applicable regulatory authority before we can pay any such dividends. Limits on the ability of our insurance subsidiaries to pay dividends could adversely affect our liquidity, including our ability to pay dividends to shareholders, service our debt, and make share repurchases. In addition, the payment of dividends by us is within the discretion of our Board of Directors and will depend on numerous factors, including our financial condition, our capital requirements and other factors that our Board of Directors considers relevant.
| |
• | The price of our common stock may be volatile. |
The price of our common stock may be volatile.
The trading price of our common stock may fluctuate substantially due to a variety of factors, some of which are beyond our control and may not be related to our operating performance. These fluctuations could be significant and could cause a loss in the amount invested in our shares of common stock. Factors that could cause fluctuations include, but are not limited to, the following:
| |
• | Variations in our actual or anticipated operating results or changes in the expectations of financial market analysts with respect to our results. |
| |
• | Inve stor perceptions of the insurance industry in general and our company in particular. |
| |
• | Market conditions in the insurance industry and any significant volatility in the market. |
| |
• & nbsp; | Major catastrophic events. |
| |
• | Departure of our key personnel. |
| |
• | Certain provisions of our organizational documents, as well as applicable insurance laws, could impede an attempt to replace or remove our management, prevent the sale of our company or prevent or frustrate any attempt by stockholders to change the direction of our company, each of which could diminish the value of our common stock. |
Variations in our actual or anticipated operating results or changes in the expectations of financial market analysts with respect to our results.
Investor perceptions of the insurance industry in general and the Company in particular.
Market conditions in the insurance industry and any significant volatility in the market.
United Fire Group, Inc. Form 10-K | 2011
Major catastrophic events.
Departure of key personnel.
Certain provisions of our organizational documents, as well as applicable insurance laws, could impede an attempt to replace or remove our management, prevent the sale of the Company or prevent or frustrate any attempt by stockholders to change the direction of the Company, each of which could diminish the value of our common stock.
Our articles of incorporation and bylaws, as well as applicable laws governing corporations and insurance companies, contain provisions that could impede an attempt to replace or remove our management or prevent the sale of our companythe Company that, in either case, stockholders might consider being in their best interests. For example:
| |
• | Our Board of Directors is divided into three classes. At any annual meeting of our stockholders, our stockholders have the right to appoint approximately one-third of the directors on our Board of Directors. Consequently, it will take at least two annual stockholder meetings to effect a change in control of our Board of Directors. |
| |
• | Our articles of incorporation limit the rights of stockholders to call special stockholder meetings. |
| |
• | Our articles of incorporation set the minimum number of directors constituting the entire Board of Directors at nine and the maximum at 15, and they require approval of holders of two-thirds of all outst anding shares to amend these provisions. |
| |
• | Our articles of incorporation require the affirmative vote of two-thirds of all outstanding shares to approve any plan of merger, consolidation, or sale or exchange of all, or substantially all, of our assets. |
Our articles of incorporation set the minimum number of directors constituting the entire Board of Directors at nine and the maximum at 15, and they require approval of holders of 60.0 percent of all outstanding shares to amend these provisions. Within the range, the Board of Directors may increase by one each year the number of directors serving on the Board of Directors.
Our articles of incorporation require the affirmative vote of 60.0 percent of all outstanding shares to approve any plan of merger, consolidation, or sale or exchange of all, or substantially all, of our assets.
United Fire & Casualty Company Form 10-K | 2010Our Board of Directors may fill vacancies on the Board of Directors.
Our Board of Directors has the authority, without further approval of our stockholders, to issue shares of preferred stock having such rights, preferences and privileges as the Board of Directors may determine.
| |
• | Our Board of Directors may fill vacancies on the Board of Directors. |
| |
• | Our Board of Directors has the authority, without further approval of our stockholders, to issue shares of preferred stock having such rights, preferences and privileges as the Board of Directors may determine. |
| |
• | Section 490.1110 of the Iowa Business Corporation Act imposes restrictions on mergers and other business combinations between us and any holder of 10.0 percent or more of our common stock. |
| |
• | Section 490.624A of the Iowa Business Corporation Act authorizes the terms and conditions of stock rights or options issued by us to include restrictions or conditions that preclude or limit the exercise, transfer, or receipt of such rights or options by a person, or group of persons, owning or offering to acquire a specified number or percentage of the outstanding common shares or other securities of the corporation. |
Section 490.1110 of the Iowa Business Corporation Act imposes restrictions on mergers and other business combinations between us and any holder of 10.0 percent or more of our common stock.
Section 490.624A of the Iowa Business Corporation Act authorizes the terms and conditions of stock rights or options issued by us to include restrictions or conditions that preclude or limit the exercise, transfer, or receipt of such rights or options by a person, or group of persons, owning or offering to acquire a specified number or percentage of the outstanding common shares or other securities of the corporation.
Further, the insurance laws of Iowa and the states in which our subsidiary insurance companies are domiciled prohibit any person from acquiring direct or indirect control of us or our insurance company subsidiaries, generally defined as owning or having the power to vote 10.0 percent or more of our outstanding voting stock, without the prior written approval of stat estate regulators.
These provisions of our articles of incorporation and bylaws, and these state laws governing corporations and insurance companies, may discourage potential acquisition proposals. These provisions and state laws may also delay, deter or prevent a change of control of our company,the Company, in particular through unsolicited transactions that some or all of our stockholders might consider to be desirable. As a result, efforts by our stockholders to change the direction or our company’sthe Company's management may be unsuccessful, and the existence of such provisions may adversely affect market prices for our common stock if they are viewed as discouraging takeover attempts.
United Fire Group, Inc. Form 10-K | 2011
ITEM 1B. UNRESOLVED STAFF COMMENTS
None.
ITEM 2. PROPERTIES
We own three buildings:buildings in Cedar Rapids, Iowa, that we use as our corporate headquarters including: a five-story office building, a two-story office building and an eight-story office building in which a portion of the first floor (approximately 5.76.0 percent of th ethe building’s square footage) is leased to tenants, and related parking facilities in Cedar Rapids, Iowa, that we use as our corporate headquarters.facilities. All three buildings are connected by a skywalk system. We also own a 250-space parking ramp which is located adjacent to our corporate headquarters, for use by our employees. The parking ramp is located adjacent to our corporate headquarters upon aone parcel of real estate that we own and aanother parcel that we lease with an option to purchase.
In addition, three of our regional locations in Lock Haven, Pennsylvania, Pennington, New Jersey, and Rocklin, California, conduct operations in office space that we own. A portion of the Lock Haven (approximately 20.0 percent) and Pennington (approximately 4.0 percent) office space is leased to tenants. We also own a tract of land adjacent to the Pennington office and a townhouse located near the Rocklin office that is used for corporate purposes.
Our other two regional locations in Westminster, Colorado, and Galveston, Texas, and our claims office in Metairie, Louisiana, conduct operations in leased office space.
United Fire & Casualty Company Form 10-K | 2010
The following table shows a brief description of our owned and leased office space. We believe our current facilities are adequate to meet our needs with additional space available for future expansion, if necessary, at each of our leased and owned facilities.
|
| | | |
| Location | Utilized by | Owned or Leased | Lease Expiration Date |
| Corporate Headquarters – | | | |
| Cedar Rapids, Iowa (118 Second Avenue SE) | Corporate Administration,
Property and Casualty Insurance Segment | Owned | N/A |
| Cedar Rapids, Iowa (119 Second Avenue SE) | Corporate Administration,
Life Insurance Segment | Owned | N/A |
| Cedar Rapids, Iowa (109 Second Street SE) | P ropertyProperty and Casualty Insurance Segment | Owned | N/A |
| Denver Regional Office – Westminster, Colorado | Property and Casualty Insurance Segment | Leased | June 30, 2015 |
| Gulf Coast Regional Office – Galveston, Texas | Property and Casualty Segm entInsurance Segment | Leased | November 30, 2014 |
| Lock Haven Regional Office - Lock Haven, Pennsylvania | Property and Casualty Insurance Segment | Owned | N/A |
| New Orleans Claims Office – Metairie, Louisiana | Property and Casualty Insurance Segment | Leased | September 30, 2012 |
| Pennington Regional Office - Pennington, New Jersey | Property and Casualty Insurance Segment | Owned | N/A |
| Rocklin Townhouse - Rocklin, California | Property and Casualty Insurance Segment | Owned | N/A |
| Rocklin Regional Office - Rocklin, California | Property and Casualty Insurance Segment | Owned | N/A |
United Fire Group, Inc. Form 10-K | 2011
ITEM 3. LEGAL PROCEEDINGS
Incorporated by reference from Note 1615 “Contingent Liabilities” contained in Part II, Item 8, “Financial Statements and Supplementary Data.”
ITEM 4. SUBMISSION OF MATTERS TO A VOTE OF SECURITY HOLDERS
There were no matters submitted to a vote of the stockholders during the fourth quarter of 2010.MINE SAFETY DISCLOSURES
None.
PART II
ITEM 5. MARKET FOR REGISTRANT’S COMMON EQUITY, RELATED STOCKHOLDER MATTERS AND ISSUER PURCHASES OF EQUITY SECURITIES
Common Stockholders
United Fire’sFire Group, Inc.’s common stock is traded on The NASDAQ StockGlobal Select Market LLC (“NASDAQ”) under the symbol “UFCS.” On February 1, 20112012, there were 880877 holders of record of United Fire commonGroup, Inc.common stock. The number of record holders does not reflect stockholders who beneficially own common stock in nominee or street name, but does include participants in our employee stock ownership plan.
See “Security Ownership of Certain Beneficial Owners,” “Security Ownership of Management” and “Securities Authorized for Issuance under Eq uityEquity Compensation Plans,” in Part III, Item 12 of this Form 10-K, which incorporates by reference our definitive Proxy Statement for our annual meeting of stockholders to be held on May 18, 201116, 2012. The Proxy Statement will be filed with the SEC within 120 days after the end of our fiscal year (the “20112012 Proxy Statement”) and is incorporated herein by reference.
Dividends
Our practice has been to pay quarterly cash dividends, which we have paid every quarter since March 1968.
The table in the following section shows the quarterly cash dividends declared in 20102011 and 20092010. Payments of any future dividends and the amounts of such dividends, however, will depend upon factors such as net income, financial condition, capital requirements, and general business conditions. We will only pay dividends if declared by our Board of Directors, out of funds legally available, and subject to any other restrictions that may be applicable to us.
State law permits the payment of dividends only from earned surplus arising from business operations. Furthermore,
United Fire & Casualty Company Form 10-K | 2010
under Iowa law we may pay dividends only if after giving effect to the payment we are either able to pay our debts as they become due in the normal course of business or our total assets would be equal to or more than the sum of our total liabilities. Our subsidiaries are also subject to similar state law restrictions on dividends. Additional information about these restrictions is incorporated by reference from Note 76 “Statutory Reporting, Capital Requirements and Dividends and Retained Earnings Restrictions” contained in Part II, Item 8, “Financial Statements and Supplementary Data.”
Market Information
The following table sets forth the high and low trading price for our common stock for the calendar periods indicated. These quotations reflect interdealer prices without retail markups, markdowns, or commissions and may not necessarily represent actual transactions.
United Fire Group, Inc. Form 10-K | 2011
| | | Share Price | | Cash Dividends Declared | | | | | | | | | |
| | | Share Price | | Cash Dividends Declared |
| | | High | Low | |
| 2011 | | | | |
| Quarter Ended: | | | | |
| March 31 | | $ | 23.29 |
| $ | 18.50 |
| | $ | 0.15 |
|
| June 30 | | 21.95 |
| 17.10 |
| | 0.15 |
|
| September 30 | | 18.52 |
| 14.79 |
| | 0.15 |
|
| December 31 | | 21.16 |
| 16.20 |
| | 0.15 |
|
| | High | Low | | Cash Dividends Declared | | | |
| 2010 | | | | | |
| Quarter Ended: | | | | | | | |
| March 31 | $ | 18.92 | | $ | 15.99 | | | $ | 0.15 | | $ | 18.92 |
| $ | 15.99 |
| | $ | 0.15 |
|
| June 30 | 24.57 | | 17.55 | | | 0.15 | | 24.57 |
| 17.55 |
| | 0.15 |
|
| September 30 | 22.67 | | 18.86 | | | 0.15 | | 22.67 |
| 18.86 |
| | 0.15 |
|
| December 31 | 23.41 | | 19.82 | | | 0.15 | | 23.41 |
| 19.82 |
| | 0.15 |
|
| | | | | |
| 2009 | | | | |
| Quarter Ended: | | | | |
| March 31 | $ | 31.31 | | $ | 15.72 | | | $ | 0.15 | | |
| June 30 | 24.75 | | 16.47 | | | 0.15 | | |
| September 30 | 21.66 | | 16.39 | | | 0.15 | | |
| December 31 | 21.30 | | 16.50 | | | 0.15 | | |
Issuer Purchases of Equity Securities
Under our share repurchase program, first announced in August 2007, we may purchase com monour common stock from time to time on the open market or through privately negotiated transactions. The amount and timing of any purchases will be at our discretion and will depend upon a number of factors, including the share price, economic and general market conditions, and corporate and regulatory requirements. We will generally consider repurchasing companyour common stock on the open market if (i) the trading price on NASDAQ drops below 130 percent of its book value, and(ii) sufficient excess capital is available to purchase the stock.stock, and (iii) we are optimistic about future market trends and the performance of the Company. Our share repurchase programShare Repurchase Program may be modified or discontinued at any time.
United Fire & Casualty Company Form 10-K | 2010
The following table provides information with respect to purchases of shares of common stock made by or on our behalf or by any “affiliated purchaser,” as defined in Rule 10b-18(a)(3) under the Securities Exchange Act of 1934, during the three-month period ended December 31, 20102011.
| | | | | | | | | | | | |
| Period | Total Number of Shares Purchased (1) | | Average Price Paid per Share | | Total Number of Shares Purchased as a Part of Publicly Announced Plans or Programs | | Maximum Number of Shares that may be Purchased Under t he Plans or Programs |
| 10/1/10 - 10/31/10 | 28,168 | | | $ | 19.94 | | | 28,168 | | | 183,400 | |
| 11/1/10 - 11/30/10 | 10,574 | | | 19.95 | | | 10,574 | | | 172,826 | |
| 12/1/10 - 12/31/10 | — | | | — | | | — | | | 172,826 | |
|
| | | | | | | | | | | | |
| Period | Total Number of Shares Purchased (1) | | Average Price Paid per Share | | Total Number of Shares Purchased as a Part of Publicly Announced Plans or Programs | | Maximum Number of Shares that may be Purchased Under the Plans or Programs |
| 10/1/11 - 10/31/11 | — |
| | $ | — |
| | — |
| | 471,686 |
|
| 11/1/11 - 11/30/11 | — |
| | — |
| | — |
| | 471,686 |
|
| 12/1/11 - 12/31/11 | 1,807 |
| | 20.14 |
| | 1,807 |
| | 469,879 |
|
(1) Our share repurchase program was originally announced in August 2007 and allowed2007. Our Board of Directors authorized us, in May 2011, to repurchasepurchase up to an additional 600,0001,000,000 shares of our common stock bringing our total repurchase authorization to 687,167 shares. The program was extended for an additional two years by the board of directors inthrough August 2009. It is currently set to expire in August 2011.2013.
United Fire & Casualty Company Common Stock Performance Graph
The following graph compares the performance of an investment in ourUnited Fire & Casualty Company's common stock from December 31, 20052006, through December 31, 20102011, with the Standard & Poor’s 500 Index (“S&P 500 Index”), and the Standard & Poor’s 600 Property and Casualty Index (“S&P 600 P&C Index”), Russell 2000 Index, the SNL Insurance Company Index and the SNL Property & Casualty Insurance Index.. The graph assumes $100 was invested on December 31, 20052006, in each of our common stock and the above listed indices and that all dividends were reinvested on the date of payment without payment of any commissions. Dollar amounts in the graph are rounde drounded to the nearest whole dollar. The performance shown in the graph represents past performance and should not be considered an indication of future performance.
In order to provide a better comparison, we have replaced the Russell 2000 Index, the SNL Insurance Company Index and the SNL Property & Casualty Insurance Index, the indices used in previous years, with the S&P 500 Index and S&P 600 P&C Index for stockholder return purposes. These indices were also chosen because we believe they are a more appropriate benchmark against which to measure stock performance. Please note that the Russell 2000 Index, the SNL Insurance Company Index and the SNL Property & Casualty Insurance Index are represented in the following graph in accordance with Item 201(e)(4) of Regulation S-K, which requires that both the new and old index be shown if the graph shows a dif ferent index from that used in the preceding year. We will not include the Russell 2000 Index, the SNL Insurance Company Index and the SNL Property & Casualty Insurance Index in our December 31, 2011 Form 10-K.
United Fire & Casualty CompanyGroup, Inc. Form 10-K | 20102011
The following table shows the data used in the Total Return Performance graph above.
| | | | | Period Ending | Period Ending |
| Index | | 12/31/05 | | 12/31/06 | | 12/31/07 | | 12/31/08 | | 12/31/09 | | 12/31/10 | 12/31/06 | | 12/31/07 | | 12/31/08 | | 12/31/09 | | 12/31/10 | | 12/31/11 |
| United Fire & Casualty Company | | $ | 100.00 | | | $ | 88.52 | | | $ | 74.20 | | | $ | 80.87 | | | $ | 49.04 | | | $ | 61.84 | | $ | 100.00 |
| | $ | 83.82 |
| | $ | 91.36 |
| | $ | 55.40 |
| | $ | 69.86 |
| | $ | 65.18 |
|
| S&P 500 Index | | 100.00 | | | 115.79 | | | 122.16 | | | 76.96 | | | 97.33 | | | 111.99 | | 100.00 |
| | 105.49 |
| | 66.46 |
| | 84.05 |
| | 96.71 |
| | 98.76 |
|
| S&P 600 P&C Index | | 100.00 | | | 110.41 | | | 97.07 | | | 89.82 | | | 77.45 | | &n bsp; | 94.43 | | 100.00 |
| | 87.92 |
| | 81.36 |
| | 70.15 |
| | 85.53 |
| | 93.56 |
|
| Russell 2000 Index | | 100.00 | | | 116.57 | | | 125.86 | | | 97.42 | | | 105.33 | | | 125.60 | | |
| SNL Insurance P&C | | 100.00 | | | 109.90 | | | 110.60 | | | 59.04 | | | 67.69 | | | 81.27 | | |
| SNL Insurance | | 100.00 | | | 118.37 | | | 116.51 | | | 77.15 | | | 98.11 | | | 124.46 | | |
United Fire & Casualty CompanyGroup, Inc. Form 10-K | 20102011
ITEM 6. SELECTED FINANCIAL DATA
The following table sets forth certain selected financial data derived from the Consolidated Financial Statements of United Fire & Casualty Company and its subsidiaries and affiliate.affiliates. The data should be read in conjunction with Part II, Item 7, “Management’s Discussion and Analysis of Financial Condition and Results of Operations” and Part II, Item 8, “Financial Statements and Supplementary Data.”
| | | | | | | | | | | | | | | | | | | |
| (In Thousands, Except Per Share Data) | | | | | | | | | |
| Years Ended December 31 | 2010 | | 2009 | | 2008 | | 2007 | | 2006 |
| Consolidated Balance Sheet Data: | | | | | | | | | |
| Total cash and investments | $ | 2,662,955 | | | $ | 2,542,693 | | | $ | 2,205,355 | | | $ | 2,399,141 | | | $ | 2,388,387 | |
| Total assets | 3,007,439 | | | 2,902,544 | | | 2,687,130 | | | 2,760,554 | | | 2,776,067 | |
| | | | | | | | | | |
| Future policy benefits and losses, claims and loss settlement expenses | | | | | | | | | |
Property and casualty insurance (1) | 603,090 | | | 606,045 | | | 586,109 | | | 496,083 | | | 518,886 | |
| Life insurance | 1,389,331 | | | 1,321,600 | | | 1,167,665 | | | 1,184,977 | | | 1,233,342 | |
| Unearned premiums | 200,341 | | | 206,010 | | | 216,966 | | | 224,530 | | | 231,377 | |
| | | | | | | | | | |
| Total liabilities | 2,291,015 | | | 2,229,809 | | | 2,045,389 | | | 2,009,057 | | | 2,095,259 | |
Net unrealized gains, after tax (2) | 102,649 | | | 82,491 | | | 25,543 | & nbsp; | | 85,579 | | | 93,519 | |
| Repurchase of United Fire common stock | (6,280 | ) | | (1,545 | ) | | (14,817 | ) | | (16,078 | ) | | — | |
Total stockholders’ equity (3) | 716,424 | | | 672,735 | | | 641,741 | | | 751,497 | | | 680,808 | |
| | | | | | | | | | |
| Book value per share | 27.35 | | | 25.35 | | | 24.10 | | | 27.63 | | | 24.62 | |
| | | | | | | | | | |
| Consolidated Income Statement Data: | | | | | | | | | |
| Revenues | | | | | | | | | |
Net premiums written (4) | $ | 463,892 | | | $ | 467,427 | | | $ | 496,897 | | | $ | 501,849 | | | $ | 509,669 | |
| Net premiums earned | 469,473 | | | 478,498 | | | 503,375 | | | 505,763 | | | 503,122 | |
Investment income, net of investment expenses (5) | 111,685 | | | 106,075 | | | 107,577 | | | 122,439 | | | 121,981 | |
Realized investment gains (losses) (6) | 8,489 | | | (13,179 | ) | | (10,383 | ) | | 9,670 | | | 9,965 | |
| Other income | 1,425 | | | 799 | | | 880 | | | 654 | | | 532 | |
| Consolidated revenues | $ | 591,072 | | | $ | 572,193 | | | $ | 601,449 | | | $ | 638,526 | | | $ | 635,600 | |
| | | | | | | | | | |
| Losses and loss settlement expenses | | | | | | | | | | | | | | |
| Property and casualty insurance | 289,437 | | | 365,721 | | | 393,349 | | | 245,845 | | | 278,504 | |
| Life insurance | 20,359 | | | 16,773 | | | 13,291 | | | 14,869 | | | 14,285 | |
| Amortization of deferred policy acquistion costs | 113,371 | | | 114,893 | | | 129,158 | | | 136,805 | | | 126,898 | |
Other underwriting expenses (7) | 39,321 | | | 39,298 | | | 28,252 | | | 22,918 | | | 21,525 | |
Net income (loss) (8) | 47,513 | | | (10,441 | ) | | (13,064 | ) | | 111,392 | | &nb sp; | 88,085 | |
| | | | | | | | | | |
| Property and C asualty Insurance Segment Data: | | | | | | | | | |
Net premiums written (4) | 414,908 | | | 424,827 | | | 459,571 | | | 470,402 | | | 476,402 | |
| Net premiums earned | 420,373 | | | 435,677 | | | 465,581 | | | 473,134 | | | 467,031 | |
| Net income (loss) | 34,726 | | | (17,677 | ) | | (15,156 | ) | | 98,225 | | | 73,970 | |
Combined ratio (4) | 99.9 | % | | 115.2 | % | | 113.9 | % | | 81.3 | % | | 87.9 | % |
| | | | | | | | | | |
| Life Insurance Segment Data: | | | | | | | | | |
| Net premiums earned | 49,100 | | | 42,821 | | | 37,794 | | | 32,629 | | | 36,091 | |
| Net income | 12,787 | | | 7,236 | | | 2,092 | | | 13,167 | | | 14,115 | |
| | | | | | | | | | |
| Earnings Per Share Data: | | | | | | | | | |
Basic earnings (loss) per common share (9) | 1.81 | | | (0.39 | ) | | (0.48 | ) | | 4.04 | | | 3.37 | |
| Diluted earnings (loss) per common share | 1.80 | | | (0.39 | ) | | (0.48 | ) | | 4.03 | | | 3.36 | |
| | | | | | | | | | |
| Other Supplemental Data: | | | | | | | | | |
| Cash dividends declared per common share | 0.60 | | | 0.60 | | | 0.60 | | | 0.555 | | | 0.495 | |
United Fire & Casualty CompanyGroup, Inc. Form 10-K | 20102011
|
| | | | | | | | | | | | | | | | | | | |
| (In Thousands, Except Per Share Data) | | | | | | | | | |
| Years Ended December 31 | 2011 | | 2010 | | 2009 | | 2008 | | 2007 |
| Consolidated Balance Sheet Data: | | | | | | | | | |
| Total cash and investments | $ | 3,052,535 |
| | $ | 2,662,955 |
| | $ | 2,542,693 |
| | $ | 2,205,355 |
| | $ | 2,399,141 |
|
| Total assets | 3,618,924 |
| | 3,007,439 |
| | 2,902,544 |
| | 2,687,130 |
| | 2,760,554 |
|
| | | | | | | | | | |
| Future policy benefits and losses, claims and loss settlement expenses | | | | | | | | | |
Property and casualty insurance (1) | 945,051 |
| | 603,090 |
| | 606,045 |
| | 586,109 |
| | 496,083 |
|
| Life insurance | 1,476,281 |
| | 1,389,331 |
| | 1,321,600 |
| | 1,167,665 |
| | 1,184,977 |
|
| Unearned premiums | 288,991 |
| | 200,341 |
| | 206,010 |
| | 216,966 |
| | 224,530 |
|
| | | | | | | | | | |
| Total liabilities | 2,922,783 |
| | 2,291,015 |
| | 2,229,809 |
| | 2,045,389 |
| | 2,009,057 |
|
Net unrealized gains, after tax (2) | 124,376 |
| | 102,649 |
| | 82,491 |
| | 25,543 |
| | 85,579 |
|
| Repurchase of United Fire & Casualty Company common stock | (12,433 | ) | | (6,280 | ) | | (1,545 | ) | | (14,817 | ) | | (16,078 | ) |
Total stockholders’ equity (3) | 696,141 |
| | 716,424 |
| | 672,735 |
| | 641,741 |
| | 751,497 |
|
| | | | | | | | | | |
| Book value per share | 27.29 |
| | 27.35 |
| | 25.35 |
| | 24.10 |
| | 27.63 |
|
| | | | | | | | | | |
| Consolidated Income Statement Data: | | | | | | | | | |
| Revenues | | | | | | | | | |
Net premiums written (4) | $ | 604,867 |
| | $ | 463,892 |
| | $ | 467,427 |
| | $ | 496,897 |
| | $ | 501,849 |
|
| Net premiums earned | 586,783 |
| | 469,473 |
| | 478,498 |
| | 503,375 |
| | 505,763 |
|
Investment income, net of investment expenses (5) | 109,494 |
| | 111,685 |
| | 106,075 |
| | 107,577 |
| | 122,439 |
|
Realized investment gains (losses) (6) | 6,440 |
| | 8,489 |
| | (13,179 | ) | | (10,383 | ) | | 9,670 |
|
| Other income | 2,291 |
| | 1,425 |
| | 799 |
| | 880 |
| | 654 |
|
| Consolidated revenues | $ | 705,008 |
| | $ | 591,072 |
| | $ | 572,193 |
| | $ | 601,449 |
| | $ | 638,526 |
|
| | | | | | | | | | |
| Losses and loss settlement expenses |
|
| |
|
| |
|
| |
|
| |
|
|
Property and casualty insurance (7) | 407,831 |
| | 289,437 |
| | 365,721 |
| | 393,349 |
| | 245,845 |
|
| Life insurance | 22,558 |
| | 20,359 |
| | 16,773 |
| | 13,291 |
| | 14,869 |
|
Amortization of deferred policy acquisition costs (8) | 153,176 |
| | 113,371 |
| | 114,893 |
| | 129,158 |
| | 136,805 |
|
Other underwriting expenses (9) | 58,757 |
| | 39,321 |
| | 39,298 |
| | 28,252 |
| | 22,918 |
|
Net income (loss) (10) | 11 |
| | 47,513 |
| | (10,441 | ) | | (13,064 | ) | | 111,392 |
|
| | | | | | | | | | |
| Property and Casualty Insurance Segment Data: | | | | | | | | | |
Net premiums written (4) | 551,923 |
| | 414,908 |
| | 424,827 |
| | 459,571 |
| | 470,402 |
|
| Net premiums earned | 533,771 |
| | 420,373 |
| | 435,677 |
| | 465,581 |
| | 473,134 |
|
| Net income (loss) | (7,639 | ) | | 34,726 |
| | (17,677 | ) | | (15,156 | ) | | 98,225 |
|
Combined ratio (4) | 112.1 | % | | 99.9 | % | | 115.2 | % | | 113.9 | % | | 81.3 | % |
| | | | | | | | | | |
| Life Insurance Segment Data: | | | | | | | | | |
| Net premiums earned | 53,012 |
| | 49,100 |
| | 42,821 |
| | 37,794 |
| | 32,629 |
|
| Net income | 7,650 |
| | 12,787 |
| | 7,236 |
| | 2,092 |
| | 13,167 |
|
| | | | | | | | | | |
| Earnings Per Share Data: | | | | | | | | | |
Basic earnings (loss) per common share (11) | — |
| | 1.81 |
| | (0.39 | ) | | (0.48 | ) | | 4.04 |
|
| Diluted earnings (loss) per common share | — |
| | 1.80 |
| | (0.39 | ) | | (0.48 | ) | | 4.03 |
|
| | | | | | | | | | |
| Other Supplemental Data: | | | | | | | | | |
| Cash dividends declared per common share | 0.60 |
| | 0.60 |
| | 0.60 |
| | 0.60 |
| | 0.555 |
|
| |
| (1) | Property and casualty reserves may be affected by both internal and external events, such as changes in claims handling procedures, judicial or legislative actions, inflation, and catastrophes. TheIn 2011, our acquisition of Mercer Insurance Group and a significant level of catastrophes were factors in the change in our reserves. In prior years, the fluctuations in our reserves over the past five years primarily relaterelated to losses incurred from Hurricanes Ike and Gustav, which occurred in 2008, and the adverse claims litigation that has resulted from Hurricane Katrina, which occurred in 2005. For further discussion of Hurricane Katrina,our acquisition of Mercer Insurance Group, refer to our “Results of Operations” contained in Part II, Item 7, “Management’s Discussion and Analysis of Financial Condition and Results of Operations” and Note 16, “Contingent Liabilities”“Business Combinations” contained in Part II, Item 8, “Financial Statements and Supplementary Data.” |
| |
| (2) | Net unrealized gains, after tax, were impacted in 2008 due toby the volatility in the financial markets. The severe downturn in the financial markets resulted in a significant decrease to our net unrealized appreciation in 2008, while in 2009 and 2010 our net unrealized appreciation returned to levels similar to years prior to 2008. |
United Fire Group, Inc. Form 10-K | 2011
markets resulted in a significant decrease to our net unrealized gains in 2008, while in subsequent years our net unrealized gains returned to levels similar to years prior to 2008. In addition, our 2011 net unrealized gains were impacted by our acquisition of the investment portfolio of Mercer Insurance Group.
| |
| (3) | In 2011, our stockholders' equity decreased as a result of stockholder dividends, stock repurchases and an increase in the underfunded status of our employee benefit plans. The decrease was somewhat offset by an increase in net unrealized gains. In 2010, our stockholders' equity improved due to an increase in net unrealized gains and a significant improvement in our earnings. In 2008 and 2009, our stockholders’ equity was impacted by the overall state of the economy and the volatility in the financial markets, which impaired our ability to generate an underwriting profit and reduced our net investment income and net unrealized investment gains. Additionally, we recognized in equity, for the five years, the net change in the underfunded status of our employee benefit plans. |
| |
| (4) | PleaseFor further information on this line, please refer to the Statutory Financial Measures sectionResults of Operations and Measurement of Results sections in Part II, Item 7 for further explanation of this measure.7. |
| |
| (5) | The decline in investment income in 2009 and 2008since 2007 was due to lower market interest rates earned on our investment portfolio, which affected the amount we earned on our short-term investments and cash and cash equivalents;equivalents, and the changes in the value of certain investments in limited liability partnerships. Additionally in 2009 and 2008, investment income was affected by agency bonds that were called during 2009, the proceeds of which wewere reinvested at a lower interest rate than was previously available in prior years;years, and the reduction or discontinuation of dividend payments by some of our equity securit iessecurities that previously had paid regular dividends; and the changes in the value of certain investments in limited liability partnerships.dividends. |
| |
| (6) | Realized investment gains and losses could be material to our results of operations over the long term, and the occurrence and timing of realized gains and losses may cause our earnings to fluctuate substantially. GAAP requires us to recognize gains and losses from certain changes in the fair value of securities without the actual sale of those securities. The realized investment losses in 2009 and 2008 were primarily due to pre-tax realized losses from other-than-temporary investment charges incurred on our fixed maturity securities and equity securities. We recorded other-than-temporary investment charges of $0.4 million, $0.5 million, $18.3 million, $9.9 million and $0.1 million in $9.9 million2011, $0.1 million2010, 2009, 2008 and $0.4 million in 2010, 2009, 2008, 2007 and 2006,, respectively. |
| |
| (7) | TwoFor further information on this line, please refer to the Results of Operations section in Part II, Item 7. |
| |
| (8) | Amortization of deferred policy acquisitions costs increased in 2011 as a result of our acquisition of Mercer Insurance Group and the impact of amortization of the value of business acquired ("VOBA") asset. The VOBA asset is being amortized in the first 12 months of operations subsequent to the acquisition, in correlation to the remaining term of Mercer Insurance Group policies that we acquired. |
| |
| (9) | In 2011, our acquisition of Mercer Insurance Group primarily accounts for the fluctuation in other underwriting expenses when compared to prior years. The two factors causedthat historically cause most of the fluctuation in other underwriting expenses:expenses are the level of deferrable underwriting expenses, which generally correlates to our level of written premiums, and changes in the expense for our employee benefit plans. |
| |
(8) (10) | Our net income in 2011 reflects an increase in loss and loss settlement expenses from catastrophes and an increased level of other underwriting expenses, primarily as a result of our acquisition of Mercer Insurance Group. Our net losses in 2009 and 2008 were due to lower revenues from premiums earned, a decrease in net investment income, realized losses, higher expenses from losses, and other underwriting expenses. For further discussion of net income (loss) refer to our “Results of Operations” contained in Part II, Item 7, “Management’s Discussion and Analysis of Financial Condition and Results of Operations.” |
| |
(9) (11) | Our basic earnings (loss) per common share is calculated by dividing our net income (loss) by the weighted average common shares outstanding during the reporting period. |
United Fire & Casualty CompanyGroup, Inc. Form 10-K | 20102011
ITEM 7. MANAGEMENT’S DISCUSSION AND ANALYSIS OF FINANCIAL CONDITION AND RESULTS OF OPERATIONS
|
|
| FORWARD-LOOKING STATEMENTS |
This report may contain forward-looking statements about our operations, anticipated performance and other similar matters. The Private Securities Litigation Reform Act of 1995 provides a safe harbor under the Securities Act of 1933 and the Securities Exchange Act of 1934 for forward-looking statements. The forward-looking statements are not historical facts and involve risks and uncertainties that could cause actual results to differ materially from those expected and/or projected. Such forward-looking statements are based on current expectations, estimates, forecasts and projections about our company,the Company, the industry in which we operate, and beliefs and assumptions made by management. Words such as “expect(s),” “anticipate(s),” “intend(s),” “plan(s),” “believe(s),” “continue(s),”
“seek(s),” “estimate(s),” “goal(s),” “target(s),” “forecast(s),” “project(s),” “predict(s),” “should,” “could,” “may,” “will continue,” “might,” “hope,” “can” and other words and terms of similar meaning or expression in connection with a discussion of future operations, financial performance or financial condition, are intended to identify forward-looking statements. These statements are not guarantees of future performance and involve risks, uncertainties and assumptions that are difficult to predict. Therefore, actual outcomes and results may differ materially from what is expressed in such forward-looking statements. Information concerning factors that could cause actual results to differ materially from those in the forward-looking statements is contained in Part II Item 1A, “Risk Factors&rdq uo;Factors” of this document. Among the factors that could cause our actual outcomes and results to differ are:
| |
• | The adequacy of our loss and loss settlement expense reserves established for Hurricane Katrina, which are based on management’s estimates.
|
The frequency and severity of claims, including those related to catastrophe losses, and the impact those claims have on our loss reserve adequacy.
| |
• | The frequency and severity of claims, including those related to catastrophe losses, and the impact those claims have on our loss reserve adequacy. |
| |
• | Developments in the domestic and global financial markets that could affect our investment portfolio and financing plans. |
Developments in the domestic and global financial markets that could affect our investment portfolio.
| |
• | The calculation and recovery of deferred policy acquisition costs (“DAC”). |
| |
• | The valuation of pension and other postretirement benefit obligations. |
The calculation and recovery of deferred policy acquisition costs (“DAC”).
| |
• | Our relationship with our agents. |
| |
•&nbs p; | Our relationship with our reinsurers. |
The valuation of pension and other postretirement benefit obligations.
| |
• | The financial strength rating of our reinsurers. |
| |
• | Changes in industry trends and significant industry developments. |
Our relationship with our agencies and agents.
| |
• | The resolution of regulatory issues and litigation pertaining to and arising out of Hurricane Katrina. |
| |
• | Governmental actions, policies and reg ulations, including, but not limited to, domestic health care reform, financial services regulatory reform, corporate governance, new laws or regulations or court decisions interpreting existing laws and regulations or policy provisions. |
Our relationship with our reinsurers.
| |
• | NASDAQ policies or regulations relating to corporate governance and the cost to comply. |
The financial strength rating of our reinsurers.
Changes in industry trends and significant industry developments.
Our exposure to international catastrophes through our assumed reinsurance program.
Governmental actions, policies and regulations, including, but not limited to, domestic health care reform, financial services regulatory reform, corporate governance, new laws or regulations or court decisions interpreting existing laws and regulations or policy provisions.
NASDAQ policies or regulations relating to corporate governance and the cost to comply.
These are representative of the risks, uncertainties, and assumptions that could cause actual outcomes and results to differ materially from what is expressed in forward-looking statements. Readers are cautioned not to place undue reliance on these forward-looking statements, which speak only as of the date of this report or as of the date they are
United Fire & Casualty Company Form 10-K | 2010
made. Except as required under the federal securities laws and the rules and regulations of the Securities and Exchange Commission, we do not have any intention or obligation to update publicly any forward-looking statements, whether as a result of new information, future events, or otherwise.
Additional information concerning factors that could cause actual results to differ materially from those in the forward-looking statements is contained in Part I, Item 1A, “Risk Factors”
United Fire Group, Inc. Form 10-K | 2011
|
INTRODUCTIO N |
| INTRODUCTION |
The purpose of the Management’s Discussion and Analysis is to provide an understanding of our results of operations and consolidated financial position. Our Management’s Discussion and Analysis should be read in conjunction with Part II, Item 6, “Selected Financial Data” and Part II, Item 8, “Financial Statements and Supplementary Data.” When we provide information on a statutory basis, we label it as such; otherwise, all other data is presented in accordance with U.S. generally accepted accounting principles (“GAAP”).
This discussion and analysis is presented in these sections:
Our Business
| |
• | Consolidated Financial Highlights |
| |
• | Results of Operations for the Years Ended December 31, 2010, 2009, and 2008
|
Measurement of Results
| |
• | Liquidity and Capital Resources |
Consolidated Financial Highlights
| |
• | Critical Accounting Estimates |
| |
• | Pending Accounting Standards |
Results of Operations for the Years Ended December 31, 2011, 2010, and 2009
| |
• | Statutory Financial Measures |
| |
• | Non-GAAP Financial Measures |
Investments
Liquidity and Capital Resources
Critical Accounting Estimates
Pending Accounting Standards
Founded in 1946, United Fire & Casualty Company providesand its subsidiaries provide insurance protection for individuals and businesses through several regional companies. We are represented nationally by 7961,302 independent property and casualty insurance agencies and predominantly in the Midwest by 956950 independent life insurance agencies throughout the country, predominantly in the Midwest, West and South.agencies.
Segments
We operate two business segments withthat are comprised of a wide range of products:
| |
• | property and casualty insurance, which includes commercial insurance, personal insurance, surety bonds and assumed insurance; and |
| |
• | life insurance, which includes deferred and immediate annuities, universal life products and traditional life (primarily single premium whole life insurance) products. |
property and casualty insurance, which includes commercial insurance, personal insurance, and assumed insurance; and
life insurance, which includes deferred and immediate annuities, universal life products and traditional life (primarily single premium whole life insurance) products.
These business segments are managed separately, as they generally do not share the same customer base, and they each have different products, pricing, and expense structures.
United Fire & Casualty Company Form 10-K | 2010
For 20102011, property and casualty business accounted for nearlyapproximately 90.0 percent of our net premiums earned, of which 90.589.6 percent was generated from commercial insurance. Life insurance business made up approximately 10.0 percent of our net premiums earned, of which over 61.0 percent was generated from traditional life insurance products.
Pooling Arrangement
All of our property and casualty insurance subsidiaries, with the exception of Texas General Indemnity Company, are members of an intercompany reinsurance pooling arrangement. The insurance entities of Mercer Insurance
United Fire Group, Inc. Form 10-K | 2011
Group participated in their own pooling arrangement in 2011, which was in place when we acquired Mercer Insurance Group on March 28, 2011. Effective January 1, 2012, one pooling arrangement exists to cover all participating insurance subsidiaries of United Fire Group, Inc. Pooling arrangements permit the participating companies to rely on the capacity of the entire pool’s capital and surplus, rather than being limited to policy exposures of a size commensurate with each participant’s own surplus level.
Geographic Concentration
For 20102011, more than halfapproximately 50.0 percent of our property and casualty premiums were written in Texas, Iowa, California, Missouri, Louisiana, and Illinois;Louisiana; over three-fourths70.0 percent of our life insurance premiums were written in Iowa, Wisconsin,Minnesota, Illinois, Nebraska, and Minnesota.Wisconsin.
Sources of Revenue and Expense
We evaluate segment profit or loss based upon operating and investment results. Segment profit or loss described in the following sections of Management’s Discussion and Analysis is reported on a pre-tax basis. Additional segment information is presented in Part II, Item 8, Note 1110 “Segment Information” to the Consolidated Financial Statements.
Our primary sources of revenue are premiums and investment income. Major categories of expenses include losses and loss settlement expenses, changes in reserves for future policy benefits, operating (i.e., underwriting) expenses and interest on policyholders’ accounts.
Profit Factors
The profitability of our companythe Company is influenced by many factors, including price, competition, economic conditions, interest rates, catastrophic events and other natural disasters, man-made disasters, state regulations, court decisions, and changes in the law. Management believes that climate change considerations will not have a material impact on our profitability, unlessUnless a connection to increased extreme weather events related to climate change is ultimately proven true.true, management believes that climate change considerations will not have a material impact on our profitability.
How We Achieve Profitability
To manage these risks and uncertainties, we seek to achieve consistent profitability through strong agency relationships, exceptional customer service, fair and prompt claims handling, disciplined underwriting, superior loss control services, and effective and efficient use of technology.
United Fire & Casualty CompanyGroup, Inc. Form 10-K | 20102011
Our consolidated financial statements are prepared on the basis of GAAP. We also prepare financial statements for each of our insurance subsidiaries based on statutory accounting principles; these statements are filed with insurance regulatory authorities in the states where they do business.
Management evaluates our operations by monitoring key measures of growth and profitability. The following provides further explanation of the key measures management uses to evaluate the results:
Premiums written is a statutory measure of our overall business volume. Premiums written is an important measure of business production for the period under review. Net premiums written comprise direct and assumed premiums written, less ceded premiums written. Direct premiums written is the amount of premiums charged for policies issued during the period. For the property and casualty insurance segment there are no differences between direct statutory premiums written and direct premiums written under GAAP. However, for the life insurance segment, deferred annuity deposits (i.e., sales) are included in direct statutory premiums written, whereas they are excluded for GAAP.
Assumed premiums written is consideration or payment we receive in exchange for insurance we provide to other insurance companies. We report these premiums as revenue as they are earned over the underlying policy period. Ceded premiums written is the portion of direct premiums written that we cede to our reinsurers under our reinsurance contracts.
|
| | | | | | | | | | | |
| | Years Ended December 31 |
| (In Thousands) | 2011 | | 2010 | | 2009 |
| Net premiums written | $ | 604,867 |
| | $ | 463,892 |
| | $ | 467,427 |
|
| Net change in unearned premium | (16,401 | ) | | 5,669 |
| | 10,956 |
|
| Net change in prepaid reinsurance premium | (1,683 | ) | | (88 | ) | | 115 |
|
| Net premiums earned | $ | 586,783 |
| | $ | 469,473 |
| | $ | 478,498 |
|
Combined ratio is a commonly used statutory financial measure of property and casualty underwriting performance. A combined ratio below 100.0 percent generally indicates a profitable book of business. The combined ratio is the sum of two separately calculated ratios, the loss and loss settlement expense ratio (the “net loss ratio”) and the underwriting expense ratio (the “expense ratio”). If the combined ratio is at or above 100.0 percent, an insurance company is not underwriting profitably and may not be profitable unless investment income is sufficient to offset underwriting losses.
When prepared in accordance with GAAP, the net loss ratio is calculated as the ratio of losses and loss settlement expenses incurred to net premiums earned and measures the underwriting profitability of a company’s insurance business. We use the net loss ratio as a measure of the overall underwriting profitability of the insurance business we write and to assess the adequacy of our pricing. Our net loss ratio is meaningful in evaluating our financial results as reported in our Consolidated Financial Statements.
When prepared in accordance with GAAP, the underwriting expense ratio is calculated as the ratio of amortization of deferred policy acquisition costs and nondeferred underwriting expenses to net premiums earned. The underwriting expense ratio measures a company’s operational efficiency in producing, underwriting and administering its insurance business.
When prepared in accordance with statutory accounting principles, the net loss ratio is calculated by dividing the sum of losses and loss settlement expenses by net premiums earned; the expense ratio is calculated by dividing underwriting expenses by net premiums written.
Catastrophe losses is a commonly used non-GAAP financial measure, which utilize the designations of the Insurance Services Office (ISO) and are reported with loss and loss settlement expense amounts net of reinsurance recoverables, unless specified otherwise. According to the ISO, a catastrophe loss is defined as a single
United Fire Group, Inc. Form 10-K | 2011
unpredictable incident or series of closely related incidents that result in $25.0 million or more in U.S. industry-wide direct insured losses to property and that affect a significant number of insureds and insurers (“ISO catastrophe”). In addition to ISO catastrophes, we also include as catastrophes those events (“non-ISO catastrophes”), which may include U.S. or international losses, that we believe are, or will be, material to our operations, either in amount or in number of claims made. Management, at times, may determine for comparison purposes that it is more meaningful to exclude extraordinary catastrophe losses and resulting litigation, such as Hurricane Katrina. The frequency and severity of catastrophic losses we experience in any year affect our results of operations and financial position. In analyzing the underwriting performance of our property and casualty insurance segment, we evaluate performance both including and excluding catastrophe losses. Portions of our catastrophe losses may be recoverable under our catastrophe reinsurance agreements. We include a discussion of the impact of catastrophes because we believe it is meaningful for investors to understand the variability in periodic earnings.
|
| | | | | | | | | | | |
| | Years Ended December 31 |
| (In Thousands) | 2011 | | 2010 | | 2009 |
ISO catastrophes (1) | $ | 57,238 |
| | $ | 16,230 |
| | $ | 20,781 |
|
Non-ISO catastrophes (2) | 23,555 |
| | 3,540 |
| | 1,616 |
|
| Total catastrophes | $ | 80,793 |
| | $ | 19,770 |
| | $ | 22,397 |
|
(1) This number does not include loss and loss settlement expenses incurred for Hurricane Katrina claims and related litigation.
(2) This number includes international assumed losses.
United Fire Group, Inc. Form 10-K | 2011
|
|
| CONSOLIDATED FINANCIAL HIGHLIGHTS |
Consolidated Results of Operations
| | | | | | | | | | | % Change | | | | | | | % Change |
| (In Thousands) | | | | | | | | 2010 | | 2009 | | | | | | | 2011 | | 2010 |
| Years ended December 31 | | 2010 | | 2009 | | 2008 | | vs. 2009 | | vs. 2008 | 2011 | | 2010 | | 2009 | | vs. 2010 | | vs. 2009 |
| Revenues | | | | | | | | | | | | | | | | | | | |
| Net premiums earned | | $ | 469,473 | | | $ | 478,498 | | | $ | 503,375 | | | (1.9 | )% | | (4.9 | )% | $ | 586,783 |
| | $ | 469,473 |
| | $ | 478,498 |
| | 25.0 | % | | (1.9 | )% |
| Investment income, net | | 111,685 | | | 106,075 | | | 107,577 | | | 5.3 | | | (1.4 | ) | 109,494 |
| | 111,685 |
| | 106,075 |
| | (2.0 | ) | | 5.3 |
|
| Realized investment gains (losses), net | | 8,489 | | | (13,179 | ) | | (10,383 | ) | | 164.4 | | | (26.9 | ) | |
| Realized investment gains (losses) | | | | | | | | | | |
| Other-than-temporary impairment charges | | (395 | ) | | (459 | ) | | (18,307 | ) | | 13.9 |
| | 97.5 |
|
| Other realized gains, net | | 6,835 |
| | 8,948 |
| | 5,128 |
| | (23.6 | ) | | 74.5 |
|
| Total realized investment gains (losses) | | 6,440 |
| | 8,489 |
| | (13,179 | ) | | (24.1 | ) | | 164.4 |
|
| Other income | | 1,425 | | | 799 | | | 880 | | | 78.3 | | | (9.2 | ) | 2,291 |
| | 1,425 |
| | 799 |
| | 60.8 |
| | 78.3 |
|
| Total Revenues | | $ | 591,072 | | | $ | 572,193 | | | $ | 601,449 | | | 3.3 | % | | (4.9 | )% | $ | 705,008 |
| | $ | 591,072 |
| | $ | 572,193 |
| | 19.3 | % | | 3.3 | % |
| Benefits, Losses and Expenses | | | | | | | | | | | | | | | | | | | | | |
| Loss and loss settlement expenses | | $ | 309,796 | | | $ | 382,494 | | | $ | 406,640 | | | (19.0 | )% | | (5.9 | )% | $ | 430,389 |
| | $ | 309,796 |
| | $ | 382,494 |
| | 38.9 | % | | (19.0 | )% |
| Increase in liability for future policy benefits | | 27,229 | | | 23,897 | | | 23,156 | | | 13.9 | | | 3.2 | | |
| Liability for future policy benefits | | 32,567 |
| | 27,229 |
| | 23,897 |
| | 19.6 |
| | 13.9 |
|
| Amortization of deferred policy acquisition costs | | 113,371 | | | 114,893 | | | 129,158 | | | (1.3 | ) | | (11.0 | ) | 153,176 |
| | 113,371 |
| | 114,893 |
| | 35.1 |
| | (1.3 | ) |
| Other underwriting expenses | | 39,321 | | | 39,298 | | | 28,252 | | | 0.1 | | | 39.1 | | 58,757 |
| | 39,321 |
| | 39,298 |
| | 49.4 |
| | 0.1 |
|
Disaster charges and other related expenses,
net of recoveries | | (16 | ) | | (1,335 | ) | | 7,202 | | | (98.8 | ) | | (118.5 | ) | — |
| | (16 | ) | | (1,335 | ) | | NM |
| | 98.8 |
|
| Interest on policyholders’ accounts | | 42,988 | | | 41,652 | | | 40,177 | | | 3.2 | | | 3.7 | | 42,834 |
| | 42,988 |
| | 41,652 |
| | (0.4 | ) | | 3.2 |
|
| Total Benefits, Losses and Expenses | | $ | 532,689 | | | $ | 600,899 | | | $ | 634,585 | | | (11.4 | )% | | (5.3 | )% | $ | 717,723 |
| | $ | 532,689 |
| | $ | 600,899 |
| | 34.7 | % | | (11.4 | )% |
| Income (loss) before income taxes | | 58,383 | | | (28,706 | ) | | (33,136 | ) | | NM | | | 13.4 | | (12,715 | ) | | 58,383 |
| | (28,706 | ) | | (121.8 | ) | | NM |
|
| Federal income tax expense (benefit) | | 10,870 | | | (18,265 | ) | | (20,072 | ) | | 159.5 | | | 9.0 | | (12,726 | ) | | 10,870 |
| | (18,265 | ) | | NM |
| | 159.5 |
|
| Net Income (Loss) | | $ | 47,513 | | | $ | (10,441 | ) | | $ | (13,064 | ) | | NM | | | 20.1 | % | $ | 11 |
| | $ | 47,513 |
| | $ | (10,441 | ) | | (100.0 | )% | | NM |
|
| | | | | | | | | | | | | | | | | | | | | | |
| Basic earnings (loss) per share | | $ | 1.81 | | | $ | (0.39 | ) | | $ | (0.48 | ) | | NM | | | 18.8 | % | $ | — |
| | $ | 1.81 |
| | $ | (0.39 | ) | | (100.0 | )% | | NM |
|
| Diluted earnings (loss) per share | | $ | 1.80 | | | $ | (0.39 | ) | | $ | (0.48 | ) | | NM | | & nbsp; | 18.8 | | $ | — |
| | $ | 1.80 |
| | $ | (0.39 | ) | | (100.0 | ) | | NM |
|
NM = not meaningful
Consolidated Results of Operations
The following is a summaryyear 2011 will be remembered for its devastating catastrophes, both domestic and abroad. According to various reports, 2011 was the costliest catastrophe year on record for the property and casualty insurance industry globally. We experienced losses in our direct and assumed books of business that negatively impacted our full-year results. However, premium rates increased across all lines of business, and there were some positive signs in the overall economy. Additionally, we have taken steps to improve and strengthen our underwriting guidelines based on our catastrophe experiences of the past year. Internal analyses of our financial performancecatastrophe exposures, utilizing various approaches including the results of the updated RMS Model Version 11, supported the underwriting changes.
We also focused on our capital management strategy through our stock repurchase program and by entering into a new banking relationship with KeyBank National Association that established a $100.0 million syndicated line of credit, allowing us to reduce our cash position.
During 2011 we began the process of integrating Mercer Insurance Group into our operations. Mercer Insurance Group agents have represented our new combined companies and as a group have increased their production over the last three yearspast year. We began integrating Mercer Insurance Group's policy renewals into our processing systems, and the primary factors that have affected our performance.we
Consolidated R esults of Operations
| |
• | Net income was $47.5 million in 2010 compared to net losses of $10.4 million and $13.1 million in 2009 and 2008, due to an improvement in underwriting income resulting from a decrease in loss and loss settlement expenses, along with increases in net investment income and realized investment gains. The increase in our realized investment gains is attributable to a significant reduction in other-than-temporary impairment (“OTTI”) charges, which totaled $0.5 million, $18.3 million and $9.9 million for 2010, 2009 and 2008, respectively.
|
| |
• | Our property and casualty premium writings decreased 2.3 percent for 2010 and 7.6 percent in 2009. The slow economic recovery continues to affect potential commercial lines policyholders. In 2010, policy cancellations due to non-payment and/or companies going out of business contributed to the decline in our premium writings. In addition, ongoing competition in a soft insurance market continued to impact our business. In the fourth quarter of 2010, we slightly reduced our commercial lines pricing levels in order to retain quality accounts, however, new business pricing remained unchanged.
|
| |
• | Deferred annuity deposits (i.e., sales) decreased to $92.4 million for 2010, from $216.6 million and $161.1 millionin 2009 and 2008, respectively. In 2010, historic, low interest rates continued to affect our level of
|
United Fire Group, Inc. Form 10-K | 2011
remain on schedule to convert the West Coast business to our systems in 2012. We also began the initial planning for integration of the East Coast business. In addition, we consolidated Mercer Insurance Group's core and catastrophe reinsurance programs into our programs, resulting in increased coverage and reduction in Mercer Insurance Group's historical costs. We expect to realize cost savings of approximately $1.5 million in 2012 from the consolidation of these programs.
In 2011, our life insurance subsidiary received approval to operate in New Jersey, North Carolina, Pennsylvania,Virginia and West Virginia, continuing to leverage the Mercer Insurance Group acquisition by expanding the life insurance segment's geographical footprint. Our life management team continues to improve service to our agents by increasing marketing support and automating life product processes.
At a special meeting held on January 24, 2012, our stockholders approved our reorganization into a new holding company structure. United Fire Group, Inc. has replaced United Fire & Casualty Company Form 10-K | 2010
deferred annuity deposits. Our deposits were driven by consumers who sought a conservative, guaranteed rate of return on their funds, while our surrendersas the publicly held corporation, and withdrawals were driven by consumers who had a greater tolerance for risk and were seeking a potentially greater return. Deferred annuity deposi ts are not recorded as a component of net premiums written or net premiums earned; however, they do generate investment income.
| |
• | A benign hurricane season contributed to a reduction in catastrophe losses in both 2010 and 2009. Our catastrophe losses excluding the impact of Hurricane Katri na totaled $19.8 million in 2010 compared to $22.4 million in 2009. In 2008, our catastrophe losses totaled $76.1 million.
|
| |
• | Adverse development from Hurricane Katrina resulted in losses of $8.6 million in 2010 compared to $38.0 million for 2009 and $26.6 million for 2008, as we continued to resolve outstanding litigation.
|
| |
• | Our combined ratio improved to 99.9 percent f or 2010, compared to 115.2 percent and 113.9 percent for 2009 and 2008, respectively. Catastrophe losses contributed 4.7 percent, 5.1 percent and 16.3 percent to our 2010, 2009 and 2008 combined ratio, respectively.
|
Consolidated Financial Condition
| |
• | Deferred annuity deposits and withdrawals resulted in a net cash inflow related to our annuity business of $0.4 million and $96.0 million in 2010 and 2009, respectively, compared to a net cash outflow of $73.0 million in 2008.
|
| |
•&n bsp; | In 2010, we repurchased 343,328 shares of our common stock for $6.3 million, at an average cost of $18.29. As of December 31, 2010, 172,826 shares of common stock remained authorized for repurchase under our share repurchase program, which expires in August 2011.
|
| |
• | The carrying value of our investment portfolio increased in 2010, with net unrealized gains, after tax, of $102.6 million at December 31, 2010, compared to $82.5 million and $25.5 million at December 31, 2009 and 2008, respectively. The 2010 and 2009 increases in net unrealized investment gains was the result of increases in the fair value of our bond and equity holdings. In 2008, depressed bond and equity prices contributed to a decrease in net unrealized gains.
|
| |
• | Our financial strength continued to improve, as our stockholders’ equity increased in 2010 to $716.4 million from $672.7 million in 2009 and $641.7 million in 2008. The increase in 2010 was primarily due to net income totaling $47.5 million, which was generated during the year.
|
| |
• | Our book value per share increased by $2.00 to $27.35 in 2010 from $25.35 in 2009, primarily as a result of our significant increase in net income. Net unrealized investment gains, which was the primary factor increasing book value in 2009, were also a contributing factor in 2010. Book value per share in 2008 was $24.10.
|
Commentary on the Economy
We were encouraged by the economic improvement in 2010, despite seeing some lingering effects of the credit crisis and recession from 2008 and 2009 that continued to affect our business:
| |
• | Net premiums written decreased due to the weak economy, as growth remained depressed among current and potential commercial policyholders. In 2010, policy cancellations due to non-payment and/or companies going out of business contributed to a decline in our premium writings. However, in 2010 we successfully reduced loss and loss settlement expenses and took advantage of opportunities to grow our personal lines to offset the weaker commercial market. |
United Fire & Casualty Company Form 10-K | 2010is now a wholly owned subsidiary of United Fire Group, Inc. In addition to creating a more streamlined corporate structure, the new holding company's organizational documents enhanced our stockholder rights by reducing the percentage of stockholders required to amend our Articles of Incorporation, approve the merger or sale of substantially all company assets, and call a special meeting. This new structure will potentially provide us with more flexibility to operate and finance our businesses, particularly if we should need to raise capital in the future.
| |
• | Pricing in the insurance industry remained soft and very competitive in commercial lines. In the fourth quarter of 2010, we slightly reduced our commercial lines renewal pricing levels in order to retain quality accounts, although new business pricing remained unchanged. We retained approximately 80.0 percent of our commercial line accounts, in line with our goals. Personal lines retention rates reached approximately 87.0 percent for 2010 and we were successful in achieving slight price increases. |
| |
• | While there are industry-wide concerns about the municipal bond market, we believe the fundamentals of our own bond portfolio are strong. We select bonds based solely on their underlying credit (92 percent are rated “A” or better) and diversify risk by purchasing bonds issued across a large number of states. In 2010, we added a small number of bonds to our municipal bond portfolio and extended durations on new purchases in order to capture higher interest rates on our other bonds. |
| |
• | Interest ra tes remained a concern. While investment income has experienced gains due to increases in our bond and equity holdings in 2010, we saw some deterioration in the unrealized gains on our bond portfolio develop during the fourth quarter of 2010, due to rising interest rates. |
|
|
RESULTS OF OPERATIONS FOR THE YEARS ENDED DECEMBER 31, 2011, 2010 2009 AND 20082009 |
Property and Casualty Insurance Segment
| | Property & Casualty Segment Results of Operations | | % Change | |
| | Property & Casualty Insurance Segment Results of Operations | | Property & Casualty Insurance Segment Results of Operations | | % Change |
| (In Thousands) | | 2010 | 2009 | | 2011 | 2010 |
| Years ended December 31 | 2010 | 2009 | 2008 | vs. 2009 | vs. 2008 | 2011 | 2010 | 2009 | vs. 2010 | vs. 2009 |
Net premiums written (1) | $ | 414,908 | | $ | 424,827 | | $ | 459,571 | | (2.3 | )% | (7.6 | )% | $ | 551,923 |
| $ | 414,908 |
| $ | 424,827 |
| 33.0 | % | (2.3 | )% |
| Net premiums earned | $ | 420,373 | | $ | 435,677 | | $ | 465,581 | | (3.5 | ) | (6.4 | ) | $ | 533,771 |
| $ | 420,373 |
| $ | 435,677 |
| 27.0 |
| (3.5 | ) |
| Loss and loss settlement expenses | 289,437 | | 365,721 | | 393,349 | | (20.9 | ) | (7.0 | ) | 407,831 |
| 289,437 |
| 365,721 |
| 40.9 |
| (20.9 | ) |
| Amortizatio n of deferred policy acquisition costs | 102,636 | | 105,606 | | 117,590 | | (2.8 | ) | (10.2 | ) | |
| Amortization of deferred policy acquisition costs | | 143,952 |
| 100,310 |
| 105,606 |
| 43.5 |
| (5.0 | ) |
| Other underwriting expenses | 28,003 | | 30,553 | | 19,146 | | (8.3 | ) | 59.6 | | 46,404 |
| 30,329 |
| 30,553 |
| 53.0 |
| (0.7 | ) |
| Underwriting income (loss) | $ | 297 | | $ | (66,203 | ) | $ | (64,504 | ) | 100.4 | % | (2.6 | )% | $ | (64,416 | ) | $ | 297 |
| $ | (66,203 | ) | NM |
| 100.4 | % |
| | | | | |
| Investment income, net | 34,787 | | 31,542 | | 33,452 | | 10.3 | % | (5.7 | )% | 35,513 |
| 34,787 |
| 31,542 |
| 2.1 | % | 10.3 | % |
| Realized investment gains (losses) | | | | | |
| Other-than-temporary impairment charges | (153 | ) | (9,824 | ) | (960 | ) | 98.4 | | NM | | — |
| (153 | ) | (9,824 | ) | 100.0 |
| 98.4 |
|
| Other realized gains, net | 3,746 | | 3,009 | | 2,839 | | 24.5 | | 6.0 | | 3,081 |
| 3,746 |
| 3,009 |
| (17.8 | ) | 24.5 |
|
| Total realized investment gains (losses) | 3,593 | | (6,815 | ) | 1,879 | | 152.7 | | NM | | 3,081 |
| 3,593 |
| (6,815 | ) | (14.2 | ) | 152.7 |
|
| Other income (loss) | 147 | | 194 | | (55 | ) | (24.2 | ) | NM | | |
| Other income | | 1,592 |
| 147 |
| 194 |
| NM |
| (24.2 | ) |
Disaster charges and other related expenses,
net of recoveries | (16 | ) | (1,335 | ) | 7,202 | | (98.8 | ) | 118.5 | | — |
| (16 | ) | (1,335 | ) | 100.0 |
| 98.8 |
|
| Income (loss) before income taxes | $ | 38,840 | | $ | (39,947 | ) | $ | (36,430 | ) | 197.2 | % | (9.7 | )% | $ | (24,230 | ) | $ | 38,824 |
| $ | (39,947 | ) | (162.4 | )% | 197.2 | % |
NM = not meaningful
| |
| (1) | The Statutory Financial MeasuresMeasurement of Results section of this report defines data prepared in accordance with statutory accounting practices, which is a comprehensive basis of accounting other than U.S. GAAP. |
United Fire & Casualty CompanyGroup, Inc. Form 10-K | 20102011
| | | | | | | | | | | | | | |
| | | | | | | | Increase (Decrease) in Ratios |
| | | | | | | | 2010 | | 2009 |
| Years ended December 31 | 2010 | | 2009 | | 2008 | | vs. 2009 | | vs. 2008 |
| GAAP combined ratio: | | | | | | | | | |
Net loss ratio (without catastrophes and Hurricane
Katrina development) | 62.2 | % | | 70.1 | % | | 65.9 | % | | (11.3 | )% | | 6.4 | % |
| Hurricane Katrina litigation – effect on net loss ratio | 2.0 | | | 8.7 | | | 2.3 | | | (77.0 | ) | | NM | |
| Other catastrophes – effect on net loss ratio | 4.7 | | | 5.1 | | | 16.3 | | | (7.8 | ) | | (68.7 | ) |
| Net loss ratio | 68.9 | % | | 83.9 | % | | 84.5 | % | | (17.9 | )% | | (0.7 | )% |
Expense ratio (1) | 31.0 | | | 31.3 | | | 29.4 | | | (1.0 | ) | | 6.5 | |
Combined ratio (2) | 99.9 | % | | 115.2 | % | | 113.9 | % | ; | (13.3 | )% | | 1.1 | % |
| Statutory combined ratio: | | | | | | | | | |
Net loss ratio (without catastrophes and Hurricane
Katrina development) | 62.2 | % | | 70.1 | % | | 66.0 | % | | (11.3 | )% | | 6.2 | % |
| Hurricane Katrina litigation – effect on net loss ratio | 2.0 | | | 8.7 | | | 2. 3 | | | (77.0 | ) | &nb sp; | NM | |
| Other catastrophes – effect on net loss ratio | 4.7 | | | 5.1 | | | 16.3 | | | (7.8 | ) | | (68.7 | ) |
| Net loss ratio | 68.9 | % | | 83.9 | % | | 84.6 | % | | (17.9 | )% | | (0.8 | )% |
Expense ratio (1) | 31.0 | | | 30.3 | | | 28.8 | | | 2.3 | | | 5.2 | |
Combined ratio (2) | 99.9 | % | | 114.2 | % | | 113.4 | % | | (12.5 | )% | | 0.7 | % |
Industry statutory combined ratio: (3) | | | | | | | | | |
| Net loss ratio | 74.5 | % | | 72.7 | % | | 77.1 | % | | 2.5 | % | | (5.7 | )% |
Expense ratio (1) | 28.5 | | | 28.5 | | | 28.0 | | | — | | | 1.8 | |
Combined ratio (2) | 103.0 | % | | 101.2 | % | | 105.1 | % | | 1.8 | % | | (3.7 | )% |
Combined ratio (without catastrophes) (2) | 98.0 | % | | 97.8 | % | | 98.8 | % | | 0.2 | % | ; | (1.0 | )% |
|
| | | | | | | | | | | | | | |
| | | | | | | | Increase (Decrease) in Ratios |
| | | | | | | | 2011 | | 2010 |
| Years ended December 31 | 2011 | | 2010 | | 2009 | | vs. 2010 | | vs. 2009 |
| GAAP combined ratio: | | | | | | | | | |
| Net loss ratio (without catastrophes) | 61.3 | % | | 64.2 | % | | 78.8 | % | | (4.5 | )% | | (18.5 | )% |
| Catastrophe losses - effect on net loss ratio | 15.1 |
| | 4.7 |
| | 5.1 |
| | 221.3 |
| | (7.8 | ) |
| Net loss ratio | 76.4 | % | | 68.9 | % | | 83.9 | % | | 10.9 | % | | (17.9 | )% |
Expense ratio (1) | 35.7 |
| | 31.0 |
| | 31.3 |
| | 15.2 |
| | (1.0 | ) |
| Combined ratio | 112.1 | % | | 99.9 | % | | 115.2 | % | | 12.2 | % | | (13.3 | )% |
Statutory combined ratio:(2) | | | | | | | | | |
| Net loss ratio (without catastrophes) | 61.3 | % | | 64.2 | % | | 78.8 | % | | (4.5 | )% | | (18.5 | )% |
| Catastrophe losses - effect on net loss ratio | 15.1 |
| | 4.7 |
| | 5.1 |
| | 221.3 |
| | (7.8 | ) |
| Net loss ratio | 76.4 | % | | 68.9 | % | | 83.9 | % | | 10.9 | % | | (17.9 | )% |
Expense ratio (1) | 32.2 |
| | 31.0 |
| | 30.3 |
| | 3.9 |
| | 2.3 |
|
| Combined ratio | 108.6 | % | | 99.9 | % | | 114.2 | % | | 8.7 | % | | (12.5 | )% |
Industry statutory combined ratio: (2)(3) |
| |
| |
| | | | |
| Net loss ratio | 79.1 | % | | 72.0 | % | | 70.8 | % | | 9.9 | % | | 1.7 | % |
Expense ratio (1) | 28.4 |
| | 29.0 |
| | 28.7 |
| | (2.1 | ) | | 1.0 |
|
| Combined ratio | 107.5 | % | | 101.0 | % | | 99.5 | % | | 6.4 | % | | 1.5 | % |
| Combined ratio (without catastrophes) | 97.4 | % | | 96.4 | % | | 96.1 | % | | 1.0 | % | | 0.3 | % |
NM = not meaningful
| |
(1)&n bsp; | Includes policyholder dividends. |
| |
| (2) | The Statutory Financial MeasuresMeasurement of Results section of this report defines data prepared in accordance with statutory accounting practices, which is a comprehensive basis of accounting other than U.S. GAAP. |
| |
| (3) | A.M. Best Company estimate. |
Our property and casualty insurance segment reported pre-tax losses of $24.2 million and $39.9 million in 2011 and 2009, respectively, compared to pre-tax income of $38.8 million in 2010 compared to pre-tax losses of $39.9 million and $36.4 million in 2009 and 2008, respectively. While a slow economic recovery and ongoing competition continued to affect our commercial lines, we achieved slight increases. The deterioration in our personal lines rates. Additionally,2011 results is due to an increase in loss and loss settlement expenses primarily from catastrophe losses and one-time acquisition-related costs and other expenses associated with our acquisition of Mercer Insurance Group, as explained in more detail throughout this section.
In 2010, our loss and loss settlement expenses decreased by 20.9 percent or $76.3 million from 2009 due in large part to our prior year’s claim experience.the adverse reserve development experienced in 2009. A decrease in non-catastrophe claims severity, accompanied by a slight decrease in frequency in 2010, also contributed to the reduction in losses and loss settlement expenses.
Other underwriting expenses decreased 8.30.7 percent in 2010, primarily as the result of a higher level of deferrable underwriting expenses in 2010 as compared to 2009. However, included in this line arewere transaction costs totaling $1.2 million that were incurred during the fourth quarter ofin 2010 related to our planned acquisition of Mercer Insurance Group, Inc. (“Mercer”). For further discussion of this planned acquisition, see the “Liquidity and Capital Resources” section contained in this item.Group.
Our 2009 results were negatively impacted by a decline in net premiums written and earned due to the weak economy. Additionally, in 2009, we incurred OTTI ch argescharges of $9.8 million and $38.0 million in adverse development from Hurricane Katrina, which impacted our pre-tax earnings. Our 2008 results were negatively impacted by the significant number of catastrophe losses we experienced that year, along with an increase in the severity of non-catastrophe losses and the impact of competitive market conditions on pricing.
United Fire & Casualty CompanyGroup, Inc. Form 10-K | 20102011
Premiums
The following table shows our premiums written and earned for 20102011, 20092010 and 20082009:
| | | | | | | | | | | % Change | | | | | | | % Change |
| (In Thousands) | | | | | | | | 2010 | | 2009 | | | | | | | 2011 | | 2010 |
| Years ended December 31 | | 2010 | | 2009 | | 2008 | | vs. 2009 | | vs. 2008 | 2011 | | 2010 | | 2009 | | vs. 2010 | | vs. 2009 |
| Direct premiums written | | $ | 435,706 | | | $ | 454,046 | | | $ | 484,038 | | | (4.0 | )% | | (6.2 | )% | $ | 580,890 |
| | $ | 435,706 |
| | $ | 454,046 |
| | 33.3 | % | | (4.0 | )% |
| Assumed premiums written | | 11,713 | | | 7,820 | | | 12,660 | | | 49.8 | | | (38.2 | ) | 14,954 |
| | 11,713 |
| | 7,820 |
| | 27.7 |
| | 49.8 |
|
| Ceded premiums written | | (32,511 | ) | | (37,039 | ) | | (37,127 | ) | &n bsp; | (12.2 | ) | | (0.2 | ) | (43,921 | ) | | (32,511 | ) | | (37,039 | ) | | 35.1 |
| | (12.2 | ) |
Net premiums written (1) | | $ | 414,908 | | | $ | 424,827 | | | $ | 459,571 | | | (2.3 | )% | | (7.6 | )% | $ | 551,923 |
| | $ | 414,908 |
| | $ | 424,827 |
| | 33.0 | % | | (2.3 | )% |
| Net premiums earned | | 420,373 | | | 435,677 | | | 465,581 | | | (3.5 | ) | | (6.4 | ) | 533,771 |
| | 420,373 |
| | 435,677 |
| | 27.0 |
| | (3.5 | ) |
| |
| (1) | The Statutory Financial MeasuresMeasurement of Results section of this report defines data prepared in accordance with statutory accounting practices, which is a comprehensive basis of accounting other than U.S. GAAP. |
Net Premiums Written
Net premiums written comprise direct and assumed premiums written, less ceded premiums written. Direct premiums written are the total policy premiums, net of cancellations, associated with policies issued and underwritten by our property and casualty insurance segment. Assumed premiums written are the total premiums associated with the insurance risk transferred to us by other insurance and reinsurance companies pursuant to reinsurance contracts. Ceded premiums written is the portion of direct premiums written that we cede to our reinsurers under our reinsurance contracts. Net premiums earned are recognized over the life of a policy and differ from net premiums written, which are recognized on the effective date of the policy.
Direct Premiums Written
Direct premiums written increased $145.2 million in 2011, of which $115.3 million resulted from our acquisition of Mercer Insurance Group. The remaining $29.9 million reflects low-to mid-single-digit rate increases across all lines, along with growth from internal initiatives we implemented at the beginning of 2011.
In our commercial lines, competitive market conditions eased during 2011, although not equally among all regions. New business increased by $15.7 million over 2010. All regions continued to see commercial lines policy cancellations, though at a declining rate, due to insureds going out of business. In our personal lines, pricing continued to improve during 2011, continuing a trend that began over two years ago. In both our commercial and personal lines, policy retention rates remained strong with approximately 82.0 percent of our policies renewing.
Direct premiums written decreased in 2010 as a slow recovery continued to affect the economy and potential commercial lines policyholders. Cancellations due to non-payment and/or companies going out of business contributed to the decline, while ongoing competition in a soft insurance market also continued to have an impact on our business. In the fourth quarter of 2010, we slightly reduced our commercial lines renewal pricing levels in order to retain quality accounts, keeping approximately 80.0 percent of our accounts, which is in line with our retention goals. However, new business pricing remained unchanged.
In 2010, we hired an outside insurance consultant to conduct a study, on our behalf, of strategic growth opportunities in the property and casualty industry that we could potentially use in the future as a means for generating additional revenue. Management has evaluated the findings from the study and are now engaged in determining if and when we will execute growth strategies.
In 2009, direct premiums written decreased due towere negatively impacted by continued competition and the weak economy. Also contributing to the reduction in direct premiums written in 2009, waseconomy along with the nonrenewal of accounts that no longer met our underwriting or pricing guidelines.
The insurance marketplace remained competitive in our commercial lines of business in 2009. We experienc ed a less than 1.0 percent decrease in our commercial lines premium level in the fourth quarter of 2009, reflecting a continuation of a trend of gradual decreases in premium level for some lines of business dating back to the third quarter of 2004. In our personal lines business, we averaged low- to mid-single-digit percentage increases in premium level for our homeowner and personal auto lines of business in late 2009.
Our policy retention rate in both the personal and commercial lines of business was approximately 80.0 percent in 2009, which was a slight decrease from 2008, as our underwriters continued to focus on writing good business at an adequate price, preferring quality to volume. Despite continued competition, particularly on medium and large commercial accounts, we were able to renew a select number of accounts at a higher rate/premium level in 2009 as compared to 2008.
United Fire & Casualty Company Form 10-K | 2010
Assumed Premiums Written
In 2010,2011, we increased our participation on one active contract, while renewing all other active contracts. Our increased participation and pricing increases in assumed business, whichrecent years led to the increase in assumed premiums written forin both
United Fire Group, Inc. Form 10-K | 2011
2011 and 2010. For 2012, using the year. The decrease in 2009 was attributable to the termination of oneresults of our assumed reinsurance contracts and our reduced participation level on another contract. Also contributing to the decline in 2009 and 2008 was some of our assumed business in early 2009 that had been in run-off since late 20 06.
For 2011,catastrophe expense analysis we have renewed our participation levels in all of our active assumed programs, while increasingwith the exception of one contract for which we decreased our participation level on one contract.level.
Ceded Premiums Written
Direct and assumed premiums written are reduced by the ceded premiums that we pay to reinsurers. For 2011, the increase in ceded premiums written is primarily related to our acquisition of Mercer Insurance Group. The reduction in ceded premiums written in 2010 as compared to 2009 and 2008 was due to the lower level of direct premiums written, which also affected the premiums we pay for our property catastrophe reinsurance program.
For 2011,We consolidated both Mercer Insurance Group's non-catastrophe and catastrophe reinsurance programs into our programs, effective January 1, 2012, resulting in increased coverage for Mercer Insurance Group and an expected cost savings of $1.5 million because of synergies. The change in programs increased Mercer Insurance Group's catastrophe protection from $55.0 million to $200.0 million and increased their catastrophe retention from $5.0 million to $20.0 million. Mercer Insurance Group's non-catastrophe retention was increased from $1.0 million to $2.0 million. We had no other significant changes to coverage, limits, or retentions for our catastrophe or non-catastrophe programs.
In comparison, the renewal pricing for our 2011 non-catastrophe reinsurance program, which excludes our property catastrophe program increased approximately 4.0 percent due to losses in 2010, in the first and second layers of our casualty program. Our cata strophecatastrophe reinsurance program pricing decreased approximately 8.0 percent because of the soft market conditions and because we had no losses to the program during 2010. We had no significant changes to coverage, limits, or retentions for our catastrophe or non-catastrophe programs. 2010.
The renewal pricing for our 2010 non-catastrophe reinsurance program experienced a slight decrease due to the inclusion of umbrella coverage under the non-catastrophe program rather than maintaining it as a separate program. The renewal for our 2010 catastrophe reinsurance program also decreased as the soft market conditions impacted catastrophe reinsurance pricing.
For 2009, the renewals for both our catastrophe and non-catastrophe reinsurance programs increased slightly. The increase in our catastrophe program was a result of the active hurricane season in the United States during 2008, which included Hurricanes Ike and Gustav.
Losses and Loss Settlement Expenses
Catastrophe LossesExposures
Catastrophe losses are inherent risks of the property and casualty insurance business. Catastrophic events and natural disasters include, without limit ation,limitation, hurricanes, tornadoes, earthquakes, hailstorms, wildfires, high winds, winter storms and other natural disasters. We also face man-made exposures to losses resulting from, without limitation, acts of war, acts of terrorism and political instability. Such events result in insured losses that can be, and may continue to be, a material factor in our results of operations and financial position. Additionally, sinceposition, as the extent of losses from a catastrophe is a function of both the total amount of insured exposure in an area affected by the event and the severity of the event. Because the level of insured losses that may occur in any one year cannot be accurately predicted, these losses contribute to fluctuations in our year-to-year results of operations and financial position. Some types of catastrophes are more likely to occur at certain times within the year than others, which adds an element of seasonality to our property and casualty insurance claims. The frequency and severity of catastrophic events are difficult to accurately predict in any year. However, some geographic locations are more susceptible to these events than others.
We have endeavored to control our direct insurance exposures in certain regions that are prone to naturally occurring catastrophic events through a combination of geographic diversification, restrictions on the amount and location of new business production in such regions, and reinsurance. We regularly assess our concentration of risk exposures in natural catastrophe exposed areas; we have strategies and underwriting standards to manage these exposures through individual risk selection, subject to regulatory constraints, and through the purchase of catastrophe reinsurance coverage. We use catastrophe modeling and a risk concentration management tool to monitor and control our accumulations of potential losses in natural catastrophe exposed areas of the United States, such as California and the Gulf and East Coasts, as well as in natural catastrophe exposed areas of other countries. The information provided by the catastrophe modeling and the risk concentration management tool has resulted in our nonrenewal of
United Fire Group, Inc. Form 10-K | 2011
some accounts and refraining from writing others.
A new version of a third-party catastrophe modeling tool that we and others in the insurance industry utilize for estimating potential losses from natural catastrophes was released in 2011. Overall, the model is indicating higher risk estimates for our exposure to hurricanes in the United States, but the impact of the new model on our book of business varies significantly among the regions that we model for hurricanes. Based on our analysis, and the indications of other catastrophe models, we have begun to implement more targeted underwriting and rate initiatives in some regions. We will continue to take underwriting actions and/or purchase additional reinsurance to reduce our exposure as we believe is warranted.
Catastrophe modeling generally relies on multiple inputs based on experience, science, engineering and history, and the selection of those inputs requires a significant amount of judgment. The modeling results may also fail to account for risks that are outside the range of normal probability or are otherwise unforeseen. Because of this, actual results may differ materially from those derived from our modeling exercises.
Despite our efforts to manage our catastrophe exposure, the occurrence of one or more severe natural catastrophic events in heavily populated areas could have a material effect on our results of operations, financial condition or liquidity.
The process of estimating and establishing reserves for catastrophe losses incurred from catastrophic events is inherently uncertain and the actual ultimate cost of a claim, net of reinsurance recoveries, may vary materially from the estimated amount reserved. Although we reinsure a portion of our exposure, reinsurance may prove to be inadequate if a major catastrophic event exceeds our reinsurance limits or if we experience a number of small catastrophic events that individually fall below our reinsurance retention level.
United Fire & Casualty Company Form 10-K | 2010
Hurricane Katrina
Hurricane Katrina made landfall in New Orleans, on August 29, 2005, causing an estimated $80.0 billion in damages. Over 95.0 percent of our policyholders in the New Orleans area suffered damage from Hurricane Katrina, with over 11,000 claims reported; we have concluded 97.6 percent of those claims as of December 31, 2010. Our loss and loss settlement expenses inception to date (net of reinsurance) attributable to Hurricane Katrina totaled $297.5 million as of December 31, 2010, of which $8.6 million was incurred in 2010 due to adverse claims litigation. In 2010, we continued to settle unresolved litigation related to Hurricane Katrina, concluding over 55.0 percent of the claims that were in litigation as of December 31, 2009. Our 2010 combined ratio was impacted 2.0 percent by Hurricane Katrina loss development compared to 8.7 percent and 2.3 percent for 2009 and 2008, respectively.Catastrophes Losses
In 2009 and 2008, adverse development from Hurricane Katrina resulted in losses of $38.0 million and $26.6 million, respectively.
Since the occurrence of Hurricane Katrina in 2005, we have focused on reducing our risk exposure in southern Louisiana by decreasing the number of insured properties, raising rates and purchasing additional reinsurance coverage.
In January 2010, we ceased renewing policies or writing new business in the State of Louisiana through Lafayette Insurance Company and began to provide personal and commercial insurance coverage under United Fire & Casualty Company and our subsidiary, United Fire & Indemnity Company.
Ot her Catastrophes
In 20102011, our pre-tax catastrophe losses, withoutnot including adverse development from Hurricane Katrina claims litigation, were $19.880.8 million. In comparison, our 20092010 and 20082009 pre-tax catastrophe losses were $22.419.8 million and $76.122.4 million, respectively. Our 2011 losses were the result of several large natural disasters in both our direct business and assumed reinsurance business. The losses in our direct business totaled $59.7 million and resulted from a string of devastating tornadoes that tore through the southern states in April 2011, followed by storms that included a multiple-vortex tornado that destroyed Joplin, Missouri in May 2011. In 2008July 2011, a powerful, long-lasting straightline windstorm known as a derecho hit Iowa, and in August 2011, Hurricane Irene impacted our East Coast policyholders. Our assumed reinsurance business contributed $21.1 million of catastrophe losses from prior year development and current year losses as a result of natural disasters (i.e., the portion of these losses attributable to adverse development from Hurricane Katrina that was not related to claims litigation was $15.8 million. earthquakes and tsunamis) in New Zealand and Japan.
Our 2010 losses were the result of 26 new catastrophes with our largest single pre-tax catastrophe loss totaling $2.5 million. That loss was the result of a hailstorm that primarily affected the state of Colorado, but also impacted some areas in Wyoming, South Dakota and Nebraska.
For In 2009,, we also experienced 26 new catastrophe losses,catastrophes, with our largest single loss coming from a Midwest storm that caused wind and hail damage andthat resulted in a pre-tax lossesloss totaling $3.6 million. In 2008, we experienced our second highest year for catastrophe losses in the past decade, with losses from 34 new catastrophe events. Our largest losses during 2008 were related to Hurricane Ike ($20.2 million) and Hurricane Gustav ($15.8 million).
Catastrophe Reinsurance
Our 2010In 2011, only Mercer Insurance Group exceeded their $5.0 million catastrophe reinsurance programs remained relatively unchangedretention due to losses incurred from our 2009 programs. Neither terms and conditions nor pricing were materially different.Hurricane Irene. In both 2010 and 2009, we did not exceed our catastrophe retention of $20.0 million. However,Effective January 1, 2012, Mercer Insurance Group is included in2008, we exceeded our catastrophe retention of $20.0 million with Hurricane Ike, and recorded $2.4 million in ceded losses recoverable from that catastrophe.reinsurance program.
Our planned reduction in southern Louisiana that began after Hurricane Katrina haswas completed in 2011 and reduced our estimated 100-year maximum probable loss by over 60.0 percent as of December 31, 2010.percent. To maintain profitability of our remaining southern Louisiana business, we have employed portfolio optimizing techniques (i.e., proximity to the coast, type of construction, the reduction of geographic risk concentration and higher deductibles) to reduce the impact of any one future catastrophe. As an example
United Fire Group, Inc. Form 10-K | 2011
In 2011, we developed earthquake underwriting guidelines to significantly decrease our earthquake exposure in the New Madrid fault area of the effectivenessMidwest. The guidelines were implemented with most agents in the New Madrid fault area in July 2011. The reduction in exposure has occurred through business being non-renewed, moved by the agent, the use of sublimits rather than using full earthquake limits, and a waiver signed by the insured rejecting earthquake coverage. As of December 31, 2011, our risk-reduct ion efforts, we estimate that we incurred $12.8earthquake exposure has been reduced by $111.2 million, less in losses relatedwith an ultimate reduction goal of $405.4 million to Hurricane Gustav in 2008 than we would have if we had not undertaken these measures.be accomplished by the end of 2013.
We use many reinsurers, both domestic and foreign, which helps us to avoid concentrations of credit risk associated with our reinsurance. All reinsurers we do business with must meet the following minimum criteria: capital and surplus of at least $250.0 million and an A.M. Best rating of at least “A-” or an S&P rating of at least “A-.” If a reinsurer is rated by both rating agencies, then both ratings must be at least an “A-.”
United Fire & Casualty Company Form 10-K | 2010
The following table represents the primary reinsurers we utilize and their financial strength ratings as of December 31, 20102011:
|
| | |
| Name of Reinsurer | A.M. Best | S&P Rating |
| Arch Reinsurance Company | A+ | A+ |
| Argo Re Ltd | A | A+N/A |
| FM Global Group | A+ | N/A |
Hannover Rueckversicherung AG (1) (2) | A | AA- |
Lloyds SyndicatesLloyd's | A | A+ |
Paris Re (2)
| A | AA- |
Partner Re (1) (2)
| A+ | AA- |
Platinum Underwriters Reinsurance, Inc.Inc | A | AA- |
QBE Reinsurance Corporation (1) | A | A+ |
R&V Versicherung AG (2) | N/A | A+AA- |
RenaissanceSCOR Reinsurance LtdCompany | A+A | AA-A |
| Tokio Millennium Re Ltd | A++ | AAAA- |
| |
(1) &nb sp; | Primary insurers participating on the property and casualty excess of loss programs. |
| |
| (2) | Primary insurers participating on the surety excess of loss program. |
Refer to Part II, Item 8, Note 54 “Reinsurance” for further discussion of our reinsurance programs.
Terrorism Coverage
The Terrorism Risk Insurance Program Reauthorization Act of 2007 (“TRIPRA”) was signed into law on December 27, 2007. TRIPRA coverage includes most direct commercial lines of business, including coverage for losses from nuclear, biological and chemical exposures if coverage was afforded by an insurer, with exclusions for commercial automobile insurance, burglary and theft insurance, surety, professional liability insurance and farm owners multiple peril insurance. Under TRIPRA, each insurer has a deductible amount, which is 20.0 percent of the prior year’s direct commercial lines earned premiums for the applicable lines of business, and retention of 15.0 percent above the deductible. No insurer that has met its deductible shall be liable for the payment of any portion of that amount that exceeds the annual $100.0 trillion aggregate loss cap specified in TRIPRA. TRIPRA provides marketplace stability. As a result, coverage for terrorist events in both the insurance and reinsurance markets is often available. The amount of aggregate losses necessary for an act of terrorism to be certified by the U.S. Secretary of Treasury, the Secretary of State and the Attorney General was $100.0 million for 20102011 and remains the same for 20112012. Our TRIPRA deductible was $60.2$55.9 million for 20102011 and our TRIPRA deductible will be $55.9$78.2 million for 20112012. Our catastrophe and non-catastrophe reinsurance programprograms provide limited coverage for terrorism exposure excluding nuclear, biological and chemical relatedchemical-related claims.
Non-Catastrophe Losses and Reserve Development
Workers’ compensation insurance and other liability insurance are considered to be long-tail lines of business due to the length of time that may elapse before claims are finally settled. Therefore, we may not know our final development on individual claims for many years. Our e stimatesestimates for losses, particularly in these long-tail lines, are dependent upon many factors, such as the legal environment, inflation and medical costs. We consider all of these
United Fire Group, Inc. Form 10-K | 2011
factors, as well as others, in estimating our loss reserves. As conditions or trends with respect to these factors change, we change our estimate for loss reserves accordingly. Refer to “Critical Accounting Estimates” in this section for a more detailed discussion of our property and casualty insurance segment’s loss and loss settlement expenses reserves.
We experienced favorable development in all lines of business with the exception of assumed reinsurance, which experienced a $4.6 million incurred loss as a result of development on 2010 catastrophe activity, and direct commercial multi peril, which experienced a slight deficiency. Our other liability and products liability lines had significant decreases in losses as a result of a lower level of required reserves for incurred but not reported ("IBNR") losses in 2011; a reduction in our legal expenses is a result of an initiative we implemented in 2009; and an overall improvement in our underwriting results.
2010 Results
United Fire & Casualty Company Form 10-K | 2010
2010 Results
In 2010, we saw an improvement in our loss and loss settlement expenses due to favorable reserve development of $45.9 million from prior year’s losses.$45.9 million. This level of development is consistent with our historical experience, excluding the impact of Hurricane Katrina. The 2010favorable development included $8.6 million in adverse development from Hurricane Katrina as a result of our continuing resolution of outstanding claims litigation.
We experienced favorable development in all lines of business with the exception of fire and allied lines, which experienced a slight deficiency, primarily due to Hurricane Katrina development.Katrina. Our workers’ compensation line had a significant decrease in losses as a result of a reduction in frequency as well as favorable reserve development on resolved cases. Additionally, we experienced an overall decrease in claims severity accompanied by a slight decrease in claims frequency, which contributed to the improvement.
2009 Results
In 2009, we increased our reserves on prior year losses partially due to an increase in late reported claims. In addition, we focused on establishing reserves for reported claims more quickly. Our other liability line of business had a significant increase in losses and loss settlement expenses as a result of unfavorable reserve development from the re-estimation o f our recorded reserves, a slight increase in severity as a result of larger jury awards and continuing construction defect claims and loss settlement expenses. Overall, claims frequency decreased. Claims severity also flattened for a majority of lines, with a slight increase in certain liability lines, specifically automobile and other liability as compared to 2008.
Overall, we experienced a net deficiency in our prior year reserves of $26.2$26.2 million for 2009.2009. The major components of this deficiency were the deterioration in our other liability lines of business, which resulted in a deficiency in these lines of $21.8 million, and adverse development from Hurricane Katrina claims and litigation totaling $38.0$38.0 million,, which resulted in a deficiency in the fire and allied lines of business of $16.9 million.
2008 Results
Late in 2008, we began a corporate-wide audit of our reported large claim losses to analyze the increase in severity that we experienced in 2008. While we were satisfied with the results of the audit, our review resulted in the modification of certain underwriting guidelines. Examples of such modifications include an increase in the number of commercial accounts serviced by our loss control unit, the development of a new safety class for insureds, a decline in certain classes of commercial business that were no longer profitable and the introduction of some pricing increases.
We also increased our case reserves on prior year’s losses, which result ed in a net deficiency of $0.5 million for 2008. The primary cause of our net deficiency in 2008 was the $26.6 million in adverse development from Hurricane Katrina. The Hurricane Katrina-related losses contributed to a deficiency in the fire and allied lines of business of $12.2 million.
Also contributing to our net deficiency in prior year reserves was an increase in general liability losses, which impacted our other an d products liability lines of business. Claims for construction defect losses are included in the products liability line of business. Incurred losses from construction defect claims for prior years were $7.7 million in 2008. These losses contributed to a deficiency in the other liability and products liability lines of business totaling $5.8 million.
Other changes in loss development included prior year reserve redundancies in the following lines of business: commercial auto liability ($3.2 million), workers’ compensation ($7.2 million) and assumed reinsurance ($5.2 million).
United Fire & Casualty CompanyGroup, Inc. Form 10-K | 20102011
Reser ve
Reserve Development
The following table illustrates the major components of the net redundancy (deficiency) we experienced in our reserves for 20102011, 20092010 and 20082009:
| | | (In Thousands) | | | | | | | | | | | |
| Years ended December 31 | | 2010 | | 2009 | | 2008 | 2011 | | 2010 | | 2009 |
| Savings from: | | | | | | | | | | | |
| Salvage and subrogation | | $ | 4,070 | | | $ | 5,968 | | | $ | 7,099 | | $ | 4,905 |
| | $ | 4,070 |
| | $ | 5,968 |
|
| Estimated alternative dispute resolution | | 11,182 | | | 12,957 | | | 7,352 | | 10,129 |
| | 11,182 |
| | 12,957 |
|
| Workers’ compensation medical bill review | | 3,830 | | | 3,516 | | | 3,477 | | 5,225 |
| | 3,830 |
| | 3,516 |
|
| Other | | 35,372 | | | (10,680 | ) | | 8,152 | | 47,364 |
| | 35,372 |
| | (10,680 | ) |
| Net redundancy excluding Hurricane Katrina | | 54,454 | | | 11,761 | | | 26,080 | | 67,623 |
| | 54,454 |
| | 11,761 |
|
| Adverse development from Hurricane Katrina | | (8,576 | ) | | (37,976 | ) | | (26,628 | ) | (6,528 | ) | | (8,576 | ) | | (37,976 | ) |
| Net redundancy (deficiency) | | $ | 45,878 | | | (26,215 | ) | | $ | (548 | ) | $ | 61,095 |
| | 45,878 |
| | $ | (26,215 | ) |
Salvage is the sale of damaged goods, for which the insured has been indemnified and for which the insured has transferred title to the insurance company. Salvage reduces the cost incurred for property losses. Subrogation also reduces the costs incurred for a loss by seeking payment from other parties involved in the loss and/or from the other parties’ insurance company. Alternative dispute resolution facilitates settlements and reduces defense and legal costs through processes such as mediation and arbitration. Workers’ compensation medical bill review is a system designed to detect duplicate billings, unrelated and unauthorized charges, and coding discrepancies. It also ensures that we are billed for medical services according to the fee schedule designated by each state in which we have claims.
Our “other” redundancy (deficiency) is attributable to both the payment of claims in amounts other than the amounts reserved and changes in reserves due to additional information on individual claims that we received after the reserves for those claims had been established. The additional information we consider is unique to each claim. Such information may include facts that reveal we have no coverage obligation for a particular claim, changes in applicable laws that reduce or increase our liability or coverage exposure on a particular claim, fact sfacts that implicate other parties as being liable on a particular claim and favorable or unfavorable court rulings that changes our liability for a particular claim. Also, additional information relating to severity is unique to each claim. For example, we may learn during the course of a claim that bodily injuries may be less or more severe than originally believed or that damage to a structure is merely cosmetic instead of structural.
United Fire & Casualty CompanyGroup, Inc. Form 10-K | 20102011
Net Loss Ratios by Line
The following table depicts our net loss ratio for 20102011, 20092010 and 20082009:
| | | Years ended December 31 | 2010 | | 2009 | | 2008 | 2011 | | 2010 | | 2009 |
| (In Thousands) | Net Premiums Earned | | Net Losses and Loss Settlement Expenses Incurred | | Net Loss Ratio | | Net Premiums Earned | | Net Losses and Loss Settlement Expenses Incurred | | Net Loss Ratio | | Net Premiums Earned | | Net Losses and Loss Settlement Expenses Incurred | | Net Loss Ratio | Net Premiums Earned | | Net Losses and Loss Settlement Expenses Incurred | | Net Loss Ratio | | Net Premiums Earned | | Net Losses and Loss Settlement Expenses Incurred | | Net Loss Ratio | | Net Premiums Earned | | Net Losses and Loss Settlement Expenses Incurred | | Net Loss Ratio |
| Commercial lines | | | | | | | | | | ; | | | | | | | | | | | | | | | | | | | | | | | | |
| Other liability | $ | 113,555 | | | $ | 94,645 | | | 83.3 | % | | $ | 119,587 | | | $ | 119,200 | | | 99.7 | % | | $ | 134,429 | | | $ | 93,000 | | | 69.2 | % | $ | 159,977 |
| | $ | 75,589 |
| | 47.2 | % | | $ | 113,555 |
| | $ | 94,645 |
| | 83.3 | % | | $ | 119,587 |
| | $ | 119,200 |
| | 99.7 | % |
| Fire and allied lines | 98,673 | | | 78,174 | | | 79.2 | | | 102,265 | | | 100,436 | | | 98.2 | | | 109,217 | | | 134,060 | | | 122.7 | | 117,812 |
| | 123,418 |
| | 104.8 |
| | 98,673 |
| | 78,174 |
| | 79.2 |
| | 102,265 |
| | 100,436 |
| | 98.2 |
|
| Automobile | 93,160 | | | 66,946 | | | 71.9 | | | 97,948 | | | 75,123 | | | 76.7 | | | 101,229 | | | 72,384 | | | 71.5 | | 115,230 |
| | 84,221 |
| | 73.1 |
| | 93,160 |
| | 66,946 |
| | 71.9 |
| | 97,948 |
| | 75,123 |
| | 76.7 |
|
| Workers’ compensation | 45,174 | | | 27,238 | | | 60.3 | | | 51,992 | | | 41,283 | | | 79.4 | | | 52,792 | | | 41,434 | | | 78.5 | | 54,404 |
| | 47,153 |
| | 86.7 |
| | 45,174 |
| | 27,238 |
| | 60.3 |
| | 51,992 |
| | 41,283 |
| | 79.4 |
|
| Fidelity and surety | 19,113 | | | 3,133 | | | 16.4 | | | 21,354 | | | 1,838 | | | 8.6 | | | 22,244 | | | 4,105 | | | 18.5 | | 16,665 |
| | 1,349 |
| | 8.1 |
| | 19,113 |
| | 3,133 |
| | 16.4 |
| | 21,354 |
| | 1,838 |
| | 8.6 |
|
| Other | 804 | | | 1,048 | | | 130.3 | | | 854 | | | 214 | | | 25.1 | | | 858 | | | 438 | | | 51.0 | | 854 |
| | (410 | ) | | (48.0 | ) | | 804 |
| | 1,048 |
| | 130.3 |
| | 854 |
| | 214 |
| | 25.1 |
|
| Total commercial lines | $ | 370,479 | | | $ | 271,184 | | | 73.2 | % | | $ | 394,000 | | | $ | 338,094 | | | 85.8 | % | | $ | 420,769 | | | $ | 345,421 | | | 82.1 | % | $ | 464,942 |
| | $ | 331,320 |
| | 71.3 | % | | $ | 370,479 |
| | $ | 271,184 |
| | 73.2 | % | | $ | 394,000 |
| | $ | 338,094 |
| | 85.8 | % |
| | | | | | | | | | | | | | | | | | | | | | | | | | | | | | | | | | | |
| Personal lines | | | | | | | | | | | | | | | | | | | | | | | | | | | | | | | | | | |
| Fire and allied l ines | $ | 24,668 | | | $ | 13,850 | | | 56.1 | % | | $ | 22,317 | | | $ | 12,254 | | | 54.9 | % | | $ | 21,353 | | | $ | 34,195 | | | 160.1 | % | |
| Fire and allied lines | | $ | 36,027 |
| | $ | 36,086 |
| | 100.2 | % | | $ | 24,668 |
| | $ | 13,850 |
| | 56.1 | % | | $ | 22,317 |
| | $ | 12,254 |
| | 54.9 | % |
| Automobile | 14,616 | | | 12,642 | | | 86.5 | | | 13,053 | | | 10,725 | | | 82.2 | | | 12,603 | | | 11,701 | | | 92.8 | | 18,744 |
| | 15,542 |
| | 82.9 |
| | 14,616 |
| | 12,642 |
| | 86.5 |
| | 13,053 |
| | 10,725 |
| | 82.2 |
|
| Other | 447 | | | (916 | ) | | (204.9 | ) | | 365 | | | 662 | | | 181.4 | | | 326 | | | 472 | | | 144.8 | | 797 |
| | 97 |
| | 12.2 |
| | 447 |
| | (916 | ) | | (204.9 | ) | | 365 |
| | 662 |
| | 181.4 |
|
| Total personal lines | $ | 39,731 | | | $ | 25,576 | | | 64.4 | ;% | | $ | 35,735 | | | $ | 23,641 | | | 66.2 | % | | $ | 34,282 | | | $ | 46,368 | | | 135.3 | % | $ | 55,568 |
| | $ | 51,725 |
| | 93.1 | % | | $ | 39,731 |
| | $ | 25,576 |
| | 64.4 | % | | $ | 35,735 |
| | $ | 23,641 |
| | 66.2 | % |
| Reinsurance assumed | $ | 10,163 | | | $ | (7,323 | ) | | (72.1 | )% | | $ | 5,942 | | | $ | 3,986 | | | 67.1 | % | | $ | 10,530 | | | $ | 1,560 | | | 14.8 | % | $ | 13,261 |
| | $ | 24,786 |
| | 186.9 | % | | $ | 10,163 |
| | $ | (7,323 | ) | | (72.1 | )% | | $ | 5,942 |
| | $ | 3,986 |
| | 67.1 | % |
| Total | $ | 420,373 | | | $ | 289,437 | | | 68.9 | % | | $ | 435,677 | | | $ | 365,721 | | | 83.9 | % | | $ | 465,581 | | | $ | 393,349 | | | 84.5 | % | $ | 533,771 |
| | $ | 407,831 |
| | 76.4 | % | | $ | 420,373 |
| | $ | 289,437 |
| | 68.9 | % | | $ | 435,677 |
| | $ | 365,721 |
| | 83.9 | % |
United Fire & Casualty CompanyGroup, Inc. Form 10-K | 20102011
Commercial Lines
The net loss ratio in our commercial lines of business, excluding assumed reinsurance, improved to71.3 percent in 2011 from 73.2 percent in 2010 fromand 85.8 percent in 2009. Our acquisition of Mercer Insurance Group added 1.5 points to this ratio. For 2011, commercial lines without Mercer Insurance Group experienced a slight improvement, primarily in the other liability lines of business, that was somewhat offset by the fire and allied lines, as these lines were affected by a significant amount of catastrophe losses during the year.82.1 percent
The significant decrease in 2008, dueour net loss ratio in 2010 as compared to 2009 was the significantresult of a decrease in our loss and loss settlement expenses, for 2010 as compared to prior years, and in spite of the lower level of premiums earned during the year. The decrease occurred in our largest lines of business, other liability, fire and allied, automobile, and workers’ compensation, as a result of favorable reserve development, on our prior year’s claims experience, which is consistent with our historical level of development, excluding the impact of Hurricane Katrina.
The slow economic recovery during 2010 continued to affect potential commercial lines policyholders. In 2010, cancellations due to non-p ayment and/or companies going out of business contributed to the decline in our premium written and earned. Our profitability has also been impacted by ongoing competition in a soft commercial lines market in each of the last three years. In 2010 and 2009, we experienced a modest decrease in premium level, reflecting the continuation of a trend of gradual decreases in premium level for some lines of business dating back to the third quarter of 2004.
In 2009, the deterioration in our other liability lines was attributable toexperienced unfavorable reserve development from the re-estimation of certain of our recorded reserves and a slight increase in severity as a result of larger jury awards and continuing construction defect claims and loss sett lementsettlement expenses.
In 2008, our loss ratio was significantly impacted by pre-tax catastrophe losses totaling $54.5 million, which reflected our second highest year for catastrophe losses in the past decade. A portion of these losses was attributable to a $10.8 million judgment, net of reinsurance, for Hurricane Katrina litigation that was under appeal in 2008, but which we lost on appeal in 2009.
Commercial Fire and Allied Lines
Commercial fire and allied lines include fire, allied lines, commercial multiple peril and inland marine. The insurance covers l osseslosses to an insured’s property, including its contents, from weather, fire, theft or other causes. We provide this coverage through a variety of business policies.
The net loss ratio for our commercial fire and allied lines was 104.8 percent in 2011, 79.2 percent in 2010, and 98.2 percent in 2009 and .122.7 percent
The deterioration in 2008.2011 was due to the significant increase in catastrophe activity during the year as compared to 2010. The improvement in 2010 was due to a reduction in adverse development from Hurricane Katrina as compared to 2009, and a decrease in severity. The improvement in 2009 as compared to 2008 was primarily the result of a decrease in loss and loss settlement expenses due to lower catastrophe losses and a leveling off of severity. Without considering catastrophe losses, frequency did not change signifi cantly in 2009 from 2008.
In 2009, we took additional measures to address the increase in incurred losses in the commercial fire and allied lines of business, by implementing a number of underwriting initiatives that we anticipated would improve our loss experience. The following are the underwriting initiatives we undertook in 2009 and the progress we have made with them during 2010:
| |
• | In 2009, we continued the expansion of the loss control function in our Gu lf Coast and Denver regions. Our service account program, which provides at least annual loss control visits, was implemented for larger and/or more complex accounts. |
| |
• | In 2009, we continued expansion of the use of pre-surveys, where loss control makes a visit to applicant’s property, prior to quoting larger new business accounts. The use of pre-surveys helped all of our regions in 2010 to identify quality new business that we would like to write. |
| |
• | In 2009, we changed our underwriting guidelines to address issues noted in large loss audits. The result of this change was that underwriting guidelines now focus on older buildings and hazards from adjacent properties, such as vacancies and changing occupancies. We are reinspecting more older properties and also are taking the age of the building more into account in our rate structure for both renewals and new business. |
United Fire & Casualty Company Form 10-K | 2010
| |
• | In 2009, we continued to reduce our risk exposure in southern Louisiana by decreasing the number of insured properties and increasing our premium rates. Our risk exposure continued to decline in 2010 as we terminated relationships with seven agencies in the New Orleans area and did not renew accounts that no longer met our underwriting or pricing guidelines. |
| |
• | In 2009, we implemented CATography™ Underwriter, a new property underwriting tool that integrates hazard data for many perils, catastrophe modeling, interactive color-coded exposure mapping, and aerial photography into an intuitive dashboard screen, providing a complete overview of the risk landscape at a geocode or street address level. This tool has allowed us to identify risks with above-average exposure to weather, sinkhole, mine subsidence, storm surge, wildfire and earthquakes, on both new and renewal business. The information obtained allows us to adjust our premium levels and terms accordingly. In addition, the tool has enabled us to identify a small number of risks with favorable hazard characteristics that we otherwise might not have written. |
Premiums2011, premiums earned in these lines have decreased from $109.2 million in 2008increased to $102.3117.8 million, of which $19.2 million was related to our acquisition of Mercer Insurance Group. Without Mercer Insurance Group, the premiums earned in this line were flat.
2009In 2010 premiums earned in these lines decreased to $98.7 million in 2010. Ouras our premium writings continued to bewere affected by ongoing competition in a soft commericalcommercial lines market. In 2009, this led to a decline in both the residential housing market in our western states and in government-funded projects, as well as a reduction in the volume of business for the commercial and residential contractors that we insure. Also contributing to the reduction in direct premiums written for 2009 was the nonrenewal of accounts in 2009 that no longer met our underwriting or pricing guidelines. As pricing in the industry continued to decrease, we avoided accounts that became too underpriced for the risk.
In addition, since the occurrence of Hurricane Katrina in 2005, we have focused on reducing our risk exposure in southern Louisiana by, among other things, decreasing the number of insured properties and raising rates, which has led to a decline in premiums earned in recent years. In 2010, we reduced the number of insured properties by over 1 5.0 percent as compared to the number of insureds at December 31, 2009.
Other Liability
Other liability is business insurance covering bodily injury and property damage arising from general business operations, accidents on the insured’s premises and products manufactured or sold. We reported a net loss ratio in this line of 47.2 percent in 2011, 83.3 percent in 2010, and 99.7 percent in 2009 and 69.2 percent in 2008.
The other liability line experienced a slight increase in premiums earned in 2011 as compared to 2010, which were similar to the premiums earned in 2009. The decline in premiums earned in 2010 and 2009, as compared to 2008,was due to the effect competition and the weak economy had on residential and commercial construction. Our other liability losses and loss settlement expenses incurred were $75.6 million in 2011, compared to $94.6 million in 2010, compared to and $119.2 million in 2009. The improvement in this line is the result of a lower level of required reserves for IBNR losses in 2011; a reduction in our legal expenses as a result of an initiative we implemented in 2009; and $93.0 millionan overall improvement in 2008. For 2009, the deterioration was attributable to unfavorable reserve development from the re-estimation of recorded reserves and a slight increase in severity from trends such as larger jury awards and increases in construction defect claims and loss settlement expenses.our underwriting results.
Construction Defect Losses
Losses from construction defect claims were $9.711.1 million in 20102011 compared to $6.09.7 millionand $11.06.0 million in 20092010 and 2008,2009, respectively. At December 31, 2010,2011, we had $21.142.3 million in construction defect loss and loss settlement expense reserves excluding(excluding IBNR reserves,reserves), which consisted of 3261,861 claims. The numberacquisition of Mercer
United Fire Group, Inc. Form 10-K | 2011
Insurance Group contributed $24.9 million in construction defect claimsloss and loss settlement expense reserves at December 31, 2010, is a result of the long-tail nature of this line of business, as some prior year claims remained open. However, the number of current year claims moderated as compared to our experience in recent years.2011, representing 1,535 claims. In comparison, at December 31, 20092010 and 20082009, we had reserves of $15.221.1 million and $16.015.2 million, excluding IBNR reserves, consisting of 234326 claims and 243234 claims, respectively.
Construction defect claims generally relate to allegedly defective work performed in the construction of structures such as apartments, condominiums, single family dwellings or other housing, as well as the sale of defective building materials. Such claims seek recovery due to damage caused by alleged deficient construction techniques or workmanship. The reporting of such claims can be quite delayed due to an extended statute of limitations, sometimes up to ten years. Court decisions have expanded insurers’ exposure to construction defect claims as well.
United Fire & Casualty Company Form 10-K | 2010
Defense costs are also a part of the insured expenses covered by liability policies and can be significant, sometimes greater than the cost of the actual paid claims.
A majority of our exposure to construction defect claims has been in Colorado, and surrounding states. Historically weWe have historically insured small- to medium-sized contractors in this geographic area. In an effort to limit the number of future claims from multi-unit buildings, we have implemented new policy exclusions in recent years limitingthat limit subcontractor coverage on any building project with more than 12 units or on single family homes in any subdivision where the contractor is working on more than 15 homes. We also changed our underwriting guidelines to add a professional liability exclusion when contractors prepare their own design work or blueprints. In 2009, weblueprints and implemented the multi-family exclusion and tract home building limitation form for the state of Colorado and our other western states which we anticipate will benefit usas a means to reduce our exposure in future years.
As a result of our acquisition of Mercer Insurance Group, we have construction defect exposure in the states of California, Nevada and Arizona. Mercer Insurance Group has been writing in these states for more than 20 years. We expect to leverage recent improvements in Mercer Insurance Group's program that focus on targeted risk selection, tailored policy forms and the utilization of an in-house legal department staffed by ten attorneys.
Other Liability Losses — Other Than Construction Defect
Within our other liability lines of business (other than construction defect), frequency increaseddecreased in 20102011 as compared to 2009,2010, with losses incurred on 6,1343,962 claims in 20102011 as compared to 6,134 in 2010 and 4,936 in 2009 and 4,817 in 2008.2009. In 20102011, our average direct losses incurred per other liability claim (other than construction defect) were $15,930$15,952 per claim compared to $15,930 per claim in 2010 and $23,699 per claim in 2009 and $28,727 per claim in 2008.
I nIn 2011, better underwriting results and improvement in the economy contributed to the decrease in frequency. In 2010, the increase in frequency on the other liability line of business iswas due to the continued deterioration of the economy with an associated increase in new claims submitted, primarily bodily injury claims.
Because of the long-tail nature of liability claims, significant periods of time, ranging up to several years, may elapse between the occurrence of the loss, the reporting of the loss to us and the settlement of the claim. In both 2009, and 2008, over 37.0 percent of our other liability losses incurred (other than construction defect) resulted from losses that occurred in prior years.
In recent years, we have begunbegan to use our loss control department more extensively in an attempt to return this line of business to a hig herhigher level of profitability. For example, our loss control department has representatives make multiple visits each year to businesses and job sites to ensure safety. We also non-renew accounts that no longer meet our underwriting or pricing guidelines. As pricing in the industry continues to decrease, we continue to avoid accounts that have become too underpriced for the risk.
Commercial Automobile
Our commercial automobile insurance covers physical damage to an insured’s vehicle, as well as liabilities to third parties. Automobile physical damage insurance covers loss or damage to vehicles from collision, vandalism, fire, theft, flood or other causes. Automobile liability insurance covers b odilybodily injury, damage to property resulting from automobile accidents caused by the insured, uninsured or underinsured motorists and the legal costs of defending the insured against lawsuits. Generally, our company policy is to write standard automobile insurance. Our net loss ratio in the
United Fire Group, Inc. Form 10-K | 2011
commercial automobile was73.1 percent in 2011, 71.9 percent in 2010, and 76.7 percent in 2009 and 71.5 percent in 2008.
In 2010 and 2009,2011, our commercial automobile premium writings increased as a result of our acquisition of Mercer Insurance Group, whereas without this acquisition our premium writings would have remained flat. Our premium writings in 2010 continued to be affected by the slow recovery in the economy, which resulted in a decrease inlower level of premiums earned as compared to 2008. In 2009, we also experienced a slight decrease in our policy counts, which resulted in a decrease in premiums earned, compared to 2008.2009. Losses and loss settlement expenses were $84.2 million in 2011, of which Mercer Insurance Group contributed $13.8 million, compared to $66.9 million and $75.1 million in 2010 compared to $75.1 millionand$72.4 million in 2009, respectively. The deterioration in 2011 is primarily attributable to including Mercer Insurance Group's loss and 2008, respectively.loss settlement expenses in our results; otherwise the line remained relatively flat year-over-year. We attribute the improvement in 2010 to a decrease in claims severity as compared to our results for 2009, when we experienced a slight increase in claims severity.
Workers’ Compensation
Our net loss ratio in the workers’ compensation line of business was 86.7 percent in 2011, 60.3 percent in 2010, and 79.4 percent in 2009 and 78 .5 percent in 2008. We consider our workers’ compensation business to be a companion product; we rarely write stand-alone workers’ compensation policies. Our workers’ compensation insurance covers primarily small- to mid-size accounts.
United Fire & Casualty Company Form 10-K | 2010
In 2010 and 2009, both the nonrenewal of accounts that no longer meetmet our underwriting or pricing guidelines and avoiding accounts that havehad become too underpriced for the risk have contributed to the reduction in premiums earned in this line. Also in 2010, cancellations due to non-payment and/or companies goin ggoing out of business contributed to the decline in our premium writings. In 2008, we increased our writing of workers’ compensation business, as we worked to retain business with current policyholders that required workers’ compensation insurance coverage.
The challenges faced by workers’ compensation insurance providers to attain profitability include the regulatory climates in some states that make it difficult to obtain appropriate premium rate increases and inflationary medical costs. Despite these pricing issues, we continue to believe that we can improve the results of this line of business. Consequently, we have increased the utilization of our loss control unit in the analysis of current risks, with the intent of increasing the quality of our workers’ compensation book of business. And inIn 2011, we plan to introduceintroduced predictive modeling analyt icsanalytics into our workers’ compensation underwriting process. We are currently using this model to assist us in risk selection, and we will continue to evaluate the model results.
The improvement in the loss and loss settlement expenses in 2010 was the result of a reduction in frequency as well as favorable reserve development on resolved cases. In comparison, the deterioration in 2009 is reflective of the increased premium writings we undertook in recent years and the risk associated with this long-tail line of business.
Fidelity and Surety
Our surety products guarantee performance and payment by our bonded principals. Our contract bonds protect owners from failure to perf ormperform on the part of our principals. In addition, our surety bonds protect material suppliers and subcontractors from nonpayment by our contractors. When surety losses occur, our loss is determined by estimating the cost to complete the remaining work and to pay the contractor’s unpaid bills, offset by contract funds due to the contractor, reinsurance, and the value of any collateral to which we may have access. The net loss ratio in this line was 8.1 percent in 2011, 16.4 percent in 2010, and 8.6 percent in 2009 and 18.5 percent in 2008.
BeginningIn 2011, we experienced an improvement in 2008, a downturnour net loss ratio, that is the result of continued underwriting discipline and some favorable development on losses incurred in general economic conditions decreased demand for our surety products, as construction activity declined. This contributed to the slight decline in premiums earned in 2009.prior years. The improvement in our loss and loss settlement expense for 20092011 was also the result of a slight decrease in claims frequency and related loss settlement expenses.frequency.
In 2010, we had an increase in our loss and loss settlement expenses, which is primarily the result of one large claim. Also, in 2010, the construction environment continued to be impacted by the economy and competition remained strong, especially in the Midwest.
United Fire Group, Inc. Form 10-K | 2011
There were no new claims that exceeded our $1.5 million reinsurance retention level in 2011, 2010 2009 and 2008.2009.
Personal Lines
Our personal lines consist primarily of fire and allied lines (including homeowners) and automobile lines. The net loss ratio was 93.1 percent in 2011, 64.4 percent in 2010, and 66.2 percent in 2009 and .135.3
The deterioration in 2011 was due to the significant increase in catastrophe activity during the year as compared to 2010. Personal lines pricing continued to improve during 2011, continuing a trend that began over two years ago. Policy retention rates remained strong, with approximately 82.0 percent in 2008.of our policies renewing.
In 2010, we continued to average low- to mid-single digit percentage increases in our personal lines premium rates, with a retention rate of approximately 87.0 percent. We will continue pursuing opportunities to grow our personal lines business in the future. We have added within our CATography™ Underwriter tool the ability to determine whether the premium we charge for an exposure is adequate in areas where hurricanes and earthquakes occur. Some initiatives that we hope to implement include predictive analytics for the homeowners and automobile lines and data prefill, which is a data accessing methodology that allows for a more complete profile of our customers at the agent’s point of sale during the quotation process.
In late 2009, we averaged low- to mid-single-digit percentage increases in premium rates for our homeowner and personal auto lines of business. In 2008, premium rates decreased onlybusiness and experienced an increase in our personal auto line of business. In 2009,the policy counts for homeowners, automobile and umbrella increased, as compared to 2008.lines.
The results reported for 2008 were impacted by a significant level of catastrophe losses totaling $21.6 million.
United Fire & Casualty Company Form 10-K | 2010
Assumed Reinsurance
Our assumed reinsurance line of business had a favorablenet loss ratio in 2010of (72.1)186.9 percent, compared toa negative net loss ratiosratio of 72.1 percent and a net loss ratio of 67.1 percent andin 14.8 percent2011 for, 20092010 and 20082009, respectively. The net loss ratio experienced in 2011 was the result of significant losses from natural disasters, including catastrophes impacting New Zealand and Japan.
The favorable loss ratio experienced in 2010 resulted from our process to evaluate the overall adequacy of our property and casualty insurance reserve s.reserves. We re-estimated our reserve requirement for this line of business as our largest assumed contract has been in run-off for many years and we believe any new claims on this contract will be minimal. In addition, our current participation level in assumed business is much lower than our historical participation level through selective renewal of the number and type of assumed contracts we have elected to continue writing.
In comparison, the deterioration in 2009 was due to losses on contracts related to Hurricanes Gustavboth 2011 and Ike, as well as environmental and asbestos losses on run-off business.
In 2010, we increased our participation in assumed business, which led to the increase in assumed premium writings for the year. The decrease in these years. In 2009 was attributable to the termination of we terminated one of our assumed reinsurance contracts and reduced our reduced participation level on another contract. Also contributing to the decline in 2009 was the conclusion ofWe also concluded some of our assumed business in early 2009 that had been in run-off since late 2006.
In 2010,2011, losses and loss settlement expenses were $(7.3)24.8 million compared to $4.0(7.3) million in 2010. In 2009, we incurred $4.0 million of losses and loss settlement expenses, of which $0.9 million of the losses were attributable to Hurricanes Gustav and Ike. The remaining losses incurred were primarily from business that was in run-off. In 2008, we incurred $1.6 million of losses and loss settlement expenses, which is attributable to a low level of assumed catastrophe losses, as well as favorable claims development on run-off business. We continue to have exposure, primarily with respect to environmental and asbestos coverage related to the runoff of some business, as well as exposure to catastrophe losses for the small number of assumed reinsurance contracts that we have continued to underwrite.
Other Underwriting Expenses
Our underwriting expense ratios, which are a percentage of other underwriting expenses over premiums earned, were 31.035.7 percent, 31.331.0 percent and 29.431.3 percent for 20102011, 20092010 and 20082009, respectively. In 2011, our other underwriting expenses were higher than our historical experience as a result of increased amortization of deferred policy acquisition costs and the impact of amortization of the value of business acquired ("VOBA") asset recorded in connection with the acquisition of Mercer Insurance Group. The VOBA asset is being amortized in the first 12 months of operations subsequent to the acquisition in correlation to the remaining term of Mercer Insurance Group policies that were acquired. As of December 31, 2011, the VOBA asset was $1.7 million, which will be fully
United Fire Group, Inc. Form 10-K | 2011
amortized in the first quarter of 2012. In addition, we incurred one-time acquisition-related costs in connection with this transaction totaling $8.3 million, which included change in control payments, legal expenses and other acquisition related expenses.
In 2010, our other underwriting expense ratio decreased slightly in 2010, primarily as the result of a higher level of deferrable underwriting expenses in 2010 as compared to 2009. Included in this line for 2010 are the transaction costs totaling $1.2 million that were incurred during the fourth quarter related to our planned acquisition of Mercer. For further discussion of this planned acquisition, refer to “Pending Purchase of Mercer Insurance Group” in Part I, Item 1, “Business” and in the “Liquidity and Capital Resources” section contained in this item.Group.
In 2009, we were unable to defer underwriting expenses (primarily agent commissions and employee salaries) at the same level as we were able to in 2008, due to lower premium writings resulting from continued competition and the weak economy, thus leading to the increase in our expense ratio.
United Fire & Casualty Company Form 10-K | 2010
Life Insurance Segment
| | | Life Insurance Segment Results of Operations | | | | | | | | % Change | Life Insurance Segment Results of Operations | | | | | | % Change |
| (In Thousands) | | | | | | | | 2010 | | 2009 | | | | | | | 2011 | | 2010 |
| Years ended December 31 | | 2010 | | 2009 | | 2008 | | vs. 2009 | | vs. 2008 | 2011 | | 2010 | | 2009 | | vs. 2010 | | vs. 2009 |
| Revenues | | | | | | | | | | | | | | | | | | | |
Net premiums written (1) | | $ | 48,984 | | | $ | 42,600 | | | $ | 37,326 | | | 15.0 | % | | 14.1 | % | $ | 52,944 |
| | $ | 48,984 |
| | $ | 42,600 |
| | 8.1 | % | | 15.0 | % |
| Net premiums earned | | $ | 49,100 | | | $ | 42,821 | | | $ | 37,794 | | | 14.7 | % | | 13.3 | % | $ | 53,012 |
| | $ | 49,100 |
| | $ | 42,821 |
| | 8.0 | % | | 14.7 | % |
| Investment income, net | | 76,898 | | | 74,533 | | | 74,125 | | | 3.2 | | | 0.6 | | 73,981 |
| | 76,898 |
| | 74,533 |
| | (3.8 | ) | | 3.2 |
|
| Realized investment gains (losses) | | | | | | | | | | | | | | | |
|
| |
|
| |
|
| |
|
| |
|
|
| Other-than-temporary impairment charges | | (306 | ) | | (8,482 | ) | | (8,944 | ) | | 96.4 | | | 5.2 | | (395 | ) | | (306 | ) | | (8,482 | ) | | (29.1 | ) | | 96.4 |
|
| Other realized gains (losses), net | | 5,202 | | | 2,118 | | | (3,318 | ) | | 145.6 | | | 163.8 | | |
| Other realized gains, net | | 3,754 |
| | 5,202 |
| | 2,118 |
| | (27.8 | ) | | 145.6 |
|
| Total realized investment gains (losses) | | 4,896 | | | (6,364 | ) | | (12,262 | ) | | 176.9 | | | 48.1 | | 3,359 |
| | 4,896 |
| | (6,364 | ) | | (31.4 | ) | | 176.9 |
|
| Other income | | 1,278 | | | 605 | | | 935 | | | 111.2 | | | (35.3 | ) | 699 |
| | 1,278 |
| | 605 |
| | (45.3 | ) | | 111.2 |
|
| Total Revenues | | $ | 132,172 | | | $ | 111,595 | | | $ | 100,592 | | | 18.4 | % | | 10.9 | % | $ | 131,051 |
| | $ | 132,172 |
| | $ | 111,595 |
| | (0.8 | )% | | 18.4 | % |
| | | | | | | | | | | | | | | | | |
| |
|
| Benefits, Losses and Expenses | | | | | | | | | | | | | | | | | | | |
| Loss and loss settlement expenses | | $ | 20,359 | | | $ | 16,773 | | | $ | 13,291 | | | 21.4 | % | | 26.2 | % | $ | 22,558 |
| | $ | 20,359 |
| | $ | 16,773 |
| | 10.8 | % | | 21.4 | % |
| Increase in liability for future policy benefits | | 27,229 | | | 23,897 | | | 23,156 | | | 13.9 | | | 3.2 | | 32,567 |
| | 27,229 |
| | 23,897 |
| | 19.6 |
| | 13.9 |
|
| Amortization of deferred policy acquisition costs | | 10,735 | | | 9,287 | | | 11,568 | | | 15.6 | | | (19.7 | ) | 9,224 |
| | 10,735 |
| | 9,287 |
| | (14.1 | ) | | 15.6 |
|
| Other underwriting expenses | | 11,318 | | | 8,745 | | | 9,106 | | | 29.4 | | | (4.0 | ) | 12,353 |
| | 11,318 |
| | 8,745 |
| | 9.1 |
| | 29.4 |
|
| Interest on policyholders’ accounts | | 42,988 | | | 41,652 | | | 40,177 | | | 3.2 | | | 3.7 | | 42,834 |
| | 42,988 |
| | 41,652 |
| | (0.4 | ) | | 3.2 |
|
| Total Benefits, Losses and Expenses | | $ | 112,629 | | | $ | 100,354 | | | $ | 97,298 | | | 12.2 | % | | 3.1 | % | $ | 119,536 |
| | $ | 112,629 |
| | $ | 100,354 |
| | 6.1 | % | | 12.2 | % |
| | | | | | | | | | | | | | | | | | | |
|
| |
|
|
| Income Before Income Taxes | | $ | 19,543 | | | $ | 11,241 | | | $ | 3,294 | | | 73.9 | % | | 241.3 | % | $ | 11,515 |
| | $ | 19,543 |
| | $ | 11,241 |
| | (41.1 | )% | | 73.9 | % |
| |
| (1) | The Statutory Financial MeasuresMeasurement of Results section of this report defines data prepared in accordance with statutory accounting practices, which is a comprehensive basis of accounting other than U.S. GAAP. |
Our life insurance segment recorded pre-tax income of $19.5 million in 2010, compared to $11.2 million in 2009 and $3.3 million in 2008. The improvement in our 2010 results is attributable to the reduction in OTTI charges, a component of realized investment losses, as compared to the levels experienced in both 2009 and 2008. In 2010, 2009 and 2008, OTTI charges recorded totaled $0.3 million, $8.5 million and $8.9 million, respectively.
Net premiums earned increased 14.7 percent in 2010 as compared to 2009, and 13.3 percent in 2009 compared to 2008, as a result of our strategy to emphasize the marketing of our traditional life insurance products, primarily single premium whole life, to our independent life insurance agents, achieving a more balanced mix of traditional life insurance products to annuities.
Net investment income in 2010 was higher than in 2009 and 2008. An increase in annuity sales in 2009 contributed to the increase in net investment income and invested assets. For discussion of our consolidated investment results, see the “Investments” section contained in this item.
United Life Insurance Company underwrites all of our life insurance business. Our principal life insurance products are deferred and immediate annuities, universal life products and traditional life (primarily single premium whole life insurance) products. We also underwrite and market other traditional products, including term life insurance and whole life insurance. Deferred and immediate annuities (66.4(71.7 percent), traditional life products (21.9(18.9 percent), universal life products (10.3(8.3 percent), and other life products (1.4(1.1 percent) comprised our 20102011 life insurance premium revenues, as determined on the basis of statutory accounting practices. We do not write variable annuities or variable insurance products.
Our life insurance segment recorded pre-tax income of $11.5 million in 2011, compared to $19.5 million in 2010 and $11.2 million in 2009. The deterioration in our 2011 results is primarily due to historically low investment yields, but it was also affected by an increase in future policy benefits and an increase in death benefits due to our preliminary review of available Social Security records that identified deceased policy holders whose beneficiaries had not submitted claims.
The improvement in our 2010 results, as compared to 2009, is attributable to the reduction in other-than-temporary-
United Fire & Casualty CompanyGroup, Inc. Form 10-K | 20102011
impairment ("OTTI") charges, which are reported as realized investment losses, as compared to the level experienced in 2009. In 2011, 2010 and 2009, OTTI charges recorded totaled $0.4 million, $0.3 million and $8.5 million, respectively.
Net premiums earned increased 8.0 percent in 2011 as compared to 2010, and 14.7 percent in 2010 compared to 2009, due to an increase in sales of our single premium whole life product and sales of single premium immediate annuities, which are attractive to consumers seeking a consistent rate of return. Also contributing to increased sales was our strategy to emphasize the marketing of our traditional life insurance products to our independent life insurance agents in order to achieve a more balanced mix of traditional life insurance products to annuities.
Net investment income in 2011 was lower than in 2010 and 2009. This was driven by the continuing low interest rate environment. In the fourth quarter of 2011, we began taking advantage of the decreasing spread between AAA- and A-rated fixed maturity securities to improve the quality of our fixed maturity purchases. Additionally, in 2011 we began increasing the duration of our investment portfolio to more closely match our liabilities, which have increased in conjunction with sales of our single premium whole life product. For discussion of our consolidated investment results, see the “Investments” section contained in this item.
The fixed annuity deposits that we collect are not reported as net premiums earned under GAAP. Instead, we invest annuity deposits and record them as a liability against future policy benefits. The revenue that is generated from fixed annuity products consists of policy surrender charges and investment income. The difference between the yield we earn on our investment portfolio and the interest we credit on our fixed annuities is known as the investment spread. The investment spread is a major driver of the profitability for all of our annuity products.
Our deferred annuity deposits increased 33.7 percent in 2011 compared to 2010, and decreased 57.3 percent in 2010 compared to 2009, and increased 34.4 percent in 2009 compared to 2008.. Annuity deposit levels decreasedincreased from 20092010 to 20102011 as historic, low interest ratessome consumers continued to affect our level of deferred annuity deposits. Our deposits were driven by consumers who soughtseek products with a conservative, guaranteedconsistent rate of return on their funds, while our withdrawals were driven by consumers who had a greater tolerance for riskas the equity markets remained volatile and were seeking a potentially greater return.interest rates remained low.
InAlthough interest on policyholders’ accounts remained flat in 20102011, we experienced an increase in interest on policyholders’policyholders' accounts due to the higher average deferred annuity balance in 2010 as compared to 2009. In 2009, we experienced an increase in this line, which is reflective of the increase in annuity deposits increased during the year and we experienced the lowest level of surrenders and withdrawals experienced since 2005. In 2008, we experienced a decrease in this line, as surrenders and withdrawals exceeded deposits, due to our annuitants seeking alternative options for their money.
Amortization of DAC increased from $9.3 million in 2009 to $10.7 million in 2010. This was due to a combination of changes in the amortization schedules for the universal life and deferred annuity lines to reflect, mostly, changes in market investment yields and related interest spreads, as well as allocated capital gains to these lines for 2010, as compared to capital losses for 2009. The net effect of this was an increase in amortization of $2.6 million. Offsetting this was a reduction in traditional life amortization, due to improved persistency, amounting to $1.1 million
The decrease in amortization of DAC for 2009 was due to modest changes in amortization schedules implemented for the universal life and deferred annuity lines, as compared to more significant changes in 2008. The 2008 changes were implemented because of lower than expected investment returns, reflecting large realized capital losses, as well as an adjustment in anticipated lapse rates, based upon recent experience. The impact of the changes each year resulted in a decrease of $3.1 million in DAC amortization charges in 2009 as compared to 2008. Offsetting this decrease was an increase in regular amortization charges in the traditional life line due to the growth of the business, increasing amortization charges by $0.8 million in 2009 as compared to 2008.
Refer to “Critical Accounting Estimates&rdqu o; in this section for a more detailed discussion of our life segment’s deferred policy acquisition costs.
Federal Income Taxes
We reported a federal income tax benefit of $12.7 million in 2011 and $18.3 million in 2009, respectively, compared to a federal income tax expense of $10.9 million in 2010 and a federal income tax benefit of $18.3 million and $20.1 million in 2009 and 2008, respectively.. The benefit in 20092011 and 20082009 resulted from a taxable loss in our property and casualty insurance operations. Our effective federal tax rate varied from the statutory federal income tax expense rate of 35.0 percent, due primarily to our portfolio of tax-exempt securities.
As of December 31, 2010,2011, we have a net operating loss (“NOL”) carryforward of $12.5$24.1 million, all$13.1 million of which is due to ou rthe net operating loss generated in 2011 and $11.0 million of which is due to our purchase of American Indemnity Financial Corporation in 1999. Such net operating losses are currently available to offset future taxable income of our property and casualty insurance operations.No NOLs totaling $1.6 millionwill expire in 2011.2012.
Due to our determination that we may not be able to fully realize the benefits of thesethe NOLs acquired in the purchase of American Indemnity Financial Corporation, which are only available to offset the future taxable income of our property and casualty insurance operations, we have recorded a valuation allowance against the NOLs. AtNOLs that totaled $3.5 million at December 31, 2010, this valuation allowance totaled $4.0 million.31,2011. Based on a yearly review, we determine whether the benefit of the NOLs can be realized, and, if so, the decrease in the valuation allowance is recorded as a reduction to current federal income tax expense. If NOLs expire during the year, the decrease in the valuation allowance is offset with a corresponding decrease to the deferred income tax asset. The valuation allowance was reduced by $.5 million in 2011 due to the expiration of $1.6 million in 2010 due to utilization of the NOLs.
United Fire & Casualty CompanyGroup, Inc. Form 10-K | 20102011
Investment Environment
During 2010, we sawIn 2011, volatility across investment classes was at the highest level since the financial markets begincrisis of 2008 and 2009. Credit rating downgrades of major economies (including the U.S.), natural disasters, and extraordinary political events dominated investor sentiment and the investment landscape. Fixed maturity security yields are at or near historic lows, due in part to strengthen, with less volatility than what was expe rienced in 2009a combination of investors wanting safety and 2008. The improvementthe massive amount of monetary and fiscal stimulus in the markets lead to an increase in our unrealized investments gains and net investment income and a significant decrease in OTTI charges as compared to our 2009 results.world's financial system. We continue to carefully monitor the national and global economies and financial markets and modifyremain disciplined in our approach to managing the risks and maximizing returns in the investment portfolio. We believe our investment portfolio to reflect changes in market conditions in order to match the durationstrategy is prudent during this period of our liabilities and maximize our investment return.heightened uncertainty.
Investment Philosophy
We invest the property and casualty insurance segment’s assets to meet our liquidity needs and maximize our after-tax returns while maintaining appropriate risk diversification. We invest the life insurance segment’s assets primarily in investment-grade fixed maturities in order to meet our liquidity needs, maximize our investment return and achieve a matching of assets to liabilities.
We comply with state insurance laws that prescribe the quality, concentration and type of investments that may be made by insurance companies. We determine the mix of our investment portfolio based upon these state laws, our liquidity needs, our tax position and general market conditions. We also consider the timing of our obligations, so we have cash available to pay our obligations when they become due. We make any necessary modifications to our investment portfolio as warranted by changing conditions in the financial markets. We manage all but a small portion of our investment portfolio internally.
With respect to our portfolio of fixed maturity securities, our general investment philosophy is to purchase financial instruments with the expectation that we will hold them to their maturity. However, close management of our available-for-sale portfolio is considered necessary to maintain an approximate matching of assets to liabilities and to adjust the portfolio to respond to changing market conditions and tax considerations.
Investment Portfolio
Our invested assets at December 31, 20102011, totaled $2.52.9 billion, compared to $2.42.5 billion at December 31, 20092010. At December 31, 20102011, fixed maturity securities and equity securities comprised 92.593.4 percent and 5.5 percent of our investment portfolio, while equity securities accounted for 6.0 percent of the value of our portfolio.respectively. Because the primary purpose of the investment portfolio is to fund future claims payments, we utilize a conservative investment philosophy, investing in a diversified portfolio of high quality, intermediate-term taxable corporate bonds, taxable U.S. government bonds and tax-exempt U.S. municipal bonds.
Composition
We develop our investment strategies based on a number of factors, including estimated duration of reserve liabilities, short- and long-term liquidity needs, projected tax status, general economic conditions, expected rates of inflation and regulatory requirements. We manage our portfolio based on investment guidelines approved by management, which comply with applicable statutory regulations.
The composition of our investment portfolio at December 31, 20102011, is presented in the following table:
United Fire & Casualty CompanyGroup, Inc. Form 10-K | 20102011
| | | | | Property & Casualty Insurance Segment | | Life Insurance Segment | | Total | Property & Casualty Insurance Segment | | Life Insurance Segment | | Total |
| (In Thousands) | | | | Percent of Total | | | | Percent of Total | | | | Percent of Total | | | % of Total | | | | % of Total | | | | % of Total |
Fixed maturities (1) | | $ | 786,185 | | | 83.0 | % | | $ | 1,498,608 | | | 97.6 | % | | $ | 2,284,793 | | | 92.0 | % | $ | 1,083,860 |
| | 86.1 | % | | $ | 1,617,531 |
| | 98.0 | % | | $ | 2,701,391 |
| | 92.9 | % |
| Equity securities | | 131,551 | | | 13.9 | | | 18,155 | | | 1.2 | | | 149,706 | | | 6.0 | | 141,693 |
| | 11.3 |
| | 17,758 |
| | 1.1 |
| | 159,451 |
| | 5.5 |
|
| Trading securities | | 12,886 | | | 1.4 | | | — | | | — | | | 12,886 | | | 0.5 | | 13,454 |
| | 1.1 |
| | — |
| | — |
| | 13,454 |
| | 0.5 |
|
| Mortgage loans | | — | | | — | | | 6,497 | | | 0.4 | | | 6,497 | | | 0.3 | | — |
| | — |
| | 4,829 |
| | 0.3 |
| | 4,829 |
| | 0.2 |
|
| Policy loans | | — | | | — | | | 7,875 | | | 0.5 | | | 7,875 | | | 0.4 | | — |
| | — |
| | 7,209 |
| | 0.4 |
| | 7,209 |
| | 0.2 |
|
| Other long-term investments | | 15,454 | | | 1.6 | | | 4,587 | | | 0.3 | | | 20,041 | | | 0.8 | | 17,249 |
| | 1.4 |
| | 3,325 |
| | 0.2 |
| | 20,574 |
| | 0.7 |
|
| Short-term investments | | 1,100 | | | 0.1 | | | — | | | — | | | 1,100 | | | — | | 1,100 |
| | 0.1 |
| | — |
| | — |
| | 1,100 |
| | — |
|
| Total | | $ | 947,176 | | | 100.0 | % | | $ | 1,535,722 | | | 100.0 | % | | $ | 2,482,898 | | | 100.0 | % | $ | 1,257,356 |
| | 100.0 | % | | $ | 1,650,652 |
| | 100.0 | % | | $ | 2,908,008 |
| | 100.0 | % |
| |
| (1) | Available-for-sale fixed maturities are carried at fair value. Held-to-maturity fixed maturities are carried at amortized cost. |
At December 31, 20102011, $2.32.7 billion, or 99.799.4 percent, of our fixed maturities were classified as available-for-sale, compared with $2.22.3 billion, or 99.699.2 percent, at December 31, 20092010., due to the addition of Mercer Insurance Group's investment portfolio. We classify our remaining fixed maturities as held-to-maturity or trading. We record held-to-maturity securities at amortized cost. We record trading securities, primarily convertible redeemable preferred debt securities, at fair value, with any changes in fair value recognized in earnings.
Credit Quality
The following table is a breakdown of the composition of fixed maturity securities held in our available-for-sale, held-to-maturity and trading security portfolios, by credit rating, at December 31, 20102011 and 20092010, respectively. Information contained in the table is based upon issue credit ratings provided by Moody’s unless the rating is unavailable, and then it is obtained from Standard & Poor’s:
| | | (In Thousands) | | December 31, 2010 | | December 31, 2009 | | December 31, 2011 | | December 31, 2010 |
| Rating | | Carrying Value | | % of Total | | Carrying Value | | % of Total | | Carrying Value | | % of Total | | Carrying Value | | % of Total |
| AAA | | $ | 279,009 | | | 12.1 | % | | $ | 207,199 | | | 9.5 | % | | $ | 409,124 |
| | 15.0 | % | | $ | 279,009 |
| | 12.1 | % |
| AA | | 480,478 | | | 20.9 | | | 397,380 | | | 18.2 | | | 631,250 |
| | 23.3 |
| | 480,478 |
| | 20.9 |
|
| A | | 476,044 | | | 20.7 | | | 562,795 | | | 25.8 | | | 626,927 |
| | 23.1 |
| | 476,044 |
| | 20.7 |
|
| Baa/BBB | | 938,781 | | | 40.9 | | | 869,465 | | | 39.9 | | | 929,188 |
| | 34.2 |
| | 938,781 |
| | 40.9 |
|
| Other/Not Rated | | 123,367 | | | 5.4 | | | 143,770 | | | 6.6 | | | 118,356 |
| | 4.4 |
| | 123,367 |
| | 5.4 |
|
| | | $ | 2,297,679 | | | 100.0 | % | | $ | 2,180,609 | | | 100.0 | % | | $ | 2,714,845 |
| | 100.0 | % | | $ | 2,297,679 |
| | 100.0 | % |
Our total carrying valueChanges in the credit ratings of our “AAA” fixed maturity securities increased inat 2010December 31, 2011, as compared to 2009December 31, 2010, are primarily due to purchasesthe inclusion of government agency bonds as well as an improvementMercer Insurance Group's invested assets in bond ratings, which causedour portfolio. In addition during the creditfourth quarter of 2011, we began taking advantage of the decreasing spread between AAA- and A-rated fixed maturity securities to improve the quality of our investment portfolio to shift upward. The change in ratings is also the primary reason our “AA” rated fixed maturity securities increased in 2010 as compared to 2009. Our “Baa/BBB” fixed maturity securities increased in 2010 as we chose to purchase more securities of this type in order to obtain a higher yield on our portfolio.purchases.
Duration
Our investment portfolio is comprised primarily of fixed maturity securities whose fair value is susceptible to market risk, specifically interest rate changes. Duration is a measurement used to quantify our inherent interest rate risk and analyze our ability to match our invested assets to our claimsclaim liabilities. If our invested assets and claimsclaim liabilities have similar durations, then any change in interest rates will have an equal and opposite effect on these account balances. Mismatches in the duration of assets and liabilities can cause significant fluctuations in our results of operations. The primary purpose for matching invested assets and claimsclaim liabilities is liquidity. With appropriate matching, our investments will mature when cash is needed, preventing the need to liquidate other assets prematurely.
United Fire & Casualty CompanyGroup, Inc. Form 10-K | 20102011
Group
The weighted average effective duration of our portfolioholdings of fixed maturity securities, at December 31, 20102011, is 5.23.6 years compared to 6.03.7 years at December 31, 20092010.
Property and Casualty Insurance Segment
For our property and casualty insurance segment, the weighted average effective duration of our portfolioholdings of fixed maturity securities, at December 31, 20102011, is 6.54.0 years compared to 7.35.3 years at December 31, 20092010.
The amortized cost and fair value of held-to-maturity, available-for-sale and trading securities at December 31, 20102011, by contractual maturity, are shown in the following table. Actual maturities may differ from contractual maturities because borrowers may have the right to call or prepay obligations with or without call or prepayment penalties. Mortgage-backedAsset-backed securities, mortgage-backed securities and collateralized mortgage obligations may be subject to prepayment risk and are therefore not categorized by contractual maturity.
| | | (In Thousands) | | Held-To-Maturity | | Available-For-Sale | | Trading | Held-To-Maturity | | Available-For-Sale | | Trading |
| | | Amortized | | Fair | | Amortized | | Fair | | Amortized | | Fair | Amortized | | Fair | | Amortized | | Fair | | Amortized | | Fair |
| December 31, 2010 | &n bsp; | Cost | | Value | | Cost | | Value | | Cost | | Value | |
| December 31, 2011 | | Cost | | Value | | Cost | | Value | | Cost | | Value |
| Due in one year or less | | $ | 680 | | | $ | 693 | | | $ | 28,716 | | | $ | 29,419 | | | $ | 2,836 | | | $ | 2,867 | | $ | 395 |
| | $ | 397 |
| | $ | 56,442 |
| | $ | 56,777 |
| | $ | 2,544 |
| | $ | 2,860 |
|
| Due after one year through five years | | 4,679 | | | 4,666 | | | 123,946 | ; | | 129,111 | | | 1,900 | | | 1,890 | | 2,969 |
| | 2,955 |
| | 276,288 |
| | 288,784 |
| | 4,880 |
| | 4,749 |
|
| Due after five years through 10 years | | 3 | | | 3 | | | 547,806 | | | 576,907 | | | — | | | — | | — |
| | — |
| | 577,503 |
| | 633,598 |
| | 497 |
| | 439 |
|
| Due after 10 years | | — | | | — | | | 39,510 | | | 40,322 | | | 7,586 | | | 8,129 | | — |
| | — |
| | 46,484 |
| | 48,521 |
| | 5,508 |
| | 5,406 |
|
| Asset-backed securities | | — |
| | — |
| | 967 |
| | 1,024 |
| | — |
| | — |
|
| Mortgage-backed securities | | 3 | | | 3 | | | 2 | | | 2 | | | — | | | — | | 3 |
| | 3 |
| | 34,353 |
| | 35,390 |
| | — |
| | — |
|
| Collateralized mortgage obligations | | — | | | — | | | 4,533 | | | 5,058 | | | — | | | — | | — |
| | — |
| | 15,563 |
| | 16,399 |
| | — |
| | — |
|
| | | $ | 5,365 | | | $ | 5,365 | | | $ | 744,513 | | | $ | 780,819 | | | $ | 12,322 | | | $ | 12,886 | | $ | 3,367 |
| | $ | 3,355 |
| | $ | 1,007,600 |
| | $ | 1,080,493 |
| | $ | 13,429 |
| | $ | 13,454 |
|
Life Insurance Segment
For our life insurance segment, weighted average effective duration of our portfolioholdings of fixed maturity securities, at December 31, 20102011, is 3.63.4 years compared to 4.32.8 years at December 31, 20092010.
The amortized cost and fair value of held-to-maturity, available-for-sale and trading securities at December 31, 20102011, by contractual maturity, are shown in the following table. Actual maturities may differ from contractual maturities because borrowers may have the right to call or prepay obligations with or without call or prepayment penalties. Mortgage-backedAsset-backed securities, mortgage-backed securities and collateralized mo rtgagemortgage obligations may be subject to prepayment risk and are therefore not categorized by contractual maturity.
| | | (In Thousands) | | Held-To-Maturity | | Available-For-Sale | Held-To-Maturity | | Available-For-Sale |
| | | Amortized | | Fair | | Amortized | | Fair | Amortized | | Fair | | Amortized | | Fair |
| December 31, 2010 | | Cost | | Value | | Cost | | Value | |
| December 31, 2011 | | Cost | | Value | | Cost | | Value |
| Due in one year or less | | $ | — | | | $ | — | | | $ | 203,711 | | | $ | 208,222 | | $ | — |
| | $ | — |
| | $ | 214,812 |
| | $ | 218,583 |
|
| Due after one year through five years | | 475 | | | 479 | | | 996,324 | | | 1,050,851 | | 375 |
| | 378 |
| | 808,506 |
| | 851,218 |
|
| Due after five years through 10 years | | — | | | — | | | 202,961 | | | 205,328 | | — |
| | — |
| | 386,949 |
| | 396,992 |
|
| Due after 10 years | | — | | | — | | | 18,126 | | | 18,690 | | — |
| | — |
| | 76,103 |
| | 78,238 |
|
| Asset-backed securities | | — |
| | — |
| | 4,834 |
| | 5,272 |
|
| Mortgage-backed securities | | 441 | | | 491 | | | — | | | — | | 353 |
| | 378 |
| | — |
| | — |
|
| Collateralized mortgage obligations | | 83 | | | 87 | | | 13,031 | | | 14,519 | | 48 |
| | 50 |
| | 63,982 |
| | 66,452 |
|
| | | $ | 999 | | | $ | 1,057 | | | $ | 1,434,153 | | | $ | 1,497,610 | | $ | 776 |
| | $ | 806 |
| | $ | 1,555,186 |
| | $ | 1,616,755 |
|
United Fire & Casualty CompanyGroup, Inc. Form 10-K | 20102011
Investment Results
We invest the premiums received from our policyholders and annuitants in order to generate investment income, which is an important component of our revenues and profitability. The amount of investment income that we are able to generate is affected by many factors, some of which are beyond our control. These factors include: volatility in the financial markets, economic growth, inflation, interest rates, world political conditions, terrorism attacks or threats, adverse events a ffectingaffecting other companies in our industry or the industries in which we invest and other unpredictable national or world events.
Our investment results are summarized in the following table:
| | | | | | | | | | | | | | | | | | |
| (In Thousands) | | | | | | | | % Change |
| | | | | | | | | 2010 | | 2009 |
| As of and for the Years Ended December 31 | | 2010 | | 2009 | | 2008 | | vs. 2009 | | vs. 2008 |
| Investment income, net | | $ | 111,685 | | | $ | 106,075 | | | $ | 107,577 | | | 5.3 | % | | (1.4 | )% |
| Realized investment gains (losses) | | | | | | | | | | |
| Other-than-temporary impairment charges | | $ | (459 | ) | | $ | (18,307 | ) | | $ | (9,904 | ) | | 97.5 | | | (84.8 | ) |
| Other realized investment gains (losses) | | 8,948 | | | 5,128 | | | (479 | ) | | 74.5 | | | NM | |
| Total realized investment gains (losses) | | $ | 8,489 | | | $ | (13,179 | ) | | $ | (10,383 | ) | | 164.4 | % | | (26.9 | )% |
| Net unrealized gains, after tax | | $ | 102,649 | | | $ | 82,491 | | | $ | 25,543 | | | 24.4 | % | | 222.9 | % |
NM = not meaningful |
| | | | | | | | | | | | | | | | | |
| (In Thousands) | | | | | | | % Change |
| | | | | | | | 2011 | | 2010 |
| As of and for the Years Ended December 31 | 2011 | | 2010 | | 2009 | | vs. 2010 | | vs. 2009 |
| Investment income, net | $ | 109,494 |
| | $ | 111,685 |
| | $ | 106,075 |
| | (2.0 | )% | | 5.3 | % |
| Realized investment gains (losses) | | | | | | | | | |
| Other-than-temporary impairment charges | $ | (395 | ) | | $ | (459 | ) | | $ | (18,307 | ) | | 13.9 |
| | 97.5 |
|
| Other realized gains, net | 6,835 |
| | 8,948 |
| | 5,128 |
| | (23.6 | ) | | 74.5 |
|
| Total realized investment gains (losses) | $ | 6,440 |
| | $ | 8,489 |
| | $ | (13,179 | ) | | (24.1 | )% | | 164.4 | % |
| Net unrealized gains, after tax | $ | 124,376 |
| | $ | 102,649 |
| | $ | 82,491 |
| | 21.2 | % | | 24.4 | % |
Net Investment Income
In 2011, our investment income, net of investment expenses, decreased $2.2 million to $109.5 million as compared to 2010. This decrease is attributable to ongoing low investment yields in 2011 and interest expense paid in 2011 in connection with our purchases of Mercer Insurance Group. We are preparing for an extended period of low interest rates by increasing our purchases of long-term fixed maturity securities and a small number of equity securities.
In 2010, our investment income, net of investment expenses, increased $5.6 million to $111.7 million as compared to the same period in 2009. The growth in our annuity sales in 2009 contributed to an increase in our invested assets and our 2010 net investment income evengenerated in spite of2010, despite historically low interest rates.
The slight decline in our 2009 net investment income as compared to 2008 was due to the following factors: lower market inter est rates earned on our investment portfolio, which also affected the returns on our short-term investments and cash and cash equivalents; agency bonds that were called during 2009, the proceeds of which we reinvested at lower interest rates than the called bonds carried; and the reduction or discontinuation of dividend payments by some of our equity securities that previously had paid regular dividends.
The following table summarizes the components of net investment income:
| | (In Thousands) Years Ended December 31 | | 2010 | | 2009 | | 2008 | 2011 | | 2010 | | 2009 |
| Investment income | | | | | | | | | | | |
| Interest on fixed maturities | | $ | 108,754 | | | $ | 106,023 | | | $ | 100,755 | | $ | 109,467 |
| | $ | 108,754 |
| | $ | 106,023 |
|
| Dividends on equity securities | | 3,675 | | | 3,950 | &n bsp; | | 5,749 | | 4,628 |
| | 3,675 |
| | 3,950 |
|
Income (loss) on other long-term investments (1) | | 411 | | | (1,133 | ) | | (4,442 | ) | |
| Income (loss) on other long-term investments | | | | | | |
| Interest | | 224 |
| | 24 |
| | (6 | ) |
Change in value (1) | | (137 | ) | | 387 |
| | (1,127 | ) |
| Interest on mortgage loans | | 479 | | &nb sp; | 587 | | | 851 | | 285 |
| | 479 |
| | 587 |
|
| Interest on short-term investments | | 6 | | | 558 | | | 3,127 | | 4 |
| | 6 |
| | 558 |
|
| Interest on cash and cash equivalents | | 1,064 | | | 1,094 | | | 4,710 | | 913 |
| | 1,064 |
| | 1,094 |
|
| Other | | 2,686 | | | 1,253 | | | 1,588 | | 2,542 |
| | 2,686 |
| | 1,253 |
|
| Total investment income | | $ | 117,075 | | | $ | 112,332 | | | $ | 112,338 | | $ | 117,926 |
| | $ | 117,075 |
| | $ | 112,332 |
|
| Less investment expenses | | 5,390 | | | 6,257 | | | 4,761 | | 8,432 |
| | 5,390 |
| | 6,257 |
|
| Investment income, net | | $ | 111,685 | | | $ | 106,075 | | | $ | 107,577 | | $ | 109,494 |
| | $ | 111,685 |
| | $ | 106,075 |
|
| |
| (1) | Includes an adjustment forRepresents the changeschange in value of our holdings in limited liability partnership funds, which are accounted for under the equity method of accounting. |
United Fire & Casualty CompanyGroup, Inc. Form 10-K | 20102011
In 20102011, 92.992.8 percentof our gross investment income originated from interest on fixed maturities, compared to 94.492.9 percent and 89.794.4 percent in 20092010 and 20082009, respectively.
The following table details our yield on average invested assets for 20102011, 20092010 and 20082009, which is based on our invested assets (including money market accounts) at the beginning and end of the year divided by net investment income:
| | | | | | | | | | | |
| (In Thousands) | | | | | | |
Years ended December 31 | | Average Invested Assets | | Investment Income, Net | | Annualized Yield on Average Invested Assets |
| 2010 | | $ | 2,482,643 | | | $ | 111,685 | | | 4.5 | % |
| 2009 | | 2,307,260 | | | 106,075 | | | 4.6 | % |
| 2008 | | 2,211,780 | | | 107,577 | | | 4.9 | % |
Securities Lending
We terminated our participation in a securities lending program effective December 31, 2010. Our participation in the securities lending program generated investment income of $100,000, $139,000 and $89,000 in 2010, 2009 and 2008, respectively. |
| | | | | | | | | | |
| (In Thousands) | | | | | |
Years ended December 31 | Average Invested Assets | | Investment Income, Net | | Annualized Yield on Average Invested Assets |
| 2011 | $ | 2,744,095 |
| | $ | 109,494 |
| | 4.0 | % |
| 2010 | 2,482,643 |
| | 111,685 |
| | 4.5 | % |
| 2009 | 2,307,260 |
| | 106,075 |
| | 4.6 | % |
Realized Investment Gains and Losses
In2011 and 2010, we reported realized investment gains of $6.4 million and $8.5 million, respectively, compared to losses of $13.2 million and $10.4 millionin 2009 and 2008, respectively.. The following table summarizes the components of our realized investment gains or losses:
| | (In Thousands) Years Ended December 31 | | 2010 | | 2009 | | 2008 | 2011 | | 2010 | | 2009 |
| Realized investment gains (losses) | | | | | | | | | | | |
| Fixed maturities | | $ | 4,079 | | | $ | (4,117 | ) | | $ | (11,728 | ) | $ | 4,389 |
| | $ | 4,079 |
| | $ | (4,117 | ) |
| Equity securities | | 5,030 | | | (11,362 | ) | | 1,427 | | 2,984 |
| | 5,030 |
| | (11,362 | ) |
| Trading securities | | (127 | ) | | 1,965 | | | (82 | ) | (865 | ) | | (127 | ) | | 1,965 |
|
| Mortgage loans | | (362 | ) | | — | | | — | | — |
| | (362 | ) | | — |
|
| Other long-term investments | | (131 | ) | | 332 | | | — | | (68 | ) | | (131 | ) | | 332 |
|
| Short-term investments | | — | | | 3 | | | — | | — |
| | — |
| | 3 |
|
| Total realized investment gains (losses) | | $ | 8,489 | | | $ | (13,179 | ) | | $ | (10,383 | ) | $ | 6,440 |
| | $ | 8,489 |
| | $ | (13,179 | ) |
The improvement in our realized investment gains in 2011 and 2010, as compared to the losses incurred in 2009, and 2008, was primarily due to a significant reduction in pre-tax realized losses from OTTI charges on our fixed maturity securities and equity securities. We incurred substantial OTTI charges in 2009 and 2008 as a result of the recent credit crisis that impacted the financial markets.
We recorded $0.5 million inthe following pre-tax OTTI charges i nin 2011, in 2010 compared to $18.3 millionand$9.9 million in 2009 and 2008, respectively, as follows:respectively:
| | | | | | | | | | | | |
(In Thousands) Years Ended December 31 | | 2010 | | 2009 | | 2008 |
| Other-than-temporary-impairment charges (pre-tax) | | | | | | |
| Fixed maturities | | $ | — | | | $ | 5,759 | | | $ | 8,597 | |
| Equity securities | | 459 | | | 12,548 | | | 1,307 | |
| Total other-than-temporary-impairment charges | | $ | 459 | | | $ | 18,307 | | | $ | 9,904 | |
|
| | | | | | | | | | | | |
(In Thousands) Years Ended December 31 | | 2011 | | 2010 | | 2009 |
| Other-than-temporary-impairment charges | | | | | | |
| Fixed maturities | | $ | 395 |
| | $ | — |
| | $ | 5,759 |
|
| Equity securities | | — |
| | 459 |
| | 12,548 |
|
| Total other-than-temporary-impairment charges | | $ | 395 |
| | $ | 459 |
| | $ | 18,307 |
|
59
United Fire & Casualty Company Form 10-K | 2010
The charges that occurred in all three years represented less than 1.0 percent of our investment portfolio at the balance sheet date.
Net Unrealized Gains and Losses
As of December 31, 20102011, net unrealized gains, after tax, totaled $102.6$124.4 million, compared to $82.5$102.6 million and $25.5$82.5 million as of December 31, 20092010 and 20082009, respectively. In both2011, our acquisition of Mercer Insurance Group increased our holdings of fixed maturity securities that, in connection with a decrease in market interest rates, led to an increase in our net unrealized gains. In 2010, and 2009, the improvement in the equity markets and a decrease in market
United Fire Group, Inc. Form 10-K | 2011
interest rates led to an increase in the carrying value of our fixed maturity and equity securities, which improved our net unrealized gains. We have and will continue to closely monitor market conditions and evaluate the long-term impact of the market volatility experienced in recent years on all of our investment holdings.
Changes in unrealized gains on available-for-sale securities do not affect net income (loss) and earnings (loss)& nbsp;per share, but do impact comprehensive income, (loss), stockholders’ equity and book value per share. We believe that our unrealized losses on available-for-sale securities at December 31, 2010, are temporary basedBased upon both our current analysis of the issuers of the securities that we hold and on current market conditions. It is possibleconditions, we believe that we could recognize impairmentour unrealized losses in future periods on available-for-sale securities that we own at December 31, 20102011, ifare temporary. If future events and information cause us to determine that a decline in value is other-than-temporary.other-than-temporary, it is possible that we could recognize impairment write-downs in future periods on securities that we own at December 31, 2011. However, we endeavor to invest in high quality assets to provide protection from future credit quality issues and corresponding impairment write-downs.T hewrite-downs. The following table summarizes the change in our net unrealized gains:
| | (In Thousands) Years Ended December 31 | | 2010 | | 2009 | | 2008 | 2011 | | 2010 | | 2009 |
| Net changes in unrealized investment gains | | | | | | | |
| Changes in net unrealized investment gains | | | | | | |
| Available-for-sale fixed maturity securities | | $ | 17,105 | | | $ | 126,555 | | | $ | (70,516 | ) | $ | 34,699 |
| | $ | 17,105 |
| | $ | 126,555 |
|
| Equity securities | | 16,155 | | | 24,673 | | | (58,130 | ) | (4,675 | ) | | 16,155 |
| | 24,673 |
|
| Deferred policy acquistion costs | | (2,172 | ) | | (63,425 | ) | | 36,284 | | |
| Deferred policy acquisition costs | | 3,402 |
| | (2,172 | ) | | (63,425 | ) |
| Income tax effect | | (10,930 | ) | | (30,855 | ) | | 32,326 | | (11,699 | ) | | (10,930 | ) | | (30,855 | ) |
| Change in net unr ealized gains | | $ | 20,158 | | | $ | 56,948 | | | $ | (60,036 | ) | |
| Total change in net unrealized gains, net of tax | | $ | 21,727 |
| | $ | 20,158 |
| | $ | 56,948 |
|
Refer to “Critical Accounting Estimates” in this section for a detailed discussion of our policy for recording OTTI charges.
Market Risk
Our Consolidated Balance Sheets include financial instruments whose fair values are subject to market risk. The active management of market risk is integral to our operations. Market risk is the potential for loss due to a decrease in the fair value of securities resulting from uncontrollable fluctuations such as: interest rate risk, equity price risk, foreign exchange risk, credit risk, inflation, or world political conditions. Our primary mark etmarket risk exposure is to changes in interest rates. We also have limited exposure to equity price risk and foreign exchange risk.
Interest Rate Risk
Interest rate risk is the price sensitivity of a fixed maturity security or portfolio of securities to changes in interest rates. We invest in fixed maturity and other interest rate sensitive securities. While it is generally our intent to hold our investments in fixed maturity securities to maturity, we have classified a majority of our fixed maturity portfolio as available-for-sale. Available-for-sale fixed maturity securities are carried at fair value on the balance sheet with unrealized gains or losses reported net of tax in accumulated other comprehensive income .income.
Increases and decreases in prevailing interest rates generally translate into decreases and increases in the fair value of our fixed maturity securities. Additionally, fair values of interest rate sensitive securities may be affected by the creditworthiness of the issuer, prepayment options, relative values of alternative investments, the liquidity of the instrument and other general market conditions.
United Fire & Casualty Company Form 10-K | 2010
Market Risk and Duration
The active management of market risk is integral to our operations. We analyze potential changes in the value of our investment portfolio due to the market risk factors noted ab oveabove within the overall context of asset and liability management. A technique we use in the management of our investment portfolio and reserve portfolioliabilities is the calculation of duration. Our actuaries estimate the payout pattern of our reserve liabilities to determine their duration, which is the present value of the weighted average payments expressed in years. We then establish a target duration for our investment portfolio so that at any given time the estimated cash generated by the investment portfolio will match the estimated cash flowing outrequired for the payment of the reserve portfolio.
United Fire Group, Inc. Form 10-K | 2011
related reserves. We structure the investment portfolio to meet the target duration to achieve the required cash flow, based on liquidity and market risk factors.
Duration relates primarily to our life insurance segment because the long-term nature of these reserve liabilities increases the importance of projecting estimated cash flows over an extended time frame. At December 31, 20102011, our life insurance segment had $948.9999.5 million in deferred annuity liabilities that were specifically allocated to investments in fixed maturity securities.
The duration forof the life insurance segmentsegment's investment portfolio must take into consideration interest rate risk. This is accomplished through the use of sensitivity analysis, which measures the price sensitivity of the fixed maturities to changes in interest rates. The alternative valuations of the investment portfolio, given the various hypothetical interest r aterate changes utilized by the sensitivity analysis, allow management to revalue the potential cash flow from the investment portfolio under varying market interest rate scenarios. Duration can then be recalculated at the differing levels of projected cash flows.
Impact of Interest Rate Changes
The amounts set forth in the following tables detail the impact of hypothetical interest rate changes on the fair value of fixed maturity securities held at December 31, 20102011 and 20092010. The sensitivity analysis measures the change in fair values arising from immediate changes in selected interest rate scenarios. We employed hypothetical parallel shifts in the yield curve of plus or minus 100 and 200 basis points in the simulations. Additionally, based upon the yield curve shifts, we employ estimates of prepayment speeds for mortgage-related products and the likelihood of call or put options being exercised within the simulations. According to this analysis, at current levels of interest rates, the duration of the investments supporting the deferred annuity liabilities is 0.700.34 years shorterlonger than the projected duration of the liabilities. If interest rates increase by 100 basis points, the duration of the investments supporting the deferred annuity liabilities would be 0.270.75 years longershorter than the projected duration of the liabilities.
The selection of a 100-basis-point increase in interest rates should not be construed as a prediction by our management of future market events, but rather as an illustration of the potential impact of an event.
United Fire & Casualty CompanyGroup, Inc. Form 10-K | 20102011
| | | | | | | | | | | | | | | | | | | | |
| December 31, 2010 | | -200 Basis | &nb sp; | -100 Basis | | | | +100 Basis | | + 200 Basis |
| (In Thousands) | | Points | | Points | | Base | | Points | | Points |
| HELD-TO-MATURITY | | | | | | | | | | |
| Fixed maturities | | | | | | | | | | |
| Bonds | | | | | | | | | | |
| United States government | | | | | | | | | | |
| Collateralized mortgage obligations | | $ | 89 | | | $ | 88 | | | $ | 87 | | | $ | 86 | | | $ | 84 | |
| Mortgage-backed securities | | 508 | | | 502 | | | 494 | | | 485 | | | 475 | |
| States, municipalities and political subdivisions | | | | | | | | | | |
| General obligations | | 782 | | | 761 | | | 741 | | | 722 | | | 704 | |
| Special revenue | | 5,383 | | | 5,238 | | | 5,100 | | | 4,965 | | | 4,836 | |
| Total Held-to-Maturity Fixed Maturities | | $ | 6,762 | | | $ | 6,589 | | | $ | 6,422 | | | $ | 6,258 | | | $ | 6,099 | |
| AVAILABLE-FOR-SALE | | | | | | | | | | |
| Fixed maturities | | | | | | | | | | |
| Bonds | | | | | | | | | | |
| United States government | | | | | | | | | | |
| Collateralized mortgage obligations | | $ | 21,178 | | | $ | 20,43 5 | | | $ | 19,577 | | | $ | 18,682 | | | $ | 17,793 | |
| Mortgage-backed securities | | 2 | | | 2 | | | 2 | | | 2 | | | 2 | |
| U.S. Treasury | | 41,057 | | | 40,048 | | | 39,076 | | | 38,141 | | | 37,240 | |
| Agency | | 105,348 | | | 104,868 | | | 103,131 | | | 98,919 | | | 93,668 | |
| States, municipalities and political subdivisions | | | | | | | | | | |
| General obligations | | 446,917 | | | 419,334 | | | 393,781 | | | 370,084 | | | 348,100 | |
| Special revenue | | 253,353 | | | 238,866 | | | 225,433 | | | 212,967 | | | 201,390 | |
| Foreign bonds | | | | | | | | | | |
| Canadian | | 77,147 | | | 75,020 | | | 72,923 | | | 70,878 | | | 68,915 | |
| Other | | 95,475 | | | 92,553 | | | 89,754 | | | 87,073 | | | 84,503 | |
| Public utilities | | &n bsp; | | | | ; | | | | |
| Electric | | 228,095 | | | 221,675 | | | 215,544 | | | 209,697 | | | 204,110 | |
| Natural gas | | 61,871 | | | 60,436 | | | 59,074 | | | 57,780 | | | 56,550 | |
| Other | | 4,095 | | | 3,886 | | | 3,690 | | | 3,508 | | | 3,338 | |
| Corporate bonds | | | | | | | | | | |
| Banks, trusts and insurance companies | | 290,349 | | | 282,920 | | | 275,720 | | | 268,553 | | | 261,603 | |
| Transportation | | 28,002 | | | 27,314 | | | 26,657 | | | 26,028 | | | 25,427 | |
| Energy | | 166,272 | | | 161,956 | | | 157,804 | | | 153,816 | | | 149,979 | |
| Technology | | 115,304 | | | 111,782 | | | 108,420 | | | 105,212 | | | 102,130 | |
| Basic industry | | 128,264 | | | 124,885 | | | 121,639 | | | 118,518 | | | 115,493 | |
| Credit cyclicals | | 71,304 | | | 69,529 | | | 67,822 | | | 66,180 | | | 64,601 | |
| Other | | 317,204 | | | 307,540 | | | 298,382 | | | 289,703 | | | 281,461 | |
| Total Available-For-Sale Fixed Maturities | | $ | 2,451,237 | | | $ | 2,363,049 | | | $ | 2,278,429 | | | $ | 2,195,741 | | | $ | 2,116,303 | |
| TRADING | | | | | | | | | | |
| Fixed maturities | | | | | | | | | | |
| Bonds | | | | | | | | | | |
| Foreign bonds | | $ | 3,336 | | | $ | 2,751 | | | $ | 2,283 | | | $ | 1,907 | | | $ | 1,603 | |
| Corporate bonds | | | | | | | | | | |
| Banks, trusts and insurance companies | | 1,533 | | | 1,349 | | | 1,198 | | | 1,072 | | | 967 | |
| Energy | | 3,371 | | | 3,087 | | | 2,844 | | | 2,636 | | | 2,457 | |
| Technology | | 4,620 | | | 3,895 | | | 3,311 | | | 2,841 | | | 2,459 | |
| Other | | 384 | | | 384 | | | 384 | | | 384 | | | 384 | |
| Redeemable preferred stock | | 2,866 | | | 2,866 | | | 2,866 | | | 2,866 | | | 2,866 | |
| Total Trading Fixed Maturities | | $ | 16,110 | | | $ | 14,332 | | | $ | 12,886 | | | $ | 11,706 | | | $ | 10,736 | |
| Total Fixed Maturity Securities | | $ | 2,474,109 | | | $ | 2,383,970 | | | $ | 2,297,737 | | | $ | 2,213,705 | | | $ | 2,133,138 | |
|
| | | | | | | | | | | | | | | | | | | |
| December 31, 2011 | -200 Basis | | -100 Basis | | | | +100 Basis | | + 200 Basis |
| (In Thousands) | Points | | Points | | Base | | Points | | Points |
| HELD-TO-MATURITY | | | | | | | | | |
| Fixed maturities | | | | | | | | | |
| Bonds | | | | | | | | | |
| States, municipalities and political subdivisions | | | | | | | | | |
| General obligations | $ | 502 |
| | $ | 502 |
| | $ | 501 |
| | $ | 501 |
| | $ | 500 |
|
| Special revenue | | | | | | | | | |
| Midwest | | | | | | | | | |
| North central - East | 257 |
| | 256 |
| | 254 |
| | 252 |
| | 251 |
|
| North central - West | 231 |
| | 230 |
| | 230 |
| | 230 |
| | 230 |
|
| South | 586 |
| | 580 |
| | 573 |
| | 567 |
| | 561 |
|
| West | 2,177 |
| | 2,174 |
| | 2,172 |
| | 2,169 |
| | 2,154 |
|
| Collateralized mortgage obligations | 50 |
| | 50 |
| | 50 |
| | 49 |
| | 48 |
|
| Mortgage-backed securities | 391 |
| | 388 |
| | 381 |
| | 374 |
| | 366 |
|
| Total Held-to-Maturity Fixed Maturities | $ | 4,194 |
| | $ | 4,180 |
| | $ | 4,161 |
| | $ | 4,142 |
| | $ | 4,110 |
|
| AVAILABLE-FOR-SALE | | | | | | | | | |
| Fixed maturities | | | | | | | | | |
| Bonds | | | | | | | | | |
| U.S. government and government-sponsored enterprises | | | | | | | | | |
| U.S. Treasury | $ | 46,012 |
| | $ | 44,963 |
| | $ | 43,951 |
| | $ | 42,974 |
| | $ | 42,030 |
|
| Agency | 97,679 |
| | 97,161 |
| | 96,395 |
| | 92,542 |
| | 86,056 |
|
| States, municipalities and political subdivisions | | | | | | | | | |
| General obligations | | | | | | | | | |
| Midwest | | | | | | | | | |
| North central - East | 139,247 |
| | 134,349 |
| | 129,605 |
| | 124,797 |
| | 119,641 |
|
| North central - West | 90,417 |
| | 87,322 |
| | 84,311 |
| | 81,334 |
| | 78,242 |
|
| Northeast | 44,269 |
| | 42,524 |
| | 40,863 |
| | 39,240 |
| | 37,569 |
|
| South | 123,952 |
| | 119,628 |
| | 115,473 |
| | 111,350 |
| | 107,101 |
|
| West | 80,522 |
| | 77,412 |
| | 74,378 |
| | 71,294 |
| | 68,027 |
|
| Special revenue | | | | | | | | | |
| Midwest | | | | | | | | | |
| North central - East | 76,002 |
| | 73,353 |
| | 70,813 |
| | 68,295 |
| | 65,657 |
|
| North central - West | 60,837 |
| | 58,002 |
| | 55,236 |
| | 52,421 |
| | 49,550 |
|
| Northeast | 15,932 |
| | 15,316 |
| | 14,733 |
| | 14,176 |
| | 13,634 |
|
| South | 111,824 |
| | 107,354 |
| | 103,074 |
| | 98,859 |
| | 94,684 |
|
| West | 65,291 |
| | 62,376 |
| | 59,621 |
| | 56,959 |
| | 54,305 |
|
| Foreign bonds | | | | | | | | | |
| Canadian | 76,525 |
| | 74,305 |
| | 72,176 |
| | 70,061 |
| | 68,007 |
|
| Other foreign | 155,017 |
| | 148,627 |
| | 142,639 |
| | 137,018 |
| | 131,734 |
|
| Public utilities | | | | | | | | | |
| Electric | 251,265 |
| | 242,099 |
| | 233,479 |
| | 225,368 |
| | 217,715 |
|
| Gas distribution | 28,109 |
| | 26,839 |
| | 25,658 |
| | 24,557 |
| | 23,532 |
|
| Other | 11,706 |
| | 11,310 |
| | 10,934 |
| | 10,577 |
| | 10,237 |
|
| Corporate bonds | | | | | | | | | |
| Oil and gas | 212,074 |
| | 204,406 |
| | 197,192 |
| | 190,396 |
| | 183,983 |
|
| Chemicals | 66,783 |
| | 64,452 |
| | 62,261 |
| | 60,197 |
| | 58,251 |
|
| Basic resources | 26,729 |
| | 25,345 |
| | 24,061 |
| | 22,867 |
| | 21,760 |
|
| Construction and materials | 25,514 |
| | 24,907 |
| | 24,330 |
| | 23,779 |
| | 23,253 |
|
| Industrial goods and services | 200,057 |
| | 192,293 |
| | 185,025 |
| | 178,112 |
| | 171,515 |
|
| Autos and parts | 20,117 |
| | 19,140 |
| | 18,229 |
| | 17,378 |
| | 16,582 |
|
| Food and beverage | 73,665 |
| | 71,388 |
| | 69,241 |
| | 67,215 |
| | 65,298 |
|
| Personal and household goods | 65,936 |
| | 63,892 |
| | 61,963 |
| | 60,137 |
| | 58,409 |
|
| Health care | 125,233 |
| | 120,292 |
| | 115,671 |
| | 111,344 |
| | 107,284 |
|
| Retail | 64,555 |
| | 62,239 |
| | 60,063 |
| | 58,014 |
| | 56,084 |
|
| Media | 45,591 |
| | 43,711 |
| | 41,969 |
| | 40,351 |
| | 38,846 |
|
| Travel and leisure | 2,858 |
| | 2,766 |
| | 2,678 |
| | 2,593 |
| | 2,511 |
|
United Fire & Casualty CompanyGroup, Inc. Form 10-K | 20102011
| | | | | | | | | | | | | | | | | | | | |
| December 31, 2009 | | -200 Basis | | -100 Basis | | | | +100 Basis | | +200 Basis |
| (In Thousands) | | Points | | Points | | Base | | Points | | Points |
| HELD-TO-MATURITY | | | | | | | | | | |
| Fixed maturities | | | | | | | | | | |
| Bonds | | | | | | | | | | |
| United States government | | | | | | | | | | |
| Collateralized mortgage obligations | | $ | 981 | | | $ | 979 | | | $ | 976 | | | $ | 972 | | | $ | 966 | |
| Mortgage-backed securities | | 625 | | | 617 | | | 607 | | | 596 | | | 582 | |
| States, municipalities and political subdivisions | | | | | | | | | | |
| General obligations | | 1,521 | | | 1,513 | | | 1,495 | | | 1,454 | | | 1,412 | |
| Special revenue | | 7,018 | | | 6,831 | | | 6,642 | | | 6,430 | | | 6,225 | |
| Total Held-to-Maturity Fixed Maturities | | $ | 10,145 | | | $ | 9,940 | | | $ | 9,720 | | | $ | 9,452 | | | $ | 9,185 | |
| AVAILABLE-FOR-SALE | | | | | | | | | | |
| Fixed maturities | | | | | | | | | | |
| Bonds | | | | | | | | | | |
| United States government | | | | | | | | | | |
| Collateralized mortgage obligations | | $ | 20,967 | | | $ | 20,006 | | | $ | 18,952 | | | $ | 17,895 | | | $ | 16,877 | |
| Mortgage-backed securities | | 2 | | | 2 | | | 2 | | | 2 | | | 2 | |
| U.S. Treasury | | 37,446 | | | 36,531 | | | 35,650 | | | 34,806 | | | 33,993 | |
| Agency | | 72,621 | | | 72,262 | | | 70,625 | | | 66,681 | | | 62,095 | |
| States, municipalities and political subdivisions | | | | | | | | | | |
| General obligations | | 438,949 | | | 415,235 | | | 390,378 | | | 365,631 | | | 342,414 | |
| Special revenue | | 254,712 | | | 241,178 | | | 227,362 | | | 213,532 | | | 200,584 | |
| Foreign bonds | | | | | | | | | | |
| Canadian | | 62,555 | | | 60,664 | | | 58,826 | | | 57,056 | | | 55,359 | |
| Other | | 87,265 | | | 84,788 | | | 82,414 | | | 80,137 | | | 77,955 | |
| Public utilities | | | | | | | | | | |
| Electric | | 236,852 | | | 230,288 | | | 224,004 | | | 217,882 | | | 211,870 | |
| Natural gas | | 60,775 | | | 59,258 | | | 57,806 | | | 56,416 | | | 55,084 | |
| Other | | 4,216 | | | 3,989 | | | 3,778 | | | 3,581 | | | 3,398 | |
| Corporate bonds | | | | | | | | | | |
| Banks, trusts and insurance companies | | 306,419 | | | 297,703 | | | 289,209 | | | 280,924 | | | 272,999 | |
| Transportation | | 33,495 | | | 32,828 | | | 32,187 | | | 31,570 | | | 30,977 | |
| Energy | | 160,027 | | | 156,110 | | | 152,339 | | | 148,706 | | | 145,208 | |
| Technology | | 94,532 | | | 91,807 | | | 89,172 | | | 86,607 | | | 84,141 | |
| Basic industry | | 115,732 | | | 112,597 | | | 109,567 | | | 106,600 | | | 103,704 | |
| Credit cyclicals | | 75,894 | | | 74,209 | | | 72,585 | | | 71,018 | | | 69,438 | |
| Other | | 258,085 | | | 250,618 | | | 243,535 | | &nb sp; | 236,806 | | | 230,405 | |
| Total Available-For-Sale Fixed Maturities | | $ | 2,320,544 | | | $ | 2,240,073 | | | $ | 2,158,391 | | | $ | 2,075,850 | | | $ | 1,996,503 | |
| TRADING | | | | | | | | | | |
| Fixed maturities | | | | | | | | | | |
| Bonds | | | | | | | | | | |
| Foreign bonds | | $ | 2,788 | | | $ | 2,738 | | | $ | 2,689 | | | $ | 2,642 | | | $ | 2,595 | |
| Public uti lities | | | | | | | | | | |
| Electric | | 1,460 | | | 1,460 | | | 1,460 | | | 1,460 | | | 1,460 | |
| Corporate bonds | | | | | | | | | | |
| Energy | | 2,379 | | | 2,345 | | | 2,310 | | | 2,278 | | | 2,245 | |
| Technology | | 4,669 | | | 4,515 | | | 4,314 | | | 4,102 | | | 3,906 | |
| Other | | 678 | | | 597 | | | 532 | | | 477 | | | 432 | |
| Redeemable preferred stock | | 1,308 | | | 1,308 | | | 1,308 | | | 1,308 | | | 1,308 | |
| Total Trading Fixed Maturities | | $ | 13,282 | | | $ | 12,963 | | | $ | 12,613 | | | $ | 12,267 | | | $ | 11,946 | |
| Total Fixed Maturity Securities | | $ | 2,343,971 | | | $ | 2,262,976 | | | $ | 2,180,724 | | | $ | 2,097,569 | | | $ | 2,017,634 | |
|
| | | | | | | | | | | | | | | | | | | |
| Telecommunications | 42,464 |
| | 41,149 |
| | 39,915 |
| | 38,755 |
| | 37,663 |
|
| Banks | 137,620 |
| | 134,682 |
| | 131,876 |
| | 129,114 |
| | 126,430 |
|
| Insurance | 25,326 |
| | 24,490 |
| | 23,700 |
| | 22,952 |
| | 22,242 |
|
| Real estate | 24,956 |
| | 23,952 |
| | 23,022 |
| | 22,159 |
| | 21,356 |
|
| Financial services | 90,597 |
| | 88,609 |
| | 86,703 |
| | 84,873 |
| | 83,113 |
|
| Technology | 33,652 |
| | 32,321 |
| | 31,064 |
| | 29,876 |
| | 28,750 |
|
| Collateralized mortgage obligations |
|
| |
|
| |
|
| |
|
| |
|
|
| Government | 90,704 |
| | 87,682 |
| | 82,691 |
| | 76,357 |
| | 69,576 |
|
| Other | 232 |
| | 191 |
| | 160 |
| | 147 |
| | 134 |
|
| Mortgage backed securities | 35,480 |
| | 35,646 |
| | 35,390 |
| | 34,474 |
| | 32,910 |
|
| Asset-backed securities | 6,660 |
| | 6,474 |
| | 6,296 |
| | 6,128 |
| | 5,967 |
|
| Redeemable preferred stock | 439 |
| | 424 |
| | 409 |
| | 395 |
| | 382 |
|
| Total Available-For-Sale Fixed Maturities | $ | 2,891,848 |
| | $ | 2,793,391 |
| | $ | 2,697,248 |
| | $ | 2,599,435 |
| | $ | 2,500,020 |
|
| TRADING | | | | | | | | | |
| Fixed maturities | | | | | | | | | |
| Bonds | | | | | | | | | |
| Foreign bonds | | | | | | | | | |
| Canadian | $ | 1,612 |
| | $ | 1,570 |
| | $ | 1,530 |
| | $ | 1,490 |
| | $ | 1,452 |
|
| Other foreign | 1,471 |
| | 1,455 |
| | 1,376 |
| | 1,166 |
| | 952 |
|
| Corporate bonds | | | | | | | | | |
| Basic resources | 1,448 |
| | 1,445 |
| | 1,443 |
| | 1,440 |
| | 1,437 |
|
| Food and beverage | 1,093 |
| | 1,076 |
| | 1,059 |
| | 1,042 |
| | 1,026 |
|
| Health care | 1,943 |
| | 1,671 |
| | 1,450 |
| | 1,271 |
| | 1,126 |
|
| Banks | 1,565 |
| | 1,399 |
| | 1,237 |
| | 1,095 |
| | 971 |
|
| Insurance | 490 |
| | 464 |
| | 440 |
| | 416 |
| | 394 |
|
| Financial services | 479 |
| | 429 |
| | 386 |
| | 349 |
| | 317 |
|
| Technology | 2,127 |
| | 1,754 |
| | 1,458 |
| | 1,220 |
| | 1,030 |
|
| Redeemable preferred stock | 3,102 |
| | 3,089 |
| | 3,075 |
| | 3,063 |
| | 3,050 |
|
| Total Trading Fixed Maturities | $ | 15,330 |
| | $ | 14,352 |
| | $ | 13,454 |
| | $ | 12,552 |
| | $ | 11,755 |
|
| Total Fixed Maturity Securities | $ | 2,911,372 |
| | $ | 2,811,923 |
| | $ | 2,714,863 |
| | $ | 2,616,129 |
| | $ | 2,515,885 |
|
United Fire Group, Inc. Form 10-K | 2011
|
| | | | | | | | | | | | | | | | | | | |
| December 31, 2010 | -200 Basis | | -100 Basis | | | | +100 Basis | | +200 Basis |
| (In Thousands) | Points | | Points | | Base | | Points | | Points |
| HELD-TO-MATURITY | | | | | | | | | |
| Fixed maturities | | | | | | | | | |
| Bonds | | | | | | | | | |
| States, municipalities and political subdivisions | | | | | | | | | |
| General obligations | $ | 782 |
| | $ | 761 |
| | $ | 741 |
| | $ | 722 |
| | $ | 704 |
|
| Special revenue | | | | | | | | | |
| Midwest | | | | | | | | | |
| North central - East | 405 |
| | 397 |
| | 391 |
| | 383 |
| | 376 |
|
| North central - West | 536 |
| | 523 |
| | 511 |
| | 499 |
| | 487 |
|
| Northeast | 247 |
| | 244 |
| | 242 |
| | 240 |
| | 238 |
|
| South | 1,006 |
| | 984 |
| | 963 |
| | 944 |
| | 924 |
|
| West | 3,189 |
| | 3,089 |
| | 2,993 |
| | 2,900 |
| | 2,811 |
|
| Collateralized mortgage obligations | 89 |
| | 88 |
| | 87 |
| | 86 |
| | 84 |
|
| Mortgage-backed securities | 508 |
| | 502 |
| | 494 |
| | 485 |
| | 475 |
|
| Total Held-to-Maturity Fixed Maturities | $ | 6,762 |
| | $ | 6,588 |
| | $ | 6,422 |
| | $ | 6,259 |
| | $ | 6,099 |
|
| AVAILABLE-FOR-SALE | | | | | | | | | |
| Fixed maturities | | | | | | | | | |
| Bonds | | | | | | | | | |
| U.S. government and government-sponsored enterprises | | | | | | | | | |
| U.S. Treasury | $ | 41,057 |
| | $ | 40,048 |
| | $ | 39,076 |
| | $ | 38,141 |
| | $ | 37,240 |
|
| Agency | 105,348 |
| | 104,868 |
| | 103,131 |
| | 98,919 |
| | 93,668 |
|
| States, municipalities and political subdivisions | | | | | | | | | |
| General obligations | | | | | | | | | |
| Midwest | | | | | | | | | |
| North central - East | 145,061 |
| | 136,082 |
| | 127,770 |
| | 120,069 |
| | 112,929 |
|
| North central - West | 91,965 |
| | 86,348 |
| | 81,132 |
| | 76,282 |
| | 71,774 |
|
| Northeast | 33,299 |
| | 31,343 |
| | 29,525 |
| | 27,836 |
| | 26,265 |
|
| South | 112,383 |
| | 105,595 |
| | 99,297 |
| | 93,452 |
| | 88,021 |
|
| West | 64,210 |
| | 59,966 |
| | 56,053 |
| | 52,444 |
| | 49,110 |
|
| Special revenue | | | | | | | | | |
| Midwest | | | | | | | | | |
| North central - East | 68,036 |
| | 64,445 |
| | 61,093 |
| | 57,962 |
| | 55,035 |
|
| North central - West | 45,709 |
| | 42,897 |
| | 40,305 |
| | 37,912 |
| | 35,703 |
|
| Northeast | 5,385 |
| | 5,051 |
| | 4,743 |
| | 4,457 |
| | 4,193 |
|
| South | 84,160 |
| | 79,271 |
| | 74,747 |
| | 70,558 |
| | 66,676 |
|
| West | 50,035 |
| | 47,188 |
| | 44,545 |
| | 42,089 |
| | 39,807 |
|
| Foreign bonds | | | | | | | | | |
| Canadian | 77,147 |
| | 75,020 |
| | 72,923 |
| | 70,878 |
| | 68,915 |
|
| Other foreign | 95,475 |
| | 92,553 |
| | 89,754 |
| | 87,073 |
| | 84,503 |
|
| Public utilities | | | | | | | | | |
| Electric | 239,027 |
| | 232,018 |
| | 225,324 |
| | 218,938 |
| | 212,835 |
|
| Gas distribution | 23,516 |
| | 22,831 |
| | 22,185 |
| | 21,574 |
| | 20,996 |
|
| Other | 21,964 |
| | 21,769 |
| | 21,580 |
| | 21,398 |
| | 21,222 |
|
| Corporate bonds | | | | | | | | | |
| Oil and gas | 195,117 |
| | 190,179 |
| | 185,436 |
| | 180,885 |
| | 176,513 |
|
| Chemicals | 58,091 |
| | 56,499 |
| | 54,971 |
| | 53,497 |
| | 52,055 |
|
| Basic resources | 7,793 |
| | 7,607 |
| | 7,427 |
| | 7,252 |
| | 7,082 |
|
| Construction and materials | 21,241 |
| | 20,741 |
| | 20,258 |
| | 19,789 |
| | 19,336 |
|
| Industrial goods and services | 162,848 |
| | 158,887 |
| | 155,058 |
| | 151,193 |
| | 147,416 |
|
| Autos and parts | 19,361 |
| | 18,860 |
| | 18,384 |
| | 17,929 |
| | 17,496 |
|
| Food and beverage | 76,973 |
| | 75,475 |
| | 74,033 |
| | 72,648 |
| | 71,314 |
|
| Personal and household goods | 73,331 |
| | 71,319 |
| | 69,387 |
| | 67,534 |
| | 65,755 |
|
| Health care | 89,875 |
| | 86,512 |
| | 83,342 |
| | 80,351 |
| | 77,524 |
|
| Retail | 46,727 |
| | 45,309 |
| | 43,960 |
| | 42,675 |
| | 41,453 |
|
| Media | 35,874 |
| | 34,520 |
| | 33,254 |
| | 32,067 |
| | 30,952 |
|
United Fire Group, Inc. Form 10-K | 2011
|
| | | | | | | | | | | | | | | | | | | |
| Travel and leisure | 6,143 |
| | 6,002 |
| | 5,866 |
| | 5,735 |
| | 5,609 |
|
| Telecommunications | 38,444 |
| | 37,703 |
| | 36,984 |
| | 36,285 |
| | 35,592 |
|
| Banks | 128,570 |
| | 125,057 |
| | 121,634 |
| | 118,278 |
| | 115,048 |
|
| Insurance | 27,886 |
| | 27,160 |
| | 26,467 |
| | 25,805 |
| | 25,173 |
|
| Real estate | 23,808 |
| | 22,733 |
| | 21,737 |
| | 20,812 |
| | 19,951 |
|
| Financial services | 87,856 |
| | 85,611 |
| | 83,455 |
| | 81,386 |
| | 79,398 |
|
| Technology | 18,312 |
| | 17,476 |
| | 16,688 |
| | 15,947 |
| | 15,248 |
|
| Collateralized mortgage obligations | 21,178 |
| | 20,435 |
| | 19,577 |
| | 18,682 |
| | 17,793 |
|
| Mortgage backed securities | 2 |
| | 2 |
| | 2 |
| | 2 |
| | 2 |
|
| Asset-backed securities | 7,953 |
| | 7,630 |
| | 7,326 |
| | 7,039 |
| | 6,769 |
|
| Total Available-For-Sale Fixed Maturities | $ | 2,451,160 |
| | $ | 2,363,010 |
| | $ | 2,278,429 |
| | $ | 2,195,773 |
| | $ | 2,116,371 |
|
| TRADING | | | | | | | | | |
| Fixed maturities | | | | | | | | | |
| Bonds | | | | | | | | | |
| Foreign bonds | $ | 3,336 |
| | $ | 2,751 |
| | $ | 2,283 |
| | $ | 1,907 |
| | $ | 1,603 |
|
| Corporate bonds | | | | | | | | | |
| Oil and gas | 3,371 |
| | 3,087 |
| | 2,843 |
| | 2,636 |
| | 2,457 |
|
| Health care | 2,563 |
| | 2,208 |
| | 1,917 |
| | 1,678 |
| | 1,480 |
|
| Banks | 1,533 |
| | 1,349 |
| | 1,198 |
| | 1,072 |
| | 967 |
|
| Financial services | 384 |
| | 384 |
| | 384 |
| | 384 |
| | 384 |
|
| Technology | 2,060 |
| | 1,688 |
| | 1,394 |
| | 1,162 |
| | 977 |
|
| Redeemable preferred stock | 2,866 |
| | 2,866 |
| | 2,867 |
| | 2,866 |
| | 2,866 |
|
| Total Trading Fixed Maturities | $ | 16,113 |
| | $ | 14,333 |
| | $ | 12,886 |
| | $ | 11,705 |
| | $ | 10,734 |
|
| Total Fixed Maturity Securities | $ | 2,474,035 |
| | $ | 2,383,931 |
| | $ | 2,297,737 |
| | $ | 2,213,737 |
| | $ | 2,133,204 |
|
To the extent actual results differ from the assumptions utilized;utilized our duration and interest rate measures could be significantly affected. As a result, these calculations may not fully capture the impact of nonparallel changes in the relationship between short-term and long-term interest rates.
United Fire & Casualty Company For m 10-K | 2010
Equity Price Risk
Equity price risk is the potential loss arising from changes in the fair value of equity securities. Our exposure to this risk relates tosecurities held in our equity securities portfolio and covered call options that we write from time to time to generate additional portfolio income.portfolio. The carrying values of our equity securities are based on quoted market prices as of the balance sheet date. Market prices of equity securities, in general, are subject to fluctuations that could cause the amount to be realized upon the future sale of the securities to differ significantly from the current reported value. The fluctuations may result from perceived changes in the underlying econom iceconomic characteristics of the issuer of securities, the relative price of alternative investments, general market conditions, and supply and demand imbalances for a particular security.
Impact of Price Change
The following table details the effect on the fair value of our investments in equity securities for a positive and negative 10 percent price change at December 31, 20102011 and 20092010:
| | | (In Thousands) | | -10% | | Base | | +10% | | -10% | | Base | | +10% |
| Estimated fair value of equity securities at | | | | | | | | | | | | |
| December 31, 2011 | | | $ | 143,506 |
| | $ | 159,451 |
| | $ | 175,396 |
|
| December 31, 2010 | | $ | 134,735 | | | $ | 149,706 | | | $ | 164,677 | | | 134,735 |
| | 149,706 |
| | 164,677 |
|
| December 31, 2009 | | 119,446 | | | 132,718 | | | 145,990 | | |
Foreign Currency Exchange Rate Risk
Foreign currency exchange rate risk arises from the possibility that changes in foreign exchange rates will impact our transactions with foreign reinsurers relating to the settlement of amounts due to or from foreign reinsurers in the normal course of business. We consider this risk to be immaterial to our operations.
United Fire Group, Inc. Form 10-K | 2011
Credit Risk
We base our investment decisions on the credit characteristics of individual securities; however, we have within our municipal bond portfolio a number of securities whose ratings were enhanced by third-party insurance for the payment of principal and interest in the event of an issuer default. A downgrade in the credit ratings of the insurers of these securities in 20102011 and 20092010 resulted in a corresponding downgrade in the ratings of the securities. Of the insured municipal securities in our investment portfolio, 88.493.0 percent and 95.188.4 percent were rated single “A” or above, and 65.457.9 percent and 70.065.4 percent were rated “AA” or above at December 31, 20102011 and 20092010, respectively, without the benefit of insurance. Due to the underlying financial strength of the issuers of the securities, we believe that the loss of insurance would not have a material impact on our operations, financial position, or liquidity.
We reviewed our investment portfolio pertaining to securities g uaranteed by third parties, with both direct and indirect exposure. We have no direct exposure in any of the guarantors that guarantee our investments. Our largest indirect exposure with a single guarantor totaled $134.4$133.8 million or 31.228.8 percent of our insured municipal securities at December 31, 20102011, as compared to $129.7$134.4 million or 31.531.2 percent at December 31, 20092010. Our five largest indirect exposures to financial guarantors accounted for 79.677.6 percent and 79.079.6 percent of our insured municipal securities at December 31, 20102011 and 20092010, respectively.
|
|
| LIQUIDITY AND CAPITAL RESOURCES |
Liquidity measures our ability to generate sufficient cash flows to meet our short- and long-term cash obligations. Our cash inflows are primarily a result of collection of premiums, annuity deposits, reinsurance recoveries, sales or maturities of investments, and investment income. Cash provided from these sources is used primarily forto fund loss and loss settlement expenses, payment of policyholder benefits under life insurance contracts;contracts, annuity withdrawals, operating expenses,stockholder dividends, pension plan contributions, commissions, premium taxes, income taxes, operating expenses, and, in recent years, for common sharestock repurchases.
United Fire & Casualty Company Form 10-K | 2010
Cash outflows may be variable because of the uncertainty regarding settlement dates for losses. In addition, the timing and amount of individual catastrophe losses are inherently unpredictable and could increase our liquidity requirements. The timing and amount of reinsurance recoveries may be affected by reinsurer solvency and reinsurance cove ragecoverage disputes.
Historically, we have generated substantial cash inflows from operations. It is our policy to invest the cash generated from operations in securities with maturities that correlate to the anticipated timing of payments for losses and loss settlement expenses of the underlying insurance policies. The majority of our assets are invested in available-for-sale fixed maturity securities.
The following table displays a summary of cash sources and uses in 20102011, 20092010 and 20082009:
| | | Cash Flow Summary | | Years Ended December 31 | Years Ended December 31 |
| (In Thousands) | | 2010 | | 2009 | | 2008 | 2011 | | 2010 | | 2009 |
| Cash provided by (used in) | | | | | | | | | | | |
| Operating activities | | $ | 71,216 | | | $ | 100,409 | | | $ | 43,904 | | $ | 74,430 |
| | $ | 71,216 |
| | $ | 100,409 |
|
| Investing activities | | (94,711 | ) | | (130,089 | ) | | (107,255 | ) | (175,191 | ) | | (94,711 | ) | | (130,089 | ) |
| Financing activities | | 12,700 | | | 110,950 | | | (79,632 | ) | 65,231 |
| | 12,700 |
| | 110,950 |
|
| Net increase (decrease) in cash and cash equivalents | | $ | (10,795 | ) | | $ | 81,270 | | | $ | (142,983 | ) | $ | (35,530 | ) | | $ | (10,795 | ) | | $ | 81,270 |
|
United Fire Group, Inc. Form 10-K | 2011
Operating Activities
Net cash flows provided by operating activities totaled $74.4 million in 2011, compared to $71.2 million in 2010, compared to and $100.4 million in 2009 and $43.9 million in 2008, respectively. CashOperating cash flows in 2011 reflected a higher level of loss and loss settlement expense payments, and a lower level of investment income received from the prior year.
Operating cash flows in 2010 reflected a lower level of loss and loss settlement expense payments, a lower level of operating expenses paid and an increased level of investment income received.received from the prior year. Negatively impacting operating cash flows was a lower level of property and casualty insurance premiums collected. The increase in2009 operating cash flow for 2009 reflects an increase in loss payments;flows include a reduction in other assets of $29.0 million for the conclusion of certain litigation related to Hurricane Katrina; and a reduction in reinsurance recoveries due to the collection of payments during the year and thean improvement in our catastrophe experience in 2009 as compared to 2008.experience.
Our cash flows from operations were sufficient to meet our liquidity needs in 20102011, 20092010 and 20082009.
Investing Activities
Cash in excess of operating requirements is generally invested in fixed maturity securities and equity securities. Fixed maturities provide regular interest payments as well as the abilityand allow us to match the duration of our liabilities. Equity securities provide the potential for future increases in dividend income, potential dividend income growth or reduction and for app reciation.potential appreciation or depreciation. For further discussion of our investments, including our philosophy and portfolio, see the “Investments” section contained in this item.
In addition to investment income, possible sales of investments and proceeds from calls or maturities of fixed maturity securities can also can provide liquidity. During the next five years, $1.3 billion, or 58.449.1 percent, of our fixed maturity portfolio will mature.
We invest funds requ iredrequired for short-term cash needs primarily in money market accounts, which are classified as cash equivalents. At December 31, 20102011, our cash and cash equivalents included $34.462.9 million related to these money market accounts, compared with $96.234.4 million at December 31, 20092010.
Ne tNet cash flows used in investment activities totaled $175.2 million in 2011, compared to $94.7 million in 2010, compared to and $130.1 million in 2009. In 2011, we had cash inflows from scheduled and unscheduled investment maturities, redemptions, prepayments, and sales of investments that totaled $610.0 million compared to $482.5 million and $107.3399.6 million for the same period in 2010 and 2009, respectively. The increasing cash inflows over the last three years primarily relates to redemptions of fixed maturity securities that are reissued at lower interest rates as interest rates have been declining during this period.
Our cash outflows for investment purchases totaled $598.5 million in 20082011.The, compared to $575.2 million and $519.1 million for the same period in 2010 and 2009, respectively. We also had a net cash available from annuity deposits receivedoutflow in 2009 allowed us2011 of $172.6 million related to invest at a level in 2010, similar to 2008.our acquisition of Mercer Insurance Group.
In 2009, we continued to purchase a higher level of corporate fixed maturities rather than other investment vehicles such as short-term investments, which were less profitable due to the lower market interest rates.
United Fire & Casualty Company Form 10-K | 2010
Financing Activities
Net cash flows provided by financing activities totaled $65.2 million, $12.7 million, and $111.0 million in 2011, 2010, and 2009, respectively, compared to net cash used in financing activities totaling $79.6 million in 2008.respectively. Net cash from financing activities decreasedincreased in 2011 because our life insurance segment's annuity and universal life contract deposits exceeded withdrawals. Also affecting 2011 cash flows were borrowed funds totaling $124.9 million related to our acquisition of Mercer Insurance Group, of which $82.9 million was repaid in 2011. For further discussion of our outstanding debt, refer to Part II, Item 8, Note 17 “Debt.”
In 2010, net cash from financing activities decreased due to a lower volume of annuity deposits. Net cash flows from financing activities improved significantly in 2009 primari lywere primarily due to the life insurance segment'sdeposits from annuity and universal life contract depositscontracts exceeding withdrawals. We began to experience a slowdown inIn 2009, we experienced the amountlargest reduction of withdrawals in 2008,since 2005, which iswas indicative of the change in economic conditions and the inclination of consumers to choose products with less risk and guaranteed returns. This slowdown continued into 2009, with 2009 experiencing
United Fire Group, Inc. Form 10-K | 2011
Net cash inflows from our life insurance segment's annuity and universal life deposits totaled $51.0 million, in 2011, compared to $34.6 million and $128.4 million for the largest reduction of withdrawals since 2005.same period in 2010 and 2009, respectively.
Dividends
Dividends paid to stockholders totaled $15.815.5 million, $16.015.8 million and $16.216.0 million in 20102011, 20092010 and 20082009, respectively. Our practice has been to pay quarterly cash dividends, which we have paid every quarter since March 1968.
Payments of any future dividends an dand the amounts of such dividends, however, will depend upon factors such as net income, financial condition, capital requirements, and general business conditions. We will only pay dividends if declared by our Board of Directors, out of funds legally available, and subject to any other restrictions that may be applicable to us.
State law permits the payment oflaws permit United Fire & Casualty Company to pay dividends to United Fire Group, Inc. for distribution to stockholders only from earned surplus arising from business operations. Furthermore, under Iowa law weUnited Fire & Casualty Company may pay dividends only if after giving effect to the payment we are either that the company is able to pay our debts as they become due in the normal course of business or our total assets would be equal to or more than the sum of our total liabilities. Our subsidiaries are also subject to similar state law restrictions on dividends. Based on these restrictions, in 20112012, we areUnited Fire & Casualty will be allowed to make a maximum of $59.456.6 million in dividend distributions to stockholders without prior approval. Dividend payments by the other insurance subsidiaries to United Firein the holding company system are subject to similar restrictions in the states in which they are domiciled. These restrictions will not have a material impact in meeting our cash obligations.
Stock Repurchases
Under our share repurchase program, first announced in August 2007, we may purchase our common stock from time t oto time on the open market or through privately negotiated transactions. The amount and timing of any purchases will be at our discretion and will depend upon a number of factors, including the share price, economic and general market conditions, and corporate and regulatory requirements. Our share repurchase program may be modified or discontinued at any time.
During 20102011, 20092010 and 20082009, pursuant to authorization by our Board of Di rectors,Directors, we repurchased 343,328702,947; 92,721343,328; and 580,79292,721 shares of our common stock respectively, which used cash totaling $12.4 million in 2011, $6.3 million in 2010, and $1.5 million in 2009 and $14.8 million in 2008. At December 31, 20102011, we were authorized to purchase an additional 172,826469,879 shares of our common stock under our Share Repurchase Program,share repurchase program, which expires in August 2011.2013.
LineCredit Facilities
In the fourth quarter of Credit
If our operating2011, United Fire & Casualty Company entered into a credit agreement with a syndicate of financial institutions as lenders party thereto, KeyBank National Association as administrative agent, lead arranger, sole book runner, swingline lender, and investing cash flows are not sufficient to support our operations, we may also borrowletter of credit issuer, and Bankers Trust Company as syndication agent. The four-year credit agreement provides for a $100.0 million unsecured revolving credit facility that includes a $20.0 million letter of credit subfacility and a swing line subfacility in the amount of up to $5.0 million.
During the term of this credit facility, we have the right to increase the total facility from $100.0 million up to $125.0 million, provided that no event of default has occurred or is continuing and certain other conditions are satisfied. The credit facility is available for general corporate purposes, including working capital, acquisitions and liquidity purposes. Principal of the credit facility is due in full at maturity, on December 22, 2015. The interest rate is based on our monthly choice of either the London Interbank Offered Rate (“LIBOR”) or a base rate plus, in each case, a calculated margin amount. A commitment fee on each lender's unused commitment under the credit facility is also payable quarterly. The credit facility replaced a $50.0 million revolving credit facility with Bankers Trust Company, which was repaid and terminated in connection with entering into the new credit agreement.
The credit agreement contains customary representations, covenants and events of default, including certain covenants that limit or restrict our ability to engage in certain activities. Subject to certain exceptions, these activities include restricting our ability to sell or transfer assets or enter into a merger or consolidate with another company,
United Fire Group, Inc. Form 10-K | 2011
grant certain types of security interests, incur certain types of liens, impose restrictions on subsidiary dividends, enter into leaseback transactions, or incur certain indebtedness. The credit agreement contains certain financial covenants including covenants that require us to maintain a bank line of credit. Underminimum consolidated net worth, a debt to capitalization ratio and minimum stockholders' equity. The credit agreement contains terms that allow the current termsagreement to continue after the formation of our credit agreement, interestholding company, United Fire Group, Inc., which occurred on outstanding notes is payable at the lender’s prevailing prime rate, minus 1.0 percent, with a floor of 6.0 percent. We are currently in the process of reevaluating our line of credit options with other lenders. We did not utilize our line of credit during 2010 or 2009.
Stockholders’ EquityFebruary 1, 2012.
Stockholders’ equity increased from $672.7 million atAs of December 31, 20092011, towe were in compliance with the covenants for the credit agreement.
Stockholders' Equity
Stockholders' equity decreased from $716.4 million at December 31, 2010, an increaseto $696.1 million at December 31, 2011, a decrease of 6.52.8 percent. The increase in stockholders’ equity between years is primarily duedecline was attributable to net incomestockholder dividends of
United Fire & Casualty Company Form 10-K | 2010
$47.5 million. Also contributing to the improvement was an increase in unrealized investment gains totaling $20.215.5 million, after tax, which is a 24.4 percent increase since December 31, 2009. This increase is due to an appreciation in the market valuestock repurchases of our fixed maturity securities even as interest rates remained h istorically low as well as an increase in the market value of our equity securities.
These increases were somewhat offset by dividend payments; common stock repurchases;$12.4 million, and an increase in the underfunded status of our employee benefit plans of $3.816.1 million, afternet of tax. The decrease was somewhat offset by net unrealized investment appreciation of $21.7 million, net of tax. This increase is due to an appreciation in the market value of our holdings of fixed maturity securities, which was somewhat offset by a decline in the market value of our holdings of equity securities. The book value per share of our common stock was $27.29 at December 31, 2011, compared with $27.35 at December 31, 2010, compared with $25.35 at December 31, 2009.
Risk-Based Capital
The National Association of Insurance Commissioner’sCommissioner���s (“NAIC”) adopted risk-based capital requirements, which requires us to calculate a minimum capital requirement for each of our insurance companies based on individual company insurance risk factors. These “risk-based capital” results are used by state insurance regulators to identify companies that require regulatory attention or the initiation of regulatory action. At December 31, 20102011, all of our insurance companies had capital well in excess of the required levels.
Pending PurchaseAcquisition of Mercer Insurance Group
On November 30, 2010,March 28, 2011, we announced our entry into a definitive agreement to acquireacquired 100 percent of the outstanding common stock of Mercer in a transaction valued at approximately $191.0Insurance Group for $191.5 million. The acquisition was funded through a combination of cash and $79.9 million of short-term debt. Accordingly, the results of operations for Mercer Insurance Group are included in our Consolidated Financial Statements from that date forward. After the acquisition, we market our products through over 1,300 independent property and casualty agencies. In addition, the acquisition allows us to diversify our exposure to weather and other catastrophe risks across our geographic markets.
This transaction is subjectwas accounted for under the acquisition method using Mercer Insurance Group historical financial information and applying fair value estimates to customary conditions, including approval by the stockholders of Merceracquired assets, liabilities and regulatory authorities. Approvalcommitments as of the transaction by United Fire stockholders is not required and there is no financing conditionacquisition date. Refer to consummate the transaction.
We believe that our existing sources of liquidity, including cash and short-term investments, are adequate to meet anticipated operating needs at comparable risk-based interest rates for the foreseeable future. Acquisition spending and/or share repurchases could increase our debt. Management anticipates that the net debt to net capitalization ratio will be approximately 10.0 percent. A combination of our operating cash flows, our bank line of credit (as described in Note 4 “Short-Term Borrowings” contained in Part II, Item 8, “Financial Statements and Supplementary Data”), and a loan from the Federal Home Loan Bank are expected to satisfy our costsNote 16 “Business Combinations” for additional information related to this acquisition.
In connection with this acquisition, we incurred $8.3 million of transactions costs, which included $5.5 million of expense in the planned acquisitionfirst quarter of Mercer.2011 related to change in control payments made to the former executive officers of Mercer Insurance Group.
Contrac tualContractual Obligations and Commitments
The following table shows our contractual obligations and commitments, including our estimated payments due by period, at December 31, 20102011:
United Fire Group, Inc. Form 10-K | 2011
| | | (In Thousands) | Payments Due By Period | Payments Due By Period |
Contractual Obligations | Total | | Less Than One Year | | One to Three Years | | Three to Five Years | | More Than Five Years | Total | | Less Than One Year | | One to Three Years | | Three to Five Years | | More Than Five Years |
Future policy benefit reserves (1) | $ | 2,001,196 | | | $ | 207,969 | | | $ | 489,942 | | | $ | 409,879 | | | $ | 893,406 | | 2,314,309 |
| | 228,157 |
| | 460,169 |
| | 374,271 |
| | 1,251,712 |
|
| Loss and loss settlement expense res erves | 603,090 | | | 214,220 | | | 193,835 | | | 90,464 | | | 104,571 | | |
| Loss and loss settlement expense reserves | | 945,051 |
| | 304,165 |
| | 281,801 |
| | 141,758 |
| | 217,327 |
|
| Line of credit | | 45,000 |
| | — |
| | — |
| | 45,000 |
| | — |
|
| Operating leases | 14,658 | | | 4,561 | | | 6,649 | | | 2,493 | | | 955 | | 19,968 |
| | 6,024 |
| | 9,996 |
| | 3,061 |
| | 887 |
|
| Trust preferred securities | | 15,626 |
| | — |
| | — |
| | — |
| | 15,626 |
|
| Interest expense | | 19,669 |
| | 1,719 |
| | 3,208 |
| | 3,210 |
| | 11,532 |
|
| Profit-sharing commissions | 7,019 | | | 7,019 | | | — | | | — | | | — | | 9,699 |
| | 9,699 |
| | — |
| | — |
| | — |
|
| Pension plan contributions | 6,000 | | | 6,000 | | | — | | | — | | | — | | 7,000 |
| | 7,000 |
| | — |
| | — |
| | — |
|
| Total | $ | 2,631,963 | &nbs p; | | $ | 439,769 | | | $ | 690,426 | | | $ | 502,836 | | | $ | 998,932 | | 3,376,322 |
| | 556,764 |
| | 755,174 |
| | 567,300 |
| | 1,497,084 |
|
| |
| (1) | This projection of our obligation for future policy benefits considers only actual future cash outflows. The future policy benefit reserves presented on the Consolidated Balance Sheets is the net present value of the benefits to be paid, less the net present value of future net premiums. |
Future Policy Benefits
Future payments to be made to policyholde rspolicyholders and beneficiaries must be actuarially estimated and are not determinable from the contract. The projected payments are based on our current assumptions for mortality, morbidity and policy lapse, but are not discounted with respect to interest. Additionally, the projected payments are
United Fire & Casualty Company Form 10-K | 2010
based on the assumption that the holders of our annuities and life insurance policies will withdraw their account balances from our company upon the expiration of their contracts. Policies must remain in force for the policyholder or beneficiary to receive the benefit under the policy. Depending on the terms of a particular policy, future premiums from the policyholder may be required for the policy to remain in force. The future policy benefit reserves for theour life insurance segment presented on the Consolidated Balance Sheets are generally based on the historical assumptions for mortality and policy lapse rates and are on a discounted basis. Accordingly, the amounts presented above for future policy benefit reserves significantly exceeds the amount of future policy benefit reserves reported on our Consolidated Balance Sheets at December 31, 20102011.
Loss and Loss Settlement Expense Reserves
The amounts presented above are estimates of the dollar amounts and time periods in which we expect to pay out our gross loss and loss settlement expense reserves. TheseBecause the timing of future payments may vary from the stated contractual obligation, these amounts are estimates based upon historical payment patterns and may not represent actual future pay ments because the timing of future payments may vary from the stated contractual obligation.payments. Refer to “Critical Accounting Estimates: Loss and Loss Settlement Expenses — Property and Casualty Insurance Segment” in this section for further discussion.
Credit Facility
For a discussion of our credit facility, refer to Part II, Item 8, Note 17 “Debt.”
Operating Leases
Our operating lease obligations are for the rental of office space, vehicles, computer equipment and office equipment. For further discussion of our operating leases, refer to Part II, Item 8, Note 14 “Lease Commitments.”
Trust Preferred Securities
We are obligated under three statutory trusts to repay $15.5 million in trust preferred securities upon their maturities, with the first maturity in December of 2032 and the last maturity in September of 2033. We have the ability to prepay this commitment and are exercising that right. All three statutory trusts will be retired by April 2, 2012. For a discussion of our trust preferred securities, refer to Part II, Item 8, Note 18 “Trust Preferred Securities.”
United Fire Group, Inc. Form 10-K | 2011
Interest Expense
Our interest expense is primarily related to our three Trust Preferred Securities, as discussed in Part II, Item 8, Note 18 “Trust Preferred Securities.” The remaining interest expense is related to our credit facility, as discussed in Part II, Item 8, Note 17 “Debt.”
Profit-Sharing Commissions
We offer our agents a profit-sharing plan as an incentive for them to place high-quality property and casualty insurance business with us. WeBased on business produced by the agencies in 2011, we estimate property and casualty agencies will receive profit-sharing payments of $7.09.7 million in 2011, based on business produced by the agencies in 20102012.
Pension Plan Payments
We estimated the pension contribution for 20112012 in accordance with the Pension Protection Act of 2006 (“the Act”). Contributions for future years are dependent on a number of factors, including actual performance versus actuarial assumptions made at the time of the actuarial valuations and maintaining certain funding levels relative to regulatory requirements. Contributions in 20112012, and in future years, are expected to be an amount at least equal to the IRS minimum required contribution in accordance with the Act.
Off-Balance Sheet Arrangements
Pursuant to an agreement with one of our limited liability partnership holdings,funds, we are contractually committed to make capital contributions up to $15.0 million, upon request by the partnership, through December 31, 2017. Our remaining potential contractual obligation was $11.49.2 million at December 31, 20102011.
|
|
| CRITICAL ACCOUNTING ESTIMATES |
Critical accounting estimates are defined as those that are representative of significant judgments a ndand uncertainties and that may potentially may result in materially different results under different assumptions and conditions. We base our discussion and analysis of our results of operations and financial condition on the amounts reported in our Consolidated Financial Statements, which we have prepared in accordance with GAAP. As we prepare these Consolidated Financial Statements, we must make estimates and assumptions that affect the reported amounts of assets and liabilities; and the disclosure of contingent assets and liabilities at the date of the financial statements; and the reported amounts of revenues and expenses for the reporting period. We evaluate our estimates on an ongoing basis. We base our estimates on historical experience and on other assumptions that we believe to be reasonable under the circumstances. Actual results could differ from those estimates. We believe that our most critical accounting estimates are as follows.
United Fire & Casualty Company Form 10-K | 2010
Investment Valuation
Upon acquisition, we classify investments in marketable securities as held-to-maturity, available-for-sale, or trading. We record investments in held-to-maturity fixed maturities at amortized cost. We record available-for-sale fixed maturity securities, trading securities and equity securities at fair value. Other long-term investments consist primarily of our interests in limited liability partnerships or joint ventures and are recorded on the equity method of accounting. We record mortgage loans at amortized costtheir unpaid principal balance and policy loans at the outstanding loan amount due from policyholders.
In general, investment securities are exposed to various risks, such as interest rate risk, credit risk, and overall market volatility risk. Therefore, it is reasonably possible that changes in the fair value of our investment securities, reported at fair value, will occur in the near term and such changes could materially affect the amounts reported in the Consolidated Financial Statements. Also, it is reasonably possible that a changechanges in the value of our investments in limited liability partnerships could occur in the future and such changes could materially affect our results of operations and financial condition on the amountsas reported in our Consolidated Financial Statements.
United Fire Group, Inc. Form 10-K | 2011
Determining Fair Value
We value our available-for-sale fixed maturities,maturity and trading securities, equity securities, short-term investments and money market accounts at fair value in accordance with the current accounting guidance on fair value measurements and disclosures.measurements. We exclude unrealized appreciation or depreciation on investments carried at fair value, with the exception of trading securities, from net income, and report it, net of applicable deferred income taxes, as a component of accumulated other comprehensive income in stockholders’ equity.
Current accounting guidance on fair value measurements includes the application of a fair value hierarchy that requires us to maximize the use of observable inputs and minimize the use of unobservable inputs when measuring fair value. Our financial instruments that are recorded at fair value are categorized into a three-level hierarchy, which is based upon the priority of the inputs to the valuation technique. The fair value hierarchy gives the highest priority to quoted prices in active m arketsmarkets for identical assets (Level(i.e., Level 1) and the lowest priority to unobservable inputs (Level(i.e., Level 3). If the inputs used to measure fair value fall within different levels of the hierarchy, the category level is based on the lowest priority level input that is significant to the fair value measurement of the financial instrument.
Financial instruments recorded at fair value are categorized in the fair value hierarchy as follows:
| |
• | Level 1: Valuations are based on unadjusted quoted prices in active markets for identical financial instruments that we have the ability to access. |
| |
• | Level 2: Valuations are based on quoted prices for similar financial instruments, other than quoted prices included in Level 1, in markets that are not active or on inputs that are observable either directly or indirectly for the full term of the financial instrument. |
| |
• | Level 3: Valuations are based on pricing or valuation techniques that require inputs that are both unobservable and significant to the overall fair value measurement of the financial instrument. Such inputs may reflect management’s own assumptions about the assumptions a market participant would use in pricing the financial instrument. |
Level 1: Valuations are based on unadjusted quoted prices in active markets for identical financial instruments that we have the ability to access.
Level 2: Valuations are based on quoted prices for similar financial instruments, other than quoted prices included in Level 1, in markets that are not active or on inputs that are observable either directly or indirectly for the full term of the financial instrument.
Level 3: Valuations are based on pricing or valuation techniques that require inputs that are both unobservable and significant to the overall fair value measurement of the financial instrument. Such inputs may reflect management’s own assumptions about the assumptions a market participant would use in pricing the financial instrument.
Transfers between levels, if any, are recorded as of the beginning of the reporting period.
To determine the fair value of the majority of our investments, we utilize prices obtained from independent, nationally recognized pricing services. We obtain one price for each security. When the pricing services cannot provide a determination of fair value for a specific security, we obtain non-binding price quotes from broker-dealers with whom we have had several years’years experience and who have demonstrated knowledge of the subject security. We request and utilize one broker quote per security.
We validate the prices obtained from pricing services and brokers prior to their use for reporting purposes by evaluating their reasonableness on a monthly basis. Our validation process includes a review for unusual fluctuations. In our opinion, the pricing obtained at December 31, 20102011, was reasonable.
United Fire & Casualty Company Form 10-K | 2010
In order to determine the proper classification in the fair value hierarchy for each security where the price is obtained from an independent pricing service, we obtain and evaluate the vendors’ pricing procedures and inputs used to price the security, which include unadjusted quoted market prices for identical securities, such as a New York Stock Exchange closing price and quoted prices for identical securities in markets that are not active. For fixed maturity securities, an evaluation of interest rates and yield curves observable at commonly quoted intervals, volatility, prepayment speeds, credit risks and default rates may also be performed. We have determined that these processes and inputs result in fair values a ndand classifications consistent with the applicable current accounting guidance on fair value measurements.
We review our fair value hierarchy categorizations on a quarterly basis at which time the classification of certain financial instruments may change if the input observations have changed.
The following table presents the categorization for our financial instruments measured at fair value on a recurring
United Fire Group, Inc. Form 10-K | 2011
basis in our Consolidated Balance Sheets at December 31, 20102011 and 20092010:
|
| | | | | | | | | | | | | | | |
| (In Thousands) | | | Fair Value Measurements |
| Description | Total | | Level 1 | | Level 2 | | Level 3 |
| Assets as of December 31, 2011 | | | | | | | |
| Available-for-sale fixed maturities | $ | 2,697,248 |
| | $ | 409 |
| | $ | 2,674,523 |
| | $ | 22,316 |
|
| Equity securities | 159,451 |
| | 155,667 |
| | 258 |
| | 3,526 |
|
| Trading securities | 13,454 |
| | 1,659 |
| | 11,795 |
| | — |
|
| Short-term investments | 1,100 |
| | 1,100 |
| | — |
| | — |
|
| Money market accounts | 62,899 |
| | 62,899 |
| | — |
| | — |
|
| Total assets measured at fair value | $ | 2,934,152 |
| | $ | 221,734 |
| | $ | 2,686,576 |
| | $ | 25,842 |
|
| |
|
| | | | | | |
| Assets as of December 31, 2010 |
|
| | | | | | |
| Available-for-sale fixed maturities | $ | 2,278,429 |
| | $ | — |
| | $ | 2,252,799 |
| | $ | 25,630 |
|
| Equity securities | 149,706 |
| | 147,908 |
| | 263 |
| | 1,535 |
|
| Trading securities | 12,886 |
| | 1,476 |
| | 11,410 |
| | — |
|
| Short-term investments | 1,100 |
| | 1,100 |
| | — |
| | — |
|
| Money market accounts | 34,384 |
| | 34,384 |
| | — |
| | — |
|
| Total assets measured at fair value | $ | 2,476,505 |
| | $ | 184,868 |
| | $ | 2,264,472 |
| | $ | 27,165 |
|
| | | | | | | | | | | | | | | | | |
| (In Thousands) | | | | Fair Value Measurements |
| Description | | Total | | Level 1 | | Level 2 | | Level 3 |
| Assets as of December 31, 2010 | | | | | | | | |
| Available-for-sale fixed maturities | | $ | 2,278,429 | | | $ | — | | | $ | 2,252,799 | | | $ | 25,630 | |
| Equity securities | | 149,706 | | | 147,908 | | | 263 | | | 1,535 | |
| Trading securities | | 12,886 | | | 1,476 | | | 11,410 | | | — | |
| Short-term investments | | 1,100 | | | 1,100 | | | — | | | — | |
| Money market accounts | | 34,384 | | | 34,384 | | | — | | | — | |
| Total assets measured at fair value | | $ | 2,476,505 | �� | | $ | 184,868 | | 2,264,472 | | $ | 2,264,472 | | | $ | 27,165 | |
| | | | | | | | | | |
| Assets as of December 31, 2009 | | | | | | | | | |
| Available-for-sale fixed maturities | | $ | 2,158,391 | | | $ | — | | | $ | 2,127,932 | | | $ | 30,459 | |
| Equity securities | | 132,718 | | | 132,428 | | | 290 | | | — | |
| Trading securities | &n bsp; | 12,613 | | | 1,519 | | | 11,094 | | | — | |
| Short-term investments | | 7,359 | | | 1,100 | | | 6,005 | | | 254 | |
| Money market accounts | | 96,163 | | | 96,163 | | | — | | | — | |
| Total assets measured at fair value | | $ | 2,407,244 | | | $ | 231,210 | | | $ | 2,145,321 | | | $ | 30,713 | |
The fair value of securities that are categorized as Level 1 is based on quoted market prices that are readily and regularly available.
The fair value of securities that are categorized as Level 2 is determined by management after reviewing market prices obtained from independent pricing services and brokers. Such estimated fair values do not necessarily represent the values for which these securities could have been sold at the reporting date. Our independent pricing services and brokers obtain prices from reputable pricing vendors in the marketplace. They continually monitor and review the external pricing sources, while actively participatin gparticipating to resolve any pricing issues that may arise.
For the year ended December 31, 20102011, the change in our available-for-sale securities categorized as Level 1 and Level 2 is the result of investment purchases and disposals made during the period, which were made from funds held in our money market accounts, and an increase in unrealized gains on both fixed maturities and equity securities. There were no significant transfers of securities in or out of Level 1 or Level 2 during the period.year.
Securities that may be categorized as Level 3 include holdings in certain private placement fixed maturity and e quityequity securities and certain other securities that were determined to be other-than-temporarily impaired in a prior period and for which an active market does not currently exist.
United Fire & Casualty Company Form 10-K | 2010
The fair value of our Level 3 private placement securities is determined by management in reliance uponrelying on pricing received from our independent pricing services and brokers consistent with the process to estimate fair value for Level 2 securities. If pricing could not be obtained from these sources, management performs an analysis of the contractual cash flows of the underlying security to estimate fair value.
The fair value of our Level 3 impaired securities was determined primarily based upon management’s assumptions regarding the timing and amount of future cash inflows. If a security has been written down or the issuer is in bankruptcy, management relies in part on outside opinions from rating agencies, our lien position on the secur ity,security, general economic conditions and management’s expertise to determine fair value. We have the ability and the positive intent to hold securities until such time that we are able to recover all or a portion of our original investment. If a security does not have a market at the balance sheet date, management will estimate the security’s fair value based on other securities in the market. Management will continue to monitor securities after the balance sheet date to confirm that their estimated fair value is reasonable.
United Fire Group, Inc. Form 10-K | 2011
The following table provides a summary of the changes in fair value of our Level 3 securities for 2011:
|
| | | | | | | | | | | |
| (In Thousands) | Available-for-sale fixed maturities | | Equity securities | | Total |
| Balance at January 1, 2011 | $ | 25,630 |
| | $ | 1,535 |
| | $ | 27,165 |
|
Realized gains (1) | 12 |
| | 10 |
| | 22 |
|
Unrealized gains (losses) (1) | 184 |
| | (8 | ) | | 176 |
|
| Amortization | (15 | ) | | — |
| | (15 | ) |
| Purchases | 1,543 |
| | 3,271 |
| | 4,814 |
|
| Disposals | (4,838 | ) | | (1,282 | ) | | (6,120 | ) |
| Transfers in | 16,956 |
| | — |
| | 16,956 |
|
| Transfers out | (17,156 | ) | | — |
| | (17,156 | ) |
| Balance at December 31, 2011 | $ | 22,316 |
| | $ | 3,526 |
| | $ | 25,842 |
|
| |
| (1) | Realized gains are recorded as a component of current operations whereas unrealized gains (losses) are recorded as a component of comprehensive income. |
The equity securities reported as “purchases” primarily relate to our acquisition of Mercer Insurance Group. We purchased securities in the Federal Home Loan Bank of Des Moines, as a requirement to obtain membership and secure a loan used as part of the acquisition financing. These securities were classified as Level 3 because we had no observable market price at December 31, 2011. The reported “disposals” relate to the receipt of principal on calls or sinking fund bonds, in accordance with the indentures.
The securities reported as “transfers in” relate to securities transferred from either level 1 or 2 to level 3 because an updated market value was not available. The securities reported as “transfers out” relate to securities transferred from Level 3 to either Level 1 or 2 because an updated market value was available.
The following table provides a summary of the changes in fair value of our Level 3 securities for 2010:
| | | (In Thousands) | | Available-for-sale fixed maturities | | Equity securities | | Short-term investments | | Total | Available-for-sale
fixed maturities | | Equity
securities | | Short-term
investments | | Total |
| Balance at January 1, 2010 | | $ | 30,459 | | | $ | — | | | $ | 254 | | | $ | 30,713 | | $ | 30,459 |
| | $ | — |
| | $ | 254 |
| | $ | 30,713 |
|
Realized gains (1) | | — | | | — | | | — | | | — | | — |
| | — |
| | — |
| | — |
|
Unrealized gains (1) | | 351 | | | — | | | — | | | 351 | | 351 |
| | — |
| | — |
| | 351 |
|
| Amortization | | (2 | ) | | — | | | — | | | (2 | ) | (2 | ) | | — |
| | — |
| | (2 | ) |
| Purchases | | 7 | | | 1,535 | | | — | | | 1,542 | | 7 |
| | 1,535 |
| | — |
| | 1,542 |
|
| Disposals | | (5,439 | ) | | — | | | — | | | (5,439 | ) | (5,439 | ) | | — |
| | — |
| | (5,439 | ) |
| Transfers in | | 254 | | | — | | | — | | | 254 | | 254 |
| | — |
| | — |
| | 254 |
|
| Transfers out | | — | | | — | | | (254 | ) | | (254 | ) | — |
| | — |
| | (254 | ) | | (254 | ) |
| Balance at December 31, 2010 | | $ | 25,630 | | | $ | 1,535 | | | $ | — | | | $ | 27,165 | | $ | 25,630 |
| | $ | 1,535 |
| | $ | — |
| | $ | 27,165 |
|
| |
| (1) | Realized gains are recorded as a component of current operations whereas unrealiz edunrealized gains are recorded as a component of comprehensive income. |
The $5.4$5.4 million reported as “disposals” included $1.9 million of corporate bonds that were called as a result of debt restructuring by the issuer and $2.0 million of corporate bonds that matured. Of the $1.9 million, $0.3$.3 million were short-term investments that were transferred to corporate bonds as a result of the restructuring.restructuring of debt by the issuer. The remaining $1.5$1.5 million in disposals relates to the receipt of principal on calls or sinksinking fund bonds, in accordance with the indentures.
The following table provides a summary of the changes in fair value of our Level 3 securities for 2009:
| | | | | | | | | | | | | | | | |
| (In Thousands) | | Available-for-sale
fixed maturities | | Equity
securities | | Short-term
investments | | Total |
| Balance at January 1, 2009 | | $ | 6,254 | | | $ | 1,851 | | | $ | — | | | $ | 8,105 | |
Realized losses (1) | | (1 | ) | | — | | | — | | | (1 | ) |
Unrealized gains (1) | | 331 | | | — | | | — | | | 331 | |
| Amortization | | — | | | — | | | — | | | — | |
| Purchases | | 4,682 | | | — | | | 750 | | | 5,432 | |
| Disposals | | (4,617 | ) | | — | | | (496 | ) | | (5,113 | ) |
| Transfers in | | 26,010 | | | — | | | — | | | 26,010 | |
| Transfers out | | (2,200 | ) | | (1,851 | ) | | — | | | (4,051 | ) |
| Balance at December 31, 2009 | | $ | 30,459 | | | $ | — | | | $ | 254 | | | $ | 30,713 | |
| |
(1) | Realized losses are recorded as a component of current operations whereas unrealized gains are recorded as a component of comprehensive income. |
The $26.0 mil lion reported as “transfers in” consisted of $22.7 million in available-for-sale fixed maturities that were primarily private placement securities that had no observable price available at December 31, 2010, and $3.3 million of available-for-sale fixed maturities that were subsequently reclassified, as a disposal, to other long-term
United Fire & Casualty CompanyGroup, Inc. Form 10-K | 20102011
investments due to bankruptcy reorganization. The $4.1 million in “transfers out” resulted from available-for-sale fixed maturities and equityfollowing table presents the composition of our Level 3 securities that previously had no observable ma rket price at December 31, 20092011, but for which observable prices were available at December 31, 2010.:
|
| | | | | | | | | | | | | |
| (In Thousands) | Level
Three | | % of Level Three | | Total from Balance Sheet | | % of Total
Fair Value |
| AVAILABLE-FOR-SALE |
| | | | | | |
| Fixed maturities |
| | | | | | |
| Bonds |
| | | | | | |
| U.S. government and government-sponsored enterprises |
| | | | | | |
| U.S. Treasury | $ | — |
| | — | % | | $ | 43,951 |
| | 1.6 | % |
| Agency | — |
| | — |
| | 96,395 |
| | 3.6 |
|
| States, municipalities and political subdivisions |
| |
| | | |
|
| General obligations |
| |
| | | |
|
| Midwest | | |
| | | |
|
| North central - East | — |
| | — |
| | 129,605 |
| | 4.8 |
|
| North central - West | — |
| | — |
| | 84,311 |
| | 3.1 |
|
| Northeast | — |
| | — |
| | 40,863 |
| | 1.5 |
|
| South | — |
| | — |
| | 115,473 |
| | 4.3 |
|
| West | — |
| | — |
| | 74,378 |
| | 2.7 |
|
| Special revenue | | |
| | | |
|
| Midwest | | |
| | | |
|
| North central - East | 880 |
| | 3.9 |
| | 70,813 |
| | 2.6 |
|
| North central - West | — |
| | — |
| | 55,236 |
| | 2.0 |
|
| Northeast | — |
| | — |
| | 14,733 |
| | 0.5 |
|
| South | — |
| | — |
| | 103,074 |
| | 3.8 |
|
| West | — |
| | — |
| | 59,621 |
| | 2.2 |
|
| Foreign bonds |
| |
| | | |
|
| Canadian | — |
| | — |
| | 72,176 |
| | 2.7 |
|
| Other foreign | 836 |
| | 3.7 |
| | 142,639 |
| | 5.3 |
|
| Public utilities |
| |
| | | |
|
| Electric | — |
| | — |
| | 233,479 |
| | 8.7 |
|
| Gas distribution | — |
| | — |
| | 25,658 |
| | 0.9 |
|
| Other | — |
| | — |
| | 10,934 |
| | 0.4 |
|
| Corporate bonds |
| |
| | | |
|
| Oil and gas | — |
| | — |
| | 197,192 |
| | 7.3 |
|
| Chemicals | — |
| | — |
| | 62,261 |
| | 2.3 |
|
| Basic resources | — |
| | — |
| | 24,061 |
| | 0.9 |
|
| Construction and materials | — |
| | — |
| | 24,330 |
| | 0.9 |
|
| Industrial goods and services | 2,897 |
| | 13.0 |
| | 185,025 |
| | 6.9 |
|
| Autos and parts | — |
| | — |
| | 18,229 |
| | 0.7 |
|
| Food and beverage | 1,415 |
| | 6.4 |
| | 69,241 |
| | 2.6 |
|
| Personal and household goods | — |
| | — |
| | 61,963 |
| | 2.3 |
|
| Health care | — |
| | — |
| | 115,671 |
| | 4.3 |
|
| Retail | — |
| | — |
| | 60,063 |
| | 2.2 |
|
| Media | — |
| | — |
| | 41,969 |
| | 1.6 |
|
| Travel and leisure | — |
| | — |
| | 2,678 |
| | 0.1 |
|
| Telecommunications | — |
| | — |
| | 39,915 |
| | 1.5 |
|
| Banks | 7,230 |
| | 32.4 |
| | 131,876 |
| | 4.9 |
|
| Insurance | — |
| | — |
| | 23,700 |
| | 0.9 |
|
| Real estate | 7,780 |
| | 34.9 |
| | 23,022 |
| | 0.9 |
|
| Financial services | 963 |
| | 4.3 |
| | 86,703 |
| | 3.2 |
|
| Technology | — |
| | — |
| | 31,064 |
| | 1.2 |
|
| Collateralized mortgage obligations |
| |
| | | |
|
| Government | — |
| | — |
| | 82,691 |
| | 3.1 |
|
United Fire Group, Inc. Form 10-K | 2011
|
| | | | | | | | | | | | | |
| Other | — |
| | — |
| | 160 |
| | — |
|
| Mortgage-backed securities | — |
| | — |
| | 35,390 |
| | 1.3 |
|
| Asset-backed securities | 315 |
| | 1.4 |
| | 6,296 |
| | 0.2 |
|
| Redeemable preferred stock | — |
| | — |
| | 409 |
| | — |
|
| Total Available-For-Sale Fixed Maturities | $ | 22,316 |
| | 100.0 | % | | $ | 2,697,248 |
| | 100.0 | % |
| Equity securities |
| |
| | | |
|
| Common stocks |
| |
| | | |
|
| Public utilities |
| |
| | | |
|
| Electric | $ | — |
| | — | % | | $ | 12,419 |
| | 7.8 | % |
| Gas distribution | — |
| | — |
| | 2,223 |
| | 1.4 |
|
| Other | — |
| | — |
| | 93 |
| | — |
|
| Corporate |
| |
| | | |
|
| Oil and gas | — |
| | — |
| | 12,210 |
| | 7.7 |
|
| Chemicals | — |
| | — |
| | 5,039 |
| | 3.2 |
|
| Industrial goods and services | — |
| | — |
| | 23,517 |
| | 14.7 |
|
| Autos and parts | — |
| | — |
| | 580 |
| | 0.4 |
|
| Food and beverage | — |
| | — |
| | 6,106 |
| | 3.8 |
|
| Personal and household goods | — |
| | — |
| | 8,671 |
| | 5.4 |
|
| Health care | — |
| | — |
| | 15,988 |
| | 10.0 |
|
| Retail | — |
| | — |
| | 3,207 |
| | 2.0 |
|
| Media | — |
| | — |
| | 134 |
| | 0.1 |
|
| Telecommunications | — |
| | — |
| | 6,160 |
| | 3.9 |
|
| Banks | 3,526 |
| | 100.0 |
| | 41,514 |
| | 26.0 |
|
| Insurance | — |
| | — |
| | 13,034 |
| | 8.2 |
|
| Real Estate | — |
| | — |
| | 1,114 |
| | 0.7 |
|
| Financial services | — |
| | — |
| | 428 |
| | 0.3 |
|
| Technology | — |
| | — |
| | 3,724 |
| | 2.3 |
|
| Nonredeemable preferred stocks | — |
| | — |
| | 3,290 |
| | 2.1 |
|
| Total Available-for-Sale Equity Securities | $ | 3,526 |
| | 100.0 | % | | $ | 159,451 |
| | 100.0 | % |
United Fire Group, Inc. Form 10-K | 2011
The following table presents the composition of our Level 3 securities at December 31, 2010:
| | | (In Thousands) | Level
Three | | % of Level Three | | Total from Balance Sheet | | % of Total
Fair Value | Level
Three | | % of Level Three | | Total from Balance Sheet | | % of Total
Fair Value |
| Available-For-Sale Fixed Maturities | | | | | | | | |
| AVAILABLE-FOR-SALE | |
| | | | | | |
| Fixed maturities | |
| | | | | | |
| Bonds | | | | | | | |
| | | | | | |
| Collateralized mortgage obligation | $ | — | | | — | % | | $ | 19,577 | | | — | % | |
| Mortgage-backed securities | — | | | — | | | 2 | | | — | | |
| All other government | | | | | | | | |
| U.S. government and government-sponsored enterprises | |
| | | | | | |
| U.S. Treasury | — | | | — | | | 39,076 | | | — | | $ | — |
| | — | % | | $ | 39,076 |
| | 1.7 | % |
| Agency | — | | | — | | | 103,131 | | | — | | — |
| | — |
| | 103,131 |
| | 4.5 |
|
| States, municipalities and political subdivisions | | | | | | | |
| | | | | | |
| General obligations | — | | | — | | | 393,781 | | | — | |
| | | | | | |
| Midwest | | | | | | | | |
| North central - East | | — |
| | — |
| | 127,770 |
| | 5.6 |
|
| North central - West | | — |
| | — |
| | 81,132 |
| | 3.6 |
|
| Northeast | | — |
| | — |
| | 29,525 |
| | 1.3 |
|
| South | | — |
| | — |
| | 99,297 |
| | 4.4 |
|
| West | | — |
| | — |
| | 56,053 |
| | 2.5 |
|
| Special revenue | 1,001 | | | 3.9 | | | 225,433 | | | 0.4 | |
| | | | | | |
| Midwest | | | | | | | | |
| North central - East | | 1,001 |
| | 3.9 |
| | 61,093 |
| | 2.7 |
|
| North central - West | | — |
| | — |
| | 40,305 |
| | 1.8 |
|
| Northeast | | — |
| | — |
| | 4,743 |
| | 0.2 |
|
| South | | — |
| | — |
| | 74,747 |
| | 3.3 |
|
| West | | — |
| | — |
| | 44,545 |
| | 1.9 |
|
| Foreign bonds | | | | | | | — | |
| | | | | | |
| Canadian | — | | | — | | | 72,923 | | | — | | — |
| | — |
| | 72,923 |
| | 3.2 |
|
| Other | 1,115 | | | 4.4 | | | 89,754 | | | 1.2 | | |
| Other foreign | | 1,115 |
| | 4.3 |
| | 89,754 |
| | 3.9 |
|
| Public utilities | | | | | | | |
| | | | | | |
| Electric | 35 | | | 0.1 | | | 215,544 | | | — | | 35 |
| | 0.1 |
| | 225,324 |
| | 9.9 |
|
| Natural gas | — | | | — | | | 59,074 | &nbs p; | | — | | |
| Gas distribution | | — |
| | — |
| | 22,185 |
| | 1.0 |
|
| Other | — | | | — | | | 3,690 | | | — | | — |
| | — |
| | 21,580 |
| | 0.9 |
|
| Corporate bonds | | | | | | | &nb sp; |
| | | | | | |
| Banks, trusts, and insurance companies | 12,058 | | | 47.0 | | | 275,720 | | | 4.4 | | |
| Transportation | — | | | — | | | 26,657 | | | — | | |
| Energy | — | | | — | | | 157,804 | | | — | | |
| Technology | — | | | — | | | 108,420 | | | — | | |
| Basic industry | 2,897 | | | 11.3 | | | 121,639 | | | 2.4 | | |
| Credit cyclicals | 2,503 | | | 9.8 | | | 67,822 | | | 3.7 | | |
| Other | 6,021 | | | 23.5 | | | 298,382 | | | 2.0 | | |
| Total Available-For-Sale Fixed Maturities | $ | 25,630 | | | 100.0 | % | | $ | 2,278,429 | | | 1.1 | % | |
| | | | | | | | | |
| Equity securities | | | | | | | | |
| Common stocks | | | | | | | | |
| Public utilities | | | | | | | | |
| Electric | $ | — | | | — | % | | $ | 10,761 | | | — | % | |
| Natural gas | — | | | — | | | 1,997 | | | — | | |
| Banks, trusts and insurance companies | | | | | | | | |
| Oil and gas | | — |
| | — |
| | 185,436 |
| | 8.1 |
|
| Chemicals | | — |
| | — |
| | 54,971 |
| | 2.4 |
|
| Basic resources | | — |
| | — |
| | 7,427 |
| | 0.3 |
|
| Construction and materials | | — |
| | — |
| | 20,258 |
| | 0.9 |
|
| Industrial goods and services | | 2,897 |
| | 11.3 |
| | 155,058 |
| | 6.8 |
|
| Autos and parts | | — |
| | — |
| | 18,384 |
| | 0.8 |
|
| Food and beverage | | 1,482 |
| | 5.8 |
| | 74,033 |
| | 3.2 |
|
| Personal and household goods | | 2,503 |
| | 9.8 |
| | 69,387 |
| | 3.0 |
|
| Health care | | — |
| | — |
| | 83,342 |
| | 3.7 |
|
| Retail | | — |
| | — |
| | 43,960 |
| | 1.9 |
|
| Media | | — |
| | — |
| | 33,254 |
| | 1.5 |
|
| Travel and leisure | | — |
| | — |
| | 5,866 |
| | 0.3 |
|
| Telecommunications | | — |
| | — |
| | 36,984 |
| | 1.6 |
|
| Banks | 1,535 | | | 100.0 | | | 41,168 | | | 3.7 | | 7,523 |
| | 29.4 |
| | 121,634 |
| | 5.3 |
|
| Insurance | — | | | — | | | 14,408 | | | — | | — |
| | — |
| | 26,467 |
| | 1.2 |
|
| Other | — | | | — | | | 2,886 | | | — | | |
| All other common stocks | | | — | | | | | — | | |
| Transportation | — | | | — | | | 1 | | | — | | |
| Energy | — | | | — | | | 11,444 | | | — | | |
| Real estate | | 7,973 |
| | 31.1 |
| | 21,737 |
| | 1.0 |
|
| Financial services | | 1,101 |
| | 4.3 |
| | 83,455 |
| | 3.7 |
|
| Technology | — | | | — | | | 14,653 | | | — | | — |
| | — |
| | 16,688 |
| | 0.7 |
|
| Basic industry | — | | | — | | | 16,905 | | | — | | |
| Credit cyclicals | — | | | — | | | 783 | | | — | | |
| Other | — | | | — | | | 33,310 | | | — | | |
| Nonredeemable preferred stocks | — | | | — | | | 1,390 | | | — | | |
| Total Equity Securities | $ | 1,535 | | | 100.0 | % | | $ | 149,706 | | | 1.0 | % | |
| Collateralized mortgage obligations | | — |
| | — |
| | 19,577 |
| | 0.9 |
|
| Mortgage-backed securities | | — |
| | — |
| | 2 |
| | — |
|
United Fire & Casualty CompanyGroup, Inc. Form 10-K | 20102011
The following table presents the composition of our Level 3 securities at December 31, 2009:
| | | | | | | | | | | | | |
| (In Thousands) | Level
Three | | % of Level Three | | Total from Balance Sheet | | % of Total
Fair Value |
| Available-For-Sale Fixed Maturities | | | | | | | |
| Bonds | | | | | | | |
| Collateralized mortgage obligation | $ | — | | | — | % | | $ | 18,952 | | | — | % |
| Mortgage-backed securities | — | | | — | | | 2 | | | — | |
| All other government | | | | | | | |
| U.S. Treasury | — | | | — | | | 35,650 | | | — | |
| Agency | — | | | — | | | 70,625 | | | — | |
| States, municipalities and political subdivisions | | | | | | | |
| General obligations | — | | | — | | | 390,378 | | | — | |
| Special revenue | 1,110 | | | 3.6 | | | 227,362 | | | 0.5 | |
| Foreign bonds | | | | | | | |
| Canadian | — | | | — | | | 58,826 | | | — | |
| Other | 1,394 | | | 4.6 | | | 82,414 | | | 1.7 | |
| Public utilities | | | | | | | |
| Electric | 70 | | | 0.2 | | | 224,004 | | | — | |
| Natural gas | — | | | — | | | 57,806 | | | — | |
| Other | — | | | — | | | 3,778 | | | — | |
| Corporate bonds | | | | | | | |
| Banks, tr usts, and insurance companies | 14,028 | | | 46.1 | | | 289,209 | | | 4.8 | |
| Transportation | — | | | — | | | 32,187 | | | — | |
| Energy | — | | | — | | | 152,339 | | | — | |
| Technology | — | | | — | | | 89,172 | | | — | |
| Basic industry | 4,806 | | | 15.7 | | | 109,567 | | | 4.4 | |
| Credit cyclicals | 2,848 | | | 9.4 | | | 72,585 | | | 3.9 | |
| Other | 6,203 | | | 20.4 | | | 243,535 | | | 2.5 | |
| Total Available-For-Sale Fixed Maturities | $ | 30,459 | | | 100.0 | % | | $ | 2,158,391 | | | 1.4 | % |
| | | | | | | | |
| Short-Term Investments | $ | 254 | | | 100.0 | % | | $ | 7,359 | | | 3.5 | % |
|
| | | | | | | | | | | | | |
| Asset-backed securities | — |
| | — |
| | 7,326 |
| | 0.3 |
|
| Total Available-For-Sale Fixed Maturities | 25,630 |
| | 100.0 |
| | 2,278,429 |
| | 100.0 |
|
| Equity securities |
| | | | | | |
| Common stocks |
| | | | | | |
| Public utilities |
| | | | | | |
| Electric | — |
| | — |
| | 10,390 |
| | 6.9 |
|
| Gas distribution | — |
| | — |
| | 676 |
| | 0.4 |
|
| Corporate |
| | | | | | |
| Oil and gas | — |
| | — |
| | 13,134 |
| | 8.8 |
|
| Chemicals | — |
| | — |
| | 6,079 |
| | 4.1 |
|
| Industrial goods and services | — |
| | — |
| | 23,297 |
| | 15.6 |
|
| Autos and parts | — |
| | — |
| | 794 |
| | 0.5 |
|
| Food and beverage | — |
| | — |
| | 4,474 |
| | 3.0 |
|
| Personal and household goods | — |
| | — |
| | 8,603 |
| | 5.7 |
|
| Health care | — |
| | — |
| | 12,548 |
| | 8.4 |
|
| Retail | — |
| | — |
| | 728 |
| | 0.5 |
|
| Travel and leisure | — |
| | — |
| | 1 |
| | — |
|
| Telecommunications | — |
| | — |
| | 5,814 |
| | 3.9 |
|
| Banks | 1,535 |
| | 100.0 |
| | 43,760 |
| | 29.2 |
|
| Insurance | — |
| | — |
| | 14,408 |
| | 9.6 |
|
| Real Estate | — |
| | — |
| | 1,020 |
| | 0.7 |
|
| Financial services | — |
| | — |
| | 559 |
| | 0.4 |
|
| Technology | — |
| | — |
| | 2,031 |
| | 1.4 |
|
| Nonredeemable preferred stocks | — |
| | — |
| | 1,390 |
| | 0.9 |
|
| Total Available-for-Sale Equity Securities | 1,535 |
| | 100.0 |
| | 149,706 |
| | 100.0 |
|
For further discussion on fair value measurements and disclosures refer to Note 3 “Fair Value of Financial Instruments” contained in Part II, Item 8, “Financial Statements and Supplementary Data.”
Other-Than-Temporary Impairment Charges
We continually monitor the difference between our cost basis and the estimated fair value of our investments. Our accounting policy for impairment recognition requires OTTI charges to be recorded when we determine that it is more likely than not that we will be unable to collect all amounts due according to the contr actualcontractual terms of the fixed maturity security or that the anticipated recovery in fair value of the equity security will not occur in a reasonable amount of time. Impairment charges on investments are recorded based on the fair value of the investments at the measurement date. Factors considered in evaluating whether a decline in value is other-than-temporary include: the length of time and the extent to which fair value has been less than cost; the financial condition and near-term prospects of the issuer; our intention to hold the investment; and the likelihood that we will be required to sell the investment.
As of December 31, 20102011 and 2009,2010, we had a number of securities where fair value was less than our cost. The t otaltotal unrealized depreciation on these securities was$7.5 million at December 31, 2011, compared with $8.8 million at December 31, 2010, compared with $14.7 million at December 31, 2009. At December 31, 20102011, the largest pre-tax unrealized loss after tax, on any singlean individual equity security was $0.1$0.2 million. Our ration alerationale for not recording OTTI charges on these securities is discussed in Part II, Item 8, Note 2 “Summary of Investments.”
United Fire & Casualty CompanyGroup, Inc. Form 10-K | 20102011
Deferred Policy Acquisition Costs — Property and Casualty Insurance Segment
We record an asset for DAC,certain costs of underwriting new business, such as commissions, premium taxes and other variable costs incurred in connection with the writing of our property and casualty lines of business.that have been deferred.
The following table summarizes the activity related to our DAC asset for December 31, 20102011 and 20092010:
| | | | | | | | |
| | | Years Ended December 31 |
| (In Thousands) | | 2010 | | 2009 |
| Deferred policy acquisition costs at beginning of the year | | $ | 45,562 | | | $ | 52,222 | |
| Underwriting costs deferred | | 101,755 | | | 98,946 | |
| Amortization of deferred costs | | (102,636 | ) | | (105,606 | ) |
| Deferred policy acquistion costs at end of year | | $ | 44,681 | | | $ | 45,562 | |
|
| | | | | | | |
| | Year Ended December 31, |
| (In Thousands) | 2011 | | 2010 |
| Deferred policy acquisition costs at December 31, 2010 | $ | 44,681 |
| | $ | 45,562 |
|
| Value of business acquired | 27,436 |
| | — |
|
| Amortization of value of business acquired | (25,763 | ) | | — |
|
| Current deferred costs | 132,503 |
| | 101,755 |
|
| Current amortization | (118,189 | ) | | (102,636 | ) |
| Recorded deferred policy acquisition costs at December 31, 2011 | $ | 60,668 |
| | $ | 44,681 |
|
This asset is amortized over the life of the policies written, generally one year. We assess the recoverability of DAC on a quarterly basis by line of business. This assessment is performed by comparing recorded unearned premium to the sum of unamortized DAC and estimates of expected losses and loss settlement expenses. If the sum of these costs exceeds the amount of recorded unearned premium (i.e., the line of business is expected to generate an operating loss), the excess is recognized as an offset against the established DAC asset. ThisWe refer to this offset is referred to as a premium deficiency charge. If the amount of the premium deficiency charge is greater than the unamortized DAC asset, a liability will be recorded for the excess. No such liability was recorded in 2010 or 2009.
To calculate the premium deficiency charge by line of business, we estimate expected losses and loss settlement expenses by using an assumedexpected loss and loss settlement expense ratio which approximates thatis based on an analysis of actual experience of the line of business in recent past.years. This calculation is performed on a quarterly basis. This is the only assumption process we utilize in our calculation. Changes in this assumptionthese assumptions can have a significant impact on the amount of premium deficiency charge calculated.calculated for a line of business.
The following table illustrates the hypothetical impact on the premium deficiency charge recorded atfor the quarter ended December 31, 20102011, of reasonably likely changes in the assumed loss and loss settlement expense ratio utilized for purposes of this calculation .calculation. The entire impact of these changes would be recognized through income as other underwriting expenses. The base amount indicated below is the actual premium deficiency charge recorded as an offset against the established DAC asset as of December 31, 20102011.
| | Sensitivity Analysis — Impact of Changes in Assumed Loss and Loss Settlement Expense Ratios | | (In Thousands) | | -10% | | -5% | | Base | | +5% | | +10% | -10% | | -5% | | Base | | +5% | | +10% |
| Premium deficiency charge estimated | | $ | 2,795 | | | $ | 4,389 | | | $ | 4,853 | | | $ | 9,115 | | | $ | 15,061 | | $ | 619 |
| | $ | 1,325 |
| | $ | 2,598 |
| | $ | 6,518 |
| | $ | 11,735 |
|
Actual future results could differ materially from our current estimates, requiring adjustmentsassumptions used to calculate the recorded DAC asset. Such adjustments are recorded through operationsChanges in our assumed loss and loss settlement expense ratios in the future would impact the amount of deferred costs in the period the adjustments are identified. Due tosuch changes in assumptions are made. The premium deficiency charge calculated for the estimated recoverability of DAC quarter ended December 31, 2011, was $2.6 million as compared to the premium deficiency charge of $4.9 million calculated at bothfor the quarter ended December 31, 2010 and 2009, increased $1.8 million from the premium deficiency charge calculated at December 31, 2009 and 2008, respectively. An increase. The reduction in the premium deficiency charge results in the deferral of comparatively less underwriting costs period over period, resultingresulted in a relatively smallercomparatively larger DAC asset. The changes in the estimated recoverabilityasset at December 31, 2011, than at December 31, 2010.
United Fire Group, Inc. Form 10-K | 2011
Deferred Policy Acquisition Costs — Life Insurance Segment
Costs that vary with and relate to the acquisition of life insurance and annuity business are deferred and recorded as a DAC asset.deferred. Such costs consist principally of commissions and related underwriting, agency and policy issue expenses.
United Fire & Casualty Company Form 10-K | 2010
The following table summarizes the activity related to our DAC asset for 20102011 and 20092010. The ma joritymajority of the DAC asset relates to our universal life and annuity contracts, hereafter referred to as non-traditional business.
| | | | & nbsp; | Years Ended December 31 | Years Ended December 31 |
| (In Thousands) | | 2010 | | 2009 | 2011 | | 2010 |
| Deferred policy acquisition costs at beginning of the year | | $ | 46,943 | | | $ | 106,043 | | |
| Deferred policy acquisition costs at December 31, 2010 | | $ | 42,843 |
| | $ | 46,943 |
|
| Underwriting costs deferred | | 8,807 | | | 13,612 | | 8,965 |
| | 8,807 |
|
| Amortization of deferred costs | | (10,735 | ) | | (9,287 | ) | (9,224 | ) | | (10,735 | ) |
| Ending unamortized deferred policy acquisition costs | | $ | 45,015 | | | $ | 110,368 | | $ | 42,584 |
| | $ | 45,015 |
|
| Change in “shadow” deferred policy acquistion costs | | (2,172 | ) | | (63,425 | ) | |
| Deferred policy acquistion costs at end of year | | $ | 42,843 | | & nbsp; | $ | 46,943 | | |
| Change in “shadow” deferred policy acquisition costs | | 3,402 |
| | (2,172 | ) |
| Recorded deferred policy acquisition costs at December 31, 2011 | | $ | 45,986 |
| | $ | 42,843 |
|
We defer and amortize policy acquisition costs, with interest, on traditional life insurance policies, over the anticipated premium-payin gpremium-paying period in proportion to the present valueratio of the expected grossannual premium revenue to the expected total premium revenue. The present value of expected grosstotal premium revenue is based upon the premium requirement of each policy and assumptions for mortality, morbidity, persistency and investment returns at policy issuance. These assumptions are not revised after policy issuance unless the recorded DAC asset is deemed to be unrecoverable from future expected profits. Absent a premium deficiency, variability in amortization after policy issuance is caused only by variability in premium volumes.
We defer policy acquisition costs related to non-traditional business and amortize these costs in proportion to the present valueratio of estimatedthe expected annual gross profits to the expected total gross profits. The components of expected gross profits include investment spread, mortality and expense margins and surrender charges. Of these factors, we anticipate that i nvestmentinvestment returns, expenses and persistency are reasonably likely to significantly impact the rate of DAC amortization.
We periodically review estimates of expected profitability and evaluate the need to “unlock” or revise the amortization of the DAC asset. The primary assumptions utilized when estimating future profitability relate to interest rate spread, mortality experience and policy lapse experience. The table below illustrates the impact that a reasonably likely change in our assumptions used to estimate expected gross profits would have on the DAC asset for our non-traditional business recorded as of December 31, 20102011. The entire impact of the changes illustrated would be recogni zedrecognized through operations as an increase or decrease to amortization expense.
| Sensitivity Analysis — Impact of changes in assumptions (In Thousands) | | | | | |
| Sensitivity Analysis — Impact of changes in assumptions on DAC asset (In Thousands) | | | | |
| Changes in assumptions | | -10% | | +10% |
| Mortality experience | | 3,137 |
| | (3,612 | ) |
| Policy lapse experience | | 2,381 |
| | (2,207 | ) |
| Changes in assumptions | | -10% | | +10% | -1% | | +1% |
| Interest rate spread | | $ | (1,904 | ) | | $ | 1,894 | | (2,329 | ) | | 1,984 |
|
| Mortality experience | | 2,994 | | | (3,098 | ) | |
| Policy lapse experience | | 2,911 | | | (2,311 | ) | |
A material change in these assumptions could have a significant negative or positive effect on our reported DAC asset, earnings and stockholders’ equity.
The DAC asset recorded in connection with our non-traditional business is also adjusted with respect to estimated expected gross profits as a result of changes in the net unrealized gains or losses on available-for-sale fixed maturity securities allocated to support the block of fixed annuities and universal life policies. That is, because we carry
United Fire Group, Inc. Form 10-K | 2011
available-for-sale fixed maturity securities at fair value, we make an adjustment to the DAC asset equal to the change in amortization that would have been recorded if we had sold such securities at their stated fair value and reinvested the proceeds at current yields. We include this adjustment, which is called “shadow” DAC, net of tax, as a component of accumulated other comprehensive income. At December 31, 20102011 and 2009,2010, the “shadow” DAC adjustment decreased our DAC asset by $37.3$33.9 million and $35.1$37.3 million, respectively.
United Fire & Casualty Company Form 10-K | 2010
Loss and Loss Settlement Expenses — Property and Casualty Insurance Segment
Reserves for losses and loss settlement expenses are reported using our best estimate of ultimate liability for claims that occurred prior to the end of any given accountingreporting period, but have not yet been paid. Before credit for reinsurance recoverables, these reserves were $603.1945.1 million and $606.0603.1 million at December 31, 20102011 and 20092010, respectively. We purchase reinsurance to mitigate the impact of large losses and catastrophic events. Loss and loss settlement expense reserves ceded to reinsurers were $120.4 million for 2011 and $39.0 million for 2010 and $33.8 million for 2009. Our reserves, before credit for reinsurance recoverables, by line of business as of December 31, 20102011, were as follows:
| | | (In Thousands) | | Case Basis | | IBNR | | Loss
Settlement Expense | | Total Reserves | Case Basis | | IBNR | | Loss
Settlement Expense | | Total Reserves |
| Commer cial lines | | | | &nb sp; | | | | | |
| Commercial lines | | | | | | | | |
| Fire and allied lines | | $ | 35,097 | | | $ | 19,982 | | | $ | 4,729 | | | $ | 59,808 | | $ | 49,824 |
| | $ | 15,023 |
| | $ | 17,096 |
| | $ | 81,943 |
|
| Other liability | | 118,259 | | | 60,648 | | | 103,807 | | | 282,714 | | 150,058 |
| | 208,015 |
| | 147,882 |
| | 505,955 |
|
| Automobile | | 60,213 | | | 15,708 | | | 15,113 | | | 91,034 | | 70,228 |
| | 31,599 |
| | 21,586 |
| | 123,413 |
|
| Workers' compensation | ; | 109,008 | | | 3,200 | | | 16,315 | | | 128,523 | | 131,061 |
| | 6,340 |
| | 20,086 |
| | 157,487 |
|
| Fidelity and surety | | 4,812 | | | 750 | | | 743 | | | 6,305 | | 6,213 |
| | 6,337 |
| | 1,564 |
| | 14,114 |
|
| Miscellaneous | | 245 | | | 942 | | | 185 | | | 1,372 | | 716 |
| | 893 |
| | 226 |
| | 1,835 |
|
| Total commercial lines | | $ | 327,634 | | | $ | 101,230 | | | $ | 140,892 | | | $ | 569,756 | | $ | 408,100 |
| | $ | 268,207 |
| | $ | 208,440 |
| | $ | 884,747 |
|
| Personal lines | | | | | | | | | | | | | | | |
| Automobile | | $ | 6,966 | | | $ | 342 | | | $ | 1,006 | | | $ | 8,314 | | $ | 6,921 |
| | $ | 2,359 |
| | $ | 1,640 |
| | $ | 10,920 |
|
| Fire and allied lines | | 8,879 | | | 2,292 | | | 872 | | | 12,043 | | 14,410 |
| | 6,149 |
| | 2,723 |
| | 23,282 |
|
| Miscellaneous | | 51 | | | 152 | | | 98 | | | 301 | | 254 |
| | 337 |
| | 121 |
| | 712 |
|
| Total personal lines | | $ | 15,896 | | | $ | 2,786 | | | $ | 1,976 | | | $ | 20,658 | | $ | 21,585 |
| | $ | 8,845 |
| | $ | 4,484 |
| | $ | 34,914 |
|
| Reinsurance | | 7,586 | | | 5,000 | | | 90 | | | 12,676 | | |
| Reinsurance assumed | | 17,568 |
| | 7,720 |
| | 102 |
| | 25,390 |
|
| Total | | $ | 351,116 | | | $ | 109,016 | | | $ | 142,958 | | | $ | 603,090 | | $ | 447,253 |
| | $ | 284,772 |
| | $ | 213,026 |
| | $ | 945,051 |
|
Case-Basis Reserves
For each of our lines of business, with respect to reported claims, we establish reserves on a case-by-case basis. Our experienced claims personnel estimate these case-basedcase-basis reserves using adjusting guidelines established by management. Our goal is to set the case-basedcase-basis reserves at the ultimate expected loss amount as soon as possible after information about the claim becomes available.
Estimating case reserves is subjective and complex and requires us to make estimates about the future payout of cl aims,claims, which is inherently uncertain. When we establish and adjust reserves, we do so based on our knowledge of the circumstances and facts of the claim. Upon notice of a claim, we establish a factor reserve based on the claim information reported to us at that time. Subsequently, we conduct an investigation of each reported claim, which allows us to more fully understand the factors contributing to the loss and our potential exposure. This investigation may extend over a long period of time. As our investigation of a claim develops, and as our claims personnel identify trends in claims activity, we may refine and adjust our estimates of case reserves. To evaluate and refine our overall reserving process, we track and monitor all claims until they are settled and paid in full, with all salvage and subrogation claims being resolved.
Most of our insurance policies are writ tenwritten on an occurrence basis that provides coverage if a loss occurs in the policy period, even if the insured reports the loss many years later. For example, some general liability claims are reported 10.0
United Fire Group, Inc. Form 10-K | 2011
10 years or more after the policy period, and the workers’ compensation coverage provided by our policies pays unlimited medical benefits for the duration of the claimant’s injury up to the lifetime of the claimant. In addition, final settlement of certain claims can be delayed for years due to litigation or other reasons. Reserves for these claims require us to estimate future costs, including the effect of judicial actions, litigation trends and medical cost inflation, among others. Reserve development can occur over time as conditions and circumstances change in years after the policy was issued.
United Fire & Casualty Company Form 10-K | 2010
Our loss reserves include amounts related to both short-tail and long-tail lines of business. “Tail” refers to the time period between the occurrence of a loss and the ultimate settlement of the claim. A short-tail insurance product is one where ultimate losses are known and settled comparatively quickly; ultimatequickly. Ultimate losses under a long-tail insurance product are sometimes not known and settled for many years. The longer the time span between the incidence of a loss and the settlement of the claim, the more the ultimate settlement amount can vary from the reserves initially established. Accordingly, long-tail insurance products can have significant implications on the reserving process.
Our short-tail lines of business include fire and allied lines, homeowners, commercial property, auto physical damage and inland marine. The amounts of the case-based reserves that we establish for claims in these lines depend upon various factors, such as indi vidualindividual claim facts (including type of coverage and severity of loss), companyour historical loss experience and trends in general economic conditions (including changes in replacement costs, medical costs and inflation).
For short-tail lines of business, the estimation of case-basis loss reserves is less complex than for long-tail lines because claims are generally reported and settled shortly after the loss occurs and because the claims relate to tangible property. Because of the relatively short time from claim occurrence to settlement, actual losses typically do not vary significantly from reserve estimates.
Our long-tail lines of business include workers’ compensation and other liability. In addition, certain product lines s uchsuch as personal and commercial auto, commercial multi-peril and surety include both long-tail coverages and short-tail coverages. For many liability claims, significant periods of time, ranging up to several years, may elapse between the occurrence of the loss, the reporting of the loss to us and the settlement of the claim. As a result, loss experience in the more recent accident years for the long-tail liability coverages has limited statistical credibility in our reserving process because a relatively small proportion of losses in these accident years are reported claims and an even smaller proportion are paid losses. In addition, long-tail liability claims are more susceptible to litigation and can be significantly affected by changing contract interpretations and the legal environment. Consequently, the estimation of loss reserves for long-tail coverages is more complex and subject to a higher degree of variability than for short-tail coverages.
The amounts of the case-basedcase-basis loss reserves that we establish for claims in long-tail lines of business depends upon various factors, including individual claim facts (including type of coverage, severity of loss and underlying policy limits), companyCompany historical loss experience, changes in underwriting practice, legislative enactments, judicial decisions, legal developments in the awarding of damages, changes in political attitudes and trends in general economic conditions, including inflation. As with theour short-tail lines of business, we review and make changes to long-tail case-based reserves based on our review of continually evolving facts as they become available to us during the claims settlement process. Our adjustments to case-based reserves are reported in the financial statements in the period that new information arises about the claim. Examples of facts that become known that could cause us to change our case-based rese rvesreserves include, but are not limited to: evidence that loss severity is different than previously assessed; new claimants who have presented claims; and the assessment that no coverage exists.
Incurred But Not Reported (“IBNR”)(IBNR) Reserves
IBNR reserves are estimated liabilities, which we establish because claims are not always reported promptly upon occurrence and because the assessment of existing known claims may change over time with the development of new facts, circumstances and conditions, which may include litigation.
For both our short-tail and long-tail lines of business, we establish our IBNR reserves by applying a factor to our current pool of in-force premium, as well as evaluating our exposure units. This factor has been developed through a
United Fire Group, Inc. Form 10-K | 2011
historical analysis of companyCompany experience as to what level of IBNR reserve should be established to achieve an adequate IBNR reserve relative to our existing loss exposure base. Unique circumstances or trends, which are evident as of the end of a given period, may require us to refine our IBNR reserve calculation. This methodology for establishing our IBNR reserve has consistently resulted in aggregate reserve levels that management believes are reasonable in comparison to the res ervereserve estimates prepared by our independent actuary, Regnier Consulting Group, Inc. (“Regnier”).
United Fire & Casualty Company Form 10-K | 2010
For our short-tail lines of business, IBNR reserves constitute a small portion of the overall reserves. This is becauseAs these claims are generally reported and settled shortly after the loss occurs. In our long-tail lines of business, IBNR reserves constitute a relatively higher proportion of total reserves, because, for many liability claims, significant periods of time may elapse between the initial occurrence of the loss, the reporting of the loss to us and the ultimate settlement of the claim.
Loss Settlement Expense Reserves
Loss settlement expense reserves include amounts ultimately allocable to individual claims, as well as amounts required for the general overhead of the claims handling operation that are not specifically allocable to individual claims. We do not establish loss settlement expense reserves on a claim-by-claim basis. Instead, we examineon a quarterly basis, our actuary performs a detailed statistical analysis (using historical data) to estimate the ratio ofrequired reserve for unpaid loss settlement expenses paidexpenses. On a monthly basis, the required reserve estimate is adjusted to losses paid overreflect additional earned exposure and expense payments that have occurred subsequent to completion of the most recent three-year period, by line. We use these factors and apply them to open reserves, including IBNR reserves. We develop these factors annually in December, and use them throughout the year, unless development patterns or emerging trends warrant adjustments to the factors.quarterly analysis.
Generally, the loss settlement expense reserves for long-tail lines of business are a greater portion of the overall reserves, as there are often subst antialsubstantial legal fees and other costs associated with the complex liability claims that are associated with long-tail coverages. Because short-tail lines of business settle much more quickly and the costs are easier to determine, loss settlement expense reserves for short-tailsuch claims constitute a smaller portion of the total reserves.
Reinsurance Reserves
The estimation of assumed and ceded reinsurance loss and loss settlement expense reserves is subject to the same factors as the estimation of loss and loss settlement expense reserves. In addition to those factors, which give rise to inherent uncertainties in establishing loss and loss settlement expense reserves, there exists a delay in our receipt of reported claims for assumed business due to the procedure of having claims first reported through one or more intermediary insurers or reinsurers.
Key Assumptions
In establishing an estimate of loss and loss settlement expense reserves, management uses a number of key assumptions, which are as follows:
| |
• | To the best of our knowledge, there are no new latent trends that would impact our case-basis reserves; |
| |
• | Our case-basis reserves reflect the most up-to-date information available about the unique circumstances of each claim; |
| |
• | No new judicial decisions or regulatory actions will increase our case-basis obligations; |
| |
• | The historical patterns of claim frequency and claim severity utilized within our IBNR reserve calculation, without considering unusual events, are consistent and will continue to be consistent; and |
| |
• | The company’s historical ratio of loss settlement expenses (“LAE”) paid to losses paid is consistent and will continue to be consistent. |
To the best of our knowledge, there are no new latent trends that would impact our case-basis reserves;
Our case-basis reserves reflect the most up-to-date information available about the unique circumstances of each claim;
No new judicial decisions or regulatory actions will increase our case-basis obligations;
The historical patterns of claim frequency and claim severity utilized within our IBNR reserve calculation, without considering unusual events, are consistent and will continue to be consistent; and
The Company’s historical ratio of loss settlement expenses paid to losses paid is consistent and will continue to be consistent.
Our key assumptions are subject to change as actual claims occur and as we gain additional information about the variables that underlie our assumptions. Accordingly, management reviews and updates these assumptions periodically to ensure that the assumptions continue to be valid. If necessary, management makes changes not only
United Fire Group, Inc. Form 10-K | 2011
in the estimates derived from the use of these assumptions, but also in the assumptions themselves. Due to the inherent uncertainty in the loss reserving process, management believes that there is a reasonable chance that modification to key assumptions could individually, or in aggregate, result in reserve levels that are misstated either significantly above or below the actual amount for which the related claims will eventually settle.
United Fire & Casualty Company Form 10-K | 2010
As an example, if our loss and loss settlement expense reserves of $603.1945.1 million as of December 31, 20102011, is 10.0 percent inadequate, we would experience a reduction in future pre-tax earnings of up to $60.394.5 million. This reduction could be recorded in one year or multiple years, depending on when we identify the deficiency. The deficiency would also affect our financial position in that our equity would be reduced by an amount equivalent to the reduction in net income. Any deficiency that would be recognized in our loss and loss settlement expense reserves usually does not have a material effect on our liquidity because the claims have not been paid. Conversely, if our estimates of ultimate unpaid loss and loss settlement expense reserves prove to be redundant, our future earnings and financial position would be improved.
We are unable to reasonably qua ntifyquantify the impact of changes in our key assumptions utilized to establish individual case-basis reserves on our total reported reserve because the impact of these changes would be unique to each specific case-basis reserve established. However, based on historical experience, we believe that aggregate case-basis reserve volatility levels of 5.0 percent and 10.0 percent can be attributed to the ultimate development of our net case-basis reserves. The table below details the impact of this development volatility on our reported net case-basis reserves. The impact to pre-tax earnings would be a decrease if the reserves were to be adjusted upwards and an increase if the reserves were to be adjusted downwards.
| | | (In Thousands) | | | | | | | |
| Change in level of net case-basis reserve development | | 5% | | 10% | 5% | | 10% |
| Impact on rep orted net case-basis reserves | | $ | 15,715 | | | $ | 31,430 | | |
| Impact on reported net case-basis reserves | | $ | 19,918 |
| | $ | 39,836 |
|
Due to the formula-based nature of our IBNR and loss settlement expense reserve calculations, changes in the key assumptions utilized to generate these reserves can result in a quantifiable impact on our reported results. It is not possible to isolate and measure the potential impact of just one of these factors, and future loss trends could be partially impacted by all factors concurrently. Nevertheless, it is meaningful to view the sensitivity of the reserves to potential changes in these variables. To demonstrate the sensitivity of reserves to changes in significant assumptions, the following example is presented. The amounts reflect the pre-tax impact on earnings from a hypothetical percentage change in the calculation of IBNR and loss settlement expense reserves. The impact to pre-tax earnings would be a decrease if the reserves were to be adjusted upwards and an increase if the reserves were to be adjusted downwards. We believe that the changes presented are reasonably likely based upon an analysis of our historical IBNR and loss settlement expense reserve experience.
| | | (In Thousands) | | | | | | | |
| Change in claim frequency and claim severity assumptions | | 5% | | 10% | 5% | | 10% |
| Impact due to change in IBNR reserving assumptions | | $ | 5,451 | &n bsp; | | $ | 10,902 | | $ | 11,629 |
| | $ | 23,258 |
|
| | | (In Thousands) | | | | | | | |
| Change in LAE paid to losses paid ratio | | 1% | | 2% | 1% | | 2% |
| Impact due to change in LAE reserving assumptions | | $ | 1,408 | | | $ | 2,816 | | $ | 1,938 |
| | $ | 3,875 |
|
In 20102011, we did not change the key assumptions on which we based our reserving calculations. In estimating our 20102011 loss and loss settlement expense reserves, we did not anticipate future events or conditions that were inconsistent with past development patterns.
Certain of our lines of business are subject to the potential for greater loss and loss settlement expense development than others, which are discussed below.
United Fire Group, Inc. Form 10-K | 2011
Other Liability Reserves
Other liability is considered a long-tail line of business, as it can take a relatively long period of time to settle claims from prior accident years. This is partly due to the lag time between the date when a loss or event occurs that triggers coverage and the date when the claim is actually reported. Defense costs are also a part of the insured
United Fire & Casualty Company Form 10-K | 2010
expenses covered by liability policies and can be significant, sometimes greater than the cost of the actual paid claims. For the majority of our products, defense costs are outside of the policy limit, meaning that the amounts paid for defense costs are not subtracted from the available policy limit.
Factors that can cause reserve uncertainty in estimating reserves in this line include:
| |
• | The number of parties involved in the underlying tort action; |
| |
• | Whether the “event” triggering coverage is confined to only one time period or is spread over multiple time periods; |
| |
• | The potential dollars involved (in the individual claim actions); |
| |
• | Whether such claims were reasonably foreseeable and intended to be covered at the time the contracts were written (i.e., coverage disputes); and |
| |
• | The potential for mass claim actions. |
Reporting time lag;
The number of parties involved in the underlying tort action;
Whether the “event” triggering coverage is confined to only one time period or is spread over multiple time periods;
The potential dollars involved in the individual claim actions;
Whether such claims were reasonably foreseeable and intended to be covered at the time the contracts were written (i.e., coverage disputes); and
The potential for mass claim actions.
Claims with longer reporting time lags may result in greater inherent risk. This is especially true for alleged claims with a latency feature, particularly where courts have ruled that coverage is spread over multiple policy years, hence involving multiple defendants (and their insurers and reinsurers) and multiple policies (thereby increasing the potential dollars involved and the underlying settlement complexity). Claims with long latencies also increase the potential time lag between writing a policy in a certain market and the recognition that such policy has potential mass tort and/or latent claim exposure.
Our reserve for other liability claims at December 31, 20102011, is $282.7506.0 million and consists of 3,4195,358 claims,compared with $253.9282.7 million, consisting of 5,3633,419 claims at December 31, 20092010. Of the $282.7506.0 million total reserve for other liability claims, $85.1$79.0 millionis identified as defense costs and $18.9$15.5 million is identified as general overhead required in the settlement of claims. If our established reserve is overstated or understated by 10 percent, the potential impact to our Consolidated Financial Statements would be approximately $28.3 million, before federal income taxes.
Included in the other liability line of business are gross reserves for construction defect losses and loss settlement expenses. Construction defect is a liability allegation relating to defective work performed in the construction of structures such as commercial buildings, apartments, condominiums, single family dwellings or other housing, as well as the sale of defective building materials. These claims seek recovery due to damage caused by alleged deficient construction techniques or workmanship. At December 31, 20102011, we had $21.142.3 million in construction defect loss and loss settlement expense reserves, excluding IBNR reserves, which consisted of 3261,861 claims, compared with $15.2claims. The acquisition of Mercer Insurance Group contributed $24.9 million, excluding IBNR in construction defect loss and loss settlement expense reserves consisting of 234 claims, at December 31, 20092011., representing 1,535 claims. At December 31, 2010, our reserves, excluding IBNR reserves, totaled $21.1 million, which consisted of 326 claims. The reporting of such claims can be delayed, as the statute of limitations can be up to 10 years. Also, court decisions in recent years have expanded insurers’ exposure to construction defect claims. As a result, claims may be reported more than 10 years after a project has been completed, as litigation can proceed for several years before an insurance company is identified as a potential contributor. Claims have also emerged from parties claiming additional insured status on p oliciespolicies issued to other parties, such as contractors seeking coverage from a subcontractor’s policy.
In addition to these issues, other variables also contribute to a high degree of uncertainty in establishing reserves for construction defect claims. These variables include: whether coverage exists; when losses occur; the size of each loss; expectations for future interpretive rulings concerning contract provisions; and the extent to which the assertion of these claims will expand geographically. In recent years, we have implemented various underwriting measures
United Fire Group, Inc. Form 10-K | 2011
that we anticipate will mitigate the amount of construction defect losses experienced. These initiatives include increased care regarding additional insured endorsements and stricter underwriting guidelines on the writing of residential contractors and an increased utilization of loss control.
United Fire & Casualty Company Form 10-K | 2010
Asbestos and Environmental Reserves
Included in the other liability and assumed reinsurance lines of business are reserves for asbestos and other environmental losses and loss settlement expenses. At December 31, 20102011 and 20092010, we had $3.41.8 million and $3.83.4 million in direct and assumed asbestos and environmental loss reserves. In addition, we had ceded asbestos and environmental loss reserves of $0.3 million and $0.5 million at December 31, 20102011 and 20092010, respectively. The estimation of loss reserves for environmental claims and claims related to long-term exposure to asbestos and other substances is one of the most difficult aspects of establishing reserves, especially given the inherent uncertainties surrounding such clai ms.claims. Although we record our best estimate of loss and loss settlement expense reserves, the ultimate amounts paid upon settlement of such claims may be more or less than the amount of the reserves, because of the significant uncertainties involved and the likelihood that these uncertainties will not be resolved for many years.
Workers’ Compensation Reserves
Like the other liability line of business, workers’ compensation losses and loss settlement expense reserves are based upon variables that create imprecision in estimating the ultimate reserve. Estimates for workers’ compensation are particularly sensitive to assumptions about medical cost inflation, which has been steadily inc reasingincreasing over the past few years. Other variables that we consider and that contribute to the uncertainty in establishing reserves for workers’ compensation claims include: the state legislative and regulatory environments; trends in jury awards; and mortality rates. Because of these variables, the process of reserving for the ultimate loss and loss settlement expense to be incurred requires the use of informed judgment and is inherently uncertain. Consequently, actual loss and loss settlement expense reserves may deviate from our estimates. Such deviations may be significant. Our reserve for workers’ compensation claims at December 31, 20102011, is $128.5157.5 million and consists of 1,9672,015 claims, compared with $131.7128.5 million, consisting of 3,4161,967 claims, at December 31, 20092010. If our established reserve is overstated or understated by 10 percent, the potential impact to our Consolidated Financial Statements would be approximately $12.9 million, before federal income taxes .
Reserve Development
In establishing reserves, management’s goal is to ensure that our net reserves for losses and loss settlement expenses are adequate to cover all costs, while sustaining minimal variation from the time such reserves are initially estimated until the underlying claims are concluded. Changes in our reserve estimates over time, also referred to as “development,” will occur and may be material. Favorable development is recognized and reported in the Consolidated Financial Statements when we decrease our previous estimate of ultimate losses and loss settlement expenses, which results in an increase to net income in the period recognized. Adverse development is rec ognizedrecognized and reported in the Consolidated Financial Statements when we increase our previous estimate of ultimate losses and loss settlement expenses, which results in a decrease to net income.
In 2011 and 2010, our development resulted in a redundancy in our net reserves for prior accident years totaling $61.1 million and $45.9 million, respectively, which is consistent with our historical development, excluding the impact of Hurricane Katrina. In 2009 and 2008,, our development resulted in deficiencies in our net reserves for prior accident years totaling $26.2 million and $0.5 million, respectively.. Our development in these years was negatively impacted by adverse development from Hurricane Katrina claims and related litigation totaling $8.66.5 million, $38.08.6 million and $26.6 million in 2010, 2009 and 2008$38.0 million in 2011, 2010 and 2009, respectively. Also contributing to our deficiencydevelopment in 2009 and 2008 was the deterioration in our other liability lines of business which includes claims for construction defects.
Generally, we base reserves for each claim on the estimated ultimate exposure for that claim, determined from a pessimistic point of view. We believe that it is appropriate and reasonable to establish a best estimate for reserves within a range of reasonable estimates, especially when we are reserving for claims for bodily injury, disabilities and similar claims, for which settlements and verdicts can vary widely. Our reserving philosophy may result in favorable development in future ye arsyears that will decrease losses and loss settlement expenses for prior year claims in the year of adjustment. While we realize that this philosophy, coupled with what we believe to be aggressive and successful
United Fire Group, Inc. Form 10-K | 2011
claims management and loss settlement practices, has resulted in year-to-year redundancies in reserves, we believe our approach is better than experiencing year-to-year uncertainty as to the adequacy of our reserves.
United Fire & Casualty Company Form 10-K | 2010
The factors contributing to our year-to-year redundancy include:
| |
• | Establishing reserves that are appropriate and reasonable, but assuming a pessimistic view of potential outcomes. |
| |
• | Using claims negotiation to control the size of settlements. |
| |
• | Assuming that we have liability for all claims, even though the issue of liability may, in some cases, be resolved in our favor. |
| |
• | Promoting claims management services to encourage return-to-work programs, case management by nurses for serious injuries and management of medical provider services and billings. |
| |
• | Using programs and services to help prevent fraud and to assist in favorably resolving cases. |
Establishing reserves that are appropriate and reasonable, but assuming a pessimistic view of potential outcomes.
Using claims negotiation to control the size of settlements.
Assuming that we have liability for all claims, even though the issue of liability may, in some cases, be resolved in our favor.
Promoting claims management services to encourage return-to-work programs, case management by nurses for serious injuries and management of medical provider services and billings.
Using programs and services to help prevent fraud and to assist in favorably resolving cases.
Based upon our comparison of carried reserves to actual claims experience over the last several years, we believe that using company historical premium and claims data to establish reserves for losses and loss settlement expenses results in adequate and reasonable reserves. Based upon this comparison, we believe that our total established reserves at December 31, 20102011, are unlikely to vary by more than 10 percent of the recorded amounts, either positively or negatively. Historically, our reserves have had an average variance of less than 10 percent of recorded amounts, with our reserves booked as of December 31, 2009, generating a redundancy of 8.0 percent in 2010. Our reserves booked as of December 31, 2008, generated a reserve deficiency of 4.9 percent in 2009. These deficiencies areReserve development is discussed in detail under the heading “Reserve Development” in the “Property and Casualty Insurance Segment” of the “Results of Operations” section in this item.
The following table details the pre-tax impact on our property and casualty insurance segment’s financial results and financial condition of reasonably likely reserve development. Our lines of business that have historically been most susceptible to significant volatility in reserve development have been shown separately and utilize hypothetical levels of volatility of 5.0 percent and 10.0 percent. Our other, less volatile, lines of business have been aggregated and utilize hypothetical l evelslevels of volatility of 3.0 percent and 5.0 percent.
| | | (In Thousands) | | | | | | | | | | | | | | | |
| Hypothetical Reserve Development Volatility Levels | | -10% | | -5% | | +5% | | +10% | -10% | | -5% | | +5% | | +10% |
| Impact on loss and loss settlement expenses | | &n bsp; | | | | | | | | | | | | | |
| Other liability | | $ | (28,271 | ) | | $ | (14,136 | ) | | $ | 14,136 | | | $ | 28,271 | | $ | (50,596 | ) | | $ | (25,298 | ) | | $ | 25,298 |
| | $ | 50,596 |
|
| Workers' compensation | | (12,852 | ) | | (6,426 | ) | | 6,426 | | | 12,852 | | (15,749 | ) | | (7,874 | ) | | 7,874 |
| | 15,749 |
|
| Automobile | | (9,935 | ) | | (4,967 | ) | | 4,967 | | | 9,935 | | (13,433 | ) | | (6,717 | ) | | 6,717 |
| | 13,433 |
|
| | | | | | | | | | | | | | | | |
| Hypothetical Reserve Development Volatility Levels | | -5% | | -3% | | +3% | | +5% | -5% |
| | -3% |
| | +3% |
| | +5% |
|
| Impact on loss and loss settlement expenses | | | | | | | | | | | | | | | |
| All other lines | | $ | (4,625 | ) | | $ | (2,775 | ) | ; | $ | 2,775 | | | $ | 4,625 | | $ | (7,364 | ) | | $ | (4,418 | ) | | $ | 4,418 |
| | $ | 7,364 |
|
Independent Actuary
We engage an independent actuarial firm to render an opinion as to the reasonableness of the statutory reserves we establish. There were no material differences between our statut orystatutory reserves and those established under GAAP. During 20102011 and 20092010, we engaged the services of Regnier as our independent actuarial firm for the property and casualty insurance segment. We anticipate that this engagement will continue in 20112012.
It is management’s policy to utilize staff adjusters to develop our estimate of case-basis loss reserves. IBNR and loss settlement expense reserves are established through various form ulaeformulae that utilize pertinent, recent companyCompany historical data. The calculations are supplemented with knowledge of current trends and events that could result in adjustments to the level of IBNR and loss settlement expense reserves. In addition, management consults with Regnier throughout the year as deemed necessary. On an annual basis, we compare our estimate of total reserves to
United Fire & Casualty CompanyGroup, Inc. Form 10-K | 20102011
point estimates prepared by Regnier by line of business to ensure that our estimates are within the actuary’s acceptable range. Regnier performs an extensive review of loss and loss settlement expense reserves at each year end using generally accepted actuarial guidelines to ensure that the recorded reserves appear reasonable. If the carried reserves were deemed unreasonable, we would adjust reserves. In 20102011 and 20092010, after considering the actuary’s range of reasonable point estimates, management believed that carried reserves were reasonable and therefore did not adjust the recorded amount.
Regnier uses four projection methods in their actuarial analysis of our loss reserves and uses the paid-to-paid projection method in their analysis of our loss settlement expense reserves. Based on the results of the projection methods, the actuaries select an actuarial central estimate of the reserves, which is compared to our carried reserves to evaluate the reasonableness of the carried reserves. The four methods utilized by Regnier are: paid loss development; reported loss development; exp ectedexpected loss emergence based on paid losses; and expected loss emergence based on reported losses.
The actuarial analysis performed by Regnier indicated a reasonable range for our net reserves of $498.5705.3 million to $606.8887.3 million at December 31, 20102011. Our net reserves for losses and loss settlement expenses as of December 31, 20102011 were $564.1824.7 million.
We do not view the result of a single projection method as superior over the results of a combination of projection methods. That is, our actuary has not selected one method on which to evaluate our reserves for reasonableness. The results of Regnier’s use of various methods, in conjunction with their actuarial judgment, leads to the actuarially-determined estimate of the reserves. The impact of reasonably likely changes in the reserving variables is implicitly considered in Regnier’s use of several reserving methods.
Future Policy Benefits and Losses, Claims and Loss Settlement Expenses — Life Insurance Segment
We establish reserves for amounts that are payable under traditional insurance policies, including traditional life products, disability income and income annuities. Reserves are calculated as the present value of future benefits expected to be paid, reduced by the present value of future expected premiums. Our estimates use methods and underlying assumptions that are in accordance with GAAP and applicable actuarial standards. The key assumptions that we utilize in establishing reserves are mortality, morbidity, policy lapse, renewal, retirement, investment returns, inflation and expenses. Future investment return assumptions are determined based upon prevailing investment yields as well as estimated reinvestment yields. Mortality, mo rbiditymorbidity and policy lapse assumptions are based on our experience. Expense assumptions include the estimated effects of inflation and expenses to be incurred beyond the premium-paying period. These assumptions are established at the time the policy is issued, are consistent with the assumptions for determining DAC amortization for these contracts, and are generally not changed during the policy coverage period. However, if actual experience emerges in a manner that is significantly adverse relative to the original assumptions, adjustments to reserves (or DAC) may be required resulting in a charge to earnings which could have a material adverse effect on our operating results and financial condition.
For limited pay traditional life products, we periodically determine if any profit occurs at the issuance of a contract that should be deferred over the life of that contract .contract. To the extent that this occurs, we establish an unearned revenue liability at issuance that is amortized over the anticipated life of the contract.
We periodically review the adequacy of these reserves and recoverability of DAC for these contracts on an aggregate basis using actual experience. In the event that actual experience is significantly adverse compared to the original assumptions, any remaining unamortized DAC asset must be expensed to the extent not recoverable and the establishment of a premium deficiency reserve may be required. The effects of changes in reserve estimates are reported in the results of operations in the period in which the changes are determined. We have not made any changes in our methods or assumptions for estimating reserves in the past three years. However, we anticipate that changes in mortality, investment and reinvestment yields, and policy termination assumptions are the factors that would most likely require an adjustment to these reserves or related DAC asset.
Liabilities for future policy benefits for disability claims are estimated using the present value of benefits method and experience assumptions as to claim terminations, expenses and interest.
United Fire & Casualty CompanyGroup, Inc. Form 10-K | 20102011
Other reserves include claims that have been reported but not settled and IBNR claims on life and disability income insurance. We use our own historical experience and other assumptions such as any known or anticipated developments or trends to establish reserves for these unsettled or unreported claims. The effects of changes in our estimated reserves are included in the results of operations in the period in which the changes occur.
Our reserves for universal life and deferred annuity contracts are based upon the policyholders’ current account value. Acquisition expenses are amortized in relation to expected gross profits forecast based upon current best estimates of anticipated premium income, investment earnings, benefits and expenses. Annually, we review our estimates of reserves and the related DAC asset and compare them with actual experience. Differences between actual experience and the assumptions that we used in the pricing of these policies, guarantees and riders, and in the establishment of the related reserves will result in variances in profit, and could result in changes in net income. The effects of the changes in such estimated reserves are included in the results of operations in the period in which the changes occur.
The following table reflects the estimated pre-tax impact to DAC, net of unearned revenue liabilities to our universal life and fixed annuity products that could occur in a twelve-month period on account of an unlocking adjustment due to reasonably likely changes in significant assumptions. Changes in assumptions of the same magnitude in the opposite direction would have an impact of a similar magnitude but opposite direction of the examples provided.
|
| | |
| Assumption | Determination Methodology | Potential One-Time Effect on DAC Asset, Net of Unearned Revenue Liabilities |
| Mortality Experience | Based on our mortality experience with consideration given to industry experience and trends | A 10.0% increase in expected mortality experience for all future years would result in a reduction in DAC and an increase in current period amortization expense of $3.1$3.6 million. |
| Surrender Rates | Based on our policy surrender experience with consideration given to industry experience and trends | A 10.0% increase in expected surrender rates for all future years would result in a reduction in DAC and an increase in curr entcurrent period amortization expense of $2.3$2.2 million. |
| Interest Spreads | Based on our expected future investment returns and expected future crediting rates applied to policyholder account balances; future crediting rates include constraints imposed by policy guarantees | A 10-basis-point reduction in future interest rate spreads would result in a reduction in DAC and an increase in current period amortization expense of $1.9$2.3 million. |
| Maintenance Expenses | Based on our experience using an internal expense al locationallocation methodology | A 10.0% increase in future maintenance expenses would result in a reduction in DAC and an increase in current period amortization expense of $0.5$0.7 million. |
Independent Actuary
We engage an independent actuarial firm to render opinions as to the reasonableness of the statutory reserves we establish. Statutory reserves are established using considerably more conservative assumptions regarding future investment earnings and contractual benefit payments than are used for GAAP reserves. During 20102011 and 20092010, we engaged the services of Griffith, Ballard and Company as our independent actuarial firm for the life insurance segment. We anticipate that this engagement will continue in 2012.
Recoverability of Goodwill and Other Intangible Assets
Goodwill and other intangible assets arise as a result of business combinations and consist of the excess of the fair value of consideration paid over the tangible assets acquired and liabilities assumed.We evaluate goodwill and other intangible assets for impairment at least on an annual basis or whenever events or changes in circumstances indicate that it is more likely than not that the carrying amount of goodwill and other intangible assets may exceed the implied fair value. Goodwill is evaluated at the reporting unit level. Any impairment is charged to operations in the period that the impairment was recognized. We did not recognize an impairment charge on our goodwill in 2011.
United Fire Group, Inc. Form 10-K | 2011
Pension and Postretirement Benefit Obligations
The process of estimating our pension and postretirement benefit obligations and related benefit expense is inherently uncertain, and the actual cost of benefits may vary materially from the estimates recorded. These liabilities are particularly volatile due to their long-term nature and are based on several assumptions. The main assumptions used in the valuation of our benefit obligations are:
Estimated mortality of the employees and retirees eligible for benefits;
Estimated expected long-term rates of returns on investments;
Estimated compensation increases;
Estimated employee turnover;
Estimated medical trend rate; and
Estimated rate used to discount the ultimate estimated liability to a present value.
A change in any one or more of these assumptions is likely to result in an ultimate liability different from the original actuarial estimate. Such changes in estimates may be material. For example, a 100 basis point decrease in our estimated discount rate would increase the pension and postretirement benefit obligation at December 31, 2011, by $19.9 million and $7.1 million, respectively, while a 100 basis point increase in the rate would decrease the benefit obligation at December 31, 2011, by $15.8 million and $5.6 million, respectively.
In addition, for the postretirement benefit plan, a 100 basis point increase in the medical trend rate would increase the postretirement benefit obligation at December 31, 2011, by $7.1 million, while a 100 basis point decrease in the medical trend rate would decrease the benefit obligation at December 31, 2011, by $5.6 million.
A 100 basis point decrease in our estimated long-term rate of return on plan assets would increase the pension benefit expense for the year ended December 31, 2011, by $0.6 million, while a 100 basis point increase in the rate would decrease benefit expense by $0.6 million, for the same period.
For the postretirement benefit plan, an increase in our estimated medical trend rate would increase the postretirement benefit expense for the year ended December 31, 2011, by $0.8 million, while a 100 basis point decrease in the rate would decrease benefit expense by $0.6 million, for the same period.
|
|
| PENDING ACCOUNTING STANDARDS |
Incorporated by reference from Note 1 “Significant Accounting Policies” under the heading “Pending Accounting Standards,” contained in Part II, Item 8, “Financial Statements and Supplementary Data.”
United Fire & Casualty CompanyGroup, Inc. Form 10-K | 20102011
|
STATUTORY FINANCIAL MEASURES |
United Fire and its subsidiaries are required to file financial statements based on statutory accounting principles in each of the states where our insurance companies are domiciled and licen sed to conduct business. Management analyzes financial data and statements that are prepared in accordance with statutory accounting principles, as well as GAAP.
The following definitions of key statutory financial measures are provided for our readers’ convenience.
Regulation G promulgated by the Securities and Exchange Commission does not require reconciliation to GAAP of data prepared under a system of regulation of a government or governmental authority or self-regulatory organization that is applicable to the registrant.
Premiums written is a measure of our overall business volume. Net premiums written comprise direct and assumed premiums written, less ceded premiums written. Direct premiums written is the amount of premiums charged for policies issued during the period. For the property and casualty insurance segment there are no differences between direct statutory premiums written and direct premiums written under GAAP. However, for the life insurance segment, annuity deposits (i.e., sales) are included in direct statutory premiums written, whereas they are excluded for GAAP.
Assumed premiums written is consideration or payment we receive in exchange for insurance we provide to other insurance companies. We report these premiums as revenue as they are earned over the underlying policy period. Ceded premiums written is the portion of direct premiums written that we cede to our reinsurers under our reinsurance contracts. Premiums written is an important measure of business production for the period under review.
| | | | | | | | | | | | |
| | | Years Ended December 31 |
| (In Thousands) | | 2010 | | 2009 | | 2008 |
| Net premiums written | | $ | 463,892 | | | $ | 467,427 | | | $ | 496,897 | |
| Net change in unearned premium | | 5,669 | | | 10,956 | | | 7,564 | |
| Net change in prepaid reinsurance premium | | (88 | ) | | 115 | | | (1,086 | ) |
| Net premiums earned | | $ | 469,473 | | | $ | 478,498 | | | $ | 503,375 | |
Combined ratio is a commonly used statutory financial measure of underwriting performance. A combined ratio below 100.0 percent generally indicates a profitable book of business. The combined ratio is the sum of two separately calculate d ratios, the loss and loss settlement expense ratio (the “net loss ratio”) and the underwriting expense ratio (the “expense ratio”).
When prepared in accordance with GAAP, the net loss ratio is calculated by dividing the sum of losses and loss settlement expenses by net premiums earned. The expense ratio is calculated by dividing nondeferred underwriting expenses and amortization of deferred policy acquisition costs by net premiums earned.
When prepared in accordance with statutory accounting principles, the net loss ratio is calculated by dividing the sum of losses and loss settlement expenses by net premium earned; the expense ratio is calculated by dividing underwriting expenses by net premiums written .
United Fire & Casualty Company Form 10-K | 2010
|
NON-GAAP FINANCIAL MEASURES |
We believe that disclosure of certain Non-GAAP financial measures enhances investor understanding of our financial performance. The following No n-GAAP financial measure is utilized in this filing:
Catastrophe losses utilize the designations of the Insurance Services Office (ISO) and are reported with loss and loss settlement expense amounts net of reinsurance recoverables, unless specified otherwise. According to the ISO, a catastrophe loss is defined as a single unpredictable incident or series of closely related incidents that result in $25.0 million or more in industry-wide direct insured losses to property and that affect a significant number of insureds and insurers (“ISO catastrophe”). In addition to ISO catastrophes, we also include as catastrophes those events (“non-ISO catastrophes”) we believe are, or will be, material to our operations, either in amount or in number of claims made. Management, at times, may determine for comparison purposes that it is more meaningful to exclude extraordinary catastrophe losses and resulting litigation, such as Hurricane Katrina. The frequency and severity of catastrophic losses we experience in any year affect our results of operations and financial position. In analyzing the underwriting performance of our property and casualty insurance segment, we evaluate performance both including and excluding catastrophe losses. Portions of our catastrophe losses may be recoverable under our catastrophe reinsurance agreements. We include a discussion of the impact of catastrophes because we believe it is meaningful for investors to understand the variability in periodic earnings.
| | | | | | | | | | | | |
| | | Years Ended December 31 |
| (In Thousands) | | 2010 | | 2009 | | 2008 |
| ISO catastrophes | | $ | 24,806 | | | $ | 58,757 | | | $ | 84,102 | |
Less Hurricane Katrina loss development (1) | | (8,576 | ) | | (37,976 | ) | | (10,790 | ) |
| ISO catastrophes without Hurricane Katrina | | $ | 16,230 | | | $ | 20,781 | | | $ | 73,312 | |
| Non-ISO catastrophes | | 3,540 | | | 1,616 | | | 2,754 | |
| Total catastrophes | | $ | 19,770 | | | $ | 22,397 | | | $ | 76,066 | |
| |
(1) | This number reflects the reserves established for Hurricane Katrina litigation and does not include other Hurricane Katrina loss development. |
ITEM 7A. QUANTITATIVE AND QUALITATIVE DISCLOSURES ABOUT MARKET RISK
Incorporated by reference from Part II, Item 7, “Management’s Discussion and Analysis of Financial Condition and
Results of Operations” under the headings “Investments” and “Market Risk.”
United Fire & Casualty CompanyGroup, Inc. Form 10-K | 20102011
ITEM 8. FINANCIAL STATEMENTS AND SUPPLEMENTARY DATA
Consolidated Balance Sheets
December 31, 20102011 and 20092010
| | | (In Thousands, Except Per Share Data and Number of Shares) | 2010 | | 2009 | 2011 | | 2010 |
| ASSETS | | | | | | |
| Investments | | | | | | |
| Fixed maturities | | | | | | |
| Held-to-maturity, at amortized cost (fair value $6,422 in 2010 and $9,720 in 2009) | $ | 6,364 | | | $ | 9,605 | | |
| Available-for-sale, at fair value (amortized cost $2,178,666 in 2010 and $2,075,733 in 2009) | 2,278,429 | | | 2,158,391 | | |
| Equity securities, at fair value (cost $54,139 in 2010 and $53,306 in 2009 | 149,706 | | | 132,718 | | |
| Trading securities, at fair value (amortized cost $12,322 in 2010 and $11,724 in 2009) | 12,886 | | | 12,613 | | |
| Held-to-maturity, at amortized cost (fair value $4,161 in 2011 and $6,422 in 2010) | | $ | 4,143 |
| | $ | 6,364 |
|
| Available-for-sale, at fair value (amortized cost $2,562,786 in 2011 and $2,178,666 in 2010) | | 2,697,248 |
| | 2,278,429 |
|
| Equity securities, at fair value (cost $68,559 in 2011 and $54,139 in 2010 | | 159,451 |
| | 149,706 |
|
| Trading securities, at fair value (amortized cost $13,429 in 2011 and $12,322 in 2010) | | 13,454 |
| | 12,886 |
|
| Mortgage loans | 6,497 | | | 7,328 | | 4,829 |
| | 6,497 |
|
| Policy loans | 7,875 | | | 7,947 | | 7,209 |
| | 7,875 |
|
| Other long-term investments | 20,041 | | | 15,880 | | 20,574 |
| | 20,041 |
|
| Short-term investments | 1,100 | | | 7,359 | | 1,100 |
| | 1,100 |
|
| | $ | 2,482,898 | | | $ | 2,351,841 | | $ | 2,908,008 |
| | $ | 2,482,898 |
|
| Cash and cash equivalents | $ | 180,057 | | | $ | 190,852 | | $ | 144,527 |
| | $ | 180,057 |
|
| Accrued investment income | 28,977 | | | 28,697 | | 32,219 |
| | 28,977 |
|
| Premiums receivable (net of allowance for doubtful accounts of $1,001 in 2010 and $688 in 2009) | 124,459 | | | 127,456 | | |
| Premiums receivable (net of allowance for doubtful accounts of $825 in 2011 and $1,001 in 2010) | | 172,348 |
| | 124,459 |
|
| Deferred policy acquisition costs | 87,524 | | | 92,505 | | 106,654 |
| | 87,524 |
|
| Property and equipment (primarily land and buildings, at cost, less accumulated depreciation of $33,397 in 2010 and $30,812 in 2009) | 21,554 | | | 22,278 | | |
| Property and equipment (primarily land and buildings, at cost, less accumulated depreciation of $35,248 in 2011 and $33,397 in 2010) | | 45,644 |
| | 21,554 |
|
| Reinsurance receivables and recoverables | 46,731 | | | 40,936 | | 128,574 |
| | 46,731 |
|
| Prepaid reinsurance premiums | 1,586 | | | 1,673 | | 6,191 |
| | 1,586 |
|
| Income taxes receivable | 17,772 | | | 28,197 | | 26,742 |
| | 17,772 |
|
| Goodwill and intangible assets | | 30,801 |
| | 430 |
|
| Other assets | 15,881 | | | 18,109 | | 17,216 |
| | 15,451 |
|
| TOTAL ASSETS | $ | 3,007,439 | | | $ | 2,902,544 | | $ | 3,618,924 |
| | $ | 3,007,439 |
|
| LIABILITIES AND STOCKHOLDERS' EQUITY | | | | | | |
| Liabilities | | | | | | |
| Future policy benefits and losses, claims and loss settlement expenses | | | | | | |
| Property and casualty insurance | $ | 603,090 | | | $ | 606,045 | | $ | 945,051 |
| | $ | 603,090 |
|
| Life insurance | 1,389,331 | | | 1,321,600 | | 1,476,281 |
| | 1,389,331 |
|
| Unearned premiums | 200,341 | | | 206,010 | | 288,991 |
| | 200,341 |
|
| Accrued expenses and other liabilities | 78,439 | | | 84,934 | | 138,210 |
| | 78,439 |
|
| Deferred income taxes | 19,814 | | | 11,220 | | 13,624 |
| | 19,814 |
|
| Debt | | 45,000 |
| | — |
|
| Trust preferred securities | | 15,626 |
| | — |
|
| TOTAL LIABILITIES | $ | 2,291,015 | | | $ | 2,229,809 | | $ | 2,922,783 |
| | $ | 2,291,015 |
|
| Stockholders' Equity | | | | | | |
| Common stock, $3.33 1/3 par value; authorized 75,000,000 shares; 26,195,552 and 26,533,040 shares issued and outstanding in 2010 and 2009, respectively | $ | 87,318 | | | $ | 88,443 | | |
| Common stock, $0.001 par value; authorized 75,000,000 shares; 25,505,350 and 26,195,552 shares issued and outstanding in 2011 and 2010, respectively | | $ | 25 |
| | $ | 26 |
|
| Additional paid-in capital | 136,147 | | | 139,403 | | 213,045 |
| | 223,439 |
|
| Retained earnings | 415,981 | | | 384,242 | | 400,485 |
| | 415,981 |
|
| Accumulated other comprehensive income, net of tax | 76,978 | | | 60,647 | | 82,586 |
| | 76,978 |
|
| TOTAL STOCKHOLDERS' EQUITY | $ | 716,424 | | | $ | 672,735 | | $ | 696,141 |
| | $ | 716,424 |
|
| TOTAL LIABILITIES AND STOCKHOLDERS' EQUITY | $ | 3,007,439 | | | $ | 2,902,544 | | $ | 3,618,924 |
| | $ | 3,007,439 |
|
United Fire & Casualty CompanyGroup, Inc. Form 10-K | 20102011
Consolidated Statements of Income
Years Ended December 31, 20102011, 20092010 and 20082009
| | | (In Thousands, Except Per Share Data and Number of Shares) | | 2010 | | 2009 | | 2008 | 2011 | | 2010 | | 2009 |
| | | | | | | | | | | | |
| Revenues | | | | | | | | | | | |
| Net premiums earned | | $ | 469,473 | | | $ | 478,498 | | | $ | 503,375 | | $ | 586,783 |
| | $ | 469,473 |
| | $ | 478,498 |
|
| Investment income, net of investment expenses | | 111,685 | | | 106,075 | | | 107,577 | | 109,494 |
| | 111,685 |
| | 106,075 |
|
| Realized investment gains (losses) | | | | | | |
| | | | |
| Other-than-temporary impairment charges | | (459 | ) | | (18,307 | ) | | (9,904 | ) | (395 | ) | | (459 | ) | | (18,307 | ) |
| Other realized gains (losses), net | | 8,948 | | | 5,128 | | | (479 | ) | |
| Other realized gains, net | | 6,835 |
| | 8,948 |
| | 5,128 |
|
| Total realized investment gains (losses) | | 8,489 | | | (13,179 | ) | | (10,383 | ) | 6,440 |
| | 8,489 |
| | (13,179 | ) |
| Other income | | 1,425 | | | 799 | | | 880 | | 2,291 |
| | 1,425 |
| | 799 |
|
| | | $ | 705,008 |
| | $ | 591,072 |
| | $ | 572,193 |
|
| | | $ | 591,072 | | | $ | 572,193 | | | $ | 601,449 | | | | | | |
| Benefits, Losses and Expenses | | | | | | | | | | | |
| Losses and loss settlement expenses | | $ | 309,796 | | | $ | 382,494 | | | $ | 406,640 | | $ | 430,389 |
| | $ | 309,796 |
| | $ | 382,494 |
|
| Increase in liability for future policy benefits | | 27,229 | | | 23,897 | | | 23,156 | | 32,567 |
| | 27,229 |
| | 23,897 |
|
| Amortization of deferred policy acquisition costs | | 113,371 | | | 114,893 | | | 129,158 | | 153,176 |
| | 113,371 |
| | 114,893 |
|
| Other underwriting expenses | | 39,321 | | | 39,298 | | | 28,252 | | 58,757 |
| | 39,321 |
| | 39,298 |
|
| Disaster charges and other related expenses, net of recoveries | | (16 | ) | | (1,335 | ) | | 7,202 | | — |
| | (16 | ) | | (1,335 | ) |
| Interest on policyholders’ accounts | | 42,988 | | | 41,652 | | | 40,177 | | 42,834 |
| | 42,988 |
| | 41,652 |
|
| | | $ | 532,689 | | | $ | 600,899 | | | $ | 634,585 | | $ | 717,723 |
| | $ | 532,689 |
| | $ | 600,899 |
|
| | | | | | | |
| Income (loss) before income taxes | | $ | 58,383 | | | $ | (28,706 | ) | | $ | (33,136 | ) | $ | (12,715 | ) | | $ | 58,383 |
| | $ | (28,706 | ) |
| Federal income tax expense (benefit) | | 10,870 | | | (18,265 | ) | | (20,0 72 | ) | (12,726 | ) | | 10,870 |
| | (18,265 | ) |
| Net income (loss) | | $ | 47,513 | | | $ | (10,441 | ) | | $ | (13,064 | ) | $ | 11 |
| | $ | 47,513 |
| | $ | (10,441 | ) |
| | | | | | | |
| Weighted average common shares outstanding | | 26,318,214 | | | 26,590,458 | | | 26,959,875 | | 25,878,535 |
| | 26,318,214 |
| | 26,590,458 |
|
| Basic earnings (loss) per share | | $ | 1.81 | | | $ | (0.39 | ) | | $ | (0.48 | ) | $ | — |
| | $ | 1.81 |
| | $ | (0.39 | ) |
| Diluted earnings (loss) per share | | $ | 1.80 | | | $ | (0.39 | ) | | $ | (0.48 | ) | $ | — |
| | $ | 1.80 |
| | $ | (0.39 | ) |
| Cash dividends declared per share | | $ | 0.60 | | | $ | 0.60 | | | $ | 0.60 | | $ | 0.60 |
| | $ | 0.60 |
| | $ | 0.60 |
|
United Fire & Casualty CompanyGroup, Inc. Form 10-K | 20102011
Consolidated Statements of Stockholders’ Equity
Years Ended December 31, 20102011, 20092010 and 20082009
| | (In Thousands, Except Per Share Data and Number of Sh ares) | | 2010 | | 2009 | | 2008 | |
| | (In Thousands, Except Per Share Data and Number of Shares) | | 2011 | | 2010 | | 2009 |
| | | | | | | | | | | | |
| Common stock | | | | | | | | | | | |
| Balance, beginning of year | | $ | 88,443 | | | $ | 88,747 | | | $ | 90,653 | | $ | 26 |
| | $ | 26 |
| | $ | 26 |
|
| Shares repurchased (343,328 in 2010; 92,721 in 2009; and 580,792 in 2008) | | (1,144 | ) | | (309 | ) | | (1,936 | ) | |
| Shares issued for stock-based awards (5,840 in 2010; 1,675 in 2009; and 8,990 in 2008) | | 19 | | | 5 | | | 30 | | |
| Shares repurchased (702,947 in 2011; 343,328 in 2010; and 92,721 in 2009) | | (1 | ) | | — |
| | — |
|
| Shares issued for stock-based awards (12,745 in 2011; 5,840 in 2010; and 1,675 in 2009) | | — |
| | — |
| | — |
|
| Balance, end of year | | $ | 87,318 | | | $ | 88,443 | | | $ | 88,747 | | $ | 25 |
| | $ | 26 |
| | $ | 26 |
|
| | | | | | | | | | | | |
| Additional paid-in capital | | | | | | | | | | | |
| Balance, beginning of year | | $ | 139,403 | | | $ | 138,511 | | | $ | 149,511 | | $ | 223,439 |
| | $ | 227,820 |
| | $ | 227,232 |
|
Compensation expense and related tax benefit for
stock-based award grants | | 1,801 | | | 2,107 | | | 1,744 | | 1,830 |
| | 1,801 |
| | 2,107 |
|
| Shares repurchased | | (5,136 | ) | | (1,236 | ) | | (12,881 | ) | (12,432 | ) | | (6,280 | ) | | (1,545 | ) |
| Shares issued for stock-based awards | | 79 | | | 21 | | | 137 | | 208 |
| | 98 |
| | 26 |
|
| Balance, end of year | | $ | 136,147 | | | $ | 139,403 | | | $ | 138,511 | | $ | 213,045 |
| | $ | 223,439 |
| | $ | 227,820 |
|
| | | | | | | | | | | | |
| Retained earnings | | | | | | | | | | | |
| Balance, beginning of year | | $ | 384,242 | | | $ | 410,634 | | | $ | 439,860 | | $ | 415,981 |
| | $ | 384,242 |
| | $ | 410,634 |
|
| Net income (loss) | | 47,513 | | | (10,441 | ) | | (13,064 | ) | 11 |
| | 47,513 |
| | (10,441 | ) |
| Dividends on common stock ($0.60 per share in 2010, 2009 and 2008) | | (15,774 | ) | | (15,951 | ) | | (16,162 | ) | |
| Dividends on common stock ($0.60 per share in 2011, 2010 and 2009) | | (15,507 | ) | | (15,774 | ) | | (15,951 | ) |
| Balance, end of year | | $ | 415,981 | | | $ | 384,242 | | | $ | 410,634 | | $ | 400,485 |
| | $ | 415,981 |
| | $ | 384,242 |
|
| | | | | | | | | | | | |
| Accumulated other comprehensive income, net of tax | | | | | | | | | | | |
| Balance, beginning of year | | $ | 60,647 | | | $ | 3,849 | | | $ | 71,473 | | $ | 76,978 |
| | $ | 60,647 |
| | $ | 3,849 |
|
Change in net unrealized appreciation (1) | | 20,158 | | | 56,948 | | | (60,036 | ) | 21,727 |
| | 20,158 |
| | 56,948 |
|
Change in underfunded status of employee benefit plans (2) | | (3,827 | ) | | (150 | ) | | (7,588 | ) | (16,119 | ) | | (3,827 | ) | | (150 | ) |
| Balance, end of year | | $ | 76,978 | | | $ | 60,647 | | | $ | 3,849 | | $ | 82,586 |
| | $ | 76,978 |
| | $ | 60,647 |
|
| | | | | | | | | | | | |
| Summary of changes | | | | | | | | | | | |
| Balance, beginning of year | | $ | 672,735 | | | $ | 641,741 | | | $ | 751,497 | | $ | 716,424 |
| | $ | 672,735 |
| | $ | 641,741 |
|
| Net income (loss) | | 47,513 | | | (10,441 | ) | | (13,064 | ) | 11 |
| | 47,513 |
| | (10,441 | ) |
| All other changes in stockholders' equity accounts | | (3,824 | ) | | 41,435 | | | (96,692 | ) | (20,294 | ) | | (3,824 | ) | | 41,435 |
|
| Balance, end of year | | $ | 716,424 | | | $ | 672,735 | | | $ | 641,741 | | $ | 696,141 |
| | $ | 716,424 |
| | $ | 672,735 |
|
| | | | | | | | | | | | |
| Comprehensive income (loss) | | | | | | | | | | | |
| Net income (loss) | | $ | 47,513 | | | $ | (10,441 | ) | | $ | (13,064 | ) | $ | 11 |
| | $ | 47,513 |
| | $ | (10,441 | ) |
Change in net unrealized appreciation (1) | | 20,158 | | | 56,948 | | | (60,036 | ) | 21,727 |
| | 20,158 |
| | 56,948 |
|
Change in underfunded status of employee benefit plans (2) | | (3,827 | ) | | (150 | ) | | (7,588 | ) | (16,119 | ) | | (3,827 | ) | | (150 | ) |
| Comprehensive income (loss) for the year | &n bsp; | $ | 63,844 | | | $ | 46,357 | | | $ | (80,688 | ) | |
| Comprehensive income for the year | | $ | 5,619 |
| | $ | 63,844 |
| | $ | 46,357 |
|
| |
| (1) | The change in net unrealized appreciation is net of reclassification adjustments and income taxes. |
| |
| (2) | The recognition of the underfunded status of e mployeeemployee benefit plans is net of income taxes. |
The Notes to Consolidated Financial Statements are an integral part of these statements.
United Fire & Casualty CompanyGroup, Inc. Form 10-K | 20102011
Consolidated Statements of Cash Flows
Years Ended December 31, 20102011, 20092010 and 20082009
| | | (In Thousands) | | 2010 | | 2009 | | 2008 | 2011 | | 2010 | | 2009 |
| Cash Flows From Operating Activities | | | | | | | | | | | |
| Net income (loss) | | $ | 47,513 | | | $ | (10,441 | ) | | $ | ( 13,064 | ) | $ | 11 |
| | $ | 47,513 |
| | $ | (10,441 | ) |
| Adjustments to reconcile net income (loss) to net cash provided by operating activities | | | | | | | | | | | |
| Net accretion of bond premium | | $ | 4,727 | | | $ | 2,951 | | | $ | 3,069 | | $ | 11,638 |
| | $ | 4,727 |
| | $ | 2,951 |
|
| Depreciation and amortization | | 2,872 | | | 3,533 | | | 3,616 | | 5,583 |
| | 2,872 |
| | 3,533 |
|
| Stock-based compensation expense | | 1,787 | | | 2,084 | | | 1,780 | | 1,829 |
| | 1,787 |
| | 2,084 |
|
| Realized investment (gains) losses | | (8,489 | ) | | 13,179 | | | 10,383 | | (6,440 | ) | | (8,489 | ) | | 13,179 |
|
| Net cash flows from trading investments | | (585 | ) | | (2,492 | ) | | 1,866 | | (1,993 | ) | | (585 | ) | | (2,492 | ) |
| Deferred income tax expense (benefit) | | 977 | | | (10,858 | ) | | (11,752 | ) | (6,288 | ) | | 977 |
| | (10,858 | ) |
| Changes in | | | | | | | | | | | |
| Accrued investment income | | (280 | ) | | (848 | ) | | 582 | | 499 |
| | (280 | ) | | (848 | ) |
| Premiums receivable | | 2,997 | | | 6,839 | | | (13,236 | ) | (12,067 | ) | | 2,997 |
| | 6,839 |
|
| Deferred policy acquisition costs | | 2,340 | | | 2,804 | | | 7,017 | | 11,709 |
| | 2,340 |
| | 2,804 |
|
| Reinsurance receivables | | (5,795 | ) | | 19,339 | | | (14,800 | ) | (23,649 | ) | | (5,795 | ) | | 19,339 |
|
| Prepaid reinsurance premiums | | 87 | | | (114 | ) | | 1,086 | | 1,684 |
| | 87 |
| | (114 | ) |
| Income taxes receivable/payable | | 10,425 | | | (1,223 | ) | | (19,535 | ) | (6,310 | ) | | 10,425 |
| | (1,223 | ) |
| Other assets | | 2,228 | | | 1,851 | | | (3,388 | ) | 9,970 |
| | 2,228 |
| | 1,851 |
|
| Funds on deposit for Hurricane Katrina litigation | | — | | | 29,026 | | | (29,026 | ) | — |
| | — |
| | 29,026 |
|
| Future policy benefits and losses, claims and loss settlement expenses | | 30,134 | | | 45,474 | | | 121,498 | | 67,302 |
| | 30,134 |
| | 45,474 |
|
| Unearned premiums | | (5,669 | ) | | (10,956 | ) | | (7,564 | ) | 16,401 |
| | (5,669 | ) | | (10,956 | ) |
| Accrued expenses and other liabilities | | (12,382 | ) | | 10,054 | | | (961 | ) | 3,504 |
| | (12,382 | ) | | 10,054 |
|
| Deferred income taxes | | (1,177 | ) | | (275 | ) | | 338 | | (82 | ) | | (1,177 | ) | | (275 | ) |
| Other, net | | (494 | ) | | 482 | | | 5,995 | | 1,130 |
| | (494 | ) | | 482 |
|
| Total adjustments | | $ | 23,703 | | | $ | 110,850 | | | $ | 56,968 | | $ | 74,420 |
| | $ | 23,703 |
| | $ | 110,850 |
|
| Net cash provided by operating activities | | $ | 71,216 | | | $ | 100,409 | | | $ | 43,904 | | $ | 74,431 |
| | $ | 71,216 |
| | $ | 100,409 |
|
| Cash Flows From Investing Activities | | | | | | | | | | | |
| Proceeds from sale of available-for-sale investments | | $ | 3,402 | | | $ | 13,432 | | | $ | 6,724 | | $ | 39,496 |
| | $ | 3,402 |
| | $ | 13,432 |
|
| Proceeds from call and maturity of held-to-maturity investments | | 3,278 | | | 5,600 | | | 12,262 | | 2,243 |
| | 3,278 |
| | 5,600 |
|
| Proceeds from call and maturity of available-for-sale investments | | 471,499 | | | 348,581 | | | 358,248 | | 563,515 |
| | 471,499 |
| | 348,581 |
|
| Proceeds from short-term and other investments | | 4,353 | | | 31,937 | | | 127,516 | | 4,741 |
| | 4,353 |
| | 31,937 |
|
| Purchase of available-for-sale investments | | (567,499 | ) | | (502,392 | ) | | (534,668 | ) | (595,162 | ) | | (567,499 | ) | | (502,392 | ) |
| Purchase of short-term and other investments | | (7,653 | ) | | (16,672 | ) | | (67,766 | ) | (3,357 | ) | | (7,653 | ) | | (16,672 | ) |
| Net purchases and sales of property and equipment | | (2,091 | ) | | (10,575 | ) | | (9,571 | ) | (14,048 | ) | | (2,091 | ) | | (10,575 | ) |
| Acquisition of property and casualty company, net of cash acquired | | (172,620 | ) | | — |
| | — |
|
| Net cash used in investing activities | | $ | (94,711 | ) | | $ | (130,089 | ) | | $ | (107,255 | ) | $ | (175,192 | ) | | $ | (94,711 | ) | | $ | (130,089 | ) |
| Cash Flows From Financing Activities | | | | | | | | | | | |
| Policyholders’ account balances | | | | | | | | | | | |
| Deposits to investment and universal life contracts | | $ | 141,614 | | | $ | 264,994 | | | $ | 210,939 | | $ | 170,678 |
| | $ | 141,614 |
| | $ | 264,994 |
|
| Withdrawals from investment and universal life contracts | | (106,972 | ) | | (136,597 | ) | | (259,723 | ) | (119,716 | ) | | (106,972 | ) | | (136,597 | ) |
| Borrowings of short-term debt | | 124,900 |
| | — |
| | — |
|
| Repayment of short-term debt | | (82,900 | ) | | — |
| | — |
|
| Payment of cash dividends | | (15,774 | ) | | (15,951 | ) | | (16,162 | ) | (15,507 | ) | | (15,774 | ) | | (15,951 | ) |
| Repurchase of common stock | | (6,280 | ) | | (1,545 | ) | | (14,817 | ) | (12,433 | ) | | (6,280 | ) | | (1,545 | ) |
| Issuance of common stock | | 98 | | | 26 | | | 167 | | 208 |
| | 98 |
| | 26 |
|
| Tax impact from issuance of common stock | | 14 | | | 23 | | | (36 | ) | 1 |
| | 14 |
| | 23 |
|
| Net cash provided by (used in) financing activities | | $ | 12,700 | | | $ | 110,950 | | | $ | (79,632 | ) | |
| Net cash provided by financing activities | | $ | 65,231 |
| | $ | 12,700 |
| | $ | 110,950 |
|
| Net change in cash and cash equivalents | | $ | (10,795 | ) | | $ | 81,270 | | | $ | (142,983 | ) | $ | (35,530 | ) | | $ | (10,795 | ) | | $ | 81,270 |
|
| Cash and cash equivalents at beginning of year | &n bsp; | 190,852 | | | 109,582 | | | 252,565 | | 180,057 |
| | 190,852 |
| | 109,582 |
|
| Cas h and cash equivalents at end of year | | $ | 180,057 | | | $ | 190,852 | | | $ | 109,582 | | |
| Cash and cash equivalents at end of year | | $ | 144,527 |
| | $ | 180,057 |
| | $ | 190,852 |
|
The Notes to Consolidated Financial Statements are an integral part of these statements.
United Fire & Casualty CompanyGroup, Inc. Form 10-K | 20102011
|
| |
| Index of Notes to Consolidated Financial Statements | Page |
| |
| |
| |
| |
| |
| |
| |
| |
| |
| |
| |
| |
| |
| |
| |
| |
| |
| |
| |
| |
| |
United Fire & Casualty CompanyGroup, Inc. Form 10-K | 20102011
NOTES TO CONSOLIDATED FINANCIAL STATEMENTS
|
|
| NOTE 1. SUMMARY OF SIGNIFICANT ACCOUNTING POLICIES |
Nature of Business
United Fire & Casualty CompanyGroup, Inc. (“United Fire”) and its consolidated subsidiaries and affiliateaffiliates is engaged in the business of writing property and casualty insurance and life insurance and selling annuities through a network of independent agencies. We report our operations in two business segments: property and casualty insurance and life insurance. We areAt December 31, 2011, we were licensed as a property and casualty insurer in 43 states plus the District of Columbia and as a life insurer in 33 states.
On March 28, states.2011, we acquired 100 percent of the outstanding common stock of Mercer Insurance Group, Inc. for $191,475,000. The acquisition was funded through a combination of cash and $79,900,000 of short-term debt. Accordingly, the results of operations for Mercer Insurance Group, Inc. have been included in the accompanying consolidated financial statements from that date forward. After the acquisition, we market our products through over 1,300 independent property and casualty agencies. In addition, the acquisition allows us to diversify our exposure to weather and other catastrophe risks across our geographic markets. In connection with this acquisition, we incurred $8,318,000 of transaction costs, which included $5,540,000 of expense related to change in control payments made to the former executive officers of Mercer Insurance Group, Inc.. Refer to Note 16 "Business Combinations" for additional information on this acquisition.
Holding Company Reorganization
On February 1, 2012, United Fire & Casualty Company completed a corporate reorganization that resulted in the creation of United Fire Group, Inc., an Iowa corporation, as the holding company and sole owner of United Fire & Casualty Company. In connection with the reorganization transaction, each share of United Fire & Casualty Company common stock (par value $3.33 1/3 per share) that was issued and outstanding immediately prior to the effective date was automatically converted into a share of United Fire Group, Inc. common stock (par value $0.001 per share). In addition, each outstanding option to purchase or other right to acquire shares of United Fire & Casualty Company common stock was automatically converted into an option to purchase or right to acquire, upon the same terms and conditions, an identical number of shares of United Fire Group, Inc. common stock. United Fire Group, Inc. became the publicly held corporation upon completion of the reorganization.
We have accounted for the reorganization as a merger of entities under common control, which is similar to the former "pooling of interests method" to account for business combinations. Accordingly, the accompanying Consolidated Financial Statements include the consolidated financial position and results of operations of United Fire & Casualty Company on the same basis as was historically presented, except that the amount reported for common stock at par value has been retrospectively restated to report the par value of United Fire Group, Inc. common stock. The resulting difference has been recorded in additional paid-in capital for all periods presented.
Principles of Consolidation
The accompanying Consolidated Financial Statements include United Fire Group, Inc. and its wholly owned subsidiaries: United Fire & Casualty Company, United Life Insurance Company (“United Life”), Lafayette Insurance Company, Addison Insurance Company, American Indemnity Financial Corporation, Lafayette Insurance Company, United Fire & Indemnity Company, and Texas General Indemnity Company. Company and Mercer Insurance Group, Inc. which includes BICUS Services Corporation, Financial Pacific Insurance Agency (currently inactive), Financial Pacific Insurance Company, Financial Pacific Insurance Group, Inc., Franklin Insurance Company, Mercer Insurance Company, and Mercer Insurance Company of New Jersey, Inc. (collectively, "Mercer Insurance Group").
United Fire Lloyds, an affiliate of United Fire & Indemnity Company, has also been included in consolidation. All intercompany balances have been eliminated in consolidation.
United Fire Lloyds is organized as a Texas Lloy dsLloyds plan, which is an aggregation of underwriters who, under a common name, engage in the business of insurance through a corporate attorney-in-fact. United Fire Lloyds is financially and operationally controlled by United Fire & Indemnity
United Fire Group, Inc. Form 10-K | 2011
Company, its corporate attorney-in-fact, pursuant to three types of agreements: trust agreements between United Fire & Indemnity Company and certain individuals who agree to serve as trustees; articles of agreement among the trustees who agree to act as underwriters to establish how the Lloyds plan will be operated; and powers of attorney from each of the underwriters appointing a corporate attorney-in-fact, who is authorized to operate the Lloyds plan. Because United Fire & Indemnity Company can name the trustees, the Lloyds plan is perpetual, subject only to United Fire & Indemnity Company’s desire to terminate it.
United Fire & Indemnity Company provides all of the statutory capital necessary for the formation of the Lloyds plan by contributing capital to each of the trustees. The trust agreements require the trustees to become underwriters of the Lloyds plan, to contribute the capital to the Lloyds plan, to sign the articles of agreement and to appoint the attorney-in-fact. The trust agreements also require the trustees to pay to United Fire & Indemnity Company all of the profits and benefits received by the trustees as underwriters of the Lloyds plan, which means that United Fire & Indemnity Company has the right to receive 100 percent of the gains and profits from the Lloyds plan. The trustees serve at the pleasure of United Fire & Indemnity Company, which may remove a trustee and replace that trustee at any time. Termination of a trustee must be accompanied by the resignation of the trustee as an underwriter, so that the trustee can obtain the capital contribution from the Lloyds plan to r eimbursereimburse United Fire & Indemnity Company. By retaining the ability to terminate trustees, United Fire & Indemnity Company possesses the ability to name and remove the underwriters.
United Fire Lloyds and three statutory trusts affiliated with Financial Pacific Insurance Group, Inc., have also been included in consolidation. Refer to Note 18 “Trust Preferred Securities” for a discussion of the nature and purpose of the trusts. All intercompany balances have been eliminated in consolidation.
Basis of Presentation
The accompanying Consolidated Financial Statements have been prepared on the basis of U.S. generally accepted accounting principles (“GAAP”), which differ in some respects from those followed in preparing our statutory reports to insurance regulatory authorities. Our stand-alone financial statements submitted to insurance regulatory authorities are presented on the basis of accounting practices prescribed or permitted by the insurance departments of the states in which we are domiciled (“st atutorystatutory accounting practices”).
In the preparation of the accompanying Consolidated Financial Statements, we have evaluated all material subsequent events or transactions that occurred after the balance sheet date through the date on which the financial statements were issued for potential recognition or disclosure therein.
Certain prior year amounts have been reclassified to conform to the current year presentation.
92
United Fire & Casualty Company Form 10-K | 2010
Use of Estimates
The preparation of financial statements in conformity with GAAP requires management to make estimates and assumptions that affect the reported amounts of assets and liabilities and the disclosure of contingent assets and liabilities at the date of the financial statements, and the reported amounts of revenues and expenses during the reporting period. Actual results could differ from those estimates. The financial statement accountscategories that are most dependent on management estimates and assumptions includeinclude: investments; deferred policy acquisition costs (“DAC”)costs; reinsurance receivables and recoverables (for net realizable value); goodwill and intangible assets (for recoverability); and future policy benefits and losses, claims and loss settlement expenses.
Property and Casualty Insurance Business
Premiums written are deferred and recorded as earned premium on a daily pro rata basis over the terms of the respective policies. Unearned premium reserves are established for the portion of premiums written applicable to the unexpired term of insurance policies in force. Premiums receivable are presented net of an estimated allowance for doubtful accounts, which is based on a periodic evaluation of the aging and collectability of amounts due from policyholders.
Certain costs of underwriting new business, principally commissions, premium taxes and variable underwriting and
United Fire Group, Inc. Form 10-K | 2011
policy issue expenses, have been deferred. Such costs are amortized as premium revenue is recognized. Policy acquisition costs deferred in 20102011, 20092010 and 20082009 weretotaled $101,755,000132,503,000, $98,946,000101,755,000 and $111,521,00098,946,000, respectively. Amortization of DAC, which included $25,763,000 from the amortization of the value of business acquired asset, which was recorded as a result of our acquisition of Mercer Insurance Group, totaled $143,952,000 in 2011. Amortization of DAC in 2010, and 2009 and 2008 totaled $102,636,000, $105,606,000100,310,000 and $117,590,000105,606,000, respectively. The method followed in computing DAC limits the amount of such deferred costs to their estimated realizable value, which gives effect to the premium to be earned, losses and loss settlement expenses to be incurred and certain other costs expected to be incurred as the premium is earned.
To establish loss and loss settlement expense reserves, we make estimates and assumptions ab outabout the future development of claims. Actual results could differ materially from those estimates, which are subjective, complex and inherently uncertain. When we establish and adjust reserves, we do so given our knowledge at that time of the circumstances and facts of known claims. To the extent that we have overestimated or underestimated our loss and loss settlement expense reserves, we adjust the reserves in the period in which such adjustment is determined.
Life Insurance Business
Our whole life and term insurance (i.e., traditional business) premiums are reported as earned when due and benefits and expenses are associated with premium income in order to result in the recognition of profits over the lives of t hethe related contracts. Premiums receivable are presented net of an estimated allowance for doubtful accounts. On universal life and annuity policies (i.e., non-traditional business), income and expenses are reported when charged and credited to policyholder account balances in order to result in the recognition of profits over the lives of the related contracts. We accomplish this by means of a provision for future policy benefits and the deferral and subsequent amortization of policy acquisition costs.
The costs of acquiring new life business, principally commissions and certain variable underwriting, agency and policy issue expenses, have been deferred. These costs are amortized to income over the premium-paying period of the related traditional policies in proportion to the ratio of the expected annual premium revenue to the expected total premium revenue and over the an ticipatedanticipated terms of non-traditional policies in proportion to the ratio of the expected annual gross profits to the expected total gross profits. Policy acquisition costs deferred in 20102011, 20092010 and 20082009 weretotaled $8,807,0008,965,000, $13,612,0008,807,000 and $10,620,00013,612,000, respectively. Amortization of DAC in 20102011, 20092010 and 20082009 totaled $10,735,0009,224,000, $9,287,00010,735,000 and $11,568,0009,287,000, respectively. The expected premium revenue and gross profits are based upon the same mortality and withdrawal assumptions used in determining future policy benefits. For non-traditional policies, changes in the amount or timing of expected gross profits result in adjustments to the cumulative amortization of these costs. The effect on the amortization of DAC for revisions to estimated gross profits is reported in earnings in the period such estimated gross profits are revised.
United Fire & Casualty Company Form 10-K | 2010
The effect on DAC that results from the assumed realization of unrealized gains (losses) on investments allocated to non-traditional business is recognized with an offset to net unrealized investment appreciation as of the balance sheet dates. InThe DAC asset increased by $3,402,000 in 2011 and decreased by $2,172,000 and $63,425,000 in 2010 and 2009,, DAC decreased by $2,172,000 and $63,425,000, respectively, as a result of this adjustment.
Liabilities for future policy benefits for traditional products are computed by the net level premium method, using interest assumptions ranging from 4.5 percent to 6.0 percent and withdrawal, mortality and morbidity assumptions appropriate at the time the policies were issued. Liabilities for non-traditional business are stated at policyholder account values before surrender charges. Liabilities for traditional immediate annuities are based primarily upon future anticipated cash flows using statutory mortality and interest rates, which produ ceproduce results that are not materially different from GAAP. Liabilities for deferred annuities are carried at the account value.
Investments
Investments in fixed maturities include bonds and redeemable preferred stocks. Our investments in held-to-maturity fixed maturities are recorded at amortized cost. Our investments in available-for-sale fixed maturities and trading securities are recorded at fair value.
United Fire Group, Inc. Form 10-K | 2011
Investments in equity securities, which include common and non-redeemable preferred stocks, are classified as available-for-sale and recorded at fair value.
Changes in unrealized appreciation and depreciation, with respect to available-for-sale fixed maturities and equity securities, are reported as a component of accumulated other comprehensive income, net of applicable deferred income taxes, in stockholders’ equity.
Other long-term investments consist primarily of our interests in limited liability partnerships or joint ventures and are recorded on the equity method of accounting. Mortgage loans are recorded at cost.their unpaid principal balance. Policy loans are recorded at the outstanding loan amount due from policyholders. Included in investments at December 31, 20102011 an dand 20092010, are securities on deposit with, or available to, various regulatory authorities as required by law, with fair values of $1,563,821,0001,682,525,000 and $1,464,406,0001,563,821,000, respectively.
Realized gains or losses on disposition of investments are computed using the specific identification method and are included in the computation of net income.
In 20102011, 20092010 and 20082009, we recorded a pre-tax realized loss of $459,000395,000, $18,307,000459,000 and $9,904,00018,307,000, respectively, as a result of the recognition of other-than-temporary impairment (“OTTI”) charges on certain holdings in our investment portfolio. None of the OTTI charges were considered to have a noncredit related loss component. We continue to review all of our investment holdings for appropriate valuation on an ongoing basis. Refer to Note 2 “Summary of Investments” for a discussion of our accounting policy for impairment recognition.
Reinsurance
Premiums earned and losses and loss settlement expenses incurred are reported net of reinsurance ceded. Ceded insurance business is accounted for on a basis consistent with the original policies issued and the terms of the reinsur ancereinsurance contracts. Refer to Note 54 “Reinsurance” for a discussion of our reinsurance operations.
Cash and Cash Equivalents
For purposes of reporting cash flows, cash and cash equivalents include cash, money market accounts and non-negotiable certificates of deposit with original maturities of three months or less.
We made payments for income taxes of $14,124,000, $4,324,000 and $13,817,000 during 2010$570,000, 2009$14,124,000 and 2008$4,324,000 during 2011, 2010 and 2009, respectively. In addition, we received refunds totaling $13,491,000, $10,256,000$13,491,000 and $2,904,000$10,256,000 in 2010, and 2009 and 2008, respectively, due to the overpayment of prior year tax and carryback of operating losses. ThereIn 2011, we received no refunds. We made payments of interest totaling $1,926,000 during 2011, which does not include payments to policyholders' accounts related to non-traditional life insurance business. In 2010 and 2009, there were no significant payments of interest, in 2010, 2009 and 2008, other than payments to policyholders’ accounts related to non-traditional life insurance business.accounts.
United Fire & Casualty Company Form 10-K | 2010
Property, Equipment and Depreciation
Property and equipment is presented at cost less accumulated depreciation. Expenditures for maintenance and repairs are generally expensed as incurred. We periodica llyperiodically review these assets for impairment whenever events or changes in business circumstances indicate that the carrying value of the underlying asset may not be recoverable. A loss would be recognized if the estimated fair value of the asset were less than its carrying value.
Depreciation is computed primarily by the straight-line method over the following estimated useful lives:
United Fire Group, Inc. Form 10-K | 2011
|
| |
| | Useful Life |
| Computer equipment | Three years |
| Furniture and fixtures | Seven years |
| Leasehold improvements | Shorter of the lease term or useful life of the asset |
| Real estate | Seven to thirty-nine years |
| Software | Three years |
Depreciation expense totaled $2,812,0003,661,000, $3,473,0002,812,000 and $3,556,0003,473,000 for 20102011, 20092010 and 20082009, respectively.
AmortizationGoodwill and Other Intangible Assets
Goodwill and other intangible assets arise as a result of Intangibles
Our intangibles are composed entirelybusiness combinations and consist of agency relationships, which are being amortized by the straight-line methodexcess of the fair value of consideration paid over periods of up to 10 years.the tangible assets acquired and liabilities assumed. We regularly reviewevaluate goodwill and other intangible assets for impairment at least on an annual basis or whenever events or changes in circumstances indicate that it is more likely than not that the carrying valueamount of our intangibles forgoodwill and other intangible assets may exceed the implied fair value. Goodwill is evaluated at the reporting unit level. Any impairment in the recoverability of the underlying asset, with any impairment beingis charged to operations in the period that the impairment was recognized. We did not recognize an impairment charge on our intangiblesgoodwill in 20102011.
Our intangible assets, which consist primarily of agency relationships, trade names, licenses, and software, are being amortized by the straight-line method over periods ranging from 2 years to 15 years, with the exception of licenses, which are indefinite-lived and not amortized. We did not recognize an impairment charge on our intangible assets in 2011, 20092010 and 20082009.
Amortization expense, which is allocated to the property and casualty insurance segment, totaled$1,922,000 for 2011, and $60,000 for both 2010, 2009 and 20082009, respectively.
Income Taxes
Deferred tax assets and liabilities are established based on differences between the financial statement bases of assets and liabilities and the tax basesbasis of those same assets and liabilities, using the currently enacted statutory tax rates. Deferred income tax expense is measured by the year-to-year change in the net deferred tax asset or liability, except for certain changes in deferred tax amounts that affect stockholders’stockholders' equity and do not impact federal income tax expense.
We h avehave recognized no liability for unrecognized tax benefits at December 31, 20102011 or 20092010 or at any time during 20102011 or 20092010. In addition, we have not accrued for interest and penalties related to unrecognized tax benefits. However, if interest and penalties would need to be accrued related to unrecognized tax benefits, such amounts would be recognized as a component of federal income tax expense.
We file a consolidated federal income tax return. We also file income tax returns in various state jurisdictions. We are no longer subject to federal or state income tax examination for years before 2006. There are ongoing examinations of income tax returns by the Internal Revenue Service of the 2008 tax year and by the State of IllinoisFlorida for the 2007 and 2008 through 2010 tax years.
Stock-Based Compensation
We currently have two equity compensation plans. One plan allows us to grant restricted and unrestricted stock, stock appreciation rights, incentive stock options, and non-qualified stock options to employees. The other plan allows us to grant restricted and unrestricted stock and non-qualified stock options to non-employee directors.
For our non-qualified stock options, we utilize the Black-Scholes option pricing method to establish the fair value of options granted under our stock awardequity compensation plans. Our determination of the fair value of stock options on the date of grant using this option-pricing model is affected by our stock price, as well as assumptions regarding a number of complex and subjective variables, which include the expected volatility in our stock price, the expected term of the award, the expected dividends to be paid over the term of the award and the expected risk-free interest rate. Any changes in these assumptions may materially affect the estimated fair value of the award. For our restricted
United Fire & Casualty CompanyGroup, Inc. Form 10-K | 20102011
For our restricted and unrestricted stock awards, we utilize the fair value of our common stock on the date of grant to establish the fair value of the award.
For 2010, 2009 and 2008, we recognized stock-based compensation expense of $1,787,000, $2,084,000 and $1,780,000, respectively. As of December 31, 2010, we have $3,229,000 in stock-based compensation expense that has yet Refer to be recognized through our results of operations. This compensation expense will be recognized over a term of five years as reported in the following table, except with respect to awards that are accelerated by the Board of Directors, in which case any remaining compensation expense would be recognized in the period in which the awards are accelerated.
| | | |
| (In Thousands) | |
| 2011 | $ | 1,362 | |
| 2012 | 967 | |
| 2013 | 531 | |
| 2014 | 300 | |
| 2015 | 69 | |
| Total | $ | 3,229 | |
Securities Lending
We terminated our participation in a securities lending program effective December 31, 2010. Our participation in the securities lending program generated investment income of $100,000, $139,000 and $89,000 in 2010, 2009 and 2008, respectively.Note 9 “Stock Option Plans” for further discussion.
Recently Issued Accounting Standards
AdoptedAdoption of Accounting Standards
Fair Value MeasurementsGoodwill Impairment
In January 2010,September 2011, the FASB issued revisedupdated accounting guidance that clarifiesis intended to reduce complexity and provides additional disclosure requirements relatedcosts by allowing an entity to recurring and non-recurringmake a qualitative evaluation about the likelihood of goodwill impairment to determine whether it should calculate the fair value measurements.of a reporting unit. The updated guidance requires separate disclosures foralso improves previous guidance by expanding upon the amountsexamples of significant transfersevents and circumstances that an entity should consider between annual impairment tests in and out of Level 1 and Level 2determining whether it is more likely than not that the fair value measurements, alongof a reporting unit is less than its carrying amount. In addition, the updated guidance improves the examples of events and circumstances that an entity having a reporting unit with an explanation for the transfers. Additionally, a separate disclosure is required for purchases, sales, issuances and settlements on a gross basis for Level 3 fair value measurements. The guidance also provides additional clarification for both the level of disaggregation reported for each class of assetszero or liabilities and disclosures of inputs and valuation techniques usednegative carrying amount should consider in determining whether to measure fair value for both recurring and non-recurring fair value measurements for assets and liabilities categorized as Level 2 or Level 3.
an impairment loss, if any, under the second step of the goodwill impairment test. The new disclosures and clarifications of existing disclosures areupdated guidance is effective for annual and interim and annual reporting periods beginning after December 15, 2009, except for the disclosures about purchases, sales, issuances, and settlements in the roll forward of activity in Level 3 fair value measurements, which are effectivegoodwill impairment tests performed for fiscal years beginning after December 15, 20 10. Refer2011, with early adoption permitted. We have elected to Note 3 “Fair Value ofearly adopt this guidance, which did not impact the amounts reported in our Consolidated Financial Instruments” for the information required to be disclosed upon our adoption of the guidance, effective January 1, 2010. We do not anticipate that our adoption of the guidance, effective January 1, 2011, will have any impact on our consolidated financial position or results of operations.Statements.
United Fire & Casualty Company Form 10-K | 2010
Pending Adoption of Accounting Standards
Financial Services — InsurancePolicy Acquisition Costs
In October 2010, the FASB issued updated accounting guidance to address the diversity in practice for the accou ntingaccounting for costs associated with acquiring or renewing insurance contracts. This guidance modifies the definition of acquisition costs to specify that a cost must be incremental and directly related to the successful acquisition of a new or renewal insurance contract in order to be deferred. Acquisition costs that are not eligible for deferral are to be charged to expense in the period incurred. If application of this guidance would result in the capitalization of acquisition costs that had not previously been capitalized by a reporting entity, the entity may elect not to capitalize those costs. The updated guidance is effective for interim and annual reporting periods beginning after December 15, 2011. We arewill adopt this guidance prospectively effective January 1, 2012.The implementation of this guidance will reduce the amount of acquisition costs we can capitalize and report as an asset in the accompanying Consolidated Balance Sheets. We currently evaluatingestimate that the impactcorresponding reduction in pretax income will be approximately $11,000,000 to $17,000,000 in 2012. However, this estimate is preliminary in nature and the actual amount of the reduction may be above or below the range.
Comprehensive Income
In June 2011, the FASB issued revised accounting guidance that oureliminates the option to present the components of other comprehensive income as part of the statement of stockholders' equity. Instead, comprehensive income must be reported in either a single continuous statement of comprehensive income that contains two sections, net income and other comprehensive income, or in two separate but consecutive statements. The revised guidance will be effective for public companies for interim and annual reporting periods beginning after December 15, 2011 with early adoption of thepermitted, and is to be applied retrospectively. We will adopt this guidance effective January 1, 2012, which will have not change the items that constitute net income or other comprehensive income as currently reported.
Fair Value Measurements
In May 2011, the FASB issued updated accounting guidance that changes the wording used to describe many of the requirements in GAAP for measuring fair value and for disclosing information about fair value measurements to ensure consistency between GAAP and International Financial Reporting Standards. The guidance also expands the disclosures for fair value measurements that are estimated using significant unobservable (i.e., Level 3) inputs. The updated guidance is to be applied prospectively for public companies for interim and annual reporting periods beginning after December 15, 2011. We will adopt this guidance effective January 1, 2012 and anticipate no impact
United Fire Group, Inc. Form 10-K | 2011
on our Consolidated Financial Statements.financial position or results of operations.
United Fire & Casualty CompanyGroup, Inc. Form 10-K | 20102011
|
|
| NOTE 2. SUMMARY OF INVESTMENTS |
Fair Value of Investments
A reconciliation of the amortized cost (cost for equity securities) to fair value of investments in held-to-maturity and available-for-sale fixed maturity and equity securities at December 31, 20102011 and 20092010, is as follows:
| | December 31, 2010 | (In Thousands) | |
| | December 31, 2011 | | (In Thousands) |
| Type of Investment | Cost or Amortized Cost | | Gross Unrealized Appreciation | | Gross Unrealized Depreciation | | Fair Value | Cost or Amortized Cost | | Gross Unrealized Appreciation | | Gross Unrealized Depreciation | | Fair Value |
| HELD-TO-MATURITY | | | | | | | | | | | | | | |
| Fixed maturities | | | | | | | | | | | | | | |
| Bonds | | | | | | | | | | | | | | |
| United States government | | | | | | | | |
| Collateralized mortgage obligations | $ | 83 | | | $ | 4 | | | $ | — | | | $ | 87 | | |
| Mortgage-backed securities | 444 | | | 50 | | | — | | | 494 | | |
| States, municipalities and political subdivisions | | | | | &nb sp; | | | | | | | | | |
| General obligations | 731 | | | 10 | | | — | | | 741 | | $ | 496 |
| | $ | 5 |
| | $ | — |
| | $ | 501 |
|
| Special revenue | 5,106 | | | 102 | | | 108 | | | 5,100 | | | | | | | | |
| North central - East | | 242 |
| | 12 |
| | — |
| | 254 |
|
| North central - West | | 218 |
| | 12 |
| | — |
| | 230 |
|
| South | | 633 |
| | 1 |
| | 61 |
| | 573 |
|
| West | | 2,150 |
| | 22 |
| | — |
| | 2,172 |
|
| Collateralized mortgage obligations | | 48 |
| | 2 |
| | — |
| | 50 |
|
| Mortgage-backed securities | | 356 |
| | 25 |
| | — |
| | 381 |
|
| Total Held-to-Maturity Fixed Maturities | $ | 6,364 | | | $ | 166 | | | $ | 108 | | | $ | 6,422 | | $ | 4,143 |
| | $ | 79 |
| | $ | 61 |
| | $ | 4,161 |
|
| AVAILABLE-FOR-SALE | | | | | | | | | | | | | | |
| Fixed maturities | | | | | | | | | | | | | | |
| Bonds | | | | | | | | | | | | | | |
| United States government | | | | | | | | |
| Collateralized mortgage obligations | $ | 17,564 | | | $ | 2,013 | | | $ | — | | | $ | 19,577 | | |
| Mortgage-backed securities | 2 | | | — | | | — | | | 2 | | |
| U.S. government and government-sponsored enterprises | | | | | | | | |
| U.S. Treasury | 38,133 | | | 943 | | | — | | | 39,076 | | $ | 42,530 |
| | $ | 1,421 |
| | $ | — |
| | $ | 43,951 |
|
| Agency | 104,049 | | | 96 | | | 1,014 | | | 103,131 | | 95,813 |
| | 582 |
| | — |
| | 96,395 |
|
| States, municipalities and political subdivisions | | | | | | | | | | | | | | |
| General obligations | 371,790 | | | 22,329 | | | 338 | | | 393,781 | | | | | | | | |
| Midwest | | | | | | | | |
| North central - East | | 118,456 |
| | 11,149 |
| | — |
| | 129,605 |
|
| North central - West | | 76,986 |
| | 7,325 |
| | — |
| | 84,311 |
|
| Northeast | | 37,436 |
| | 3,428 |
| | 1 |
| | 40,863 |
|
| South | | 105,034 |
| | 10,439 |
| | — |
| | 115,473 |
|
| West | | 68,329 |
| | 6,049 |
| | — |
| | 74,378 |
|
| Special revenue | 216,245 | | | 9,782 | | | 594 | | | 225,433 | | | | | | | | |
| Midwest | | | | | | | | |
| North central - East | | 66,188 |
| | 4,625 |
| | — |
| | 70,813 |
|
| North central - West | | 50,658 |
| | 4,578 |
| | — |
| | 55,236 |
|
| Northeast | | 13,780 |
| | 955 |
| | 2 |
| | 14,733 |
|
| South | | 95,565 |
| | 7,514 |
| | 5 |
| | 103,074 |
|
| West | | 54,607 |
| | 5,014 |
| | — |
| | 59,621 |
|
| Foreign bonds | | | | | | | | | | | | | | |
| Canadian | 69,209 | | | 3,908 | | | 194 | | | 72,923 | | 69,107 |
| | 3,269 |
| | 200 |
| | 72,176 |
|
| Other | 85,434 | | | 4,588 | | | 268 | | | 89,754 | | |
| Other foreign | | 137,765 |
| | 5,497 |
| | 623 |
| | 142,639 |
|
| Public utilities | | | | | | | | | | | | | | |
| Electric | 204,765 | | | 11,298 | | | 519 | | | 215,544 | | 220,682 |
| | 13,047 |
| | 250 |
| | 233,479 |
|
| Natural gas | 56,873 | | | 2,560 | | | 359 | | | 59,074 | | |
| Gas distribution | | 24,044 |
| | 1,677 |
| | 63 |
| | 25,658 |
|
| Other | 3,293 | | | 397 | | | — | | | 3,690 | | 10,096 |
| | 838 |
| | — |
| | 10,934 |
|
| Corporate bonds | | | | | | | | | | | | | | |
| Banks, trusts and insurance companies | 265,679 | | | 12,755 | | | 2,714 | | | 275,720 | | |
| Transportation | 25,624 | | | 1,090 | | | 57 | | | 26,657 | | |
| Energy | 150,873 | | | 7,041 | | | 110 | | | 157,804 | | |
| Technology | 102,768 | | | 6,048 | | | 396 | | | 108,420 | | |
| Basic industry | 116,591 | | | 5,285 | | | 237 | | | 121,639 | | |
| Credit cyclicals | 64,331 | | | 3,591 | | | 100 | | | 67,822 | | |
| Other | 285,443 | | | 14,309 | | | 1,370 | | | 298,382 | | |
| Total Available-For-Sale Fixed Maturities | $ | 2,178,666 | | | $ | 108,033 | | | $ | 8,270 | | | $ | 2,278,429 | &n bsp; | |
| Equity securities | | | | | | | | |
| Common stocks | | | | | | | | |
| Public utilities | | | | | | | | |
| Electric | $ | 6,011 | | | $ | 4,751 | | | $ | 1 | | | $ | 10,761 | | |
| Natural gas | 838 | | | 1,159 | | | — | | | 1,997 | | |
| Banks, trusts and insurance companies | | | | | | | | |
| Oil and gas | | 189,902 |
| | 7,567 |
| | 277 |
| | 197,192 |
|
| Chemicals | | 59,569 |
| | 2,692 |
| | — |
| | 62,261 |
|
| Basic resources | | 24,448 |
| | 129 |
| | 516 |
| | 24,061 |
|
| Construction and materials | | 23,962 |
| | 384 |
| | 16 |
| | 24,330 |
|
| Industrial goods and services | | 177,717 |
| | 7,426 |
| | 118 |
| | 185,025 |
|
| Autos and parts | | 17,743 |
| | 801 |
| | 315 |
| | 18,229 |
|
| Food and beverage | | 66,753 |
| | 2,621 |
| | 133 |
| | 69,241 |
|
| Personal and household goods | | 59,256 |
| | 2,721 |
| | 14 |
| | 61,963 |
|
| Health care | | 109,219 |
| | 6,497 |
| | 45 |
| | 115,671 |
|
| Retail | | 57,345 |
| | 2,718 |
| | — |
| | 60,063 |
|
| Media | | 40,346 |
| | 1,670 |
| | 47 |
| | 41,969 |
|
| Travel and leisure | | 2,851 |
| | 11 |
| | 184 |
| | 2,678 |
|
| Telecommunications | | 38,203 |
| | 1,715 |
| | 3 |
| | 39,915 |
|
| Banks | 8,013 | | | 33,255 | | | 100 | | | 41,168 | | 129,326 |
| | 3,755 |
| | 1,205 |
| | 131,876 |
|
| Insurance | 3,129 | | | 11,320 | | | 41 | | | 14,408 | | 22,878 |
| | 831 |
| | 9 |
| | 23,700 |
|
| Other | 1,505 | | | 1,381 | | | — | | | 2,886 | | |
| All other common stocks | | | | | | | | |
| Transportation | 1 | | | — | | | — | | | 1 | | |
| Energy | 5,211 | | | 6,235 | | | 2 | | | 11,444 | | |
| T echnology | 8,100 | | | 6,692 | | | 139 | | | 14,653 | | |
| Basic industry | 7,789 | | | 9,116 | | | — | | | 16,905 | | |
| Credit cyclicals | 116 | | | 667 | | | — | | | 783 | | |
| Other | 11,965 | | | 21,448 | | | 103 | | | 33,310 | | |
| Nonredeemable preferred s tocks | 1,461 | | | 3 | | | 74 | | | 1,390 | | |
| Total Available-for-Sale Equity Securities | $ | 54,139 | | | $ | 96,027 | | | $ | 460 | | | $ | 149,706 | | |
| Total Available-for-Sale Securities | $ | 2,232,805 | | | $ | 204,060 | | | $ | 8,730 | | | $ | 2,428,135 | | |
| Real estate | | 20,981 |
| | 2,222 |
| | 181 |
| | 23,022 |
|
| Financial services | | 85,341 |
| | 2,267 |
| | 905 |
| | 86,703 |
|
United Fire & Casualty CompanyGroup, Inc. Form 10-K | 20102011
| | | | | | | | | | | | | | | |
| December 31, 2009 | (In Thousands) |
| Type of Investment | Cost or Amortized Cost | | Gross Unrealized Appreciation | | Gross Unrealized Depreciation | | Fair Value |
| HELD-TO-MATURITY | | | | | | | |
| Fixed maturities | | | | | | | |
| Bonds | | | | | | | |
| United States government | | | | | | | |
| Collateralized mortgage obligations | $ | 955 | | | $ | 21 | | | — | | | $ | 976 | |
| Mortgage-backed securities | 534 | | | 73 | | | — | | | 607 | |
| States, municipalities and political subdivisions | | | | | | | |
| General obligations | 1,478 | | | 21 | | | 5 | | | 1,494 | |
| Special revenue | 6,638 | | | 163 | | | 158 | | | 6,643 | |
| Total Held-to-Maturity Fixed Maturities | $ | 9,605 | | | $ | 278 | | | $ | 163 | | | $ | 9,720 | |
| AVAILABLE-FOR-SALE | | | | | | | |
| Fixed maturities | | | | | | | |
| Bonds | | | | | | | |
| United States government | | | | | | | |
| Collateralized mortgage obligations | $ | 17,452 | | ; | $ | 1,500 | | | — | | | $ | 18,952 | |
| Mortgage-backed securities | 2 | | | — | | | — | | &n bsp; | 2 | |
| U.S.Treasury | 35,278 | ; | | 564 | | | 192 | | | 35,650 | |
| Agency | 71,667 | | | 6 | | | 1,048 | | | 70,625 | |
| States, municipalities and political subdivisions | | | | | | | |
| General obligations | 371,098 | | | 19,408 | | | 128 | | | 390,378 | |
| Special revenue | 219,991 | | | 8,605 | | | 1,234 | | | 227,362 | |
| Foreign bonds | | | | | | | |
| Canadian | 55,979 | | | 2,847 | | | — | | | 58,826 | |
| Other | 79,115 | | | 3,571 | | | 272 | | | 82,414 | |
| Publi c utilities | | | | | | | |
| Electric | 212,699 | | | 11,603 | | | 298 | | | 224,004 | |
| Natural gas | 54,936 | | | 2,870 | | | — | | | 57,806 | |
| Other | 3,597 | | | 181 | | | — | | | 3,778 | |
| Corporate bonds | | | | | | | |
| Banks, trusts and insurance companies | 287,409 | | | 10,061 | | | 8,261 | | | 289,209 | |
| Transportation | 30,427 | | | 1,775 | | | 15 | | | 32,187 | |
| Energy | 145,933 | | | 6,653 | | | 247 | | | 152,339 | |
| Technology | 84,123 | | | 5,180 | | | 131 | | | 89,172 | |
| Basic industry | 105,631 | | | 4,266 | | | 330 | | | 109,567 | |
| Credit cyclicals | 69,686 | | | 2,912 | | | 13 | | | 72,585 | |
| Other | 230,710 | | | 13,874 | | | 1,049 | | | 243,535 | |
| Total Available-For-Sale Fixed Maturities | $ | 2,075,733 | | | $ | 95,876 | | | $ | 13,218 | | | $ | 2,158,391 | |
| Equity securities | | | &n bsp; | | | | |
| Common stocks | | | | | | | |
| Public utilities | | | | | | | |
| Electric | $ | 6,646 | | | $ | 3,649 | | | $ | 262 | | | $ | 10,033 | |
| Natural gas | 838 | | | 846 | | | — | | | 1,684 | |
| Banks, trusts and insurance companies | | | | | | | |
| Banks | 6,517 | | | 29,503 | | | 131 | | | 35,889 | |
| Insurance | 3,129 | | | 8,634 | | | 111 | | | 11,652 | |
| Other | 1,505 | | | 437 | | | — | | | 1,942 | |
| All other common stocks | | | | | | | |
| Transportation | 38 | | | 1,555 | | | — | | | 1,593 | |
| Energy | 4,903 | | | 4,650 | | | 24 | | | 9,529 | |
| Technology | 8,100 | | | 5,995 | | | 185 | | | 13,910 | |
| Basic industry | 7,156 | | | 6,403 | | | 110 | | | 13,449 | |
| Credit cyclicals | 1,402 | | | 1,774 | | | — | | | 3,176 | |
| Other | 11,611 | | | 17,241 | | | 20 | | | 28,832 | |
| Nonredeemable preferred stocks | 1,461 | | | — | | | 432 | | | 1,029 | |
| Total Available-for-Sale Equity Securities | $ | 53,306 | | | $ | 80,687 | | | $ | 1,275 | | | $ | 132,718 | |
| Total Available-for-Sale Securities | $ | 2,129,039 | | | $ | 176,563 | | | $ | 14,493 | | | $ | 2,291,109 | |
|
| | | | | | | | | | | | | | | |
| Technology | 29,766 |
| | 1,566 |
| | 268 |
| | 31,064 |
|
| Collateralized mortgage obligations | | | | | | | |
| Government | 79,269 |
| | 3,490 |
| | 68 |
| | 82,691 |
|
| Other | 276 |
| | — |
| | 116 |
| | 160 |
|
| Mortgage-backed securities | 34,353 |
| | 1,041 |
| | 4 |
| | 35,390 |
|
| Asset-backed securities | 5,801 |
| | 495 |
| | — |
| | 6,296 |
|
| Redeemable preferred stock | 405 |
| | 4 |
| | — |
| | 409 |
|
| Total Available-For-Sale Fixed Maturities | $ | 2,562,786 |
| | $ | 140,030 |
| | $ | 5,568 |
| | $ | 2,697,248 |
|
| Equity securities | | | | | | | |
| Common stocks | | | | | | | |
| Public utilities | | | | | | | |
| Electric | $ | 6,227 |
| | $ | 6,290 |
| | $ | 98 |
| | $ | 12,419 |
|
| Gas distribution | 928 |
| | 1,295 |
| | — |
| | 2,223 |
|
| Other | 76 |
| | 17 |
| | — |
| | 93 |
|
| Corporate | | | | | | | |
| Oil and gas | 5,094 |
| | 7,116 |
| | — |
| | 12,210 |
|
| Chemicals | 2,734 |
| | 2,305 |
| | — |
| | 5,039 |
|
| Industrial goods and services | 9,944 |
| | 13,848 |
| | 275 |
| | 23,517 |
|
| Autos and parts | 277 |
| | 310 |
| | 7 |
| | 580 |
|
| Food and beverage | 2,124 |
| | 3,982 |
| | — |
| | 6,106 |
|
| Personal and household goods | 5,513 |
| | 3,158 |
| | — |
| | 8,671 |
|
| Health care | 8,212 |
| | 8,008 |
| | 232 |
| | 15,988 |
|
| Retail | 2,836 |
| | 532 |
| | 161 |
| | 3,207 |
|
| Media | 147 |
| | — |
| | 13 |
| | 134 |
|
| Telecommunications | 2,399 |
| | 3,778 |
| | 17 |
| | 6,160 |
|
| Banks | 11,690 |
| | 30,196 |
| | 372 |
| | 41,514 |
|
| Insurance | 3,209 |
| | 9,902 |
| | 77 |
| | 13,034 |
|
| Real estate | 393 |
| | 793 |
| | 72 |
| | 1,114 |
|
| Financial services | 300 |
| | 150 |
| | 22 |
| | 428 |
|
| Technology | 2,822 |
| | 1,018 |
| | 116 |
| | 3,724 |
|
| Nonredeemable preferred stocks | 3,634 |
| | 40 |
| | 384 |
| | 3,290 |
|
| Total Available-for-Sale Equity Securities | $ | 68,559 |
| | $ | 92,738 |
| | $ | 1,846 |
| | $ | 159,451 |
|
| Total Available-for-Sale Securities | $ | 2,631,345 |
| | $ | 232,768 |
| | $ | 7,414 |
| | $ | 2,856,699 |
|
United Fire Group, Inc. Form 10-K | 2011
|
| | | | | | | | | | | | | | | |
| December 31, 2010 | (In Thousands) |
| Type of Investment | Cost or Amortized Cost | | Gross Unrealized Appreciation | | Gross Unrealized Depreciation | | Fair Value |
| HELD-TO-MATURITY | | | | | | | |
| Fixed maturities | | | | | | | |
| Bonds | | | | | | | |
| U.S. government and government-sponsored enterprises | | | | | | | |
| General obligations | $ | 731 |
| | $ | 10 |
| | $ | — |
| | $ | 741 |
|
| Special revenue | | | | | | | |
| North central - East | 364 |
| | 27 |
| | — |
| | 391 |
|
| North central - West | 488 |
| | 23 |
| | — |
| | 511 |
|
| Northeast | 230 |
| | 12 |
| | — |
| | 242 |
|
| South | 1,067 |
| | 4 |
| | 108 |
| | 963 |
|
| West | 2,957 |
| | 36 |
| | — |
| | 2,993 |
|
| Collateralized mortgage obligations | 83 |
| | 4 |
| | — |
| | 87 |
|
| Mortgage-backed securities | 444 |
| | 50 |
| | — |
| | 494 |
|
| Total Held-to-Maturity Fixed Maturities | $ | 6,364 |
| | $ | 166 |
| | $ | 108 |
| | $ | 6,422 |
|
| AVAILABLE-FOR-SALE | | | | | | | |
| Fixed maturities | | | | | | | |
| Bonds | | | | | | | |
| U.S. government and government-sponsored enterprises | | | | | | | |
| U.S. Treasury | $ | 38,133 |
| | $ | 943 |
| | $ | — |
| | $ | 39,076 |
|
| Agency | 104,049 |
| | 96 |
| | 1,014 |
| | 103,131 |
|
| States, municipalities and political subdivisions | | | | | | | |
| General obligations | | | | | | | |
| Midwest | | | | | | | |
| North central - East | 121,273 |
| | 6,634 |
| | 137 |
| | 127,770 |
|
| North central - West | 76,699 |
| | 4,491 |
| | 58 |
| | 81,132 |
|
| Northeast | 27,861 |
| | 1,664 |
| | — |
| | 29,525 |
|
| South | 92,795 |
| | 6,555 |
| | 53 |
| | 99,297 |
|
| West | 53,160 |
| | 2,983 |
| | 90 |
| | 56,053 |
|
| Special revenue | | | | | | | |
| Midwest | | | | | | | |
| North central - East | 59,063 |
| | 2,205 |
| | 175 |
| | 61,093 |
|
| North central - West | 38,827 |
| | 1,744 |
| | 266 |
| | 40,305 |
|
| Northeast | 4,505 |
| | 247 |
| | 9 |
| | 4,743 |
|
| South | 71,486 |
| | 3,405 |
| | 144 |
| | 74,747 |
|
| West | 42,363 |
| | 2,182 |
| | — |
| | 44,545 |
|
| Foreign bonds | | | | | | | |
| Canadian | 69,209 |
| | 3,908 |
| | 194 |
| | 72,923 |
|
| Other foreign | 85,434 |
| | 4,588 |
| | 268 |
| | 89,754 |
|
| Public utilities | | | | | | | |
| Electric | 213,636 |
| | 12,207 |
| | 519 |
| | 225,324 |
|
| Gas distribution | 21,131 |
| | 1,124 |
| | 70 |
| | 22,185 |
|
| Other | 21,029 |
| | 551 |
| | — |
| | 21,580 |
|
| Corporate bonds | | | | | | | |
| Oil and gas | 177,973 |
| | 7,890 |
| | 427 |
| | 185,436 |
|
| Chemicals | 52,561 |
| | 2,445 |
| | 35 |
| | 54,971 |
|
| Basic resources | 6,971 |
| | 456 |
| | — |
| | 7,427 |
|
| Construction and materials | 19,385 |
| | 873 |
| | — |
| | 20,258 |
|
| Industrial goods and services | 148,212 |
| | 7,208 |
| | 362 |
| | 155,058 |
|
| Autos and parts | 17,500 |
| | 1,003 |
| | 119 |
| | 18,384 |
|
| Food and beverage | 70,613 |
| | 3,531 |
| | 111 |
| | 74,033 |
|
| Personal and household goods | 66,597 |
| | 3,079 |
| | 289 |
| | 69,387 |
|
| Health care | 78,595 |
| | 4,933 |
| | 186 |
| | 83,342 |
|
| Retail | 42,150 |
| | 2,139 |
| | 329 |
| | 43,960 |
|
| Media | 31,702 |
| | 1,552 |
| | — |
| | 33,254 |
|
| Travel and leisure | 5,882 |
| | 61 |
| | 77 |
| | 5,866 |
|
| Telecommunications | 34,706 |
| | 2,329 |
| | 51 |
| | 36,984 |
|
| Banks | 117,506 |
| | 5,817 |
| | 1,689 |
| | 121,634 |
|
| Insurance | 25,682 |
| | 799 |
| | 14 |
| | 26,467 |
|
| Real estate | 20,903 |
| | 1,101 |
| | 267 |
| | 21,737 |
|
| Financial services | 80,803 |
| | 3,635 |
| | 983 |
| | 83,455 |
|
| Technology | 15,952 |
| | 1,070 |
| | 334 |
| | 16,688 |
|
| Collateralized mortgage obligations | 17,564 |
| | 2,013 |
| | — |
| | 19,577 |
|
| Mortgage-backed securities | 2 |
| | — |
| | — |
| | 2 |
|
| Asset-backed securities | 6,754 |
| | 572 |
| | — |
| | 7,326 |
|
| Total Available-For-Sale Fixed Maturities | $ | 2,178,666 |
| | $ | 108,033 |
| | $ | 8,270 |
| | $ | 2,278,429 |
|
| Equity securities | | | | | | | |
| Common stocks | | | | | | | |
| Public utilities | | | | | | | |
United Fire Group, Inc. Form 10-K | 2011
|
| | | | | | | | | | | | | | | |
| Electric | $ | 6,229 |
| | $ | 4,164 |
| | $ | 3 |
| | $ | 10,390 |
|
| Gas distribution | 90 |
| | 586 |
| | — |
| | 676 |
|
| Corporate | | | | | | | |
| Oil and gas | 5,740 |
| | 7,394 |
| | — |
| | 13,134 |
|
| Chemicals | 2,734 |
| | 3,345 |
| | — |
| | 6,079 |
|
| Industrial goods and services | 8,112 |
| | 15,185 |
| | — |
| | 23,297 |
|
| Autos and parts | 257 |
| | 537 |
| | — |
| | 794 |
|
| Food and beverage | 682 |
| | 3,792 |
| | — |
| | 4,474 |
|
| Personal and household goods | 5,233 |
| | 3,370 |
| | — |
| | 8,603 |
|
| Health care | 6,367 |
| | 6,367 |
| | 186 |
| | 12,548 |
|
| Retail | 380 |
| | 348 |
| | — |
| | 728 |
|
| Travel and leisure | 1 |
| | — |
| | — |
| | 1 |
|
| Telecommunications | 2,376 |
| | 3,438 |
| | — |
| | 5,814 |
|
| Banks | 9,498 |
| | 34,363 |
| | 101 |
| | 43,760 |
|
| Insurance | 3,129 |
| | 11,320 |
| | 41 |
| | 14,408 |
|
| Real estate | 393 |
| | 667 |
| | 40 |
| | 1,020 |
|
| Financial services | 300 |
| | 274 |
| | 15 |
| | 559 |
|
| Technology | 1,157 |
| | 874 |
| | — |
| | 2,031 |
|
| Nonredeemable preferred stocks | 1,461 |
| | 3 |
| | 74 |
| | 1,390 |
|
| Total Available-for-Sale Equity Securities | $ | 54,139 |
| | $ | 96,027 |
| | $ | 460 |
| | $ | 149,706 |
|
| Total Available-for-Sale Securities | $ | 2,232,805 |
| | $ | 204,060 |
| | $ | 8,730 |
| | $ | 2,428,135 |
|
Maturities
The amortized cost and fair value of held-to-maturity, available-for-sale and trading securities at December 31, 20102011, by contractual maturity, are shown in the following table. Actual maturities may differ from contractual maturities because borrowers may have the right to call or prepay obligations with or without call or prepayment penalties. Mortgage-backed securities and collateralized mortgage obligations may be subj ectsubject to prepayment risk and are therefore not categorized by contractual maturity.
|
| | | | | | | | | | | | | | | | | | | | | | | |
| (In Thousands) | Held-To-Maturity | | Available-For-Sale | | Trading |
| | Amortized | | Fair | | Amortized | | Fair | | Amortized | | Fair |
| December 31, 2011 | Cost | | Value | | Cost | | Value | | Cost | | Value |
| Due in one year or less | $ | 395 |
| | $ | 397 |
| | $ | 271,254 |
| | $ | 275,360 |
| | $ | 2,544 |
| | $ | 2,860 |
|
| Due after one year through five years | 3,344 |
| | 3,333 |
| | 1,084,794 |
| | 1,140,002 |
| | 4,880 |
| | 4,749 |
|
| Due after five years through 10 years | — |
| | — |
| | 964,452 |
| | 1,030,590 |
| | 497 |
| | 439 |
|
| Due after 10 years | — |
| | — |
| | 122,587 |
| | 126,759 |
| | 5,508 |
| | 5,406 |
|
| Asset-backed securities | — |
| | — |
| | 5,801 |
| | 6,296 |
| | — |
| | — |
|
| Mortgage-backed securities | 356 |
| | 381 |
| | 34,353 |
| | 35,390 |
| | — |
| | — |
|
| Collateralized mortgage obligations | 48 |
| | 50 |
| | 79,545 |
| | 82,851 |
| | — |
| | — |
|
| | $ | 4,143 |
| | $ | 4,161 |
| | $ | 2,562,786 |
| | $ | 2,697,248 |
| | $ | 13,429 |
| | $ | 13,454 |
|
United Fire & Casualty CompanyGroup, Inc. Form 10-K | 20102011
| | | | | | | | | | | | | | | | | | | | | | | | |
| (In Thousands) | | Held-To-Maturity | | Available-For-Sale | | Trading |
| | | Amortized | | Fair | | Amortized | | Fair | | Amortized | | Fair |
| December 31, 2010 | | Cost | | Value | | Cost | | Value | | Cost | | Value |
| Due in one year or less | | $ | 680 | | | $ | 693 | | | $ | 232,427 | | | $ | 237,641 | | | $ | 2,836 | | | $ | 2,867 | |
| Due after one year through five years | | 5,15 4 | | | 5,145 | | | 1,120,270 | | | 1,179,962 | | | 1,900 | | | 1,890 | |
| Due after five years through 10 years | | 3 | | | 3 | | | 750,767 | | | 782,235 | | | — | | | — | |
| Due after 10 years | | — | | | — | | | 57,636 | | | 59,012 | | | 7,586 | | | 8,129 | |
| Mortgage-backed securities | | 444 | | | 494 | | | 2 | | | 2 | | | — | | | — | |
| Collateralized mortgage obligations | | 83 | | | 87 | | | 17,564 | | | 19,577 | | | — | | | — | |
| | | $ | 6,364 | | | $ | 6,422 | | | $ | 2,178,666 | | | $ | 2,278,429 | | | $ | 12,322 | | | $ | 12,886 | |
Realized Investment Gains and Losses
A summary of realized investment gains (losses) for 20102011, 20092010 and 20082009, is as follows:
| | | (In Thousands) | | | | | | | | | | | |
| Years Ended December 31 | | 2010 | | 2009 | | 2008 | 2011 | | 2010 | | 2009 |
| Realized investment gains (losses) | | | | | | | | | | | |
| Fixed maturities | | $ | 4,079 | | | $ | (4,117 | ) | | $ | (11,728 | ) | $ | 4,389 |
| | $ | 4,079 |
| | $ | (4,117 | ) |
| Equity securities | | 5,030 | | | (11,362 | ) | | 1,427 | | 2,984 |
| | 5,030 |
| | (11,362 | ) |
| Trading securities | | (127 | ) | | 1,965 | | | (82 | ) |
|
| |
|
| |
|
|
| Change in fair value | | (539 | ) | | (325 | ) | | 1,547 |
|
| Sales | | (326 | ) | | 198 |
| | 418 |
|
| Mortgage loans | | (362 | ) | | — | | | — | | — |
| | (362 | ) | | — |
|
| Other long-term investments | | (131 | ) | | 332 | | | — | | (68 | ) | | (131 | ) | | 332 |
|
| Short-term investments | | — | | | 3 | | | — | | — |
| | — |
| | 3 |
|
| Total realized investment gains (losses) | | $ | 8,489 | | | $ | (13,179 | ) | &nb sp; | $ | (10,383 | ) | $ | 6,440 |
| | $ | 8,489 |
| | $ | (13,179 | ) |
Th eThe proceeds and gross realized gains (losses) on the sale of available-for-sale securities for 20102011, 20092010 and 20082009, were as follows:
| | | (In Thousands) | | | | | | | | | | | |
| Years Ended December 31 | | 2010 | | 2009 | | 2008 | 2011 | | 2010 | | 2009 |
| Proceeds from sales | | $ | 3,402 | | | $ | 13,432 | | | $ | 6,724 | | $ | 39,496 |
| | $ | 3,402 |
| | $ | 13,432 |
|
| Gross realized gains | | 1,915 | | | 2,009 | | | 151 | | 1,144 |
| | 1,915 |
| | 2,009 |
|
| Gross realized losses | | — | | | (890 | ) | | (74 | ) | (1,562 | ) | | — |
| | (890 | ) |
There were no sales of held-to-maturity securities in 20102011, 20092010 and 20082009.
Our investment portfolio includes trading securities with embedded derivatives. These securities, which are primarily convertible redeemable preferred debt securities, are recorded at fair value. Income or loss, including the change in the fair value of these trading securities, is recognized currently in earnings as a component of realized investment gains (losses). Our portfolio of trading securities had a fair value of $12,886,00013,454,000 and $12,613,00012,886,000 at December 31, 20102011 and 20092010, respectively.
The realized gains (losses) attributable to the change in fair value of trading securities still held at December 31, 2010, 2009 and 2008 were $(325,000), $1,547,000 and $(1,528,000), respectively.
United Fire & Casualty CompanyGroup, Inc. Form 10-K | 20102011
Net Investment Income
Net investment income for the years ended December 31, 20102011, 20092010 and 20082009, is comprised of the following:
| | | (In Thousands) | | | | | | | | | | | |
| Years Ended December 31 | | 2010 | | 2009 | | 2008 | 2011 | | 2010 | | 2009 |
| Investment income | | | | | | | | | | | |
| Interest on fixed maturities | | $ | 108,754 | | | $ | 106,023 | | | $ | 100,755 | | $ | 109,467 |
| | $ | 108,754 |
| | $ | 106,023 |
|
| Dividends on equity securities | | 3,675 | | | 3,950 | | | 5,749 | | 4,628 |
| | 3,675 |
| | 3,950 |
|
Income (loss) on other long-term investments (1) | | 411 | | | (1,133 | ) | | (4,442 | ) | |
| Income (loss) on other long-term investments | | | | | | |
| Interest | | 224 |
| | 24 |
| | (6 | ) |
Change in value (1) | | (137 | ) | | 387 |
| | (1,127 | ) |
| Interest on mortgage loans | | 479 | | | 587 | | | 851 | | 285 |
| | 479 |
| | 587 |
|
| Interest on short-term investments | | 6 | | | 558 | | | 3,127 | | 4 |
| | 6 |
| | 558 |
|
| Interest on cash and cash equivalents | | 1,064 | | | 1,094 | | | 4,710 | | 913 |
| | 1,064 |
| | 1,094 |
|
| Other | | 2,686 | | | 1,253 | | | 1,588 | | 2,542 |
| | 2,686 |
| | 1,253 |
|
| Total investment income | | $ | 117,075 | | | $ | 112,332 | | | $ | 112,338 | | $ | 117,926 |
| | $ | 117,075 |
| | $ | 112,332 |
|
| Less investment expenses | | 5,390 | | | 6,257 | | | 4,761 | | 8,432 |
| | 5,390 |
| | 6,257 |
|
| Investment income , net | | $ | 111,685 | | | $ | 106,075 | | | $ | 107,577 | | |
| Investment income, net | | $ | 109,494 |
| | $ | 111,685 |
| | $ | 106,075 |
|
| |
| (1) | Includes an adjustment forRepresents the changeschange in value of our holdings in limited liability partnership funds, which are accounted for under the equity method of accounting. |
Off-Balance Sheet Arrangements
Pursuant to an agreement with one of our limited liability partnership holdings,funds, we are contractually committed to make capital contributions up to $15,000,000, upon request by the partnership, through December 31, 2017. Our remaining potential contractual obligation was $11,406,0009,156,000 at December 31, 20102011.
Unrealized Appreciation and Depreciation
A summary of changes in net unrealized investment appreciation is as follows:
| | | (In Thousands) | | | | | | | | | | | |
| Years Ended December 31 | | 2010 | | 2009 | | 2008 | 2011 | | 2010 | | 2009 |
| Changes in net unrealized investment appreciation | | | | | | | | | | | |
| Available-for-sale fixed maturities and equity securities | | $ | 33,260 | | | $ | 151,228 | | | $ | (128,646 | ) | |
| Deferred policy acquistion costs | | (2,172 | ) | | (63,425 | ) | | 36,284 | | |
| Available-for-sale fixed maturities | | $ | 34,699 |
| | $ | 17,105 |
| | $ | 126,555 |
|
| Equity securities | | (4,675 | ) | | 16,155 |
| | 24,673 |
|
| Deferred policy acquisition costs | | 3,402 |
| | (2,172 | ) | | (63,425 | ) |
| Income tax effect | | (10,930 | ) | | (30,855 | ) | | 32,326 | | (11,699 | ) | | (10,930 | ) | | (30,855 | ) |
| Total change in net unrealized appreciation, net of tax | | $ | 20,158 | | | $ | 56,948 | | | $ | (60,036 | ) | $ | 21,727 |
| | $ | 20,158 |
| | $ | 56,948 |
|
We continually monitor the difference between our cost basis and the estimated fair value of our investments. Our accounting policy for impairment recognition requires OTTI charges to be recorded when we determine that it is more likely than not that we will be unable to collect all amounts due according to the contractual terms of the fixed maturity security or that the anticipated recovery in fair value of the equity security will not occur in a reasonable amount of time. Impairment charges on investments are recorded based on the fair value of the investments at the measurement date. Factors considered in evaluating whether a decline in value is other-than-temporary include: the length of time and the extent to which fair value has been less than cost; the financial condition and near-term prospects of the issuer; our intention to hold the investment; and the likelihood that we will be required to sell the investment.
United Fire Group, Inc. Form 10-K | 2011
The tables on the following pages summarize our fixed maturity and equity securities that were in an unrealized loss position at December 31, 20102011 and 20092010. The securities are presented by the length of time they have been continuously in an unrealized loss position. It is possible that we could recognize OTTI charges in future periods on securities held at December 31, 20102011, if future events or information cause us to determine that a decline in fair
United Fire & Casualty Company Form 10-K | 2010
value is other-than-temporary.
We believe the unrealized depreciation in value of our fixed maturity portfolio is primarily attributable to changes in market interest rates and not the credit quality of the issuer. We have no intent to sell and it is more likely than not that we will not be required to sell the securities until such time that the fair value recovers or the securities mature.
We have evaluated the unrealized losses reported for all of our equity securities at December 31, 20102011, and have concluded that the duration and severity of these losses do not warrant the recognition of an OTTI charge at December 31, 20102011. Our largest unrealized loss greater than 12 months on an individual equity security at December 31, 20102011, was $124,000.$122,000. We have no intention to sell any of these securities prior to a recovery in value, but will continue to monitor the fair va luevalue reported for these securities as part of our overall process to evaluate investments for OTTI recognition.
United Fire & Casualty Company Form 10-K | 2010
| | | | | | | | | | | | | | | | | | | | | | | | | | | | | |
| (In Thousands) | | | | | | | | | | | | | | | |
| December 31, 2010 | Less than 12 months | | 12 months or longer | | Total |
| | | | | | Gross | | | | | | Gross | | | | Gross |
| | Number | | Fair | | Unrealized | | Number | | Fair | | Unrealized | | Fair | | Unrealized |
| Type of Investment | of Issues | | Value | | Depreciation | | of Issues | | Values | | Depreciation | | Values | | Depreciation |
| HELD-TO-MATURITY | | | | | | | | | | | | | | | |
| Fixed maturities | | | | | | | | | | | | | | | |
| Bonds | | | | | | | | | | | | | | | |
| States, municipalities and political subdivisions | | | | | | | | | | | | | | | |
| Special revenue | — | | | $ | — | | | $ | — | | | 2 | | | $ | 590 | | | $ | 108 | | | $ | 590 | | | $ | 108 | |
| Total Held-to-Maturity Fixed Maturities | — | | | $ | — | | | $ | — | | | 2 | | | $ | 590 | | | $ | 108 | | | $ | 590 | | | $ | 108 | |
| AVAILABLE-FOR-SALE | | | | | | | | | | | | | | | |
| Fixed maturities | | | | | | | | | | | | | | | |
| Bonds | | | | | | | | | | | | | | | |
| United States government | | | | | | | | | | | | | | | |
| Agency | 12 | | | $ | 41,374 | | | $ | 626 | | | 7 | | | $ | 30,661 | | | $ | 388 | | | $ | 72,035 | | | $ | 1,014 | |
| States, municipalities and political subdivisions | | | | | | | | | | | | | | | |
| General obligations | 9 | | | 6,876 | | | 306 | | | 1 | | | 497 | | | 32 | | | 7,373 | | | 338 | |
| Special revenue | 12 | | | 15,331 | | | 342 | | | 5 | | | 5,880 | | | 252 | | | 21,211 | | | 594 | |
| Foreign bonds | | | | | | | | | | | | | | | |
| Canadian | 1 | | | 5,687 | | | 194 | | | — | | | — | | | — | | | 5,687 | | | 194 | |
| Other | 2 | | | 6,634 | | | 235 | | | 2 | | | 2,873 | | | 33 | | | 9,507 | | | 268 | |
| Public utilities | | | | | | | | | | | | | | | |
| Electric | 3 | | | 4,490 | | | 100 | | | 3 | | | 10,003 | | | 419 | | | 14,493 | | | 519 | |
| Natural gas | — | | | — | | | — | | | 3 | | | 5,840 | | | 359 | | | 5,840 | | | 359 | |
| Corporate bonds | | | | | | | | | | | | | | | |
| Banks, trusts and insurance companies | 5 | | | 16,749 | | | 268 | | | 31 | | | 36,565 | | | 2,446 | | | 53,314 | | | 2,714 | |
| Transportation | 3 | | | 5,249 | | | 57 | | | — | | | — | | | — | | | 5,249 | | | 57 | |
| Energy | — | | | — | | | — | | | 1 | | | 3,340 | | | 110 | | | 3,340 | | | 110 | |
| Technology | 3 | | | 5,924 | | | 58 | | | 3 | | | 9,151 | | | 338 | | | 15,075 | | | 396 | |
| Basic industry | 2 | | | 3,218 | | | 34 | | | 3 | | | 10,236 | | | 203 | | | 13,454 | | | 237 | |
| Credit cyclicals | — | | | — | | | — | | | 3 | | | 6,571 | | | 100 | | | 6,571 | | | 100 | |
| Other | 16 | | | 46,890 | | | 1,098 | | | 6 | | | 10,243 | | | 272 | | | 57,133 | | | 1,370 | |
| Total Available-For-Sale Fixed Maturities | 68 | | | $ | 158,422 | | | $ | 3,318 | | | 68 | | | $ | 131,860 | | | $ | 4,952 | | | $ | 290,282 | | | $ | 8,270 | |
| Equity securities | | | | | | | | | | | | | | | |
| Common stocks | | | | | | | | | | | | | | | |
| Public utilities | | | | | | | | | | | | | | | |
| Electric | — | | | $ | — | | | $ | — | | | 4 | | | $ | — | | | $ | 1 | | | $ | — | | | $ | 1 | |
| Banks, trusts and insurance companies | | | | | | | | | | | | | | | |
| Banks | 2 | | | 594 | | | 32 | | | 1 | | | 488 | | | 68 | | | 1,082 | | | 100 | |
| Insurance | 1 | | | 260 | | | 28 | | | 1 | | | 43 | | | 13 | | | 303 | | | 41 | |
| All other common stock | | | | | | | | | | | | | | | |
| Energy | 3 | | | 306 | | | 2 | | | — | | | — | | | — | | | 306 | | | 2 | |
| Technology | 2 | | | 287 | | | 15 | | | 1 | | | 371 | | | 124 | | | 658 | | | 139 | |
| Other | 3 | | | 1,516 | | | 73 | | | 2 | | | 158 | | | 30 | ; | | 1,674 | | | 103 | |
| Nonredeemable preferred stocks | — | | | — | | | — | | | 2 | | | 1,158 | | | 74 | | | 1,158 | | & nbsp; | 74 | |
| Total Available-for-Sale Equity Securities | 11 | | | $ | 2,963 | & nbsp; | | $ | 150 | | | 11 | | | $ | 2,218 | | | $ | 310 | | | $ | 5,181 | | | $ | 460 | |
| Total Available-for-Sale Securities | 79 | | | $ | 161,385 | | | $ | 3,468 | | | 79 | | | $ | 134,078 | | | $ | 5,262 | | | $ | 295,463 | | | $ | 8,730 | |
| Total | 79 | | | $ | 161,385 | | | $ | 3,468 | | | 81 | | | $ | 134,668 | | | $ | 5,370 | | | $ | 296,053 | | | $ | 8,838 | |
Un ited Fire & Casualty Company Form 10-K | 2010
| | | | | | | | | | | | | | | | | | | | | | | | | | | | | |
| (In Thousands) | | | | | | | | | | | | | | | |
| December 31, 2009 | Less than 12 months | | 12 months or longer | | Total |
| | | | | | Gross | | | | | | Gross | | | | Gross |
| | Number | | Fair | | Unrealized | | Number | | Fair | | Unrealized | | Fair | | Unrealized |
| Type of Investment | of Issues | | Va lue | | Depreciation | | of Issues | | Values | | Depreciation | | Values | | Depreciation |
| HELD-TO-MATURITY | | | | | | | | | | | | | | | |
| Fixed maturities | | | | | | | | | | | | | | | |
| Bonds | | | | | | | | | | | | | | | |
| States, municipalities and political subdivisions | | | | | | | | | | | | | | | |
| General obligations | 1 | | | $ | 300 | | | $ | 5 | | | — | | | $ | — | | | $ | — | | | $ | 300 | | | $ | 5 | |
| Special revenue | — | | | — | | | — | | | 1 | | | 679 | | | 158 | | | 679 | | | 158 | |
| Total Held-to-Maturity Fixed Maturities | 1 | | | $ | 300 | | | $ | 5 | | | 1 | | | $ | 679 | | | $ | 158 | | | $ | 979 | | | $ | 163 | |
| AVAILABLE-FOR-SALE | | | | | | | | | | | | | | | |
| Fixed maturities | | | | | | | | | | | | | | | |
| Bonds | | | | | | | | | | | | | | | |
| United States government | | | | | | | | | | | | | | | |
| U.S. Treasury | 5 | &nb sp; | | $ | 11,772 | | | $ | 192 | | | — | | | $ | — | | | $ | — | | | $ | 11,772 | | | $ | 192 | |
| Agency | 5 | | | 24,755 | | | 246 | | | 10 | | | 42,198 | | | 802 | | | 66,953 | | | 1,048 | |
| States, municipalities and political subdivisions | | | | | | | | | | | | | | | |
| General obligations | 2 | | | 966 | | | 23 | | | 3 | | | 2,118 | | | 105 | | | 3,084 | | | 128 | |
| Special revenue | 21 | | | 22,892 | | | 463 | | | 10 | | | 9,401 | | | 771 | | | 32,293 | | | 1,234 | |
| Foreign bonds | | | | | | | | | | | | | | | |
| Other | 2 | | | 1,329 | | | 19 | | | 4 | | | 10,492 | | | 253 | | | 11,821 | | | 272 | |
| Public utilities | | | | | | | | | | | | | | | |
| Electric | 1 | | | 4,958 | | | 99 | | | 6 | | | 7,761 | | | 199 | | | 12,719 | | | 298 | |
| Corporate bonds | | | | | | | | | | | | | | | |
| Banks, trusts and insurance companies | 13 | | | 20,789 | | | 813 | | ; | 46 | | | 70,871 | | | 7,448 | | | 91,660 | | | 8,261 | |
| Transportation | — | | | — | | | — | | | 1 | | | 1,997 | | | 15 | | | 1,997 | | | 15 | |
| Energy | 1 | | | 3,189 | | | 37 | | | 5 | | | 9,710 | | | 210 | | | 12,899 | | | 247 | |
| Technology | 4 | | | 8,263 | | | 65 | | | 1 | | | 952 | | | 66 | | | 9,215 | | | 131 | |
| Basic industry | 6 | | | 15,843 | | | 136 | | | 2 | | | 4,806 | | | 194 | | | 20,649 | | | 330 | |
| Credit cyclicals | 3 | | | 5,217 | | | 13 | | | — | | | — | | | — | | | 5,217 | | | 13 | |
| Other | 1 | | | 3,270 | | | 72 | | | 7 | | | 16,892 | | | 977 | | | 20,162 | | | 1,049 | |
| Total Available-For-Sale Fixed Maturities | 64 | | | $ | 123,243 | | | $ | 2,178 | | | 95 | | | $ | 177,198 | | | $ | 11,040 | | | $ | 300,441 | | | $ | 13,218 | |
| Equity securities | | | | | | | | | | | | | | | |
| Common stocks | | | | | | | | | | | | | | | |
| Public utilities | | | | | | | | | | | | | | | |
| Electric | — | | | $ | — | | | $ | — | | | 12 | | | $ | 2,074 | | | $ | 262 | | | $ | 2,074 | | | $ | 262 | |
| Banks, trusts and insurance companies | | | | | | | | &n bsp; | | | | ; | | | |
| Banks | — | | | — | | | — | | | 1 | | | 425 | | | 131 | | | 425 | | | 131 | |
| Insurance | 2 | | | 299 | | | 46 | | | 3 | | | 391 | | | 65 | | | 690 | | | 111 | |
| All other common stock | | | | | | | | | | | | | | | |
| Energy | — | | | — | | | — | | | 2 | | | 188 | | | 24 | | | 188 | | | 24 | |
| Technology | — | | | — | | | — | | | 5 | | | 2,235 | | | 185 | | | 2,235 | | | 185 | |
| Basic industry | — | | | — | | | — | | | 2 | | | 151 | | | 110 | | | 151 | | | 110 | |
| Other | — | | | — | | | — | | | 3 | | | 258 | | | 20 | | | 258 | | | 20 | |
| Nonredeemable preferred stocks | — | | | — | | | — | | | 5 | | | 1,030 | | | 432 | | | 1,030 | | | 432 | |
| Total Available-for-Sale Equity Securities | 2 | | | $ | 299 | | | $ | 46 | | | 33 | | | $ | 6,752 | | | $ | 1,229 | | | $ | 7,051 | | | $ | 1,275 | |
| Total Available-for-Sale Securities | 66 | | | $ | 123,542 | | | $ | 2,224 | | | 128 | &nbs p; | | $ | 183,950 | | | $ | 12,269 | | | $ | 307,492 | | | $ | 14,493 | |
| Total | 67 | | | $ | 123,842 | | | $ | 2,229 | | | 129 | | | $ | 184,629 | | | $ | 12,427 | | | $ | 308,471 | | | $ | 14,656 | |
United Fire & Casualty CompanyGroup, Inc. Form 10-K | 20102011
|
| | | | | | | | | | | | | | | | | | | | | | | | | | | | | |
| (In Thousands) | | | | | | | | | | | | | | | |
| December 31, 2011 | Less than 12 months | | 12 months or longer | | Total |
| | | | | | Gross | | | | | | Gross | | | | Gross |
| | Number | | Fair | | Unrealized | | Number | | Fair | | Unrealized | | Fair | | Unrealized |
| Type of Investment | of Issues | | Value | | Depreciation | | of Issues | | Values | | Depreciation | | Values | | Depreciation |
| HELD-TO-MATURITY | | | | | | | | | | | | | | | |
| Fixed maturities | | | | | | | | | | | | | | | |
| Bonds | | | | | | | | | | | | | | | |
| States, municipalities and political subdivisions | | | | | | | | | | | | | | | |
| Special revenue | — |
| | $ | — |
| | $ | — |
| | 1 |
| | $ | 473 |
| | $ | 61 |
| | $ | 473 |
| | $ | 61 |
|
| Total Held-to-Maturity Fixed Maturities | — |
| | $ | — |
| | $ | — |
| | 1 |
| | $ | 473 |
| | $ | 61 |
| | $ | 473 |
| | $ | 61 |
|
| AVAILABLE-FOR-SALE | | | | | | | | | | | | | | | |
| Fixed maturities | | | | | | | | | | | | | | | |
| Bonds | | | | | | | | | | | | | | | |
| States, municipalities and political subdivisions | | | | | | | | | | | | | | | |
| General obligations | 2 |
| | $ | 1,506 |
| | $ | 1 |
| | — |
| | $ | — |
| | $ | — |
| | $ | 1,506 |
| | $ | 1 |
|
| Special revenue | | | | | | | | | | | | | | | |
| Northeast | — |
| | — |
| | — |
| | 1 |
| | 619 |
| | 2 |
| | 619 |
| | 2 |
|
| South | 4 |
| | 2,049 |
| | 5 |
| | — |
| | — |
| | — |
| | 2,049 |
| | 5 |
|
| Foreign bonds | | | | | | | | | | | | | | | |
| Canadian | 1 |
| | 5,667 |
| | 97 |
| | 2 |
| | 2,930 |
| | 103 |
| | 8,597 |
| | 200 |
|
| Other foreign | 12 |
| | 12,334 |
| | 391 |
| | 4 |
| | 11,193 |
| | 232 |
| | 23,527 |
| | 623 |
|
| Public utilities | | | | | | | | | | | | | | | |
| Electric | 4 |
| | 6,486 |
| | 97 |
| | 1 |
| | 1,068 |
| | 153 |
| | 7,554 |
| | 250 |
|
| Gas distribution | 2 |
| | 3,093 |
| | 63 |
| | — |
| | — |
| | — |
| | 3,093 |
| | 63 |
|
| Corporate bonds | | | | | | | | | | | | | | | |
| Oil and gas | 2 |
| | 5,436 |
| | 53 |
| | 1 |
| | 5,223 |
| | 224 |
| | 10,659 |
| | 277 |
|
| Basic resources | 3 |
| | 10,861 |
| | 328 |
| | 2 |
| | 5,238 |
| | 188 |
| | 16,099 |
| | 516 |
|
| Construction and materials | 3 |
| | 10,560 |
| | 16 |
| | — |
| | — |
| | — |
| | 10,560 |
| | 16 |
|
| Industrial goods and services | 3 |
| | 4,243 |
| | 15 |
| | 1 |
| | 2,897 |
| | 103 |
| | 7,140 |
| | 118 |
|
| Autos and parts | 1 |
| | 2,685 |
| | 315 |
| | — |
| | — |
| | — |
| | 2,685 |
| | 315 |
|
| Food and beverage | 1 |
| | 1,012 |
| | 1 |
| | 5 |
| | 3,932 |
| | 132 |
| | 4,944 |
| | 133 |
|
| Personal and household goods | 1 |
| | 1,047 |
| | 14 |
| | — |
| | — |
| | — |
| | 1,047 |
| | 14 |
|
| Health care | 2 |
| | 5,027 |
| | 45 |
| | — |
| | — |
| | — |
| | 5,027 |
| | 45 |
|
| Media | 2 |
| | 7,081 |
| | 47 |
| | — |
| | — |
| | — |
| | 7,081 |
| | 47 |
|
| Travel and leisure | 2 |
| | 616 |
| | 184 |
| | — |
| | — |
| | — |
| | 616 |
| | 184 |
|
| Telecommunications | 1 |
| | 1,966 |
| | 3 |
| | — |
| | — |
| | — |
| | 1,966 |
| | 3 |
|
| Banks | 18 |
| | 16,946 |
| | 264 |
| | 8 |
| | 17,267 |
| | 941 |
| | 34,213 |
| | 1,205 |
|
| Insurance | 2 |
| | 504 |
| | 9 |
| | — |
| | — |
| | — |
| | 504 |
| | 9 |
|
| Real estate | 2 |
| | 378 |
| | 10 |
| | 1 |
| | 4,396 |
| | 171 |
| | 4,774 |
| | 181 |
|
| Financial services | 1 |
| | 2,245 |
| | 9 |
| | 17 |
| | 7,229 |
| | 896 |
| | 9,474 |
| | 905 |
|
| Technology | 10 |
| | 5,101 |
| | 268 |
| | — |
| | — |
| | — |
| | 5,101 |
| | 268 |
|
| Collateralized mortgage obligations | | | | | | | | | | | | | | | |
| Government | 6 |
| | 4,306 |
| | 25 |
| | 3 |
| | 5,209 |
| | 43 |
| | 9,515 |
| | 68 |
|
| Other | 1 |
| | 160 |
| | 116 |
| | — |
| | — |
| | — |
| | 160 |
| | 116 |
|
| Mortgage-backed securities | 5 |
| | 684 |
| | 4 |
| | — |
| | — |
| | — |
| | 684 |
| | 4 |
|
| Total Available-For-Sale Fixed Maturities | 91 |
| | $ | 111,993 |
| | $ | 2,380 |
| | 46 |
| | $ | 67,201 |
| | $ | 3,188 |
| | $ | 179,194 |
| | $ | 5,568 |
|
| Equity securities | | | | | | | | | | | | |
| |
|
| Common stocks | | | | | | | | | | | | | | | |
| Public utilities | | | | | | | | | | | | | | | |
| Electric | 3 |
| | $ | 210 |
| | $ | 98 |
| | — |
| | $ | — |
| | $ | — |
| | $ | 210 |
| | $ | 98 |
|
| Corporate | | | | | | | | | | | | | | | |
United Fire Group, Inc. Form 10-K | 2011
|
| | | | | | | | | | | | | | | | | | | | | | | | | | | | | |
| Industrial goods and services | 7 |
| | 975 |
| | 155 |
| | 8 |
| | 577 |
| | 120 |
| | 1,552 |
| | 275 |
|
| Autos and parts | 6 |
| | 14 |
| | 7 |
| | — |
| | — |
| | — |
| | 14 |
| | 7 |
|
| Health care | 5 |
| | 768 |
| | 94 |
| | 4 |
| | 455 |
| | 138 |
| | 1,223 |
| | 232 |
|
| Retail | 6 |
| | 611 |
| | 143 |
| | 3 |
| | 431 |
| | 18 |
| | 1,042 |
| | 161 |
|
| Media | — |
| | — |
| | — |
| | 1 |
| | 134 |
| | 13 |
| | 134 |
| | 13 |
|
| Telecommunications | 4 |
| | 60 |
| | 8 |
| | 1 |
| | 10 |
| | 9 |
| | 70 |
| | 17 |
|
| Banks | 11 |
| | 875 |
| | 250 |
| | 1 |
| | 434 |
| | 122 |
| | 1,309 |
| | 372 |
|
| Insurance | 4 |
| | 742 |
| | 47 |
| | 2 |
| | 107 |
| | 30 |
| | 849 |
| | 77 |
|
| Real estate | — |
| | — |
| | — |
| | 3 |
| | 205 |
| | 72 |
| | 205 |
| | 72 |
|
| Financial services | 1 |
| | 259 |
| | 22 |
| | — |
| | — |
| | — |
| | 259 |
| | 22 |
|
| Technology | 3 |
| | 511 |
| | 116 |
| | — |
| | — |
| | — |
| | 511 |
| | 116 |
|
| Nonredeemable preferred stocks | 3 |
| | 1,171 |
| | 31 |
| | 2 |
| | 878 |
| | 353 |
| | 2049 |
| | 384 |
|
| Total Available-for-Sale Equity Securities | 53 |
| | $ | 6,196 |
| | $ | 971 |
| | 25 |
| | $ | 3,231 |
| | $ | 875 |
| | $ | 9,427 |
| | $ | 1,846 |
|
| Total Available-for-Sale Securities | 144 |
| | $ | 118,189 |
| | $ | 3,351 |
| | 71 |
| | $ | 70,432 |
| | $ | 4,063 |
| | $ | 188,621 |
| | $ | 7,414 |
|
| Total | 144 |
| | $ | 118,189 |
| | $ | 3,351 |
| | 72 |
| | $ | 70,905 |
| | $ | 4,124 |
| | $ | 189,094 |
| | $ | 7,475 |
|
United Fire Group, Inc. Form 10-K | 2011
|
| | | | | | | | | | | | | | | | | | | | | | | | | | | | | |
| (In Thousands) | | | | | | | | | | | | | | | |
| December 31, 2010 | Less than 12 months | | 12 months or longer | | Total |
| | | | | | Gross | | | | | | Gross | | | | Gross |
| | Number | | Fair | | Unrealized | | Number | | Fair | | Unrealized | | Fair | | Unrealized |
| Type of Investment | of Issues | | Value | | Depreciation | | of Issues | | Values | | Depreciation | | Values | | Depreciation |
| HELD-TO-MATURITY | | | | | | | | | | | | | | | |
| Fixed maturities | | | | | | | | | | | | | | | |
| Bonds | | | | | | | | | | | | | | | |
| States, municipalities and political subdivisions | | | | | | | | | | | | | | | |
| Special revenue | — |
| | $ | — |
| | $ | — |
| | 2 |
| | $ | 590 |
| | $ | 108 |
| | $ | 590 |
| | $ | 108 |
|
| Total Held-to-Maturity Fixed Maturities | — |
| | $ | — |
| | $ | — |
| | 2 |
| | $ | 590 |
| | $ | 108 |
| | $ | 590 |
| | $ | 108 |
|
| AVAILABLE-FOR-SALE | | | | | | | | | | | | | | | |
| Fixed maturities | | | | | | | | | | | | | | | |
| Bonds | | | | | | | | | | | | | | | |
| U.S. government and government-sponsored enterprises | | | | | | | | | | | | | | | |
| Agency | 12 |
| | $ | 41,374 |
| | $ | 626 |
| | 7 |
| | $ | 30,661 |
| | $ | 388 |
| | $ | 72,035 |
| | $ | 1,014 |
|
| States, municipalities and political subdivisions | | | | | | | | | | | | | | | |
| General obligations | | | | | | | | | | | | | | | |
| Midwest | | | | | | | | | | | | | | | |
| North central - East | 3 |
| | 2,346 |
| | 105 |
| | 1 |
| | 497 |
| | 32 |
| | 2,843 |
| | 137 |
|
| North central - West | 1 |
| | 860 |
| | 58 |
| | — |
| | — |
| | — |
| �� | 860 |
| | 58 |
|
| South | 2 |
| | 947 |
| | 53 |
| | — |
| | — |
| | — |
| | 947 |
| | 53 |
|
| West | 3 |
| | 2,723 |
| | 90 |
| | — |
| | — |
| | — |
| | 2,723 |
| | 90 |
|
| Special revenue | | | | | | | | | | | | | | | |
| Midwest | | | | | | | | | | | | | | | |
| North central - East | 7 |
| | 8,275 |
| | 96 |
| | 2 |
| | 2,553 |
| | 79 |
| | 10,828 |
| | 175 |
|
| North central - West | 2 |
| | 3,092 |
| | 102 |
| | 2 |
| | 2,555 |
| | 164 |
| | 5,647 |
| | 266 |
|
| Northeast | — |
| | — |
| | — |
| | 1 |
| | 771 |
| | 9 |
| | 771 |
| | 9 |
|
| South | 3 |
| | 3,964 |
| | 144 |
| | — |
| | — |
| | — |
| | 3,964 |
| | 144 |
|
| Foreign bonds | | | | | | | | | | | | | | | |
| Canadian | 1 |
| | 5,687 |
| | 194 |
| | — |
| | — |
| | — |
| | 5,687 |
| | 194 |
|
| Other foreign | 2 |
| | 6,634 |
| | 235 |
| | 2 |
| | 2,873 |
| | 33 |
| | 9,507 |
| | 268 |
|
| Public utilities | | | | | | | | | | | | | | | |
| Electric | 3 |
| | 4,490 |
| | 100 |
| | 3 |
| | 10,003 |
| | 419 |
| | 14,493 |
| | 519 |
|
| Gas distribution | — |
| | — |
| | — |
| | 1 |
| | 1,420 |
| | 70 |
| | 1,420 |
| | 70 |
|
| Corporate bonds | | | | | | | | | | | | | | | |
| Oil and gas | — |
| | — |
| | — |
| | 4 |
| | 10,168 |
| | 427 |
| | 10,168 |
| | 427 |
|
| Chemicals | 3 |
| | 3,366 |
| | 19 |
| | 1 |
| | 4,939 |
| | 16 |
| | 8,305 |
| | 35 |
|
| Industrial goods and services | 5 |
| | 13,642 |
| | 171 |
| | 2 |
| | 5,821 |
| | 191 |
| | 19,463 |
| | 362 |
|
| Autos and parts | — |
| | — |
| | — |
| | 1 |
| | 3,928 |
| | 119 |
| | 3,928 |
| | 119 |
|
| Food and beverage | 1 |
| | 2,006 |
| | 12 |
| | 2 |
| | 4,491 |
| | 99 |
| | 6,497 |
| | 111 |
|
| Personal and household goods | 3 |
| | 9,233 |
| | 241 |
| | 2 |
| | 3,039 |
| | 48 |
| | 12,272 |
| | 289 |
|
| Health care | 4 |
| | 14,416 |
| | 186 |
| | — |
| | — |
| | — |
| | 14,416 |
| | 186 |
|
| Retail | 4 |
| | 9,370 |
| | 321 |
| | 1 |
| | 2,308 |
| | 8 |
| | 11,678 |
| | 329 |
|
| Travel and leisure | 1 |
| | 2,013 |
| | 69 |
| | 2 |
| | 792 |
| | 8 |
| | 2,805 |
| | 77 |
|
| Telecommunications | 2 |
| | 2,696 |
| | 51 |
| | — |
| | — |
| | — |
| | 2,696 |
| | 51 |
|
| Banks | 1 |
| | 2,920 |
| | 18 |
| | 15 |
| | 28,887 |
| | 1,671 |
| | 31,807 |
| | 1,689 |
|
| Insurance | 1 |
| | 2,169 |
| | 14 |
| | — |
| | — |
| | — |
| | 2,169 |
| | 14 |
|
| Real Estate | 1 |
| | 4,539 |
| | 177 |
| | 1 |
| | 2,256 |
| | 90 |
| | 6,795 |
| | 267 |
|
| Financial services | 3 |
| | 11,660 |
| | 236 |
| | 15 |
| | 5,270 |
| | 747 |
| | 16,930 |
| | 983 |
|
| Technology | — |
| | — |
| | — |
| | 3 |
| | 8,628 |
| | 334 |
| | 8,628 |
| | 334 |
|
United Fire Group, Inc. Form 10-K | 2011
|
| | | | | | | | | | | | | | | | | | | | | | | | | | | | | |
| Total Available-For-Sale Fixed Maturities | 68 |
| | $ | 158,422 |
| | $ | 3,318 |
| | 68 |
| | $ | 131,860 |
| | $ | 4,952 |
| | $ | 290,282 |
| | $ | 8,270 |
|
| Equity securities | | | | | | | | | | | | | | | |
| Common stocks | | | | | | | | | | | | | | | |
| Public utilities | | | | | | | | | | | | | | | |
| Electric | 3 |
| | $ | 306 |
| | $ | 2 |
| | 4 |
| | $ | — |
| | $ | 1 |
| | $ | 306 |
| | $ | 3 |
|
| Corporate | | | | | | | | | | | | | | | |
| Health care | 2 |
| | 1,437 |
| | 62 |
| | 1 |
| | 371 |
| | 124 |
| | 1,808 |
| | 186 |
|
| Banks | 2 |
| | 614 |
| | 33 |
| | 1 |
| | 488 |
| | 68 |
| | 1,102 |
| | 101 |
|
| Insurance | 1 |
| | 260 |
| | 28 |
| | 1 |
| | 43 |
| | 13 |
| | 303 |
| | 41 |
|
| Real estate | 1 |
| | 79 |
| | 10 |
| | 2 |
| | 158 |
| | 30 |
| | 237 |
| | 40 |
|
| Financial services | 1 |
| | 267 |
| | 15 |
| | — |
| | — |
| | — |
| | 267 |
| | 15 |
|
| Nonredeemable preferred stocks | — |
| | — |
| | — |
| | 2 |
| | 1,158 |
| | 74 |
| | 1,158 |
| | 74 |
|
| Total Available-for-Sale Equity Securities | 10 |
| | $ | 2,963 |
| | $ | 150 |
| | 11 |
| | $ | 2,218 |
| | $ | 310 |
| | $ | 5,181 |
| | $ | 460 |
|
| Total Available-for-Sale Securities | 78 |
| | $ | 161,385 |
| | $ | 3,468 |
| | 79 |
| | $ | 134,078 |
| | $ | 5,262 |
| | $ | 295,463 |
| | $ | 8,730 |
|
| Total | 78 |
| | $ | 161,385 |
| | $ | 3,468 |
| | 81 |
| | $ | 134,668 |
| | $ | 5,370 |
| | $ | 296,053 |
| | $ | 8,838 |
|
|
|
| NOTE 3. FAIR VALUE OF FINANCIAL INSTRUMENTS |
We estimate the fair value of our financial instruments based on relevant mark etmarket information or by discounting estimated future cash flows at estimated current market discount rates appropriate to the specific asset or liability.
In most cases, we use quoted market prices to determine the fair value of fixed maturities, equity securities, trading securities and short-term investments. When quoted market prices do not exist, we baseestimate fair valuesvalue based on pricing or valuation techniques that require inputs that are both unobservable and significant to the overall fair value measurement of the financial instrument. Such inputs may reflect management’s own assumptions about the assumptions a market participant would use in pricing the financial instrument.
We baseestimate the estimated fair value of mortgage loans based on d iscounteddiscounted cash flows, utilizing the market rate of interest for similar loans in effect at the valuation date.
The estimated fair value of policy loans is equivalent to carrying value. We do not make policy loans for amounts in excess of the cash surrender value of the related policy. In all instances, the policy loans are fully collateralized by the related liability for future policy benefits for traditional insurance policies or by the policyholders’ account balance for non-traditional policies.
Our other long-term investments consist primarily of holdings in limited liability partnership funds that are valued by the various fund managers and are recorded on the equity method of accounting. In management’s opinion, these values represent fair value.
For cash and cash equivalents and accrued investment income, carrying value is a reasonable estimate of fair value due to itsthe short-term nature.nature of these financial instruments.
We calculate the fair value of the liabilities for all of our annuity products based upon the estimated value of the business, using current market rates and forecast assumptions and risk-adjusted discount rates, when relevant observable market data does not exist.
United Fire Group, Inc. Form 10-K | 2011
A summary of the carrying value and estimated fair value of our financial instruments at December 31, 20102011 and 20092010, is as follows:
| | | At December 31 | 2010 | | 2009 | 2011 | | 2010 |
| (In Thousands) | Fair Value | | Carrying Value | | Fair Value | | Carrying Value | Fair Value | | Carrying Value | | Fair Value | | Carrying Value |
| Assets | | | | | | | | | | | | | | |
| Investments | | | | | | | | | | | | | | |
| Held-to-maturity fixed maturit ies | $ | 6,422 | | | $ | 6,364 | | | $ | 9,720 | | | $ | 9,605 | | |
| Held-to-maturity fixed maturities | | $ | 4,161 |
| | $ | 4,143 |
| | $ | 6,422 |
| | $ | 6,364 |
|
| Available-for-sale fixed maturities | 2,278,429 | | | 2,278,429 | | | 2,158,391 | | | 2,158,391 | | 2,697,248 |
| | 2,697,248 |
| | 2,278,429 |
| | 2,278,429 |
|
| Trading securities | 12,886 | | | 12,886 | | | 12,613 | | | 12,613 | | 13,454 |
| | 13,454 |
| | 12,886 |
| | 12,886 |
|
| Equity securities | 149,706 | | | 149,706 | | | 132,718 | | | 132,718 | | 159,451 |
| | 159,451 |
| | 149,706 |
| | 149,706 |
|
| Mortgage loans | 7,658 | | | 6,497 | | &nb sp; | 8,229 | | | 7,328 | | 5,219 |
| | 4,829 |
| | 7,658 |
| | 6,497 |
|
| Policy loans | 7,875 | | | 7,875 | | | 7,947 | | &nbs p; | 7,947 | | 7,209 |
| | 7,209 |
| | 7,875 |
| | 7,875 |
|
| Other long-term investments | 20,041 | | | 20,041 | | | 15,880 | | | 15,880 | | 20,574 |
| | 20,574 |
| | 20,041 |
| | 20,041 |
|
| Short-term investments | 1,100 | | | 1,100 | | | 7,359 | | | 7,359 | | 1,100 |
| | 1,100 |
| | 1,100 |
| | 1,100 |
|
| Cash and cash equivalents | 180,057 | | | 180,057 | | | 190,852 | | | 190,852 | | 144,527 |
| | 144,527 |
| | 180,057 |
| | 180,057 |
|
| Accrued investment income | 28,977 | | | 28,977 | | | 28,697 | | | 28,697 | | 32,219 |
| | 32,219 |
| | 28,977 |
| | 28,977 |
|
| Liabilities | | | | | | | | | | | | | | |
| Policy Reserves | | | | | | | | | | | | | | |
Annuity (accumulations) (1) | $ | 965,932 | | | $ | 948,920 | | | $ | 1,087,457 | | | $ | 914,003 | | $ | 1,074,661 |
| | $ | 999,534 |
| | $ | 965,932 |
| | $ | 948,920 |
|
| Annuity (benefit payments) | 102,511 | | | 86,874 | | | 85,336 | | | 77,025 | | 133,921 |
| | 94,465 |
| | 102,511 |
| | 86,874 |
|
| |
| (1) | Annuity accumulations represent deferred annuity contracts whichthat are currently earning interest. |
United Fire & Casualty Company Form 10-K | 2010
Current accounting guidance o non fair value measurements includes the application of a fair value hierarchy that requires us to maximize the use of observable inputs and minimize the use of unobservable inputs when measuring fair value. Our financial instruments that are recorded at fair value are categorized into a three-level hierarchy, which is based upon the priority of the inputs to the valuation technique. The fair value hierarchy gives the highest priority to quoted prices in active markets for identical assets (Level(i.e., Level 1) and the lowest priority to unobservable inputs (Level(i.e., Level 3). If the inputs used to measure fair value fall within different levels of the hierarchy, the category level is based on the lowest priority level input that is significant to the fair value measurement of the financial instrument.
Financial instruments recorded at fair value are categorized in the fair value hierarchy as follows:
| |
• | Level 1: Valuations are based on unadjusted quoted prices in active markets for identical financial instruments that we have the ability to access. |
| |
• | Level 2: Valuations are based on quoted prices for similar financial instruments, other than quoted prices included in Level 1, in markets that are not active or on inputs that are observable either directly or indirectly for the full term of the financial instrument. |
| |
• | Level 3: Valuations are based on pricing or valuation techniques that require inputs that are both unobservable and significant to the overall fair value measurement of the financial in strument. Such inputs may reflect management’s own assumptions about the assumptions a market participant would use in pricing the financial instrument. |
Level 1: Valuations are based on unadjusted quoted prices in active markets for identical financial instruments that we have the ability to access.
Level 2: Valuations are based on quoted prices for similar financial instruments, other than quoted prices included in Level 1, in markets that are not active or on inputs that are observable either directly or indirectly for the full term of the financial instrument.
Level 3: Valuations are based on pricing or valuation techniques that require inputs that are both unobservable and significant to the overall fair value measurement of the financial instrument. Such inputs may reflect management’s own assumptions about the assumptions a market participant would use in pricing the financial instrument.
Transfers between levels, if any, are recorded as of the beginning of the reporting period.
To determine the fair value of the majority of our investments, we utilize prices obtained from independent, nationally recognized pricing services. We obtain one price for each security. When the pricing services cannot provide a determination of fair value for a specific security, we obtain non-binding price quotes from broker-dealers with whom we have had several years experience and who have demonstrated knowledge of the subject security. We
United Fire Group, Inc. Form 10-K | 2011
request and utilize one broker quote per security.
We validate the prices obtained from pricing services and brokers prior to their use for reporting purposes by evaluating their reasonableness on a monthly basis. Our validation process includes a review for unusual fluctuations. In our opinion, the pricing obtained at December 31, 20102011, was reasonable.
In order to determine the proper classification in the fair value hierarchy for each security where the price is obtained from an independent pricing service, we obtain and evaluate the vendors’ pricing procedures and inputs used to price the security, which include unadjusted quoted market prices for identical securities, such as a New York Stock Exchange closing price and quoted prices for identical securities in markets that are not active. For fixed maturity securities, an evaluation of interest rates and yield curves observable at commonly quoted intervals, volatility, prepayment speeds, credit risks and default rates may also be performed. We have determined that these processes and inputs result in fair values and classifications consistent with the applicable current accounting guidance on fair value measurements.
We review our fair value hierarchy categorizations on a quarterly basis at which time the classification of certain financial instruments may change if the input observations have changed.
The following tables present the categorization for our financial instruments measured at fair value on a recurring basis in our Consolidated Balance Sheets at December 31, 20102011 and 20092010:
United Fire & Casualty CompanyGroup, Inc. Form 10-K | 20102011
| | | (In Thousands) | | | | Fair Value Measurements | | | Fair Value Measurements |
| Description | | December 31, 2010 | | Level 1 | | Level 2 | | Level 3 | December 31, 2011 | | Level 1 | | Level 2 | | Level 3 |
| AVAILABLE-FOR-SALE | | | | | | | | |
| |
| |
| |
|
| Fixed maturities | | | | | | | | |
| |
| |
| |
|
| Bonds | | | | | | | | |
| |
| |
| |
|
| United States government | | | | | | | | | |
| Collateralized mortgage obligations | | $ | 19,577 | | | $ | — | | | $ | 19,577 | | | $ | — | | |
| Mortgage-backed securities | | 2 | | | — | | | 2 | | | — | | |
| U.S. government and government-sponsored enterprises | |
| |
| |
| |
|
| U.S. Treasury | | 39,076 | | | — | | | 39,076 | | | — | | $ | 43,951 |
| | $ | — |
| | $ | 43,951 |
| | $ | — |
|
| Agency | | 103,131 | | | — | | | 103,131 | | | — | | 96,395 |
| | — |
| | 96,395 |
| | — |
|
| States, municipalities and political subdivisions | | | | | | | | |
| |
| |
| |
|
| General obligations | | 393,781 | | | — | | | 393,781 | | | — | |
| |
| |
| |
|
| Midwest | | | | | | | | |
| North central - East | | 129,605 |
| | — |
| | 129,605 |
| | — |
|
| North central - West | | 84,311 |
| | — |
| | 84,311 |
| | — |
|
| Northeast | | 40,863 |
| | — |
| | 40,863 |
| | — |
|
| South | | 115,473 |
| | — |
| | 115,473 |
| | — |
|
| West | | 74,378 |
| | — |
| | 74,378 |
| | — |
|
| Special revenue | | 225,433 | | | — | | | 224,432 | | | 1,001 | |
| |
| |
| |
|
| Midwest | | | | | | | | |
| North central - East | | 70,813 |
| | — |
| | 69,933 |
| | 880 |
|
| North central - West | | 55,236 |
| | — |
| | 55,236 |
| | — |
|
| Northeast | | 14,733 |
| | — |
| | 14,733 |
| | — |
|
| South | | 103,074 |
| | — |
| | 103,074 |
| | — |
|
| West | | 59,621 |
| | — |
| | 59,621 |
| | — |
|
| Foreign bonds | | | | & nbsp; | | | | |
| |
| |
| |
|
| Canadian | | 72,923 | | | — | | | 72,923 | | | — | | 72,176 |
| | — |
| | 72,176 |
| | — |
|
| Other | | 89,754 | | | — | | | 88,639 | | | 1,115 | | |
| Other foreign | | 142,639 |
| | — |
| | 141,803 |
| | 836 |
|
| Public utilities | | | | | | | | |
| |
| |
| |
|
| Electric | | 215,544 | | | — | | | 215,509 | | | 35 | | 233,479 |
| | — |
| | 233,479 |
| | — |
|
| Natural gas | | 59,074 | | | — | | | 59,074 | | | — | | |
| Gas distribution | | 25,658 |
| | — |
| | 25,658 |
| | — |
|
| Other | | 3,690 | | | — | | | 3,690 | | | — | | 10,934 |
| | — |
| | 10,934 |
| | — |
|
| Corporate bonds | | | | | | | | |
| |
| |
| |
|
| Banks, trusts and insurance companies | | 275,720 | | | — | | | 263,662 | | | 12,058 | | |
| Transportation | | 26,657 | | | — | | | 26,657 | | | — | | |
| Energy | | 157,804 | | | — | | | 157,804 | | | — | | |
| Oil and gas | | 197,192 |
| | — |
| | 197,192 |
| | — |
|
| Chemicals | | 62,261 |
| | — |
| | 62,261 |
| | — |
|
| Basic resources | | 24,061 |
| | — |
| | 24,061 |
| | — |
|
| Construction and materials | | 24,330 |
| | — |
| | 24,330 |
| | — |
|
| Industrial goods and services | | 185,025 |
| | — |
| | 182,128 |
| | 2,897 |
|
| Autos and parts | | 18,229 |
| | — |
| | 18,229 |
| | — |
|
| Food and beverage | | 69,241 |
| | — |
| | 67,826 |
| | 1,415 |
|
| Personal and household goods | | 61,963 |
| | — |
| | 61,963 |
| | — |
|
| Health care | | 115,671 |
| | — |
| | 115,671 |
| | — |
|
| Retail | | 60,063 |
| | — |
| | 60,063 |
| | — |
|
| Media | | 41,969 |
| | — |
| | 41,969 |
| | — |
|
| Travel and leisure | | 2,678 |
| | — |
| | 2,678 |
| | — |
|
| Telecommunications | | 39,915 |
| | — |
| | 39,915 |
| | — |
|
| Banks | | 131,876 |
| | — |
| | 124,646 |
| | 7,230 |
|
| Insurance | | 23,700 |
| | — |
| | 23,700 |
| | — |
|
| Real estate | | 23,022 |
| | — |
| | 15,242 |
| | 7,780 |
|
| Financial services | | 86,703 |
| | — |
| | 85,740 |
| | 963 |
|
| Technology | | 108,420 | | | — | | | 108,420 | | | — | | 31,064 |
| | — |
| | 31,064 |
| | — |
|
| Basic industry | | 121,639 | | | — | | | 118,742 | | | 2,897 | | |
| Credit cyclicals | | 67,822 | | | — | | | 65,319 | | | 2,503 | | |
| Collateralized mortgage obligations | |
| |
| |
| |
|
| Government | | 82,691 |
| | — |
| | 82,691 |
| | — |
|
| Other | | 298,382 | | | — | | | 292,361 | | | 6,021 | | 160 |
| | — |
| | 160 |
| | — |
|
| Mortgage-backed securities | | 35,390 |
| | — |
| | 35,390 |
| | — |
|
| Asset-backed securities | | 6,296 |
| | — |
| | 5,981 |
| | 315 |
|
| Redeemable preferred stock | | 409 |
| | 409 |
| | — |
| | — |
|
| Total Available-For-Sale Fixed Maturities | | $ | 2,278,429 | | | $ | — | | | $ | 2,252,799 | | | $ | 25,630 | | $ | 2,697,248 |
| | $ | 409 |
| | $ | 2,674,523 |
| | $ | 22,316 |
|
| Equity securities | | | | | | | �� | |
| |
| |
| |
|
| Common stocks | | | | | | | | |
| |
| |
| |
|
| Public utilities | | | | | | | | |
| |
| |
| |
|
| Electric | | $ | 10,761 | | | $ | 10,761 | | | $ | — | | | $ | — | | $ | 12,419 |
| | $ | 12,419 |
| | $ | — |
| | $ | — |
|
| Natural gas | | 1,997 | | | 1,997 | | | — | | | — | | |
| Banks, trusts and insurance companies | | | | | | | | | |
| Banks | | 41,168 | | | 39,633 | | | — | | | 1,535 | | |
| Insurance | | 14,408 | | | 14,408 | | | — | | | — | | |
| Other | | 2,886 | | | 2,886 | | | — | | | — | | |
| All other common stocks | | | | | | | | | |
| Transportation | | 1 | | | 1 | | | — | | | — | | |
| Energy | | 11,444 | | | 11,444 | | | — | | | — | | |
| Technology | | 14,653 | | | 14,622 | | | 31 | | | — | | |
| Basic industry | | 16,905 | | | 16,905 | | | — | | | — | | |
| Credit cyclicals | | 783 | | | 783 | | | — | | | — | | |
| Other | | 33,310 | | | 33,310 | | | — | | | — | | |
| Nonredeemable preferred stocks | | 1,390 | | | 1,158 | | | 232 | | | — | | |
| Total Available-for-Sale Equity Securities | | $ | 149,706 | | | $ | 147,908 | | | $ | 263 | | | $ | 1,535 | | |
| Total Available-for-Sale Securities | | $ | 2,428,135 | | | $ | 147,908 | | | $ | 2,253,062 | | | $ | 27,165 | | |
| TRADING | | | | | | | | | |
| Fixed maturities | | | | | | | | | |
| Bonds | | | | | | | | | |
| Foreign bonds | | $ | 2,283 | | | $ | — | | | $ | 2,283 | | | $ | — | | |
| Corporate bonds | | | | | | | | | |
| Banks, trusts and insurance companies | | 1,198 | | | — | | | 1,198 | | | — | | |
| Energy | | 2,844 | | | — | | | 2,844 | | | — | | |
| Technology | | 3,311 | | | — | | | 3,311 | | | — | | |
| Other | | 384 | | | — | | | 384 | | | — | | |
| Redeemable Preferred Stock | | 2,866 | | | 1,476 | | | 1,390 | | | — | | |
| Total Trading Fixed Maturities | | $ | 12,886 | | | $ | 1,476 | | | $ | 11,410 | | | $ | — | | |
| Short-Term Investments | | $ | 1,100 | | | $ | 1,100 | | | $ | — | | | $ | — | | |
| Money Market Accounts | | $ | 34,384 | | | $ | 34,384 | | | $ | — | | | $ | — | | |
| Total Assets Measured at Fair Value | | $ | 2,476,505 | | | $ | 184,868 | | | $ | 2,264,472 | | | $ | 27,165 | | |
United Fire & Casualty CompanyGroup, Inc. Form 10-K | 20102011
| | | | | | | | | | | | | | | | |
| (In Thousands) | | | | Fair Value Measurements |
| Description | | December 31, 2009 | | Level 1 | | Level 2 | | Level 3 |
| AVAILABLE-FOR-SALE | | | | | | | | |
| Fixed maturities | | | | | | | | |
| Bonds | | | | | | | | |
| United States government | | | | | | | | |
| Collateralized mortgage obligations | | $ | 18,952 | | | $ | — | | | $ | 18,952 | | | $ | — | |
| Mortgage-backed securities | | 2 | | | — | | | 2 | | | — | |
| U.S. Treasury | | 35,650 | | | — | | | 35,650 | | | — | |
| Agency | | 70,625 | | | — | | | 70,625 | | | — | |
| States, municipalities and political subdivisions | | | | | | | | |
| General obligations | | 390,378 | | | — | | | 390,378 | | | — | |
| Special revenue | | 227,362 | | | — | | | 226,252 | | | 1,110 | |
| Foreign bonds | | | | | | | | |
| Canadian | & nbsp; | 58,826 | | | — | | | 58,826 | | | — | |
| Other | | 82,414 | | | — | | | 81,020 | | | 1,394 | |
| Public utilities | | | | | | | | |
| Electric | | 224,004 | | | — | | | 223,934 | &n bsp; | | 70 | |
| Natural gas | | 57,806 | | | — | | | 57,806 | | | — | |
| Other | | 3,778 | | | — | | | 3,778 | | | — | |
| Corporate bonds | | | | | | | | |
| Banks, trusts and insurance companies | | 289,209 | | | — | | | 275,181 | | | 14,028 | |
| Transportation | | 32,187 | | | — | | | 32,187 | | | — | |
| Energy | | 152,339 | | | — | | | 152,339 | | | — | |
| Technology | | 89,172 | | | — | | | 89,172 | | | — | |
| Basic industry | | 109,567 | | | — | | | 104,761 | | | 4,806 | |
| Credit cyclicals | | 72,585 | | | — | | | 69,737 | | | 2,848 | |
| Other | | 243,535 | | | — | | | 237,332 | | | 6,203 | |
| Total Available-For-Sale Fixed Maturities | | $ | 2,158,391 | | | $ | — | | | $ | 2,127,932 | | | $ | 30,459 | |
| Equity securities | | | | | | | | |
| Common stocks | | | | | | | | |
| Public utilities | | | | | | | | |
| Electric | | $ | 10,033 | | | $ | 10,033 | | | $ | — | | | $ | — | |
| Natural gas | | 1,684 | | | 1,684 | | | — | | | — | |
| Banks, trusts and insurance companies | | | | | | | | |
| Banks | | 35,889 | | | 35,889 | | | — | | | — | |
| Insurance | | 11,652 | | | 11,652 | | | — | | | — | |
| Other | | 1,942 | | | 1,942 | | | — | | | — | |
| All other common stocks | | | | | | | | |
| Transportation | | 1,593 | | | 1,593 | | | — | | | — | |
| Energy | | 9,529 | | | 9,529 | | | — | | | — | |
| Technology | | 13,910 | | | 13,879 | | | 31 | | | — | |
| Basic industry | | 13,449 | | | 13,449 | | | — | | | — | |
| Credit cyclicals | | 3,176 | | | 3,176 | | | — | | | — | |
| Other | | 28,832 | | | 28,573 | | | 259 | | | — | |
| Nonredeemable preferred stocks | | 1,029 | | | 1,029 | | | — | | | — | |
| Total Available-for-Sale Equity Securities | | $ | 132,718 | | | $ | 132,428 | | | $ | 290 | | | $ | — | |
| Total Available-for-Sale Securities | | $ | 2,2 91,109 | | | $ | 132,428 | | | $ | 2,128,222 | | | $ | 30,459 | |
| TRADING | | | | | | | | |
| Fixed maturities | | | | | | | | |
| Bonds | | | | | | | | |
| Foreign bonds | | $ | 2,689 | | | $ | — | | | $ | 2,689 | | | $ | — | |
| Public utilities | | 1,460 | | | — | | | 1,460 | | | — | |
| Corporate bonds | | | | | | | | |
| Energy | | 2,310 | | | — | | | 2,310 | | | — | |
| Technology | | 4,314 | | | — | | | 4,314 | | | — | |
| Other | | 532 | | | 211 | | | 321 | | | — | |
| Redeemable Preferred Stock | | 1,308 | | | 1,308 | | | — | | | — | |
| Total Trading Fixed Maturities | | $ | 12,613 | | | $ | 1,519 | | | $ | 11,094 | | | $ | — | |
| Short-Term Investments | &nbs p; | $ | 7,359 | | | $ | 1,100 | | | $ | 6,005 | | | $ | 254 | |
| Money Market Accounts | | $ | 96,163 | | | $ | 96,163 | | | $ | — | | | $ | — | |
| Total Assets Measured at Fair Value | | $ | 2,407,244 | | | $ | 231,210 | | | $ | 2,145,321 | | | $ | 30,713 | |
|
| | | | | | | | | | | | | | | |
| Gas distribution | 2,223 |
| | 2,223 |
| | — |
| | — |
|
| Other | 93 |
| | 93 |
| | — |
| | — |
|
| Corporate |
| |
| |
| |
|
| Oil and gas | 12,210 |
| | 12,210 |
| | — |
| | — |
|
| Chemicals | 5,039 |
| | 5,039 |
| | — |
| | — |
|
| Industrial goods and services | 23,517 |
| | 23,517 |
| | — |
| | — |
|
| Autos and parts | 580 |
| | 580 |
| | — |
| | — |
|
| Food and beverage | 6,106 |
| | 6,106 |
| | — |
| | — |
|
| Personal and household goods | 8,671 |
| | 8,671 |
| | — |
| | — |
|
| Health care | 15,988 |
| | 15,988 |
| | — |
| | — |
|
| Retail | 3,207 |
| | 3,207 |
| | — |
| | — |
|
| Media | 134 |
| | 134 |
| | — |
| | — |
|
| Telecommunications | 6,160 |
| | 6,160 |
| | — |
| | — |
|
| Banks | 41,514 |
| | 37,988 |
| | — |
| | 3,526 |
|
| Insurance | 13,034 |
| | 13,034 |
| | — |
| | — |
|
| Real Estate | 1,114 |
| | 1,114 |
| | — |
| | — |
|
| Financial services | 428 |
| | 428 |
| | — |
| | — |
|
| Technology | 3,724 |
| | 3,724 |
| | — |
| | — |
|
| Nonredeemable preferred stocks | 3,290 |
| | 3,032 |
| | 258 |
| | — |
|
| Total Available-for-Sale Equity Securities | $ | 159,451 |
| | $ | 155,667 |
| | $ | 258 |
| | $ | 3,526 |
|
| Total Available-for-Sale Securities | $ | 2,856,699 |
| | $ | 156,076 |
| | $ | 2,674,781 |
| | $ | 25,842 |
|
| TRADING |
| |
| |
| |
|
| Fixed maturities |
| |
| |
| |
|
| Bonds |
| |
| |
| |
|
| Foreign bonds |
| |
| |
| |
|
| Canadian | $ | 1,530 |
| | $ | — |
| | $ | 1,530 |
| | $ | — |
|
| Other foreign | 1,376 |
| | — |
| | 1,376 |
| | — |
|
| Corporate bonds |
| |
| |
| |
|
| Basic resources | 1,443 |
| | — |
| | 1,443 |
| | — |
|
| Food and beverage | 1,059 |
| | — |
| | 1,059 |
| | — |
|
| Health care | 1,450 |
| | — |
| | 1,450 |
| | — |
|
| Banks | 1,237 |
| | — |
| | 1,237 |
| | — |
|
| Insurance | 440 |
| | — |
| | 440 |
| | — |
|
| Financial services | 386 |
| | — |
| | 386 |
| | — |
|
| Technology | 1,458 |
| | — |
| | 1,458 |
| | — |
|
| Redeemable Preferred Stock | 3,075 |
| | 1,659 |
| | 1,416 |
| | — |
|
| Total Trading Fixed Maturities | $ | 13,454 |
| | $ | 1,659 |
| | $ | 11,795 |
| | $ | — |
|
| Short-Term Investments | $ | 1,100 |
| | $ | 1,100 |
| | $ | — |
| | $ | — |
|
| Money Market Accounts | $ | 62,899 |
| | $ | 62,899 |
| | $ | — |
| | $ | — |
|
| Total Assets Measured at Fair Value | $ | 2,934,152 |
| | $ | 221,734 |
| | $ | 2,686,576 |
| | $ | 25,842 |
|
United Fire & Casualty CompanyGroup, Inc. Form 10-K | 20102011
|
| | | | | | | | | | | | | | | |
| (In Thousands) | | | Fair Value Measurements |
| Description | December 31, 2010 | | Level 1 | | Level 2 | | Level 3 |
| AVAILABLE-FOR-SALE |
| |
| |
| |
|
| Fixed maturities |
| |
| |
| |
|
| Bonds |
| |
| |
| |
|
| U.S. government and government-sponsored enterprises |
| |
| |
| |
|
| U.S. Treasury | $ | 39,076 |
| | $ | — |
| | $ | 39,076 |
| | $ | — |
|
| Agency | 103,131 |
| | — |
| | 103,131 |
| | — |
|
| States, municipalities and political subdivisions |
| |
| |
| |
|
| General obligations |
| |
| |
| |
|
| Midwest | | | | | | | |
| North central - East | 127,770 |
| | — |
| | 127,770 |
| | — |
|
| North central - West | 81,132 |
| | — |
| | 81,132 |
| | — |
|
| Northeast | 29,525 |
| | — |
| | 29,525 |
| | — |
|
| South | 99,297 |
| | — |
| | 99,297 |
| | — |
|
| West | 56,053 |
| | — |
| | 56,053 |
| | — |
|
| Special revenue |
| |
| |
| |
|
| Midwest | | | | | | | |
| North central - East | 61,093 |
| | — |
| | 60,092 |
| | 1,001 |
|
| North central - West | 40,305 |
| | — |
| | 40,305 |
| | — |
|
| Northeast | 4,743 |
| | — |
| | 4,743 |
| | — |
|
| South | 74,747 |
| | — |
| | 74,747 |
| | — |
|
| West | 44,545 |
| | — |
| | 44,545 |
| | — |
|
| Foreign bonds |
| |
| |
| |
|
| Canadian | 72,923 |
| | — |
| | 72,923 |
| | — |
|
| Other foreign | 89,754 |
| | — |
| | 88,639 |
| | 1,115 |
|
| Public utilities |
| |
| |
| |
|
| Electric | 225,324 |
| | — |
| | 225,289 |
| | 35 |
|
| Gas distribution | 22,185 |
| | — |
| | 22,185 |
| | — |
|
| Other | 21,580 |
| | — |
| | 21,580 |
| | — |
|
| Corporate bonds |
| |
| |
| |
|
| Oil and gas | 185,436 |
| | — |
| | 185,436 |
| | — |
|
| Chemicals | 54,971 |
| | — |
| | 54,971 |
| | — |
|
| Basic resources | 7,427 |
| | — |
| | 7,427 |
| | — |
|
| Construction and materials | 20,258 |
| | — |
| | 20,258 |
| | — |
|
| Industrial goods and services | 155,058 |
| | — |
| | 152,161 |
| | 2,897 |
|
| Autos and parts | 18,384 |
| | — |
| | 18,384 |
| | — |
|
| Food and beverage | 74,033 |
| | — |
| | 72,551 |
| | 1,482 |
|
| Personal and household goods | 69,387 |
| | — |
| | 66,884 |
| | 2,503 |
|
| Health care | 83,342 |
| | — |
| | 83,342 |
| | — |
|
| Retail | 43,960 |
| | — |
| | 43,960 |
| | — |
|
| Media | 33,254 |
| | — |
| | 33,254 |
| | — |
|
| Travel and leisure | 5,866 |
| | — |
| | 5,866 |
| | — |
|
| Telecommunications | 36,984 |
| | — |
| | 36,984 |
| | — |
|
| Banks | 121,634 |
| | — |
| | 114,111 |
| | 7,523 |
|
| Insurance | 26,467 |
| | — |
| | 26,467 |
| | — |
|
| Real estate | 21,737 |
| | — |
| | 13,764 |
| | 7,973 |
|
| Financial services | 83,455 |
| | — |
| | 82,354 |
| | 1,101 |
|
| Technology | 16,688 |
| | — |
| | 16,688 |
| | — |
|
| Collateralized mortgage obligations | 19,577 |
| | — |
| | 19,577 |
| | — |
|
| Mortgage-backed securities | 2 |
| | — |
| | 2 |
| | — |
|
| Asset-backed securities | 7,326 |
| | — |
| | 7,326 |
| | — |
|
| Total Available-For-Sale Fixed Maturities | $ | 2,278,429 |
| | $ | — |
| | $ | 2,252,799 |
| | $ | 25,630 |
|
| Equity securities |
| |
| |
| |
|
| Common stocks |
| |
| |
| |
|
| Public utilities |
| |
| |
| |
|
| Electric | $ | 10,390 |
| | $ | 10,390 |
| | $ | — |
| | $ | — |
|
| Gas distribution | 676 |
| | 676 |
| | — |
| | — |
|
| Corporate |
| |
| |
| |
|
| Oil and gas | 13,134 |
| | 13,134 |
| | — |
| | — |
|
| Chemicals | 6,079 |
| | 6,079 |
| | — |
| | — |
|
United Fire Group, Inc. Form 10-K | 2011
|
| | | | | | | | | | | | | | | |
| Industrial goods and services | 23,297 |
| | 23,297 |
| | — |
| | — |
|
| Autos and parts | 794 |
| | 794 |
| | — |
| | — |
|
| Food and beverage | 4,474 |
| | 4,474 |
| | — |
| | — |
|
| Personal and household goods | 8,603 |
| | 8,603 |
| | — |
| | — |
|
| Health care | 12,548 |
| | 12,548 |
| | — |
| | — |
|
| Retail | 728 |
| | 728 |
| | — |
| | — |
|
| Travel and leisure | 1 |
| | 1 |
| | — |
| | — |
|
| Telecommunications | 5,814 |
| | 5,783 |
| | 31 |
| | — |
|
| Banks | 43,760 |
| | 42,225 |
| | — |
| | 1,535 |
|
| Insurance | 14,408 |
| | 14,408 |
| | — |
| | — |
|
| Real Estate | 1,020 |
| | 1,020 |
| | — |
| | — |
|
| Financial services | 559 |
| | 559 |
| | — |
| | — |
|
| Technology | 2,031 |
| | 2,031 |
| | — |
| | — |
|
| Nonredeemable preferred stocks | 1,390 |
| | 1,158 |
| | 232 |
| | — |
|
| Total Available-for-Sale Equity Securities | $ | 149,706 |
| | $ | 147,908 |
| | $ | 263 |
| | $ | 1,535 |
|
| Total Available-for-Sale Securities | $ | 2,428,135 |
| | $ | 147,908 |
| | $ | 2,253,062 |
| | $ | 27,165 |
|
| TRADING |
| |
| |
| |
|
| Fixed maturities |
| |
| |
| |
|
| Bonds |
| |
| |
| |
|
| Foreign bonds | $ | 2,283 |
| | $ | — |
| | $ | 2,283 |
| | $ | — |
|
| Corporate bonds |
| |
| |
| |
|
| Oil and gas | 2,843 |
| | — |
| | 2,843 |
| | — |
|
| Health care | 1,917 |
| | — |
| | 1,917 |
| | — |
|
| Banks | 1,198 |
| | — |
| | 1,198 |
| | — |
|
| Financial services | 384 |
| | — |
| | 384 |
| | — |
|
| Technology | 1,394 |
| | — |
| | 1,394 |
| | — |
|
| Redeemable Preferred Stock | 2,867 |
| | 1,476 |
| | 1,391 |
| | — |
|
| Total Trading Fixed Maturities | $ | 12,886 |
| | $ | 1,476 |
| | $ | 11,410 |
| | $ | — |
|
| Short-Term Investments | $ | 1,100 |
| | $ | 1,100 |
| | $ | — |
| | $ | — |
|
| Money Market Accounts | $ | 34,384 |
| | $ | 34,384 |
| | $ | — |
| | $ | — |
|
| Total Assets Measured at Fair Value | $ | 2,476,505 |
| | $ | 184,868 |
| | $ | 2,264,472 |
| | $ | 27,165 |
|
The fair value of securities that are categorized as Level 1 is based on quoted market prices that are readily and regularly available.
The fair value of securities that are categorized as Level 2 is determined by management after reviewing market prices obtained from independent pricing services and brokers. Such estimated fair values do not necessarily represent the values for which these securities could have been sold at the reporting date. Our independent pricing services and brokers obtain prices from reputable pricing vendors in the marketplace. They continually monitor and review the external pricing sources, while actively participating to resolve any pricing issues that may arise.
For the year ended December 31, 20102011, the change in our available-for-sale securities categorized as Level 1 and Level 2 is the result of investment purchases and disposals made during the period, which were made fr omfrom funds held in our money market accounts, and an increase in unrealized gains on both fixed maturities and equity securities. There were no significant transfers of securities in or out of Level 1 or Level 2 during the period.year.
Securities that may be categorized as Level 3 include holdings in certain private placement fixed maturity and equity securities and certain other securities that were determined to be other-than-temporarily impaired in a prior period and for which an active market does not currently exist.
The fair value of our Level 3 private placement securities is determined by management relying on pricing received from our independent pricing services and brokers consistent with the process to estimate fair value fo rfor Level 2 securities. If pricing could not be obtained from these sources, management performs an analysis of the contractual cash flows of the underlying security to estimate fair value.
The fair value of our Level 3 impaired securities was determined primarily based upon management’s assumptions regarding the timing and amount of future cash inflows. If a security has been written down or the issuer is in bankruptcy, management relies in part on outside opinions from rating agencies, our lien position on the security, general economic conditions and management’s expertise to determine fair value. We have the ability and the
United Fire Group, Inc. Form 10-K | 2011
positive intent to hold securities until such time that we are able to recover all or a portion of our original investment. If a security does not have a market at the balance sheet date, management will estimate the security’s fair value based on other securities in the market. Management will continue to monitor securities after the balance sheet date to confirm that their estimated fair va luevalue is reasonable.
The following table provides a summary of the changes in fair value of our Level 3 securities for 2011:
|
| | | | | | | | | | | | | | | | | | | | | |
| (In Thousands) | States, municipalities and political subdivisions | Foreign bonds | Public utilities | Corporate bonds | Asset-backed securities | Equities | Total |
| Balance at January 1, 2011 | $ | 1,001 |
| $ | 1,115 |
| $ | 35 |
| $ | 23,479 |
| $ | — |
| $ | 1,535 |
| $ | 27,165 |
|
Realized gains (1) | — |
| — |
| — |
| — |
| 12 |
| 10 |
| 22 |
|
Unrealized gains (losses) (1) | — |
| 7 |
| (2 | ) | 178 |
| 1 |
| (8 | ) | 176 |
|
| Amortization | — |
| — |
| — |
| — |
| (15 | ) | — |
| (15 | ) |
| Purchases | — |
| — |
| — |
| 106 |
| 1,437 |
| 3,271 |
| 4,814 |
|
| Disposals | (121 | ) | (286 | ) | (33 | ) | (3,278 | ) | (1,120 | ) | (1,282 | ) | (6,120 | ) |
| Transfers in | — |
| — |
| — |
| 16,956 |
| — |
| — |
| 16,956 |
|
| Transfers out | — |
| — |
| — |
| (17,156 | ) | — |
| — |
| (17,156 | ) |
| Balance at December 31, 2011 | $ | 880 |
| $ | 836 |
| $ | — |
| $ | 20,285 |
| $ | 315 |
| $ | 3,526 |
| $ | 25,842 |
|
| |
| (1) | Realized gains are recorded as a component of current operations whereas unrealized gains (losses) are recorded as a component of comprehensive income. |
The equity securities reported as “purchases” primarily relate to our acquisition of Mercer Insurance Group. We purchased securities in the Federal Home Loan Bank of Des Moines, as a requirement to obtain membership and secure a loan used as part of the acquisition financing. These securities were classified as Level 3 because we had no observable market price at December 31, 2011. The reported “disposals” relate to the receipt of principal on calls or sinking fund bonds, in accordance with the indentures.
The securities reported as “transfers in” relate to securities transferred from either Level 1 or 2 to Level 3 because an updated market value was not available. The securities reported as “transfers out” relate to securities transferred from Level 3 to either Level 1 or 2 because an updated market value was available.
The following table provides a summary of the changes in fair value of our Level 3 securities for 2010:
| | | (In Thousands) | States, municipalities and political subdivisions | Foreign bonds | Public utilities | Corporate bonds | Equities | Short-term investments | Total | States, municipalities and political subdivisions | Foreign bonds | Public utilities | Corporate bonds | Equities | Short-term investments | Total |
| Balance at January 1, 2010 | $ | 1,110 | | $ | 1,394 | | $ | 70 | | $ | 27,885 | | $ | — | | $ | 254 | | $ | 30,713 | | $ | 1,110 |
| $ | 1,394 |
| $ | 70 |
| $ | 27,885 |
| $ | — |
| $ | 254 |
| $ | 30,713 |
|
Realized gains (1) | — | | — | | — | | — | | — | | — | | — | | |
Unrealized gains (1) | — | | 7 | | (1 | ) | 345 | | — | | — | | 351 | | |
Realized losses (1) | | — |
| — |
| — |
| — |
| — |
| — |
| — |
|
Unrealized gains (losses) (1) | | �� |
| 7 |
| (1 | ) | 345 |
| — |
| — |
| 351 |
|
| Amortization | — | | — | | (1 | ) | (1 | ) | — | | — | | (2 | ) | — |
| — |
| (1 | ) | (1 | ) | — |
| — |
| (2 | ) |
| Purchases | — | | — | | — | | 7 | | 1,535 | | — | | 1,542 | | — |
| — |
| — |
| 7 |
| 1,535 |
| — |
| 1,542 |
|
| Disposals | (109 | ) | (286 | ) | (33 | ) | (5,011 | ) | — | | — | | (5,439 | ) | (109 | ) | (286 | ) | (33 | ) | (5,011 | ) | — |
| — |
| (5,439 | ) |
| Transfers in | — | | — | | — | | 254 | | — | | — | | 254 | | — |
| — |
| — |
| 254 |
| — |
| — |
| 254 |
|
| Transfers out | — | | — | | — | | — | | — | | (254 | ) | (254 | ) | — |
| — |
| — |
| — |
| — |
| (254 | ) | (254 | ) |
| Balance at December 31, 2010 | $ | 1,001 | | $ | 1,115 | | $ | 35 | | $ | 23,479 | | $ | 1,535 | | $ | — | | $ | 27,165 | | $ | 1,001 |
| $ | 1,115 |
| $ | 35 |
| $ | 23,479 |
| $ | 1,535 |
| $ | — |
| $ | 27,165 |
|
| |
| (1) | Realized gainslosses are recorded as a component of current operations whereas unrealized gains (losses) are recorded as a component of comprehensive income. |
The $5,439,000$5,439,000 reported as “disposals” included $1,930,000 of corporate bonds that were called as a result of debt restructuring by the issuer and $2,000,000 of corporate bonds that matured. Of the $1,930,000, $254,000 were short-term investments that were transferred to corporate bonds as a result of the restructuring. The remaining $1,509,000
United Fire Group, Inc. Form 10-K | 2011
in disposals relates to the receipt of principal on calls or sinksinking fund bonds, in accordance with the indentures.
United Fire & Casualty CompanyGroup, Inc. Form 10-K | 20102011
The following table provides a summary of the changes in fair value of our Level 3 securities for 2009:
| | | | | | | | | | | | | | | | | | | | | |
| (In Thousands) | States, municipalities and political subdivisions | Foreign bonds | Public utilities | Corporate bonds | Equities | Short-term investments | Total |
| Balance at January 1, 2009 | $ | 1,210 | | $ | 300 | | $ | — | | $ | 4,744 | | $ | 1,851 | | $ | — | | $ | 8,105 | |
Realized losses (1) | — | | — | | (1 | ) | — | | — | | — | | (1 | ) |
Unrealized gains (1) | | 7 | | — | | 324 | | — | | — | | 331 | |
| Amortization | — | | — | | — | | — | | — | | — | | — | |
| Purchases | — | | — | | — | | 4,682 | | — | | 750 | | 5,432 | |
| Disposals | (100 | ) | (286 | ) | (33 | ) | (4,198 | ) | — | | (496 | ) | (5,113 | ) |
| Transfers in | — | & nbsp; | 1,674 | | 105 | | 24,231 | | — | | — | | 26,010 | |
| Transfers out | — | | (300 | ) | — | | (1,900 | ) | (1,851 | ) | — | | (4,051 | ) |
| Balance at December 31, 2009 | $ | 1,110 | | $ | 1,395 | | $ | 71 | | $ | 27,883 | | $ | — | | $ | 254 | | $ | 30,713 | |
| |
(1) | Realized losses are recorded as a component of current operations whereas unrealized gains are recorded as a component of comprehensive income. |
The $26,010,000 reported as “transfers in” consisted of $22,760,000 in available-for-sale fixed maturities that were primarily private placement securities that had no observable price available at December 31, 2010, and $3,250,000 of available-for-sale fixed maturities that were subsequently reclassified, as a disposal, to other long-term investments due to bankruptcy reorganization. The $4,051,000 in “transfers out” resulted from available-for-sale fixed maturities and equity securities that previously had no observable market price at December 31, 2009, but for which observable prices were available at December 31, 2010.
|
NOTE 4. SHORT-TERM BORROWINGS |
We maintain a $50,000,000 bank line of credit. Under the terms of the agreement, interest on outstanding notes is payable at the lender’s prevailing prime rate minus 1.0 percent. No outstanding loan balances existed at December 31, 2010 and 2009, and we did not borrow against this line of credit in 2010, 2009 or 2008.
Property and Casualty Insurance Segm entSegment
Ceded and Assumed Reinsurance
Reinsurance is a contract by which one insurer, called the reinsurer, agrees to cover, under certain defined circumstances, a portion of the losses incurred by a primary insurer if a claim is made under a policy issued by the primary insurer. Our property and casualty insurance companies follow the industry practice of reinsuring a portion of their exposure by ceding to reinsurers a portion of the premium received and a portion of the risk under the policies written. We purchase reinsurance to reduce the net liability on individual risks to predetermined limits and to protect us against catastrophic losses from a single catastrophe, such as a hurricane or tornado. We do not engage in any reinsurance transactions classified as finite risk reinsurance.
We account for premiums, written and earned, and losses incurred net of reinsurance ceded. The ceding of insurance does not legally discharge us from primary liability under our policies, and we must pay the loss if the reinsurer fails to meet its obligation. We periodically monitor the financial condition of our reinsurers to confirm that they are financially stable. We believe that all of our reinsurers are in an acceptable financial condition and there were no reinsurance balances at December 31, 20102011, for which collection is at risk that would result in a material impact on our Consolidated Financial Statements. The amount of reinsurance recoverable on paid losses totaled $2,590,000 and $2,207,000 at December 31, 2011 and 2010, respectively.
United Fire & Casualty Company Form 10-K | 2010
We also assume both property and casualty insurance from other insurance or reinsurance companies. Most of the business we have assumed is property insurance, with an emphasis on catastrophe coverage. The assumption of reinsurance is not a significant component of our property and casualty operations.
We limit our exposure on our assumed reinsurance contracts through selective renewal. However, we still have exposure related to the assumed reinsurance contracts that we have elected to continue writing and those that are in run-off status.
Premiums and loss and loss settlement expenses related to our ceded and assumed business is as f ollows:follows:
| | | (In Thousands) | | | | | | | | | | | |
| Years Ended December 31 | | 2010 | | 2009 | | 2008 | 2011 | | 2010 | | 2009 |
| Ceded Business | | | | | | | | | | | |
| Ceded premiums written | | $ | 32,511 | | | $ | 37,039 | | | $ | 37,127 | | $ | 43,921 |
| | $ | 32,511 |
| | $ | 37,039 |
|
| Ceded premiums earned | | 32,598 | | | 36,925 | | | 38,212 | | 45,604 |
| | 32,598 |
| | 36,925 |
|
| Loss and loss settlement expenses ceded | | 17,381 | | | 5,942 | | | 24,485 | | 39,335 |
| | 17,381 |
| | 5,942 |
|
| | | | | | | | | | | | |
| Assumed Business | | | | | | | | | | | |
| Assumed premiums written | | $ | 11,713 | | | $ | 7,820 | | | $ | 12,660 | | $ | 14,954 |
| | $ | 11,713 |
| | $ | 7,820 |
|
| Assumed premiums earned | | 11,668 | | | 7,904 | | | 12,953 | | 14,869 |
| | 11,668 |
| | 7,904 |
|
| Loss and loss settlement expenses assumed | | (4,276 | ) | | 5,818 | | | 4,122 | | 24,151 |
| | (4,276 | ) | | 5,818 |
|
In 2011, we renewed our participation in all of our assumed programs, while increasing the participation level on one contract, which generated the growth of our assumed premiums written and earned. Loss and loss settlement expenses increased significantly in 2011 due to several natural disasters, primarily in New Zealand and Japan, that impacted our assumed program.
In 2010, we increased our participation in assumed business, which led to the increase in assumed premium writings for the year. The decrease in 2009 was attributable to the termination of one of our assumed reinsurance contracts and our reduced participation level on another contract. We also concluded some of our assumed business in early 2009 that had been in run-off since late 2006.
For 2011, we have renewed our participation in all of our assumed programs, while increasing the participation level on one contract.
The benefit reported for lossesloss and loss settlement expenses incurred from assumed business in 2010 is the result of our process to evaluate the overall reserve adequacy of our property and casualty insurance segment. We re-estimated our reserve requirement for assumed business as our largest assumed reinsurance contract has been in run-off for many years and we believe any new claims on this contract willwould not be significant. In addition, our current participation level in assumed business iswas much lower than our historical participation level. The re-estimation of reserve estimates specific to the assumed reinsurance line of business was part of an overall review of reserves by line of business and did not have a direct impact on the net income reported for our property and casualty insurance segment in 2010.
United Fire Group, Inc. Form 10-K | 2011
Refer to Note 65 “Reserves for Loss and Loss Settlement Expenses” for an analysis of changes in our overall property and casualty insurance reserves for 2010.reserves.
United Fire & Casualty Company Form 10-K | 2010
Reinsurance Programs and Retentions
We have several programs that provide reinsurance coverage. This reinsurance coverage limits the risk of loss that we retain by reinsuring direct risks in excess of our retention limits. The following table provides a summary of our primary reinsurance programs, which remained the same for both 20102011 and 20092010. Retention amounts reflect the accumulated retentions and co-participation of all layers within a program.
| | (Dollars in Thousands) | | 2010 Reinsurance Program | | 2009 Reinsurance Program | |
| | | Stated | | | | | | Stated | | | | | | | | | | | | | |
| (In Thousands) | | 2011 & 2010 Reinsurance Programs |
| Type of Reinsurance | | Retention | | Limits | | Coverage | | Retention | | Limits | | Coverage | Stated Retention | | Limits | | Coverage |
| Casualty excess of loss | | $ | 2,000 | & nbsp; | | $ | 40,000 | | | 100% of $38,000 | | $ | 2,000 | | | $ | 20,000 | | | 100% of $18,000 | $ | 2,000 |
| | $ | 40,000 |
| | 100% of $38,000 |
| Property excess of loss | | 2,000 | | | 15,000 | | | 100% of $13,000 | | 2,000 | | �� | 12,000 | | | 100% of $10,000 | 2,000 |
| | 15,000 |
| | 100% of $13,000 |
| Umbrella excess of loss | | 1,000 | | | 10,000 | | | 100% of $9,000 | | 1,000 | | | 10,000 | | | 100% of $9,000 | |
| Surety excess of loss | | 1,500 | | | 28,000 | | | 91% of $26,500 | | 1,500 | | | 22,500 | | | 88% of $21,000 | 1,500 |
| | 28,000 |
| | 91% of $26,500 |
| Property catastrophe, excess | | 20,000 | | | 200,000 | | | 95% of $180,000 | | 20,000 | | | 200,000 | | | 95% of $180,000 | 20,000 |
| | 200,000 |
| | 95% of $180,000 |
| Boiler and machinery | | N/A | | | 50,000 | | | 100% of $50,000 | | N/A | | | 50,000 | | | 100% of $50,000 | N/A |
| | 50,000 |
| | 100% of $50,000 |
The following table provides a summary of Mercer Insurance Group's primary reinsurance programs for 2011:
|
| | | | | | | | | |
| (In Thousands) | 2011 Reinsurance Programs |
| Type of Reinsurance | Stated Retention | | Limits | | Coverage |
Casualty excess of loss (1) | $ | 1,000 |
| | $ | 5,000 |
| | 100% of $4,000 |
Property excess of loss (1) | 1,000 |
| | 10,000 |
| | 100% of $9,000 |
Umbrella excess of loss(1) | 1,000 |
| | 11,000 |
| | 75% of first $1,000 and 100% of remaining $9,000 |
| Surety excess of loss | 500 |
| | 4,500 |
| | 90% of $4,000 less $500 deductible |
| Property catastrophe, excess | 5,000 |
| | 55,000 |
| | 100% of $50,000 |
| Boiler and machinery | N/A |
| | 50,000 |
| | 100% of $50,000 |
(1) On August 1, 2011, Mercer Insurance Group's property and casualty reinsurance retention and limits were changed to match the rest of the property and casualty insurance segment.
If we incur catastrophe losses and loss settlement expenses that exceed the coverage limits of our reinsurance program, our property catastrophe program provides one guaranteed reinstatement. In such an instance, we are required to pay the r einsurersreinsurers a reinstatement premium at 100.0 percentequal to the full amount of the original premium, which will reinstate the full amount of reinsurance available under the property catastrophe program.
Life Insurance Segment
Ceded and Assumed Reinsurance
United Life purchases reinsurance to limit the dollar amount of any one risk of loss. Beginning in 2011, our retention on standard individual life cases is $300,000. Our accidental death benefit rider on an individual policy is reinsured at 100.0100 percent, up to a maximum benefit of $250,000. Our group cove rage,coverage, both life and accidental death and dismemberment, is reinsured at 50.0 percent. Catastrophe excess reinsurance coverage applies when three or more insureds die in a catastrophic accident. For catastrophe excess claims, we retain the first $1,000,000 of ultimate net loss and the reinsurer agrees to indemnify us for the excess up to a maximum of $5,000,000. We supplement this coverage when appropriate with “known concentration” coverage. Known concentration coverage is typically tied to a specific event and time period, with a threshold of a minimum number of lives involved in the event, minimum event deductible (stated retention limit) and a maximum payout.
United Fire Group, Inc. Form 10-K | 2011
Premiums and losses and loss settlement expenses related to our ceded business is as follows:
| | | (In Thousands) | | | | | | | | | | | |
| Years Ended December 31 | | 2010 | | 2009 | | 2008 | 2011 | | 2010 | | 2009 |
| Ceded Business | | | | | | | | | | | |
| Ceded insurance in-force | | $ | 959,145 | | | $ | 910,775 | | | $ | 836,784 | | $ | 974,556 |
| | $ | 959,145 |
| | $ | 910,775 |
|
| Ceded premiums earned | | 2,123 | | | 1,935 | | | 1,729 | | 2,318 |
| | 2,123 |
| | 1,935 |
|
| Loss and loss settlement expenses ceded | | 3,072 | | | 809 | | | 1,588 | | 3,786 |
| | 3,072 |
| | 809 |
|
The ceding of insurance does not legally discharge United Life from primary liability under its policies. United Life must pay the loss if the reinsurer fails to meet its obligations. We periodically monitor the financial condition of our reinsurers to confirm that they are financially stable. We believe that all of our reinsurers are in an acceptable financial condition. Approximately 99.0 percent of ceded life insurance in force as of December 31, 20102011, has been ceded to five reinsurers.
United Fire & Casualty CompanyGroup, Inc. Form 10-K | 20102011
|
|
NOTE 6.5. RESERVES FOR LOSS AND LOSS SETTLEMENT EXPENSES |
Because property and casualty insurance reserves are estimates of the unpaid portions of incurred losses that have been reported to us, as well as losses that have been IBNR,incurred but not reported ("IBNR"), the establishment of appropriate reserves, including reserves for catastrophes, is an inherently uncertain and complex process. The ultimate cost of losses and related loss settlement expenses may vary materially from recorded amounts, which are based on management’s best estimates. We regularly update our reserve estimates as new information becomes available and as events unfold that may affect the resolution of unsettled claims. Changes in pri orprior year reserve estimates, which may be material, are reported in losses and loss settlement expenses in the accompanying Consolidated Statements of Income in the period such changes are determined.
The following table provides an analysis of changes in our property and casualty loss and loss settlement expense reserves for 20102011, 20092010 and 20082009 (net of reinsurance amounts):
| | | (In Thousands) | | | | | | | | | | |
| Years Ended December 31 | 2010 | | 2009 | | 2008 | 2011 | | 2010 | | 2009 |
Gross liability for losses and loss settlement expenses
at beginning of year | $ | 606,045 | | | $ | 586,109 | | | $ | 496,083 | | $ | 603,090 |
| | $ | 606,045 |
| | $ | 586,109 |
|
| Ceded loss and loss settlement expenses | (33,754 | ) | | (52,508 | ) | | (38,800 | ) | (39,000 | ) | | (33,754 | ) | | (52,508 | ) |
Net liability for losses and loss settlement expenses
at beginning of year | $ | 572,291 | | | $ | 533,601 | | | $ | 457,283 | | $ | 564,090 |
| | $ | 572,291 |
| | $ | 533,601 |
|
| Reserves acquired in Mercer Insurance Group acquisition, net | | 252,598 |
| | — |
| | — |
|
| Beginning balance, as adjusted | | $ | 816,688 |
| | $ | 572,291 |
| | $ | 533,601 |
|
Losses and loss settlement expenses incurred
for claims occurring during | | | | | |
| |
| |
|
| Current year | $ | 335,315 | | | $ | 339,506 | | | $ | 392,801 | | $ | 468,926 |
| | $ | 335,315 |
| | $ | 339,506 |
|
| Prior years | (45,878 | ) | | 26,215 | | | 548 | | (61,095 | ) | | (45,878 | ) | | 26,215 |
|
| Total incurred | $ | 289,437 | | | $ | 365,721 | | | $ | 393,349 | | $ | 407,831 |
| | $ | 289,437 |
| | $ | 365,721 |
|
Losses and loss settlement expense payments
for claims occurring during | | | | | |
| |
| |
|
| Current year | $ | 132,592 | | | $ | 131,507 | | | $ | 176,882 | | $ | 253,175 |
| | $ | 132,592 |
| | $ | 131,507 |
|
| Prior years | 165,046 | | | 195,524 | | | 140,149 | | 146,653 |
| | 165,046 |
| | 195,524 |
|
| Total paid | $ | 297,638 | | | $ | 327,031 | | | $ | 317,031 | | $ | 399,828 |
| | $ | 297,638 |
| | $ | 327,031 |
|
Net liability for losses and loss settlement expenses
at end of year | $ | 564,090 | | | $ | 572,291 | | | $ | 533,601 | | $ | 824,692 |
| | $ | 564,090 |
| | $ | 572,291 |
|
| Ceded loss and loss settlement expenses | 39,000 | | | 33,754 | | | 52,508 | | 120,359 |
| | 39,000 |
| | 33,754 |
|
Gross liability for losses and loss settlement expenses
at end of year | $ | 603,090 | | | $ | 606,045 | | | $ | 586,109 | | $ | 945,051 |
| | $ | 603,090 |
| | $ | 606,045 |
|
The favorable development in 2011 and 2010 on claims that occurred in prior years, resulted from a re-estimation of loss reserves recorded at December 31 of the prior year. This re-estimation is primarily attributable to both the payment of claims in amounts less than the amounts reserved and changes in loss reserves mainly in the other liability and commercial automobile lines due to additional information on individual claims that we received after the reserves for those claims had been established. Another factor contributing to the redundancy recognized is the development of reserves for IBNR loss and loss settlement expenses at a level significantly less than anticipated at December 31 of the prior year. We attribute the favorable development to the fact that we have experienced overall lower levels of claims frequency and severity during recent years.
The unfavorable development in 2009 and 2008 was attrib utableattributable to an increase we made in our prior accident year loss reserves due to additional development from Hurricane Katrina, which included a federal court ruling and subsequent judgment of $28,868,000, which we paid in 2009. We also experienced deterioration in our other liability lines of business, which includes claims for construction defects.
United Fire & Casualty CompanyGroup, Inc. Form 10-K | 20102011
We did not alter our reserving process during 20102011. However, conditions and trends that have affected the reserve development for a given year may change. Therefore, such development cannot be used to extrapolateproject future reserve redundancies or deficiencies.
We are not aware of any significant contingent liabilities related to environmental issues. Because of the type of property coverage we write, we have potential exposure to environmental pollution, mold and asbestos claims. Our underwriters are aware of these exposures and use riders or endorsements to limit exposure.
United Fire & Casualty Company Form 10-K | 2010
|
|
NOTE 7.6. STATUTORY REPORTING, CAPITAL REQUIREMENTS AND DIVIDENDS AND RETAINED EARNINGS RESTRICTIONS |
Statutory capital and surplus in regards to policyholders at December 31, 20102011, 20092010 and 20082009 and statutory net income (loss) for the years then ended are as follows:
| | | (In Thousands) | Statutory Capital and Surplus | | Statutory Net Income (Loss) | Statutory Capital and Surplus | | Statutory Net Income (Loss) |
| 2011 | | | | |
| Property and casualty (1) | | $ | 565,843 |
| | $ | 10,529 |
|
| Life, accident and health | | 167,164 |
| | 6,180 |
|
| 2010 | | | | | | |
| Property and casualty (1) | $ | 594,308 | | | $ | 52,803 | | $ | 594,308 |
| | $ | 52,803 |
|
| Life, accident and health | 158,379 | | | 13,443 | | 158,379 |
| | 13,443 |
|
| 2009 | | | | | | |
| Property and casualty (1) | $ | 556,265 | | | $ | (12,350 | ) | $ | 556,265 |
| | $ | (12,350 | ) |
| Life, accident and health | 160,179 | | | 3,523 | | 160,179 |
| | 3,523 |
|
| 2008 | | | | |
| Property and casualty (1) | $ | 553,058 | | | $ | (3,203 | ) | |
| Life, accident and health | 157,003 | | | 646 | | |
| |
| (1) | Because United Fire & Casualty Company owns United Life Insurance Company, the property and casualty statutory capital an dand surplus includes life, accident and health statutory capital and surplus, and therefore represents our total consolidated statutory capital and surplus. |
All states require domiciled insurance companies to prepare statutory-basis financial statements in conformity with the National Association of Insurance Commissioner’s (“NAIC”) Accounting Practices and Procedures Manual, subject to any deviations prescribed or permitted by the applicable insurance commissioner and/or director. Statutory accounting practices primarily differ from GAAP in that policy acquisition and certain sales inducement costs are charged to expense as incurred, life insurance reserves are established based on different actuarial assumptions and the values reported for investments, pension obligations and deferred taxes are established on a different basis.
Our property and casualty and life insurance subsidiaries are required to file financial statements with state regulatory authorities. The accounting principles used to prepare these statutory-basis financial statements follow prescribed or permitted accounting practices that differ from GAAP. Prescribed statutory accounting principles include state laws, regulations and general administrative rules issued by the state of domicile, as well as a variety of publications and manuals of the NAIC. Permitted accounting practices encompass all accounting practices not prescribed, but allowed by the state of domicile. No permitted accounting practices were used to prepare our statutory-basis financial statements during 20102011, 20092010 and 20082009.
We are directed by the state insurance departments’ solvency regulations to calculate a required minimum level of statutory capital and surplus based on insurance risk factors. The risk-based capital results are used by the NAIC and state insurance departments to identify companies that merit regulatory attention or the initiation of regulatory action. Both United Life and United Fire & Casualty Company and its property and casualty insurance subsidiaries and affiliate had statutory capital and surplus in regards to policyholders well in excess of their required levels at December 31, 20102011.
United Fire & Casualty CompanyGroup, Inc. Form 10-K | 20102011
The State of Iowa Insurance Department governs the amount of dividends that we may pay to stockholders without prior approval by the department. Based on these restrictions, we are allowed to make a maximum of $59,431,00056,584,000 in dividend distributions to stockholders in 20112012 without prior approval. We paid dividends of $15,774,00015,507,000, $15,951,00015,774,000 and $16,162,00015,951,000 in 20102011, 20092010 and 20082009, respectively. Dividend payments by the insurance subsidiaries to United Fire Group, Inc. are subject to similar restrictions in the states in which they are domiciled. In 2011, United Fire & Casualty Company received dividends from Addison Insurance Company, American Indemnity Financial Corporation, and Lafayette Insurance Company for $3,000,000, $1,700,000 and $6,750,000, respectively. In 2010 and 2009, United Fire & Casualty Company received a dividend from United Life of $1 5,000,000, $4,000,000$15,000,000 and $4,000,000, in 2010, 2009 and 2008, respectively. These intercompany dividend payments are eliminated in our Consolidated Financial Statements.
|
|
NOTE 8.7. FEDERAL INCOME TAX |
Federal income tax expense (benefit) is composed of the following:
| | | (In Thousands) | | &n bsp; | | | | | | | | | |
| Years Ended December 31 | | 2010 | | 2009 | | 2008 | 2011 | | 2010 | | 2009 |
| Current | | $ | 11,070 | | | $ | (7,132 | ) | | $ | (8,658 | ) | $ | (3,517 | ) | | $ | 11,070 |
| | $ | (7,132 | ) |
| Deferred | | (200 | ) | | (11,133 | ) | | (11,414 | ) | (9,209 | ) | | (200 | ) | | (11,133 | ) |
| Total | | $ | 10,870 | | | $ | (18,265 | ) | | $ | (20,072 | ) | $ | (12,726 | ) | | $ | 10,870 |
| | $ | (18,265 | ) |
A reconciliation of income tax expense (benefit) computed at the applicable federal tax rate of 35 percent to the amount recorded in the accompanying Consolida tedConsolidated Statements of Income is as follows:
| | | (In Thousands) | | | | | | | | | | | |
| Years Ended December 31 | | 2010 | | 2009 | | 2008 | 2011 | | 2010 | | 2009 |
| Computed expected income tax expense (benefit) | | $ | 20,434 | | | $ | (10,048 | ) | | $ | (11,598 | ) | $ | (4,451 | ) | | $ | 20,434 |
| | $ | (10,048 | ) |
| Tax-exempt municipal bond interest income | | (7,287 | ) | | (7,411 | ) | | (6,954 | ) | (7,908 | ) | | (7,287 | ) | | (7,411 | ) |
| Nontaxable dividend income | | (751 | ) | | (788 | ) | | (1,219 | ) | (859 | ) | | (751 | ) | | (788 | ) |
| Valuation allowance reduction | | (1,643 | ) | | — | | | — | | — |
| | (1,643 | ) | | — |
|
| Acquisition related expenses | | 860 |
| | 403 |
| | — |
|
| Other, net | | 117 | | | (18 | ) | | (301 | ) | (368 | ) | | (286 | ) | | (18 | ) |
| Federal income tax expense (benefit) | | $ | 10,870 | | | $ | (18,265 | ) | | $ | (20,072 | ) | $ | (12,726 | ) | | $ | 10,870 |
| | $ | (18,265 | ) |
United Fire & Casualty CompanyGroup, Inc. Form 10-K | 20102011
The significant components of the net deferred tax liability at December 31, 20102011 and 20092010, are as follows:
| | | (In Thousands) | | | | | | |
| December 31 | 2010 | | 2009 | 2011 | | 2010 |
| Deferred tax liabilities | | | | | | |
| Net unrealized appreciation on investment securities | $ | 68,330 | | | $ | 56,715 | | |
| Net unrealized appreciation on investment securities: | |
|
| |
|
|
| Equity securities | | 31,812 |
| | 33,448 |
|
| All other securities | | 47,026 |
| | 34,882 |
|
| Deferred policy acquisition costs | 26,279 | | | 28,276 | | 32,795 |
| | 26,279 |
|
| Prepaid pension cost | 2,709 | | | 3,384 | | 3,053 |
| | 2,709 |
|
| Net bond discount accretion and premium amortization | 3,161 | | | 2,755 | | 3,678 |
| | 3,161 |
|
| Depreciation | | 2,844 |
| | 632 |
|
Revaluation of investment basis (1) | | 5,734 |
| | — |
|
Identifiable intangible assets (1) | | 5,328 |
| | — |
|
| Other | 1,592 | | | 2,076 | | 2,594 |
| | 960 |
|
| Gross deferred tax liability | $ | 102,071 | | | $ | 93,206 | | $ | 134,864 |
| | $ | 102,071 |
|
| Deferred tax assets | | | | | | |
| Financial statement reserves in excess of income tax reserves | $ | 30,476 | | | $ | 30,958 | | $ | 42,273 |
| | $ | 30,476 |
|
| Unearned premium adjustment | 13,842 | | | 14,225 | | 19,771 |
| | 13,842 |
|
| Net operating loss carryforwards | 4,004 | | | 5,647 | | 8,055 |
| | 4,004 |
|
| Underfunded benefit plan obligation | 13,823 | | | 11,762 | | 22,503 |
| | 13,823 |
|
| Postretirement benefits other than pensions | 7,597 | | | 6,802 | | 8,599 |
| | 7,597 |
|
| Investment impairments | 8,824 | | | 9,829 | | 8,124 |
| | 8,824 |
|
Contingent ceding commission accrual (1) | | 6,672 |
| | — |
|
| Salvage and subrogation | 1,748 | | | 1,515 | | 1,526 |
| | 1,748 |
|
| Compensation expense related to stock options | 2,750 | | | 2,130 | | 3,392 |
| | 2,750 |
|
| Other | 3,197 | | | 4,765 | | 3,781 |
| | 3,197 |
|
| Gross deferred tax asset | $ | 86,261 | | | $ | 87,633 | | $ | 124,696 |
| | $ | 86,261 |
|
| Valuation allowance | (4,004 | ) | | (5,647 | ) | (3,456 | ) | | (4,004 | ) |
| Deferred tax asset | $ | 82,257 | | | $ | 81,986 | | $ | 121,240 |
| | $ | 82,257 |
|
| Net deferred tax liability | $ | 19,814 | | | $ | 11,220 | | $ | 13,624 |
| | $ | 19,814 |
|
(1) Related to our acquisition of Mercer Insurance Group
We have a gross deferred tax asset forDue to our determination that we may not be able to fully realize the benefits of the net operating loss carryforwards totaling $12,520,000 at December 31, 2010. Net operating loss carryforwards totaling $1,565,000 expirelosses ("NOLs") acquired in 2011 and canthe purchase of American Indemnity Financial Corporation, which are only be usedavailable to offset the future taxable income of our property and casualty insurance segment. We are required to establish a valuation allowance for any portion of the gross deferred tax asset thatoperations, we believe may not be realized. Accordingly, w ehave recorded a valuation allowance of $4,004,000against the NOLs that totaled $3,456,000 at December 31, 20102011. AsBased on a yearly review, we determine thatwhether the benefit of these net operating lossesthe NOLs can be realized, and, if so, the related reductiondecrease in the deferred tax asset valuation allowance will beis recorded as a reduction to ourcurrent federal income tax expenseexpense. If NOLs expire during the year, the decrease in the periodvaluation allowance is offset with a corresponding decrease to the deferred income tax asset. The valuation allowance was reduced by $548,000 in 2011 due to the expiration of such determination.$1,643,000 in NOLs. No portion of the NOLs will expire in 2012.
|
|
NOTE 9.8. EMPLOYEE BENEFITS |
We offer various benefits to our employees including a noncontributory defined benefit pension plan, an employee/retiree health and dental benefit plan, a profit-sharing plan and an employee stock ownership plan.
Pension and Other Postretirement Benefit Plans
We offer a noncontributory defined benefit pension plan in which all of our employees are eli gibleeligible to participate after they have completed one year of service, attained 21 years of age and have met the hourly service
United Fire Group, Inc. Form 10-K | 2011
requirements. Retirement benefits under our pension plan are based on the number of years of service and level of compensation. Our policy to fund the pension plan on a current basis to not less than the minimum amounts required by the Employee Retirement Income Security Act of 1974, as amended, and the Internal Revenue Code of 1986, as amended, is to assure that plan assets will be adequate to provide retirement benefits. We estimate that we will contribute approximately $6,000,0007,000,000 to the pension plan in 20112012.
We also offer a health and dental benefit plan (the “other retiree plan”“postretirement benefit plan") to all of our eligible employees and retirees which comprisesthat consists of two programs: (1) the self-funded retiree health and dental benefit plan and (2) the self-funded employee health and dental benefit plan. The other retireepostretirement benefit plan provides health and dental benefits to our employees
United Fire & Casualty Company Form 10-K | 2010
and retirees (and covered dependents) who have met the service and participation requirements stipulated by the other retireepostretirement benefit plan. The other retiree plan’s contractthird party administrators for the postretirement benefit plan are responsible for making medical and dental care benefit payments. Participants are required to submit claims for reimbursement or payment to the claims administrator within twelve months after the end of the calendar year in which the charges were incurred. An unfunded benefit obligatio nobligation is reported for the other retireepostretirement benefit plan in the accompanying Consolidated Balance Sheets, which relates to our postretirement benefits program.Sheets.
Investment Policies and Strategies
Our investment policy and objective for the pension plan is to generate long-term capital growth and income, by way of a diversified investment portfolio along with appropriate employer contributions, which will allow us to provide for the pension plan’s benefit obligation.
The investments held by the pension plan at December 31, 20102011, include the following asset categories:
| |
• | Fixed maturity securities, which may include bonds and convertible securities. |
| |
• | Equity securities, which may include various types of stock, such as large-cap, mid-cap and small-cap stocks, international stocks and United Fire common stock. |
| |
• | An arbitrage fund, which is a fund that takes advantage of price discrepancies, primarily equity securities, for the same asset in different markets. |
| |
• | A group annuity contract that is administered by United Life. |
| |
• | Cash and cash equivalents, which include money market funds. |
Fixed maturity securities, which may include bonds and convertible securities.
Equity securities, which may include various types of stock, such as large-cap, mid-cap and small-cap stocks, international stocks and our common stock.
An arbitrage fund, which is a fund that takes advantage of price discrepancies, primarily equity securities, for the same asset in different markets.
A group annuity contract that is administered by United Life.
Cash and cash equivalents, which include money market funds.
We have an internal investment/retirement committee, which includes our Chief Executive Officer, Chief Investment Officer, and Executive Vice President, all of whom receive monthly information on the value of the pension plan assets and their performance. Quarterly, the committee meets to review and discuss the performance of the pension plan assets as well as the allocation of investments within the pension plan.
As of December 31, 20102011, we had six external investment managers that are allowed to exercise investment discretion, subject to limitations, if any, established by the investment/retirement committee. We utilize multiple investment managers in order to maximize the pension plan’s investment return while minimizing risk. None of our investment managers uses leverage in managing the pension plan. Annually, the investment/retirement committee meets with each investment manager to review the investment manager’s goals, objectives and the performance of the assets they manage. The decision to establish or terminate a relationship with an investment manager is at the discretion of our investment/retirement committee.
We consider historical experience for comparable investments and the target allocations we have established for the various asset categories of the pension plan to determine the expected long-term rate of return, which is an assumption as to the average rate of earnings expected on the pension plan funds invested, or to be invested, by the pension plan, to provide for the settlement of benefits included in the projected pension benefit obligation. Investment securit ies,securities, in general, are exposed to various risks, such as fluctuating interest rates, credit standing of the issuer of the security and overall market volatility. Annually, we perform an analysis of expected long-term rates of return based on the composition and allocation of our pension plan assets and recent economic conditions. We use
United Fire Group, Inc. Form 10-K | 2011
an external actuarial firm to verify that the expected long-term rate of return is reasonable.
United Fire & Casualty Company Form 10-K | 2010
The following is a summary of the pension plan’s actual and target asset allocations at December 31, 20102011 and 20092010, by asset category:
| | | Pension Plan Assets | | | | | Target |
|
|
|
| Target |
| (In Thousands) | 2010 | % of Total | 2009 | % of Total | Allocation | 2011 | % of Total | 2010 | % of Total | Allocation |
| Fixed maturity securities | &nbs p; | | | | |
|
|
|
|
|
| Corporate bonds | $ | 3,686 | | 5.9 | % | $ | 1,617 | | 2.9 | % | 0 - 10% | $ | 4,000 |
| 6.1 | % | $ | 3,686 |
| 5.9 | % | 0 - 10% |
| Redeemable preferred stock | 1,524 | | 2.4 | | 880 | | 1.6 | | 0 - 5% | 2,067 |
| 3.2 |
| 1,524 |
| 2.4 |
| 0 - 5% |
| U.S. government securities | — | | — | | 2,992 | | 5.5 | | 0 - 10% | — |
| — |
| — |
| — |
| 0 - 10% |
| Equity securities | | | | | |
|
|
|
|
|
| United Fire common stock | 4,510 | | 7.2 | | 3,684 | | 6.7 | | 0 - 10% | |
| United Fire Group, Inc. common stock | | 4,078 |
| 6.3 |
| 4,510 |
| 7.2 |
| 0 - 10% |
| Unaffiliated common stock | 35,018 | | 55.8 | | 28,133 | | 51.3 | | 50 - 70% | 34,085 |
| 52.2 |
| 35,018 |
| 55.8 |
| 50 - 70% |
| Arbitrage fund | 4,073 | | 6.5 | | — | | — | | 0 - 10% | 5,239 |
| 8.0 |
| 4,073 |
| 6.5 |
| 0 - 10% |
| United Life annuity | 9,376 | | 15.0 | | 8,910 | | 16.3 | | 10 - 20% | 7,803 |
| 12.0 |
| 9,376 |
| 15.0 |
| 10 - 20% |
| Cash and cash equivalents | 4,543 | | 7.2 | | 8,606 | | 15.7 | | 10 - 25% | 7,995 |
| 12.2 |
| 4,543 |
| 7.2 |
| 10 - 25% |
| Total plan assets | $ | 62,730 | | 100.0 | % | $ | 54,822 | | 100.0 | % | | $ | 65,267 |
| 100.0 | % | $ | 62,730 |
| 100.0 | % |
|
The investment return expectations for the pension plan a reare used to develop the asset allocation based on the specific needs of the pension plan. Accordingly, fixed maturity and equity securities comprise the largest portion of our pension plan assets, as they yield the highest rate of return. The United Life annuity, which is the secondthird largest asset category and was originally written by our life insurance subsidiary in 1976, provides a guaranteed rate of return. The interest rate on the group annuity contract is determined annually.
The availability of assets held in cash and cash equivalents enables the pension plan to mitigate market risk that is associated with other types of investments and allows the pension plan to maintain liquidity both for the purpose of making future benefit payments to participants and their beneficiaries and for future investment opportunities.
The pension plan also hashad a significant investment in United Fire Group, Inc. common stock. We believe that even though market fluctuations impact the fair value of this investment, the target allocation is reasonable and the shares held have historically generated investment income, through dividend payments, for the pension plan. Dividends on shares of United Fire Group, Inc. common stock totaled $121,000$121,000 for 20102011, 20092010 and 20082009, respectively.
Valuation of Investments
Fixed Maturity and Equity Securities
Investments in fixed maturity and equity securities are stated at fair value based upon quoted market prices reported on recognized securities exchanges on the last business day of the year. Purchases and sales of securities are recorded as of the trade date.
United Life Annuity
The United Life group annuity contract, which is a deposit administration contract, is stated at contract value as determined by United Life. Under the group annuity contract, the plan's investment account is credited with compound interest on the average account balance for the year. The interest rate is equivalent to the ratio of net investment income to mean assets of United Life, net of investment expenses.
Cash and Cash Equivalents
Cash and cash equivalents primarily consist of insured cash and money market funds held with various financial institutions. Interest is earned on a daily basis. The fair value of these funds approximates their co stcost basis due to their short-term nature.
United Fire & Casualty CompanyGroup, Inc. Form 10-K | 2 0102011
United Fire Group, Inc. Common Stock
The investment in United Fire Group, Inc. common stock is stated at fair value based upon the closing sales price reported on a recognized securities exchange on the last business day of the year or, when no sales are reported, the bid price on that date. Our common stock is actively traded.
Arbitrage Fund
The fair value of the arbitrage fund is determined based on its net a ssetasset value, which is obtained from the custodian and determined monthly with issuances and redemptions of units of the fund made, based on the net asset value per unit as determined on the valuation date. We have not adjusted the net asset value provided by the custodian.
Fair Value Measurement
The following tables present the categorization of the pension plan’s assets measured at fair value on a recurring basis at December 31, 20102011 and 2009:2010:
| | (In Thouands) | | | Fair Value Measurements | |
| | (In Thousands) | | | | Fair Value Measurements |
| Description | December 31, 2010 | | Level 1 | | Level 2 | | Level 3 | December 31, 2011 | | Level 1 | | Level 2 | | Level 3 |
| Fixed maturity securities | | | | | | | | | | | | | | |
| Corporate bonds | $ | 3,686 | | | $ | — | | | $ | 3,686 | | | $ | — | | $ | 4,000 |
| | $ | — |
| | $ | 4,000 |
| | $ | — |
|
| Redeemable preferred stock | 1,524 | | | 1,524 | | &nbs p; | — | | | — | | 2,067 |
| | 2,067 |
| | — |
| | — |
|
| Equity securites | | | | | | | | |
| United Fire common stock | 4,510 | | | 4,510 | | | — | | | — | | |
| Equity securities | | | | | | | | |
| United Fire Group, Inc. common stock | | 4,078 |
| | 4,078 |
| | — |
| | — |
|
| Unaffiliated common stock | 35,018 | | | 35,018 | | | — | | | — | | 34,085 |
| | 34,085 |
| | — |
| | — |
|
| Arbitrage fund | 4,073 | | | — | | | 4,073 | | | | | 5,239 |
| | — |
| | 5,239 |
| |
|
|
| Money market funds | 2,354 | | | 2,354 | | | — | | | — | | 4,763 |
| | 4,763 |
| | — |
| | — |
|
| Total assets measured at fair value | $ | 51,165 | | | $ | 43,406 | | | $ | 7,759 | | | $ | — | | $ | 54,232 |
| | $ | 44,993 |
| | $ | 9,239 |
| | $ | — |
|
| | (In Thouands) | | | Fair Value Measurements | |
| | (In Thousands) | | | | Fair Value Measurements |
| Description | December 31, 2009 | | Level 1 | | Level 2 | | Level 3 | December 31, 2010 | | Level 1 | | Level 2 | | Level 3 |
| Fixed maturity securities | | | | | | | | | | | | | | |
| Corporate bonds | $ | 1,617 | | | $ | — | | | $ | 1,617 | | | $ | — | | $ | 3,686 |
| | $ | — |
| | $ | 3,686 |
| | $ | — |
|
| Redeemable preferred stock | 551 | | | 551 | | | — | | | — | | 1,524 |
| | 1,524 |
| | — |
| | — |
|
| U.S. Treasury and agenc y | 2,992 | | | 2,992 | | | — | | | — | | |
| Equity securites | | | | | | | | |
| United Fire common stock | 3,684 | | | 3,684 | | | — | | & nbsp; | — | | |
| Equity securities | |
| |
| |
| |
|
| United Fire Group, Inc. common stock | | 4,510 |
| | 4,510 |
| | — |
| | — |
|
| Unaffiliated common stock | 28,462 | | | 28,462 | | | — | | | — | | 35,018 |
| | 35,018 |
| | — |
| | — |
|
| Arbitrage fund | | 4,073 |
| | — |
| | 4,073 |
| |
|
| Money market funds | 6,206 | | | 6,206 | | | — | | | — | | 2,354 |
| | 2,354 |
| | — |
| | — |
|
| Total assets measured at fair value | $ | 43,512 | | | $ | 41,895 | | | $ | 1,617 | | | $ | — | | $ | 51,165 |
| | $ | 43,406 |
| | $ | 7,759 |
| | $ | — |
|
There were no transfers of assets in or out of Level 1 or Level 2 during the period.
The fair value of investments categorized as Level 1 is based on quote dquoted market prices that are readily and regularly available.
The fair value of fixed maturity securities categorized as Level 2 is determined by management based on fair value information reported in the custodial statements, which is derived from recent trading activity of the underlying security in the financial markets. These securities represent various taxable bonds held by the pension plan.
United Fire & Casualty CompanyGroup, Inc. Form 10-K | 20102011
The fair value of the arbitrage fund is categorized as Level 2 since there are no restrictions as to the pension plan's ability to redeem its investment at the net asset value of the fund as of the reporting date.
Estimat esEstimates and Assumptions
The preparation of financial statements in conformity with GAAP requires us to make various estimates and assumptions that affect the reporting of net periodic benefit cost, plan assets and plan obligations for all planseach plan at the date of the financial statements. Actual results could differ from these estimates. One significant estimate relates to the calculation of plan obligationsthe benefit obligation for all plans.each plan. We annually establish the discount rate, which is an estimate of the interest rate at which thethese benefits for all plans could be effectively settled, that is used to determine the present value of the respective plan’s benefit obligations as of December 31. In estimating the discount rate, we look to rates of return on high-quality, fixed-income investments currently available and expected to be available during the period to maturity of the respecti verespective plan’s benefit obligations.
Assumptions Used to Determine Benefit Obligations
The following actuarial assumptions were used to determine the reported plan benefit obligations at December 31:
| | | Weighted-average assumptions as of | | Pension Benefits | | Other Retiree Benefits | Pension Benefits | | Postretirement Benefits |
| December 31 | | 2010 | | 2009 | | 2010 | | 2009 | 2011 | | 2010 | | 2011 | | 2010 |
| Discount rate | | 5.50 | % | | 6.00 | % | | 5.50 | % | | 5.75 | % | 4.50 | % | | 5.50 | % | | 4.50 | % | | 5.50 | % |
| Rate of compensation increase | | 4.00 | | | 4.00 | | | N/A | | | N/A | | 3.75 |
| | 4.00 |
| | N/A |
| | N/A |
|
The low interest rate environment has resulted in a significant decline in the discount rates we use to value our respective plan's benefit obligations. As a result, the valuation of the benefit obligations has increased, which has reduced the funded status of those plans. A prolonged low interest rate environment could require a higher level of cash contributions to fund our pension plan.
Assumptions Used to Determine Net Periodic Benefit Cost
The following actuarial assumptions were used at January 1 to determine our reported net periodic benefit costs for the year ended December 31:
| | | Weighted-average assumptions as of | | Pension Benefits | | Other Retiree Benefits | Pension Benefits | | Postretirement Benefits |
| January 1 | | 2010 | | 2009 | | 2008 | | 2010 | | 2009 | | 2008 | 2011 | | 2010 | | 2009 | | 2011 | | 2010 | | 2009 |
| Discount rate | | 5.50 | % | | 6.00 | % | | 5.75 | % | | 5.50 | % | | 6.00 | % | | 5.75 | % | 4.50 | % | | 5.50 | % | | 6.00 | % | | 4.50 | % | | 5.50 | % | | 6.00 | % |
| Expected long-term rate of return on plan assets | | 8.25 | % | | 8.25 | % | | 8.25 | % | | N/A | | | N/A | | | N/A | | 8.00 |
| | 8.25 |
| | 8.25 |
| | N/A |
| | N/A |
| | N/A |
|
| Rate of compensation increase | | 4.00 | % | | 4.00 | % | | 4.00 | % | | N/A | | | N/A | | | N/A | | 3.75 |
| | 4.00 |
| | 4.00 |
| | N/A |
| | N/A |
| | N/A |
|
Assumed Health Care Cost Trend Rates
| | | | Health Care Benefits | | Dental Claims | Health Care Benefits | | Dental Claims |
| Years Ended December 31 | 2010 | | 2009 | | 2010 | | 2009 | 2011 | | 2010 | | 2011 | | 2010 |
| Health care cost trend rates assumed for next year | 10.00 | % | | 9.00 | % | | 5.25 | % | | 5.25 | % | 10.00 | % | | 10.00 | % | | 5.25 | % | | 5.25 | % |
| Rate to which the health care trend rate is assumed to decline (ultimate trend rate) | 5.25 | % | | 5.25 | % | | N/A | | | N/A | | 5.25 | % | | 5.25 | % | | N/A |
| | N/A |
|
| Year that the rate reaches the ultimate trend rate | 2016 | | | 2014 | | | N/A | | | N/A | | 2017 |
| | 2016 |
| | N/A |
| | N/A |
|
United Fire Group, Inc. Form 10-K | 2011
Assumed health care cost trend rates have a significant effect on the amounts reported for the other retireepostretirement benefit plan. A 1.0 percent change in assumed health care cost trend rates would have the following effects:
| | | | | | | | |
| (In Thousands) | | 1% Increase | | 1% Decrease |
| Effect on the net periodic postretirement health care benefit cost | | $ | 632 | | | $ | (499 | ) |
| Effect on the accumulated postretirement benefit obligation | | 5,247 | | | (4,229 | ) |
|
| | | | | | | | |
| (In Thousands) | | 1% Increase | | 1% Decrease |
| Effect on the net periodic postretirement health care benefit cost | | $ | 807 |
| | $ | (631 | ) |
| Effect on the accumulated postretirement benefit obligation | | 7,054 |
| | (5,632 | ) |
121
United Fire & Casualty Company Form 10-K | 2010
Benefit Obligation and Funded Status
The following table provides a reconciliation of benefit obligations, plan assets and funded status of our plans:
| | | (In Thousands) | | Pension Benefits | | Other Retiree Benef its | Pension Benefits | | Postretirement Benefits |
| Years Ended December 31 | | 2010 | | 2009 | | 2010 | | 2009 | 2011 | | 2010 | | 2011 | | 2010 |
Reconciliation of benefit obligation (1) | &nb sp; | | | | | | | | | | | | | | |
| Benefit obligation at begin ning of year | | $ | 76,410 | | | $ | 70,242 | | | $ | 23,096 | | | $ | 18,958 | | |
| Benefit obligation at beginning of year | | $ | 88,723 |
| | $ | 76,410 |
| | $ | 28,886 |
| | $ | 23,096 |
|
| Service cost | | 2,853 | | | 2,747 | | | 1,514 | | | 1,347 | | 3,166 |
| | 2,853 |
| | 1,985 |
| | 1,514 |
|
| Interest cost | | 4,569 | | | 4,218 | | | 1,433 | | | 1,222 | | 4,761 |
| | 4,569 |
| | 1,590 |
| | 1,433 |
|
| Actuarial loss | | 7,489 | | | 1,430 | | | 3,338 | | | 2,155 | | 17,379 |
| | 7,489 |
| | 4,421 |
| | 3,338 |
|
| Benefit payments and adjustments | | (2,598 | ) | | (2,227 | ) | | (495 | ) | | (586 | ) | (2,689 | ) | | (2,598 | ) | | (548 | ) | | (495 | ) |
| Benefit obligation at end of year | | $ | 88,723 | | | $ | 76,410 | | | $ | 28,886 | | | $ | 23,096 | | $ | 111,340 |
| | $ | 88,723 |
| | $ | 36,334 |
| | $ | 28,886 |
|
| Reconciliation of fair value of plan assets | | | | | | | | | | | | | | | |
| Fair value of pla n assets at beginning of year | | $ | 54,822 | | | $ | 48,122 | | | $ | — | | | $ | — | | |
| Fair value of plan assets at beginning of year | | $ | 62,730 |
| | $ | 54,822 |
| | $ | — |
| | $ | — |
|
| Actual return on plan assets | | 7,145 | | | 4,927 | | | — | | | — | | (74 | ) | | 7,145 |
| | — |
| | — |
|
| Employer contributions | | 3,361 | | | 4,000 | | | 495 | | | 586 | | 5,300 |
| | 3,361 |
| | 548 |
| | 495 |
|
| Benefit payments and adjustments | | (2,598 | ) | | (2,227 | ) | | (495 | ) | | (586 | ) | (2,689 | ) | | (2,598 | ) | | (548 | ) | | (495 | ) |
| Fair value of plan assets at end of year | | $ | 62,730 | | | $ | 54,822 | | | $ | — | | | $ | — | | $ | 65,267 |
| | $ | 62,730 |
| | $ | — |
| | $ | — |
|
| Funded status at end of year | | $ | (25,993 | ) | | $ | (21,588 | ) | | $ | (28,886 | ) | | $ | (23,096 | ) | $ | (46,073 | ) | | $ | (25,993 | ) | | $ | (36,334 | ) | | $ | (28,886 | ) |
| |
| (1) | For the pension plan, the benefit obligation is the projected benefit obligation. For the other retireepostretirement benefit plan, the benefit obligation is the accumulated postretirement benefit obl igation.obligation. |
Our accumulated pension benefit obligation was $73,762,000$93,769,000 and $63,431,000$73,762,000 at December 31, 20102011 and 20092010, respectively.
The following table displays the effect that the unrecognized prior service cost and unrecognized actuarial loss of our plans had on accumulated other comprehensive income (“AOCI”), as reported in the accompanying Consolidated Balance Sheets:
| | | (In Thousands) | | Pension Benefits | | Other Retiree Benefits | | Pension Benefits | | Postretirement Benefits |
| Years Ended December 31 | | 2010 | | 2009 | | 2010 | | 2009 | | 2011 | | 2010 | | 2011 | | 2010 |
| Amounts recognized in AOCI | | | | | | | | | | | | | | | | |
| Unrecognized prior service cost | | $ | 18 | | | $ | 29 | | | $ | (38 | ) | | $ | (92 | ) | | $ | 8 |
| | $ | 18 |
| | $ | (6 | ) | | $ | (38 | ) |
| Unrecognized actuarial loss | | 32,719 | | | 30,212 | | | 6,795 | | | 3,457 | | | 53,076 |
| | 32,719 |
| | 11,216 |
| | 6,795 |
|
| Total amounts recognized in AOCI | | $ | 32,737 | | | $ | 30,241 | | | $ | 6,757 | | | $ | 3,365 | | | $ | 53,084 |
| | $ | 32,737 |
| | $ | 11,210 |
| | $ | 6,757 |
|
The unrecognized prior service cost is being amortized on a straight-line basis over an average period of approximately 10 years. We anticipate amortization of prior service costs and net actuarial losses for our pension plan in 20112012 to be $11,000$8,000 and $2,301,000,$4,450,000, respectively. We anticipate amortization of our prior service costs and net actuarial losses for our postretirement benefit plan in 20112012 to be $(32,000)$(6,000) and $360,000,$726,000, respectively.
United Fire & Casualty CompanyGroup, Inc. Form 10-K | 20102011
Net Periodic Benefit Cost
The components of the net periodic benefit cost for our plans are as follows:
| | | (In Thousands) | | Pension benefits | | Other Retiree Benefits | | Pension benefits | | Postretirement Benefits |
| Years Ended December 31 | | 2010 | | 2009 | | 2008 | | 2010 | | 2009 | | 2008 | | 2011 | | 2010 | | 2009 | | 2011 | | 2010 | | 2009 |
| Net periodic benefit cost | | | | | | | | | | | | | | | | | | | | | | | | |
| Service cost | | $ | 2,853 | | | $ | 2,747 | | | $ | 2,709 | | | $ | 1,514 | | | $ | 1,347 | | | $ | 1,225 | | | $ | 3,166 |
| | $ | 2,853 |
| | $ | 2,747 |
| | $ | 1,985 |
| | $ | 1,514 |
| | $ | 1,347 |
|
| Interest cost | | 4,569 | | | 4,218 | | | 3,872 | | | 1,433 | | | 1,222 | | | 1,086 | | | 4,761 |
| | 4,569 |
| | 4,218 |
| | 1,590 |
| | 1,433 |
| | 1,222 |
|
| Expected return on plan assets | | (4,526 | ) | | (4,003 | ) | | (4,846 | ) | | — | | | — | | | — | | | (5,288 | ) | | (4,526 | ) | | (4,003 | ) | | — |
| | — |
| | — |
|
| Amortization of prior service cost | | 11 | | | 7 4 | | | 107 | | | (54 | ) | | (55 | ) | | (55 | ) | | 10 |
| | 11 |
| | 74 |
| | (32 | ) | | (54 | ) | | (55 | ) |
| Amortization of net loss | | 2,181 | | | 2,411 | | | 1,185 | | | 71 | | | — | | | 24 | | | 2,368 |
| | 2,181 |
| | 2,411 |
| | 224 |
| | 71 |
| | — |
|
| Net periodic benefit cost | | $ | 5,088 | | | $ | 5,447 | | | $ | 3,027 | | | $ | 2,964 | | | $ | 2,514 | | | $ | 2,280 | | | $ | 5,017 |
| | $ | 5,088 |
| | $ | 5,447 |
| | $ | 3,767 |
| | $ | 2,964 |
| | $ | 2,514 |
|
Projected Benefit Payments
The following table summarizes the expected benefits to be paid from our plans over the next 10 years:
| | | (In Thousands) | | 2011 | | 2012 | | 2013 | | 2014 | | 2015 | | 2016-2020 | | 2012 | | 2013 | | 2014 | | 2015 | | 2016 | | 2017 - 2021 |
| Pension benefits | | $ | 2,749 | | | $ | 2,978 | | | $ | 3,249 | | | $ | 3,535 | | | $ | 3,754 | | | $ | 22,076 | | | $ | 3,088 |
| | $ | 3,262 |
| | $ | 3,532 |
| | $ | 3,769 |
| | $ | 3,976 |
| | $ | 23,864 |
|
| Other retiree benefits | | | | | | | | | | | | | |
| Postretirement benefits | | | | | | | | | | | | | |
| Excluding Modernization Act subsidy | | 850 | | | 917 | | | 1,005 | | | 1,126 | &nb sp; | | 1,233 | | | 8,563 | | | 837 |
| | 938 |
| | 1,052 |
| | 1,192 |
| | 1,343 |
| | 9,884 |
|
| Expected Modernization Act subsidy | | (85 | ) | | (99 | ) | | (114 | ) | | (129 | ) | | (144 | ) | | (975 | ) | | (97 | ) | | (113 | ) | | (132 | ) | | (150 | ) | | (169 | ) | | (1,226 | ) |
| Other retiree benefits | | $ | 765 | | | $ | 818 | | | $ | 891 | | | $ | 997 | | | $ | 1,089 | | | $ | 7,588 | | |
| Postretirement benefits | | | $ | 740 |
| | $ | 825 |
| | $ | 920 |
| | $ | 1,042 |
| | $ | 1,174 |
| | $ | 8,658 |
|
Profit-Sharing Plan and Employee Stock Ownership Plan
We have a profit-sharing plan in which employees who meet service requirements are eligible to participate. The amount of our contribution is discretionary and is determined annually, but cannot exceed the amount deductible for federal income tax purposes. Our contribution to the profit-sharing plan for 20102011, 2 0092010 and 20082009, was $2,074,000, $927,000$1,092,000, $2,074,000 and $974,000,$927,000, respectively.
We have an employee stock ownership plan (the “ESOP”) for the benefit of eligible employees and their beneficiaries. All employees are eligible to participate in the ESOP upon completion of one year of service, meeting the hourly employment requirements with United Fire and attaining 21 years of age. Contributions to the ESOP are made at our discretion. TheseWhen made, these contributions are based upon a percentage of the total payroll and are allocated to participants on the basis of compensation. We can make contributions in stock or cash, which the trustee uses to acquire shares of United Fireour stock to allocate to participants’ accounts. As of December 31, 20102011, 20092010 and 20082009, the ESOP owned 234,107; 241,741;226,375, 234,107, and 241,796241,741 shares of United Fire Group, Inc. common stock, respectively. Shares owned by the ESOP are included in shares issued and outstanding for purposes of calculating earnings per share, and dividends paid on the shares are charged to retained earnings. We made contributions to the ESOP of $100,000$175,000 in 2011, $100,000 in 2010, and $150,000 i n both$150,000 in 2009 and 2008.
United Fire & Casualty CompanyGroup, Inc. Form 10-K | 20102011
|
|
NOTE 10 .9. STOCK OPTION PLANS |
Non-qualified Employee Stock Award Plan
The United Fire & Casualty CompanyGroup, Inc. 2008 Stock Plan (the “2008 Stock Plan”) authorizes the issuance of restricted and unrestricted stock awards, stock appreciation rights, incentive stock options, and non-qualified stock options for up to 1,900,000 shares of United Fireour common stock to employees, with 833,495653,511 authorize dauthorized shares available for future issuance at December 31, 20102011. The 2008 Stock Plan is administered by the Board of Directors, which determines those employees thatwho will receive awards, when awards will be granted, and the terms and conditions of the awards. The Board of Directors may also take any action it deems necessary and appropriate for the administration of the 2008 Stock Plan. Pursuant to the 2008 Stock Plan, the Board of Directors may, at its sole discretion, grant awards to our employees of United Fire or any of its affiliated companies who are in positions of substantial responsibility with United Fire.
Option awardsOptions granted pursuant to the 2008 Stock Plan are granted to buy shares of United Fire'sour common stock a tat the market value of the stock on the date of grant. All outstanding option awards vest and are exercisable in installments of 20.0 percent of the number of shares covered by the option award each year from the grant date, unless the Board of Directors authorizes the acceleration of vesting. To the extent not exercised, vested option awards accumulate and are exercisable by the awardee, in whole or in part, in any subsequent year included in the option period, but not later than 10.010 years from the grant date. Restricted and unrestricted stock awards granted pursuant to the 2008 Stock Plan are granted at the market value of our stock on the date of the grant andgrant. Restricted stock awards fully vest after 5.05 years from the date of issuance, unless accelerated upon the approval of the Board of Directors, at which time United Fire common stock will be issued to the awardee. Restricted and unrestricted stockAll awards are generally granted free of charge to the eligible employees of United Fire as designated by the Board of Dire ctors.Directors.
The activity in the 2008 Stock Plan is displayed in the following table.table:
| | | | | Year-Ended | | Inception | Year-Ended | | Inception |
| Authorized Shares Available for Future Award Grants | | December 31, 2010 | | to Date | December 31, 2011 | | to Date |
| Beginning balance | | 919,525 | | | 1,900,000 | | 833,495 |
| | 1,900,000 |
|
| Number of awards granted | | (114,255 | ) | | (1,139,230 | ) | (206,459 | ) | | (1,345,689 | ) |
| Number of awards forfeited or expired | | 28,225 | | | 72,725 | | 26,475 |
| | 99,200 |
|
| Ending balance | | 833,495 | | | 833,495 | | 653,511 |
| | 653,511 |
|
| Number of option awards exercised | | 250 | | | 167,292 | | 10,725 |
| | 178,017 |
|
| Number of unrestricted stock awards vested | | 1,755 | | | 1,755 | | 730 |
| | 2,485 |
|
| Number of restricted stock awards vested | | — | | | — | | — |
| | — |
|
Non-qualified Non-employee Director Stock Option and Restricted Stock Plan
We have a non-employee director stock optionThe 2005 Non-qualified Non-Employee Director Stock Option and restricted stock plan thatRestricted Stock Plan (the "Director Plan") authorizes United Fireus to grant restricted and unrestricted stock and non-qualified stock options to purchase 150,000shares of United Fire'sour common stock withto non-employee directors. At our annual stockholders’ meeting on May 18, 2011, our stockholders approved an amendment to the Director Plan to increase from 150,000 to 300,000 the number of shares that may be issued under the Director Plan and to extend the life of the Director Plan from December 31, 2014 to December 31, 2020. At 37,003December 31, 2011, we had 160,009 optionsauthorized shares available for future issuance at issuance.December 31, 2010.
The Board of Directors has the authority to determine which non-employee directors receive awards, when options and restricted and unrestricted stock shall be granted, the option price, the option expiration date, the date of grant, the vesting schedule of options or whether the options shall be immediately vested, the terms and conditions of options and restricted stock (other than those terms and conditions set forth in the plan) and the number of shares of common stock to be issued pursuant to an option agreement or restricted stock agreement. The Board of Directors may also take any action it deems necessary and appropriate for the administration of the plan.
Director Plan.
United Fire & Casualty CompanyGroup, Inc. Form 10-K | 20102011
The activity in our non-employee director stock option and restricted stock planthe Director Plan is displayed in the following table:
| | | | | Year-Ended | | Inception | Year-Ended | | Inception |
| Authorized Shares Available for Future Award Grants | | December 31, 2010 | | to Date | December 31, 2011 | | to Date |
| Beginning balance | | 7 0,003 | | | 150,000 | | 37,003 |
| | 150,000 |
|
| Additional authorization | | 150,000 |
| | 150,000 |
|
| Number of awards granted | | (33,000 | ) | | (119,000 | ) | (26,994 | ) | | (145,994 | ) |
| Number of awards forfeited or expired | | — | | | 6,003 | | — |
| | 6,003 |
|
| Ending balance | | 37,003 | | | 37,003 | | 160,009 |
| | 160,009 |
|
| Number of awards exercised | | — | | | — | | — |
| | — |
|
Stock-Based Compensation Expense
For 2011, 2010 and 2009, we recognized stock-based compensation expense of $1,829,000, $1,787,000, and $2,084,000, respectively.
As of December 31, 2011, we had $3,784,000 in stock-based compensation expense that has yet to be recognized through our results of operations. We expect this compensation to be recognized in subsequent years according to the following table, except with respect to awards for which the Board of Directors accelerates vesting, which will result in the recognition of any remaining compensation expense in the period in which the awards are accelerated.
|
| | | |
| (In Thousands) | |
| 2012 | $ | 1,432 |
|
| 2013 | 996 |
|
| 2014 | 765 |
|
| 2015 | 533 |
|
| 2016 | 58 |
|
| Total | $ | 3,784 |
|
Analysis of Award Activity
The analysis below details the award activity for 20102011 and the awards outstanding at December 31, 20102011, for both of our plans and ad hoc options, which were granted prior to the adoption of the other plans:
| | | Options | Shares | | Weighted-Average Exercise Price | | Weighted-Average Remaining Life (Yrs) | | Aggregate Intrinsic Value (In Thousands) | Shares | | Weighted-Average Exercise Price | | Weighted-Average Remaining Life (Yrs) | | Aggregate Intrinsic Value (In Thousands) |
| Outstanding at January 1, 2010 | 912,566 | | | $ | 30.77 | | | | | | |
| Outstanding at January 1, 2011 | | 1,025,191 |
| | $ | 29.30 |
| | | | |
| Granted | 145,500 | | | 19.64 | | | | | | 204,984 |
| | 20.52 |
| | | | |
| Exercised | (4,650 | ) | | 16.18 | | | | | | (11,925 | ) | | 15.99 |
| | | | |
| Forfeited or expired | (28,225 | ) | | 29.15 | | | | | | (29,478 | ) | | 27.10 |
| | | | |
| Outstanding at December 31, 2010 | 1,025,191 | | | $ | 29.30 | | | 6.21 | | | $ | 1,135 | | |
| Exercisable at December 31, 2010 | 601,361 | | | $ | 31.05 | | | 5.08 | | | $ | 452 | | |
| Outstanding at December 31, 2011 | | 1,188,772 |
| | $ | 27.95 |
| | 5.89 |
| | $ | 555 |
|
| Exercisable at December 31, 2011 | | 710,003 |
| | $ | 31.09 |
| | 4.49 |
| | $ | 268 |
|
Intrinsic value is the difference between our share price on the last day of trading (i.e., December 31, 20102011) and the price of the options when granted and represents the value that would have been received by option holders had they exercised their options on that dat e.date. These values change based on the fair market value of our shares. The intrinsic value of options exercised totaled $27,000, $4,000 and $125,000 in 2010$35,000, 2009$27,000 and 2008$4,000 in 2011, 2010 and 2009, respectively.
United Fire Group, Inc. Form 10-K | 2011
At December 31, 20102011, we had 19,46450,206 restricted stock awards outstanding, all of which 19,464, were grant edgranted in May 2008 at a fair market value of $33.43$33.43 per share and 30,742 were granted in February 2011 at a fair market value of $20.54, which resulted in $634,000 of compensation expense to bethat is recognized over a five-year vesting period.period from the date of grant. In 2011, we recognized $245,000 in compensation expense related to these awards. In each of 2010 and 2009, we recognized $127,000 in compensation expense. At December 31, 2011, we had $662,000 in compensation expense that has yet to be recognized through our results of operations related to these awards. The intrinsic value of the unvested restricted stock awards outstanding totaled $434,000$1,013,000 and $355,000$434,000 at December 31, 20102011 and 20092010, respectively.
Assumptions
The weighted-average grant-date fair value of the options granted under our plans has been estima tedestimated using the Black-Scholes option pricing model with the following weighted-average assumptions:
| | | | | | | | | | | | |
| December 31, | | 2010 | | 2009 | | 2008 |
| Risk-free interest rate | | 3.03 | % | | 2.72 | % | | 3.32 | % |
| Expected volatility | | 59.03 | % | | 54.88 | % | | 26.57 | % |
| Expected option life (in years) | | 7 | | | 7 | | | 7 | |
| Expected dividends | | $ | 0.60 | | | $ | 0.60 | | | $ | 0.60 | |
| Weighted-average grant-date fair value of options granted during the year | | $ | 9.00 | | | $ | 7.52 | | | $ | 9.54 | |
|
| | | | | | | | | | | |
| December 31, | 2011 | | 2010 | | 2009 |
| Risk-free interest rate | 2.99 | % | | 3.03 | % | | 2.72 | % |
| Expected volatility | 55.47 | % | | 59.03 | % | | 54.88 | % |
| Expected option life (in years) | 7 |
| | 7 |
| | 7 |
|
| Expected dividends | $ | 0.60 |
| | $ | 0.60 |
| | $ | 0.60 |
|
| Weighted-average grant-date fair value of options granted during the year | $ | 8.99 |
| | $ | 9.00 |
| | $ | 7.52 |
|
125
United Fire & Casualty Company Form 10-K | 2010
The following table summarizes information regarding the stock options outstanding and exercisable at December 31, 20102011:
| | | | Options Outstanding | Options Exercisable | Options Outstanding | Options Exercisable |
| Range of Exercise Prices | Number Outstanding | Weighted-Average Remaining Contractual Life (Yrs) | Weighted-Average Exercise Price | Number Exercisable | Weighted-Average Exercise Price | Number Outstanding | Weighted-Average Remaining Contractual Life (Yrs) | Weighted-Average Exercise Price | Number Exercisable | Weighted-Average Exercise Price |
| $15.01 - 21.00 | 218,875 | | 7.11 | | $ | 17.33 | | 75,825 | | $ | 16.93 | | 401,959 |
| 7.72 |
| $ | 18.97 |
| 91,775 |
| $ | 17.26 |
|
| 21.01 - 28.00 | 154,050 | | 6.08 | | 22.63 | | 82,050 | | 22.79 | | 149,647 |
| 5.04 |
| 22.64 |
| 94,450 |
| 22.76 |
|
| 28.01 - 35.00 | 335,766 | | 6.15 | | 33.03 | | 213,886 | | 32.73 | | 328,166 |
| 5.15 |
| 33.01 |
| 250,878 |
| 32.80 |
|
| 35.01 - 41.00 | 316,500 | | 5.71 | | 36.86 | | 229,600 | | 37.10 | | 309,000 |
| 4.71 |
| 36.85 |
| 272,900 |
| 37.07 |
|
| $15.01 - 41.00 | 1,025,191 | | 6.21 | | $ | 29.30 | | 601,361 | | $ | 31.05 | | 1,188,772 |
| 5.89 |
| $ | 27.95 |
| 710,003 |
| $ | 31.09 |
|
|
|
NOTE 11.10. SEGMENT INFORMATION |
We have two reportable business segments in our operations: property and casualty insurance and life insurance. The property and casualty insurance segment has threesix domestic locations from which it conducts its business. All offices target a si milar customer base, market the same products and use the same marketing strategies and are therefore aggregated. The life insurance segment operates from our home office. The accounting policies of the segments are the same as those described in Note 1 to our Consolidated Financial Statements. We analyze results based on profitability (i.e., loss ratios), expenses and return on equity. Because all of our insurance is sold domestically, we have no revenues allocable to foreign operations.
Property and Casualty Insurance Segment
We write both commercial and personal lines of property and casualty insurance. We focus on our commercial lines, which represented 90.589.6 percent of our property and casualty insurance premiums earned for 20102011. Our personal lines represented 9.510.4 percent of our property and casualty insurance premiums earned for 20102011.
Products
Our primary commercial policies are tailored business packages that include the following coverages: fire and allied
United Fire Group, Inc. Form 10-K | 2011
lines, other liability, automobile, workers’ compensation and surety. Our personal lines consist primarily of automobile and fire and allied lines coverage, including homeowners.
Pricing
The pricing ofPricing levels for our property and casualty insurance products are based oninfluenced by many factors, including state regulationan estimation of expected losses, the expenses of producing, issuing and legislation, competition,servicing business and economic conditionsmanaging claims, the time value of money associated with such as: inflation,loss and expense cash flows, and a reasonable allowance for profit. We have a disciplined approach to underwriting and risk management that emphasizes profitable growth rather than premium volume or market share. Our insurance subsidiaries are subject to state laws and regulations regarding rate and policy form approvals. The applicable state laws and regulations establish standards in certain lines of business to ensure that rates of interest, expenses, the frequency and severity of claims,are not excessive, inadequate, unfairly discriminatory, or used to engage in unfair price competition. Our ability to increase rates and the outcomerelative timing of judicial decisions. Additionally, many state regulators consider investment inco me when establishing or approving rates, which can reduce the margin for profit that we include inprocess are dependent upon each respective state's requirements, as well as the rating formula.competitive market environment.
Seasonality
Our property and casualty insurance segment experiences some seasonality with regard to premiums written, which are generally highest in January and July and lowest during the fourth quarter. Although we experience some seasonality in our premiums written, premiums are earned ratably over the period of coverage. Losses and loss settlement expenses incurred tend to remain consistent throughout the year, with the exception of catastrophe losses. Catastrophes inherently are unpredictable and can occur at any time during the year from man-made or natural disaster events th atthat include, but which are not limited to, hail, tornadoes, hurricanes and windstorms.
United Fire & Casualty Company Form 10-K | 2010
Disaster Charges and Other Related Expenses
In June 2008, our corporate headquarters was forced to close temporarily due to historic flooding in Cedar Rapids, Iowa, that caused extensive damage to the first and lower levels of our buildings. We recorded flood-related charges of $6,803,000, net of insurance, in 2008, and net insurance recoveries of $1,468,000 and $16,000 in 2009 and 2010, respectively. These charges primarily relate to costs incurred to clean up and restore our home office and contents. We have received insurance reimbursements totaling $34,000, $1,822,000 and $3,106,000, in 2010, 2009 and 2008, respectively, which off set all of the charges incurred in 2010 and 2009 and a portion of the charges incurred in 2008. There will be no further disaster charges or recoveries in 2011.
In September 2008, our New Orleans claims office in Metairie closed for three days due to Hurricane Gustav and our Gulf Coast regional office in Galveston, Texas, was temporarily closed for three weeks due to Hurricane Ike. We recorded $133,000, net of insurance, and $399,000 of hurricane-related expenses in 2009 and 2008, respectively, which primarily relates to costs incurred to remove damaged contents from the affected areas and establish a temporary facility for our Gulf Coast regional office. We have received insurance reimbursements totaling $275,000 in 2009, which offset a portion of the charges incurred in 2009. There were no such reimbursements recorded in 2008. There were no charges or recoveries for this disaster in 2010.
Life Insurance Segment
Products
United Life Insurance Company underwrites all of our life insurance business and sells annuities. Our principal products are single premium annuities, universal life products and traditional life (primarily single premium whole life insurance) products. We also underwrite and market other traditional products, including term life insurance and whole life insurance. We do not write variable annuities or variable insurance products.
Life insurance in force, before ceded reinsurance, totaled $4,804,167,0004,916,875,000 and $4,715,258,0004,804,167,000 as of December 31, 20102011 and 20092010, respectively. Traditional life insurance products represented 64.165.5 percent and 62.864.1 percent of our insurance in-force at December 31, 20102011 and 20092010, respectively. Universal life insurance represented 33.231.8 percent and 34.333.2 percent of insurance in force at December 31, 20102011 and 20092010, respectively.
Pricing
Premiums for our life and health insurance products are based on assumptions with respect to mortality, morbidity, investment yields, expenses, and lapses and are also affected by state laws and regulations, as well as competition. Pricing assumptions are based on our experience, as well as the industry in general, depending upon the factor being considered. The actual profit or loss produced by a product will vary from the anticipated profit if the actual experience differs from the assumptions used in pricing the product.
United Fire & Casualty CompanyGroup, Inc. Form 10-K | 20102011
Premiums Earned by Segment
The following table setsets forth our net premiums earned by segment before intersegment eliminations:
| | | (In Thousands) | | | | | | | | | | |
| Years Ended December 31 | 2010 | | 2009 | | 2008 | 2011 | | 2010 | | 2009 |
| Property and Casualty Insurance Segment | | | | | | | | | | |
| Net premiums earned | | | | | | | | | | |
| Fire and allied lines | $ | 123,341 | | | $ | 124,582 | | | $ | 130,570 | | $ | 153,839 |
| | $ | 123,341 |
| | $ | 124,582 |
|
| Other liability | 113,555 | | | 119,587 | | | 134,429 | | 159,977 |
| | 113,555 |
| | 119,587 |
|
| Automobile | 107,776 | | | 111,001 | | | 113,832 | | 133,974 |
| | 107,776 |
| | 111,001 |
|
| Workers’ compensation | 45,174 | | | 51,992 | | | 52,792 | | 54,404 |
| | 45,174 |
| | 51,992 |
|
| Fidelity and surety | 19,113 | | | 21,354 | | | 22,244 | | 16,665 |
| | 19,113 |
| | 21,354 |
|
| Reinsurance assumed | 10,163 | | | 5,942 | | | 10,530 | | 13,261 |
| | 10,163 |
| | 5,942 |
|
| Other | 1,251 | | | 1,219 | | | 1,184 | | 1,651 |
| | 1,251 |
| | 1,219 |
|
| Total net premiums earned | $ | 420,373 | | | $ | 435,677 | | | $ | 465,581 | | $ | 533,771 |
| | $ | 420,373 |
| | $ | 435,677 |
|
| Life Insurance Segment | | | | | | | | | | |
| Net premiums earned | | | | | | | | | | |
| Ordinary life (excluding Universal life) | $ | 28,463 | | | $ | 23,842 | | | $ | 21,617 | | $ | 30,374 |
| | $ | 28,463 |
| | $ | 23,842 |
|
| Universal life policy fees | 10,774 | | | 10,554 | | | 9,653 | | 10,995 |
| | 10,774 |
| | 10,554 |
|
| Accident and health | 1,538 | &n bsp; | | 1,634 | | | 1,790 | | 1,472 |
| | 1,538 |
| | 1,634 |
|
| Immediate annuities with life contingencies | 8,354 | | | 6,755 | | | 4,505 | | 10,276 |
| | 8,354 |
| | 6,755 |
|
| Credit life | 76 | | | 140 | | | 271 | | 46 |
| | 76 |
| | 140 |
|
| Group life | 210 | | | 2 06 | | | 239 | | 216 |
| | 210 |
| | 206 |
|
| Total net premiums earned | $ | 49,415 | | | $ | 43,131 | | | $ | 38,075 | | $ | 53,379 |
| | $ | 49,415 |
| | $ | 43,131 |
|
Total revenue by segment includes sales to external customers and intersegment sales that are eliminated to arrive at the total revenues as reported in the accompanying Consolidated Statements of Income. We account for intersegment sales on the same basis as sales to external customers.
The following table sets forth certain data for each of our business segments and is reconciled to our Consolidated Financial Statements. Depreciation expense and property and equipment acquisitions for 20102011, 20 092010 and 20082009, are reported in the property and casualty insurance segment.
United Fire & Casualty CompanyGroup, Inc. Form 10-K | 20102011
| | | (In Thousands) | | | | | | | | | | | |
| Years Ended December 31 | | 2010 | | 2009 | | 2008 | 2011 | | 2010 | | 2009 |
| Property and Casualty Insurance Segment | | | | | | | | | | | |
| Revenues | | | | | | | | | | | |
| Net premiums earned | | $ | 420,373 | | | $ | 435,677 | | | $ | 465,581 | | $ | 533,771 |
| | $ | 420,373 |
| | $ | 435,677 |
|
| Investment income, net of investment expenses | | 34,968 | | | 31,715 | | | 33,618 | | 35,690 |
| | 34,968 |
| | 31,715 |
|
| Realized investment gains (losses) | | 3,402 | | | (6,815 | ) | | 1,879 | | 3,066 |
| | 3,402 |
| | (6,815 | ) |
| Other income (expense) | | 147 | | | 194 | | | (55 | ) | |
| Other income | | 1,592 |
| | 147 |
| | 194 |
|
| Total reportable segment | | $ | 458,890 | | | $ | 460,771 | | | $ | 501,023 | | $ | 574,119 |
| | $ | 458,890 |
| | $ | 460,771 |
|
| Intersegment eliminations | | 10 | | | (173 | ) | | (166 | ) | (162 | ) | | 10 |
| | (173 | ) |
| Total revenues | | $ | 458,900 | | | $ | 460,598 | | | $ | 500,857 | | $ | 573,957 |
| | $ | 458,900 |
| | $ | 460,598 |
|
| Net income (loss) before income taxes | | | | | | | | | | | |
| Revenues | | $ | 458,890 | | | $ | 460,77 1 | | | $ | 501,023 | | $ | 574,119 |
| | $ | 458,890 |
| | $ | 460,771 |
|
| Benefits, losses and expenses | | 420,374 | | | 500,855 | | | 537,569 | | 598,684 |
| | 420,374 |
| | 500,855 |
|
| Total reportable segment | | $ | 38,516 | | | $ | (40,084 | ) | | $ | (36,546 | ) | $ | (24,565 | ) | | $ | 38,516 |
| | $ | (40,084 | ) |
| Intersegment eliminations | | 324 | | | 137 | | | 116 | | 335 |
| | 324 |
| | 137 |
|
| Income (loss) before income taxes | | $ | 38,840 | | | $ | (39,947 | ) | | $ | (36,430 | ) | $ | (24,230 | ) | | $ | 38,840 |
| | $ | (39,947 | ) |
| Income tax expense (benefit) | | 4,114 | | | (22,270 | ) | | (21,274 | ) | (16,591 | ) | | 4,114 |
| | (22,270 | ) |
| Net income (loss) | | $ | 34,726 | | | $ | (17,677 | ) | | $ | (15,156 | ) | $ | (7,639 | ) | | $ | 34,726 |
| | $ | (17,677 | ) |
| Assets | | | | | | | | | | | |
| Total reportable segment | | $ | 1,591,392 | | | $ | 1,561,474 | | | $ | 1,495,883 | | $ | 2,117,352 |
| | $ | 1,591,392 |
| | $ | 1,561,474 |
|
| Intersegment eliminations | | (245,419 | ) | | (237,165 | ) | | (185,116 | ) | (252,205 | ) | | (245,419 | ) | | (237,165 | ) |
| Total assets | | $ | 1,345,973 | | | $ | 1,324,309 | | | $ | 1,310,767 | | $ | 1,865,147 |
| | $ | 1,345,973 |
| | $ | 1,324,309 |
|
| Life Insurance Segment Revenues | | | | | | |
| Life Insurance Segment | | | | | | |
| Revenues | | | | | | | | | | | |
| Net premiums earned | | $ | 49,415 | | | $ | 43,131 | | | $ | 38,075 | | $ | 53,379 |
| | $ | 49,415 |
| | $ | 43,131 |
|
| Investment income, net of investment expenses | | 76,898 | | | 74,533 | | | 74,125 | | 73,977 |
| | 76,898 |
| | 74,533 |
|
| Realized investment gains (losses) | | 4,896 | | | (6,364 | ) | | (12,262 | ) | 3,647 |
| | 4,896 |
| | (6,364 | ) |
| Other income | | 1,278 | | | 605 | | | 935 | | 699 |
| | 1,278 |
| | 605 |
|
| Total reportable segment | | $ | 132,487 | | | $ | 111,905 | | | $ | 100,873 | | $ | 131,702 |
| | $ | 132,487 |
| | $ | 111,905 |
|
| Intersegment eliminations | | (315 | ) | | (310 | ) | | (281 | ) | (651 | ) | | (315 | ) | | (310 | ) |
| Total revenues | | $ | 132,172 | | | $ | 111,595 | | | $ | 100,592 | | $ | 131,051 |
| | $ | 132,172 |
| | $ | 111,595 |
|
| Net income before income taxes | | | | | | | | | | | |
| Revenues | | $ | 132,487 | | | $ | 111,905 | | | $ | 100,873 | | $ | 131,702 |
| | $ | 132,487 |
| | $ | 111,905 |
|
| Benefits, losses and expenses | | 112,810 | | &nbs p; | 100,528 | | | 97,464 | | 119,712 |
| | 112,810 |
| | 100,528 |
|
| Total reportable segment | | $ | 19,677 | | | $ | 11,377 | | | $ | 3,409 | | $ | 11,990 |
| | $ | 19,677 |
| | $ | 11,377 |
|
| Intersegment eliminations | | (134 | ) | | (136 | ) | | (115 | ) | (475 | ) | | (134 | ) | | (136 | ) |
| Income before income taxes | | $ | 19,543 | | | $ | 11,241 | | | $ | 3,294 | | $ | 11,515 |
| | $ | 19,543 |
| | $ | 11,241 |
|
| Income tax expense | | 6,756 | | | 4,005 | | | 1,2 02 | | 3,865 |
| | 6,756 |
| | 4,005 |
|
| Net income | | $ | 12,787 | | | $ | 7,236 | | | $ | 2,092 | | $ | 7,650 |
| | $ | 12,787 |
| | $ | 7,236 |
|
| Assets | | $ | 1,661,466 | | | $ | 1,578,235 | | | $ | 1,376,363 | | $ | 1,753,777 |
| | $ | 1,661,466 |
| | $ | 1,578,235 |
|
| Consolidated Totals | | | | | | | | | | | |
| Total consolidated revenues | | $ | 591,072 | | | $ | 572,193 | | | $ | 601,449 | | $ | 705,008 |
| | $ | 591,072 |
| | $ | 572,193 |
|
| Total consolidated net income (loss) | | $ | 47,513 | | | $ | (10,441 | ) | | $ | (13,064 | ) | $ | 11 |
| | $ | 47,513 |
| | $ | (10,441 | ) |
| Total consolidated assets | | $ | 3,007,439 | | | $ | 2,902,544 | | | $ | 2,687,130 | | $ | 3,618,924 |
| | $ | 3,007,439 |
| | $ | 2,902,544 |
|
United Fire & Casualty CompanyGroup, Inc. Form 10-K | 20102011
|
|
NOTE 12.11. QUARTERLY SUPPLEMENTARY FINANCIAL INFORMATION (UNAUDITED) |
The following table sets forth our selected unaudited quarterly financial information:
| | | (In Thousands Except Per Share Data) | | | | | | | | | | | | | | | | | | | |
| Quarters | | First | | Second | | Third | | Fourth | | Total | First | | Second | | Third | | Fourth | | Total |
| Year Ended December 31, 2011 | | | | | | | | | | |
| Total revenues | | $ | 144,076 |
| | $ | 181,804 |
| | $ | 187,574 |
| | $ | 191,554 |
| | $ | 705,008 |
|
| Income (loss) before income taxes | | 6,939 |
| | (30,996 | ) | | (10,474 | ) | | 21,816 |
| | (12,715 | ) |
| Net income (loss) | | $ | 5,810 |
| | $ | (17,914 | ) | | $ | (4,776 | ) | | $ | 16,891 |
| | $ | 11 |
|
Basic earnings per share (1) | | $ | 0.22 |
| | $ | (0.69 | ) | | $ | (0.19 | ) | | $ | 0.66 |
| | $ | — |
|
Diluted earnings per share (1) | | 0.22 |
| | (0.69 | ) | | (0.19 | ) | | 0.66 |
| | — |
|
| Year Ended December 31, 2010 | | | | | | | | | | | | | | | | | | | |
| Total revenues | | $ | 145,125 | | | $ | 148,014 | | | $ | 147,904 | & nbsp; | | $ | 150,029 | | | $ | 591,072 | | $ | 145,125 |
| | $ | 148,014 |
| | $ | 147,904 |
| | $ | 150,029 |
| | $ | 591,072 |
|
| Income before income taxes | | 24,271 | | | 20,591 | | | 2,595 | | | 10,926 | | | 58,383 | | 23,842 |
| | 18,340 |
| | 1,492 |
| | 14,709 |
| | 58,383 |
|
| Net income | | $ | 19,392 | | | $ | 15,394 | | | $ | 3,640 | | | $ | 9,087 | | | $ | 47,513 | | $ | 19,113 |
| | $ | 13,931 |
| | $ | 2,923 |
| | $ | 11,546 |
| | $ | 47,513 |
|
Basic earnings per share (1) | | $ | 0.73 | | | $ | 0.58 | | | $ | 0.14 | | | $ | 0.35 | | | $ | 1.81 | | $ | 0.72 |
| | $ | 0.53 |
| | $ | 0.11 |
| | $ | 0.44 |
| | $ | 1.81 |
|
Diluted earnings per share (1) | | 0.73 | | | 0.58 | | | 0.14 | | | 0.35 | | | 1.80 | | 0.72 |
| | 0.53 |
| | 0.11 |
| | 0.44 |
| | 1.80 |
|
| Year Ended December 31, 2009 | | | | | | | | | | $ | — | | |
| Total revenues | | $ | 138,263 | | | $ | 134,046 | | | $ | 150,701 | | | $ | 149,183 | | | $ | 572,193 | | |
| Income (loss) before income taxes | | 1,491 | | | (11,360 | ) | | (18,589 | ) | | (248 | ) | | (28,706 | ) | |
| Net income (loss) | | $ | 3,270 | | | $ | (5,334 | ) | | $ | (10,156 | ) | | $ | 1,779 | | | $ | (10,441 | ) | |
Basic earnings (loss) per share (1) | | $ | 0.12 | | | $ | (0.20 | ) | | $ | (0.38 | ) | | $ | 0.07 | | | $ | (0.39 | ) | |
Diluted earnings (loss) per share (1) | | 0.12 | | | (0.20 | ) | | (0.38 | ) | | 0.07 | | | (0.39 | ) | |
| |
| (1) | The sum of the quarterly reported amounts may not equal the full year, as each is computed independently. |
|
|
NOTE 13.12. EARNINGS PER COMMON SHARE |
Basic earnings (loss) per share is computed by dividing net income (loss) by the weighted-average number of common shares outstanding during the reporting period. Diluted earnings (loss) per share gives effect to all dilutive common shares outstanding during the reporting period. The dilutive shares we consider in our diluted earnings (loss) per share calculation relate to our outstanding stock options and restricted and unrestricted stock awards.
We determine the dilutive effect of our outstanding stock options using the “treasury stock” method. Under this method, we assume the exercise of all of the outstanding stock options whose exercise price is less than the weighted-average fair market value of our common stock during the reporting period. This method also assumes that the proceeds from the hypothetical stock option exercises are used to re purchaserepurchase shares of our common stock at the weighted-average fair market value of the stock during the reporting period. The net of the assumed stock options exercised and assumed common shares repurchased represents the number of dilutive common shares, which we add to the denominator of the earnings per share calculation.
The components of basic and diluted earnings (loss) per share are displayed in the table below:were as follows:
| | | Years ended December 31 | | 2010 | | 2009 | | 2008 | 2011 | | 2010 | | 2009 |
| (In Thousands Except Per Share Data) | | Basic | | Diluted | | Basic | | Diluted | | Basic | | Diluted | Basic | | Diluted | | Basic | | Diluted | | Basic | | Diluted |
| Net incom e (loss) | | $ | 47,513 | | | $ | 47,513 | | | $ | (10,441 | ) | | $ | (10,441 | ) | | $ | (13,064 | ) | | $ | (13,064 | ) | |
| Net income (loss) | | $ | 11 |
| | $ | 11 |
| | $ | 47,513 |
| | $ | 47,513 |
| | $ | (10,441 | ) | | $ | (10,441 | ) |
| Weighted-average common shares outstanding | | 26,318 | | | 26,318 | | | 26,590 | | | 26,590 | | | 26,960 | | | 26,960 | | 25,879 |
| | 25,879 |
| | 26,318 |
| | 26,318 |
| | 26,590 |
| | 26,590 |
|
| Add dilutive effect of restricted stock awards | | — | | | 19 | | | — | | | — | | | — | | | — | | — |
| | 50 |
| | — |
| | 19 |
| | — |
| | — |
|
| Add dilutive effect of stock options | | — | | | 1 | | | — | | | — | | | — | | | — | | — |
| | 30 |
| | — |
| | 1 |
| | — |
| | — |
|
| Weighted-average common shares for EPS calculation | | 26,318 | | | 26,338 | | | 26,590 | | | 26,590 | | | 26,960 | | | 26,960 | | 25,879 |
| | 25,959 |
| | 26,318 |
| | 26,338 |
| | 26,590 |
| | 26,590 |
|
| Earnings (loss) per share | | $ | 1.81 | | | $ | 1.80 | | | $ | (0.39 | ) | | $ | (0.39 | ) | | $ | (0.48 | ) | | $ | (0.48 | ) | $ | — |
| | $ | — |
| | $ | 1.81 |
| | $ | 1.80 |
| | $ | (0.39 | ) | | $ | (0.39 | ) |
Awards excluded from diluted EPS calculation (1) | | — | | | 806 | | | — | | | 932 | | | — | | | 832 | | — |
| | 989 |
| | — |
| | 806 |
| | — |
| | 932 |
|
(1) Outstanding awards were excluded from the diluted earnings per share calculation because the effect of including them would have been anti-dilutive.
United Fire & Casualty CompanyGroup, Inc. Form 10-K | 20102011
|
|
NOTE 14.13. COMPREHENSIVE INCOME (LOSS) |
Comprehensive income (loss) includes changes in stockholders’ equity during a period except those resulting from investments by and dividends to stockholders.
The following table sets forth the components of our comprehensive income (loss) and the related tax effects for 20102011, 20092010 and 20082009:
| | | | Years Ended December 31 | Years Ended December 31 |
| (In Thousands) | 2010 | | 2009 | | 2008 | 2011 | | 2010 | | 2009 |
| Net income (loss) | $ | 47,513 | | | $ | (10,441 | ) | | $ | (13,064 | ) | $ | 11 |
| | $ | 47,513 |
| | $ | (10,441 | ) |
| | | | | | | | | | | |
| Other comprehensive income (loss) | | | | | | |
| Other comprehensive income | | | | | | |
| Change in net unrealized appreciation on investments | $ | 39,577 | | | $ | 74,624 | | | $ | (102,745 | ) | $ | 39,866 |
| | $ | 39,577 |
| | $ | 74,624 |
|
| Adjustment for net realized (gains) losses included in income | (8,489 | ) | | 13,179 | | | 10,383 | | (6,440 | ) | | (8,489 | ) | | 13,179 |
|
| Change in unrecognized employee benefit costs | (8,097 | ) | | (2,661 | ) | | (12,934 | ) | (27,528 | ) | | (8,097 | ) | | (2,661 | ) |
| Adjustment for costs included in employee benefit expense | 2,209 | | | 2,430 | | | 1,261 | | 2,570 |
| | 2,209 |
| | 2,430 |
|
| Other comprehensive income (loss), before tax | $ | 25,200 | | | $ | 87,572 | | | $ | (104,035 | ) | |
| Other comprehensive income, before tax | | $ | 8,468 |
| | $ | 25,200 |
| | $ | 87,572 |
|
| Income tax effect | (8,869 | ) | | (30,774 | ) | | 36,411 | | (2,860 | ) | | (8,869 | ) | | (30,774 | ) |
| Other comprehensive income (loss), after tax | $ | 16,331 | | | $ | 56,798 | | | $ | (67,624 | ) | |
| Other comprehensive income, after tax | | $ | 5,608 |
| | $ | 16,331 |
| | $ | 56,798 |
|
| | | | | | | | | | |
| Comprehensive income (loss) | $ | 63,844 | | | $ | 46,357 | | | $ | (80,688 | ) | |
| Comprehensive income | | $ | 5,619 |
| | $ | 63,844 |
| | $ | 46,357 |
|
|
|
NOTE 15.14. LEASE COMMITMENTS |
At December 31, 20102011, we were obligated under noncancelable operating lease agreements for office space, vehicles, computer equipment and office equipment. Most of our leases include renewal options, purchase options or both. These provisions may be exercised by us upon the expiration of the related lease agreements. Rental expense under our operating lease agreements was $4,506,000, $4,209,000 and $4,085,000 for 2010$5,232,000, 2009$4,506,000 and 2008$4,209,000 for 2011, 2010 and 2009, respectively. Our most significant lease arrangement is for office space for our regional office in Galveston, Texas. This lease expires i n in December 2014.2014. The annual lease payments for this office space total approximately $2,100,000.$2,100,000.
At December 31, 20102011, our future minimum rental payments are as follows:
| | | (In Thousands) | | |
| 2011 | $ | 4,561 | | |
| 2012 | 3,701 | | $ | 6,024 |
|
| 2013 | 2,948 | | 5,682 |
|
| 2014 | 2,344 | | 4,314 |
|
| 2015 | 149 | | 1,720 |
|
| 2016 | | 1,341 |
|
| Thereafter | 955 | | 887 |
|
| Total | $ | 14,658 | | $ | 19,968 |
|
United Fire & Casualty CompanyGroup, Inc. Form 10-K | 20102011
|
|
NOTE 16.15. CONTINGENT LIABILITIES |
Legal Proceedings
We have beenare named as a defendant in various lawsuits including actions seeking certification from the court to proceed as a class action suit and actions filed by individual policyholders, relating to disputes arising from damages that occurred as a result of Hurricane Katrina in 2005. As of December 31, 2010, there were approximately 90 individual policyholder cases pending and four class action cases pending. These cases have been filed in Louisiana state courts and federal district courts andlawsuits involve, among other claims,claims: disputes as to the amount of reimbursable claims in particular cases, as well asclaims; the scope of insurance coverage u nderunder homeowners and commercial property policies due to flooding, civil authority actions, loss of use and business interruption. Certaininterruption; breach of these cases also claim a breach ofthe duty of good faith or violations of Louisiana insurance claims-handling laws or regulations and(which cases involve claims for statutory damages and, in some cases, punitive or exemplary damages. Other cases claim that under Louisiana’sdamages); the applicability of Louisiana's so-called “Valued Policy Law,” thepursuant to which insurers must pay the total insured value of a homestructure that is totally destroyed if any portion of such damage was caused by a covered peril, even if the principal cause of the loss was an excluded peril. Other cases challengeperil; and the scope or enforceability of the water damage exclusion in the policies.
Several actions pending against various insurers, including us, were consolidated for purposes of pre-trial discovery and motion practice under the caption In re Katr ina Canal Breaches Consolidated Litigation, Civil Action No. 05-4182 in the United States District Court, Eastern District of Louisiana. In August 2009, the federal trial court ruled in that case that certification of policyholder claims as a class would be inappropriate. The Federal Fifth Circuit Court of Appeals affirmed the denial of class certification. Federal court rulings in that case are not binding on state courts, which do not have to follow the federal court ruling on class certification.
Following an April 2008 Louisiana Supreme Court decision finding that flood damage was clearly excluded from coverage, both state and federal courts have been reviewing pending lawsuits seeking class certification and other pending lawsuits in order to expedite pre-trial discovery and to move the cases towards trial. In 2010, we concluded 130 of the appr oximately 215 lawsuits that were pending at December 31, 2009. Five new lawsuits were filed in 2010 against us, alleging entitlement to additional insurance recovery as a result of Katrina-related damage. We have asserted that these suits were not timely filed and should be dismissed, but no court has yet addressed the viability of these recently filed suits.
In July 2008, Lafayette Insurance Company participated in a hearing in St. Bernard Parish, Louisiana, after which the court entered an order certifying a class defined as all Lafayette Insurance Company personal lines policyholders within an eight parish area in and around New Orleans who sustained wind damage as a result of Hurricane Katrina and whose claims were at least partially denied or allegedly misadjusted. We appealed this order, and in a decision dated, November 30, 2010, the Louisiana Supr eme Court ruled that certification of the class was improper and remanded the matter to the trial court for a determination of the merits of the claims of individually identified policyholders. In light of this decision, we believe it unlikely that class certification will be upheld in any of the other suits seeking class relief. As the claims of potential class members will likely not be addressed in class action litigation, the only recourse for policyholders dissatisfied with their insurance claim adjustment will be through litigation pursued by specifically named persons. While we believe that the allowable time for commencement of such litigation has passed, this issue has not yet been definitively decided by Louisiana courts, and it is possible that suits may still be commenced that are not subject to dismissal as untimely.
We intend t o continue to defend the cases related to losses incurred as a consequence of Hurricane Katrina. We have established our loss and loss settlement expense reserves on the assumption that the application of the Valued Policy Law will not result in our having to pay damages for perils not otherwise covered. We believe that, in the aggregate, these reserves are adequate.
We intend to continue to defend the cases related to losses incurred as a consequence of Hurricane Katrina. There are approximately 49 individual policyholder cases pending as of December 31, 2011. Our evaluation of these claims and the adequacy of recorded reserves may change if we encounter adverse developments in the further defense of these claims.
We intend to continue to defend For the cases related to lossesyears ended December 31, 2011, 2010, and 2009, we incurred as a consequence$6,528,000,$8,576,000, and $37,976,000, respectively, of Hurricane Katrina. We have established our loss and loss settlement expense reserves on the assumption that the application of the Valued Policy
United Fire & Casualty Company Form 10-K | 2010
Law will not result in our having to p ay damages for perils not otherwise covered. We believe that, in the aggregate, these reserves are adequate. Our evaluation of theseexpenses from Hurricane Katrina claims and the adequacy of recorded reserves may change if we encounter adverse developments in the further defense of these claims.related litigation.
We are a defendant in two lawsuits filed in the Superior Court of New Jersey of Mercer County, Chancery Division, relating to our proposed merger with Mercer Insurance Group, Inc. Each of the lawsuits was filed as a class action on behalf of all of Mercer's stockholders and alleges, among other things, that the consideration that stockholders will receive in connection with the merger is inadequate, that Mercer's directors breached their fiduciary duties to stockholders in negotiating and approving the merger agreement, and that we aided and abetted the breach of fiduciary duty by Mercer's directors. Each of the complaints s eeks various forms of relief, including injunctive relief that would, if granted, prevent the merger from closing in accordance with the agreed-upon terms. We intend to aggressively defend these cases. While we believe that the claims asserted against United Fire, Mercer, and its directors are without merit, we, along with Mercer Insurance Group, are pursuing resolution of the suits. We believe that any exposure on the part of United Fire is not material. Resolution of the litigation will remove the potential for delay in the shareholder vote which may be sought by the plaintiffs and the possibility of a consequential delay in the closing of the sale.
We consider all of our other litigation pending as of December 31, 2010,2011, to be ordinary, routine, and incidental to our business.
United Fire Group, Inc. Form 10-K | 2011
|
|
| NOTE 16. BUSINESS COMBINATIONS |
The excess of the purchase price over the estimated fair value of the tangible assets acquired and liabilities assumed at the acquisition date has been allocated to goodwill and intangible assets of our property and casualty insurance segment. The following is a summary of the fair value of the tangible and intangible assets acquired and liabilities assumed of Mercer Insurance Group at the date of acquisition:
|
| | | |
| (In Thousands) | March 28, 2011 |
| | |
| Assets | |
| Available-for-sale fixed maturity securities | $ | 401,548 |
|
| Equity securities | 10,266 |
|
| Short-term investments | 400 |
|
| Cash and cash equivalents | 18,855 |
|
| Accrued investment income | 3,741 |
|
| Premiums receivable | 35,822 |
|
| Value of business acquired | 27,436 |
|
| Property and equipment | 14,985 |
|
| Reinsurance receivables and recoverables | 58,193 |
|
| Prepaid reinsurance premiums | 6,289 |
|
| Income taxes receivable | 2,657 |
|
| Deferred income taxes | 2,837 |
|
| Goodwill and intangible assets | 32,293 |
|
| Other assets | 11,353 |
|
| Total assets | $ | 626,675 |
|
| | |
| Liabilities | |
| Reserves for losses, claims and loss settlement expenses | $ | 310,647 |
|
| Unearned premiums | 72,249 |
|
| Accrued expenses and other liabilities | 33,690 |
|
| Debt | 3,000 |
|
| Trust preferred securities | 15,614 |
|
| Total liabilities | $ | 435,200 |
|
| Total net assets acquired | $ | 191,475 |
|
The fair value of available-for-sale fixed maturity securities is primarily based on quoted prices for similar financial instruments in markets that are not active or on inputs that are observable either directly or indirectly for the full term of the financial instrument. The fair value of equity securities is primarily based on unadjusted quoted prices in active markets for identical financial instruments that we have the ability to access.
The fair value of reserves for losses, claims and loss settlement expenses related to incurred claims and reinsurance receivables and recoverables is determined using a valuation model that is based on actuarial estimates of future cash flows for the underwriting liabilities. These future cash flows are adjusted for the time value of money using duration-matched risk-free interest rates that approximate current U.S. Treasury bill rates and a risk margin to compensate the acquirer for the risk associated with these liabilities.
The value of business acquired (“VOBA”) at the acquisition date is an intangible asset relating to the difference between the unearned premium reserves acquired in the transaction and the estimated fair value of the unexpired insurance policies, which consists of two components: (1) a provision for loss and loss settlement expenses that will be incurred as the premium is earned and (2) a provision for policy maintenance costs related to servicing those policies until they expire. Loss and loss settlement expenses are valued in a manner identical to that used for loss reserve valuation. Policy maintenance costs are valued based on estimates of future cash flows that are discounted to present value using duration-matched risk-free interest rates. VOBA is reported as a component of deferred policy acquisition costs in the accompanying Consolidated Balance Sheets and is amortized over a twelve-month period
United Fire Group, Inc. Form 10-K | 2011
from the acquisition date in proportion to the timing of the estimated underwriting profit associated with the in-force business. The amortization pattern for the VOBA asset will be greater in the initial months subsequent to the acquisition date in correlation to the remaining term of the policies that were underwritten by Mercer Insurance Group. We recorded amortization expense of $25,763,000 in 2011. The VOBA asset was $1,673,000 at December 31, 2011, which will be fully amortized in the first quarter of 2012.
The fair value of property and equipment related to land and buildings approximates the appraised value of the respective assets at the acquisition date.
The fair value of the intangible asset for agency relationships was established using the excess earnings method, which is an income approach based on estimated financial projections developed by management using market participant assumptions. Fair value has been estimated as the present value of the benefits anticipated from our continued relationship with these agencies that are in excess of the return required on the investment in contributory assets necessary to realize those benefits. The rate used to discount the net benefits is based on a risk-adjusted rate that takes into consideration market-based rates of return and is representative of the relative risk of the acquired asset.
The fair value of the intangible asset for software was established using the replacement cost method, which estimates the cost to recreate the utility of the subject asset in consideration of the technological and functional obsolescence of the acquired software.
The fair value of the intangible asset for trade names was established using the relief from royalty method, which treats the trade name as being licensed in an arm’s length transaction to a third party. A review was performed of comparable arm’s length royalty or license agreements involving assets that reflect similar risk and return investment characteristics with the subject trade name. The royalty rate selected is then multiplied by the net revenue expected to be generated by the trade names over the course of the assumed life of the trade names. The product of the royalty rate and the revenue provides an estimate of the royalty income that could be generated hypothetically by licensing the subject trade name.
The fair value of the intangible asset for licenses was estimated by assigning values to state insurance licenses to determine the value of the company if it were sold as a “shell company” (i.e., no policies in force but with the license to write business in certain states). Value is derived from the states having limited the number of insurers licensed or from the significant expense of obtaining a new license from the state.
The fair value of all other tangible assets and liabilities approximates their carrying values at the acquisition date due to their short-term duration.
The following is a summary of our unaudited pro forma historical results as if Mercer Insurance Group had been acquired on January 1, 2010:
|
| | | | | | | |
| (In Thousands) | Year Ended December 31, |
| | 2011 | | 2010 |
| Revenue | $ | 741,833 |
| | $ | 744,630 |
|
Net income (1) | 8,139 |
| | 62,249 |
|
| Basic earnings per share | 0.31 |
| | 2.37 |
|
| Diluted earnings per share | 0.31 |
| | 2.36 |
|
(1) The year ended December 31, 2011, excludes transaction related expenses incurred that reduced net income by $11.9 million.
The unaudited pro forma results above have been prepared for comparative purposes only and do not purport to be indicative of the results of operations that actually would have resulted had the acquisition occurred at January 1, 2010, and they are not necessarily indicative of future operating results. Annualized revenues of Mercer Insurance Group were $145,868,000 for 2011. Total revenues and net loss recorded in the accompanying Consolidated Statements of Income related to Mercer Insurance Group was $109,043,000 and $14,650,000 for the year ended December 31, 2011, respectively.
United Fire Group, Inc. Form 10-K | 2011
In the fourth quarter of 2011, United Fire & Casualty Com panyCompany entered into a credit agreement with a syndicate of financial institutions as lenders party thereto, KeyBank National Association as administrative agent, lead arranger, sole book runner, swingline lender, and letter of credit issuer, and Bankers Trust Company as syndication agent. The four-year credit agreement provides for a $100,000,000 unsecured revolving credit facility that includes a $20,000,000 letter of credit subfacility and a swing line subfacility in the amount of up to $5,000,000.
During the term of this credit facility, we have the right to increase the total facility from $100,000,000 up to $125,000,000, provided that no event of default has occurred and is continuing and certain other conditions are satisfied. The credit facility is available for general corporate purposes, including working capital, acquisitions and liquidity purposes. Principal of the credit facility is due in full at maturity, on December 22, 2015. The interest rate is based on our monthly choice of either the London Interbank Offered Rate (“LIBOR”) or a base rate plus, in each case, a calculated margin amount. A commitment fee on each lender's unused commitment under the credit facility is also payable quarterly. The credit facility replaced a $50,000,000 revolving credit facility with Bankers Trust Company, which was repaid and terminated in connection with entering into the new credit agreement.
The credit agreement contains customary representations, covenants and events of default, including certain covenants that limit or restrict our ability to engage in certain activities. Subject to certain exceptions, these activities include restricting our ability to sell or transfer assets or enter into a merger or consolidate with another company, grant certain types of security interests, incur certain types of liens, impose restrictions on subsidiary dividends, enter into leaseback transactions, or incur certain indebtedness. The credit agreement contains certain financial covenants including covenants that require us to maintain a minimum consolidated net worth, a debt to capitalization ratio and minimum stockholders equity. The credit agreement contains terms that allowed the agreement to continue after the formation of the holding company, United Fire Group, Inc., which was completed on February 1, 2012.
We were in compliance with all covenants for the credit agreement as of December 31, 2011.
|
|
| NOTE 18. TRUST PREFERRED SECURITIES |
In connection with our acquisition of Mercer Insurance Group, we acquired three statutory business trusts formed by Mercer Insurance Group to issue floating rate capital securities (“Trust Preferred Securities”) and to invest the proceeds in junior subordinated debentures of Mercer Insurance Group. Mercer Insurance Group holds $488,000 of equity securities to capitalize the Trusts. The three trusts issued a total of $15,500,000 Trust Preferred Securities to the public. The following Trust Preferred Securities were outstanding as of December 31, 2011:
|
| | | | | | | | | |
| (In Thousands) | Issue Date | | Amount | | Interest Rate | | Maturity Date |
| Financial Pacific Statutory Trust I | 12/4/2002 | | $ | 5,032 |
| | LIBOR + 4.00% | | 12/4/2032 |
| Financial Pacific Statutory Trust II | 5/15/2003 | | 3,017 |
| | LIBOR + 4.10% | | 5/15/2033 |
| Financial Pacific Trust III | 9/30/2003 | | 7,577 |
| | LIBOR + 4.05% | | 9/30/2033 |
| Total Trust Preferred Securities | | | $ | 15,626 |
| | | | |
Financial Pacific Statutory Trust I (“Trust I”) is a Connecticut statutory business trust. Trust I issued 5,000,000 shares of the Trust Preferred Securities at a price of $1 per share for $5,000,000 and purchased $5,155,000 in junior subordinated debentures from Mercer Insurance Group that mature on December 4, 2032. The annual effective rate of interest at December 31, 2011 is 4.527 percent.
Financial Pacific Statutory Trust II (“Trust II”) is a Connecticut statutory business trust. Trust II issued 3,000,000 shares of the Trust Preferred Securities at a price of $1 per share for $3,000,000 and purchased $3,093,000 in junior subordinated debentures from Mercer Insurance Group that mature on May 15, 2033. The annual effective rate of interest at December 31, 2011 is 4.557 percent.
United Fire Group, Inc. Form 10-K | 20102011
Financial Pacific Trust III (“Trust III”) is a Delaware statutory business trust. Trust III issued 7,500,000 shares of the Trust Preferred Securities at a price of $1 per share for $7,500,000 and purchased $7,740,000 in junior subordinated debentures from Mercer Insurance Group that mature on September 30, 2033. The annual effective rate of interest at December 31, 2011 is 4.419 percent.
We have the right, at any time, so long as there are no continuing events of default, to defer payments of interest on the junior subordinated debentures for a period not exceeding 20 consecutive quarters, but not beyond the stated maturity of the junior subordinated debentures. To date no interest has been deferred. Total interest expense for the year ended December 31, 2011 was $1,055,000.
The Trust Preferred Securities are subject to mandatory redemption, in whole or in part, upon repayment of the junior subordinated debentures at maturity or their earlier redemption. We have the right to redeem the junior subordinated debentures after December 4, 2007 for Trust I, after May 15, 2008 for Trust II and after September 30, 2008 for Trust III. Mercer Insurance Group has not exercised these rights as of December 31, 2011.
Trust II was redeemed along with the corresponding junior subordinated debentures on February 15, 2012 for $3,129,000 and Trust I was redeemed along with the corresponding junior subordinated debentures on March 5, 2012 for $5,214,000.
United Fire Group, Inc. Form 10-K | 2011
|
|
| NOTE 19. INTANGIBLE ASSETS |
The carrying value of our goodwill was $15,091,000 at December 31, 2011.
Our major classes of intangible assets are presented in the following table:
|
| | | | | | | |
| | Year Ended December 31, |
| (In Thousands) | 2011 | | 2010 |
| Agency relationships | $ | 10,338 |
| | $ | 1,680 |
|
| Accumulated amortization - agency relationships | (1,743 | ) | | (1,250 | ) |
| | $ | 8,595 |
| | $ | 430 |
|
| | | | — |
|
| Software | $ | 3,260 |
| | $ | — |
|
| Accumulated amortization - software | (1,223 | ) | | — |
|
| | $ | 2,037 |
| | $ | — |
|
| | | | |
| Trade names | $ | 1,978 |
| | $ | — |
|
| Accumulated amortization - trade names | (99 | ) | | — |
|
| | $ | 1,879 |
| | $ | — |
|
| | | | |
| Favorable contract | $ | 286 |
| | $ | — |
|
| Accumulated amortization - favorable contract | (107 | ) | | — |
|
| | $ | 179 |
| | $ | — |
|
| | | | |
State insurance licenses (1) | $ | 3,020 |
| | $ | — |
|
| | | | |
| Net intangible assets | $ | 15,710 |
| | $ | 430 |
|
(1) The intangible asset for licenses has an indefinite life and therefore is not amortized.
The estimated useful lives assigned to our major classes of amortizable intangible assets are as follows:
|
| |
| Useful Life |
| Agency relationships | Fifteen years |
| Software | Two years |
| Trade names | Fifteen years |
| Favorable contract | Two years |
Our estimated aggregate amortization expense for each of the next five years is as follows:
|
| | | |
| In Thousands | |
| 2012 | $ | 2,542 |
|
| 2013 | 1,212 |
|
| 2014 | 769 |
|
| 2015 | 769 |
|
| 2016 | 769 |
|
United Fire Group, Inc. Form 10-K | 2011
Report of Independent Registered Public Accounting Firm on Financial Statements
Board of Directors and Stockholders
United Fire & Casualty CompanyGroup, Inc.
We have audited the accompanying consolidated balance sheets of United Fire & Casualty CompanyGroup, Inc. (United Fire) as of December 31, 20102011 and 20092010, and the related consolidated statements of income, stockholders’ equity, and cash flows for each of the three years in the period ended December 31, 20102011. Our audits also included the financial statement schedules of United Fire listed in Item 15(a)(2). These financial statements and schedules are the responsibility of United Fire’s management. Our responsibility is to express an opinion on these financial statements and schedules based on our audits.
We conducted our audits in accordance with the standards of the Public Company Acc ountingAccounting Oversight Board (United States). Those standards require that we plan and perform the audit to obtain reasonable assurance about whether the financial statements are free of material misstatement. An audit includes examining, on a test basis, evidence supporting the amounts and disclosures in the financial statements. An audit also includes assessing the accounting principles used and significant estimates made by management, as well as evaluating the overall financial statement presentation. We believe that our audits provide a reasonable basis for our opinion.
In our opinion, the financial statements referred to above present fairly, in all material respects, the consolidated financial position of United Fire & Casualty CompanyGroup, Inc. at December 31, 20102011 and 20092010, and the consolidated results of its operations and its cash flows for each of the three years in the period ended December 31, 20102011, in conformity with U.S. generally accepted accounting principles. Also, in our opinion, the related financial statement schedules, when considered in relation to the basic financial statements taken as a whole, present fairly in all material respects the information set forth therein.
We also have audited, in accordance with the standards of the Public Company Accounting Oversight Board ( United(United States), United Fire’s internal control over financial reporting as of December 31, 20102011, based on criteria established in Internal Control — Integrated Framework issued by the Committee of Sponsoring Organizations of the Treadway Commission and our report, dated February 28, 2011March 15, 2012, expressed an unqualified opinion thereon.
|
| |
| /s/Ernst & Young LLP | |
| Ernst & Young LLP | |
| | |
| Chicago, Illinois | |
February 28, 2011March 15, 2012 | |
United Fire & Casualty CompanyGroup, Inc. Form 10-K | 20102011
ITEM 9. CHANGES IN AND DISAGREEMENTS WITH ACCOUNTANTS ON ACCOUNTING AND FINANCIAL DISCLOSURE
None.
ITEM 9A. CONTROLS AND PROCEDURES
|
|
| EVALUATION OF DISCLOSURE CONTROLS AND PROCEDURES |
Our management, with the participation of our Chief Executive Officer and Chief Financial Officer, have evaluated the effectiveness of our disclos uredisclosure controls and procedures (as such term is defined in Rules 13a-15(e) and 15d-15(e) under the Securities Exchange Act of 1934, as amended) as of the end of the period covered by this report. Based on that evaluation, the chief executive officer and chief financial officer concluded that our disclosure controls and procedures, as of the end of the period covered by this report, were designed and functioning effectively to provide reasonable assurance that the information required to be disclosed by us in reports filed or submitted under the Exchange Act is recorded, processed, summarized and reported within the time periods specified in the Securities and Exchange Commission’s rules and forms. We believe that a control system, no matter how well designed and operated, cannot provide absolute assurance that the objectives of the control system are met, and no evaluation of controls can provide absolute assurance that all control issues and instances of fraud, if any, within a company have been detected .detected.
|
|
| MANAGEMENT’S ANNUAL REPORT ON INTERNAL CONTROL OVER FINANCIAL REPORTING |
The management of United Fire & Casualty CompanyGroup, Inc. is responsible for establishing and maintaining adequate internal control over financial reporting. United Fire & Casualty Company’sGroup, Inc.’s internal control over financial r eportingreporting is a process designed under the supervision of its Chief Executive Officer and Chief Financial Officer to provide reasonable assurance regarding the reliability of financial reporting and the preparation of its Consolidated Financial Statements for external purposes in accordance with GAAP.
As of December 31, 20102011, United Fire & Casualty Company’sGroup, Inc.’s management assessed the effectiveness of internal control over financial reporting based on the criteria for effective internal control over financial reporting established in “Internal Control — Integrated Framework,” issued by the Committee of Sponsoring Organizations of the Treadway Commission. Based on the assessment, United Fire & Casualty Company’sGroup, Inc.’s management determined that effective internal control over financial reporting is maintained as of December 31, 20102011, based on those criteria.
Ernst & Young LLP, the independent registered public accounting firm that audited the Consolidated Financial Statements of United Fire & Casualty CompanyGroup, Inc. included in this Annual Report on Form 10-K, has audited the effectiveness of internal control over financial reporting as of December 31, 20102011. Their report, which expresses an unqualified opinion on the effectiveness of United Fire & Cas ualty Company’sGroup, Inc.’s internal control over financial reporting as of December 31, 20102011, is included in this item under the heading “Report of Independent Registered Public Accounting Firm on Internal Control Over Financial Reporting.”
Dated: February 28, 2011March 15, 2012
|
| | |
| /s/ Randy A. Ramlo | |
| Randy A. Ramlo | |
| Chief Executive Officer | |
| | | |
| /s/ Dianne M. Lyons | |
| Dianne M. Lyons | |
| Chief Financial Officer | |
United Fire & Casualty CompanyGroup, Inc. Form 10-K | 20102011
|
|
| ATTESTATION REPORT OF THE REGISTERED PUBLIC ACCOUNTING FIRM |
Report of Independent Registered Public Accounting Firm on Internal Control Over Financial Reporting
Board of Directors and Stockholders
United Fire & Casualty CompanyGroup, Inc.
We have audited United F ire & Casualty Company’sFire Group, Inc.’s (United Fire) internal control over financial reporting as of December 31, 20102011, based on criteria established in Internal Control — Integrated Framework issued by the Committee of Sponsoring Organizations of the Treadway Commission (the COSO criteria). United Fire’s management is responsible for maintaining effective internal control over financial reporting, and for its assessment of the effectiveness of internal control over financial reporting included in the accompanying Management’s Annual Report on Internal Control Over Financial Reporting. Our responsibility is to express an opinion on the company’sUnited Fire’s internal control over financial reporting based on our audit.
We conducted our audit in accordance with the standards of the Public Company Accounting Oversight Board (United States). Those standards require that we plan and perform the audit to obtain reasonable assurance about whether effective internal control over financial reporting was maintained in all material respects. Our audit included obtaining an understanding of internal control over financial reporting, assessing the risk that a material weakness exists, testing and evaluating the design and operating effectiveness of internal control based on the assessed risk, and performing such other procedures as we considered necessary in the circumstances. We believe that our audit provides a reasonable basis for our opinion.
A company’s internal control over financial reporting is a process designed to provide reasonable assurance regarding the reliability of f inancialfinancial reporting and the preparation of financial statements for external purposes in accordance with U.S. generally accepted accounting principles. A company’s internal control over financial reporting includes those policies and procedures that (1) pertain to the maintenance of records that, in reasonable detail, accurately and fairly reflect the transactions and dispositions of the assets of the company; (2) provide reasonable assurance that transactions are recorded as necessary to permit preparation of financial statements in accordance with U.S. generally accepted accounting principles, and that receipts and expenditures of the company are being made only in accordance with authorizations of management and directors of the company; and (3) provide reasonable assurance regarding prevention or timely detection of unauthorized acquisition, use, or disposition of the company’s assets that could have a material effect on the financial statements.
Because of its inherent limitations, internal control over financial reporting may not prevent or detect misstatements. Also, projections of any evaluation of effectiveness to future periods are subject to the risk that controls may become inadequate because of changes in conditions, or that the degree of compliance with the policies or procedures may deteriorate.
In our opinion, United Fire & Casualty CompanyGroup, Inc. maintained, in all material respects, effective internal control over financial reporting as of December 31, 20102011, based on the COSO criteria.criteria.
We also have audited, in accordance with the standards of the Public Company Accounting Oversight Board (United States), the consolidated balance sheets of United Fire & Casualty CompanyGroup, Inc. as of December 31, 20102011 and 20092010 and the related consolidated statements of income, stockholders’ equity, and cash flows for each of the three years in the period ended December 31, 20102011 and our report dated February 28, 2011March 15, 2012 expressed an unqualified opinion thereon.
|
| |
| /s/ Ernst & Young LLP | |
| Ernst & Young LLP | |
| | |
| Chicago, Illinois | |
February 28, 2011March 15, 2012 | |
United Fire & Casualty CompanyGroup, Inc. Form 10-K | 20102011
|
|
| CHANGES IN INTERNAL CONTROL OVER FINANCIAL REPORTING |
There have been no changes in our internal control over financial reporting (as defined in Exchange Act Rules 13a-15 and 15d-15) that occurred during the fiscal quarter ended December 31, 20102011, that have materially affected, or are reasonably likely to materially affect, our internal control over financial reporting.
ITEM 9B. OTHER INFORMATION
None.
PART III
ITEM 10. DIRECTORS, EXECUTIVE OFFICERS AND CORPORATE GOVERNANCE
|
|
EXECUTIVE OFFICERS AND CERTAIN SIGNIFICANT EMPLOYEES AT UNITED FIRE |
The following table sets forth information as of December 31, 20102011, concerning the following executive officers and other significant employees:
|
| | |
| Name | Age | Position |
Randy A. Ramlo*Ramlo (1) | 4950 | President and Chief Executive Officer |
Michael T. Wilkins*Wilkins (1) | 4748 | Executive Vice President, Corporate Administration |
Dianne M. Lyons*Lyons (1) | 4748 | Vice President and Chief Financial Officer |
| Brian S. Berta | 4647 | Vice President, Great Lakes regional office |
David E. Conner*Conner (1) | 5253 | Vice President and Chief Claims Officer |
| Raymond E. Dudonis | 55 | Vice President, East Coast regional office |
Barrie W. Ernst*Ernst (1) | 5657 | Vice President and Chief Investment Officer |
| Kevin W. Helbing | 4546 | Controller |
| David L. Hellen | 5859 | Vice President, Denver regional office |
| Joseph B. Johnson | 5859 | Vice President, Gulf Coast regional office |
| David A. Lange | 5354 | Corporate Secretary and Fidelity and Surety Claims Manager |
| Janice A. Martin | 4950 | Treasurer |
| Scott A. Minkel | 4849 | Vice President, Information Services |
| Douglas L. Penn | 6162 | Vice President, Mi dwestMidwest regional office |
| Dennis J. Richmann | 4647 | Vice President, Fidelity and Surety |
Neal R. Scharmer*Scharmer (1) | 5455 | Vice President, General Counsel and Corporate Secretary |
Michael J. Sheeley (1) | 51 | Vice President and Chief Operating Officer, United Life Insurance Company |
| Allen R. Sorensen | 5253 | Vice President, Corporate Underwriting |
| Colleen R. Sova | 5556 | Vice President, e-Solutions |
| Timothy G. Spain | 5859 | Vice President, Human Resources |
*(1) Executive Officers
A brief description of the business experience of these officers follows.
United Fire & Casualty Company Form 10-K | 2010
Randy A. Ramlo was appointed our President and Chief Executive Officer in May 2007. He previously served us as Chief Operating Officer from May 2006 until May 2007, as Executive Vice President from May 2004 until May 2007, and as Vice President, Fidelity and Surety, from November 2001 until May 2004. He also worked as an underwriting manager in our Great Lakes region. We have employed Mr. Ramlo since 1984.
Michael T. Wilkins became our Executive Vice President, Corporate Administration, in May 2007. He was our
United Fire Group, Inc. Form 10-K | 2011
Senior Vice President, Corporate Administration, from May 2004 u ntiluntil May 2007, our Vice President, Corporate Administration, from August 2002 until May 2004 and the resident Vice President in our Lincoln regional office from 1998 until 2002. Prior to 1998, Mr. Wilkins held various other positions within our companythe Company since joining us in 1985.
Dianne M. Lyons was appointed Chief Financial Officer in May 2006. She was appointed Vice President in May 2003 and served as our Controller from 1999 until May 2006. Ms. Lyons has been employed by us in the accounting department since 1983.
Brian S. Berta is Vice President of our Great Lakes region, a position he has held since May 2006. Mr. Berta previously servedworked as Underwriting Manageran underwriting manager in our Great Lakes region and has been employed by us since 199 3.1993.
David E. Conner was appointedhas served as our Vice President and Chief Claims Officer effectivesince January 1, 2005. Mr. Conner has served in various capacities within the claims department, including Claims Managerclaims manager and Assistant Vice President, since joining us in 1998.
Raymond E. Dudonis was appointed Vice President of our East Coast regional office, effective August 18, 2011. Mr. Dudonis had been a member of the Mercer Insurance Group's management team since December of 2006, serving as an Assistant Vice President of Underwriting in its Pennington, New Jersey office at the time of the acquisition in March of 2011. Mr. Dudonis has over 30 years of experience in the insurance industry.
Barrie W. Ernst is our Vice President and Chief Investment Officer. He joined us in August 2002. Previously, Mr. Ernst served as Senior Vice President of SCI Financial Group, Cedar Rapids, Iowa, where he worked from 1980 to 2002. SCI Financial Group was a regional financial services firm providing brokerage, insurance and related services to its clients.
Kevin W. Helbing joined us as our Controller in February 2008. Mr. Helbing was previously employed by Marsh U.S.A. in Iowa City, Iowa, as Vice President, Treasury, from April 2007 until February 2008. From March 2001 until April 2007, Mr. Helbing was employed by Marsh Advantage America, first as an accounting manager and then as Assistant Vice President and Controller. Marsh U.S.A. and Marsh Advantage America design, manage and administer insurance and risk programs for businesses.
David L. Hellen serves as Vice President of our Denver regional office; a position he has held since 1988. We have employed Mr. Hellen since 1975.
Joseph B. Johnson was named Vice President of our Gulf Coast regional offic eoffice in May 2007, after having served as branch manager since August 2006. Mr. Johnson has over 25 years of experience in the insurance industry. From August 2001 until August 2006, he served as Vice President of Insurance Operationsinsurance operations for Beacon Insurance Group in Wichita Falls, Texas.
David A. Lange has served as one of our Corporate Secretaries since 1997. He has been our Surety Claims Managersurety claims manager since 1987. Mr. Lange began his employment with us in 1981, with an interruption in service from 1984 until 1987.
Janice A. Martin was named Treasurer in May 2008. Ms. Martin has served in various capacities since joining us in 1988, including as Tax Accountanta tax accountant and as Tax Managertax manager since January 2006.
Scott A. Minkel is our Vice President, Information Services, a position he has held since May 2007. Mr. Minkel previously served in various capacities within the information services department since joining us in 1984, including as Assistant Vice President, Director of Information Services and Programming Manager.programming manager.
Douglas L. Penn is Vice President of our Midwest regional office, a position he has held since May 2007. Since joining us in 1974, Mr. Penn has served in a variety of capacities, including as Underwriting Manager, Marketing Representativean underwriting manager, marketing representative and Commercial Underwriter.commercial underwriter.
Dennis J. Richmann was named our Vice President, Fidelity and Surety, in May 2006. He has been employed by us in various capacities since joining us in August 1988, most recently as Surety Bond Underwriting Manager.surety bond underwriting manager.
United Fire & Casualty Company Form 10-K | 2010
Neal R. Scharmer was appointed our Vice President and General Counsel in May 2001 and Corporate Secretary in
United Fire Group, Inc. Form 10-K | 2011
May 2006. He joined us in 1995.
Michael J. Sheeley was appointed Vice President and Chief Operating Officer of our life insurance subsidiary, United Life Insurance Company, on March 8, 2011. Prior to assuming leadership of United Life Insurance Company, Mr. Sheeley served us as personal lines underwriting manager from 1991 to 2011. He also served us in various capacities including commercial underwriting and claims since joining us in 1985.
Allen R. Sorensen became our Vice President, Corporate Underwriting, in May 2006. Mr. Sorensen began his career with us in June 1981 and has served us in various capacities, including underwriting, product support and product automation.
Colleen R. Sova serves as Vice President in our e-Soluti onse-Solutions department, a position she has held since May 2007. Ms. Sova has previously served us in a variety of capacities since joining us in 1981, including as Assistant Vice President and Director of e-Solutions, Director of Claims Administration, Claims Supervisorclaims supervisor and Claims Adjuster.claims adjuster.
Timothy G. Spain became our Vice President, Human Resources, in July 2006. Mr. Spain began his employment with us in December 1994 as Training Director.our training director.
The information required by this Item regarding our directors and corporate governance matters is included under the captions “Board of Directors,” subheading “Corporate Governance” and “Proposal 1-Election of Directors,” in our 20112012 Proxy Statement, and is incorporated herein by reference. The information required by this Item regarding our Code of Ethics is included under the caption “Board of Directors,” subheading “Corporate Governance,” subpart “Code of Ethics” in our 20112012 Proxy Statement and is incorporated herein by reference. The information required by this Item regarding compliance with Section 16(a) of the Exchange Act is included under the caption “Section 16(a) Beneficial Ownership Reporting Compliance” in our 20112012 Proxy Stateme ntStatement and is incorporated herein by reference.
ITEM 11. EXECUTIVE COMPENSATION
The information required under this Item regarding our executive compensation and our Compensation Committee Report is included under the captions “Executive Compensation” and “Report of the Compensation Committee” in our 20112012 Proxy Statement and is incorporated her einherein by reference. The information required by this Item regarding Compensation Committee interlocks and insider participation is included under the caption “Board of Directors,” subheading “Compensation Committee,” subpart “Compensation Committee Interlocks and Insider Participation” in our 20112012 Proxy Statement and is incorporated herein by reference.
ITEM 12. SECURITY OWNERSHIP OF CERTAIN BENEFICIAL OWNERS AND MANAGEMENT AND RELATED STOCKHOLDERS MATTERS
The information required under this Item is included under the captions “Security Ownership of Certain Beneficial Owners,” “Security Ownership of Management” and “Securities Authorized for Issuance under Equity Compensation Plans” in our 20112012 Proxy Statement and is incorporated herein by reference.
ITEM 13. CERTAIN RELATIONSHIPS AND RELATED TRANSACTIONS, AND DIRECTOR INDEPENDENCE
The information required under this Item is included under the caption “Transactions with Related Persons” in our 20112012 Proxy Statement and is incorporated herein by reference.
ITEM 14. PRINCIPAL ACCOUNTING FEES AND SERVICES
The information requ iredrequired under this Item is included under the caption “Proposal Two - Ratification of the Appointment of Independent Registered Public Accounting Firm,” subheading “Information About Our Independent Registered Public Accounting Firm” in our 20112012 Proxy Statement and is incorporated herein by reference.
United Fire & Casualty CompanyGroup, Inc. Form 10-K | 20102011
PART IV
ITEM 15. EXHIBITS, FINANCIAL STATEMENT SCHEDULES
We have filed the following documents as part of this Annual Report on Form 10-K:
|
| |
| | Page |
| |
| |
| |
| |
| |
| |
| | |
| |
| |
| |
| |
| |
| |
| All other schedules have been omitted as not required, not applicable, not deemed material or because the information is included the Consolidated Financial Statements. |
| (a) 3. See the Exhibit Index immediately following the signature page of this Annual Report on Form 10-K. | |
United Fi re & Casualty CompanyFire Group, Inc. Form 10-K | 20102011
Schedule I. Summary of Investments — Other than Investments in Related Parties
| | December 31, 2010 | (In Thousands) | |
| | December 31, 2011 | | (In Thousands) |
| | Cost or Amortized Cost | | | | Amounts at Which Shown in Balance Sheet | Cost or Amortized Cost | | | | Amounts at Which Shown in Balance Sheet |
| Type of Investment | | Fair Value | | | Fair Value | |
| Fixed maturities | | | | | | | | | | |
| Bonds | | | | | | | | | | |
| United States Government and government agencies and authorities | $ | 160,275 | | | $ | 162,367 | | | $ | 162,313 | | $ | 252,369 |
| | $ | 258,858 |
| | $ | 258,831 |
|
| States, municipalities and political subdivisions | 593,872 | | | 625,055 | | | 625,051 | | 690,778 |
| | 751,837 |
| | 751,846 |
|
| Foreign governments | 156,843 | | | 164,960 | | | 164,960 | | 209,773 |
| | 217,721 |
| | 217,721 |
|
| Public utilities | 264,931 | | | 278,308 | | | 278,308 | | 254,822 |
| | 270,071 |
| | 270,071 |
|
| All other corporate bonds | 1,018,546 | | | 1,064,181 | | | 1,064,181 | | 1,169,018 |
| | 1,212,892 |
| | 1,212,892 |
|
| Redeemable preferred stock | 2,885 | | | 2,866 | | | 2,866 | | 3,598 |
| | 3,484 |
| | 3,484 |
|
| Total fixed maturities | $ | 2,197,352 | | | $ | 2,297,737 | | | $ | 2,297,679 | | $ | 2,580,358 |
| | $ | 2,714,863 |
| | $ | 2,714,845 |
|
| Equity securities | | | | | | | | | | |
| Common stocks | | | | | | | | | | |
| Public utilities | $ | 6,849 | | | $ | 12,758 | | | $ | 12,758 | | $ | 7,231 |
| | $ | 14,735 |
| | $ | 14,735 |
|
| Banks, trusts and insurance companies | 12,647 | | | 58,462 | | | 58,462 | &nb sp; | 15,199 |
| | 54,976 |
| | 54,976 |
|
| Industrial, miscellaneous and all other | 33,182 | | | 77,096 | | | 77,096 | | 42,495 |
| | 86,450 |
| | 86,450 |
|
| Nonredeemab le preferred stocks | 1,461 | | | 1,390 | | | 1,390 | | |
| Nonredeemable preferred stocks | | 3,634 |
| | 3,290 |
| | 3,290 |
|
| Total equity securities | $ | 54,139 | | | $ | 149,706 | | | $ | 149,706 | | $ | 68,559 |
| | $ | 159,451 |
| | $ | 159,451 |
|
| Mortgage loans on real estate | $ | 6,497 | | | $ | 7,658 | | | $ | 6,497 | | $ | 4,829 |
| | $ | 5,219 |
| | $ | 4,829 |
|
| Policy loans | 7,875 | | | 7,875 | | | 7,875 | | 7,209 |
| | 7,209 |
| | 7,209 |
|
| Other long-term investments | 20,041 | | | 20,041 | | | 20,041 | | 20,574 |
| | 20,574 |
| | 20,574 |
|
| Short-term investments | 1,100 | | | 1,100 | | | 1,100 | | 1,100 |
| | 1,100 |
| | 1,100 |
|
| Total investments | $ | 2,287,004 | | | $ | 2,484,117 | | | $ | 2,482,898 | | $ | 2,682,629 |
| | $ | 2,908,416 |
| | $ | 2,908,008 |
|
United Fire & Casualty CompanyGroup, Inc. Form 10-K | 20102011
Schedule III. Supplement arySupplementary Insurance Information
| | | (In Thousands) | Deferred Policy Acquisition Costs | | Future Policy Benefits, Losses, Claims and Loss Expenses | | Unearned Premiums | | Earned Premium Revenue | | Investment Income, Net | | Benefits, Claims, Losses and Settlement Expenses | | Amortization of Deferred Policy Acquisition Costs | | Other UnderwritingExpenses | | Interest on Policyholders' Accounts | | Premiums Written (2) | Deferred Policy Acquisition Costs | | Future Policy Benefits, Losses, Claims and Loss Expenses | | Unearned Premiums | | Earned Premium Revenue | | Investment Income, Net | | Benefits, Claims, Losses and Settlement Expenses | | Amortization of Deferred Policy Acquisition Costs (4) | | Other Underwriting Expenses | | Interest on Policyholders' Accounts | | Premiums Written (2) |
| Year Ended December 31, 2011 | | | | | | | | | | | | | | | | | | | | |
| Property and casualty | | $ | 60,668 |
| | $ | 945,051 |
| | $ | 288,868 |
| | $ | 533,771 |
| | $ | 35,513 |
| | $ | 407,831 |
| | $ | 143,952 |
| | $ | 46,404 |
| | $ | — |
| | $ | 551,923 |
|
Life, accident and health (1) | | 45,986 |
| | 1,476,281 |
| | 123 |
| | 53,012 |
| | 73,981 |
| | 55,125 |
| | 9,224 |
| | 12,353 |
| | 42,834 |
| | — |
|
| Total | | $ | 106,654 |
| | $ | 2,421,332 |
| | $ | 288,991 |
| | $ | 586,783 |
| | $ | 109,494 |
| | $ | 462,956 |
| | $ | 153,176 |
| | $ | 58,757 |
| | $ | 42,834 |
| | $ | 551,923 |
|
| Year Ended December 31, 2010 | | &nb sp; | | | | | | | | | | | | | | | | | | | | | | | | | | | | | | | | | | | | |
Property and casualty (3) | $ | 44,681 | | | $ | 603,090 | | | $ | 200,151 | | | $ | 420,373 | | | $ | 34,787 | | | $ | 289,437 | | | $ | 102,636 | | | $ | 28,003 | | | $ | — | | & nbsp; | $ | 414,908 | | $ | 44,681 |
| | $ | 603,090 |
| | $ | 200,151 |
| | $ | 420,373 |
| | $ | 34,787 |
| | $ | 289,437 |
| | $ | 100,310 |
| | $ | 30,329 |
| | $ | — |
| | $ | 414,908 |
|
Life, accident and health (1) | 42,843 | | | 1,389,331 | | | 190 | | | 49,100 | | | 76,898 | | | 47,588 | | | 10,735 | | | 11,318 | | | 42,988 | | | — | | 42,843 |
| | 1,389,331 |
| | 190 |
| | 49,100 |
| | 76,898 |
| | 47,588 |
| | 10,735 |
| | 11,318 |
| | 42,988 |
| | — |
|
| Total | $ | 87,524 | | | $ | 1,992,421 | | | $ | 200,341 | | | $ | 469,473 | | | $ | 111,685 | | | $ | 337,025 | | | $ | 113,371 | | | $ | 39,321 | | | $ | 42,988 | | | $ | 414,908 | | $ | 87,524 |
| | $ | 1,992,421 |
| | $ | 200,341 |
| | $ | 469,473 |
| | $ | 111,685 |
| | $ | 337,025 |
| | $ | 111,045 |
| | $ | 41,647 |
| | $ | 42,988 |
| | $ | 414,908 |
|
| Year Ended December 31, 2009 | | | | | | | | | | | | | | | | | | | | | | | | | | | | | | | | | | | | | | |
Property and casualty (3) | $ | 45,562 | & nbsp; | | $ | 606,045 | | | $ | 205,703 | | | $ | 435,677 | | | $ | 31,542 | | | $ | 365, 721 | | | $ | 105,606 | | | $ | 30,553 | | | $ | — | | | $ | 424,827 | | $ | 45,562 |
| | $ | 606,045 |
| | $ | 205,703 |
| | $ | 435,677 |
| | $ | 31,542 |
| | $ | 365,721 |
| | $ | 105,606 |
| | $ | 30,553 |
| | $ | — |
| | $ | 424,827 |
|
Life, accident and health (1) | 46,943 | | | 1,321,600 | | | 307 | | | 42,821 | | | 74,533 | | | 40,670 | | | 9,287 | | | 8,745 | | | 41,652 | | | — | | 46,943 |
| | 1,321,600 |
| | 307 |
| | 42,821 |
| | 74,533 |
| | 40,670 |
| | 9,287 |
| | 8,745 |
| | 41,652 |
| | — |
|
| Total | $ | 92,505 | | | $ | 1,927,645 | | | $ | 206,010 | | | $ | 478,498 | | | $ | 106,075 | | | $ | 406,391 | & nbsp; | | $ | 114,893 | | | $ | 39,298 | | | $ | 41,652 | | | $ | 424,827 | | $ | 92,505 |
| | $ | 1,927,645 |
| | $ | 206,010 |
| | $ | 478,498 |
| | $ | 106,075 |
| | $ | 406,391 |
| | $ | 114,893 |
| | $ | 39,298 |
| | $ | 41,652 |
| | $ | 424,827 |
|
| Year Ended December 31, 2008 | | | | | | | | | | | | | | | | | | | | |
Property and casualty (3) | $ | 52,222 | | | $ | 586,109 | | | $ | 216,438 | | | $ | 465,581 | | | $ | 33,452 | | | $ | 393,349 | | | $ | 117,590 | | | $ | 19,146 | | | $ | — | | | $ | 459,571 | | |
Life, accident and health (1) | 106,043 | | | 1,167,665 | | | 528 | | | 37,794 | | | 74,125 | | | 36,447 | | | 11,568 | | | 9,106 | | | 40,177 | | | — | | |
| Total | $ | 158,265 | | | $ | 1,753,774 | | | $ | 216,966 | | | $ | 503,375 | | | $ | 107,577 | | | $ | 429,796 | | | $ | 129,158 | | | $ | 28,252 | | | $ | 40,177 | | | $ | 459,571 | | |
| |
| (1) | Annuity deposits are included in future policy benefits, losses, claims and loss expenses. |
| |
| (2) | Pursuant to Regulation S-X, premiums written does not apply to life insurance companies. Please refer to the Statutory Financial MeasuresMeasurement of Results section of Part II, Item 7, for further explanation of this measure. |
| |
| (3) | Disaster charges and other related expenses incurred in 2010, and 2009 and 2008 are not included in this table. Please refer to the Consolidated Statements of Income for this amount. |
| |
| (4) | For 2011, this line includes amortization of the value of business acquired asset that was recorded as a result of our acquisition of Mercer Insurance Group totaling $25,763,000. |
United Fire & Casualty CompanyGroup, Inc. Form 10-K | 20102011
Schedule IV. Reinsurance
| | | (In Thousands) | Gross Amount | | Ceded to Other Companies | | Assumed From Other Companies | | Net Amount | | Percentage of Amount Assumed to Net Earned | Gross Amount | | Ceded to Other Companies | | Assumed From Other Companies | | Net Amount | | Percentage of Amount Assumed to Net Earned |
| Year Ended December 31, 2011 | | |
| | |
| | |
| | |
| | |
| Life insurance in force | | $ | 4,916,833 |
| | $ | 974,556 |
| | $ | 42 |
| | $ | 3,942,319 |
| | |
| Premiums earned | | | | | | | | | | |
| Property and casualty insurance | | $ | 564,506 |
| | $ | 45,604 |
| | $ | 14,869 |
| | $ | 533,771 |
| | 2.79 | % |
| Life, accident and health insurance | | 55,330 |
| | 2,318 |
| | — |
| | 53,012 |
| | — | % |
| Total | | $ | 619,836 |
| | $ | 47,922 |
| | $ | 14,869 |
| | $ | 586,783 |
| | 2.53 | % |
| Year Ended December 31, 2010 | | | | | | | | | | | | | | | | | | | | | | |
| Life insurance in force | $ | 4,804,095 | | | $ | 959,145 | | | $ | 72 | | | $ | 3,845,022 | | | | $ | 4,804,095 |
| | $ | 959,145 |
| | $ | 72 |
| | $ | 3,845,022 |
| | |
| Premiums earned | | | | | | | | | | | | | | | | | | |
| Property and casualty insurance | $ | 441,303 | | | $ | 32,598 | | | $ | 11,668 | | | $ | 420,373 | | | 2.78 | % | $ | 441,303 |
| | $ | 32,598 |
| | $ | 11,668 |
| | $ | 420,373 |
| | 2.78 | % |
| Life, accident and health insurance | 51,222 | | | 2,123 | | | 1 | | | 49,100 | | | 0.00 | % | 51,222 |
| | 2,123 |
| | 1 |
| | 49,100 |
| | — | % |
| Total | $ | 492,525 | | | $ | 34,721 | | | $ | 11,669 | | | $ | 469,473 | | | 2.49 | % | $ | 492,525 |
| | $ | 34,721 |
| | $ | 11,669 |
| | $ | 469,473 |
| | 2.49 | % |
| Year Ended December 31, 2009 | | | | | | | | | | | | | | | | | | |
| Life insurance in force | $ | 4,715,138 | | | $ | 910,775 | | | $ | 120 | | | $ | 3,804,483 | | | | $ | 4,715,138 |
| | $ | 910,775 |
| | $ | 120 |
| | $ | 3,804,483 |
| | |
| Premiums earned | | | | | | | | | | | | | | | | | | |
| Property and casualty insurance | $ | 464,698 | | & nbsp; | $ | 36,925 | | | $ | 7,904 | | | $ | 435,677 | | | 1.81 | % | $ | 464,698 |
| | $ | 36,925 |
| | $ | 7,904 |
| | $ | 435,677 |
| | 1.81 | % |
| Life, accident and health insurance | 44,754 | | | 1,935 | | | 2 | | | 42,821 | | | 0.00 | % | 44,754 |
| | 1,935 |
| | 2 |
| | 42,821 |
| | — | % |
| Total | $ | 509,452 | | | $ | 38,860 | | | $ | 7,906 | | | $ | 478,498 | | | 1.65 | % | $ | 509,452 |
| | $ | 38,860 |
| | $ | 7,906 |
| | $ | 478,498 |
| | 1.65 | % |
| Year Ended December 31, 2008 | | | | | | | | | | |
| Life insurance in force | $ | 4,588,688 | | | $ | 836,784 | | | $ | 322 | | | $ | 3,752,226 | | | | |
| Premiums earned | | | | | | | | | | |
| Property and casualty insurance | $ | 490,840 | | | $ | 38,212 | | | $ | 12,953 | | | $ | 465,581 | | | 2.78 | % | |
| Life, accident and health insurance | 39,513 | | | 1,729 | | | 10 | | | 37,794 | | | 0.03 | % | |
| Total | $ | 530,353 | | | $ | 39,941 | | | $ | 12,963 | | | $ | 503,375 | | | 2.58 | % | |
United Fire & Casualty CompanyGroup, Inc. Form 10-K | 20102011
Schedule V. Valuation And Qualifying Accounts
| | | (In Thousands) | | Balance at beginning of period | | Charged to costs and expenses | &nb sp; | Deductions | | Balance at end of period | Balance at beginning of period | | Charged to costs and expenses | | Deductions | | Balance at end of period |
| Description | | | |
| Allowance for bad debts | | | | | | | | | | | | | | | |
| Year Ended December 31, 2011 | | $ | 1,001 |
| | $ | — |
| | $ | 176 |
| | $ | 825 |
|
| Year Ended December 31, 2010 | | $ | 688 | | | $ | 313 | | | $ | — | | | $ | 1,001 | | 688 |
| | 313 |
| | — |
| | 1,001 |
|
| Year Ended December 31, 2009 | | 655 | | | 33 | | | — | | | 688 | | 655 |
| | 33 |
| | — |
| | 688 |
|
| Year Ended December 31, 2008 | | 631 | | | 24 | | | — | | | 655 | | |
| | | | | | | | | | | | | | | | |
Deferred tax asset valuation allowance (1) | | | | | | | | | | | | | | | |
| Year Ended December 31, 2011 | | $ | 4,004 |
| | $ | — |
| | $ | 548 |
| | $ | 3,456 |
|
| Year Ended December 31, 2010 | | $ | 5,647 | | | $ | — | | | $ | 1,643 | | | $ | 4,004 | | 5,647 |
| | — |
| | 1,643 |
| | 4,004 |
|
| Year Ended December 31, 2009 | | 5,647 | | | — | | | — | | | 5,647 | | 5,647 |
| | — |
| | — |
| | 5,647 |
|
| Year Ended December 31, 2008 | | 5,647 | | | — | | | — | | | 5,647 | | |
| |
| (1) | Recorded in connection with the purchase of American Indemnity Financial Corporation in 1999. |
United Fire & Casualty CompanyGroup, Inc. Form 10-K | 20102011
Schedule VI. Supplemental Information Concerning Property and Casualty Insurance Operations
| | | (In Thousands) | | | | | | | | | | | | | | | | | | | | | | | | | | | | | | | | | | | | | | | | | | |
| Affiliation with Registrant: United Fire and consolidated property and casualty subsidiaries | | | | | | | | | | | | | Claims and Claim Adjustment Expenses Incurred Related to: | | Amortization of Deferred Policy Acquisi tion Costs | | | | | |
| | | Reserves for Unpaid Claims and Claim Adjustment Expenses | | | | | | Net Realized Investment Gains (Losses) | | | | | | | |
| Deferred Policy Acquisition Costs | | | | | | Net Investment Income | | Claims and Claim Adjustment Expenses Incurred Related to: | | Amortization of Deferred Policy Acquisi tion Costs | | |
| | Reserves for Unpaid Claims and Claim Adjustment Expenses | Unearned Premiums | | Earned Premiums | | Net Realized Investment Gains (Losses) | Current Year | Paid Claims and Claim Adjustment Expenses | Current Year | | Premiums Written | Amortization of Deferred Policy Acquisi tion Costs | |
| Affiliation with Registrant: United Fire & Casualty Company and consolidated property and casualty subsidiaries | | | | | | | | | | | | | | Claims and Claim Adjustment Expenses Incurred Related to: | | Amortization of Deferred Policy Acquisition Costs (1) | | | | |
| | | Reserves for Unpaid Claims and Claim Adjustment Expenses | | | | | | Net Realized Investment Gains (Losses) | | | | | | |
| Deferred Policy Acquisition Costs | | | | | | Net Investment Income | | Claims and Claim Adjustment Expenses Incurred Related to: | | Amortization of Deferred Policy Acquisition Costs (1) | |
| | Reserves for Unpaid Claims and Claim Adjustment Expenses | Unearned Premiums | | Earned Premiums | | Net Realized Investment Gains (Losses) | Current Year | Paid Claims and Claim Adjustment Expenses | Current Year | | Premiums Written | Amortization of Deferred Policy Acquisition Costs (1) |
| 2011 | | $ | 60,668 |
| | $ | 945,051 |
| | $ | 533,771 |
| | $ | 3,081 |
| $ | 35,513 |
| 468,926 | (61,095 | ) | $ | 143,952 |
| 399,828 |
| 2010 | $ | 44,681 | | | $ | 603,090 | | | $ | 200,151 | | | $ | 420,373 | | | $ | 3,593 | | | $ | 34,787 | | | $ | 335,315 | | | $ | (45,878 | ) | | $ | 102,636 | | | $ | 297,638 | | | $ | 414,908 | | $ | 44,681 |
| | $ | 603,090 |
| | $ | 420,373 |
| | $ | 3,593 |
| $ | 34,787 |
| 335,315 |
| | $ | (45,878 | ) | | $ | 100,310 |
| | $ | 297,638 |
| 2009 | $ | 45,562 | | | $ | 606,045 | | | $ | 205,703 | | | $ | 435,677 | | | $ | (6,815 | ) | | $ | 31,542 | | | $ | 339,507 | | | $ | 26,215 | | | $ | 105,606 | | | $ | 327,032 | | | $ | 424,827 | | $ | 45,562 |
| | $ | 606,045 |
| | $ | 205,703 |
| | $ | 435,677 |
| | $ | (6,815 | ) | | $ | 31,542 |
| | $ | 339,507 |
| | $ | 26,215 |
| | $ | 105,606 |
| | $ | 327,032 |
| | $ |
| 2008 | $ | 52,222 | | | $ | 586,109 | | | $ | 216,438 | | | $ | 465,581 | | | $ | 1,879 | | | $ | 33,452 | | | $ | 392,801 | | | $ | 548 | | | $ | 117,590 | | | $ | 317,031 | | | $ | 459,571 | | |
| |
| (1) | For 2011, this line includes amortization of the value of business acquired asset that was recorded as a result of our acquisition of Mercer Insurance Group totaling $25,763,000. |
United Fire & Casualty CompanyGroup, Inc. Form 10-K | 20102011
SIGNATURES
Pursuant to the requirements of Section 13 or 15(d) of the Securities Exchange Act of 1934, the Registrant has duly caused this report to be signed on its behalf by the undersigned, thereunto duly authorized.
UNITED FIRE & CASUALTY COMPANYGROUP, INC.
|
| |
| By: | /s/ Randy A. Ramlo |
| | Randy A. Ramlo, Chief Executive Officer, Director and Principal Executive Officer |
| | |
| Date: | 2/28/20113/15/2012 |
| | |
| By: | /s/ Dianne M. Lyons |
| | Dianne M. Lyons, Vice President, Chief Financial Officer and Principal Accounting Officer |
| | |
| Date: | 2/28/20113/15/2012 |
Pursuant to the requirements of the Securities Exchange Act of 1934, this report has been signed below by the following persons on behalf of the Registrant and in the capacities and on the dates indicated.
|
| | | | |
| By | /s/ Jack B. Evans | | By | /s/ Christopher R. Drahozal |
| | Jack B. Evans, Chairman and Director | | | Christopher R. Drahozal, Director |
| | | | | |
| Date | 2/28/20113/15/2012 | | Date | 2/28/20113/15/2012 |
| | | | | |
| By | /s/ Thomas W. Hanley | | By: | /s/ Douglas M. Hultquist |
| | &nbs p; | | | |
| | Thomas W. Hanley, Director | | | Douglas M. Hultquist, Director |
| | | | | |
| Date | 2/28/20113/15/2012 | | Date | 2/28/20113/15/2012 |
| | | | | |
| By | /s/ Casey D. Mahon | | By | /s/ George D. Milligan |
| | | | | |
| | Casey D. Mahon, Director | | | George D. Milligan, Director |
| | | | | |
| Date | 2/28/20113/15/2012 | | Date | 2/28/20113/15/2012 |
& nbsp; | | | | |
| By | /s/ James W. Noyce | | By | /s/ Mary K. QuassMichael W. Phillips |
| | | | | |
| | James W. Noyce, Director | | | Mary K. Quass,Michael W. Phillips, Director |
| | | | | |
| Date | 2/28/20113/15/2012 | | Date | 2/28/20113/15/2012 |
| | | | | |
| By | /s/ John A. RifeMary K. Quass | | By | /s/ Kyle D. SkogmanJohn A. Rife |
| | | | | |
| | Mary K. Quass, Director | | | John A. Rife, Vice Chairman and Director | | | Kyle D. Skogman, Director |
| | | | | |
| Date | 2/28/20113/15/2012 | | Date | 2/28/20113/15/2012 |
| | | | | |
| By | /s/ Kyle D. Skogman | | By | /s/ Frank S. Wilkinson Jr. | | | |
| | | | | |
| | Kyle D. Skogman, Director | | | Frank S. Wilkinson Jr., Director | | | |
| | | | | |
| Date | 2/28/20113/15/2012 | | Date | 3/15/2012 |
United Fire & Ca sualty CompanyGroup, Inc. Form 10-K | 20102011
Exhibit Index
| | | | | | | | | Incorporated by reference | | | | | | Incorporated by reference |
| Exhibit number | Exhibit number | | Exhibit description | Filed herewith | | Form | | Period ending | | Exhibit | | Filing date | Exhibit number | | Exhibit description | Filed herewith | | Form | | Period ending | | Exhibit | | Filing date |
| 2.1 | | | | Agreement and Plan of Merger among United Fire, Acquisition Corp. and Mercer | | | 8-K | | 2.1 | | | 12/1/2010 |
| | Agreement and Plan of Merger among United Fire & Casualty Company, Red Oak Acquisition Corp.and Mercer Insurance Group, Inc. | | 8-K | | 2.1 |
| | 12/1/2010 |
| 3.1 | | | | Fourth Restated Articles of Incorporation | | | 10-Q | | 6/30/2008 | | 3.1 | | | 8/4/2008 |
| | | Articles of Incorporation of United Fire Group, Inc. | | | S-4 | | Annex II |
| | 5/25/2011 |
| 3.2 | | | | First Amendment to Fourth Restated Articles of Incorporation | | | 10-Q | | 6/30/2008 | | 3.2 | | | 8/4/2008 |
| | | Bylaws of United Fire Group, Inc. | | | S-4 | | Annex II |
| | 5/25/2011 |
| 3.3 | | | | Second Amendment to Fourth Restated Articles of Incorporation | | | 10-Q | | 6/30/2008 | | 3.3 | | | 8/4/2008 | |
| 3.4 | | | | Third Amendment to Fourth Restated Articles of Incorporation | | | 10-Q | | 6/30/2008 | | 3.4 | | | 8/4/2008 | |
| 3.5 | | | | Byl aws of United Fire & Casualty Company | | | 8-K | & nbsp; | | | 99.2 | | | 11/20/2009 | |
| 10.1 | | | | United Fire & Casualty Company Employee Stock Purchase Plan | | | 10-K | | 12/31/2007 | | 10.2 | | | 2/27/2008 |
| | | Employee Stock Purchase Plan | | | 10-K | | 12/31/2007 | | 10.2 |
| | 2/27/2008 |
| 10.2 | | * | | United Fire & Casualty Company Non-qualified Non-employee Director Stock Option and Restricted Stock Plan | | | S-8 | | | | 4.1 | | | 11/23/2005 |
| * | | 2005 Non-qualified Non-employee Director Stock Option and Restricted Stock Plan | | | S-8 | | | | 4.1 |
| | 11/23/2005 |
| 10.3 | | * | | Description of employmen t arrangement between United Fire & Casualty Company and Randy A. Ramlo | | | 10-Q | | 6/30/2007 | | 10.1 | | | 7/27/2007 | |
| 10.4 | | * | | United Fire & Casualty Annual Incentive Plan (Amended October 19, 2007) | | | 10-Q | | 9/30/2007 | | 10.2 | | | 10/25/2007 |
| * | | United Fire Group, Inc. Amended and Restated Annual Incentive Plan (Amended February 24, 2012) | X | | | |
| 10.5 | | * | | United Fire & Casualty Company’s Non-qualified Deferred Compensation Plan | | | 10-Q | | 9/30/2007 | | 10.3 | | | 10/25/2007 |
| * | | Non-qualified Deferred Compensation Plan | | | 10-Q | | 9/30/2007 | | 10.3 |
| | 10/25/2007 |
| 10.6 | | * | | Form of United Fire & Casualty Company Non-qualified Employee Stock Option Agreement | | | 10-K | | 12/31/2007 | | 10.7 | | | 2/27/2008 |
| * | | Form of Non-qualified Employee Stock Option Agreement under the 2008 Stock Plan | | | 10-K | | 12/31/2007 | | 10.7 |
| | 2/27/2008 |
| 10.7 | | * | | Form of Option Issued Pursuant to United Fire & Casualty Company Non-qualified Non-employee Director Stock Option and Restricted Stock Plan | | | 10-K | | 12/31/2007 | | 10.8 | | | 2/27/2008 |
| * | | Form of Option Issued Pursuant to the 2005 Non-qualified Non-employee Director Stock Option and Restricted Stock Plan | | | 10-K | | 12/31/2007 | | 10.8 |
| | 2/27/2008 |
| 10.8 | | * | | United Fire & Casualty Company 2008 Stock Plan | | | 8-K | | | | 99.1 | | | 5/22/2008 |
| * | | 2008 Stock Plan | | | 8-K | | | | 99.1 |
| | 5/22/2008 |
| 10.9 | | * | | Form of Stock Award Agreement under United Fire & Casualty Company 2008 Stock Plan | | | 8-K | | | | 99.2 | | | 5/22/2008 |
| * | | Form of Stock Award Agreement under 2008 Stock Plan | | | 8-K | | | | 99.2 |
| | 5/22/2008 |
| 10.10 | | * | | Form of Non-qualified Stock Option Agreement for the Purchase of Stock under United Fire & Casualty Company 2008 Stock Plan | | | 8-K | | | | 99.3 | | | 5/22/2008 |
| * | | Form of Non-qualified Stock Option Agreement for the Purchase of Stock under 2008 Stock Plan | | | 8-K | | | | 99.3 |
| | 5/22/2008 |
| 10.11 | | * | | Form of Incentive Stock Option Agreement for the Purchase of Stock under United Fire & Casualty Company 2008 Stock Plan | | | 8-K | | | | 99.4 | | | 5/22/2008 |
| * | | Form of Incentive Stock Option Agreement for the Purchase of Stock under 2008 Stock Plan | | | 8-K | | | | 99.4 |
| | 5/22/2008 |
| 10.12 | | * | | Am endment to Non-qualified Stock Option Agreements for John A. Rife | | | 8-K/A | | | | 99.1 | | | 2/24/2009 |
| * | | Amendment to Non-qualified Stock Option Agreements for John A. Rife | | | 8-K/A | | | | 99.1 |
| | 2/24/2009 |
| 10.13 | | * | | Form of Shareholder Support Agreement | | 8-K | | 10.1 | | | 12/1/2010 |
| | Credit Agreement | | 8-K | | 10.1 |
| | 12/23/2011 |
| 10.14 | |
| * | | Form of Restricted Stock Agreement under 2005 Nonqualified Non-employee Director Stock Option Plan | X | | | |
| 10.15 | |
| * | | United Fire Group, Inc. Plan for Allocation of Equity Compensation to Management Team | X | | | |
| 11 | | | | Statement Re Computation of Per Share Earnings. All information required by Exhibit 11 is presented within Note 13 of the Notes to Consolidated Financial Statements | X | | | | | | | | |
| | | Statement Re Computation of Per Share Earnings. All information required by Exhibit 11 is presented within Note 12 of the Notes to Consolidated Financial Statements | X | | | | | | | | |
| 12 | | | Statement Re Computation of Ratios | X | | | | | | | |
| | Statement Re Computation of Ratios | X | | | |
| 14 | |
| | Code of Ethics | | | 10-K | | 12/31/2006 | | 3.4 |
| | 3/1/2007 |
*Indicates a management contract or compensatory plan or arrangement.
United Fire & Casualty CompanyGroup, Inc. Form 10-K | 20102011
| | | | | | | | | | | | | | |
| | | | | | | Incorporated by reference |
| Exhibit number | | Exhibit description | Filed herewith | | Form | | Period ending | | Exhibit | | Filin g date |
| 14 | | | | Code of Ethics | | | 10-K | | 12/31/2006 | | 3.4 | | | 3/1/2007 |
| 21 | | &nbs p; | | Subsidiaries of the Registrant | X | | | | | | | | |
| 23.1 | | | | Consent of Ernst & Young LLP, Independent Registered Public Accounting Firm | X | | | | | | | | |
| 23.2 | | | | Consent of Griffith, Ballard & Company, Independent Actuary | X | | | | | | | | |
| 23.3 | | | | Consent of Regnier Consulting Group, Inc., Independent Actuary | X | | | | | | | | |
| 31.1 | | | | Certification of Randy A. Ramlo Pursuant to Section 302 of the Sarbanes—Oxley Act of 2002 | X | | | | | | | | |
| 31.2 | | | | Certification of Dianne M. Lyons Pursuant to Section 302 of the Sarbanes—Oxley Act of 2002 | X | | | | | | | | |
| 32.1 | | | | Certification of Randy A. Ramlo Pursuant to 18 U.S.C. Section 1350, as Adopted Pursuant to Section 906 of the Sarbanes—Oxley Act of 2002 | X | | | | | | | | |
| 32.2 | | | | Certification of Dianne M . Lyons Pursuant to 18 U.S.C. Section 1350, as Adopted Pursuant to Section 906 of the Sarbanes—Oxley Act of 2002 | X | | | | | | | | |
|
| | | | | | | | | | | | | |
| | | | | | Incorporated by reference |
| Exhibit number | | Exhibit description | Filed herewith | | Form | | Period ending | | Exhibit | | Filing date |
| 21 |
| | | Subsidiaries of the Registrant | X | | | | | | | | |
| 23.1 |
| | | Consent of Ernst & Young LLP, Independent Registered Public Accounting Firm | X | | | | | | | | |
| 23.2 |
| | | Consent of Griffith, Ballard & Company, Independent Actuary | X | | | | | | | | |
| 23.3 |
| | | Consent of Regnier Consulting Group, Inc., Independent Actuary | X | | | | | | | | |
| 31.1 |
| | | Certification of Randy A. Ramlo Pursuant to Section 302 of the Sarbanes-Oxley Act of 2002 | X | | | | | | | | |
| 31.2 |
| | | Certification of Dianne M. Lyons Pursuant to Section 302 of the Sarbanes-Oxley Act of 2002 | X | | | | | | | | |
| 32.1 |
| | | Certification of Randy A. Ramlo Pursuant to 18 U.S.C. Section 1350, as Adopted Pursuant to Section 906 of the Sarbanes-Oxley Act of 2002 | X | | | | | | | | |
| 32.2 |
| | | Certification of Dianne M. Lyons Pursuant to 18 U.S.C. Section 1350, as Adopted Pursuant to Section 906 of the Sarbanes-Oxley Act of 2002 | X | | | | | | | | |
| 101.1 |
| | | The following financial information from United Fire Group, Inc.'s Annual Report on Form 10-K for the year ended December 31, 2011 formatted in XBRL: (i) Consolidated Balance Sheets at December 31, 2011 and 2010; (ii) Consolidated Statements of Income for the years ended December 31, 2011, 2010 and 2009; (iii) Consolidated Statement of Stockholders’ Equity for the years ended December 31, 2011, 2010 and 2009; (iv) Consolidated Statements of Cash Flows for the years ended December 31, 2011, 2010 and 2009; and (v) Notes to Consolidated Financial Statements, tagged as a block of text.
| X | | | | | | | | |
*Indicates a management contract or compensatory plan or arrangement.