Timothy P. Francis,Ellen S. Dasher, age 46, Senior54, Vice President and Finance Business Partner –of Global OperationsTaxation since June 2022. Senior Vice President and Controller from June 2014 to June 2022.
Gene Padgett, age 52, Senior Vice President, Finance and Chief Accounting Officer since November 2022. Senior Vice President and Chief Accounting Officer of DXP Enterprises, Inc., an industrial products distributor and equipment manufacturer, from 2018 to October 2022.
T. Mitchell Parnell, age 57, Executive Vice President, Chief Human Resources Officer since January 2019. Vice President, Human Resources, Valmont Engineered Support Structures from 2016 to 2018.
Claudio O. Laterreur, age 56, Senior Vice President and Chief Information Officer since May 2019. US Industrial Products Partner at IBM and North America Vice President for manufacturing at Neoris from 2013 to May 2019.December 2015.
R. Andrew Massey, age 53,54, Vice President, and Chief Legal & Compliance Officer, and Corporate Secretary since July 2006.
Ellen S. Dasher, age 53, Vice President, Global Taxation since December 2015, previously Assistant Director of Taxation.
18
21
PART II
ITEM 5. MARKET FOR REGISTRANT’S COMMON EQUITY, RELATED STOCKHOLDER MATTERS AND
ISSUER PURCHASES OF EQUITY SECURITIES.SECURITIES
Market Information
Our common stock is traded on the New York Stock Exchange under the ticker symbol “VMI”. We
Holders
As of December 30, 2023, we had approximately 36,16357,128 shareholders of common stock.
Dividends
Cash dividends on our common stock at December 31, 2022.are paid quarterly. We paid a total of $49.5 million and $45.8 million in dividends in fiscal 2023 and 2022, respectively. The Board of Directors determines whether to declare dividends, the timing, and the amount based on financial condition and other factors it deems relevant. We currently expect that dividends comparable to those paid historically will continue to be paid in the future.
Issuer PurchasesPurchase of Equity Securities
By the Issuer and Affiliated Purchasers
| | | | | | | | | | |
| | | | | | | Total Number of | | | |
| | | | | | | Shares Purchased | | Approximate Dollar | |
| | | | | | | as Part of | | Value of Maximum | |
| | Total Number | | | | | Publicly | | Number of | |
| | of | | | | Announced Plans | | Shares that may yet | ||
| | Shares | | Average Price | | or | | be Purchased under the | ||
Period |
| Purchased |
| paid per share |
| Programs |
| Program (1) | ||
September 25, 2022 to October 22, 2022 |
| — | | $ | — |
| — | | $ | 101,371,000 |
October 23, 2022 to November 26, 2022 |
| 26,995 | |
| 328.93 |
| 26,995 | |
| 92,523,000 |
November 27, 2022 to December 31, 2022 |
| 33,207 | |
| 334.38 |
| 33,207 | |
| 81,419,000 |
Total |
| 60,202 | | $ | 331.94 |
| 60,202 | | $ | 81,419,000 |
| | | | | | | | | | |
| | | | | | | Total Number of | | | |
| | | | | | | Shares Purchased | | Approximate Dollar | |
| | Total | | | | | as Part of | | Value of | |
| | Number | | Average | | Publicly | | Shares that May Yet | ||
| | of Shares | | Price Paid | | Announced Plans | | Be Purchased | ||
Period |
| Purchased |
| per Share |
| or Programs |
| Under the Program (1) | ||
October 1, 2023 to October 28, 2023 |
| — | | $ | — |
| — | | $ | 314,724,000 |
October 29, 2023 to December 2, 2023 |
| | | | | | | | | |
Non-Accelerated Share Repurchase | | 240,120 | |
| 211.69 |
| 240,120 | |
| 263,883,000 |
November 2023 Accelerated Share Repurchase (2) | | 438,917 | | | (2) | | 438,917 | | | 143,883,000 |
December 3, 2023 to December 30, 2023 |
| 35,000 | |
| 222.11 |
| 35,000 | |
| 136,108,000 |
Total |
| 714,037 | | $ | 250.15 |
| 714,037 | | $ | 136,108,000 |
| (1) | On May 13, 2014, we announced a capital allocation philosophy |
| (2) | In November 2023, we entered into an accelerated purchase agreement to repurchase $120.0 million of the Company’s outstanding common stock (“November 2023 ASR”) with CitiBank, N.A. as counterparty. The November 2023 ASR was entered into under our previously announced share repurchase program described above. In the fourth quarter of fiscal 2023, the Company pre-paid $120.0 million and received an initial delivery of 438,917 shares of common stock from CitiBank, which represented 75% of the prepayment amount divided by the closing price of $205.05 per share on November 28, 2023. The final number of shares to be delivered and the average price paid per share will be based on the daily volume weighted average share price during the term of the November 2023 ASR less a discount, which will be completed during the first quarter of fiscal 2024. |
The Inflation Reduction Act of 2022, which was enacted into law on August 16, 2022, imposed a nondeductible 1% excise tax on the net value of certain stock repurchases made after December 31, 2022. Excise tax accrued for the fiscal year ended December 30, 2023 totaled $2.8 million.
2219
ITEM 6. [RESERVED]
ITEM 7. MANAGEMENT’S DISCUSSION AND ANALYSIS OF FINANCIAL CONDITION AND RESULTS
OF OPERATION.OPERATIONS
MANAGEMENT’S DISCUSSION AND ANALYSIS
Forward‑Looking Statements
Management’s discussion and analysis, and other sections of this annual report, contain forward‑looking statements within the meaning of the Private Securities Litigation Reform Act of 1995. These forward‑looking statements are based on assumptions that management has made in light of experience in the industries in which the Company operates, as well as management’s perceptions of historical trends, current conditions, expected future developments, and other factors believed to be appropriate under the circumstances. These statements are not guarantees of performance or results. They involve risks, uncertainties (some of which are beyond the Company’s control), and assumptions. Management believes that these forward‑looking statements are based on reasonable assumptions. Many factors could affect the Company’s actual financial results and cause them to differ materially from those anticipated in the forward‑looking statements. These factors include, among other things, risk factors described from time to time in the Company’s reports to the Securities and Exchange Commission,SEC, as well as future economic and market circumstances, industry conditions, company performance and financial results, operating efficiencies, availability and price of raw materials, availability and market acceptance of new products, product pricing, domestic and international competitive environments, and actions and policy changes of domestic and foreign governments.
The following discussion and analysis providesprovide information whichthat management believes is relevant to an assessment and understanding of ourthe Company’s consolidated results of operations and financial position. This discussion should be read in conjunction with the Consolidated Financial Statements and related Notes.notes.
This section of thisthe Form 10-K generally discusses fiscal 2023 items, fiscal 2022 items, and year-to-year comparisons between fiscal 2023 and fiscal 2022. Discussions of fiscal 2021 items and year-to-year comparisons between fiscal 2022 and 2021. Discussions of 2020 items and year-to-year comparisons betweenfiscal 2021 and 2020 that are not included in thison Form 10-K can be found in "Management’s Discussion and Analysis of Financial ConditionsCondition and Results of Operations" in Part II, Item 7 of the Company’s Annual Report on Form 10-K for the fiscal year ended December 25, 2021.31, 2022.
During the first quarter of 2022, the Company’s Chief Operating Decision Maker (“CODM”) changed the Company’s management structure and began to manage the business, allocate resources, and evaluate performance based on the new structure. As a result, the Company has realigned to a two reportable segment structure organized by market dynamics (Infrastructure and Agriculture). Three operating segments resulted from the new management structure and two are aggregated into the Agriculture reportable segment. The Company considers gross profit margins, nature of products sold, nature of the production processes, type and class of customer, and methods used to distribute products when assessing aggregation of operating segments. The Infrastructure segment includes the previous reportable segments of Utility Support Structures, Engineered Support Structures, and Coatings. All prior period segment information has been recast to reflect this change in reportable segments.
20
23
General
| | | | | | | | | | | | | | | | | | | | | | | | | | | | | | | | | | |
| | 2022 | | 2021 | | Change 2022 - 2021 | | 2020 | | Change 2021 - 2020 | | Fiscal Year Ended | | | | | Fiscal Year Ended | | | | ||||||||||||||
| | Dollars in millions, except per share amounts | | December 30, | | December 31, | | Percent | | | December 25, | | Percent | | ||||||||||||||||||||
Dollars in millions, except per share amounts | | 2023 | | 2022 | | Change | | | 2021 | | Change | | ||||||||||||||||||||||
Consolidated | | | | | | | | | | | | | | | | | | | | | | | | | | | | | | | | | | |
Net sales | | | $ | 4,345.2 | | | $ | 3,501.6 |
| | 24.1 | % | | $ | 2,895.4 |
| | 20.9 | % | | $ | 4,174.6 | | $ | 4,345.2 |
| (3.9) | % | | $ | 3,501.6 |
| 24.1 | % |
Gross profit | | |
| 1,126.3 | | |
| 883.9 |
| | 27.4 | % | |
| 765.5 |
| | 15.5 | % | |
| 1,236.0 | |
| 1,126.3 |
| 9.8 | % | |
| 883.9 |
| 27.4 | % |
as a percent of sales | | |
| 25.9 | % | |
| 25.2 | % | |
| | |
| 26.4 | % | |
| | |||||||||||||||
SG&A expense | | |
| 693.0 | | |
| 597.1 |
| | 16.1 | % | |
| 539.6 |
| | 10.7 | % | |||||||||||||||
as a percent of sales | | |
| 15.9 | % | |
| 17.1 | % | |
| | |
| 18.6 | % | |
| | |||||||||||||||
as a percent of net sales | |
| 29.6 | % |
| 25.9 | % |
| | |
| 25.2 | % |
| | |||||||||||||||||||
Selling, general, and administrative expenses | |
| 768.4 | |
| 693.0 |
| 10.9 | % | |
| 590.6 |
| 17.3 | % | |||||||||||||||||||
as a percent of net sales | |
| 18.4 | % |
| 15.9 | % |
| | |
| 16.9 | % |
| | |||||||||||||||||||
Impairment of goodwill and intangible assets | | | 140.8 | |
| — |
| NM | | |
| 6.5 |
| NM | | |||||||||||||||||||
Realignment charges | | | 35.2 | |
| — |
| NM | | |
| — |
| NM | | |||||||||||||||||||
Operating income | | |
| 433.3 | | |
| 286.8 |
| | 51.1 | % | |
| 225.9 |
| | 27.0 | % | |
| 291.6 | |
| 433.3 |
| (32.7) | % | |
| 286.8 |
| 51.1 | % |
as a percent of sales | | |
| 10.0 | % | |
| 8.2 | % | |
| | |
| 7.8 | % | |
| | |||||||||||||||
as a percent of net sales | |
| 7.0 | % |
| 10.0 | % |
| | |
| 8.2 | % |
| | |||||||||||||||||||
Net interest expense | | |
| 45.5 | | |
| 41.4 |
| | 9.9 | % | |
| 38.7 |
| | 7.0 | % | |
| 50.6 | |
| 45.5 |
| 11.2 | % | |
| 41.4 |
| 9.9 | % |
Effective tax rate | | |
| 29.9 | % | |
| 23.6 | % | |
| | |
| 25.7 | % | |
| | |
| 38.1 | % |
| 29.9 | % |
| | |
| 23.6 | % |
| |
Net earnings | | |
| 250.9 | | |
| 195.6 |
| | 28.3 | % | |
| 140.7 |
| | 39.0 | % | |||||||||||||||
Net earnings attrib. to Valmont Industries, Inc. | |
| 150.8 | |
| 250.9 |
| (39.9) | % | |
| 195.6 |
| 28.3 | % | |||||||||||||||||||
Diluted earnings per share | | | $ | 11.62 | | | $ | 9.10 |
| | 27.7 | % | | $ | 6.57 |
| | 38.5 | % | | $ | 6.78 | | $ | 11.62 |
| (41.7) | % | | $ | 9.10 |
| 27.7 | % |
Infrastructure | | |
|
| | |
|
|
| |
| | |
|
|
| |
| | |
|
| |
|
|
|
| | |
|
|
|
| |
Net sales | | | $ | 2,909.7 | | | $ | 2,361.5 |
| | 23.2 | % | | $ | 2,135.2 |
| | 10.6 | % | | $ | 2,999.6 | | $ | 2,909.7 |
| 3.1 | % | | $ | 2,361.5 |
| 23.2 | % |
Gross profit | | |
| 736.6 | | |
| 603.6 |
| | 22.0 | % | |
| 564.9 |
| | 6.9 | % | |
| 842.1 | |
| 736.6 |
| 14.3 | % | |
| 603.6 |
| 22.0 | % |
SG&A expense | | |
| 382.1 | | |
| 330.0 |
| | 15.8 | % | |
| 347.6 |
| | (5.1) | % | |||||||||||||||
Selling, general, and administrative expenses | |
| 424.9 | |
| 382.1 |
| 11.2 | % | |
| 330.0 |
| 15.8 | % | |||||||||||||||||||
Impairment of goodwill and intangible assets | | | 3.6 | |
| — |
| NM | | |
| — |
| NM | | |||||||||||||||||||
Realignment charges | | | 17.3 | |
| — |
| NM | | |
| — |
| NM | | |||||||||||||||||||
Operating income | | |
| 354.5 | | |
| 273.6 |
| | 29.6 | % | |
| 217.3 |
| | 25.9 | % | |
| 396.3 | |
| 354.5 |
| 11.8 | % | |
| 273.6 |
| 29.6 | % |
Agriculture | | |
| | | |
|
|
| |
| | |
|
|
| |
| | |
| | |
|
|
|
| | |
|
|
|
| |
Net sales | | | $ | 1,335.3 | | | $ | 1,017.1 |
| | 31.3 | % | | $ | 640.1 |
| | 58.9 | % | | $ | 1,175.0 | | $ | 1,335.3 |
| (12.0) | % | | $ | 1,017.1 |
| 31.3 | % |
Gross profit | | |
| 381.8 | | |
| 297.7 |
| | 28.2 | % | |
| 197.3 |
| | 50.9 | % | |
| 393.9 | |
| 381.8 |
| 3.2 | % | |
| 297.7 |
| 28.2 | % |
SG&A expense | | |
| 202.5 | | |
| 160.6 |
| | 26.1 | % | |
| 114.2 |
| | 40.6 | % | |||||||||||||||
Selling, general, and administrative expenses | |
| 230.7 | |
| 202.5 |
| 13.9 | % | |
| 160.6 |
| 26.1 | % | |||||||||||||||||||
Impairment of goodwill and intangible assets | | | 137.2 | |
| — |
| NM | | |
| — |
| NM | | |||||||||||||||||||
Realignment charges | | | 9.1 | |
| — |
| NM | | |
| — |
| NM | | |||||||||||||||||||
Operating income | | |
| 179.3 | | |
| 137.1 |
| | 30.8 | % | |
| 83.1 |
| | 65.0 | % | |
| 16.9 | |
| 179.3 |
| (90.6) | % | |
| 137.1 |
| 30.8 | % |
Other | | | | | | | | | | | | | | | | | | | | | | | | | | | | | | | | | | |
Net sales | | | $ | 100.2 | | | $ | 123.0 | | | (18.5) | % | | $ | 120.1 | | | 2.4 | % | | $ | — | | $ | 100.2 | | NM | | | $ | 123.0 | | (18.5) | % |
Gross profit (loss) | | | | 7.9 | | | | (18.2) | | | NM | | | | 3.3 | | | NM | | | | — | | | 7.9 | | NM | | | | (18.2) | | NM | |
SG&A expense | | | | 5.6 | | | | 22.0 | | | (74.5) | % | | | 11.5 | | | 91.3 | % | |||||||||||||||
Selling, general, and administrative expenses | | | — | | | 5.6 | | NM | | | | 15.5 | | (63.9) | % | |||||||||||||||||||
Impairment of goodwill and intangible assets | | | — | | | — | | NM | | | | 6.5 | | NM | | |||||||||||||||||||
Operating income (loss) | | | | 2.3 | | | | (40.2) | | | NM | | | | (8.2) | | | 390.2 | % | | | — | | | 2.3 | | NM | | | | (40.2) | | NM | |
Net corporate expense | | |
|
| | |
|
|
| |
| | |
|
|
| |
| | |||||||||||||||
Corporate | |
|
| |
|
|
|
| | |
|
|
|
| | |||||||||||||||||||
Gross profit | | | $ | — | | | $ | 0.8 |
| | — | | | $ | — |
| | — | % | | $ | — | | $ | — |
| NM | | | $ | 0.8 |
| NM | |
SG&A | | |
| 102.8 | | |
| 84.5 |
| | 21.7 | % | |
| 66.3 |
| | 27.5 | % | |||||||||||||||
Selling, general, and administrative expenses | |
| 112.8 | |
| 102.8 |
| 9.7 | % | |
| 84.5 |
| 21.7 | % | |||||||||||||||||||
Realignment charges | | | 8.8 | |
| — |
| NM | | |
| — |
| NM | | |||||||||||||||||||
Operating loss | | |
| (102.8) | | |
| (83.7) |
| | 22.8 | % | |
| (66.3) |
| | 26.2 | % | |
| (121.6) | |
| (102.8) |
| 18.3 | % | |
| (83.7) |
| 22.8 | % |
NM = not meaningful
2421
RESULTS OF OPERATIONS
FISCAL 20222023 COMPARED WITH FISCAL 20212022
Overview
The increasedecrease in net sales in 2022,fiscal 2023, as compared with 2021,fiscal 2022, was the result of lower sales in the Agriculture segment, partially offset by higher sales in both the Infrastructure and Agriculture segments.segment. Fiscal 2023 included 52 weeks, while fiscal 2022 included 53 weeks, while fiscal 2021 included 52 weeks. The estimated impact on the Company's results of operations due to the extra week in fiscal 2022 was additional net sales of approximately $80.8 million and additional net earnings of approximately $5.3 million.
| | | | | | | | | | | | |
|
| Total |
| Infrastructure | | Agriculture |
| Other | ||||
Sales - 2021 | | $ | 3,501.6 | | $ | 2,361.5 | | $ | 1,017.1 | | $ | 123.0 |
Volume | |
| 184.0 | |
| 108.7 | |
| 88.9 | |
| (13.6) |
Pricing / mix | |
| 686.5 | |
| 459.4 | |
| 223.1 | |
| 4.0 |
Acquisition | |
| 30.1 | |
| 28.8 | |
| 1.3 | |
| — |
Currency translation | |
| (57.0) | |
| (48.7) | |
| 4.9 | |
| (13.2) |
Sales - 2022 | | $ | 4,345.2 | | $ | 2,909.7 | | $ | 1,335.3 | | $ | 100.2 |
| | | | | | | | | | | | |
Dollars in millions |
| Infrastructure | | Agriculture | | Other |
| Total | ||||
Net sales - fiscal 2022 | | $ | 2,909.7 | | $ | 1,335.3 | | $ | 100.2 | | $ | 4,345.2 |
Volume | |
| 9.6 | |
| (175.5) | |
| — | |
| (165.9) |
Pricing and mix | |
| 85.1 | |
| (1.2) | |
| — | |
| 83.9 |
Acquisition | |
| 12.2 | |
| 14.0 | |
| — | |
| 26.2 |
Divestiture | | | — | | | — | | | (100.2) | | | (100.2) |
Currency translation | |
| (17.0) | |
| 2.4 | |
| — | |
| (14.6) |
Net sales - fiscal 2023 | | $ | 2,999.6 | | $ | 1,175.0 | | $ | — | | $ | 4,174.6 |
Volume impacts are estimated based on physical production or sales measure. Since products we sell are not uniform in nature, pricing and mix relate to a combination of changes in sales prices and the attributes of the productproducts sold. Accordingly, pricing and mix changes do not necessarily result in operating income changes.
Due to supply chain disruptions and lingering impacts of the pandemic, average steelSteel prices for both hot rolled coil and plate werehave remained volatile over the past fewtwo fiscal years, especially in North America. While hot rolled coil steel has decreasedDecreases in price, the steel consumed during 2022 withinaverage cost of sales was atconsumed steel combined with recent customer pricing strategy mechanisms more than offset the overall decrease in volumes on a much higher average costconsolidated basis in fiscal 2023, as compared to 2021. Gross profit margin was higherfiscal 2022.
During the third quarter of fiscal 2023, management initiated a plan to streamline segment support across the Company and reduce costs through an organizational realignment program (the “Realignment Program”). The Realignment Program provided for a reduction in 2022, as comparedforce through a voluntary early retirement program and other headcount reduction actions, which were completed by the end of fiscal 2023. The Board of Directors authorized the incurrence of cash charges up to 2021, as customer pricing mechanisms$36.0 million in connection with the Realignment Program of which $35.2 million were incurred in fiscal 2023. Severance and product selling price practices allowed for the recovery of price inflation forother employee benefit costs totaled approximately $17.3 million within the Infrastructure segment, $9.1 million within the Agriculture segment, and Agriculture reportable segments.$8.8 million within Corporate expense.
Items Impacting Comparability
Items of note impacting the comparability of results from net earnings for 2022 included the following:fiscal 2023 included:
| ● | charges |
| ● | charges of $35.2 million ($26.5 million after-tax) related to the Realignment Program, |
| ● | charges of $5.6 million ($4.2 million after-tax) related to non-recurring charges related to major scope changes for two strategic projects initiated by departed senior leadership, |
Items of note impacting the comparability of results from net earnings for fiscal 2022 included:
| ● | charges of $33.3 million (no associated tax benefit) related to the divestiture of the offshore wind energy structures business, |
| ● |
| ● | charges of $9.9 million ($8.9 million after-tax) related to stock-based compensation expense |
Items22
Acquisitions
The Company acquired the following businesses in 2022fiscal 2023 and 2021:fiscal 2022:
| ● | HR Products, a leading wholesale supplier of irrigation parts in Australia, in the third quarter of fiscal 2023, for $37.3 million, included in the Agriculture segment, and |
| ● | 51% of ConcealFab, |
25
Divestitures
The Company divested its offshore wind energy structures businessthe following businesses in the fourth quarter of 2022, which resulted in a loss of approximately $33.3 million (no associated tax benefit). The offshore wind energy structures business is included in the Other segmentfiscal 2023 and the loss was recorded in “Other income (expenses)” in the Consolidated Statements of Earnings.fiscal 2022:
| ● | Torrent Engineering and Equipment in the second quarter of fiscal 2023, which resulted in a gain of $3.0 million. The integrator of prepackaged pump stations in Indiana was included in the Agriculture segment and the gain was recorded in “Other income (expenses)” in the Consolidated Statements of Earnings, and |
| ● | Valmont SM in the fourth quarter of fiscal 2022, which resulted in a loss of $33.3 million with no associated tax benefit. The offshore wind energy structures business in Denmark was included in the Other segment and the loss was recorded in “Other income (expenses)” in the Consolidated Statements of Earnings. |
Macroeconomic Impacts on Financial Results and Liquidity
We continue to monitor several macroeconomic and geopolitical trendsuncertainties that have impacted or may impact our business, including inflationary cost pressures, supply chain disruptions, changes in foreign currency exchange rates against the strengthened U.S. dollar, therising interest rates, ongoing Russia-Ukraine conflict, changing conditions from the COVID-19 pandemic,international armed conflicts, and labor shortages.
Change in Reportable Segments
On December 26, 2021, the Company’s CODM began to manage the business, allocate resources, and evaluate performance based on changes madeIn addition to the Company’s management structure. As a result,two reportable segments, the Company has realignedhad a business and related activities in fiscal 2022 that were not more than 10% of consolidated sales, operating income, or assets. This business, the offshore wind energy structures business, was reported in the Other segment until its reportable segment structure. The Company reorganized from a four segment structure previously organized by product category (Utility Support Structures, Engineered Support Structures, Coatings, and Irrigation) to a two segment reporting structure organized by market dynamics (Infrastructure and Agriculture).divestiture in the fourth quarter of fiscal 2022. All prior period information has been recast to reflect this change in reportable segments. See Note 21 to our Consolidated Financial Statements for additional information.
In addition to these two reportable segments, the Company had a business and related activities that are not more than 10% of consolidated sales, operating income, or assets. This includes the offshore wind energy structures business and was reported in the “Other” segment until its divestiture in 2022.
Currency TranslationBacklog
The continued strengtheningconsolidated backlog of the U.S. dollar resulted in negative foreign currency impacts for manyunshipped orders was approximately $1.5 billion as of our businesses located in foreign jurisdictions. In 2022, we realized an increase in operating profit,December 30, 2023 as compared with fiscal 2021, despite these overall negative currency translation effects.to approximately $1.7 billion as of December 31, 2022. The breakdown of this effect bydecrease is attributed to the Agriculture segment, was as follows:
| | | | | | | | | | | | | | | | |
|
| | Total |
| Infrastructure |
| Agriculture | | Other |
| Corporate | |||||
Full year | | | $ | (2.0) | | $ | (5.9) | | $ | 3.1 | | $ | 0.3 | | $ | 0.5 |
while Infrastructure segment backlog remains comparable to the prior year end.
Gross Profit, Selling, General, and Administrative Expenses (“SG&A,&A”), and Operating Income
AtOn a consolidated level,basis, gross profit and gross profit as a percentpercentage of sales was higherincreased in 2022,fiscal 2023, as compared with 2021.to fiscal 2022. Gross profit and gross profit as a percentpercentage of sales was relatively flat for both the Infrastructure and Agriculture segments, as increased raw material and labor costs were offset by an increase in average selling prices. Gross profit was higher for both the Infrastructure and Agriculture segments in 2022.fiscal 2023 primarily due to increased average selling prices and activities executed to improve overall costs of goods sold, partially offset by decreased volumes.
The Company saw an increaseConsolidated SG&A increased in selling, general, and administrative (“SG&A”) expense in 2022,fiscal 2023, as compared to 2021. The increase in SG&A wasfiscal 2022, due to increased employment costs and increased professional fees, partially offset by slightly decreased incentive expenses.
Consolidated operating income in fiscal 2023, as compared to fiscal 2022, was impacted by the incrementalimpairment of certain goodwill and intangible assets totaling $140.8 million primarily within the Agriculture Technology reporting unit and realignment charges totaling $35.2 million, along with higher SG&A from the Prospera acquisitionpartially offset by increased gross profit.
Net Interest Expense
Consolidated interest expense increased in May 2021 (including intangible asset amortization, stock-based compensation, and research and development costs), higher incentives and stock-based compensation costsfiscal 2023, as compared to fiscal 2022, primarily due to improved operations, salary merit increases, and higher travel costs. In 2021,additional borrowings on the Other segment recognized a pre-tax $27.9 million impairment chargerevolving line of long-lived assets ($21.4 million recognized in cost of goods sold and $6.5 million in SG&A) and a $5.5 million write-off of an accounts receivable related to the offshore wind energy structures business that did not recur in 2022.credit along with increased interest rates.
2623
Net Interest Expense and Debt
Net interest expense in 2022 was higher than 2021 due to higher average borrowings during the year. Interest income was also higher in 2022, as compared to 2021, due to higher interest rates.
Other Income/ExpenseIncome / Expenses (including Gain (Loss) on Investments – Unrealized)
Amounts in “Gain (loss) on investments – unrealized)
The change- unrealized" included changes in other income/expensesthe market value of deferred compensationassets which were offset by an equal opposite amount included in 2022, as compared to 2021, was primarily due to a lower pension benefit of $4.5 million andSG&A for the corresponding change in the valuation ofdeferred compensation assets which resultedliabilities. Other items included in “Other income (expenses)” were pension expense, a lower incomegain relatedto the sale of $5.5 million. These decreases were offset by an increaseTorrent Engineering and Equipment in investment incomethe second quarter of $2.7fiscal 2023 totaling approximately $3.0 million, and a gain of $2.1 millionloss related to insurance proceeds received associated with windstorm damage at oneArgentine peso hyperinflation totaling approximately $5.1 million. Pension expense in fiscal 2023 was $0.2 millioncompared to a pension benefit of our facilities$10.1 million in France. The change related to deferred compensation assets is offset by an opposite change of the same amount in SG&A expense.fiscal 2022.
Income Tax Expense
Our effective income tax rate in fiscal 2023 and fiscal 2022 was 38.1% and 2021 was 29.9% and 23.6%, respectively. In 2022,fiscal 2023, the increase ineffective tax rate was the result of goodwill impairment charges for which no tax benefits were recorded. In fiscal 2022, the effective tax rate was the result of a change in geographical earnings and the approximately $33.3 million loss from divestiture of the offshore wind energy structures business which had no associated income tax benefit. In 2021, the effective tax rate was impacted by a U.S. tax benefit related to foreign taxes paid which was offset by a valuation allowance recorded against the offshore wind energy business structures’ deferred tax assets.
EarningsLoss (Earnings) Attributable to Redeemable Noncontrolling Interests
EarningsLoss (earnings) attributable to redeemable noncontrolling interests were higher in 2022 compared with 2021, primarily due toreflects the new noncontrolling interest not acquired as partoperating results of the acquisitionsubsidiaries the Company does not own 100%. Two of 51% ownership of ConcealFab in the first half of 2022.
Cash Flows from Operations
Our cash flows provided by operations were $326.3 millionsubsidiaries not 100% owned generated net losses in fiscal 2022, as compared with $65.9 million provided by operations2023 whereas these two subsidiaries generated net earnings in fiscal 2021. The increase in operating cash flow in 2022, as compared with 2021, was primarily due to the increase in net earnings and a significant increase in working capital levels during 2021 that did not occur in 2022, partially offset by an increase of approximately $15.2 million in contributions to the defined benefit pension plan.2022.
Infrastructure Segment
| | | | | | | | | | | | | | | | | | | | | | | | |
| | Fifty-three and fifty-two weeks ended | | Fiscal Year Ended | | | | | | | ||||||||||||||
| | | | | | | | Dollar | | |
| | December 30, | | December 31, | | Dollar | | Percent | |||||
Infrastructure |
| 2022 |
| 2021 |
| Change |
| % Change | ||||||||||||||||
Sales, gross of intercompany eliminations: | | |
|
| |
|
| |
|
|
| | ||||||||||||
Dollars in millions |
| 2023 |
| 2022 |
| Change |
| Change | ||||||||||||||||
Transmission, Distribution, and Substation | | | 1,184.7 | | | 935.1 |
| | 249.6 |
| 26.7 | % | | $ | 1,243.8 | | $ | 1,184.7 |
| $ | 59.1 |
| 5.0 | % |
Lighting & Transportation | | | 940.5 | | | 825.9 |
| | 114.6 |
| 13.9 | % | ||||||||||||
Lighting and Transportation | | | 964.1 | | | 940.5 |
| | 23.6 |
| 2.5 | % | ||||||||||||
Coatings | | | 356.7 | | | 309.7 |
| | 47.0 |
| 15.2 | % | | | 354.3 | | | 356.7 |
| | (2.4) |
| (0.7) | % |
Telecommunications | | | 320.3 | | | 238.5 |
| | 81.8 |
| 34.3 | % | | | 252.2 | | | 320.3 |
| | (68.1) |
| (21.3) | % |
Renewable Energy | | | 126.2 | | | 62.9 |
| | 63.3 |
| 100.6 | % | ||||||||||||
Total | | $ | 2,928.4 | | $ | 2,372.1 | | $ | 556.3 |
| 23.5 | % | ||||||||||||
Solar | | | 195.7 | | | 126.2 |
| | 69.5 |
| 55.1 | % | ||||||||||||
Total sales | | $ | 3,010.1 | | $ | 2,928.4 | | $ | 81.7 |
| 2.8 | % | ||||||||||||
| | | | | | | | | | | | | | | | | | | | | | | | |
Operating Income | | $ | 354.5 | | $ | 273.6 | | $ | 80.9 |
| 29.6 | % | ||||||||||||
Operating income | | $ | 396.3 | | $ | 354.5 | | $ | 41.8 |
| 11.8 | % | ||||||||||||
NetInfrastructure segment sales were higherincreased in 2022 by approximately $548.2 millionfiscal 2023, as compared to 2021, primarily driven by higherfiscal 2022, due to increased average selling prices across all product lines and increased volumes in TD&S and Solar, partially offset by $48.7 million of unfavorable foreign currency translation effects year over year. The increaseand much lower volumes in netTelecommunications. Infrastructure segment sales forincreased in North America in fiscal 2023, as compared to fiscal 2022, versus 2021 was substantially higher thanwhile decreasing slightly internationally in the increase within international markets,same period.
Transmission, Distribution, and Substation product line sales increased in fiscal 2023, as compared to fiscal 2022, due to increased average selling prices and increased sales volumes, partially attributedoffset by unfavorable foreign currency translation effects totaling approximately $4.0 million.
Lighting and Transportation product line sales increased in fiscal 2023, as compared to thefiscal 2022, due to increased average selling prices and increased sales volumes, partially offset by an unfavorable currency translation effects (continued strengtheningeffect totaling approximately $8.1 million.
Coatings product line sales decreased in fiscal 2023, as compared to fiscal 2022, due to decreased sales volumes along with an unfavorable currency translation effect totaling approximately $6.5 million partially offset by increased average selling prices.
Telecommunications product line sales decreased in fiscal 2023, as compared to fiscal 2022, due to decreased sales volumes partially offset by increased average selling prices and incremental sales from the second quarter of fiscal 2022 acquisition of ConcealFab totaling $12.2 million. We expect sales for Telecommunications to remain lower until network enhancement spending of the U.S. dollar).major carriers returns to more elevated levels. As the continued rollout and expansion of 5G wireless technology accelerates globally, sales for our products are expected to grow.
2724
In the TD&SSolar product line net sales increased in 2022, as compared with 2021, due primarily to a substantial increase in average selling prices for the steel structures product line. A number of our sales contracts in North America contain provisions that tie the sales price to published steel index pricing at the time our customer issues their purchase order. Sales volumes increased modestly in 2022 as compared to 2021.
Lighting and transportation net sales increased in 2022, as compared to 2021 from the realization of customer pricing actions. Sales volumes increased in North America but decreased within international markets in fiscal year 2022,2023, as compared to fiscal year 2021. Reported international2022, due to increased sales decreasedvolumes primarily attributable to increased market share and throughput in 2022,the North American and European markets.
We expect Infrastructure segment sales to increase mid-single digits in fiscal 2024 from growth in the TD&S and Solar product lines attributed to the grid hardening efforts in the U.S. and the global energy transition.
Infrastructure segment gross profit and gross profit margin increased in fiscal 2023, as compared to 2021, by approximately $32.1 millionfiscal 2022, due to unfavorable foreign currency translation effects.
In the Telecommunications product line, net sales increased in 2022, as compared to 2021, due primarily to higher average selling prices and approximately $26.9 million of net sales attributed to the 2022 acquisition of ConcealFab. Higher sales volume in 2022 for North America, primarily attributed to the 5G deployments across additional markets, was partially offset by lower sales volume within international markets.
Coatings net sales increased in 2022, as compared to 2021, due to higher average selling prices, adjusted throughout the year to reflect higher average zinc costs and production wage inflation. Sales volume increased modestly in both North America and international markets in 2022, as compared to 2021. Reported international sales for the Coatings product line decreased in 2022, as compared to 2021, by approximately $10.1 million due to unfavorable foreign currency translation effects.
Renewable Energy net sales doubled in 2022, as compared to 2021, almost all attributed to an increase in sales volume.
Gross profit was higher in 2022, as compared to 2021. Contractualcontractual customer pricing mechanisms and selling price management ledleading to a large increase inincreased average selling prices while maintainingand deliberate actions to improve overall costs of goods sold. These items, partially offset by a decrease in sales volumes in the Telecommunications product line, resulted in an overall increase in the amount of gross profit margins during the highly inflationary environment.profit.
Infrastructure segment SG&A was higherincreased in 2022,fiscal 2023, as compared to 2021,fiscal 2022, due to wage inflation, increased incentives duecompensation and incentive costs, increased bad debt reserve charges including approximately $2.7 million related to improved financial performance,a Telecommunications customer that became insolvent, increased travel expense,research and development expenses, and incremental SG&A attributedfrom the June 2022 acquisition of ConcealFab.
We incurred severance and other employee benefit costs totaling $17.3 million within the Infrastructure segment in fiscal 2023 related to the recent acquisition. OperatingRealignment Program.
Infrastructure segment operating income increased in fiscal 2023, as compared to fiscal 2022, due to gross profit improvements, driven by favorable pricing and deliberate actions to improve overall costs of goods sold more than offsetting increased SG&A.
Agriculture Segment
| | | | | | | | | | | | |
| | Fiscal Year Ended | | | | | | | ||||
| | December 30, | | December 31, | | Dollar | | Percent | ||||
Dollars in millions |
| 2023 |
| 2022 |
| Change |
| Change | ||||
North America | | $ | 587.1 | | $ | 766.9 |
| $ | (179.8) |
| (23.4) | % |
International | | | 595.1 | | | 579.8 |
| | 15.3 |
| 2.6 | % |
Total sales | | $ | 1,182.2 | | $ | 1,346.7 | | $ | (164.5) |
| (12.2) | % |
| | | | | | | | | | | | |
Operating income | | $ | 16.9 | | $ | 179.3 | | $ | (162.4) |
| (90.6) | % |
Agriculture segment sales decreased in fiscal 2023, as compared to fiscal 2022. In North America, the increasedecrease in sales in fiscal 2023, as compared to fiscal 2022, was primarily due to notably lower sales volumes of irrigation equipment. This was impacted by lower net farm income, growers’ decisions to delay capital investments due to general economic uncertainty, and a number of macroeconomic factors including higher interest rates, continued inflationary pressures, and recessionary fears. International sales growth was driven by higher project sales and incremental sales from the HR Products acquisition totaling $14.0 million partially offset by lower sales volumes in Brazil due to muted farmer sentiment attributed to lower agricultural commodity prices. Sales of technology-related products and services in fiscal 2023 were similar to fiscal 2022.
Our Agriculture business is cyclical and is impacted by changes in net farm income, commodity prices, weather volatility, geopolitical factors, and farmer sentiment related to future economic uncertainty. We continue to monitor potential impacts of these factors on our financial results including estimated U.S. net farm income, as released periodically by the USDA. In Brazil, we also actively track changes in soybean and other crop prices and projected farm input costs to evaluate grower sentiment.
Irrigation equipment and aftermarket part sales in North America are expected to remain below prior year levels in fiscal 2024. The previous three fiscal years benefited from record levels of disaster relief and pandemic-related stimulus for farmers in North America which contributed to higher demand.
Agriculture segment gross profit increased in fiscal 2023, as compared to fiscal 2022, due to deflation in the cost of steel and other favorable changes in input costs more than offsetting the effectsimpact of inflation and other increased expenses in both cost oflower sales and to SG&A.
Agriculture Segment
| | | | | | | | | | | | |
| | Fifty-three and fifty-two weeks ended | ||||||||||
| | | | | | | | Dollar | | |
| |
Agriculture |
| 2022 |
| 2021 |
| Change |
| % Change | ||||
Sales, gross of intercompany eliminations: | | |
|
| |
|
| |
|
|
| |
North America | | | 766.9 | | | 545.6 |
| | 221.3 |
| 40.6 | % |
International | | | 579.8 | | | 483.1 |
| | 96.7 |
| 20.0 | % |
Total | | $ | 1,346.7 | | $ | 1,028.7 | | $ | 318.0 |
| 30.9 | % |
| | | | | | | | | | | | |
Operating Income | | $ | 179.3 | | $ | 137.1 | | $ | 42.2 |
| 30.8 | % |
volumes.
Agriculture segment net salesSG&A increased in 2022 by approximately $318.2 millionfiscal 2023, as compared to 2021, primarilyfiscal 2022, due to much higher average selling prices of irrigation equipment globally of approximately 22%. In North America, higher sales volumes for irrigation systemsincreased bad debt reserve charges, particularly in Brazil, and parts in 2022, as compared to 2021, were drivenincreased employment costs, partially offset by improved agricultural commodity prices. International irrigation experienced a slightly lower sales volume in 2022, as compared to 2021. Overall lower project sales to Egypt for the year 2022 more than offset the sales volume increases in many foreign markets. Partially offsetting that decrease was a sales volume increase in 2022 versus 2021 due to robust demand for irrigation equipment and agriculture solar products in Brazil. Sales of technology-related products increased $17.2 million as growers continued their adoption of technology to reduce costs and enhance profitability.decreased incentive expenses.
25
28
SG&A was higherWe incurred severance and other employee benefit costs totaling $9.1 million within the Agriculture segment in 2022,fiscal 2023 related to the Realignment Program.
Agriculture segment operating income decreased in fiscal 2023, as compared to 2021,fiscal 2022, primarily due to higher overall compensation coststhe impairment of certain goodwill and higher incentives due to improved business performance, as well as the incremental SG&A from the Prospera subsidiary acquiredother intangible assets in the secondthird quarter of 2021 (including the amortization of identified intangible assets, research and development costs, and stock-compensation expense). Operating income increased in 2022 over 2021, as improved globalfiscal 2023 totaling approximately $137.2 million, along with decreased sales volumes and pricing more than offset increases in the cost of sales and SG&A.by gross profit improvements.
Other
In November 2022, the Companywe completed the sale of Valmont SM, an offshore wind energy structures business with operations in Denmark. The CompanyWe realized an approximate $33.3 million loss on the sale that iswas recorded in “Other income (expenses)” in the Consolidated Statements of Earnings, subjectEarnings. The final payment of $2.2 million was received in January 2024, subsequent to certain post-closing adjustments. In 2021, the offshore wind energy structures business recognized a pre-tax $27.9 million impairment charge of long-lived assets and a $5.5 million write-off of an accounts receivable that did not recur in 2022.fiscal year ended December 30, 2023.
Net Corporate Expense
Corporate SG&A expense was higherincreased in 2022fiscal 2023, as compared to 2021. The increase can be attributed to higher incentive expensesfiscal 2022, due to improved business performance, an increaseincreased employment costs, increased professional fees, and incremental expense from changes in stock compensation expense, an increase in compensation expense due to salary merit increases, as well as an increase in rent expense of $2.7 million with the new corporate headquarters lease starting in the second quarter of 2021. The increase was partially offset by the change in valuation of deferred compensation plan assets which resultedliabilities. Charges related to changes in lower expense of $5.5 milliondeferred compensation plan liabilities are offset by an opposite change in 2022, as compared to 2021. Thean equal amount included in “Other income (expenses)” for the change in deferred compensation plan assets is offset by the same amount inassets.
We incurred severance and other income/expenses.
FISCAL 2021 COMPARED WITH FISCAL 2020
Infrastructure Segment
Net sales were higher in 2021 by approximately $226.3employee benefit costs totaling $8.8 million as compared to 2020, primarily driven by higher average selling prices across all product lines, as well as $33.3 million of favorable foreign currency translation effects year over year.
In the TD&S product line, net sales increased approximately $139.4 million in 2021, as compared with 2020, due primarily to an increase in average selling prices for the steel structures product line, reflecting the significant inflation seen in the cost of steel during 2021. A number of our sales contracts in North America contain provisions that tie the sales price to published steel index pricing at the time our customer issues their purchase order.
Lighting and transportation net sales increased by approximately $28.6 million in 2021, as compared to 2020. Sales volumes slightly decreased in North America as declines in volumes within the transportation markets were partially offset by increased higher average selling pricing year over year. Sales increased within international marketsCorporate expense in fiscal year 2021, as compared to fiscal year 2020, due to favorable foreign currency translation effects of approximately $24 million, slightly higher average selling prices, and slightly lower sales volumes.
In the Telecommunication product line, net sales increased by approximately $52.3 million in 2021, as compared to 2020, due primarily to higher net sales in North America, as communication product sales volumes increased due to strong demand from 5G and other connectivity initiatives and an increase in average selling prices. Communication product line sales within international markets increased modestly in 2021 mostly attributed to an increase in volume.
Coatings net sales increased approximately $29.5 million in 2021, as compared to 2020, due to higher average selling prices and favorable foreign currency translation. In North America, higher average selling prices helped to counteract the higher cost of zinc that incurred throughout the year. North America continued to see decreased industrial production attributed largely2023 related to the economic impacts from COVID-19, but not to the severity of 2020. In Asia-Pacific region, sales volumes improved in all regions, primarily due to sales pricing increases, higher volumes, and favorable foreign currency translation.Realignment Program.
29
In the Renewable Energy product line, net sales decreased approximately $23.5 million in 2021, as compared to 2020, due to a decrease in sales volumes attributed to less large projects.
Gross profit was higher by approximately $38.7 million in 2021, as compared to 2020. Contractual customer pricing mechanisms along with selling price management led to a large increase in average selling prices which more than offset the higher costs of goods sold. The increase in sales volume for Telecommunications product line also contributed to the increase in gross profit. SG&A was lower in 2021, as compared to 2020, primarily due to recording a partial goodwill and tradename impairment for the Access Systems business of $16.6 million during 2020 and other restructuring costs recognized in 2020 that did not recur in 2021. Operating income increased in 2021, as compared to 2020, due the increase in net sales and the decrease in SG&A.
Agriculture Segment
Agriculture segment net sales increased in 2021 by approximately $377.0 million, as compared to 2020, primarily due to higher sales volumes in almost all markets, as well as higher average selling prices. Net sales also increased slightly due to the continuing increase in sales of technology-related products and services, strengthened by our acquisitions of Prospera and PivoTrac that occurred in 2021. The sales increase for International irrigation of $215.7 million was primarily due to deliveries on the multi-year Egypt project and higher sales volumes in Brazil. In North America, higher sales volumes for irrigation systems and parts were driven by improved agricultural commodity prices. Average selling prices for the North American tubular product line were up substantially in 2021, versus 2020, to reflect the inflation seen in the cost of steel during 2021.
SG&A was higher in 2021, as compared to 2020, due to approximately $20.0 million of SG&A from the acquisitions of Prospera and PivoTrac, higher compensation costs, and higher incentives due to improved business performance. These increases were somewhat offset by one-time costs associated with the early retirement program incurred in 2020. Operating income increased in 2021 over 2020, as improved global sales volumes and pricing more than offset increases in the cost of steel.
Other
The net sales for the offshore wind energy structures business in 2021 was comparable 2020. Gross profit decreased in 2021, as compared to 2020, due primarily to the $21.4 million impairment of long-lived assets. SG&A expense was higher in 2021, as compared with 2020, primarily due to $6.5 million of impairments of intangible assets and a $5.5 million write-off of an accounts receivable. Operating income decreased in 2021 primarily due to the $27.9 million impairment of long-lived assets for the offshore wind energy structures business.
LIQUIDITY AND CAPITAL RESOURCES
Capital Allocation Philosophy
We have historically funded our growth, capital spending, and acquisitions through a combination of operating cash flows and debt financing. The following are the capital allocation/allocation priorities for cash generated:
| ● | working capital and capital expenditure investments necessary for future sales growth; |
| ● | dividends on common stock generally in the range of |
| ● | acquisitions; and |
| ● | return of capital to shareholders through share repurchases. |
We also announced our intentionintend to manage our capital structure to maintain our investment grade debt rating. Our most recent ratings were Baa3 by Moody’s Investors Services,Service, Inc., BBB- by Fitch Ratings, Inc., and BBB+ by Standard and Poor’s Rating Services.S&P Global Ratings. We would be willing to allow our debt rating to fall to BBB- to finance a special acquisition or other
30
opportunity. We expect to maintain a ratio of debt to invested capital which will support our current investment grade debt rating.
TheIn May 2014, the Board of Directors in May 2014 authorized the purchase of up to $500$500.0 million of the Company’s outstanding common stock from time to time over twelve months at prevailing market prices, through open market or privately-negotiatedprivately negotiated transactions. The Board of Directors authorized an additional $250$250.0 million of share purchases, without an expiration daterepurchases in both February 2015 and again in October 2018.2018, and authorized an additional $400.0 million of share repurchases in February 2023. These authorizations have no expiration date. The purchases are funded from available working capital and short-term borrowings and will be made subject to market and economic conditions. We are not obligated to make any repurchases and may discontinue the program at any time. As of December 31, 2022,30, 2023, we have acquired approximately 6.67.9 million shares for approximately $918.6$1,263.9 million under this share repurchase program. Subsequent
In November 2023, we entered into an accelerated purchase agreement to year end, onrepurchase $120.0 million of the Company’s outstanding common stock, under our previously announced share repurchase program described above. In the fourth quarter of fiscal 2023, we pre-paid $120.0 million and received an initial delivery of a number of shares of common stock which represented 75% of the prepayment amount. The accelerated share repurchase will be completed during the first quarter of fiscal 2024.
26
In February 27, 2023, the Company announced that the Board of Directors increasedapproved an increase to the amount remaining underquarterly cash dividend on the common stock to $0.60 per share, or a rate of $2.40 per share on an annualized basis, an increase of 9% from the prior quarterly cash dividend of $0.55 per share.
Supplier Finance Program
We have a supplier finance program agreement with a financial institution which allows qualifying suppliers, at their election and on terms they negotiate directly with the financial institution, to sell their receivables from the Company. A supplier’s voluntary participation in the program by an additional $400does not change our payment terms, amounts paid, payment timing, or impact our liquidity, and we have no economic interest in a supplier’s decision to participate. As of December 30, 2023 and December 31, 2022, our accounts payable on our Consolidated Balance Sheets included $41.9 million with no stated expiration date.and $48.9 million, respectively, of our payment obligations under this program.
Sources of Financing
Our debt financing atas of December 31, 202230, 2023 consisted primarily of long‑term debt and borrowings on our revolving credit facility. Our long‑term debt as of December 31, 2022,30, 2023, principally consisted of:
| ● | $ |
| ● | $ |
We are allowed to repurchase the notes subject to the payment of a make-whole premium. Both tranches of these notes are guaranteed by certain of our subsidiaries.
Our revolving credit facility with JP MorganJPMorgan Chase Bank, N.A., as Administrative Agent, and the other lenders party thereto, has a maturity date of October 18, 2026.
The revolving credit facility provides for $800$800.0 million of committed unsecured revolving credit loans with available borrowings thereunder to $400$400.0 million in foreign currencies. We may increase the credit facility by up to an additional $300$300.0 million at any time, subject to lenders increasing the amount of their commitments. The Company and our wholly-owned subsidiaries, Valmont Industries Holland B.V. and Valmont Group Pty. Ltd., are authorized borrowers under the credit facility. The obligations arising under the revolving credit facility are guaranteed by the Company and its wholly-owned subsidiaries, Valmont Telecommunications, Inc., Valmont Coatings, Inc., Valmont Newmark, Inc., and Valmont Queensland Pty. Ltd.
The interest rate on our borrowings will be, at our option, either:
| (a) | term |
| (b) | the higher of |
| ● | the prime lending rate, |
| ● | the overnight bank rate plus 50 basis points, and |
| ● | term SOFR (based on a one-month interest period) plus 100 basis points, |
plus, in each case, 0 to 62.5 basis points, depending on the credit rating of our senior unsecured long-term debt published by Standard & Poor’s Rating ServicesS&P Global Ratings and Moody’s Investors Service, Inc.; or
31
| (c) | daily simple SOFR plus a 10 basis point adjustment plus a spread of 100 to 162.5 basis points, depending on the credit rating of the Company’s senior unsecured long-term debt published by |
A commitment fee is also required under the revolving credit facility which accrues at 10 to 25 basis points, depending on the credit rating of our senior unsecured long-term debt published by Standard and Poor’s Rating ServicesS&P Global Ratings and Moody’s Investor Services,Investors Service, Inc., on the average daily unused portion of the commitments under the revolving credit agreement.
27
As of December 30, 2023 and December 31, 2022, we had outstanding borrowings of $377.9 million and $140.5 million, respectively, under the revolving credit facility. The revolving credit facility has a maturity date of October 18, 2026 and contains a financial covenant that may limit our additional borrowing capability under the agreement. As of December 31, 2022,30, 2023, we had the ability to borrow $659.4$421.9 million under this facility, after consideration of standby letters of credit of $0.2 million associated with certain insurance obligations. We also maintain certain short‑term bank lines of credit totaling $125.0$39.3 million, of which $119.2$36.1 million waswere unused as of December 31, 2022.30, 2023.
Our senior unsecured notes and revolving credit agreement each contain cross-default provisions which permit the acceleration of our indebtedness to them if we default on other indebtedness that results in, or permits, the acceleration of such other indebtedness.
The revolving credit facility requires maintenance of a financial leverage ratio, measured as of the last day of each of our fiscal quarters, of 3.50:13.50 or less. The leverage ratio is the ratio of: (a) interest-bearing debt minus unrestricted cash in excess of $50$50.0 million (but not exceeding $500$500.0 million); to (b) earnings before interest, taxes, depreciation, and amortization, adjusted EBITDA. The debt agreements provide a modification of the definition of “EBITDA” to add-back anyfor non-cash stock-based compensation in any trailing twelve month period and allow for an adjustment to EBITDA, subject to certain limitations, for non-cash charges or gains that are non-recurring in nature.nature, subject to certain limitations (“Adjusted EBITDA”). The leverage ratio is permitted to increase from 3.50:13.50 to 3:75:13.75 for the four consecutive fiscal quarters after certain material acquisitions.
The revolving credit agreement also contains customary affirmative and negative covenants or credit facilities of this type, including, among others, limitations on us and our subsidiaries with respect to indebtedness, liens, mergers and acquisitions, investments, dispositions of assets, restricted payments, transactions with affiliates, and prepayments of indebtedness. The revolving credit agreement also provides for acceleration of the obligations thereunder and exercise of other enforcement remedies upon the occurrence of customary events of default (subject to customary grace periods, as applicable).
As of December 31, 2022,30, 2023, we were in compliance with all covenants related to these debt agreements.
The calculation of Adjusted EBITDA-last four quartersEBITDA and the leverage ratio are presented in the tables below in Selected Financial Measures.
Cash Uses
Our principal cash requirements include working capital, capital expenditures, payments of principal and interest on our debt, payments of taxes, contributions to the pension plan, and, if market conditions warrant, occasional investments in, or acquisitions of, business ventures. In addition, we regularly evaluate our ability to pay dividends or repurchase stock, all consistent with the terms of our debt agreements.
Cash requirements for fiscal 20232024 are expected to consist primarily of capital expenditures, Delta pension plan contributions, operating leases, and interest on outstanding debt. The CompanyWe also hashave unconditional purchase commitments that relate to purchase orders for zinc, aluminum, and steel, all of which we plan to use in 2023.fiscal 2024. We believe the quantities under contract are reasonable in light of normal fluctuations in business levels and we expect to use the commodities under contract during the contract period. Total capital expenditures for fiscal 20232024 are expected to be approximately $105$125.0 million to $125$140.0 million.
32
The following table summarizes current and long-term material cash requirements as of December 31, 2022 (in millions of dollars):30, 2023:
| | | | | | | | | |
| | | | | Next 12 | | | | |
Contractual Obligations |
| Total |
| months |
| Thereafter | |||
Long‑term debt | | $ | 899.1 | | $ | 1.2 | | $ | 897.9 |
Interest1 | |
| 1,070.3 | |
| 40.4 | |
| 1,029.9 |
Delta pension plan contributions | |
| 206.8 | |
| 16.0 | |
| 190.8 |
Operating leases | |
| 235.4 | |
| 23.2 | |
| 212.2 |
Total contractual cash obligations | | $ | 2,411.6 | | $ | 80.8 | | $ | 2,330.8 |
| | | | ��� | | | | | |
| | Next 12 | | | | | | ||
Dollars in millions |
| Months |
| Thereafter |
| Total | |||
Long‑term debt | | $ | 0.7 | | $ | 1,134.2 | | $ | 1,134.9 |
Interest1 | |
| 57.7 | |
| 901.3 | |
| 959.0 |
Pension plan contributions | |
| 16.7 | |
| 200.2 | |
| 216.9 |
Operating leases | |
| 27.9 | |
| 222.4 | |
| 250.3 |
Total contractual cash obligations | | $ | 103.0 | | $ | 2,458.1 | | $ | 2,561.1 |
1 Interest expense amount assumes that long-term debt will be held to maturity.
Our businesses are cyclical, but we have diversity in our markets from a product, customer, and a geographical standpoint. We have demonstrated the ability to effectively manage through business cycles and maintain liquidity. We have consistently generated operating cash flows in excess of our capital expenditures. Based on our available credit facilities, issuance
28
access to capital markets, and our history of positive operational cash flows, we believe that we have adequate liquidity to meet our needs for fiscal year 20232024 and beyond.
We had cash balances of $185.4$203.0 million as of December 31, 2022,30, 2023 with approximately $147.2$162.0 million is held in our non-U.S. subsidiaries. If we distributed our foreign cash balances, certain taxes would be applicable. As of December 31, 2022,30, 2023, we had a liability for foreign withholding taxes and U.S. state income taxes of $2.0$1.6 million and $0.9$0.8 million, respectively.
Cash Flows
The following table includes a summary of our cash flow information for the fiscal years ended December 30, 2023, December 31, 2022, and December 25, 2021:
| | | | | | | | | | |
Dollars in thousands |
| | 2022 |
| 2021 |
| 2020 | |||
Cash flow data: | | | | | | | | | | |
Net cash flows from operating activities | | | $ | 326,265 | | $ | 65,938 | | $ | 316,294 |
Net cash flows from investing activities | | |
| (132,080) | |
| (417,308) | |
| (104,029) |
Net cash flows from financing activities | | |
| (181,905) | |
| 133,500 | |
| (173,756) |
| | | | | | | | | |
| | Fiscal Year Ended | |||||||
| | December 30, | | December 31, | | December 25, | |||
Dollars in thousands | | 2023 |
| 2022 |
| 2021 | |||
Net cash flows provided by operating activities | | $ | 306,775 | | $ | 326,265 | | $ | 65,938 |
Net cash flows used in investing activities | |
| (115,281) | |
| (132,080) | |
| (417,308) |
Net cash flows provided by (used in) financing activities | |
| (176,405) | |
| (181,905) | |
| 133,500 |
Operating Cash Flows and Working Capital – Cash generated fromprovided by operating activities totaled $306.8 million in fiscal 2023, as compared with $326.3 million in 2022 compared with $65.9 millionfiscal 2022. The decrease in 2021. Net working capital was $976.6 million as of December 31, 2022, as compared with $946.9 million as of December 25, 2021. The increase in net working capital in 2022 was attributed to the overall increase in net sales and the related impact on contract asset and receivables, partiallyoperating cash flows reflects cash flows generated from higher gross profits, more than offset by increases in accounts payabletax and interest payments of $10.6 million and $8.9 million, respectively, and payments of severance and other accrued expenses. Overall working capital was also affected by our use of cashemployee benefit costs related to fund our capital spending and acquisition of ConcealFab as well as our various financing activities.the Realignment Program totaling $22.7 million in fiscal 2023.
Investing Cash Flows – Cash used in investing activities totaled $115.3 million in fiscal 2023, as compared to $132.1 million in 2022, compared to $417.3 million in 2021.fiscal 2022. Investing activities in fiscal 2023 included capital spending of $96.8 million and the acquisition of HR Products, net of cash acquired, of $32.7 million partially offset by proceeds from the divestiture of Torrent Engineering and Equipment, net of cash divested, of $6.4 million, and proceeds from property damage insurance claims of $7.5 million. Investing activities in fiscal 2022 included capital spending of $93.3 million and the acquisition of a controlling ownership investment in ConcealFab for $39.3 million. In 2021, investing activities primarily included capital spending of $107.8 million and the acquisitions of two businesses within the Agriculture segment for $312.5 million.
Financing Cash Flows – Cash used in financing activities totaled $176.4 million in fiscal 2023, as compared to $181.9 million in 2022, compared to cash provided by financing activities of $133.5 million in 2021.fiscal 2022. Our total interest‑bearing debt decreasedincreased to $1,138.1 million as of December 30, 2023, from $878.0 million as of December 31, 2022,2022. The financing cash used in fiscal 2023 was primarily the result of borrowings on the revolving credit agreement and short-term notes of $400.8 million, offset by principal payments on our long-term debt and short-term borrowings of $168.8 million, dividends paid of $49.5 million, the purchase of treasury shares of $345.3 million, and $12.9 million of net activity from $965.4 million on December 25, 2021. Financingstock option and incentive plans, including the associated withholding tax payments. The financing cash outflowsused in fiscal 2022 primarily consisted of principal payments of long-term borrowings of $336.4, offset by proceeds from long-term debt borrowings of $254.0 million, dividends paid of $45.8 million, net payments on short-term agreements of $7.6 million, the purchase of treasury shares of $40.5 million, and the purchase of redeemable noncontrolling interests of $7.3 million.
During 2021, the Company had proceeds from long-term debt borrowings of $312.5 million, offset by payments on long-term debt of $91.3 million, dividends paid of $41.4 million, net payments on short-term agreements of $20.2 million, and the purchase of treasury shares of $26.1 million.
33
Guarantor Summarized Financial Information
We are providing the following information in compliance with Rule 3-10 and Rule 13-01 of Regulation S-X with respect to our two tranches of senior unsecured notes. All of the senior notes are guaranteed, jointly, severally, fully, and unconditionally (subject to certain customary release provisions, including sale of the subsidiary guarantor, or sale of all or substantially all of its assets) by certain of the Company’sour current and future direct and indirect domestic and foreign subsidiaries (collectively the “Guarantors”). The Parent is the Issuer of the notes and consolidates all Guarantors.
The financial information of the Issuer and Guarantors is presented on a combined basis with intercompany balances and transactions between the Issuer and Guarantors eliminated. The Issuer’s or Guarantors’ amounts due from, amounts due to, and transactions with non-guarantor subsidiaries are separately disclosed.
29
Combined financial information is as follows:
Supplemental Combined Parent and Guarantors Financial Information
Forfor the three-year periodfiscal years ended December 31, 2022
| | | | | | | | | | |
|
| | | | | | | |||
Dollars in thousands |
| | 2022 |
| 2021 |
| 2020 | |||
Net sales | | | $ | 2,876,425 | | $ | 2,139,427 | | $ | 1,854,141 |
Gross Profit | | |
| 695,211 | |
| 574,128 | |
| 512,880 |
Operating income | | |
| 268,142 | |
| 208,041 | |
| 180,206 |
Net earnings | | |
| 167,114 | |
| 120,655 | |
| 106,404 |
Net earnings attributable to Valmont Industries, Inc. | | |
| 167,220 | |
| 120,458 | |
| 102,266 |
Supplemental Combined Parent and Guarantors Financial Information
30, 2023, December 31, 2022, and December 25, 2021 was as follows:
| | | | | | | | | |
| | Fiscal Year Ended | |||||||
| | December 30, | | December 31, | | December 25, | |||
Dollars in thousands | | 2023 |
| 2022 |
| 2021 | |||
Net sales | | $ | 2,713,928 | | $ | 2,876,425 | | $ | 2,139,427 |
Gross profit | |
| 756,966 | |
| 695,211 | |
| 574,128 |
Operating income | |
| 255,401 | |
| 268,142 | |
| 208,041 |
Net earnings | |
| 134,831 | |
| 167,114 | |
| 120,655 |
Net earnings attributable to Valmont Industries, Inc. | |
| 133,300 | |
| 167,220 | |
| 120,458 |
Combined financial information as of December 30, 2023 and December 31, 2022 was as follows:
| | | | | | | |
Dollars in thousands |
| | 2022 |
| 2021 | ||
Current assets | | | $ | 769,263 | | $ | 801,797 |
Noncurrent assets | | |
| 925,088 | |
| 807,294 |
Current liabilities | | |
| 459,961 | |
| 383,394 |
Noncurrent liabilities | | |
| 1,189,548 | |
| 1,305,756 |
Noncontrolling interest in consolidated subsidiaries | | |
| 1,612 | |
| 1,844 |
| | | | | | |
| | December 30, | | December 31, | ||
Dollars in thousands | | 2023 |
| 2022 | ||
Current assets | | $ | 777,539 | | $ | 769,263 |
Non-current assets | |
| 872,016 | |
| 925,088 |
Current liabilities | |
| 361,211 | |
| 459,961 |
Non-current liabilities | |
| 1,436,131 | |
| 1,189,548 |
Redeemable noncontrolling interests | |
| 10,518 | |
| 1,612 |
Included in noncurrentnon-current assets is a due from non-guarantor subsidiaries receivable of $136,904 and $205,424 as of December 30, 2023 and $93,613 at December 31, 2022, and December 25, 2021.respectively. Included in noncurrentnon-current liabilities is a due to non-guarantor subsidiaries payable of $216,633 and $200,522 as of December 30, 2023 and $236,577 at December 31, 2022, and December 25, 2021.respectively.
34
Selected Financial Measures
We are including the following financial measures for the Company.
Return on Invested Capital is a non-GAAP measure. Accordingly, Invested Capital and– Return on invested capital (“ROIC”) and Adjusted ROIC are some of our key operating ratios, as they allow investors to analyze our operating performance in light of the amount of investment required to generate our operating profit. ROIC and Adjusted ROIC are also measurements used to determine management incentives. The table below shows how invested capital, ROIC, and Adjusted ROIC are calculated from our Consolidated Statements of Earnings and our Consolidated Balance Sheets. ROIC is calculated as after-tax operating income divided by the average of beginning and ending invested capital. Adjusted ROIC is calculated as after-tax operating income adjusted for the impairment of long-lived assets, realignment charges, non-recurring charges associated with the major scope changes for two strategic projects initiated by departed senior leadership, intangible asset amortization and stock-based compensation related to the Prospera subsidiary acquisition, the write-off of a receivable, and acquisition diligence then divided by the average of beginning and ending invested capital. Invested Capitalcapital represents total assets minus total liabilities (excluding interest-bearing debt and redeemable noncontrolling interests). ROIC and Adjusted ROIC are non-generally accepted accounting principles (“GAAP”) measures. Accordingly, invested capital, ROIC, and Adjusted ROIC should not be considered in isolation or as a substitute for net earnings, cash flows from operations, or other income or cash flow data prepared in accordance with GAAP or as a measure of our operating performance or liquidity.
30
The table below shows how Invested Capitalcalculation of these ratios for the fiscal years ended December 30, 2023, December 31, 2022, and Return on Invested Capital are calculated from our income statement and balance sheet. Return on Invested Capital is calculatedDecember 25, 2021 was as Operating Income (after-tax) divided by the average of beginning and ending Invested Capital. Invested Capital represents total assets minus total liabilities (excluding interest-bearing debt). Return on Invested Capital is one of our key operating ratios, as it allows investors to analyze our operating performance in light of the amount of investment required to generate our operating profit. Return on Invested Capital is also a measurement used to determine management incentives.follows:
| | | | | | | | | | | | |
Dollars in thousands |
| 2022 | | 2021 | | 2020 | ||||||
Operating income | | $ | 433,249 | | | $ | 286,785 | | | $ | 225,953 | |
Adjusted effective tax rate1 | |
| 27.7 | % | |
| 23.6 | % | |
| 24.2 | % |
Tax effect on operating income | |
| (119,872) | | |
| (67,681) | | |
| (54,681) | |
After-tax operating income | | $ | 313,377 | | | $ | 219,104 | | | $ | 171,272 | |
Average invested capital | | $ | 2,437,232 | | | $ | 2,176,577 | | | $ | 1,975,693 | |
Return on invested capital | |
| 12.9 | % | |
| 10.1 | % | |
| 8.7 | % |
| | | | | | | | | | | | |
Total assets | | $ | 3,556,996 | | | $ | 3,447,249 | | | $ | 2,953,160 | |
Less: Accounts payable | |
| (360,312) | | |
| (347,841) | | |
| (268,099) | |
Less: Accrued expenses | |
| (248,320) | | |
| (253,330) | | |
| (227,735) | |
Less: Income Tax Payable | |
| (3,664) | | |
| — | | |
| — | |
Less: Defined benefit pension asset | | | (24,216) | | | | — | | | | — | |
Less: Defined benefit pension liability | |
| — | | |
| (536) | | |
| (118,523) | |
Less: Deferred compensation | |
| (30,316) | | |
| (35,373) | | |
| (44,519) | |
Less: Other noncurrent liabilities | |
| (13,480) | | |
| (89,207) | | |
| (58,657) | |
Less: Dividends payable | |
| (11,742) | | |
| (10,616) | | |
| (9,556) | |
Less: Lease liability | |
| (155,469) | | |
| (147,759) | | |
| (80,202) | |
Less: Contract liability | |
| (172,915) | | |
| (135,746) | | |
| (130,018) | |
Less: Deferred tax liability | |
| (41,091) | | |
| (47,849) | | |
| (41,689) | |
Total Invested capital | | $ | 2,495,471 | | | $ | 2,378,992 | | | $ | 1,974,162 | |
Beginning of year invested capital | | $ | 2,378,992 | | | $ | 1,974,162 | | | $ | 1,977,223 | |
Average invested capital | | $ | 2,437,232 | | | $ | 2,176,577 | | | $ | 1,975,693 | |
| | | | | | | | | | | | |
|
| Fiscal Year Ended | ||||||||||
| | December 30, | | December 31, | | December 25, | ||||||
Dollars in thousands | | 2023 | | 2022 | | 2021 | ||||||
Operating income | | $ | 291,557 | | | $ | 433,249 | | | $ | 286,785 | |
Adjusted effective tax rate1 | |
| 38.1 | % | |
| 27.7 | % | |
| 23.6 | % |
Tax effect on operating income | |
| (111,124) | | |
| (119,872) | | |
| (67,681) | |
After-tax operating income | | $ | 180,433 | | | $ | 313,377 | | | $ | 219,104 | |
Average invested capital | | $ | 2,504,474 | | | $ | 2,437,232 | | | $ | 2,176,577 | |
Return on invested capital | |
| 7.2 | % | |
| 12.9 | % | |
| 10.1 | % |
| | | | | | | | | | | | |
Operating income | | $ | 291,557 | | | $ | 433,249 | | | $ | 286,785 | |
Impairment of long-lived assets | | | 140,844 | | | | — | | | | 27,911 | |
Realignment charges | | | 35,210 | | | | — | | | | 4,052 | |
Other non-recurring charges | | | 5,626 | | | | — | | | | — | |
Prospera intangible asset amortization3 | | | — | | | | 6,580 | | | | 3,396 | |
Prospera stock-based compensation3 | | | — | | | | 9,896 | | | | 5,240 | |
Write-off of a receivable | | | — | | | | — | | | | 5,545 | |
Acquisition diligence | | | — | | | | — | | | | 1,120 | |
Adjusted operating income | | $ | 473,237 | | | $ | 449,725 | | | $ | 334,049 | |
Adjusted effective tax rate1,2 | |
| 25.9 | % | |
| 27.7 | % | |
| 23.6 | % |
Tax effect on adjusted operating income | |
| (122,665) | | |
| (124,431) | | |
| (78,836) | |
After-tax adjusted operating income | | $ | 350,572 | | | $ | 325,294 | | | $ | 255,213 | |
Average invested capital | | $ | 2,504,474 | | | $ | 2,437,232 | | | $ | 2,176,577 | |
Adjusted return on invested capital | |
| 14.0 | % | |
| 13.3 | % | |
| 11.7 | % |
| | | | | | | | | | | | |
Total assets | | $ | 3,477,448 | | | $ | 3,556,996 | | | $ | 3,447,249 | |
Less: Defined benefit pension asset | | | (15,404) | | | | (24,216) | | | | — | |
Less: Accounts payable | |
| (358,311) | | |
| (360,312) | | |
| (347,841) | |
Less: Accrued expenses | |
| (277,764) | | |
| (248,320) | | |
| (253,330) | |
Less: Contract liabilities | |
| (70,978) | | |
| (172,915) | | |
| (135,746) | |
Less: Income taxes payable | |
| — | | |
| (3,664) | | |
| — | |
Less: Dividends payable | |
| (12,125) | | |
| (11,742) | | |
| (10,616) | |
Less: Deferred income taxes | |
| (21,205) | | |
| (41,091) | | |
| (47,849) | |
Less: Operating lease liabilities | |
| (162,743) | | |
| (155,469) | | |
| (147,759) | |
Less: Deferred compensation | |
| (32,623) | | |
| (30,316) | | |
| (35,373) | |
Less: Defined benefit pension liability | |
| — | | |
| — | | |
| (536) | |
Less: Other non-current liabilities | |
| (12,818) | | |
| (13,480) | | |
| (89,207) | |
Total invested capital | | $ | 2,513,477 | | | $ | 2,495,471 | | | $ | 2,378,992 | |
Beginning invested capital | | $ | 2,495,471 | | | $ | 2,378,992 | | | $ | 1,974,162 | |
Average invested capital | | $ | 2,504,474 | | | $ | 2,437,232 | | | $ | 2,176,577 | |
1 The adjusted effective tax rate for fiscal 2022 excludesexcluded the effects of the $33,273$33.3 million loss from the divestiture of the offshore wind energy structures business which iswas not deductible for income tax purposes. The effective tax rate including the loss on the divestiture iswas 29.9%.
2 The adjusted effective tax rate for 2020 excludesfiscal 2023 excluded the effects of the $12,575 goodwill impairment which is not deductibleof long-lived assets of $140.8 million, realignment charges of $35.2 million, non-recurring charges associated with major scope changes for incometwo strategic projects initiated by departed senior leadership of $5.6 million, loss from Argentine peso hyperinflation of $5.1 million, and non-recurring tax purposes.benefit items of $3.6 million. The effective tax rate in 2020 including the impairments is 25.7%these items was 38.1%.
Return on invested capital,3The Company does not include adjustments for the Prospera non-cash expenses for fiscal 2023 or going forward as these amounts are no longer financially significant after the third quarter of fiscal 2023 impairment of long-lived assets and realignment activities completed during the fourth quarter of fiscal 2023.
ROIC and Adjusted ROIC, as presented, may not be comparable to similarly titled measures of other companies.
31
35
Adjusted EBITDA. Earnings before Interest, Taxes, Depreciation and Amortization (“ – Adjusted EBITDA”)EBITDA is one of our key financial ratios in that it is the basis for determining our maximum borrowing capacity at any one time. Our bank credit agreements contain a financial covenant that our total interest-bearing debt not exceed 3.50x3.50 times Adjusted EBITDA (or 3.75x3.75 times Adjusted EBITDA after certain material acquisitions) for the most recent, calculated on a rolling four quarters.fiscal quarter basis. These bank credit agreements allow us to add estimated EBITDA from acquired businesses for periods we did not own the acquired businesses. The bank credit agreements also provideoutline adjustments for an adjustment to EBITDA, subject to certain specified limitations, fornon-cash stock-based compensation and non-cash charges or gains that are non-recurring in nature.nature, subject to certain limitations, to be included in the calculation of Adjusted EBITDA. If this financial covenant is violated, we may incur additional financing costs or be required to pay the debt before its maturity date. Adjusted EBITDA is a non-GAAP measure and, accordingly, should not be considered in isolation or as a substitute for net earnings, cash flows from operations or other income or cash flow data prepared in accordance with GAAP or as a measure of our operating performance or liquidity.
The calculation of Adjusted EBITDA isfor the fiscal year ended December 30, 2023 was as follows:
| | | |
| | Fiscal Year Ended | |
| | December 30, | |
Dollars in thousands | | 2023 | |
Net cash flows provided by operating activities | | $ | 306,775 |
Interest expense | |
| 56,808 |
Income tax expense | |
| 90,121 |
Impairment of long-lived assets | |
| (140,844) |
Deferred income tax benefit | |
| 18,649 |
Redeemable noncontrolling interests | |
| 5,937 |
Defined benefit pension plan cost | |
| (249) |
Contribution to defined benefit pension plan | |
| 17,345 |
Changes in assets and liabilities, net of acquisitions | |
| 80,561 |
Other | |
| 602 |
EBITDA | |
| 435,705 |
Impairment of long-lived assets | |
| 140,844 |
Realignment charges | | | 35,210 |
Proforma acquisition adjustment | | | 5,152 |
Adjusted EBITDA | | $ | 616,911 |
| | | | | | | | | | |
Dollars in thousands |
| | 2022 |
| 2021 |
| 2020 | |||
Net cash flows from operations | | | $ | 326,265 | | $ | 65,938 | | $ | 316,294 |
Interest expense | | |
| 47,534 | |
| 42,612 | |
| 41,075 |
Income tax expense | | |
| 108,687 | |
| 61,414 | |
| 49,615 |
Loss on investment | | | | — | | | — | | | (39) |
Impairment of long-lived assets | | |
| — | |
| (27,911) | |
| (20,389) |
Loss on divestiture of offshore wind energy structures business | | |
| (33,273) | |
| — | |
| — |
Deferred income tax (expense) benefit | | |
| 1,225 | |
| (71) | |
| 1,397 |
Noncontrolling interest | | |
| (3,388) | |
| (2,095) | |
| (1,456) |
Pension plan expense | | |
| 10,087 | |
| 14,567 | |
| 7,311 |
Contribution to pension plan | | |
| 17,155 | |
| 1,924 | |
| 35,399 |
Changes in assets and liabilities, net of acquisitions | | |
| 72,996 | |
| 264,558 | |
| (98,994) |
Other | | |
| (1,187) | |
| 17 | |
| (1,064) |
EBITDA | | |
| 546,101 | |
| 420,953 | |
| 329,149 |
Impairment of long-lived assets | | |
| — | |
| 27,911 | |
| 20,389 |
Loss on divestiture of offshore wind energy structures business | | |
| 33,273 | |
| — | |
| — |
Cash restructuring expenses | | | | — | | | — | | | 18,955 |
Adjusted EBITDA | | | $ | 579,374 | | $ | 448,864 | | $ | 368,493 |
| | | |
| | Fiscal Year Ended | |
| | December 30, | |
Dollars in thousands | | 2023 | |
Net earnings attributable to Valmont Industries, Inc. | | $ | 150,849 |
Interest expense | |
| 56,808 |
Income tax expense | |
| 90,121 |
Depreciation and amortization expense | |
| 98,708 |
Stock-based compensation | |
| 39,219 |
EBITDA | | | 435,705 |
Impairment of long-lived assets | | | 140,844 |
Realignment charges | | | 35,210 |
Proforma acquisition adjustment | | | 5,152 |
Adjusted EBITDA | | $ | 616,911 |
| | | | | | | | | | |
|
| | 2022 |
| 2021 |
| 20201 | |||
Net earnings attributable to Valmont Industries, Inc. | | | $ | 250,863 | | $ | 195,630 | | $ | 140,693 |
Interest expense | | |
| 47,534 | |
| 42,612 | |
| 41,075 |
Income tax expense | | |
| 108,687 | |
| 61,414 | |
| 49,615 |
Stock based compensation | | |
| 41,850 | |
| 28,720 | |
| 14,874 |
Depreciation and amortization expense | | |
| 97,167 | |
| 92,577 | |
| 82,892 |
EBITDA | | |
| 546,101 | |
| 420,953 | |
| 329,149 |
Impairment of long-lived assets | | |
| — | |
| 27,911 | |
| 20,389 |
Loss on divestiture of offshore wind energy structures business | | |
| 33,273 | |
| — | |
| — |
Cash restructuring expenses | | | | — | | | — | | | 18,955 |
Adjusted EBITDA | | | $ | 579,374 | | $ | 448,864 | | $ | 368,493 |
1 Calculated in accordance with the terms of the credit facility as in effect on December 25, 2021.
EBITDA and Adjusted EBITDA, as presented, may not be comparable to similarly titled measures of other companies. In October 2021, our revolving credit facility was amended to allow the Company to add-back any non-cash stock-based compensation in any trailing twelve month period and allow for an adjustment to EBITDA, subject to certain limitations, for non-cash charges or gains that are non-recurring in nature.
36
Leverage Ratio. – Leverage ratio is calculated as the sum of interest-bearing debt minus unrestricted cash in excess of $50$50.0 million (but not exceeding $500$500.0 million); divided by Adjusted EBITDA. The leverage ratio is one of the key financial ratios in the covenants under our major debt agreements and the ratio cannot exceed 3.53.50 (or 3.75x3.75 after certain material acquisitions) for any reporting period (four quarters)., calculated on a rolling four fiscal quarter basis. If those covenants are violated, we may incur additional financing costs or be required to pay the debt before its maturity date. Leverage ratio is a non-GAAP measure and, accordingly, should not be considered in isolation or as a substitute for net earnings, cash flows from operations, or other income or cash flow data prepared in accordance with GAAP or as a measure of our operating performance or liquidity.
32
The calculation of this ratio isas of December 30, 2023 was as follows:
| | | | | | | | | | |
Dollars in thousands |
| | 2022 |
| 2021 |
| 20201 | |||
Interest-bearing debt | | | $ | 877,975 | | $ | 965,395 | | $ | 766,326 |
Less: Cash and cash equivalents in excess of $50 million | | |
| 135,406 | |
| 127,232 | |
| 350,726 |
Net indebtedness | | |
| 742,569 | |
| 838,163 | |
| 415,600 |
Adjusted EBITDA | | |
| 579,374 | |
| 448,864 | |
| 368,493 |
Leverage Ratio | | |
| 1.28 | |
| 1.87 | |
| 1.13 |
| | | |
| | December 30, | |
Dollars in thousands | | 2023 | |
Interest-bearing debt, excluding origination fees and discounts of $26,310 | | $ | 1,138,119 |
Less: Cash and cash equivalents in excess of $50,000 | |
| 153,041 |
Net indebtedness | |
| 985,078 |
Adjusted EBITDA | |
| 616,911 |
Leverage ratio | |
| 1.60 |
Leverage ratio, as presented, may not be comparable to similarly titled measures of other companies.
1 Calculated in accordance with the terms of the credit facility as in effect on December 25, 2021.
MARKET RISK
Changes in Prices
Certain key materials we use are commodities traded in worldwide markets andwhich are subject to fluctuations in price. The most significant materials are steel, aluminum, zinc, and natural gas. Over the last several years, prices for these commodities have been volatile. The volatility in these prices was due to such factors as fluctuations in supply and demand conditions, government tariffs, and the costs of steel‑making inputs. Steel is most significant for our TD&S product line where the cost of steel has been approximately 50% of the net sales, on average. In fiscal 2018, we began using steel hot rolled steel coil derivative contracts on a limited basis to mitigate the impact of rising steel prices on operating income. Assuming a similar sales mix, a hypothetical 20% change in the price of steel would have affected net sales in this product line by approximately $95$100.0 million for the fiscal year ended December 31, 2022.30, 2023.
We have also experienced volatility in natural gas prices in the past several years. Our main strategies in managing these risks are a combination of fixed pricefixed-price purchase contracts with our vendors to reduce the volatility in our purchase prices and sales price increases where possible. We use natural gas swap contracts on a limited basis to mitigate the impact of rising natural gas prices on our operating income.
Risk Management
Market Risk—The principal market risks affecting us are exposure to interest rates, foreign currency exchange rates, and commodity prices. At times, we utilize derivative financial instruments to hedge these exposures, but we do not use derivatives for trading purposes.
Interest Rates—Rate Risk:Our interest‑bearing debt atas of December 31, 202230, 2023 was primarily fixed ratefixed-rate debt and borrowings on our revolving credit facility. Our notes payable, revolving credit facility, and a small portion of our long-term debt accrue interest at a variable rate. Assuming average interest rates and borrowings on variable rate debt, a hypothetical 10% change in interest rates would have affected our interest expense in 2022fiscal 2023 and 2021fiscal 2022 by approximately $0.8$2.5 million and $0.4$0.8 million, respectively. Likewise, we have excess cash balances on deposit in interest‑bearing accounts in financial institutions. An increase or decrease in interest rates of ten basis points would have impacted our annual interest earnings by approximately $0.2 million and $0.2 million in bothfiscal 2023 and fiscal 2022, and 2021.respectively.
37
Foreign Exchange—Exchange Risk:Exposures to transactions denominated in a currency other than thean entity’s functional currency are not material and, therefore, the potential exchange losses in future earnings, fair value, and cash flows from these transactions are not material. The Company isWe are also exposed to investment risk related to foreign operations. From time to time, as market conditions indicate, we will enter into foreign currency contracts to manage the risks associated with anticipated future transactions, current balance sheet positions, and foreign subsidiary investments that are in currencies other than the functional currencies of our businesses. AtAs of December 31, 2022,30, 2023, the Company had one outstanding fixed-for-fixed cross currency swap (“CCS”), swapping U.S. dollar principal and interest payments on a portion of its 5.00% senior unsecured notes due in fiscal 2044 for Euro denominated payments. The CCS was entered into in fiscal 2019 in order to mitigate foreign currency risk on the Company’sour Euro investments and to reduce interest expense. The notional amount of the Euro CCS is $80.0 million and matures in fiscal 2024. In fiscal 2019, the Company entered into a fixed-for-fixed CCS, swapping U.S. dollar principal and interest payments on a portion of its 5.00% senior unsecured notes due in fiscal 2044 for Danish krone (“DKK”) denominated payments. The DKK CCS, which qualified as a net investment hedges, werehedge, was settled in fiscal 2022, with the Company receiving $3.5 million.
33
Much of our cash in non-U.S. entities is denominated in foreign currencies, where fluctuations in exchange rates will impact our cash balances in U.S. dollar terms. A hypothetical 10% change in the value of the U.S. dollar would impact our reported cash balance by approximately $13.2 million in fiscal 2023 and $11.2 million in 2022 and $13.6 million in 2021.fiscal 2022.
We manage our investment risk in foreign operations by borrowing in the functional currencies of the foreign entities or by utilizing hedging instruments, (asas discussed above)above, where appropriate. The following table indicates the change in the recorded value of our most significant investments at year-endas of December 30, 2023 and December 31, 2022 assuming a hypothetical 10% change in the value of the U.S. dollar.
| | | | | | |
|
| December 30, |
| December 31, | ||
Dollars in millions | | 2023 | | 2022 | ||
Australian dollar | | $ | 6.9 | | $ | 4.3 |
Brazilian real | |
| 18.8 | |
| 11.8 |
British pound | |
| 17.2 | |
| 17.5 |
Canadian dollar | |
| 4.0 | |
| 3.8 |
Chinese renminbi | |
| 5.6 | |
| 6.0 |
Euro | |
| 9.5 | |
| 8.6 |
| | | | | | |
|
| 2022 |
| 2021 | ||
|
| (in millions) | ||||
Australian dollar | | $ | 4.3 | | $ | 11.6 |
Euro | |
| 8.6 | |
| 8.6 |
Danish krone | |
| — | |
| 2.4 |
Chinese renminbi | |
| 6.0 | |
| 6.2 |
Canadian dollar | |
| 3.8 | |
| 3.6 |
U.K. pound | |
| 17.5 | |
| 16.8 |
Brazilian real | |
| 11.8 | |
| 4.5 |
Commodity risk—Steel hotRisk: Hot rolled steel coil is a significant commodity input used by each of our segments in the manufacture of our products, with the exception of the Coatings product line. Steel prices are volatile and we may utilize derivative financial instruments to mitigate commodity price risk on fixed pricefixed-price orders. In 2021fiscal 2023 and fiscal 2022, the Companywe entered into steel hot rolled steel coil forward contracts and swaps which qualified as a cash flow hedgehedges of the variability in the cash flows attributable to future steel purchases. As of December 31, 2022,30, 2023, we had open forward contracts and swaps with a notional amount of $9.8$7.8 million for the total purchase of 10,3008,500 short tons from JanuaryDecember 2023 to March 2023.April 2024.
Natural gas is a significant commodity used in our factories, especially in our Coatings product line galvanizing operations, where natural gasit is used to heat tanks that enable the hot-dipped galvanizing process. Natural gas prices are volatile and we mitigate some of this volatilitywhich is somewhat mitigated through the use of derivative commodityfinancial instruments. Our current policy is to manage this commodity price risk for 0 to 75% of our U.S. natural gas requirements for the upcoming 6 to 1824 months through the purchase of natural gas swaps based on NYMEXNew York Mercantile Exchange futures prices for delivery in the month being hedged. The objective of this policy is to mitigate the impact on our earnings of sudden, significant increases in the price of natural gas. As of December 31, 2022,30, 2023, we havehad open natural gas swaps with a notional value of $7.0$4.3 million for 1,230,000 MMBtu.960,475 MMBtu from January 2024 to October 2025.
Diesel fuel is a significant commodity used by our contracted carriers who deliver our products. Diesel fuel prices are volatile which is somewhat mitigated through the use of derivative financial instruments. In fiscal 2023, we entered into diesel fuel option contracts that qualified as cash flow hedges of the variability of cash flows attributable to the diesel fuel costs charged by contracted carriers. As of December 30, 2023, we had open option contracts with a notional amount of $0.5 million for the total purchase of 1,890,000 gallons from January 2024 to September 2024.
CRITICAL ACCOUNTING POLICIES
The following accounting policies involve judgments and estimates used in preparation of the Consolidated Financial Statements. There is a substantial amount of management judgment used in preparing financial statements. We must make estimates on a number of items, such as impairments of long-lived assets, income taxes, revenue recognition for the product lines recognized over time, inventory obsolescence, and pension benefits. We base our estimates on our experience and on other assumptions that we believe are reasonable under the circumstances. Further, we re-evaluate our
38
estimates from time to time and as circumstances change. Actual results may differ under different assumptions or conditions. The selection and application of our critical accounting policies are discussed annually with our audit committee.Audit Committee.
Depreciation, Amortization, and Impairment of Long-Lived Assets
Our long-lived assets consist primarily of property, plant, and equipment, right-of-use (lease) assets, and goodwill and intangible assets acquired in business acquisitions. We have assigned useful lives to our property, plant, and equipment and certain intangible assets ranging from 32 to 4030 years. AIn the fourth quarter of fiscal 2021, a pre-tax $27.9 million impairment of the long-lived assets (customer relationship intangible asset, trade name, and$21.4 million of property, plant, and equipment)equipment was recognized in fiscal year 2021.for the offshore wind energy structures business.
34
We identified thirteen reporting units for purposes of evaluating goodwill and we annually evaluate our reporting units for goodwill impairment during the third fiscal quarter, which usually coincides with our strategic planning process. For twelveWe estimated the value of all fourteen of the reporting units we estimateidentified for the value of the reporting units usingfiscal 2023 goodwill impairment analysis utilizing a discounted cash flow model. The discounted cash flow model uses projected after-tax cash flows from operations (less capital expenses)expenditures) discounted to present value ("discounted cash flows"). The key assumptions in the discounted cash flow analysis are the discount rate and the projected cash flows.value. We also useperform sensitivity analysisanalyses to determine what the impact of changes in key assumptions, including discount rates and cash flow forecasts, may have on the valuation of the reporting units. For our solar tracking structure reporting unit, we project meaningful annual revenue growth for the foreseeable future due to strong market conditions. Therefore, we valued this reporting unit using a blend of both the discounted cash flows and a market approach. The market valuation approach estimates the value for this reporting unit using a multiple of earnings before interest, taxes, depreciation, and amortization (“EBITDA”). We analyze EBITDA multiples for other industrial companies with similar product lines in determining what to use in the model. The key assumption in the market approach analysis is the selection of industrial companies with similar product lines and forecasted EBITDA.
For both the 2022 and 2021fiscal 2023 annual impairment tests,test, the estimated fair value of alltwo of our reporting units exceededwas less than their respective carrying value, so no goodwill was impaired in 2022 or 2021. A $12.6value. As a result, a $120.0 million impairment of our access systemsAgriculture Technology reporting unit wasand a $1.9 million impairment of our India Structures reporting unit were recognized as a resultin the third quarter of an interimfiscal 2023.
The primary drivers for the reduction in the estimated fair value of the Agriculture Technology reporting unit were the less favorable outlook for the North American agriculture market and lower revenue projections for the Prospera agronomy software solutions. A higher weighted average cost of capital, primarily driven by increases in overall interest rates since the fiscal 2022 annual impairment test, and lower long-term revenue growth rate assumptions also partially contributed to the reduction in 2020.the estimated fair value of the reporting unit.
IfFor the India Structures reporting unit, assumptions around future cash flows including working capital requirements resulted in the impairment of the goodwill.
For all reporting units, if our assumptions on discount rates and future cash flows change as a result of events or circumstances and we believe these assets may have declined in value, then we may record impairment charges, resulting in lower profits. profits. Our reporting units are all cyclical, and their sales and profitability may fluctuate from year to year. We continue to monitor changes in the global economy that could impact the future operating results of itsour reporting units. If such adverse conditions arise, we will test a givenimpacted reporting unitunits for impairment prior to the annual test. In the evaluation of our reporting units, we look at the long-term prospects for the reporting unit and recognize that current performance may not be the best indicator of future prospects or value, which requires management judgment.
For four of our reporting units, Europe, Middle East & Africa Structures, Asia Pacific Highway Safety, Asia Pacific Access Systems, and Solar Tracking Structure, the amount of cushion or excess fair value above carrying value was less than 15%. We have identified cost-saving initiatives within these reporting units and believe they will continue to generate positive cash flows in excess of their current carrying value, however, we will continue to monitor their prospects for growth and continuous improvement. Should our assumptions around these businesses change negatively, there could be additional triggers for another goodwill assessment in the future.
Our indefinite‑livedindefinite-lived intangible assets consist of trade names. We assess the values of these assets apart from goodwill as part of the annual impairment testing. We use the relief-from-royalty method to evaluate our trade names, under which the value of a trade name is determined based on a royalty that could be charged to a third party for using the trade name in question. The royalty, which is based on a reasonable rate applied against estimated future sales, is tax-effected and discounted to present value. The most significant assumptions in this evaluation includeBased on our fiscal 2023 annual testing, the carrying value of one trade name exceeded its estimated future sales,fair value. An impairment of $1.7 million was recognized within the royalty rate andInfrastructure segment.
During the after-tax discount rate.
We performed our annualfourth quarter of fiscal 2021, an impairment test was required when the Company received clarifying information on the competitive environment of allthe offshore wind energy structures business. As a result, impairment charges of $2.0 million were recognized against the related trade names inname and $4.5 million were recognized against the related customer relationships asset.
In the third quarter of 2022fiscal 2023, the Company tested the recoverability of a certain amortizing proprietary technology intangible asset related to Prospera included within the Agriculture Technology reporting unit due to identified impairment indicators. The Company determined the carrying value of the asset exceeded the total undiscounted estimated future cash flows and determined none were impaired. We recognized anreduced the asset to its fair value. An impairment of approximately $2$17.3 million was recognized within the Agriculture segment.
35
Inventories
Inventories are valued at the lower of cost, determined on a first-in, first-out basis, or net realizable value. We write down slow-moving and obsolete inventory by the difference between the value of the inventory and our estimate of the reduced value based on potential future uses, the likelihood that overstocked inventory will be sold, and the expected selling prices of the inventory. If our ability to realize value on slow-moving or obsolete inventory is less favorable than assumed, additional inventory write downswrite-downs may be required.
39
Income Taxes
We record valuation allowances to reduce our deferred tax assets to amounts that are more likely than not to be realized. We consider future taxable income expectations and tax-planning strategies in assessing the need for the valuation allowance. If we estimate a deferred tax asset is not likely to be fully realized in the future, a valuation allowance to decrease the amount of the deferred tax asset would decrease net earnings in the period the determination was made. Likewise, if we subsequently determine that we are able to realize all or part of a net deferred tax asset in the future, an adjustment reducing the valuation allowance would increase net earnings in the period such determination was made.
AtAs of December 31, 2022,30, 2023, we had approximately $67.2$58.5 million in deferred tax assets relating to tax credits and loss carryforwards, with a valuation allowance of $43.4$42.4 million, including $7.1$2.5 million in valuation allowances related to capital loss carryforwards, which are unlikely ever to be realized. If circumstances related to our deferred tax assets change in the future, we may be required to increase or decrease the valuation allowance on these assets, resulting in an increase or decrease in income tax expense and a reduction or increase in net income. Also, we consider the earnings in our greater than 50% owned non-U.S. subsidiaries to not be indefinitely reinvestedre-invested and, accordingly, we have a deferred tax liability of $3.0$2.4 million related to these unremitted foreign earnings for future taxes that will be incurred when cash is repatriated.
We are subject to examination by taxing authorities in the various countries in which we operate. The tax years subject to examination vary by jurisdiction. We regularly consider the likelihood of additional income tax assessments in each of these taxing jurisdictions based on our experiences related to prior audits and our understanding of the facts and circumstances of the related tax issues. We include in current income tax expense any changes to accruals for potential tax deficiencies. If our judgments related to tax deficiencies differ from our actual experience, our income tax expense could increase or decrease in a given fiscal period.
Pension Benefits
Delta Ltd. maintains a defined benefit pension plan for qualifying employees in the United Kingdom.U.K. There are no active employees as members in the plan. Independent actuaries assist in properly measuring the liabilities and expenses associated with accounting for pension benefits to eligible employees.members. In order to use actuarial methods to value the liabilities and expenses, we must make several assumptions. The critical assumptions used to measure pension obligations and expenses are the discount rate and expected rate of return on pension assets.
We evaluate our critical assumptions at least annually. Key assumptions are based on the following factors:
| ● | Discount rate is based on the yields available on AA-rated corporate bonds with durational periods similar to that of the pension liabilities. |
| ● | Expected return on plan assets is based on our asset allocation mix and our historical return, taking into consideration current and expected market conditions. Most of the assets in the pension plan are invested in corporate bonds, the expected return of which |
| ● | Inflation is based on the estimated change in the consumer price index (“CPI”) or the retail price index (“RPI”), depending on the relevant plan provisions. |
36
The discount rate used to measure the defined benefit obligation was 4.80% at4.50% as of December 31, 2022.30, 2023. The following tables present the key assumptions in the measurement of the pension benefitcost for 2023fiscal 2024 and the estimated impact relative to a change in those assumptions for 2023:
fiscal 2024:
| | | |
|
|
| |
Discount rate |
|
| % |
Expected return on plan assets |
|
| % |
Inflation - CPI |
|
| % |
Inflation - RPI |
|
| % |
40
| | | |
|
| Decrease | |
| | in Pension | |
Assumptions In Millions of Dollars | | Benefit | |
0.25% increase in discount rate | | $ | 0.4 |
0.25% decrease in expected return on plan assets | | $ | 1.3 |
0.25% increase in inflation | | $ | 1.0 |
| | | |
|
| Increase | |
| | in Pension | |
Dollars in millions | | Cost | |
0.25% decrease in discount rate | | $ | 0.3 |
0.25% decrease in expected return on plan assets | | | 1.3 |
0.25% increase in inflation | | | 1.0 |
Revenue Recognition
We determine the appropriate revenue recognition for our contracts by analyzing the type, terms, and conditions of each contract or arrangement with a customer. We have no contracts with customers, under any product line, where we could earn variable consideration.
The following provides additional information about our contracts with transmission, distribution, and substation structures (“TD&S”)&S and certain telecommunication structuresTelecommunications customers where the revenue recognition is over time, the judgments we make in accounting for those contracts, and the resulting amounts recognized in our financial statements.Consolidated Financial Statements.
Accounting for utility structures and telecommunication monopole contracts: TD&S and telecommunicationTelecommunications monopole structures are engineered to customer specifications resulting in limited ability to sell the structure to a different customer if an order is canceled after production commences. The continuous transfer of control to the customer is evidenced either by contractual termination clauses or by our rights to payment for work performed to-dateto date plus a reasonable profit as the products do not have an alternative use to us. Since control is transferringtransferred over time, revenue is recognized based on the extent of progress towardstoward completion of the performance obligation. We also have certain telecommunicationTelecommunications structures customers’ contracts where we do not have the right to payment for work performed. In those instances, we recognize revenue at a point in time which is the time of the shipment of the structure.
The selection of the method to measure progress towardstoward completion requires judgment. For our steelTD&S and concrete utility and wireless communication structureTelecommunications product lines, we recognize revenue on an inputs basis, using total production hours incurred to-dateto date for each order as a percentage of total hours estimated to produce the order. The completion percentage is applied to the order’s total revenue and total estimated costs to determine reported revenue, cost of goods sold, and gross profit. Our enterprise resource planning (“ERP”) system captures the total costs incurred to-dateto date and the total production hours, both incurred to-dateto date and forecast to complete. The recently divested offshore wind energy structures business, divested in the fourth quarter of fiscal 2022, also recognized revenue using an inputs method, based on the cost-to-cost measure of progress. Under the cost-to-cost measure of progress, the extent of progress towards completion is measured based on the ratio of costs incurred to date to the total estimated costs at completion of the performance obligation.
Management must make assumptions and estimates regarding manufacturing labor hours and wages, the usage and cost of materials, and manufacturing burden /and overhead recovery rates for each production facility. For our steel, concrete, and wireless communication structures, production of an order, once started, is typically completed within three months. Projected profitability on open production orders is reviewed and updated monthly. We elected the practical expedient to not disclose the partially satisfied performance obligation at the end of the period when the contract has an original expected duration of one year or less.
We also have a few TD&S customer orders in a fiscal year that require one to three years to complete, due to the quantity of structures. Burden rates and routed production hours, per structure, will be adjusted if and when actual costs incurred are significantly higher than what had been originally projected. This resets the timing of revenue recognition for future periods so it is better aligned with the new production schedule. For our offshore wind energy structures business, prior to its divestiture in the fourth quarter of fiscal 2022, we updated the estimates of total costs to complete each order quarterly. Based on these updates, revenue in the current fiscal period may reflect adjustments for amounts that had been previously recognized. During fiscal 2023, 2022, 2021, and 2020,2021, there were no changes to inputs or estimates which resulted in
37
adjustments to revenue for production that occurred prior to the beginning of the fiscal year. A provision for loss on the performance obligation is recognized if and when an order is projected to be at a loss, whether or not production has started.
41
ITEM 7A. QUANTITATIVE AND QUALITATIVE DISCLOSURES ABOUT MARKET RISK.RISK
The information required is included underin the captioned paragraph, “MARKET RISK” on page 34section “Market Risk” within "Management’s Discussion and Analysis of Financial Condition and Results of Operations" in Part II, Item 7 of this report.
4238
ITEM 8. FINANCIAL STATEMENTS AND SUPPLEMENTARY DATA.
The following consolidated financial statements of the Company and its subsidiaries are included herein as listed below:
DATA
43
REPORT OF INDEPENDENT REGISTERED PUBLIC ACCOUNTING FIRM
To the shareholders and the Board of Directors of Valmont Industries, Inc.
Opinion on the Financial Statements
We have audited the accompanying consolidated balance sheets of Valmont Industries, Inc. and subsidiaries (the “Company”"Company") as of December 31, 202230, 2023 and December 25, 2021,31, 2022, the related consolidated statements of earnings, comprehensive income, shareholders' equity and redeemable noncontrolling interests, and cash flows, and shareholders’ equity, for each of the fiscalthree years in the three-year period ended December 31, 2022,30, 2023, and the related notes listed in the Index at Item 15 (collectively referred to as the "financial statements"). In our opinion, the financial statements present fairly, in all material respects, the financial position of the Company as of December 31, 202230, 2023 and December 25, 2021,31, 2022, and the results of its operations and its cash flows for each of the fiscalthree years in the three-year period ended December 31, 2022,30, 2023, in conformity with accounting principles generally accepted in the United States of America.
We have also audited, in accordance with the standards of the Public Company Accounting Oversight Board (United States) (PCAOB), the Company’sCompany's internal control over financial reporting as of December 31, 2022,30, 2023, based on criteria established in Internal Control — Integrated Framework (2013) issued by the Committee of Sponsoring Organizations of the Treadway Commission and our report dated March 1, 2023,February 28, 2024, expressed an unqualified opinion on the Company’sCompany's internal control over financial reporting.
Basis for Opinion
These financial statements are the responsibility of the Company’sCompany's management. Our responsibility is to express an opinion on the Company’sCompany's financial statements based on our audits. We are a public accounting firm registered with the PCAOB and are required to be independent with respect to the Company in accordance with the U.S. federal securities laws and the applicable rules and regulations of the Securities and Exchange Commission and the PCAOB.
We conducted our audits in accordance with the standards of the PCAOB. Those standards require that we plan and perform the audit to obtain reasonable assurance about whether the financial statements are free of material misstatement, whether due to error or fraud. Our audits included performing procedures to assess the risks of material misstatement of the financial statements, whether due to error or fraud, and performing procedures that respond to those risks. Such procedures included examining, on a test basis, evidence regarding the amounts and disclosures in the financial statements. Our audits also included evaluating the accounting principles used and significant estimates made by management, as well as evaluating the overall presentation of the financial statements. We believe that our audits provide a reasonable basis for our opinion.
Critical Audit Matter
The critical audit matter communicated below is a matter arising from the current-period audit of the financial statements that was communicated or required to be communicated to the audit committee and that (1) relates to accounts or disclosures that are material to the financial statements and (2) involved our especially challenging, subjective, or complex judgments. The communication of critical audit matters does not alter in any way our opinion on the financial statements, taken as a whole, and we are not, by communicating the critical audit matter below, providing a separate opinion on the critical audit matter or on the accounts or disclosures to which it relates.
Goodwill — Refer to Notes 1 and 8 to the consolidated financial statements
Critical Audit Matter Description
The Company has goodwill which is allocated among thirteenfourteen reporting units. The Company evaluates its thirteenfourteen reporting units for goodwill impairment during the third fiscal quarter of each year, or when events or changes in circumstances indicate the carrying value may not be recoverable. Twelve reportingReporting units are evaluated using projected after-tax cash flows from operations (less capital expenses) discounted to present value (“discounted cash flows”). The solar tracking structure reporting unit was valued using a blend of both the discounted cash flows and a market approach. The marketvalue. This valuation
44
approach estimates the value for this reporting unit using a multiple of earnings before interest, taxes, depreciation and amortization (EBITDA). The EBITDA multiples are analyzed against other industrial companies with similar product lines. These valuation methods require method requires management to make significant estimates and assumptions related to projected cash flows selection of industrial companies with similar product lines and forecasted EBITDA, and discount rates.
We identified goodwill for certainat the Agriculture Technology, Solar Tracking Structure, and Asia Pacific Access Systems reporting units as a critical audit matter because of the significant estimates and assumptions made by management to estimate fair value and the difference between the fair values and the carrying values of certain reporting units as of August 27, 2022.September 2, 2023. This required a high degree
39
of auditor judgment and an increased extent of effort, including the need to involve our fair value specialists, when performing audit procedures to evaluate the reasonableness of management’s estimates and assumptions related to certain assumptions within the projected cash flows selection of industrial companies with similar product lines and forecasted EBITDA, and discount rates.rates for these three reporting units.
How the Critical Audit Matter Was Addressed in the Audit
Our audit procedures related to the goodwill impairment assessment for certainthe Agriculture Technology, Solar Tracking Structure, and Asia Pacific Access Systems reporting units included the following, among others:
| ● | We tested the effectiveness of internal controls over management’s goodwill impairment evaluation, including those over the projected cash flows |
| ● | We evaluated management’s ability to accurately forecast cash flows by comparing actual results to management’s historical forecasts. |
| ● | We evaluated the reasonableness of management’s projected cash flows by comparing to (1) historical results, (2) internal communications to management and the Board of Directors, and (3) industry |
| ● | With the assistance of our fair value specialists, we evaluated the discount rates |
/s/ DELOITTE & TOUCHE LLP
Omaha, Nebraska
March 1, 2023
February 28, 2024
We have served as the Company’s auditor since 1996.
4540
Valmont Industries, Inc. and SubsidiariesVALMONT INDUSTRIES, INC. AND SUBSIDIARIES
CONSOLIDATED STATEMENTS OF EARNINGS
Three-year period ended December 31, 2022
(Dollars in thousands, except per share amounts)
| | | | | | | | | |
| | 2022 |
| 2021 |
| 2020 | |||
Product sales | | $ | 3,955,320 | | $ | 3,159,605 | | $ | 2,594,855 |
Services sales | |
| 389,930 | |
| 341,970 | |
| 300,500 |
Net sales | |
| 4,345,250 | |
| 3,501,575 | |
| 2,895,355 |
Product cost of sales | |
| 2,958,208 | |
| 2,395,630 | |
| 1,936,024 |
Services cost of sales | |
| 260,818 | |
| 222,056 | |
| 193,817 |
Total cost of sales | |
| 3,219,026 | |
| 2,617,686 | |
| 2,129,841 |
Gross profit | |
| 1,126,224 | |
| 883,889 | |
| 765,514 |
Selling, general, and administrative expenses | |
| 692,975 | |
| 590,608 | |
| 522,923 |
Impairment of goodwill and intangible assets | |
| — | |
| 6,496 | |
| 16,638 |
Operating income | |
| 433,249 | |
| 286,785 | |
| 225,953 |
Other income (expenses): | |
| | |
| | | | |
Interest expense | |
| (47,534) | |
| (42,612) | |
| (41,075) |
Interest income | |
| 2,015 | |
| 1,192 | |
| 2,374 |
Gain (loss) on investments - unrealized | |
| (3,374) | |
| 1,920 | |
| 2,443 |
Loss from divestiture of offshore wind energy structures business | | | (33,273) | | | — | | | — |
Other | |
| 12,805 | |
| 12,798 | |
| 3,073 |
| |
| (69,361) | |
| (26,702) | |
| (33,185) |
Earnings before income taxes | |
| 363,888 | |
| 260,083 | |
| 192,768 |
Income tax expense: | |
|
| |
|
| |
|
|
Current | |
| 109,912 | |
| 61,343 | |
| 51,012 |
Deferred | |
| (1,225) | |
| 71 | |
| (1,397) |
| |
| 108,687 | |
| 61,414 | |
| 49,615 |
Earnings before equity in earnings of nonconsolidated subsidiaries | |
| 255,201 | |
| 198,669 | |
| 143,153 |
Equity in loss of nonconsolidated subsidiaries | | | (950) | | | (944) | | | (1,004) |
Net earnings | |
| 254,251 | |
| 197,725 | |
| 142,149 |
Less: Earnings attributable to noncontrolling interests | |
| (3,388) | |
| (2,095) | |
| (1,456) |
Net earnings attributable to Valmont Industries, Inc. | | $ | 250,863 | | $ | 195,630 | | $ | 140,693 |
Earnings per share: | |
|
| |
|
| |
|
|
Basic | | $ | 11.77 | | $ | 9.23 | | $ | 6.60 |
Diluted | | $ | 11.62 | | $ | 9.10 | | $ | 6.57 |
| | | | | | | | | |
| | Fiscal Year Ended | |||||||
| | December 30, | | December 31, | | December 25, | |||
| | 2023 |
| 2022 |
| 2021 | |||
Product sales | | $ | 3,772,835 | | $ | 3,955,320 | | $ | 3,159,605 |
Service sales | |
| 401,763 | |
| 389,930 | |
| 341,970 |
Net sales | |
| 4,174,598 | |
| 4,345,250 | |
| 3,501,575 |
Product cost of sales | |
| 2,672,740 | |
| 2,958,208 | |
| 2,395,630 |
Service cost of sales | |
| 265,824 | |
| 260,818 | |
| 222,056 |
Total cost of sales | |
| 2,938,564 | |
| 3,219,026 | |
| 2,617,686 |
Gross profit | |
| 1,236,034 | |
| 1,126,224 | |
| 883,889 |
Selling, general, and administrative expenses | |
| 768,423 | |
| 692,975 | |
| 590,608 |
Impairment of goodwill and intangible assets | |
| 140,844 | |
| — | |
| 6,496 |
Realignment charges | | | 35,210 | |
| — | |
| — |
Operating income | |
| 291,557 | |
| 433,249 | |
| 286,785 |
Other income (expenses): | |
| | |
| | | | |
Interest expense | |
| (56,808) | |
| (47,534) | |
| (42,612) |
Interest income | |
| 6,230 | |
| 2,015 | |
| 1,192 |
Gain (loss) on investments - unrealized | |
| 3,564 | |
| (3,374) | |
| 1,920 |
Gain (loss) on divestitures | | | 2,994 | | | (33,273) | | | — |
Other | |
| (11,085) | |
| 12,805 | |
| 12,798 |
Total other income (expenses) | |
| (55,105) | |
| (69,361) | |
| (26,702) |
Earnings before income taxes and equity in loss of nonconsolidated subsidiaries | |
| 236,452 | |
| 363,888 | |
| 260,083 |
Income tax expense (benefit): | |
|
| |
|
| |
|
|
Current | |
| 108,770 | |
| 109,912 | |
| 61,343 |
Deferred | |
| (18,649) | |
| (1,225) | |
| 71 |
Total income tax expense | |
| 90,121 | |
| 108,687 | |
| 61,414 |
Earnings before equity in loss of nonconsolidated subsidiaries | |
| 146,331 | |
| 255,201 | |
| 198,669 |
Equity in loss of nonconsolidated subsidiaries | | | (1,419) | | | (950) | | | (944) |
Net earnings | |
| 144,912 | |
| 254,251 | |
| 197,725 |
Loss (earnings) attributable to redeemable noncontrolling interests | |
| 5,937 | |
| (3,388) | |
| (2,095) |
Net earnings attributable to Valmont Industries, Inc. | | $ | 150,849 | | $ | 250,863 | | $ | 195,630 |
Earnings per share: | |
|
| |
|
| |
|
|
Basic | | $ | 6.85 | | $ | 11.77 | | $ | 9.23 |
Diluted | | $ | 6.78 | | $ | 11.62 | | $ | 9.10 |
See accompanying notes to consolidated financial statements.
4641
Valmont Industries, Inc. and SubsidiariesVALMONT INDUSTRIES, INC. AND SUBSIDIARIES
CONSOLIDATED STATEMENTS OF COMPREHENSIVE INCOME
Three-year period ended December 31, 2022
(Dollars in thousands)
| | | | | | | | | |
| | 2022 |
| 2021 |
| 2020 | |||
Net earnings | | $ | 254,251 | | $ | 197,725 | | $ | 142,149 |
Other comprehensive income (loss), net of tax: | |
|
| |
|
| |
|
|
Foreign currency translation adjustments: | |
|
| |
|
| |
|
|
Unrealized translation gains (losses) | | | (44,741) | | | (31,405) | | | 21,483 |
Realized loss on offshore wind energy structures business recorded in other expense | | | 25,977 | | | — | | | — |
| | $ | (18,764) | | $ | (31,405) | | $ | 21,483 |
Gain (loss) on hedging activities: | |
| | | | | | | |
Commodity hedges | |
| (2,352) | |
| 20,019 | |
| — |
Realized (gain) loss on commodity hedges recorded in earnings | |
| 5,212 | |
| (25,821) | |
| — |
Unrealized gain (loss) on cross currency swaps | | | 5,146 | | | 6,093 | | | (5,751) |
Unrealized gain on net investment hedges, net of tax expense of $2,428 in 2020 | | | — | | | — | | | 7,289 |
Realized (gain) on offshore wind energy structures business cross currency swap, net of tax expense of $1,207 in 2022 | | | (3,620) | | | — | | | — |
Cash flow hedges | |
| — | |
| — | |
| 1,598 |
Realized gain on cash flow hedges recorded in earnings | | | — | | | — | | | (1,598) |
Amortization cost included in interest expense | |
| (64) | |
| (64) | |
| (64) |
| | | 4,322 | | | 227 | | | 1,474 |
Net gain (loss) on defined benefit pension plan, net of tax expense (benefit) of $(606) in 2022, $25,736 in 2021, $(4,183) in 2020 | |
| 1,345 | |
| 76,718 | |
| (17,349) |
Other comprehensive income (loss) | |
| (13,097) | |
| 45,540 | |
| 5,608 |
Comprehensive income | |
| 241,154 | |
| 243,265 | |
| 147,757 |
Comprehensive income attributable to noncontrolling interests | |
| (2,073) | |
| (976) | |
| (3,428) |
Comprehensive income attributable to Valmont Industries, Inc. | | $ | 239,081 | | $ | 242,289 | | $ | 144,329 |
| | | | | | | | | |
| | Fiscal Year Ended | |||||||
| | December 30, | | December 31, | | December 25, | |||
| | 2023 |
| 2022 |
| 2021 | |||
Net earnings | | $ | 144,912 | | $ | 254,251 | | $ | 197,725 |
Other comprehensive income (loss), net of tax: | |
|
| |
|
| |
|
|
Foreign currency translation adjustments: | |
|
| |
|
| |
|
|
Unrealized translation gain (loss) | | | 25,261 | | | (44,741) | | | (31,405) |
Realized loss on offshore wind energy structures business recorded in other expense | | | — | | | 25,977 | | | — |
Total foreign currency translation adjustments | | | 25,261 | | | (18,764) | | | (31,405) |
Hedging activities: | |
| | | | | | | |
Unrealized gain (loss) on commodity hedges | |
| (2,227) | |
| (2,352) | |
| 20,019 |
Realized loss (gain) on commodity hedges recorded in earnings | |
| 5,288 | |
| 5,212 | |
| (25,821) |
Unrealized gain (loss) on cross currency swaps | | | (2,119) | | | 5,146 | | | 6,093 |
Realized gain on offshore wind energy structures business cross currency swap, net of tax expense of $1,207 | | | — | | | (3,620) | | | — |
Amortization cost included in interest expense | |
| (52) | |
| (64) | |
| (64) |
Total hedging activities | | | 890 | | | 4,322 | | | 227 |
Net gain (loss) on defined benefit pension plan | |
| (23,326) | |
| 1,345 | |
| 76,718 |
Other comprehensive income (loss), net of tax | |
| 2,825 | |
| (13,097) | |
| 45,540 |
Comprehensive income | |
| 147,737 | |
| 241,154 | |
| 243,265 |
Comprehensive loss (income) attributable to redeemable noncontrolling interests | |
| 4,785 | |
| (2,073) | |
| (976) |
Comprehensive income attributable to Valmont Industries, Inc. | | $ | 152,522 | | $ | 239,081 | | $ | 242,289 |
See accompanying notes to consolidated financial statements.
4742
Valmont Industries, Inc. and SubsidiariesVALMONT INDUSTRIES, INC. AND SUBSIDIARIES
CONSOLIDATED BALANCE SHEETS
December 31, 2022 and December 25, 2021
(Dollars in thousands, except shares and per share amounts)par value)
| | | | | | | ||||||
| | | | | | |
| December 30, | | December 31, | ||
|
| 2022 |
| 2021 | | 2023 |
| 2022 | ||||
ASSETS | | | | | | | | | | | | |
Current assets: | | |
|
| |
| | |
|
| |
|
Cash and cash equivalents | | $ | 185,406 | | $ | 177,232 | | $ | 203,041 | | $ | 185,406 |
Receivables, less allowance of $20,890 in 2022 and $18,050 in 2021 | |
| 604,181 | |
| 571,593 | ||||||
Receivables, less allowance of $32,897 and $20,890, respectively | |
| 657,960 | |
| 604,181 | ||||||
Inventories | |
| 728,762 | |
| 728,834 | |
| 658,428 | |
| 728,762 |
Contract assets | |
| 174,539 | |
| 142,643 | |
| 175,721 | |
| 174,539 |
Prepaid expenses and other assets | |
| 87,697 | |
| 83,646 | ||||||
Prepaid expenses and other current assets | |
| 91,754 | |
| 87,697 | ||||||
Refundable income taxes | |
| — | |
| 8,815 | |
| 725 | |
| — |
Total current assets | |
| 1,780,585 | |
| 1,712,763 | |
| 1,787,629 | |
| 1,780,585 |
Property, plant, and equipment, at cost | |
| 1,433,151 | |
| 1,422,101 | |
| 1,513,239 | |
| 1,433,151 |
Less accumulated depreciation and amortization | |
| 837,573 | |
| 823,496 | ||||||
Net property, plant and equipment | |
| 595,578 | |
| 598,605 | ||||||
Less accumulated depreciation | |
| (895,845) | |
| (837,573) | ||||||
Property, plant, and equipment, net | |
| 617,394 | |
| 595,578 | ||||||
Goodwill | |
| 739,861 | |
| 708,566 | |
| 632,964 | |
| 739,861 |
Other intangible assets, net | |
| 176,615 | |
| 175,364 | |
| 150,687 | |
| 176,615 |
Defined pension benefit asset | | | 24,216 | |
| — | | | 15,404 | |
| 24,216 |
Other assets | |
| 240,141 | |
| 251,951 | ||||||
Other non-current assets | |
| 273,370 | |
| 240,141 | ||||||
Total assets | | $ | 3,556,996 | | $ | 3,447,249 | | $ | 3,477,448 | | $ | 3,556,996 |
| | | | | | | | | | | | |
LIABILITIES AND SHAREHOLDERS’ EQUITY | |
| | |
| | ||||||
LIABILITIES, REDEEMABLE NONCONTROLLING INTERESTS, | | | | | | | ||||||
Current liabilities: | |
|
| |
|
| |
|
| |
|
|
Current installments of long-term debt | | $ | 1,194 | | $ | 4,884 | | $ | 719 | | $ | 1,194 |
Notes payable to banks | |
| 5,846 | |
| 13,439 | |
| 3,205 | |
| 5,846 |
Accounts payable | |
| 360,312 | |
| 347,841 | |
| 358,311 | |
| 360,312 |
Accrued employee compensation and benefits | |
| 124,355 | |
| 144,559 | |
| 130,861 | |
| 124,355 |
Contract liabilities | |
| 172,915 | |
| 135,746 | |
| 70,978 | |
| 172,915 |
Other accrued expenses | |
| 123,965 | |
| 108,771 | |
| 146,903 | |
| 123,965 |
Income taxes payable | | | 3,664 | | | — | | | — | | | 3,664 |
Dividends payable | |
| 11,742 | |
| 10,616 | |
| 12,125 | |
| 11,742 |
Total current liabilities | |
| 803,993 | |
| 765,856 | |
| 723,102 | |
| 803,993 |
Deferred income taxes | |
| 41,091 | |
| 47,849 | |
| 21,205 | |
| 41,091 |
Long-term debt, excluding current installments | |
| 870,935 | |
| 947,072 | |
| 1,107,885 | |
| 870,935 |
Operating lease liabilities | |
| 155,469 | |
| 147,759 | |
| 162,743 | |
| 155,469 |
Deferred compensation | |
| 30,316 | |
| 35,373 | |
| 32,623 | |
| 30,316 |
Other noncurrent liabilities | |
| 13,480 | |
| 89,743 | ||||||
Other non-current liabilities | |
| 12,818 | |
| 13,480 | ||||||
Total liabilities | | | 2,060,376 | | | 1,915,284 | ||||||
Redeemable noncontrolling interests | |
| 62,792 | |
| 60,865 | ||||||
Shareholders’ equity: | |
|
| |
|
| |
|
| |
|
|
Common stock of $1 par value - | |
| | |
| | ||||||
Authorized 75,000,000 shares; 27,900,000 issued | |
| 27,900 | |
| 27,900 | ||||||
Additional paid-in capital | |
| — | |
| 1,479 | ||||||
Common stock of $1 par value, authorized 75,000,000 shares; 27,900,000 issued | |
| 27,900 | |
| 27,900 | ||||||
Retained earnings | |
| 2,593,039 | |
| 2,394,307 | |
| 2,643,606 | |
| 2,593,039 |
Accumulated other comprehensive loss | |
| (274,909) | |
| (263,127) | |
| (273,236) | |
| (274,909) |
Cost of treasury stock, common shares of 6,549,833 in 2022 and 6,619,860 in 2021 | |
| (765,183) | |
| (773,712) | ||||||
Total Valmont Industries, Inc. shareholders’ equity | |
| 1,580,847 | |
| 1,386,847 | ||||||
Noncontrolling interest in consolidated subsidiaries | |
| 60,865 | |
| 26,750 | ||||||
Treasury stock, at cost, common shares of 7,691,192 and 6,549,833, respectively | |
| (1,043,990) | |
| (765,183) | ||||||
Total shareholders’ equity | | | 1,641,712 | | | 1,413,597 | | | 1,354,280 | | | 1,580,847 |
Total liabilities and shareholders’ equity | | $ | 3,556,996 | | $ | 3,447,249 | ||||||
Total liabilities, redeemable noncontrolling interests, and shareholders’ equity | | $ | 3,477,448 | | $ | 3,556,996 | ||||||
See accompanying notes to consolidated financial statements.
4843
Valmont Industries, Inc. and SubsidiariesVALMONT INDUSTRIES, INC. AND SUBSIDIARIES
CONSOLIDATED STATEMENTS OF CASH FLOWS
Three-year period ended December 31, 2022 (Dollars(Dollars in thousands)
| | | | | | | | | |
| | 2022 |
| 2021 |
| 2020 | |||
Cash flows from operating activities: | | |
|
| |
|
| |
|
Net earnings | | $ | 254,251 | | $ | 197,725 | | $ | 142,149 |
Adjustments to reconcile net earnings to net cash flows from operations: | |
|
| |
|
| |
|
|
Depreciation and amortization | |
| 97,167 | |
| 92,577 | |
| 82,892 |
Noncash loss on trading securities | |
| — | |
| — | |
| 39 |
Contribution to defined benefit pension plan | |
| (17,155) | |
| (1,924) | |
| (35,399) |
Impairment of long-lived assets | |
| — | |
| 27,911 | |
| 20,389 |
Loss on sale of offshore wind energy structures business | | | 33,273 | |
| — | |
| — |
Stock-based compensation | |
| 41,850 | |
| 28,720 | |
| 14,874 |
Defined benefit pension plan benefit | |
| (10,087) | |
| (14,567) | |
| (7,311) |
Loss (gain) on sale of property, plant and equipment | |
| 237 | |
| (961) | |
| 60 |
Equity in loss in nonconsolidated subsidiaries | |
| 950 | |
| 944 | |
| 1,004 |
Deferred income taxes | |
| (1,225) | |
| 71 | |
| (1,397) |
Changes in assets and liabilities: | |
|
| |
| | | | |
Receivables | |
| (74,163) | |
| (69,275) | |
| (24,403) |
Inventories | |
| (3,429) | |
| (289,942) | |
| (21,888) |
Prepaid expenses and other assets (current and non-current) | |
| 26,625 | |
| (36,066) | |
| (10,633) |
Contract assets | |
| (53,008) | |
| (21,579) | |
| 19,835 |
Accounts payable | |
| 36,990 | |
| 89,418 | |
| 33,044 |
Accrued expenses | |
| 624 | |
| 30,556 | |
| 52,548 |
Contract liabilities | |
| (567) | |
| 6,589 | |
| 12,072 |
Other noncurrent liabilities | |
| (16,904) | |
| 20,181 | |
| 46,712 |
Income taxes payable / refundable | |
| 10,836 | |
| 5,560 | |
| (8,293) |
Net cash flows from operating activities | |
| 326,265 | |
| 65,938 | |
| 316,294 |
Cash flows from investing activities: | | | | | | | | | |
Purchase of property, plant, and equipment | |
| (93,288) | |
| (107,790) | |
| (106,700) |
Proceeds from sale of assets | |
| 1,582 | |
| 1,745 | |
| 10,860 |
Acquisitions, net of cash acquired | |
| (39,287) | |
| (312,500) | |
| (15,862) |
Proceeds from settlement of net investment hedge | |
| — | |
| — | |
| 11,983 |
Investments in nonconsolidated subsidiaries | |
| — | |
| — | |
| (1,283) |
Other, net | | | (1,087) | |
| 1,237 | |
| (3,027) |
Net cash flows from investing activities | |
| (132,080) | |
| (417,308) | |
| (104,029) |
Cash flows from financing activities: | |
|
| |
|
| |
|
|
Proceeds from short-term borrowings | |
| 9,665 | |
| 5,821 | |
| 20,990 |
Payments on short-term borrowings | |
| (17,242) | |
| (26,062) | |
| (7,946) |
Proceeds from long-term borrowings | |
| 253,999 | |
| 312,485 | |
| 88,872 |
Principal payments on long-term borrowings | |
| (336,403) | |
| (91,313) | |
| (121,665) |
Proceeds from settlement of financial derivatives | |
| 3,532 | |
| — | |
| — |
Debt issuance costs | |
| — | |
| (2,267) | |
| — |
Dividends paid | |
| (45,813) | |
| (41,412) | |
| (36,930) |
Dividends to noncontrolling interest | |
| (714) | |
| — | |
| (5,642) |
Purchase of noncontrolling interests | |
| (7,338) | |
| — | |
| (59,416) |
Purchase of treasury shares | |
| (40,474) | |
| (26,100) | |
| (56,491) |
Proceeds from exercises under stock plans | |
| 16,849 | |
| 23,895 | |
| 18,961 |
Purchase of common treasury shares—stock plan exercises | |
| (17,966) | |
| (21,547) | |
| (14,489) |
Net cash flows from financing activities | |
| (181,905) | |
| 133,500 | |
| (173,756) |
Effect of exchange rate changes on cash and cash equivalents | |
| (4,106) | |
| (5,624) | |
| 8,675 |
Net change in cash and cash equivalents | |
| 8,174 | |
| (223,494) | |
| 47,184 |
Cash and cash equivalents—beginning of year | |
| 177,232 | |
| 400,726 | |
| 353,542 |
Cash and cash equivalents—end of period | | $ | 185,406 | | $ | 177,232 | | $ | 400,726 |
| | | | | | | | | |
| | Fiscal Year Ended | |||||||
| | December 30, | | December 31, | | December 25, | |||
| | 2023 |
| 2022 |
| 2021 | |||
Cash flows from operating activities: | | |
|
| |
|
| |
|
Net earnings | | $ | 144,912 | | $ | 254,251 | | $ | 197,725 |
Adjustments to reconcile net earnings to net cash flows from operations: | |
|
| |
|
| |
|
|
Depreciation and amortization | |
| 98,708 | |
| 97,167 | |
| 92,577 |
Contribution to defined benefit pension plan | |
| (17,345) | |
| (17,155) | |
| (1,924) |
Impairment of long-lived assets | |
| 140,844 | |
| — | |
| 27,911 |
Loss (gain) on divestitures | | | (2,994) | |
| 33,273 | |
| — |
Stock-based compensation | |
| 39,219 | |
| 41,850 | |
| 28,720 |
Defined benefit pension plan cost (benefit) | |
| 249 | |
| (10,087) | |
| (14,567) |
Loss (gain) on sale of property, plant, and equipment | |
| 973 | |
| 237 | |
| (961) |
Equity in loss of nonconsolidated subsidiaries | |
| 1,419 | |
| 950 | |
| 944 |
Deferred income taxes | |
| (18,649) | |
| (1,225) | |
| 71 |
Changes in assets and liabilities: | |
|
| |
| | | | |
Receivables | |
| (46,308) | |
| (74,163) | |
| (69,275) |
Inventories | |
| 88,433 | |
| (3,429) | |
| (289,942) |
Contract assets | |
| (1,230) | |
| (53,008) | |
| (21,579) |
Prepaid expenses and other assets (current and non-current) | |
| (26,161) | |
| 26,625 | |
| (36,066) |
Accounts payable | |
| (10,529) | |
| 36,990 | |
| 89,418 |
Contract liabilities | |
| (106,884) | |
| (567) | |
| 6,589 |
Accrued expenses | |
| 22,591 | |
| 624 | |
| 30,556 |
Income taxes payable / refundable | |
| 13,746 | |
| 10,836 | |
| 5,560 |
Other non-current liabilities | |
| (14,219) | |
| (16,904) | |
| 20,181 |
Net cash flows provided by operating activities | |
| 306,775 | |
| 326,265 | |
| 65,938 |
Cash flows from investing activities: | | | | | | | | | |
Purchase of property, plant, and equipment | |
| (96,771) | |
| (93,288) | |
| (107,790) |
Proceeds from divestitures, net of cash divested | | | 6,369 | |
| — | |
| — |
Proceeds from sale of assets | |
| 1,710 | |
| 1,582 | |
| 1,745 |
Proceeds from property damage insurance claims | | | 7,468 | |
| — | |
| — |
Acquisitions, net of cash acquired | |
| (32,676) | |
| (39,287) | |
| (312,500) |
Other, net | | | (1,381) | |
| (1,087) | |
| 1,237 |
Net cash flows used in investing activities | |
| (115,281) | |
| (132,080) | |
| (417,308) |
Cash flows from financing activities: | |
|
| |
|
| |
|
|
Proceeds from short-term borrowings | |
| 30,785 | |
| 9,665 | |
| 5,821 |
Payments on short-term borrowings | |
| (34,083) | |
| (17,242) | |
| (26,062) |
Proceeds from long-term borrowings | |
| 370,012 | |
| 253,999 | |
| 312,485 |
Principal payments on long-term borrowings | |
| (134,748) | |
| (336,403) | |
| (91,313) |
Proceeds from settlement of financial derivatives | |
| — | |
| 3,532 | |
| — |
Debt issuance costs | |
| — | |
| — | |
| (2,267) |
Dividends paid | |
| (49,515) | |
| (45,813) | |
| (41,412) |
Dividends to redeemable noncontrolling interests | |
| (662) | |
| (714) | |
| — |
Purchase of redeemable noncontrolling interests | |
| — | |
| (7,338) | |
| — |
Purchase of treasury shares | |
| (345,279) | |
| (40,474) | |
| (26,100) |
Proceeds from exercises under stock plans | |
| 5,841 | |
| 16,849 | |
| 23,895 |
Tax withholdings on exercises under stock plans | |
| (18,756) | |
| (17,966) | |
| (21,547) |
Net cash flows provided by (used in) financing activities | |
| (176,405) | |
| (181,905) | |
| 133,500 |
Effect of exchange rate changes on cash and cash equivalents | |
| 2,546 | |
| (4,106) | |
| (5,624) |
Net change in cash and cash equivalents | |
| 17,635 | |
| 8,174 | |
| (223,494) |
Cash and cash equivalents—beginning of period | |
| 185,406 | |
| 177,232 | |
| 400,726 |
Cash and cash equivalents—end of period | | $ | 203,041 | | $ | 185,406 | | $ | 177,232 |
See accompanying notes to consolidated financial statements.
44
49
Valmont Industries, Inc. and SubsidiariesVALMONT INDUSTRIES, INC. AND SUBSIDIARIES
CONSOLIDATED STATEMENTS OF SHAREHOLDERS’ EQUITY
Three-year period ended December 31, 2022 AND
REDEEMABLE NONCONTROLLING INTERESTS
(Dollars in thousands, except shares and per share amounts)
| | | | | | | | | | | | | | | | | | | | | |
| | | |
| | |
| | |
| Accumulated |
| | |
| Noncontrolling |
| | | ||
| | | | | Additional | | | | | other | | | | | interest in | | Total | ||||
| | Common | | paid-in | | Retained | | comprehensive | | Treasury | | consolidated | | shareholders’ | |||||||
| | stock | | capital | | earnings | | income (loss) | | stock | | subsidiaries | | equity | |||||||
Balance at December 28, 2019 | | $ | 27,900 | | $ | — | | $ | 2,173,802 | | $ | (313,422) | | $ | (743,942) | | $ | 45,407 | | $ | 1,189,745 |
Net earnings | |
| — | |
| — | |
| 140,693 | |
| — | |
| — | |
| 1,456 | |
| 142,149 |
Other comprehensive income (loss) | |
| — | |
| — | |
| — | |
| 3,636 | |
| — | |
| 1,972 | |
| 5,608 |
Cash dividends declared ($1.80 per share) | |
| — | |
| — | |
| (38,393) | |
| — | |
| — | |
| — | |
| (38,393) |
Dividends to noncontrolling interests | |
| — | |
| — | |
| — | |
| — | |
| — | |
| (5,642) | |
| (5,642) |
Purchase of noncontrolling interest | |
| — | |
| — | |
| (31,067) | |
| — | |
| — | |
| (22,544) | |
| (53,611) |
Addition of noncontrolling interest | | | — | | | — | | | — | | | — | | | — | | | 5,125 | | | 5,125 |
Purchase of treasury shares; 441,119 shares acquired | |
| — | |
| — | |
| — | |
| — | |
| (56,491) | |
| — | |
| (56,491) |
Stock plan exercises, 88,411 shares acquired | |
| — | |
| — | |
| — | |
| — | |
| (14,489) | |
| — | |
| (14,489) |
Stock options exercised; 147,014 shares issued | |
| — | |
| (6,335) | |
| — | |
| — | |
| 25,296 | |
| — | |
| 18,961 |
Stock option expense | |
| — | |
| 2,628 | |
| — | |
| — | |
| — | |
| — | |
| 2,628 |
Stock awards; 65,248 shares issued | |
| — | |
| 4,042 | |
| — | |
| — | |
| 8,204 | |
| — | |
| 12,246 |
Balance at December 26, 2020 | |
| 27,900 | |
| 335 | |
| 2,245,035 | |
| (309,786) | |
| (781,422) | |
| 25,774 | |
| 1,207,836 |
Net earnings | |
| — | |
| — | |
| 195,630 | |
| — | |
| — | |
| 2,095 | |
| 197,725 |
Other comprehensive income (loss) | |
| — | |
| — | |
| — | |
| 46,659 | |
| — | |
| (1,119) | |
| 45,540 |
Cash dividends declared ($2.00 per share) | |
| — | |
| — | |
| (42,472) | |
| — | |
| — | |
| — | |
| (42,472) |
Purchase of treasury shares; 111,833 shares acquired | |
| — | |
| — | |
| — | |
| — | |
| (26,100) | |
| — | |
| (26,100) |
Stock plan exercises; 90,292 shares acquired | |
| — | |
| — | |
| — | |
| — | |
| (21,547) | |
| — | |
| (21,547) |
Stock options exercised; 169,908 shares issued | |
| — | |
| (15,357) | |
| (3,886) | |
| — | |
| 43,138 | |
| — | |
| 23,895 |
Stock option expense | |
| — | |
| 2,538 | |
| — | |
| — | |
| — | |
| — | |
| 2,538 |
Stock awards; 88,395 shares issued | |
| — | |
| 13,963 | |
| — | |
| — | |
| 12,219 | |
| — | |
| 26,182 |
Balance at December 25, 2021 | |
| 27,900 | |
| 1,479 | |
| 2,394,307 | |
| (263,127) | |
| (773,712) | |
| 26,750 | |
| 1,413,597 |
Net earnings | |
| — | |
| — | |
| 250,863 | |
| — | |
| — | |
| 3,388 | |
| 254,251 |
Other comprehensive loss | |
| — | |
| — | |
| — | |
| (11,782) | |
| — | |
| (1,315) | |
| (13,097) |
Cash dividends declared ($2.20 per share) | |
| — | |
| — | |
| (46,939) | |
| — | |
| — | |
| — | |
| (46,939) |
Dividends to noncontrolling interests | | | — | | | — | | | — | | | — | | | — | | | (714) | | | (714) |
Addition of noncontrolling interest | | | — | | | — | | | — | | | — | | | — | | | 41,693 | | | 41,693 |
Reduction of noncontrolling interest | | | — | | | 1,599 | | | — | | | — | | | — | | | (8,937) | | | (7,338) |
Purchase of treasury shares; 137,612 shares acquired | |
| — | |
| — | |
| — | |
| — | |
| (40,474) | |
| — | |
| (40,474) |
Stock plan exercises; 60,599 shares acquired | |
| — | |
| — | |
| — | |
| — | |
| (17,966) | |
| — | |
| (17,966) |
Stock options exercised; 121,163 shares issued | |
| — | |
| (17,754) | |
| (5,192) | |
| — | |
| 39,795 | |
| — | |
| 16,849 |
Stock option expense | |
| — | |
| 3,120 | |
| — | |
| — | |
| — | |
| — | |
| 3,120 |
Stock awards; 147,075 shares issued | |
| — | |
| 11,556 | |
| — | |
| — | |
| 27,174 | |
| — | |
| 38,730 |
Balance at December 31, 2022 | | $ | 27,900 | | $ | — | | $ | 2,593,039 | | $ | (274,909) | | $ | (765,183) | | $ | 60,865 | | $ | 1,641,712 |
| | | | | | | | | | | | | | | | | | | | | |
| | | |
| | |
| | |
| Accumulated |
| | |
| | | | | | |
| | | | | Additional | | | | | other | | | | | Total | | Redeemable | ||||
| | Common | | paid-in | | Retained | | comprehensive | | Treasury | | shareholders’ | | noncontrolling | |||||||
| | stock | | capital | | earnings | | income (loss) | | stock | | equity | | interests | |||||||
Balance as of December 26, 2020 | | $ | 27,900 | | $ | 335 | | $ | 2,245,035 | | $ | (309,786) | | $ | (781,422) | | $ | 1,182,062 | | $ | 25,774 |
Net earnings | |
| — | |
| — | |
| 195,630 | |
| — | |
| — | |
| 195,630 | |
| 2,095 |
Other comprehensive income (loss), net of tax | |
| — | |
| — | |
| — | |
| 46,659 | |
| — | |
| 46,659 | |
| (1,119) |
Cash dividends declared ($2.00 per share) | |
| — | |
| — | |
| (42,472) | |
| — | |
| — | |
| (42,472) | |
| — |
Purchase of treasury shares; 111,833 shares acquired | |
| — | |
| — | |
| — | |
| — | |
| (26,100) | |
| (26,100) | |
| — |
Stock option and incentive plans | | | — | | | 1,144 | | | (3,886) | | | — | | | 33,810 | | | 31,068 | | | — |
Balance as of December 25, 2021 | |
| 27,900 | |
| 1,479 | |
| 2,394,307 | |
| (263,127) | |
| (773,712) | |
| 1,386,847 | |
| 26,750 |
Net earnings | |
| — | |
| — | |
| 250,863 | |
| — | |
| — | |
| 250,863 | |
| 3,388 |
Other comprehensive loss, net of tax | |
| — | |
| — | |
| — | |
| (11,782) | |
| — | |
| (11,782) | |
| (1,315) |
Cash dividends declared ($2.20 per share) | |
| — | |
| — | |
| (46,939) | |
| — | |
| — | |
| (46,939) | |
| — |
Dividends to redeemable noncontrolling interests | | | — | | | — | | | — | | | — | | | — | | | — | | | (714) |
Addition of redeemable noncontrolling interests | | | — | | | — | | | — | | | — | | | — | | | — | | | 41,693 |
Reduction of redeemable noncontrolling interests | | | — | | | 1,599 | | | — | | | — | | | — | | | 1,599 | | | (8,937) |
Purchase of treasury shares; 137,612 shares acquired | |
| — | |
| — | |
| — | |
| — | |
| (40,474) | |
| (40,474) | |
| — |
Stock option and incentive plans | | | — | | | (3,078) | | | (5,192) | | | — | | | 49,003 | | | 40,733 | | | — |
Balance as of December 31, 2022 | |
| 27,900 | |
| — | |
| 2,593,039 | |
| (274,909) | |
| (765,183) | |
| 1,580,847 | |
| 60,865 |
Net earnings (loss) | |
| — | |
| — | |
| 150,849 | |
| — | |
| — | |
| 150,849 | |
| (5,937) |
Other comprehensive income, net of tax | |
| — | |
| — | |
| — | |
| 1,673 | |
| — | |
| 1,673 | |
| 1,152 |
Cash dividends declared ($2.40 per share) | |
| — | |
| — | |
| (49,898) | |
| — | |
| — | |
| (49,898) | |
| — |
Change in redemption value of redeemable noncontrolling interest | | | — | | | — | | | (7,374) | | | — | | | — | | | (7,374) | | | 7,374 |
Dividends to redeemable noncontrolling interests | | | — | | | — | | | — | | | — | | | — | | | — | | | (662) |
Purchase of treasury shares; 1,282,706 shares acquired | |
| — | |
| — | |
| (30,000) | |
| — | |
| (318,121) | |
| (348,121) | |
| — |
Stock option and incentive plans | | | — | | | — | | | (13,010) | | | — | | | 39,314 | | | 26,304 | | | — |
Balance as of December 30, 2023 | | $ | 27,900 | | $ | — | | $ | 2,643,606 | | $ | (273,236) | | $ | (1,043,990) | | $ | 1,354,280 | | $ | 62,792 |
See accompanying notes to consolidated financial statements.
5045
Valmont Industries, Inc. and SubsidiariesVALMONT INDUSTRIES, INC. AND SUBSIDIARIES
NOTES TO CONSOLIDATED FINANCIAL STATEMENTS
Three-year period ended December 31, 2022
(Dollars in thousands, except per share amounts)
(1) SUMMARY OF SIGNIFICANT ACCOUNTING POLICIES
Principles of Consolidation
The consolidated financial statementsConsolidated Financial Statements include the accounts of Valmont Industries, Inc. and its wholly and majority‑ownedcontrolled subsidiaries (the “Company”). Investments in 20% to 50% owned affiliates and joint ventures through which the Company exercises significant influence over but does not control the investee and is not the primary beneficiary of the investee's activities are accounted for byusing the equity method. Investments in less than 20% owned affiliates are accounted for by the cost method. All intercompany items have been eliminated.
Cash OverdraftsFiscal Year
Cash book overdrafts totaling $25,075 and $19,670 were classified as accounts payable atThe Company operates on a 52 or 53 week fiscal year with each fiscal year ending on the last Saturday in December. Accordingly, the Company’s fiscal year ended December 30, 2023 consisted of 52 weeks, the Company’s fiscal year ended December 31, 2022 consisted of 53 weeks, and the Company’s fiscal year ended December 25, 2021 respectively.consisted of 52 weeks. The Company’s policy isestimated impact on the Company's results of operations due to report the change in book overdrafts as an operating activityadditional week in the Consolidated Statementsfiscal year ended December 31, 2022 was additional net sales of Cash Flows.approximately $80,800 and additional net earnings of approximately $5,300.
Change in Reportable Segments
During the first quarter of 2022, the Company’s Chief Executive Officer, as the chief operating decision maker, made changes to the Company’s management structure and began to manage the business, allocate resources, and evaluate performance under the new structure. As a result, the Company has realigned its reportable segment structure. All prior period segment information has been recast to reflect this change in reportable segments. Refer to Note 21 for additional information.
The Company has two reportable segments based on its management structure. Each segment is global in nature with a manager responsible for segment operational performance and allocation of capital within the segment.capital. Reportable segments are as follows:
INFRASTRUCTURE: This segment consists of the manufacture and distribution of products and solutions to serve the infrastructure markets of utility, renewable energy,solar, lighting, transportation, and telecommunications, andalong with coatings services to preserveprotect metal products.
AGRICULTURE: This segment consists of the manufacture of center pivot components and linear irrigation equipment for agricultural markets, including parts and tubular products, and advanced technology solutions for precision agriculture.
In addition to these two reportable segments, the Company had a business and related activities in fiscal 2022 that waswere not more than 10% of consolidated sales, operating income, or assets. This includesbusiness, the offshore wind energy structures business, and iswas reported in the “Other” segment until its divestiture in the fourth quarter of fiscal 2022.
Fiscal YearCash Overdrafts
The Company operates on a 52 or 53 week fiscal year with each year ending onCash book overdrafts totaling $19,869 and $25,075 were classified as “Accounts payable” in the last Saturday in December. Accordingly, the Company’s fiscal year endedConsolidated Balance Sheets as of December 30, 2023 and December 31, 2022, consistedrespectively. The Company’s policy is to report the change in book overdrafts as “Cash flows from operating activities” in the Consolidated Statements of 53 weeks and the Company’s fiscal years ended December 25, 2021 and December 26, 2020 consisted of 52 weeks. The estimated impact on the Company's results of operations due to the extra week in fiscal year 2022 was additional net sales of approximately $80,800 and additional net earnings of approximately $5,300.Cash Flows.
Accounts ReceivableReceivables
Accounts receivableReceivables are reported on the balance sheetConsolidated Balance Sheets net of any allowance for doubtful accounts.credit losses. Allowances are maintained in amounts considered to be appropriate in relation to the outstanding receivables based on the age of the receivable, economic conditions, and customer credit quality. As the Company’s international business has grown, the exposure to potential losses in international
51
Valmont Industries, Inc. and Subsidiaries
NOTES TO CONSOLIDATED FINANCIAL STATEMENTS – CONTINUED
Three-year period ended December 31, 2022
(Dollars in thousands, except per share amounts)
markets has also increased. These exposures can be difficult to estimate, particularly in areas of political instability, with governments with which the Company has limited experience, or where there is a lack of transparency as to the current credit condition of governmental units.
46
52
Valmont Industries, Inc. and SubsidiariesVALMONT INDUSTRIES, INC. AND SUBSIDIARIES
NOTES TO CONSOLIDATED FINANCIAL STATEMENTS – CONTINUED
Three-year period ended December 31, 2022
(Dollars in thousands, except per share amounts)
(1) SUMMARY OF SIGNIFICANT ACCOUNTING POLICIES – CONTINUED
The following table details the balances of the allowance for doubtful receivablescredit losses and changes therein:
| | | | | | | | | | | | | | | | | | | | | | | | | | | | | | |
|
| Balance at |
| Charged to |
| Currency |
| Deductions |
| Balance at |
| Balance as of |
| Charged to |
| Currency |
| Deductions |
| Balance as of | ||||||||||
| | Beginning of | | Profit and | | Translation | | from | | Close of | | Beginning of | | Profit and | | Translation | | from | | Close of | ||||||||||
For periods ended: | | Period | | Loss | | Adjustment | | Reserves | | Period | ||||||||||||||||||||
Fiscal year ended: | | Period | | Loss | | Adjustment | | Reserves | | Period | ||||||||||||||||||||
December 30, 2023 | | $ | 20,890 | | $ | 17,657 | | $ | 911 | | $ | (6,561) | | $ | 32,897 | |||||||||||||||
December 31, 2022 | | $ | 18,050 | | $ | 4,237 | | $ | (522) | | $ | (875) | | $ | 20,890 | |
| 18,050 | |
| 4,237 | |
| (522) | |
| (875) | |
| 20,890 |
December 25, 2021 | |
| 15,952 | |
| 3,379 | |
| (339) | |
| (942) | |
| 18,050 | |
| 15,952 | |
| 3,379 | |
| (339) | |
| (942) | |
| 18,050 |
December 26, 2020 | |
| 9,548 | |
| 7,957 | |
| 260 | |
| (1,813) | |
| 15,952 | |||||||||||||||
The Company sells trade accounts receivable at a discount under uncommitted trade accounts receivable sale programs to third partythird-party financial institutions without recourse. As these accounts receivable are sold without recourse, the Company does not retain the associated risks following the transfer of such accounts receivable to the financial institutions.
Transfers of accounts receivable are accounted for as sales and, accordingly, accounts receivablesreceivable sold are excluded from “Receivables, less allowance” onin the Consolidated Balance Sheets, and cash proceeds are reflected in “Cash flows from operating activities” onin the Consolidated Statements of Cash Flows. The difference between the carrying amount of the trade accounts receivables sold and the cash received, or discount, is recorded in “Other” expenses on“Other income (expenses)” in the Consolidated Statements of Earnings.
AtAs of December 30, 2023 and December 31, 2022, and December 25, 2021, the Company sold trade accounts receivable of $100.0 million$60,000 and $25.4 million,$100,000, respectively. The fees associated with the trade accounts receivables soldfactoring program are immaterial.recognized within “Selling, general, and administrative expenses” in the Consolidated Statements of Earnings and were approximately $4,500 for the fiscal year ended December 30, 2023.
Inventories
Inventory is valued at the lower of cost, determined on the first-in, first-out (“FIFO”) method, or net realizable value. Finished goods and manufactured goods inventories include the costs of acquired raw materials and related factory labor and overhead charges required to convert raw materials to manufactured and finished goods.
Long-Lived Assets
Property, plant, and equipment are recorded at historical cost. The Company generally uses the straight-line method in computing depreciation and amortization for financial reporting purposes and accelerated methods for income tax purposes. The annual provisions for depreciation and amortization have been computed principally in accordance with the following ranges of asset lives: buildings and improvements 15- 10 to 4030 years, machinery and equipment - 3 to 1210 years, transportation equipment - 3 to 2410 years, office furniture and equipment - 3 to 7 years, and intangible assets 5- 2 to 20 years. Depreciation expense inwas $78,138, $73,938, and $70,223 for the fiscal years ended December 30, 2023, December 31, 2022, 2021, and 2020 was $73,938, $70,223, and $63,890,December 25, 2021, respectively.
An impairment loss is recognized if the carrying amount of an asset may not be recoverable and exceeds the estimated future undiscounted cash flows of the asset. A recognized impairment loss reduces the carrying amount of the asset to its estimated fair value. The Company recognized a pre-tax $27,900 impairment of long-lived assets (property, plant, and equipment, customer relationship intangible asset, and trade name) in 2021 when it determined that its offshore wind energy business reporting unit would not generate sufficient cash flows to recover the carrying values. An impairment test was required in November 2021 when the Company received clarifying information on the competitive environment of this reporting unit in Europe. Impairment losses were recorded in 2020 as facilities were closed and future plans for certain fixed assets changed in connection with the Company’s restructuring plans.
53
Valmont Industries, Inc. and Subsidiaries
NOTES TO CONSOLIDATED FINANCIAL STATEMENTS – CONTINUED
Three-year period ended December 31, 2022
(Dollars in thousands, except per share amounts)
The Company evaluates its reporting units for impairment of goodwill during the third fiscal quarter of each fiscal year or when events or changes in circumstances indicate the carrying value may not be recoverable. Reporting units are evaluated using after-tax operating cash flows (less capital expenditures) discounted to present value (“discounted cash flows”). For the solar tracking reporting unit, the Company valued this reporting unit using a blend of the discounted cash flows and multiple of earnings before interest, taxes, depreciation, and amortization (“EBITDA”) approach.value. Indefinite‑lived intangible assets are assessed separately from goodwill as part of the annual impairment testing using a relief-from-royalty method. If the underlying assumptions related to the valuation of a reporting unit’s goodwill or an indefinite‑lived intangible assetassets change materially before or after the annual impairment testing, the reporting unit or asset is evaluated for potential impairment. In these evaluations, management considers recent operating performance, expected future performance, industry conditions, and other indicators of potential impairment. The Company recognized a pre-tax $21,415 impairment of property, plant, and equipment in fiscal 2021 when it determined that its offshore wind energy structures business reporting unit would not generate sufficient cash flows to recover the carrying values, recorded as “Product cost of sales” in the Consolidated Statements of Earnings. See footnoteNote 8 for details of impairments of goodwill and other intangible assets recognized during the fiscal years ended December 30, 2023 and December 25, 2021.
5447
Valmont Industries, Inc. and SubsidiariesVALMONT INDUSTRIES, INC. AND SUBSIDIARIES
NOTES TO CONSOLIDATED FINANCIAL STATEMENTS – CONTINUED
Three-year period ended December 31, 2022
(Dollars in thousands, except per share amounts)
(1) SUMMARY OF SIGNIFICANT ACCOUNTING POLICIES – CONTINUED
Leases
The Company's operating leaseslease right-of-use (“ROU”) assets are included in “Other non-current assets” and the corresponding lease obligations are included in “Other accrued expenses” and “Operating lease liabilities” in the Consolidated Balance Sheets.
Income Taxes
The Company uses the asset and liability method to calculate deferred income taxes. Deferred tax assets and liabilities are recognized on temporary differences between financial statement and tax bases of assets and liabilities using enacted tax rates. The effect of tax rate changes on deferred tax assets and liabilities is recognized in income during the period that includes the enactment date.
Warranties
The Company’s provision for product warranty reflects management’s best estimate of probable liability under its product warranties. Estimated future warranty costs are recorded at the time a sale is recognized. Future warranty liability is determined based on applying historical claim rate experience to units sold that are still within the warranty period. In addition, the Company records provisions for known warranty claims.
Pension BenefitsCost (Benefit)
Certain expenses are incurred in connection with a defined benefit pension plan. In order to measure the expense and the related benefit obligation, various assumptions are made including discount rates used to value the obligation, the expected return on plan assets used to fund these expenses, and the estimated future inflation rates. These assumptions are based on historical experience as well as current facts and circumstances. An actuarial analysis is used to measure the expense and liability associated with the pension benefits.cost (benefit).
Stock Plans
The Company maintains stock-based compensation plans approved by the shareholders, which provide that the Human ResourceResources Committee of the Board of Directors may grant incentive stock options, nonqualified stock options, stock appreciation rights, restricted stock awards, restricted stock units, and bonuses of common stock.
Fair Value
The Company applies the provisions of Accounting Standards Codification 820, Fair Value Measurement (“ASC 820”), which defines fair value, establishes a framework for measuring fair value, and expands disclosures about fair value measurements. The provisions of ASC 820 apply to other accounting pronouncements that require or permit fair value measurements. As defined in ASC 820, fair value is the price that would be received to sell an asset or paid to transfer a liability in an orderly transaction between market participants at the measurement date.
Derivative Instruments
The Company may enter into derivative financial instruments to manage risk associated with fluctuation in interest rates, foreign currency rates, or commodities.commodity prices. Where applicable, the Company may elect to account for such derivatives as either a cash flow, fair value, or net investment hedge.
5548
Valmont Industries, Inc. and SubsidiariesVALMONT INDUSTRIES, INC. AND SUBSIDIARIES
NOTES TO CONSOLIDATED FINANCIAL STATEMENTS – CONTINUED
Three-year period ended December 31, 2022
(Dollars in thousands, except per share amounts)
(1) SUMMARY OF SIGNIFICANT ACCOUNTING POLICIES – CONTINUED
Comprehensive Income (Loss)
Comprehensive income (loss) includes net earnings, foreign currency translation adjustments, certain derivative-related activity, and changes in net actuarial gains / lossesprior service cost from athe pension plan. Results of operations for foreign subsidiaries are translated using the average exchange rates during the period. Assets and liabilities are translated at the exchange rates in effect on the balance sheet dates. The components of accumulatedAccumulated other comprehensive income (loss) (“AOCI”) consisted of the following:following as of December 30, 2023 and December 31, 2022:
| | | | | | | | | | | | | | | | | | |
|
| Foreign |
| | |
| | |
| Accumulated | | December 30, | | December 31, | ||||
| | Currency | | | | Defined | | Other | | 2023 |
| 2022 | ||||||
| | Translation | | Hedging | | Benefit | | Comprehensive | ||||||||||
| | Adjustments | | Activities | | Pension Plan | | Income (Loss) | ||||||||||
Balance at December 25, 2021 | | $ | (243,350) | | $ | 15,777 | | $ | (35,554) | | $ | (263,127) | ||||||
Current period comprehensive income (loss) | |
| (43,426) | |
| 7,942 | |
| 1,345 | |
| (34,139) | ||||||
Divestiture of offshore wind energy structures business | | | 25,977 | | | (3,620) | | | — | | | 22,357 | ||||||
Balance at December 31, 2022 | | $ | (260,799) | | $ | 20,099 | | $ | (34,209) | | $ | (274,909) | ||||||
Foreign currency translation adjustments | | $ | (236,690) | | $ | (260,799) | ||||||||||||
Hedging activities | | | 20,989 | | | 20,099 | ||||||||||||
Defined benefit pension plan | | | (57,535) | | | (34,209) | ||||||||||||
Accumulated other comprehensive loss | | $ | (273,236) | | $ | (274,909) | ||||||||||||
Revenue Recognition
The Company determines the appropriate revenue recognition model for contracts by analyzing the type, terms, and conditions of each contract or arrangement with a customer. Contracts with customers for all businesses are fixed-price with sales tax excluded from revenue and do not include variable consideration. Discounts included in contracts with customers, typically early pay discounts, are recorded as a reduction of net sales in the period in which the sale is recognized. Contract revenues are classified as product sales“Product sales” when the performance obligation is related to the manufacturing and sale of goods. Contract revenues are classified as service sales“Service sales” when the performance obligation is the performance of a service. Service revenue is primarily related to the Coatings product line and Technology Products and Services product lines.line.
Customer acceptance provisions exist primarilyonly in the design stage of our products (on a limited basis, the Company may agree to other acceptance terms), and acceptance of the design by the customer is required before manufacturing commences and the projectproduct is manufactured and delivered to the customer. The Company is generally not entitled to any compensation solely based on the design of the product and does not recognize this service as a separate performance obligation, and, therefore, no revenue is recognized with thefor design stage.services. No general rights of return exist for customers once the product has been delivered, and the Company establishes provisions for estimated warranties. The Company does not sell extended warranties for any of its products.
Shipping and handling costs associated with sales are recorded as costswithin cost of goods sold.sales. The Company elected to use the practical expedient of treating freight as a fulfillment obligation instead of a separate performance obligation and ratably recognize freight expense as the structure is being manufactured when the revenue from the associated customer contract is being recognized over time. With the exception of the transmission, distribution,Transmission, Distribution, and substation structuresSubstation ("TD&S"), Solar, and Telecommunications product line, the renewable energy product line, and the telecommunication structures product line,lines, the Company’s inventory is interchangeable for a variety of each segment’s customers. The Company has elected to not disclose the partially satisfied performance obligation at the end of the period when the contract has an original expected duration of one year or less. In addition, the Company does not adjust the amount of consideration to be received in a contract for any significant financing component if payment is expected within twelve monthsone year of transfer of control of goods or services.
The Company’s contract assets as of December 31, 2022 and December 25, 2021 totaled $174,539 and $142,643, respectively.
56
Valmont Industries, Inc. and Subsidiaries
NOTES TO CONSOLIDATED FINANCIAL STATEMENTS – CONTINUED
Three-year period ended December 31, 2022
(Dollars in thousands, except per share amounts)
While mostMost of the Infrastructure segmentCompany’s customers are generally invoiced upon shipment or delivery of the goods to the customer’s specified location, certainlocation. Contract assets are recorded as revenue is recognized over time and such contract assets are relieved when the customer is invoiced. As of December 30, 2023 and December 31, 2022, the Company’s contract assets totaled $175,721 and $174,539, respectively.
49
VALMONT INDUSTRIES, INC. AND SUBSIDIARIES
NOTES TO CONSOLIDATED FINANCIAL STATEMENTS
(Dollars in thousands, except per share amounts)
Certain customers are also invoiced by advanced billings or progress billings. AtWhen progress on performance obligations is less than the amount the customer has been billed, a contract liability is recognized. As of December 30, 2023, total contract liabilities of $70,978 were recorded as “Contract liabilities” in the Consolidated Balance Sheets. As of December 31, 2022, and December 25, 2021, total contract liabilities were $178,531 and $213,203, respectively. At December 31, 2022,of $172,915 waswere recorded as contract liabilities“Contract liabilities” and $5,616 waswere recorded as other noncurrent liabilities on“Other non-current liabilities” in the consolidated balance sheets.Consolidated Balance Sheets. Additional details are as follows:
57
Valmont Industries, Inc. and Subsidiaries
NOTES TO CONSOLIDATED FINANCIAL STATEMENTS – CONTINUED
Three-year period ended December 31, 2022
(Dollars in thousands, except per share amounts)
(1) SUMMARY OF SIGNIFICANT ACCOUNTING POLICIES – CONTINUED
| ● | During the fiscal |
| ● |
Segment and Product Line Revenue Recognition
Infrastructure Segment
Steel and concrete utility structures within the TD&S and Telecommunications product lines are engineered to customer specifications resulting in limited ability to sell the structure to a different customer if an order is canceled after production commences. The continuous transfer of control to the customer is evidenced either by contractual termination clauses or by rights to payment for work performed to-dateto date plus a reasonable profit as the products do not have an alternative use to the Company. Since control is transferringtransferred over time, revenue is recognized based on the extent of progress towardstoward completion of the performance obligation. The selection of the method to measure progress towardstoward completion requires judgment. For the structures manufactured within the TD&S and telecommunication structureTelecommunications product lines, the Company generally recognizes revenue on an inputs basis, using total production hours incurred to-dateto date for each order as a percentage of total hours estimated to producecomplete the order. The completion percentage is applied to the order’s total revenue and total estimated costs to determine reported revenue, cost of goods sold,sales, and gross profit. Production of an order, once started, is typically completed within three months. Depending on the product sold, revenue from renewable energythe Solar product line is recognized both upon shipment or delivery of goods to the customer depending on contract terms, or by using an inputs method, based on the ratio of costs incurred to-dateto date to the total estimated costs at completion of the performance obligation. External sales agents are used in certain TD&S product line sales and the Company has chosen to expense estimated commissions owed to third parties by recognizing them proportionately as the goods are manufactured.
For the structures sold for lightingthe Lighting and transportationTransportation product line and for the majority of telecommunicationTelecommunications products, revenue is recognized upon shipment or delivery of goods to the customer depending on contract terms, which is the same point in time that the customer is billed. There are alsoSome large regional customers who have unique product specifications for telecommunication structures. When the customer contract includes a cancellation clause that would require them to pay for work completed plus a reasonable margin if an order was canceled, revenue is recognized over time based on hours worked as a percent of total estimated hours to complete production.
The Coatings product line revenues are derived by providing coating services to customers’ products, which include galvanizing, anodizing, and powder coating. Revenue is recognized once the coating service has been performed and the goods are ready to be picked up or delivered to the customer, which is the same time that the customer is billed.
Agriculture Segment
Revenue recognition from the manufacture of irrigation equipment and related parts and services (including tubular products for industrial customers) is generally upon shipment of the goods to the customer which is the same point in time that the customer is billed. The remote monitoring subscription services recognized as part of technology servicesthe Technology Products and Services product line are primarily billed annually and revenue is recognized on a straight-line basis over the subsequent twelve months (contract terms).contract period.
5850
Valmont Industries, Inc. and SubsidiariesVALMONT INDUSTRIES, INC. AND SUBSIDIARIES
NOTES TO CONSOLIDATED FINANCIAL STATEMENTS – CONTINUED
Three-year period ended December 31, 2022
(Dollars in thousands, except per share amounts)
(1) SUMMARY OF SIGNIFICANT ACCOUNTING POLICIES – CONTINUED
DisaggregationThe disaggregation of revenue by product line is disclosed in the “Business Segments” footnote.Note 21. A breakdown by segment of revenue recognized over time and revenue recognized at a point in time for the fiscal years ended December 30, 2023, December 31, 2022, and December 25, 2021 iswas as follows:
| | | | | | | | | | | | | | | | | | | | | | | | | | | | | | | | | | | | |
| | Fiscal Year 2022 | | Fiscal Year 2021 | | Fiscal Year 2020 | | Fiscal Year Ended | ||||||||||||||||||||||||||||
| | Point in | | Over | | Point in | | Over | | Point in | | Over | | December 30, 2023 | | December 31, 2022 | | December 25, 2021 | ||||||||||||||||||
|
| Time |
| Time |
| Time |
| Time |
| Time |
| Time |
| Point in Time | | Over Time | | Point in Time | | Over Time | | Point in Time | | Over Time | ||||||||||||
Infrastructure | | $ | 1,687,458 | | $ | 1,222,288 | | $ | 1,388,297 | | $ | 973,227 | | $ | 1,296,497 | | $ | 838,703 | | $ | 1,744,139 | | $ | 1,255,498 | | $ | 1,687,458 | | $ | 1,222,288 | | $ | 1,388,297 | | $ | 973,227 |
Agriculture | |
| 1,307,681 | |
| 27,604 | |
| 996,278 | |
| 20,772 | |
| 624,831 | |
| 15,261 | |
| 1,144,633 | |
| 30,328 | |
| 1,307,681 | |
| 27,604 | |
| 996,278 | |
| 20,772 |
Other | | | — | | | 100,219 | | | — | | | 123,001 | | | — | | | 120,063 | | | — | | | — | | | — | | | 100,219 | | | — | | | 123,001 |
Total | | $ | 2,995,139 | | $ | 1,350,111 | | $ | 2,384,575 | | $ | 1,117,000 | | $ | 1,921,328 | | $ | 974,027 | ||||||||||||||||||
Total net sales | | $ | 2,888,772 | | $ | 1,285,826 | | $ | 2,995,139 | | $ | 1,350,111 | | $ | 2,384,575 | | $ | 1,117,000 | ||||||||||||||||||
Use of Estimates
Management of the Company has made a number of estimates and assumptions relating to the reporting of assets and liabilities, the reported amounts of revenue and expenses, and the disclosure of contingent assets and liabilities to prepare these financial statementsthe Consolidated Financial Statements in conformity with generally accepted accounting principles. Actual results could differ from those estimates.
Equity Method Investments
The Company has equity method investments in non-consolidatednonconsolidated subsidiaries which are recorded within “Other non-current assets” onin the Consolidated Balance Sheets.
Treasury Stock
Repurchased shares are recorded as “Cost of treasury stock”“Treasury stock, at cost” and result in a reduction of “Shareholders’ equity.”equity” in the Consolidated Balance Sheets. When treasury shares are reissued, the Company uses the last-in, first-out method, and the difference between the repurchase cost and re-issuance price is charged or credited to “Additional paid-in capital”.
In May 2014, the Company announced a capital allocation philosophy whichthat covered a share repurchase program. Specifically, the Board of Directors at that time authorized the purchase of up to $500,000 of the Company’s outstanding common stock from time to time over twelve months at prevailing market prices, through open market or privately-negotiatedprivately negotiated transactions. In February 2015 and again in October 2018, the Board of Directors authorized an additional purchase of up to $250,000 of the Company’s outstanding common stock with no stated expiration date. As of December 31, 2022, the Company has acquired 6,613,018 shares for approximately $918,600 under this share repurchase program. Subsequent to year end, onIn February 27, 2023, the Board of Directors increased the amount remaining under the program by an additional $400,000, with no stated expiration date.date, bringing the total authorization to $1,400,000. As of December 30, 2023, the Company has acquired 7,895,724 shares for approximately $1,263,900 under this share repurchase program.
In November 2023, the Company entered into an accelerated purchase agreement to repurchase $120,000 of the Company’s outstanding common stock (“November 2023 ASR”) with CitiBank, N.A. as counterparty. The November 2023 ASR was entered into under the Company’s previously announced share repurchase program described above. In the fourth quarter of fiscal 2023, the Company pre-paid $120,000 and received an initial delivery of 438,917 shares of common stock from CitiBank, which represented 75% of the prepayment amount divided by the closing price of $205.05 per share on November 28, 2023. The final number of shares to be delivered and the average price paid per share will be based on the daily volume weighted average share price during the term of the November 2023 ASR less a discount, which will be completed during the first quarter of fiscal 2024.
Research and Development
Research and development costs are charged to operations in the fiscal year incurred. These costs are a component of “Selling, general, and administrative expenses” onin the Consolidated Statements of Earnings. ResearchDuring the fiscal years ended December 30, 2023, December 31, 2022, and December 25, 2021, research and development expensescosts were approximately $55,000, $46,000, in 2022,and $37,000, in 2021, and $21,400 in 2020.respectively.
5951
Valmont Industries, Inc. and SubsidiariesVALMONT INDUSTRIES, INC. AND SUBSIDIARIES
NOTES TO CONSOLIDATED FINANCIAL STATEMENTS – CONTINUED
Three-year period ended December 31, 2022
(Dollars in thousands, except per share amounts)
Recently Adopted Accounting PronouncementsSupplier Finance Program
In March 2020, the Financial Accounting Standards Board (FASB) issuedfirst quarter of fiscal 2023, the Company adopted Accounting Standards Update No. 2020-04 (ASU 2020-04),2022-04, Reference Rate Reform (Topic 848)Liabilities – Supplier Finance Programs (Subtopic 405-50): FacilitationDisclosure of the Effects of Reference Rate Reform on Financial ReportingSupplier Finance Program Obligations, as well as early adopted the amendment on rollforward information. During fiscal 2019, the Company entered into an agreement with a third-party financial institution to facilitate a supplier finance program that allows qualifying suppliers to sell their receivables from the Company to the financial institution. These participating suppliers negotiate their outstanding receivable arrangements directly with the financial institution and the Company’s rights and obligations to suppliers are not impacted. The Company has no economic interest in a supplier’s decision to enter into these agreements. Once a qualifying supplier elects to participate in the supplier finance program and reaches an agreement with a financial institution, they elect which provides optional expedientsindividual Company invoices they sell to the financial institution. The Company’s obligation is to make payment in the invoice amount negotiated with participating suppliers to the financial institution on the invoice due date, regardless of whether the individual invoice is sold by the supplier to the financial institution. The financial institution pays the supplier on the invoice due date for any invoices that were not previously sold under the supplier finance program. The invoice amounts and exceptions for applying GAAP principlesscheduled payment terms are not impacted by the suppliers’ decisions to contracts, hedging relationships,sell amounts under these arrangements. The payment of these obligations is included in “Cash flows from operating activities” in the Consolidated Statements of Cash Flows. As of December 30, 2023 and other transactions that reference London Interbank Offered Rate (“LIBOR”) or another reference rate expected to be discontinued due to reference rate reform. This guidance was able to be adopted on a prospective basis no later than December 31, 2022, with early adoption permitted. In December 2022,there were $41,916 and $48,880 of outstanding payment obligations, respectively, that were sold to the FASB issued ASU No 2022-06, financial institution under the Company’s supplier finance program included in “Accounts payable” in the Consolidated Balance Sheets.
| | | |
Confirmed obligations outstanding as of December 31, 2022 | | $ | 48,880 |
Invoices confirmed during the period | | | 264,051 |
Confirmed invoices paid during the period | |
| (271,015) |
Confirmed obligations outstanding as of December 30, 2023 | | $ | 41,916 |
Reference Rate Reform (Topic 848): DeferralRedeemable Noncontrolling Interests
Subsequent to the issuance of the Sunset DateCompany’s Consolidated Financial Statements as of Topic 848 (ASU 2022-06). ASU 2022-06 defersand for the sunset date of Topic 848 fromyear ended December 31, 2022, to the Company identified an error in the presentation of “Noncontrolling interests in consolidated subsidiaries” of $60,865 as of December 31, 2024. As2022, $26,750 as of December 25, 2021, and $25,774 as of December 26, 2020, that has been corrected in the current year. Such amounts were previously reported within “Total shareholders’ equity” and have been revised in the December 31, 2022 Consolidated Balance Sheets and the Consolidated Statements of Shareholders’ Equity and Redeemable Noncontrolling Interests to be presented as “Redeemable noncontrolling interests” outside of “Total shareholders’ equity”. We have evaluated the materiality of this error based on an analysis of quantitative and qualitative factors and concluded it was not material to the prior period financial statements, individually or in aggregate.
Noncontrolling interests with redemption features that are not solely within the Company’s control are considered redeemable noncontrolling interests. The Company has redeemable noncontrolling interests in certain entities. The seller can require the Company no longer has any LIBORto purchase their remaining ownership, known as a put right, for an amount and on a date specified in the applicable operating agreement. Likewise, the Company can require the seller to sell the Company their remaining ownership based contracts, ASU 2020-04 and ASU 2022-06 did not have a material effect on the Company’ssame amount and timing, known as a call option.
As a result of these redemption features, the Company records the noncontrolling interests as redeemable and classifies the balances in temporary equity in the Consolidated Balance Sheets initially at its acquisition-date fair value. The Company adjusts the redeemable noncontrolling interests each reporting period for the net income (loss) attributable to the noncontrolling interests and any redemption value adjustments. The redeemable noncontrolling interest is accreted to the future redemption value using the effective interest method up to the date on which the put right becomes effective. Any accretion adjustment in the current financial position,reporting period of the redeemable noncontrolling interest is offset against retained earnings and impacts earnings used in the calculation of earnings per share in the reporting period.
As of December 30, 2023 and December 31, 2022, the redeemable noncontrolling interests were $62,792 and $60,865, respectively. The ultimate amount paid for the redeemable noncontrolling interests could be significantly different because the redemption amounts depend on the future results of operations or financial statement disclosures.of the businesses.
52
60
Valmont Industries, Inc. and SubsidiariesVALMONT INDUSTRIES, INC. AND SUBSIDIARIES
NOTES TO CONSOLIDATED FINANCIAL STATEMENTS – CONTINUED
Three-year period ended December 31, 2022
(Dollars in thousands, except per share amounts)
(1) SUMMARY OF SIGNIFICANT ACCOUNTING POLICIES – CONTINUED
Recently Issued Accounting Pronouncements (Not Yet Adopted)
In September 2022,November 2023, the FASBFinancial Accounting Standards Board (“FASB”) issued Accounting Standards Update No. 2022-04 (ASU 2022-04),2023-07, Liabilities - Supplier Finance ProgramsSegment Reporting (Topic 450-50)280): Disclosure of Supplier Finance Program ObligationsImprovements to Reportable Segment Disclosures, which requires all buyers that use supplier finance programs to enhanceimproves the transparency of such programs to allow financial statement users to understand the effect on working capital, liquidity, and cash flows. The newdisclosures about reportable segments including more detailed information about a reportable segment’s expenses. This guidance requires disclosure of key terms of the program, including a description of the payment terms, payment timing, and assets pledged as security or other forms of guarantees provided to the finance provider or intermediary. Other requirements include the disclosure of the amount that remains unpaid as of the end of the reporting period, a description of where these obligations are presented in the balance sheet, and a rollforward of the obligation during the annual period. The guidance iswill be effective in the first quarter of 2023, except for the rollforward, which is effective in 2024. Earlyfiscal year ending December 28, 2024 and the interim periods thereafter, with early adoption is permitted. The new guidance will have no effect on the Company’s results of operations as the changes are primarily disclosure related.
In December 2023, the FASB issued Accounting Standards Update No. 2023-09, Income Taxes (Topic 740): Improvements to Income Tax Disclosures, which enhances the transparency and decision usefulness of income tax disclosures, primarily related to the rate reconciliation and income taxes paid information. This guidance will be effective on a prospective basis for the fiscal year ending December 27, 2025, with early adoption permitted. The Company intends to adoptguidance will have no effect on the new standard in 2023 with enhancedCompany’s results of operations as the changes are primarily disclosure where required.related.
(2) ACQUISITIONS
Acquisitions of Businesses
On August 31, 2023, the Company acquired HR Products for $58,044 Australian dollars ($37,302 United States (“U.S.”) dollars) in cash (net of cash acquired) and subject to working capital adjustments. Of this amount, $7,200 Australian dollars ($4,626 U.S. dollars) was withheld by the Company at closing as a retention fund, to be settled in two equal payments at 12 and 24 months from the acquisition date for contingencies and disagreements. HR Products provides a broad range of irrigation products to serve the agriculture and landscaping industries and its operations are reported in the Agriculture segment. The acquisition strengthens the Company’s value proposition to customers in the key agriculture market of Australia by expanding its geographic footprint and accelerating its aftermarket parts presence. The amount allocated to goodwill is attributable to anticipated synergies and other intangibles that do not qualify for separate recognition and is not deductible for tax purposes. The Company is currently completing its fair value assessment and expects to finalize the purchase price allocation by the third quarter of fiscal 2024.
The following table summarizes the preliminary fair values of the assets acquired and liabilities assumed of HR Products as of the date of acquisition:
| | | |
| | August 31, | |
| | 2023 | |
Current assets | | $ | 24,816 |
Property, plant, and equipment | |
| 1,379 |
Goodwill | |
| 9,177 |
Customer relationships | | | 11,632 |
Other non-current assets | |
| 3,997 |
Total fair value of assets acquired | | | 51,001 |
Current liabilities | |
| 4,183 |
Operating lease liabilities | |
| 2,792 |
Deferred income taxes | |
| 3,489 |
Total fair value of liabilities assumed | | | 10,464 |
Net assets acquired | | $ | 40,537 |
On June 1, 2022, the Company acquired approximately 51% of ConcealFab for $39,287 in cash (net of cash acquired) and subject to working capital adjustments.. Approximately $1,850 of the purchase price iswas contingent on seller representations and warranties that will bewere settled within 18 monthsin the fourth quarter of the acquisition date.fiscal 2023. ConcealFab is located in Colorado Springs, Colorado, and its operations are reported in the Infrastructure segment. The acquisition was made to allow the Company to incorporate innovative 5G infrastructure and passive intermodulation mitigation solutions into the Company’sits advanced infrastructureInfrastructure portfolio. Goodwill iswas not deductible for tax purposes. The amount allocated to goodwill was primarily attributable to anticipated synergies and other intangibles that do not qualify for separate recognition. The Company expects to finalizefinalized the purchase price allocation early in the first quarter of fiscal 2023.
The following table summarizes the preliminary fair values of the assets acquired and liabilities assumed of ConcealFab as of the date of acquisition:
53
61
Valmont Industries, Inc. and SubsidiariesVALMONT INDUSTRIES, INC. AND SUBSIDIARIES
NOTES TO CONSOLIDATED FINANCIAL STATEMENTS – CONTINUED
Three-year period ended December 31, 2022
(Dollars in thousands, except per share amounts)
| | | |
|
| As of June 1, | |
| | 2022 | |
Current assets | | $ | 21,133 |
Customer relationships | |
| 26,200 |
Trade name | |
| 5,000 |
Property, plant & equipment | |
| 3,813 |
Other assets | |
| 9,108 |
Goodwill | |
| 42,465 |
Total fair value of assets acquired | | $ | 107,719 |
Current liabilities | |
| 6,658 |
Long-term debt | |
| 2,038 |
Operating lease liabilities | |
| 7,812 |
Deferred taxes | |
| 5,464 |
Other noncurrent liabilities | |
| 12 |
Total fair value of liabilities assumed | | $ | 21,984 |
Non-controlling interest in consolidated subsidiaries | |
| 41,693 |
Net assets acquired | | $ | 44,042 |
Pursuant to the operating agreement and subject to the terms and conditions thereof, the minority owners have the right to sell all of the remaining interest in ConcealFab to the Company, and the Company has the right to purchase all of the remaining interest in ConcealFab from the minority owners, in each case generally at any time following the fifth anniversary of the effective date of the transaction. The purchase price for any remaining interest put to, or called by, the Company will be determined based on a pre-defined formula as stated in the operating agreement. As a result of this redemption feature, the Company recorded the noncontrolling interest as redeemable and classified it in temporary equity within the Consolidated Balance Sheets. See Note 1 for discussion of the Company’s redeemable noncontrolling interests.
The following table summarizes the fair values of the assets acquired and liabilities assumed of ConcealFab as of the date of acquisition:
| | | |
| | June 1, | |
| | 2022 | |
Current assets | | $ | 21,133 |
Property, plant, and equipment | |
| 3,813 |
Goodwill | |
| 42,465 |
Customer relationships | |
| 26,200 |
Trade name | |
| 5,000 |
Other non-current assets | |
| 9,108 |
Total fair value of assets acquired | | | 107,719 |
Current liabilities | |
| 6,658 |
Long-term debt | |
| 2,038 |
Operating lease liabilities | |
| 7,812 |
Deferred income taxes | |
| 5,464 |
Other non-current liabilities | |
| 12 |
Total fair value of liabilities assumed | | | 21,984 |
Redeemable noncontrolling interest | |
| 41,693 |
Net assets acquired | | $ | 44,042 |
On May 12, 2021, the Company acquired the outstanding shares of Prospera Technologies, Ltd. ("Prospera"), an artificial intelligence company focused on machine learning and computer vision in agriculture, for $300,000 in cash (net of cash acquired). The acquisition of Prospera, located in Tel Aviv, Israel, was made to allow the Company to accelerate innovation with machine learning for agronomy and is reported in the Agriculture segment. Goodwill iswas not deductible for tax purposes, the trade name will be amortized overwas assigned an estimated useful life of seven years, and the developed technology asset will be amortized overwas assigned an estimated useful life of five years. The amount allocated to goodwill was primarily attributable to anticipated synergies and other intangibles that dodid not qualify for separate recognition. See Note 8 for details of impairments of goodwill and other intangible assets recognized during the fiscal year ended December 30, 2023. The Company finalized the purchase price allocation in the fourth quarter of fiscal 2021.
(2) ACQUISITIONS – CONTINUED54
VALMONT INDUSTRIES, INC. AND SUBSIDIARIES
NOTES TO CONSOLIDATED FINANCIAL STATEMENTS
(Dollars in thousands, except per share amounts)
The following table summarizes the fair values of the assets acquired and liabilities assumed of Prospera as of the date of acquisition:
| | | | | | |
|
| As of May 12, |
| May 12, | ||
| | 2021 | | 2021 | ||
Current assets | | $ | 647 | | $ | 647 |
Property, plant, and equipment | |
| 1,063 | |||
Goodwill | |
| 273,453 | |||
Developed technology | |
| 32,900 | |
| 32,900 |
Trade name | |
| 2,850 | |
| 2,850 |
Property, plant & equipment | |
| 1,063 | |||
Goodwill | |
| 273,453 | |||
Total fair value of assets acquired | | $ | 310,913 | | $ | 310,913 |
Current liabilities | |
| 2,690 | |
| 2,690 |
Deferred taxes | |
| 8,223 | |||
Deferred income taxes | |
| 8,223 | |||
Total fair value of liabilities assumed | | $ | 10,913 | | $ | 10,913 |
Net assets acquired | | $ | 300,000 | | $ | 300,000 |
62
Valmont Industries, Inc. and Subsidiaries
NOTES TO CONSOLIDATED FINANCIAL STATEMENTS – CONTINUED
Three-year period ended December 31, 2022
(Dollars in thousands, except per share amounts)
On April 20, 2021, the Company acquired the assets of PivoTrac for $12,500 in cash. The agreed uponagreed-upon purchase price was $14,000, with $1,500 being held back for seller representations and warranties. The acquisition of PivoTrac, located in Texas, was made to allow the Company to advance its technology strategy and increase its number of connected agricultural devices and is reported in the Agriculture segment. The fair values assigned were $10,800 for goodwill and $2,627 for customer relationships, andwith the remainder isrepresenting net working capital. Goodwill iswas not deductible for tax purposes and the customer relationshiprelationships will be amortized over eight years. The amount allocated to goodwill was primarily attributable to anticipated synergies and other intangibles that do not qualify for separate recognition. The Company finalized the purchase price allocation in the second quarter of fiscal 2022.
On May 29, 2020, the Company acquired 55% of Energia Solar do Brasil ("Solbras") for $4,308. Approximately $646 of the purchase price was contingent on seller representations and warranties and was settled for the full amount in the second quarter of 2021. Solbras is a leading provider of solar energy solutions for agriculture. In the purchase price allocation, goodwill of $3,341 and customer relationships of $3,718 were recorded and the remainder to net working capital. Goodwill is not deductible for tax purposes and the customer relationship will be amortized over eight years. The acquisition of Solbras, located in Brazil, was made to allow the Company to expand its product offerings in the Agriculture segment to include not only pivots, but also a sustainable and low-cost energy source to provide electricity to the units. The Company finalized the purchase price allocation in the fourth quarter of 2020.
On March 6, 2020, the Company acquired 75% of KC Utility Packaging, LLC for $4,200. Approximately $400 of the purchase price was contingent on seller representations and warranties and was settled for the full amount in the first quarter of 2021. The Company name was subsequently changed to Valmont Substations, LLC. The acquisition was made to expand the Company’s utility substation product offering. In the purchase price allocation, goodwill of $1,100, customer relationships of $4,000, and other intangibles of $500 were recorded. The Company finalized the purchase price allocation in the fourth quarter of 2020.
Proforma disclosures were omitted for these acquisitions as they do not have a significant impact on the Company’s financial results.
Acquisition-related costs incurred for the above acquisitions were insignificant for all fiscal years presented.
Acquisitions of Redeemable Noncontrolling Interests
InSubsequent to fiscal 2023, on January 26, 2024, the Company acquired approximately 9% of ConcealFab for $7,227. Additionally, subsequent to fiscal 2023, the minority owner of a consolidated subsidiary exercised their put option to require the Company to purchase their remaining ownership. As such, $10,518 is expected to be paid to acquire the remaining portion of this entity prior to the end of the first quarter of fiscal 2024.
On August 10, 2022, the Company acquired the remaining 9% of Convert Italia S.p.A. for $3,046. As this transaction was for the acquisition of all remaining shares of consolidated subsidiary with no change in control, it was recorded within shareholders’ equity and as a financing cash flow in the Consolidated Statements of Cash Flows.
InOn May 10, 2022, the Company acquired the remaining 20% of Valmont West Coast Engineering, Ltd. for $4,292. As this transaction was
These transactions were for the acquisitionacquisitions of allportions of the remaining shares of consolidated subsidiarysubsidiaries with no changechanges in control, itcontrol.
(3) DIVESTITURES
On April 30, 2023, the Company completed the sale of Torrent Engineering and Equipment, an integrator of prepackaged pump stations in Indiana, reported in the Agriculture segment, for net proceeds of $6,369. In the second quarter of fiscal 2023, a pre-tax gain of $2,994 was recorded within shareholders’ equity and as a financing cash flowreported in “Other income (expenses)” in the Consolidated Statements of Cash Flows.
(2) ACQUISITIONS – CONTINUED
In February 2020, the Company acquired the remaining 49% of AgSense that it did not own for $43,983, which includes a holdback payment of $2,200 that was made in the second quarter of 2020. The accounting for owning 100% of AgSense resulted in the recognition of a deferred tax asset of approximately $7,700.
In December 2020, the Company acquired the remaining 40% of Torrent Engineering and Equipment that it did not own for $3,500. In the first quarter of 2020, the Company acquired 16% of the remaining 25% that it did not own of Convert Italia S.p.A. for a cash payment of $11,750. The purchase agreement also settled the escrow funds which the Company had paid at date of acquisition.
63
Valmont Industries, Inc. and Subsidiaries
NOTES TO CONSOLIDATED FINANCIAL STATEMENTS – CONTINUED
Three-year period ended December 31, 2022
(Dollars in thousands, except per share amounts)
(3) DIVESTITURESEarnings.
On November 30, 2022, the Company completed the sale of Valmont SM, the offshore wind energy structures business in Denmark, reported in the Other segment. The business was sold because it did not align with the long-term strategic plans for the Company. The offshore wind energy structures business’ historical annual sales, operating profit,income, and net assets arewere not significant for discontinued operations presentation.
The offshore wind energy structures business had operating income of $2,259 for the year ended December 31, 2022, and an operating loss of $40,192 (inclusive of a $27,900 impairment of long-lived assets) for the year ended December 25, 2021. The Company received Danish Krone 90,000 (U.S. $12,570) at closing with an additional Danish Krone 28,000 (U.S. $4,027) held in an escrow account subject to normal closing conditions before it will be released to the Company.
The assets and liabilities of the offshore wind energy structures business at closing on November 30, 2022 were as follows:
| | | |
Cash and cash equivalents | | $ | 12,420 |
Receivables, net | | | 35,407 |
Inventories | |
| 1,144 |
Contract assets | | | 19,127 |
Prepaid expenses and other assets | | | 1,852 |
Net property, plant, and equipment | |
| 12,915 |
Intangible assets | | | 5,579 |
Other assets | | | 1,103 |
Total assets | | $ | 89,547 |
| | | |
Accounts payable | | $ | 23,611 |
Contract liabilities | | | 34,814 |
Accrued expenses | | | 4,737 |
Deferred income taxes | | | 1,375 |
Total liabilities | | $ | 64,537 |
| | | |
Net assets | | $ | 25,010 |
The pre-tax loss from divestiture is reported in “Other income (expenses)”. The loss is comprised of the proceeds and an asset recognized for the escrow funds not yet released from buyer, less deal-related costs and the net assets of the business, which resulted in a loss of $12,123. In addition to this amount is a $21,150 realized loss on foreign exchange translation adjustments and net investment hedges previously reported in shareholders’ equity.
| | | |
Pre-tax loss from divestitures, before recognition of currency translation loss | | $ | 12,123 |
Recognition of cumulative currency translation loss and hedges (reclassified from OCI) | |
| 21,150 |
Net pre-tax loss from divestiture of offshore wind energy structures business | | $ | 33,273 |
The transaction did not result in a taxable capital loss.
6455
Valmont Industries, Inc. and SubsidiariesVALMONT INDUSTRIES, INC. AND SUBSIDIARIES
NOTES TO CONSOLIDATED FINANCIAL STATEMENTS – CONTINUED
Three-year period ended December 31, 2022
(Dollars in thousands, except per share amounts)
The offshore wind energy structures business had an operating income of $2,259 for the fiscal year ended December 31, 2022, and an operating loss of $40,192 (inclusive of an approximately $27,900 impairment of long-lived assets) for the fiscal year ended December 25, 2021. The Company received 90,000 Danish kroner ($12,570 U.S. dollars) at closing. An additional 15,000 Danish kroner ($2,189 U.S. dollars) had been held in an escrow account subject to normal closing conditions before it was released to the Company in the first quarter of fiscal 2024.
The assets and liabilities of the offshore wind energy structures business as of closing on November 30, 2022 were as follows:
| | | |
| | November 30, | |
| | 2022 | |
Cash and cash equivalents | | $ | 12,420 |
Receivables, net | | | 35,407 |
Inventories | |
| 1,144 |
Contract assets | | | 19,127 |
Prepaid expenses and other current assets | | | 1,852 |
Property, plant, and equipment, net | |
| 12,915 |
Other intangible assets, net | | | 5,579 |
Other non-current assets | | | 1,103 |
Total assets | | $ | 89,547 |
Accounts payable | | | 23,611 |
Contract liabilities | | | 34,814 |
Other accrued expenses | | | 4,737 |
Deferred income taxes | | | 1,375 |
Total liabilities | | $ | 64,537 |
Net assets divested | | $ | 25,010 |
The pre-tax loss from divestiture was reported in “Other income (expenses)” in the Consolidated Statements of Earnings for the fiscal year ended December 31, 2022. The loss was comprised of the proceeds and an asset recognized for the escrow funds not at the time released from the buyer, less deal-related costs, and the net assets of the business, which resulted in a loss of $12,123. In addition to this amount was a $21,150 realized loss on foreign exchange translation adjustments and net investment hedges previously reported in “Shareholders’ equity” in the Consolidated Balance Sheets.
| | | |
Pre-tax loss from divestitures, before recognition of currency translation loss | | $ | 12,123 |
Recognition of cumulative currency translation loss and hedges (reclassified from OCI) | |
| 21,150 |
Net pre-tax loss from divestiture of offshore wind energy structures business | | $ | 33,273 |
The transaction did not result in a tax-deductible capital loss.
(4) RESTRUCTURINGREALIGNMENT ACTIVITIES
During 2020,the third quarter of fiscal 2023, management initiated a plan to streamline segment support across the Company executed certain regional restructuring activitiesand reduce costs through an organizational realignment program (the "2020 Plan"“Realignment Program”) and. The Realignment Program provided for a U.S. specificreduction in force through a voluntary early retirement program. The 2020 Plan included the closure of one U.S. galvanizing facility. All 2020 restructuring activitiesprogram and other headcount reduction actions, which were completed byas of December 26, 2020.30, 2023. The Board of Directors authorized the incurrence of cash charges up to $36,000 in connection with the Realignment Program.
During the fiscal year ended December 30, 2023, the Company recorded the following pre-tax expenses:expenses for the Realignment Program:
| | | | | | | | | | | | | | | |
| | Infrastructure | | Agriculture | | Other | | Corporate | | Total | |||||
Severance | | $ | 1,139 | | $ | — | | $ | — | | $ | — | | $ | 1,139 |
Other cash restructuring expenses | |
| 1,847 | |
| — | |
| — | |
| — | |
| 1,847 |
Impairments of fixed assets/net loss on disposals | |
| 3,751 | |
| — | |
| — | |
| — | |
| 3,751 |
Total cost of sales | |
| 6,737 | |
| — | |
| — | |
| — | |
| 6,737 |
| | | | | | | | | | | | | | | |
Severance | |
| 7,873 | |
| 2,968 | |
| 1,192 | |
| 1,761 | |
| 13,794 |
Other cash restructuring expenses | |
| 1,852 | |
| — | |
| 79 | |
| 244 | |
| 2,175 |
Impairments of assets / net loss on disposals | |
| 349 | |
| — | |
| 94 | |
| — | |
| 443 |
Total selling, general and administrative expenses | |
| 10,074 | |
| 2,968 | |
| 1,365 | |
| 2,005 | |
| 16,412 |
Consolidated total | | $ | 16,811 | | $ | 2,968 | | $ | 1,365 | | $ | 2,005 | | $ | 23,149 |
| | | | | | | | | | | | |
| | Infrastructure | | Agriculture | | Corporate | | Total | ||||
Severance and other employee benefit costs | | $ | 17,260 | | $ | 9,101 | | $ | 8,849 | | $ | 35,210 |
56
VALMONT INDUSTRIES, INC. AND SUBSIDIARIES
NOTES TO CONSOLIDATED FINANCIAL STATEMENTS
(Dollars in thousands, except per share amounts)
Changes in liabilities recorded for the Realignment Program were as follows:
| | | | | | | | | | | | |
|
| Balance as of |
| Recognized |
| Costs Paid or |
| Balance as of | ||||
| | December 31, | | Realignment | | Otherwise | | December 30, | ||||
| | 2022 | | Expense | | Settled | | 2023 | ||||
Severance and other employee benefit costs | | $ | — |
| $ | 35,210 | | $ | (22,696) | | $ | 12,514 |
(5) CASH FLOW SUPPLEMENTARY INFORMATION
The Company considers all highly liquid temporary cash investments purchased with an original maturity of three months or less at the time of purchase to be cash equivalents. Cash payments for interest and income taxes (net of refunds) for the fifty-three weeksfiscal years ended December 30, 2023, December 31, 2022, and the fifty-two weeks ended December 25, 2021 and December 26, 2020 were as follows:
| | | | | | | | | | ||||||||||
| | Fiscal Year Ended | |||||||||||||||||
| | | | | | | | | | | | December 30, | | December 31, | | December 25, | |||
|
| | 2022 |
| 2021 |
| 2020 | | 2023 |
| 2022 |
| 2021 | ||||||
Interest | | | $ | 46,653 | | $ | 41,159 | | $ | 40,209 | | $ | 55,541 | | $ | 46,653 | | $ | 41,159 |
Income taxes | | |
| 93,109 | |
| 60,366 | |
| 54,801 | |
| 103,697 | |
| 93,109 | |
| 60,366 |
The sale of the offshore wind energy structures business in 2022 included a hold back receivable contingent on normal closing conditions that is expected to be resolved in the first half of 2023. The acquisitions in 2020 included hold back payments contingent on seller representations and warranties of $1,046. The 2020 hold back payments were released from a trust in the first half of 2021 and the 2019 hold back payments were paid in the first quarter of 2020 and are shown as an investing use of cash in the acquisitions line item of the Consolidated Statements of Cash Flows.
(6) INVENTORIES
Inventories as of December 30, 2023 and December 31, 2022 consisted of the following at December 31, 2022 and December 25, 2021:following:
| | | | | | | | | | | | |
| | December 31, | | December 25, | | December 30, | | December 31, | ||||
| | 2022 |
| 2021 | | 2023 |
| 2022 | ||||
Raw materials and purchased parts | | $ | 258,814 | | $ | 278,107 | | $ | 217,134 | | $ | 258,814 |
Work-in-process | |
| 44,453 | |
| 63,628 | |
| 37,826 | |
| 44,453 |
Finished goods and manufactured goods | |
| 425,495 | |
| 387,099 | |
| 403,468 | |
| 425,495 |
| | $ | 728,762 | | $ | 728,834 | ||||||
Total inventories | | $ | 658,428 | | $ | 728,762 | ||||||
65
Valmont Industries, Inc. and Subsidiaries
NOTES TO CONSOLIDATED FINANCIAL STATEMENTS – CONTINUED
Three-year period ended December 31, 2022
(Dollars in thousands, except per share amounts)
(7) PROPERTY, PLANT, AND EQUIPMENT
Property, plant, and equipment, at cost, consistas of December 30, 2023 and December 31, 2022 consisted of the following:
| | | | | | | ||||||
| | | | | | |
| December 30, | | December 31, | ||
|
| 2022 |
| 2021 | | 2023 |
| 2022 | ||||
Land and improvements | | $ | 113,188 | | $ | 112,236 | | $ | 118,869 | | $ | 113,188 |
Buildings and improvements | |
| 390,435 | |
| 413,884 | |
| 409,092 | |
| 390,435 |
Machinery and equipment | |
| 721,223 | |
| 672,319 | |
| 750,959 | |
| 721,223 |
Transportation equipment | |
| 30,610 | |
| 27,020 | |
| 31,278 | |
| 30,610 |
Office furniture and equipment | |
| 128,922 | |
| 117,757 | |
| 140,061 | |
| 128,922 |
Construction in progress | |
| 48,773 | |
| 78,885 | |
| 62,980 | |
| 48,773 |
| | $ | 1,433,151 | | $ | 1,422,101 | ||||||
Total property, plant, and equipment, at cost | | $ | 1,513,239 | | $ | 1,433,151 | ||||||
(8) GOODWILL AND INTANGIBLE ASSETS
Amortized Intangible Assets
The components of amortized intangible assets at December 31, 2022 and December 25, 2021 were as follows:
| | | | | | | | |
| | December 31, 2022 | ||||||
| | Gross | | | | | Weighted | |
| | Carrying | | Accumulated | | Average | ||
|
| Amount |
| Amortization |
| Life | ||
Customer Relationships | | $ | 222,716 | | $ | 145,502 | | 13 years |
Patents & Proprietary Technology | |
| 58,404 | |
| 21,291 |
| 9 years |
Trade Name | |
| 2,850 | |
| 645 |
| 7 years |
Other | |
| 2,462 | |
| 2,164 |
| 5 years |
| | $ | 286,432 | | $ | 169,602 | | |
| | | | | | | | |
| | December 25, 2021 | ||||||
| | Gross | | | | | Weighted | |
| | Carrying | | Accumulated | | Average | ||
| | Amount |
| Amortization |
| Life | ||
Customer Relationships | | $ | 224,597 | | $ | 160,626 | | 13 years |
Patents & Proprietary Technology | |
| 58,699 | |
| 13,955 |
| 9 years |
Trade Name | | | 2,850 | | | 183 | | 7 years |
Other | |
| 4,534 | |
| 3,959 |
| 6 years |
| | $ | 290,680 | | $ | 178,723 | | |
Amortization expense for intangible assets was $22,120, $21,320, and $18,147 for the fiscal years ended December 31, 2022, December 25, 2021, and December 26, 2020, respectively. During the fourth quarter of fiscal 2021, an impairment test was required when the Company received clarifying information on the competitive environment of the offshore wind energy structures business. As a result, an impairment charge of approximately $4,483 was recognized against the remaining net book value of the related customer relationships.
6657
Valmont Industries, Inc. and SubsidiariesVALMONT INDUSTRIES, INC. AND SUBSIDIARIES
NOTES TO CONSOLIDATED FINANCIAL STATEMENTS – CONTINUED
Three-year period ended December 31, 2022
(Dollars in thousands, except per share amounts)
(8) GOODWILL AND INTANGIBLE ASSETS – CONTINUED
Estimated annual amortization expense related to finite‑lived intangible assets is as follows:
| | | |
|
| Estimated | |
| | Amortization | |
| | Expense | |
2023 | | $ | 20,825 |
2024 | |
| 18,888 |
2025 | |
| 17,454 |
2026 | |
| 12,933 |
2027 | |
| 9,695 |
The useful lives assigned to finite‑lived intangible assets included consideration of factors such as the Company’s past and expected experience related to customer retention rates, the remaining legal or contractual life of the underlying arrangement that resulted in the recognition of the intangible asset, and the Company’s expected use of the intangible asset.
Non-Amortized Intangible Assets
Intangible assets with indefinite lives are not amortized. The carrying values of these trade names at December 31, 2022 and December 25, 2021 were as follows:
| | | | | | | | |
|
| December 31, |
| December 25, |
| Year | ||
| | 2022 | | 2021 | | Acquired | ||
Newmark | | $ | 11,111 | | $ | 11,111 |
| 2004 |
Convert Italia S.p.A. | |
| 8,024 | |
| 8,479 |
| 2018 |
Webforge | | | 7,107 | | | 7,877 | | 2010 |
Ingal EPS / Ingal Civil Products | |
| 6,891 | |
| 7,637 |
| 2010 |
Valmont SM | |
| — | |
| 6,082 |
| 2014 |
ConcealFab | |
| 5,000 | |
| — |
| 2022 |
Shakespeare | |
| 4,000 | |
| 4,000 |
| 2014 |
Walpar | |
| 3,500 | |
| 3,500 |
| 2018 |
Other | |
| 14,152 | |
| 14,721 |
| Various |
| | $ | 59,785 | | $ | 63,407 | | |
In its determination of these intangible assets as indefinite‑lived, the Company considered such factors as its expected future use of the intangible asset, legal, regulatory, technological, and competitive factors that may impact the useful life or value of the intangible asset, and the expected costs to maintain the value of the intangible asset. The Company expects that these intangible assets will maintain their value indefinitely. Accordingly, these assets are not amortized.
Indefinite-lived intangibles, although not amortized, are still subject to annual impairment assessments, and interim date assessments should events arise that suggest their value may be diminished. The Company’s trade names were tested for impairment as of August 27, 2022. The values of each trade name were determined using the relief-from-royalty method. Based on this evaluation, no trade names were determined to be impaired. During the fourth quarter of fiscal year 2021, an impairment test was required when the Company received clarifying information on the competitive environment of the offshore wind energy structures business. As a result, an impairment charge of approximately $2,013 was recognized against the related trade name. In conjunction with an interim second quarter 2020 goodwill impairment test, impairment indicators were noted for the Webforge and Locker trade names requiring an interim impairment test. As a result, an impairment charge of approximately $3,900 was recognized against these two trade names in fiscal year 2020.
67
Valmont Industries, Inc. and Subsidiaries
NOTES TO CONSOLIDATED FINANCIAL STATEMENTS – CONTINUED
Three-year period ended December 31, 2022
(Dollars in thousands, except per share amounts)
(8) GOODWILL AND INTANGIBLE ASSETS – CONTINUED
Goodwill
The carrying amount of goodwill by segment as of December 30, 2023 and December 31, 2022 was as follows:
| | | | | | | | | |
| | Infrastructure | | Agriculture | | Total | |||
Gross balance as of December 31, 2022 | | $ | 473,551 | | $ | 313,777 | | $ | 787,328 |
Accumulated impairment losses | |
| (47,467) | |
| — | |
| (47,467) |
Balance as of December 31, 2022 | |
| 426,084 | |
| 313,777 | | | 739,861 |
Acquisitions | |
| — | |
| 9,177 | |
| 9,177 |
Divestiture | | | — | | | (160) | | | (160) |
Impairment | | | (1,915) | | | (120,000) | | | (121,915) |
Foreign currency translation | |
| 5,112 | |
| 889 | |
| 6,001 |
Balance as of December 30, 2023 | | $ | 429,281 | | $ | 203,683 | | $ | 632,964 |
| | | | | | | | | |
| | Infrastructure | | Agriculture | | Total | |||
Gross balance as of December 25, 2021 | | $ | 442,521 | | $ | 313,512 | | $ | 756,033 |
Accumulated impairment losses | |
| (47,467) | |
| — | |
| (47,467) |
Balance as of December 25, 2021 | |
| 395,054 | |
| 313,512 | |
| 708,566 |
Acquisitions | |
| 42,465 | |
| — | |
| 42,465 |
Foreign currency translation | |
| (11,435) | |
| 265 | |
| (11,170) |
Balance as of December 31, 2022 | | $ | 426,084 | | $ | 313,777 | | $ | 739,861 |
In the third quarter of fiscal 2023, the Company performed its annual goodwill impairment assessment utilizing a quantitative test on all of its reporting units using a measurement date of September 2, 2023. The fair values of the reporting units were estimated using a discounted cash flow analysis which requires the Company to estimate the future cash flows as well as select a risk-adjusted discount rate to measure the present value of the anticipated cash flows.
The carrying value for two of the reporting units, Agriculture Technology and India Structures, exceeded their respective estimated fair value. As a result, impairments of $120,000 and $1,915 were recognized in the Agriculture and Infrastructure segments, respectively, and recorded as “Impairment of goodwill and intangible assets” in the Consolidated Statements of Earnings. For the Agriculture Technology reporting unit, the recent less favorable outlook for the agriculture market in North America and the slower-than-expected adoption rate of the agronomy software solution led to a reduction in forecasted sales. These reduced forecasted cash flows resulted in a lower fair value of the Agriculture Technology reporting unit when discounted back to the present value. For the India Structures reporting unit, assumptions around future cash flows including working capital requirements resulted in the impairment of its goodwill.
Intangible Assets
The components of intangible assets as of December 30, 2023 and December 31, 2022 were as follows:
| | | | | | | | | | | | |
| | December 30, 2023 |
| December 31, 2022 | ||||||||
| | Gross | | | |
| Gross | | | | ||
| | Carrying | | Accumulated |
| Carrying | | Accumulated | ||||
|
| Amount |
| Amortization |
| Amount |
| Amortization | ||||
Amortizing intangible assets: | | | | | | | | | | | | |
Customer relationships | | $ | 233,852 | | $ | 157,873 | | $ | 222,716 | | $ | 145,502 |
Patents & proprietary technology | |
| 59,311 | |
| 45,416 | |
| 58,404 | |
| 21,291 |
Trade names | |
| 2,870 | |
| 1,056 | |
| 2,850 | |
| 645 |
Other | |
| 4,787 | |
| 4,538 | |
| 2,462 | |
| 2,164 |
Non-amortizing intangible assets: | | | | | | | | | | | | |
Trade names | | | 58,750 | | | — | | | 59,785 | | | — |
| | $ | 359,570 | | $ | 208,883 | | $ | 346,217 | | $ | 169,602 |
58
VALMONT INDUSTRIES, INC. AND SUBSIDIARIES
NOTES TO CONSOLIDATED FINANCIAL STATEMENTS
(Dollars in thousands, except per share amounts)
Amortizing intangible assets carry a remaining weighted average life of approximately four years. Amortization expense was $19,455, $22,120, and $21,320 for the fiscal years ended December 30, 2023, December 31, 2022, and December 25, 2021, wasrespectively. Based on amortizing intangible assets recognized in the Consolidated Balance Sheets as follows:
of December 30, 2023, amortization expense is estimated to average $11,158 for
| | | | | | | | | | | | |
| | Infrastructure | | Agriculture | | Other | | Total | ||||
Gross balance at December 25, 2021 | | $ | 442,521 | | $ | 313,512 | | $ | 14,355 | | $ | 770,388 |
Accumulated impairment losses | |
| (47,467) | |
| — | |
| (14,355) | |
| (61,822) |
Balance at December 25, 2021 | |
| 395,054 | |
| 313,512 | |
| — | | $ | 708,566 |
Acquisitions | |
| 42,465 | |
| — | |
| — | |
| 42,465 |
Foreign currency translation | |
| (11,435) | |
| 265 | |
| — | |
| (11,170) |
Balance at December 31, 2022 | | $ | 426,084 | | $ | 313,777 | | $ | — | | $ | 739,861 |
each
| | | | | | | | | | | | |
| | Infrastructure | | Agriculture | | Other | | Total | ||||
Gross balance at December 26, 2020 | | $ | 447,612 | | $ | 30,177 | | $ | 14,355 | | $ | 492,144 |
Accumulated impairment losses | |
| (47,467) | |
| — | |
| (14,355) | |
| (61,822) |
Balance at December 26, 2020 | |
| 400,145 | |
| 30,177 | |
| — | |
| 430,322 |
Acquisitions | |
| — | |
| 284,253 | |
| — | |
| 284,253 |
Foreign currency translation | |
| (5,091) | |
| (918) | |
| — | |
| (6,009) |
Balance at December 25, 2021 | | $ | 395,054 | | $ | 313,512 | | $ | — | | $ | 708,566 |
of the nextfive fiscal years.
The Company’s annualindefinite-lived trade names were tested for impairment as of September 2, 2023. The values of each trade name were determined using the relief-from-royalty method. Based on this evaluation, the carrying value of one trade name exceeded its estimated fair value. An impairment charge of $1,656 was recognized within the Infrastructure segment and recorded as “Impairment of goodwill and intangible assets” in the Consolidated Statements of Earnings. In the fourth quarter of fiscal 2021, an impairment test was required when the Company received clarifying information on the competitive environment of the offshore wind energy structures business. As a result, an impairment charge of approximately $2,013 was recognized against the related trade name and recorded as “Impairment of goodwill was performed asand intangible assets” in the Consolidated Statements of August 27, 2022, using primarilyEarnings.
In the discounted cash flow method. The solar tracking structurethird quarter of fiscal 2023, the Company tested the recoverability of a certain amortizing proprietary technology intangible asset related to Prospera included within the Agriculture Technology reporting unit projects meaningful annual revenue growth for the foreseeable future due to strong market conditions. Therefore,identified impairment indicators. The Company determined the Company valued this reporting unit using a blendcarrying value of both the discountedasset exceeded the total undiscounted estimated future cash flows and reduced the asset to its fair value. An impairment charge of $17,273 was recognized within the Agriculture segment and recorded as “Impairment of goodwill and intangible assets” in the Consolidated Statements of Earnings. In the fourth quarter of fiscal 2021, an impairment test was required when the Company received clarifying information on the competitive environment of the offshore wind energy structures business. As a market approach. The market valuation approach estimatesresult, an impairment charge of $4,483 was recognized against the terminalremaining net book value for this reporting unit using a multiple of earnings before interest, taxes, depreciation,the related customer relationships and amortization (“EBITDA”). During fiscal year 2022, norecorded as “Impairment of goodwill impairment was recorded.and intangible assets” in the Consolidated Statements of Earnings.
(9) BANK CREDIT ARRANGEMENTS
The Company maintains various lines of credit for short-term borrowings totaling $125,034$39,336 available atas of December 31, 2022.30, 2023. As of December 30, 2023 and December 31, 2022, $3,205 and December 25, 2021, $5,846 and $13,439 was outstanding and recorded as notes“Notes payable to banksbanks” in the Consolidated Balance Sheets, respectively. The interest rates charged on these lines of credit vary in relation to the banks’ costs of funds. The weighted average interest rate on short-term borrowings was 6.52% at5.16% as of December 31, 2022.30, 2023. The unused and available borrowings under the lines of credit were $119,188 at$36,131 as of December 31, 2022.30, 2023. The lines of credit can be modified at any time at the option of the banks. The Company pays no fees in connection with unused lines of credit.
(10) INCOME TAXES
Earnings before income taxes and equity in earningsloss of nonconsolidated subsidiaries arefor the fiscal years ended December 30, 2023, December 31, 2022, and December 25, 2021 were as follows:
| | | | | | | | | |
| | 2022 |
| 2021 |
| 2020 | |||
United States | | $ | 224,370 | | $ | 202,051 | | $ | 169,281 |
Foreign | |
| 139,518 | |
| 58,032 | |
| 23,487 |
| | $ | 363,888 | | $ | 260,083 | | $ | 192,768 |
| | | | | | | | | |
| | Fiscal Year Ended | |||||||
| | December 30, | | December 31, | | December 25, | |||
| | 2023 |
| 2022 |
| 2021 | |||
United States | | $ | 195,491 | | $ | 224,370 | | $ | 202,051 |
Foreign | |
| 40,961 | |
| 139,518 | |
| 58,032 |
Earnings before income taxes and equity in loss of nonconsolidated subsidiaries | | $ | 236,452 | | $ | 363,888 | | $ | 260,083 |
6859
Valmont Industries, Inc. and SubsidiariesVALMONT INDUSTRIES, INC. AND SUBSIDIARIES
NOTES TO CONSOLIDATED FINANCIAL STATEMENTS – CONTINUED
Three-year period ended December 31, 2022
(Dollars in thousands, except per share amounts)
(10) INCOME TAXES – CONTINUED
Income tax expense (benefit) consistsfor the fiscal years ended December 30, 2023, December 31, 2022, and December 25, 2021 consisted of:
| | | | | | | | | |
|
| 2022 |
| 2021 |
| 2020 | |||
Current: |
| |
|
| |
|
| |
|
Federal | | $ | 48,309 | | $ | 30,031 | | $ | 30,431 |
State | |
| 11,888 | |
| 8,891 | |
| 8,302 |
Foreign | |
| 48,273 | |
| 20,644 | |
| 12,730 |
| |
| 108,470 | |
| 59,566 | |
| 51,463 |
Non-current: | |
| 1,442 | |
| 1,777 | |
| (451) |
Deferred: | |
|
| |
|
| |
|
|
Federal | |
| (7,544) | |
| 4,587 | |
| (6,086) |
State | |
| (1,973) | |
| 558 | |
| (822) |
Foreign | |
| 8,292 | |
| (5,074) | |
| 5,511 |
| |
| (1,225) | |
| 71 | |
| (1,397) |
| | $ | 108,687 | | $ | 61,414 | | $ | 49,615 |
| | | | | | | | | |
|
| Fiscal Year Ended | |||||||
| | December 30, | | December 31, | | December 25, | |||
| | 2023 |
| 2022 |
| 2021 | |||
Current: |
| |
|
| |
|
| |
|
Federal | | $ | 42,226 | | $ | 48,309 | | $ | 30,031 |
State | |
| 8,480 | |
| 11,888 | |
| 8,891 |
Foreign | |
| 56,107 | |
| 48,273 | |
| 20,644 |
Total current income tax expense | |
| 106,813 | |
| 108,470 | |
| 59,566 |
Non-current: | | | 1,957 | | | 1,442 | | | 1,777 |
Deferred: | |
|
| |
|
| |
|
|
Federal | |
| (12,585) | |
| (7,544) | |
| 4,587 |
State | |
| (2,586) | |
| (1,973) | |
| 558 |
Foreign | |
| (3,478) | |
| 8,292 | |
| (5,074) |
Total deferred income tax expense (benefit) | |
| (18,649) | |
| (1,225) | |
| 71 |
Total income tax expense | | $ | 90,121 | | $ | 108,687 | | $ | 61,414 |
The reconciliations of the statutory federal income tax rate and the effective tax rate for the fiscal years ended December 30, 2023, December 31, 2022, and December 25, 2021 were as follows:
| | | | | | | | | | |||||||||
|
| Fiscal Year Ended | ||||||||||||||||
| | | | | | | | | | | December 30, | | December 31, | | December 25, | |||
|
| 2022 | | 2021 | | 2020 | | 2023 |
| 2022 |
| 2021 | ||||||
Statutory federal income tax rate |
| 21.0 | % | | 21.0 | % | | 21.0 | % |
| 21.0 | % | | 21.0 | % | | 21.0 | % |
State income taxes, net of federal benefit |
| 2.3 |
| | 2.9 |
| | 3.5 | |
| 1.8 |
| | 2.3 |
| | 2.9 | |
Carryforwards, credits and changes in valuation allowances |
| 1.0 |
| | 1.5 |
| | (1.6) | |
| (2.4) |
| | 1.0 |
| | 1.5 | |
Foreign jurisdictional tax rate differences |
| 4.2 |
| | (0.1) |
| | (1.7) | |
| 4.6 |
| | 4.2 |
| | (0.1) | |
Changes in unrecognized tax benefits |
| 0.3 |
| | 0.7 |
| | 0.2 | |
| 0.8 |
| | 0.3 |
| | 0.7 | |
Goodwill and intangible impairment |
| — |
| | — |
| | 2.4 | | |||||||||
Loss on divestiture of offshore wind energy structures business | | 2.2 |
| | — |
| | — | | |||||||||
Impairment of long-lived assets |
| 11.9 |
| | — |
| | — | | |||||||||
Excess tax benefit on equity compensation | | 1.1 | | | 0.5 | | | 0.7 | | |||||||||
Loss from divestiture of offshore wind energy structures business | | — |
| | 2.2 |
| | — | | |||||||||
Other |
| (1.1) |
| | (2.4) |
| | 1.9 | |
| (0.7) |
| | (1.6) |
| | (3.1) | |
|
| 29.9 | % | | 23.6 | % | | 25.7 | % | |||||||||
Effective tax rate |
| 38.1 | % | | 29.9 | % | | 23.6 | % | |||||||||
FiscalThe fiscal year ended December 30, 2023 included $28,079 of tax expense related to non-tax deductible impairment of goodwill. The fiscal year ended December 31, 2022 includesincluded $8,166 of tax expense related to the divestiture of the offshore wind energy structures business for which no benefit has beenwas recorded. FiscalThe fiscal year ended December 25, 2021 includesincluded $1,894 of U.S. tax benefits related to foreign taxes paid offset by $5,102 of valuation allowance recorded against the offshore wind energy structures businessbusiness’ deferred tax assets. Fiscal year 2020 includes $4,651 of tax expense related to non-tax deductible impairment of goodwill. Fiscal year 2020 also includes $1,100 of tax expense primarily related to restructuring charges for which no tax benefits have been recorded due to the increase in valuation allowance.
6960
Valmont Industries, Inc. and SubsidiariesVALMONT INDUSTRIES, INC. AND SUBSIDIARIES
NOTES TO CONSOLIDATED FINANCIAL STATEMENTS – CONTINUED
Three-year period ended December 31, 2022
(Dollars in thousands, except per share amounts)
(10) INCOME TAXES – CONTINUED
Deferred income taxes reflect the net tax effects of (a) temporary differences between the carrying amounts of assets and liabilities for financial reporting purposes and the amounts used for income tax purposes, and (b) operating loss and tax credit carryforwards. The tax effects of significant items comprising the Company’s net deferred income tax assets/liabilities areassets (liabilities) as of December 30, 2023 and December 31, 2022 were as follows:
| | | | | | | ||||||
| | | | | | |
| December 30, | | December 31, | ||
|
| 2022 |
| 2021 | | 2023 |
| 2022 | ||||
Deferred income tax assets: |
| |
|
| |
|
| |
|
| |
|
Accrued expenses and allowances | | $ | 33,577 | | $ | 21,241 | | $ | 36,883 | | $ | 25,927 |
Tax credits and loss carryforwards | |
| 67,249 | |
| 83,690 | |
| 58,519 | |
| 67,249 |
Defined benefit pension liability | |
| — | |
| 134 | ||||||
Inventory allowances | |
| 7,912 | |
| 2,818 | |
| 8,427 | |
| 7,912 |
Accrued compensation and benefits | |
| 24,398 | |
| 24,302 | |
| 23,880 | |
| 24,398 |
Lease liabilities | |
| 40,709 | |
| 41,128 | |
| 41,769 | |
| 40,709 |
Research and development expenditures | | | 22,751 | |
| 7,650 | ||||||
Deferred compensation | |
| 16,308 | |
| 10,893 | |
| 16,163 | |
| 16,308 |
Gross deferred income tax assets | |
| 190,153 | |
| 184,206 | |
| 208,392 | |
| 190,153 |
Valuation allowance | |
| (48,974) | |
| (54,256) | |
| (48,632) | |
| (48,974) |
Net deferred income tax assets | |
| 141,179 | |
| 129,950 | |
| 159,760 | |
| 141,179 |
Deferred income tax liabilities: | |
|
| |
|
| |
|
| |
|
|
Property, plant and equipment | |
| 45,300 | |
| 37,686 | ||||||
Property, plant, and equipment | |
| 42,299 | |
| 45,300 | ||||||
Intangible assets | |
| 52,750 | |
| 48,244 | |
| 52,017 | |
| 52,750 |
Defined benefit pension asset | |
| 6,054 | |
| — | |
| 3,851 | |
| 6,054 |
Lease assets | |
| 40,708 | |
| 41,128 | |
| 42,717 | |
| 40,708 |
Other deferred tax liabilities | |
| 4,941 | |
| 5,041 | |
| 6,616 | |
| 4,941 |
Total deferred income tax liabilities | |
| 149,753 | |
| 132,099 | |
| 147,500 | |
| 149,753 |
Net deferred income tax asset (liability) | | $ | (8,574) | | $ | (2,149) | ||||||
Net deferred income tax assets (liabilities) | | $ | 12,260 | | $ | (8,574) | ||||||
Deferred income tax assets (liabilities) arewere presented as follows onas of December 30, 2023 and December 31, 2022 in the Consolidated Balance Sheets:
| | | | | | |
Balance Sheet Caption |
| 2022 |
| 2021 | ||
Other assets | | $ | 32,517 | | $ | 45,700 |
Deferred income taxes | |
| (41,091) | |
| (47,849) |
Net deferred income tax asset (liability) | | $ | (8,574) | | $ | (2,149) |
| | | | | | |
|
| December 30, | | December 31, | ||
| | 2023 |
| 2022 | ||
Other non-current assets | | $ | 33,465 | | $ | 32,517 |
Deferred income taxes | |
| (21,205) | |
| (41,091) |
Net deferred income tax assets (liabilities) | | $ | 12,260 | | $ | (8,574) |
Management of the Company has reviewed recent operating results and projected future operating results. The Company’s belief that realization of its net deferred tax assets is more likely than not is based on, among other factors, changes in operations that have occurred in recent fiscal years and available tax planning strategies. AtAs of December 30, 2023 and December 31, 2022, and December 25, 2021 respectively, there were $67,249$58,519 and $83,690$67,249 relating to tax credits and loss carryforwards.
Valuation allowances have been established for certain losses that reduce deferred tax assets to an amount that will more likely than not be realized. During fiscal 2021, it was determined no longer more likely than not that the offshore wind energy structures business, based in Denmark, would generate future taxable income so a valuation allowance of $5,102 was recognized against their tax loss carryforwards. During fiscal year 2022, the offshore wind energy structures business was sold. Also in 2021, the Company recorded a valuation allowance of $6,472 against the tax attributes related to the acquisition of Prospera. The deferred tax assets atas of December 31, 202230, 2023 that are associated with tax loss and tax credit carryforwards not reduced by valuation allowances expire in periods starting in 2023.2024.
70
Valmont Industries, Inc. and Subsidiaries
NOTES TO CONSOLIDATED FINANCIAL STATEMENTS – CONTINUED
Three-year period ended December 31, 2022
(Dollars in thousands, except per share amounts)
Uncertain tax positions included in other“Other non-current liabilitiesliabilities” in the Consolidated Balance Sheets are evaluated in a two-step process, whereby (1) the Company determines whether it is more likely than not that the tax positions will be sustained based on the technical merits of the position and (2) for those tax positions that meet the more likely than not recognition threshold, the Company would recognize the largest amount of tax benefit that is greater than fifty percent likely to be realized upon ultimate settlement with the related tax authority.
61
71
Valmont Industries, Inc. and SubsidiariesVALMONT INDUSTRIES, INC. AND SUBSIDIARIES
NOTES TO CONSOLIDATED FINANCIAL STATEMENTS – CONTINUED
Three-year period ended December 31, 2022
(Dollars in thousands, except per share amounts)
(10) INCOME TAXES – CONTINUED
The following summarizes the activity related to the unrecognized tax benefits in 2022for the fiscal years ended December 30, 2023 and 2021:December 31, 2022:
| | | | | | | | | | | | |
|
| 2022 |
| 2021 |
| Fiscal Year Ended | ||||||
Gross unrecognized tax benefits—beginning of year | | $ | 2,664 | | $ | 1,864 | ||||||
| | December 30, | | December 31, | ||||||||
| | 2023 |
| 2022 | ||||||||
Gross unrecognized tax benefits—beginning of period | | $ | 2,536 | | $ | 2,664 | ||||||
Gross increases—tax positions in prior period | |
| 1,133 | |
| 1,315 | |
| 2,174 | |
| 1,133 |
Gross decreases—tax positions in prior period | |
| — | |
| (6) | ||||||
Gross increases—current‑period tax positions | |
| 523 | |
| 240 | |
| 370 | |
| 523 |
Settlements with taxing authorities | |
| (1,576) | |
| — | |
| (32) | |
| (1,576) |
Lapse of statute of limitations | |
| (208) | |
| (749) | ||||||
Gross unrecognized tax benefits—end of year | | $ | 2,536 | | $ | 2,664 | ||||||
Lapses of statutes of limitation | |
| (742) | |
| (208) | ||||||
Gross unrecognized tax benefits—end of period | | $ | 4,306 | | $ | 2,536 | ||||||
There are approximately $1,141$1,514 of uncertain tax positions for which reversal is reasonably possible during the next 12 months due to the closing of the statutestatutes of limitations.limitation. The nature of these uncertain tax positions is generally the computation of a tax deduction or a tax credit. During the fiscal year ended December 30, 2023, the Company recorded a reduction of its gross unrecognized tax benefit of $742, with $586 recorded as a reduction of income tax expense, due to the expiration of statutes of limitation in the U.S. During the fiscal year ended December 31, 2022, the Company recorded a reduction of its gross unrecognized tax benefit of $208, with $165 recorded as a reduction of income tax expense, due to the expiration of statutes of limitation in the United States. During 2021, the Company recorded a reduction of its gross unrecognized tax benefit of $749 with $592 recorded as a reduction of income tax expense, due to the expiration of statutes of limitation in the United States.U.S. In addition to these amounts, there was an aggregate of $172$442 and $1,758$172 of interest and penalties atas of December 30, 2023 and December 31, 2022, and December 25, 2021, respectively. The Company’s policy is to record interest and penalties directly related to income taxes as income“Income tax expenseexpense” in the Consolidated Statements of Earnings.
The Company files income tax returns in the U.S. and various states as well as foreign jurisdictions. Tax years 20192020 and forward remain open under U.S. statutes of limitation. The total amount of unrecognized tax benefits that, if recognized, would affect the effective tax rate was $4,372 and $2,447 as of December 30, 2023 and $4,324 at December 31, 2022, respectively.
The Organisation for Economic Co-operation and December 25, 2021, respectively.Development (“OECD”) has released the Pillar Two Model Rules Framework (the “Framework”) defining the global minimum tax rules, which contemplate a minimum tax rate of 15% and continues to release additional guidance. Although it is uncertain whether the U.S. will enact legislation to adopt the minimum tax directive, certain countries in which the Company operates have adopted legislation effective January 1, 2024, and other countries are in the process of introducing legislation to implement the minimum tax directive. Further, the OECD issued administrative guidance providing transition and safe harbor rules that could delay the impact of the minimum tax directive. The Company will continue to monitor the implementation of the Framework by the countries in which the Company operates. The Company does not expect the Framework to have a material impact on its Consolidated Financial Statements.
(11) LONG-TERM DEBT
Long-term debt isas of December 30, 2023 and December 31, 2022 was as follows:
| | | | | | |
| | December 31, |
| December 25, | ||
|
| 2022 |
| 2021 | ||
5.00% senior unsecured notes due 2044 (a) | | $ | 450,000 | | $ | 450,000 |
5.25% senior unsecured notes due 2054 (b) | |
| 305,000 | |
| 305,000 |
Unamortized discount on 5.00% and 5.25% senior unsecured notes (a) (b) | |
| (20,053) | |
| (20,436) |
Revolving credit agreement (c) | |
| 140,513 | |
| 218,897 |
Other notes | |
| 3,587 | |
| 5,684 |
Debt issuance costs | |
| (6,918) | |
| (7,189) |
Long-term debt | |
| 872,129 | |
| 951,956 |
Less: Current installments of long-term debt | |
| 1,194 | |
| 4,884 |
Long-term debt, excluding current installments | | $ | 870,935 | | $ | 947,072 |
| | | | | | |
|
| December 30, | | December 31, | ||
| | 2023 |
| 2022 | ||
5.00% senior unsecured notes due in fiscal 2044 (a) | | $ | 450,000 | | $ | 450,000 |
5.25% senior unsecured notes due in fiscal 2054 (b) | |
| 305,000 | |
| 305,000 |
Unamortized discount on 5.00% and 5.25% senior unsecured notes (a) (b) | |
| (19,665) | |
| (20,053) |
Revolving credit agreement (c) | |
| 377,899 | |
| 140,513 |
Other notes | |
| 2,015 | |
| 3,587 |
Debt issuance costs | |
| (6,645) | |
| (6,918) |
Long-term debt | |
| 1,108,604 | |
| 872,129 |
Less: Current installments of long-term debt | |
| 719 | |
| 1,194 |
Long-term debt, excluding current installments | | $ | 1,107,885 | | $ | 870,935 |
62
VALMONT INDUSTRIES, INC. AND SUBSIDIARIES
NOTES TO CONSOLIDATED FINANCIAL STATEMENTS
(Dollars in thousands, except per share amounts)
| (a) | The 5.00% senior unsecured notes due in fiscal 2044 include an aggregate principal amount of $450,000 on which interest is paid and an unamortized discount balance of |
72
Valmont Industries, Inc. and Subsidiaries
NOTES TO CONSOLIDATED FINANCIAL STATEMENTS – CONTINUED
Three-year period ended December 31, 2022
(Dollars in thousands, except per share amounts)
| (b) | The 5.25% senior unsecured notes due in fiscal 2054 include an aggregate principal amount of $305,000 on which interest is paid and an unamortized discount balance of |
73
Valmont Industries, Inc. and Subsidiaries
NOTES TO CONSOLIDATED FINANCIAL STATEMENTS – CONTINUED
Three-year period ended December 31, 2022
(Dollars in thousands, except per share amounts)
(11) LONG-TERM DEBT – CONTINUED
| (c) | On October 18, 2021, the Company along with its wholly-owned subsidiaries, Valmont Industries Holland B.V. and Valmont Group Pty. Ltd., as borrowers, entered into an amendment and restatement of the revolving credit agreement with the Company’s lenders. The maturity date of the revolving credit facility was extended to October 18, 2026. The credit facility provides for $800,000 of committed unsecured revolving credit loans with available borrowings thereunder to $400,000 in foreign currencies. The Company may increase the credit facility by up to an additional $300,000 at any time, subject to lenders increasing the amount of their commitments. The interest rate on the borrowings will be, at the Company’s option, either: |
| (i) | term |
| (ii) | the higher of |
| ● | the prime lending rate, |
| ● | the overnight bank rate plus 50 basis points, and |
| ● | term SOFR (based on a |
plus, in each case, 0 to 62.5 basis points, depending on the credit rating of the Company’s senior unsecured long-term debt published by Standard & Poor’s Rating ServicesS&P Global Ratings and Mood’sMoody’s Investors Service, Inc.; or
| (iii) | daily simple SOFR plus a 10 basis point adjustment plus a spread of 100 to 162.5 basis points, depending on the credit rating of the Company’s senior unsecured long-term debt published by |
AtAs of December 31, 2022,30, 2023, the Company had $140,513$377,899 outstanding borrowings under the revolving credit facility. The revolving credit facility has a maturity date of October 18, 2026 and contains a financial covenant that may limit additional borrowing capability under the agreement. AtAs of December 31, 2022,30, 2023, the Company had the ability to borrow $659,401$421,939 under this facility, after consideration of standby letters of credit of $162 associated with certain insurance obligations. The Company also maintains certain short-term bank lines of credit totaling $125,034,$39,336, of which $119,188 was$36,131 were unused atas of December 31, 2022.30, 2023.
The revolving credit facility includes a financial leverage covenant. The Company was in compliance with this covenant atas of December 31, 2022.30, 2023. The minimum aggregate maturities of long-term debt for each of the five fiscal years following 2022 are: $1,194, $860, $679, $141,081,the fiscal year ended December 30, 2023 are $719; $599; $378,554; $43; and $10.$0.
The obligations arising under the 5.00% senior unsecured notes due in fiscal 2044, the 5.25% senior unsecured notes due in fiscal 2054, and the revolving credit facility are guaranteed by the Company and its wholly owned subsidiaries, Valmont Telecommunications, Inc., Valmont Coatings, Inc., Valmont Newmark, Inc., and Valmont Queensland Pty. Ltd.
(12) STOCK-BASED COMPENSATION
The Company maintains stock‑based compensation plans approved by the shareholders, which provide that the Human Resource Committee of the Board of Directors may grant incentive stock options, nonqualified stock options, stock appreciation rights, restricted stock awards, restricted stock units, and bonuses of common stock. At December 31, 2022, 1,722,643 shares of common stock remained available for issuance under the plans. Shares and options issued and available are subject to changes in
7463
Valmont Industries, Inc. and SubsidiariesVALMONT INDUSTRIES, INC. AND SUBSIDIARIES
NOTES TO CONSOLIDATED FINANCIAL STATEMENTS – CONTINUED
Three-year period ended December 31, 2022
(Dollars in thousands, except per share amounts)
(12) STOCK-BASED COMPENSATION
The Company maintains stock‑based compensation plans approved by the shareholders, which provide that the Human Resources Committee of the Board of Directors may grant incentive stock options, nonqualified stock options, stock appreciation rights, restricted stock awards, restricted stock units, and bonuses of common stock. As of December 30, 2023, 1,513,652 shares of common stock remained available for issuance under the plans. Shares and options issued and available are subject to changes in capitalization. The Company’s policy is to issue shares upon exercise of stock options or vesting of restricted stock units or issuance of restricted stock from treasury shares held by the Company.
UnderStock options granted under the stock option plans call for the exercise price of each option equalsto equal the closing market price atas of the timedate of the grant. Options vest beginning on the first anniversary of the grant date in equal amounts over three years or on the grant’s fifth anniversary of the grant.date. Expiration of grants is seven to ten years from the date of grant.the award. Restricted stock units and awards generally vest in equal installments over three or four years beginning on the first anniversary of the grant. TheFor the fiscal years ended December 30, 2023, December 31, 2022, and December 25, 2021, the Company recorded $39,219, $41,850, $28,720, and $14,874$28,720 of compensation expense (included in selling,“Selling, general, and administrative expenses)expenses” in the 2022, 2021, and 2020 fiscal yearsConsolidated Statements of Earnings) for all share-based compensation programs, respectively. The associated tax benefits recorded infor the 2022, 2021, and 2020 fiscal years was $10,463, $7,180, and $3,719, respectively.
(12) STOCK-BASED COMPENSATION – CONTINUED
Atended December 30, 2023, December 31, 2022, and December 25, 2021, were $7,092, $10,463, and $7,180, respectively.
As of December 30, 2023, the amount of unrecognized stock option compensation expense, to be recognized over a weighted average period of 2.372.00 years, was approximately $6,814. Compensation$6,408. During the fiscal years ended December 30, 2023, December 31, 2022, and December 25, 2021, compensation expense for stock options was $3,687, $3,120, in 2022,and $2,538, in 2021, and $2,628 in 2020.respectively.
The Company uses a binomial option pricing model to value its stock options. The fair value of each option grant made inas of December 30, 2023, December 31, 2022, 2021 and 2020December 25, 2021 was estimated using the following assumptions:
| | | | | | | | | | |||||||||
| | | | | | | | | |
| December 30, | | December 31, | | December 25, | |||
|
| 2022 | | 2021 | | 2020 | | 2023 | | 2022 | | 2021 | ||||||
Expected volatility |
| 32.36 | % | | 33.01 | % | | 33.72 | % |
| 31.97 | % | | 32.36 | % | | 33.01 | % |
Risk-free interest rate |
| 3.75 | % | | 1.26 | % | | 0.43 | % |
| 4.21 | % | | 3.75 | % | | 1.26 | % |
Expected life from vesting date |
| 5.4 yrs |
| | 4.0 yrs |
| | 4.0 yrs | |
| 5.4 yrs |
| | 5.4 yrs |
| | 4.0 yrs | |
Dividend yield |
| 1.10 | % | | 1.20 | % | | 1.24 | % |
| 0.87 | % | | 1.10 | % | | 1.20 | % |
FollowingThe following is a summary of the stock option activity during 2020, 2021the fiscal years ended December 30, 2023, December 31, 2022, and 2022:December 25, 2021:
| | | | | | | | | | | | | | | | | | | | |
| | | | | | | Weighted | | | | | | | | | | Weighted | | | |
| | | | Weighted | | Average | | | | | | | Weighted | | Average | | | | ||
| | | | Average | | Remaining | | Aggregate | | | | Average | | Remaining | | Aggregate | ||||
| | Number of | | Exercise | | Contractual | | Intrinsic | | Number of | | Exercise | | Contractual | | Intrinsic | ||||
|
| Shares |
| Price |
| Term |
| Value |
| Shares |
| Price |
| Term |
| Value | ||||
Outstanding at December 28, 2019 |
| 488,560 | | $ | 133.13 |
|
|
| |
| ||||||||||
Outstanding as of December 31, 2022 |
| 195,690 | | $ | 214.62 |
|
|
| |
| ||||||||||
Granted |
| 66,231 | |
| 168.80 |
|
|
| |
|
| 43,340 | |
| 226.55 |
|
|
| |
|
Exercised |
| (147,014) | |
| 125.43 |
|
|
| |
|
| (39,055) | |
| 155.24 |
|
|
| |
|
Forfeited |
| (8,212) | |
| 137.49 |
|
|
| |
|
| (18,445) | |
| 307.81 |
|
|
| |
|
Outstanding at December 26, 2020 |
| 399,565 | | $ | 141.79 |
| 4.88 | | $ | 12,103 | ||||||||||
Options vested or expected to vest at December 26, 2020 |
| 389,633 | | $ | 141.56 |
| 4.81 | |
| 11,890 | ||||||||||
Options exercisable at December 26, 2020 |
| 254,498 | | $ | 138.64 |
| 3.38 | |
| 8,510 | ||||||||||
Outstanding as of December 30, 2023 |
| 181,530 | | $ | 220.77 |
| 7.99 | | $ | 5,992 | ||||||||||
Options vested or expected to vest as of December 30, 2023 |
| 178,820 | | $ | 220.31 |
| 7.96 | |
| 5,975 | ||||||||||
Options exercisable as of December 30, 2023 |
| 116,545 | | $ | 203.78 |
| 7.13 | |
| 5,576 | ||||||||||
64
75
Valmont Industries, Inc. and SubsidiariesVALMONT INDUSTRIES, INC. AND SUBSIDIARIES
NOTES TO CONSOLIDATED FINANCIAL STATEMENTS – CONTINUED
Three-year period ended December 31, 2022
(Dollars in thousands, except per share amounts)
The weighted average per share fair value of options granted during 2020 was $45.49.
| | | | | | | | | | |
| | | | | | | Weighted | | | |
| | | | Weighted | | Average | | | | |
| | | | Average | | Remaining | | Aggregate | ||
| | Number of | | Exercise | | Contractual | | Intrinsic | ||
|
| Shares |
| Price |
| Term |
| Value | ||
Outstanding at December 26, 2020 |
| 399,565 | | $ | 141.79 |
|
|
| |
|
Granted |
| 47,223 | |
| 252.89 |
|
|
| |
|
Exercised |
| (169,908) | |
| 135.76 |
|
|
| |
|
Forfeited |
| (416) | |
| 132.84 |
|
|
| |
|
Outstanding at December 25, 2021 |
| 276,464 | | $ | 164.48 |
| 5.88 | | $ | 22,586 |
Options vested or expected to vest at December 25, 2021 |
| 268,338 | | $ | 163.42 |
| 5.80 | |
| 22,188 |
Options exercisable at December 25, 2021 |
| 154,860 | | $ | 142.15 |
| 4.00 | |
| 15,896 |
The weighted average per share fair value of options granted during 2021 was $67.81.
76
Valmont Industries, Inc. and Subsidiaries
NOTES TO CONSOLIDATED FINANCIAL STATEMENTS – CONTINUED
Three-year period ended December 31, 2022
(Dollars in thousands, except per share amounts)
(12) STOCK-BASED COMPENSATION – CONTINUED
| | | | | | | | | | |
| | | | | | | Weighted | | | |
| | | | Weighted | | Average | | | | |
| | | | Average | | Remaining | | Aggregate | ||
| | Number of | | Exercise | | Contractual | | Intrinsic | ||
|
| Shares |
| Price |
| Term |
| Value | ||
Outstanding at December 25, 2021 |
| 276,464 | | $ | 164.48 |
|
|
| |
|
Granted |
| 40,564 | |
| 332.63 |
|
|
| |
|
Exercised |
| (121,163) | |
| 139.89 |
|
|
| |
|
Forfeited |
| (175) | |
| 104.47 |
|
|
| |
|
Outstanding at December 31, 2022 |
| 195,690 | | $ | 214.62 |
| 7.53 | | $ | 22,644 |
Options vested or expected to vest at December 31, 2022 |
| 189,267 | | $ | 212.69 |
| 7.48 | |
| 22,261 |
Options exercisable at December 31, 2022 |
| 90,556 | | $ | 172.08 |
| 6.40 | |
| 14,276 |
The weighted average per share fair value of options granted during the fiscal year ended December 31, 2023 was $72.60.
| | | | | | | | | | |
| | | | | | | Weighted | | | |
| | | | Weighted | | Average | | | | |
| | | | Average | | Remaining | | Aggregate | ||
| | Number of | | Exercise | | Contractual | | Intrinsic | ||
|
| Shares |
| Price |
| Term |
| Value | ||
Outstanding as of December 25, 2021 |
| 276,464 | | $ | 164.48 |
|
|
| |
|
Granted |
| 40,564 | |
| 332.63 |
|
|
| |
|
Exercised |
| (121,163) | |
| 139.89 |
|
|
| |
|
Forfeited |
| (175) | |
| 104.47 |
|
|
| |
|
Outstanding as of December 31, 2022 |
| 195,690 | | $ | 214.62 |
| 7.53 | | $ | 22,644 |
Options vested or expected to vest as of December 31, 2022 |
| 189,267 | | $ | 212.69 |
| 7.48 | |
| 22,261 |
Options exercisable as of December 31, 2022 |
| 90,556 | | $ | 172.08 |
| 6.40 | |
| 14,276 |
The weighted average per share fair value of options granted during the fiscal year ended December 31, 2022 was $104.01.
| | | | | | | | | | |
| | | | | | | Weighted | | | |
| | | | Weighted | | Average | | | | |
| | | | Average | | Remaining | | Aggregate | ||
| | Number of | | Exercise | | Contractual | | Intrinsic | ||
|
| Shares |
| Price |
| Term |
| Value | ||
Outstanding as of December 26, 2020 |
| 399,565 | | $ | 141.79 |
|
|
| |
|
Granted |
| 47,223 | |
| 252.89 |
|
|
| |
|
Exercised |
| (169,908) | |
| 135.76 |
|
|
| |
|
Forfeited |
| (416) | |
| 132.84 |
|
|
| |
|
Outstanding as of December 25, 2021 |
| 276,464 | | $ | 164.48 |
| 5.88 | | $ | 22,586 |
Options vested or expected to vest as of December 25, 2021 |
| 268,338 | | $ | 163.42 |
| 5.80 | |
| 22,188 |
Options exercisable as of December 25, 2021 |
| 154,860 | | $ | 142.15 |
| 4.00 | |
| 15,896 |
The weighted average per share fair value of options granted during the fiscal year ended December 25, 2021 was $67.81.
In accordance with shareholder-approved plans, the Human ResourceResources Committee of the Board of Directors may grant stock under various stock‑based compensation arrangements, including restricted stock awards, restricted stock units, performance basedperformance-based restricted stock units, and stock issued in lieu of cash bonuses. Under such arrangements, stock or cash (as applicable) is issued without direct cost to the employee. The restricted stock units are settled in Company stock when the restriction period ends. Restricted stock units and awards generally vest in equal installments over three years beginning on the first anniversary of the grant. All cash-settled restricted stock units are marked-to-marketDuring the fiscal years ended December 30, 2023, December 31, 2022, and presented within other accrued expenses and noncurrent liabilities in the Consolidated Balance Sheets. During fiscal 2022,December 25, 2021, and 2020, the Company granted restricted stock units to directors and certain management employees as follows (which are not included in the above stock plan activity tables):
| | | | | | | | | |
|
| 2022 |
| 2021 |
| 2020 | |||
Restricted stock units granted |
| | 60,901 |
| | 216,971 |
| | 85,251 |
Weighted‑average per share price on grant date | | $ | 313.75 | | $ | 236.28 | | $ | 161.73 |
Recognized compensation expense | | $ | 22,664 | | $ | 16,147 | | $ | 9,081 |
65
VALMONT INDUSTRIES, INC. AND SUBSIDIARIES
NOTES TO CONSOLIDATED FINANCIAL STATEMENTS
(Dollars in thousands, except per share amounts)
| | | | | | | | | |
|
| Fiscal Year Ended | |||||||
| | December 30, | | December 31, | | December 25, | |||
| | 2023 |
| 2022 |
| 2021 | |||
Restricted stock units granted |
| | 67,723 |
| | 60,901 |
| | 216,971 |
Weighted‑average per share price on grant date | | $ | 233.96 | | $ | 313.75 | | $ | 236.28 |
Recognized compensation expense | | $ | 22,478 | | $ | 22,664 | | $ | 16,147 |
During the second half of fiscal 2021, the Company granted 159,982 restricted stock units, worth $36,916, to certain employees of Prospera.Prospera, of which 50,141 remain outstanding as of December 30, 2023. These restricted stock units vest in equal installments over four years and require the employees to continue employment over those four years. As such, the related compensation expense will be incurred over the vesting period.
AtAs of December 31, 202230, 2023, the amount of deferred stock‑based compensation granted, to be recognized over a weighted‑average period of 2.732.12 years, was approximately $50,422.$33,933.
Performance-based restricted stock units (“PSU”PSUs”) awards consist of shares of the Company’s stock which are payable upon the determination that the Company achieveachieves certain established performance targets and can range from 0% to 200% of the targeted payout based on the actual results. PSUs granted in 2022the fiscal years ended December 30, 2023 and 2021December 31, 2022 have a performance period of three years. The fair value of each PSU granted is equal to the fair market value of the Company’s common stock on the date of grant. PSUs granted generally have a three yearsthree-year period cliff vesting schedule; however, according to the grant agreements, if certain conditions are met, the employee (or beneficiary) will receive a prorated amount of the award based on active employment during the service period.
77
Valmont Industries, Inc. and Subsidiaries
NOTES TO CONSOLIDATED FINANCIAL STATEMENTS – CONTINUED
Three-year periodDuring the fiscal years ended December 30, 2023, December 31, 2022,
(Dollars in thousands, except per share amounts)
During fiscal 2022, and December 25, 2021, and 2020, the Company granted PSU awards as follows (which are not included in the above stock plan activity tables):
| | | | | | | | | | |||||||||
|
| Fiscal Year Ended | ||||||||||||||||
| | | | | | | | | | | December 30, | | December 31, | | December 25, | |||
|
| 2022 |
| 2021 |
| 2020 | | 2023 |
| 2022 |
| 2021 | ||||||
Shares granted |
| | 33,736 |
| | 41,060 |
| | 35,181 |
| | 38,201 |
| | 33,736 |
| | 41,060 |
Weighted‑average per share price on grant date | | $ | 215.15 | | $ | 230.40 | | $ | 125.41 | | $ | 299.20 | | $ | 215.15 | | $ | 230.40 |
Recognized compensation expense | | $ | 16,066 | | $ | 10,035 | | $ | 3,165 | | $ | 13,054 | | $ | 16,066 | | $ | 10,035 |
78
Valmont Industries, Inc. and Subsidiaries
NOTES TO CONSOLIDATED FINANCIAL STATEMENTS – CONTINUED
Three-year period ended December 31, 2022
(Dollars in thousands, except per share amounts)
(13) EARNINGS PER SHARE
The following table provides a reconciliation between the earnings and average share amounts used to compute both basic and diluted earnings per share (“EPS”):share:
| | | | | | | | | |
|
| |
| Dilutive |
| | |||
| | | | | Effect of | | | ||
| | | | | Stock | | Diluted | ||
| | Basic EPS | | Options | | EPS | |||
2022: | | | | | | | | | |
Net earnings attributable to Valmont Industries, Inc. | | $ | 250,863 | | $ | — | | $ | 250,863 |
Weighted average shares outstanding (000’s) | |
| 21,311 | |
| 269 | |
| 21,580 |
Per share amount | | $ | 11.77 | | $ | (0.15) | | $ | 11.62 |
2021: | |
|
| |
|
| |
|
|
Net earnings attributable to Valmont Industries, Inc. | | $ | 195,630 | | $ | — | | $ | 195,630 |
Weighted average shares outstanding (000’s) | |
| 21,193 | |
| 300 | |
| 21,493 |
Per share amount | | $ | 9.23 | | $ | (0.13) | | $ | 9.10 |
2020: | |
|
| |
|
| |
|
|
Net earnings attributable to Valmont Industries, Inc. | | $ | 140,693 | | $ | — | | $ | 140,693 |
Weighted average shares outstanding (000’s) | |
| 21,315 | |
| 110 | |
| 21,425 |
Per share amount | | $ | 6.60 | | $ | (0.03) | | $ | 6.57 |
| | | | | | | | | |
| | Fiscal Year Ended | |||||||
| | December 30, | | December 31, | | December 25, | |||
| | 2023 |
| 2022 |
| 2021 | |||
Net earnings attributable to Valmont Industries, Inc. including change in redemption value of redeemable noncontrolling interest: | | | | | | | | | |
Net earnings attributable to Valmont Industries, Inc. | | $ | 150,849 | | $ | 250,863 | | $ | 195,630 |
Change in redemption value of redeemable noncontrolling interest | | | (7,374) | | | — | | | — |
Net earnings attributable to Valmont Industries, Inc. including change in redemption value of redeemable noncontrolling interest | | $ | 143,475 | | $ | 250,863 | | $ | 195,630 |
Weighted average shares outstanding (000s): | | | | | | | | | |
Basic | | | 20,956 | | | 21,311 | | | 21,193 |
Dilutive effect of various stock awards | | | 203 | | | 269 | | | 300 |
Diluted | | | 21,159 | | | 21,580 | | | 21,493 |
Net earnings per share attributable to common shareholders: | | | | | | | | | |
Basic | | $ | 6.85 | | $ | 11.77 | | $ | 9.23 |
Dilutive effect of various stock awards | | | (0.07) | | | (0.15) | | | (0.13) |
Diluted | | $ | 6.78 | | $ | 11.62 | | $ | 9.10 |
66
VALMONT INDUSTRIES, INC. AND SUBSIDIARIES
NOTES TO CONSOLIDATED FINANCIAL STATEMENTS
(Dollars in thousands, except per share amounts)
Basic and diluted net earnings and earnings per share in the fiscal year ended December 30, 2023 were impacted by the impairment of certain long-lived assets of $136,457 after-tax ($6.45 per share) and realignment charges of $26,490 after-tax ($1.25 per share). Basic and diluted net earnings and earnings per share in the fiscal year ended December 31, 2022 were impacted by a loss from the divestiture of the offshore wind energy structures’structures business of $33,273 (no associated tax benefit) ($1.54 per share). Basic and diluted net earnings and earnings per share in the fiscal year ended December 25, 2021 were impacted by impairments of long-lived assets (customer relationship intangible asset, trade name, and property, plant and equipment) associated with the offshore wind energy structures business of $21,678 after-tax ($1.01 per share) and a valuation allowance against the deferred tax assets of the offshore wind energy structures business of $5,076 after-tax ($0.24 per share). Basic
As of December 30, 2023, December 31, 2022, and diluted net earnings and earnings per share in fiscal year 2020 were impacted by impairments of goodwill and intangible assets in fiscal year 2020 of $16,220 after-tax ($0.76 per share) and restructuring expenses of $17,324 after-tax ($0.81 per share).
Earnings per share are computed independently for each of the quarters. Therefore, the sum of the quarterly earnings per share may not equal the total for the year.
At the end of fiscal years 2022,December 25, 2021, and 2020 there were 40,564,127,774; 40,564; and 47,223 and 0 outstanding stock options respectively, with exercise prices exceeding the average market price of common stock during the applicable period that were excluded from the computation of diluted earnings per share, respectively.
(14) EMPLOYEE RETIREMENT SAVINGS PLAN
Established under Internal Revenue Code Section 401(k), the Valmont Employee Retirement Savings Plan (“VERSP”) is a defined contribution plan available to all eligible employees. Participants can elect to contribute up to 60% of their annual pay, on a pre-tax and/or after-tax basis. The Company also makes contributions to the VERSP and a non-qualified deferred compensation plan for certain Company executives. The 2022, 2021, and 2020 CompanyCompany’s contributions to these plans for the fiscal years ended December 30, 2023, December 31, 2022, and December 25, 2021, amounted to approximately $20,000, $18,300, $16,000, and $14,800,$16,000, respectively.
The Company sponsors a fully‑funded, non-qualified deferred compensation plan for certain Company executives who otherwise would be limited in receiving companyCompany contributions into the VERSP under Internal Revenue Service regulations. The invested assets and related liabilities of these participants were $26,803 and $25,008 as of December 30, 2023 and $29,982 at December 31, 2022, and December 25, 2021, respectively. Such amounts are included in “Other non-current assets” and “Deferred compensation” onin the Consolidated Balance Sheets.
79
Valmont Industries, Inc. and Subsidiaries
NOTES TO CONSOLIDATED FINANCIAL STATEMENTS – CONTINUED
Three-year period ended December 31, 2022
(Dollars in thousands, except per share amounts)
Amounts distributed from the Company’s non-qualified deferred compensation plan to participants under the transition rules of sectionSection 409A of the Internal Revenue Code were approximately $5,476 and $4,691 as of December 30, 2023 and $8,900 at December 31, 2022, and December 25, 2021, respectively. All distributions were made in cash.
80
Valmont Industries, Inc. and Subsidiaries
NOTES TO CONSOLIDATED FINANCIAL STATEMENTS – CONTINUED
Three-year period ended December 31, 2022
(Dollars in thousands, except per share amounts)
(15) DISCLOSURES ABOUT THE FAIR VALUE OF FINANCIAL INSTRUMENTSMEASUREMENTS
The carrying amountamounts of cash and cash equivalents, receivables, accounts payable, notes payable to banks, and accrued expenses approximate fair value because of the short maturity of these instruments. The fair values of each of the Company’s long-term debt instruments are based on the amount of future cash flows associated with each instrument discounted using the Company’s current borrowing rate for similar debt instruments of comparable maturity (Level 2).maturity. The fair value estimates are made at a specific point in time and the underlying assumptions are subject to change based on market conditions. AtAs of December 30, 2023, the carrying amount of the Company’s long-term debt was $1,108,604 with an estimated fair value of approximately $1,064,916. As of December 31, 2022, the carrying amount of the Company’s long-term debt was $872,129 with an estimated fair value of approximately $807,281. At December 25, 2021, the carrying amount of the Company’s long-term debt was $951,956 with an estimated fair value of approximately $1,175,332.
ASC 820 establishes a three‑level hierarchy for fair value measurements based uponon the transparency of inputs to the valuation of an asset or liability as of the measurement date is used. Inputs refersrefer broadly to the assumptions that market participants would use in pricing the asset or liability, including assumptions about risk. Financial assets and liabilities carried at fair value will be classified and disclosed in one of the following three categories:
| ● | Level 1: Quoted |
| ● | Level 2: |
| ● | Level 3: Unobservable inputs |
The categorization within the valuation hierarchy is based upon the lowest level of input that is significant to the fair value measurement. Following is a description of the valuation methodologies used for assets and liabilities measured at fair value.
Trading Securities: The assets and liabilities recorded for the investments held in the Valmont Deferred Compensation Plan of $25,008 ($29,982 in 2021) represent mutual funds, invested in debt and equity securities, classified as trading securities, considering the employee’s ability to change investment allocation of their deferred compensation at any time. The Company’s remaining ownership in Delta EMD Pty. Ltd. (JSE:DTA) of $0 ($94 in 2021) is recorded at fair value at December 31, 2022. Quoted market prices are available for these securities in an active market and therefore categorized as a Level 1 input. These securities are included in “Other assets” on the Consolidated Balance Sheets.
Derivative Financial Instruments: The fair value of foreign currency and commodity forward and cross currency contracts is based on a valuation model that discounts cash flows resulting from the differential between the contract price and the market-based forward rate.
Mutual Funds: The Company has short-term investments in various mutual funds.
Marketable Securities: The Company’s marketable securities consist of short-term investments in certificates of deposit.
| | | | | | | | | | | | |
| | | | | Fair Value Measurement Using: | |||||||
| | |
| Quoted Prices in |
| Significant Other |
| Significant | ||||
| | | | | Active Markets | | Observable | | Unobservable | |||
| | Carrying Value | | for Identical | | Inputs | | Inputs | ||||
| | December 31, 2022 | | Assets (Level 1) | | (Level 2) | | (Level 3) | ||||
Assets: | | | | | | | | | | | | |
Trading securities | | $ | 25,008 | | $ | 25,008 | | $ | — | | $ | — |
Derivative financial instruments, net | | $ | 1,404 | | $ | — | | $ | 1,404 | | $ | — |
Cash and cash equivalents - mutual funds | | $ | 7,205 | | $ | 7,205 | | $ | — | | $ | — |
Cash and cash equivalents - marketable securities | | $ | 136 | | $ | — | | $ | 136 | | $ | — |
67
81
Valmont Industries, Inc. and SubsidiariesVALMONT INDUSTRIES, INC. AND SUBSIDIARIES
NOTES TO CONSOLIDATED FINANCIAL STATEMENTS – CONTINUED
Three-year period ended December 31, 2022
(Dollars in thousands, except per share amounts)
(15) DISCLOSURES ABOUT THE FAIR VALUE OF FINANCIAL INSTRUMENTS – CONTINUED
| | | | | | | | | | | | |
| | | | | Fair Value Measurement Using: | |||||||
| | |
| Quoted Prices in |
| Significant Other |
| Significant | ||||
| | Carrying Value | | Active Markets | | Observable | | Unobservable | ||||
| | December 25, | | for Identical | | Inputs | | Inputs | ||||
| | 2021 | | Assets (Level 1) | | (Level 2) | | (Level 3) | ||||
Assets (Liabilities): | | | | | | | | | | | | |
Trading securities | | $ | 30,076 | | $ | 30,076 | | $ | — | | $ | — |
Derivative financial instruments, net | | $ | (4,007) | | $ | — | | $ | (4,007) | | $ | — |
The categorization within the valuation hierarchy is based on the lowest level of input that is significant to the fair value measurement. The following are descriptions of the valuation methodologies used for assets and liabilities measured at fair value:
Trading Securities: The Company’s trading securities represent the investments held in the Valmont Deferred Compensation Plan (the “DCP”). As of December 30, 2023 and December 31, 2022, the assets of the DCP were $26,803 and $25,008, respectively. These assets represent mutual funds, invested in debt and equity securities, classified as trading securities, considering the employee’s ability to change investment allocation of their deferred compensation at any time. Quoted market prices are available for these securities in an active market and therefore are categorized as Level 1 inputs. These securities are included in “Other non-current assets” in the Consolidated Balance Sheets.
Derivative Financial Instruments: The fair values of foreign currency, commodity, and cross currency swap derivative contracts are based on valuation models that use market observable inputs including forward and spot prices for commodities and currencies.
Mutual Funds: The Company has short-term investments in various mutual funds.
| | | | | | | | | | | | |
| | Carrying Value | | Fair Value Measurement Using: | ||||||||
| | December 30, 2023 | | Level 1 | | Level 2 | | Level 3 | ||||
Trading securities | | $ | 26,803 | | $ | 26,803 | | $ | — | | $ | — |
Derivative financial instruments, net | | | 2,860 | | | — | | | 2,860 | | | — |
Cash and cash equivalents - mutual funds | | | 6,258 | | | 6,258 | | | — | | | — |
| | | | | | | | | | | | |
| | Carrying Value | | Fair Value Measurement Using: | ||||||||
| | December 31, 2022 | | Level 1 | | Level 2 | | Level 3 | ||||
Trading securities | | $ | 25,008 | | $ | 25,008 | | $ | — | | $ | — |
Derivative financial instruments, net | | | 1,404 | | | — | | | 1,404 | | | — |
Cash and cash equivalents - mutual funds | | | 7,205 | | | 7,205 | | | — | | | — |
(16) DERIVATIVE FINANCIAL INSTRUMENTS
The Company manages interest rate risk, commodity price risk, and foreign currency risk related to foreign currency denominated transactions and investments in foreign subsidiaries. Depending on the circumstances, the Company may manage these risks by utilizing derivative financial instruments. Some derivative financial instruments are marked to market and recorded in the Company’s Consolidated Statements of Earnings, while others may be accounted for as fair value, cash flow, or net investment hedges. The Company had open foreign currency forward contracts that are marked to market at December 31, 2022 and December 25, 2021, which are insignificant and thus excluded from the tables below. Derivative financial instruments have credit and market risk. The Company manages these risks of derivative instruments by monitoring limits as to the types and degree of risk that can be taken and by entering into transactions with counterparties who are recognized, stable multinational banks. Any gains or losses from net investment hedge activities remain in AOCI until either the sale or substantially complete liquidation of the related subsidiaries.
FairThe fair value of derivative instruments atas of December 30, 2023 and December 31, 2022 and December 25, 2021 arewas as follows:
| | | | | | | | |
Derivatives designated as hedging instruments: |
| Balance sheet location | | 2022 | | 2021 | ||
Commodity forward contracts | | Accrued expenses | | $ | (3,854) | | $ | (5,802) |
Foreign currency forward contracts |
| Prepaid expenses and other assets | | | 83 |
| | 149 |
Foreign currency forward contracts |
| Accrued expenses | | | — |
| | (118) |
Cross currency swap contracts |
| Prepaid expenses and other assets | | | 5,385 |
| | 1,764 |
Cross currency swap contracts |
| Accrued expenses | | | (210) |
| | — |
| | | | $ | 1,404 | | $ | (4,007) |
| | | | | | | | |
| | | | December 30, | | December 31, | ||
Derivatives designated as hedging instruments: |
| Balance Sheets location | | 2023 | | 2022 | ||
Commodity contracts | | Prepaid expenses and other current assets | | $ | 2,520 | | $ | — |
Commodity contracts | | Other accrued expenses | | | (1,586) | | | (3,854) |
Foreign currency forward contracts |
| Prepaid expenses and other current assets | | | — |
| | 83 |
Cross currency swap contracts |
| Prepaid expenses and other current assets | | | 1,938 |
| | 5,385 |
Cross currency swap contracts |
| Other accrued expenses | | | (12) |
| | (210) |
| | | | $ | 2,860 | | $ | 1,404 |
68
VALMONT INDUSTRIES, INC. AND SUBSIDIARIES
NOTES TO CONSOLIDATED FINANCIAL STATEMENTS
(Dollars in thousands, except per share amounts)
Gains (losses) on derivatives recognized in the Consolidated Statements of Earnings for the fiscal years ended December 30, 2023, December 31, 2022, and December 25, 2021 and December 26, 2020 arewere as follows:
| | | | | | | | | | | | | | | | | | | | | | | |
Derivatives designated as hedging instruments: | | Statements of earnings location | | | 2022 | | 2021 | | 2020 | ||||||||||||||
Commodity forward contracts | | Product cost of sales | | | $ | (5,212) | | $ | 25,821 | | $ | — | |||||||||||
Foreign currency forward contracts | | Product sales | | | | — | | | — | | | 1,598 | |||||||||||
|
| | | Fiscal Year Ended | |||||||||||||||||||
Derivatives designated as | | Statements of | | December 30, | | December 31, | | December 25, | |||||||||||||||
hedging instruments: | | Earnings location | | 2023 | | 2022 | | 2021 | |||||||||||||||
Commodity contracts | | Product cost of sales | | $ | (7,057) | | $ | (5,212) | | $ | 25,821 | ||||||||||||
Foreign currency forward contracts | | Other income | | | | (45) |
| | (40) |
| | 187 | | Other income (expenses) | | | 177 |
| | (45) |
| | (40) |
Interest rate hedge amortization | | Interest expense | | | | (64) |
| | (64) |
| | (64) | | Interest expense | | | (64) |
| | (64) |
| | (64) |
Cross currency swap contracts | | Loss from divestiture of wind energy structures business | | | | 4,827 |
| | — |
| | — | | Other income (expenses) | | | — |
| | 4,827 |
| | — |
Cross currency swap contracts | | Interest expense | | | | 2,875 |
| | 2,780 |
| | 2,738 | | Interest expense | | | 1,813 |
| | 2,875 |
| | 2,780 |
| | | | | $ | 2,381 | | $ | 28,497 | | $ | 4,459 | | | | $ | (5,131) | | $ | 2,381 | | $ | 28,497 |
82
Valmont Industries, Inc. and Subsidiaries
NOTES TO CONSOLIDATED FINANCIAL STATEMENTS – CONTINUED
Three-year period ended December 31, 2022
(Dollars in thousands, except per share amounts)
Cash Flow Hedges
During 2021, theThe Company enteredenters into steel hot rolled coil (“HRC”)commodity forward, swap, and option contracts that qualify as a cash flow hedgehedges of the variability in cash flows attributable to future steel purchases. The forward contracts had a notional amount of $93,498 for the total purchase of 86,100 short tons. During the second quarter of 2022, the Company entered into additional steel HRC forward contracts that qualify as a cash flow hedge of the variability in cash flows attributable to future steel purchases. The forward contracts had a notional amount of $14,010 for the total purchase of 15,000 short tons. As of December 31, 2022, the forward contracts had a notional amount of $9,766 for the total purchase of 10,300 short tons from January 2023 to March 2023. The gain (loss) realized upon settlement will be recorded in product cost of sales in the Consolidated Statements of Earnings over average inventory turns.
83
Valmont Industries, Inc. and Subsidiaries
NOTES TO CONSOLIDATED FINANCIAL STATEMENTS – CONTINUED
Three-year period ended December 31, 2022
(Dollars in thousands, except per share amounts)
(16) DERIVATIVE FINANCIAL INSTRUMENTS – CONTINUED
During the third quarter of 2022, the Company entered into natural gas commodity forward contracts that qualify as a cash flow hedge of the variability in cash flows attributable to future natural gas purchases. The forward contracts had a notional amount of $5,211 for the total purchase of 770,000 mmBtu from October 2022 to October 2023. During the fourth quarter of 2022, the Company entered into additional natural gas commodity forward contracts that also qualify as a cash flow hedge. The forward contracts had a notional amount of $3,088 for the total purchase of 620,000 mmBtu from January 2023 to October 2024. As of December 31, 2022, the forward contracts had a notional amount of $7,043 for the total purchase of 1,230,000 mmBtu from January 2023 to October 2024. The gain (loss) realized upon settlementeach will be recorded in “Product cost of sales” in the Consolidated Statements of Earnings in the period consumed.
During the third quarter Notional amounts, purchase quantities, and maturity dates of 2022, a subsidiary with a euro functional currency entered into a foreign currency forward contract to mitigate foreign currency risk related to a large customer order denominated in U.S. dollars. The forward contract, which qualifiesthese contracts as a fair value hedge, matures in Februaryof December 30, 2023 and has a notional amount to sell $1,800 in exchange for a stated amount of euros.
During 2021, a Brazilian subsidiary with a real functional currency entered into foreign currency forward contracts to mitigate foreign currency risk related to a customer order with components purchased in euros. The forward contracts, which qualifiedwere as a cash flow hedge, matured in July and September 2021 and had notional amounts to buy 3,800 euros in exchange for a stated amount of Brazilian real. During 2021, a subsidiary with a euro functional currency entered into a foreign currency forward contract to mitigate foreign currency risk related to a large customer order denominated in U.S. dollars. The forward contract, which qualified as a fair value hedge, matured in December 2021 and a notional amount to sell $2,000 in exchange for a stated amount of euros.follows:
In 2020, a Brazilian subsidiary with a real functional currency entered into foreign currency forward contracts to mitigate foreign currency risk related to a customer order with components purchased in euros. The forward contracts, which qualified as a cash flow hedge, matured in December 2020 and a notional amount to buy 4,500 euros in exchange for a stated amount of Brazilian real. In 2020, a subsidiary with a euro functional currency entered into foreign currency forward contracts to mitigate foreign currency risk related to a large customer order denominated in U.S. dollars. The forward contracts, which qualified as a cash flow hedge, matured in June 2021 and a notional amount to sell $27,500 in exchange for a stated amount of euros.
| | | | | | | |
|
| Notional | | Total | | | |
Commodity Type | | Amount | | Purchase Quantity | | Maturity Dates | |
Hot rolled steel coil | | $ | 7,844 | | 8,500 short tons |
| December 2023 to April 2024 |
Natural gas | | | 4,272 | | 960,475 MMBtu | | January 2024 to October 2025 |
Diesel fuel | | | 542 | | 1,890,000 gallons | | January 2024 to September 2024 |
Net Investment Hedges
In the second quarter of 2020, the Company early settled its Australian dollar denominated foreign currency forward contracts and received proceeds of $11,983. Amounts will remain in OCI until either the sale or substantially complete liquidation of the related subsidiaries.
In the second quarter offiscal 2019, the Company entered into two fixed-for-fixed cross currency swaps ("CCS"), swapping U.S. dollar principal and interest payments on a portion of its 5.00% senior unsecured notes due in fiscal 2044 for Danish krone (“DKK”) and euroEuro denominated payments. The CCS were entered into in order to mitigate foreign currency risk on the Company’s euroEuro and DKK investments and to reduce interest expense. Interest is exchanged twice per year on April 1 and October 1.
The Company designated the initial full notional amount of the two CCS ($130,000) as a hedge of the net investment in certain Danish and European subsidiaries under the spot method, with all changes in the fair value of the CCS that are included in the assessment of effectiveness (changes due to spot foreign exchange rates) are recorded as cumulative foreign currency translation within AOCI. Net interest receipts will be recorded as a reduction of interest expense over the life of the CCS.
DuringIn the second halfthird and fourth quarters of fiscal 2022, the Company settled the DKK CCS and received proceeds of $3,532. Due to the sale of the offshore wind energy structures business in the fourth quarter of fiscal 2022, the Company reclassified the cumulative net investment hedge
84
Valmont Industries, Inc. and Subsidiaries
NOTES TO CONSOLIDATED FINANCIAL STATEMENTS – CONTINUED
Three-year period ended December 31, 2022
(Dollars in thousands, except per share amounts)
gain of $4,827 ($3,620 after tax)after-tax) from OCIAOCI to “Loss from divestiture of offshore wind energy structures business”“Other income (expenses)” in the Consolidated Statements of Earnings.
Key terms of the Euro CCS are as follows:
| | | | | | | | | | | | | | | | | | | | | |
|
| Notional | | | | Swapped | | Set Settlement |
|
| Notional | | | | Swapped | | Set Settlement | ||||
Currency | | Amount | | Termination Date | | Interest Rate | | Amount |
| | Amount | | Termination Date | | Interest Rate | | Amount | ||||
Euro | | $ | 80,000 | | April 1, 2024 |
| 2.825% | | € | 71,550 | | | $ | 80,000 | | April 1, 2024 |
| 2.825% | | € | 71,550 |
69
VALMONT INDUSTRIES, INC. AND SUBSIDIARIES
NOTES TO CONSOLIDATED FINANCIAL STATEMENTS
(Dollars in thousands, except per share amounts)
(17) GUARANTEESWARRANTIES
The Company’s product warranty accrual reflects management’s best estimate of the probable liability under its product warranties. Historical product claims data is used to estimate the cost of product warranties at the time revenue is recognized.
Changes in the product warranty accrual, which isare recorded in “Accrued“Other accrued expenses”, in the Consolidated Balance Sheets, for the fiscal years ended December 31, 202230, 2023 and December 25, 2021,31, 2022 were as follows:
| | | | | | |
|
| 2022 |
| 2021 | ||
Balance, beginning of period | | $ | 21,308 | | $ | 14,787 |
Payments made | |
| (10,569) | |
| (6,444) |
Change in liability for warranties issued during the period | |
| 12,866 | |
| 13,534 |
Change in liability for pre-existing warranties | |
| (3,832) | |
| (569) |
Balance, end of period | | $ | 19,773 | | $ | 21,308 |
| | | | | | |
| | Fiscal Year Ended | ||||
| | December 30, | | December 31, | ||
| | 2023 |
| 2022 | ||
Balance, beginning of period | | $ | 19,773 | | $ | 21,308 |
Payments made | |
| (17,072) | |
| (10,569) |
Change in liability for warranties issued during the period | |
| 24,096 | |
| 12,866 |
Change in liability for pre-existing warranties | |
| (4,363) | |
| (3,832) |
Balance, end of period | | $ | 22,434 | | $ | 19,773 |
(18) COMMITMENTS & CONTINGENCIES
Various claims and lawsuits are pending against the Company and certain of its subsidiaries. The Company cannot fully determine the effect of all asserted and unasserted claims on its consolidated results of operations, financial condition, or liquidity. Where asserted and unasserted claims are considered probable and reasonably estimable, a liability has been recorded. The Company does not expect that any known lawsuits, claims, environmental costs, commitments, or contingent liabilities will have a material adverse effect on the consolidated results of operations, financial condition, or liquidity.
(19) DEFINED BENEFIT RETIREMENT PLAN
Delta Ltd., a wholly-owned subsidiary of the Company, is the sponsor of the Delta Pension Plan ("Plan"(the "Plan"). The Plan provides defined benefit retirement income to eligible employees in the United Kingdom.Kingdom (“U.K.”). Pension retirement benefits to qualified employees are 1.67% of final salary per year of service upon reaching the age of 65 years. ThisThe Plan has no active employees as members atas of December 31, 2022.30, 2023.
Funded Status
The Company recognizes the overfunded or underfunded status of the pension plan as an asset or liability. The funded status represents the difference between the projected benefit obligation (“PBO”) and the fair value of the plan assets. The PBO is the present value of benefits earned to date by plan participants, including the effect of assumed future salary increases (if applicable) and inflation. Plan assets are measured at fair value. Because the pension planPlan is denominated in British pounds, sterling, the Company used exchange rates of $1.209/$1.273/£ and $1.356/$1.209/£ to translate the net pension liabilityasset into U.S. dollars atas of December 30, 2023 and December 31, 2022, and December 25, 2021, respectively. The PBO was $435,711 at$477,763 as of December 31, 2022.30, 2023. The net funded status of $24,216 at$15,404 as of December 31, 202230, 2023 is recorded as a noncurrentnon-current asset reflecting, in part, a significantan actuarial gainloss for the period from December 25, 202131, 2022 to December 31, 202230, 2023 attributed to an increasea slight decrease in the discount rate.
85
Valmont Industries, Inc. and Subsidiaries
NOTES TO CONSOLIDATED FINANCIAL STATEMENTS – CONTINUED
Three-year period ended December 31, 2022
(Dollars in thousands, except per share amounts)
Projected Benefit Obligation and Fair Value of Plan Assets—The accumulated benefit obligation (“ABO”) is the present value of benefits earned to date, assuming no future compensation growth.
As there are no active employees in the plan, the ABO is equal to the PBO for all years presented. The overfunded ABO represents the difference between the PBO and the fair value of plan assets.
(19) DEFINED BENEFIT RETIREMENT PLAN – CONTINUED
Changes in the PBO and fair value of plan assets for the pension plan for the period from December 26, 2020 to December 25, 2021 were as follows:
| | | | | | | | | |
|
| Projected |
| | |
| | | |
| | Benefit | | Plan | | Funded | |||
| | Obligation | | Assets | | status | |||
Fair Value at December 26, 2020 | | $ | 860,173 | | $ | 741,650 | | $ | (118,523) |
Employer contributions | | | — | | | 1,924 | |
| |
Interest cost |
| | 9,896 |
| | — |
| |
|
Actual return on plan assets |
| | — |
| | 48,637 |
| |
|
Benefits paid |
| | (22,952) |
| | (22,952) |
| |
|
Actuarial gain |
| | (77,379) |
| | — |
| |
|
Currency translation |
| | (8,032) |
| | (8,089) |
| |
|
Fair Value at December 25, 2021 | | $ | 761,706 | | $ | 761,170 | | $ | (536) |
Changes in the PBO and fair value of plan assets for the pension plan for the period from December 25, 2021 to December 31, 2022 were as follows:
| | | | | | | | | |
|
| Projected |
| | |
| | | |
| | Benefit | | Plan | | Funded | |||
| | Obligation | | Assets | | status | |||
Fair Value at December 25, 2021 | | $ | 761,706 | | $ | 761,170 | | $ | (536) |
Employer contributions | | | — | | | 17,155 | |
| |
Interest cost |
| | 12,551 |
| | — |
| |
|
Actual return on plan assets |
| | — |
| | (228,493) |
| |
|
Benefits paid |
| | (20,175) |
| | (20,175) |
| |
|
Actuarial gain |
| | (248,252) |
| | — |
| |
|
Currency translation |
| | (70,119) |
| | (69,730) |
| |
|
Fair Value at December 31, 2022 | | $ | 435,711 | | $ | 459,927 | | $ | 24,216 |
Actuarial gain decreased the projected benefit obligation resulted from an increase in the discount rate to 4.80% in 2022 versus 1.90%.
8670
Valmont Industries, Inc. and SubsidiariesVALMONT INDUSTRIES, INC. AND SUBSIDIARIES
NOTES TO CONSOLIDATED FINANCIAL STATEMENTS – CONTINUED
Three-year period ended December 31, 2022
(Dollars in thousands, except per share amounts)
Changes in the PBO and fair value of plan assets for the Plan for the period from December 31, 2022 to December 30, 2023 were as follows:
| | | | | | | | | |
|
| Projected |
| | |
| | | |
| | Benefit | | Plan | | Funded | |||
| | Obligation | | Assets | | Status | |||
Fair value as of December 31, 2022 | | $ | 435,711 | | $ | 459,927 | | $ | 24,216 |
Employer contributions | | | — | | | 17,345 | |
| |
Interest cost |
| | 21,555 |
| | — |
| |
|
Actual return on plan assets |
| | — |
| | 10,966 |
| |
|
Benefits paid |
| | (20,683) |
| | (20,683) |
| |
|
Actuarial loss |
| | 17,692 |
| | — |
| |
|
Currency translation |
| | 23,488 |
| | 25,612 |
| |
|
Fair value as of December 30, 2023 | | $ | 477,763 | | $ | 493,167 | | $ | 15,404 |
The actuarial loss increased the projected benefit obligation and resulted primarily from a decrease in the discount rate from 4.80% in fiscal 2022 to 4.50% in fiscal 2023.
Changes in the PBO and fair value of plan assets for the Plan for the period from December 25, 2021 to December 31, 2022 were as follows:
| | | | | | | | | |
|
| Projected |
| | |
| | | |
| | Benefit | | Plan | | Funded | |||
| | Obligation | | Assets | | Status | |||
Fair value as of December 25, 2021 | | $ | 761,706 | | $ | 761,170 | | $ | (536) |
Employer contributions | | | — | | | 17,155 | |
| |
Interest cost |
| | 12,551 |
| | — |
| |
|
Actual return on plan assets |
| | — |
| | (228,493) |
| |
|
Benefits paid |
| | (20,175) |
| | (20,175) |
| |
|
Actuarial gain |
| | (248,252) |
| | — |
| |
|
Currency translation |
| | (70,119) |
| | (69,730) |
| |
|
Fair value as of December 31, 2022 | | $ | 435,711 | | $ | 459,927 | | $ | 24,216 |
The actuarial gain decreased the project benefit obligation and resulted from an increase in the discount rate from 1.90% in fiscal 2021 to 4.80% in fiscal 2022.
Pre-tax amounts recognized in accumulated other comprehensive income (loss) as of December 31, 202230, 2023 and December 25, 202131, 2022 consisted of actuarial gains (losses):losses, as follows:
| | | |
Balance as of December |
| $ |
|
|
|
| |
|
|
| |
|
|
| |
|
| (60,940) | |
Actuarial loss | |
| (2,915) |
| |
| 493 |
Currency translation gain | |
| 5,451 |
Balance as of December 31, 2022 | | (57,911) | |
Actuarial loss | | (28,071) | |
Amortization of prior service costs | | 498 | |
Currency translation loss | | (3,667) | |
Balance as of December 30, 2023 | | $ |
|
71
VALMONT INDUSTRIES, INC. AND SUBSIDIARIES
NOTES TO CONSOLIDATED FINANCIAL STATEMENTS
(Dollars in thousands, except per share amounts)
Assumptions—The weighted-average actuarial assumptions used to determine the benefit obligation atas of December 30, 2023 and December 31, 2022 and December 25, 2021 were as follows:
| | | | | | | | | | | | |
Percentages |
| 2022 |
| 2021 | ||||||||
|
| December 30, | | December 31, | ||||||||
| | 2023 |
| 2022 | ||||||||
Discount rate |
| 4.80 | % | | 1.90 | % |
| 4.50 | % | | 4.80 | % |
Salary increase |
| N/A |
| | N/A | |
| N/A |
| | N/A | |
CPI inflation |
| 2.35 | % | | 2.70 | % | ||||||
RPI inflation |
| 3.25 | % | | 3.30 | % | ||||||
Consumer Price Index ("CPI") inflation |
| 2.25 | % | | 2.35 | % | ||||||
Retail Price Index ("RPI") inflation |
| 3.05 | % | | 3.25 | % | ||||||
(19) DEFINED BENEFIT RETIREMENT PLAN – CONTINUED
Expense/Cost/(Benefit)
Pension benefitcost (benefit) is determined based uponon the annual service cost of benefits (the actuarial cost of benefits earned during a period) and the interest cost on those liabilities, less the expected return on plan assets. The interest cost component is calculated using the full yield curve approach to estimate the interest cost by applying the specific spot rates along the yield curve used to determine the present value of the benefit plan obligations to relevant cash outflows for the corresponding year. The expected long-term rate of return on plan assets is applied to the fair value of plan assets. Differences in actual experience in relation to assumptions are not recognized in net earnings immediately, but are deferred and, if necessary, amortized as pension expense.
cost.
The components of the net periodic pension benefitcost (benefit) for the fiscal years ended December 31, 202230, 2023 and December 25, 202131, 2022 were as follows:
| | | | | | |
Net periodic (benefit) expense: | | 2022 |
| 2021 | ||
Interest cost | | $ | 12,551 | | $ | 9,896 |
Expected return on plan assets | |
| (23,131) | |
| (27,763) |
Amortization of prior service cost | |
| 493 | |
| 550 |
Amortization of actuarial loss | |
| — | |
| 2,750 |
Net periodic benefit | | $ | (10,087) | | $ | (14,567) |
| | | | | | |
| | Fiscal Year Ended | ||||
| | December 30, | | December 31, | ||
| | 2023 |
| 2022 | ||
Interest cost | | $ | 21,555 | | $ | 12,551 |
Expected return on plan assets | |
| (21,804) | |
| (23,131) |
Amortization of prior service costs | |
| 498 | |
| 493 |
Net periodic pension cost (benefit) | | $ | 249 | | $ | (10,087) |
87Assumptions
Valmont Industries, Inc. and Subsidiaries
NOTES TO CONSOLIDATED FINANCIAL STATEMENTS – CONTINUED
Three-year period ended December 31, 2022
(Dollars in thousands, except per share amounts)
Assumptions—The weighted-average actuarial assumptions used to determine expense arethe cost (benefit) were as follows for the fiscal years 2022ended December 30, 2023 and 2021:December 31, 2022:
| | | | | | | | | | | | |
Percentages |
| 2022 | | 2021 | ||||||||
|
| December 30, | | December 31, | ||||||||
| | 2023 |
| 2022 | ||||||||
Discount rate for benefit obligations |
| 1.90 | % | | 1.40 | % |
| 4.80 | % | | 1.90 | % |
Discount rate for interest cost | | 1.80 | % | | 1.15 | % | | 4.90 | % | | 1.80 | % |
Expected return on plan assets |
| 3.48 | % | | 3.96 | % |
| 4.85 | % | | 3.48 | % |
CPI Inflation |
| 2.70 | % | | 2.00 | % | ||||||
RPI Inflation |
| 3.30 | % | | 2.90 | % | ||||||
CPI inflation |
| 2.35 | % | | 2.70 | % | ||||||
RPI inflation |
| 3.25 | % | | 3.30 | % | ||||||
The discount rate is based on the yields of AA-rated corporate bonds with durational periods similar to that of the pension liabilities. The expected return on plan assets is based on the asset allocation mix and the historical return, taking into account current and expected market conditions. The expected return ofon plan assets decreasedincreased from 3.96%3.48% to 3.48%4.85% for 2022fiscal 2023 as the investment composition has more liability matching versus return seekingreturn-seeking assets. Inflation is based on expected changes in the consumer price indexCPI or the retail price indexRPI in the U.K. depending on the relevant plan provisions.
Cash Contributions
The Company completed negotiations with Plan trustees in fiscal 2022 regarding annual funding for the Plan. The annual contributions into the Plan are $16,000 (/£approximately $16,700 (£13,100) per annum as part of the Plan’s recovery plan, along with a contribution to cover the administrative costs of the Plan of approximately $1,600 (/£$1,700 (£1,300) per annum. In Decemberthe fourth quarter of fiscal 2020, the Company made its required fiscal 2021 annual contribution in addition to the required fiscal 2020 annual contribution that was made earlier in fiscal 2020.
72
VALMONT INDUSTRIES, INC. AND SUBSIDIARIES
NOTES TO CONSOLIDATED FINANCIAL STATEMENTS
(Dollars in thousands, except per share amounts)
Benefit Payments
The following table details expected pension benefit payments for the fiscal years 20232024 through 2032:2033:
| | | | | | |
2023 |
| $ | 20,432 | |||
2024 | |
| 21,036 |
| $ | 21,641 |
2025 | |
| 21,641 | |
| 22,278 |
2026 | |
| 22,366 | |
| 23,042 |
2027 | |
| 22,970 | |
| 23,678 |
Years 2028 - 2032 | |
| 125,733 | |||
2028 | |
| 24,442 | |||
2029 - 2033 | |
| 133,540 | |||
88
Valmont Industries, Inc. and Subsidiaries
NOTES TO CONSOLIDATED FINANCIAL STATEMENTS – CONTINUED
Three-year period ended December 31, 2022
(Dollars in thousands, except per share amounts)
(19) DEFINED BENEFIT RETIREMENT PLAN – CONTINUED
Asset Allocation Strategy
The investment strategy for pension plan assets is to maintain a diversified portfolio consisting of
| ● | Long-term |
| ● | Common stock mutual funds in U.K. and non-U.K. companies, and |
| ● | Diversified growth funds, which are invested in a number of investments, including common stock, fixed income funds, properties, and commodities. |
The Plan, as required by U.K. law, has an independent trustee that sets investment policy. The general strategy is to invest approximately 50% of the assets of the planPlan in common stock mutual funds and diversified growth funds, with the remainder of the investments in long-term fixed income securities, including corporate bonds and index-linked U.K. gilts. The trustees regularly consult with representatives of the planPlan sponsor and independent advisors on such matters.
The pension plan investments are held in a trust. The weighted‑weighted average maturity of the corporate bond portfolio was 13 years atas of December 31, 2022.30, 2023.
Fair Value Measurements
The pension plan assets are valued at fair value. The following is a description of the valuation methodologies used for the investments measured at fair value, including the general classification of such instruments pursuant to the valuation hierarchy.
Leveraged Inflation-Linked Gilts (“LDIs”)—LDIsThese investments are a combination of U.K. government-backed securities (such as bonds or other fixed income securities issued directly by the U.K. Treasury) money market instruments, and derivatives combined to give leveraged exposure to changes in the U.K. long-term interest and inflation rates. These funds are expected to offset a proportion of the impact changes in the long-term interest and inflation rates in the U.K. have on the pension plan’s benefit plan obligation liability. The fair value recorded by the Plan is calculated using net asset value (“NAV”) for each investment.
Temporary Cash Investments—These investments consist of British pound sterling,pounds, reported in terms of U.S. dollars based on currency exchange rates readily available in active markets. These temporary cash investments are classified as Level 1 investments.
Corporate Bonds—Corporate bonds and debentures consist of fixed income securities issued by U.K. corporations. The fair value recorded by the Plan is calculated using NAV for each investment.
Corporate Stock—This investment category consists of common and preferred stock, including mutual funds, issued by U.K. and non-U.K. corporations. The fair value recorded by the Plan is calculated using NAV for each investment.
73
VALMONT INDUSTRIES, INC. AND SUBSIDIARIES
NOTES TO CONSOLIDATED FINANCIAL STATEMENTS
(Dollars in thousands, except per share amounts)
Secured Income Asset (“SIA”) Funds—This investment category consists of holdings which willthat have a high level of expected inflation linkage. Examples of underlying assetsasset classes are rental streams and infrastructure debt. Due to the private nature of these investments, pricing inputs are not readily observable. Asset valuations are developed by the fund manager. These valuations are based on the application of public market multiples to private company cash flows, market transactions that provide valuation information for comparable companies, and other methods. The fair value recorded by the Plan is calculated using NAV.
As of December 30, 2023 and December 31, 2022, the pension plan assets measured at fair value on a recurring basis were as follows:
| | | | | | | | | | | | |
| | Fair Value Measurement Using: | | | | |||||||
December 30, 2023 | | Level 1 | | Level 2 | | | Level 3 | | Total | |||
Plan assets at fair value: |
| |
|
| |
|
| |
|
| |
|
Temporary cash investments | | $ | 7,077 | | $ | — | | $ | — | | $ | 7,077 |
Plan assets at NAV: | |
|
| |
|
| |
|
| |
|
|
Leveraged inflation-linked gilt funds | | | | |
|
| |
|
| |
| 216,405 |
Corporate bonds | | | | |
|
| |
|
| |
| 74,440 |
Corporate stock | | | | |
|
| |
|
| |
| 72,548 |
Secured income asset funds | | | | |
|
| |
|
| |
| 122,697 |
Total plan assets at NAV | | | | |
|
| |
|
| |
| 486,090 |
Total plan assets | | | | |
|
| |
|
| | $ | 493,167 |
| | | | | | | | | | | | |
| | Fair Value Measurement Using: | | | | |||||||
December 31, 2022 | | Level 1 | | Level 2 | | | Level 3 | | Total | |||
Plan assets at fair value: |
| |
|
| |
|
| |
|
| |
|
Temporary cash investments | | $ | 5,916 | | $ | — | | $ | — | | $ | 5,916 |
Plan assets at NAV: | |
|
| |
|
| |
|
| |
|
|
Leveraged inflation-linked gilt funds | | | | |
|
| |
|
| |
| 206,555 |
Corporate bonds | | | | |
|
| |
|
| |
| 63,953 |
Corporate stock | | | | |
|
| |
|
| |
| 55,379 |
Secured income asset funds | | | | |
|
| |
|
| |
| 128,124 |
Total plan assets at NAV | | | | |
|
| |
|
| |
| 454,011 |
Total plan assets | | | | |
|
| |
|
| | $ | 459,927 |
(20) LEASES
The Company has operating leases for plant locations, corporate offices, sales offices, and certain equipment. Outstanding leases as of December 30, 2023 have remaining lease terms of one year to twenty-three years, some of which include options to extend leases for up to ten years. The Company does not have any financing leases. The Company elected to not separate lease and non-lease components for all classes of underlying assets.
The Company determines if an arrangement is a lease at inception. Operating leases are included in “Other non-current assets”, “Other accrued expenses”, and “Operating lease liabilities” in the Consolidated Balance Sheets. ROU assets represent the right to use an underlying asset for the lease term and lease liabilities represent the obligation to make future lease payments arising from the lease. Operating lease ROU assets and liabilities are recognized at the commencement date based on the present value of lease payments over the lease term. The Company used its collateralized incremental borrowing rate in determining the present value of future lease payments. The operating lease ROU assets are adjusted for any lease payments made, lease incentives, and impairments. The lease terms for some of the Company’s facility leases include options to extend the lease when it is reasonably certain that the option will be exercised. Lease expense is recognized on a straight-line basis over the lease term.
8974
Valmont Industries, Inc. and SubsidiariesVALMONT INDUSTRIES, INC. AND SUBSIDIARIES
NOTES TO CONSOLIDATED FINANCIAL STATEMENTS – CONTINUED
Three-year period ended December 31, 2022
(Dollars in thousands, except per share amounts)
(19) DEFINED BENEFIT RETIREMENT PLAN – CONTINUED
At December 31, 2022 and December 25, 2021, the pension plan assets measured at fair value on a recurring basis were as follows:
| | | | | | | | | | | | |
|
| Quoted Prices in |
| Significant Other |
| Significant |
| | | |||
| | Active Markets | | Observable | | Unobservable | | | | |||
| | for Identical | | Inputs | | Inputs | | | | |||
December 31, 2022 | | Inputs (Level 1) | | (Level 2) | | (Level 3) | | Total | ||||
Plan assets at fair value: |
| |
|
| |
|
| |
|
| |
|
Temporary cash investments | | $ | 5,916 | | $ | — | | $ | — | | $ | 5,916 |
Total plan net assets at fair value | | $ | 5,916 | | $ | — | | $ | — | | $ | 5,916 |
Plan assets at NAV: | |
|
| |
|
| |
|
| |
|
|
Leveraged inflation-linked gilt funds | | | | |
|
| |
|
| |
| 206,555 |
Corporate bonds | | | | |
|
| |
|
| |
| 63,953 |
Corporate stock | | | | |
|
| |
|
| |
| 55,379 |
Secured income asset funds | | | | |
|
| |
|
| |
| 128,124 |
Total plan assets at NAV | | | | |
|
| |
|
| |
| 454,011 |
Total plan assets | | | | |
|
| |
|
| | $ | 459,927 |
| | | | | | | | | | | | |
|
| Quoted Prices in |
| Significant Other |
| Significant |
| | | |||
| | Active Markets | | Observable | | Unobservable | | | | |||
| | for Identical | | Inputs | | Inputs | | | | |||
December 25, 2021 | | Inputs (Level 1) | | (Level 2) | | | (Level 3) | | Total | |||
Plan assets at fair value: |
| |
|
| |
|
| |
|
| |
|
Temporary cash investments | | $ | 14,000 | | $ | — | | $ | — | | $ | 14,000 |
Total plan net assets at fair value | | $ | 14,000 | | $ | — | | $ | — | | $ | 14,000 |
Plan assets at NAV: | |
|
| |
|
| |
|
| |
|
|
Leveraged inflation-linked gilt funds | | | | |
|
| |
|
| |
| 283,288 |
Corporate bonds | | | | |
|
| |
|
| |
| 107,945 |
Corporate stock | | | | |
|
| |
|
| |
| 212,730 |
Secured income asset funds | | | | |
|
| |
|
| |
| 143,207 |
Total plan assets at NAV | | | | |
|
| |
|
| |
| 747,170 |
Total plan assets | | | | |
|
| |
|
| | $ | 761,170 |
(20) LEASES
The Company has operating leases for plant locations, corporate offices, sales offices, and certain equipment. Outstanding leases at December 31, 2022 have remaining lease terms of one year to twenty-five years, some of which include options to extend leases for up to ten years. The Company does not have any financing leases. The Company elected practical expedients not to reassess whether existing contracts are or contain leases, to not reassess the lease classification of any existing leases, to not reassess initial direct costs for any existing leases, to use hindsight in determining the lease term and in assessing impairment of the right-of-use asset, and to not separate lease and non-lease components for all classes of underlying assets.
The Company determines if an arrangement is a lease at inception. Operating leases are included in “Other assets”, “Other accrued expenses”, and “Operating lease liabilities” in the Consolidated Balance Sheets. ROU assets represent the right to use an underlying asset for the lease term and lease liabilities represent the obligation to make future lease payments arising from the lease.
90
Valmont Industries, Inc. and Subsidiaries
NOTES TO CONSOLIDATED FINANCIAL STATEMENTS – CONTINUED
Three-year period ended December 31, 2022
(Dollars in thousands, except per share amounts)
Operating lease ROU assets and liabilities are recognized at commencement date based on the present value of lease payments over the lease term. The Company used its collateralized incremental borrowing rate in determining the present value of future lease payments. The operating lease ROU asset also includes any lease payments made and excludes any lease incentives and impairments. Some of the Company’s facility leases include options to extend the lease when it is reasonably certain that the option will be exercised. Lease expense is recognized on a straight-line basis over the lease term.
The Company commenced on a new corporate headquarters operating lease with straight-line annual expense of approximately $5,100, a 2% annual increase in lease payment, and a 25-year term during 2021. In recognition of this lease, an operating lease asset of $71,853 and an operating long-term liability of $71,196 was recognized.
(20) LEASES – CONTINUED
Lease cost and other information related to the Company’s operating leases atas of and for the fiscal year ended December 30, 2023 and December 31, 2022 and December 25, 2021 arewere as follows:
| | | | | | | | | | ||||||||
| | Fifty-three | | Fifty-two | | ||||||||||||
| | weeks ended | | weeks ended | | | | | | | | | |||||
| | December 31, | | December 25, | |
| December 30, | | December 31, | ||||||||
|
| 2022 | | 2021 | | | 2023 | | 2022 | ||||||||
Operating lease cost | | $ | 31,062 | | | $ | 27,421 | | | | $ | 33,714 | | $ | 31,062 | | |
| | | | | | | | | | | | | | | | | |
Operating cash outflows from operating leases | | $ | 33,150 |
| | $ | 27,793 | |
| | $ | 34,967 |
| | $ | 33,150 | |
ROU assets obtained in exchange for lease obligations | | $ | 27,480 |
| | $ | 86,481 | |
| | $ | 25,688 |
| | $ | 27,480 | |
Weighted average remaining lease term | |
| 17 years |
| |
| 17 years | |
| |
| 16 years |
| |
| 17 years | |
Weighted average discount rate | |
| 4.2 | % | |
| 4.0 | % | | |
| 4.4 | % | |
| 4.2 | % |
Operating lease cost includes approximately $1,600$1,900 for short-term lease costs and approximately $4,400$4,800 for variable lease payments in 2022.fiscal 2023.
Supplemental balance sheet information related to operating leases as of December 30, 2023 and December 31, 2022 and December 25, 2021 iswas as follows:
| | | | | | | | | | | | | | | | |
|
| |
| December 31, |
| December 25, | | | | December 30, | | December 31, | ||||
| | Classification | | 2022 | | 2021 | | Classification | | 2023 |
| 2022 | ||||
Operating lease assets |
| Other assets | | $ | 162,930 | | $ | 152,664 |
| Other non-current assets | | $ | 171,616 | | $ | 162,930 |
| | | | | | | | | | | | | | | | |
Operating lease short-term liabilities |
| Other accrued expenses | |
| 16,857 | |
| 16,754 |
| Other accrued expenses | |
| 19,553 | |
| 16,857 |
Operating lease long-term liabilities |
| Operating lease liabilities | |
| 155,469 | |
| 147,759 |
| Operating lease liabilities | |
| 162,743 | |
| 155,469 |
Total lease liabilities | | | | $ | 172,326 | | $ | 164,513 | | | | $ | 182,296 | | $ | 172,326 |
91
Valmont Industries, Inc. and Subsidiaries
NOTES TO CONSOLIDATED FINANCIAL STATEMENTS – CONTINUED
Three-year period ended December 31, 2022
(Dollars in thousands, except per share amounts)
Minimum lease payments under operating leases expiring subsequent to December 31, 202230, 2023 are as follows:
| | | | | | |
Fiscal year ending: |
|
| |
| | |
2023 | | $ | 23,815 | |||
2024 | |
| 20,689 | | $ | 27,924 |
2025 | |
| 19,615 | |
| 26,507 |
2026 | |
| 17,333 | |
| 22,613 |
2027 | |
| 13,924 | |
| 17,288 |
2028 | |
| 15,384 | |||
Subsequent | |
| 147,767 | |
| 140,573 |
Total minimum lease payments | | $ | 243,143 | | | 250,289 |
Less: Interest | | $ | 70,817 | | | 67,993 |
Present value of minimum lease payments | | $ | 172,326 | | $ | 182,296 |
92
Valmont Industries, Inc. and Subsidiaries
NOTES TO CONSOLIDATED FINANCIAL STATEMENTS – CONTINUED
Three-year period ended December 31, 2022
(Dollars in thousands, except per share amounts)
(21) BUSINESS SEGMENTS
During the first quarter of 2022, the Company’s CODM changed the Company’s management structure and began to manage the business, allocate resources, and evaluate performance based on the new structure. As a result, the Company has realigned to a two reportable segment structure organized by market dynamics (Infrastructure and Agriculture). Three operating segments resulted from the new management structure and two are aggregated into the Agriculture reportable segment. The Company considers gross profit margins, nature of products sold, nature of the production processes, type and class of customer, and methods used to distribute products when assessing aggregation of operating segments. The Infrastructure segment includes the previous reportable segments of Utility Support Structures, Engineered Support Structures, and Coatings. All prior period segment information has been recast to reflect this change in reportable segments.
The Company has two reportable segments based on its management structure. Each segment is global in nature with a manager responsible for segment operational performance and the allocation of capital within the segment. Net corporate expense is net of certain service‑related expenses that are allocated to business units generally based on the basis of employee headcounts and sales dollars.
Reportable segments are as follows:
INFRASTRUCTURE: This segment consists of the manufacture and distribution of products and solutions to serve the infrastructure markets of utility, renewable energy,solar, lighting, transportation, and telecommunications, andalong with coatings services to preserve medalprotect metal products.
AGRICULTURE: This segment consists of the manufacture of center pivot components and linear irrigation equipment for agricultural markets, including parts and tubular products, and advanced technology solutions for precision agriculture.
In addition to these two reportable segments, the Company had a business and related activities that is not more than 10% of consolidated sales, operating income or assets. This includes the offshore wind energy structures business and was reported in the “Other” segment until its divestiture in 2022.
The accounting policies of the reportable segments are the same as those described in Note 1. The Company evaluates the performance of its business segments based upon operating income and invested capital. The Company’s operating income for segment purposes excludes unallocated corporate general and administrative expenses, interest expense, non-operating income and deductions, or income taxes.
75
93
Valmont Industries, Inc. and SubsidiariesVALMONT INDUSTRIES, INC. AND SUBSIDIARIES
NOTES TO CONSOLIDATED FINANCIAL STATEMENTS – CONTINUED
Three-year period ended December 31, 2022
(Dollars in thousands, except per share amounts)
(21) BUSINESS SEGMENTS – CONTINUEDIn addition to these two reportable segments, the Company had a business and related activities in fiscal 2022 that were not more than 10% of consolidated sales, operating income, or assets. This business, the offshore wind energy structures business, was reported in the “Other” segment until its divestiture in the fourth quarter of fiscal 2022.
The accounting policies of the reportable segments are the same as those described in Note 1. The Company evaluates the performance of its reportable segments based on operating income and return on invested capital. The Company’s operating income for segment purposes excludes unallocated corporate general and administrative expenses, interest expense, non-operating income and deductions, or income taxes.
Summary by Business
| | | | | | | | | | |
| | | 2022 | | 2021 | | 2020 | |||
SALES: | | | | | | | | | | |
Infrastructure | | | $ | 2,928,419 | | $ | 2,372,100 | | $ | 2,141,741 |
Agriculture | | | | 1,346,672 | | | 1,028,717 | | | 645,831 |
Other | | | | 100,219 | | | 123,001 | | | 120,063 |
Total | | | | 4,375,310 | | | 3,523,818 | | | 2,907,635 |
INTERSEGMENT SALES: | | | | | | | | | | |
Infrastructure | | | | (18,673) | | | (10,576) | | | (6,541) |
Agriculture | | | | (11,387) | | | (11,667) | | | (5,739) |
Other | | | | — | | | — | | | — |
Total | | | | (30,060) | | | (22,243) | | | (12,280) |
NET SALES: | | | | | | | | | | |
Infrastructure | | | | 2,909,746 | | | 2,361,524 | | | 2,135,200 |
Agriculture | | | | 1,335,285 | | | 1,017,050 | | | 640,092 |
Other | | | | 100,219 | | | 123,001 | | | 120,063 |
Total | | | $ | 4,345,250 | | $ | 3,501,575 | | $ | 2,895,355 |
| | | | | | | | | | |
OPERATING INCOME (LOSS): | | | | | | | | | | |
Infrastructure | | | | 354,499 | | | 273,598 | | | 217,364 |
Agriculture | | | | 179,263 | | | 137,027 | | | 83,046 |
Other | | | | 2,259 | | | (40,192) | | | (8,192) |
Corporate | | | | (102,772) | | | (83,648) | | | (66,265) |
Total | | | $ | 433,249 | | $ | 286,785 | | $ | 225,953 |
| | | | | | | | | | | | | | | |
|
| Fifty-three weeks ended December 31, 2022 | |||||||||||||
| | Infrastructure |
| Agriculture | | Other |
| Intersegment Sales |
| Consolidated | |||||
Geographical market: | | |
|
| |
| | |
|
| |
|
| |
|
North America | | $ | 2,234,339 | | $ | 766,929 | | $ | — | | $ | (26,248) | | $ | 2,975,020 |
International | |
| 694,080 | |
| 579,743 | |
| 100,219 | |
| (3,812) | |
| 1,370,230 |
Total | | $ | 2,928,419 | | $ | 1,346,672 | | $ | 100,219 | | $ | (30,060) | | $ | 4,345,250 |
| | | | | | | | | | | | | | | |
Product line: | |
|
| |
|
| |
|
| |
|
| |
|
|
Transmission, Distribution, and Substation | | $ | 1,184,660 | | $ | — | | $ | — | | $ | — | | $ | 1,184,660 |
Lighting and Transportation | |
| 940,462 | |
| — | |
| — | |
| — | |
| 940,462 |
Coatings | |
| 356,707 | |
| — | |
| — | |
| (15,327) | |
| 341,380 |
Telecommunications | |
| 320,342 | |
| — | |
| — | |
| — | |
| 320,342 |
Renewable Energy | |
| 126,248 | |
| — | |
| 100,219 | |
| (3,346) | |
| 223,121 |
Irrigation Equipment and Parts, excluding Technology | |
| — | |
| 1,231,587 | |
| — | |
| (11,387) | |
| 1,220,200 |
Technology Products and Services | |
| — | |
| 115,085 | |
| — | |
| — | |
| 115,085 |
Total | | $ | 2,928,419 | | $ | 1,346,672 | | $ | 100,219 | | $ | (30,060) | | $ | 4,345,250 |
| | | | | | | | | |
|
| Fiscal Year Ended | |||||||
|
| December 30, |
| December 31, | | December 25, | |||
| | 2023 | | 2022 | | 2021 | |||
SALES: | | | | | | | | | |
Infrastructure | | $ | 3,010,067 | | $ | 2,928,419 | | $ | 2,372,100 |
Agriculture | | | 1,182,223 | | | 1,346,672 | | | 1,028,717 |
Other | | | — | | | 100,219 | | | 123,001 |
Total sales | | | 4,192,290 | | | 4,375,310 | | | 3,523,818 |
INTERSEGMENT SALES: | | | | | | | | | |
Infrastructure | | | (10,430) | | | (18,673) | | | (10,576) |
Agriculture | | | (7,262) | | | (11,387) | | | (11,667) |
Total intersegment sales | | | (17,692) | | | (30,060) | | | (22,243) |
NET SALES: | | | | | | | | | |
Infrastructure | | | 2,999,637 | | | 2,909,746 | | | 2,361,524 |
Agriculture | | | 1,174,961 | | | 1,335,285 | | | 1,017,050 |
Other | | | — | | | 100,219 | | | 123,001 |
Total net sales | | $ | 4,174,598 | | $ | 4,345,250 | | $ | 3,501,575 |
| | | | | | | | | |
OPERATING INCOME (LOSS): | | | | | | | | | |
Infrastructure | | | 396,253 | | | 354,499 | | | 273,598 |
Agriculture | | | 16,850 | | | 179,263 | | | 137,027 |
Other | | | — | | | 2,259 | | | (40,192) |
Corporate | | | (121,546) | | | (102,772) | | | (83,648) |
Total operating income | | $ | 291,557 | | $ | 433,249 | | $ | 286,785 |
9476
Valmont Industries, Inc. and SubsidiariesVALMONT INDUSTRIES, INC. AND SUBSIDIARIES
NOTES TO CONSOLIDATED FINANCIAL STATEMENTS – CONTINUED
Three-year period ended December 31, 2022
(Dollars in thousands, except per share amounts)
(21) BUSINESS SEGMENTS – CONTINUED
| | | | | | | | | | | | | | | |
|
| Fifty-two weeks ended December 25, 2021 | |||||||||||||
| | Infrastructure |
| Agriculture | | Other |
| Intersegment Sales |
| Consolidated | |||||
Geographical market: | | |
|
| |
| | |
|
| |
|
| |
|
North America | | $ | 1,724,531 | | $ | 545,574 | | $ | — | | $ | (22,243) | | $ | 2,247,862 |
International | |
| 647,569 | |
| 483,143 | |
| 123,001 | |
| — | |
| 1,253,713 |
Total | | $ | 2,372,100 | | $ | 1,028,717 | | $ | 123,001 | | $ | (22,243) | | $ | 3,501,575 |
| | | | | | | | | | | | | | | |
Product line: | |
|
| |
|
| |
|
| |
|
| |
|
|
Transmission, Distribution, and Substation | | $ | 935,099 | | $ | — | | $ | — | | $ | — | | $ | 935,099 |
Lighting and Transportation | |
| 825,923 | |
| — | |
| — | |
| — | |
| 825,923 |
Coatings | |
| 309,647 | |
| — | |
| — | |
| (10,575) | |
| 299,072 |
Telecommunications | |
| 238,527 | |
| — | |
| — | |
| — | |
| 238,527 |
Renewable Energy | |
| 62,904 | |
| — | |
| 123,001 | |
| — | |
| 185,905 |
Irrigation Equipment and Parts, excluding Technology | |
| — | |
| 930,858 | |
| — | |
| (11,668) | |
| 919,190 |
Technology Products and Services | |
| — | |
| 97,859 | |
| — | |
| — | |
| 97,859 |
Total | | $ | 2,372,100 | | $ | 1,028,717 | | $ | 123,001 | | $ | (22,243) | | $ | 3,501,575 |
| | | | | | | | | | | | | | | |
|
| Fifty-two weeks ended December 26, 2020 | |||||||||||||
| | Infrastructure |
| Agriculture | | Other |
| Intersegment Sales |
| Consolidated | |||||
Geographical market: | | |
|
| |
| | |
|
| |
|
| |
|
North America | | $ | 1,574,802 | | $ | 378,424 | | $ | — | | $ | (12,280) | | $ | 1,940,946 |
International | |
| 566,939 | |
| 267,407 | |
| 120,063 | |
| — | |
| 954,409 |
Total | | $ | 2,141,741 | | $ | 645,831 | | $ | 120,063 | | $ | (12,280) | | $ | 2,895,355 |
| | | | | | | | | | | | | | | |
Product line: | |
|
| |
|
| |
|
| |
|
| |
|
|
Transmission, Distribution, and Substation | | $ | 795,693 | | $ | — | | $ | — | | $ | — | | $ | 795,693 |
Lighting and Transportation | |
| 797,335 | |
| — | |
| — | |
| — | |
| 797,335 |
Coatings | |
| 276,087 | |
| — | |
| — | |
| (6,541) | |
| 269,546 |
Telecommunications | |
| 186,244 | |
| — | |
| — | |
| — | |
| 186,244 |
Renewable Energy | |
| 86,382 | |
| — | |
| 120,063 | |
| — | |
| 206,445 |
Irrigation Equipment and Parts, excluding Technology | |
| — | |
| 578,686 | |
| — | |
| (5,739) | |
| 572,947 |
Technology Products and Services | |
| — | |
| 67,145 | |
| — | |
| — | |
| 67,145 |
Total | | $ | 2,141,741 | | $ | 645,831 | | $ | 120,063 | | $ | (12,280) | | $ | 2,895,355 |
95
Valmont Industries, Inc. and Subsidiaries
NOTES TO CONSOLIDATED FINANCIAL STATEMENTS – CONTINUED
Three-year period ended December 31, 2022
(Dollars in thousands, except per share amounts)
| | | | | | | | | |
|
| 2022 |
| 2021 |
| 2020 | |||
OPERATING INCOME (LOSS): | | | | | | | | | |
Infrastructure | | $ | 354,499 | | $ | 273,598 | | $ | 217,364 |
Agriculture | |
| 179,263 | |
| 137,027 | |
| 83,046 |
Other | | | 2,259 | | | (40,192) | | | (8,192) |
Corporate | |
| (102,772) | |
| (83,648) | |
| (66,265) |
Total | |
| 433,249 | |
| 286,785 | |
| 225,953 |
Interest expense, net | |
| (45,519) | |
| (41,420) | |
| (38,701) |
Loss from divestiture of wind energy structures business | | | (33,273) | |
| — | |
| — |
Other | |
| 9,431 | |
| 14,718 | |
| 5,516 |
Earnings before income taxes and equity in earnings of nonconsolidated subsidiaries | | $ | 363,888 | | $ | 260,083 | | $ | 192,768 |
| | | | | | | | | | | | |
|
| Fiscal year ended December 30, 2023 | ||||||||||
| | Infrastructure |
| Agriculture |
| Intersegment |
| Consolidated | ||||
Geographical market: | | |
|
| |
|
| |
|
| |
|
North America | | $ | 2,318,801 | | $ | 587,056 | | $ | (16,282) | | $ | 2,889,575 |
International | |
| 691,266 | |
| 595,167 | |
| (1,410) | |
| 1,285,023 |
Total sales | | $ | 3,010,067 | | $ | 1,182,223 | | $ | (17,692) | | $ | 4,174,598 |
| | | | | | | | | | | | |
Product line: | |
|
| |
|
| |
|
| |
|
|
Transmission, Distribution, and Substation | | $ | 1,243,768 | | $ | — | | $ | — | | $ | 1,243,768 |
Lighting and Transportation | |
| 964,072 | |
| — | |
| — | |
| 964,072 |
Coatings | |
| 354,330 | |
| — | |
| (9,020) | |
| 345,310 |
Telecommunications | |
| 252,165 | |
| — | |
| — | |
| 252,165 |
Solar | |
| 195,732 | |
| — | |
| (1,410) | |
| 194,322 |
Irrigation Equipment and Parts | |
| — | |
| 1,069,425 | |
| (7,262) | |
| 1,062,163 |
Technology Products and Services | |
| — | |
| 112,798 | |
| — | |
| 112,798 |
Total sales | | $ | 3,010,067 | | $ | 1,182,223 | | $ | (17,692) | | $ | 4,174,598 |
| | | | | | | | | | | | | | | |
|
| Fiscal year ended December 31, 2022 | |||||||||||||
| | Infrastructure |
| Agriculture | | Other |
| Intersegment |
| Consolidated | |||||
Geographical market: | | |
|
| |
| | |
|
| |
|
| |
|
North America | | $ | 2,234,339 | | $ | 766,929 | | $ | — | | $ | (26,248) | | $ | 2,975,020 |
International | |
| 694,080 | |
| 579,743 | |
| 100,219 | |
| (3,812) | |
| 1,370,230 |
Total sales | | $ | 2,928,419 | | $ | 1,346,672 | | $ | 100,219 | | $ | (30,060) | | $ | 4,345,250 |
| | | | | | | | | | | | | | | |
Product line: | |
|
| |
|
| |
|
| |
|
| |
|
|
Transmission, Distribution, and Substation | | $ | 1,184,660 | | $ | — | | $ | — | | $ | — | | $ | 1,184,660 |
Lighting and Transportation | |
| 940,462 | |
| — | |
| — | |
| — | |
| 940,462 |
Coatings | |
| 356,707 | |
| — | |
| — | |
| (15,327) | |
| 341,380 |
Telecommunications | |
| 320,342 | |
| — | |
| — | |
| — | |
| 320,342 |
Solar | |
| 126,248 | |
| — | |
| — | |
| (3,346) | |
| 122,902 |
Irrigation Equipment and Parts | |
| — | |
| 1,231,587 | |
| — | |
| (11,387) | |
| 1,220,200 |
Technology Products and Services | |
| — | |
| 115,085 | |
| — | |
| — | |
| 115,085 |
Other | | | — | |
| — | |
| 100,219 | |
| — | |
| 100,219 |
Total sales | | $ | 2,928,419 | | $ | 1,346,672 | | $ | 100,219 | | $ | (30,060) | | $ | 4,345,250 |
| | | | | | | | | | | | | | | |
|
| Fiscal year ended December 25, 2021 | |||||||||||||
| | Infrastructure |
| Agriculture | | Other |
| Intersegment |
| Consolidated | |||||
Geographical market: | | |
|
| |
| | |
|
| |
|
| |
|
North America | | $ | 1,724,531 | | $ | 545,574 | | $ | — | | $ | (22,243) | | $ | 2,247,862 |
International | |
| 647,569 | |
| 483,143 | |
| 123,001 | |
| — | |
| 1,253,713 |
Total sales | | $ | 2,372,100 | | $ | 1,028,717 | | $ | 123,001 | | $ | (22,243) | | $ | 3,501,575 |
| | | | | | | | | | | | | | | |
Product line: | |
|
| |
|
| |
|
| |
|
| |
|
|
Transmission, Distribution, and Substation | | $ | 935,099 | | $ | — | | $ | — | | $ | — | | $ | 935,099 |
Lighting and Transportation | |
| 825,923 | |
| — | |
| — | |
| — | |
| 825,923 |
Coatings | |
| 309,647 | |
| — | |
| — | |
| (10,575) | |
| 299,072 |
Telecommunications | |
| 238,527 | |
| — | |
| — | |
| — | |
| 238,527 |
Solar | |
| 62,904 | |
| — | |
| — | |
| — | |
| 62,904 |
Irrigation Equipment and Parts | |
| — | |
| 930,858 | |
| — | |
| (11,668) | |
| 919,190 |
Technology Products and Services | |
| — | |
| 97,859 | |
| — | |
| — | |
| 97,859 |
Other | | | — | |
| — | |
| 123,001 | |
| — | |
| 123,001 |
Total sales | | $ | 2,372,100 | | $ | 1,028,717 | | $ | 123,001 | | $ | (22,243) | | $ | 3,501,575 |
9677
Valmont Industries, Inc. and SubsidiariesVALMONT INDUSTRIES, INC. AND SUBSIDIARIES
NOTES TO CONSOLIDATED FINANCIAL STATEMENTS – CONTINUED
Three-year period ended December 31, 2022
(Dollars in thousands, except per share amounts)
(21) BUSINESS SEGMENTS – CONTINUED
| | | | | | | | | |
|
| 2022 |
| 2021 |
| 2020 | |||
TOTAL ASSETS: | |
|
| |
|
| |
|
|
Infrastructure | | $ | 2,267,800 | | $ | 2,102,851 | | $ | 1,933,970 |
Agriculture | |
| 1,112,588 | |
| 1,027,272 | |
| 465,322 |
Other | | | — | | | 67,592 | | | 137,316 |
Corporate | |
| 176,608 | |
| 249,534 | |
| 416,552 |
Total | | $ | 3,556,996 | | $ | 3,447,249 | | $ | 2,953,160 |
| | | | | | | | | |
|
| Fiscal Year Ended | |||||||
| | December 30, | | December 31, | | December 25, | |||
| | 2023 |
| 2022 |
| 2021 | |||
EARNINGS BEFORE INCOME TAXES AND EQUITY IN LOSS OF NONCONSOLIDATED SUBSIDIARIES: | | | | | | | | | |
Infrastructure | | $ | 396,253 | | $ | 354,499 | | $ | 273,598 |
Agriculture | |
| 16,850 | |
| 179,263 | |
| 137,027 |
Other | | | — | | | 2,259 | | | (40,192) |
Corporate | |
| (121,546) | |
| (102,772) | |
| (83,648) |
Total operating income | |
| 291,557 | |
| 433,249 | |
| 286,785 |
Interest expense, net | |
| (50,578) | |
| (45,519) | |
| (41,420) |
Other income (expenses) | |
| (4,527) | |
| (23,842) | |
| 14,718 |
Earnings before income taxes and equity in loss of nonconsolidated subsidiaries | | $ | 236,452 | | $ | 363,888 | | $ | 260,083 |
| | | | | | | | | | | | | | | | | | |
|
| 2022 |
| 2021 |
| 2020 |
| December 30, | | December 31, | | December 25, | ||||||
CAPITAL EXPENDITURES: | | | | | | | | | | |||||||||
| | 2023 |
| 2022 |
| 2021 | ||||||||||||
ASSETS: | |
|
| |
|
| |
|
| |||||||||
Infrastructure |
| $ | 53,228 |
| $ | 72,129 |
| $ | 81,074 | | $ | 2,249,132 | | $ | 2,267,800 | | $ | 2,102,851 |
Agriculture |
| | 32,886 |
| | 17,509 |
| | 16,740 | |
| 978,590 | |
| 1,112,588 | |
| 1,027,272 |
Other | | | — | | | 345 | | | — | | | — | | | — | | | 67,592 |
Corporate |
| | 7,174 |
| | 17,807 |
| | 8,886 | |
| 249,726 | |
| 176,608 | |
| 249,534 |
Total | | $ | 93,288 | | $ | 107,790 | | $ | 106,700 | |||||||||
Total assets | | $ | 3,477,448 | | $ | 3,556,996 | | $ | 3,447,249 | |||||||||
| | | | | | | | | | | | | | | | | | |
|
| 2022 |
| 2021 |
| 2020 |
| Fiscal Year Ended | ||||||||||
DEPRECIATION AND AMORTIZATION: | | | | | | | | | | |||||||||
| | December 30, | | December 31, | | December 25, | ||||||||||||
| | 2023 |
| 2022 |
| 2021 | ||||||||||||
CAPITAL EXPENDITURES: | | | | | | | | | | |||||||||
Infrastructure | | $ | 62,398 | | $ | 59,748 | | $ | 58,985 |
| $ | 68,295 |
| $ | 53,228 |
| $ | 72,129 |
Agriculture | |
| 23,681 | |
| 17,813 | |
| 12,098 |
| | 10,890 |
| | 32,886 |
| | 17,509 |
Other | | | 1,393 | | | 5,988 | | | 5,848 | | | — | | | — | | | 345 |
Corporate | |
| 9,695 | |
| 9,028 | |
| 5,961 |
| | 17,586 |
| | 7,174 |
| | 17,807 |
Total | | $ | 97,167 | | $ | 92,577 | | $ | 82,892 | |||||||||
Total capital expenditures | | $ | 96,771 | | $ | 93,288 | | $ | 107,790 | |||||||||
Summary by Geographical Area by Location of Valmont Facilities:
| | | | | | | | | |
|
| 2022 |
| 2021 |
| 2020 | |||
NET SALES: | | | | | | | | | |
United States | | $ | 2,965,673 | | $ | 2,260,198 | | $ | 1,919,136 |
Australia | |
| 292,072 | |
| 297,720 | |
| 252,253 |
Brazil | |
| 354,497 | |
| 200,402 | |
| 103,591 |
Denmark | |
| 100,219 | |
| 123,001 | |
| 120,063 |
Other | |
| 632,789 | |
| 620,254 | |
| 500,312 |
Total | | $ | 4,345,250 | | $ | 3,501,575 | | $ | 2,895,355 |
| | | | | | | | | |
LONG-LIVED ASSETS: | |
|
| |
|
| |
|
|
United States | | $ | 1,246,956 | | $ | 1,172,552 | | $ | 748,886 |
Australia | |
| 82,290 | |
| 173,240 | |
| 179,673 |
Brazil | |
| 42,259 | |
| 28,583 | |
| 17,151 |
Denmark | |
| — | |
| 21,232 | |
| 61,546 |
Other | |
| 404,906 | |
| 338,879 | |
| 391,279 |
Total | | $ | 1,776,411 | | $ | 1,734,486 | | $ | 1,398,535 |
| | | | | | | | | |
|
| Fiscal Year Ended | |||||||
| | December 30, | | December 31, | | December 25, | |||
| | 2023 |
| 2022 |
| 2021 | |||
DEPRECIATION AND AMORTIZATION: | | | | | | | | | |
Infrastructure | | $ | 64,654 | | $ | 62,398 | | $ | 59,748 |
Agriculture | |
| 23,409 | |
| 23,681 | |
| 17,813 |
Other | | | — | | | 1,393 | | | 5,988 |
Corporate | |
| 10,645 | |
| 9,695 | |
| 9,028 |
Total depreciation and amortization expense | | $ | 98,708 | | $ | 97,167 | | $ | 92,577 |
9778
Valmont Industries, Inc. and SubsidiariesVALMONT INDUSTRIES, INC. AND SUBSIDIARIES
NOTES TO CONSOLIDATED FINANCIAL STATEMENTS – CONTINUED
Three-year period ended December 31, 2022
(Dollars in thousands, except per share amounts)
| | | | | | | | | |
|
| Fiscal Year Ended | |||||||
| | December 30, | | December 31, | | December 25, | |||
| | 2023 |
| 2022 |
| 2021 | |||
NET SALES: | | | | | | | | | |
United States | | $ | 2,860,951 | | $ | 2,965,673 | | $ | 2,260,198 |
Australia | |
| 313,075 | |
| 292,072 | |
| 297,720 |
Brazil | |
| 311,367 | |
| 354,497 | |
| 200,402 |
Denmark | |
| — | |
| 100,219 | |
| 123,001 |
Other | |
| 689,205 | |
| 632,789 | |
| 620,254 |
Total net sales | | $ | 4,174,598 | | $ | 4,345,250 | | $ | 3,501,575 |
| | | | | | | | | |
|
| December 30, | | December 31, | | December 25, | |||
| | 2023 |
| 2022 |
| 2021 | |||
LONG-LIVED ASSETS: | |
|
| |
|
| |
|
|
United States | | $ | 1,116,962 | | $ | 1,246,956 | | $ | 1,172,552 |
Australia | |
| 103,847 | |
| 82,290 | |
| 173,240 |
Brazil | |
| 60,937 | |
| 42,259 | |
| 28,583 |
Denmark | |
| — | |
| — | |
| 21,232 |
Other | |
| 408,073 | |
| 404,906 | |
| 338,879 |
Total long-lived assets | | $ | 1,689,819 | | $ | 1,776,411 | | $ | 1,734,486 |
No single customer accounted for more than 10% of net sales in fiscal 2023, 2022, 2021, or 2020.2021. Net sales by geographical area are based on the location of the facility producing the sales and do not include sales to other operating units of the Company. Brazil and Australia each accounted for approximately 8% and 7% of the Company’s net sales in 2022, respectively;fiscal 2023; no other foreign country accounted for more than 3%4% of the Company’s net sales.
Operating income by business segment areis based on net sales less identifiable operating expenses and allocations and includes profits recorded on sales to other operating units of the Company. Long-lived assets consist of property, plant, and equipment, net of depreciation, goodwill,depreciation; goodwill; other intangible assets, net of amortization; and other non-current assets. Long-lived assets by geographical area are based on the location of facilities.
9879
ITEM 9. CHANGES IN AND DISAGREEMENTS WITH ACCOUNTANTS ON ACCOUNTING AND FINANCIAL DISCLOSURE.
DISCLOSURE
None.
ITEM 9A. CONTROLS AND PROCEDURES.PROCEDURES
The Company carried out an evaluation, under the supervision and with the participation of the Company’s management, including the Company’s Chief Executive Officer and Chief Financial Officer, of the effectiveness of the design and operation of the Company’s disclosure controls and procedures pursuant toas defined in Rule 13a-15(e) under the Securities Exchange Act Rule 13a-15.of 1934, as amended. Based upon that evaluation, the Chief Executive Officer and Chief Financial Officer concluded that, as of the end of the period covered by this report, the Company’s disclosure controls and procedures are effective to providein providing reasonable assurance that information required to be disclosed by the Company in the reports the Company files or submits under the Securities Exchange Act of 1934 is (1) accumulated and communicated to management, including the Company’s Chief Executive Officer and Chief Financial Officer, to allow timely decisions regarding required disclosures and (2) recorded, processed, summarized, and reported within the time periods specified in the Commission’s rules and forms.
MANAGEMENT’S REPORT ON INTERNAL CONTROL OVER FINANCIAL REPORTINGManagement’s Annual Report on Internal Control Over Financial Reporting
The Company’s management is responsible for establishing and maintaining adequate internal control over financial reporting as such term is defined in Rule 13a-15(f) under the Securities Exchange Act Rule 13a-15(f).of 1934, as amended. The Company carried out an evaluation under the supervision and with the participation of the Company’s management, including the Company’s Chief Executive Officer and Chief Financial Officer, of the effectiveness of the Company’s internal control over financial reporting. The Company’s management used the frameworkcriteria established in Internal Control—Integrated Framework (2013), issued by the Committee of Sponsoring Organizations (“COSO”)of the Treadway Commission, to perform this evaluation. Based on that evaluation, the Company’s management concluded that the Company’s internal control over financial reporting was effective as of December 31, 2022.30, 2023.
The effectiveness of the Company’s internal control over financial reporting as of December 31, 202230, 2023 has been audited by Deloitte & Touche LLP, an independent registered public accounting firm, as stated in their report, a copy of which is included in this Annual Reportannual report on Form 10-K.
9980
REPORT OF INDEPENDENT REGISTERED PUBLIC ACCOUNTING FIRM
To the shareholders and the Board of Directors of Valmont Industries, Inc.
Opinion on Internal Control over Financial Reporting
We have audited the internal control over financial reporting of Valmont Industries, Inc. and subsidiaries (the “Company”) as of December 31, 2022,30, 2023, based on criteria established in Internal Control — Integrated Framework (2013) issued by the Committee of Sponsoring Organizations of the Treadway Commission (COSO). In our opinion, the Company maintained, in all material respects, effective internal control over financial reporting as of December 31, 2022,30, 2023, based on criteria established in Internal Control — Integrated Framework (2013) issued by COSO.
We have also audited, in accordance with the standards of the Public Company Accounting Oversight Board (United States) (PCAOB), the consolidated financial statements as of and for the year ended December 31, 2022,30, 2023, of the Company and our report dated March 1, 2023,February 28, 2024, expressed an unqualified opinion on those financial statements.
Basis for Opinion
The Company’s management is responsible for maintaining effective internal control over financial reporting and for its assessment of the effectiveness of internal control over financial reporting, included in the accompanying Management’s Report on Internal Control Over Financial Reporting. Our responsibility is to express an opinion on the Company’s internal control over financial reporting based on our audit. We are a public accounting firm registered with the PCAOB and are required to be independent with respect to the Company in accordance with the U.S. federal securities laws and the applicable rules and regulations of the Securities and Exchange Commission and the PCAOB.
We conducted our audit in accordance with the standards of the PCAOB. Those standards require that we plan and perform the audit to obtain reasonable assurance about whether effective internal control over financial reporting was maintained in all material respects. Our audit included obtaining an understanding of internal control over financial reporting, assessing the risk that a material weakness exists, testing and evaluating the design and operating effectiveness of internal control based on the assessed risk, and performing such other procedures as we considered necessary in the circumstances. We believe that our audit provides a reasonable basis for our opinion.
Definition and Limitations of Internal Control over Financial Reporting
A company’s internal control over financial reporting is a process designed to provide reasonable assurance regarding the reliability of financial reporting and the preparation of financial statements for external purposes in accordance with generally accepted accounting principles. A company’s internal control over financial reporting includes those policies and procedures that (1) pertain to the maintenance of records that, in reasonable detail, accurately and fairly reflect the transactions and dispositions of the assets of the company; (2) provide reasonable assurance that transactions are recorded as necessary to permit preparation of financial statements in accordance with generally accepted accounting principles, and that receipts and expenditures of the company are being made only in accordance with authorizations of management and directors of the company; and (3) provide reasonable assurance regarding prevention or timely detection of unauthorized acquisition, use, or disposition of the company’s assets that could have a material effect on the financial statements.
Because of its inherent limitations, internal control over financial reporting may not prevent or detect misstatements. Also, projections of any evaluation of effectiveness to future periods are subject to the risk that controls may become inadequate because of changes in conditions, or that the degree of compliance with the policies or procedures may deteriorate.
/s/ DELOITTE & TOUCHE LLP
Omaha, Nebraska
March 1, 2023
February 28, 2024
10081
ITEM 9B. OTHER INFORMATION.INFORMATION
Shareholder Return Performance Graphs
The graphs below compare the yearlyannual change in the cumulative total shareholder return on the Company’s common stock with the cumulative total returns of the S&P Mid CapMidCap 400 Index and the S&P Mid Cap 400 Industrial Machinery & Supplies & Components Index for the five and ten-year periods ended December 31, 2022.30, 2023. The Company was added to these indexes in 2009 by Standard & Poor’s.S&P Global Ratings. The graphs assume that the beginning value of the investment in Valmont Common StockIndustries, Inc. common stock and each index was $100 and that all dividends were reinvested.
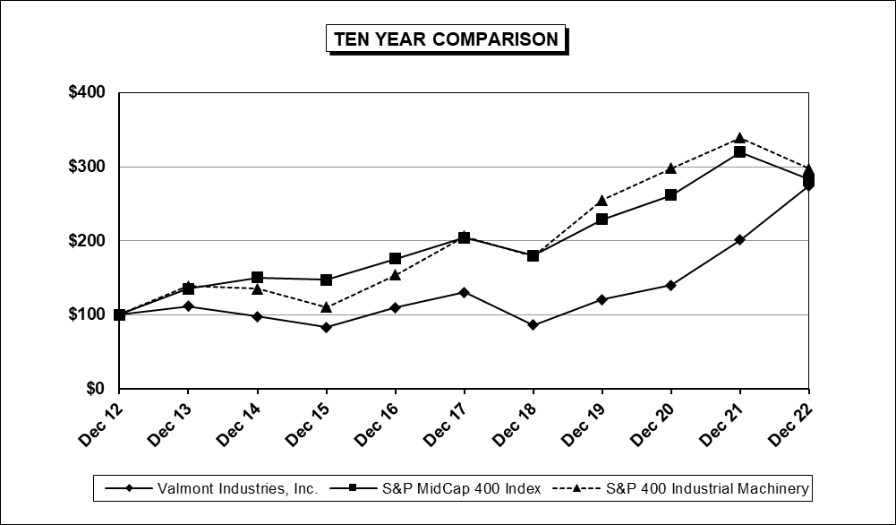


10182
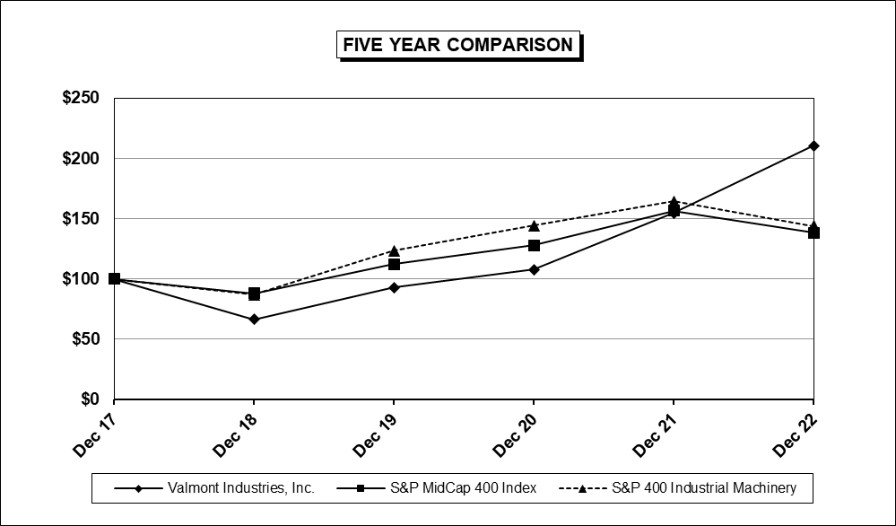
ITEM 9C. DISCLOSURE REGARDING FOREIGN JURISDICTIONS THAT PREVENT INSPECTIONS.INSPECTIONS
Not Applicable.applicable.
10283
PART III
ITEM 10. DIRECTORS, EXECUTIVE OFFICERS AND CORPORATE GOVERNANCE.GOVERNANCE
Except for the information relating to the executive officers of the Company set forth in Part I of this Form 10-K, Report, the information called for by itemsItems 10, 11, and 13 is incorporated by reference to the sections entitled “Certain Shareholders”, “Corporate Governance”, “Board of Directors and Election of Directors”, "Board Committees"“Board Committees”, “Compensation Discussion and Analysis”, "Compensation“Compensation Risk Assessment"Assessment”, “Human Resources Committee Report”, "Pay“Pay Ratio Information"Information”, “Summary Compensation Table”, “Grants of Plan-Based Awards for Fiscal Year 2022”2023”, “Outstanding Equity Awards at Fiscal Year-End”, “Options Exercised and Stock Vested in Fiscal 2022”2023”, “Nonqualified Deferred Compensation”, “Director Compensation”, and “Potential Payments Upon Termination or Change-in-Control” in the Company’s Proxy Statement.
The Company has adopted a Code of Ethics for Senior Officers that applies to the Company’s Chief Executive Officer, Chief Financial Officer, and Controller and has posted the code on its website at www.valmont.com through the “Investors“Investor Relations” link. The Company intends to satisfy the disclosure requirement under Item 5.05 of Form 8-K relating to amendments to or waivers from any provision of the Code of Ethics for Senior Officers applicable to the Company’s Chief Executive Officer, Chief Financial Officer, or Controller by posting that information on the Company’s Web sitewebsite at www.valmont.com through the “Investors“Investor Relations” link.
ITEM 11. EXECUTIVE COMPENSATION.COMPENSATION
See Item 10.
ITEM 12. SECURITY OWNERSHIP OF CERTAIN BENEFICIAL OWNERS AND MANAGEMENT AND
RELATED STOCKHOLDER MATTERS.MATTERS
IncorporatedThe information required by this item is incorporated herein by reference to the sections titled “Certain Shareholders” and “Equity Compensation Plan Information”Compensation” in the Company’s Proxy Statement.
ITEM 13. CERTAIN RELATIONSHIPS AND RELATED TRANSACTIONS, AND DIRECTOR INDEPENDENCE.INDEPENDENCE
See Item 10.
ITEM 14. PRINCIPAL ACCOUNTANT FEES AND SERVICES.SERVICES
The information called forrequired by Item 14this item is incorporated herein by reference to the sectionssection titled “Ratification of Appointment of Independent Auditors” in the Company’s Proxy Statement.
10384
PART IV
ITEM 15. EXHIBITSEXHIBIT AND FINANCIAL STATEMENT SCHEDULES.SCHEDULES
(a)(1)(2) Financial Statements and Schedules.
The following consolidated financial statementsConsolidated Financial Statements of the Company and its subsidiaries are included herein as listed below:
All financial statement schedules have been omitted as the required information is not applicable, not required, or the information is included in the consolidated financial statementsConsolidated Financial Statements or related notes. Separate financial statements of the registrant have been omitted because the registrant meets the requirements which permit omission.
(3)Index to Exhibits
See exhibits listed under Part B below.
104
(b)Exhibits
| | |
Exhibit 3.1 | — | |
| | |
Exhibit 3.2 | — | |
| | |
Exhibit | — | |
| | |
Exhibit 4.2 | — | |
| | |
Exhibit 4.3 | — | |
| | |
Exhibit 4.4 | — | |
| | |
85
Exhibit 4.5 | — | |
| | |
Exhibit 4.6 | — | |
| | |
Exhibit 10.1 | — | |
| | |
Exhibit 10.2 | — | |
| | |
Exhibit 10.3
| — | |
| | |
Exhibit 10.4
| — | |
| | |
105
Exhibit 10.5 | — | |
| | |
Exhibit 10.6 | — | |
| | |
Exhibit 10.7 | — | |
| | |
Exhibit 10.8 | — | |
| | |
Exhibit 10.9 | — | |
| | |
Exhibit 10.10 | — | |
| | |
Exhibit 10.11 | — | |
| | |
Exhibit 10.12 | — | |
| | |
86
Exhibit 19.1* | — | |
| | |
Exhibit 21* | — | |
| | |
Exhibit 22.1 |
| |
| | |
Exhibit 23* | — | |
| | |
Exhibit 24* | — | |
| | |
Exhibit 31.1* | — | |
| | |
Exhibit 31.2* | — | |
| | |
Exhibit 32.1* | — | |
| | |
Exhibit 97.1* | — | Valmont’s Policy for the Recovery of Erroneously Awarded Compensation. |
| | |
Exhibit 101 | — | The following financial information from the Company’s Annual Report on Form 10-K for the year ended December |
| | |
Exhibit 104 | — | Cover Page Interactive File (formatted as Inline XBRL and contained in Exhibit 101). |
* | Filed herewith |
106
Pursuant to Item 601(b)(4) of Regulation S-K, certain instruments with respect to the registrant’s long-term debt are not filed with this Form 10-K. ValmontThe Company will furnish a copy of such long-term debt agreements to the Securities and Exchange Commission upon request.
Management contracts and compensatory plans are set forth as Exhibits 10.1 through 10.11.10.12.
ITEM 16. FORM 10-K SUMMARY
None.
10787
SIGNATURES
Pursuant to the requirements of Section 13 or 15(d) of the Securities Exchange Act of 1934, the registrant has duly caused this report to be signed on its behalf by the undersigned, thereunto duly authorized, on the 1st28th day of March, 2023February, 2024.
| | |
| Valmont Industries, Inc. | |
| | |
| By: | /s/ |
| |
President and Chief Executive Officer |
Pursuant to the requirements of the Securities Exchange Act of 1934, this report has been signed below by the following persons on behalf of the registrant and in the capacities indicated and on the dates indicated.
| | | | |
Signature |
| Title |
| Date |
| | | | |
/s/ | | Director, President and Chief Executive Officer | |
|
|
|
|
|
|
|
|
|
|
|
|
|
|
|
|
Avner M. Applbaum | | | | |
| | | | |
/s/ | | Senior Vice President and | |
|
| | | | |
| | | | |
Mogens C. Bay* | | James B. Milliken* | | |
K.R. den Daas* | | Daniel P. Neary* | | |
Ritu C. Favre* | | Catherine J. Paglia* | | |
Theo W. Freye* | |
| | |
Richard A. Lanoha* | |
| | |
| | | | |
* |
|
| | |
| By: | /s/ |
| |
Attorney-in-Fact |
10988