UNITED STATES
SECURITIES AND EXCHANGE COMMISSION
Washington, D. C. 20549
FORM 10-K
|
| |
þ
| Annual Report Pursuant to Section 13 or 15(d) of the Securities Exchange Act of 1934 |
For the Fiscal Year Ended September 30, 2018
December 31, 2019
OR
|
| |
o
| Transition Report Pursuant to Section 13 or 15(d) of the Securities Exchange Act of 1934 |
For the Transition Period from _____ to _____
Commission File Number:0-49807
WASHINGTON GAS LIGHT COMPANY
(Exact name of Registrant as Specified in Its Charter)
|
| | | | | | |
Commission
File Number
District of Columbia and Virginia | | Exact name of registrant as specified in its charter and
address of principal executive offices and telephone number
| | | | 53-0162882 |
(State or Other Jurisdiction of IncorporationIncorporation)
| | | | | | (I.R.S. Employer Identification No. |
0-55968 | | WGL Holdings, Inc.
1000 Maine Ave., S.W.
Washington, D.C. 20024
(703) 750-2000
| | Virginia | | 52-2210912 |
0-49807 | | Washington Gas Light Company
1000 Maine Ave., S.W.
Washington, D.C. 20024
(703) 750-4440
| | District of
Columbia
and Virginia
| | 53-0162882) |
1000 Maine Ave., S.W.
Washington, D.C. 20024
(Address of Principal Executive Offices and Zip Code)
(703) 750-4440
(Registrant's telephone number, including area code)
|
| | |
| Securities registered pursuant to Section 12(b) of the Act: None |
|
|
| Securities registered pursuant to Section 12(g) of the Act: |
Title of each class |
WGL Holdings, common stock, no par value |
Washington Gas Light Company preferred stock,
|
cumulative, withoutCommon stock, $1.00 par value:
|
$4.25 Series
|
$4.80 Series
|
$5.00 Seriesvalue
|
Indicate by check mark if eachthe registrant is a well-known seasoned issuer, as defined in Rule 405 of the Securities Act.
|
| | |
WGL Holdings, Inc. | | Yes [ ] No [ü]
|
Washington Gas Light Company | | Yes [ ] No [ü]
|
Indicate by check mark if eachthe registrant is not required to file reports pursuant to Section 13 or Section 15(d) of the Act. Yes [ ] No [ü]
Indicate by check mark whether eachthe registrant: (1) has filed all reports required to be filed by Section 13 or 15(d) of the Securities Exchange Act of 1934 during the preceding 12 months (or for such shorter period that the registrants wereregistrant was required to file such reports) and (2) has been subject to such filing requirements for the past 90 days. Yes [ü] No [ ]
Indicate by check mark whether eachthe registrant has submitted electronically every Interactive Data File required to be submitted pursuant to Rule 405 of Regulation S-T during the preceding 12 months (or for such shorter period that the registrant was required to submit and post such files). Yes [ü] No [ ]
Indicate by check mark if disclosure of delinquent filers pursuant to Item 405 of Regulation S-K (§ 229.405 of this chapter) is not contained herein, and will not be contained, to the best of the registrants’ knowledge, in definitive proxy or information statements incorporated by reference in Part III of this Form 10-K or any amendment to this Form 10-K. [ü]
Indicate by check mark whether the registrant is a large accelerated filer, an accelerated filer, a non-accelerated filer, smaller reporting company, or an emerging growth company. See the definitions of “large accelerated filer,” “accelerated filer,” “smaller reporting company,” and "emerging growth company" in Rule 12b-2 of the Exchange Act.
WGL Holdings, Inc.:
|
| | | | | | |
Large Accelerated Filer o | | Accelerated Filer o | | Non-Accelerated Filer [ü] | | Smaller Reporting Company o |
| | | | | (Do not check if a smaller reporting company) | | |
Emerging growth company o
| | | | | | |
Washington Gas Light Company:
|
| | | | | | |
Large Accelerated Filer o
| | Accelerated Filer o
| | Non-Accelerated Filer [ü]
| | Smaller Reporting Company o
|
| | | | (Do not check if a smaller reporting company) | |
Emerging growth company o | | | | | | |
Indicate by check mark whether eachthe registrant is a shell company (as defined in Rule 12b-2 of the Act): Yes [ ] No [ü]
The aggregate market value of the voting common equity held by non-affiliates of the registrant WGL Holdings, Inc., amounted to $4,250,758,369 as of March 31, 2018.
The aggregate market value of the voting common equity held by non-affiliates of the registrant, Washington Gas Light Company, amounted towas $0 as of MarchJune 30, 2019.
As of January 31, 2018.
WGL Holdings, Inc.2020, there were 46,479,536 shares of registrant common stock, no$1 par value, outstanding as of October 31, 2018: 100 shares.outstanding. All of the outstanding shares of common stock no par value, of WGL Holdings, Inc. are held by Wrangler 1SPE LLC, an indirect wholly owned subsidiary of AltaGas Ltd. as of October 31, 2018.
Washington
REDUCED DISCLOSURE FORMAT
Washington Gas Light Company, common stock, $1 par value, outstanding as of October 31, 2018: 46,479,536 shares. All of the outstanding shares of common stock, $1 par value, of Washington Gas Light Company are held by Wrangler SPE LLC (the SPE), a direct wholly ownedan indirect wholly-owned subsidiary of WGL Holdings, Inc. asAltaGas Ltd., meets the requirements set forth in General Instruction I(1)(a) and (b) of October 31, 2018.Form 10-K and is therefore filing this Form 10-K with the reduced disclosure format.
WGL Holdings, Inc.
Washington Gas Light Company
Form 10-K
For the Fiscal Year Ended September 30, 2018December 31, 2019
Table of Contents
|
| | |
| PART I | |
| |
| |
| | |
| | |
| |
| Item 1. | | |
| | | |
| | | |
| | | |
| | | |
| Item 1A. | | |
| Item 1B. | | |
| Item 2. | | |
| Item 3. | | |
| Item 4. | | |
| |
| | |
| PART II | |
| |
| Item 5. | | |
| Item 6. | | |
| Item 7. | | |
| Item 7A. | | |
| Item 8. | | |
| | |
| | |
| | | |
| | |
| Item 9. | | |
| Item 9A. | | |
| Item 9B. | | |
| | | |
| PART III | |
| |
| Item 10. | | |
| Item 11. | | |
| Item 12. | | |
| Item 13. | | |
| Item 14. | | |
| | | |
| PART IV | |
| |
| Item 15. | | |
| Item 16. | | |
| |
WGL Holdings, Inc.
Washington Gas Light Company
Part I
INTRODUCTIONEXPLANATORY NOTE REGARDING THIS ANNUAL REPORTFILING FORMAT
On December 28, 2018, our Board of Directors approved a change of Washington Gas Light Company's fiscal year from the period beginning on October 1 and ending on September 30 to the period beginning on January 1 and ending on December 31. This annual report on Form 10-K is a combinedfor the twelve-month period from January 1, 2019 to December 31, 2019. References in this report being filed by two separate registrants: WGL Holdings, Inc. (WGL)to "calendar year" refer to the year ended December 31. References in this report to "transition period" refer to the three-month transition period from October 1, 2018 through December 31, 2018. References in this report to "fiscal year" refer to the twelve-month period ending on September 30. For comparison purposes, the unaudited data for twelve months ended December 31, 2018 and three months ended December 31, 2017 are presented.
SAFE HARBOR FOR FORWARD-LOOKING STATEMENTS Washington Gas Light Company (Washington Gas) is an indirect, wholly owned subsidiary of, among other entities, WGL Holdings, Inc (WGL). WGL is an indirect wholly owned subsidiary of AltaGas Ltd. (AltaGas). Except where the content clearly indicates otherwise, any reference in thethis report to “WGL,“Washington Gas”,” “we,” “us”, “our” or “our” is“the Company” refers to the holding company or the consolidated entity ofWashington Gas Light Company. References to “WGL” refer to WGL Holdings, Inc. and all of its subsidiaries, including Washington Gas which is a distinct registrant that is an indirect wholly owned subsidiary of WGL. Washington Gas makes no representations as to the information contained in this report relating to WGL and its subsidiaries, other than Washington Gas.
The Management’s Discussion and Analysis of Financial Condition and Results of Operations (Management’s Discussion) included under Item 7 is divided into two major sections, one for WGL and one for Washington Gas. The Consolidated Financial Statements of WGL and the Financial Statements of Washington Gas are included under Item 8 as well as the Notes to Consolidated Financial Statements that are presented on a combined basis for both WGL and Washington Gas.
SAFE HARBOR FOR FORWARD-LOOKING STATEMENTSsubsidiaries.
Certain matters discussed in this report, excluding historical information, include forward-looking statements within the meaning of the Private Securities Litigation Reform Act of 1995 with respect to the outlook for earnings, dividends, revenues and other future financial business performance, strategies, financing plans, AltaGas Ltd.'s (AltaGas)AltaGas' integration of us and other expectations. Forward-looking statements are typically identified by words such as, but not limited to, “estimates,” “expects,” “anticipates,” “intends,” “believes,” “plans” and similar expressions, or future or conditional terms such as “will,” “should,” “would” and “could.” Forward-looking statements speak only as of the filing date of this report, and the registrants assumeregistrant assumes no duty to update them. Factors that could cause actual results to differ materially from forward-looking statements or historical performance include those discussed in Item 1A. Risk Factors and may include, but are not limited to the following:
hazards involved in the storage, transportation, moving of marketing of hydrocarbon products;
leaks, mechanical problems, incidents, or other operational issues could affect public safety and the reliability of Washington Gas’ distribution system;
the availability of natural gas supply or an inability to obtain an adequate supply of gas to satisfy present and future demands;
challenges in securing the necessary transportation or storage capacity to deliver or acquire the volume of gas necessary to meet customer demands and future growth expectations;
cyberattacks, including cyberterrorism, or other information technology security breaches or failures;
the inability to meet commitments under various orders and agreements associated with regulatory approvals for the merger could have a detrimental impact on WGL’s business, financial condition, operatingMerger;
the Merger may not achieve its expected results and prospects;
the inabilityWashington Gas may be unable to successfully be integratedintegrate into the operations of AltaGas following the merger with AltaGas and realize anticipated benefits;
changes in WGL's or AltaGas' credit ratings and disruptions in credit market conditions or other factors that may affect our access to and cost of capital;AltaGas;
the effectoccurrence of the consummation of the merger on the ability of WGL to retain customers and retain and hire key personnel;
the effect of the consummation of the merger on the ability of WGL to maintain relationships with its suppliers;
potential litigationunexpected costs in connection with the merger;Merger;
securities class action suits and derivative suits;
the levelloss of certain administrative and ratemanagement functions and services provided by AltaGas;
changes in AltaGas' strategy or relationship with Washington Gas that could affect our performance or operations;
Washington Gas Light Company
Part I
the ability to access capital and the costs at which we incurWashington Gas is able to access capital and credit markets, including changes in the credit ratings of Washington Gas, WGL, and AltaGas;
disruptions or decline in the local economy in which Washington Gas operates;
the credit-worthiness of customers; suppliers and derivatives counterparties;
changes in the value of derivative contracts and the availability of suitable derivative counterparties;
rules implementing the derivatives transaction provisions of the Dodd-Frank Act may impose costs on our derivatives activities;
failures of Washington Gas service providers that could negatively impact the Company’s business;
compliance with Section 404(a) of Sarbanes-Oxley Act;
acts of nature and expenses,catastrophic events, including terrorist acts;
an inability to attract and retain key management and sufficiently skilled operational personnel;
strikes or work stoppages by unionized employees;
changes in the costs of providing retirement plan benefits;
the extent to which we are allowed to recover from our customers, through the regulatory process, such costs and expenses relating to constructing, operating and maintaining Washington Gas’ distribution system;
the availability of natural gas and electricity supply, interstate pipeline transportation and storage capacity;
the outcome of new and existing matters before courts, regulators, government agencies or arbitrators, including those relatingrelated to our purchase of natural gas under the Antero gas supply contracts,operations and the August 2016 explosion and fire at an apartment complex in Silver Spring, Maryland;
factors beyond our control that affect the ability of natural gas producers, pipeline gatherersthe Company to earn a reasonable rate of return on its invested capital;
concerns involving climate change and natural gas processors to deliver natural gas into interstate pipelinesthe movement for delivery to the entrance points of Washington Gas' distribution system;
WGL Holdings, Inc.
Washington Gas Light Company
security breaches of our information technology infrastructure, including cyber-attacks and cyber-terrorism;
the loss of certain services provided by AltaGas;
leaks, mechanical problems, incidents or other operational issues in our natural gas distribution system, including the effectiveness of our efforts to mitigate the effects of receiving low-HHC natural gas;
changes and developments in economic, competitive, political and regulatory conditions;
unusual weather conditions and changes in natural gas consumption patterns;carbon neutral energy sources;
changes in energy commodity market conditions, including the relative prices of alternative forms of energy such as electricity, fuel oil and propane;
physical and financial risks associated with climate change;
unusual weather conditions and changes in natural gas consumption patterns;
costs associated with certain legacy operations of Washington Gas and environmental remediation efforts;
the valueoutcome of derivative contractsnew and existing matters before courts, regulators, government agencies or arbitrators;
changes to government fiscal and trade policies;
regulatory and financial risks related to pipeline safety legislation;
changes to the availability of suitable derivative counterparties;
factors affectingtax code and our ability to quantify such changes and seek recovery for the timing of construction and the effective operation of pipelinesmanner in which we have invested;
the credit-worthiness ofcorporate taxes are shared with customers; suppliers and derivatives counterparties;
changes in laws and regulations, including tax, environmental, pipeline integrity and employment laws and regulations, including the competitiveness of WGL Energy Systems, Inc. in securing future assets to continue its growth;
legislative, regulatory and judicial mandates or decisions affecting our business operations, including interpretations of the Tax Cuts and Jobs Act (Tax Act);
the timing and success of business and product development efforts and technological improvements;
the level of demand from government agencies and the private sector for commercial energy systems, and delays in federal government budget appropriations;
the pace of deregulation of energy markets and the availability of other competitive alternatives to our products and services;
changes in accounting principles and the effect of accounting pronouncements issued periodically by accounting standard-setting bodies;
our ability to manage the outsourcing of several business processes;
strikes or work stoppages by unionized employees;
acts of nature and catastrophic events, including terrorist acts;
decisions made by management and co-investors in non-controlled investees; and
changes in AltaGas’ strategy, relationship with us or performance.bodies.
All such factors are difficult to predict accurately and are generally beyond the direct control of the registrants.registrant. Readers are urged to use care and consider the risks, uncertainties and other factors that could affect the registrants’registrant’s business as described in this annual report on Form 10-K.
WGL Holdings, Inc.
Washington Gas Light Company
Part I
GLOSSARY OF KEY TERMS AND DEFINITIONS
Accelerated Pipe Replacement Programs:Programs (APRPs): Programs focused on replacement activities, targeting specific piping materials, installed years and/or locations which are undertaken on an expedited basis in an effort to improve safety, system reliability and to reduce potential greenhouse gas (GHG) emissions.
Accounting Standards Codification (ASC): The source of authoritative generally accepted accounting principles (GAAP).
Accounting Standards Update (ASU): An update issued to communicate changes to an ASC.
Active Customer Meters: Natural gas meters that are physically connected to a building structure within the Washington Gas distribution system that are receiving natural gas distribution service.
AltaGas Ltd. (AltaGas): AltaGas is a Canadian corporation that became the parent company of WGL Holdings, Inc. upon consummation of the Merger on July 6, 2018.
AltaGas Services (U.S.) Inc. (ASUS): ASUS is a wholly owned subsidiary of AltaGas. It is the parent company of all AltaGas' U.S. subsidiaries.
Area-Wide Contract: A contract between Washington Gas and the General Services Administration for utility and energy-management services.
Asset Optimization Program: A program to optimize the value of Washington Gas’ long-term natural gas transportation and storage capacity resources during periods when these resources are not being used to physically serve customers.
Bundled Service: Service in which customers purchase both the natural gas commodity and the distribution or delivery of the commodity from the local regulated utility. When customers purchase bundled service from Washington Gas, no mark-up is applied to the cost of the natural gas commodity that is passed through to customers.
Business Process Outsourcing (BPO) Agreement: An agreement whereby a service provider performs certain ongoing support functions.
CARE Ratemaking Adjustment (CRA): A billing mechanism in the state of Virginia that is designed to minimize the effect of factors such as conservation on utility net revenues.
City Gate: A point or measuring station at which a gas distribution company, such as Washington Gas, receives natural gas from an unaffiliated pipeline or transmission system.
Competitive Service Provider (CSP): Also referred to as Third-Party Marketer (see definition below).
Commercial Energy Systems: Includes the operations of WGL Energy Systems, Inc. and WGSW, Inc. and the results of operations for affiliate owned commercial distributed energy projects.
Conservation and Ratemaking Efficiency (CARE Plan): Provides for the CRA as well as cost effective conservation and energy efficient programs.
Cooling Degree Day (CDD): A measure of the variation in weather based on the extent to which the daily average temperature is above 65 degrees Fahrenheit.
Delivery Service: The regulated distribution or delivery of natural gas to retail customers. Washington Gas provides delivery service to retail customers in Washington, D.C. and parts of Maryland and Virginia.
Design Day: Washington Gas’ design day represents the maximum anticipated demand on Washington Gas’ distribution system during a 24-hour period assuming a five-degree Fahrenheit average temperature and 17 miles per hour average wind, considered to be the coldest conditions expected to be experienced in the Washington, D.C. region.
Distributed Generation Assets: Assets that use renewable energy sources including Solar Photovoltaic (Solar PV) systems, combined heat and power plants, and natural gas fuel cells to generate electricity near the point of consumption.
Earnings Before Interest, Taxes, Depreciation and Taxes (EBITAmortization (EBITDA): A non-GAAP performance measure that includes operating income, other income (expense), earnings from unconsolidated affiliates and is reduced by amounts attributable to non-controlling
WGL Holdings, Inc.
Washington Gas Light Company
Part I
interests. EBIT is used in assessing the results of each segment'sWashington Gas' operations.
Federal Energy Regulatory Commission (FERC): An independent agency of the federal government that regulates the interstate transmission of electricity, natural gas, and oil. The FERC also reviews proposals to build liquefied natural gas terminals and interstate natural gas pipelines.
Financial Contract: A contract in which no commodity is transferred between parties and only cash payments are exchanged in amounts equal to the financial benefit of holding the contract.
Washington Gas Light Company
Part I
Firm Customers: Customers whose natural gas supply will not be disrupted by the regulated utility to meet the needs of other customers. Typically, this class of customer comprises residential customers and most commercial customers.
Generally Accepted Accounting Principles (GAAP): A standard framework of accounting rules used to prepare, present and report financial statements in the United States of America.
Gross Margin: A measure calculated as operating revenues, less the associated cost of energy and applicable revenue taxes. Gross margin is used to measure the success of the retail energy-marketing segment’s core strategy for the sale of natural gas and electricity.
Hampshire: Hampshire Gas Company is a subsidiary of WGL that provides regulated interstate natural gas storage services to Washington Gas under a FERC approved interstate storage service tariff.
Heating Degree Day (HDD): A measure of the variation in weather based on the extent to which the daily average temperature falls below 65 degrees Fahrenheit.
Heavy Hydrocarbons (HHCs): Compounds, such as hexane, that Washington Gas is injecting into its distribution system to treat vaporized liquefied natural gas or domestic sources of gas that have had such HHCs removed as a result of liquids processing.
Hypothetical Liquidation at Book Value (HLBV): A balance sheet-oriented approach to the equity method of accounting which provides a methodology for allocating pre-tax GAAP income or loss to the partners. This approach calculates the amount each partner would receive in the event the partnership was liquidated at book value at the end of each measurement period.
Interruptible Customers: Large commercial customers whose service can be temporarily interrupted in order for the regulated utility to meet the needs of firm customers. These customers pay a lower delivery rate than firm customers and they must be able to readily substitute an alternate fuel for natural gas.
Liquefied Natural Gas (LNG): The liquid form of natural gas.
Lower-of-Cost or Net Realizable Value: The process of adjusting the value of inventory to reflect the lesser of its original cost or its net realizable value.
Mark-to-Market:The process of adjusting the carrying value of an asset or liability to reflect its current fair value.
Megawatt (MW): A unit of power that is equivalent to 1 million watts.
Megawatt hour (MWh): A unit of energy. A power source with a power rating of one MW that is turned on for 1 hour will use 1 MWh of energy.
Merger Agreement: A reference to the agreement, consummated July 6, 2018, governing the merger of WGL's into an agreement for WGL to combine withindirect, wholly-owned AltaGas subsidiary, with WGL continuingsurviving as a surviving corporation in the merger and becoming an indirect wholly ownedwholly-owned subsidiary of AltaGas (the Merger).
Midstream Energy Services: The midstream energy services segment includes the operations of WGL Midstream, Inc.
New Customer Meters Added: Natural gas meters that are newly connected to a building structure within the Washington Gas distribution system. Service may or may not have been activated.
WGL Holdings, Inc.
Washington Gas Light Company
Part I
Non-Controlling Interest: The portion of equity (net assets) in a consolidated subsidiary that is not attributable directly or indirectly to WGL.
Normal Weather: A forecast of expected HDDs or CDDs based on historical HDD or CDD data.
Power Purchase Agreement (PPA): A power purchase agreement, or electricity power agreement, is a contract between two parties, one which generates the electricity and one which is looking to purchase electricity. The PPA defines all of the commercial terms for the sale of electricity between two parties.
PROJECTpipes: An accelerated pipe replacement program to replace bare and/or unprotected steel services, bare and targeted unprotected steel mains, and cast iron mainsthat provides a recovery mechanism for costs of eligible infrastructure replacements in the District of Columbia.
PSC of DC: The Public Service Commission of the District of Columbia, is a three-member board that regulates Washington Gas’ distribution operations in the District of Columbia.
PSC of MD: The Maryland Public Service Commission, is a five-member board that regulates Washington Gas’ distribution operations in Maryland.
Purchased Gas Charge (PGC): The purchased gas charge represents the cost of gas, gas transportation, gas storage services purchased and other gas related costs. The purchased gas charge is collected from customers through tariffs established by the regulatory commissions that have jurisdiction over Washington Gas.
Purchase of Receivables (POR): A program in Maryland, whereby Washington Gas purchases receivables from participating energy marketersCSPs at approved discount rates.
Regulated Utility Segment: Includes the operations of Washington Gas and the operations of Hampshire.
Renewable Energy Credits (RECs): A certificate representing the “green attributes” of one megawatt-hour (MWh) of electricity generated from renewable energy.
Retail Energy-Marketing Segment: Includes the operations of WGL Energy Services, Inc.
Return on Average Common Equity: Net income divided by average common shareholders’ equity.
Revenue Normalization Adjustment (RNA): A regulatory billing mechanism in the state of Maryland designed to stabilize the level of net revenues collected from customers by eliminating the effect of deviations in customer usage caused by variations in weather from normal levels, and other factors such as conservation.
SCC of VA: The Commonwealth of Virginia State Corporation Commission is a three-member board that regulates Washington Gas’ distribution operations in Virginia.
Sendout: The total amount of gas that flows into Washington Gas' distribution system within a certain interval of time.
Service Area: The region in which Washington Gas operates. The service area includes the District of Columbia, and the surrounding metropolitan areas in Maryland and Virginia.
SF ASD LLC (SF ASD): A wholly owned subsidiary of WGL Energy Systems.
SF Echo LLC (SF Echo): A wholly owned subsidiary of WGSW.
SFGF, LLC (SFGF): A tax equity partnership whose results of operation are consolidated into WGL's financial statements, as WGSW, Inc. is the primary beneficiary.
SFGF II, LLC (SFGF II): A tax equity partnership whose results of operation are consolidated into WGL's financial statements, as WGSW, Inc. is the primary beneficiary.
WGL Holdings, Inc.
Washington Gas Light Company
Part I
SFRC, LLC (SFRC): A tax equity partnership whose results of operation are consolidated into WGL's financial statements, as WGSW, Inc. is the primary beneficiary.
Steps to Advance Virginia’s Energy Plan (SAVE Plan): An accelerated pipe replacement planprogram that provides a recovery mechanism for costs of eligible infrastructure replacements in the state of Virginia.
Washington Gas Light Company
Part I
Strategic Infrastructure Development and Enhancement Plan (STRIDE Plan): An accelerated pipe replacement planprogram that provides a recovery mechanism for reasonable and prudent costs associated with infrastructure replacements in the state of Maryland.
Tariffs: Documents approved by the regulatory commission in each jurisdiction that set the prices Washington Gas may charge and the practices it must follow when providing utility service to its customers.
Therm: A natural gas unit of measurement that includes a standard measure for heating value. We report our natural gas sales and deliveries in therms. A therm of gas contains 100,000 British thermal units of heat, or the energy equivalent of burning approximately 100 cubic feet of natural gas under normal conditions. Ten million therms equal approximately one billion cubic feet of natural gas. A dekatherm is 10 therms and is abbreviated Dth.
Third-party Marketer: Unregulated companies that sell natural gas and electricity directly to retail customers. WGL Energy Services, an affiliate of Washington Gas, and a wholly owned subsidiary company of Washington Gas Resources Corporation, is a third-party marketer.
Tier 1 Renewable Resource: The renewable portfolio standard is divided into 2 tiers based on the electricity generation resource. Some examples of Tier 1 renewables are solar, wind, and fuel cells powered through renewables.
Unbundling: The separation of the delivery of natural gas or electricity from the sale of these commodities and related services that, in the past, were provided only by a regulated utility.
Utility Net Revenues: A non-GAAP measure used by the regulated utility segment which is calculated as operating revenues less the associated cost of gas and applicable revenue
taxes. For the regulated utility, theThe cost of gas associated with sales to customers and revenue taxes are generally pass through amounts.
Value-At-Risk: A risk measurement that estimates the largest expected loss over a specified period of time under normal market conditions within a specified probabilistic confidence interval.
Washington GasGas: :Washington Gas Light Company (Washington Gas) is an indirect, wholly owned subsidiary of, WGL Holdings, Inc. that sells and delivers natural gas primarily to retail customers in accordance with tariffs approved by the PSC of DC, the PSC of MD and the SCC of VA. As of the close of the Merger, all Washington Gas' common stock is held by Wrangler SPE LLC.among other entities, WGL.
Washington Gas Resources: Washington Gas Resources Corporation is a subsidiary of WGL Holdings, Inc. that owns the majority of the non-utility subsidiaries.
Weather Normalization Adjustment (WNA): A billing adjustment mechanism in Virginia that is designed to minimize the effect of variations from normal weather on utility net revenues.
WGL: WGL Holdings, Inc. is(WGL), a holding company that is the indirect parent company of Wrangler SPE LLC, Washington Gas Light Company and other subsidiaries.affiliated subsidiaries of Washington Gas. It is an indirect wholly owned subsidiary of AltaGas.
WGL Energy ServicesServices: :WGL Energy Services, Inc. is a subsidiary of Washington Gas Resources CorporationWGL that sells natural gas and electricity to retail customers on an unregulated basis.
WGL Energy Systems:Systems: WGL Energy Systems, Inc. is a subsidiary of Washington Gas Resources Corporation, whichWGL that provides commercial energy efficient and sustainable solutions to government and commercial clients.
WGL MidstreamMidstream: :WGL Midstream Inc. is a subsidiary of Washington Gas ResourcesWGL that engages in acquiring and optimizing natural gas storage and transportation assets.
WGL Holdings, Inc.
Washington Gas Light Company
Part I
WGSW: WGSW, Inc. is a subsidiary of Washington Gas Resources Corporation that was formed to invest in certain renewable energy projects.
Wrangler 1 LLC: Wrangler 1 LLC is an indirect wholly owned subsidiary of AltaGas Ltd. Upon close of the Merger, Wrangler 1 LLC owns all the shares of common stock of WGL.
Wrangler SPE LLC (SPE)(Wrangler): Wrangler SPE LLC is a bankruptcy remote special purpose entity whichthat owns all the shares of the common stock of Washington Gas. It was established as a wholly owned subsidiary of WGL upon consummation of the Merger with AltaGas.
WGL Holdings, Inc.
Washington Gas Light Company
Part I
Item 1. Business
ITEM 1. BUSINESS
CORPORATE OVERVIEW
WGL HOLDINGS, INC.
WGL was established on November 1, 2000 as a Virginia corporation. Through our wholly owned subsidiaries, we sell and deliver natural gas and provide energy-related products and services to customers primarily in the District of Columbia and the surrounding metropolitan areas in Maryland and Virginia, although our non-utility segments provide various energy services across the United States. WGL promotes the efficient use of clean natural gas and renewable energy to improve the environment for the benefit of customers, investors, employees, and the communities it serves. On January 25, 2017, WGL entered into an Agreement and Plan of Merger (Merger Agreement) to combine with AltaGas Ltd., a Canadian Corporation (AltaGas). On July 6, 2018, the merger was consummated between AltaGas, WGL, and Wrangler Inc. (Merger Sub), a newly formed indirect wholly owned subsidiary of AltaGas. The Merger Agreement provided for the merger of the Merger Sub with and into WGL, with WGL surviving as an indirect wholly owned subsidiary of AltaGas (the Merger). In connection with the Merger, WGL established Wrangler SPE LLC., a bankruptcy remote special purpose entity (the SPE) for the purposes of owning the common stock of Washington Gas. The SPE is a wholly owned subsidiary of WGL. In addition, WGL owns all of the shares of common stock of Washington Gas Resources Corporation (Washington Gas Resources) and Hampshire Gas Company (Hampshire). Washington Gas Resources owns all of the shares of common stock of four non-utility subsidiaries that include WGL Energy Services, Inc. (WGL Energy Services), WGL Energy Systems, Inc. (WGL Energy Systems), WGL Midstream, Inc. (WGL Midstream) and WGSW, Inc. (WGSW). Additionally, several subsidiaries of WGL own interests in other entities.
For further information on the Merger, see “Safe Harbor and Forward Looking Statements” in the Introduction, Item I. Business, Item 1A. Risk Factors, and Note 20 “Merger with AltaGas Ltd.” of the Notes to Consolidated Financial Statements in this Form 10-K.
|
| | | | | | | | | | | | |
| | | | | | | | | | | |
| | | | | WGL(1)(3)
| | | | |
| | | | | | | | | | | | |
| | | | | | | | | | | | |
| Wrangler SPE LLC | | | | | | | | | | |
| | | | | | | | | | | | |
| Washington Gas
Regulated Utility
| | | Hampshire
Regulated Utility
| | | Washington Gas Resources(2)
|
| | | | | | | | | | | | |
| | | | | | | | | | | | |
| WGL Energy Services Retail
Energy-Marketing
| | WGL Energy Systems
Commercial Energy Systems
| | | WGSW
Commercial Energy Systems
| | WGL Midstream
Midstream Energy Services
|
| | | | | | | | | | | | |
| (1)Crab Run Gas Company is an inactive, wholly owned subsidiary of WGL.
|
| (2)Holding company whose stand-alone results are reported in "other activities".
|
| (3) WGL is an indirect wholly owned subsidiary of AltaGas.
|
INDUSTRY SEGMENTS
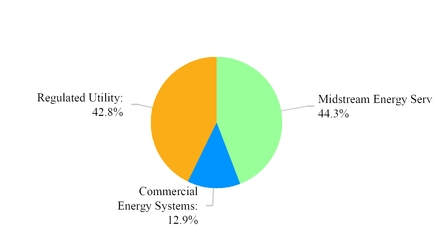
Our segments include regulated utility, retail energy-marketing, commercial energy systems and midstream energy services. Transactions and activities not specifically identified in one of these four segments are reported as “Other Activities.” The four segments are described below.
REGULATED UTILITY SEGMENT
WGL Holdings, Inc.Corporate Overview
Washington Gas, Light Company
Part I
Item 1. Business (continued)
The regulated utility segment consistsan indirect wholly-owned subsidiary of Washington Gas and Hampshire and represents approximately 71% of WGL’s total assets.
Washington Gas Light Company
Washington Gas is a regulated public utility that sells and delivers natural gas to retail customers in accordance with tariffs approved by regulatory commissions in the District of Columbia and adjoining areas in Maryland, Virginia and several cities and towns in the northern Shenandoah Valley of Virginia. Washington GasAltaGas, has been engaged in the natural gas distribution business since its incorporation by an Act of Congress in 1848. Washington Gas has been aIt was incorporated in Virginia corporation sincein 1953 and a corporation ofin the District of Columbia sincein 1957. Washington Gas promotes the efficient use of clean natural gas to improve the environment for the benefit of customers, investors, employees, and the communities it serves.
Following the July 2018 merger pursuant to the Merger Agreement, Washington Gas became an indirect, majority owned subsidiary of, among other entities, AltaGas and WGL. In connection with the Merger, and at the command of Washington Gas’ regulators, WGL, the former parent entity of Washington Gas, formed a wholly owned subsidiary, Wrangler SPE LLC (Wrangler), a bankruptcy remote, special purpose entity to own the common stock of Washington Gas. Wrangler was formed for the purpose of “ring fencing” Washington Gas, that is removing Washington Gas from the bankruptcy estate of AltaGas and its affiliates in the event that any parent or affiliate entity becomes the subject of bankruptcy or insolvency proceedings.
On December 20, 2019, Washington Gas redeemed all the outstanding shares of its preferred stock. As a result, Washington Gas is now an indirect, wholly owned subsidiary of AltaGas and WGL. At December 31, 2019, we had 1,574 employees.
Products and Services
Washington Gas providesis a regulated distributionpublic utility company that sells and delivers natural gas to customers in accordance with tariffs approved by regulatory commissions in the District of Columbia and the surrounding metropolitan areas in Maryland and Virginia. At December 31, 2019, Washington Gas’ service area had a population estimated at 5.9 million and included approximately 2.2 million households and commercial structures. Washington Gas operations are such that the loss of any one customer or deliverygroup of customers would not have a significant adverse effect on its business.
Natural Gas Distribution
Washington Gas' core business is to provide regulated distribution of natural gas to retail customers under tariff rates designed to provide for a return on and return of the investment used in providing that service. The rates are also designed to provide for recovery of operating expenses and federal and state income taxes incurred in providing that service. Washington Gas also sells natural gas at no margin to customers who have not elected to purchase natural gas from unregulated third-party marketers (refer to the section entitled “Natural Gas Unbundling”). Washington Gas recovers the cost of the natural gas purchased to serve firm customers through recovery mechanisms as approved in jurisdictional tariffs. Any difference between gas costs incurred on behalf of firm customers and the gas costs recovered from those customers is deferred on the balance sheet as an amount to be collected from or refunded to customers in future periods. Therefore, increases or decreases in the cost of gas associated with sales made to firm customers have no direct effect on Washington Gas’ net revenues and net income. However, to the extent Washington Gas does not have regulatory mechanisms in place to mitigate the indirect effects of higher gas prices, such as: (i) lower natural gas consumption caused by customer conservation; (ii) increased short-term interest expense to finance a higher natural gas storage
Rates and accounts receivables balances and (iii) higher expenses for uncollectible accounts, its net income may decrease.
Washington Gas, under its asset optimization program, makes use of storage and transportation capacity resources when those assets are not required to serve utility customers. The objective of this program is to derive a profit to be shared with its utility customers. These profits are earned by entering into commodity-related physical and financial contracts with third parties (refer to the section entitled “Asset Optimization Derivative Contracts” for further discussion of the asset optimization program). Unless otherwise noted, therm deliveries reported for the regulated utility segment do not include deliveries related to the asset optimization program.
At September 30, 2018, Washington Gas’ service area had a population estimated at 5.9 million and included approximately 2.2 million households and commercial structures. Washington Gas operations are such that the loss of any one customer or group of customers would not have a significant adverse effect on its business. The following table lists the number of active customer meters and therms delivered by jurisdiction as of and for the year ended September 30, 2018 and 2017, respectively.
|
| | | | | | | | | | | |
| Active Customer Meters and Therms Delivered by Jurisdiction |
| Jurisdiction | Active Customer Meters as of September 30, 2018 | | Millions of Therms Delivered Fiscal Year Ended September 30, 2018 | | Active Customer Meters as of September 30, 2017 | | Millions of Therms Delivered Fiscal Year Ended September 30, 2017 |
| | | | | | | | |
| District of Columbia | 163,516 |
| | 298.4 |
| | 161,990 |
| | 270.6 |
|
| Maryland | 485,619 |
| | 914.7 |
| | 478,004 |
| | 742.8 |
|
| Virginia | 528,841 |
| | 673.8 |
| | 523,661 |
| | 589.1 |
|
| Total | 1,177,976 |
| | 1,886.9 |
| | 1,163,655 |
| | 1,602.5 |
|
For additional information about gas deliveries and meter statistics, refer to the section entitled “Results of Operations” in Management’s Discussion for Washington Gas.
Hampshire Gas Company
Hampshire owns full and partial interests in underground natural gas storage facilities, including pipeline delivery facilities located in and around Hampshire County, West Virginia, and operates those facilities to serve Washington Gas, which purchases all of the storage services of Hampshire. Washington Gas includes the cost of these services in the bills sent to its customers. Hampshire operates under a “pass-through” cost of service-based tariff approved by the FERC and adjusts its billing rates to Washington Gas on a periodic basis to account for changes in its investment in utility plant and associated expenses.
WGL Holdings, Inc.
Washington Gas Light Company
Part I
Item 1. Business (continued)
Regulatory EnvironmentMatters
Washington Gas is regulated by the PSC of DC, the PSC of MD and the SCC of VA which approve its terms of service and the billing rates that it charges to its customers. Hampshire is regulated by the FERC. The rates charged to utility customers are designed to recover Washington Gas’ operating expenses and natural gas commodity costs and to provide a return on its investmentinvested capital, including the equity in the net assets used in its firm gas sales and delivery service. For each jurisdiction in which Washington Gas operates, changes in customer usage profiles are reflected in rate case proceedings and rates are adjusted accordingly.
For a discussion of current rates and regulatory matters, refer to the section entitled “Rates and Regulatory Matters” in Management’s Discussion for Washington Gas.
District of Columbia Jurisdiction
The PSC of DC consists of three full-time members who are appointed by the Mayor with the advice and consent of the District of Columbia City Council. The term of each commissioner is four years with no limitations on the number of terms that can be served. The PSC of DC has no time limitation within which it must make decisions regarding modifications to base rates charged by Washington Gas to its customers; however, it targets resolving pending rate cases within three months of the close of record.
Maryland Jurisdiction
The PSC of MD consists of five full-time members who are appointed by the Governor with the advice and consent of the Senate of Maryland. Each commissioner is appointed to a five-year term, with no limit on the number of terms that can be served.
When Washington Gas files for a rate increase, the PSC of MD may initially suspend the proposed increase for 180 days, and then has the option to extend the suspension for an additional 30 days. If action has not been taken after 210 days, the requested rates become effective subject to refund.
Virginia Jurisdiction
The SCC of VA consists of three full-time members who are elected by the General Assembly of Virginia. Each commissioner has a six-year term with no limitation on the number of terms that can be served.
Either of two methods may be used to request a modification of existing rates. Washington Gas may file an application for a general rate increase, in which it may propose new adjustments to the cost of service that are different from those previously approved for Washington Gas by the SCC of VA, as well as a revised return on equity. The proposed rates under this process may take effect 150 days after the filing, subject to refund pending the outcome of the SCC of VA’s action on the application.
Alternatively, an expedited rate case procedure allows proposed rate increases to be effective 30 days after the filing date, subject to refund. Under this procedure, Washington Gas may not propose new adjustments for issues not approved in its last general rate case or request a change in its authorized return on common equity. Once filed, other parties may propose new adjustments or a change in the cost of capital from the level authorized in its last general rate case. The expedited rate case procedure may not be available if the SCC of VA decides that there has been a substantial change in circumstances since the last general rate case filed by Washington Gas.Analysis.
Seasonality of Business Operations
Washington Gas’ business is weather-sensitive and seasonal because the majority of its business is derived from residential and small commercial customers who use natural gas for space heating. Excluding deliveries for electric generation, 74%77% and 73%75% of the total therms delivered in Washington Gas’ service area occurred during its first and second fiscalfourth quarters for fiscalcalendar years 20182019 and 2017,2018, respectively. Washington Gas’ earnings are typically generated during these two quarters, and Washington Gas typically incurs net losses in the thirdsecond and fourth fiscalthird quarters. The seasonal nature of the business creates large variations in short-term cash requirements, primarily due to the season-to-season fluctuations in the level of customer accounts receivable, unbilled revenues and storage gas inventories. Washington Gas finances these seasonal requirements primarily through the sale
Washington Gas Light Company
Part I
Item 1. Business (continued)
of commercial paper and unsecured short-term bank loans.backed by a revolving credit facility. For information on our management of weather risk, refer to the section entitled “Weather Risk” in Management’s Discussion and Analysis. For information about management of cash requirements, refer to the section entitled “Liquidity and Capital Resources” in Management’s Discussion and Analysis.
Non-Weather Related Changes in Natural Gas Consumption Patterns
Natural gas supply requirements for the utility are also affected by changes in the natural gas consumption patterns of our customers that are driven by factors other than weather. Natural gas usage per customer may decline as customers change their consumption patterns for various reasons, including: (i) more volatile and higher natural gas prices; (ii) customer upgrades to more energy efficient appliances and building structures and (iii) a decline in the economy in the region in which we operate.
WGL Holdings, Inc.
In certain of Washington Gas Light Company
Part I
Item 1. Business (continued)
For each jurisdiction in which Washington Gas operates, changes in customer usage profiles are reflected in rate case proceedingsGas’ jurisdictions (Maryland and rates are adjusted accordingly. Changes in customer usage by existing customers that occur subsequent to rate case proceedings in Maryland generally will not change revenues because the RNA mechanism stabilizes the level of delivery charge revenues received from customers.
In Virginia, decoupling rate mechanisms for residential, small commercial and industrial and group metered apartment customers permit Washington Gas to adjust revenues for non-weather related changes in customer usage. The WNA and the CRAVirginia) there are billing mechanisms that togetherin place which are designed to eliminate the effects of bothvariance in customer usage caused by weather and other factors such as conservation.
In the District of Columbia, there is no weather normalization billing mechanism, nor does Washington Gas hedge to offset the effects of weather. As a decreaseresult, colder or warmer weather will result in customer usagevariances to financial results. On January 13, 2020, Washington Gas filed an application with the PSC of DC that occurs subsequent torequested approval for a rate case proceeding would have the effect of reducing revenues, which could be offset by additions of new customers.weather normalization billing mechanism.
Natural Gas Supply and Capacity
Capacity and Supply Requirements
Washington Gas must contract for reliable and adequate natural gas supplies, interstate pipeline capacity and storage capacity to provide natural gas to its distribution system, while considering: (i) the dynamics of the commodity supply and interstate pipeline and storage capacity markets; (ii) its own on-system natural gas peaking facilities and (iii) the characteristics of its customer base. Energy-marketing companies that sell natural gas to customers located within Washington Gas’ service territory are responsible for acquiring natural gas for their customers; however, Washington Gas allocates certain storage and pipeline capacity related to these customers in accordance with regulatory requirements.
system. Washington Gas has adopted a diversified portfolio approach designed to address constraints on supply by using multiple supply receipt points, dependable interstate pipeline transportation and storage arrangements, and its own substantial storage and peak shaving capabilities. Washington Gas’ supply and pipeline capacity plan is based on forecasted system requirements, and takes into account estimated load growth, attrition, conservation, geographic location, interstate pipeline and storage capacity and contractual limitations and the forecasted movement of customers between bundled service and delivery service. Under reduced supply conditions, Washington Gas may implement contingency plans in order to maximize the number of customers served. Contingency plans include requests to the general population to conserve and target curtailments to specific sections of the system, consistent with curtailment tariffs approved by regulators in each of Washington Gas’ three jurisdictions.
Washington Gas obtains natural gas supplies that originate from multiple regions throughout the United States. At September 30, 2018 and 2017,December 31, 2019, Washington Gas had multiple service agreements with four pipeline companies that provides firm transportation and/or storage services directly to Washington Gas’ city gates. These contracts have expiration dates ranging from fiscalcalendar years 20192020 to 2045.2044. Additionally, Washington Gas has contracted with various interstate pipeline and storage companies to add to its storage and transportation capacity and continues to monitor other opportunities to acquire or participate in additional pipeline and storage capacity to support customer growth and improve or maintain the high level of service expected by its customer base.
Asset Optimization Derivative Contracts
Under the asset optimization program, Energy-marketing companies that sell natural gas to customers located within Washington Gas’ service territory are responsible for acquiring natural gas for their customers; however, Washington Gas utilizes itsallocates certain storage and transportation capacity resources when they are not being used to serve its utility customers. Washington Gas executes commodity-related physical and financial contracts in the form of forwards, futures and options as part of an asset optimization program that is managed by its internal staff. These transactions are accounted for as derivatives. The objective of this program is to derive a profit to be shared with Washington Gas' utility customers. Washington Gas enters into these derivative transaction contracts to secure operating margins that will ultimately be shared between customers and Washington Gas. Because these sharing mechanisms are approved by our regulators in all three jurisdictions, any changes in fair value of the derivatives are recorded either through earnings for margins that are retained by Washington Gas or as regulatory assets or liabilities if the ultimate realized gains and losses will be included in the rates charged to customers.
The derivatives used under this program are subject to fair value accounting treatment which may cause significant period-to-period volatility in earnings from unrealized gains and losses associated with changes in fair value for the portion of net profits attributed to shareholders. However, this earnings volatility does not change the realized margins that Washington Gas expects to earn from these transactions. All physically and financially settled contracts under our asset optimization program are reported on a net basis in the statements of income in “Utility cost of gas.” Total net margins including unrealized gains and losses recorded to “Utility cost of gas” after sharing and management fees associated with all asset optimization transactions for the years ended September 30, 2018, 2017 and 2016, respectively, were net gains of $34.3 million, $82.9 million, and $43.8 million.
WGL Holdings, Inc.
Washington Gas Light Company
Part I
Item 1. Business (continued)
Refer to the sections entitled “Results of Operations — Regulated Utility Operating Results” and “Market Risk” in Management’s Discussion for further discussion of the asset optimization program and its effect on earnings.
Annual Sendout
As reflected in the table below, Washington Gas received natural gas from multiple sources in fiscal year 2018 and expects to use those same sources to satisfy customer demand in fiscal year 2019. Firm transportation denotes gas transported directly to the entry point of Washington Gas’ distribution system in contractual volumes. Transportation storage denotes volumes stored by a pipeline during the spring, summer and fall for withdrawal and delivery to the Washington Gas distribution system during the winter heating season to meet load requirements. Peak load requirements are met by: (i) underground natural gas storage at the Hampshire storage field; (ii) the local production of propane air plants located at Washington Gas-owned facilities in Rockville, Maryland (Rockville Station) and in Springfield, Virginia (Ravensworth Station) and (iii) other peak-shaving resources. Unregulated third-party marketers acquire interstate pipeline and storage capacity and the natural gas commodity on behalf of Washington Gas’ delivery service customers under customer choice programs. Washington Gas also provides transportation, storage and peaking resources to unregulated third-party marketers (refer to the section entitled “Natural Gas Unbundling”). These retail marketers have natural gas delivered to the entry point of Washington Gas’ distribution system on behalf of those utility customers that have decided to acquire their natural gas commodity on an unbundled basis, as discussed below.
Excluding the sendout of sales and deliveries of natural gas used for electric generation, the following table outlines total sendout of the system. The sources of delivery and related volumes that were used to satisfy the requirements of fiscal year 2018 and those projected for pipeline year 2019 are shown in the following table.
|
| | | | | | | | | |
Sources of Delivery for Annual Sendout |
| (In millions of therms) | | Fiscal Year |
| Sources of Delivery | | Actual 2017 | | Actual 2018 | | Projected 2019(a) |
| Firm Transportation | | 513 |
| | 643 |
| | 587 |
|
| Transportation Storage | | 398 |
| | 501 |
| | 390 |
|
| Hampshire Storage, Company-Owned Propane-Air Plants, and other Peak-Shaving Resources | | 29 |
| | 45 |
| | 29 |
|
| Unregulated Third-Party Marketers | | 783 |
| | 845 |
| | 861 |
|
| Total | | 1,723 |
| | 2,034 |
| | 1,867 |
|
(a)Based on normal weather.
Design Day Sendout
The effectiveness of Washington Gas’ capacity resource plan is largely dependent on the sources used to satisfy forecasted and actual customer demand requirements for its design day. For planning purposes, Washington Gas assumes that all interruptible customers will be curtailed on the design day. Washington Gas’ forecasted design day demand for the 2018-2019 winter season is 19.9 million therms and Washington Gas’ projected sources of delivery for design day sendout is 21.0 million therms. This provides a reserve margin of approximately 5.3%. Washington Gas plans for the optimal utilization of its storage and peaking capacity to reduce its dependency on firm transportation and to lower pipeline capacity costs. The following table reflects the sources of delivery that are projectedrelated to be used to satisfy the forecasted design day sendout estimate for fiscal year 2019.
WGL Holdings, Inc.
Washington Gas Light Company
Part I
Item 1. Business (continued)
|
| | | | | |
| Projected Sources of Delivery for Design Day Sendout |
| (In millions of therms) | Fiscal Year 2019 |
| Sources of Delivery | Volumes | | Percent |
| Firm Transportation | 6.8 |
| | 32 | % |
| Transportation Storage | 8.5 |
| | 41 | % |
| Hampshire Storage, Company-Owned Propane-Air Plants and other Peak-Shaving Resources | 5.5 |
| | 26 | % |
| Unregulated Third-Party Marketers | 0.2 |
| | 1 | % |
| Total | 21.0 |
| | 100 | % |
Natural Gas Unbundling
At September 30, 2018, customerCustomer choice programs for natural gas customers wereare available to all of Washington Gas’ regulated utility customers in the District of Columbia, Maryland and Virginia. These programs allow customers to purchase their natural gas from unregulated third-party marketers, rather than purchasing this commodity as part of a bundled service from the local utility. Of Washington Gas’ 1.2 million active customers at September 30, 2018, approximately 174,000 customers purchased their natural gas commodity from unregulated third-party marketers.
The following table provides the percentage of customers participating in customer choice programs in Washington Gas’ jurisdictions at September 30, 2018.
|
| | | | | | |
| Participation in Customer Choice Programs |
| At September 30, 2018 |
| Jurisdiction | Customer Class | Eligible Customers |
| | | Total | | % Participating |
District of Columbia | Firm: | | | |
| | Residential | 150,417 |
| | 9 | % |
| | Commercial | 12,954 |
| | 34 | % |
| | Interruptible | 145 |
| | 98 | % |
| Maryland | Firm: | | | |
| | Residential | 454,121 |
| | 19 | % |
| | Commercial | 31,316 |
| | 42 | % |
| | Interruptible | 180 |
| | 99 | % |
| | Electric Generation | 2 |
| | 100 | % |
| Virginia | Firm: | | | |
| | Residential | 498,790 |
| | 9 | % |
| | Commercial | 29,886 |
| | 31 | % |
| | Interruptible | 165 |
| | 95 | % |
| Total | | 1,177,976 |
| | |
When customers choose to purchase the natural gas commodity from unregulated third-partyretail marketers, Washington Gas’ net income is not affected because Washington Gas charges its customers the cost of gas without any mark-up. When customers select an unregulated third-party marketer as their gas supplier, Washington Gas continues to charge these customers to deliver natural gas through its distribution system at rates identical to the delivery portion of the bundled sales service customers. Of Washington Gas’ 1.2 million active customers at December 31, 2019, approximately 171,000 customers purchased their natural gas commodity from unregulated third-party marketers.
Asset Optimization Contracts
Washington Gas, under its asset optimization program, makes use of storage and transportation capacity resources when those assets are not required to serve utility customers. The objective of this program is to derive a profit to be shared with its utility customers. Washington Gas executes commodity-related physical and financial contracts in the form of forwards, futures and options as part of an asset optimization program that is managed by its internal staff. These transactions are accounted for as derivatives. Sharing mechanisms are approved by our regulators in all three jurisdictions, accordingly, any changes in fair
Washington Gas Light Company
Part I
Item 1. Business (continued)
value of the derivatives are recorded either through earnings for margins that are retained by Washington Gas or as regulatory assets or liabilities for realized gains and losses that will be included in the rates charged to customers.
Refer to the sections entitled “Results of Operations” and “Market Risk” in Management’s Discussion and Analysis for further discussion of the asset optimization program and its effect on earnings.
Safety and Reliability of the Natural Gas Distribution System
Maintaining and improving the public safety and reliability of Washington Gas’ distribution system is our highest priority, providingpriority. Doing so allows Washington Gas to provide benefits to both customers and investors through improved customer service. Washington Gas continually monitors and reviews changes in requirements of the codes and regulations that govern the operation of the distribution system and refines its safety practices, with a particular focus on design, construction, maintenance, operation, replacement, inspection and monitoring practices to meet or exceed these requirements. Significant changes in regulations can impact the cost of operating and maintaining our distribution system.
WGL Holdings, Inc.
Washington Gas Light Company
Part I
Item 1. Business (continued)
has accelerated pipe and infrastructure replacement programs in place in the District of Columbia, Maryland, and Virginia. These are long-term programs subject to both changing conditions and regulatory review and approval in five-year increments. Washington Gas is accelerating pipe and infrastructure replacement to further enhance the safety and reliability of the natural gas delivery system. Washington Gas is allowed to begin recovering the cost, including a return, for these investments immediately through approved surcharges for each accelerated pipe or infrastructure replacement program. Once new base rates are put into effect in a given jurisdiction, expenditures previously recovered through the surcharge will be collected through the new base rates.
Competition
The Natural Gas Delivery Function
The natural gas delivery function the core business of Washington Gas, continues to beis regulated by local and state regulatory commissions. In developingTo support this core business,function, Washington Gas has invested approximately $4 billion through September 30, 2018,of invested assets at December 31, 2019, to build, maintain and serve customers through safe and reliable distribution system assets. Because of the high fixed costs and significant safety and environmental considerations associated with building, operating and operatingmaintaining a natural gas distribution system, Washington Gas expects to continue being the onlysole owner and operator of a distribution system in its current franchise areas for the foreseeable future. The nature of Washington Gas’ customer base and the distance of most customers from interstate pipelines mitigate the threat of bypass ofbypassing its facilities by other potential delivery service providers.
Competition with Other Energy Products
Washington Gas faces competition based on customers’ preference for other energy products and the prices of those products compared to natural gas. In the residential market, which generates a significant portion of Washington Gas’ net income, the most significant product competition occurs between natural gas and electricity. Because the cost of electricity is affected by the cost of fuel used to generate electricity, such as natural gas, Washington Gas generally maintains a price advantage over competitive electricity supply in its service area for traditional residential uses of energy such as heating, water heating and cooking. In 2019, Washington Gas continues to attract the majority of the newadded 11,156 residential construction market in its service territory,customers and consumers’ continuing preference for natural gas allows Washington Gas to maintain a strong market presence. The following table lists the new customer meters added by jurisdiction742 commercial, interruptible and major rate class for the year ended September 30, 2018.
|
| | | | | | | | | | | | |
| New Customer Meters by Area |
| | Residential | | Commercial and Interruptible | | Group Metered Apartments | | Total |
| Maryland | | 5,692 |
| | 395 |
| | — |
| | 6,087 |
|
| Virginia | | 5,209 |
| | 344 |
| | 1 |
| | 5,554 |
|
| District of Columbia | | 818 |
| | 121 |
| | 1 |
| | 940 |
|
| Total | | 11,719 |
| | 860 |
| | 2 |
| | 12,581 |
|
group metered apartments. In the interruptible market, fuel oil is the prevalent energy alternative to natural gas. Washington Gas’ success in this market depends largely on the relationship between natural gas and oil prices. The supply of natural gas primarily is derived from domestic sources, and the relationship between supply and demand generally has the greatest impact on natural gas prices. Since the source of a large portion of oil comes from foreign countries, political events and foreign currency conversion rates can influence oil supplies and prices to domestic consumers.
Critical Factors
Factors critical to the success of the regulated utility segment include: (i) operating a safe and reliable natural gas distribution system; (ii) having sufficient natural gas supplies to meet customer demands; (iii) being competitive with other sources of energy such as electricity, fuel oil and propane; (iv) having access to sources of liquidity; (v) recovering the costs and expenses of this business in the rates charged to customers and (vi) earning a just and reasonable rate of return on invested capital.
RETAIL ENERGY-MARKETING SEGMENT
The retail energy-marketing segment consists of the operations of WGL Energy Services, which competes with regulated utilities and other unregulated third-party marketers to sell natural gas and/or electricity directly to residential, commercial and industrial customers in Maryland, Virginia, Delaware, Pennsylvania and the District of Columbia. WGL Energy Services is subject to regulation by the public service regulatory commissions of the states in which the company is authorized as a competitive service provider. These regulatory commissions: (i) authorize WGL Energy Services to provide service, (ii) review certain terms and conditions of service, (iii) establish the regulatory rules for interactions between the utility and the competitive service provider and (iv) issue orders and promulgate rules that establish the broad structure and conduct of retail energy markets. Changes to the rules, rates and orders by the regulatory commissions may affect WGL Energy Services’ financial performance.
WGL Energy Services buys natural gas and electricity with the objective of earning a profit through competitively priced sales contracts with end-users. These commodities are delivered to retail customers through the distribution systems owned by regulated utilities. Washington Gas is one of several utilities that deliver gas to, and on behalf of, WGL Energy Services.
WGL Holdings, Inc.
Washington Gas Light Company
Part I
Item 1. Business (continued)
Unaffiliated electric utilities deliver all of the electricity sold by WGL Energy Services. WGL Energy Services bills its customers either independently or through the billing services of the regulated utilities that deliver its commodities. Refer to Note 17—Related Party Transactions of the Notes to Consolidated Financial Statements for further discussion of our purchase of receivables program.
WGL Energy Services also sells wind and other RECs and carbon offsets to retail customers. WGL Energy Services owns solar generating assets which are dedicated to five specific customers. The results of operations for these assets are reported within the Commercial Energy Systems segment. WGL Energy Services does not own or operate any other electric generation, transmission or distribution assets.
At September 30, 2018, WGL Energy Services served approximately 108,900 residential, commercial and industrial natural gas customer accounts and approximately 101,700 residential, commercial and industrial electricity customer accounts located in Maryland, Virginia, Delaware, Pennsylvania and the District of Columbia. Its customer concentration is such that the loss of any one customer or group of customers would not have a significant adverse effect on its business.
Seasonality of Business Operations
The operations of WGL Energy Services are seasonal, with larger amounts of electricity being sold in the summer and peak winter months and larger amounts of natural gas being sold in the winter months. Working capital requirements can vary significantly during the year and these variations are financed through internally generated funds and WGL’s issuance of commercial paper and unsecured short-term bank loans. WGL Energy Services accesses these funds through the WGL money pool. For a discussion of the WGL money pool, refer to the section entitled “Money Pool” in Management’s Discussion and Analysis.
Natural Gas and Electricity Supply
WGL Energy Services contracts for storage and pipeline capacity to meet its customers’ needs primarily through transportation releases and storage services allocated from the utility companies in the various service territories in which it provides retail energy commodity.
On February 20, 2013, WGL Energy Services entered into a five-year secured supply arrangement with Shell Energy North America (US), LP (Shell Energy). Under this arrangement, WGL Energy Services has the ability to purchase the majority of its power, natural gas and related products from Shell Energy in a structure that reduces WGL Energy Services’ cash flow risk from collateral posting requirements. While Shell is intended to be the majority provider of natural gas and electricity, WGL Energy Services retains the right to purchase supply from other providers. On November 7, 2016, the supply arrangement was extended for two years, expiring in 2020.
Natural gas supplies are delivered to WGL Energy Services’ market territories through several interstate natural gas pipelines. To supplement WGL Energy Services’ natural gas supplies during periods of high customer demand, WGL Energy Services maintains gas storage inventory in storage facilities that are assigned by natural gas utilities such as Washington Gas. This storage inventory enables WGL Energy Services to meet daily and monthly fluctuations in demand and to minimize the effect of market price volatility.
The PJM Interconnection (PJM) is a regional transmission organization that regulates and coordinates generation supply and the wholesale delivery of electricity in the states and jurisdictions where WGL Energy Services operates. WGL Energy Services buys wholesale and sells retail electricity in the PJM market territory, subject to its rules and regulations.
Competition
Natural Gas. WGL Energy Services competes with regulated gas utilities and other third-party marketers to sell natural gas to customers both inside and outside of the Washington Gas service area.
Electricity. WGL Energy Services competes with regulated electric utilities and other third-party marketers to sell electricity to customers.
Marketers of natural gas and electric supply compete largely on price; therefore, gross margins are relatively small. To provide competitive pricing to its retail customers and in adherence to its risk management policies and procedures, WGL Energy Services manages its natural gas and electricity contract portfolios by attempting to closely match the commitments for gas and electricity deliveries from suppliers with requirements to serve sales customers.
WGL Energy Services’ residential and small commercial electric customer growth opportunities are significantly affected by the price for Standard Offer Service (SOS) offered by electric utilities. These rates are periodically reset for each customer class
WGL Holdings, Inc.
Washington Gas Light Company
Part I
Item 1. Business (continued)
based on the regulatory requirements in each jurisdiction. Customer growth opportunities either expand or contract due to the relationship of these SOS rates to current market prices.
For a discussion of WGL Energy Services’ exposure to and management of price risk, refer to the section entitled “Market Risk—Price Risk Related to the Non-Utility Segments” in Management’s Discussion.
Critical Factors
Factors critical to managing the retail energy-marketing segment include: (i) managing the market risk of the difference between the price committed to customers under sales contracts and the cost of natural gas and electricity needed to satisfy these commitments, including PJM costs and costs to meet renewable portfolio standards; (ii) having sufficient deliverability of natural gas and electric supplies and transportation to serve the demand of its customers, which can be affected by the ability of natural gas producers, pipeline gatherers, natural gas processors, interstate pipelines, electricity generators and regional electric transmission operators to deliver the respective commodities; (iii) access to sources of financial liquidity; (iv) managing credit risks associated with customers and suppliers; (v) controlling the level of selling, general and administrative expenses, including customer acquisition expenses and (iv) access to markets through customer choice programs or other forms of deregulation.
COMMERCIAL ENERGY SYSTEMS SEGMENT
The commercial energy systems segment consists of the operations of WGL Energy Systems, WGSW and the results of operations of wholly owned subsidiaries, consolidated tax equity and other investments and affiliate owned commercial distributed energy projects.
This segment focuses on clean and energy efficient solutions for its customers, driving earnings through (i) investing in distributed generation assets such as Solar PV systems, combined heat and power plants, and natural gas fuel cells and (ii) operating as a general contractor to upgrade the mechanical, electrical, water and energy-related infrastructure of large governmental and commercial facilities by implementing both traditional and alternative energy technologies. This segment has assets and activities across the United States.
As of September 30, 2018, this segment owned $577.1 million of operating distributed generation assets, generating a total of 342,306 megawatt hours in fiscal year 2018. Additionally, as of September 30, 2018, there was $11.0 million of signed projects under construction. These distributed generation assets drive revenue through the sale of renewable power generation under long-term power purchase agreements and the sale of renewable energy credits. As of September 30, 2018, we have $156.1 million in unamortized investment tax credits and grants related to these assets placed in service. These credits and grants are recognized as reductions in tax expense by amortizing them over the useful life of the underlying assets, typically 30 years.
Competition
There are many competitors in this business segment. In the renewable energy and distributed generation market, competitors primarily include other developers, tax equity investors, distributed generation asset owner firms and lending institutions. Within the government sector, competitors primarily include companies contracting with customers under Energy Savings Performance Contracting (ESPC) as well as utilities providing services under Utility Energy Saving Contracts (UESC). WGL Energy Systems competes on the basis of strong customer relationships developed over many years of implementing successful projects, developing and maintaining strong supplier relationships, and focusing in areas where it can bring relevant expertise.
Critical Factors
Factors critical to the success of the commercial energy systems segment include: (i) generating adequate sales commitments from distributed generation channel partners and customers; (ii) generating adequate sales commitments from the government and private sectors in the facility construction and retrofit markets; (iii) building a stable base of customer relationships; (iv) estimating and managing fixed-price contracts with contractors; (v) managing selling, general and administrative expenses; (vi) managing price and operational risk associated with distributed energy projects and (vii) successful operation and optimization of commercial assets.
MIDSTREAM ENERGY SERVICES SEGMENT
WGL Midstream specializes in the investment, management, development and optimization of natural gas storage and transportation assets. At September 30, 2018, WGL Midstream had infrastructure investments totaling $770.0 million. For a discussion of WGL Midstream's infrastructure investments, refer to the section entitled "Liquidity and Capital Resources--Infrastructure Investments" in Management's Discussion.
WGL Holdings, Inc.
Washington Gas Light Company
Part I
Item 1. Business (continued)
Additionally, WGL Midstream provides natural gas related solutions to its customers and counterparties including producers, utilities, local distribution companies, power generators, wholesale energy suppliers, LNG exporters, pipelines and storage facilities. Moreover, WGL Midstream contracts for storage and pipeline capacity in its trading activities through both long term contracts and short term transportation releases. WGL Midstream also contracts for physical natural gas sales and purchases on both a long term and short term basis.
WGL Midstream enters into both physical and financial derivative transactions to mitigate risks while seeking to maximize potential profits from the optimization of the transportation and storage assets it has under contract. These derivatives may cause significant period-to-period volatility in earnings as recorded under GAAP; however, this earnings volatility will not change the realized margins that WGL Midstream expects to earn on the underlying physical transactions.
WGL Midstream seeks to manage price risk exposure under its risk management policy by matching its forward physical and financial positions with its asset base. For a discussion of WGL Midstream’s exposure to and management of price risk, refer to the section entitled “Market Risk-Price Risk Related to the Non-Utility Segments” in Management’s Discussion and Analysis.
Competition
WGL Midstream competes with other midstream infrastructure and energy services companies, wholesale energy suppliers, producers and other non-utility affiliates of regulated utilities for the acquisition of natural gas storage and transportation assets.
Price Volatility
WGL Midstream can be positively or negatively affected by significant volatility in the wholesale price of natural gas. WGL Midstream risk management policies and procedures are designed to minimize the risk that purchase commitments and the related sale commitments do not closely match. In general, profit opportunities for trading activities are increased for WGL Midstream with increased volatility in natural gas prices. These opportunities are primarily in short term transportation and storage spreads, seasonal storage spreads and long term supply or basis transactions.
Critical Factors
Factors critical to the success of WGL Midstream’s operations include: (i) pipeline investment projects are on time and on budget within set parameters; (ii) internal risk management policies; (iii) winning business in a competitive marketplace; (iv) managing counterparty credit risk; (v) managing contract risks associated with the purchase and sale of natural gas, including index pricing and changes in natural gas markets; (vi) maintaining and leveraging expertise in managing and optimizing natural gas related contracts; (vii) access to sources of financial liquidity and (viii) the level of general and administrative expenses.
OTHER ACTIVITIES
Activities and transactions that are not significant enough on a stand-alone basis to warrant treatment as an operating segment, and that do not fit into one of our other operating segments, are aggregated as “Other activities” in the Operating Segment Financial Information. Transaction fees related to the merger with AltaGas as well as administrative and business development activity costs associated with WGL and Washington Gas Resources are included in this segment.
ENVIRONMENTAL MATTERSEnvironmental Matters
We are subject to federal, state and local laws and regulations related to environmental matters. These laws and regulations may require expenditures over a long timeframean extended time frame to control environmental effects. Almost allMost of the environmental liabilities we have recorded are for costs expected to be incurred to remediate sites where we or a predecessor affiliate operated manufactured gas plants (MGPs).plants. Estimates of liabilities for environmental response costs are difficult to determine with precision because of the various factors that can affect their ultimate level. These factors include, but are not limited to, the following:
the complexitySee Note 12 — Environmental Matters of the site;
changes inNotes to Financial Statements for further discussion of environmental laws and regulations at the federal, state and local levels;response costs.
the number of regulatory agencies or other parties involved;
new technology that renders previous technology obsolete or experience with existing technology that proves ineffective;
the level of remediation required and
WGL Holdings, Inc.
Washington Gas Light Company
Part I
Item 1. Business (concluded)
(continued)
variation between the estimated and actual period of time required to respond to an environmentally contaminated site.Available Information
Washington Gas has identified up to ten sites where it ormakes copies of its predecessors may have operated MGPs. Washington Gas last used any such plant in 1984. In connection with these operations, weSEC filings available, free of charge, on its website (www.washingtongas.com) as reasonably practicable after they are aware that coal tar and certain other by-products of the gas manufacturing process are present at or near some former sites and may be present at others.
Washington Gas is currently remediating its East Station property, which is adjacent to the Anacostia River, including ground water pump and treat, tar recovery, soil encapsulation and other treatment. Washington Gas is conducting a remedial investigation and feasibility study under a 2012 consent decreefiled with the DistrictSEC. Such filings are also available, free of Columbia and the federal government and additional remediation may be required. In addition, manufactured gas waste was discovered at an adjoining property, a parcel of land adjacent to East Station. Washington Gas has agreed to work with the owners of the adjoining property to perform a site investigation, ground water sampling, and reportcharge, on the contamination at the site pursuant to oversight by Department of Energy and Environment (DOEE)SEC’s website (www.sec.gov/edgar/).
Washington Gas received a letter in February 2016 from the District of Columbia and National Park Service regarding the Anacostia River Sediment Project, indicating that the District of Columbia is conducting a separate remedial investigation and feasibility study of the river to determine if and what cleanup measures may be required and to prepare a natural resource damage assessment. The sediment project draft remedial investigation report issued on March 30, 2018 identifies East Station as one of seventeen potential environmental cleanup sites. During the fiscal year ended September 30, 2017, Washington Gas received a request for information related to three Washington Gas properties. We are not able to estimate the total amount of potential damages or timing associated with the District of Columbia's environmental investigation on the Anacostia River at this time. While an allocation method has not been established, Washington Gas has accrued an amount based on a potential range of estimates.
See Note 11—Environmental Matters of the Notes to Consolidated Financial Statements for further discussion of environmental response costs.
OTHER INFORMATION
At September 30, 2018, we had 1,648 employees comprising 1,519 utility and 129 non-utility employees.
WGL has determined that none of its entities, either separately or in the aggregate, will be classified as swap dealers or major swap participants under the Dodd-Frank Act.
The following documentation is available on the Web site for WGL (www.wglholdings.com) under “Corporate Governance”: our code of conduct, the AltaGas Code of Business Ethics, which also applies to WGL, and the WGL Audit Committee Charter. Any changes or amendments to these documents will also be posted to this section of the WGL Web site.
The following documentation is available on the Web site for Washington Gas (www.washingtongas.com) under “Corporate Information”/“Governance”: our code of conduct, the AltaGas Code of Business Ethics, which also applies to Washington Gas, the Washington Gas Corporate Governance Guidelines, and the Charters for the Governance & Environment, Health and Safety, Audit and Human Resources Committees of Washington Gas. Any changes or amendments to these documents will also be posted to this section of the Washington Gas Web site.
Copies of any of the aforementioned documents may be obtained by request to the Corporate Secretary at WGL Holdings, Inc., 1000 Maine Ave., S.W., Washington, D.C. 20024. Also on the WGL corporate Web site is additional information about WGL Holdings and free access to our annual reports on Form 10-K, quarterly reports on Form 10-Q, current reports on Form 8-K and any amendments filed with or furnished to the Securities and Exchange Commission.
Our research and development costs during fiscal years 2018, 2017 and 2016 were not material.
WGL Holdings, Inc.
Washington Gas Light Company
Part I
Item 1A. Risk Factors
The risk factors described below should be read in conjunction with other information included or incorporated by reference in this annual report on Form 10-K, including an in-depth discussion10-K. Based on current information, the company believes that the following identifies the most significant risk factors that could affect its operations.
The ownership and operation of Washington Gas’ business is subject to hazards of transporting, storing, and marketing hydrocarbon products.
These hazards include, without limitation, blowouts, fires, explosions, gaseous leaks, releases and migration of harmful substances, hydrocarbon spills, corrosion, and acts of vandalism and terrorism. Any of these hazards can interrupt operations, impact AltaGas’ reputation, cause loss of life or personal injury, result in loss of or damage to equipment, property, information technology systems, related data and control systems, and cause environmental damage that may include polluting water, land or air.
Further, such ownership and operations carry the potential for liability related to worker health and safety, including, without limitation, the risk of any or all of government imposed orders to remedy unsafe conditions, potential penalties for contravention of health and safety laws, licenses, permits and other approvals, and potential civil liability. Compliance with health and safety laws (and any future changes) and the requirements of licenses, permits and other approvals are expected to remain material to Washington Gas’ business.
No assurances can be given that the occurrence of any of the above listed events or the additional workers’ health and safety issues relating thereto will not require unanticipated expenditures, or result in fines, penalties or other consequences (including, without limitation, changes to operations) material to Washington Gas’ business and operations.
Leaks, mechanical problems, incidents or other operational issues could affect public safety and the reliability of Washington Gas’ distribution system, which could materially affect Washington Gas’ results of operations, financial condition and cash flows.
Washington Gas’ business is exposed to operational issues, hazards and risks inherent in the section entitled “Management’s Discussionstoring and Analysis of Financial Condition and Results of Operations.”
The risk factors discussed below are separated into three sections. The first discusses those factorstransporting natural gas that could affect the consolidated entitypublic safety and reliability of WGL Holdingsits distribution system. These issues, such as leaks, equipment failure, problems and incidents, including explosions and fire, could and have resulted in legal liability, repair and remediation costs, increased operating costs, significant increased capital expenditures, regulatory fines and penalties and other costs and a loss of customer confidence. Any liabilities resulting from the occurrence of any of these events may not be covered by insurance, or may not be fully covered by insurance (which typically only covers injuries or property loss), and Washington Gas may be unable to recover from customers through the regulatory process all of these repair, remediation and other costs and earn its authorized rate of return on these costs.
Washington Gas may be unable to obtain an adequate supply of gas to satisfy present and future customer demand and it may be unable to secure the necessary transportation or storage capacity to deliver or acquire the volume of gas necessary to meet its current obligations or growth demands.
In order to service customer demand, the Company must acquire an adequate supply of natural gas, have the appropriate capacity to store its gas supply, and have adequate pipeline transportation capacity to secure the transportation of its required gas supply. We purchase almost all of our natural gas supply from third party sources that must then be transported primarily through pipelines to our service territories. The Company depends on the ability of natural gas producers, pipeline gathers, natural gas processes, commodity storage facilities, and interstate pipelines to meet these requirements. In addition, the Company may construct transmission and distribution pipe to deliver additional capacity into growth areas within its service territory in order to meet customer demand. If the Company is unable to secure adequate supplies of gas in a timely manner because of a failure of its upstream suppliers or if it were unable to acquire adequate pipeline capacity or construct new infrastructure to transport our gas, the Company may be unable to meet the requirements of its customers.
Washington Gas Light Company
Part I
Item 1A. Risk Factors (continued)
A significant disruption to or reduction in pipeline capacity may occur due to events such as operational failures or disruptions, hurricanes, tornadoes, floods, or other weather-related events, freeze off of natural gas wells, terrorist or cyberattacks or other acts of war, or legislative or regulatory actions or requirements, including remediation related to integrity inspections and future regulations related to climate change, could reduce the Company’s normal supply of gas, which may affect the Company’s ability to serve customer demand and may reduce the Company’s earnings. These factors may also cause the demands of our customers to fluctuate or increase, for example our customers may require additional natural gas during periods of sustained cold weather. Further, our ability to construct new infrastructure to transport our gas could be adversely affected by the timing of Washington Gas’ participation in new interstate pipeline construction projects, local permitting requirements, the ability to acquire necessary rights of way, and an increase in legal challenges facing large infrastructure projects designed to bring commodity supply to Washington Gas’ market.
Additionally, Washington Gas purchases almost all of its subsidiaries,gas supply from sources that must then be transported to its service territory. There may be inadequate pipeline transportation or storage capacity to meet the Company’s current or future demands. Any inability to secure an adequate supply of gas or to secure or build adequate pipeline transportation capacity to satisfy customer demands could result in defaults under contracts with customers, penalties and financial damage payments, costs relating to procedures to recover from a disruption of service, the loss of key licenses and operating authorities, and the loss of customers, any of which could have a material adverse effect on the Company’s business and financial results.
Cyberattacks, including cyberterrorism or other information technology security breaches, or information security or technology failures may disrupt our business operations, increase our costs, lead to the disclosure of confidential information, and damage our reputation.
Washington Gas. The second section describesGas’ business processes are increasingly reliant upon information systems automation provided by infrastructure, technologies, and data. A failure of these information systems could lead to the impairment of business processes, and there is a risk of cascading failure of information systems leading to the impairment of multiple business processes. Security breaches of our information technology infrastructure, including cyberattacks and cyberterrorism, or other risk factors affectingfailures of our information technology infrastructure could lead to disruptions of our natural gas distribution operations and otherwise adversely impact our ability to safely and effectively operate our pipelines and serve our customers. Such security breaches of our information technology infrastructure could adversely affect our business reputation, diminish customer confidence, subject us to financial liability or increased regulation, increase our costs and expose us to material legal claims and liability and adversely affect our operations and financial results. Despite steps Washington Gas includedmay take to detect, deter, mitigate, and respond to potential security threats, the techniques used by those who wish to obtain unauthorized access, disable or sabotage systems, or steal confidential information and data change frequently and there is no guarantee that the Company will be successful in protecting against cyberattacks. To the extent that the occurrence of any of these cyberattacks is not fully insured, it could adversely affect Washington Gas’ financial condition and results of operations.
In addition, the Company collects personally identifiable information (PII) regarding its customers and employees as part of its business processes and activities. An attack on or failure of our information technology systems could result in the unauthorized release of customer or employee PII or Company data that is crucial to our operational security or could adversely affect our ability to deliver and collect on customer bills. The federal and state legislative and regulatory environment surrounding PII, information security and data privacy is evolving and is likely to become increasingly demanding. Should the Company experience a breach, it could face substantial compliance costs, reputational damage, and uncertain litigation risks.
Washington Gas may encounter unexpected difficulties or costs in meeting commitments made under “Risks Affectingvarious orders and agreements associated with regulatory approvals for the Merger.
As a result of the process to obtain regulatory approvals required for the Merger, Washington Gas." The final section focusesGas is committed to various programs, contributions and investments in several agreements and regulatory approval orders. It is possible that Washington Gas may encounter delays, unexpected difficulties or additional costs in meeting these commitments in compliance with the terms of the relevant agreements and orders. Failure to fulfill the commitments in accordance with their terms could result in increased costs or result in penalties or fines that could have a material adverse effect on those factors affecting non-utility entities.Washington Gas’ business, financial condition, operating results and prospects.
RISKS RELATING TO WGL AND ALL OF ITS SUBSIDIARIES
The merger of WGL with AltaGas may not achieve its anticipated results, and WGL, including Washington Gas, may be unable to integrate the operations of AltaGas in the manner expected.
Washington Gas Light Company
Part I
Item 1A. Risk Factors (continued)
WGL and AltaGas entered into the Merger Agreement with the expectationexpecting that the merger will result inMerger to yield various benefits, including, among other things, cost savings and operating efficiencies. Achieving the anticipated benefits of the mergerMerger is subject to a number of uncertainties, including whether the businesses of WGL and AltaGas can be integrated in an efficient, effective and timely manner. The combination of two independent businesses is complex, costly, and time-consumingtime-consuming; and may divert significant management attention and resources, including those of Washington Gas, to combining WGL’s and AltaGas’ business practices and operations, which could otherwise have been devoted to WGL’s business opportunities.opportunities of WGL and, specifically, Washington Gas. This process may disrupt WGL’s and AltaGas’ respective businesses.Washington Gas’ business.
In addition, it is possible that the integration process could take longer than anticipated and could result in the disruption of WGL’s businesses,Washington Gas’ business, processes, and systemssystems; or inconsistencies in standards, controls, procedures, practices, and policies, any of which could adversely affect the combined company’s ability to achieve the anticipated benefits of the mergerMerger as and when expected. The overall combination of WGL’s and AltaGas’ businesses may also result in material unanticipated problems, expenses, liabilities, competitive responses, and loss of customer and other business relationships. Failure to achieve these anticipated benefits or the incurrence of unanticipated expenses and liabilities could materially adversely affect WGL’s business, financial condition, operating results and prospects, as well as that of the combined company.
Uncertainties associated with the merger may causehave a loss of management personnel and other key employees, which could adversely affect the future business and operations of the combined company.
WGL and AltaGas are dependentmaterial adverse effect on the experience and industry knowledge of their officers and other key employees to execute their respective business plans. The combined company’s success will depend in part upon its ability to retain key management personnel and other key employees of WGL and AltaGas. Current and prospective employees of WGL and AltaGas may experience uncertainty about their future roles with the combined company, which may materially adversely affect the ability of each of WGL and AltaGas to attract and retain key personnel going forward. WGL may also have difficulty addressing possible differences in corporate cultures and management philosophies. Accordingly, no assurance can be given that the combined company will be able to retain key management personnel and other key employees of WGL and AltaGas, which could materially adversely affect WGL’sWashington Gas’ business, financial condition, operating results and prospects.
WGL
Washington Gas may incur unexpected transaction fees and merger-related costs in connection with the merger.Merger.
WGL
Washington Gas expects to continue to incur a number of non-recurring expenses associated with consummating the merger,Merger, as well as continuing expenses related to combining the operations of the two companies. WGLWashington Gas may incur additional unanticipated costs in the integration of the businesses of WGLWashington Gas and AltaGas. Although WGLWashington Gas expects that the elimination of certain duplicative costs, as well as the realization of other efficiencies related to the integration of the two businesses, will offset the incremental transaction and merger-relatedany Merger-related costs over time, the combined company may not achieve this net benefit in the near term, or at all.
WGL may encounter unexpected difficulties or costs in meeting commitments made under various orders and agreements associated with regulatory approvals for the merger.
As a result of the process to obtain regulatory approvals required for the merger, WGL is committed to various programs, contributions and investments in several agreements and regulatory approval orders. It is possible that WGL may encounter delays, unexpected difficulties or additional costs in meeting these commitments in compliance with the terms of the relevant agreements and orders. Failure to fulfill the commitments in accordance with their terms could result in increased costs or result in penalties or fines that could materially adversely affect WGL’s business, financial condition, operating results and prospects.
WGL Holdings, Inc.
Washington Gas Light Company
Part I
Item 1A. Risk Factors (continued)
WGL and AltaGas may become targets of securities class action suits and derivative suits, which could result in substantial costs and divert management attention and resources.
Securities class action suits and derivative suits are often brought against companies who have entered into mergers and acquisition transactions. There can be no assurance that WGL or AltaGas will not be targets of such suits in the future, and no guarantee that WGL or AltaGas can successfully defend against any such actions. Defending against these claims, even if meritless, could result in substantial costs to WGL and AltaGas and could divert the attention of management.
A downgrade in WGL’s or AltaGas’ credit ratings could negatively affect WGL’s cost of and ability to access capital.
WGL’s ability to obtain adequate and cost-effective financing depends in part on its credit ratings. A negative change in its ratings outlook or any downgrade in its current investment-grade credit ratings by the rating agencies, particularly below investment grade, could adversely affect WGL’s costs of borrowing and/or access to sources of liquidity and capital. Further, a negative change in AltaGas’ ratings outlook or any downgrade in its credit ratings could negatively impact WGL’s ratings outlook or downgrade its credit ratings. Such downgrades could limit WGL’s access to the credit markets and increase the costs of borrowing under available credit lines. Should WGL’s credit ratings be downgraded, the interest rate on its borrowings under its existing credit facilities and commercial paper program, as well as on any future public or private debt issuances, would increase. An increase in borrowing costs without the ability to recover these higher costs in the rates charged to WGL’s customers, which would be impacted by the merger-related commitment that prohibits Washington Gas from recovering any incremental financing costs due to a credit downgrade, could adversely affect earnings or cash flows by limiting WGL’s ability to earn its allowed rate of return. And if WGL falls below investment grade, WGL may need to obtain additional credit support which may include obtaining a parent guarantee from AltaGas.
WGL may be unable to access capital or the cost of capital may significantly increase.
WGL’s ability to obtain adequate and cost-effective financing is dependent upon the liquidity of the financial markets, in addition to its credit ratings. Disruptions in the capital and credit markets or waning investor sentiment could adversely affect WGL’s ability to access short-term and long-term capital. WGL’s access to funds under its commercial paper program is dependent on investor demand for its commercial paper. Disruptions and volatility in the global credit markets could limit the demand for WGL’s commercial paper or result in the need to offer higher interest rates to investors, which would result in higher expense and could adversely impact liquidity.
As a subsidiary of AltaGas, WGL also may become a party to AltaGas’ existing debt arrangements or rely on access to short-term intercompany borrowings. The inability to access adequate capital or the increase in cost of capital may require WGL to conserve cash, prevent or delay WGL from making capital expenditures, require WGL to reduce or eliminate distributions to AltaGas or other discretionary uses of cash or could negatively affect its future growth or earnings. A significant reduction in WGL’s liquidity could cause a negative change in its ratings outlook or even a reduction in its credit ratings. This could in turn further limit WGL’s access to credit markets and increase its costs of borrowing.
As an indirect, wholly ownedwholly-owned subsidiary of AltaGas, WGL is affected by AltaGas’ strategic decisions and performance.
As an indirect, wholly owned subsidiary of AltaGas, WGL’s business and operating performance can be affected by a wide range of strategic decisions that AltaGas may make from time to time. Significant changes in AltaGas’ strategy, its relationship with WGL, as well as material adverse changes in the performance of AltaGas, could have a material adverse effect on WGL’s business, financial condition, operating results and prospects.
Changes to government fiscal and trade policies and state/local renewable energy mandates could adversely affect WGL’s strategic decisions and operating performance.
Any changes in the US trade policy could trigger retaliatory actions by affected companies resulting in increased costs for goods used in our normal course of business, such as solar panels and steel pipe. Additionally, state and local initiatives adopting or increasing renewable portfolio standards could result in lower demand of natural gas due to mandatory or voluntary efforts.
WGL is a holding company and we depend on the receipt of dividends and other payments from our subsidiaries to pay dividends to our parent company and to pay principal and interest on our outstanding debt.
WGL is a holding company whose assets consist primarily of investments in subsidiaries. Accordingly, we conduct all of our operations through our subsidiaries. Our ability to pay dividends to our parent company and to pay principal and accrued interest on our outstanding debt depends on the payment of dividends to us by certain of our subsidiaries or the repayment of funds to us by our subsidiaries. Our subsidiaries, in turn, may be restricted from paying dividends, making repayments or making other distributions to us for financial, regulatory, legal or other reasons. The extent to which our subsidiaries are not able to pay dividen
WGL Holdings, Inc.
Washington Gas Light Company
Part I
Item 1A. Risk Factors (continued)
ds or repay funds to us may adversely affect our ability to pay dividends to our parent company and principal and interest to holders of our debt.
If we are unable to access sources of liquidity or capital, or if the cost of funds increases significantly, our business, financial results and strategic growth plans may be adversely affected.
WGL and Washington Gas require access to sources of liquidity to fund our operations and to support our growth strategy. Our ability to obtain adequate and cost-effective financing depends on the credit ratings of WGL and Washington Gas and the liquidity of financial markets. A material downgrade in WGL’s or Washington Gas’ credit ratings or disruptions in the credit market, including as a result of natural disasters and catastrophic events (including terrorist acts), could adversely affect our access to sources of liquidity and increase our borrowing costs.
Our strategic growth plans assume that we will have continued access to liquidity and capital. In addition, the ability of our non-utility subsidiaries to purchase natural gas and electricity from their suppliers is partly dependent upon the creditworthiness of WGL, and upon access to cash collateral through the issuance of commercial paper and unsecured short-term bank loans by WGL. If WGL’s credit ratings are materially downgraded, we may be required to provide additional credit support. If we are required to provide significant additional credit support, or if there is significant disruption in the credit markets, our ability to implement our strategic plans and the ability of our non-utility subsidiaries to make commodity purchases at reasonable prices may be impaired.
Cyber-attacks, including cyber-terrorism or other information technology security breaches, or information technology failures may disrupt our business operations, increase our costs, lead to the disclosure of confidential information and damage our reputation.
Security breaches of our information technology infrastructure, including cyber-attacks and cyber-terrorism, or other failures of our information technology infrastructure could lead to disruptions of our natural gas distribution operations and otherwise adversely impact our ability to safely and effectively operate our pipeline and distributed generation systems and serve our customers. In addition, an attack on or failure of information technology systems could result in the unauthorized release of customer, employee or Company data that is crucial to our operational security or could adversely affect our ability to deliver and collect on customer bills. Such security breaches of our information technology infrastructure could adversely affect our business reputation, diminish customer confidence, subject us to financial liability or increased regulation, increase our costs and expose us to material legal claims and liability and adversely affect our operations and financial results. We have implemented preventive, detective and remediation measures to manage these risks, and we maintain cyber risk insurance to mitigate the effects of these events. Nevertheless, these may not effectively protect all of our systems all of the time. To the extent that the occurrence of any of these cyber-events is not fully covered by insurance, it could adversely affect WGL’s financial condition and results of operations.
As an indirect, wholly owned subsidiary of AltaGas, WGL is dependent on AltaGas for certain services under a services agreement. Loss of such services, if any, could have a material impact on WGL’sWashington Gas’ business, financial condition, results of operations and cash flows.
WGL
Washington Gas receives general corporate services from AltaGas under a service agreement approved by the SCC of VA. Under the agreement, WGLWashington Gas relies on AltaGas for certain administrative and management functions and services, including human resources, employee benefits, finance, legal, accounting, tax, information technology, and office services. Should AltaGas not be able to provide such services to WGLWashington Gas for any reason, WGLWashington Gas will need to utilizeuse its own resources for such services or otherwise find a substitute provider for such services. WGL,Washington Gas, however, may not have sufficient internal resources to effectively provide such services or may not be able to contract with a substitute service provider on similar terms or at all. Moreover, the costs of obtaining a substitute service provider, if found, may also be substantial and overly burdensome for WGL. WGLWashington Gas. Washington Gas may also experience an interruption in the provision of such services to it. In addition, in light of AltaGas' familiarity with WGL,Washington Gas, a substitute service provider, if any, may not be able to provide the same level of service due to lack of preexisting synergies. If WGLWashington Gas cannot support necessary services from its internal resources or otherwise locate providers that are able to provide it with substantially similar services, WGL’sWashington Gas’ business, financial condition, results of operations and cash flows could be adversely affected.
Our
As an indirect, wholly-owned subsidiary of AltaGas, Washington Gas is affected by AltaGas' strategic decisions and performance.
As an indirect, wholly-owned subsidiary of AltaGas, Washington Gas’ business, operations, and financial performance (including its ability to meet our customers’ requirements mayaccess capital, receive equity, and ability to spend capital) can be impaired if contracted supply is not available, if supplies are not delivered inaffected by a timely manner, if we lose key suppliers or if we are not able to obtain additional supplies during significant spikes in demand.
Washington Gas must acquire adequate natural gas supply and pipeline and storage capacity to meet current and future customers’ annual and seasonal natural gas requirements. Similarly, WGL Energy Services requires adequate natural gas andwide range of strategic
WGL Holdings, Inc.
Washington Gas Light Company
Part I
Item 1A. Risk Factors (continued)
electric suppliesdecisions that AltaGas may make from time to servetime. Significant changes in AltaGas’ strategy, its relationship with Washington Gas, as well as material adverse changes in the demandsperformance of its customersAltaGas, could have a material adverse effect on Washington Gas’ business, financial condition, operating results and WGL Midstream requires adequate natural gas supply and storage and pipeline capacity to meet its delivery obligations to its customers. We depend on the ability of natural gas producers, pipeline gatherers, natural gas processors, interstate pipelines, suppliers of electricity and regional electric transmission operators to meet these requirements. If we are unable to secure adequate supplies in a timely manner because of a failure of our suppliers to deliver the contracted commodity, capacity or storage, if we are unable to secure additional quantities during significant abnormal weather conditions, or if prospects.
Washington Gas' or WGL Energy Services' interruptible customers fail to comply with requests to curtail their gas usage during periods of sustained cold weather, weGas may be unable to meet our customers’ requirements. Such inabilityaccess capital or the cost of capital may significantly increase.
Washington Gas’ ability to obtain adequate and cost-effective financing depends on the liquidity of the financial markets, its credit ratings, and the ability of it and AltaGas to access the financial markets. Disruptions in the capital and credit markets could adversely affect Washington Gas’ ability to access short-term and long-term capital. Washington Gas’ access to funds under its commercial paper program is dependent on investor demand for its commercial paper. Disruptions and volatility in the global credit markets could limit the demand for Washington Gas’ commercial paper borrowings or result in defaultsthe need to offer higher interest rates to investors, which would result in higher expense and could adversely impact liquidity. The Company’s credit ratings, as well as the ratings of WGL and AltaGas impact the Company’s ability to access credit markets and the costs of borrowing under contracts withavailable credit lines. A negative change in the Company’s (or its affiliates’) ratings outlook or any downgrade in current investment-grade credit ratings, particularly below investment grade, could adversely affect Washington Gas’ costs of borrowing and/or access to sources of liquidity and capital. An increase in borrowing costs without the ability to recover those higher costs in the rates charged to Washington Gas’ customers, penaltieswhich would be impacted by the merger-related commitment that prohibits Washington Gas from recovering any incremental financing costs due to a credit downgrade, would adversely affect earnings or cash flows by limiting Washington Gas’ ability to earn its allowed rate of return. Additionally, disruptions in the credit market, including as a result of natural disasters, catastrophic events (including terrorist acts and health and safety epidemics), could adversely affect Washington Gas’ access to sources of liquidity and increase its borrowing costs
A decline in the local economy in which Washington Gas operates may reduce net revenue growth and reduce future earnings and cash flows.
Substantially all of our natural gas utility customers are located in Virginia, Maryland and the District of Columbia. A general decline in the economy of the region in which Washington Gas operates or a change in the usage patterns and financial damage payments, costscondition of customers in the region due to factors beyond Washington Gas' control may adversely affect Washington Gas’ ability to grow its customer base and collect revenues from existing customers, which may negatively affect net revenue growth and increase costs.
We are exposed to counterparty and contract-related risks that could adversely affect our results of operations, cash flows and financial condition.
We may extend credit to counterparties, including other utilities, holding companies, banks, gas exploration and production companies, government-backed utilities and other participants in the energy industry relating to the sale, purchase and delivery of commodities. In addition, certain of our outstanding debt, including our medium-term notes, may accrue interest at variable rates based on the London Interbank Offered Rate (LIBOR). In July 2017, the United Kingdom Financial Conduct Authority (FCA), which regulates LIBOR, announced that the FCA intends to stop compelling banks to submit rates for the calculation of LIBOR after 2021. It is not possible to predict the effect of these changes, other reforms or the establishment of alternative reference rates in the United Kingdom or elsewhere. Although we believe we have prudent policies in place to manage our credit risk, we may not be able to collect amounts owed to us, which could adversely affect our liquidity and results of operations.
Our risk management strategies and related hedging activities may not be effective in managing risks and may cause increased volatility in our earnings and may result in costs and losses for which rate recovery may be disallowed.
We are exposed to commodity price, weather, and interest rate risks. For gas purchases to serve utility customers, Washington Gas attempts to manage its exposure to these risks, in part, through regulatory recovery mechanisms. In addition, we attempt to mitigate risks by hedging, setting risk limits and employing other risk management tools and procedures. These risk management activities may not be effective and cannot eliminate these risks in their entirety. If these tools and procedures to recover from a disruption of service, the loss of key licenses and operating authorities, and the loss of customers,are ineffective, we could incur significant losses, which could have a material adverse effect on our financial results.results and liquidity. In addition, although Washington Gas generally anticipates rate recovery of its costs or losses incurred in connection with these risk management activities, a regulator could subsequently disallow these costs or losses from the determination of revenues, which could adversely affect our financial results and increase the volatility of our earnings.
Washington Gas Light Company
Part I
Item 1A. Risk Factors (continued)
Rules implementing the derivatives transaction provisions of the Dodd-Frank Act could have an adverse impact on our ability to hedge risks associated with our business.
The Dodd-Frank Act regulates derivatives transactions, which include certain instruments, such as interest rate swaps, and commodity options, financial and other contracts, used in our risk management activities. The Dodd-Frank Act requires that a registered clearing facility clear most swaps and that the swaps trade on a designated exchange or swap execution facility, with certain exceptions for entities that use swaps to hedge or mitigate commercial risk. The Dodd-Frank requirements relating to derivative transactions have not been fully implemented by the SEC and the Commodity Futures Trading Commission. When fully implemented, the law and any new regulations could increase the operational and transactional cost of derivatives contracts and affect the number and/or creditworthiness of available counterparties.
Failure of our service providers could negatively impact our business, results of operations and financial condition.
Certain of our information technology, customer service, supply chain, pipeline and infrastructure installation and maintenance, engineering, payroll, and human resources functions that we rely on are provided by third-party vendors. Some of these services may be provided by vendors from centers located outside of the United States. Services provided pursuant to these agreements could be disrupted due to events and circumstances beyond our control, including natural disasters, catastrophic events (including terrorist acts and health and safety epidemics) and uncertain economic and political conditions. Our reliance on these service providers could have an adverse effect on our business, results of operations and financial condition.
Failure of the Company’s internal controls and procedures for financial reporting could adversely affect investor confidence and expose the Company to additional risks.
Beginning in 2019, the Company’s internal control over financial reporting were required to be in compliance with the requirements of Section 404(a) of Sarbanes-Oxley, and the related rules of the Securities Exchange Commission and the Public Company Accounting Oversight Board. Washington Gas’ failure to satisfy the requirements of Section 404(a) on an ongoing basis, or any failure of its internal controls could adversely affect investor confidence, cause reputational damage, and expose the Company to monetary penalties. Any such effects of non-compliance could have an adverse effect on Washington Gas’ results of operations, financial conditions and cash flows.
Natural disasters and catastrophic events, including terrorist acts, may adversely affect our business.
Natural disasters and catastrophic events such as fires, earthquakes, explosions, floods, tornados, terrorist acts, health and safety epidemics, and other similar occurrences, could damage our operational assets, including our utility facilities, and information technology infrastructure, distributed generation assets and pipeline assets owned by investees of our non-utility subsidiaries.could reduce employee productivity. Such events could likewise damage the operational assets of our suppliers or customers. These events could disrupt our ability to meet customer requirements, significantly increase our response costs, and significantly decrease our revenues. Unanticipated events or a combination of events, failure in resources needed to respond to events, or a slow or inadequate response to events may have an adverse impact on our operations, financial condition, and results of operations. The availability of insurance covering catastrophic events, sabotage and terrorism may be limited or may result in higher deductibles, higher premiums, and more restrictive policy terms.
We are exposed
Washington Gas may be unable to counterpartyretain key management and contract-related risks that could adversely affect our resultsto attract and compensate sufficient skilled employees and contractors to meet its needs in field operations and construction activities.
Washington Gas depends on the experience and industry knowledge of operations, cash flows and financial condition.
We extend credit to counterparties, including other utilities, holding companies, banks, gas exploration and production companies, government-backed utilitiesits officers and other participantskey employees to execute its business plans. The success of the company depends in part upon its ability to attract retain key management personnel and other employees, including its highly skilled operational employees. In addition, Washington Gas relies on its field employees and contractors to perform maintenance, construction and other operational activities to maintain and enhance its distribution system. These activities require specific skills and experience to meet internal and external standards and procedures and there is no guarantee that the energy industry. Although we believe we have prudent policies in place to manage our credit risk, including credit policies, netting arrangements and margining provisions incorporated in contractual agreements, we may notCompany will be able to collect amounts owedrecruit and train such personnel. Certain events, such as an aging workforce without appropriate replacements, mismatch of skillsets to us, which could adversely affect our liquidityfuture needs, or the unavailability of contract resources may lead to operating challenges and results of operations.
In addition, we enter into agreements with counterparties relating to the sale, purchase and delivery of commodity, transportation capacity, energy system design and construction, investment terms, and other matters. Our decisions to enter into these agreements are based on our expectations about the ongoing viability of our counterparties, assumptions and expectations underlying pricing terms and conditions, and commercial terms and other matters. These expectations may prove to be incorrect or our counterparties may dispute key terms of our agreements in ways that we do not anticipate. Such developments could result in our incurring losses or otherwise not achieving anticipated financial returns, which could have a material adverse effect on our results of operations. We are currently involved in legal proceedings with Antero Resources (Antero) relating to a dispute over the gas being delivered under natural gas purchase contracts. To date, WGL Midstream has incurred losses associated with this dispute of approximately $29.6 million. Separately, Antero has initiated suit against Washington Gas and WGL Midstream, claiming that they have failed to purchase specified daily quantities of gas and seeking alleged cover damages exceeding $100 million as of April 4, 2018, according to Antero's complaint. Washington Gas and WGL Midstream oppose both the validity and amount of Antero’s claim.increased costs. If we are not successful in these proceedings,unable to attract, train, and retain, and appropriately qualified workforce our results of operations wouldcould be negatively affected.
Our risk management strategies and related hedging activities may not be effective in managing risks and may cause increased volatility in our earnings and, in our utility segment, may result in costs and losses for which rate recovery may be disallowed.
We are exposed to commodity price, weather and interest rate risks. In addition, WGL Energy Services is exposed to pricing of certain ancillary services provided by the power pool in which it operates.
For gas purchases to serve utility customers, Washington Gas attempts to manage its exposure to these risks, in part, through regulatory recovery mechanisms. Our other subsidiaries primarily seek to manage risks by matching natural gas and electricity purchase obligations with sales commitments in terms of volume and pricing. In addition, we attempt to mitigate risks by hedging, setting risk limits and employing other risk management tools and procedures. These risk management activities may not be effective and cannot eliminate these risks in their entirety. If these tools and procedures are ineffective, we could incur significant losses, which could have a material adverse effect on our financial results and liquidity. In addition, although Washington Gas generally anticipates rate recovery of its costs or losses incurred in connection with these risk management
WGL Holdings, Inc.
Washington Gas Light Company
Part I
Item 1A. Risk Factors (continued)
activities, a regulator
Washington Gas’ business and financial condition could subsequently disallow these costsbe adversely impacted by strikes or losses fromwork stoppages by its unionized employees.
Washington Gas’ business is dependent upon employees who are represented by unions and are covered by collective bargaining agreements. Disputes with the determination of revenues, whichunions could adversely affect our financial results and increaseresult in work stoppages that could impact the volatility of our earnings.
Rules implementing the derivatives transaction provisions of the Dodd-Frank Act could have an adverse impact on our ability to hedge risks associated with our business.
The Dodd-Frank Act regulates derivatives transactions, which include certain instruments, such as interest rate swaps, and commodity options, financial and other contracts, used in our risk management activities. The Dodd-Frank Act requires that most swaps be cleared through a registered clearing facility and that they be traded on a designated exchange or swap execution facility, with certain exceptions for entities that use swaps to hedge or mitigate commercial risk. The Dodd-Frank requirements relating to derivative transactions have not been fully implemented by the SEC and the Commodity Futures Trading Commission. When fully implemented, the law and any new regulations could increase the operational and transactional cost of derivatives contracts and affect the number and/or creditworthiness of available counterparties.
In addition, we may transact with counterparties based in the European Union, Canada or other jurisdictions which, like the U.S., are in the process of implementing regulations to regulate derivatives transactions, some of which are currently in effect and may impose costs on our derivatives activities.
Our business, earnings and cash requirements are highly weather sensitive and seasonal.
The earnings of Washington Gas can vary from year to year depending, in part, on weather conditions. Warmer-than-normal weather can reduce our utility margins as customer consumption declines. In Maryland and Virginia, we have in place regulatory mechanisms and rate designs intended to stabilize the level of net revenues that we collect from customers by eliminating the effect of deviations in customer usage caused by variations in weather from normal levels, and other factors such as conservation. If our rates and tariffs are modified to eliminate these provisions, then we would be exposed to significant risk associated with weather.
The operations of WGL Energy Services, our retail energy-marketing subsidiary, are weather sensitive and seasonal, with a significant portion of revenues derived from the sale of natural gas to retail customers for space heating during the winter months, and from the sale of electricity to retail customers for cooling during the summer months. Weather conditions directly influence the volumedelivery of natural gas and electricity delivered to customers. Weather conditions can alsoother services, which could affect the short-term pricing of energy supplies that WGL Energy Services may need to procure to meet the needs of its customers. Similarly, the business of WGL Midstream is seasonal due to the tendency of storageour relationships with customers, vendors and transportation spreads to increase during the winter. In addition, the distributed generation operations of WGL Energy Systems, which derive significant revenues from the sale of electricity to customers from solar generating assets, are weather sensitive because weather conditions directly influence the generation of electricity that is delivered to customers.
Deviations from normal weather conditionsregulators and the seasonal nature of these businesses can create large fluctuations in these subsidiaries’ short-term cash requirements and earnings.
Washington Gas and WGL Midstream may face regulatory and financial risks related to pipeline safety legislation.
A number of proposals to require increased oversight over pipeline operations and increased investment in and inspections of pipeline facilities are pending or have previously been proposed in the United States Congress. Additional operating expenses and capital expenditures may be necessary to remain in compliance with the increased federal oversight resulting from such proposals. While we cannot predict with certainty the extent of these expenses and expenditures or when they will become effective, the adoption of such proposals could result in significant additional costs toadversely affect Washington Gas’ and WGL Midstream’s businesses. Washington Gas may be unable to recover from customers through the regulatory process all or some of these costs and may be unable to earn its authorized rate of return on these costs.
Failure of our service providers could negatively impact our business results of operations and financial condition.
Certain
The cost of providing retirement plan benefits to eligible current and former employees is subject to changes in the performance of investments, demographics, and other factors and assumptions. These changes may have a material adverse effect on us.
The cost of providing retirement plan benefits to eligible current and former employees is subject to changes in the market value of our information technology, customer service, supply chain, pipelineretirement plan assets, changing bond yields, changing demographics and infrastructure installation and maintenance, engineering, payroll and human resources functions that we rely on are provided by third-party vendors. Somechanging assumptions. Any sustained declines in equity markets, reductions in bond yields, increases in health care cost trends, or increases in life expectancy of these servicesbeneficiaries may be provided by vendors from centers located outside of the United States. Services provided pursuant to these agreements could be disrupted due to events and circumstances beyond our control. Our reliance on these service providers could have an adverse effect on our business, results of operationsretirement plan liabilities, assets and financial condition.
The Tax Act could adversely affect WGL.
On December 22, 2017, President Trump signed into law the Tax Act, which significantly reforms the Internal Revenue Code of 1986, as amended. While WGL has made an initial assessment of the impacts of the Tax Act on it and its subsidiaries, it
WGL Holdings, Inc.
benefit costs. Additionally, Washington Gas Light Company
Part I
Item 1A. Risk Factors (continued)may be required to increase our contributions in future periods in order to preserve the current level of benefits under the plans and/or due to federal funding requirements.
remains unknown at this time how the Treasury Department may interpret certain provisions of the Tax Act. These interpretations could have a negative impact on the results of operations, cash flows and financial condition of WGL and its subsidiaries.
The Tax Act may impact WGL’s ability to use its net operating loss carryforwards.
The Tax Act includes a limitation on the utilization of net operating losses beginning October 1, 2018 to 80% of current year taxable income and eliminates any NOL carrybacks. Such net operating losses have an unlimited carryforward. These provisions may affect the timing of the utilization of net operating loss carryforwards and investment tax credit carryforwards.
RISKS RELATING TO WASHINGTON GAS
Changes in the regulatory environment or unfavorable rate regulation may restrict or delay Washington Gas’ ability to earn a reasonable rate of return on its capital invested to provide utility service and to recover fully its operating costs.
Washington Gas is regulated by several regulatory commissions and agencies. These regulatory commissions generally have authority over many of the activities of Washington Gas’ business including, but not limited to, the rates it charges to its customers, the amount and type of securities it can issue, the nature of investments it can make, the nature and quality of services it provides, safety standards, collection practices and other matters. These regulators also may modify Washington Gas’ rates to change the level, type and methods that it utilizes to recover its costs, including the costs to acquire, store, transport and deliver natural gas. In addition, the regulatory environment and rate regulation can be affected by new laws and political considerations. Most significantly, we incur both planned and unplanned costs to operate, improve, maintain and repair our operational assets. The amount of these costs may vary from our expectations due to significant unanticipated repairs, maintenance and remediation of our assets, changes in legal and regulatory requirements, natural disasters, terrorism, changes in interest rates of our indebtedness and other events. To the extent these costs are not included in approved rates or tariffs, we seek our recovery through rate cases; however, the regulatory process may be lengthy and costs may be disallowed, causing us to suffer the negative financial effects of costs incurred without the benefit of rate relief. Additionally, the actions of regulatory commissions may restrict or delay Washington Gas’ ability to earn a reasonable rate of return on invested capital.
Washington Gas must acquire additional capacity to deliver natural gas into growth areas and it may not be able to do so in a timely manner.
Washington Gas must acquire additional interstate pipeline transportation or storage capacity and construct transmission and distribution pipe to deliver additional capacity into growth areas on our system. The specific timing of any larger customer additions to our market may not be forecasted with sufficiently long lead timeClimate change concerns and the availability of these supply optionsmovement for carbon neutral energy sources pose challenges to serve anythe Company’s operating model.
Climate change and the costs that may be associated with its impacts have the potential to affect our business in many ways, including increasing the costs we incur in providing our products and services, impacting the demand for and consumption of our customer additions may be limited by market supplyproducts and demand,services (due to change in both costs and weather patterns), and affecting the timingeconomic health of Washington Gas’ participationthe regions in new interstate pipeline construction projects, local permitting requirementswhich we operate. Energy customers are also increasingly indicating preferences for carbon-neutral and renewable sources of energy.
Regulatory and legislative responses to climate change have been mixed, and the ability to acquire necessary rightspolitics of way. These limitations could result in an interruption in Washington Gas’ ability to satisfy the needs of some of its customers.
Leaks, mechanical problems, incidents or other operationalmatter has created much uncertainty about how governing bodies will respond, making long-term corporate planning around climate change issues could affect public safety and the reliability of Washington Gas’ distribution system, which could materially affect Washington Gas’ results of operations, financial condition and cash flows.
Washington Gas’ business is exposed to operational issues, hazards and risks inherent in storing and transporting natural gas that could affect the public safety and reliability of its distribution system. While Washington Gas, with support from each of its regulatory commissions, is accelerating the replacement of aging pipeline infrastructure prioritized on a risk-based approach, there are potential operating issues. These issues such as leaks, equipment problems and incidents, including explosions and fire, could result in legal liability, repair and remediation costs, increased operating costs, significant increased capital expenditures, regulatory fines and penalties and other costs and a loss of customer confidence. Any liabilities resulting from the occurrence of these events may not be fully covered by insurance, and Washington Gas may be unable to recover from customers through the regulatory process all of these repair, remediation and other costs and earn its authorized rate of return on these costs.
Washington Gas has implemented preventive and remedial measures to address increased leak rates in its distribution system caused by an increase in the volume of natural gas containing low concentration of HHCs received from its suppliers. These measures include the injection of hexane to increase the concentration of HHCs and the implementation of pipe replacement programs. If Washington Gas were unable to inject hexane into its natural gas supply due to limited availability of hexane, equipment or operational problems, or damage to our facilities at which hexane is injected, our leak rates could increase, which
WGL Holdings, Inc.
Washington Gas Light Company
Part I
Item 1A. Risk Factors (continued)
would exacerbate the risks discussed above. In addition, Washington Gas’ ability to continue to recover the cost of these preventive and remedial measures and to earn its authorized rate of return on these costs is subjectdifficult owing to the regulatory process.
Current and future environmental regulations may adversely affect Washington Gas’ operations and financial results.
Washington Gas is subject to federal, state and localshifting landscape. We believe existing laws and regulations relatedwill continue to environmental matters. These evolving lawsevolve and regulations may require expenditures over a long timeframe. Failure to comply with these laws and regulations may expose Washington Gas to fines, penalties and operational interruptions that could adversely affect its financial results. Moreover, new environmental requirements, revisions and reinterpretations of existing environmental requirements and changes in environmental enforcement policies and practices may stretch Washington Gas’ operational resources and adversely affect its financial results.
In
Washington Gas Light Company
Part I
Item 1A. Risk Factors (continued)
Certain jurisdictions within Washington Gas’ operating territory have adopted initiatives to address climate change that include setting targets to reduce GHG (often expressed in measures of carbon dioxide equivalent emissions), requiring the past,use of varying amounts of renewable electricity, and banning fossil fuel use, including natural gas, in new construction. Carbon taxes, which would include a tax on natural gas emissions also continue to be considered. Such actions have multiple implications and risks for Washington Gas, including supply availability and sourcing risks, and higher product costs as the United States Congress has considered legislative proposalscompany investigates new sources of non-traditional carbon neutral gaseous fuels. Related risks include the ability of the existing infrastructure to limit greenhouseaccess and safely deliver these new fuels. Other risks include lower revenue from reduced gas (GHG) emissions. Future proposalsdeliveries as customer demand declines in response to limit GHGcompany-initiated efficiency programs, penetration high-efficiency appliances and technologies, new building standards, and external forces, including potential government sponsored policy initiatives that promote electrification.
Additional risks include securing regulatory and policy support for changes in the Company’s business operations and pricing model that allow recovery of associated costs and offer returns sufficient to attract and maintain capital. Erosion of investor confidence in fossil fuel-based companies is leading some to divest from the sector completely. Maintaining investor confidence and attracting capital will be dependent depend on successfully demonstrating our ability to reduce emissions couldassociated with the use of our products, and the failure to do so may materially and adversely affect our operatingbusiness, reputation, and service costs and demand for our product. Should future proposals become law, operating and service costs may increase and demand for our product could decrease, and utility costs and prices charged to utility customers may increase, which would adversely affect our financial results.
Changes in the relative prices of alternative forms of energy may weaken the competitive position of Washington Gas’ delivery service, which could reduce growth in natural gas customers, reduce the volume of natural gas delivered and negatively affect Washington Gas’ cash flows and earnings.
The price of natural gas delivery service that Washington Gas provides competes with the price of other forms of energy such as electricity, heating oil and propane. An increase in the price of natural gas compared to other sources of energy may cause the competitive position of our natural gas delivery service to decline. A decline in the competitive position of natural gas service may lead to fewer natural gas customers, lower volumes of natural gas delivered, lower cash flows and lower earnings.
A decline in the local economy in which
Washington Gas operatesis subject to physical and financial risks associated with climate change.
Changing weather patterns that may reduce net revenue growth and reduce future earnings and cash flows.
Approximately 71% of our assets arebe attributable to our regulated utility businesses,climate change make it harder for the Company to predict weather patterns and plan for winter heating seasons. Increased or decreased energy use due to weather changes may require the dividends paid by Washington GasCompany to WGL constituted approximately 84% of the amount of WGL Holdings' dividends paidinvest in additional gathering, storage, or other infrastructure and warmer weather could lead to decreased demand for fiscal year 2018. Further, substantially all of our natural gas, utility customers are located in Virginia, Maryland and the District of Columbia. A decline in the economy of the region in which Washington Gas operates or a change in the usage patterns and financial condition of customers in the region might adversely affect Washington Gas’ ability to grow its customer base and collect revenues from existing customers, which maywould negatively affect net revenue growth and increase costs.
Washington Gas’ business and financial condition could be adversely impacted by strikes or work stoppages by its unionized employees.
Washington Gas’ business is dependent upon employees who are represented by unions and are covered by collective bargaining agreements. Disputes with the unions could result in work stoppages that could impact the delivery of natural gas and other services,Company’s financial results. Extreme weather conditions can contribute to increased stress on Company systems, which could affect our relationships with customers, vendorsinclude service interruptions. From an operational perspective, increasingly severe and regulators and adversely affect Washington Gas’ business and financial condition.
The availability of adequate interstate pipeline transportation capacity and natural gas supply may decrease.
We purchase almost all of our natural gas supply from interstate sources that must then be transported to our service territory. In particular, while the Marcellus Shale region is rapidly developing as a premier gas formation, the interstate pipeline transportation capacity may limit the availability of gas from the Marcellus Shale region in the near term. A significant disruption to or reduction in interstate pipeline capacity due to events such as operational failures or disruptions, hurricanes, tornadoes, floods, freeze off of natural gas wells, terrorist or cyber-attacks or other acts of war, or legislative or regulatory actions or requirements, including remediation related to integrity inspections,variable weather could reduce our normal interstate supply of gas, which may affect our ability to servesecure and deliver our product and perform system replacement, repair, and maintenance work, while also potentially disrupting our supply chain. Interferences of this sort are likely to drive up the cost of system operations. To the extent climate change negatively impacts a region’s economic health, through rising sea levels, increases in number of and/or severity of weather events, displacement or other means, any such impact could have a negative effect on the Company’s customer demandbase, and correspondingly, on revenues. Additionally, climate change activism could lead to business interruptions for the Company as citizen engagement on this issue has in the past targeted Washington, DC for business disruption and may do so in the future.
Our business, earnings and cash requirements are highly weather sensitive and seasonal.
The earnings of Washington Gas can vary from year to year depending, in part, on weather conditions. Forecasts of sales are based on “normal” weather, which represents a long-term historical average. Warmer-than-normal weather can reduce our earnings.
The costutility margins as customer consumption declines. In Maryland and Virginia, we currently have in place regulatory mechanisms and rate designs intended to stabilize the level of providing retirement plan benefits to eligible current and former employees is subject to changesnet revenues that we collect from customers by eliminating the effect of deviations in the performance of investments, demographics,customer usage caused by variations in weather from normal levels, and other factors such as conservation. If our rates and assumptions. These changes maytariffs are modified to eliminate these provisions, then we would be exposed to significant risk associated with weather. Weather can also impact our operating costs related to system maintenance which is not covered by regulatory mechanisms.
Certain legacy operations of the Company have a material adverse effect on us.
The cost of providing retirement plan benefitsexposed it to eligible current and former employees is subject to changespotential liabilities in the market value of our retirement plan assets, changing bond yields, changing demographics and changing assumptions. Any sustained declines in equity markets, reductions in bond yields, increases in health care cost trends, or increases in life expectancy of beneficiaries may have an adverse effect on our retirement plan liabilities assets and benefit costs. Additionally, we may beconnection with environmental remediation efforts.
WGL Holdings, Inc.
Washington Gas Light Company
Part I
Item 1A. Risk Factors (continued)
required
Washington Gas has identified up to increase our contributionsten sites where it or its predecessors may have operated manufactured gas plants (MGPs). Though Washington Gas ceased all such operations and last used any such plant in future periods1984, it is aware of the presence of coal tar and certain other by-products of gas manufacturing processes at certain sites and its potential presence at others. The Company is currently remediating certain properties, and is involved in order to preserve the current level of benefits under the plans and/or due to federal funding requirements.
RISKS RELATING TO THE NON-UTILITY SUBSIDIARIES OF WGL
The construction of WGL Midstream’s pipeline assetsremediation negotiations and planning for certain other properties both in its individual capacity and collectively with other parties. Environmental remediation efforts typically have experienceda long time frame, are costly, and may continue to experience legislative and regulatory obstacles, and the construction and operation of these assets are subject to hazards, equipment failures, supply chain disruptions,the unexpected, making such efforts difficult to plan and budget for. Company management and personnel issuesmay have to devote significant time and related risks, which could result in decreased values ofresources to these investments, including impairments, and/or delays their in-service dates, whichefforts and there is no guarantee that the costs associated with any remediation efforts would negatively affect our results of operations.
WGL Midstream’s business plan involves making substantial investments in pipeline construction projects, which are subject to FERC and state agency regulation and approval. These construction projects are also subject to environmental, political and legal uncertainties that are beyond our control. These factors may reduce some opportunities to grow our midstream business or impair our existing investments.
In addition, the construction and operation of WGL Midstream’s pipeline assets are subject to risks relating to breakdowns or failures of equipment or processes due to pipeline integrity, fuel supply or transportation disruptions, accidents, labor disputes or work stoppages, construction delays or cost overruns, and shortages of or delays in obtaining equipment, material and labor. Because these assets are interconnected with facilities of third parties, the operation of these facilities could also be adversely affected by unexpected or uncontrollable events occurring on the systems of such third parties. These events could further delay the in-service date of WGL Midstream’s projects or disrupt operations on these projects, which could have an adverse effect on its financial results.
Returns on our non-utility subsidiaries’ investments in renewable energy projects are dependent upon regulatory and tax incentives, which may expire or be reduced or modified.
WGL Energy Systems derives a significant portion of its revenues from the sale of solar renewable energy credits (RECs), which are produced as a result of owning and operating commercial distributed energy systems. The value of these RECs is determined by markets in the states where the distributed energy systems are installed, which are driven by state laws relating to renewable portfolio standards or alternative compliance payment requirements for renewable energy. Overbuilding of distributed energy systems in these states or legislative changes reducing renewable portfolio standards or alternative compliance payment requirements could negatively impact the price of RECs that we sell and the value of the RECs that we hold in our portfolio.
In addition, WGL Energy Systems and WGSW’s investment strategy of participating with counterparties in energy-related investments, or to directly own and operate energy assets and sell energy to customers, has historically allowed us to benefit from incentives in the federal tax code. WGL’s ability to continue to benefit from these investments is based on certain assumptions about the level of our income taxes and our ability to utilize tax incentives to reduce our tax burden. Our ability to continue participating in these investments with counterparties depends in part on the effect of the Tax Act on the market demand for such investments.
WGL may be impacted by changes in federal income tax policy.
WGL is impacted by the United States federal income tax policy, including corporate income tax laws. The Tax Cuts and Jobs Act enacted comprehensive tax reform, including significant changes to the United States corporate income tax laws. Some provisions of the Tax Cuts and Jobs Act require interpretive guidance. As a result, management is currently unable to predict whether these reforms will have a cumulative positive or negative impact on corporations, including WGL. These changes in the United States federal income tax laws could have an adverse effect on cash flow, financial condition, and liquidity.
WGL Energy Systems’ inability to find counterparties for tax equity partnerships could negatively impact its results.
WGL Energy Systems has derived a significant portion of its revenues from alternative energy investments, including investments in tax equity partnerships. The Tax Act reduces the corporate tax rate from 35% to 21%. WGL anticipates that this reduction in the corporate tax rate maynot have a negative impact on its abilitythe Company’s earnings.
Washington Gas is subject to continue to engage counterparties in these transactions as such counterparties’ appetite forvarious legal proceedings and management cannot predict the tax benefitsoutcome of such partnerships will decreaseproceedings.
In the course of its business, Washington Gas is subject to lawsuits, regulatory proceedings, and other claims arising out of its operations. Defense and settlement costs associated with these proceedings can be substantial, even with respect to matters that we believe have no merit. Due to the inherent uncertainty of the litigation process, contested regulatory proceedings, or the progress of other claims, the resolution of any particular matter could have a material adverse effect on the financial position or operating results of Washington Gas.
Changes to government fiscal and trade policies could adversely affect Washington Gas’ strategic decisions and operating performance.
Any changes in the US trade policy could trigger retaliatory actions by affected companies resulting in increased costs for goods used in our normal course of business, such as steel pipe. Higher than expected inflation or tariffs may increase costs of construction and operations.
Washington Gas may face regulatory and financial risks related to pipeline safety legislation.
A number of proposals to require increased oversight of pipeline operations and increased investment in and inspections of pipeline facilities are pending or have been proposed in the United States Congress. Additional operating expenses and capital expenditures may be necessary to remain in compliance with the lower overall corporate tax rate. In addition, a base erosion anti-abuse tax, enacted as partincreased federal oversight resulting from such proposals. While we cannot predict with certainty the extent of these expenses and expenditures or when they will become effective, the Tax Act,adoption of such proposals could result in significant additional costs to Washington Gas’ business. Washington Gas may decrease the appetite for tax credits by counterparties who engage in business with foreign affiliates. Should WGL be unable to find sufficientrecover from customers through the regulatory process all or suitable counterparties forsome of these partnerships going forward for any reason, including duecosts and may be unable to the enactmentearn its authorized rate of return on these costs.
Changes in taxation and the Tax Act, thus limiting its ability to enter into these transactions, WGL’s results of operations, cash flows andquantify such changes could adversely affect our financial condition may be negatively impacted.
WGL Holdings, Inc.
Washington Gas Light Company
Part I
Item 1A. Risk Factors (continued)
results.
Legislative and regulatory developments and other uncertainties, delays or cost overruns may negatively affect WGL Energy Services or our other non-utility subsidiaries.
Legislation or changes in the regulations that govern the conduct of competitive energy marketers could reduce customer growth opportunities for WGL Energy Services and could reduce the profit opportunities associated with existing customers. In addition, our non-utility subsidiaries hold investments in natural gas related businesses thatWe are subject to lawstaxation by the various taxing authorities at the federal, state and regulations thatlocal levels where we do business. Legislation or regulation which could adversely affect their performance.
Competition may negatively affect our non-utility subsidiaries.
We face strong competitiontax burden could be enacted by any of these governmental authorities. The outcome of regulatory proceedings regarding how corporate taxes are shared with customers and the period over which it will be shared could significantly impact future earnings and cash flows. Separately, a challenge by a taxing authority or a change in our non-utility segments. WGL Energy Services competes with other non-regulated retail suppliers of natural gas and electricity, as well as with the commodity rate offerings of electric and gas utilities. Increases in competition, including utility commodity rate offers that are below prevailing market rates, may result in a loss of sales volumes or a reduction in growth opportunities. WGL Midstream competes with other midstream infrastructure and energy services companies, wholesale energy suppliers and other non-utility affiliates of regulated utilities to acquire natural gas storage and transportation assets. WGL Energy Systems faces many competitors in the commercial energy systems segment, including, for government customers, companies that contract with customers under ESPC and other utilities providing services under UESCs and, in the renewable energy and distributed generation market, other developers, tax equity investors, distributed generation asset owner firms and lending institutions. These competitors may have diversified energy platforms with multiple marketing approaches, broader geographic coverage, greater access to credit and other financial resources, or lower cost structures, and may make strategic acquisitions or establish alliances among themselves. There can be no assurances that we can compete successfully, and our failure to do so could have an adverse impact on our results of operations and cash flow.
WGL subsidiaries invest in non-controlling interests in investments and may have limited ability to manage risks associated with these investments.
We own, anduse tax benefits such as carryforwards or tax credits may acquire additional, non-controlling interests in investments. We may not have the right or power to direct the management of these investments, and other investors may take action that is contrary toimpact our interests. In addition, other participants may become bankrupt or have other economic or business objectives that could negatively impact the value and performance of our investments.
Reductions or delays in federal government budget appropriations may negatively impact WGL Energy Systems’ earnings.
The Energy Efficiency and Energy Management operations of WGL Energy Systems are sensitive to federal government agencies’ receipt of funding in a timely manner. A portion of WGL Energy Systems revenues is derived from implementing projects related to energy efficiency and energy conservation measures for federal government agencies in the Washington D.C. metropolitan area. A reduction or delay in funding for these federal agencies directly impacts completion of ongoing projects and may harm WGL Energy Systems’ ability to obtain new contracts, which may negatively impact earnings.financial results.
WGL Holdings, Inc.
Washington Gas Light Company
Part I
ITEM 1B. UNRESOLVED STAFF COMMENTS
None.
ITEM 2. PROPERTIES
At September 30, 2018,December 31, 2019, Washington Gas provided services in various areas of the District of Columbia, Maryland and Virginia, and held certificates of convenience and necessity, licenses and permits necessary to maintain and operate its properties and businesses.
At September 30, 2018,December 31, 2019, Washington Gas had approximately 576588 miles of transmission mains, 13,18813,293 miles of distribution mains and 12,44912,964 miles of distribution services.
Washington Gas owns approximately 20 acres of land and two buildings (completed in 2012) at 6801 and 6803 Industrial Road in Springfield, Virginia. The Springfield site houses both operating and certain administrative functions of the utility. Washington Gas also holds title to land and buildings used as substations for its utility operations. Washington Gas holds title to land and buildings used for utility operational functions, such as gate stations or substations throughout its service territory in the District of Columbia, Maryland and Virginia.
Washington Gas also has peak shaving facilities in Springfield, Virginia (Ravensworth Plant) and Rockville, Maryland (Rockville Plant). At September 30, 2018, Hampshire owns full and partial interests in, and operates, underground natural gas storage facilities in Hampshire County, West Virginia. Hampshire owns certain exploration and development rights in West Virginia principally in the Oriskany Sandstone, the Marcellus Shale and other shale formations. These rights are predominately owned by lease and they are applicable to approximately 26,000 gross acres for the storage facilities. Hampshire also operates a compressor station utilized to increase line pressure for injection of gas into storage.
In addition, WGL Energy Systems owns 252 megawatts of installed solar capacity across the United States at September 30, 2018.
Facilities utilized by our corporate headquarters, as well as by the retail energy-marketing and commercial energy systems segments, are located in the Washington, D.C. and Baltimore metropolitan area and are leased.
The Mortgage of Washington Gas dated January 1, 1933 (Mortgage), as supplemented and amended, securing any First Mortgage Bonds (FMBs) it issues, constitutes a direct lien on substantially all property and franchises owned by Washington Gas other than a small amount of property that is expressly excluded. At September 30, 2018 and 2017, there was no debt outstanding under the Mortgage.
ITEM 3. LEGAL PROCEEDINGS
TheFrom time to time the Company is involved in various litigation matters arising out of the normal course of business. In particular, the nature of our business ordinarily results in periodic regulatory proceedings before various state and federal authorities. For information regarding pending federal and state regulatory matters, see Note 12-Commitments13 — Commitments and Contingencies of the Notes to Consolidated Financial Statements.
Silver Spring, Maryland Incident
Washington Gas has continually worked withOn April 23, 2019, the NTSB to support its investigationNational Transportation and Safety Board (NTSB) held a hearing during which it found, among other things, that the probable cause of the August 10, 2016, explosion and fire at an apartment complex on Arliss Street in Silver Spring, Maryland “was the failure of an indoor mercury service regulator with an unconnected vent line that allowed natural gas into the meter room where it accumulated and ignited from an unknown ignition source. Contributing to the accident was the location of the mercury service regulators where leak detection by odor was not readily available.” Washington Gas disagrees with the NTSB’s probable cause of which has not been determined. Additional information will be made available byfindings. Following this hearing, on June 10, 2019, the NTSB atissued an accident report.
In connection with the appropriate time. On November 2, 2016, twoincident, a total of 37 civil actions related to the incident were filed in the District of Columbia Superior Court against WGL and Washington Gas (as well as a property management company that is not affiliated with WGL or Washington Gas), by residents of the apartment complex. In one lawsuit, twenty-nine plaintiffs sought unspecified damages for, among others, wrongful death and personal injury. The other action was a class action suit seeking total damages stated to be less than $5 million for, among others, property damage and various counts relating to the loss of the use of the premises. Both actions alleged causes of action for negligence, product liability, and declaratory relief. These cases were dismissed on November 16, 2017. Thirty-five civil actions have been filed in the Circuit Court for Montgomery County, Maryland seekingMaryland. All of these suits sought unspecified damages for personal injury and/or property damage.
All personal injury and property damage. We maintain excess liability insurance coverage from highly-rateddamage claims asserted by residents at the Flower Branch Apartments have been settled and paid. The Company has been reimbursed by its insurers subjectfor the amounts paid in the settlements.
Also, in connection with the incident, on September 5, 2019, the PSC of MD ordered the Company, within 30 days, to (i) provide a nominal self-insured retention. We believedetailed response to the NTSB’s probable cause findings and (ii) provide evidence regarding the status of a 2003 mercury regulator replacement program and, if the program was not completed, to show cause why the PSC of MD should not impose a civil penalty on the Company. (Show-Cause Order).
On November 18, 2019 the Technical Staff of the PSC of MD, the Maryland Office of People’s Counsel (OPC), Montgomery County, MD and the Apartment and Office Building Association of Metropolitan Washington (AOBA) filed written comments on the Company’s Response to the Show-Cause Order. Technical Staff commented that thisthe PSC of MD may impose a civil
WGL Holdings, Inc.
Washington Gas Light Company
Part I
coverage will be sufficientpenalty but did not expressly recommend same. Montgomery County, MD, OPC and AOBA requested that the PSC of MD impose a civil penalty on the Company.
On December 17, 2019 the PSC of MD held a public hearing near the apartment complex at Arliss Street, at which some residents requested that the Company accelerate and complete its mercury service regulator program and that the Company absorb the cost of same.
The Company intends to cover any significant liability to it that may result from this incident. Management is unable to determine a range of potential losses that are reasonably possible of occurring and therefore we have not recorded a reserve associated with this incident. Washington Gas was invited by the NTSB to be a party to the investigation and in that capacity, has continued to work closelyfile comments with the NTSBPSC of MD responding to help determine the cause of this incident. Information about our obligations as a signed party to the investigation can be found in the form of the Certificate of Party Representation, which is available on the investigations page of the NTSB website https://www.ntsb.gov/legal/Documents/NTSB_Investigation_Party_Form.pdf,all written comments and 49 CFR 831.13. On August 14, 2017, the NTSB opened the public docket related to its ongoing investigation.resident testimony.
ITEM 4. MINE SAFETY DISCLOSURES
Not Applicable.
WGL Holdings, Inc.
Washington Gas Light Company
Part III
EXECUTIVE OFFICERS OF THE REGISTRANTSThe names, ages and positions of the executive officers of each of the registrants at October 31, 2018, are listed below along with their business experience during at least the past five years. The age of each officer listed is as of the date of filing of this report. There is no family relationship among the officers.
Unless otherwise indicated, all officers have served continuously since the dates indicated, and all positions are executive officers listed with Washington Gas Light Company.
|
| | |
Executive Officers |
Name, Age and Position with the registrants | | Date Elected or Appointed
|
|
Adrian P. Chapman, Age 61(1)
| | |
President and Chief Executive Officer | | July 6, 2018 |
President and Chief Operating Officer | | October 1, 2009 |
| | |
Vincent L. Ammann, Jr., Age 59(1)
| | |
Executive Vice President and Chief Financial Officer | | July 6, 2018 |
Senior Vice President and Chief Financial Officer | | October 1, 2013 |
Vice President and Chief Financial Officer | | September 30, 2006 |
| | |
Douglas I. Bonawitz, Age 56(1)
| | |
Vice President and Treasurer | | July 5, 2017 |
Assistant Treasurer | | October 1, 2016 |
| | |
William R. Ford, Age 63(1)
| | |
Vice President and Chief Accounting Officer | | October 1, 2013 |
Controller | | October 1, 2010 |
| | |
Marcellous P. Frye, Jr., Age 50(2)
| | |
Vice President—Business Services and Public Policy | | March 21, 2008 |
| | |
Luanne S. Gutermuth, Age 56(1)
| | |
Executive Vice President and Chief Administrative Officer | | July 6, 2018 |
Senior Vice President—Shared Services and Chief Human Resource Officer | | October 1, 2014 |
Vice President—Human Resources and Organization Development | | October 1, 2010 |
| | |
Karen M. Hardwick, Age 55(1)(3)
| | |
Senior Vice President and General Counsel | | October 15, 2018 |
| | |
Mark A. Lowe, Age 55(2)
| | |
Vice President—Gas Supply and Engineering | | October 1, 2014 |
Division Head—Gas Supply | | March 10, 2008 |
| | |
Richard H. Moore, Age 50(1)
| | |
Vice President—Corporate Development Officer | | October 1, 2015 |
Division Head and Chief Operating Officer, Washington Gas Energy Services | | May 25, 2014 |
WGL Holdings, Inc.
Washington Gas Light Company
Part I
|
| | |
Division Head—Strategy and Business Development | | November 30, 2009 |
| | |
Anthony M. Nee, Age 62(4)
| | |
Vice President, Strategy, Business Development and Non-Utility Operations | | July 5, 2017 |
Vice President and Treasurer | | October 1, 2013 |
Treasurer | | February 14, 2009 |
| | |
John O'Brien, Age 58(1)(5)
| | |
Executive Vice President, Strategy & Public Affairs | | July 6, 2018 |
| | |
Dorothy Ramsey, Age 63(1)
| | |
Vice President—Human Resources | | October 15, 2018 |
Assistant Vice President and Chief Talent Officer | | September 29, 2016 |
Director Organization Effectiveness | | March 13, 2006 |
| | |
Douglas A. Staebler, Age 58(2)
| | |
Senior Vice President—Utility Operations | | October 1, 2014 |
Vice President—Operations, Engineering, Construction and Safety | | October 31, 2006 |
| | |
Leslie T. Thornton, Age 60(1)
| | |
Senior Vice President—General Counsel and Merger Transition Counsel | | October 15, 2018 |
Senior Vice President—General Counsel and Corporate Secretary | | October 1, 2014 |
Vice President and General Counsel | | January 1, 2012 |
Counsel to the Chairman | | November 28, 2011 |
| | |
Tracy L. Townsend, Age 52(2)
| | |
Vice President—Construction, Compliance and Safety | | October 1, 2014 |
Division Head—Safety, Compliance, Construction Operations Support and Technology | | October 1, 2010 |
| | |
(1) At October 31, 2018, Executive Officer of both WGL Holdings, Inc. and Washington Gas Light Company.
(2) At October 31, 2018, Executive Officer of only Washington Gas Light Company.
(3)Prior to her appointment as General Counsel of WGL Holdings, Inc. and Washington Gas Light Company, Ms. Hardwick served as General Counsel for the University of the District of Columbia from March 2016 to October 2018. Prior to that position, Ms. Hardwick served as General Counsel/City Attorney to Annapolis, Maryland from December 2009 to December 2013.
(4) At October 31, 2018, Executive Officer of only WGL Holdings, Inc.
(5) Mr. O'Brien has had various roles within the AltaGas organization since joining in 2015, most recently as President and Chief Operating Officer of ASUS. He is currently also Executive Vice President, Government and Regulatory for ASUS and AUHUS, both of which are subsidiaries of AltaGas. Prior to this appointment, Mr. O'Brien was the President and Chief Operating Officer of AltaGas Services (U.S.) Inc. from April 2016 to July 2018, overseeing its operational and business development activities. Prior to AltaGas, Mr. O'Brien held management positions in Government Relations and Regulatory Affairs within the energy industry, including most recently in the position of Executive Vice President, Public Policy and External Affairs with Energy Future Holdings (Energy Future Holdings filed for bankruptcy in 2014).
ITEM 5. MARKET FOR REGISTRANT’S COMMON EQUITY, RELATED STOCKHOLDER MATTERS AND ISSUER PURCHASES OF EQUITY SECURITIES
On July 6, 2018, we consummated the Merger with AltaGas. The Merger Agreement provided for the Merger of the Merger Sub, a newly formed indirect wholly owned subsidiary of AltaGas with and into WGL, whereby WGL became an indirect wholly owned subsidiary of AltaGas. Upon consummation of the Merger, all then outstanding shares of WGL common stock were converted into the right to receive the merger consideration of $88.25 per share. Each share of the Merger Sub's issued and outstanding common stock at the time of the consummation of the Merger was converted into one share of no par value
WGL Holdings, Inc.
Washington Gas Light Company
Part II
Item 5. Market for Registrant’sRegistrant's Common Equity, Related
Stockholder Matters and Issuer Purchases of Equity Securities
WGL common stock for a total of 100 WGL post-Merger shares owned by Wrangler 1 LLC, an indirect wholly owned subsidiary of AltaGas (Wrangler 1). As a result of the Merger, WGL's common stock was delisted from the New York Stock Exchange, and there is no longer a market for WGL’s common stock.
In connection with the Merger, WGL established Wrangler SPE LLC (SPE), the special purpose bankruptcy remote entity formed for the purposes of owning the common stock of Washington Gas and providing ring-fencing protections to Washington Gas in the event of a bankruptcy of the larger AltaGas organization. The SPE is a wholly owned subsidiary of WGL. Following the consummation of the Merger, all of Washington Gas’ outstanding shares of common stock previously held by WGL were transferred to the SPE. The Merger had no effect on the Washington Gas preferred stock, which continues to be outstanding.
WGL Holdings, Inc.
Washington Gas Light Company
Part II
ITEM 5. MARKET FOR REGISTRANT’S COMMON EQUITY, RELATED STOCKHOLDER MATTERS AND ISSUER PURCHASES OF EQUITY SECURITIES
Market Information
All of the outstanding shares of Washington Gas' common stock are owned by Wrangler, an indirect wholly owned subsidiary of AltaGas Ltd. Washington Gas' common stock is not publicly traded.
On December 17, 2018, we voluntarily registered Washington Gas' common stock under Section 12(g) of the Securities Exchange Act of 1934, as amended, effective on such date.
Washington Gas Light Company
Part II
Item 6. Selected Financial Data
ITEM 6. SELECTED FINANCIAL DATA-WGL Holdings, Inc.
The following table presents selected financial dataWashington Gas meets the conditions set forth in General Instruction I(1) of Form 10-K and has omitted the information called for WGL derived from our financial statements asby this Item pursuant to General Instruction I(2) of and for the last five fiscal years. The information should be read in conjunction with “Management’s Discussion and Analysis of Financial Condition and Results of Operations” and the audited Consolidated Financial Statements and the Notes to the Consolidated Financial Statements.Form 10-K.
|
| | | | | | | | | | | | | | | | | | | | |
| (In thousands) | | | | | | | | | | |
| Years Ended September 30, | 2018 | | 2017 | | 2016 | | 2015 | | 2014 | |
| SUMMARY OF EARNINGS | | | | | | | | | | |
| Operating Revenues | | | | | | | | | | |
| Utility | $ | 1,229,521 |
| | $ | 1,143,337 |
| | $ | 1,044,117 |
| | $ | 1,303,044 |
| | $ | 1,416,951 |
| |
| Non-utility | 1,112,244 |
| | 1,211,387 |
| | 1,305,442 |
| | 1,356,786 |
| | 1,363,996 |
| |
| Total operating revenues | $ | 2,341,765 |
| | $ | 2,354,724 |
| | $ | 2,349,559 |
| | $ | 2,659,830 |
| | $ | 2,780,947 |
| |
| Net income applicable to common stock | $ | 49,343 |
| | $ | 192,620 |
| | $ | 167,594 |
| | $ | 131,259 |
| | $ | 105,940 |
| |
| CAPITALIZATION-YEAR END | | | | | | | | | | |
| WGL Holdings Common shareholders’ equity | $ | 1,796,478 |
| | 1,502,690 |
| | $ | 1,375,561 |
| | $ | 1,243,247 |
| | $ | 1,246,576 |
| |
| Non-controlling interest | 7,732 |
| | 6,851 |
| | 409 |
| | — |
| | — |
| |
| Washington Gas Light Company preferred stock | 28,173 |
| | 28,173 |
| | 28,173 |
| | 28,173 |
| | 28,173 |
| |
| Total equity | 1,832,383 |
| | 1,537,714 |
| | 1,404,143 |
| | 1,271,420 |
| | 1,274,749 |
| |
| Long-term debt, excluding current maturities | 1,879,875 |
| | 1,430,861 |
| | 1,435,045 |
| (a) | 937,101 |
| (a) | 675,095 |
| (a) |
| Total capitalization | $ | 3,712,258 |
| | 2,968,575 |
| | $ | 2,839,188 |
| (a) | $ | 2,208,521 |
| (a) | $ | 1,949,844 |
| (a) |
| OTHER FINANCIAL DATA | | | | | | | | | | |
| Property, plant and equipment-net—year-end | $ | 4,885,429 |
| | $ | 4,630,051 |
| | $ | 4,127,237 |
| | $ | 3,672,728 |
| | $ | 3,314,445 |
| |
| Total assets—year-end | $ | 7,248,087 |
| | $ | 6,629,009 |
| | $ | 6,049,450 |
| (a) | $ | 5,254,259 |
| (a) | $ | 4,825,702 |
| (a) |
WGL Holdings, Inc.
Washington Gas Light Company
Part II
Item 6. Selected Financial Data
ITEM 6. SELECTED FINANCIAL DATA-Washington Gas Light Company
The following table presents selected financial data for Washington Gas derived from the financial statements as of and for the last five fiscal years. The information should be read in conjunction with “Management’s Discussion and Analysis of Financial Condition and Results of Operations” and the audited Consolidated Financial Statements and the Notes to the Consolidated Financial Statements.
|
| | | | | | | | | | | | | | | | | | | | |
| (In thousands, except per share data) | | | | | | | | | | |
| Years Ended September 30, | 2018 | | 2017 | | 2016 | | 2015 | | 2014 | |
| SUMMARY OF EARNINGS | | | | | | | | | | |
| Operating Revenues | | | | | | | | | | |
| Total operating revenues | $ | 1,248,063 |
| | $ | 1,166,968 |
| | $ | 1,070,904 |
| | $ | 1,328,191 |
| | $ | 1,443,800 |
| |
| Net income applicable to common stock | $ | (27,962 | ) | | $ | 130,472 |
| | $ | 111,794 |
| | $ | 107,358 |
| | $ | 97,004 |
| |
| CAPITALIZATION-YEAR END | | | | | | | | | | |
| Common shareholder’s equity | $ | 1,442,764 |
| | $ | 1,164,749 |
| | $ | 1,113,446 |
| | $ | 1,081,292 |
| | $ | 1,050,166 |
| |
| Preferred stock | 28,173 |
| | 28,173 |
| | 28,173 |
| | 28,173 |
| | 28,173 |
| |
| Long-term debt, excluding current maturities | 1,084,933 |
| | 1,134,461 |
| | 939,015 |
| (a) | 691,330 |
| (a) | 675,095 |
| (a) |
| Total capitalization | $ | 2,555,870 |
| | $ | 2,327,383 |
| | $ | 2,080,634 |
| (a) | $ | 1,800,795 |
| (a) | $ | 1,753,434 |
| (a) |
| OTHER FINANCIAL DATA | | | | | | | | | | |
| Property, plant and equipment-net—year-end | $ | 4,117,454 |
| | $ | 3,887,715 |
| | $ | 3,526,732 |
| | $ | 3,243,446 |
| | $ | 3,022,064 |
| |
| Total assets—year-end | $ | 5,150,082 |
| | $ | 4,954,714 |
| | $ | 4,609,555 |
| (a) | $ | 4,199,577 |
| (a) | $ | 3,938,029 |
| (a) |
UTILITY GAS SALES AND DELIVERIES (thousands of therms) | | | | | | | | | | |
| Gas sold and delivered | | | | | | | | | | |
| Residential firm | 711,726 |
| | 600,279 |
| | 590,625 |
| | 734,874 |
| | 738,963 |
| |
| Commercial and industrial | | | | | | | | | | |
| Firm | 205,644 |
| | 174,436 |
| | 167,832 |
| | 197,543 |
| | 200,153 |
| |
| Interruptible | 2,520 |
| | 2,554 |
| | 2,771 |
| | 2,072 |
| | 2,193 |
| |
| Total gas sold and delivered | 919,890 |
| | 777,269 |
| | 761,228 |
| | 934,489 |
| | 941,309 |
| |
| Gas delivered for others | | | | | | | | | | |
| Firm | 538,266 |
| | 495,031 |
| | 501,030 |
| | 558,125 |
| | 535,503 |
| |
| Interruptible | 248,151 |
| | 242,545 |
| | 239,013 |
| | 260,264 |
| | 267,705 |
| |
| Electric generation | 180,626 |
| | 87,611 |
| | 291,252 |
| | 179,061 |
| | 144,403 |
| |
| Total gas delivered for others | 967,043 |
| | 825,187 |
| | 1,031,295 |
| | 997,450 |
| | 947,611 |
| |
| Total utility gas sales and deliveries | 1,886,933 |
| | 1,602,456 |
| | 1,792,523 |
| | 1,931,939 |
| | 1,888,920 |
| |
| OTHER STATISTICS | | | | | | | | | | |
| Active customer meters—year-end | 1,177,976 |
| | 1,163,655 |
| | 1,144,160 |
| | 1,129,865 |
| | 1,117,043 |
| |
| New customer meters added | 12,581 |
| | 12,488 |
| | 12,221 |
| | 12,099 |
| | 13,327 |
| |
| Heating degree days—actual | 3,759 |
| | 3,127 |
| | 3,341 |
| | 3,929 |
| | 4,111 |
| |
| Weather percent colder (warmer) than normal | (4.7 | )% | | (15.9 | )% | | (10.4 | )% | | 4.6 | % | | 9.6 | % | |
WGL Holdings, Inc.
Washington Gas Light Company
Part II
Item 7. Management’s Discussion and Analysis of
Financial Condition and Results of Operations
ITEM 7. MANAGEMENT’S DISCUSSION AND ANALYSIS OF FINANCIAL CONDITION AND RESULTS OF OPERATIONS
INTRODUCTIONIntroduction
This Management’s Discussion and Analysis of Financial Condition and Results of Operations (Management’s Discussion)Discussion and Analysis) analyzes the financial condition, results of operations and cash flows of WGL and its subsidiaries.Washington Gas. This discussion follows the format permitted in accordance with General Instruction I(2) of Form 10-K, in light of Washington Gas’ status as a wholly-owned subsidiary of AltaGas as permitted under General Instruction I(1) of Form 10-K. It also includes management’s narrative analysis of results of operations and reasons for material changes. This narrative discusses past financial results and potential factors that may affect future results, potential future risks and approaches that may be used to manage them. Except where the content clearly indicates otherwise, “WGL,“Washington Gas,” “we,” “us”“us,” “our” or “our”the "Company" refers to the holding company or the consolidated entity of WGL Holdings, Inc. and all of its subsidiaries.Washington Gas Light Company.
Management’s Discussion is divided into the following two major sections:
WGL—This section describes the financial condition and results of operations of WGL Holdings, Inc. and its subsidiaries on a consolidated basis. It includes discussions of our regulated operations, including Washington Gas and Hampshire Gas Company (Hampshire), and our non-utility operations.
Washington Gas—This section describes the financial condition and results of operations of Washington Gas, a subsidiary of WGL, which comprises the majority of the regulated utility segment.
Both sections of Management’s Discussion—WGL and Washington Gas—areAnalysis is designed to provide an understanding of our operations and financial performance and should be read in conjunction with the respective company’s financial statements and the combined Notes to Consolidated Financial StatementsStatements.
Executive Overview
Washington Gas has one operating segment that engages in this annual report.
EXECUTIVE OVERVIEW
Introduction
WGL, through its subsidiaries, sellscore business of delivering and deliversselling natural gas and provides a variety of energy-related products and services to customers primarily in the District of Columbia and the surrounding metropolitan areas in Maryland and Virginia. In addition to our primary markets, WGL’s non-utility subsidiaries provide customized energy solutions across a much wider footprint, with business activities across the United States.
WGL has four operating segments:
regulated utility;
retail energy-marketing;
commercial energy systems; and
midstream energy services.
Refer to the Business section under Item 1 of this report for further discussion of our regulated utility and non-utility business segments.
On July 6, 2018, WGL became an indirect wholly owned subsidiary of AltaGas. For further information on the merger, see "Safe Harbor and Forward Looking Statements" in the Introduction, Item I, Item 1A. Risk Factors, and Note 20 — Merger with AltaGas Ltd. of the Notes to Consolidated Financial Statements in this Form 10-K.
Regulated Utility Operating Segment
The regulated utility operating segment is composed of our core subsidiary, Washington Gas and Hampshire. Washington Gas engages in the delivery and sale of natural gas that is regulatedtariffs approved by regulatory commissions in the District of Columbia, Maryland and Virginia. During fiscalNet income was $99.8 million for the calendar year 2018ended December 31, 2019 compared to a net loss of $35.4 million for the previous year, this segment had reduced earnings due to: (i) highersame period ended December 31, 2018. The increase in net income was mainly from $58.0 million increase in operating revenues driven by the impact of rate cases, accelerated pipe replacement programs and customer growth, and a $159.5 million decrease in operation and maintenance expenses primarily relateddue to the lower merger commitmentcommitments and related costs.
Factors critical to the success of Washington Gas include: (i) operating a safe and reliable natural gas distribution system; (ii) having sufficient natural gas supplies to meet customer demands; (iii) being competitive with other sources of energy such as electricity, fuel oil and propane; (iv) having access to sources of liquidity; (v) recovering the costs and expenses (ii) lower realized marginsof this business in the rates charged to customers, and (vi) earning a fair, just and reasonable rate of return on invested capital.
Results of Operations
Our chief operating decision maker utilizes the non-GAAP measure, EBITDA, as the primary measure of profit and loss in assessing the results of operations. We believe that our use of EBITDA enhances the ability to evaluate Washington Gas' performance because it excludes interest and income tax expense, which are affected by corporate-wide strategies of AltaGas such as capital financing. It also excludes depreciation and amortization which do not affect cash flows.
EBITDA should not be considered an alternative to, or a more meaningful indicator of our operating performance than, net income.
The following table reconciles EBITDA to net income for the calendar years ended December 31, 2019 and 2018, three months ended December 31, 2018 and 2017, and fiscal years ended September 30, 2018 and 2017.
|
| | | | | | | | | | | | | | | | | | | | | | | | | | | | | | | | |
| |
| Calendar Years Ended December 31, | | Three Months Ended December 31, | | Fiscal Years Ended September 30, | | Increase (Decrease) |
| (In millions) | 2019 | 2018 (unaudited) | | 2018 |
2017 (unaudited)
| | 2018 | | 2017 | | Calendar Year | Three Months | | Fiscal Year |
| | | | 2019
vs. 2018 | 2018
vs. 2017 | | 2018
vs. 2017 |
| Net income (loss) | $ | 99.8 |
| $ | (35.4 | ) | | $ | 49.2 |
| $ | 57.9 |
| | $ | (26.6 | ) | | $ | 131.8 |
| | $ | 135.2 |
| $ | (8.7 | ) | | $ | (158.4 | ) |
| Interest expense | 62.6 |
| 59.2 |
| | 15.7 |
| 15.0 |
| | 58.5 |
| | 52.2 |
| | 3.4 |
| 0.7 |
| | 6.3 |
|
| Income tax expense (benefit) | 19.0 |
| (42.9 | ) | | 7.8 |
| 24.9 |
| | (25.9 | ) | | 79.8 |
| | 61.9 |
| (17.1 | ) | | (105.7 | ) |
| Depreciation and amortization | 142.6 |
| 136.4 |
| | 34.9 |
| 33.6 |
| | 135.1 |
| | 129.4 |
| | 6.2 |
| 1.3 |
| | 5.7 |
|
| EBITDA | $ | 324.0 |
| $ | 117.3 |
| | $ | 107.6 |
| $ | 131.4 |
| | $ | 141.1 |
| | $ | 393.2 |
| | $ | 206.7 |
| $ | (23.8 | ) | | $ | (252.1 | ) |
Summary Financial Results
The following table summarizes the Company’s financial data for the calendar year ended December 31, 2019 and 2018, three months ended December 31, 2018 and 2017, and fiscal years ended September 30, 2018 and 2017.
|
| | | | | | | | | | | | | | | | | | | | | | | | | | | | | | | | |
| |
| Calendar Year Ended December 31, | | Three Months Ended December 31, | | Fiscal Years Ended September 30, | | Increase (Decrease) |
| (In millions) | 2019 | 2018 (unaudited) | | 2018 |
2017 (unaudited)
| | 2018 | | 2017 | | Calendar Year | Three Months | | Fiscal Year |
| | | | 2019
vs. 2018 | 2018
vs. 2017 | | 2018
vs. 2017 |
| Net revenues: | | | | | | |
| | | | | | | |
| Operating revenues | $ | 1,330.7 |
| $ | 1,272.7 |
| | $ | 402.1 |
| $ | 377.5 |
| | $ | 1,248.1 |
| | $ | 1,167.0 |
| | $ | 58.0 |
| $ | 24.6 |
| | $ | 81.1 |
|
| Less: Cost of gas | 461.6 |
| 438.9 |
| | 156.6 |
| 124.8 |
| | 407.0 |
| | 297.9 |
| | 22.7 |
| 31.8 |
| | 109.1 |
|
| Less: Revenue taxes | 81.8 |
| 82.7 |
| | 24.2 |
| 24.0 |
| | 82.5 |
| | 75.1 |
| | (0.9 | ) | 0.2 |
| | 7.4 |
|
| Total net revenues | 787.3 |
| 751.1 |
| | 221.3 |
| 228.7 |
| | 758.6 |
| | 794.0 |
| | 36.2 |
| (7.4 | ) | | (35.4 | ) |
| Operation and maintenance | 405.0 |
| 564.5 |
| | 102.7 |
| 82.4 |
| | 544.2 |
| | 340.6 |
| | (159.5 | ) | 20.3 |
| | 203.6 |
|
| General taxes and other assessments | 67.8 |
| 64.0 |
| | 14.4 |
| 16.0 |
| | 65.6 |
| | 59.6 |
| | 3.8 |
| (1.6 | ) | | 6.0 |
|
| Other income (expenses)-net | 9.5 |
| (5.1 | ) | | 3.4 |
| 1.1 |
| | (7.7 | ) | | (0.6 | ) | | 14.6 |
| 2.3 |
| | (7.1 | ) |
| EBITDA | $ | 324.0 |
| $ | 117.5 |
| | $ | 107.6 |
| $ | 131.4 |
| | $ | 141.1 |
| | $ | 393.2 |
| | $ | 206.5 |
| $ | (23.8 | ) | | $ | (252.1 | ) |
Revenues
Operating revenues increased by $58.0 million in the calendar year ended December 31, 2019 compared to calendar year 2018 mainly driven by the impact of rate cases, accelerated pipe replacement programs, customer growth and other increases from conservation programs, recovery of various costs, and increases from interruptible and special contracts. We also utilize the non-GAAP measure of net revenues, calculated as revenues less the associated cost of energy and applicable revenue taxes, to assist in the analysis of profitability. The cost of the natural gas commodity (as adjusted for Asset Optimization sharing) and revenue taxes are included in the rates that Washington Gas charges to customers as reflected in operating revenues. Accordingly, changes in the cost of gas and revenue taxes associated with sales made to customers generally have no direct effect on utility net revenues, operating income or net income. Net revenues should not be considered an alternative to, or a more meaningful indicator of our operating performance than, operating revenues. Additionally, net revenues may not be comparable to similarly titled measures of other companies. The table above reconciles net revenues to operating revenues for the reporting periods as part of the reconciliation of operating revenues to EBITDA. Net revenues increased by $36.2 million in the calendar year ended December 31, 2019 compared to calendar year 2018.
The following are the main drivers noted above for the increase in operating revenues, as well as the additional drivers for the increase in net revenues:
Impact of rate cases. $16.2 million increase due to new base rates in Maryland, effective December 2018. Refer to “Rates and Regulatory Matters” for further discussion of these matters.
Accelerated replacement programs. $11.7 million increase due to approved accelerated replacement programs that were in place with an associated surcharge mechanism to recover the cost, including a return, on those capital investments.
Customer growth. $6.3 million increase due to customer growth. At the calendar year ended December 31, 2019, average active customer meters increased by approximately 12,000 over the number of average active customer meters for the same period of 2018, contributing to the increase. Adding new customers directly drives earnings growth through additional distribution revenues.
Asset optimization. $11.0 million decrease due to asset optimization. We recorded a net gain of $18.5 million including an unrealized mark-to-market valuationsgain of $5.4 million associated with our asset optimization program,energy-related derivatives for the calendar year ended December 31, 2019, compared to a net gain of $29.5 million including an unrealized gain of $7.6 million for the calendar year ended December 31, 2018.
Estimated effects of weather and (iii) higher depreciationconsumption patterns. Weather, when measured by HDDs, was 7.9% and amortization expense associated with growth in our utility plant. Partially offsetting these unfavorable variances were: (i) customer growth, (ii) higher2.5% warmer than normal for the calendar years ended December 31, 2019 and 2018, respectively, driving lower net revenues attributed to colder weather inof $3.0 million. In the District of Columbia, where Washington Gas does not have a billing mechanism or financial instruments to offset the effects of weather, the comparatively warmer weather for the calendar year ended December 31, 2019 resulted in a negative variance to net revenues. Natural gas consumption patterns may be affected by shifts in weather patterns in which customer heating usage may not correlate highly with average historical levels of usage per heating degree days that occur. Natural gas consumption patterns may also be affected by non-weather related factors such as customer conservation. Refer to the section entitled "Weather Risk" for a discussion of billing mechanisms in Maryland and Virginia, which are designed to eliminate the net revenue effects of variations in customer usage caused by weather and other factors such as conservation.
Other. $16.0 million increase from conservation programs, recovery of various costs, and increases from interruptible and special contracts.
Operation and Maintenance Expenses
Operating and maintenance expenses decreased $159.5 million in calendar year 2019 compared to fiscalcalendar year 2018. The decrease was mainly driven by lower Merger commitments and related costs, offset by higher employee labor costs and benefits, corporate shared service cost paid to AltaGas after the Merger, and higher cost on safety and reliability activities including leak repair and mitigation.
Depreciation and Amortization
The $6.2 million increase between calendar year 2019 and 2018 represented higher depreciation expense on capital additions.
Other income (expense)
The $14.6 million increase in other income (expenses) for the calendar year 2019 compared to the calendar year 2018 was mainly driven by $13.5 million expense for charitable contributions as part of the Merger commitments that were recorded in 2018.
Income Taxes
The effective income tax rate for calendar year 2019 was 16.0% compared to 54.8% for calendar year 2018. The change in the effective income tax rate is primarily due to adjustments related to the amortization of excess deferred taxes. Refer to Note 9 — Income Taxes of the Notes to Financial Statements for details.
Statistical Information
Key gas delivery, weather and meter statistics are shown in the table below for the calendar years ended December 31, 2019 and 2018, three months ended December 31, 2018 and 2017, and (iii) new basefiscal years ended September 30, 2018 and 2017.
|
| | | | | | | | | | | | | | | | | | |
| Gas Deliveries, Weather and Meter Statistics |
| | Calendar Years Ended December 31, | Three Months Ended December 31, | Fiscal Years Ended September 30, | Increase (decrease) |
| | 2019 | 2018 | 2018 | 2017 | 2018 | 2017 | Calendar Year 2019 vs. 2018 | Three Months 2018 vs. 2017 | Fiscal Year 2018
vs. 2017 |
Gas Sales and Deliveries (millions of therms) | | | | | | | | | |
| Firm | 1,410.0 |
| 1,461.6 |
| 473.7 |
| 441.2 |
| 1,455.6 |
| 1,269.8 |
| (51.6 | ) | 32.5 |
| 185.8 |
|
| Interruptible | 259.4 |
| 245.5 |
| 67.2 |
| 72.2 |
| 250.7 |
| 245.1 |
| 13.9 |
| (5.0 | ) | 5.6 |
|
| Electric generation | 67.0 |
| 172.8 |
| 24.3 |
| 32.1 |
| 180.6 |
| 87.6 |
| (105.8 | ) | (7.8 | ) | 93.0 |
|
| Other | 36.8 |
| 37.4 |
| — |
| — |
| — |
| — |
| (0.6 | ) | — |
| — |
|
| Total deliveries | 1,773.2 |
| 1,917.3 |
| 565.2 |
| 545.5 |
| 1,886.9 |
| 1,602.5 |
| (144.1 | ) | 19.7 |
| 284.4 |
|
| Degree Days | | | | | | | | | |
| Actual | 3,552 |
| 3,820 |
| 1,398 |
| 1,335 |
| 3,759 |
| 3,127 |
| (268 | ) | 63 |
| 632 |
|
| Normal | 3,855 |
| 3,917 |
| 1,392 |
| 1,419 |
| 3,944 |
| 3,970 |
| (62 | ) | (27 | ) | (26 | ) |
| Percent colder (warmer) than normal | (7.9 | )% | (2.5 | )% | 0.4 | % | (5.9 | )% | (4.7 | )% | (21.2 | )% | n/a |
| n/a |
| n/a |
|
| Average active customer meters | 1,189,000 |
| 1,177,000 |
| 1,181,000 |
| 1,167,000 |
| 1,173,000 |
| 1,155,000 |
| 12,000 |
| 14,000 |
| 18,000 |
|
| Ending active customer meters | 1,192,462 |
| 1,184,830 |
| 1,184,830 |
| 1,169,294 |
| 1,177,976 |
| 1,163,655 |
| 7,632 |
| 15,536 |
| 14,321 |
|
| New customer meters added | 11,898 |
| 11,975 |
| 3,216 |
| 3,673 |
| 12,581 |
| 12,488 |
| (77 | ) | (457 | ) | 93 |
|
Gas Service to Firm Customers
The volume of gas delivered to firm customers is highly sensitive to weather variability as a large portion of the natural gas delivered by Washington Gas is used for space heating. Washington Gas’ rates are based on an assumption of normal weather. The tariffs in the DistrictMaryland and Virginia jurisdictions include provisions that consider the effects of Columbiathe RNA and Virginia.the WNA/CRA mechanisms, respectively, that are designed to, among other things, eliminate the effect on net revenues of variations in weather from normal levels (refer to the section entitled “Weather Risk” for a further discussion of these mechanisms and other weather-related instruments included in our weather protection strategy).
During the calendar year ended December 31, 2019, the comparison in natural gas deliveries to firm customers primarily reflects 7.9% warmer than normal weather when measured by HDDs, compared to 2.5% warmer than normal weather for the prior year. We also had an increase in average active customer meters of approximately 12,000 during the calendar year ended December 31, 2019, when compared to the prior year.
WGL Holdings, Inc.Many customers choose to buy the natural gas commodity from unregulated third-party marketers, rather than purchase the natural gas commodity and delivery service from Washington Gas on a bundled basis. This does not affect Washington Gas' net income because Washington Gas charges its customers the cost of gas without any mark-up. Of Washington Gas’ 1.2 million
Washington Gas Light Company
Part II
Item 7. Management’s Discussion and Analysis of
Financial Condition and Results of Operations (continued)
Retail Energy-Marketing Operating Segment
We offer competitively priced natural gas, electricity and energy from renewable sources to customers through WGL Energy Services, our non-utility retail energy-marketing subsidiary. During fiscal year 2018 compared to the previous year, this segment had reduced earnings as a result of: (i) unrealized commodity margin losses in the current year compared to gains in the prior year, (ii) lower realized electric margins due to lower average unit margins and lower sales volumes, and (iii) higher operating expenses due to increased corporate overhead allocations and customer marketing expenses. Partially offsetting the reduced earnings was higher realized gas margins due to increased portfolio optimization.
Commercial Energy Systems Operating Segment
Through WGL Energy Systems and WGSW, we offer efficient and sustainable commercial energy solutions focused on owning and operating distributed generation assets such as Solar PV systems and upgrading energy related systems of large government and commercial facilities. During fiscal year 2018 compared to the previous fiscal year, this segment had reduced earnings due to: (i) lower solar renewable energy credit sales and rebate income revenues, (ii) higher costs primarily relating to increased corporate overhead allocation expenses, and (iii) increased bad debt expense. The reduced earnings were partially offset by higher earnings from alternative energy investments, including investments in tax equity partnerships.
Midstream Energy Services Operating Segment
WGL Midstream specializes in the investment, management, development and optimization of natural gas storage and transportation midstream infrastructure projects. Lower earnings for fiscal year 2018 compared to the previous year primarily reflect: (i) an impairment related to our investment in Constitution Pipeline Company, LLC (Constitution), and (ii) a decrease related to valuations on our derivative contracts associated with our commodity trading portfolio. Partially offsetting these unfavorable variances was an increase related to realized margins on both our transportation and storage strategies.
Other Activities
Activities and transactions that are not significant enough on a stand-alone basis to warrant treatment as an operating segment, and that do not fit into one of our four operating segments, are aggregated as “Other Activities” and are included as part of non-utility operations. Administrative and business development costs associated with WGL and Washington Gas Resources are also included in “Other Activities.” Higher losses for fiscal year 2018 compared to the previous year primarily relates to investment banking and legal fees due upon the merger closing with AltaGas.
CRITICAL ACCOUNTING POLICIES
Preparation of financial statements and related disclosures in compliance with GAAP requires the selection and the application of appropriate technical accounting guidance to the relevant facts and circumstances of our operations, as well as our use of estimates to compile the consolidated financial statements. The application of these accounting policies involves judgment regarding estimates and projected outcomes of future events, including the likelihood of success of particular regulatory initiatives, the likelihood of realizing estimates for legal and environmental contingencies, and the probability of recovering costs and investments in both the regulated utility and non-regulated business segments.
We have identified the following critical accounting policies discussed below that require our judgment and estimation, where the resulting estimates have a material effect on the consolidated financial statements.
Accounting for Unbilled Revenue
For regulated deliveries of natural gas, Washington Gas reads meters and bills customers on a monthly cycle basis. The billing cycles for customers do not coincide with the accounting periods used for financial reporting purposes. Washington Gas accrues unbilled revenues for gas that has been delivered but not yet billed at the end of an accounting period by jurisdiction and customer class, including the estimated effects of billing adjustment mechanisms. WGL Energy Services also accrues unbilled revenues for both gas and electricity, which is billed on cycles that do not coincide with the accounting periods used for financial reporting purposes.
Accounting for Regulatory Operations—Regulatory Assets and Liabilities
A significant portion of our business is subject to regulation by independent government entities. As the regulated utility industry continues to address competitive market issues, the cost-of-service regulation used to compensate Washington Gas for the cost of its regulated operations will continue to evolve. Non-traditional ratemaking initiatives and market-based pricing of
WGL Holdings, Inc.
Washington Gas Light Company
Part II
Item 7. Management’s Discussion and Analysis of
Financial Condition and Results of Operations
products and services could have additional long-term financial implications for us. The carrying cost of Washington Gas’ investment in fixed assets assumes continued regulatory oversight of our operations.
Washington Gas’ jurisdictional tariffs contain mechanisms that provide for the recovery of the cost of gas consumed by firm customers. Under these mechanisms, Washington Gas periodically adjusts its firm customers’ rates to reflect fluctuations in the cost of gas. Annually, Washington Gas reconciles the difference between the gas costs collected from firm customers and the cost of gas incurred, defers any difference and either recovers deficiencies from, or refunds excess recoveries to, customers over a period of time authorized by its regulators.
Washington Gas accounts for its regulated operations in accordance with FASB Accounting Standards Codification (ASC) Topic 980, Regulated Operations (ASC Topic 980), which results in differences in the application of GAAP between regulated and unregulated businesses. ASC Topic 980 requires recording regulatory assets or liabilities for certain transactions that would have been treated as expense or revenue in unregulated businesses. Washington Gas defers the recognition of an incurred cost and records a regulatory asset when it is probable that these costs will be recovered in future rates. Washington Gas defers the recognition of revenue and records a regulatory liability when it is probable that it will refund an amount previously collected from customers or refund a gain to customers. Additionally, Washington Gas records a regulatory liability when a regulator provides current rates intended to recover costs that will be incurred in the future. Future regulatory changes or changes in the competitive environment could result in WGL and Washington Gas discontinuing the application of ASC Topic 980 for some of its business and require the write-off of the portion of any regulatory asset or liability for which recovery or refund is no longer probable. If Washington Gas were required to discontinue the application of ASC Topic 980 for any of its operations, it would record a non-cash charge or credit to income for the net book value of its regulatory assets and liabilities. Other adjustments might also be required.
The current regulatory environment and Washington Gas’ specific facts and circumstances support both the continued application of ASC Topic 980 for our regulatory activities and the conclusion that all of our regulatory assets and liabilities as of September 30, 2018 are recoverable or refundable through rates charged to customers. See Note 2—Regulated Operations of the Notes to Consolidated Financial Statements for further discussion of our regulated operations.
Accounting for Income Taxes
We recognize deferred income tax assets and liabilities for all temporary differences between the financial statement basis and the tax basis of assets and liabilities, including those temporary differences that regulators exclude from current rates for ratemaking purposes of Washington Gas, in accordance with ASC Topic 740, Accounting for Income Taxes.
Regulatory assets or liabilities, corresponding to such additional deferred tax assets or liabilities, may be recorded to the extent recoverable from or payable to customers through the ratemaking process in future periods. These deferred income tax related regulatory assets and liabilities primarily represent differences between the financial statement basis and tax basis of net utility plant in service.
The company is earning investment tax credits on its renewable energy investments. We have elected to record investment tax credits as deferred credits and amortize the balances to income over the life of the related property.
See Note 8—Income Taxes of the Notes to Consolidated Financial Statements for further discussion of income taxes.
Accounting for Contingencies
We account for contingent liabilities utilizing ASC Topic 450, Contingencies. By their nature, the amount of the contingency and the timing of a contingent event and any resulting accounting recognition are subject to our judgment of such events and our estimates of the amounts. Actual results related to contingencies may be difficult to predict and could differ significantly from the estimates included in reported earnings. For a discussion of contingencies, see Note 12—Commitments and Contingencies of the Notes to Consolidated Financial Statements.
Accounting for Derivatives
We enter into both physical and financial contracts for the purchase and sale of natural gas and electricity and apply the fair value requirements of ASC Topic 815, Derivatives and Hedging. The financial contracts and the portion of the physical contracts that qualify as derivative instruments and are subject to the mark-to-market accounting requirements are recorded on the balance sheet at fair value. A portion of our physical contracts entered into for the purpose of serving our customers are designated as “normal purchases and normal sales” and therefore, not subject to the fair value accounting requirements of ASC Topic 815. Certain physical contracts do not qualify as derivative instruments due to the significance of their notional amounts
WGL Holdings, Inc.
Washington Gas Light Company
Part II
Item 7. Management’s Discussion and Analysis of
Financial Condition and Results of Operations
relative to the applicable liquid markets. Future changes related to these markets may result in mark-to-market accounting requirements for these contracts.
WGL and Washington Gas also utilize derivative instruments to minimize the risk of interest-rate volatility associated with planned issuances of debt securities. Depending on the applicability of ASC Topic 980 or hedge accounting, the impact of the instruments may be offset on the balance sheet as regulatory assets or liabilities, in other comprehensive income or in earnings.
The gain or loss on a derivative that qualifies as a cash flow hedge of an exposure to variable cash flows of a forecasted transaction is initially recorded in accumulated other comprehensive income (AOCI) to the extent that the hedge is effective and is subsequently reclassified into earnings, in the same category as the item hedged, when the gain or loss from the forecasted transaction occurs. If a derivative that previously qualified for cash flow hedging no longer qualifies because the underlying forecasted transaction is no longer probable of occurring, then the treatment of the fair value must be assessed. If it is reasonably possible that the forecasted transaction will occur, then the fair value changes going forward will be charged to earnings and previous amounts recorded to AOCI will remain until the forecasted transaction is probable of not occurring, in which case, the deferred gain or loss in AOCI is immediately reclassified into earnings. Gains or losses related to any ineffective portion of the cash flow hedges are also recognized in earnings immediately.
Judgment is required in determining the appropriate accounting treatment for our derivative instruments, including our ability to: (i) evaluate contracts and other activities as derivative instruments subject to the accounting guidelines of ASC Topic 815; (ii) determine whether or not our derivative instruments are recoverable from or refundable to customers in future periods and (iii) derive the estimated fair value of our derivative instruments. See Note 13— Derivative and Weather-Related Instruments of the Notes to Consolidated Financial Statements for a discussion of our derivatives.
Accounting for Fair Value Instruments
Fair value is based on actively quoted market prices when they are available. In the absence of actively quoted market prices, we seek indicative price information from external sources, including broker quotes and industry publications. If pricing information from external sources is not available, internal models are used to estimate prices based on available historical and near-term future price information and/or the use of statistical methods. These inputs are used with industry standard valuation methodologies. See Note 14— Fair Value Measurements of the Notes to Consolidated Financial Statements for a discussion of our valuation methodologies.
Accounting for Investments
WGL evaluates its interests in other legal entities for consolidation under the variable interest entity (VIE) model or the voting interest model. A VIE is an entity where the total equity investment at risk is not sufficient to permit the entity to finance its activities without additional subordinated financial support or its equity investors, as a group, lack the characteristics of a controlling financial interest. WGL would consolidate a VIE when it is the primary beneficiary because it has both the power to direct the activities that have the most significant impact on economic performance and it has the obligation to absorb potentially significant losses or the right to receive potentially significant benefits. If an entity is not a VIE, it is evaluated under the voting interest method and would be consolidated if WGL has a controlling financial interest, which is typically evidenced by an ownership of a voting interest greater than 50% allowing for the control over the operations and policies of the investee.
WGL applies the equity method or cost method of accounting to its investments in which it does not have a controlling financial interest. WGL applies the equity method of accounting to its investments when it can exercise a significant influence over an investee. Under the equity method, WGL reports its interest in the entity and its share of the earnings from the entity as single line items in its financial statements, namely Investments in unconsolidated affiliates.
WGL uses the HLBV methodology for certain equity method investments as well as consolidating entities with non-controlling interests when the governing structuring agreement over the equity investment results in different liquidation rights and priorities than what is reflected by the underlying ownership percentage.
WGL uses the cost method of accounting for investments where it does not exercise significant influence. Under the cost method, WGL reports its investment at cost and recognizes income only to the extent it receives dividends or distributions.
Impairment of Long-lived Assets
Management regularly reviews property and equipment and other long-lived assets, including certain definite-lived intangible assets and our equity method investments for possible impairment whenever events or changes in circumstances indicate that the carrying value of such assets may not be recoverable. For our properties and equipment, the indicators of potential
WGL Holdings, Inc.
Washington Gas Light Company
Part II
Item 7. Management’s Discussion and Analysis of
Financial Condition and Results of Operations
impairment may include a deteriorating business or legal climate, a significant adverse change in asset condition, specific regulatory disallowance, advances in technology or plans to dispose of an asset significantly before the end of its useful life, among others. Management performs the recoverability test whenever the indicators show a possible impairment. The carrying amount of recoverability is determined based on an estimate of undiscounted cash flows, and measurement of an impairment loss is determined based on the fair value of the assets. The determination of fair value requires management to make assumptions about future cash inflows and outflows over the life of an asset. Any changes to the assumptions used for the future cash flow could result in revisions to the evaluation of the recoverability of the long-lived assets and the recognition of an impairment loss in the Consolidated Financial Statements.
For our equity method investments, an impairment is recorded when the investment has experienced decline in value that is other-than-temporary. Additionally, if the projects in which we hold an investment recognize an impairment loss, we would record our proportionate share of that impairment loss and evaluate the investment for decline in value that is other-than-temporary. This review occurs quarterly, or more frequently if events or changes in circumstances indicate the carrying amount of the asset may not be recoverable.
Principles of Consolidation and Non-controlling Interests
We consolidate an entity, after the elimination of intercompany transactions, when we have a controlling financial interest based on our evaluation of the entity under the voting interest model, or when we are the primary beneficiary based on our evaluation of the entity under the VIE model as discussed in the 'Accounting for Investments' section above. These evaluations require the use of judgment. The portion of equity interests attributable to other parties is reported as non-controlling interest.
We report the non-controlling interest in the consolidated balance sheet within the equity section, separately from WGL's common shareholders' equity. Non-controlling interest represents the non-controlling interest holder's proportionate share of consolidated total equity not attributable to WGL or its subsidiaries. Non-controlling interest is determined by the contributions from/distributions to the non-controlling interest holder, as adjusted for the non-controlling interest holder's proportionate share of the earnings or losses and other comprehensive income (loss), if any. The non-controlling interest holder continues to be allocated its share of losses even if it results in a deficit non-controlling interest balance.
Accounting for Pension and Other Post-Retirement Benefit Plans
Washington Gas maintains a qualified, trusteed, employee-non-contributory defined benefit pension plan (qualified pension plan) covering most active and vested former employees of Washington Gas and a separate non-qualified defined benefit supplemental retirement plan (DB SERP) covering certain executive officers. The qualified pension plan and DB SERP were closed to new entrants on January 1, 2010. As of January 1, 2010, all new employees were entitled to participate in our defined contribution plans, and certain management employees receive benefits under a non-funded defined benefit restoration plan (DB Restoration). The DB Restoration was established for the purpose of providing supplemental pension and pension related benefits. Washington Gas also provides certain health care and life insurance benefits for retired employees (health and life benefit plan). Washington Gas accrues the estimated benefit obligation for all of our defined benefit plans as earned by the covered employees. The qualified pension plan and health and life benefit plan benefits are paid out of the respective trusts. For the unfunded DB SERP and DB Restoration, Washington Gas pays, from internal funds, the individual benefits as they are due or from funds held in rabbi trusts formed to fully satisfy certain outstanding employee benefit obligations immediately prior to the merger close. The qualified pension plan, DB SERP, DB Restoration and health and life benefit plans are collectively referred to as the “Plans.”
The measurement of the Plans’ obligations and costs is dependent on a variety of factors, such as employee demographics, the level of contributions made to the Plans, earnings on the Plans’ assets and mortality rates. The following assumptions are also critical to this measurement. These assumptions are derived on an annual basis with the assistance of a third-party actuarial firm:
Discount rate,
Expected long-term return on plan assets,
Rate of compensation increase,
Healthcare cost trend rate and
Projected increases to the Health Reimbursement Account (HRA) plan stipend.
WGL Holdings, Inc.
Washington Gas Light Company
Part II
Item 7. Management’s Discussion and Analysis of
Financial Condition and Results of Operations
We determine the discount rate based on a portfolio of high quality fixed-income investments (AA- as assigned by Standard & Poor’s or Aa3 as assigned by Moody’s or better) whose cash flows would cover our expected benefit payments. We determine the expected long-term rate of return by averaging the expected earnings for the target asset portfolio. In developing the expected rate of return assumption, we evaluate an analysis of historical actual performance and long-term return projections, which gives consideration to the asset mix and anticipated length of obligation of the Plans. Historically, the expected long-term return on plan assets has been lower for the health and life benefit plan than for the qualified pension plan due to differences in the allocation of the assets in the plan trusts and the taxable status of one of the trusts. We calculate the rate of compensation increase based on salary expectations, expected inflation levels, union negotiated salary rates and promotional expectations. The healthcare cost trend rate is determined by working with insurance carriers, reviewing historical claims data for the health and life benefit plan, considering plan provisions and analyzing market expectations. Effective January 1, 2015, Medicare eligible retirees and dependents age 65 and older receive an annual subsidy of $3,300 as a benefit from the HRA plan and, therefore, the value of the benefits provided to these participants is not affected by the healthcare cost trend rate. While the HRA plan terms do not guarantee increases to the stipend, Washington Gas intends to review the stipend annually. Washington Gas assumed no increase to the annual subsidy until 2020 when the stipend is expected to increase 3.0% each year in order to approximate possible future increases to the stipend.
The following table illustrates the effect of changing these actuarial assumptions, while holding all other assumptions constant:
|
| | | | | | | | | |
Effect of Changing Critical Actuarial Assumptions |
(In millions) | | | Pension Benefits | | Health and Life Benefits |
Actuarial Assumptions | Percentage-Point
Change in
Assumption
| | Increase
(Decrease) in
Ending
Obligation
| | Increase
(Decrease) in
Annual Cost
| | Increase
(Decrease) in
Ending
Obligation
| | Increase
(Decrease) in
Annual Cost
|
Expected long-term return on plan assets | +/- 1.00 pt. | | n/a | | $(7.4) / $7.4 | | n/a | | $(4.9) / $4.9 |
Discount rate | +/- 0.25 pt. | | $(30.0) / $31.6 | | $(2.8) / $3.0 | | $(8.9) / $9.5 | | $(0.0) / $0.0 |
Rate of compensation increase | +/- 0.25 pt. | | $5.0 / $(4.8) | | $1.1 / $(1.1) | | n/a | | n/a |
Healthcare cost trend rate | +/- 1.00 pt. | | n/a | | n/a | | $5.2 / $(4.6) | | $0.6 / $(0.5) |
Projected increases to the HRA plan stipend | +/- 1.00 pt. | | n/a | | n/a | | $32.2 / $(26.3) | | $3.6 / $(2.3) |
We have historically utilized the Society of Actuaries’ (SOA) published mortality data in developing a best estimate of mortality as part of the calculation of the pension and other post-retirement benefit obligations. On October 27, 2014, the SOA published updated mortality tables for U.S. plans (RP-2014) and an updated improvement scale (MP-2014), which both reflect improved longevity. The MP-2014 improvement scale assumes that short-term rates of mortality improvement will converge to 1.00% per annum up to age 85 trending down to 0% between age 85 and age 115 with the ultimate long-term rate of improvement over a 20-year period from 2007 to 2027. Based upon an evaluation of the information provided by the SOA related to the RP-2014 tables and the MP-2014 improvement scale as well as recent additional studies of mortality improvement, we adopted the RP-2014 tables and adopted a modified improvement scale. We have modified the MP-2014 improvement scale to (a) adjust the ultimate long-term rate of mortality improvement from 1.00% to 0.75% per annum up to age 85 trending down to 0% between age 85 and age 115; and (b) shorten the convergence period from short term to ultimate rates of improvement from the 20-year period to a 15-year period. These mortality assumptions were used to determine the benefit obligations as of September 30, 2018 and 2017. Subsequently, the SOA published updated improvement scales (MP-2015, MP-2016, and MP-2017) which, compared to MP-2014, includes more recent mortality experience data and projects a lower rate of future mortality improvement. These updates are consistent with the adjustments we made to MP-2014 to develop our modified improvement scale.
Differences between actuarial assumptions and actual plan results are deferred and amortized into cost when the accumulated differences exceed ten percent of the greater of the projected benefit obligation or the market-related value of the plan assets. If necessary, the excess is amortized over the average remaining service period of active employees. At September 30, 2018, the discount rate for the pension, DB SERP and DB Restoration plans increased to 4.4%, 4.3% and 4.3%, from 3.9%, 3.6% and 3.6%, respectively, for the comparable period in the prior year. The health and post-retirement plans discount rate also increased
WGL Holdings, Inc.
Washington Gas Light Company
Part II
Item 7. Management’s Discussion and Analysis of
Financial Condition and Results of Operations
to 4.4% from 3.9% during the same period. The higher discount rates reflect the change in long-term interest rates primarily due to current market conditions. The change in the discount rates resulted in actuarial gains decreasing our pension and other post-retirement obligations by $66.4 million and $19.5 million, respectively, for the year ended September 30, 2018. Refer to Note 9 —Pension and Other Post-Retirement Benefit Plans of the Notes to Consolidated Financial Statements for a listing of the actuarial assumptions used and for further discussion of the accounting for the Plans.
WGL HOLDINGS, INC.
RESULTS OF OPERATIONS
Our chief operating decision maker utilizes earnings before interest and tax (“EBIT”) as the primary measure of profit and loss in assessing the results of each segment’s operations. EBIT includes operating income, other income (expense), earnings from unconsolidated affiliates and is adjusted by amounts attributable to non-controlling interests. We believe that our use of EBIT enhances the ability to evaluate segment performance because it excludes interest and income tax expense, which are affected by corporate-wide strategies of AltaGas such as capital financing and tax sharing allocations.
EBIT should not be considered an alternative to, or a more meaningful indicator of our operating performance than, net income. Refer to summary results below for a reconciliation of EBIT to net income applicable to common stock.
Summary Results
WGL reported net income (loss) applicable to common stock of $49.3 million, $192.6 million and $167.6 million for the fiscal years ended September 30, 2018, 2017 and 2016, respectively. Fiscal year 2018 results reflect $236.7 million of expenses incurred by the Company in connection with its merger with AltaGas.
The following table summarizes our EBIT by operating segment for fiscal years ended September 30, 2018, 2017 and 2016.
|
| | | | | | | | | | | | | | | | | | | |
| Analysis of Consolidated Results |
| Years Ended September 30, | | Increase (Decrease) |
| (In millions) | 2018 | | 2017 | | 2016 | | 2018 vs. 2017 | | 2017 vs. 2016 |
| EBIT: | | | | | | | | | |
| Regulated utility | $ | 7.9 |
| | $ | 266.3 |
| | $ | 228.2 |
| | $ | (258.4 | ) | | $ | 38.1 |
|
| Retail energy-marketing | 31.5 |
| | 53.2 |
| | 65.0 |
| | (21.7 | ) | | (11.8 | ) |
| Commercial energy systems | 34.9 |
| | 40.8 |
| | 22.0 |
| | (5.9 | ) | | 18.8 |
|
| Midstream energy services | 29.4 |
| | 37.7 |
| | 7.8 |
| | (8.3 | ) | | 29.9 |
|
| Other activities | (40.0 | ) | | (19.9 | ) | | (3.2 | ) | | (20.1 | ) | | (16.7 | ) |
| Intersegment eliminations | (4.4 | ) | | 1.0 |
| | (0.5 | ) | | (5.4 | ) | | 1.5 |
|
| Total | $ | 59.3 |
| | $ | 379.1 |
| | $ | 319.3 |
| | $ | (319.8 | ) | | $ | 59.8 |
|
| Interest expense | 62.1 |
| | 74.0 |
| | 52.3 |
| | (11.9 | ) | | 21.7 |
|
| Income tax expense (benefit) | (53.4 | ) | | 111.2 |
| | 98.1 |
| | (164.6 | ) | | 13.1 |
|
| Dividends on Washington Gas preferred stock | 1.3 |
| | 1.3 |
| | 1.3 |
| | — |
| | — |
|
| Net income applicable to common stock | $ | 49.3 |
| | $ | 192.6 |
| | $ | 167.6 |
| | $ | (143.3 | ) | | $ | 25.0 |
|
Regulated Utility Operating Results
The following table summarizes the regulated utility segment’s financial data for fiscal years ended September 30, 2018, 2017 and 2016.
WGL Holdings, Inc.
Washington Gas Light Company
Part II
Item 7. Management’s Discussion and Analysis of
Financial Condition and Results of Operations
|
| | | | | | | | | | | | | | | | | | | |
| Regulated Utility Financial Data |
| Years Ended September 30, | | Increase (Decrease) |
| (In millions) | 2018 | | 2017 | | 2016 | | 2018
vs. 2017 | | 2017
vs. 2016 |
Utility net revenues(1): | | | | | | | | | |
| Operating revenues | $ | 1,248.1 |
| | $ | 1,167.0 |
| | $ | 1,070.9 |
| | $ | 81.1 |
| | $ | 96.1 |
|
| Less: Cost of gas | 407.0 |
| | 297.9 |
| | 272.0 |
| | 109.1 |
| | 25.9 |
|
| Revenue taxes | 82.5 |
| | 75.1 |
| | 73.0 |
| | 7.4 |
| | 2.1 |
|
| Total utility net revenues | 758.6 |
| | 794.0 |
| | 725.9 |
| | (35.4 | ) | | 68.1 |
|
| Operation and maintenance | 528.8 |
| | 332.2 |
| | 322.0 |
| | 196.6 |
| | 10.2 |
|
| Depreciation and amortization | 136.9 |
| | 131.2 |
| | 116.1 |
| | 5.7 |
| | 15.1 |
|
| General taxes and other assessments | 66.0 |
| | 59.8 |
| | 57.4 |
| | 6.2 |
| | 2.4 |
|
| Other income (expenses)-net | (19.0 | ) | | (4.5 | ) | | (2.2 | ) | | (14.5 | ) | | (2.3 | ) |
| EBIT | $ | 7.9 |
| | $ | 266.3 |
| | $ | 228.2 |
| | $ | (258.4 | ) | | $ | 38.1 |
|
(1)We utilize utility net revenues, calculated as revenues less the associated cost of energy and applicable revenue taxes,toassist in the analysis ofprofitabilityfor the regulated utility segment. The cost of the natural gas commodity (as adjusted for Asset Optimization sharing) and revenue taxes are included in the rates that Washington Gas charges to customers as reflected in operating revenues. Accordingly, changes in the cost of gas and revenue taxes associated with sales made to customers generally have no direct effect on utility net revenues, operating income or net income.Utility net revenues should not be considered an alternative to, or a more meaningful indicator of our operating performance than, operating income. Additionally, utility net revenues may not be comparable to similarly titled measures of other companies.
Fiscal Year 2018 vs. Fiscal Year 2017
The EBIT comparisons for the current year compared to the prior year primarily reflect:
higher operation and maintenance expenses primarily related to merger commitments and related expenses;
lower realized margins and unrealized mark-to-market valuations associated with our asset optimization program;
lower billed and estimated utility rates associated with the pass-through of future tax savings from the Tax Act, however the decrease is offset by lower income tax expense; and
higher depreciation and amortization expenses associated with growth in our utility plant.
Included in the EBIT comparisons are the favorable effects of:
customer growth of approximately 18,000 average active customer meters;
higher revenues attributed to colder weather in the District of Columbia; and
new base rates in the District of Columbia and Virginia.
Fiscal Year 2017 vs. Fiscal Year 2016
The increase in EBIT primarily reflects the following:
new base rates in Virginia and the District of Columbia;
higher utility net revenue related to growth of approximately 13,000 average active customer meters; and
higher unrealized mark-to-market valuations associated with our asset optimization program.
Partially offsetting these favorable variances were:
higher depreciation and amortization expense; and
higher operation and maintenance expenses.
Utility Net Revenues. The following table provides the key factors contributing to the changes in the utility net revenues of the regulated utility segment between years.
WGL Holdings, Inc.
Washington Gas Light Company
Part II
Item 7. Management’s Discussion and Analysis of
Financial Condition and Results of Operations
|
| | | | | | | |
| Composition of Changes in Utility Net Revenues |
| Increase (Decrease) |
| (In millions) | 2018
vs. 2017 | | 2017
vs. 2016 |
| Asset optimization: | | | |
| Realized margins | $ | (9.7 | ) | | $ | 1.8 |
|
| Unrealized mark-to-market valuations | (38.9 | ) | | 37.4 |
|
| Impact of lower tax rates per Tax Act | (27.8 | ) | | — |
|
| Impact of rate cases | 11.6 |
| | 33.5 |
|
| Customer growth | 10.9 |
| | 7.4 |
|
| Estimated effects of weather and consumption patterns | 8.5 |
| | (0.4 | ) |
| Late fees | 6.1 |
| | (2.6 | ) |
| Accelerated pipe replacement programs | 0.8 |
| | (5.8 | ) |
| Other | 3.1 |
| | (3.2 | ) |
| Total | $ | (35.4 | ) | | $ | 68.1 |
|
Asset optimization — We recorded unrealized mark-to-market gains associated with our energy-related derivatives of $10.4 million for the year ended September 30, 2018, compared to unrealized mark-to-market gains of $49.3 million and unrealized mark-to-market gains of $12.0 million for the fiscal years ended September 30, 2017 and 2016, respectively. When these derivatives settle, any unrealized amounts will ultimately reverse and Washington Gas expects to realize margins in combination with related transactions that these derivatives economically hedge. The large swings in the valuations are partially due to movements in unobservable inputs used in the valuation of long-dated forward contracts. We believe that these values are not reflective of our ultimate cash flows as these purchases are utilized in the optimization of our long-term natural gas transportation and storage capacity resources, the value of which is not reflected at fair value. Refer to the section entitled “Market Risk—Price Risk Related to the Regulated Utility Segment” for further discussion of our asset optimization program.
Impact of lower tax rates per Tax Act — The decrease in revenue reflects the impact of the Tax Act on rates charged to customers, however the decrease is offset by lower income tax expense.
Impact of rate cases — The increase in revenue reflects new base rates in the District of Columbia, effective March 24, 2017 and in Virginia, effective November 28, 2016, with modification made in November 2017, as a result of the final approval. Refer to "Rates and Regulatory Matters" for further discussion of this matter.
Customer growth — Average active customer meters increased by approximately 18,000 from fiscal year 2017 to 2018. Average active customer meters increased by more than 13,000 from fiscal year 2016 to 2017.
Estimated effects of weather and consumption patterns— Weather, when measured by HDDs, was 4.7% warmer than normal during the year ended September 30, 2018, compared to 15.9% warmer than normal and 10.4% warmer than normal during the years ended September 30, 2017 and 2016. In the District of Columbia, where Washington Gas does not have a billing mechanism or financial instruments to offset the effects of weather, the comparatively cooler weather, partially offset by unfavorable changes in natural gas consumption patterns, for the year ended September 30, 2018, resulted in a positive variance to net revenues. Natural gas consumption patterns may be affected by shifts in weather patterns in which customer heating usage may not correlate highly with average historical levels of usage per heating degree days that occur. Natural gas consumption patterns may also be affected by non-weather related factors such as customer conservation. Refer to the section entitled "Weather Risk" for a discussion of billing mechanisms in Maryland and Virginia, which are designed to eliminate the net revenue effects of variations in customer usage caused by weather and other factors such as conservation.
Late fees - In fiscal year 2017, we temporarily suspended charging late fees during the stabilization period of our new billing system. The year-over-year variances reflect the resumption of charging late fees in fiscal year 2018.
Accelerated pipe replacement programs — The decrease in revenue for fiscal year 2017 compared to fiscal year 2016 primarily reflects the transfer of project costs that were being collected through accelerated pipeline replacement surcharge revenues to new base rates in District of Columbia, effective March 24, 2017 as well as in Virginia, put into effect in the December 2016 billing cycle.
WGL Holdings, Inc.
Washington Gas Light Company
Part II
Item 7. Management’s Discussion and Analysis of
Financial Condition and Results of Operations
Operation and Maintenance Expenses. The following table provides the key factors contributing to the changes in operation and maintenance expenses of the regulated utility segment between years.
|
| | | | | | | |
| Composition of Changes in Operation and Maintenance Expenses |
| Increase/(Decrease) |
| (In millions) | 2018
vs. 2017 | | 2017
vs. 2016 |
| Merger commitments and related expenses | $ | 187.0 |
| | $ | — |
|
| Employee incentives and direct labor costs | 2.9 |
| | 2.5 |
|
| Employee benefits | (10.7 | ) | | (1.0 | ) |
| System safety and integrity | 10.8 |
| | 1.9 |
|
| Environmental costs, net | 1.6 |
| | 1.2 |
|
| Support services | (5.1 | ) | | (1.6 | ) |
| Uncollectible accounts | 4.5 |
| | 4.5 |
|
| Corporate Allocation | 4.0 |
| | — |
|
| Other | 1.6 |
| | 2.7 |
|
| Total | $ | 196.6 |
| | $ | 10.2 |
|
Merger commitments and related expenses — In fiscal year 2018, we recorded costs for accrued bill credits to customers, an accrual for our commitment of charitable contributions and community support, employee benefits related severance, retention and acceleration of incentive plans, and an impairment that was booked as part of the Merger with AltaGas. See Note 20— Merger with AltaGas, Ltd. to the Consolidated Financial Statements in this Form 10-K for further information on these expenses.
Employee incentives and direct labor costs — The year-over-year variances for both periods are primarily due to an increase in employees and higher salaries.
Employee benefits — The decrease in employee benefits expense in fiscal year 2018 from the previous fiscal year is primarily due to lower pension and post-retirement benefit costs resulting from an increase in the discount rate. The decrease in employee benefits expense in fiscal year 2017 from the previous fiscal year was primarily due to amendments to the post-retirement benefit plans, which lowered expense in fiscal year 2017.
System safety and integrity — The year-over-year variances for both periods reflect increased safety and reliability activities including leak repair and mitigation.
Environmental costs, net — The year-over-year variances for both periods reflect an increase in the liability associated with sites previously used to operate manufactured gas plants.
Support services — The decrease in expense for fiscal year 2018 from the previous fiscal year was due to lower project related costs. The decrease in expense for fiscal year 2017 from the previous fiscal year was due to lower business process outsourcing costs.
Uncollectible accounts — The year-over-year variances for both periods reflect a higher delinquency rate resulting from the suspension of dunning activities during the stabilization period of our new billing system. Refer to Rates and Regulatory Matters for a further discussion.
Corporate Allocation— The increase in fiscal year 2018 over the previous fiscal year is due to the initial allocation of corporate overhead expenses subsequent to the merger with AltaGas. Over time, such costs are expected to be offset by reductions in other functional areas.
Depreciation and Amortization. The following table provides the key factors contributing to the changes in depreciation and amortization of the regulated utility segment between years. The decrease in software amortization is due to certain capitalized software reaching the end of its amortizable life.
WGL Holdings, Inc.
Washington Gas Light Company
Part II
Item 7. Management’s Discussion and Analysis of
Financial Condition and Results of Operations
|
| | | | | | | |
| Composition of Changes in Depreciation and Amortization |
| Increase (Decrease) |
| (In millions) | 2018
vs. 2017 | | 2017
vs. 2016 |
| Accelerated pipe replacement programs | $ | 2.4 |
| | $ | 2.7 |
|
| Software | (1.4 | ) | | 6.7 |
|
| Other capital expenditures, net | 4.7 |
| | 5.7 |
|
| Total | $ | 5.7 |
| | $ | 15.1 |
|
WGL Holdings, Inc.
Washington Gas Light Company
Part II
Item 7. Management’s Discussion and Analysis of
Financial Condition and Results of Operations
Non-Utility Operating Results
Retail Energy-Marketing
The following table depicts the retail energy-marketing segment’s operating results along with selected statistical data.
|
| | | | | | | | | | | | | | | | | | | |
| Retail-Energy Marketing Financial and Statistical Data |
| | Years Ended September 30, | | Increase (Decrease) |
| | 2018 | | 2017 | | 2016 | | 2018
vs. 2017 | | 2017
vs. 2016 |
Operating Results (In millions) | | | | | | | | | |
Gross margins(1): | | | | | | | | | |
| Operating revenues | $ | 1,009.7 |
| | $ | 1,107.2 |
| | $ | 1,238.5 |
| | $ | (97.5 | ) | | $ | (131.3 | ) |
| Less: Cost of energy | 904.5 |
| | 989.0 |
| | 1,110.4 |
| | (84.5 | ) | | (121.4 | ) |
| Revenue taxes | 11.8 |
| | 11.4 |
| | 11.0 |
| | 0.4 |
| | 0.4 |
|
| Total gross margins | 93.4 |
| | 106.8 |
| | 117.1 |
| | (13.4 | ) | | (10.3 | ) |
| Operation expenses | 55.5 |
| | 47.2 |
| | 46.5 |
| | 8.3 |
| | 0.7 |
|
| Depreciation and amortization | 1.1 |
| | 1.1 |
| | 1.2 |
| | — |
| | (0.1 | ) |
| General taxes and other assessments—other | 5.5 |
| | 5.4 |
| | 4.5 |
| | 0.1 |
| | 0.9 |
|
| Other income - net | 0.2 |
| | 0.1 |
| | 0.1 |
| | 0.1 |
| | — |
|
| EBIT | $ | 31.5 |
| | $ | 53.2 |
| | $ | 65.0 |
| | $ | (21.7 | ) | | $ | (11.8 | ) |
Analysis of gross margins (In millions) | | | | | | | | | |
| Natural gas | | | | | | | | | |
| Realized margins | $ | 58.1 |
| | $ | 41.2 |
| | $ | 49.1 |
| | $ | 16.9 |
| | $ | (7.9 | ) |
| Unrealized mark-to-market valuations | (1.7 | ) | | 3.6 |
| | 8.1 |
| | (5.3 | ) | | (4.5 | ) |
| Total gross margins—natural gas | 56.4 |
| | 44.8 |
| | 57.2 |
| | 11.6 |
| | (12.4 | ) |
| Electricity | | | | | | | | | |
| Realized margins | $ | 37.8 |
| | $ | 54.0 |
| | $ | 57.2 |
| | $ | (16.2 | ) | | $ | (3.2 | ) |
| Unrealized mark-to-market valuations | (0.8 | ) | | 8.0 |
| | 2.7 |
| | (8.8 | ) | | 5.3 |
|
| Total gross margins—electricity | 37.0 |
| | 62.0 |
| | 59.9 |
| | (25.0 | ) | | 2.1 |
|
| Total gross margins | $ | 93.4 |
| | $ | 106.8 |
| | $ | 117.1 |
| | $ | (13.4 | ) | | $ | (10.3 | ) |
| Other Retail-Energy Marketing Statistics | | | | | | | | | |
| Natural gas | | | | | | | | | |
Therm sales (millions of therms) | 654.8 |
| | 693.3 |
| | 750.7 |
| | (38.5 | ) | | (57.4 | ) |
Number of customers (end of period) | 108,900 |
| | 116,200 |
| | 133,000 |
| | (7,300 | ) | | (16,800 | ) |
| Electricity | | | | | | | | | |
Electricity sales (millions of kWhs) | 11,666.1 |
| | 12,248.4 |
| | 13,090.7 |
| | (582.3 | ) | | (842.3 | ) |
Number of accounts (end of period) | 101,700 |
| | 113,700 |
| | 127,400 |
| | (12,000 | ) | | (13,700 | ) |
(1) We utilize gross margins to assist with the analysis of profitability for the retail energy-marketing segment. Gross margins are calculated as revenues less the associated cost of energy and applicable revenue taxes. We consider gross margins to be a better reflection of performance than gross revenues or gross energy costs for our retail energy-marketing segment because gross margins are a direct measure of the success of our core strategy for the sale of natural gas and electricity. Gross margins should not be considered an alternative to, or a more meaningful indicator of our operating performance than operating income. Additionally, gross margins may not be comparable to similarly titled measures of other companies.
WGL Holdings, Inc.
Washington Gas Light Company
Part II
Item 7. Management’s Discussion and Analysis of
Financial Condition and Results of Operations
Fiscal Year 2018 vs. Fiscal Year 2017.The decrease in EBIT reflects unrealized commodity margin losses in the current year compared to gains in the prior year and lower realized electric margins due to lower average unit margins and lower sales volumes this fiscal year compared to the prior fiscal year. Partially offsetting the decrease was higher realized gas margins due to increased portfolio optimization.
Operating expenses were higher due to increased corporate overhead allocation and customer marketing expenses.
Fiscal Year 2017 vs. Fiscal Year 2016. The decrease in EBIT reflects lower realized natural gas margins primarily due to lower volumes, lower portfolio optimization and less favorable prices when compared to the prior fiscal year. Realized margins from electricity were unfavorable due to lower volumes this fiscal year compared to the prior fiscal year. Capacity charges from the regional power grid operator (PJM) were relatively unchanged when compared to the prior fiscal year.
Operating expenses were higher due to increased commercial broker fees.
Commercial Energy Systems
The tables below represent the financial results of the commercial energy systems segment for the fiscal years ended September 30, 2018, 2017, and 2016.
|
| | | | | | | | | | | | | | | | | | | |
| Commercial Energy Systems Segment Financial Information |
| Years Ended September 30, | | Increase (Decrease) |
| (In millions) | 2018 | | 2017 | | 2016 | | 2018
vs. 2017 | | 2017
vs. 2016 |
| Operating revenues | $ | 79.8 |
| | $ | 95.2 |
| | $ | 89.1 |
| | $ | (15.4 | ) | | $ | 6.1 |
|
| Operating expenses: | | | | | | | | | |
| Cost of sales | 16.4 |
| | 36.8 |
| | 40.9 |
| | (20.4 | ) | | (4.1 | ) |
| Operations | 35.7 |
| | 27.0 |
| | 25.1 |
| | 8.7 |
| | 1.9 |
|
| Depreciation and amortization | 24.5 |
| | 21.7 |
| | 15.2 |
| | 2.8 |
| | 6.5 |
|
| General taxes and other assessments | 1.2 |
| | 0.5 |
| | 0.5 |
| | 0.7 |
| | — |
|
| Operating expenses | $ | 77.8 |
| | $ | 86.0 |
| | $ | 81.7 |
| | $ | (8.2 | ) | | $ | 4.3 |
|
| Equity earnings | — |
| | 7.3 |
| | 7.6 |
| | (7.3 | ) | | (0.3 | ) |
| Other income | 3.4 |
| | 8.2 |
| | 6.4 |
| | (4.8 | ) | | 1.8 |
|
| Less: Non-controlling interest | (29.5 | ) | | (16.1 | ) | | (0.6 | ) | | (13.4 | ) | | (15.5 | ) |
| EBIT | $ | 34.9 |
| | $ | 40.8 |
| | $ | 22.0 |
| | $ | (5.9 | ) | | $ | 18.8 |
|
| | | | | | | | | | |
| EBIT by division: | | | | | | | | | |
| Energy efficiency | $ | (7.4 | ) | | $ | (0.1 | ) | | $ | 6.6 |
| | $ | (7.3 | ) | | $ | (6.7 | ) |
| Commercial distributed generation | 7.6 |
| | 17.6 |
| | 13.4 |
| | (10.0 | ) | | 4.2 |
|
| Investment distributed generation | 34.7 |
| | 23.3 |
| | 2.0 |
| | 11.4 |
| | 21.3 |
|
| Total | $ | 34.9 |
| | $ | 40.8 |
| | $ | 22.0 |
| | $ | (5.9 | ) | | $ | 18.8 |
|
Fiscal Year 2018 vs. Fiscal Year 2017.The decrease in EBIT primarily reflects: (i) lower solar renewable energy credit sales and rebate income revenues, (ii) higher costs primarily relating to increased office and corporate overhead allocation expenses, and (iii) a $2.7 million receivable write-off associated with one energy efficiency account. The decrease was partially offset by higher earnings from alternative energy investments, including tax equity ventures accounted for under HLBV.
Additionally, not reflected in EBIT is the amortization of investment tax credits related to our distributed generation assets which were $6.7 million and $6.8 million for the year ended September 30, 2018 and 2017, respectively.
Fiscal Year 2017 vs. Fiscal Year 2016. The increase in EBIT primarily reflectsgrowth in distributed generation assets in service, including increased solar renewable energy credit sales and rebate income and higher earnings from alternative energy investments, including tax equity ventures accounted for under HLBV. Additionally, the increase in EBIT reflects an increase in other income due to the accounting treatment of a business combination. These improvements were partially offset by lower
WGL Holdings, Inc.
Washington Gas Light Company
Part II
Item 7. Management’s Discussion and Analysis of
Financial Condition and Results of Operations
margins from the energy-efficiency contracting business and higher depreciation expenses due to the additional distributed generation assets placed in service in the current fiscal year.
Additionally, not reflected in EBIT is the amortization of investment tax credits related to our distributed generation assets which were $6.8 million and $5.3 million for the fiscal year ended September 30, 2017 and 2016, respectively.
Midstream Energy Services
The table below represents the financial results of the midstream energy services segment for the year ended September 30, 2018, 2017 and 2016.
|
| | | | | | | | | | | | | | | | | | | |
| Midstream Energy Services Segment Financial Information |
| Years Ended September 30, | | Increase (Decrease) |
| (In millions) | 2018 | | 2017 | | 2016 | | 2018
vs. 2017 | | 2017
vs. 2016 |
Operating revenues(a) | $ | 40.6 |
| | $ | 31.3 |
| | $ | 6.6 |
| | $ | 9.3 |
| | $ | 24.7 |
|
| Operating expenses: | | | | | | | | | |
| Operations | 5.0 |
| | 6.3 |
| | 4.8 |
| | (1.3 | ) | | 1.5 |
|
| Depreciation and amortization | — |
| | — |
| | 0.1 |
| | — |
| | (0.1 | ) |
| General taxes and other assessments | 0.3 |
| | 0.3 |
| | 0.3 |
| | — |
| | — |
|
| Operating expenses | $ | 5.3 |
| | $ | 6.6 |
| | $ | 5.2 |
| | $ | (1.3 | ) | | $ | 1.4 |
|
| Equity earnings | (5.8 | ) | | 12.9 |
| | 6.2 |
| | (18.7 | ) | | 6.7 |
|
| Other income | (0.1 | ) | | 0.1 |
| | 0.2 |
| | (0.2 | ) | | (0.1 | ) |
| EBIT | $ | 29.4 |
| | $ | 37.7 |
| | $ | 7.8 |
| | $ | (8.3 | ) | | $ | 29.9 |
|
(a) The trading margins of Midstream Energy Services, including unrealized gains and losses on derivative instruments, are netted within operating revenues.
Fiscal Year 2018 vs. Fiscal Year 2017. The decrease in EBIT for the year ended September 30, 2018 compared to 2017, primarily reflects a$34.0 million impairment related to our investment in Constitution pipeline and a $40.7 million decrease related to valuations on our derivative contracts associated with our commodity trading portfolio. Mostly offsetting these unfavorable variances was an increase related to realized margins associated with both our transportation and storage strategies, including margins related to our agreement with GAIL Global (USA) LNG LLC, as well as increased equity earnings from our pipeline investments, excluding the Constitution impairment.
We contracted with GAIL Global (USA) LNG LLC, a subsidiary of GAIL (India) Limited, to sell natural gas at the Cover Point LNG export facility. Under this agreement, WGL Midstream will sell and deliver a minimum of 340,000 dekatherms per day and up to 430,000 dekatherms per day of natural gas, for a term of 20 years starting April 1, 2018, the in-service date of the Cove Point LNG export facility.
Realized margins on our transportation strategies reflect losses associated with certain gas purchases from Antero beginning in January 2016. The index price used to invoice these purchases had been the subject of an arbitration proceeding; however, in February 2017, the arbitral tribunal ruled in favor of Antero. Losses realized during the fiscal year ended September 30, 2018, 2017 and 2016 were $4.6 million, $9.8 million and $15.2 million, respectively, associated with this purchase contract. In March 2017, we filed suit in state court in Colorado related to the delivery point to which the gas is being delivered by Antero. The state court initially granted Antero's motion to dismiss the case and we subsequently filed an appeal. In October 2018, the Court of Appeals reversed the state court's decision and should remand the lawsuit to the trial court within the next 30 to 60 days.
Separately, Antero has initiated suit against Washington Gas and WGL Midstream claiming that they have failed to purchase specified daily quantities of gas and seeking alleged cover damages exceeding $100 million as of April 4, 2018, according to Antero's complaint. Washington Gas and WGL Midstream oppose both the validity and amount of Antero's claim. WGL believes the probability that Antero could succeed in collecting these penalties is remote and therefore, no accrual was made as of September 30, 2018. The jury trial has been tentatively scheduled for March 2019. In December 2017, WGL Midstream amended its purchase contract with Antero and, effective February 1, 2018, was no longer obligated to purchase gas at the delivery point that is the subject of these disputes. Refer to Note 12 — Commitments and Contingencies of the Notes to Consolidated Financial Statements for further discussion of this matter.
WGL Holdings, Inc.
Washington Gas Light Company
Part II
Item 7. Management’s Discussion and Analysis of
Financial Condition and Results of Operations
Fiscal Year 2017 vs. Fiscal Year 2016. The increase in EBIT for the year ended September 30, 2017 compared to 2016, primarily reflects: (i) $16.6 million in higher valuations and realized margins related to storage inventory and the associated economic hedging transactions, (ii) a $9.0 million increase primarily related to realized margins for our transportation strategies and (iii) higher income related to our pipeline investments. Partially offsetting these favorable variances was a $1.9 million decrease related to valuations on our derivative contracts associated with our long-term transportation strategies.
Other Non-Utility Activities
Transactions that are not significant enough on a stand-alone basis to warrant treatment as an operating segment, and that do not fit into one of our four operating segments, are aggregated as “Other Activities” and included as part of non-utility operations. Our other non-utility activities reflect EBIT of $(40.0) million, $(19.9) million and $(3.2) million for the year ended September 30, 2018, 2017 and 2016, respectively. The comparison of EBIT between fiscal year 2018 and fiscal year 2017 primarily relates to investment banking and legal fees due upon the merger closing with AltaGas. The comparison of EBIT between fiscal year 2017 and fiscal year 2016 primarily relates to external costs associated with the merger with AltaGas.
Intersegment Eliminations
Intersegment eliminations include mark-to-market valuations associated with trading activities between WGL Midstream and WGL Energy Services and timing differences between Commercial Energy Systems’ recognition of revenue for the sale of REC's to Retail Energy-Marketing and Retail Energy-Marketing’s recognition of the associated expense. Our intersegment eliminations reflect EBIT of $(4.5) million, $1.0 million and $(0.5) million for the year ended September 30, 2018, 2017, and 2016, respectively. The year-over-year variances primarily relate to timing differences between Commercial Energy Systems' recognition of revenue for the sale of RECs to Retail Energy-Marketing and Retail Energy Marketing's recognition of the associated expense.
For further discussion of our financial performance by operating segment, refer to Note 15 - Operating Segment Reporting of the Notes to Consolidated Financial Statements.
Consolidated Interest Expense
The following table shows the components of WGL’s consolidated interest expense for the years ended September 30, 2018, 2017 and 2016. The decrease in interest expense for fiscal year 2018 compared to fiscal year 2017 is due to a gain on interest rate swap settlements, including a hedging gain reclassified from OCI, partially offset by higher interest expense due to the issuance of additional long-term debt by both WGL and Washington Gas. The increase in interest expense for fiscal year 2017 compared to fiscal year 2016 primarily reflects the issuance of additional long-term debt by both WGL and Washington Gas as well as interest expense associated with WGL's interest rate swap and an increase in short-term borrowings.
|
| | | | | | | | | | | | | | | | | | | |
| Composition of Consolidated Interest Expense |
| Years Ended September 30, | | Increase (Decrease) |
| (In millions) | 2018 | | 2017 | | 2016 | | 2018
vs. 2017 | | 2017
vs. 2016 |
| Interest on long-term debt | $ | 81.4 |
| | $ | 64.9 |
| | $ | 52.5 |
| | $ | 16.5 |
| | $ | 12.4 |
|
| Interest on short-term debt | 10.6 |
| | 5.6 |
| | 1.9 |
| | 5.0 |
| | 3.7 |
|
| (Gain) loss on interest rate swap | (19.2 | ) | | 5.6 |
| | — |
| | (24.8 | ) | | 5.6 |
|
| Other net, including capitalized interest | (10.7 | ) | | (2.1 | ) | | (2.1 | ) | | (8.6 | ) | | — |
|
| Total | $ | 62.1 |
| | $ | 74.0 |
| | $ | 52.3 |
| | $ | (11.9 | ) | | $ | 21.7 |
|
Consolidated Income Taxes
The following table shows WGL’s consolidated income tax expense and effective income tax rate for the years ended September 30, 2018, 2017 and 2016.
WGL Holdings, Inc.
Washington Gas Light Company
Part II
Item 7. Management’s Discussion and Analysis of
Financial Condition and Results of Operations
|
| | | | | | | | | | | | | | | | | | | |
| Consolidated Income Taxes |
| Years Ended September 30, | | Increase (Decrease) |
| (In millions) | 2018 | | 2017 | | 2016 | | 2018
vs. 2017 | | 2017
vs. 2016 |
| Income before income taxes | $ | (32.3 | ) | | $ | 289.0 |
| | $ | 266.4 |
| | $ | (321.3 | ) | | $ | 22.6 |
|
| Income tax expense | (53.4 | ) | | 111.2 |
| | 98.1 |
| | (164.6 | ) | | 13.1 |
|
| Effective income tax rate | 165.3 | % | | 38.5 | % | | 36.8 | % | | 126.8 | % | | 1.7 | % |
| Income tax expense (benefit) | (53.4 | ) | | 111.2 |
| | 98.1 |
| | (164.6 | ) | | 13.1 |
|
| Less re-measurement impact of Tax Act | (28.7 | ) | | — |
| | — |
| | (28.7 | ) | | — |
|
| Income tax expense excluding re-measurement impact | (24.7 | ) | | 111.2 |
| | 98.1 |
| | (135.9 | ) | | 13.1 |
|
| Effective income tax rate excluding re-measurement impact | 76.5 | % | | 38.5 | % | | 36.8 | % | | 38.0 | % | | 1.7 | % |
The decrease in income tax expense for fiscal year 2018 compared to fiscal year 2017 is due to the enactment of the Tax Act resulting in a re-measurement of our accumulated deferred income taxes and the reduction of the corporate federal income tax rate for 2018 to 21%. The increase in the effective income tax rate for fiscal year 2017 compared to fiscal year 2016 is mainly due to certain merger related costs not being deductible for tax purposes. Refer to Note 8—Income Taxes of the Notes to the Consolidated Financial Statements for details.
LIQUIDITY AND CAPITAL RESOURCES
General Factors Affecting Liquidity
Access to short-term debt markets is necessary for funding our short-term liquidity requirements, the most significant of which include buying natural gas, electricity and pipeline capacity, and financing both accounts receivable and storage gas inventory. We have accessed long-term capital markets primarily to fund both capital expenditures and investment activities and to retire long-term debt.
During the fiscal year ended September 30, 2018, WGL met its liquidity and capital needs through cash on hand, retained earnings, the issuance of commercial paper and long-term debt, and equity infusions from AltaGas. Washington Gas met its liquidity and capital needs through cash on hand, retained earnings, the issuance of commercial paper, and equity infusions from WGL and the SPE.
Our ability to access debt capital markets depends on our credit ratings, general market liquidity, and investor demand for our securities. On October 8th, 2018, WGL filed a Post-Effective Amendment to its Registration Statement originally filed September 15, 2017 to de-register the debt securities covered by the Registration Statement. Looking forward, WGL will obtain long-term financing from AltaGas via capital infusion and inter-company borrowings and we do not intend to offer any additional debt securities at WGL. Washington Gas will continue to access the capital markets through long-term debt issuances.
In addition, rules imposed by regulatory commissions or state law in Washington Gas' service territory restrict its ability to make advances or issue loans to its affiliates, including WGL. Washington Gas may not provide loans to an affiliate or holding company, unless Washington Gas receives commission approval.
Our credit ratings depend largely on the financial performance of our subsidiaries and the ratings of our parent company, AltaGas. A ratings downgrade could both increase our borrowing costs and trigger the need for us to post additional collateral with our wholesale counterparties or other creditors. Further, a negative change in AltaGas’ ratings outlook or any downgrade in its credit ratings could negatively impact WGL’s ratings outlook or downgrade its credit ratings. Such downgrades could limit WGL’s access to the credit markets and increase the costs of borrowing under available credit lines. Following the merger with AltaGas in July 2018, the credit rating agencies downgraded the senior unsecured debt rating for WGL from A3 to Baa1 for Moody's, from A- to BBB- for S&P, and from A- to BBB for Fitch. At the same time Moody’s downgraded the senior unsecured debt rating for Washington Gas from A1 to A2, S&P from A to A-, and Fitch from A+ to A. All three credit agencies cited the merger and issuer ratings for AltaGas as the reason for the downgrades, but also pointed to the ring fencing measures put in place for our regulatory commissions following the merger as limiting the negative impact on the ratings for Washington
WGL Holdings, Inc.
Washington Gas Light Company
Part II
Item 7. Management’s Discussion and Analysis of
Financial Condition and Results of Operations
Gas. The purpose of the ring-fencing measures is to financially separate Washington Gas from WGL, AltaGas and its non-utility affiliates to protect consumers of regulated utility services from financial instability or bankruptcy in its parent or affiliates resulting from losses that may occur from open market activities.
As of September 30, 2018, total consolidated capitalization, including current maturities of long-term debt and notes payable and project financing, comprised 40.1% common equity, 0.2% non-controlling interest, 0.6% preferred stock and 59.1% long and short-term debt. This consolidated capitalization ratio varies during the fiscal year primarily due to the seasonal nature of Washington Gas' business. This seasonality also affects our short-term debt balances, which are typically higher in the fall and winter months and substantially lower in the spring when a significant portion of Washington Gas' current assets are converted into cash at the end of the heating season. Our cash flow requirements and our ability to provide satisfactory resources to meet those requirements are influenced by the activities of all of WGL’s operating segments.
Our plans provide for sufficient liquidity to satisfy our financial obligations. Generally, Washington Gas can make dividend payments in the ordinary course of business unless any of the following regulatory limitations apply: (i) Washington Gas will not pay extraordinary dividends to its parent for three years after the Merger Close, (ii) Washington Gas will not pay dividends to its parent company if Washington Gas' senior unsecured debt rating is below investment grade or (iii) Washington Gas will not make a dividend payment to its parent company if the payment would result in its equity level to drop below 48%. At September 30, 2018, we had no significant restrictions on our cash balances or retained earnings that would affect the payment of dividends by either WGL or Washington Gas.
Short-Term Cash Requirements and Related Financing
Washington Gas has seasonal short-term cash requirements to fund the purchase of storage gas inventory in advance of the winter heating season. At September 30, 2018 and 2017, Washington Gas had balances in gas storage of $101.4 million and $92.8 million, respectively. Washington Gas collects the cost of gas under cost recovery mechanisms approved by its regulators. Additionally, Washington Gas may be required to post cash collateral for certain purchases.
During the first six months of each fiscal year, Washington Gas’ large sales volumes cause its cash requirements to peak when combined storage inventory, accounts receivable, and unbilled revenues are at their highest levels. During the last six months of each fiscal year, after the heating season, Washington Gas typically experiences a seasonal net loss due to reduced demand for natural gas. During this period, large amounts of Washington Gas’ current assets are converted to cash, which Washington Gas generally uses to reduce and usually eliminate short-term debt and acquire storage gas for the next heating season.
Variations in the timing of customer collections under Washington Gas' gas cost recovery mechanisms can significantly affect its short-term cash requirements. At September 30, 2018 and 2017, Washington Gas had $2.3 million in net under-collections from customers and $2.0 million in net over-collections from customers, respectively, of gas costs reflected in current liabilities as gas costs due to customers. Amounts under-collected or over-collected from customers during the current gas cost recovery cycle are deferred as a regulatory asset or liability on the balance sheet until September 1 of each year, at which time the accumulated amount is transferred to gas costs due from/to customers as appropriate. At September 30, 2018 and 2017, Washington Gas had a net regulatory asset of $13.9 million and $5.6 million, respectively, related to under-collections from customers in the current gas recovery cycle.
WGL Energy Services and WGL Midstream have seasonal short-term cash requirements to fund the purchase of storage gas inventory in advance of the winter heating season. At September 30, 2018 and 2017, WGL Energy Services had balances in gas storage of $25.3 million and $33.1 million, respectively. WGL Energy Services collects revenues that are designed to reimburse commodity costs used to supply its retail customer contracts and wholesale counterparty contracts. At September 30, 2018 and 2017, WGL Midstream had balances in gas storage of $61.6 million and $118.2 million, respectively. As market opportunities arise, WGL Midstream may physically sell the inventory on the wholesale natural gas market, or economically hedge the inventory with financial derivative contracts. WGL Energy Services and WGL Midstream derive funding to finance these activities from short-term debt issued by WGL, which is made available through the money pool as discussed below. Additionally, WGL Energy Services and WGL Midstream may be required to post cash collateral for certain transactions or they may be required to provide parent guarantees for certain transactions.
In addition to storage gas, WGL Midstream also has cash requirements to fund the capital requirements of its various infrastructure investments. At September 30, 2018 and 2017, WGL Midstream incurred $770.0 million and $384.6 million related to these investments, respectively. WGL Midstream initially funds capital calls related to these investments from short-term debt issued by WGL.
WGL Holdings, Inc.
Washington Gas Light Company
Part II
Item 7. Management’s Discussion and Analysis of
Financial Condition and Results of Operations
WGL Energy Systems has cash requirements to fund the construction and purchase of residential and commercial distributed generation systems. WGL Energy Systems initially finances these activities through short-term debt issued by WGL.
WGL and Washington Gas use short-term debt in the form of commercial paper or unsecured short-term bank loans to fund seasonal cash requirements. Our policy is to maintain back-up bank credit facilities in an amount equal to or greater than our expected maximum commercial paper position.
WGL and Washington Gas each have credit facilities. The credit facility for WGL permits it to borrow up to $650.0 million. The credit facility for Washington Gas permits it to borrow up to $350.0 million, and further permits, with the banks’ approval, additional borrowings of $100.0 million for a maximum potential total of $450.0 million. The interest rate on loans made under each of the credit facilities is a fluctuating rate per annum that is set using certain parameters at the time each loan is made. WGL and Washington Gas incur credit facility fees, which in some cases are based on the long-term debt ratings of WGL and Washington Gas. In the event that the long-term debt ratings are downgraded below certain levels, WGL and Washington Gas would be required to pay higher fees. There are five different levels of fees. For WGL, under the terms of the credit facilities, the lowest level facility fee is 0.075% and the highest is 0.225%. For Washington Gas, under the terms of the credit facilities, the lowest level facility fee is 0.06% and the highest is 0.175%. The facilities have a maturity date of December 19, 2019, and the credit agreements each provide WGL or Washington Gas with the right, as applicable to request two additional one-year extensions, with the lenders’ approval. Bank credit balances available to WGL and Washington Gas, net of commercial paper balances, were $157.5 million and $255.0 million at September 30, 2018, respectively, and $268.0 million and $227.0 million at September 30, 2017, respectively.
To manage credit risk, Washington Gas may require certain customers and suppliers to provide deposits, including collateral from wholesale counterparties, which are reported as current liabilities in “Customer deposits and advance payments,” in the accompanying balance sheets. At September 30, 2018 and 2017, “Customer deposits and advance payments” totaled $83.7 million and $64.2 million, respectively. For Washington Gas, deposits from customers may be refunded at various times throughout the year based on customer payment habits. At the same time, other customers make new deposits that cause the balance of customer deposits to remain relatively steady. There are no restrictions on Washington Gas’ use of these customer deposits. Washington Gas pays interest to its customers on these deposits in accordance with the requirements of its regulatory commissions.
For WGL Energy Services and WGL Midstream, deposits typically represent collateral for transactions with wholesale counterparties. These deposits may be reduced, repaid or increased at any time based on the current value of WGL Energy Services’ or WGL Midstream’s net position with the counterparty. At September 30, 2018 and 2017, “Customer deposits and advance payments” totaled $0.4 million and $1.6 million, respectively, for WGL Midstream. There were no such deposits for WGL Energy Services at September 30, 2018 and 2017. Currently, there are no restrictions on the use of deposited funds and interest is paid to the counterparty on these deposits in accordance with our contractual obligations. Refer to the section entitled “Credit Risk” for further discussion of our management of credit risk.
Money Pool
WGL has money pool arrangements with and among its subsidiaries to coordinate and provide for certain short term cash and working capital requirements. This money pool may also accumulate cash from the periodic cash infusions from its parent company as well as the operations of certain subsidiaries. In return, the money pool provides short-term loans to its subsidiaries to meet various working capital needs. Washington Gas does not participate in the money pool.
Project Financing
Washington Gas previously obtained third-party project financing on behalf of the federal government to provide funds during the construction of certain energy management services projects entered into under Washington Gas' area-wide contract. In connection with work completed under the area-wide contract, the construction work is performed by WGL Energy Systems on behalf of Washington Gas and an inter-company payable is recorded for work provided by WGL Energy Systems. As work is performed, Washington Gas establishes a receivable representing the government's obligation to remit principal and interest. The payable and receivable are equal to each other at the end of the construction period, but there may be timing differences in the recognition of the project related payable and receivable during the construction period. When these projects are formally “accepted” by the government and deemed complete, Washington Gas assigns the ownership of the receivable to the third-party lender in satisfaction of the obligation and removes both the receivable and the obligation related to the financing from its financial statements. If project acceptance does not occur by a specified date the lender may require Washington Gas to make interim interest payments or repurchase the contract payments plus a termination fee. In March 2016, the SCC of VA denied W
WGL Holdings, Inc.
Washington Gas Light Company
Part II
Item 7. Management’s Discussion and Analysis of
Financial Condition and Results of Operations
ashington Gas' further participation in the third-party financing arrangement but allowed existing debt arrangements to remain intact until the related obligations were satisfied. At September 30, 2018, there were two financing contracts that have not been novated for which draws totaling $68.5 million on the Washington Gas balance sheet as a short-term obligation to third-party lenders in "Notes payable and project financing".
In December 2016, WGL Energy Systems entered into an agreement to obtain third-party financing and receive funds directly from the third-party lender during the construction period associated with the related energy management service projects. As a result, Washington Gas will no longer be liable under future third-party financing arrangements, for projects entered into under the area-wide contract. The general terms of the financing agreement are the same as the prior financing arrangements between Washington Gas and the third-party lender mentioned above. Washington Gas will continue to record a receivable representing the government’s obligation and will record an inter-company payable to WGL Energy Systems for the construction work performed for the same amount. At September 30, 2018, there were three contracts that are outstanding totaling $13.7 million on the WGL Energy Systems' balance sheet as a short-term obligation to third-party lenders in "Notes payable and project financing".
As of September 30, 2018, WGL recorded $77.0 million in "Unbilled revenues" on the balance sheet, and WGL and Washington Gas recorded $82.2 million and $68.5 million, respectively, in a corresponding short-term obligation to third-party lenders in "Notes payable and project financing", for energy management services projects that were not complete. As of September 30, 2017, WGL recorded $85.6 million "Unbilled revenues" on the balance sheet and WGL and Washington Gas recorded $54.8 million and $43.8 million, respectively, in a corresponding short-term obligation to third-party lenders in "Notes payable and project financing" for energy management services projects that were not complete. For projects where WGL Energy Systems is the primary contractor and where these projects are financed for government agencies that have minimal credit risk, and with which we have previous collection experience, neither WGL nor Washington Gas recorded a corresponding reserve for bad debts related to these receivables at September 30, 2018 or September 30, 2017.
Long-Term Cash Requirements and Related Financing
The primary drivers of our long-term cash requirements include capital expenditures, non-utility investments and long-term debt maturities. For the regulated utility segment, our capital expenditures primarily relate to adding new utility customers and system supply as well as maintaining the safety and reliability of Washington Gas’ distribution system. For our non-utility segments, our long-term cash requirements primarily depend on the level of investments and capital expenditures. For WGL Midstream, our investments primarily relate to providing capital for construction of the infrastructure investments. For WGL Energy Systems and WGSW, our investments primarily relate to providing capital for construction of distributed generation and commercial solar projects managed by WGL Energy Systems. The investments are mainly through tax equity partnerships that create project funding using the tax benefits associated with the projects. For more information, see Note 16- Other investments of the Notes to Consolidated Financial Statements. In addition, on March 28, 2018, WGL Energy Systems entered into a new tax equity financing arrangement under which it can sell and lease back up to $75 million of commercial solar asset projects that it may develop and place into service. WGL Energy Systems will have 18 months to sell the commercial solar asset projects under the arrangement and then it would lease each project back over a period of up to 25 years. The facility will be collateralized by the leased projects.
Security Ratings
The table below reflects the current credit ratings for the outstanding debt instruments of WGL and Washington Gas. Changes in credit ratings may affect WGL's and Washington Gas' cost of short-term and long-term debt and our access to the capital markets. A security rating is not a recommendation to buy, sell or hold securities. Credit ratings are subject to revision or withdrawal at any time by the assigning rating organization and each rating should be evaluated independently of any other rating. |
| | | | | | | |
| | | | | | | |
| WGL | | Washington Gas |
Rating Service | Senior Unsecured | | Commercial Paper | | Senior Unsecured | | Commercial Paper |
Fitch Ratings(a)
| BBB | | F2 | | A | | F2 |
Moody’s Investors Service(b)
| Baa1 | | P-2 | | A2 | | P-1 |
Standard & Poor’s Ratings Services(c)
| BBB- | | A-2 | | A- | | A-2 |
WGL Holdings, Inc.
Washington Gas Light Company
Part II
Item 7. Management’s Discussion and Analysis of
Financial Condition and Results of Operations
(a) The credit ratings by Fitch Ratings for WGL and Washington Gas were revised on July 10, 2018 and the long-term debt ratings outlook was adjusted to stable.
(b) The credit ratings by Moody’s Investors Service for WGL and Washington Gas were revised on July 9, 2018 and the long-term debt ratings outlook remained negative.
(c) The credit ratings by Standard & Poor’s Rating Services for WGL and Washington Gas were revised on July 9, 2018 and the long-term debt ratings outlook remained negative.
Ratings Triggers and Certain Debt Covenants
WGL and Washington Gas pay credit facility fees, which in some cases are based on the long-term debt ratings of Washington Gas. Under the terms of WGL’s and Washington Gas' revolving credit agreements, term loan facility and private placement notes, the ratio of consolidated financial indebtedness to consolidated total capitalization cannot exceed 0.65 to 1.0 (65.0%). As of September 30, 2018, WGL's and Washington Gas' ratios of consolidated financial indebtedness to consolidated total capitalization were 59% and 47%, respectively. In addition, WGL and Washington Gas are required to inform lenders of changes in corporate existence, financial conditions, litigation and environmental warranties that might have a material effect on debt ratings. The failure to inform the lenders’ agent of material changes in these areas might constitute default under the agreements. Additionally, failure to pay principal or interest on any other indebtedness may be deemed a default under our credit agreements. A default, if not remedied, may lead to a suspension of further loans and/or acceleration in which obligations become immediately due and payable. In addition, certain of the credit facilities of WGL and Washington contain cross-default provisions. At September 30, 2018, we were in compliance with all of the covenants under our revolving credit facilities.
For certain of Washington Gas’ natural gas purchase and pipeline capacity agreements, the counterparty may withhold service or deliveries or may require additional credit support if the long-term debt of Washington Gas is downgraded below the lower of a BBB- rating by Standard & Poor’s or a Baa3 rating by Moody’s Investors Service, or if Washington Gas is deemed by a counterparty not to be creditworthy. For certain other agreements, the counterparty may require additional credit support if the counterparty’s credit exposure to Washington Gas exceeds a contractually defined threshold amount, or if Washington Gas’ credit rating declines by a certain rating level. Based on its current credit ratings, Washington Gas would not be required to provide additional credit support to its counterparties for these agreements if its long-term credit rating was to be downgraded by one rating level.
WGL guarantees payments for certain purchases of natural gas and electricity on behalf of WGL Energy Services and WGL Midstream. If the credit rating of WGL declines, WGL Energy Services and WGL Midstream may be required to provide additional credit support and credit enhancements for these purchase contracts. WGL Energy Services and WGL Midstream would provide the additional credit support required by obtaining a parent guarantee from AltaGas Ltd, an entity with an investment grade rating. Any additional credit support would be obtained from a letter of credit or providing cash collateral. Approximately $233 million of additional credit support may be required for these arrangements if WGL's credit ratings were to decline by one rating level. Beginning in October 2018, WGL began obtaining parent guarantees from AltaGas Ltd. As a result, as of November 9th, 2018, the total additional credit support that may be required is now approximately $98 million.
Historical Cash Flows
The following table summarizes WGL’s net cash provided by (used in) operating, investing and financing activities for the fiscal years ended September 30, 2018, 2017 and 2016:
|
| | | | | | | | | | | | | | | | | | | |
| | Fiscal Years Ended September 30, | | Increase / (Decrease) | | Increase / (Decrease) |
| (In millions) | 2018 | | 2017 | | 2016 | | 2018 vs. 2017 | | 2017 vs. 2016 |
| Cash provided by (used in): | | | | | | | . | | |
| Operating activities | $ | 322.8 |
| | $ | 234.2 |
| | $ | 231.0 |
| | $ | 88.6 |
| | $ | 3.2 |
|
| Financing activities | $ | 715.6 |
| | $ | 419.4 |
| | $ | 433.3 |
| | $ | 296.2 |
| | $ | (13.9 | ) |
| Investing activities | $ | (924.0 | ) | | $ | (650.7 | ) | | $ | (665.5 | ) | | $ | (273.3 | ) | | $ | 14.8 |
|
Cash Flows Provided by Operating Activities
WGL Holdings, Inc.
Washington Gas Light Company
Part II
Item 7. Management’s Discussion and Analysis of
Financial Condition and Results of Operations
The regulated utility’s cash flows from operating activities principally reflect gas sales and deliveries and the cost of operations. The volume of gas sales and deliveries is dependent primarily on factors external to the utility, such as growth of customer demand, weather, market prices for energy, economic conditions and measures that promote energy efficiency. Unbilled revenue and weather normalization, ratemaking adjustments and decoupling mechanisms in place, changes in delivery volumes from levels assumed when rates were approved may affect the timing of cash flows but not net income. The price at which the utility provides energy to customers is determined in accordance with regulatory-approved tariffs. In general, changes in the utility’s cost of gas may affect the timing of cash flows but not net income because the costs are recovered in accordance with rate agreements. In addition, the regulated utility’s cash flow is impacted by the timing of derivative settlements.
The non-utility cash flows from operating activities primarily reflect: (i) the timing of receipts related to distributed generation and federal projects in the commercial energy systems segment; (ii) the timing of receipts related to electric and gas bills and the timing of payments for the cost of the commodity for WGL Energy Services and (iii) the timing of gas purchases and sales resulting from trading activities at WGL Midstream. Both WGL Energy Services' and WGL Midstream's cash flows are impacted by the timing of derivative settlements and the related collateral requirements.
Net income is the result of cash and non-cash (or accrual) transactions. Only cash transactions affect WGL’s cash flows from operating activities. Principal non-cash charges include depreciation, accrued or deferred pension and other post-retirement benefit costs and deferred income tax expense. Non-cash charges or credits may also be accrued under the revenue decoupling and cost reconciliation mechanisms in the utilities’ rate plans.
Net cash flows provided by operating activities for the fiscal year ended September 30, 2018 was $322.8 million compared to net cash flows provided by operating activities of $234.2 million for the fiscal year ended September 30, 2017. The increase in net cash flows primarily reflects higher realized margins for both storage and transportation strategies at WGL Midstream and higher cash collections due to colder weather at Washington Gas, offset by cash payment of merger commitments, financial and legal advisory costs, severance costs, retention and acceleration of incentive plans due to the Merger. The slight increase of net cash provided by operating activities for fiscal year 2017 compared to fiscal year 2016 primarily reflects distributions received from our investment in the Stonewall Gas Gathering System. The distribution began in fiscal year 2017.
Cash Flows Provided by Financing Activities
Cash flows provided by financing activities totaled $715.6 million in fiscal year ended September 30, 2018, an increase of $296.2 million from the prior year. The increase was mainly from equity infusion from AltaGas after the Merger. Cash flow provided by financing activities decreased $13.9 million in fiscal year 2017 as compared to fiscal year 2016 as there were no issuance of common stock under our at-the-market program (ATM) in fiscal year 2017 due to the Merger.
The following table reflects the issuances and retirements of long-term debt that occurred during the fiscal years 2018, 2017 and 2016 (also refer to Note 5 —Long Term Debt of Notes to Consolidated Financial Statements).
|
| | | | | | | | | | | | | | | | | |
| Long-Term Debt Activity |
| | 2018 | | 2017 | | 2016 |
| ($ In millions) | Interest Rate | | Face value | | Interest Rate | | Face value | | Interest Rate | | Face value |
Long Term Debt(a) | | | | | | | | | | | |
| Issued | 1.88-2.66% | | $ | 550.0 |
| | 1.57-3.80% | | $ | 250.0 |
| | 1.34-3.80% | | $ | 500.0 |
|
| Retired | 2.45% | | (250.0 | ) | | | | | | 5.17% | | (25.0 | ) |
| Total | | | $ | 300.0 |
| | | | $ | 250.0 |
| | | | $ | 475.0 |
|
(a) Includes senior notes for WGL Holdings, MTN's and private placement debt for Washington Gas. Certain issuances for WGL Holdings contain make-whole call provisions.
Cash Flows Used in Investing Activities
Net cash flows used in investing activities totaled $924.0 million, $650.7 million and $665.5 million during fiscal years 2018, 2017 and 2016, respectively, which primarily consists of utility capital expenditures made by Washington Gas and non-utility investments in pipeline and distributed generation.
Capital Investments
Total WGL expenditures for capital investments for the year ended September 30, 2018 are shown in the chart below:
WGL Holdings, Inc.
Washington Gas Light Company
Part II
Item 7. Management’s Discussion and Analysis of
Financial Condition and Results of Operations
The following table depicts our actual capital investments for fiscal years 2016, 2017 and 2018. Our capital outlays include expenditures to extend service to new areas, and to ensure safe, reliable and improved service for our utility and to grow our non-utility investments.
|
| | | | | | | | | |
| Capital Expenditures |
| | Actual |
| (In millions) | 2016 | 2017 | 2018 |
New business(a) | $ | 106.6 |
| $ | 129.4 |
| $ | 141.3 |
|
| Replacements: | | | |
Accelerated Replacement plans(b) | 132.2 |
| 130.9 |
| 111.7 |
|
| Other | 74.8 |
| 68.1 |
| 70.5 |
|
| Customer information system | 39.4 |
| 28.1 |
| — |
|
| Other utility | 43.0 |
| 44.0 |
| 77.0 |
|
| Cash basis-utility | (2.5 | ) | 7.8 |
| (4.0 | ) |
Total utility(c) | 393.5 |
| 408.3 |
| 396.5 |
|
| Pipeline investments | 158.1 |
| 140.8 |
| 410.8 |
|
| Distributed generation | 163.8 |
| 85.5 |
| 142.5 |
|
| Other non-utility | 8.3 |
| 7.0 |
| 0.4 |
|
| Cash basis-non-utility | (35.3 | ) | 22.2 |
| (23.0 | ) |
| Total investments | $ | 688.4 |
| $ | 663.8 |
| $ | 927.2 |
|
(a) Includes certain projects that support the existing distribution system.
(b) Represents capital expenditures (excluding cost of removal), both approved, and expected to be approved, under our Accelerated Pipeline
Replacement Programs in all jurisdictions. Refer to the section entitled "Accelerated Pipeline Replacement Programs" for a further discussion.
(c) Excludes Allowance for Funds Used During Construction and cost of removal. Includes capital expenditures accrued and capital expenditure
adjustments recorded in the fiscal year.
New Business
The Company’s utility service areas have a population estimated at 5.9 million and include approximately 2.2 million households and commercial structures. Washington Gas actively markets and adds new customers through both capital expenditures and different rate mechanisms aimed at bringing the benefits of natural gas, including lower energy bills and reduced carbon emissions to more residents in its territories. Washington Gas added 12,581 new customers in fiscal year 2018 supported by additional capital and rate base. Adding new customers directly drives earnings growth through additional distribution revenues.
WGL Holdings, Inc.
Washington Gas Light Company
Part II
Item 7. Management’s Discussion and Analysis of
Financial Condition and Results of Operations
Replacements, Regulatory Plans - Accelerated Pipe Replacement Plans
Accelerated pipe replacement programs are in place in all three of our jurisdictions. Washington Gas is accelerating pipe replacement in order to reduce risk and further enhance the safety and reliability of the pipeline system. Each regulatory commission having jurisdiction over Washington Gas’ retail rates has approved accelerated replacement programs with an associated surcharge mechanism to recover the cost, including a return, on those capital investments. In contrast to the traditional rate-making approach to capital investments, for the accelerated pipe replacement programs, Washington Gas is receiving recovery for these investments through the approved surcharges for each program and is authorized to invest in each of these programs over a five year period. The following table presents the expenditures made and revenues recognized for the accelerated pipe replacement programs in fiscal year 2018. Refer to Rates and Regulatory Matters for a further discussion on rate case decisions during the fiscal year.
|
| | | | | | | | | | | | | | | | |
Accelerated Pipe Replacement Programs Fiscal Year 2018 Activity |
| (in millions) | | District of Columbia | | Maryland | | Virginia | | Total |
| Capital expenditures, excluding cost of removal | | $ | 23.2 |
| | $ | 31.2 |
| | $ | 57.3 |
| | $ | 111.7 |
|
| Revenues recognized | | $ | 5.5 |
| | $ | 13.4 |
| | $ | 8.1 |
| | $ | 27.0 |
|
| Fiscal Year 2017 Activity |
| Capital expenditures, excluding cost of removal | | $ | 18.1 |
| | $ | 48.6 |
| | $ | 64.2 |
| | $ | 130.9 |
|
| Revenues recognized | | $ | 5.5 |
| | $ | 13.4 |
| | $ | 6.6 |
| | $ | 25.5 |
|
District of Columbia Jurisdiction. In 2013, Washington Gas filed a Revised Accelerated Pipe Replacement Plan (PROJECTpipes) in which Washington Gas proposed to replace bare and/or unprotected steel services, bare and targeted unprotected steel main, and cast iron main in its distribution system in the District of Columbia. On January 29, 2015, the Public Service Commission of the District of Columbia issued an order approving the settlement agreement and approving recovery through the surcharge of total project costs up to $110 million through fiscal year 2019. Cumulative plant additions through September 30, 2015 were included in rate base in the most recent rate cases and are now being recovered in base rates.
Maryland Jurisdiction. In 2014, pursuant to the Strategic Infrastructure Development and Enhancement (STRIDE) law in Maryland, the PSC of MD approved Washington Gas’ initial STRIDE Plan to recover the reasonable and prudent costs associated with qualifying infrastructure replacements through monthly surcharges. The Commission approved replacement of bare and/or unprotected steel services and targeted copper and/or pre-1975 plastic services, bare and targeted unprotected steel main, mechanically coupled pipe main and service, and cast iron main in Washington Gas' Maryland distribution system at an estimated five-year cost of $200 million, including cost of removal, through calendar year 2018. In 2015, the PSC of MD approved one additional program applicable to gas distribution system replacements and three of the four requested additional programs applicable to gas transmission system replacements at an incremental cost of $18.5 million, including cost of removal, in eligible infrastructure replacements over the remaining four years of the initial STRIDE Plan. On June 15, 2018, the Company filed an Application with the Commission to amend and extend its STRIDE Plan. Washington Gas proposes to invest approximately $394 million over a five-year period to continue work on previously approved distribution and transmission system accelerated replacement programs.
Virginia Jurisdiction. On April 21, 2011, the Virginia State Corporation Commission approved, pursuant to a new law to advance Virginia’s Energy Plan (“SAVE Act”), Washington Gas’s initial SAVE Plan for accelerated replacement of infrastructure facilities and a SAVE Rider to recover eligible costs associated with those replacement programs. Subsequently, the Commission approved three amendments to the Company’s SAVE Plan, increasing the overall investment, the scope of approved programs and new facilities replacement programs. Washington Gas' current, approved SAVE Plan encompasses eight ongoing programs: (i) bare and/or unprotected steel service replacement program, (ii) bare and unprotected steel main replacement program, (iii) mechanically coupled pipe replacement, (iv) copper services replacement program, (v) black plastic services replacement program, (vi) cast iron mains replacement program, (vii) meter set and piping remediation/replacement program and (viii) transmission programs. Cumulative expenditures through November 30, 2016 were included in rate base in the most recent rate cases and are now being recovered in base rates. On November 21, 2017, the Commission approved the Company’s Application to amend and extend its SAVE Plan. Washington Gas is authorized to invest $500 million, including cost of removal over the five-year calendar period through 2022.
WGL Holdings, Inc.
Washington Gas Light Company
Part II
Item 7. Management’s Discussion and Analysis of
Financial Condition and Results of Operations
Pipeline Investments
Meade
In February 2014, WGL Midstream and certain venture partners formed Meade Pipeline Co LLC (Meade) of which WGL Midstream holds a 55% interest. Meade was formed to develop and own, jointly with Transcontinental Gas Pipe Line Company, LLC (Transco), an approximately 185-mile pipeline originating in Susquehanna County, Pennsylvania and extending to Lancaster County, Pennsylvania (Central Penn) that will have the capacity to transport and deliver up to approximately 1.7 million dekatherms per day of natural gas. Additionally, WGL Midstream entered into an agreement with Cabot Oil & Gas Corporation (Cabot) whereby WGL Midstream will purchase 500,000 dekatherms per day of natural gas from Cabot over a 15- year term. As part of this agreement, Cabot has acquired 500,000 dekatherms per day of firm gas transportation capacity on Transco’s Atlantic Sunrise project. This capacity will be released to WGL Midstream.
Central Penn is an integral part of Transco’s “Atlantic Sunrise” project and is fully integrated into Transco's system. WGL Midstream planned to invest an estimated $450 million for its interest in Meade, and Meade planned to invest an estimated $816 million in Central Penn for an approximate 39% interest in Central Penn. Transco holds the remaining ownership interests in Central Penn. Construction began after FERC issued the Notice to Proceed on September 15, 2017. On October 4, 2018, FERC issued its authorization to place the pipeline into service and Central Penn began operations on October 6, 2018. WGL Midstream held a $447.0 million and $146.7 million equity method investment in Meade at September 30, 2018 and September 30, 2017, respectively.
In August 2018, Meade executed an agreement with Transco to participate in an expansion of the Central Penn Pipeline (Leidy South) with a capital investment of up to approximately $50 million by WGL Midstream. Leidy South is expected to add an estimated 580,000 dekatherms per day of natural gas to the capacity of Central Penn through the addition of compression at new and existing stations. Meade will own 40% of the expanded capacity and WGL Midstream will indirectly own 22% of the expanded capacity through its 55% ownership interest in Meade. Leidy South is anticipated to be in-service as early as the fourth quarter of 2021 assuming all necessary regulatory approvals are received in a timely manner.
Mountain Valley Pipeline
WGL Midstream owns a 10% equity interest in Mountain Valley Pipeline, LLC (Mountain Valley). The proposed pipeline to be developed, constructed, owned and operated by Mountain Valley, will transport approximately 2.0 million dekatherms of natural gas per day and connects with EQT Corporation's Equitrans system in Wetzel County, West Virginia to Transco's Station 165 in Pittsylvania County, Virginia.
On October 13, 2017, the FERC issued the Certificate of Public Convenience and Necessity for the pipeline. In early 2018, the FERC granted several notices to proceed with certain construction activities on the pipeline. Mountain Valley has submitted additional requests to the FERC for notices to proceed. On June 21, 2018, the 4th U.S. Circuit Court of Appeals granted a stay of permit for certain construction activities in West Virginia, while the court considered challenging a federal permit. On July 27, 2018, the Court of Appeals set aside the U.S. Forest Service and Bureau of Land Management’s decisions granting a right-of-way for a 3.5-mile segment of the pipeline. On August 29, 2018 FERC and the Court of Appeals issued separate orders that allowed for full construction activities to restart along the route with exception of areas located within proximity of the Weston Gauley Bridge Turnpike Trail and the Jefferson National Forest. As a result of the legal and regulatory as well as weather delays, Mountain Valley has modified its construction schedule and the pipeline is targeted to be placed in-service during the fourth quarter of 2019.
On October 2, 2018, the 4th Circuit Court of Appeals vacated a Clean Water Act Section 404 stream and wetland crossing permit issued by the Huntington District of the U.S. Army Corps of Engineers (USACE). This decision affects stream and wetland crossings along approximately 160 miles of the route in West Virginia, and Mountain Valley is evaluating options to continue with construction activities that do not include stream and wetland crossings along this portion of the route. Mountain Valley intends to apply for a new permit with the USACE. Mountain Valley expects to secure a new Nationwide 12 permit from the USACE early in 2019. With ongoing evaluation of its construction plan, Mountain Valley has not changed its targeted in-service date.
WGL Midstream expects to invest approximately $352.0 million through the in-service date of the pipeline based on scheduled capital contributions and its pro rata share of project costs. In addition, WGL Midstream entered into a gas purchase commitment between 390,000 and 500,000 dekatherms of natural gas per day, at index-based prices, for a 20 year term, and will also be a shipper on the proposed pipeline. WGL Midstream held a $182.1 million and $63.0 million equity method investment in Mountain Valley at September 30, 2018 and September 30, 2017, respectively.
WGL Holdings, Inc.
Washington Gas Light Company
Part II
Item 7. Management’s Discussion and Analysis of
Financial Condition and Results of Operations
In April 2018, WGL Midstream entered into a separate agreement with Mountain Valley to acquire a 5% equity interest in a lateral project to build an interstate natural gas pipeline (the MVP Southgate project). The proposed pipeline will receive gas from the Mountain Valley Pipeline mainline in Pittsylvania County, Virginia and extend approximately 73 miles south to new delivery points in Rockingham and Alamance counties, North Carolina. The total commitment by WGL Midstream is expected to be approximately $17.0 million and the lateral pipeline is expected to be placed into service in late 2020.
Constitution
WGL Midstream owns a 10% interest in Constitution. The pipeline project is designed to transport at least 650,000 dekatherms of natural gas per day from the Marcellus region in northern Pennsylvania to major northeastern markets. Fully contracted with long-term commitments from established natural gas producers currently operating in Pennsylvania, the pipeline is designed to originate from the Marcellus production areas in Susquehanna County, Pennsylvania, and interconnect with the Iroquois Gas Transmission and Tennessee Gas Pipeline systems in Schoharie County, New York.
In December 2014, Constitution received approval from the FERC to construct and operate the proposed pipeline. However, on April 22, 2016, the New York State Department of Environmental Conservation (NYSDEC) denied Constitution’s application for a Section 401 Certification for the pipeline, which is necessary for the construction and operation of the pipeline. In October 2017, Constitution filed a petition for declaratory order requesting FERC to find that, by operation of law, the Section 401 certification requirement for the New York State portion of Constitution’s pipeline project was waived due to the failure by the NYSDEC to act on Constitution’s Section 401 application within a reasonable period of time as required by the express terms of the statute. On January 11, 2018, the FERC denied the petition. On January 16, 2018, Constitution petitioned the U.S. Supreme Court to review the judgment of the Second Circuit Court, asserting that the Second Circuit Court’s decision conflicts with the decisions of the U.S. Supreme Court and federal Courts of Appeals on an important question of federal law. On February 12, 2018, Constitution filed a request for rehearing with FERC, which was denied on July 19, 2018. On April 30, 2018, the U.S. Supreme Court denied Constitution’s petition for writ of certiorari.
The project’s sponsors remain committed to the project, and as such, on June 25, 2018, Constitution requested FERC grant a 24-month extension of the completion date on construction of the pipeline until the fourth quarter of 2020. On September 14, 2018 Constitution filed a petition for review of prior FERC rulings with the DC Court of Appeals.
We continually evaluate our investment in Constitution for other than temporary impairment. Our impairment assessment uses income and market approaches in determining the fair value of our investment in Constitution. Refer to Note 14 - Fair Value Measurements. We recorded an other than temporary impairment charge of $34.0 million to “Equity in earnings of unconsolidated affiliates” and recorded a reversal to “Operation and maintenance” expense of a previously recognized expense of $3.0 million during the second quarter of fiscal year 2018 after the January 11, 2018 decision. We evaluated our remaining investment at September 30, 2018 and determined that there was no additional impairment. There could be additional losses in the value of the investment beyond the impairment charge already taken. However, we believe that recoveries from the sale of the inventories held by Constitution will mostly offset these losses. We also continue to incur legal fees associated with the project. At September 30, 2018 and September 30, 2017, WGL Midstream held a $3.8 million and $38.1 million equity method investment in Constitution, respectively.
Distributed Generation Investments
Through WGL Energy Systems, the company invests in distributed generation assets such as Solar PV systems, combined heat and power plants and natural gas fuel cells through direct asset ownership or through tax equity partnerships, and operates as a general contractor to upgrade the mechanical, electrical, water and energy related infrastructure of large governmental and commercial facility using traditional and alternative energy technologies.
Refer to Note 16 - Other Investments of the Notes to Consolidated Financial Statements for further discussion of this matter.
CONTRACTUAL OBLIGATIONS, OFF-BALANCE SHEET ARRANGEMENTS AND OTHER COMMERCIAL COMMITMENTS
Contractual Obligations
WGL and Washington Gas have certain contractual obligations incurred in the normal course of business that require fixed and determinable payments in the future. These commitments include long-term debt, lease obligations, unconditional purchase obligations for pipeline capacity, transportation and storage services, certain natural gas and electricity commodity commitments and our commitments related to the business process outsourcing program.
WGL Holdings, Inc.
Washington Gas Light Company
Part II
Item 7. Management’s Discussion and Analysis of
Financial Condition and Results of Operations
The total estimated purchase obligations for WGL as of September 30, 2018 for future fiscal years are shown below. |
| | | | | | | | | | | | | | | | | | | | | | | | | | | |
| Estimated Contractual Obligations and Commercial Commitments |
| Years Ended September 30, | | | | |
| (In millions) | 2019 | | 2020 | | 2021 | | 2022 | | 2023 | | Thereafter | | Total |
Pipeline and storage contracts(a) | $ | 702.2 |
| | $ | 594.6 |
| | $ | 575.2 |
| | $ | 566.6 |
| | $ | 557.9 |
| | $ | 3,367.3 |
| | $ | 6,363.8 |
|
Long-term debt(b) | 100.0 |
| | 700.0 |
| | — |
| | — |
| | 20.0 |
| | 1,176.0 |
| | 1,996.0 |
|
Interest expense(c) | 77.9 |
| | 61.8 |
| | 56.8 |
| | 56.8 |
| | 56.1 |
| | 957.6 |
| | 1,267.0 |
|
Gas purchase commitments(d) | | | | | | | | | | | | | |
| —Washington Gas | 439.6 |
| | 387.0 |
| | 362.2 |
| | 348.2 |
| | 327.7 |
| | 2,672.5 |
| | 4,537.2 |
|
| —WGL Energy Services | 190.4 |
| | 100.2 |
| | 42.0 |
| | 12.2 |
| | 3.3 |
| | 0.4 |
| | 348.5 |
|
—WGL Midstream(e) | 1,203.2 |
| | 1,279.9 |
| | 1,156.9 |
| | 1,111.3 |
| | 1,113.2 |
| | 17,740.2 |
| | 23,604.7 |
|
Electric purchase commitments(f) | 328.8 |
| | 213.8 |
| | 97.0 |
| | 32.9 |
| | 1.9 |
| | 0.3 |
| | 674.7 |
|
| Operating leases | 5.6 |
| | 9.2 |
| | 10.1 |
| | 9.6 |
| | 9.7 |
| | 86.6 |
| | 130.8 |
|
Business process outsourcing(g) | 24.5 |
| | 24.2 |
| | 18.1 |
| | 5.3 |
| | — |
| | — |
| | 72.1 |
|
Other long-term commitments(h) | 4.6 |
| | 5.1 |
| | 2.0 |
| | 0.3 |
| | 0.3 |
| | 2.7 |
| | 15.0 |
|
| Total | $ | 3,076.8 |
| | $ | 3,375.8 |
| | $ | 2,320.3 |
| | $ | 2,143.2 |
| | $ | 2,090.1 |
| | $ | 26,003.6 |
| | $ | 39,009.8 |
|
| |
(a)
| Represents minimum payments for natural gas transportation, storage and peaking contracts for Washington Gas, WGL Energy Services and WGL Midstream. |
| |
(b)
| Represents scheduled repayment of principal. |
| |
(c)
| Represents the scheduled interest payments associated with long-term debt for WGL and Washington Gas. |
| |
(d)
| Includes known and reasonably likely commitments to purchase fixed volumes of natural gas. Cost estimates are based on forward market prices as of September 30, 2018. Certain of our gas purchase agreements have optionality, which may cause increases in these commitments. |
(e) Includes gas purchase commitments to be sold under a gas sale and purchase, and capacity agreement with GAIL, a subsidiary of GAIL (India) Limited, under which WGL Midstream has agreed to sell and deliver a minimum of 340,000 dekatherms per day and up to 430,000 dekatherms per day of natural gas, for a term of 20 years from the in-service date of the export facility. Also includes gas purchase commitments related to certain of our pipeline investments.
(f) Represents electric purchase commitments that are based on existing fixed price and fixed volume contracts. Includes $31.6 million related to renewable energy credits.
(g) Represents fixed costs to service providers related to various contracts for business process outsourcing.
(h) Includes secured supply agreements’ minimum program fees and committed payments related to certain environmental response costs.
The table above reflects fixed and variable obligations. Certain of these estimates reflect likely purchases under various contracts and may differ from minimum future contractual commitments disclosed in Note 12 — Commitments and Contingencies of the Notes to Consolidated Financial Statements.
Washington Gas outsources certain of its business processes related to human resources, information technology, consumer services, construction, integrated supplier and finance operations. The continued management of service levels provided is critical to the success of these outsourcing arrangements. Washington Gas has divided its BPO governance among functional areas within the organization, each containing a comprehensive set of processes to monitor and control the cost effectiveness and quality of services provided through the BPO.
For commitments related to Washington Gas’ pension and post-retirement benefit plans, during fiscal year 2018, Washington Gas did not contribute to its qualified pension plan but did contribute and make payment of $1.8 million to its DB SERP. In addition, Washington Gas contributed $5.0 million to its health and life insurance benefit plans during fiscal year 2018. During fiscal year 2019, Washington Gas does not expect to make a contribution to its qualified pension plan but does expect to make a payment totaling $20.2 million to its DB SERP, which is expected to be funded by the rabbi trust. Washington Gas expects to make a contribution of $1.3 million to its health and life insurance benefit plans during fiscal year 2019. For a further discussion of our pension and post-retirement benefit plans, refer to Note 9—Pension and Other Post-Retirement Benefit Plans of the Notes to Consolidated Financial Statements.
Merger Commitments
Approval of the merger with AltaGas across all jurisdictions was conditioned upon AltaGas and WGL agreeing to certain financial commitments including, but not limited to: customer bill credits, funding for low-income weatherization and energy
WGL Holdings, Inc.
Washington Gas Light Company
Part II
Item 7. Management’s Discussion and Analysis of
Financial Condition and Results of Operations
efficiency initiatives, public safety programs, energy educational programs, gas expansion fund contributions, workplace development initiatives, charitable contributions, and other required commitments. The commitments are funded within various timeframes from 30 days to 10 years after the Merger closed on July 6, 2018. In addition, the commitments related to Maryland are subject to a Most Favored Nation (MFN) provision that may change the amount or nature of the commitments. We recognized $139.7 million expenses of merger commitments for fiscal year 2018 on our Consolidated Financial Statements. $80 million has been paid as of September 30, 2018, with $59.7 million remaining as a liability on our balance sheets.
The following additional commitments by Washington Gas will have an impact on our consolidated financial statements when the transactions are incurred in the future:
1)Hiring of three damage prevention trainers in each jurisdiction for a total of $2.4 million over 5 years;
2)Investment of $70.0 million over a 10-year period to further extend natural gas service to areas within Washington Gas's service territory, which will be incorporated into Washington Gas's ongoing capital plan;
3)Spending $8.0 million on leak mitigation and reducing leak backlogs within 3 years after the Merger close; and
4)Development of 15MW of either electric grid energy storage or Tier 1 renewable resources within 5 years.
In addition, there are a number of operational commitments that will have an impact on the ongoing business of Washington Gas, including reductions of leak backlogs, conducting a root cause analysis related to customer service, increasing supplier diversity, achieving synergy savings benefits, developing protocols for moving meters from inside to outside customers’ premises, as well as reporting and tracking related to all the commitments.
For a discussion of merger related commitments, refer to Note 20 — Merger with AltaGas Ltd. of the Notes to Consolidated Financial Statements.
Financial Guarantees
WGL has guaranteed payments primarily for certain commitments on behalf of some of its subsidiaries. WGL has also guaranteed payments for certain of our external partners. At September 30, 2018, there were no guarantees to external parties.
CREDIT RISK
Wholesale Credit Risk
Certain wholesale suppliers that sell natural gas to any or all of Washington Gas, WGL Energy Services, and WGL Midstream and electricity to WGL Energy Services, may have relatively low credit ratings or may not be rated by major credit rating agencies.
Washington Gas enters into transactions with wholesale counterparties for the purpose of meeting firm ratepayer commitments, to optimize the value of its long-term capacity assets, and for hedging natural gas costs. In the event of a counterparty’s failure to deliver contracted volumes of gas or fulfill its payment obligations, Washington Gas may incur losses that would typically be passed through to its sales customers under the purchased gas cost adjustment mechanisms; however, Washington Gas may be at risk for financial loss to the extent these losses are not passed through to its customers.
For WGL Energy Services, any failure of wholesale counterparties to deliver natural gas or electricity under existing contracts could cause financial exposure for the difference between the price at which WGL Energy Services has contracted to buy these commodities and their replacement cost from another supplier. To the extent that WGL Energy Services sells natural gas to these wholesale counterparties, WGL Energy Services may be exposed to payment risk if WGL Energy Services is in a net receivable position. Additionally, WGL Energy Services enters into contracts with counterparties to hedge the costs of natural gas and electricity. Depending on the ability of the counterparties to fulfill their commitments, WGL Energy Services could be at risk for financial loss.
WGL Midstream enters into transactions with wholesale counterparties to economically hedge and optimize its portfolio of owned and managed natural gas assets. Any failure of wholesale counterparties to deliver natural gas under existing contracts could cause financial exposure for the difference between the price at which WGL Midstream has contracted to buy these commodities and their replacement cost. To the extent that WGL Midstream sells natural gas to these wholesale counterparties, WGL Midstream may be exposed to payment risk if it is in a net receivable position. In addition, WGL Midstream enters into
WGL Holdings, Inc.
Washington Gas Light Company
Part II
Item 7. Management’s Discussion and Analysis of
Financial Condition and Results of Operations
contracts with counterparties to hedge the costs of natural gas. Depending on the ability of the counterparties to fulfill their commitments, WGL Midstream could be at risk for financial loss.
Washington Gas, WGL Energy Services, and WGL Midstream operate under an existing wholesale counterparty credit policy that is designed to mitigate credit risks through requirements for credit enhancements including, but not limited to, letters of credit, parent guarantees and cash collateral when deemed necessary. In accordance with this policy, Washington Gas, WGL Energy Services, and WGL Midstream have each obtained credit enhancements from certain of their counterparties. If certain counterparties or their guarantors meet the policy’s creditworthiness criteria, Washington Gas, WGL Energy Services, and WGL Midstream may grant unsecured credit to those counterparties or their guarantors. The creditworthiness of all counterparties is continuously monitored.
Washington Gas, WGL Energy Services and WGL Midstream are also subject to the collateral requirements of their counterparties. At September 30, 2018, Washington Gas, WGL Energy Services and WGL Midstream provided $13.5 million, $32.3 million and $35.8 million in cash collateral to counterparties, respectively.
The following table provides information on our credit exposure, net of collateral, to wholesale counterparties as of September 30, 2018 for Washington Gas, WGL Energy Services and WGL Midstream, separately.
|
| | | | | | | | | | | | | | | | | | |
Credit Exposure to Wholesale Counterparties (In millions) |
Rating(a) | Exposure Before Credit Collateral(b) | | Offsetting Credit Collateral Held(c) | | Net Exposure | | Number of Counterparties Greater Than 10%(d) | | Net Exposure of Counterparties Greater Than 10% |
| Washington Gas | | | | | | | | | |
| Investment Grade | $ | 41.7 |
| | $ | — |
| | $ | 41.7 |
| | 2 |
| | $ | 27.3 |
|
| Non-Investment Grade | — |
| | — |
| | — |
| | — |
| | — |
|
| No External Ratings | 16.1 |
| | 11.0 |
| | 5.0 |
| | 1 |
| | 1.9 |
|
| WGL Energy Services | | | | | | | | | |
| Investment Grade | $ | 0.9 |
| | $ | 0.2 |
| | $ | 0.7 |
| | 3 |
| | $ | 0.6 |
|
| Non-Investment Grade | — |
| | — |
| | — |
| | — |
| | — |
|
| No External Ratings | 0.6 |
| | — |
| | 0.6 |
| | 1 |
| | 0.5 |
|
| WGL Midstream | | | | | | | | | |
| Investment Grade | $ | 66.2 |
| | $ | 18.7 |
| | $ | 47.5 |
| | 2 |
| | $ | 12.3 |
|
| Non-Investment Grade | — |
| | — |
| | — |
| | — |
| | — |
|
| No External Ratings | 16.8 |
| | 1.0 |
| | 15.8 |
| | — |
| | — |
|
(a) Investment grade is primarily determined using publicly available credit ratings of the counterparty. If the counterparty has provided a guarantee by a higher-rated entity (e.g., its parent), it is determined based upon the rating of it guarantor. Included in “Investment grade” are counterparties with a minimum Standard & Poor’s or Moody’s Investor Service rating of BBB- or Baa3, respectively.
(b) Includes the net of all open positions on energy-related derivatives subject to mark-to-market accounting requirements and the net receivable/payable for the realized transactions. Amounts due from counterparties are offset by liabilities payable to those counterparties to the extent that contractual netting arrangements are in place.
(c) Represents cash deposits and letters of credit received from counterparties, not adjusted for probability of default.
(d) Using a percentage of the net exposure.
Retail Credit Risk
Washington Gas is exposed to the risk of non-payment of utility bills by certain of its customers. To manage this customer credit risk, Washington Gas may require cash deposits from its high risk customers to cover payment of their bills until the requirements for the deposit refunds are met. In addition, Washington Gas has a purchase of receivables (POR) program in Maryland, whereby it purchases receivables from participating energy marketers at approved discount rates. Under the program, Washington Gas is exposed to the risk of non-payment by the retail customers for these receivables. This risk is factored into the approved discount rate at which Washington Gas purchases the receivables.
WGL Energy Services is also exposed to the risk of non-payment by its retail customers. WGL Energy Services manages this risk by evaluating the credit quality of certain new customers as well as by monitoring collections from existing customers. To the extent necessary, WGL Energy Services can obtain collateral from, or terminate service to, its existing customers based on credit quality criteria. In addition, WGL Energy Services participates in POR programs with certain Maryland, District of Columbia and Pennsylvania utilities, whereby it sells its receivables to various utilities at approved
WGL Holdings, Inc.
Washington Gas Light Company
Part II
Item 7. Management’s Discussion and Analysis of
Financial Condition and Results of Operations
discount rates. Under the POR programs, WGL Energy Services is exposed to the risk of non-payment by its retail customers for delivered commodities that have not yet been billed. Once the invoices are billed, however, the associated credit risk is assumed by the purchasing utilities that sponsor POR programs. While participation in POR programs reduces the risk of collection and fixes a discount rate on the receivables, there is a risk that the discount rate paid to participate in the POR program will exceed the actual bad debt expense and billing fees associated with these receivables.
WGL Energy Systems is subject to retail credit risk associated with customers who purchase electricity under long term agreements from distributed generation assets owned by the company. The customers undergo credit evaluation prior to contract execution and are monitored periodically during the contract term for payment performance and credit quality. These steps mitigate credit risk associated with the distributed generation asset customers.
At September 30, 2018, WGSW was indirectly subject to retail credit risk associated with non-payment by customers who lease distributed energy equipment or maintain energy service agreements through affiliates. This credit risk was mitigated through minimum credit quality criteria established in each of WGSW’s agreements for customer agreements. These criteria were satisfied to enable WGSW to participate in the project financing arrangement or partnership interest. Refer to Note 16, Other Investments of the Notes to Consolidated Financial Statements for a further discussion of these investments.
WGL Midstream is not subject to retail credit risk.
MARKET RISK
We are exposed to various forms of market risk including commodity price risk, weather risk and interest-rate risk. The following discussion describes these risks and our management of them.
Price Risk Related to the Regulated Utility Segment
Washington Gas faces price risk associated with the purchase and sale of natural gas. Washington Gas generally recovers the cost of the natural gas to serve customers through gas cost recovery mechanisms as approved in jurisdictional tariffs; therefore, a change in the price of natural gas generally has no direct effect on Washington Gas’ net income. However, Washington Gas is responsible for following competitive and reasonable practices in purchasing natural gas for its customers.
To manage price risk associated with its natural gas supply to its firm customers, Washington Gas: (i) actively manages its gas supply portfolio to balance sales and delivery obligations; (ii) injects natural gas into storage during the summer months when prices are generally lower, and withdraws that gas during the winter heating season when prices are generally higher and (iii) enters into hedging contracts and other contracts that may qualify as derivative instruments related to the sale and purchase of natural gas.
Washington Gas executes commodity-related physical and financial contracts in the form of forward, futures and option contracts as part of an asset optimization program that is managed by its internal staff. Under this program, Washington Gas realizes value from its long-term natural gas transportation and storage capacity resources when they are not being fully used to serve utility customers. Regulatory sharing mechanisms in all three jurisdictions allow the profit from these transactions to be shared between Washington Gas’ customers and shareholders.
The following two tables summarize the changes in the fair value of our net assets (liabilities) associated with the Regulated Utility segment’s energy-related derivatives during the fiscal year ended September 30, 2018.
|
| | | |
Regulated Utility Segment Changes in Fair Value of Energy-Related Derivatives |
| (In millions) | |
| Net assets (liabilities) at September 30, 2017 | $ | (121.3 | ) |
| Net fair value of contracts entered into during the period | 16.9 |
|
| Other changes in net fair value | (26.6 | ) |
| Realized net settlement of derivatives | 35.3 |
|
| Net assets (liabilities) at September 30, 2018 | $ | (95.7 | ) |
WGL Holdings, Inc.
Washington Gas Light Company
Part II
Item 7. Management’s Discussion and Analysis of
Financial Condition and Results of Operations
|
| | | |
Regulated Utility Segment Roll Forward of Energy-Related Derivatives |
| (In millions) | |
| Net assets (liabilities) at September 30, 2017 | $ | (121.3 | ) |
| Recorded to income | (2.1 | ) |
| Recorded to regulatory assets/liabilities | (7.6 | ) |
| Realized net settlement of derivatives | 35.3 |
|
| Net assets (liabilities) at September 30, 2018 | $ | (95.7 | ) |
The maturity dates of our net assets (liabilities) associated with the regulated utility segment’s energy-related derivatives recorded at fair value at September 30, 2018, is summarized in the following table based on the level of the fair value calculation under ASC Topic 820:
|
| | | | | | | | | | | | | | | | | | | | | | | | | | | |
Regulated Utility Segment Maturity of Net Assets (Liabilities) Associated with our Energy-Related Derivatives | | |
| | | |
| (In millions) | 2019 | | 2020 | | 2021 | | 2022 | | 2023 | | Thereafter | | Total |
| Level 1 — Quoted prices in active markets | $ | — |
| | $ | — |
| | $ | — |
| | $ | — |
| | $ | — |
| | $ | — |
| | $ | — |
|
| Level 2 — Significant other observable inputs | (1.5 | ) | | (0.1 | ) | | — |
| | — |
| | — |
| | — |
| | (1.6 | ) |
| Level 3 — Significant unobservable inputs | 1.3 |
| | (0.4 | ) | | (1.5 | ) | | (5.9 | ) | | (5.5 | ) | | (82.1 | ) | | (94.1 | ) |
| Total net assets (liabilities) associated with our energy-related derivatives | $ | (0.2 | ) | | $ | (0.5 | ) | | $ | (1.5 | ) | | $ | (5.9 | ) | | $ | (5.5 | ) | | $ | (82.1 | ) | | $ | (95.7 | ) |
Refer to Note 13, Derivative and Weather-Related Instruments and Note 14, Fair Value Measurements of the Notes to Consolidated Financial Statements for a further discussion of our derivative activities and fair value measurements.
Price Risk Related to the Non-Utility Segments
Retail Energy Marketing. Our retail energy-marketing subsidiary, WGL Energy Services, sells natural gas and electricity to retail customers at both fixed and indexed prices. WGL Energy Services must manage daily and seasonal demand fluctuations for these products with its suppliers. Price risk may exist to the extent WGL Energy Services does not closely match the timing and volume of natural gas and electricity it purchases with the related fixed price or indexed sales commitments. WGL Energy Services’ risk management policies and procedures are designed to minimize this risk.
A portion of WGL Energy Services’ annual natural gas sales volumes is subject to variations in customer demand associated with fluctuations in weather and other factors. Purchases of natural gas to fulfill retail sales commitments are generally made under fixed-volume contracts based on certain weather assumptions. If there is significant deviation from normal weather or from other factors that affect customer usage or utility delivery requirements, purchase commitments may differ significantly from actual customer usage. To the extent that WGL Energy Services cannot match its customer requirements and supply commitments, it may be exposed to commodity price and volume variances, which could negatively impact expected gross margins (refer to the section entitled “Weather Risk” for further discussion of our management of weather risk). WGL Energy Services manages these risks through the use of derivative instruments, including financial products.
WGL Energy Services procures electricity supply under contract structures in which WGL Energy Services assumes the responsibility of matching its customer requirements with its supply purchases. WGL Energy Services assembles the various components of supply, including electric energy from various suppliers, and capacity, ancillary services and transmission service from the PJM Interconnection, a regional transmission organization, in matching its customer requirements obligations. While the capacity and transmission costs within PJM are generally stable and identifiable several years into the future, the cost of ancillary services which support the reliable operation of the transmission system does fluctuate as changes occur in the balance between generation and the consumption mix within the electric system. WGL Energy Services could be exposed to price risk associated with changes in ancillary costs due to lack of available forward market products to sufficiently hedge those risks. Commercial retail contracts for larger customers often include terms which permit WGL Energy Services to pass through regulatory approved changes in capacity and transmission costs, as well as some changes in ancillary costs. These terms reduce the price risk exposure related to these changes for WGL Energy Services.
WGL Holdings, Inc.
Washington Gas Light Company
Part II
Item 7. Management’s Discussion and Analysis of
Financial Condition and Results of Operations
To the extent WGL Energy Services has not sufficiently matched its customer requirements with its supply commitments, it could be exposed to electric commodity price risk. WGL Energy Services manages this risk through the use of derivative instruments, including financial products.
WGL Energy Services’ electric business is also exposed to fluctuations in weather and varying customer usage. Purchases generally are made under fixed-price, fixed-volume contracts that are based on certain weather assumptions. If there are significant deviations in weather or usage from these assumptions, WGL Energy Services may incur price and volume variances that could negatively impact expected gross margins (refer to the section entitled “Weather Risk” for further discussion of our management of weather risk).
The following two tables summarize the changes in the fair value of our net assets (liabilities) associated with the Retail Energy-Marketing segment’s energy-related derivatives during the fiscal year ended September 30, 2018.
|
| | | |
Retail Energy-Marketing Segment Changes in Fair Value of Energy-Related Derivatives |
| (In millions) | |
| Net assets (liabilities) at September 30, 2017 | $ | (11.8 | ) |
| Net fair value of contracts entered into during the period | (1.0 | ) |
| Other changes in net fair value | (2.3 | ) |
| Realized net settlement of derivatives | 1.0 |
|
| Net assets (liabilities) at September 30, 2018 | $ | (14.1 | ) |
|
| | | |
Retail Energy-Marketing Segment Roll Forward of Energy-Related Derivatives |
| (In millions) | |
| Net assets (liabilities) at September 30, 2017 | $ | (11.8 | ) |
| Recorded to income | (3.5 | ) |
| Recorded to accounts payable | 0.2 |
|
| Realized net settlement of derivatives | 1.0 |
|
| Net assets (liabilities) at September 30, 2018 | $ | (14.1 | ) |
The maturity dates of our net assets (liabilities) associated with the retail energy-marketing segments’ energy-related derivatives recorded at fair value at September 30, 2018 are summarized in the following table based on the level of the fair value calculation under ASC Topic 820:
|
| | | | | | | | | | | | | | | | | | | | | | | | | | | |
Retail Energy-Marketing Segment Maturity of Net Assets (Liabilities) Associated with our Energy-Related Derivatives | | |
| | | |
| (In millions) | 2019 | | 2020 | | 2021 | | 2022 | | 2023 | | Thereafter | | Total |
| Level 1 — Quoted prices in active markets | $ | — |
| | $ | — |
| | $ | — |
| | $ | — |
| | $ | — |
| | $ | — |
| | $ | — |
|
| Level 2 — Significant other observable inputs | 3.1 |
| | (0.2 | ) | | (0.8 | ) | | (0.3 | ) | | — |
| | — |
| | 1.8 |
|
| Level 3 — Significant unobservable inputs | (4.6 | ) | | (8.3 | ) | | (2.8 | ) | | (0.2 | ) | | — |
| | — |
| | (15.9 | ) |
| Total net assets (liabilities) associated with our energy-related derivatives | $ | (1.5 | ) | | $ | (8.5 | ) | | $ | (3.6 | ) | | $ | (0.5 | ) | | $ | — |
| | $ | — |
| | $ | (14.1 | ) |
Refer to Note 13, Derivative and Weather-Related Instruments and Note 14, Fair Value Measurements of the Notes to Consolidated Financial Statements for a further discussion of our derivative activities and fair value measurements.
Commercial Energy Systems. WGL Energy Systems sells energy (both electricity and thermal) and RECs from distributed generation assets. The sale of energy is under long term power purchase agreements (PPAs) with a general duration of 20 years, while the sale of RECs are usually under shorter term or immediate delivery contracts. Weather patterns have an effect on WGL Energy Systems solar generation assets to the extent that output is reduced. WGL Energy Systems may also be exposed to REC price risk. The REC market has limited visibility to forward market prices. WGL Energy Systems seeks to mitigate this price risk by entering into bundled energy and REC long-term purchase agreements and independent forward REC sale agreements, when possible.
WGL Holdings, Inc.
Washington Gas Light Company
Part II
Item 7. Management’s Discussion and Analysis of
Financial Condition and Results of Operations
WGL Energy Systems also earns revenues by providing energy efficiency and sustainability solutions to governmental agencies pursuant to various contractual vehicles, including the area-wide contract. WGL Energy Systems earns margins between the price at which the solutions are sold and the cost to design and build them. Margins may be eroded by an underestimation of costs. WGL Energy Systems also conducts business with government agencies and faces future revenue risks relating to such government agencies not receiving appropriations funding or projects being unfunded by Congress.
WGSW holds project financing arrangements, whereby it holds an interest in a limited partnership that acquires distributed generation solar assets at fair market value and leases back those assets to counterparties, with fixed target rates of return over terms between 6-20 years. WGSW also enters into arrangements in which investment partners purchase solar assets and leases them to retail customers. In these cases, the purchased solar assets are expected to achieve a target rate of return from the lease payments that are collected from the retail customers. WGSW manages this price risk through its investment agreements and evaluation of the asset purchase in conjunction with the inception of the lease.
Midstream Energy Services. WGL Midstream engages in wholesale commodity transactions to optimize its owned and managed natural gas assets. Price risk exists to the extent WGL Midstream does not closely match the volume of physical natural gas in storage with the related forward sales entered into as hedges. WGL Midstream seeks to mitigate this risk by actively managing and hedging these assets in accordance with corporate risk management policies and procedures. Depending upon the nature of its forward hedges, WGL Midstream may also be exposed to fluctuations in mark-to-market valuations based on changes in forward price curves. WGL Midstream pays fixed, fair market prices for its owned storage assets and is subject to variations in annual summer-winter price differentials associated with weather and other market factors. To the extent there are significant variations in weather, WGL Midstream may incur price variances that negatively impact expected gross margins (refer to the section entitled “Weather Risk” for further discussion of our management of weather risk). WGL Midstream manages this risk through the use of derivative instruments, including financial products.
The following two tables summarize the changes in the fair value of our net assets (liabilities) associated with the Midstream Energy Services segments’ energy-related derivatives during the fiscal year ended September 30, 2018.
|
| | | |
Midstream Energy Services Segment Changes in Fair Value of Energy-Related Derivatives |
| (In millions) | |
| Net assets (liabilities) at September 30, 2017 | $ | 11.2 |
|
| Net fair value of contracts entered into during the period | (9.1 | ) |
| Other changes in net fair value | (2.4 | ) |
| Realized net settlement of derivatives | 1.4 |
|
| Net assets (liabilities) at September 30, 2018 | $ | 1.1 |
|
|
| | | |
Midstream Energy Services Segment Roll Forward of Energy-Related Derivatives |
| (In millions) | |
| Net assets (liabilities) at September 30, 2017 | $ | 11.2 |
|
| Recorded to income | (11.5 | ) |
| Realized net settlement of derivatives | 1.4 |
|
| Net assets (liabilities) at September 30, 2018 | $ | 1.1 |
|
The maturity dates of our net assets (liabilities) associated with the Midstream Energy Services segments’ energy-related derivatives recorded at fair value at September 30, 2018 are summarized in the following table based on the level of the fair value calculation under ASC Topic 820:
|
| | | | | | | | | | | | | | | | | | | | | | | | | | | |
Midstream Energy Services Segment Maturity of Net Assets (Liabilities) Associated with our Energy-Related Derivatives | | |
| | | |
| (In millions) | 2019 | | 2020 | | 2021 | | 2022 | | 2023 | | Thereafter | | Total |
| Level 1 — Quoted prices in active markets | $ | — |
| | $ | — |
| | $ | — |
| | $ | — |
| | $ | — |
| | $ | — |
| | $ | — |
|
| Level 2 — Significant other observable inputs | (0.1 | ) | | (0.3 | ) | | 0.5 |
| | 0.1 |
| | — |
| | — |
| | 0.2 |
|
| Level 3 — Significant unobservable inputs | 5.2 |
| | 4.6 |
| | 1.0 |
| | (1.3 | ) | | (2.0 | ) | | (6.6 | ) | | 0.9 |
|
| Total net assets associated with our energy-related derivatives | $ | 5.1 |
| | $ | 4.3 |
| | $ | 1.5 |
| | $ | (1.2 | ) | | $ | (2.0 | ) | | $ | (6.6 | ) | | $ | 1.1 |
|
WGL Holdings, Inc.
Washington Gas Light Company
Part II
Item 7. Management’s Discussion and Analysis of
Financial Condition and Results of Operations
Refer to Note 13, Derivative and Weather-Related Instruments and Note 14, Fair Value Measurements of the Notes to Consolidated Financial Statements for a further discussion of our derivative activities and fair value measurements.
Value-at-Risk. WGL Energy Services measures the market risk of its energy commodity portfolio by determining its value-at-risk. Value-at-risk is an estimate of the maximum loss that can be expected at some level of probability if a portfolio is held for a given time period. The value-at-risk calculation for natural gas and electric portfolios include assumptions for normal weather, new customer additions and renewing customers for which supply commitments have been secured. Based on a 95% confidence interval for a one-day holding period, WGL Energy Services’ value-at-risk at September 30, 2018 was approximately $3,900 and $7,200, related to its natural gas and electric portfolios, respectively. The high, low and average value-at-risk for natural gas and electric portfolios between the period October 1, 2017 and September 30, 2018, are noted in the table below.
WGL Energy Services
Value-at-Risk at September 30, 2018
|
| | | | | | | | | | | |
| (In thousands) | High | | Low | | Average |
| Natural Gas Portfolio | $ | 184.0 |
| | $ | 2.2 |
| | $ | 12.1 |
|
| Electric Portfolio | 97.2 |
| | 4.0 |
| | 34.1 |
|
| Total | $ | 281.2 |
| | $ | 6.2 |
| | $ | 46.2 |
|
Weather Risk
We are exposed to various forms of weather risk in both our regulated utility and non-utility business segments. Washington Gas’ operations are seasonal, with a significant portion of its revenues derived from the delivery of natural gas to residential and commercial heating customers during the winter heating season. Weather conditions directly influence the volume of natural gas delivered by Washington Gas. Weather patterns tend to be more volatile during “shoulder” months within our fiscal year in which Washington Gas is going into or coming out of the primary portion of its winter heating season. During the shoulder months within quarters ending December 31, (particularly in October and November) and June 30 (particularly in April and May), customer heating usage may not highly correlate with historical levels or with the level of heating degree days (HDDs) that occur, particularly when weather patterns experienced are not consistently cold or warm.
To the extent Washington Gas does not have weather related instruments or billing adjustment mechanisms in place, its revenues are volume driven and its current rates are based upon an assumption of normal weather. In the District of Columbia, without weather protection strategies, variations from normal weather will cause our earnings to increase or decrease depending on the weather pattern.
The financial results of our retail energy-marketing business, WGL Energy Services, are affected by variations from normal weather primarily in the winter relating to its natural gas sales, and throughout the fiscal year relating to its electricity sales. WGL Energy Services manages these weather risks with, among other things, weather related instruments.
Weather patterns have an effect on WGL Energy Systems solar generation assets to the extent that output is reduced. WGL Energy Systems seeks to mitigate weather risk by negotiating unit contingency and other measures to limit exposure in the PPAs.
Variations from normal weather may also affect the financial results of our wholesale energy business, WGL Midstream, primarily with regards to summer-winter price differentials between time periods and transportation delivery locations throughout the fiscal year. WGL Midstream manages these weather risks with, among other things, physical and financial hedging products.
Billing Adjustment Mechanisms. In Maryland, Washington Gas has a Revenue Normalization Adjustment (RNA) billing mechanism that is designed to stabilize the level of net revenues collected from Maryland2019, approximately 171,000 customers by eliminating the effect of deviations in customer usage caused by variations in weather from normal levels and other factors such as conservation. In Virginia, Washington Gas has a Weather Normalization Adjustment (WNA) billing adjustment mechanism that is designed to eliminate the effect of variations in weather from normal levels on utility net revenues. Additionally, in Virginia, as part of the Conservation and Ratemaking Efficiency (CARE) plan, Washington Gas has a CARE Ratemaking Adjustment (CRA) mechanism that, in conjunction with the WNA, eliminates the effect of both weather and other factors such as conservation for residential, small commercial and industrial and group metered apartment customers.
For the RNA, WNA and CRA mechanisms, periods of colder-than-normal weather generally would cause Washington Gas to record a reduction to its revenues and establish a refund liability to customers, while the opposite would generally result during periods of warmer-than-normal weather. However, factors such as volatile weather patterns and customer conservation may
WGL Holdings, Inc.
Washington Gas Light Company
Part II
Item 7. Management’s Discussion and Analysis of
Financial Condition and Results of Operations
cause the RNA and the CRA mechanisms to function conversely because they adjust billed revenues to provide a designed level of net revenue per meter.
Weather-Related Instruments. WGL Energy Services utilizes HDD instruments from time to time to manage weather and price risks related to its natural gas and electricity sales during the winter heating season. WGL Energy Services also utilizes cooling degree day (CDD) instruments and other instruments to manage weather and price risks related to its electricity sales during the summer cooling season. These instruments cover a portion of estimated revenue or energy-related cost exposure to variations in HDDs or CDDs. Refer to Note 13—Derivative and Weather-Related Instruments of the Notes to Consolidated Financial Statements for further discussion of the accounting for these weather-related instruments.
Interest-Rate Risk
We are exposed to interest-rate risk associated with our short-term and long-term financing. WGL and Washington Gas utilize derivative instruments from time to time in order to reducepurchased their exposure to the risk of interest-rate volatility.
Short-Term Debt. At September 30, 2018, WGL and Washington Gas had outstanding notes payable, including commercial paper and project financing, of $669.7 million and $163.5 million, respectively. At September 30, 2017, WGL and Washington Gas had outstanding notes payable of 559.8 million and 166.8 million, respectively. The carrying amount of our short-term debt approximates fair value. A change of 100 basis points in the underlying average interest rate for our commercial paper would have caused a change in interest expense of approximately $3.9 million and $0.7 million, respectively, for WGL and Washington Gas.
Long-Term Debt. At September 30, 2018 and 2017, WGL had outstanding fixed-rate and variable-rate MTNs and other long-term debt of $1,879.9 million and $1,430.9 million, respectively, excluding current maturities. While fixed-rate debt does not expose us to earnings risk when market interest rates change, such debt is subject to changes in fair value. Fair value is defined as the present value of the debt securities’ future cash flows discounted at interest rates that reflect market conditions as of the measurement date. As of September 30, 2018, the fair value of WGL’s debt was $1,912.8 million. Our sensitivity analysis indicates that fair value would increase by approximately $76.4 million or decrease by approximately $70.1 million if interest rates were to decline or increase by 10%, respectively, from current market levels. At September 30, 2018 and 2017, Washington Gas had outstanding fixed-rate MTNs and other long-term debt of $1,084.9 million and $1,134.5 million, respectively, excluding current maturities. As of September 30, 2018, the fair value of Washington Gas’ fixed-rate debt was $1,120.2 million. Our sensitivity analysis indicates that fair value would increase by approximately $62.9 million or decrease by approximately $57.7 million if interest rates were to decline or increase by 10%, respectively, from current market levels. In general, such an increase or decrease in fair value would impact earnings and cash flows only if WGL or Washington Gas were to reacquire some or all of these instruments in the open market prior to their maturity.
A total of $1,202.5 million, or approximately 63.4% of the face amount of WGL’s outstanding long-term debt, excluding current maturities, have make-whole call options which would require us to pay a premium over the face amount if we were to exercise them.
A total of $952.5 million, or approximately 86.9% of the face amount of Washington Gas’ outstanding long-term debt, excluding current maturities, have make-whole call options which would require us to pay a premium over the face amount if we were to exercise them.
Derivative Instruments. In anticipation of the issuance of 30-year debt, WGL entered into forward starting interest rate swaps with a total notional amount outstanding of $250.0 million, to hedge the variability in future interest payments. WGL designated these interest rate swaps as cash flow hedges. Through December 31, 2016, the effective portion of changes in fair value was reported as a component of other comprehensive income (loss). As a result of certain covenants related to the proposed merger with AltaGas, in January 2017, WGL de-designated these hedges and began recording charges in their fair value in interest expense. Subsequent to the Merger on July 6, 2018, the debt issuance is no longer reasonably possible of occurring and, therefore, the $6.4 million net of tax gain recorded in accumulated other comprehensive was recorded to income during the quarter ended September 30, 2018. In January 2018, WGL settled these swaps and realized a gain of $13.8 million. For the twelve months ended September 30, 2018, we recorded income of $19.4 million to interest expense related to these swaps.
Refer to Note 13 - Derivative and Weather-Related Instruments of the Notes to Consolidated Financial Statements for a further discussion of our interest-rate risk management activity.
WASHINGTON GAS LIGHT COMPANY
This section of Management’s Discussion focuses on Washington Gas for the reported periods. In many cases, explanations and disclosures for both WGL and Washington Gas are substantially the same.
RESULTS OF OPERATIONS
WGL Holdings, Inc.
Washington Gas Light Company
Part II
Item 7. Management’s Discussion and Analysis of
Financial Condition and Results of Operations
The results of operations for the regulated utility segment and Washington Gas are substantially the same; therefore, this section primarily focuses on statistical information and other information that is not discussed in the results of operations for the regulated utility segment. Refer to the section entitled “Results of Operations—Regulated Utility” for a detailed discussion of the results of operations for the regulated utility segment.
Key gas delivery, weather and meter statistics are shown in the table below for the fiscal years ending September 30, 2018, 2017 and 2016.
|
| | | | | | | | | | | | | | |
| Gas Deliveries, Weather and Meter Statistics |
| | Years Ended September 30, | | Increase (decrease) |
| | 2018 | | 2017 | | 2016 | | 2018
vs. 2017 | | 2017
vs. 2016 |
Gas Sales and Deliveries (millions of therms) | | | | | | | | | |
| Firm | | | | | | | | | |
| Gas sold and delivered | 917.3 |
| | 774.8 |
| | 758.4 |
| | 142.5 |
| | 16.4 |
|
| Gas delivered for others | 538.3 |
| | 495.0 |
| | 501.0 |
| | 43.3 |
| | (6.0 | ) |
| Total firm | 1,455.6 |
| | 1,269.8 |
| | 1,259.4 |
| | 185.8 |
| | 10.4 |
|
| Interruptible | | | | | | | | | |
| Gas sold and delivered | 2.5 |
| | 2.6 |
| | 2.8 |
| | (0.1 | ) | | (0.2 | ) |
| Gas delivered for others | 248.2 |
| | 242.5 |
| | 239.0 |
| | 5.7 |
| | 3.5 |
|
| Total interruptible | 250.7 |
| | 245.1 |
| | 241.8 |
| | 5.6 |
| | 3.3 |
|
| Electric generation—delivered for others | 180.6 |
| | 87.6 |
| | 291.3 |
| | 93.0 |
| | (203.7 | ) |
| Total deliveries | 1,886.9 |
| | 1,602.5 |
| | 1,792.5 |
| | 284.4 |
| | (190.0 | ) |
| Degree Days | | | | | | | | | |
| Actual | 3,759 |
| | 3,127 |
| | 3,341 |
| | 632 |
| | (214 | ) |
| Normal | 3,944 |
| | 3,717 |
| | 3,730 |
| | 227 |
| | (13 | ) |
| Percent colder (warmer) than normal | (4.7 | )% | | (15.9 | )% | | (10.4 | )% | | n/a |
| | n/a |
|
| Average active customer meters | 1,173,000 |
| | 1,155,000 |
| | 1,142,000 |
| | 18,000 |
| | 13,000 |
|
| Ending active customer meters | 1,177,976 |
| | 1,163,655 |
| | 1,144,160 |
| | 14,321 |
| | 19,495 |
|
| New customer meters added | 12,581 |
| | 12,488 |
| | 12,221 |
| | 93 |
| | 267 |
|
Gas Service to Firm Customers
The volume of gas delivered to firm customers is highly sensitive to weather variability as a large portion of the natural gas delivered by Washington Gas is used for space heating. Washington Gas’ rates are based on an assumption of normal weather. The tariffs in the Maryland and Virginia jurisdictions include provisions that consider the effects of the RNA and the WNA/CRA mechanisms, respectively, that are designed to, among other things, eliminate the effect on net revenues of variations in weather from normal levels (refer to the section entitled “Weather Risk” for a further discussion of these mechanisms and other weather-related instruments included in our weather protection strategy).
Fiscal Year 2018 vs. Fiscal Year 2017. During the fiscal year ended 2018, the comparison in natural gas deliveries to firm customers primarily reflects 4.7% warmer than normal weather when measured by HDDs, compared to 15.9% warmer than normal weather for fiscal year 2017. We also had an increase in average active customer meters of approximately 18,000 in fiscal year 2018, when compared to fiscal year 2017.
Many customers choose to buy the natural gas commodity from unregulated third-party marketers, rather than purchase the natural gas commodity and delivery service from Washington Gas on a “bundled” basis. Natural gas delivered to firm customers but purchased from unregulated third-party marketers represented 37.0% of total firm therms delivered during fiscal year 2018, compared to 39.0% of therms delivered during fiscal year 2017. On a per unit basis, Washington Gas earns the same net revenues from delivering gas for others as it earns from bundled gas sales in which customers purchase both the natural gas
WGL Holdings, Inc.
Washington Gas Light Company
Part II
Item 7. Management’s Discussion and Analysis of
Financial Condition and Results of Operations
commodity and the associated delivery service from Washington Gas. Therefore, Washington Gas does not experience any loss in utility net revenues when customers choose to purchase the natural gas commodity from an unregulated third-party marketer.
Fiscal Year 2017 vs. Fiscal Year 2016. During the fiscal year ended 2017, the comparison in natural gas deliveries to firm customers primarily reflects 15.9% warmer than normal weather when measured by HDDs, compared to 10.4% warmer than normal weather for fiscal year 2016. This was partially offset by an increase in average active customer meters of approximately 13,000 in fiscal year 2017, when compared to fiscal year 2016.
Natural gas delivered to firm customers but purchased from unregulated third-party marketers represented 39.0% of total firm therms delivered during fiscal year 2017, compared to 39.8% of therms delivered during fiscal year 2016.marketers.
Gas Service to Interruptible Customers
Washington Gas must curtail or interrupt service to this class of customer when the demand by firm customers exceeds specified levels. Therm deliveries to interruptible customers increased by 5.613.9 million therms in fiscalduring the calendar year 2018ended December 31, 2019 compared to fiscalthe prior year 2017 primarily due to increased demand and colder weather during fiscal year 2018. Therm deliveries to interruptible customers increased by 3.3 million therms in fiscal year 2017 compared to fiscal year 2016 primarily due to increased demand, partially offset by warmer weather during fiscal year 2017.2019.
In the District of Columbia, the effect on net income of any changes in delivered volumes and prices to interruptible customers is limited by margin-sharing arrangements that are included in Washington Gas’ firm rate designs. Rates for interruptible customers in Maryland and Virginia are based on a traditional cost of service approach. In Virginia, Washington Gas retains a majority of the margins earned on interruptible gas and delivery sales. Washington Gas shares actual non-gas margins from interruptible sales service customers that are in excess of delivery service rates. In Maryland, Washington Gas retains a defined amount of revenues based on a set threshold. Effective December 2018, Washington Gas no longer shares interruptible margins in Maryland.
Gas Service for Electric Generation
Washington Gas delivers natural gas for use at two electric generation facilities in Maryland that are each owned by companies independent of WGL. During fiscalthe calendar year 2018, deliveries to these customers increased by 93.0 million therms from fiscal year 2017. During fiscal year 2017,ended December 31, 2019, deliveries to these customers decreased by 203.7105.8 million therms from fiscalthe calendar year 2016.2018. Washington Gas shares with firm customers a significant majority of the margins earned from natural gas deliveries to these customers. Therefore, changes in the volume of interruptible gas deliveries to these customers do not materially affect either net revenues or net income.
Cost of Gas
Washington Gas’ cost of natural gas purchased includes both fixed and variable components. Washington Gas pays fixed costs or “demand charges” to pipeline companies for system capacity needed to transport and store natural gas. Washington Gas pays variable costs, or the cost of the natural gas commodity itself, to natural gas producers and suppliers. Variations in the utility’s cost of gas expense result from changes in gas sales volumes, the price of the gas purchased and the level of gas costs collected through the operation of firm gas cost recovery mechanisms. Under these regulated recovery mechanisms, Washington Gas records cost of gas expense equal to the cost of gas recovered from customers and included in revenues. The difference between the firm gas costs incurred and the gas costs recovered from customers is deferred on the balance sheet as an amount to be collected from or refunded to customers in future periods. Therefore, increases or decreases in the cost of gas associated with sales made to firm customers have no direct effect on Washington Gas’ net revenues and net income. Changes in the cost of gas can cause significant variations in Washington Gas’ cash provided by or used in operating activities. Washington Gas receives from or pays to its customers in the District of Columbia and Virginia, carrying costs associated with under-collected or over-collected gas costs recovered from its customers using short-term interest rates. Additionally, included in “Utility cost of gas” for Washington Gas are the net margins associated with our asset optimization program. To the extent these amounts are shared with customers, they are a reduction to the cost of gas invoiced to customers. Refer to the section entitled “Market Risk” for a further discussion of Washington Gas’ optimization program.
The average commodity cost of gas invoiced to Washington Gas (excluding the cost and related volumes applicable to asset optimization) were $0.28, $0.37, $0.30, $0.27, and $0.21$0.27 per therm for fiscal yearsthe calendar year ended December 31, 2019, three months ended December 31, 2018, 2017 and 2016, respectively.
Interest Expense
The following table shows the components of Washington Gas' interest expense for thefiscal years ended September 30, 2018 and 2017, respectively.
Liquidity and 2016.Capital Resources
General Factors Affecting Liquidity
WGL Holdings, Inc.Washington Gas generally meets its liquidity and capital needs through cash on hand, retained earnings, the issuance of commercial paper and long-term debt, and equity infusions from its parent holding companies, routed through Wrangler. Access to short-term debt markets is necessary for funding our short-term liquidity requirements, the most significant of which include buying natural gas and pipeline capacity, and financing both accounts receivable and storage gas inventory. We have accessed long-term capital markets primarily to fund capital expenditures and retire long-term debt. Under the Merger commitments agreed to by AltaGas and Washington Gas during the Merger and other rules imposed by regulatory commissions or laws in Washington Gas’ service territory, the Company is prohibited and/or restricted in its ability to make advances or issue loans to an affiliate or parent holding company without prior regulatory commission approval.
Our plans provide sufficient liquidity to satisfy our financial obligations. Generally, pursuant to its Merger commitments, Washington Gas can make dividend payments in the ordinary course of business unless any of the following regulatory
Washington Gas Light Company
Part II
Item 7. Management’s Discussion and Analysis of
Financial Condition and Results of Operations (continued)
limitations apply: (i) Washington Gas will not pay extraordinary dividends to its parent for three years from the date of the Merger close, (ii) Washington Gas will not pay dividends to its parent company if Washington Gas’ senior unsecured debt rating is below investment grade or (iii) Washington Gas will not make a dividend payment to its parent company if the payment would result in its equity level to drop below 48%. At December 31, 2019, we had no significant restrictions on our cash balances or retained earnings that would affect the payment of dividends.
Short-Term Cash Requirements and Related Financing
Washington Gas has seasonal short-term cash requirements to fund the purchase of storage gas inventory in advance of the winter heating season. The Company collects the cost of gas under cost recovery mechanisms approved by our regulators.
In the first and fourth quarters of each calendar year, Washington Gas’ large sales volumes cause its cash requirements to peak when combined storage inventory, accounts receivable, and unbilled revenues are at their highest levels. In the second and third quarters of each calendar year, after the heating season, Washington Gas typically experiences a seasonal net loss due to reduced demand for natural gas. During this period, large amounts of Washington Gas’ current assets are converted to cash.
Washington Gas uses short-term debt in the form of commercial paper or unsecured short-term bank loans to fund seasonal cash requirements. Our policy is to maintain back-up bank credit facilities in an amount equal to or greater than our expected maximum commercial paper position. In December 2019, we classified $100.0 million commercial paper balance as "Long-term debt" on Washington Gas' balance sheets due to its ability and intent to refinance these balances on a long-term basis.
On July 19, 2019, Washington Gas entered into an amended and restated senior unsecured revolving credit facility with a term of five years, plus two one-year extension options, available with the bank group’s approval (the Credit Facility). The Credit Facility amended and restated Washington Gas’ prior $350 million credit facility and permits Washington Gas to borrow up to $450 million with an option to increase the facility by an additional $100 million with the bank group’s approval, for a total potential maximum borrowing of $550 million. The interest rate of loans made under the credit facilities will be a fluctuating rate per annum that will be set using certain parameters at the time each loan is made. Bank credit balances available to Washington Gas under the existing credit facility, net of commercial paper balances were $50.0 million and $54.0 million at December 31, 2019 and 2018, respectively.
Long-Term Cash Requirements and Related Financing
The primary drivers of our long-term cash requirements are capital expenditures and long-term debt maturities. Our capital expenditures primarily relate to adding new utility customers and system supply and maintaining the safety and reliability of Washington Gas’ distribution system.
Security Ratings
On December 11, 2019, Standard & Poor’s Rating Services (S&P) revised its outlook on AltaGas from negative to stable, and raised the senior unsecured debt credit rating for Washington Gas from BBB+ to A- and its outlook from negative to stable. Washington Gas has ring fencing measures in place that financially separate Washington Gas from WGL, AltaGas and its affiliates as a way to protect its consumers from financial instability or bankruptcy that may be experienced by Washington Gas' parents or affiliates. S&P views the ring-fencing provisions sufficient to insulate Washington Gas from AltaGas and its other subsidiaries to warrant three-notches of ratings separation between Washington Gas and AltaGas. The credit rating for Washington Gas' commercial paper remained at A-2.
On January 30, 2020, Moody's Investors Service (Moody's) downgraded the ratings of Washington Gas' senior unsecured debt credit rating to A3 from A2 and its commercial paper rating to P-2 from P-1. The outlook for Washington Gas is stable. Moody's affirmed the ratings of WGL's Baa1 for senior unsecured rating and P-2 commercial paper rating and changed its outlook to stable from negative.
The table below reflects the credit ratings for the outstanding debt instruments of Washington Gas as of December 31, 2019. |
| | | | |
| | | | |
| Rating Service | | Senior Unsecured | | Commercial Paper |
Fitch Ratings(a) | | A | | F2 |
| Moody’s Investors Service | | A3 | | P-2 |
| Standard & Poor’s Ratings Services | | A- | | A-2 |
(a) The credit ratings by Fitch Ratings for Washington Gas were revised on July 10, 2018 and the long-term debt ratings outlook was adjusted to stable.
.
Ratings Triggers and Certain Debt Covenants
Washington Gas Light Company
Part II
Item 7. Management’s Discussion and Analysis of
Financial Condition and Results of Operations (continued)
Under the terms of Washington Gas' revolving credit agreements and private placement notes, the ratio of consolidated financial indebtedness to consolidated total capitalization cannot exceed 0.65 to 1.0 (65.0%). At December 31, 2019 and 2018, Washington Gas' ratios of consolidated financial indebtedness to consolidated total capitalization were 52% and 47%, respectively. In addition, Washington Gas is required to inform lenders of changes in corporate existence, financial conditions, litigation and environmental warranties that might have a material effect on debt ratings. The failure to inform the lenders’ agent of material changes in these areas might constitute default under the agreements. Additionally, failure to pay principal or interest on any other indebtedness may be deemed a default under our credit agreements. A default, if not remedied, may lead to a suspension of further loans and/or acceleration in which obligations become immediately due and payable. In addition, certain of the credit facilities of Washington Gas contain cross-default provisions. At December 31, 2019 and 2018, we were in compliance with all of the covenants under our revolving credit facilities, term loan facility, and private placement notes.
Historical Cash Flows
The following table summarizes Washington Gas' net cash provided by (used in) operating, investing and financing activities for calendar years ended December 31, 2019 and 2018, three months ended December 31, 2018 and 2017, and fiscal years ended September 30, 2018 and 2017:
|
| | | | | | | | | | | | | | | | | | | | | | | | | | | |
| | Calendar Years Ended December 31, | Three Months Ended
December 31, | Fiscal Years Ended September 30, | Increase / (Decrease) |
| (In millions) | 2019 | 2018 (Unaudited) | 2018 | 2017 (Unaudited) | 2018 | 2017 | Calendar year | Three Months | Fiscal year |
2019 vs. 2018 | 2018 vs. 2017 | 2018 vs. 2017 |
| Cash provided by (used in): | | | | | | | | | . |
| Operating activities | $ | 203.3 |
| $ | 56.3 |
| $ | (94.5 | ) | $ | (28.5 | ) | $ | 122.3 |
| $ | 207.3 |
| $ | 147.0 |
| $ | (66.0 | ) | $ | (85.0 | ) |
| Financing activities | $ | 219.4 |
| $ | 448.8 |
| $ | 226.9 |
| $ | 110.4 |
| $ | 332.3 |
| $ | 196.1 |
| $ | (229.4 | ) | $ | 116.5 |
| $ | 136.2 |
|
| Investing activities | $ | (433.0 | ) | $ | (440.3 | ) | $ | (126.0 | ) | $ | (75.3 | ) | $ | (389.6 | ) | $ | (403.4 | ) | $ | 7.3 |
| $ | (50.7 | ) | $ | 13.8 |
|
Cash Flows Provided by Operating Activities
Washington Gas' cash flows from operating activities principally reflect gas sales and deliveries and the cost of operations. Cash flow provided by operating activities was $203.3 million for the calendar year 2019, a $147.0 million increase from calendar year 2018. The increase was mainly driven by decreased cash payments for Merger commitments and related costs due to the Merger in 2018.
Cash Flows Provided by Financing Activities
Net cash flows provided by financing activities was $219.4 million in the calendar year 2019 compared to $448.8 million in 2018. The $219.4 million cash flows from financing activities in 2019 was mainly driven by $298.5 million proceeds from issuance of medium-term note in September 2019, $103.5 million net proceeds from commercial paper borrowings, offset by $50.0 million long-term debt repayment and $100.7 million in dividend payments on preferred and common stocks. Additionally, we paid $28.7 million to redeem three outstanding series of preferred stock in December 2019. The $448.8 million cash flows from financing activities in 2018 was mainly driven by $402.7 million capital infusion from our parent company, $134.0 million net proceeds from short-term borrowings, offset by $50 million long-term debt repayment and $90.8 million dividend payments on preferred and common stocks in 2018.
Washington Gas Light Company
Part II
Item 7. Management’s Discussion and Analysis of
Financial Condition and Results of Operations (continued)
Cash Flows Used in Investing Activities
Net cash flows used in investing activities totaled $433.0 million and $440.3 million for the calendar years ended December 31, 2019 and 2018, respectively, which primarily consists of capital expenditures made by Washington Gas.
The following table depicts our actual capital expenditures for calendar years ended December 31, 2019 and 2018, three months ended December 31, 2018, and for the fiscal years ended September 30, 2018 and 2017. Our capital outlays include expenditures to extend service to new areas, and to ensure safe, reliable and improved service for our utility.
|
| | | | | | | | | | | | | | | | | | |
| Capital Expenditures |
| | Calendar Years Ended December 31, | Three Months Ended December 31 | Fiscal Years Ended September 30, |
| (In millions) | 2019 | 2018 | 2018 | 2017 | 2018 | 2017 |
New business(a) | $ | 135.1 |
| $ | 149.3 |
| $ | 33.2 |
| $ | 24.2 |
| $ | 141.3 |
| $ | 129.4 |
|
| Replacements: | | | | | | |
Accelerated Replacement Programs(b) | 167.1 |
| 124.3 |
| 31.8 |
| 24.4 |
| 111.7 |
| 131.0 |
|
| Other | 87.8 |
| 92.9 |
| 22.6 |
| 10.4 |
| 70.5 |
| 68.1 |
|
| Customer information system | — |
| — |
| — |
| — |
| — |
| 28.1 |
|
| Other utility | 43.0 |
| 77.0 |
| 16.8 |
| 4.5 |
| 72.3 |
| 40.4 |
|
| Cash basis adjustments | — |
| — |
| 21.6 |
| 11.8 |
| (3.0 | ) | 6.4 |
|
Total (c) | $ | 433.0 |
| $ | 443.5 |
| $ | 126.0 |
| $ | 75.3 |
| $ | 392.8 |
| $ | 403.4 |
|
(a) Includes certain projects that support the existing distribution system.
(b)Represents capital expenditures (excluding cost of removal), both approved, and expected to be approved, under our Accelerated Pipeline Replacement Programs in all jurisdictions. Refer to the section entitled "Accelerated Pipeline Replacement Programs" for a further discussion.
(c)Excludes Allowance for Funds Used During Construction and cost of removal.
Accelerated Pipe Replacement Programs (APRPs). APRPs are in place in all three of our jurisdictions. Washington Gas is accelerating pipe replacement in order to reduce risk and further enhance the safety and reliability of the pipeline system. Each regulatory commission having jurisdiction over Washington Gas’ retail rates has APRPs with an associated surcharge mechanism to recover the cost, including a return, on those capital investments between base rate cases. In contrast to the traditional rate-making approach to capital investments, for the APRPs, Washington Gas is receiving recovery for these investments through the approved surcharges for each program and is authorized to invest in each of these programs over a five-year period. The following table summarizes the status of our current accelerated pipe replacement programs in three of
Washington Gas Light Company
Part II
Item 7. Management’s Discussion and Analysis of
Financial Condition and Results of Operations (continued)
|
| | | |
| Jurisdiction | Estimated Cost | Status | Expected in-service date |
| District of Columbia | Estimated $305 million over the five-year period from April 2020 to December 2024, plus additional expenditures in subsequent periods.
| Washington Gas has submitted an application for the second phase of PROJECT pipes to the Public Service Commission of the District of Columbia (PSC of DC). In the interim, Phase 1 has been extended to March 31, 2020 for an amount not to exceed $12.5 million. | Individual assets are placed into service throughout the program.
|
| Maryland | Estimated $350 million over the five-year period from January 2019 to December 2023, plus additional expenditures in subsequent periods.
| The second phase of the accelerated utility pipe replacement programs in Maryland (STRIDE 2.0) began in January 2019.
| Individual assets are placed into service throughout the program.
|
| Virginia | Estimated $500 million over the five-year period from January 2018 to December 2022, including cost of removal, plus additional expenditures in subsequent periods. | The second phase of the accelerated pipe replacement programs in Virginia (SAVE 2.0) began in January 2018.
| Individual assets are placed into service throughout the program.
|
Refer to "Rates and Regulatory Matters" for a further discussion on rate case decisions during the periods including the transfer of costs from surcharge to base rate recovery.
Contractual Obligations, Off-Balance Sheet Arrangements and Other Commitments.
Contractual Obligations
Washington Gas has certain contractual obligations incurred in the normal course of business that require fixed and determinable payments in the future. These commitments include long-term debt, unconditional purchase obligations for pipeline capacity, transportation and storage services, certain natural gas commodity commitments and our commitments related to the business process outsourcing program. In addition, Washington Gas has made certain commitments related to the Merger with AltaGas.
The total contractual obligations and commitments for Washington Gas at December 31, 2019 for future calendar years are shown below.
|
| | | | | | | | | | | | | | | | | | | | | | | | | | | |
Estimated Contractual Obligations and Commitments(g) |
| Years Ended December 31, | | | | |
| (In millions) | 2020 | | 2021 | | 2022 | | 2023 | | 2024 | | Thereafter | | Total |
Pipeline and storage contracts(a) | $ | 272.7 |
| | $ | 259.5 |
| | $ | 254.4 |
| | $ | 245.2 |
| | $ | 212.8 |
| | $ | 791.4 |
| | $ | 2,036.0 |
|
Long-term debt(b) | — |
| | — |
| | — |
| | 20.0 |
| | 100.0 |
| | 1,326.0 |
| | 1,446.0 |
|
Interest expense(c) | 60.8 |
| | 60.8 |
| | 60.8 |
| | 59.8 |
| | 59.5 |
| | 965.9 |
| | 1,267.6 |
|
Gas purchase commitments(d) | 314.4 |
| | 356.6 |
| | 340.6 |
| | 317.9 |
| | 321.0 |
| | 1,969.8 |
| | 3,620.3 |
|
| Operating leases | 6.0 |
| | 5.6 |
| | 5.5 |
| | 5.5 |
| | 5.6 |
| | 46.3 |
| | 74.5 |
|
Business process outsourcing(e) | 21.9 |
| | 12.7 |
| | 4.0 |
| | 0.5 |
| | — |
| | — |
| | 39.1 |
|
Environmental(f) | 5.0 |
| | 3.3 |
| | 0.8 |
| | 0.8 |
| | 0.5 |
| | 0.3 |
| | 10.7 |
|
Merger commitments(g) | 6.3 |
| | 2.9 |
| | 1.5 |
| | 1.5 |
| | 1.5 |
| | 3.3 |
| | 17.0 |
|
| Total | $ | 687.1 |
|
| $ | 701.4 |
|
| $ | 667.6 |
|
| $ | 651.2 |
|
| $ | 700.9 |
|
| $ | 5,103.0 |
|
| $ | 8,511.2 |
|
(a)Represents minimum payments for natural gas transportation, storage and peaking contracts.
(b)Represents scheduled repayment of principal.
(c)Represents the scheduled interest payments associated with long-term debt.
Washington Gas Light Company
Part II
Item 7. Management’s Discussion and Analysis of
Financial Condition and Results of Operations (continued)
(d)Includes known and reasonably likely commitments to purchase fixed volumes of natural gas. Cost estimates are based on forward market prices at December 31, 2019. Certain of our gas purchase agreements have optionality, which may cause increases in these commitments.
(e) Represents fixed costs to service providers related to various contracts for business process outsourcing.
(f) Includes committed payments related to certain environmental response costs.
(g)Represents the estimated future payments of Merger commitments that has been accrued but not paid. At December 31, 2019, the cumulative amount of merger commitments that has been expensed was $136.6 million, of which $17.0 million has not been paid. In addition, there are certain regulatory commitments that were and will be expensed as the costs are incurred, including the hiring of damage prevention trainers in each jurisdiction for a total of $2.4 million over 5 years; investing up to $70.0 million over a 10 year period to further extend natural gas service; and spending $8.0 million for leak mitigation within 3 years after the Merger close.
The table above reflects fixed and variable obligations. Certain of these estimates reflect likely purchases under various contracts and may differ from minimum future contractual commitments disclosed inNote 13 — Commitments and Contingencies of the Notes to Financial Statements.
For commitments related to Washington Gas’ pension and post-retirement benefit plans, refer to Note 10 — Pension and Other Post-Retirement Benefit Plans of the Notes to Financial Statements.
Credit Risk
Wholesale Credit Risk
Washington Gas enters into transactions with wholesale counterparties for the purpose of meeting firm ratepayer commitments, to optimize the value of its long-term capacity assets, and for hedging natural gas costs. Certain wholesale suppliers that sell natural gas to Washington Gas may have relatively low credit ratings or may not be rated by major credit rating agencies. In the event of a counterparty’s failure to deliver contracted volumes of gas or fulfill its payment obligations, Washington Gas may incur losses that would typically be passed through to its sales customers under the purchased gas cost adjustment mechanisms; however, Washington Gas may be at risk for financial loss to the extent these losses are not passed through to its customers.
Washington Gas operates under an existing wholesale counterparty credit policy that is designed to mitigate credit risks through requirements for credit enhancements including, but not limited to, letters of credit, parent guarantees and cash collateral when deemed necessary. In accordance with this policy, Washington Gas has obtained credit enhancements from certain of its counterparties. If certain counterparties or their guarantors meet the policy’s creditworthiness criteria, Washington Gas may grant unsecured credit to those counterparties or their guarantors. The creditworthiness of all counterparties is continuously monitored.
The following table provides information on our credit exposure, net of collateral, to wholesale counterparties as of December 31, 2019.
|
| | | | | | | | | | | | | | | | | | |
Credit Exposure to Wholesale Counterparties (In millions) |
Rating(a) | Exposure Before Credit Collateral(b) | | Offsetting Credit Collateral Held(c) | | Net Exposure | | Number of Counterparties Greater Than 10%(d) | | Net Exposure of Counterparties Greater Than 10% |
| | | | | | | | | | |
| Investment Grade | $ | 36.0 |
| | $ | — |
| | $ | 36.0 |
| | 2 |
| | $ | 20.3 |
|
| Non-Investment Grade | — |
| | — |
| | — |
| | — |
| | — |
|
| No External Ratings | 9.3 |
| | 2.4 |
| | 6.9 |
| | 1 |
| | 5.4 |
|
(a) Investment grade is primarily determined using publicly available credit ratings of the counterparty. If the counterparty has provided a guarantee by a higher-rated entity (e.g., its parent), it is determined based upon the rating of its guarantor. Included in “Investment grade” are counterparties with a minimum Standard & Poor’s or Moody’s Investor Service rating of BBB- or Baa3, respectively.
(b) Includes the net of all open positions on energy-related derivatives subject to mark-to-market accounting requirements and the net receivable/payable for the realized transactions. Amounts due from counterparties are offset by liabilities payable to those counterparties to the extent that contractual netting arrangements are in place.
(c) Represents cash deposits and letters of credit received from counterparties, not adjusted for probability of default.
(d) Using a percentage of the net exposure.
Retail Credit Risk
Washington Gas is at risk of non-payment of utility bills by customers. To manage this customer credit risk, Washington Gas may require cash deposits from high risk customers to cover payment of their bills until the requirements for the deposit refunds are met. Base rates include a provision for recovery of uncollectible accounts based on historical levels of charge offs of accounts receivable. Washington Gas also has a provision in its Gas Administrative Charge mechanism that includes an
Washington Gas Light Company
Part II
Item 7. Management’s Discussion and Analysis of
Financial Condition and Results of Operations (continued)
allowance for commodity amounts included in uncollectible accounts. In addition, Washington Gas has a POR program in Maryland and the District of Columbia, whereby it purchases receivables from participating energy marketers at approved discount rates, which incorporates the risk of non-payment by the retail customers for these receivables.
Market Risk
We are exposed to various forms of market risk including commodity price risk, weather risk and interest-rate risk. The following discussion describes these risks and our management of them.
Price Risk
Washington Gas faces price risk associated with the purchase and sale of natural gas. Washington Gas generally recovers the cost of the natural gas to serve customers through gas cost recovery mechanisms as approved in jurisdictional tariffs; therefore, a change in the price of natural gas generally has no direct effect on Washington Gas’ net income. However, Washington Gas is responsible for following competitive and reasonable practices in purchasing natural gas for its customers.
To manage price risk associated with its natural gas supply to its firm customers, Washington Gas: (i) actively manages its gas supply portfolio to balance sales and delivery obligations; (ii) injects natural gas into storage during the summer months when prices are generally lower, and withdraws that gas during the winter heating season when prices are generally higher and (iii) enters into hedging contracts and other contracts that may qualify as derivative instruments related to the sale and purchase of natural gas.
Washington Gas executes commodity-related physical and financial contracts in the form of forward, futures and option contracts as part of an asset optimization program that is managed by its internal staff. Under this program, Washington Gas realizes value from its long-term natural gas transportation and storage capacity resources when they are not being fully used to serve utility customers. Regulatory sharing mechanisms in all three jurisdictions allow the profit from these transactions to be shared between Washington Gas’ customers and shareholders.
The following two tables summarize the changes in the fair value of our net assets (liabilities) associated with the energy-related derivatives during the calendar year ended December 31, 2019.
|
| | | |
| Changes in Fair Value of Energy-Related Derivatives |
| (In millions) | |
| Net assets (liabilities) at January 1, 2019 | $ | (106.3 | ) |
| Net fair value of contracts entered into during the period | (8.4 | ) |
| Other changes in net fair value | 27.9 |
|
| Realized net settlement of derivatives | (4.2 | ) |
| Net assets (liabilities) at December 31, 2019 | $ | (91.0 | ) |
|
| | | |
Roll Forward of Energy-Related Derivatives |
| (In millions) | |
| Net assets (liabilities) at January 1, 2019 | $ | (106.3 | ) |
| Recorded to income | 5.5 |
|
| Recorded to regulatory assets/liabilities | 14.0 |
|
| Realized net settlement of derivatives | (4.2 | ) |
| Net assets (liabilities) at December 31, 2019 | $ | (91.0 | ) |
The maturity dates in calendar years of our net assets (liabilities) associated with the energy-related derivatives recorded at fair value at December 31, 2019, is summarized in the following table based on the level of the fair value calculation under Accounting Standards Codification (ASC) Topic 820.
Washington Gas Light Company
Part II
Item 7. Management’s Discussion and Analysis of
Financial Condition and Results of Operations (continued)
|
| | | | | | | | | | | | | | | | | | | |
| Composition of Interest Expense |
| Years Ended September 30, | | Increase (Decrease) |
| (In millions) | 2018 | | 2017 | | 2016 | | 2018
vs. 2017 | | 2017
vs. 2016 |
| Interest on long-term debt | $ | 57.6 |
| | $ | 50.1 |
| | $ | 40.7 |
| | $ | 7.5 |
| | $ | 9.4 |
|
| Interest on short-term debt | 1.1 |
| | 1.6 |
| | 0.7 |
| | (0.5 | ) | | 0.9 |
|
| Other net, including AFUDC | (0.2 | ) | | 0.5 |
| | — |
| | (0.7 | ) | | 0.5 |
|
| Total | $ | 58.5 |
| | $ | 52.2 |
| | $ | 41.4 |
| | $ | 6.3 |
| | $ | 10.8 |
|
|
| | | | | | | | | | | | | | | | | | | | | | | | | | | |
Maturity of Net Assets (Liabilities) Associated with our Energy-Related Derivatives | | |
| | | |
| (In millions) | 2020 | | 2021 | | 2022 | | 2023 | | 2024 | | Thereafter | | Total |
| Level 1 — Quoted prices in active markets | $ | — |
| | $ | — |
| | $ | — |
| | $ | — |
| | $ | — |
| | $ | — |
| | $ | — |
|
| Level 2 — Significant other observable inputs | (6.7 | ) | | 0.5 |
| | — |
| | — |
| | — |
| | — |
| | (6.2 | ) |
| Level 3 — Significant unobservable inputs | 2.9 |
| | 2.8 |
| | (0.3 | ) | | (2.2 | ) | | (3.4 | ) | | (84.6 | ) | | (84.8 | ) |
| Total net assets (liabilities) associated with our energy-related derivatives | $ | (3.8 | ) | | $ | 3.3 |
| | $ | (0.3 | ) | | $ | (2.2 | ) | | $ | (3.4 | ) | | $ | (84.6 | ) | | $ | (91.0 | ) |
Income Taxes
The following table shows Washington Gas' income tax expense and effective income tax rate for the years ended September 30, 2018, 2017 and 2016. The decrease in income tax expense for fiscal year 2018 compared to fiscal year 2017 is due to the enactment of the Tax Act resulting in a re-measurement of our accumulated deferred income taxes and the reduction of the corporate federal income tax rate for 2018 to 21%. The decrease in the effective income tax rate for fiscal year 2017 compared to prior year is related to a tax sharing agreement among WGL's subsidiaries.
|
| | | | | | | | | | | | | | | | | | | |
| Income Taxes |
| Years Ended September 30, | | Increase (Decrease) |
| (In millions) | 2018 | | 2017 | | 2016 | | 2018
vs. 2017 | | 2017
vs. 2016 |
| Income before income taxes | $ | (52.5 | ) | | $ | 211.6 |
| | $ | 184.8 |
| | $ | (264.1 | ) | | $ | 26.8 |
|
| Income tax expense | (25.9 | ) | | 79.8 |
| | 71.7 |
| | (105.7 | ) | | 8.1 |
|
| Effective income tax rate | 49.3 | % | | 37.7 | % | | 38.8 | % | | 11.6 | % | | (1.1 | )% |
| Income tax expense | (25.9 | ) | | 79.8 |
| | 71.7 |
| | (105.7 | ) | | 8.1 |
|
| Less re-measurement impact of Tax Act | 7.0 |
| | — |
| | — |
| | 7.0 |
| | — |
|
| Income tax expense excluding re-measurement impact | (32.9 | ) | | 79.8 |
| | 71.7 |
| | (112.7 | ) | | 8.1 |
|
| Effective income tax rate excluding re-measurement impact | 62.7 | % | | 37.7 | % | | 38.8 | % | | 25.0 | % | | (1.1 | )% |
Refer to Note 814 — Income TaxesDerivatives and Note 15 — Fair Value Measurements of the Notes to the Consolidated Financial Statements for details.a further discussion of our derivative activities and fair value measurements.
Weather Risk
The Company is exposed to various forms of weather risk due to seasonal operations, with a significant portion of its revenues derived from the delivery of natural gas to residential and commercial heating customers during the winter heating season. Weather conditions directly influence the volume of natural gas delivered by Washington Gas. Weather patterns tend to be more volatile during “shoulder” months within our calendar year in which Washington Gas is going into or coming out of the winter heating season. During the shoulder months within quarters ending June 30 (particularly in April and May) and December 31 (particularly in October and November), customer heating usage may not highly correlate with historical levels or with the level of heating degree days that occur, particularly when weather patterns experienced are not consistently cold or warm.
Washington Gas does not have a weather related instrument or billing adjustment mechanism in the District of Columbia and as a result, its revenues are volume driven and current rates are based upon an assumption of normal weather. Without weather protection strategies, variations from normal weather will cause our earnings to increase or decrease depending on the weather pattern.
Billing Adjustment Mechanisms. In Maryland, Washington Gas has an RNA billing mechanism that is designed to stabilize the level of net revenues collected from Maryland customers by eliminating the effect of deviations in customer usage caused by variations in weather from normal levels and other factors such as conservation. In Virginia, Washington Gas has a WNA billing adjustment mechanism that is designed to eliminate the effect of variations in weather from normal levels on utility net revenues for residential, commercial and industrial and group metered apartment customers. Additionally, in Virginia, as part of the CARE plan, Washington Gas has a CRA mechanism that eliminates the effect of conservation for residential customers.
Interest-Rate Risk
We are exposed to interest-rate risk associated with our short-term and long-term financing. Washington Gas has previously utilized derivative instruments in order to reduce its exposure to the risk of interest-rate volatility, with resulting gains and losses typically being recovered through each jurisdiction’s overall allowed rate of return.
At December 31, 2019 and 2018, Washington Gas had outstanding commercial paper and project financing of $399.5 million and $311.5 million, respectively. The carrying amount of commercial paper and project financing approximates their fair value. At December 31, 2019, a change of 100 basis points in the underlying average interest rate for our commercial paper would have caused a change in interest expense of approximately $2.3 million.
At December 31, 2019 and 2018, Washington Gas had outstanding fixed-rate MTNs and other long-term debt of $1,330.9 million and $1,035.0 million, respectively, excluding current maturities and commercial paper. At December 31, 2019, the fair value of Washington Gas’ fixed-rate debt was $1,480.8 million. Our sensitivity analysis indicates that fair value would increase by approximately $77.3 million or decrease by approximately $71.6 million if interest rates were to decline or increase by 10%, respectively, from current market levels. In general, such an increase or decrease in fair value would impact earnings and cash flows only if Washington Gas were to reacquire some or all of these instruments in the open market prior to their maturity.
At December 31, 2019, a total of $1,202.5 million, or approximately 89.3% of the face amount of Washington Gas’ outstanding long-term debt, excluding current maturities and commercial paper, have make-whole call options which would require us to pay a premium over the face amount if we were to exercise them.
Washington Gas Light Company
Part II
Item 7. Management’s Discussion and Analysis of
Financial Condition and Results of Operations (continued)
Refer to Note 14 — Derivatives of the Notes to Financial Statements for a further discussion of our interest-rate risk management activity.
LIQUIDITY AND CAPITAL RESOURCES
LiquidityRates and capital resources for Washington Gas are substantially the same as the liquidity and capital resources discussion included in the Management’s Discussion of WGL (except for certain items and transactions that pertain to WGL Holdings and its unregulated subsidiaries). Those explanations are incorporated by reference into this discussion.
During the fiscal year ended September 30, 2018, WGL made a $403 million equity infusion to Washington Gas. This infusion was done to fund the Merger-related costs incurred by Washington Gas and to maintain its equity ratio within a reasonable and comparable range in the industry.
RATES AND REGULATORY MATTERSRegulatory Matters
Washington Gas makes its requests to modify existing rates based on its determination of the level of net investment in plant and equipment, operating expenses, and a level of return on invested capital that is just and reasonable.
|
| | | | | | | | | | | | | | | | | |
| Summary of Major Rate Increase Applications and Results |
| Jurisdiction | Application Filed | Effective Date | Test Year 12 Months Ended | Increase in Annual Revenues (Millions) | Allowed Rate of Return |
| Requested | Granted | Overall | Equity |
| District of Columbia | 1/13/2020 | | 12/31/2019 | $ | 35.2 |
| 14.70 | % | | | 7.56%(a) |
| 10.4%(a) |
|
| District of Columbia | 2/26/2016 | 3/24/2017 | 9/30/2015 | $ | 17.3 |
| 7.60 | % | $ | 8.5 |
| 3.70 | % | 7.57 | % | 9.25 | % |
| Maryland | 4/22/2019 | 10/15/2019 | 3/31/2019 | $ | 35.9 |
| 6.64 | % | $ | 27.0 |
| 5.04 | % | 7.24 | % | 9.70 | % |
| Maryland | 5/15/2018 | 12/11/2018 | 3/31/2018 | $ | 56.3 |
| 10.96 | % | $ | 28.6 |
| 5.69 | % | 7.30 | % | 9.70 | % |
| Virginia | 7/31/2018 | 1/2/2019 | 12/31/2017 | $ | 37.6 |
| 7.18 | % | $ | 13.2 |
| 2.52 | % | 7.22 | % | 9.20 | % |
| Virginia | 6/30/2016 | 11/28/2016 | 9/30/2015 | $ | 45.6 |
| 9.30 | % | $ | 34.0 |
| 6.93 | % | — %(b) |
| 9.50 | % |
(a) The overall rate of return and return on equity are rates requested by Washington Gas in its most recent rate case.
(b) The Virginia order did not specify an overall allowed rate of return.
The following is a discussion of significant current regulatory matters. Refer to the section "Accelerated Pipe Replacement Programs" above for a discussion of regulatory matters associated with those programs.
District of Columbia Jurisdiction
PROJECTpipes 2 Plan. On December 7, 2018, Washington Gas filed a request with the PSC of DC for approval of the PROJECTpipes 2 Plan, the second phase of Washington Gas' APRP, to cover the period from October 1, 2019 through December 31, 2024. The PROJECTpipes 2 Plan seeks to address relatively higher risk pipe associated with an aging infrastructure by replacing pipe materials and components, as well as adding new features to enhance the safety of Washington Gas’ system, with an estimated total cost of $305.3 million. On September 5, 2019, the PSC of DC issued an order extending the original PROJECTpipes an additional six months through March 31, 2020, in an amount not to exceed $12.5 million. On September 13, 2019, Washington Gas submitted a revised five year final annual project list. The parties are engaged in settlement negotiations, as directed by the PSC of DC. On February 14, 2020, a final settlement conference report was submitted, and the PSC of DC continues to review the PROJECTpipes 2 Plan.
District of Columbia 2020 Rate Case. On January 13, 2020, Washington Gas filed an application for authority to increase charges for gas service in the District of Columbia. The requested rates are designed to collect approximately $35.2 million in total annual revenues. Of the approximate $35.2 million revenue increase requested, $9.1 million represents costs collected through the PROJECTpipes surcharge; therefore, the incremental amount of the base rate increase is approximately $26.1 million. The Company requests that new rates be implemented by January 1, 2021.
Maryland Jurisdiction
Maryland Rate Case 2019. On April 22, 2019, Washington Gas filed an application with the PSC of MD to increase its base rates for natural gas service, generating $30.8 million in additional annual revenue. The revenue increase represented an increase in base rates of $35.9 million, of which approximately $5.0 million relates to costs being collected through the monthly STRIDE surcharges for system upgrades. The filing also requested an increase to the Company’s return on equity from 9.7% to 10.4%. The Company also proposed a Safety Response Tracker to reconcile leak management expenses above or below the test year level on an annual basis outside of a base rate case. On August 30, 2019 Washington Gas, the Staff of the PSC of MD, the Maryland Office of People’s Counsel and the Apartment & Office Building Association of Metropolitan Washington submitted a Stipulation and Settlement designed to generate an additional $27.0 million in base rates. The Stipulation stated an overall rate of return of 7.42%, established a return on equity of 9.70%, and stated a common equity ratio of 53.5% for the Company’s hypothetical capital structure. The Stipulation and Settlement did not adopt the proposed Safety Response Tracker. On October
Washington Gas Light Company
Part II
Item 7. Management’s Discussion and Analysis of
Financial Condition and Results of Operations (continued)
|
| | | | | | | | | | | | | | | | | |
| Summary of Major Rate Increase Applications and Results |
| Jurisdiction | Application Filed | Effective Date | Test Year 12 Months Ended | Increase in Annual Revenues (Millions) | Allowed Rate of Return |
| Requested | Granted | Overall | Equity |
| District of Columbia | 2/26/2016 | 3/24/2017 | 9/30/2015 | $ | 17.3 |
| 7.57 | % | $ | 8.5 |
| 7.60 | % | 7.60 | % | 9.25 | % |
| Maryland | 5/15/2018 | | 3/31/2018 | $ | 56.3 |
| 10.96 | % | | | 7.60 | % | 10.30 | % |
| Maryland | 4/26/2013 | 11/22/2013 | 3/31/2013 | $ | 28.3 |
| 5.80 | % | $ | 8.9 |
| 1.80 | % | 7.70 | % | 9.50 | % |
| Virginia | 7/31/2018 | | 12/31/2017 | $ | 37.6 |
| 7.18 | % | | | 7.94 | % | 10.60 | % |
| Virginia | 6/30/2016 | 11/28/2016 | 9/30/2015 | $ | 45.6 |
| 9.30 | % | $ | 34.0 |
| 6.93 | % | — %(a) |
| 9.50 | % |
(a)The Virginia order did not specify an overall allowed rate of return.
The following is a discussion of significant current regulatory matters. Refer to the section "Accelerated Pipe Replacement Programs" for a discussion of regulatory matters associated with those programs.
District of Columbia Jurisdiction
Investigation into Washington Gas’ Cash Reimbursement to CSPs. On August 5, 2014, the Office of the People’s Counsel (OPC) of DC filed a complaint with15, 2019 the PSC of DC requesting thatMD issued Final Order No. 89303 which accepted the Commission open an investigation intoStipulation and Settlement without change. Pursuant to Order No. 89303 Washington Gas’ payments to CSPs to cash-out over-deliveries of natural gas supplies during the 2008-2009 winter heating season. OPC asserted that Washington Gas made excess payments in the amount of $2.4 million to CSPs. On October 27, 2015, the PSC of DC issued an order finding that Washington Gas, in performing the cash-out, had violated D.C. Code 34-1101’s requirement that no service shall be provided without Commission approval. On August 11, 2016, the PSC of DC issued an order requiring Washington Gas to refund approximately $2.4 million through the ACA. During the fiscal year ended September 30, 2017, Washington Gas issued refunds of approximately $1.9 million on active customer bills. Additionally, Washington gas billed third-party CSPs approximately $1.4 million to cover amounts credited to firm rate-payers in connections with the DC order.
On March 30, 2018, Washington Gas filed a proposal for the disbursement of the remaining funds and on April 18, 2018, the PSC of DC issued an Order approving the disbursement. On May 17, 2018, Washington gas filed an Application for Clarification of the Order seeking clarification, if any, of D.C Code 41-108, a provision of the District of Columbia Uniform Disposition of Unclaimed Property Act. On August 8, 2018, the PSC of DC issued an Order granting Washington Gas clarification and modifying the disbursements of the previous Order as deemed to be abandoned by operation of law. On October 23, 2018, the PSC of DC issued an Order closing the case on November 2, 2018, unless an objection was filed. No objection was filed.
District of Columbia Rate Case. On February 26, 2016, Washington Gas filed an application with the PSC of DC. The application, as amended, requested an increase of $17.3 million toGas’s revised base rates for natural gas delivery service. This request included $4.5 million associated with the transfer to base rates of revenue associated with natural gas system upgrades previously approved by the PSC of DC and currently recovered through monthly surcharges. The filing addressed rate relief necessary for Washington Gas to recover its costs and earn its allowed rate of return. The filing also satisfied the requirement for Washington Gas to file a new rate proposal by August 1, 2016, under a settlement agreement approved by the PSC of DC in 2015, which provides for the recovery through a surcharge mechanism of costs related to an accelerated pipe replacement program to upgrade the Washington Gas distribution system and enhance safety.
On March 3, 2017, the PSC of DC issued an Order approving an overall increase in rates for Washington Gas of $8.5 million effective for services rendered on and after March 24, 2017. This increase is based on a hypothetical 55.7% equity component of Washington Gas' capital structure and an overall return of 7.57%, which retained the current return on equity of 9.25%. Washington Gas had requested an increase of $17.3 million, assuming a 57.8% equity component and a 10.25% return on equity. The PSC of DC denied Washington Gas’ request for approval of an RNA and Combined Heat and Power (CHP) tariffs; however, the PSC of DC approved a two-year pilot incentive program for developers of multi-family housing projects to bring the benefits of natural gas, including lower energy bills and reduced carbon emissions to more residents in the District of Columbia. On April 3, 2017, the Apartment and Office Building Association of Metropolitan Washington (AOBA) and DC Climate Action filed applications for reconsideration of portions of the Opinion and Order. On May 12, 2017, the PSC of DC denied the application for reconsideration filed by AOBA and denied, in part, the application for reconsideration of DC Climate Action. Further, the PSC of DC directed its staff to develop proposed criteria to facilitate the PSC of DC’s review of the economic benefits of the Multifamily Piping Program (MPP) and submit the criteria for public comment. On June 30, 2017, the
WGL Holdings, Inc.
Washington Gas Light Company
Part II
Item 7. Management’s Discussion and Analysis of
Financial Condition and Results of Operations
PSC of DC issued a Notice outlining its proposed evaluation criteria for the pilot Multifamily Piping Program. On January 17, 2018, the PSC of DC issued an Order adopting with modifications, the staff's evaluation criteria, extending the MPP by an additional two years and splitting the MPP pilotwent into two parts: enrollment and data collection.
Investigation into the Establishment of a Purchase of Receivables Program. On June 15, 2017, the PSC of DC directed Washington Gas to develop a Purchase of Receivables (POR) program for natural gas suppliers and their customers in the District of Columbia. On July 15, 2017, Washington Gas submitted its Purchase of Receivables Implementation Plan which was approved by the PSC of DC on October 19, 2017. On March 30, 2018, Washington Gas filed its proposed Purchase of Receivables discount rates for Commission approval. On June 7, 2018, one of the parties in the case requested a six-week extension for implementation of the program. On June 19, 2018, the PSC of DC issued an Order granting approval of the implementation date extension. On September 13, 2018, Washington Gas filed updated Purchase of Receivables and Joint Proposal for discount rates. On October 17, 2018, the PSC of DC issued an Order directing Washington Gas to implement the POR program as outlined in the Order and file an updated discount rate and implementation schedule within 15 days of the date of the Order. On October 23, 2018, Washington Gas provided to the PSC of DC an updated discount rate schedule and implementation plan. Washington Gas expects to implement the program in January 2019.
Application for Approval of Reduction of Distribution Rates. On January 12, 2018, Washington Gas filed an application with the PSC of DC for approval of reduction of distribution rates to reflect the Tax Act. Washington Gas sought to change current distribution service rates for all classes of customers served in the District of Columbia, effective for meter readings on and after January 29, 2018. Additionally, Washington Gas sought an expedited hearing and waiver of provisions of the DC Code and District of Columbia municipal regulations (DCMR) to ensure the proposed rate reductions will become effective as of February 1, 2018. On January 17, 2018, the Office of the People's Counsel filed a motion to oppose the expedited hearing and waivers. On January 23, 2018, the PSC of DC issued an Order which accepted Washington Gas' application but denied the request to waive any applicable provisions of the DC Code and DCMR, because the Order established the process under which the PSC of DC will conduct this proceeding. Washington Gas was directed to track the impact of the Tax Act on revenue requirements beginning January 1, 2018, recording all impacts to regulatory assets and liabilities. Additionally, as directed by the PSC of DC, Washington Gas filed a revised application on February 12, 2018, including all work papers that support the calculation of the effect of the tax change, and including the ratemaking adjustments and across-the-board revenue reduction distributed to customer classes based on revenues approved in the PSC of DC's most recent rate case. The Order also allowed parties to file comments/objections to Washington Gas’ revised application within 60 days of the date of the Order with any responses to the comments due within 75 days of the date of the Order. On March 22, 2018, Washington Gas requested that the PSC of DC extend the period of time to file comments until April 16, 2018 and reply comments, until April 30, 2018. On March 28, 2018, the PSC of DC granted the request.
On April 9, 2018, Washington Gas advised the Commission that it had reached a settlement in principle with the parties in the case and requested that the Commission suspend the procedural schedule to allow the parties sufficient time to finalize the terms and conditions of a settlement agreement and file it with the Commission for approval. On April 12, 2018, the PSC of DC issued an order granting Washington Gas’ motion to suspend the Procedural Schedule. As directed by the Commission, Washington Gas and several parties in the case filed a joint motion and unanimous agreement of stipulation for full settlement on April 30, 2018. On May 23, 2018, the PSC of DC issued an Order granting the request to waive the hearing required by the Rules of Practice in the Joint Motion for Approval of the Unanimous Agreement of Stipulation and Full Settlement filed by WGL and other party members. Additionally, the Order allowed interested parties to file comments by June 18, 2018. On June 29, 2018, the PSC of DC approved the settlement agreement, effective for service rendered on or after July 1, 2018. The settling parties were directed to file a joint proposal depicting the regulatory liability balance for the period January 1, 2018 through June 30, 2018, which will be refunded to customers through a one-time bill credit beginning with Washington Gas' December 2018 billing cycle. On August 31, 2018, Washington Gas submitted their joint proposal for a one time bill credits. On October 17, 2018, the PSC of DC issued an Order granting Washington Gas' request. At September 30, 2018, Washington Gas accrued $5.1 million for the one time bill credits. Refer to Note 8—Income Taxes of the Notes to Consolidated Financial Statements for a discussion of regulatory liabilities we have established related to tax reform.
Maryland Jurisdiction15, 2019.
Maryland Rate Case.Case 2018. On May 15, 2018, Washington Gas filed an application with the PSC of MD to increase its base rates for natural gas service, generating $41.3 million in additional annual revenue. The revenue increase includes an increase in base ratesPSC of $56.3 million partially offset by a reduction of $15.0MD granted the Company $28.6 million in annual surcharges currently paid by customers for system upgrades. These surcharges that customers have been paying monthly since 2014 are associated with Washington Gas'
WGL Holdings, Inc.
new revenues and increased the Company’s return on equity to 9.7%. On January 10, 2019, Washington Gas Light Company
Part II
Item 7. Management’s Discussion and Analysis of
Financial Condition and Results of Operations
natural gas infrastructure replacement and environmental improvement initiatives, previously approved by the Commission under Maryland's Strategic Infrastructure Development and Enhancement (“STRIDE”) statute. Additionally, the proposed rate increase includes provisions designed to deliver the benefits of natural gas to more customers that include: (i) continued progress towards the replacement of aging infrastructure; (ii) ongoing network upgradesfiled an application for improved service in Maryland and (iii) rising cost of service of providing safe, reliable natural gas service in its Maryland service territory. On May 18, 2018rehearing with the PSC of MD, suspendedalleging two errors in the proposed rates for a period of not more than 150 days from May 14, 2018, and pursuant to MD law, the PSC of MD may suspend the proposed rates for an additional 30 days at its discretion.agency’s final order. On June 22, 201825, 2019, the PSC of MD issued an Order that adoptedorder granting in part and denying in part Washington Gas’ application for a procedural schedulerehearing, resulting in this matter. Intervenor direct testimony was filedan additional $0.5 million increase in August 2018. Rebuttal testimony and evidentiary hearings took place in September and October 2018, respectively. As directed, all parties filed a single brief by November 9, 2018. A PSC of MD decision is expected in mid-December 2018.annual distribution revenues.
Maryland STRIDE 2 Case.Show-Cause Order On June 15, 2018 Washington Gas filed. Following the NTSB hearing that examined the August 10, 2016, explosion and fire at an application withapartment complex in Silver Spring, Maryland, on September 5, 2019, the PSC of MD ordered the Company, within 30 days, to (i) provide a detailed response to the NTSB’s probable cause findings, and (ii) provide evidence regarding the status of a 2003 mercury regulator replacement program, and if the program was not completed, to show cause why the Commission should not impose a civil penalty on the Company. See Item 3 - Legal Proceedings and Note 13 - Commitments and Contingencies of the Notes to Financial Statements for additional information.
Virginia Jurisdiction
Application for the SAVE Act Plan Rider. On September 3, 2019, Washington Gas filed with the SCC of VA an application for approval of the second phaseSAVE Plan Rider for Calendar Year 2020 of its accelerated natural gas pipeline replacement initiative. The application asks for approvalannual adjustment of $393.6 million in accelerated infrastructure replacements forits Commission-approved SAVE Act under which the 2019-2023 period. A prehearing conference was held on July 25, 2018 setting a procedural schedule. Intervenor testimony was filed in August 2018. Rebuttal testimony by all parties was filed by September 5, 2018. Public hearings were held September 5thCompany's 2020 SAVE Plan Rider is reconciled and September 17th, 2018. As directed, all parties filed a single brief by November 2, 2018. A PSC of MD decision is expected in mid-December 2018.
Termination Notice Inquiry. On March 28, 2017, the PSC of MD initiated an investigation into the service termination notices sent byadjusted. Washington Gas proposed to its customers between December 1, 2013invest approximately $132 million over calendar year 2020 to continue work on previously approved distribution and Decembertransmission system accelerated replacement programs. Public comments were due by October 31, 2016.2019. The case investigated whether the service termination notices complied with CodeSCC of Maryland Regulations. The PSC of MD’s investigation of this matter considered whether fines and orVA issued an Order on November 26, 2019, approving a civil penalty should be assessed. A procedural schedule was adoptedSAVE Rider for 2020 in the case, but was suspended to permit the parties to engage in settlement discussions. On April 6, 2018, the Chief Public Utility Law Judge for the PSCamount of MD issued a proposed order approving the settlement agreement between Washington Gas and the Maryland Office of the People’s Counsel (OPC), which was filed with the PSC of MD on February 15, 2018.approximately $13.8 million. The proposed order became a final order ofSAVE Rider rates approved by the Commission reflect an investment of approximately $127 million over the 12-month period beginning on April 23, 2018. A draft Compliance Plan was provided to the PSC of MD Staff and OPC on April 16, 2018. The final Compliance Plan was filed June 14, 2018. Per the settlement agreement, in lieu of any civil penalty or fine, Washington Gas made a distribution to the Washington Area Fuel Fund in May 2018. At September 30, 2018, Washington Gas had issued $1.9 million of refunds to current and former customers.
Application for Approval of Reduction of Distribution Rates. On January 12, 2018, Washington Gas filed an application with the PSC of MD for approval of reduction of distribution rates to reflect the Tax Act. Washington Gas sought to change current distribution service rates for all classes of customers served in Maryland, effective for meter readings on and after January 29, 2018. On January 31, 2018, the PSC of MD approved the application effective for bills rendered on or after February 1, 2018. Refer to Note 8—2020.Income Taxes of theNotes to Condensed Consolidated Financial Statements for a discussion of regulatory liabilities we have established related to tax reform.
Virginia Jurisdiction
Virginia Rate Case - 2018. On July 31, 2018, Washington Gas filed an application with the SCC of VA to increase its base rates for natural gas service by $37.6 million, which includes $14.7 million of revenue associated with natural gas pipeline replacement initiatives previously approved by the CommissionSCC of VA and paid by customers through a monthly rider. Additionally, the requested revenue amount reflects a $16.3 reduction for lower tax expense due toincrease incorporated the implementationeffects of the Tax Cuts and Jobs Act and excludes any costs related to the acquisition of Washington Gas by AltaGas on July 6, 2018. At September 30, 2018, Washington Gas had accrued $13.0 million related to the(the Tax Act. Refer to Note 8—Income Taxes for a discussion of regulatory liabilities we have established related to tax reform and Note 20—Merger with AltaGas, Ltd. for a discussion of the merger. On August 23, 2018, the Commission issued an Order setting a procedural schedule and appointing a Hearing Examiner.Act). Interim rates will becomebecame effective, subject to refund, for usage in the January 2019 billing cycle.
Virginia Rate Case - 2016. On June 30, 2016, Washington Gas filed an application withSeptember 16, 2019, the HE issued a report that made certain recommendations, to which the Company responded on October 21, 2019. Thereafter, on December 20, 2019, the SCC of VA issued a Final Order that accepted some of the HE’s findings and either rejected or made adjustments to others. The Final Order included approval of (i) an increase itsin base rates for natural gas service by $45.6of $13.2 million which includes $22.3to reflect the transfer of $101.9 million of SAVE investment from the SAVE Rider to rate base (no additional revenue increase); and (ii) amortization of unprotected plant-related and non-plant-related excess deferred income tax over 8 years.
For the calendar year ended December 31, 2019, Washington Gas made the following pre-tax adjustments based on the HE’s recommendations and Commission's Final Order: (i) reduced “Operating revenues-Utility” by $7.9 million to accrue additional amounts of liability subject to refund; (ii) reduced “Operating revenues-Utility” by $9.0 million associated with natural gas pipeline replacement initiatives previously approvedthe revised amortization of the Tax Act liability; and (iii) wrote off $2.0 million in “Regulatory Assets - Other” and charged to “Operation and maintenance” expense. Additionally, the Company reduced income tax expense by $8.5 million related to the Commissionamortization of excess deferred income tax, and paid by customersrecorded $5.5 million after-tax impairment of a tax regulatory asset related to flow through income taxes. The total impact from the adjustments for the calendar year 2019 was a monthly rider. Interim rates went into effect, subject to refund,$18.9 million reduction in the December 2016 billing cycle. "Income before income taxes" and a $10.9 million reductions in "Net Income" on Washington Gas' statements of operations.
On April 17, 2017,January 9, 2020, Washington Gas filed witha petition for reconsideration regarding the SCCCommission’s decision to disallow recovery through base rates of VA a unanimous settlementthe $7.1 million regulatory asset related to previously flowed through income taxes. On January 30, 2020, the Commission issued its Order on Reconsideration denying the Company’s petition, and directing the Company to issue rate refunds, as well as to begin return of regulatory liabilities over a specific annual revenue increase, but not as to a specific returntwelve-month period, within 90 days of the date of the Order on equity, specific accounting adjustments, or specific ratemaking methodologies, except as otherwise set forth therein. On September 8, 2017, Washington Gas received a final Order from the Commission accepting settlement subject to minor modifications toReconsideration.
WGL Holdings, Inc.
Critical Accounting Policies
Washington Gas Light Company
Part II
Item 7. Management’s Discussion and Analysis of
Financial Condition and Results of Operations (continued)
Washington Gas’ System Expansion Proposals.Preparation of financial statements and related disclosures in compliance with GAAP requires the selection and the application of appropriate technical accounting guidance to the relevant facts and circumstances of our operations, as well as our use of estimates to compile the consolidated financial statements. The Commission issued its final order approvingapplication of these accounting policies involves judgment regarding estimates and projected outcomes of future events, including the revised stipulationlikelihood of success of particular regulatory initiatives, the likelihood of realizing estimates for legal and environmental contingencies, and the probability of recovering costs and investments in both the regulated utility and non-regulated business segments.
We have identified the following critical accounting policies discussed below that require our judgment and estimation, where the resulting estimates have a material effect on September 25, 2017. On December 21, 2017, Washington Gas requested an extension to completeour net income.
Accounting for Revenue
Revenue from contracts with customers is recognized in the refunds as directed by the Orderperiod in which customers obtain control of promised goods or services and was granted the extension on December 22, 2017. On January 19, 2018, Washington Gas filed its interim report as directed by the Order. On August 3, 2018, the Commission issued a final Order directing Washington Gas to issue refunds, with interest, to all customers when the substitution of final rates resultedperformance obligations are satisfied in an amount greater thanequal to the consideration in which the Company is entitled to receive in exchange for the promised goods and services. Generally, control of the promised goods or services is transferred to customer when the natural gas is delivered to the customer.
For regulated deliveries of natural gas, Washington Gas reads meters and bills customers on a monthly cycle basis. The billing cycles for customers do not coincide with the accounting periods used for financial reporting purposes. Washington Gas accrues estimated unbilled revenues for gas that has been delivered but not yet billed at the end of an accounting period by jurisdiction and customer class, including the estimated effects of billing adjustment mechanisms.
See Note 1 — Accounting Policies and Note 2 — Revenue from Contracts with Customers of the Notes to Financial Statements for additional information.
Accounting for Regulatory Operations—Regulatory Assets and Liabilities
Washington Gas accounts for its regulated operations in accordance with FASB Accounting Standards Codification (ASC) Topic 980, Regulated Operations (ASC Topic 980), which results in differences in the application of GAAP between regulated and unregulated businesses.
Washington Gas’ jurisdictional tariffs contain mechanisms that provide for the recovery of the cost of gas consumed by firm customers. Under these mechanisms, Washington Gas periodically adjusts its firm customers’ rates to reflect fluctuations in the cost of gas. Annually, Washington Gas reconciles the difference between the gas costs collected from firm customers and the cost of gas incurred, defers any difference and either recovers deficiencies from, or refunds excess recoveries to, customers over a period of time authorized by its regulators.
The current regulatory environment and Washington Gas’ specific facts and circumstances support both the continued application of ASC Topic 980 for our regulatory activities and the conclusion that all of our regulatory assets and liabilities as of December 31, 2019 are recoverable or refundable through rates charged to customers. See Note 3 — Regulated Operations of the Notes to Financial Statements for further discussion of our regulated operations.
Accounting for Contingencies
We account for contingent liabilities utilizing ASC Topic 450, Contingencies. By their nature, the amount collected duringof the interim period. Washington Gas has bookedcontingency and the timing of a receivablecontingent event and any resulting accounting recognition are subject to our judgment of $0.9 million at September 30, 2018such events and our estimates of the amounts. Actual results related to rate charges refundedcontingencies may be difficult to customers.
Other Matters
predict and could differ significantly from the estimates included in reported earnings. For a discussion of contingencies, see Note 13 — Labor Contracts. Commitments and Contingencies Washington Gas has four laborof the Notes to Financial Statements.
Accounting for Derivatives
We enter into both physical and financial contracts with bargaining units represented by three labor unions. On April 30, 2015, Washington Gas entered into a five-year labor contract withfor the Teamsters Local Union No. 96 (Local 96), a union affiliated withpurchase and sale of natural gas and apply the International Brotherhoodfair value requirements of Teamsters.ASC Topic 815, Derivatives and Hedging. The contract covers approximately 547 employeesfinancial and is effective from June 1, 2015 through May 31, 2020. Local 96 also represents union-eligible employees in the Shenandoah Gas division of Washington Gasphysical contracts that qualify as derivative instruments and has a five-year labor contract with Washington Gas that became effective on August 1, 2015 and expires on July 31, 2020. This contract covers approximately 28 employees. Washington Gas entered into a three-year labor contract with the Office and Professional Employees International Union (OPEIU-Local 2). The contract covers approximately 100 employees. OPEIU-Local 2 ratified the contract on March 21, 2016 and is effective from April 1, 2016 through March 31, 2019. Additionally, on August 1, 2017, Washington Gas entered into a three-year labor contract with the International Brotherhood of Electrical Workers Local 1900 that covers approximately 28 employees and will expire on July 31, 2020. Washington Gas isare subject to the termsmark-to-market accounting requirements are recorded on the balance sheet at fair value. Changes in the fair value of its laborderivative instruments which are recoverable or refundable to customers when they settle are subject to ASC Topic 980 and are recorded as regulatory assets or liabilities while changes in the fair value of derivative instruments not affected by rate regulation are reflected in earnings.
Judgment is required in determining the appropriate accounting treatment for our derivative instruments, including our ability to: (i) evaluate contracts with respectand other activities as derivative instruments subject to operating practicesthe accounting guidelines of ASC Topic 815; (ii) determine whether or not our derivative instruments are recoverable from or refundable to customers in future periods and compensation matters dealing with employees represented by the various bargaining units described above.
WGL Holdings, Inc.
Washington Gas Light Company
Part II
Item 7. Management’s Discussion and Analysis of
Financial Condition and Results of Operations (continued)
(iii) derive the estimated fair value of our derivative instruments. See Note 14 — Derivatives of the Notes to Financial Statements for a discussion of our derivatives.
Accounting for Fair Value Instruments
Fair value is based on actively quoted market prices when they are available. In the absence of actively quoted market prices, we seek indicative price information from external sources, including broker quotes and industry publications. If pricing information from external sources is not available, internal models are used to estimate prices based on available historical and near-term future price information and/or the use of statistical methods. These inputs are used with industry standard valuation methodologies. See Note 15 — Fair Value Measurements of the Notes to Financial Statements for a discussion of our valuation methodologies.
Accounting for Pension and Other Post-Retirement Benefit Plans
Washington Gas maintains defined benefit pension plans and other post-retirement benefit plans for eligible employees (the "Plans"). The measurement of the Plans’ obligations and costs is dependent on a variety of factors, such as employee demographics, the level of contributions made to the Plans, earnings on the Plans’ assets and mortality rates. The following assumptions are also critical to this measurement. These assumptions are derived on an annual basis with the assistance of a third-party actuarial firm:
Discount rate,
Expected long-term return on plan assets,
Rate of compensation increase,
Healthcare cost trend rate and
Projected increases to the Health Reimbursement Account (HRA) plan stipend.
The following table illustrates the effect of changing these actuarial assumptions, while holding all other assumptions constant:
|
| | | | | | | | | |
| Effect of Changing Critical Actuarial Assumptions |
| (In millions) | | | Pension Benefits | | Health and Life Benefits |
| Actuarial Assumptions | Percentage-Point Change in Assumption | | Increase (Decrease) in Ending Obligation | | Increase (Decrease) in Annual Cost | | Increase (Decrease) in Ending Obligation | | Increase (Decrease) in Annual Cost |
| Expected long-term return on plan assets | +/- 1.00 pt. | | n/a | | $(7.5) / $7.5 | | n/a | | $(5.2) / $5.2 |
| Discount rate | +/- 0.25 pt. | | $(33.1) / $35.8 | | $(2.7) / $2.8 | | $(8.5) / $9.0 | | $(0.0) / $0.0 |
| Rate of compensation increase | +/- 0.25 pt. | | $5.5 / $(4.5) | | $0.8 / $(0.8) | | n/a | | n/a |
| Healthcare cost trend rate | +/- 1.00 pt. | | n/a | | n/a | | $5.8 / $(5.1) | | $0.6 / $(0.5) |
| Projected increases to the HRA plan stipend | +/- 1.00 pt. | | n/a | | n/a | | $22.6 / $(18.8) | | $2.8 / $(2.2) |
See Note 10 — Pension and Other Post-retirement Benefits of the Notes to Financial Statements for additional discussion of the Plans.
Washington Gas Light Company
Part II
Item 7A. Quantitative and Qualitative Disclosures about Market Risk
ITEM 7A. QUANTITATIVE AND QUALITATIVE DISCLOSURES ABOUT MARKET RISK
The following issues related to our market risks are included under Item 7 of this report and are incorporated by reference into this discussion.
Price Risk Related to the Regulated Utility Segment
Price Risk Related to the Non-Utility Segments
Value-At-Risk
Weather Risk
Interest-Rate Risk
WGL Holdings, Inc.
Washington Gas Light Company
Part II
ITEM 8. FINANCIAL STATEMENTS AND SUPPLEMENTARY DATA WGL Holdings, Inc.
Consolidated Balance Sheets
|
| | | | | | | |
| | September 30, |
| (In thousands) | 2018 | | 2017 |
| ASSETS | | | |
| Property, Plant and Equipment | | | |
| At original cost | $ | 6,485,738 |
| | $ | 6,143,841 |
|
| Accumulated depreciation and amortization | (1,600,309 | ) | | (1,513,790 | ) |
| Net property, plant and equipment | 4,885,429 |
| | 4,630,051 |
|
| Current Assets | | | |
| Cash and cash equivalents | 57,969 |
| | 8,524 |
|
| Receivables | | | |
| Accounts receivable | 402,590 |
| | 398,149 |
|
| Gas costs and other regulatory assets | 5,054 |
| | 21,705 |
|
| Unbilled revenues | 159,703 |
| | 165,483 |
|
| Allowance for doubtful accounts | (40,086 | ) | | (32,025 | ) |
| Net receivables | 527,261 |
| | 553,312 |
|
| Materials and supplies—principally at average cost | 20,696 |
| | 20,172 |
|
| Storage gas | 188,270 |
| | 243,984 |
|
| Prepaid taxes | 32,746 |
| | 31,549 |
|
| Other prepayments | 80,112 |
| | 86,465 |
|
| Derivatives | 36,391 |
| | 15,327 |
|
| Other | 38,363 |
| | 26,556 |
|
| Total current assets | 981,808 |
| | 985,889 |
|
| Deferred Charges and Other Assets | | | |
| Regulatory assets | | | |
| Gas costs | 83,222 |
| | 90,136 |
|
| Pension and other post-retirement benefits | 57,269 |
| | 139,499 |
|
| Other | 104,578 |
| | 104,596 |
|
| Prepaid post-retirement benefits | 286,010 |
| | 231,577 |
|
| Derivatives | 20,572 |
| | 38,389 |
|
| Investments in unconsolidated affiliates | 769,998 |
| | 394,201 |
|
| Other | 59,201 |
| | 11,671 |
|
| Total deferred charges and other assets | 1,380,850 |
| | 1,010,069 |
|
| Total Assets | $ | 7,248,087 |
| | $ | 6,626,009 |
|
| CAPITALIZATION AND LIABILITIES | | | |
| Capitalization | | | |
| WGL Holdings common shareholders’ equity | $ | 1,796,478 |
| | $ | 1,502,690 |
|
| Non-controlling interest | 7,732 |
| | 6,851 |
|
| Washington Gas Light Company preferred stock | 28,173 |
| | 28,173 |
|
| Total equity | 1,832,383 |
|
| 1,537,714 |
|
| Long-term debt | 1,879,875 |
| | 1,430,861 |
|
| Total capitalization | 3,712,258 |
| | 2,968,575 |
|
| Current Liabilities | | | |
| Current maturities of long-term debt | 100,000 |
| | 250,000 |
|
| Notes payable and project financing | 669,697 |
| | 559,844 |
|
| Accounts payable and other accrued liabilities | 518,825 |
| | 423,824 |
|
| Wages payable | 11,379 |
| | 18,096 |
|
| Accrued interest | 8,914 |
| | 7,806 |
|
| Dividends declared | 28,939 |
| | 26,452 |
|
| Customer deposits and advance payments | 84,105 |
| | 65,841 |
|
| Gas costs and other regulatory liabilities | 34,157 |
| | 22,814 |
|
| Accrued taxes | 31,151 |
| | 17,657 |
|
| Derivatives | 22,710 |
| | 43,990 |
|
Other (a) | 48,307 |
| | 52,664 |
|
| Total current liabilities | 1,558,184 |
| | 1,488,988 |
|
| Deferred Credits | | | |
| Unamortized investment tax credits | 159,461 |
| | 155,007 |
|
| Deferred income taxes | 336,378 |
| | 868,067 |
|
| Accrued pensions and benefits | 119,597 |
| | 181,552 |
|
| Asset retirement obligations | 304,410 |
| | 296,810 |
|
| Regulatory liabilities | | | |
| Accrued asset removal costs | 270,397 |
| | 292,173 |
|
| Other post-retirement benefits | 160,286 |
| | 135,035 |
|
| Excess deferred taxes and other | 445,203 |
| | 9,403 |
|
| Derivatives | 120,513 |
| | 122,607 |
|
| Other | 61,400 |
| | 107,792 |
|
| Total deferred credits | 1,977,645 |
| | 2,168,446 |
|
| Commitments and Contingencies (Note 12) |
| |
|
| Total Capitalization and Liabilities | $ | 7,248,087 |
| | $ | 6,626,009 |
|
(a) Includes $5.1 million account payable to associated companies as of September 30, 2018. Refer to Note 17-Related Party Transactions for more information. |
| | | | | | | |
| (In thousands) | December 31, 2019 | | December 31, 2018 |
| ASSETS | | | |
| Property, Plant and Equipment | | | |
| At original cost | $ | 5,962,866 |
| | $ | 5,702,927 |
|
| Accumulated depreciation and amortization | (1,579,718 | ) | | (1,513,590 | ) |
| Net property, plant and equipment | 4,383,148 |
| | 4,189,337 |
|
| Current Assets | | | |
| Cash and cash equivalents | 17,069 |
| | 6,082 |
|
| Receivables | | | |
| Accounts receivable | 259,053 |
| | 292,871 |
|
| Gas costs and other regulatory assets | 9,894 |
| | 6,020 |
|
| Unbilled revenues | 160,546 |
| | 189,497 |
|
| Allowance for doubtful accounts | (18,708 | ) | | (29,461 | ) |
| Net receivables | 410,785 |
| | 458,927 |
|
| Materials and supplies—principally at average cost | 20,184 |
| | 19,727 |
|
| Storage gas | 87,977 |
| | 103,929 |
|
| Prepaid taxes | 34,576 |
| | 27,193 |
|
| Other prepayments | 33,867 |
| | 28,232 |
|
| Receivables from associated companies | 12,421 |
| | 4,819 |
|
| Derivatives | 6,553 |
| | 19,488 |
|
| Other | 19,619 |
| | 20,347 |
|
| Total current assets | 643,051 |
|
| 688,744 |
|
| Deferred Charges and Other Assets | | | |
| Regulatory assets | | | |
| Gas costs | 98,717 |
| | 141,636 |
|
| Pension and other post-retirement benefits | 39,435 |
| | 86,493 |
|
| Other | 84,886 |
| | 99,105 |
|
| Prepaid post-retirement benefits | 366,508 |
| | 249,462 |
|
| Right of use asset | 40,004 |
| | — |
|
| Derivatives | 10,370 |
| | 11,318 |
|
| Other | 30,620 |
| | 50,490 |
|
| Total deferred charges and other assets | 670,540 |
| | 638,504 |
|
| Total Assets | $ | 5,696,739 |
|
| $ | 5,516,585 |
|
| CAPITALIZATION AND LIABILITIES | | | |
| Capitalization | | | |
| Common shareholder’s equity | $ | 1,572,196 |
| | $ | 1,562,573 |
|
| Preferred stock | — |
| | 28,173 |
|
| Long-term debt | 1,430,949 |
| | 1,035,033 |
|
| Total capitalization | 3,003,145 |
| | 2,625,779 |
|
| Current Liabilities | | | |
| Current maturities of long-term debt | — |
| | 50,000 |
|
| Notes payable and project financing | 299,483 |
| | 311,460 |
|
| Accounts payable and other accrued liabilities | 267,408 |
| | 325,509 |
|
| Customer deposits and advance payments | 40,052 |
| | 54,370 |
|
| Gas costs and other regulatory liabilities | 105,399 |
| | 75,151 |
|
| Accrued taxes | 23,781 |
| | 28,451 |
|
| Payables to associated companies | 57,923 |
| | 95,228 |
|
| Operating lease liability | 5,850 |
| | — |
|
| Derivatives | 4,069 |
| | 20,295 |
|
| Other | 30,032 |
| | 32,074 |
|
| Total current liabilities | 833,997 |
| | 992,538 |
|
| Deferred Credits | | | |
| Unamortized investment tax credits | 2,575 |
| | 3,233 |
|
| Deferred income taxes | 462,475 |
| | 454,248 |
|
| Accrued pensions and benefits | 115,837 |
| | 156,210 |
|
| Asset retirement obligations | 206,820 |
| | 300,769 |
|
| Regulatory liabilities | | | |
| Accrued asset removal costs | 254,429 |
| | 264,556 |
|
| Other post-retirement benefits | 199,665 |
| | 121,345 |
|
Excess deferred taxes and other
| 404,700 |
| | 431,913 |
|
| Operating lease liability | 53,642 |
| | — |
|
| Derivatives | 97,695 |
| | 116,847 |
|
| Other | 61,759 |
| | 49,147 |
|
| Total deferred credits | 1,859,597 |
| | 1,898,268 |
|
| Commitments and Contingencies (Note 13) |
| |
|
| Total Capitalization and Liabilities | $ | 5,696,739 |
| | $ | 5,516,585 |
|
The accompanying notes are an integral part of these statements.
Washington Gas Light Company
WGL Holdings, Inc.
Consolidated Statements of IncomeOperations
Part II
Item 8. Financial Statements and Supplementary Data (continued)
| | | | Years Ended September 30, | Calendar Year
Ended
December 31, | | Three Months Ended December 31, | | Fiscal Years Ended September 30, |
| (In thousands) | 2018 | | 2017 | | 2016 | 2019 | | 2018 | | 2018 | | 2017 |
| | | | | | | | | |
| OPERATING REVENUES | | | | | | $ | 1,330,651 |
| | $ | 402,101 |
| | $ | 1,248,063 |
| | $ | 1,166,968 |
|
| Utility | $ | 1,229,521 |
| | $ | 1,143,337 |
| | $ | 1,044,117 |
| |
| Non-utility | 1,112,244 |
| | 1,211,387 |
| | 1,305,442 |
| |
| Total Operating Revenues | 2,341,765 |
| | 2,354,724 |
| | 2,349,559 |
| |
| OPERATING EXPENSES | | | | | | | | | | | | |
| Utility cost of gas | 388,541 |
| | 274,247 |
| | 245,189 |
| 461,574 |
| | 156,641 |
| | 407,043 |
| | 297,856 |
|
| Non-utility cost of energy-related sales | 907,512 |
| | 1,002,908 |
| | 1,123,077 |
| |
| Operation and maintenance | 665,115 |
| | 429,890 |
| | 401,776 |
| 404,961 |
| | 102,728 |
| | 544,180 |
| | 340,604 |
|
| Depreciation and amortization | 162,576 |
| | 154,138 |
| | 132,566 |
| 142,565 |
| | 34,948 |
| | 135,071 |
| | 129,428 |
|
| General taxes and other assessments | 167,360 |
| | 152,528 |
| | 146,655 |
| 149,618 |
| | 38,552 |
| | 148,178 |
| | 134,696 |
|
| Total Operating Expenses | 2,291,104 |
| | 2,013,711 |
| | 2,049,263 |
| 1,158,718 |
| | 332,869 |
|
| 1,234,472 |
| | 902,584 |
|
| OPERATING INCOME | 50,661 |
| | 341,013 |
| | 300,296 |
| 171,933 |
| | 69,232 |
| | 13,591 |
| | 264,384 |
|
| Equity in earnings of unconsolidated affiliates | (5,791 | ) | | 20,216 |
| | 13,806 |
| |
Other income (expense) — net | (15,043 | ) | | 1,819 |
| | 4,646 |
| |
| Other income (expense) — net | | 9,478 |
| | 3,494 |
| | (7,592 | ) | | (545 | ) |
| Interest expense | 62,133 |
| | 74,026 |
| | 52,310 |
| 62,567 |
| | 15,706 |
| | 58,504 |
| | 52,207 |
|
| INCOME (LOSS) BEFORE INCOME TAXES | (32,306 | ) | | 289,022 |
| | 266,438 |
| 118,844 |
| | 57,020 |
| | (52,505 | ) | | 211,632 |
|
| INCOME TAX EXPENSE (BENEFIT) | (53,452 | ) | | 111,159 |
| | 98,074 |
| 19,032 |
| | 7,847 |
| | (25,863 | ) | | 79,840 |
|
| NET INCOME | $ | 21,146 |
| | $ | 177,863 |
| | $ | 168,364 |
| |
| Non-controlling interest | (29,517 | ) | | (16,077 | ) | | (550 | ) | |
| Dividends on Washington Gas Light Company preferred stock | 1,320 |
| | 1,320 |
| | 1,320 |
| |
| NET INCOME APPLICABLE TO COMMON STOCK | $ | 49,343 |
| | $ | 192,620 |
| | $ | 167,594 |
| |
| NET INCOME (LOSS) | | $ | 99,812 |
| | $ | 49,173 |
| | $ | (26,642 | ) | | $ | 131,792 |
|
| Loss on preferred stock extinguishment | | 556 |
| | — |
| | — |
| | — |
|
| Dividends on preferred stock | | 1,169 |
| | 330 |
| | 1,320 |
| | 1,320 |
|
| NET INCOME (LOSS) APPLICABLE TO COMMON STOCK | | $ | 98,087 |
| | $ | 48,843 |
| | $ | (27,962 | ) | | $ | 130,472 |
|
The accompanying notes are an integral part of these statements.
WGL Holdings, Inc.
Consolidated Statements of Comprehensive Income
Part II
Item 8. Financial Statements and Supplementary Data (continued)
|
| | | | | | | | | | | |
| | Years Ended September 30, |
| (In thousands) | 2018 | | 2017 | | 2016 |
| NET INCOME (LOSS) | $ | 21,146 |
| | $ | 177,863 |
| | $ | 168,364 |
|
| OTHER COMPREHENSIVE INCOME (LOSS), BEFORE INCOME TAXES: | | | | | |
| Qualified cash flow hedging instruments | (6,341 | ) | | 49,610 |
| | (39,289 | ) |
| Pension and other post-retirement benefit plans | | | | | |
| Change in prior service (cost) credit | (675 | ) | | (767 | ) | | (891 | ) |
| Change in actuarial net gain (loss) | 6,324 |
| | 6,232 |
| | (936 | ) |
| TOTAL OTHER COMPREHENSIVE INCOME (LOSS) BEFORE TAXES | $ | (692 | ) | | $ | 55,075 |
| | $ | (41,116 | ) |
| INCOME TAX EXPENSE (BENEFIT) RELATED TO OTHER COMPREHENSIVE INCOME (LOSS) | 1,523 |
| | 22,533 |
| | (16,813 | ) |
| OTHER COMPREHENSIVE INCOME (LOSS) | $ | (2,215 | ) | | $ | 32,542 |
| | $ | (24,303 | ) |
| COMPREHENSIVE INCOME (LOSS) | $ | 18,931 |
| | $ | 210,405 |
| | $ | 144,061 |
|
| Non-controlling interest | (29,517 | ) | | (16,077 | ) | | (550 | ) |
| Dividends on Washington Gas Light Company preferred stock | 1,320 |
| | 1,320 |
| | 1,320 |
|
| COMPREHENSIVE INCOME (LOSS) ATTRIBUTABLE TO WGL HOLDINGS | $ | 47,128 |
|
| $ | 225,162 |
|
| $ | 143,291 |
|
The accompanying notes are an integral part of these statements.
WGL Holdings, Inc.
Consolidated Statements of Cash Flows
Part II
Item 8. Financial Statements and Supplementary Data (continued)
|
| | | | | | | | | | | |
| | Years Ended September 30, |
| (In thousands) | 2018 | | 2017 | | 2016 |
| OPERATING ACTIVITIES | | | | | |
| Net income | $ | 21,146 |
| | $ | 177,863 |
| | $ | 168,364 |
|
| ADJUSTMENTS TO RECONCILE NET INCOME TO NET CASH PROVIDED | | | | | |
| BY OPERATING ACTIVITIES | | | | | |
| Depreciation and amortization | 162,576 |
| | 154,138 |
| | 132,566 |
|
| Amortization of: | | | | | |
| Other regulatory assets and liabilities—net | 6,917 |
| | 6,422 |
| | 1,909 |
|
| Debt related costs | 2,844 |
| | 2,027 |
| | 1,284 |
|
| Deferred income taxes—net | (45,019 | ) | | 114,966 |
| | 163,879 |
|
| Distributions received from equity method investments | 19,655 |
| | 16,738 |
| | — |
|
| Accrued/deferred pension and other post-retirement benefit cost | 11,200 |
| | 22,601 |
| | 19,548 |
|
| Earnings in equity interests | (28,209 | ) | | (20,216 | ) | | (13,806 | ) |
| Compensation expense related to stock-based awards | 20,377 |
| | 17,154 |
| | 12,308 |
|
| Provision for doubtful accounts | 23,329 |
| | 17,212 |
| | 13,036 |
|
| Impairment loss | 71,969 |
| | — |
| | 4,110 |
|
| Gain on consolidation | — |
| | (1,807 | ) | | — |
|
| Unrealized (gain) loss on derivative contracts | 3,317 |
| | (85,591 | ) | | (24,774 | ) |
| Amortization of investment tax credits | (7,398 | ) | | (7,504 | ) | | (6,132 | ) |
| Other non-cash charges (credits)—net | (8,161 | ) | | (840 | ) | | (1,308 | ) |
| Changes in operating assets and liabilities (Note 19) | 68,300 |
| | (178,937 | ) | | (239,976 | ) |
| Net Cash Provided by Operating Activities | 322,843 |
| | 234,226 |
| | 231,008 |
|
| FINANCING ACTIVITIES | | | | | |
| Capital contributions from AltaGas Ltd. | 362,728 |
| | — |
| | — |
|
| Common stock issued | — |
| | 293 |
| | 78,287 |
|
| Long-term debt issued | 550,000 |
| | 245,556 |
| | 498,125 |
|
| Long-term debt retired | (250,000 | ) | | — |
| | (25,000 | ) |
| Debt issuance costs | (3,087 | ) | | (665 | ) | | (445 | ) |
| Notes payable issued (retired)—net | 82,501 |
| | 236,000 |
| | (63,000 | ) |
| Contributions from non-controlling interest | 30,548 |
| | 22,336 |
| | 959 |
|
| Distributions to non-controlling interest | (780 | ) | | (300 | ) | | — |
|
| Project financing | 55,666 |
| | 20,386 |
| | 38,468 |
|
| Dividends on common stock and preferred stock | (105,444 | ) | | (102,123 | ) | | (92,841 | ) |
| Other financing activities—net | (6,558 | ) | | (2,051 | ) | | (1,256 | ) |
| Net Cash Provided By Financing Activities | 715,574 |
| | 419,432 |
| | 433,297 |
|
| INVESTING ACTIVITIES | | | | | |
| Capital expenditures (excluding AFUDC) | (516,406 | ) | | (516,534 | ) | | (530,385 | ) |
| Investments in non-utility interests | (410,822 | ) | | (147,294 | ) | | (158,052 | ) |
| Distributions and receipts from non-utility interests | — |
| | 4,126 |
| | 8,254 |
|
| Insurance proceeds related to investing properties | 3,238 |
| | — |
| | — |
|
| Net proceeds from sale of assets | — |
| | 9,858 |
| | 19,749 |
|
| Loans to external parties | — |
| | (863 | ) | | (5,031 | ) |
| Net Cash Used in Investing Activities | (923,990 | ) | | (650,707 | ) | | (665,465 | ) |
| INCREASE (DECREASE) IN CASH, CASH EQUIVALENTS AND RESTRICTED CASH | 114,427 |
| | 2,951 |
| | (1,160 | ) |
| Cash, Cash Equivalents and Restricted Cash at Beginning of the Year | 8,524 |
| | 5,573 |
| | 6,733 |
|
| Cash, Cash Equivalents and Restricted Cash at End of the Year | $ | 122,951 |
| | $ | 8,524 |
| | $ | 5,573 |
|
| SUPPLEMENTAL DISCLOSURES OF CASH FLOW INFORMATION (Note 19) | | | | | |
The accompanying notes are an integral part of these statements.
WGL Holdings, Inc.
Consolidated Statements of Capitalization
Part II
Item 8. Financial Statements and Supplementary Data (continued)
|
| | | | | | | | | | | | | |
| | September 30, |
| ($ In thousands, except shares) | 2018 |
| | | | 2017 |
| | |
| WGL Holdings Common Shareholders’ Equity | | | | | | | |
Common stock, no par value, 120,000,000 shares authorized, 100(a) and 51,219,000 shares issued , respectively. | $ | 595,105 |
| | | | $ | 582,716 |
| | |
| Paid-in capital | 345,202 |
| | | | 10,149 |
| | |
| Retained earnings | 864,383 |
| | | | 915,822 |
| | |
| Accumulated other comprehensive loss, net of taxes | (8,212 | ) | | | | (5,997 | ) | | |
| WGL Holdings common shareholders' equity | 1,796,478 |
| | 48.4 | % | | 1,502,690 |
| | 50.6 | % |
| Non-controlling Interest | 7,732 |
| | 0.2 | % | | 6,851 |
| | 0.2 | % |
| Preferred Stock | | | | | | | |
| WGL Holdings, Inc., without par value, 3,000,000 shares authorized, none issued | — |
| | | | — |
| | |
| Washington Gas Light Company, without par value, 1,500,000 shares authorized—issued and outstanding: | — |
| | | | — |
| | |
| $4.80 series, 150,000 shares | 15,000 |
| | | | 15,000 |
| | |
| $4.25 series, 70,600 shares | 7,173 |
| | | | 7,173 |
| | |
| $5.00 series, 60,000 shares | 6,000 |
| | | | 6,000 |
| | |
| Total Preferred Stock | 28,173 |
| | 0.8 | % | | 28,173 |
| | 0.9 | % |
| Total Equity | 1,832,383 |
| | 49.4 | % | | 1,537,714 |
| | 51.7 | % |
| Long-Term Debt | | | | | | | |
| Due fiscal year 2018, 2.45% | — |
| | | | 250,000 |
| | |
| Due fiscal year 2019, 3.09% to 7.46% | 100,000 |
| | | | 100,000 |
| | |
| Due fiscal year 2020, 2.25% to 4.76% | 700,000 |
| | | | 150,000 |
| | |
| Due fiscal year 2023, 6.65% | 20,000 |
| | | | 20,000 |
| | |
| Due fiscal year 2025, 5.44% | 40,500 |
| | | | 40,500 |
| | |
| Due fiscal year 2027, 6.40% to 6.82% | 125,000 |
| | | | 125,000 |
| | |
| Due fiscal year 2028, 6.57% to 6.85% | 52,000 |
| | | | 52,000 |
| | |
| Due fiscal year 2030, 7.50% | 8,500 |
| | | | 8,500 |
| | |
| Due fiscal year 2036, 5.70% to 5.78% | 50,000 |
| | | | 50,000 |
| | |
| Due fiscal year 2041, 5.21% | 75,000 |
| | | | 75,000 |
| | |
| Due fiscal year 2044, 4.22% to 5.00% | 175,000 |
| | | | 175,000 |
| | |
| Due fiscal year 2045, 4.24% to 4.60% | 200,000 |
| | | | 200,000 |
| | |
| Due fiscal year 2046, 3.80% | 450,000 |
| | | | 450,000 |
| | |
| Total Long-Term Debt | 1,996,000 |
| | | | 1,696,000 |
| | |
| Unamortized discount | (4,341 | ) | | | | (4,541 | ) | | |
| Unamortized debt expense | (11,784 | ) | | | | (10,598 | ) | | |
| Less—current maturities | 100,000 |
| | | | 250,000 |
| | |
| Total Long-Term Debt | 1,879,875 |
| | 50.6 | % | | 1,430,861 |
| | 48.3 | % |
| Total Capitalization | $ | 3,712,258 |
| | 100.0 | % | | $ | 2,968,575 |
| | 100.0 | % |
(a) All of outstanding shares of common stock of WGL are held by Wrangler 1 LLC, an indirect wholly-owned subsidiary of AltaGas as of September 30, 2018, see note 20- Merger with AltaGas Ltd. of the Notes to Consolidated Financial Statements.
The accompanying notes are an integral part of these statements.
WGL Holdings, Inc.
Consolidated Statements of Changes in Equity
Part II
Item 8. Financial Statements and Supplementary Data (continued)
|
| | | | | | | | | | | | | | | | | | | | | | | | | | | | | | | | | | |
| | Common Stock | | Paid-In Capital | | Retained Earnings | | Accumulated Other Comprehensive Loss, Net of Taxes | | WGL Holdings Common Shareholders' Equity | | Non-controlling Interest | | Washington Gas Light Company Preferred Stock | | Total Equity |
| (In thousands, except shares) | Shares | | Amount | | | | | | | |
| Balance, September 30, 2015 | 49,728,662 |
| | $ | 485,456 |
| | $ | 14,934 |
| | $ | 757,093 |
| | $ | (14,236 | ) | | $ | 1,243,247 |
| | $ | — |
| | 28,173 |
| | $ | 1,271,420 |
|
| Net income | — |
| | — |
| | — |
| | 167,594 |
| | — |
| | 167,594 |
| | (550 | ) | | 1,320 |
| | 168,364 |
|
| Contributions from non-controlling interest | — |
| | — |
| | — |
| | — |
| | — |
| | — |
| | 959 |
| | — |
| | 959 |
|
| Other comprehensive loss | — |
| | — |
| | — |
| | — |
| | (24,303 | ) | | (24,303 | ) | | — |
| | — |
| | (24,303 | ) |
| Stock-based compensation | 115,974 |
| | 6,742 |
| | (2,415 | ) | | (164 | ) | | — |
| | 4,163 |
| | — |
| | — |
| | 4,163 |
|
| Issuance of common stock(b) | 1,235,976 |
| | 82,298 |
| | — |
| | — |
| | — |
| | 82,298 |
| | — |
| | — |
| | 82,298 |
|
| Dividends declared: | | | | | | | | | | |
| | | | | | |
| Common stock ($1.9250 per share) | — |
| | — |
| | — |
| | (97,438 | ) | | — |
| | (97,438 | ) | | — |
| | — |
| | (97,438 | ) |
| Preferred stock | — |
| | — |
| | — |
| | — |
| | — |
| | — |
| | — |
| | (1,320 | ) | | (1,320 | ) |
| Balance, September 30, 2016 | 51,080,612 |
| | 574,496 |
| | 12,519 |
| | 827,085 |
| | (38,539 | ) | | 1,375,561 |
| | 409 |
| | 28,173 |
| | 1,404,143 |
|
| Net income | — |
| | — |
| | — |
| | 192,620 |
| | — |
| | 192,620 |
| | (16,077 | ) | | 1,320 |
| | 177,863 |
|
| Contributions from non-controlling interest | — |
| | — |
| | — |
| | — |
| | — |
| | — |
| | 22,336 |
| | — |
| | 22,336 |
|
| Distributions to non-controlling interest | — |
| | — |
| | — |
| | — |
| | — |
| | — |
| | (300 | ) | | — |
| | (300 | ) |
Business combination(c) | — |
| | — |
| | — |
| | — |
| | — |
| | — |
| | 483 |
| | — |
| | 483 |
|
| Other comprehensive income | — |
| | — |
| | — |
| | — |
| | 32,542 |
| | 32,542 |
| | — |
| | — |
| | 32,542 |
|
Stock-based compensation(a) | 112,146 |
| | 6,564 |
| | (2,370 | ) | | (549 | ) | | — |
| | 3,645 |
| | — |
| | — |
| | 3,645 |
|
Issuance of common stock(b) | 26,242 |
| | 1,656 |
| | — |
| | — |
| | — |
| | 1,656 |
| | — |
| | — |
| | 1,656 |
|
| Dividends declared: | | | | | | | | | | | | | | | | | |
| Common stock ($2.0175 per share) | — |
| | — |
| | — |
| | (103,334 | ) | | — |
| | (103,334 | ) | | — |
| | — |
| | (103,334 | ) |
| Preferred stock | — |
| | — |
| | — |
| | — |
| | — |
| | — |
| | — |
| | (1,320 | ) | | (1,320 | ) |
| Balance, September 30, 2017 | 51,219,000 |
| | 582,716 |
| | 10,149 |
| | 915,822 |
| | (5,997 | ) | | 1,502,690 |
| | 6,851 |
| | 28,173 |
| | 1,537,714 |
|
| Net income | — |
| | — |
| | — |
| | 49,343 |
| | — |
| | 49,343 |
| | (29,517 | ) | | 1,320 |
| | 21,146 |
|
| Contributions from non-controlling interest | — |
| | — |
| | — |
| | — |
| | — |
| | — |
| | 30,548 |
| | — |
| | 30,548 |
|
| Distributions to non-controlling interest | — |
| | — |
| | — |
| | — |
| | — |
| | — |
| | (780 | ) | | — |
| | (780 | ) |
Business combination(c) | — |
| | — |
| | — |
| | — |
| | — |
| | — |
| | 630 |
| | — |
| | 630 |
|
| Other comprehensive loss | — |
| | — |
| | — |
| | — |
| | (382 | ) | | (382 | ) | | — |
| | — |
| | (382 | ) |
Stock-based compensation(a) | 140,182 |
| | 12,389 |
| | (27,675 | ) | | 3,996 |
| | — |
| | (11,290 | ) | | — |
| | — |
| | (11,290 | ) |
|
| | | | | | | | | | | | | | | | | | | | | | | | | | | | | | | | | | |
Issuance of common stock(b) | — |
| | — |
| | — |
| | — |
| | — |
| | — |
| | — |
| | — |
| | — |
|
| Capital contributed by AltaGas Ltd. | — |
| | — |
| | 362,728 |
| | — |
| | — |
| | 362,728 |
| | — |
| | — |
| | 362,728 |
|
ASU 2018-02 adoption impact (d) | — |
| | — |
| | — |
| | 1,833 |
| | (1,833 | ) | | — |
| | — |
| | — |
| | — |
|
| Dividends declared: | | | | | | | | | | |
| | | | | |
|
|
| Common stock ($1.5400 per share) | — |
| | | | — |
| | (106,611 | ) | | — |
| | (106,611 | ) | | — |
| | — |
| | (106,611 | ) |
| Preferred stock | — |
| | — |
| | — |
| | — |
| | — |
| | — |
| | — |
| | (1,320 | ) | | (1,320 | ) |
Outstanding shares of common stock converted into the right to receive cash (e) | (51,359,182 | ) | | — |
| | — |
| | — |
| | — |
| | — |
| | — |
| | — |
| | — |
|
| Post-Merger shares converted | 100 |
| | | | | | | | | | | | | | | | |
Balance, September 30, 2018(e) | 100 |
| | $ | 595,105 |
| | $ | 345,202 |
| | $ | 864,383 |
| | $ | (8,212 | ) | | $ | 1,796,478 |
| | $ | 7,732 |
| | $ | 28,173 |
| | $ | 1,832,383 |
|
(a) Includes dividend equivalents related to our performance shares. We recorded $4.3 million commutative adjustments to retained earnings for the fiscal year 2018 due to the adoption of ASU 2016-09. see Note 1—Accounting policies of the Notes to Consolidated Financial Statements. We accelerated the vesting of stock-based awards upon the consummation of the Merger with AltaGas during the 4th quarter of fiscal year 2018, which reduced the paid-in capital. see Note 10—Stocked-Based Compensation for a further discussion.
(b) Includes shares issued under the ATM program and the dividend reinvestment and common stock purchase plans.
(c) Resulted from the consolidation of ASD Solar LP (ASD). For more information, see Note 16—Other investments of the Notes to Consolidated Financial Statements.
(d) Amount related to adoption of ASU 2018-02.WGL reclassified a credit of $1.8 million from AOCI to retained earnings at September 30, 2018. see Note 1—Accounting policies of the Notes to Consolidated Financial Statements
(e) Upon consummation of the Merger on July 6, 2018. WGL common stock issued and outstanding immediately prior to the Merger was converted into the right to receive the merger consideration of $88.25 per share and ceased to be outstanding. Each share of the Merger Sub's issued and outstanding common stock at the time of the consummation of the Merger was converted into one share of no par value WGL common stock for a total of 100 WGL post-Merger shares owned by Wrangler 1 LLC, an indirect wholly owned subsidiary of AltaGas. As a result of the Merger, WGL's common stock was delisted from the New York Stock Exchange, and there is no longer a market for WGL’s common stock.
The accompanying notes are an integral part of these statements.
Washington Gas Light Company
Balance Sheets
Part II
Item 8. Financial Statements and Supplementary Data (continued)
|
| | | | | | | |
| | September 30, |
| (In thousands) | 2018 | | 2017 |
| ASSETS | | | |
| Property, Plant and Equipment | | | |
| At original cost | $ | 5,613,137 |
| | $ | 5,310,337 |
|
| Accumulated depreciation and amortization | (1,495,683 | ) | | (1,422,622 | ) |
| Net property, plant and equipment | 4,117,454 |
| | 3,887,715 |
|
| Current Assets | | | |
| Cash and cash equivalents | 1 |
| | 1 |
|
| Receivables | | | |
| Accounts receivable | 165,257 |
| | 190,740 |
|
| Gas costs and other regulatory assets | 5,054 |
| | 21,705 |
|
| Unbilled revenues | 101,114 |
| | 107,967 |
|
| Allowance for doubtful accounts | (29,622 | ) | | (23,741 | ) |
| Net receivables | 241,803 |
| | 296,671 |
|
| Materials and supplies—principally at average cost | 20,650 |
| | 20,126 |
|
| Storage gas | 101,379 |
| | 92,753 |
|
| Prepaid taxes | 17,732 |
| | 23,350 |
|
| Other prepayments | 24,449 |
| | 13,238 |
|
| Receivables from associated companies | 2,227 |
| | 32,362 |
|
| Derivatives | 17,441 |
| | 5,061 |
|
| Other | 20,347 |
| | 102 |
|
| Total current assets | 446,029 |
|
| 483,664 |
|
| Deferred Charges and Other Assets | | | |
| Regulatory assets | | | |
| Gas costs | 83,222 |
| | 90,136 |
|
| Pension and other post-retirement benefits | 56,983 |
| | 138,573 |
|
| Other | 104,050 |
| | 104,538 |
|
| Prepaid post-retirement benefits | 284,277 |
| | 230,283 |
|
| Derivatives | 8,736 |
| | 16,244 |
|
| Other | 49,331 |
| | 3,561 |
|
| Total deferred charges and other assets | 586,599 |
| | 583,335 |
|
| Total Assets | $ | 5,150,082 |
| | $ | 4,954,714 |
|
| CAPITALIZATION AND LIABILITIES | | | |
| Capitalization | | | |
| Common shareholder’s equity | $ | 1,442,764 |
| | $ | 1,164,749 |
|
| Preferred stock | 28,173 |
| | 28,173 |
|
| Long-term debt | 1,084,933 |
| | 1,134,461 |
|
| Total capitalization | 2,555,870 |
| | 2,327,383 |
|
| Current Liabilities | | | |
| Current maturities of long-term debt | 50,000 |
| | — |
|
| Notes payable and project financing | 163,478 |
| | 166,772 |
|
| Accounts payable and other accrued liabilities | 271,276 |
| | 219,827 |
|
| Wages payable | 10,089 |
| | 16,508 |
|
| Accrued interest | 4,000 |
| | 3,967 |
|
| Dividends declared | 24,078 |
| | 22,098 |
|
| Customer deposits and advance payments | 83,658 |
| | 64,194 |
|
| Gas costs and other regulatory liabilities | 34,157 |
| | 22,814 |
|
| Accrued taxes | 27,427 |
| | 12,808 |
|
| Payables to associated companies | 21,548 |
| | 94,844 |
|
| Derivatives | 14,838 |
| | 30,263 |
|
| Other | 7,627 |
| | 7,473 |
|
| Total current liabilities | 712,176 |
| | 661,568 |
|
| Deferred Credits | | | |
| Unamortized investment tax credits | 3,398 |
| | 4,100 |
|
| Deferred income taxes | 409,807 |
| | 888,385 |
|
| Accrued pensions and benefits | 118,204 |
| | 179,814 |
|
| Asset retirement obligations | 298,202 |
| | 291,871 |
|
| Regulatory liabilities | | | |
| Accrued asset removal costs | 270,397 |
| | 292,173 |
|
| Other post-retirement benefits | 159,152 |
| | 134,181 |
|
Excess deferred taxes and other
| 443,665 |
| | 9,403 |
|
| Derivatives | 104,165 |
| | 112,299 |
|
| Other | 75,046 |
| | 53,537 |
|
| Total deferred credits | 1,882,036 |
| | 1,965,763 |
|
| Commitments and Contingencies (Note 12) |
| |
|
| Total Capitalization and Liabilities | $ | 5,150,082 |
| | $ | 4,954,714 |
|
The accompanying notes are an integral part of these statements.
Washington Gas Light Company
Statements of Income
Part II
Item 8. Financial Statements and Supplementary Data (continued)
|
| | | | | | | | | | | |
| | Years Ended September 30, |
| (In thousands) | 2018 | | 2017 | | 2016 |
| | | | | | |
| OPERATING REVENUES | $ | 1,248,063 |
| | $ | 1,166,968 |
| | $ | 1,070,904 |
|
| OPERATING EXPENSES | | | | | |
| Utility cost of gas | 407,043 |
| | 297,856 |
| | 271,975 |
|
| Operation and maintenance | 532,896 |
| | 336,676 |
| | 325,726 |
|
| Depreciation and amortization | 135,071 |
| | 129,428 |
| | 114,605 |
|
| General taxes and other assessments | 148,178 |
| | 134,696 |
| | 130,231 |
|
| Total Operating Expenses | 1,223,188 |
| | 898,656 |
| | 842,537 |
|
| OPERATING INCOME | 24,875 |
| | 268,312 |
| | 228,367 |
|
| Other expense — net | (18,876 | ) | | (4,473 | ) | | (2,143 | ) |
| Interest expense | 58,504 |
| | 52,207 |
| | 41,444 |
|
| INCOME (LOSS) BEFORE INCOME TAXES | (52,505 | ) | | 211,632 |
| | 184,780 |
|
| INCOME TAX EXPENSE (BENEFIT) | (25,863 | ) | | 79,840 |
| | 71,666 |
|
| NET INCOME (LOSS) | $ | (26,642 | ) | | $ | 131,792 |
| | $ | 113,114 |
|
| Dividends on preferred stock | 1,320 |
| | 1,320 |
| | 1,320 |
|
| NET INCOME (LOSS) APPLICABLE TO COMMON STOCK | $ | (27,962 | ) | | $ | 130,472 |
| | $ | 111,794 |
|
The accompanying notes are an integral part of these statements.
Washington Gas Light Company
Statements of Comprehensive Income
Part II
Item 8. Financial Statements and Supplementary Data (continued)
| | | Years Ended September 30, | Calendar Year
Ended
December 31, | Three Months Ended December 31, | | Fiscal Years Ended September 30, |
| (In thousands) | 2018 | | 2017 | | 2016 | 2019 | 2018 | | 2018 | | 2017 | |
| NET INCOME (LOSS) | $ | (26,642 | ) | | $ | 131,792 |
| | $ | 113,114 |
| $ | 99,812 |
| $ | 49,173 |
| | $ | (26,642 | ) | | $ | 131,792 |
| |
| OTHER COMPREHENSIVE INCOME (LOSS), BEFORE INCOME TAXES: | | | | | | | | | | | |
| Pension and other post-retirement benefit plans | | | | | | | | | | | |
| Change in prior service cost | (675 | ) | | (767 | ) | | (891 | ) | (649 | ) | (226 | ) | | (675 | ) | | (767 | ) | |
| Change in actuarial net gain (loss) | 6,324 |
| | 6,232 |
| | (936 | ) | 16,262 |
| (6,246 | ) | | 6,324 |
| | 6,232 |
| |
| Total pension and other post-retirement benefit plans | $ | 5,649 |
| | $ | 5,465 |
| | $ | (1,827 | ) | $ | 15,613 |
| $ | (6,472 | ) |
| $ | 5,649 |
| | $ | 5,465 |
| |
| INCOME TAX EXPENSE (BENEFIT) RELATED TO OTHER COMPREHENSIVE INCOME (LOSS) | 2,957 |
| | 2,157 |
| | (709 | ) | 4,077 |
| (1,675 | ) | | 2,957 |
| | 2,157 |
| |
| OTHER COMPREHENSIVE INCOME (LOSS) | $ | 2,692 |
| | $ | 3,308 |
| | $ | (1,118 | ) | $ | 11,536 |
| $ | (4,797 | ) |
| $ | 2,692 |
| | $ | 3,308 |
| |
| COMPREHENSIVE INCOME (LOSS) | $ | (23,950 | ) | | $ | 135,100 |
| | $ | 111,996 |
| $ | 111,348 |
| $ | 44,376 |
|
| $ | (23,950 | ) | | $ | 135,100 |
| |
The accompanying notes are an integral part of these statements.
Washington Gas Light Company
Statements of Cash Flows
Part II
Item 8. Financial Statements and Supplementary Data (continued)
| | | | Years Ended September 30, | Calendar Year Ended December 31, | Three Months Ended December 31, | | Fiscal Years Ended September 30, |
| (In thousands) | 2018 | | 2017 | | 2016 | 2019 | 2018 | | 2018 | | 2017 |
| OPERATING ACTIVITIES | | | | | | | | | | |
| Net income | $ | (26,642 | ) | | $ | 131,792 |
| | $ | 113,114 |
| |
| Net income (loss) | | $ | 99,812 |
| $ | 49,173 |
| | $ | (26,642 | ) | | $ | 131,792 |
|
| ADJUSTMENTS TO RECONCILE NET INCOME TO NET CASH PROVIDED BY OPERATING ACTIVITIES | | | | | | | | | | |
| Depreciation and amortization | 135,071 |
| | 129,428 |
| | 114,605 |
| 142,565 |
| 34,948 |
| | 135,071 |
| | 129,428 |
|
| Amortization of: | | | | | | | | | | |
| Other regulatory assets and liabilities—net | 6,917 |
| | 6,422 |
| | 1,909 |
| 8,491 |
| 1,859 |
| | 6,917 |
| | 6,422 |
|
| Debt related costs | 1,580 |
| | 1,448 |
| | 1,191 |
| 1,501 |
| 382 |
| | 1,580 |
| | 1,448 |
|
| Deferred income taxes—net | (26,435 | ) | | 77,586 |
| | 123,482 |
| 19,690 |
| 8,012 |
| | (26,435 | ) | | 77,586 |
|
| Accrued/deferred pension and other post-retirement benefit cost | 11,127 |
| | 22,547 |
| | 19,497 |
| (1,466 | ) | (330 | ) | | 11,127 |
| | 22,547 |
|
| Compensation expense related to stock-based awards | 19,067 |
| | 16,153 |
| | 11,452 |
| 3,626 |
| 1,353 |
| | 19,067 |
| | 16,153 |
|
| Provision for doubtful accounts | 20,224 |
| | 14,484 |
| | 10,945 |
| 17,266 |
| 5,940 |
| | 20,224 |
| | 14,484 |
|
| Impairment loss | 37,969 |
| | — |
| | — |
| 2,042 |
| 2,453 |
| | 37,969 |
| | — |
|
| Unrealized (gain) loss on derivative contracts | (10,379 | ) | | (48,950 | ) | | (11,552 | ) | (5,429 | ) | 4,200 |
| | (10,379 | ) | | (48,950 | ) |
| Amortization of investment tax credits | (702 | ) | | (751 | ) | | (795 | ) | (658 | ) | (165 | ) | | (702 | ) | | (751 | ) |
| Other non-cash charges (credits)—net | (2,450 | ) | | (1,592 | ) | | (197 | ) | 2,436 |
| (453 | ) | | (2,450 | ) | | (1,592 | ) |
| Changes in operating assets and liabilities (Note 19) | (43,050 | ) | | (141,238 | ) | | (143,526 | ) | |
| Net Cash Provided by Operating Activities | 122,297 |
| | 207,329 |
| | 240,125 |
| |
| Changes in operating assets and liabilities (Note 18) | | (86,547 | ) | (201,840 | ) | | (43,050 | ) | | (141,238 | ) |
| Net Cash Provided by (Used In) Operating Activities | | 203,329 |
| (94,468 | ) | | 122,297 |
| | 207,329 |
|
| FINANCING ACTIVITIES | | | | | | | | | | |
| Capital contributions from WGL Holdings Inc. | 402,728 |
| | — |
| | — |
| |
| Capital contributions from parent | | — |
| 100,000 |
| | 402,728 |
| | — |
|
| Long-term debt issued | — |
| | 195,556 |
| | 248,125 |
| 298,482 |
| — |
| | — |
| | 195,556 |
|
| Long-term debt retired | — |
| | — |
| | (25,000 | ) | (50,000 | ) | (50,000 | ) | | — |
| | — |
|
| Debt issuance costs | (366 | ) | | (661 | ) | | (333 | ) | (3,130 | ) | — |
| | (366 | ) | | (661 | ) |
| Long-term commercial paper issued (retired)—net | | 100,000 |
| — |
| | — |
| | — |
|
| Notes payable issued (retired)—net | (27,998 | ) | | 81,000 |
| | (47,000 | ) | 3,483 |
| 200,999 |
| | (27,998 | ) | | 81,000 |
|
| Project financing | 53,018 |
| | 9,314 |
| | 38,468 |
| — |
| — |
| | 53,018 |
| | 9,314 |
|
| Dividends on common stock and preferred stock | (88,908 | ) | | (87,118 | ) | | (83,116 | ) | (100,736 | ) | (24,078 | ) | | (88,908 | ) | | (87,118 | ) |
| Payment for preferred stock extinguishment | | (28,729 | ) | — |
| | — |
| | — |
|
| Other financing activities—net | (6,197 | ) | | (1,982 | ) | | (277 | ) | — |
| — |
| | (6,197 | ) | | (1,982 | ) |
| Net Cash Provided by (Used in) Financing Activities | 332,277 |
| | 196,109 |
| | 130,867 |
| |
| Net Cash Provided by Financing Activities | | 219,370 |
| 226,921 |
| | 332,277 |
| | 196,109 |
|
| INVESTING ACTIVITIES | | | | | | | | | | |
| Net proceeds from sale of assets | — |
| | — |
| | 19,749 |
| |
| Capital expenditures (excluding AFUDC) | (392,830 | ) | | (403,438 | ) | | (390,741 | ) | (432,974 | ) | (126,013 | ) | | (392,830 | ) | | (403,438 | ) |
| Insurance proceeds related to investing properties | 3,238 |
| | — |
| | — |
| — |
| — |
| | 3,238 |
| | — |
|
| Net Cash Used in Investing Activities | (389,592 | ) | | (403,438 | ) | | (370,992 | ) | (432,974 | ) | (126,013 | ) | | (389,592 | ) | | (403,438 | ) |
| INCREASE (DECREASE) IN CASH, CASH EQUIVALENTS AND RESTRICTED CASH | 64,982 |
| | — |
| | — |
| (10,275 | ) | 6,440 |
| | 64,982 |
| | — |
|
| Cash, Cash Equivalents, and Restricted Cash at Beginning of the Year | 1 |
| | 1 |
| | 1 |
| 71,423 |
| 64,983 |
| | 1 |
| | 1 |
|
| Cash, Cash equivalents and Restricted Cash at End of the Year | $ | 64,983 |
| | $ | 1 |
| | $ | 1 |
| $ | 61,148 |
| $ | 71,423 |
| | $ | 64,983 |
| | $ | 1 |
|
| SUPPLEMENTAL DISCLOSURES OF CASH FLOW INFORMATION (Note 19) | | | | | | |
| SUPPLEMENTAL DISCLOSURES OF CASH FLOW INFORMATION (Note 18) | | | | | | |
The accompanying notes are an integral part of these statements.
Washington Gas Light Company
Statements of Capitalization
Part II
Item 8. Financial Statements and Supplementary Data (continued)
|
| | | | | | | | | | | | | | |
| | | September 30, |
| ($ In thousands, except shares) | | 2018 | | | | 2017 | | |
| Common Shareholder’s Equity | | | | | | | | |
| Common stock, $1 par value, 80,000,000 shares authorized, 46,479,536 shares issued | | $ | 46,479 |
| | | | $ | 46,479 |
| | |
| Paid-in capital | | 879,273 |
| | | | 492,101 |
| | |
| Retained earnings | | 518,842 |
| | | | 630,691 |
| | |
| Accumulated other comprehensive loss, net of taxes | | (1,830 | ) | | | | (4,522 | ) | | |
| Total Common Shareholder’s Equity | | 1,442,764 |
| | 56.4 | % | | 1,164,749 |
| | 50.1 | % |
| Preferred Stock | | | | | | | | |
| Washington Gas Light Company, without par value, 1,500,000 shares authorized—issued and outstanding: | | | | | | | | |
| $4.80 series, 150,000 shares | | 15,000 |
| | | | 15,000 |
| | |
| $4.25 series, 70,600 shares | | 7,173 |
| | | | 7,173 |
| | |
| $5.00 series, 60,000 shares | | 6,000 |
| | | | 6,000 |
| | |
| Total Preferred Stock | | 28,173 |
| | 1.1 | % | | 28,173 |
| | 1.2 | % |
| Long-Term Debt | | | | | | | | |
| Due fiscal year 2019, 7.46% | | 50,000 |
| | | | 50,000 |
| | |
| Due fiscal year 2020, 4.76% | | 50,000 |
| | | | 50,000 |
| | |
| Due fiscal year 2023, 6.65% | | 20,000 |
| | | | 20,000 |
| | |
| Due fiscal year 2025, 5.44% | | 40,500 |
| | | | 40,500 |
| | |
| Due fiscal year 2027, 6.40% to 6.82% | | 125,000 |
| | | | 125,000 |
| | |
| Due fiscal year 2028, 6.57% to 6.85% | | 52,000 |
| | | | 52,000 |
| | |
| Due fiscal year 2030, 7.50% | | 8,500 |
| | | | 8,500 |
| | |
| Due fiscal year 2036, 5.70% to 5.78% | | 50,000 |
| | | | 50,000 |
| | |
| Due fiscal year 2041, 5.21% | | 75,000 |
| | | | 75,000 |
| | |
| Due fiscal year 2044, 4.22% to 5.00% | | 175,000 |
| | | | 175,000 |
| | |
| Due fiscal year 2045, 4.24% | | 50,000 |
| | | | 50,000 |
| | |
| Due fiscal year 2046, 3.80% | | 450,000 |
| | | | 450,000 |
| | |
| Total Long-Term Debt | | 1,146,000 |
| | | | 1,146,000 |
| | |
| Unamortized discount | | (2,934 | ) | | | | (3,042 | ) | | |
Unamortized debt expense
| | (8,133 | ) | | | | (8,497 | ) | | |
Less—current maturities
| | 50,000 |
| | | | — |
| | |
| Total Long-Term Debt | | 1,084,933 |
| | 42.5 | % | | 1,134,461 |
| | 48.7 | % |
| Total Capitalization | | $ | 2,555,870 |
| | 100.0 | % | | $ | 2,327,383 |
| | 100.0 | % |
The accompanying notes are an integral part of these statements.
Washington Gas Light Company
Statements of Common Shareholder’s Equity
Part II
Item 8. Financial Statements and Supplementary Data (continued)
| | | | Common Stock | | Paid-In Capital | | Retained Earnings | | Accumulated Other
Comprehensive Loss, Net of Taxes | | | Common Stock | | Paid-In Capital | | Retained Earnings | | Accumulated Other
Comprehensive Loss, Net of Taxes | | |
| (In thousands, except shares) | Shares | | Amount | | Total | Shares | | Amount | | Total |
| Balance, September 30, 2015 | 46,479,536 |
| | $ | 46,479 |
| | $ | 483,677 |
| | $ | 557,848 |
| | $ | (6,712 | ) | | $ | 1,081,292 |
| |
| Net income | — |
| | — |
| | — |
| | 113,114 |
| | — |
| | 113,114 |
| |
| Other comprehensive loss | — |
| | — |
| | — |
| | — |
| | (1,118 | ) | | (1,118 | ) | |
Stock-based compensation(a) | — |
| | — |
| | 4,458 |
| | — |
| | — |
| | 4,458 |
| |
| Dividends declared: | | | | | | | | | | | | |
| Common stock | — |
| | — |
| | — |
| | (82,980 | ) | | — |
| | (82,980 | ) | |
| Preferred stock | — |
| | — |
| | — |
| | (1,320 | ) | | — |
| | (1,320 | ) | |
| Balance, September 30, 2016 | 46,479,536 |
| | 46,479 |
| | 488,135 |
| | 586,662 |
| | (7,830 | ) | | 1,113,446 |
| 46,479,536 |
| | 46,479 |
| | 488,135 |
| | 586,662 |
| | (7,830 | ) | | 1,113,446 |
|
| Net income | — |
| | — |
| | — |
| | 131,792 |
| | — |
| | 131,792 |
| — |
| | — |
| | — |
| | 131,792 |
| | — |
| | 131,792 |
|
| Other comprehensive income | — |
| | — |
| | — |
| | — |
| | 3,308 |
| | 3,308 |
| — |
| | — |
| | — |
| | — |
| | 3,308 |
| | 3,308 |
|
Stock-based compensation(a) | — |
| | — |
| | 3,966 |
| | — |
| | — |
| | 3,966 |
| — |
| | — |
| | 3,966 |
| | — |
| | — |
| | 3,966 |
|
| Dividends declared: | | | | | | | | | | | | | | | | | | | | | | |
| Common stock | — |
| | — |
| | — |
| | (86,443 | ) | | — |
| | (86,443 | ) | — |
| | — |
| | — |
| | (86,443 | ) | | — |
| | (86,443 | ) |
| Preferred stock | — |
| | — |
| | — |
| | (1,320 | ) | | — |
| | (1,320 | ) | — |
| | — |
| | — |
| | (1,320 | ) | | — |
| | (1,320 | ) |
| Balance, September 30, 2017 | 46,479,536 |
| | 46,479 |
| | 492,101 |
| | 630,691 |
| | (4,522 | ) | | 1,164,749 |
| 46,479,536 |
| | 46,479 |
| | 492,101 |
| | 630,691 |
| | (4,522 | ) | | 1,164,749 |
|
| Net income | — |
| | — |
| | — |
| | (26,642 | ) | | — |
| | (26,642 | ) | |
| Net income (loss) | | — |
| | — |
| | — |
| | (26,642 | ) | | — |
| | (26,642 | ) |
| Other comprehensive income | — |
| | — |
| | — |
| | — |
| | 4,176 |
| | 4,176 |
| — |
| | — |
| | — |
| | — |
| | 4,176 |
| | 4,176 |
|
Stock-based compensation(a) | — |
| | — |
| | (15,556 | ) | | 4,197 |
| | — |
| | (11,359 | ) | — |
| | — |
| | (15,556 | ) | | 4,197 |
| | — |
| | (11,359 | ) |
| Capital contributed by WGL Holdings | — |
| | — |
| | 402,728 |
| | — |
| | — |
| | 402,728 |
| |
| Capital contribution from parent | | — |
| | — |
| | 402,728 |
| | — |
| | — |
| | 402,728 |
|
ASU 2018-02 adoption impact (b)
| — |
| | — |
| | — |
| | 1,484 |
| | (1,484 | ) | | — |
| — |
| | — |
| | — |
| | 1,484 |
| | (1,484 | ) | | — |
|
| Dividends declared: | | | | | | | | | | | | | | | | | | | | | | |
| Common stock | — |
| | — |
| | — |
| | (89,568 | ) | | — |
| | (89,568 | ) | — |
| | — |
| | — |
| | (89,568 | ) | | — |
| | (89,568 | ) |
| Preferred stock | — |
| | — |
| | — |
| | (1,320 | ) | | — |
| | (1,320 | ) | — |
| | — |
| | — |
| | (1,320 | ) | | — |
| | (1,320 | ) |
| Balance, September 30, 2018 | 46,479,536 |
| | $ | 46,479 |
| | $ | 879,273 |
| | $ | 518,842 |
| | $ | (1,830 | ) | | $ | 1,442,764 |
| 46,479,536 |
| | $ | 46,479 |
| | $ | 879,273 |
| | $ | 518,842 |
| | $ | (1,830 | ) | | $ | 1,442,764 |
|
| Net income | | — |
| | — |
| | — |
| | 49,173 |
| | — |
| | 49,173 |
|
| Other comprehensive income | | — |
| | — |
| | — |
| | — |
| | (4,797 | ) | | (4,797 | ) |
| Capital contribution from parent | | — |
| | — |
| | 100,000 |
| | — |
| | — |
| | 100,000 |
|
| Dividends declared: | | | | | | | | | | | |
|
|
| Common stock | | — |
| | — |
| | — |
| | (24,237 | ) | | — |
| | (24,237 | ) |
| Preferred stock | | — |
| | — |
| | — |
| | (330 | ) | | — |
| | (330 | ) |
| Balance, December 31, 2018 | | 46,479,536 |
|
| 46,479 |
|
| 979,273 |
|
| 543,448 |
|
| (6,627 | ) |
| 1,562,573 |
|
| Net income | | — |
| | — |
| | — |
| | 99,812 |
| | — |
| | 99,812 |
|
| Other comprehensive income | | — |
| | — |
| | — |
| | — |
| | 11,536 |
| | 11,536 |
|
| Loss on preferred stock extinguishment | | — |
| | — |
| | — |
| | (556 | ) | | — |
| | (556 | ) |
| Dividends declared: | | | | | | | | | | | | |
| Common stock | | — |
| | — |
| | | | (100,000 | ) | | — |
| | (100,000 | ) |
| Preferred stock | | — |
| | — |
| | — |
| | (1,169 | ) | | — |
| | (1,169 | ) |
| Balance, December 31, 2019 | | 46,479,536 |
|
| 46,479 |
|
| 979,273 |
|
| 541,535 |
|
| 4,909 |
|
| 1,572,196 |
|
(a) Stock-based compensation is based on the stock awards of WGL that are allocated to Washington Gas Light Company for its pro-rata share. We recorded $4.2 million commutativeaccumulative adjustments to retained earnings for the fiscal year 2018 due to the adoption of ASUAccounting Standards Update (ASU) 2016-09. See Note 1—Accounting policies of the Notes to Consolidated Financial Statements. We accelerated the vesting of stock-based awards upon the consummation of the Merger with AltaGas during the 4thfourth quarter of fiscal year ended September 2018, which reduced the paid-in capital. seeSee Note 10—Stocked-Based11 — Stock-Based Compensation for a further discussion.
(b)Amount related to the adoption of ASU 2018-02. Washington Gas reclassified a credit of $1.5 million from AOCI to retained earnings at September 30, 2018.See Note 1—Accounting policies of the Notes to Consolidated Financial Statements.
The accompanying notes are an integral part of these statements.
WGL Holdings, Inc
Washington Gas Light Company
Part II
Item 8. Financial Statements and Supplementary Data (continued)
Notes to Consolidated Financial Statements
NOTE 1. ACCOUNTING POLICIES GeneralNature of Operations and Basis of Presentation
On January 25, 2017, WGL entered into aFollowing the 2018 Merger Agreement, to combine with AltaGas. On July 6, 2018, the Merger was consummated between AltaGas, WGL, and the Merger Sub, a newly formedWashington Gas became an indirect, whollymajority owned subsidiary of, AltaGas. The Merger Agreement provided for the Merger of the Merger Sub withamong other entities, AltaGas and into WGL, with WGL surviving as an indirect wholly owned subsidiary of AltaGas.WGL. In connection with the Merger and at the command of Washington Gas’ regulators, WGL established the SPE for the purposes of owningformed a wholly owned subsidiary, Wrangler, a bankruptcy remote, special purpose entity to own the common stock of Washington Gas. The SPE is a wholly owned subsidiary of WGL. In addition, WGL continues to own all of the shares of common stock of Washington Gas Resources and Hampshire. Washington Gas Resources owns all of the shares of common stock of fourcertain affiliated non-utility subsidiaries, that include WGL Energy Services, WGL Energy Systems, WGL Midstream and WGSW. Except where the content clearly indicates otherwise, “WGL,” “we,” “us” or “our” referssome of which provide services to the holding company or the consolidated entity of WGL Holdings, Inc. and all of its subsidiaries. Unless otherwise noted, these notes apply equally to WGL and Washington Gas. Refer to Note 20—Merger with AltaGas, Ltd., of the Notes to the Consolidated Financial Statements for a further discussion of the Merger Agreement.
Nature of Operations
Washington Gas, and Hampshire comprise our regulated utility segment.some of which own interests in other entities. On December 20, 2019, Washington Gas redeemed all the outstanding shares of its preferred stock. As a result, Washington Gas is now an indirect, wholly owned subsidiary of AltaGas and WGL. As a public utility thatcompany, Washington Gas sells and delivers natural gas to more than one million customers primarily in the District of Columbia and the surrounding metropolitan areas in Maryland and Virginia. Deliveries to firm residential and commercial customers accounted for 77% of the total therms delivered to customers by Washington Gas in the fiscal year ended September 30, 2018. Deliveries to interruptible customers accounted for 13% and deliveries to customers who use natural gas to generate electricity accounted for 10%. These amounts do not include deliveries related to Washington Gas’ asset optimization program discussed below. Hampshire operates an underground natural gas storage facility that provides services exclusively to Washington Gas. Hampshire is regulated under a cost of service tariff by the FERC.
The retail energy-marketing segment consists of WGL Energy Services which competes with regulated utilities and other unregulated third-party marketers to sell natural gas and electricity directly to residential, commercial, industrial and governmental customers with the objective of earning a profit through competitive pricing. The commodities that WGL Energy Services sells are delivered to retail customers through assets owned by regulated utilities. Washington Gas delivers the majority of natural gas sold by WGL Energy Services, and unaffiliated electric utilities deliver all of the electricity sold. WGL Energy Services owned multiple solar PV distributed generation assets at September 30, 2018, though the results from these activities are presented in the commercial energy systems segment. Other than these facilities, WGL Energy Services does not own or operate any other natural gas or electric generation, production, transmission or distribution assets. At September 30, 2018, WGL Energy Services served approximately 108,900 natural gas customers and approximately 101,700 electricity customers located in Maryland, Virginia, Delaware, Pennsylvania and the District of Columbia.
The commercial energy systems segment consists of WGL Energy Systems, WGSW and the results of operations of affiliate-owned commercial distributed energy projects. This segment focuses on clean and energy efficient solutions for its customers, driving earnings through: (i) upgrading the mechanical, electrical, water and energy-related infrastructure of large governmental and commercial facilities by implementing both traditional and alternative energy technologies; (ii) owning and operating distributed generation assets such as solar PV systems, combined heat and power plants, and natural gas fuel cells and (iii) investments in residential and commercial retail solar PV companies. In addition to our primary markets, this segment provides customized energy solutions across a much wider footprint, with business activities across the United States.
The midstream energy services segment, which consists of the operations of WGL Midstream, specializes in the investment, management, development and optimization of natural gas storage and transportation midstream infrastructure projects. WGL Midstream enters into both physical and financial transactions in a manner intended to utilize energy risk management products to mitigate risks while seeking to maximize potential profits from the optimization of the transportation and storage assets it has under contract. WGL Midstream has an equity interest in four on going pipeline projects.
Refer to Note 15—Operating Segment Reporting for further discussion of our segments.
CONSOLIDATION OF FINANCIAL STATEMENTS
WGL Holdings, Inc
Washington Gas Light Company
Part II
Item 8. Financial Statements and Supplementary Data (continued)
Notes to Consolidated Financial Statements
The Consolidated Financial Statements of WGL haveWashington Gas has been prepared in conformity with GAAP and under the rules of the Securities and Exchange Commission (SEC). The consolidated financial statements include the accounts of WGL and its subsidiaries during the fiscal years reported. Inter-company transactions have been eliminated. Refer to Note 17—Related Party Transactions for a discussion of inter-company transactions.
At September 30, 2018 WGL has a variable interest in six investments that qualify as variable interest entities (VIEs). WGSW is the primary beneficiary for five of its VIEs; SFGF, SFRC, SFGF II, ASD and SFEE and accordingly, have been consolidated. WGL Midstream has a variable interest in Meade but is not the primary beneficiary of it; therefore, WGL has not consolidated this VIE entity. Refer to Note 16—Other Investments for a discussion of VIEs and other investments.
The Merger with AltaGas was recorded using the acquisition method of accounting. Under SEC regulations, WGLWashington Gas elected to not apply push down accounting to the stand alone WGLits stand-alone financial statements. The acquisition adjustments were recorded by AltaGas.
The information presented in this annual report on Form 10-K are presented solely for the registrant WGL and Washington Gas on a stand-alone basis. As
Change of Fiscal Year End
On December 28, 2018, our Board of Directors approved a resultchange of the Merger, there were no changes in accounting principles and practices or method of application that had a material effect on the financial results forWashington Gas's fiscal year endedfrom the period beginning on October 1 and ending on September 30 to the period beginning on January 1 and ending on December 31. This annual report on Form 10-K is for the twelve-month period from January 1, 2019 to December 31, 2019. References in this report to "calendar year" refer to the year ended December 31. References in this report to "transition period" refer to the three-month transition period from October 1, 2018 through December 31, 2018. References in this report to "fiscal year" refer to the twelve-month period ending on September 30.
USE OF ESTIMATES IN THE PREPARATION OF FINANCIAL STATEMENTSUse of Estimates in the Preparation of Financial Statements
In accordance with GAAP, we make certain estimates and assumptions regarding: (i) reported assets and liabilities; (ii) disclosed contingent assets and liabilities at the date of the financial statements and (iii) reported revenues, revenues subject to refund, and expenses during the reporting period. Actual results could differ from those estimates.
CHANGE IN ACCOUNTING PRINCIPLE AND STORAGE GAS VALUATION METHODS
On October 1, 2017, Washington GasProperty, Plant and WGL Energy Services implemented a voluntary change in the application of an accounting principle with respect to accounting for natural gas, propane, and odorant inventories. Washington Gas and WGL Energy Services now apply the average cost methodology under which the cost of units carried in inventory is based on the weighted average cost per unit of inventory. Prior to this change, Washington Gas and WGL Energy Services applied the First-in First-out (FIFO) method of accounting for inventory under which the oldest inventory items were recorded as being sold first.
We believe the new policy is preferable as it conforms to the method predominately used by our peers, better reflects the physical flow of inventory, conforms to the method used for certain of our other inventories, and will simplify recordkeeping requirements.
The change in accounting principle was implemented on a prospective basis, therefore, we did not retrospectively adjust any prior periods or record a cumulative effect adjustment, as discussed below.
Washington Gas implemented the change in accounting principle on a prospective basis in accordance with ASC Topic 980, which permits regulated entities to implement changes for financial reporting purposes in the same way those changes are implemented for regulatory reporting purposes when the change impacts allowable costs. WGL Energy Services implemented the change on a prospective basis as the impact on its financial statements for all periods presented, including the cumulative effect at October 1, 2017, was immaterial. The difference during the quarter between the prior FIFO method and the new average cost method was immaterial.
WGL Midstream continues to account for its inventory using the weighted average cost method.
On October 1, 2017, WGL adopted ASU 2015-11, Inventory (Topic 330) - Simplifying the Measurement of Inventory. This standard modified the previous calculation for valuing inventory. As a result of the new standard, beginning October 1, 2017, our inventory balances are stated at the lower of cost or net realizable value. Prior to October 1, 2017, our inventory balances were stated at the lower of cost or market. Interim period inventory losses attributable to lower of cost or net realizable value adjustments may be reversed if the net realizable value of the inventory is recovered by the end of the same fiscal year.
WGL Holdings, Inc
Washington Gas Light Company
Part II
Item 8. Financial Statements and Supplementary Data (continued)
Notes to Consolidated Financial Statements
For more information see ASU 2015-11 in the accounting standards adopted in fiscal year 2018 table below. Washington Gas and WGL did not record a lower-of-cost or net realizable value adjustment to net income for the fiscal year ended September 30, 2018 or a lower-of-cost or market adjustment to net income for the fiscal year ended September 30, 2017.
During the fiscal year ended September 30, 2016, Washington Gas did not record a lower-of-cost or market adjustment to net income and WGL recorded quarterly adjustments that netted to zero.
PROPERTY, PLANT AND EQUIPMENTEquipment
Property, plant and equipment (comprised principally of utility plant) are stated at original cost, including labor, materials, taxes and overhead costs incurred during the construction period. The cost of utility plant of Washington Gas includes an allowance for funds used during construction (AFUDC) that is calculated under a formula prescribed by our regulators in Maryland and the District of Columbia. Washington Gas capitalizes AFUDC equity is reported on the statements of operations as non-cash income in "Other income (expense)". AFUDC debt is reported as a componentnon-cash offset to interest expense. After construction is completed, the company are permitted to recover these costs through inclusion in rate base and the corresponding subsequent deprecation or amortization of construction overhead.those regulated assets. The rates for AFUDC for fiscal years September 30,the calendar year ended December 31, 2019, three months ended December 31, 2018, 2017 and 2016 were 2.42%, 2.73% and 5.51%, respectively. In addition, WGL Energy Systems and WGL Midstream incurs capitalized interest during the cost of constructing and acquiring their long-term assets, including investments accounted for by the equity method. For the fiscal years ended September 30, 2018 and 2017 was 3.48%, 5.84%, 2.42% and 2016, WGLH recorded capitalized interest expense of $11.1 million, $2.9 million and $2.1 million,2.73%, respectively.
Washington Gas chargesCosts of replacement and betterments that extend the useful life of property, plant, and equipment are also capitalized. The cost of maintenance and repairs, directly to operating expenses. Washington Gas capitalizes betterments and renewal costs and calculates depreciationwhich do not extend the useful life or increase the expected output of the asset, are expensed as incurred. Depreciation applicable to its utility gas plant in service primarily usinguses a straight-line method over the estimated remaining life of the plant. The composite annual depreciation and amortization rate ofwas 2.96%, 2.78%, 2.77%, and 2.80% for the regulated utility segment was 2.78%, 2.80%calendar year ended December 31, 2019, three months ended December 31, 2018, and 2.70% during fiscal years ended September 30, 2018 2017 and 2016,2017, respectively. In accordance with regulatory requirements, such rates include a component related to asset removal costs for Washington Gas. These asset removal costs are accrued through depreciation expense with a corresponding credit to “Regulatory liabilities—Accrued asset removal costs.” When Washington Gas retires depreciable utility plant and equipment, it charges the associated original costs to “Accumulated depreciation and amortization” and any related removal costs incurred are charged to “Regulatory liabilities—Accrued asset removal costs.” Washington Gas periodically reviews the adequacy of its depreciation rates by considering estimated remaining lives and other factors. For information about Asset Retirement Obligations (ARO’s), refer
Washington Gas Light Company
Part II
Item 8. Financial Statements and Supplementary Data (continued)
Notes to Financial Statements
The following table represents the section entitled “Asset Retirement Obligations”.
At September 30, 2018components of Washington Gas' Property, Plant and 2017, 87.3% and 87.2%, respectively, of WGL’s consolidatedEquipment at original cost of property, plant and equipment was related to the regulated utility segment as shown below.
| | | Property, Plant and Equipment at Original Cost | |
| | | |
| | | | December 31, |
| ($ In millions) | | | | | 2019 | | 2018 |
| September 30, | 2018 | | 2017 | |
| Regulated utility segment | | | | | | | | |
| Distribution, transmission and storage | $ | 4,808.7 |
| | 74.1 | % | | $ | 4,544.7 |
| | 74.0 | % | | $ | 5,148.1 |
| | 86.3 | % | | $ | 4,888.4 |
| | 85.7 | % |
| General, miscellaneous and intangibles | 539.4 |
| | 8.3 | % | | 548.5 |
| | 8.9 | % | | 543.2 |
| | 9.1 | % | | 542.9 |
| | 9.5 | % |
| Construction work in progress (CWIP) | 317.3 |
| | 4.9 | % | | 264.8 |
| | 4.3 | % | | 271.6 |
| | 4.6 | % | | 271.6 |
| | 4.8 | % |
| Total regulated utility segment | 5,665.4 |
| | 87.3 | % | | 5,358.0 |
| | 87.2 | % | |
| Unregulated segments | 820.3 |
| | 12.7 | % | | 786.0 |
| | 12.8 | % | |
| Total | $ | 6,485.7 |
| | 100.0 | % | | $ | 6,144.0 |
| | 100.0 | % | | 5,962.9 |
| | 100.0 | % | | 5,702.9 |
| | 100.0 | % |
IMPAIRMENT OF LONG-LIVED ASSETSImpairment of Long-Lived Assets
Management regularly reviews property and equipment and other long-lived assets including certain definite-lived intangible assets and our equity method investments for possible impairment whenever events or changes in circumstances indicate that the carrying value of such assets may not be recoverable.
For our properties and equipment, the indicators of potential impairment may include a deteriorating business or legal climate, a significant adverse change in asset condition, specific regulatory disallowance, advances in technology or plans to dispose of an asset significantly before the end of its useful life, among others. Management performs thea recoverability test whenever the indicators show a possible impairment. The amount used to test recoverability is determined based on an estimate of undiscounted cash flows, and measurement of an impairment loss is determined based on the fair value of the assets. The d
WGL Holdings, Inc
Washington Gas Light Company
Part II
Item 8. Financial Statements and Supplementary Data (continued)
Notes to Consolidated Financial Statements
etermination of fair value requires management to makeasset, using assumptions about future cash inflows and outflows over the life of an asset. Any changes to the assumptions used for the future cash flow could result in revisions to the evaluation of the recoverability of the long-lived assets and the recognition of an impairment loss in the Consolidated Financial Statements.
For our equity method investments, an impairment is recorded when the investment has experienced decline in value that is other-than-temporary. Additionally, if the projects in which we hold an investment recognize an impairment loss, we would record our proportionate share of that impairment loss and evaluate the investment for decline in value that is other-than-temporary. This review occurs quarterly, or more frequently if events or changes in circumstances indicate the carrying amount of the asset may not be recoverable.
During the fiscal year ended September 30, 2018, management determined that, in light of the recent actions taken by the courts and regulators related to our equity method investment in Constitution, the decline in value was other-than-temporary, resulting in WGL recording an impairment charge of $34.0 million in “Equity in earnings of unconsolidated affiliates” that reduced our investment in Constitution to its estimated fair market value. Additionally, Washington Gas recorded a $38.0 million impairment to Property, Plant and Equipment in connection with an agreement ancillary to the merger proceeding not to seek recovery of certain costs incurred under the Formal Case 1027 mechanical coupling program.
During the calendar year ended December 31, 2019, the three months ended December 31, 2018, and fiscal year ended September 30, 2017, WGLWashington Gas did not record any impairments related to our long-lived assets. During the fiscal year ended September 30, 2016, WGL recorded a $4.1 million impairment for the Nextility investment in direct financing leases.
Refer to Note 1415 — Fair Value Measurements Note 16 — Other Investments and Note 20 — Merger with AltaGas, Ltd., of the Notes to Consolidated Financial Statements for further discussion of these assets.
OPERATING LEASES
We have classified the leases of multiple office locations as operating leases. We amortize as rent expense the total of all scheduled lease payments (including lease payment escalations)Cash and tenant allowances on a straight-line basis over the term of the leases. For this purpose, the lease term began on the date when the lessor commenced constructing the leasehold improvements which allowed us to occupy the respective locations. Leasehold improvement costs are classified as “Property, Plant and Equipment” on the Balance Sheets, and are being amortized to depreciation and amortization expense on a straight-line basis over the non-cancelable period of the leases. Refer to Note 12—Commitments and Contingencies for financial data for all of our operating leases.
CASH AND CASH EQUIVALENTSCash Equivalents
We consider all investments with original maturities of three months or less to be cash equivalentsequivalents.
RESTRICTED CASH AND CASH EQUIVALENTSRestricted Cash and Cash Equivalents
Restricted cash and cash equivalents represent funds that are restricted to satisfy designated liabilities. Restricted cash and cash equivalents available to satisfy designated current liabilities are classified as current assets. Restricted cash and cash equivalents expected to satisfy non-current liabilities are classified as non-current assets. Pursuant to the Merger Agreement with AltaGas, we funded rabbi trusts of retirement benefits for executives and select management employees and deferred compensation benefits for outside directors duringin the fourth quarter of fiscal year 2018. As ofended September 30, 2018. At December 31, 2019 and 2018, the rabbi trust funds are invested in money market funds which are considered as cash equivalents. The rabbi trust funds that are used for the settlement of benefit plans in long-term liabilities are classified in “Deferred charges and other assets-other”. The rabbi trust funds to settle benefit plans in current liabilities are classified in “Current Assets-Other” on both WGL’s and Washington Gas’ balance sheets. We did not have any restricted cash and cash equivalents as of September 30, 2017.sheet. Refer to Note 9-10 — Pension and Other Post-Retirement Benefits for a further discussion of the rabbi trusts and Note 19-18 — Supplemental Cash Flow Information for a further discussion of restricted cash and cash equivalents.
REVENUE AND COST RECOGNITIONAllowance for Doubtful Accounts
Regulated Utility OperationsThe allowance for doubtful accounts reflects Washington Gas' estimate of losses inherent in its account receivable balances. Washington Gas estimates its bad debt expense based on current sales and establishes the allowance. Periodically, Washington Gas evaluates the reasonableness of the allowance utilizing a variety of factors including the length of time receivables are past due, the financial health of its customers, unusual macroeconomic conditions, and historical payment and collection experience. If the financial condition of its customers deteriorates or other circumstances occur that impact the customers’ ability or desire to make payments, Washington Gas considers these factors in its evaluation of the adequacy of the allowance. Accounts are written off to the allowance when collection efforts are complete and future recovery is unlikely.
Leases
Washington Gas Light Company
Part II
Item 8. Financial Statements and Supplementary Data (continued)
Notes to Financial Statements
Lessee. We determine if an arrangement is a lease and the lease classification at inception. For the operating leases in which we are the lessee, a right-of-use (ROU) asset and a lease liability is recognized at the commencement date based on the present value of lease payments over the lease term. We use the rate implicit in the lease to determine the present value of the lease payments when the rate is readily determinable or we use our incremental borrowing rate. Our ROU assets are adjusted for lease incentives, any lease payments made in advance, and initial direct costs incurred. Lease expenses are recognized on a straight-line basis over the lease term. The estimated lease terms may include options to extend or terminate the lease when it is reasonably certain that we will exercise that option. For our lessee building and certain equipment leases, we do not separate the lease and non-lease components. Variable lease payments are recognized as lease expense when the related facts and circumstances occur, and are dependent on various external factors, including real estate taxes, common area maintenance and usage charges.
For our multiple office location leases classified as operating leases, the lease term begins on the date when construction of the leasehold improvements can start and the lessor has allowed us to occupy the respective locations. Leasehold improvement costs are classified as “Property, Plant, and Equipment” on the balance sheet, and are being amortized to “Depreciation and amortization” expense on a straight-line basis over the non-cancelable period of the leases.
Lessor. We determine if an arrangement is a lease and the lease classification at inception. Lease payments under operating leases are recognized on a straight-line basis over the lease term. For our building leases, we do not separate the lease and non-lease components.
Revenue and Cost of Gas Recognition
Revenues. For regulated deliveries ofWashington Gas generally recognizes revenue from contracts with customers when natural gas is delivered. Washington Gas reads meters and bills customers on a 19-day monthly cycle basis. The billing cycles for customers do not coincide with the accounting periods used for financial reporting purposes; therefore, Washington Gas accrues unbilled revenues for gas delivered, but not yet billed, at the end of each accounting period. Refer to Note 2 — Revenue from Contracts with Customers for further discussion of the Utility’s revenue from contracts with customers.
WGL Holdings, Inc
Alternative Revenue Programs. Certain ratemaking mechanisms of Washington Gas Lightqualify as alternative revenue programs in accordance with ASC Topic 980, Regulated Operations, if (i) the program is established by an order from a regulatory commission and allows for automatic adjustment of future rates, (ii) additional program revenues (above those amounts currently reflected in base rates) are objectively determinable and probable of recovery, and (iii) the collection of the additional revenues is allowed within 24 months of the end of the period in which they were recognized. The Company
Part II
Item 8. Financial Statements has determined that its RNA, WNA and Supplementary Data (continued)
NotesCRA billing adjustment mechanisms and APRPs are alternative revenue programs. Alternative revenue program revenues represent the initial recognition of revenue related to Consolidated Financial Statements
these programs. When amounts are billed and collected from customers through rates, the amounts are recorded as a recovery of the associated regulatory asset or liability.
Cost of Gas. Washington Gas’ jurisdictional tariffs contain mechanisms that provide for the recovery of the cost of gas incurred on behalf of firm customers, including related pipeline transportation and storage capacity charges. Under these mechanisms, Washington Gas periodically adjusts its firm customers’ rates to reflect increases and decreases in these costs. Under or over-collections of gas costs in the current cycle are charged or credited to deferred charges or credits on the balance sheet as non-current regulatory assets or liabilities. Amounts deferred at the end of the cycle, August 31 of each year, are fully reconciled and transferred to current assets or liabilities under the balance sheet captions “Gas costs and other regulatory assets” and “Gas costs and other regulatory liabilities.” These balances are recovered or refunded to customers over the subsequent 12 month period.
Revenue Taxes. Revenue taxes such as gross receipts taxes, Public Service Commission (PSC)regulatory fees, franchise fees and energy taxes are reported gross in operating revenues. During the calendar year ended December 31, 2019, three months ended December 31, 2018, and for fiscal years ended September 30, 2018 and 2017, and 2016,$81.8 million, $24.2 million, $82.5 million, $75.1 million, and $73.0$75.1 million, respectively, were recorded to operating revenues."Operating revenues" of Washington Gas' statements of operations.
Transportation Gas Imbalance. Interruptible shippers and third-party marketer shippers transport gas to Washington Gas’ distribution system as part of the unbundled services offered. The delivered volumes of gas from third-party shippers into Washington Gas’ distribution system rarely equal the volumes billed to third-party marketer customers, resulting in transportation gas imbalances. These imbalances are usually short-term in duration, and Washington Gas monitors the activity and regularly notifies the shippers when their accounts have an imbalance. In accordance with regulatory treatment, Washington Gas does not record a receivable from or liability to third-party marketers associated with gas volumes related to these transportation imbalances but, rather, reflects the financial impact as a regulatory asset or liability related to its gas cost adjustment mechanism, thereby eliminating any profit or loss that would occur as a resultbecause of the imbalance. The regulatory treatment combines the imbalance for all marketers, including our affiliate WGL Energy Services, into a single “net”
Washington Gas Light Company
Part II
Item 8. Financial Statements and Supplementary Data (continued)
Notes to Financial Statements
adjustment to the regulatory asset or liability. Refer to Note 17—16 — Related Party Transactions for further discussion of the accounting for these imbalance transactions.
Asset Optimization Program. Washington Gas optimizes the value of its long-term natural gas transportation and storage capacity resources by entering into physical and financial transactions in the form of forwards, futures and option contracts for periods when these resources are not being used to physically serve utility customers. Refer to “Derivative Activities” below for further discussion of the accounting for derivative transactions entered into under this program. Regulatory sharing mechanisms in all three jurisdictions allowoutline how the profitprofits from these transactions toshould be shared betweenwith Washington Gas’ customers and shareholders.customers.
All unrealized fair value gains and losses, and margins generated from the physical and financial settlement of these asset optimization contracts are recorded in "Utility cost of gas" on the income statement or, in the case of amounts to be shared with rate payers, regulatory assets/liabilities on the balance sheet.
Non-Utility OperationsStorage Gas
Retail Energy-Marketing Segment. WGL Energy Services sellsPrior to September 30, 2017, Washington Gas accounted for storage gas inventories using the first-in, first-out method under which the oldest inventory items were recorded as being sold first. Starting in October 1, 2017, Washington Gas implemented a voluntary change in the application of an accounting principle with respect to accounting for natural gas, propane, and electricity on an unregulated basis to residential, commercial and industrial customers both inside and outside theodorant inventories. Washington Gas service territory.
WGL Energy Services enters into indexed or fixed-rate contracts with residential, commercial and industrial customers for sales of natural gas and electricity. Customer contracts typically have terms less than 24 months, but may extend up to 5 years. WGL Energy Services bills customers based upon metered gas and electricity usage. Usage is measured either on a cycle basis at customer premises or based on quantities delivered tonow applies the local utility, both ofaverage cost methodology under which may vary by month. The billing cycles for customers do not coincide with the accounting periods used for financial reporting purposes; therefore, WGL Energy Services accrues unbilled revenues for gas and electricity delivered, but not yet billed, at the end of each accounting period. In addition, WGL Energy Services periodically makes spot sales in the wholesale market due to specific delivery requirements or to reduce customer supply costs. Revenues are reflected in “Operating Revenues—Non- utility.”
WGL Energy Services procures natural gas and electricity supply under contract structures in which it assembles the various components of supply from multiple suppliers to match its customer requirements. The cost of natural gas and electricity for these purchasesunits carried in inventory is recorded using the contracted volumes and prices in “Non-Utility cost of energy-related sales.”
Commercial Energy Systems Segment. WGL Energy Systems recognizes income and expenses for all design-build construction contracts using the percentage-of-completion method in “Operating Revenues—Non-utility” and “Non-Utility cost of energy-related sales.” WGL Energy Systems also recognizes income from its distributed energy assets based on the termsweighted average cost per unit of the related power purchase agreements. Renewable Energy Certificates (RECs) are generated by WGL Energy Systems after every 1,000 Kilowatt-hours (kWh) of electricity are produced by an eligible solar facility. WGL Energy Systems recognizes
WGL Holdings, Inc
inventory. Washington Gas Light Company
Part II
Item 8. Financial Statements and Supplementary Data (continued)
Notes to Consolidated Financial Statements
incomeimplemented the change in accounting principle on the sale of RECs based on the contractual terms and conditions of the sale. Refer to Note 16—Other Investments for discussion of our income from operating lease arrangements and equity method investments.
Midstream Energy Services Segment. WGL Midstream nets its revenues and costs related to its trading activities in "Operating Revenues—Non-utility". Any profits and losses from WGL Midstream's pipeline investments are included in “Equity in earnings of unconsolidated affiliates” in the accompanying Consolidated Statement of Income and are added to or subtracted from the carrying amount of WGL’s investment balance. Refer to Note 16—Other Investments for discussion of our pipeline equity method investments.
WEATHER-RELATED INSTRUMENTS
Periodically, we purchase certain weather-related instruments, such as HDD derivatives and CDD derivatives. We account for these weather related instrumentsa prospective basis in accordance with ASC Subtopic 815-45, DerivativesTopic 980.
On October 1, 2017, Washington Gas adopted ASU 2015-11, Inventory (Topic 330) - Simplifying the Measurement of Inventory. As a result of the new standard, beginning October 1, 2017, our inventory balances are stated at the lower of cost or net realizable value. Prior to October 1, 2017, our inventory balances were stated at the lower of cost or market. Interim period inventory losses attributable to lower of cost or net realizable value adjustments may be reversed if the net realizable value of the inventory is recovered by the end of the same year. In general, commodity costs and Hedging—Weather Derivatives. For HDD derivatives, benefits orvariable transportation costs are ultimately recognizedcapitalized as gas in underground storage. Fixed costs, primarily pipeline demand charges and storage charges, are expensed as incurred through the cost of gas.
Washington Gas did not record a material lower-of-cost or net realizable value adjustment to net income for the extent actual HDDs fall abovecalendar year ended December 31, 2019, three months ended December 31, 2018, and fiscal year September 30, 2018, or belowa lower-of-cost or market adjustment to net income for the contractual HDDs for each instrument. Benefits or costs are recognized for CDD derivatives when the average temperature exceeds or is below a contractually stated level during the contract period. Premiums for weather-related instruments are amortized based on the pattern of normal temperature days over the coverage period. Weather-related instruments for which we collect a premium are carried at fair value. Refer to Note 13—fiscal year ended September 30, 2017.
Derivative and Weather-Related Instruments for further discussion of our weather-related instruments.Activities
DERIVATIVE ACTIVITIES
Regulated Utility.Washington Gas enters into both physical and financial derivative contracts for the purchase and sale of natural gas that are subject to mark-to-market accounting. Changes in the fair value of derivative instruments which are recoverable or refundable to customers when they settle are subject to ASC Topic 980 and are recorded as regulatory assets or liabilities while changes in the fair value of derivative instruments not affected by rate regulation are reflected in earnings.
As part of its asset optimization program, Washington Gas enters into derivative contracts related to the sale and purchase of natural gas at a future price with the primary objective of securing operating margins that Washington Gas expects to ultimately realize. The fair value changes of derivatives used under this program may cause significant period-to-period volatility in earnings for the portion of net profits retained for shareholders; however, this earnings volatility will not change the realized margins that Washington Gas expects to earn. In accordance with ASC Topic 815, all financially and physically settled contracts under our asset optimization program are reported on a net basis in the statements of incomeoperations in “Utility cost of gas”.
From time to time, Washington Gas also utilizeshistorically utilized derivative instruments that are designed to minimize the risk of interest-rate volatility associated with planned issuances of long-term debt. Gains or losses associated with these derivative transactions are deferred as regulatory assets or liabilities and amortized to interest expense in accordance with regulatory accounting requirements. Refer to Note 13—14 — Derivative and Weather-Related InstrumentsDerivatives for further discussion of our derivative activities.
Non-Utility Operations. WGL Energy Services enters into both physical and financial contracts for the purchase and sale of natural gas and electricity. WGL Energy Services designates a portion of these physical contracts related to the purchase of natural gas and electricity to serve our customers as “normal purchases and normal sales;” therefore, they are not subject to the mark-to-market accounting requirements of ASC Topic 815. WGL Energy Services records these derivatives as revenues or expenses depending on the nature of the economically hedged item. WGL Midstream enters into derivative contracts for the purpose of optimizing its storage and transportation capacity as well as managing the transportation and storage assets on behalf of third parties. The financial contracts and the portion of the physical contracts that qualify as derivative instruments are subject to the mark-to-market accounting requirements and are recorded on the balance sheet at fair value and are reflected in earnings. WGL Midstream nets financial and physical contracts in "Operating Revenues-Non-utility". WGL may, from time to time, designate interest rate swaps used to manage the interest rate risk associated with future debt issuances, as cash flow hedges. Any gains or losses arising from the effective portion of cash flow hedges are recorded in other comprehensive income and are amortized using the effective interest rate method into earnings over the same period as the hedged interest payments are made. Gains or losses arising from the ineffective portion of cash flow hedges are recognized in earnings immediately.Income Taxes
INCOME TAXES
We recognize deferred income tax assets and liabilities for all temporary differences between the financial statement basis and the tax basis of assets and liabilities includingcomputed on a separate company basis. Our deferred income taxes include those that are currently excluded for ratemaking purposes of Washington Gas. Regulatory assets or liabilities, corresponding to such additional deferred income tax assets or liabilities, may be recorded to the extent recoverable from or payable to customers through the ratemaking process in future periods. Refer to Note 2—
WGL Holdings, Inc
Washington Gas Light Company
Part II
Item 8. Financial Statements and Supplementary Data (continued)
Notes to Consolidated Financial Statements
4 — Regulated Operations for Washington Gas’ regulatory assets and liabilities associated with income taxes due from and due to customers at September 30, 2018 and 2017.customers. Amounts applicable to income taxes due
Washington Gas Light Company
Part II
Item 8. Financial Statements and Supplementary Data (continued)
Notes to Financial Statements
from and due to customers primarily represent differences between the financial statement basis and tax basis of net utility plant in service. We amortize investment tax credits as reductions to income tax expense over the estimated service lives of the related properties. Refer to Note 8—9 — Income Taxes which provides detailed financial information related to our income taxes.
STOCK-BASED COMPENSATIONStock-Based Compensation
We generally account for stock-based compensation expense in accordance with ASC Topic 718, Compensation-Stock Compensation, which requires us to measureor ASC Topic 710, Compensation - General for certain awards that do not meet the definition of a stock-based award under ASC 718. All outstanding awards at December 31, 2019 and recognize stock-based compensation expense in our financial statements based on the fair value at the date of grant for our equity-classified share-based awards. If the awards have a performance condition that is not a market condition, stock-based compensation expense is adjusted on the probable outcome of that condition. If the awards have a market condition, stock-based compensation expense is not adjusted to reflect the ultimate achievement of the market condition.
For2018 are liability-classified share-based awards, weawards.
We recognize stock-based compensation expense based on their fair value at the end of each reporting period. In addition, certainCompensation expense for awards are accounted for undersubject to ASC Topic 710 Compensation - General, because they do not meet the definition of a stock-based award under ASC Topic 718. Compensation expense is recognized based on the probable outcome of the award at the end of each reporting period. For both equity-classified and liability-classified share-basedall awards, we estimate forfeitures over the requisite service period when recognizing compensation expense; these estimates are periodically adjusted to the extent to which actual forfeitures differ from such estimates. Refer to Note 10-Stock-Based11 — Stock-Based Compensation for further discussion of the accounting for our stock-based compensation plans.
ASSET RETIREMENT OBLIGATIONSAsset Retirement Obligations
Washington Gas accounts for its AROs in accordance with ASC Subtopic 410-20, Asset Retirement and Environmental Obligations—Asset Retirement Obligations. Our AROs include the costs to cut, purge and cap Washington Gas' distribution and transmission system and plug storage wells upon their retirement. We also have AROs associated with our distributed generation assets.system. These standards require recording the estimated retirement cost over the life of the related asset by depreciating the present value of the retirement obligation, measured at the time of the asset’s acquisition, and accreting the liability until it is settled. There are timing differences between the ARO-related accretion and depreciation amounts being recorded pursuant to GAAP and the recognition of depreciation expense for legal asset removal costs that we are currently recovering in rates. These timing differences are recorded as a reduction to “Regulatory liabilities—Accrued asset removal costs” in accordance with ASC Topic 980. We do not have any assets that are legally restricted related to the settlement of asset retirement obligations.
| | | WGL Holdings, Inc. | |
Changes in Asset Retirement Obligations | | | | | Calendar Year Ended December 31, | Three Months Ended December 31, | | Fiscal Year Ended September 30, |
| (In millions) | | | 2019 | 2018 | | 2018 | | 2017 |
| September 30, | 2018 | | 2017 | |
| Asset retirement obligations at beginning of year | $ | 303.9 |
| | $ | 210.3 |
| |
| Asset retirement obligations at beginning of the period | | | $ | 308.1 |
| $ | 305.5 |
| | $ | 298.9 |
| | $ | 206.6 |
|
| Liabilities incurred in the period | 2.5 |
| | 3.0 |
| | 1.7 |
| — |
| | 1.4 |
| | 2.0 |
|
| Revaluation of asset retirement obligation | — |
| | 89.5 |
| | (101.0 | ) | — |
| | — |
| | 89.5 |
|
| Liabilities settled in the period | (7.3 | ) | | (7.2 | ) | | (7.4 | ) | — |
| | (7.3 | ) | | (7.2 | ) |
| Accretion expense | 12.6 |
| | 8.3 |
| | 10.2 |
| 2.6 |
| | 12.5 |
| | 8.0 |
|
Asset retirement obligations at the end of the year(a) | $ | 311.7 |
| | $ | 303.9 |
| |
Asset retirement obligations at the end of the period(a) | | | $ | 211.6 |
| $ | 308.1 |
|
| $ | 305.5 |
| | $ | 298.9 |
|
(a)Includes short-term asset retirement obligations of $4.8 million, $7.3 million, $7.3 million and $7.1 million for calendar year ended December 31, 2019, three months ended December 31, 2018, and fiscal years ended September 30, 2018 and 2017, respectively.
WGL Holdings, Inc
Accounting Standards Adopted in the Calendar Year and Other Newly Issued Accounting Standards
The following tables represent accounting standards adopted by Washington Gas during the calendar year ended December 31, 2019, and other newly issued accounting standards that will be adopted by Washington Gas in the future.
Washington Gas Light Company
Part II
Item 8. Financial Statements and Supplementary Data (continued)
Notes to Consolidated Financial Statements
|
| | | | | | | |
Washington Gas Light Company |
| Changes in Asset Retirement Obligations |
| (In millions) | |
| September 30, | 2018 | | 2017 |
| Asset retirement obligations at beginning of year | $ | 298.9 |
| | $ | 206.6 |
|
| Liabilities incurred in the period | 1.4 |
| | 2.0 |
|
| Revaluation of asset retirement obligation | — |
| | 89.5 |
|
| Liabilities settled in the period | (7.3 | ) | | (7.2 | ) |
| Accretion expense | 12.5 |
| | 8.0 |
|
Asset retirement obligations at the end of the year(a) | $ | 305.5 |
| | $ | 298.9 |
|
(a)Includes short-term asset retirement obligations of $7.3 million and $7.1 million for fiscal year 2018 and 2017, respectively.
ACCOUNTING STANDARDS ADOPTED THIS FISCAL YEAR AND OTHER NEWLY ISSUED ACCOUNTING STANDARDS
The following tables represent accounting standards adopted by WGLH and Washington Gas during the fiscal year ended September 30, 2018 and other newly issued accounting standards that will be adopted by WGLH and Washington Gas in the future.
WGL Holdings, Inc
Washington Gas Light Company
Part II
Item 8. Financial Statements and Supplementary Data (continued)
Notes to Consolidated Financial Statements
|
| | | | | | |
ACCOUNTING STANDARDS ADOPTED IN FISCALCALENDAR YEAR 20182019 |
| Standard | | Description | | Date of adoption | | Effect on the financial statements or other significant matters |
ASU 2018-02, Income Statement—Reporting Comprehensive Income (Topic 220): Reclassification of Certain Tax Effects from Accumulated Other Comprehensive Income | | This update provides an option to reclassify the stranded tax effects resulting from the enactment of the Tax Act from accumulated other comprehensive income to retained earnings. The amendment only relates to the reclassification of the income tax effects of the Tax Act and the underlying guidance that requires that the effect of a change in tax laws or rates be included in income from continuing operations is not affected.
Election to reclassify the income tax effects in accumulated other comprehensive income (AOCI) to retained earnings is voluntary and should be disclosed if AOCI is not adjusted.
WGL elected to early adopt this standard in the fourth quarter of fiscal year 2018. | | September 30, 2018 | | As a result of the early adoption of this standard, WGL and Washington Gas reclassified a credit of $1.8 million and $1.5 million, respectively, from AOCI to retained earnings at September 30, 2018. |
ASU 2016-18, Statement of Cash Flows (Topic 230): Restricted Cash (a consensus of the FASB Emerging Issues Task Force) | | This standard requires restricted cash and restricted cash equivalents to be included in the cash and cash equivalents balances when reconciling the statement of cash flows. Presentation of restricted cash balances should be applied retrospectively to the statement of cash flows. WGL elected early adoption of this standard. | | September 30, 2018 | | At September 30, 2018, WGL had a balance of $65.0 million in multiple rabbi trusts invested in money market funds. These amounts are included in cash, cash equivalents and restricted cash balance in the Statement of Cash Flows for the fiscal year ended September 30, 2018. We did not have restricted cash and restricted cash equivalents for the fiscal years ended September 30, 2017 and 2016. For a further discussion, see the Statements of Cash Flows and Note 19-Supplemental Cash Flow Information.
|
WGL Holdings, Inc
Washington Gas Light Company
Part II
Item 8. Financial Statements and Supplementary Data (continued)
Notes to Consolidated Financial Statements
|
| | | | | | |
ASU 2016-15, Statement of Cash Flows (Topic 230)—Classification of Certain Cash Receipts and Cash Payments (a consensus of the FASB Emerging Issues Task Force) | | This update provides guidance on the classification of certain cash receipts and payments in the statement of cash flows. Early adoption is permitted and WGLH and Washington Gas elected early adoption of this standard. | | September 30, 2018 | | In September 2018, WGL and Washington Gas each reclassified $3.2 million of insurance proceeds related to our property and equipment from “Net Cash Provided by Operating Activities” to “Net Cash Used in Investing Activities” in Statement of Cash flows for the fiscal year ended September 30, 2018. We evaluated the impact of accounting guidance ASU 2016-15, and concluded that no other adjustments were needed for the fiscal years ended September 30, 2017 and 2016.
|
ASU 2018-05, Income Taxes (Topic 740)—Amendments to SEC Paragraphs Pursuant to SEC Staff Accounting Bulletin No. 118 | | This standard adds to the Codification various SEC paragraphs pursuant to the Issuance of Staff Accounting Bulletin (SAB) No. 118. and addresses the specific situation in which the initial accounting for certain income tax effects of the Tax Act will not be complete at the time that financial statements were issued covering the reporting period that includes the enactment date of December 22, 2017. | | October 1, 2017 | | Quarterly disclosures were incorporated in the Income Tax footnote in each of the FY 2018 Form 10-Q's filed with the SEC and will continue to be updated until the end of the measurement period. See Note 8-Income Taxes of the Notes to Consolidated Financial Statements for additional information.
|
WGL Holdings, Inc
Washington Gas Light Company
Part II
Item 8. Financial Statements and Supplementary Data (continued)
Notes to Consolidated Financial Statements
|
| | | | | | |
ASU 2016-09, Compensation—Stock Compensation (Topic 718): Improvements to Employee Share-Based Payment Accounting
| | This standard simplifies several aspects of the accounting for share-based payment transactions, including accounting for income taxes, forfeitures, statutory tax withholding requirements and classification in the statement of cash flows.
| | October 1, 2017 | | Forfeitures - WGL has elected to continue to estimate forfeitures for its share-based payment awards rather than account for forfeitures when they occur.
Income Taxes - On October 1, 2017, WGL and Washington Gas recorded $4.3 million and $4.2 million, respectively, on a modified retrospective basis, as a cumulative effect adjustment to retained earnings. For the fiscal year ended September 30, 2018, WGL and Washington Gas recorded $3.5 million and $3.2 million, respectively, to current tax expense for excess tax benefits related to performance shares that vested in the period.
Cash Flows - WGL and Washington Gas retroactively reclassified $3.6 million and $3.5 million, respectively, on the statement of cash flows for the fiscal year ended September 30, 2017 from operating to financing activities related to shares withheld to pay for employee taxes. For the presentation of excess tax benefits in the statement of cash flows, WGL elected to present the change prospectively.
Statutory Tax Withholding - No changes were made.
|
ASU 2016-06, Derivatives and Hedging (Topic 815) - Contingent Put and Call Options in Debt Instruments | | The amendments in this update clarify the requirements for assessing whether contingent call (put) options that can accelerate the payment of principal on debt
instruments are clearly and closely related to their debt hosts. The guidance states that for contingent call (put) options to be considered clearly and closely related, they can be indexed only to interest rates or credit risk. An entity is required to assess the embedded call (put) options solely in accordance with the four-step decision sequence. | | October 1, 2017 | | The implementation of this standard did not have an effect on WGL or Washington Gas' financial statements. |
WGL Holdings, Inc
Washington Gas Light Company
Part II
Item 8. Financial Statements and Supplementary Data (continued)
Notes to Consolidated Financial Statements
|
| | | | | | |
ASU 2015-11, Inventory (Topic 330) - Simplifying the Measurement of Inventory | | This standard reduces the complexity in the current measurement of inventory. This ASU requires inventory to be measured at the lower of cost and net realizable value, where net realizable value is the estimated selling price in the ordinary course of business less reasonably predictable costs of completion, disposal and transportation (no change to the definition of net realizable value). The amendment eliminates the guidance that requires inventory to be stated at the lower of cost or market, which includes consideration of the replacement cost of inventory and the net realizable value of inventory, less an approximately normal profit margin. | | October 1, 2017 | | The implementation of this standard did not have a material effect on WGL or Washington Gas' financial statements. Refer to the “Change in Accounting Principle and Storage Gas Valuation Methods” section above for more information.
|
|
| | | | | | |
OTHER NEWLY ISSUED ACCOUNTING STANDARDS
|
Standard | | Description | | Required date of adoption
| | Effect on the financial statements or other significant matters |
ASU 2017-07, Compensation - Retirement Benefits (Topic 715): Improving the Presentation of Net Periodic Pension Cost and Net Periodic Postretirement Benefit Cost
| | This standard requires entities to report the service cost component in the same financial statement line item as other compensation costs arising from services rendered by the pertinent employees during the period. The other components of net benefit cost are to be presented separately from service cost and outside of operating income. In addition, only the service cost component of net benefit cost is eligible for capitalization. Changes to the presentation of service costs and other components of net benefit cost should be applied retrospectively. Changes in capitalization practices should be implemented prospectively.
| | October 1, 2018 | | We have concluded our evaluation of the interaction of this standard with the various regulatory provisions concerning pensions and post-retirement benefit costs. For the fiscal years ended September 30, 2018 and 2017, we expect to record a reclassification of $16.4 million and $6.5 million for WGL, and $11.6 million and $3.6 million for Washington Gas, respectively, of net periodic benefit income from operating expenses to other income in the Consolidated Statements of Income. The change in capitalization of retirement benefits will not have a material impact on WGL or Washington Gas' financial statements.
|
WGL Holdings, Inc
Washington Gas Light Company
Part II
Item 8. Financial Statements and Supplementary Data (continued)
Notes to Consolidated Financial Statements
|
| | | | | | |
ASU 2014-09, Revenue from Contracts with Customers (Topic 606), including subsequent ASUs clarifying the guidance.
| | ASU 2014-09 establishes a comprehensive revenue recognition model clarifying the method used to determine the timing and requirements for revenue recognition from contracts with customers. The disclosure requirements under the new standard will enable users of financial statements to understand the nature, amount, timing, and uncertainty of revenue and cash flows arising from contracts with customers.
| | October 1, 2018 | | An implementation team has completed evaluating all revenue streams and reviewing contracts with customers, as well as, related financial statement disclosures to determine the impact the adoption of this standard will have on our financial statements. WGL has performed assessments and contract reviews of its revenue streams under the new revenue recognition model. WGL has finalized its review and is developing the new disclosures required by the standard. Currently, WGL does not expect adoption of this standard to have a material effect to its Consolidated Statements of Income or require a cumulative adjustment to retained earnings upon adoption of the standard. WGL will adopt using the modified retrospective approach.
|
ASU 2016-01, Financial Instruments (Subtopic 825-10): Recognition and Measurement of Financial Assets and Financial Liabilities including subsequent ASUs clarifying the guidance. | | The new standard amends certain disclosure requirements associated with the fair value of financial instruments, and significantly revises an entity’s accounting related to the classification and measurement of investments in equity securities and the presentation of certain fair value changes for financial liabilities measured at fair value. Early adoption is permitted.
| | October 1, 2018 | | We have completed our evaluation and the adoption of this standard will primarily impact the disclosure of our financial instruments in our Fair Value Measurements Footnote however, we do not expect the impact to be material.
|
WGL Holdings, Inc
Washington Gas Light Company
Part II
Item 8. Financial Statements and Supplementary Data (continued)
Notes to Consolidated Financial Statements
|
| | | | | | |
ASU 2016-02, Leases (Topic 842), ASU 2018-01, Land Easement Practical Expedient for Transition to Topic 842, and ASU 2018-11, Targeted Improvements, and ASU 2018-20, Narrow-Scope Improvements for Lessors, including other subsequent ASUs clarifying the guidance.
| | ASU 2016-02 requires recognition of a right-to-use asset and lease liability by lessees on the statement of financial position and disclosure of key information about leasing arrangements. Lessor accounting remains substantially unchanged but the standard modifies what qualifies as a sales-type and direct financing lease and eliminated real-estate specific provisions. The standard requires application using a modified retrospective approach.
ASU 2018-01 provides an optional election not to evaluate existing and expired land easements not previously accounted for as a lease.
ASU 2018-11 allows entities to elect to report comparative periods presented after adoption under the old lease standard (ASC Topic 840, Leases) and recognize a cumulative effect adjustment to the opening balance at the date of adoption. The update also provides lessors a practical expedient not requiring the separation of lease and non-lease components provided that certain conditions are met.
ASU 2018-20 allows lessors to include and exclude certain costs from variable payments. The ASU also requires lessors to allocate certain variable payments to the lease and non-lease components when the changes in facts and circumstances on which the variable payments are based occur.
| | OctoberJanuary 1, 2019
| | WGLLeases, with terms longer than 12 months, for which Washington Gas is currently performing a scoping exercise by gathering a complete inventory of lease contracts in order to evaluate the impact of adopting ASC Topic 842 on its consolidated financial statements and expects that the new standard willlessee have an impact on the Company’s balance sheet as all operating leases will need to bebeen reflected on the balance sheet upon adoption. In addition, WGL currently expectsby recording an increase to utilizenon- current assets and an increase to deferred credits net of the current portion that is recorded in current liabilities. Upon adoption, Washington Gas recorded lease liabilities of $58.9 million and a right-of-use asset of $43.2 million, net of lease incentives and prepaid or deferred rent balances of $15.7 million. Washington Gas utilized the transition practical expedients which allow entities to not have to reassess whether an arrangement contains a lease and the lease classification under the provisions of ASC Topic 842.842, land easements, and not separating out the lease and non-lease components for certain classes of assets. As a result of the transition practical expedients, Washington Gas’ operating leases on transition are consistent with its conclusions under ASC Topic 840, Leases. Washington Gas has also elected to present prior comparative information under ASC Topic 840. See Note 3 — Leases for further information and the new required lease disclosures.
|
Washington Gas Light Company
Part II
Item 8. Financial Statements and Supplementary Data (continued)
Notes to Financial Statements
|
ASU 2016-13, Financial Instruments-Credit Losses (Topic 326): Measurement of Credit Losses on Financial Instruments
| | For credit losses on financial instruments, this standard changes the current incurred loss impairment methodology to an expected loss methodology and requires consideration of a broader range of reasonable and supportable information to determine credit loss estimates.
| | October 1, 2020 | | We are in the process of evaluating the impact the adoption of this standard will have on our financial statements. Early adoption is permitted.
|
| ASU 2017-12, Derivatives and Hedging (Topic 815): Targeted improvements to Accounting for Hedging Activities and ASU 2018-16, Inclusion of the Secured Overnight Financing Rate (SOFR) Overnight Index Swap (OIS) Rate as a Benchmark Interest Rate for Hedge Accounting Purposes | | The new standardASU 2017-12 amends the hedge accounting and recognition requirements by expanding an entity'sentity’s ability to hedge non-financial and financial risk components and reduce the complexity in fair value hedges of interest rate risk. Additionally, this standard eliminates the requirement to separately measure and disclose the ineffective portion of the hedge with the entire change in the fair value of a hedging instrument to be presented in the same income statement of operations line as the hedged item. Early adoption is permitted.
ASU 2018-16 adds the OIS rate based on SOFR as a fifth U.S. benchmark interest rate for hedge accounting purposes. This standard should be adopted in conjunction with ASU 2017-12 if not early adopted.
| | OctoberJanuary 1, 2020*2019 | | The proposedadoption of this ASU did not have an impact to our financial statements. The guidance would be applicable to WGL andwill only have an impact on new transactions that are entered into and where hedge accounting is elected. |
WGL Holdings, Inc
Washington Gas Light Company
Part II
Item 8. Financial Statements and Supplementary Data (continued)
Notes to Consolidated Financial Statements
|
| | | | | | |
ASU 2018-13, Fair Value Measurement (Topic 820): Disclosure Framework—Changes to the Disclosure Requirements for Fair Value Measurement | | This update modifies the disclosure requirements on fair value measurements.
| | October 1, 2020* | | It is not expected that the adoption of this standard will have a material effect on our financial statements.
|
| ASU 2018-15, Intangibles-Goodwill and Other-Internal-Use Software (Subtopic 350-40): Customer’s Accounting for Implementation Costs Incurred in a Cloud Computing Arrangement That Is a Service Contract (a consensus of the FASB Emerging Issues Task Force) | | The update aligns the requirements for capitalizing implementation costs incurred in a hosting arrangement that is a service contract with the requirements to capitalize implementation costs incurred to develop or obtain internal-use software (and hosting arrangements that include an internal-use software license). Capitalized implementation costs should be presented in the statement of financial position as a prepaid expense and the expenses, which are amortized over the term of the hosting arrangement, presented in statementthe statements of incomeoperations in the same line items as prepayment of fees associated with the hosting arrangement.
The updates in this standard may be applied on a prospective or retrospective basis. Early adoption is permitted. | | OctoberJanuary 1, 2020*2019 | | We early adopted this standard on a prospective basis. The adoption of this ASU did not have a material effect on our financial statements.
|
Washington Gas Light Company
Part II
Item 8. Financial Statements and Supplementary Data (continued)
Notes to Financial Statements
|
| | | | | | |
OTHER NEWLY ISSUED ACCOUNTING STANDARDS |
| Standard | | Description | | Required date of adoption | | Effect on the financial statements or other significant matters |
| ASU 2016-13, Financial Instruments-Credit Losses (Topic 326): Measurement of Credit Losses on Financial Instruments, including other subsequent ASUs further amending and clarifying the guidance. | | For credit losses on financial instruments measured at amortized cost, this standard changes the current incurred loss impairment methodology to an expected loss methodology and requires consideration of a broader range of reasonable and supportable information to determine credit loss estimates. In addition, entities may make a one-time irrevocable election on certain eligible financial instruments to elect fair value treatment on an instrument-by-instrument basis. Early adoption is permitted. | | January 1, 2020 | | Cash equivalents, trade accounts receivable, unbilled revenue, and contract assets are within the scope of the new standard. We will make a one-time election to measure our cash equivalents at fair value. We analyzed our current methodology to recognize estimated credit losses and we will be making adjustments to our current methodology at adoption to meet the requirements of the new standard. These changes are not expected to have a material effect on our financial statements. |
| ASU 2018-13, Fair Value Measurement (Topic 820): Disclosure Framework—Changes to the Disclosure Requirements for Fair Value Measurement | | This update modifies the disclosure requirements on fair value measurements. Early adoption is permitted. | | January 1, 2020 | | It is not expected that the adoption of this standard will have a material effect on our financial statements.
|
| ASU 2019-01, Leases (Topic 842) Codification Improvements | | This update addresses the determination of the fair value of the underlying asset by lessors that are not manufacturers or dealers, provides guidance for the presentation of the statement of cash flows for sales-type and direct financing leases, and clarifies transition disclosures related to the adoption of ASC 842. | | January 1, 2020 | | It is not expected that the adoption of this standard will have a material effect on our financial statements.
|
| ASU 2018-14, Compensation—Retirement Benefits—Defined Benefit Plans—General (Subtopic 715-20): Disclosure Framework—Changes to the Disclosure Requirements for Defined Benefit Plans | | This standard modifies the disclosure requirements related to defined benefit pension and other postretirement plans. Early adoption is permitted.
| | September 30, 2021*December 31, 2020 | | We doIt is not anticipateexpected that the adoption of this standard will have a material effect on WGL or Washington Gas'our financial statements.
|
| ASU 2019-12, Income Taxes (Topic 740) Simplifying the Accounting for Income Taxes | | As part of FASB's Simplification Initiative, this standard amends ASC Topic 740 by removing certain exceptions to the general principles and clarifying and amending other current guidance. | | January 1, 2021 | | We are in the process of evaluating the impact the adoption of this standard will have on our financial statements. |
*WGL may adopt this accounting standard early after the Merger with AltaGas to align the timing of implementation with its new parent company. WGL uses fiscal year for reporting its financial statements, while AltaGas uses calendar year, and the effective dates for accounting standards are different between fiscal and calendar accounting periods.
WGL Holdings, Inc
Washington Gas Light Company
Part II
Item 8. Financial Statements and Supplementary Data (continued)
Notes to Consolidated Financial Statements
NOTE 2. REVENUE FROM CONTRACTS WITH CUSTOMERS
The Company adopted ASU 2014-09, Revenue from Contracts with Customers (ASC 606) and subsequent ASUs clarifying the guidance on October 1, 2018, using the modified retrospective method of adoption. Under this approach, prior year results are not required to be restated. Adoption of this standard did not change the timing or pattern of revenue recognition and a cumulative-effect adjustment was not recorded upon adoption. As a result, comparative disclosures for operating results for calendar year 2018 is not applicable because implementing the new standard did not change the timing or pattern of revenue recognition.
The Company recognizes revenue from contracts with customers to depict the transfer of goods or services to customers at an amount it expects to be entitled to in exchange for those goods or services. Washington Gas sells natural gas and distribution services to residential, commercial, industrial and governmental customers through regulated tariff rates approved by regulatory commissions in the jurisdictions where it operates. Customers are billed monthly based on regular meter readings. Customer billings are based on two main components: (i) a fixed service fee and (ii) a variable fee based on usage. For customers who choose to purchase their natural gas from Washington Gas, the bill will include a usage based charge for the cost of the commodity. Revenue is recognized over time as the natural gas is delivered or as the service is performed. As meter readings are performed on a cycle basis, Washington Gas recognizes accrued revenue for any services rendered to its customers but not billed at month-end. The tariff sales are generally considered daily or “at-will” contracts as customers may cancel their service at any time (subject to notification requirements in the tariff), and revenue generally represents the amount Washington Gas is entitled to invoice. There are certain contracts that have terms of one year or longer. For these contracts, revenue is recognized based on the amount Washington Gas is entitled to bill the customer.
Customers have the choice to purchase natural gas from competitive service providers. Washington Gas charges the competitive service providers balancing fees to manage the natural gas transportation imbalances. Where regulations require, Washington Gas issues customers a consolidated bill to include the natural gas supplied by the competitive service providers and distribution of natural gas. Washington Gas recognizes revenue only for distribution services that it has provided to the customer, and the balancing fees for the services provided to the competitive service provider.
We disaggregate revenue by type of service. The following table disaggregates revenue for the calendar year ended December 31, 2019 and three months ended December 31, 2018:
|
| | | | | | | | |
| Disaggregated Revenue by Type of Service |
| (In millions) | | Calendar Year Ended December 31, 2019 | | Three Months Ended December 31, 2018 |
| Revenue from contracts with customers | | | | |
| Gas and transportation sales | | | | |
| Gas sold and delivered | | $ | 975.8 |
| | $ | 303.2 |
|
| Gas delivered for others | | 270.7 |
| | 74.3 |
|
| Other | | 46.5 |
| | 12.5 |
|
| Other revenues | | 5.6 |
| | 1.5 |
|
| Total revenue from contracts with customers | | $ | 1,298.6 |
| | $ | 391.5 |
|
| Other sources of revenue | | | | |
Revenue from alternative revenue programs (a) | | $ | 19.6 |
| | $ | 9.1 |
|
Leasing revenue (b) | | 0.7 |
| | 0.2 |
|
| Other | | 11.8 |
| | 1.3 |
|
| Total revenue from other sources | | 32.1 |
| | 10.6 |
|
| Total Operating Revenue | | $ | 1,330.7 |
| | $ | 402.1 |
|
(a) Washington Gas has determined that the Utility's RNA,WNA, and CRA billing adjustment mechanisms and APRPs are alternative revenue programs and accounted for under ASC Topic 980.
(b) For the calendar year ended December 31, 2019, revenue generated from Washington Gas lessor operating leases was accounted for under ASC Topic 842, Leases. For the three months ended December 31, 2018, revenue generated from Washington Gas lessor operating leases was accounted for under ASC Topic 840, Leases. See Note 3 — Leases for further information on leases.
Washington Gas Light Company
Part II
Item 8. Financial Statements and Supplementary Data (continued)
Notes to Financial Statements
Washington Gas accrues unbilled revenues for gas delivered, but not yet billed at the end of each accounting period due to our customer billing cycles. “Unbilled revenues” represent performance obligations that have been satisfied and to which Washington Gas has an unconditional right to payment, except for contract assets related to Washington Gas’ area-wide contract, which requires project acceptance by federal government for the right to payment to occur. At December 31, 2019 and 2018, contract assets of $44.2 million and $85.3 million, respectively, have been recorded for financed projects within “Unbilled revenues” on the balance sheets. Washington Gas did not have any contract liabilities at December 31, 2019 and 2018. The Company does not have transaction price amounts allocated to future performance obligations. The Company applies the practical expedient available under ASC Topic 606 and does not disclose information about the remaining performance obligations for (i) contracts with an original expected length of one year or less, (ii) contracts for which revenue is recognized at the amount to which the Company has the right to invoice for performance completed, and (iii) contracts with variable consideration that is allocated entirely to a wholly unsatisfied performance obligation or to a wholly unsatisfied promise to transfer a distinct good or service that forms part of a single performance obligation.
On January 1, 2019, the Company adopted ASU 2016-02, Leases (ASC Topic 842) and the following subsequent ASUs which amended the guidance: ASU 2018-01, Land Easement Practical Expedient for Transition to Topic 842, ASU 2018-10, Codification Improvements, and ASU 2018-11, Leases Targeted Improvements, and ASU 2018-20, Narrow-Scope Improvements for Lessors. The new leasing standard requires lessees to recognize a ROU asset and lease liability for leases classified as an operating lease. The significant effects of adopting this standard and the qualitative and quantitative disclosures required to enable users of the financial statements to assess the amount, timing, and uncertainty of cash flows arising from leases are included in Note 1 — Accounting Policies and below.
Adoption of the new standard had a material impact on our balance sheets but did not have a material impact on our statements of operations. On January 1, 2019, the Company recorded ROU assets of $43.2 million (net of lease incentives and prepaid or deferred rent of $15.7 million), current lease liability of $2.8 million and non-current lease liability of $56.1 million related to our operating leases. The Company currently does not have finance leases. We elected to implement the new leasing standard retrospectively at the beginning of the period of adoption through a cumulative-effect adjustment. Under this approach, prior year results are not required to be restated and disclosures associated with prior periods are reported under ASC Topic 840.
Lessee Leases
The Company elected to use the transition practical expedient which allows an entity not to reassess whether any expired or existing contracts are, or contain, leases; the lease classification for any expired or existing leases; and the initial direct costs for any existing leases. The practical expedient also allows an entity not to reassess whether existing or expired land easements that were not previously accounted for as a lease under ASC Topic 840 was also elected. The Company elected not to separate lease and non-lease components for its building leases and has elected not to record a ROU asset and lease liability for short-term leases. Short-term leases are defined as leases with a term of 12 months or less at the commencement date, including extension options that are reasonably certain of being exercised, and do not include an option to purchase the underlying asset. Short-term lease costs for the period were not material.
Washington Gas has operating leases for our corporate headquarters and other corporate offices, communication tower space, and certain office equipment. Our leases have remaining lease terms from 1 to 22 years. Some of the leases include options to extend the lease terms for 1 to 5 years with prior written notice or automatically renew if either party does not provide intent to terminate. The leases generally have options to terminate with notice prior to the end of the lease term based on the contract terms. Refer to Note 16 — Related Party Transactions for discussion of leases with associated companies.
The following table provides our expected operating lease payments at December 31, 2019. |
| | | |
Maturity of Operating Lease Liabilities
|
| (In millions) | December 31, 2019 |
| 2020 | $ | 6.0 |
|
| 2021 | 5.6 |
|
| 2022 | 5.5 |
|
| 2023 | 5.5 |
|
| 2024 | 5.6 |
|
| Thereafter | 46.3 |
|
| Total lease payments | $ | 74.5 |
|
| Less: Interest | (15.0 | ) |
| Present Value of Lease Liabilities | $ | 59.5 |
|
Rent expense for the calendar year ended December 31, 2019, three months ended December 31, 2018, and fiscal years ended September 30, 2018 and 2017 was $5.2 million, $0.6 million, $5.8 million and $5.3 million, respectively.
The following table provides supplemental cash flow information related to operating leases for the calendar year ended December 31, 2019.
Washington Gas Light Company
Part II
Item 8. Financial Statements and Supplementary Data (continued)
Notes to Financial Statements
|
| | | |
| Supplemental Cash Flow Information Related to Operating Leases |
| ($ in millions) | Calendar Year Ended December 31, 2019 |
| Cash paid for amounts included in the lease liabilities in the operating cash flows | $ | 2.9 |
|
| Operating lease cost (including variable lease costs of $1.9 million) | $ | 7.1 |
|
| Right-of-use assets obtained in exchange for new operating lease liabilities | $ | 1.5 |
|
At December 31, 2019, the weighted average remaining lease term for operating leases was 13.3 years, and the weighted average discount rate was 3.32%.
Lessor Leases
The Company also has lessor leases for land, office space and communication tower space that are classified as operating leases. The accounting for these operating leases remained unchanged upon the adoption of ASC 842. Washington Gas has elected not to separate the lease and non-lease components for its building leases. Our leases have remaining lease terms ranging from less than a year to 81 years. Some of the leases include options to extend the lease terms for 1 to 5 years with prior written notice or automatically renew if the lessee does not provide intent not to renew. The leases generally have options to terminate the leases with notice prior to the end of the lease term based on the contract terms. The lease agreements do not contain material residual value guarantees.
The following table summarizes the future operating lease payments to be received associated with these leases. |
| | | |
Maturity of Operating Lease Payments(a)
|
(In millions) | December 31, 2019 |
| 2020 | $ | 0.9 |
|
| 2021 | 0.7 |
|
| 2022 | 0.7 |
|
| 2023 | 0.7 |
|
| 2024 | 0.6 |
|
| Thereafter | 57.8 |
|
| Total lease payments | $ | 61.4 |
|
(a) The payments are presented on an undiscounted basis
The property, plant and equipment associated with these leases are not material. For information on the lease income recognized during the period, see the Disaggregated Revenue by Type of Service table in Note 2 — Revenue from Contracts with Customers.
During the calendar year ended December 31, 2019, Washington Gas did not record any impairments related to our leased assets.
NOTE 4. REGULATED OPERATIONS Washington Gas accounts for its regulated operations in accordance with ASC Topic 980. This standard includes accounting principles for companies whose rates are determined by independent third-party regulators. When setting rates, regulators may require us to record expense in different periods than may be appropriate for unregulated enterprises. When this occurs, Washington Gas defers the associated costs as assets (regulatory assets) on its balance sheet and records them as expenses on its income statementstatements of operations as it collects the revenues designed to recover these costs through customers’ rates. Further, regulators can also impose liabilities upon a company for gains previously realized or for amounts previously collected from customers for expenses expected to be incurred in the future (regulatory liabilities).
When Washington Gas files a request with certain regulatory commissions to modify customers’ rates, it may be permitted to charge customers new rates, subject to refund, until the regulatory commission renders a final decision on the amount of the authorized change in rates. During this interim period, Washington Gas records a provision for a rate refund regulatory liability based on the difference between the amount it collects in rates and the amount it expects to recover from a final regulatory decision. Similarly, Washington Gas periodically records provisions for rate refunds related to other transactions. Actual results for these regulatory contingencies are often difficult to predict and could differ significantly from the estimates reflected in the financial statements. Refer to Note 12—13 — Commitments and Contingencies for further discussion of regulatory matters and related contingencies.
WGL Holdings, Inc
Washington Gas Light Company
Part II
Item 8. Financial StatementsAt December 31, 2019 and Supplementary Data (continued)
Notes to Consolidated Financial Statements
At September 30, 2018, and 2017, we recorded the following regulatory assets and liabilities on our balance sheets. These assets and liabilities will be recognized as revenues or expenses in future periods as they are reflected in customers’ rates.
Washington Gas Light Company
Part II
Item 8. Financial Statements and Supplementary Data (continued)
Notes to Financial Statements
|
| | | | | | | | | | | | | | | |
| Regulatory Assets and Liabilities |
| (In millions) | Regulatory Assets | | Regulatory Liabilities |
| September 30, | 2018 | | 2017 | | 2018 | | 2017 |
| Current: | | | | | | | |
Gas costs due from/to customers(a) | $ | 4.4 |
| | $ | 0.2 |
| | $ | 9.0 |
| | $ | 10.6 |
|
Interruptible sharing(a) | — |
| | 2.4 |
| | 1.5 |
| | 0.7 |
|
Revenue normalization mechanisms for Maryland and Virginia(a) | — |
| | 11.7 |
| | 3.6 |
| | 1.4 |
|
| Accelerated replacement recovery mechanisms | 0.6 |
| | 7.4 |
| | 1.9 |
| | 1.1 |
|
Rates subject to refund(c) | — |
| | — |
| | — |
| | 9.0 |
|
Tax Cuts and Jobs Act rate refunds(d) | — |
| | — |
| | 18.1 |
| | $ | — |
|
| Total current | $ | 5.0 |
| | $ | 21.7 |
| | $ | 34.1 |
| | $ | 22.8 |
|
| Deferred: | | | | | | | |
| Accrued asset removal costs | $ | — |
| | $ | — |
| | $ | 270.4 |
| | $ | 292.2 |
|
Deferred gas costs(a)(b) | 83.2 |
| | 90.1 |
| | — |
| | — |
|
| Pension and other post-retirement benefits | | | | | | | |
Deferred pension costs—trackers(e) | 9.1 |
| | 19.7 |
| | — |
| | — |
|
ASC Topic 715 unrecognized costs/income(a)(f) | | | | | | | |
| Pensions | 48.2 |
| | 119.6 |
| | — |
| | — |
|
| Other post-retirement benefits | — |
| | 0.2 |
| | 160.3 |
| | 135.0 |
|
| Total pension and other post-retirement benefits | 57.3 |
| | 139.5 |
| | 160.3 |
| | 135.0 |
|
| Other: | | | | | | | |
Income tax-related amounts due from/to customers(g) | 43.1 |
| | 37.9 |
| | 440.6 |
| | 3.2 |
|
Losses/gains on issuance and extinguishments of debt and interest-rate derivative instruments(a)(h) | 15.3 |
| | 16.4 |
| | 1.3 |
| | 1.4 |
|
Rights-of-way fees(a) | — |
| | — |
| | 1.9 |
| | 0.7 |
|
Business process outsourcing and related costs (a) | 6.2 |
| | 8.2 |
| | — |
| | — |
|
Non-retirement employee benefits(a)(i) | 16.5 |
| | 17.8 |
| | — |
| | — |
|
Deferred distribution integrity management (a)(j) | 5.8 |
| | 7.7 |
| | — |
| | — |
|
| Recoverable portion of abandoned LNG facility | 2.7 |
| | 3.1 |
| | — |
| | — |
|
Environmental response costs(a)(k) | 5.0 |
| | 2.5 |
| | — |
| | — |
|
| Energy efficiency program-Maryland | 4.5 |
| | 5.3 |
| | — |
| | — |
|
| Other regulatory expenses | 5.5 |
| | 5.7 |
| | 1.4 |
| | 4.1 |
|
| Total other | $ | 104.6 |
| | $ | 104.6 |
| | $ | 445.2 |
| | $ | 9.4 |
|
| Total deferred | $ | 245.1 |
| | $ | 334.2 |
| | $ | 875.9 |
| | $ | 436.6 |
|
| Total | $ | 250.1 |
| | $ | 355.9 |
| | $ | 910.0 |
| | $ | 459.4 |
|
|
| | | | | | | | | | | | |
| Regulatory Assets and Liabilities |
| | Regulatory Assets | Regulatory Liabilities |
| | December 31, | December 31, |
| (In millions) | 2019 | 2018 | 2019 | 2018 |
| Current: | | | | |
Gas costs due from/to customers(a) | $ | 5.9 |
| $ | 5.6 |
| $ | 44.2 |
| $ | 46.9 |
|
Interruptible sharing(a) | 2.1 |
| 0.4 |
| 0.3 |
| 1.7 |
|
Revenue normalization mechanisms for Maryland and Virginia(a) | — |
| — |
| 4.0 |
| 3.6 |
|
Accelerated replacement recovery mechanisms(l) | 1.9 |
| — |
| 0.3 |
| 3.8 |
|
Rates subject to refund(c) | — |
| — |
| 31.1 |
| — |
|
Tax Cuts and Jobs Act rate refunds(d) | — |
| — |
| 25.5 |
| 19.2 |
|
| Total current | $ | 9.9 |
| $ | 6.0 |
| $ | 105.4 |
| $ | 75.2 |
|
| Deferred: | | | | |
Accrued asset removal costs(m) | $ | — |
| $ | — |
| $ | 254.4 |
| $ | 264.6 |
|
Deferred gas costs(a)(b) | 98.7 |
| 141.6 |
| — |
| — |
|
| Pension and other post-retirement benefits |
|
|
|
|
|
|
|
|
Deferred pension costs—trackers(e) | — |
| 5.7 |
| — |
| — |
|
ASC Topic 715 unrecognized costs/income(a)(f) |
|
|
|
|
|
|
|
|
| Pensions | 39.4 |
| 80.8 |
| — |
| — |
|
| Other post-retirement benefits | — |
| — |
| 199.7 |
| 121.3 |
|
| Total pension and other post-retirement benefits | 39.4 |
| 86.5 |
| 199.7 |
| 121.3 |
|
| Other: | | | | |
Income tax-related amounts due from/to customers(g) | 26.0 |
| 41.6 |
| 400.6 |
| 427.2 |
|
| Losses/gains on issuance and extinguishment of debt and interest-rate derivative instruments(a)(h) | 13.9 |
| 15.0 |
| 1.2 |
| 1.3 |
|
Rights-of-way fees(a) | — |
| — |
| 2.4 |
| 2.5 |
|
Business process outsourcing and related costs(a) | 1.9 |
| 3.2 |
| — |
| — |
|
Non-retirement employee benefits(a)(i) | 14.9 |
| 15.6 |
| — |
| — |
|
Deferred distribution integrity management (a)(j) | 2.0 |
| 5.4 |
| — |
| — |
|
Recoverable portion of abandoned liquid natural gas facility(a) | 2.3 |
| 2.7 |
| — |
| — |
|
Environmental response costs(a)(k) | 7.0 |
| 5.8 |
| — |
| — |
|
Energy efficiency program-Maryland(n) | 9.3 |
| 3.4 |
| — |
| — |
|
| Other regulatory expenses | 7.6 |
| 6.4 |
| 0.5 |
| 0.9 |
|
| Total other | $ | 84.9 |
| $ | 99.1 |
| $ | 404.7 |
| $ | 431.9 |
|
| Total deferred | $ | 223.0 |
| $ | 327.2 |
| $ | 858.8 |
| $ | 817.8 |
|
| Total | $ | 232.9 |
| $ | 333.2 |
| $ | 964.2 |
| $ | 893.0 |
|
(a)Washington Gas does not earn its overall rate of return on these assets. Washington Gas is allowed to recover and required to pay, using short-term interest rates, the carrying costs related to billed gas costs due from and to its customers in the District of Columbia and Virginia jurisdictions.
(b)Includes fair value of derivatives, which are not included in customer bills until settled.
(c)Represents provision established forestimated refunds related to customers when the substitution of final rates resulted in an amount greater than the amount collectedbilled at a higher rate during the interim period related toas part of the 20162019 Virginia Rate Case.
(d)Represents amounts accrued for future refunds due to the Tax Cuts and Jobs Act of 2017. For a further discussion, see Rates"Rates and Regulatory MattersMatters" section of Management's Discussion Analysis and Note 8-Income9 — Income Taxes in the Notes to Consolidated Financial Statements.
(e)Relates to the District of Columbia jurisdiction. The amortization of the regulatory tracker ended in 2019.
(f)Refer to Note 9-Pension10— Pension and Other Post-Retirement Benefit Plans for a further discussion of these amounts.
(g)This balance represents amounts due from customers for deferred tax liabilities related to tax benefits on deduction flowed directly to customers prior to the adoption of income tax normalization for ratemaking purposesand to tax rate changes including the latest reduction as a result of the Tax Act.
(h)The losses or gains on the issuance and extinguishment of debt and interest-rate derivative instruments include unamortized balances from transactions executed in prior fiscal years. These transactions create gains and losses that are amortized over the remaining life of the debt as prescribed by regulatory accounting requirements.
WGL Holdings, Inc
Washington Gas Light Company
Part II
Item 8. Financial Statements and Supplementary Data (continued)
Notes to Consolidated Financial Statements
(i)Represents the timing difference between the recognition of workers compensation and short-term disability costs in accordance with generally accepted accounting principles and the wayrecovery of these costs are recovered through rates.
(j)This balance represents amounts for deferred expenditures associated with Washington Gas’ Distribution Integrity Management Program (DIMP) in Virginia.
Washington Gas Light Company
Part II
Item 8. Financial Statements and Supplementary Data (continued)
Notes to Financial Statements
(k)This balance represents allowed environmental remediation expenditures at Washington Gas sites to be recovered through rates for Maryland and the District of Columbia. The recovery period is over several years.
(l)Balance represents amounts deferred over collections or under collections of surcharges associated with Washington Gas' accelerated pipeline recovery programs in the District of Columbia, Maryland and Virginia compared the amounts reflected in revenues.
(m)Refer to Note 1 — Accounting Policies for a further discussion of these amounts.
(n)Balance represents amounts for costs incurred associated with Washington Gas' participation in the energy conservation and efficiency program EmPOWER in Maryland that are recovered from customer over time.
As required by ASC Topic 980, Washington Gas monitors its regulatory and competitive environment to determine whether the recovery of its regulatory assets remains probable. If Washington Gas were to determine that recovery of these assets is no longer probable, it would write off the assets against earnings. We have determined that ASC Topic 980 continues to apply to our regulated operations, andoperations. During the recovery of our regulatory assets at September 30, 2018 is probable.
WGL Holdings, Inc
calendar year ended December 31, 2019, Washington Gas Light Company
Part II
Item 8. Financial Statementsrecorded a $2.0 million write down of the regulatory asset related to our distribution integrity management program based on the HE’s recommendations and Supplementary Data (continued)
NotesCommission's Final Order related to Consolidated Financial Statements
Virginia rate case (Refer to Note 13 — Commitments and Contingencies for further discussion on the Virginia Rate case). During the three months ended December 31, 2018, Washington Gas recorded a $2.5 million write down to the regulatory asset associated with business process outsourcing costs, which was disallowed as a result of the Maryland Rate Case.
NOTE 3.5. ACCOUNTS PAYABLE AND OTHER ACCRUED LIABILITIES The tablestable below provideprovides details for the amounts included in “Accounts payable and other accrued liabilities” on the balance sheets for both WGL and Washington Gas.sheets.
|
| | | | | | | |
| WGL Holdings, Inc. |
| September 30, |
| (In millions) | 2018 | | 2017 |
| Accounts payable—trade | $ | 420.0 |
| | $ | 361.6 |
|
| Employee benefits and payroll accruals | 34.2 |
| | 35.0 |
|
| Other accrued liabilities | 64.6 |
| | 27.2 |
|
| Total | $ | 518.8 |
| | $ | 423.8 |
|
|
| | | | | | | |
| Washington Gas Light Company |
| September 30, |
| (In millions) | 2018 | | 2017 |
| Accounts payable—trade | $ | 187.0 |
| | $ | 174.9 |
|
| Employee benefits and payroll accruals | 32.9 |
| | 32.4 |
|
| Other accrued liabilities | 51.4 |
| | 12.5 |
|
| Total | $ | 271.3 |
| | $ | 219.8 |
|
WGL Holdings, Inc
Washington Gas Light Company
Part II
Item 8. Financial Statements and Supplementary Data (continued)
Notes to Consolidated Financial Statements
|
| | | | | | |
| (In millions) | December 31, 2019 | December 31, 2018 |
| Accounts payable—trade | $ | 154.3 |
| $ | 228.9 |
|
| Employee benefits and payroll accruals | 39.2 |
| 28.0 |
|
| Wages payable | 22.2 |
| 22.6 |
|
| Accrued interest | 17.3 |
| 14.5 |
|
| Other accrued liabilities | 34.4 |
| 31.5 |
|
| Total | $ | 267.4 |
| $ | 325.5 |
|
NOTE 4.6. SHORT-TERM DEBT WGL and Washington Gas satisfy theirsatisfies the short-term financing requirements through the sale of commercial paper, financing arrangements with third-party lenders, or through bank borrowings. Due to the seasonal nature of the regulated utility and retail energy-marketing segments,our operations, short-term financing requirements can vary significantly during the year. Revolving credit agreements are maintained to support outstanding commercial paper and to permit short-term borrowing flexibility. The policy of each WGL and Washington Gas is to maintain bank credit facilities in amounts equal to or greater than the expected maximum commercial paper position.
Credit Facility
On July 19, 2019, Washington Gas entered into an amended and restated senior unsecured revolving credit facility with a term of five years, plus two one-year extension options, available with the bank group’s approval. The Credit Facility amended and restated Washington Gas’ prior $350 million credit facility and permits Washington Gas to borrow up to $450 million with an option to increase the facility by an additional $100 million, with the bank group’s approval, for a total potential maximum borrowing of $550 million. Washington Gas incurs Credit Facility fees, which in some cases are based on the long-term debt ratings of Washington Gas. If the long-term debt ratings were downgraded below certain levels, Washington Gas would be required to pay higher fees. There are five different levels of fees. Under the terms of the Credit Facility, the lowest level facility fee is 0.06% and the highest is 0.175%. The interest rate of loans made under the Credit Facility will be a fluctuating rate per annum that is set using certain parameters at the time each loan is made.
Washington Gas Light Company
Part II
Item 8. Financial Statements and Supplementary Data (continued)
Notes to Financial Statements
The following is a summary of committed credit available at September 30, 2018December 31, 2019 and 2017.2018.
|
| | | | | | | | | | | |
| Committed Credit Available (In millions) |
| September 30, 2018 | WGL(b) | | Washington Gas | | Total Consolidated |
| Committed credit agreements | | | | | |
Unsecured revolving credit facility, expires December 19, 2019(a) | $ | 650.0 |
| | $ | 350.0 |
| | $ | 1,000.0 |
|
| Less: Commercial Paper | (492.5 | ) | | (95.0 | ) | | (587.5 | ) |
| Net committed credit available | $ | 157.5 |
| | $ | 255.0 |
| | $ | 412.5 |
|
| Weighted average interest rate | 2.61 | % | | 2.42 | % | | 2.58 | % |
| September 30, 2017 | | | | | |
| Committed credit agreements | | | | | |
Unsecured revolving credit facility, expires December 19, 2019(a) | $ | 650.0 |
| | $ | 350.0 |
| | $ | 1,000.0 |
|
| Less: Commercial Paper | (382.0 | ) | | (123.0 | ) | | (505.0 | ) |
| Net committed credit available | $ | 268.0 |
| | $ | 227.0 |
| | $ | 495.0 |
|
| Weighted average interest rate | 1.52 | % | | 1.22 | % | | 1.45 | % |
|
| | | |
| Committed Credit Available |
| (In millions) | | December 31, 2019 | December 31, 2018 |
| Committed credit agreements | | | |
| Unsecured revolving credit facility | | $450.0 | $350.0 |
Less: Commercial Paper outstanding (a) | | (400.0) | (296.0) |
| Net committed credit available | | $50.0 | $54.0 |
| Weighted average interest rate | | 2.04% | 2.93% |
(a) Washington Gas has the right to request extensions with the banks’ approval. Washington Gas’ revolving credit facility permits it to borrow an additional $100 million, with the banks’ approval, for a totalThe amount presents principal amount of $450 million.
(b) WGL includes WGL Holdings and all subsidiaries other than Washington Gas.commercial paper.
At September 30,December 31, 2019 and 2018, and 2017, there were no outstanding bank loans from WGL’s or Washington Gas’ revolving credit facilities.
Under the terms of the credit agreements,Credit Facility, the ratio of consolidated financial indebtedness to consolidated total capitalization may not exceed 0.65 to 1.0 (65.0%). At September 30,December 31, 2019 and 2018, WGL's and Washington Gas' ratios of consolidated financial indebtedness to consolidated total capitalization were 59% was 52%and 47%, respectively. In addition, WGL and Washington Gas areis required to inform lenders of changes in corporate existence, financial conditions, litigation and environmental warranties that might have a material adverse effect. Failure to inform the lenders’ agent of these material changes might constitute default under the agreements. Another potential default may be deemed to exist if WGL orShould Washington Gas were to fail to pay principal or interest when due on any other indebtedness.indebtedness, such failure may be deemed to constitute a default. Such defaults, if not remedied, could lead to suspension of further loans and/or acceleration in which obligations become immediately due and payable. At September 30,December 31, 2019 and 2018, WGL and Washington Gas werewas in compliance with all of the covenants under their revolving credit facilities.its Credit Facility.
PROJECT FINANCINGCommercial Paper
Total commercial paper recorded was $399.5 million and $296.0 million at December 31, 2019 and 2018, respectively. In December 2019, we classified $100.0 million commercial paper balance as "Long-term debt" on Washington Gas' balance sheets due to its ability and intent to refinance these balances on a long-term basis. Accordingly, $299.5 million of commercial paper remained in “Note payable and project financing” at December 31, 2019.
Project Financing
Washington Gas previously obtained third-party project financing on behalf of the federal government to provide funds duringfor the construction of certain energy management services projects entered into under Washington Gas'Gas’ area-wide contract. In connection with work completed undercontract resulting in a project financing obligation recorded in “Notes payable and project financing” on the area-wide contract,balance sheet. As the construction work iswas performed, byWashington Gas established a contract asset in “Unbilled revenue” representing the government’s obligation to remit principal and interest, and recorded a “Payable to associated company” to WGL Energy Systems on behalf of Washington Gas and an inter-company payable is recorded for the construction work provided byperformed for the same amount. WGL Energy Systems.Systems now directly obtains third-party project financing for energy management services projects with the federal government under Washington Gas’s area-wide contract. As work is performed, Washington Gas establishes a receivablecontract asset in “Unbilled revenue” representing the government'sgovernment’s obligation to remit principal and interest. Theinterest and records a “Payable to associated company” to WGL Energy Systems for the construction work performed for the same amount.
At December 31, 2019, Washington Gas recorded $44.2 million of contract assets in “Unbilled revenues” and a $44.2 million payable to WGL Energy Systems in “Payables to associated companies,” respectively, for energy management services projects financed by WGL Energy Systems that were not complete. There was no project financing obligation on Washington Gas’ balance sheet at December 31, 2019.
At December 31, 2018, Washington Gas recorded $85.3 million of contract assets in "Unbilled revenues", $15.5 million in a corresponding short-term obligation to third-party lenders in "Notes payable and receivable are equalproject financing", and $69.7 million obligation to each other at the end of the construction period, but there may be timing differencesWGL Energy Systems in the recognition of the project related payable and receivable during the construction period. When these"Payables to associated companies" for energy management services projects are formally “accepted”that were not complete.
In October 2018, WGL Energy Systems repaid $53.0 million drawn by the government and deemed complete, Washington Gas assigns the ownership of the receivable to thefrom a third-party lender in satisfaction of the obligation and removes both the receivable and the obligation related to the financing from its financial statements. Iffor a specific project acceptance does not occur by a specified date as stated in the financing agreement,that the lender mdemanded repayment for due to delays in achieving final acceptance from the federal government agency customer. The $53.0 million was included in "Payables to associated companies" on Washington Gas' balance sheets at December 31, 2018. In February 2019, WGL sold the receivables, and accordingly, Washington Gas reversed the associated amount in “Payables to associated companies” and “Unbilled revenue” on its balance sheets.
WGL Holdings, Inc
Washington Gas Light Company
Part II
Item 8. Financial Statements and Supplementary Data (continued)
Notes to Consolidated Financial Statements
ay require Washington Gas to make interim interest payments or repurchase the contract payments plus a termination fee. In March 2016, the SCC of VA denied Washington Gas' further participation in the third-party financing arrangement but allowed existing debt arrangements to remain intact until the related obligations were satisfied.
At September 30, 2018, there were two contracts remaining that haddid not yet been novated to WGL Energy Systems. The draws related to these two projects totaling $68.5 million are recorded on the Washington Gas balance sheet as a short-term obligation to third-party lenders in "Notes payable and project financing".
In December 2016, WGL Energy Systems entered into an agreement to obtain third-party financing and receive funds directly from the third-party lender during the construction period associated with the related energy management service projects. As a result, Washington Gas will no longer be liable under future third-party financing arrangements, for projects entered into under the area-wide contract. The general terms of the financing agreement are the same as the prior financing arrangements between Washington Gas and the third-party lender mentioned above. Washington Gas will continue to record a receivable representing the government’s obligation and will record an inter-company payable to WGL Energy Systems for the construction work performed for the same amount. At September 30, 2018, there were three contracts that are outstanding totaling $13.7 million on the WGL Energy Systems balance sheet as a short-term obligation to third-party lenders in "Notes payable and project financing".
As of September 30, 2018, WGL recorded $77.0 million in "Unbilled revenues" on the balance sheet, and WGL and Washington Gas recorded $82.2 million and $68.5 million, respectively, in a corresponding short-term obligation to the lender in "Notes payable and project financing", for energy management services projects that were not complete. At September 30, 2017, WGL recorded $85.6 million in "Unbilled revenues" on the balance sheet and WGL and Washington Gas recorded $54.8 million and $43.8 million, respectively, in a corresponding short-term obligation to third-party lenders in "Notes payable and project financing" for energy management services projects that were not complete.
For projects which WGL Energy Systems is the primary contractor and where these projects are financed for government agencies that have minimal credit risk, and with which we have previous collection experience, neither WGL nor Washington Gas recorded a corresponding reserve for bad debts related to these contract assets at December 31, 2019 and 2018, based on our previous collection experience with receivables at September 30, 2018 or September 30, 2017.that have been financed for government agencies with minimal credit risk.
FIRST MORTGAGE BONDSFirst Mortgage Bonds
The Mortgage of Washington Gas dated January 1, 1933 (Mortgage), as supplemented and amended, securing any First Mortgage Bonds (FMBs) it issues, constitutes a direct lien on substantially all property and franchises owned by Washington Gas, other than a small amount of property that is expressly excluded. At September 30,December 31, 2019 and 2018, and 2017, Washington Gas had no debt outstanding under the Mortgage. Any FMBs that may be issued in the future will represent indebtedness of Washington Gas.
SHELF REGISTRATIONShelf Registration
At September 30, 2018, WGL had capacity under a shelf registration to issue an unspecified amount of long-term debt securities andDecember 31, 2019, Washington Gas had remaining capacity under a shelf registration statement that was filed in May 2018 to issue up to $725.0$425.0 million of additional medium-term notes (MTN's).
WGL Holdings, IncUnsecured Notes
Washington Gas Light Company
Part II
Item 8. Financial Statements and Supplementary Data (continued)
Notes to Consolidated Financial Statements
UNSECURED NOTES
WGL and Washington Gas issueissues long-term debt that are unsecured long-term notes in the form of MTNs unsecured long-term notes and private placement notes with individual terms regarding interest rates, maturities and call or put options. These notes can have maturity dates of one or more years from the date of issuance. The following tables show the outstanding notes as of September 30, 2018 and 2017.
|
| | | | | | | | | | | |
| Long-Term Debt Outstanding |
| ($ In millions) | WGL(a) | | Washington Gas | | Total Consolidated |
| September 30, 2018 | | | | | |
Long-term debt(b) | $ | 850.0 |
| | $ | 1,146.0 |
| | $ | 1,996.0 |
|
| Unamortized discount | (1.4 | ) | | (2.9 | ) | | (4.3 | ) |
| Unamortized debt expenses | (3.7 | ) | | (8.1 | ) | | (11.8 | ) |
| Total Long-Term Debt | $ | 844.9 |
| | $ | 1,135.0 |
| | $ | 1,979.9 |
|
| Weighted average interest rate | 3.06 | % | | 4.89 | % | | 4.11 | % |
| September 30, 2017 | | | | | |
Long-term debt(b) | $ | 550.0 |
| | $ | 1,146.0 |
| | $ | 1,696.0 |
|
| Unamortized discount | (1.5 | ) | | (3.0 | ) | | (4.5 | ) |
| Unamortized debt expenses | (2.1 | ) | | (8.5 | ) | | (10.6 | ) |
| Total Long-Term Debt | $ | 546.4 |
| | $ | 1,134.5 |
|
| $ | 1,680.9 |
|
| Weighted average interest rate | 2.81 | % | | 4.89 | % | | 4.21 | % |
(a) WGL includes WGL Holdings and all subsidiaries other than Washington Gas.
(b) Includes Senior Notes and term loans for WGL and both MTNs and private placement notes for Washington Gas. Represents face value including current maturities.
The indenture for the unsecured MTNs and the note purchase agreement for the private placement notes provide that Washington Gas will not issue any FMBs under its Mortgage without securing all MTNs and the private placement notes with the Mortgage.
Certain of Washington Gas’ outstanding MTNs and private placement notes have a make-whole call feature that pays the holder a premium based on a spread over the yield to maturity of a U.S. Treasury security having a comparable maturity if that particular note were to be called by Washington Gas before its stated maturity date. With the exception of this make-whole call feature, Washington Gas is not required to pay call premiums for calling debt prior to the stated maturity date.
WGL Holdings, Inc
Washington Gas Light Company
Part II
Item 8. Financial Statements and Supplementary Data (continued)
Notes to Consolidated Financial Statements
The following tables show long-term debt issuancestable shows the outstanding notes with maturities in calendar years at December 31, 2019 and retirements for the years ended September 30, 2018 and 2017.2018.
|
| | | | | | | | | | | |
| Long-Term Debt Issuances and Retirements |
| ($ In millions) | Principal(b) | | Interest Rate(f) | | Effective Cost(f) | | Nominal Maturity Date |
| Year Ended September 30, 2018 | | | | | | | |
WGL(a) | | | | | | | |
| Issuances: | | | | | | | |
| 11/29/2017 | $ | 300.0 |
| | 1.88 | % | (c) | 2.01 | % | | 11/29/2019 |
| 3/14/2018 | $ | 250.0 |
| | 2.66 | % | (d) | 2.79 | % | | 03/12/2020 |
| Total consolidated issuances | $ | 550.0 |
| | | | | | |
WGL(a) | | | | | | | |
| Retirements: | | | | | | | |
| 02/18/2018 | $ | 250.0 |
| | 1.24 | % | | 1.24 | % | | 2/18/2018 |
| Total | $ | 250.0 |
| | | | | | |
| Year Ended September 30, 2017 | | | | | | | |
WGL(a) | | | | | | | |
| Issuances: | | | | | | | |
| 1/26/2017 | $ | 50.0 |
| | 1.57 | % | (e) |
| | 1/26/2019 |
| Total | $ | 50.0 |
| | | | | | |
| Washington Gas | | | | | | | |
| Issuances: | | | | | | | |
| 9/18/2017 | $ | 200.0 |
| | 3.80 | % | | | | 9/15/2046 |
| Total | 200.0 |
| | | | | | |
| Total consolidated issuances | $ | 250.0 |
| | | | | | |
|
| | | | | | |
| Long Term Debt Outstanding |
| ($ In millions) | December 31, 2019 | December 31, 2018 |
| | | |
| Washington Gas Unsecured Notes | | |
| Due 2019, 4.76% | $ | — |
| $ | 50.0 |
|
| Due 2023, 6.65% | 20.0 |
| 20.0 |
|
| Due 2025, 5.44% | 40.5 |
| 40.5 |
|
| Due 2026, 6.62% to 6.82% | 53.0 |
| 53.0 |
|
| Due 2027, 6.40% to 6.57% | 72.0 |
| 72.0 |
|
| Due 2028, 6.57% to 6.85% | 52.0 |
| 52.0 |
|
| Due 2030, 7.50% | 8.5 |
| 8.5 |
|
| Due 2036, 5.70% to 5.78% | 50.0 |
| 50.0 |
|
| Due 2040, 5.21% | 75.0 |
| 75.0 |
|
| Due 2043, 5.00% | 75.0 |
| 75.0 |
|
| Due 2044, 4.22% to 4.24% | 150.0 |
| 150.0 |
|
| Due 2046, 3.80% | 450.0 |
| 450.0 |
|
| Due 2049, 3.65% | 300.0 |
| — |
|
Commercial Paper due in various years (c) | $ | 100.0 |
| $ | — |
|
Total Long-Term Debt(a) | $ | 1,446.0 |
| $ | 1,096.0 |
|
| Unamortized discount | (4.3 | ) | (2.9 | ) |
| Unamortized debt expense | (10.8 | ) | (8.1 | ) |
| Less—current maturities | — |
| 50.0 |
|
| Total Long-Term Debt | $ | 1,430.9 |
| $ | 1,035.0 |
|
Weighted average interest rate(b) | 4.52 | % | 4.77 | % |
(a) WGL includes WGL HoldingsIncludes MTNs and all subsidiaries other than Washington Gas.private placement notes. The amount represents face value of long-term debt including current maturities.
(b) Represents face amount of notes.Weighted average interest rate is for the Washington Gas unsecured notes including current maturities.
(c) Floating rate per annumIn December 2019, we classified $100.0 million commercial paper balance as "Long-term debt" on Washington Gas' balance sheets due to its ability and reset quarterly basedintent to refinance these balances on terms set forth in the prospectus supplement filed by WGL pursuanta long-term basis. Refer to Securities Act Rule 424Note 6 - Short-term debt for discussion on November 27, 2017.
(d) Floating rate per annum and reset quarterly based on terms set forth in the prospectus supplement filed by WGL pursuant to Securities Act Rule 424 on March 13, 2018.
(e) Floating rate per annum that will be determined from time to time based on parameters set forth in the credit agreement.facility.
(f) Represents the interest rate and effective cost at the trade date of the debt.
WGL Holdings, Inc
Washington Gas Light Company
Part II
Item 8. Financial Statements and Supplementary Data (continued)
Notes to Consolidated Financial Statements
LONG-TERM DEBT MATURITIES
MaturitiesThe following table shows the issuances and retirements of long-term debtWashington Gas' unsecured notes for each of the next fivecalendar year ended December 31, 2019, three months ended December 31, 2018, and fiscal years and thereafter as ofyear ended September 30, 2018 are summarized in2017. There were no issuances or retirements during the following table.fiscal year ended September 30, 2018.
|
| | | | | | | | | | | |
Long-Term Debt Maturities(a) |
| (In millions) | WGL(b) | | Washington Gas | | Total |
| 2019 | $ | 50.0 |
| | $ | 50.0 |
| | $ | 100.0 |
|
| 2020 | 650.0 |
| | 50.0 |
| | 700.0 |
|
| 2023 | — |
| | 20.0 |
| | 20.0 |
|
| Thereafter | 150.0 |
| | 1,026.0 |
| | 1,176.0 |
|
| Total | $ | 850.0 |
| | $ | 1,146.0 |
| | $ | 1,996.0 |
|
| Less: current maturities | 50.0 |
| | 50.0 |
| | 100.0 |
|
| Total non-current | $ | 800.0 |
| | $ | 1,096.0 |
| | $ | 1,896.0 |
|
|
| | | | | | | | | | | |
| Washington Gas' Unsecured Notes Issuances and Retirements |
| (In millions) | Principal(a)(c) | | Interest Rate(b) | | Effective Cost(b) | | Nominal Maturity Date |
| Calendar Year Ended December 31, 2019 | | | | | | | |
| Issuances: | | | | | | | |
| 09/13/2019 | $ | 300.0 |
| | 3.65 | % | | 3.72 | % | | 9/15/2049 |
| Retirements: | | | | | | | |
| 11/1/2019 | $ | 50.0 |
| | 4.76 | % | | 4.76 | % | | 11/1/2019 |
| Three Months Ended December 31, 2018 | | | | | | | |
| Retirements: | | | | | | | |
| 12/05/2018 | $ | 50.0 |
| | 7.46 | % | | 7.46 | % | | 12/5/2018 |
| Fiscal Year ended September 30, 2017 | | | | | | | |
| Issuances: | | | | | | | |
| 9/18/2017 | $ | 200.0 |
| | 3.80 | % | | | | 9/15/2046 |
(a)Excludes unamortized discounts and debt issuance costsRepresents face amount of $5.1 million and $11.0 million at September 30, 2018, for WGL and Washington Gas, respectively.notes.
(b)WGL includes WGL HoldingsRepresents the interest rate and all subsidiaries other thaneffective cost at the trade date of the debt.
On September 13, 2019, Washington Gas.Gas issued medium-term notes with an aggregate principal amount of $300 million and 3.65% fixed interest rate that are due in September 2049. The interest will be paid semi-annually in March and September of each year. The notes have a make-whole call provision at a U.S. Treasury rate plus 25 basis points prior to March 15, 2049, and then are callable at par after March 15, 2049.
NOTE 6. COMMON STOCK — WGL COMMON STOCK OUTSTANDING
Upon consummation of the Merger, each share of WGL common stock issued and outstanding immediately prior to the closing was converted automatically into the right to receive $88.25 (Merger Consideration) in cash per share, without interest, less any applicable withholding taxes, and ceased to be outstanding. Shares of WGL common stock held by WGL, AltaGas, the Merger Sub or any subsidiaries were not entitled to receive the Merger Consideration. Each share of the Merger Sub's issued and outstanding common stock at the time of the consummation of the Merger was converted into one share of WGL common stock for a total of 100 WGL post-Merger shares owned by Wrangler 1 LLC, an indirect wholly owned subsidiary of AltaGas (Wrangler 1). As a result of the Merger, WGL's common stock was delisted from the New York Stock Exchange.
NOTE 7.8. PREFERRED STOCKOn December 20, 2019, Washington Gas has three series of cumulative preferred stock outstanding, and each series is subject to redemption by Washington Gas. All three series have a dividend preference that prohibits Washington Gas from declaring and paying dividends on shares of its common stock unless dividends onredeemed all outstanding shares of theits preferred stock have been fully paid for the respective call price per share for a total amount of $28.7 million, plus all past quarterly dividend periods. In addition, all outstanding sharesaccrued and unpaid dividends. A loss of $0.6 million was recorded in "Loss on preferred stock extinguishment" on Washington Gas' statements of operations. The following table lists Washington Gas' three series of preferred stock have a preference as toincluding the amounts that would be distributedcall price at which they were redeemed. The redemption was funded primarily through borrowings in the event of a liquidation or dissolution ofcommercial paper program. Following the redemption, Washington Gas. The following table presents this information, as well as call prices for eachGas no longer pays quarterly preferred stock series outstanding.dividends. Since Washington Gas’ preferred shares had voting rights, as a result of this redemption, Washington Gas became an indirect wholly-owned subsidiary of AltaGas.
| | Preferred Stock | | | | | | | Liquidation Preference | | |
| Preferred | | | | Liquidation Preference | | | | Per Share | | Call Price |
| Series | | Shares | | Per Share | | Call Price | | Shares
| | Involuntary | | Voluntary | | Per Share |
| Outstanding | | Outstanding | | Involuntary | | Voluntary | | Per Share | |
| $4.80 | | 150,000 | | $100 | | $101 | | $101 | | 150,000 | | $100 | | $101 | | $101 |
| $4.25 | | 70,600 | | $100 | | $105 | | $105 | | 70,600 | | $100 | | $105 | | $105 |
| $5.00 | | 60,000 | | $100 | | $102 | | $102 | | 60,000 | | $100 | | $102 | | $102 |
WGL Holdings, Inc
Washington Gas Light Company
Part II
Item 8. Financial Statements and Supplementary Data (continued)
Notes to Consolidated Financial Statements
Through July 6th6, 2018 and prior to the Merger with AltaGas, WGL and its wholly owned subsidiaries filed a consolidated federal income tax return and various state income tax returns where they had a business presence. We are no longer subject to income tax examinations by the Internal Revenue Service (IRS) for years ended prior to September 30, 2013. Substantially all state income tax years in major jurisdictions are closed for years ended prior to September 30, 2013. Through July 6, 2018, WGL and each of its subsidiaries participated in a tax sharing agreement that establishes the method for allocating tax benefits from losses that are utilized onapportioned the consolidated income tax return. The consolidated tax is apportioned among the subsidiaries on the separate return method and losses are allocated to the subsidiaries that have taxable income pro-rata basis. In fiscal year 2018, Washington Gas received $2.9 million from subsidiaries with taxable income for the utilization of Washington Gas' net operating loss pursuant to the tax sharing agreement.method.
Effective with the Merger and beginning July 7, 2018, our tax year end will changechanged to December 31 2018, and WGL and its subsidiaries will beWashington Gas was included with AltaGas’ wholly owned US subsidiaries’ consolidated income tax return with AltaGas Services (U.S.), (ASUS) being the parent company of the consolidated group. Accordingly, WGL and its subsidiaries will fileWashington Gas filed a final return as part of the WGL's consolidated income tax return for the short tax year from October 1, 2017 to July 6, 2018. WeWGL and ourits wholly owned subsidiaries will bewere included in the AltaGasAltaGas' consolidated income tax returns beginning with the period from July 7, 2018 to December 31, 2018. We have established a new tax sharing policy with ASUS. The tax sharing policy provides allocation ofASUS that allocates consolidated tax liabilities and benefits based on amounts participants would incur as standalone corporations.using a ratio determined by the separate taxable income for each member applied to the consolidated return tax liability of the group. Income taxes recorded for the period October 1, 2017 through July 6, 2018 arewere based on amounts we and our subsidiaries would incurincurred as standalone corporations. State income tax returns are filed on a separate company basis in most states and on a unitary basis as required, where we or the consolidated ASUS group have operations and/or a requirement to file.
In July 2018, we filed our At December 31, 2019, Washington Gas recorded $5.5 million receivable and $0.6 million payable with associate companies under the ASUS tax return for the year ended September 30, 2017.sharing policy. The amounts were recorded in "Receivable from associated companies" and "Payable to associated companies" on Washington Gas' balance sheets.
Impact of US Federal Income Tax Reform of 2017
On December 22, 2017, President Trump signed the Tax Cuts and Jobs Act (TCJA) (the Tax Act) into law. The Tax Act substantially reforms the Internal Revenue Code, including, but not limited to, (1) reducing the U.S. federal corporate tax rate from 35% to 21%; (2) creating a limitation on deductible interest expense equal to 30% of adjusted taxable income (not applicable to regulated utilities); (3) allowing 100% expensing for the cost of qualified property (generally not applicable to regulated utilities); (4) eliminating the domestic production activities deduction (not applicable to the consolidated tax group); (5) eliminating the corporate alternative minimum tax and changing how existing alternative minimum tax credits can be realized (not applicable to the consolidated tax group) in taxable years beginning after December 31, 2017; and (6) changing rules related to uses and limitations of net operating loss carry-forwards created in tax years beginning after December 31, 2017. ASC Topic 740 requires companies to recognize the impacts of a change in tax law or tax rates in the period of enactment.
The most significant change that impacts the Registrants’ financial statements is the reduction of the corporate federal income tax rate from 35% to 21% beginning January 1, 2018. The Tax Act also made bonus depreciation ineligible for regulated public utilities. The IRS issued proposed transition rules for property acquired and placed into service after September 27, 2017. The TCJA repeals 50% bonus depreciation for all taxpayers and provides 100% expensing for assets for non-utility companies both acquired and placed-in-service after September 27, 2017. On August 8, 2018, the IRS issued proposed regulations allowing regulated utility companies to claim bonus depreciation for assets placed in service for the first year of implementation of The Act. For regulated utility companies, projects that were greater than 10% complete at September 27, 2017, are eligible for 50% bonus depreciation when placed into service. We have recorded a provisional amount pursuant to the transition rule and the proposed depreciation regulation as of September 30, 2018.
Upon enactment of the Tax Act onwas signed into law. As of December 22, 2017, the SEC Staff issued Staff Accounting Bulletin No. 118 (SAB 118) to address the application of GAAP when a registrant does not have the necessary information available, prepared, or analyzed in reasonable detail to complete the necessary accounting. We have assessed the majority31, 2018, Washington Gas has completed its assessment of the accounting for applicable provisions in the TCJA and have recorded the associated provisional impacts as of September 30, 2018 and have followed the guidance issued in SAB 118. SAB 118 allows entities to take a reasonable period of time to measure and recognize the effects of the Tax Act while requiring disclosures during that period. Registrants discloseand recorded the items for which the accounting is complete. A provisional amount is recorded for items for which the company is able to make reasonable estimates. The recorded provisional amounts remain subject to adjustment within the measurement period. The measurement period begins in the reporting period that includes the Tax Act’s enactment date and continues one year from the date of enactment. To the extent a company cannot reasonably estimate the effects of the Tax Act, it applies the provisions of the tax law that were in effect immediately prior to enactment.
WGL Holdings, Inc
Washington Gas Light Company
Part II
Item 8. Financial Statements and Supplementary Data (continued)
Notes to Consolidated Financial Statements
SAB 118 requires disclosure of anyfollowing measurement period adjustments both provisional and final, and the effect of measurement period adjustments on the effective tax rate.
Items for which the accounting is substantially complete by September 30, 2018, however may be subject to adjustment pursuant to Technical Corrections of The Act:in accordance with SEC Staff Accounting Bulletin 118 (SAB 118).
Bonus depreciation: Under the Tax Act, regulated public utility property is ineligible for bonus depreciation and is depreciated under MACRSthe Modified Accelerated Cost Recovery System (MACRS) while non-utility property is eligible for 100% bonus depreciation. In accordance with the August 8, 2018 proposed depreciation regulations and the transitional rule above, a provisionalan amount of $86$86.2 million of additional depreciation deduction for the short period ended July 6, 2018 has beenwas recorded in the fiscal year ended September 30, 2018. The company considered all properties placed in service afterWe recognized an additional $17.4 million of bonus eligible assets for the Merger as MACRS eligible.three months ended December 31, 2018.
Decrease in regulated revenues: In January 2018, Washington Gas filed applications for approval to reduce the distribution rates it charges customers in Maryland, Virginia and the District of Columbia to reflect the impact of the Tax Act. These applications proposed to reduce rates in these jurisdictions by a combined amount of $41.2 million annually, until base rates are reestablished in a generalseparate rate case.proceeding. As described further below, the portion of this reduction in regulated revenues represented by the re-measurement of deferred tax assets and liabilities was recorded as a net regulatory liability under ASC 980, Regulated Operations. The net regulatory liability recorded is the amount we considerconsidered probable of regulatory treatment and will be refunded to customers in future periods. In addition, a portion of this reduction in regulated revenues relates to the federal tax expense included in current base rates that needs to be adjusted toat the new federal rate of 21% included in current base rates, effective January 1, 2018. ThroughFor the three months ended December 31, 2018, the revenues were lowered by an additional $13.7 million. For the fiscal year ended September 30, 2018, revenues have beenwere lowered by $27.5 million to reflect the regulatory impact of the Tax Act.
Uncertain tax position: TheFor the fiscal year ended September 30, 2018, the re-measurement of WGL’sWashington Gas’ uncertain tax position related to temporary differencesdifference associated with repairs expense was a decrease in the amount of $14.8 million. Generally, a reserve for uncertain tax benefits related to prior years would generally not be re-measured if the tax exposure related to prior years where the federal income tax rate was 35%. However, WGL’sWashington Gas' reserve for uncertain tax benefits relates solely to repair deductions for which the tax consequence of any disallowed deductions related to these temporary differences is expected to be prospective only.
All provisional amounts recorded for re-measurement remain subject to adjustment within For the measurement period pending the preparation and analysis ofthree months ended December 31, 2018, there was no additional information.
Items for which the accounting is not yet complete as of September 30, 2018 but for which we have recorded provisional amounts which are subject to adjustment during the measurement period:impact recognized associated with re-measurement.
Re-measurement of deferred tax assets and liabilities: Under ASC Topic 740, the tax rate used to measure deferred tax liabilitiesassets and deferred tax assetsliabilities are the tax rates for the yearsexpected to be in place when the liability is expected to be ultimately settled or the asset recovered. We re-measured the deferred tax balances atas of September 30, 2017. The re-measurement of our deferred tax assets and liabilities includes an initial estimatedthe impact on our cumulative prior year deferred tax asset net operating loss deferred tax asset (NOL DTA)(DTA NOL), investment tax credit and related attributes and deferred taxes associated with our benefit plans.
For the period ended July 6,As of September 30, 2018, the Company had taxable income, but had sufficient NOL DTA to apply against that amount. For the twelve months ended September 30, the Company had cumulative taxable losses, and as a result, the Company has recorded its consolidated deferred tax liabilities at a federal rate of 21%. In addition, we have recorded a provisional estimate but have not fully completed the accounting for the tax sharing impacts of the re-measurement of the deferred tax assets and deferred tax liabilities.
The effect of the re-measurement at a federal tax rate of 21% resulted in a net decrease in consolidated deferred tax liabilities in the amount of $458.7$421.7 million, including net tax gross-up. Of this amount, $422.9 million is attributablegross-up, primarily related to the regulated utility and $35.8 million is attributable to non-utility operations. Of the amount related to utility operations, the net decrease inimpact on plant-related deferred tax liabilities was $319.2 million before tax gross-up, increasing the regulatory liability. The re-measurement of deferred tax liabilities not associated with rate-making including all re-measurement of deferred tax liabilities for non-utility subsidiaries are recorded as a reduction to income tax expense of $28.7 million.
Under ASC 980, we recorded a regulatory liability for excess deferred income taxes of $431.0 million including tax gross-up. We recorded a decrease in the regulatory asset for flow-through depreciation related items in an amount of $22.4 million, including tax gross-up; and an increase in the regulatory asset for the re-measurement of non-plant excess deferred taxes (inc
WGL Holdings, Inc
Washington Gas Light Company
Part II
Item 8. Financial Statements and Supplementary Data (continued)
Notes to Consolidated Financial Statements
ludingdeferred tax liabilities. The re-measurement of deferred tax assets not associated with rate-making were recorded as income tax expense of $7.0 million.
Under ASC Topic 980, we recorded a regulatory liability for excess deferred income taxes of $431.0 million including tax gross-up for the fiscal year ended September 30, 2018. Included in this amount. we recorded a decrease for flow-through depreciation related items and an increase for the re-measurement of non-plant excess deferred taxes (including the net operating loss carryforward deferred tax asset). These adjustments both included the appropriate tax gross-up.
For the three months ended December 31, 2018, the final re-measurement implementation resulted in an amount of $28.3 million, including tax gross-up, for a net increase in regulatory assetsdeferred tax liabilities in the amount of $5.9 million, including net tax gross-up, and an increase to income tax expense of $1.2 million.
AccountingFor the three months ended December 31, 2018, under ASC Topic 980, we reduced the net regulatory liability for the tax basis adjustment for ITC: Under prior tax law and under the Tax Act, the tax basis of property must be reduced by one-half of the investment tax credits claimed thereon. Under GAAP, we adjust the book basis and amortize the investment tax credits over the book life of the associated assets. We have recorded certain provisional amounts that account for the effects on the adjustment of book basis.
Accounting for the NOL DTA associated with the prior year return to provision true-up adjustments. Following the filing of our 2017 Federal tax return, we booked certain adjustments in the fourth quarter of 2018 to adjust our estimated taxes to the amounts included in the return. We did adjust the associated impacts of temporary differences on ourexcess deferred income taxes of $6.1 million including tax balances resulting from these returngross-up.
For the fiscal year ended September 30, 2018, the Company had cumulative taxable losses, and as a result, the Company recorded its deferred tax liabilities at a federal rate of 21% because all amounts will reverse in future years when the rate is expected to provision adjustments, but have not fully analyzed the impacts to the associated NOL DTA and tax sharing.be 21%.
Components of Income Tax Expense or Benefit
The following tables provide the components of income tax expenses for WGLthe calendar year ended December 31, 2019, three months ended December 31, 2018, and Washington Gas for thefiscal years ended September 30, 2018 2017 and 2016.2017.
| | | WGL Holdings, Inc. | |
Components of Income Tax Expense (Benefit) | | Years Ended September 30, | Calendar Year Ended December 31, | Three Months Ended December 31, | Fiscal Years Ended September 30, |
| (In thousands) | 2018 | | 2017 | | 2016 | 2019 | 2018 | | 2017 | |
| INCOME TAX EXPENSE | | | | | | |
| | | | | | |
| Current: | | | | | | | | | |
| Federal | $ | (1,684 | ) | | $ | 430 |
| | $ | (57,690 | ) | $ | — |
| $ | — |
| $ | — |
| | $ | 1,722 |
| |
| State | 649 |
| | 3,267 |
| | (1,983 | ) | — |
| — |
| 1,274 |
| | 1,283 |
| |
| Total current | (1,035 | ) | | 3,697 |
| | (59,673 | ) | — |
| — |
| 1,274 |
| | 3,005 |
| |
| Deferred: | | | | | | | | | |
| Federal | | | | | | 12,216 |
| 9,031 |
| (36,331 | ) | | 64,590 |
| |
| Accelerated depreciation | (28,498 | ) | | 83,637 |
| | 93,175 |
| |
| Other | (32,490 | ) | | 13,042 |
| | 49,638 |
| |
| State | | | | | | 7,474 |
| (1,019 | ) | 9,896 |
| | 12,996 |
| |
| Accelerated depreciation | 12,399 |
| | 15,097 |
| | 12,993 |
| |
| Other | 3,570 |
| | 3,190 |
| | 8,073 |
| |
Total deferred(a) | (45,019 | ) | | 114,966 |
| | 163,879 |
| 19,690 |
| 8,012 |
| (26,435 | ) | | 77,586 |
| |
| Amortization of investment tax credits | (7,398 | ) | | (7,504 | ) | | (6,132 | ) | (658 | ) | (165 | ) | (702 | ) | | (751 | ) | |
| Total income tax expense (benefit) | $ | (53,452 | ) | | $ | 111,159 |
| | $ | 98,074 |
| $ | 19,032 |
| $ | 7,847 |
| $ | (25,863 | ) | | $ | 79,840 |
| |
Includes a net benefit of $28.7 million related to remeasurement of deferred income taxes.
WGL Holdings, Inc
Washington Gas Light Company
Part II
Item 8. Financial Statements and Supplementary Data (continued)
Notes to Consolidated Financial Statements
|
| | | | | | | | | | | |
| Washington Gas Light Company |
| Components of Income Tax Expense (Benefit) |
| Years Ended September 30, |
| (In thousands) | 2018 | | 2017 | | 2016 |
| INCOME TAX EXPENSE | | | | | |
| Current: | | | | | |
| Federal | $ | — |
| | $ | 1,722 |
| | $ | (48,064 | ) |
| State | 1,274 |
| | 1,283 |
| | (2,957 | ) |
| Total current | 1,274 |
| | 3,005 |
| | (51,021 | ) |
| Deferred: | | | | | |
| Federal | | | | | |
| Accelerated depreciation | (27,846 | ) | | 83,009 |
| | 93,385 |
|
| Other | (8,485 | ) | | (18,419 | ) | | 13,826 |
|
| State | | | | | |
| Accelerated depreciation | 12,533 |
| | 15,033 |
| | 13,081 |
|
| Other | (2,637 | ) | | (2,037 | ) | | 3,190 |
|
Total deferred(a) | (26,435 | ) | | 77,586 |
| | 123,482 |
|
| Amortization of investment tax credits | (702 | ) | | (751 | ) | | (795 | ) |
| Total income tax expense | $ | (25,863 | ) | | $ | 79,840 |
| | $ | 71,666 |
|
(a)Includes tax expense of $1.2 million and $7.0 million related to remeasurementre-measurement of deferred income taxes.taxes for three months ended December 31, 2018 and the fiscal year ended September 30, 2018, respectively.
Rate Reconciliation
The effective income tax rate from continuing operations varies from the U.S. Federal statutory rate principally due to the following:
|
| | | | | | | | | | | | | | | | | |
| WGL Holdings, Inc. |
| Reconciliation Between the Statutory Federal Income Tax Rate and Effective Tax Rate |
| Years Ended September 30, |
| ($ In thousands) | 2018 | | 2017 | | 2016 |
Income taxes at statutory federal income tax rate(a) | $ | (6,784 | ) | 21.00 | % | | $ | 101,157 |
| 35.00 | % | | $ | 93,253 |
| 35.00 | % |
| Increase (decrease) in income taxes resulting from: | |
| | | | | | |
| Accelerated depreciation less amount deferred | 1,079 |
| (3.34 | ) | | 2,213 |
| 0.77 |
| | 2,445 |
| 0.92 |
|
| Allowance for funds used during construction | (1,891 | ) | 5.85 |
| | (1,625 | ) | (0.56 | ) | | (1,537 | ) | (0.58 | ) |
| Amortization of investment tax credits | (7,398 | ) | 22.90 |
| | (7,504 | ) | (2.60 | ) | | (6,132 | ) | (2.30 | ) |
| Amortization of excess deferred taxes | (9,889 | ) | 30.61 |
| | (201 | ) | (0.07 | ) | | — |
| — |
|
| Cost of removal | (1,561 | ) | 4.83 |
| | (2,944 | ) | (1.02 | ) | | (3,722 | ) | (1.40 | ) |
| State income taxes-net of federal benefit | 3,976 |
| (12.31 | ) | | 13,472 |
| 4.66 |
| | 12,969 |
| 4.87 |
|
| Release of valuation allowance | (2,188 | ) | 6.77 |
| | — |
| — |
| | — |
| — |
|
| Merger related costs | 2,044 |
| (6.33 | ) | | 2,292 |
| 0.79 |
| | — |
| — |
|
| Non-controlling interest | 6,199 |
| (19.19 | ) | | 5,627 |
| 1.95 |
| | — |
| — |
|
| Re-measurement | (28,743 | ) | 88.97 |
| | — |
| — |
| | — |
| — |
|
| ASU 2016-09 adoption | (3,521 | ) | 10.90 |
| | — |
| — |
| | — |
| — |
|
| Return to provision adjustment | (6,279 | ) | 19.44 |
| | (3,062 | ) | (1.06 | ) | | (1,012 | ) | (0.38 | ) |
| Other items-net | 1,504 |
| (4.66 | ) | | 1,734 |
| 0.60 |
| | 1,810 |
| 0.68 |
|
| Total income tax expense (benefit) and effective tax rate | $ | (53,452 | ) | 165.44 | % | | $ | 111,159 |
| 38.46 | % | | $ | 98,074 |
| 36.81 | % |
(a)As a result of the merger with AltaGas, the Company is subject to two separate short periods and accompanying returns. The first period through July 6,WGL Holdings, Inc
Washington Gas Light Company
Part II
Item 8. Financial Statements and Supplementary Data (continued)
Notes to Consolidated Financial Statements
2018 is subjected to a higher, blended federal statutory rate. Due to the net operating loss for federal tax purposes through September 30, 2018, all current year activity is ultimately taxed at 21%. As such, for presentational purposes, we applied a 21% rate to the entire fiscal year activity.
| | | Washington Gas Light Company | |
Reconciliation Between the Statutory Federal Income Tax Rate and Effective Tax Rate | | Years Ended September 30, | Calendar Year Ended December 31, | Three Months Ended December 31, | Fiscal Years Ended September 30, |
| ($ In thousands) | 2018 | | 2017 | | 2016 | |
| (In thousands) | | 2019 | 2018 | 2018 | | 2017 |
Income taxes at statutory federal income tax rate(a) | $ | (11,026 | ) | | 21.00 | % | | $ | 74,071 |
| | 35.00 | % | | $ | 64,673 |
| | 35.00 | % | 24,957 |
| 21.00 | % | 11,974 |
| 21.00 | % | (11,026 | ) | | 21.00 | % | | 74,071 |
| | 35.00 | % |
| Increase (decrease) in income taxes resulting from: | | |
| | | | | | | | |
|
| |
| | |
| | | | |
| Accelerated depreciation less amount deferred | 1,079 |
| | (2.06 | ) | | 2,213 |
| | 1.05 |
| | 2,445 |
| | 1.32 |
| |
| Plant basis differences | | 699 |
| 0.59 |
| (4,261 | ) | (7.47 | ) | 1,079 |
| | (2.06 | ) | | 2,213 |
| | 1.05 |
|
| Allowance for funds used during construction | (70 | ) | | 0.13 |
| | (291 | ) | | (0.14 | ) | | (509 | ) | | (0.28 | ) | — |
| — |
| (520 | ) | (0.91 | ) | (70 | ) | | 0.13 |
| | (291 | ) | | (0.14 | ) |
| Amortization of investment tax credits | (703 | ) | | 1.34 |
| | (751 | ) | | (0.35 | ) | | (795 | ) | | (0.43 | ) | (658 | ) | (0.56 | ) | (165 | ) | (0.29 | ) | (703 | ) | | 1.34 |
| | (751 | ) | | (0.35 | ) |
| Amortization of excess deferred taxes | (9,798 | ) | | 18.66 |
| | (196 | ) | | (0.09 | ) | | — |
| | — |
| (18,020 | ) | (15.16 | ) | (2,431 | ) | (4.26 | ) | (9,798 | ) | | 18.66 |
| | (196 | ) | | (0.09 | ) |
| Cost of removal | (1,561 | ) | | 2.97 |
| | (2,944 | ) | | (1.39 | ) | | (3,722 | ) | | (2.01 | ) | 5,837 |
| 4.91 |
| (28 | ) | (0.05 | ) | (1,561 | ) | | 2.97 |
| | (2,944 | ) | | (1.39 | ) |
| State income taxes-net of federal benefit | (2,659 | ) | | 5.06 |
| | 9,482 |
| | 4.48 |
| | 8,310 |
| | 4.50 |
| 6,440 |
| 5.42 |
| 2,737 |
| 4.80 |
| (2,659 | ) | | 5.06 |
| | 9,482 |
| | 4.48 |
|
| Consolidated tax sharing allocation | — |
| | — |
| | — |
| | — |
| | 1,073 |
| | 0.58 |
| |
| Re-measurement | 7,031 |
| | (13.39 | ) | | — |
| | — |
| | — |
| | — |
| — |
| — |
| 1,243 |
| 2.18 |
| 7,031 |
| | (13.39 | ) | | — |
| | — |
|
| ASU 2016-09 adoption | (3,223 | ) | | 6.14 |
| | — |
| | — |
| | — |
| | — |
| — |
| — |
| — |
| — |
| (3,223 | ) | | 6.14 |
| | — |
| | — |
|
| Return to provision adjustment | (4,669 | ) | | 8.89 |
| | (4,859 | ) | | (2.30 | ) | | (1,353 | ) | | (0.73 | ) | (1,666 | ) | (1.40 | ) | — |
| — |
| (4,669 | ) | | 8.89 |
| | (4,859 | ) | | (2.30 | ) |
| Compensation Limitation under 162(m) and 280G | | 1,032 |
| 0.87 |
| — |
| — |
| — |
| | — |
| | — |
| | — |
|
| Other items-net | (264 | ) | | 0.50 |
| | 3,115 |
| | 1.47 |
| | 1,544 |
| | 0.84 |
| 411 |
| 0.34 |
| (702 | ) | (1.23 | ) | (264 | ) | | 0.50 |
| | 3,115 |
| | 1.47 |
|
| Total income tax expense (benefit) and effective tax rate | $ | (25,863 | ) | | 49.24 | % | | $ | 79,840 |
| | 37.73 | % | | $ | 71,666 |
| | 38.79 | % | $ | 19,032 |
| 16.01 | % | $ | 7,847 |
| 13.77 | % | $ | (25,863 | ) | | 49.24 | % | | $ | 79,840 |
| | 37.73 | % |
the CompanyWashington Gas is subject to two separate short periods and accompanying returns. The first period through July 6, 2018 is subjected to a higher, blended federal statutory tax rate. Due to the net operating loss for federal tax purposes through September 30, 2018, all currentthe year activity is ultimately taxed at 21%. As such, for presentational purposes, we applied a 21% rate to the entire fiscal year 2018 activity.
Components of accumulated deferred income tax assets and liabilities
The following tables providetable provides the components of accumulated deferred income tax assets (liabilities) for WGL and Washington Gas at December 31, 2019 and 2018, and September 30, 2018 and 2017.2018.
WGL Holdings, Inc
Washington Gas Light Company
Part II
Item 8. Financial Statements and Supplementary Data (continued)
Notes to Consolidated Financial Statements
| | | WGL Holdings, Inc. | |
Components of Accumulated Deferred Income Tax Assets (Liabilities) | | | |
| (In thousands) | 2018 | | 2017 | | December 31, 2019 | | December 31, 2018 |
| Deferred income tax assets: | | | | | | | | |
| Pensions | | $ | 43,553 |
| | $ | 42,593 |
| | $ | 16,923 |
| | $ | 25,629 |
|
| Uncollectible accounts | | 3,714 |
| | 10,617 |
| | 4,856 |
| | 1,680 |
|
| Inventory overheads | | 4,090 |
| | 6,617 |
| | 3,504 |
| | 4,088 |
|
| Employee compensation and benefits | | 52,526 |
| | 45,202 |
| | 30,461 |
| | 40,960 |
|
| Derivatives | | | 6,522 |
| | 8,737 |
|
| Income taxes recoverable through future rates | | 121,145 |
| | — |
| | 130,946 |
| | 96,256 |
|
| Derivatives | | 10,787 |
| | 13,802 |
| |
| Deferred gas costs | | — |
| | 1,485 |
| |
| Solar grant/investment tax credit | | 58,514 |
| | 61,773 |
| |
| Tax credit carry forward | | 158,167 |
| | 160,077 |
| |
| Net operating loss | | 114,625 |
| | 30,278 |
| | 132,774 |
| | 84,674 |
|
Other(a) | | 5,346 |
| | 2,693 |
| |
| Total assets | | 572,467 |
| | 375,137 |
| | 325,986 |
| | 262,024 |
|
| Deferred income tax liabilities: | | | | | | | | |
| Other post-retirement benefits | | 106,700 |
| | 90,031 |
| | 86,994 |
| | 63,540 |
|
| Accelerated depreciation and other plant related items | | 756,022 |
| | 1,068,951 |
| | 691,134 |
| | 636,196 |
|
| Losses/gains on reacquired debt | | 581 |
| | 1,047 |
| | 499 |
| | 571 |
|
| Income taxes recoverable through future rates | | — |
| | 33,502 |
| |
| Deferred gas costs | | 3,041 |
| | — |
| | 9,831 |
| | 14,928 |
|
| Partnership basis differences | | 41,459 |
| | 46,968 |
| |
| Valuation allowances | | — |
| | 2,188 |
| |
| Other | | | 3 |
| | 1,037 |
|
| Total liabilities | | 907,803 |
| | 1,242,687 |
| | 788,461 |
| | 716,272 |
|
| Net accumulated deferred income tax assets (liabilities) | | $ | (335,336 | ) | | $ | (867,550 | ) | | $ | (462,475 | ) | | $ | (454,248 | ) |
(a) For the fiscal years ended September 30, 2018 and 2017, amount includes $1.0 million and $0.5 million, respectively, in deferred income tax assets reported in "Deferred charges and other assets" on the consolidated balance sheet.
WGL Holdings, Inc
Washington Gas Light Company
Part II
Item 8. Financial Statements and Supplementary Data (continued)
Notes to Consolidated Financial Statements
|
| | | | | | | | | |
| Washington Gas Light Company |
| Components of Accumulated Deferred Income Tax Assets (Liabilities) |
| |
| (In thousands) | 2018 | | 2017 |
| Deferred income tax assets: | | | | | |
| Pensions | | $ | 43,071 |
| | | $ | 41,907 |
|
| Uncollectible accounts | | 1,131 |
| | | 7,815 |
|
| Inventory overheads | | 4,090 |
| | | 6,617 |
|
| Employee compensation and benefits | | 51,006 |
| | | 47,479 |
|
| Derivatives | | 7,435 |
| | | 11,187 |
|
| Income taxes recoverable through future rates | | 121,357 |
| | | — |
|
| Deferred gas costs | | — |
| | | 1,485 |
|
| Net operating loss | | 90,943 |
| | | — |
|
| Total assets | | 319,033 |
| | | 116,490 |
|
| Deferred income tax liabilities: | | | | | |
| Other post-retirement benefits | | 106,289 |
| | | 89,494 |
|
| Accelerated depreciation and other plant related items | | 615,499 |
| | | 876,235 |
|
| Losses/gains on reacquired debt | | 581 |
| | | 1,047 |
|
| Income taxes recoverable through future rates | | — |
| | | 33,324 |
|
| Deferred gas costs | | 3,041 |
| | | — |
|
| Other | | 3,430 |
| | | 4,775 |
|
| Total liabilities | | 728,840 |
| | | 1,004,875 |
|
| Net accumulated deferred income tax assets (liabilities) | | $ | (409,807 | ) | | | $ | (888,385 | ) |
The Company’s net operating losses generated through July 6, 2018December 31, 2019 have expiration dates beginning in 2036. 2033.The Company’s investmentCompany's net operating losses will be utilized under the settlement of the tax credit carry forwards expire over various years beginning 2032.sharing policy with affiliated companies.
Tabular Reconciliation of Unrecognized Tax Benefits
The following table summarizes the change in unrecognized tax benefits during calendar year ended December 31, 2019, three months ended December 31, 2018, and fiscal yearyears of 2018 and 2017, 2016 and our total unrecognized tax benefits at September 30,the periods under the provisions of ASC Topic 740, Income Taxes:740:
|
| | | | | | | | | | | |
| Unrecognized Tax Benefits |
| (In thousands) | 2018 | | 2017 | | 2016 |
| Total unrecognized tax benefits, October 1, | $ | 48,009 |
| | $ | 42,283 |
| | $ | 38,627 |
|
| Increases in tax positions relating to current year | 10,947 |
| | 10,766 |
| | 10,645 |
|
| Decreases in tax positions relating to prior year | (15,389 | ) | | (5,040 | ) | | (6,989 | ) |
| Total unrecognized tax benefits, September 30, | $ | 43,567 |
| | $ | 48,009 |
| | $ | 42,283 |
|
|
| | | | | | | | | | | | |
| Unrecognized Tax Benefits |
| | Calendar Year Ended December 31, | Three Months Ended December 31, | Fiscal Years Ended September 30, |
| (In thousands) | 2019 | 2018 | 2018 | 2017 |
| Total unrecognized tax benefits at beginning of the periods | $ | 35,906 |
| $ | 43,567 |
| $ | 48,009 |
| $ | 42,283 |
|
| Increases resulting from current period tax positions | — |
| 2,574 |
| 10,947 |
| 10,766 |
|
| Decreases resulting from prior period tax positions | (9,447 | ) | (10,235 | ) | (15,389 | ) | (5,040 | ) |
| Total unrecognized tax benefits at end of the periods | $ | 26,459 |
| $ | 35,906 |
| $ | 43,567 |
| $ | 48,009 |
|
During the calendar year ended December 31, 2019, the three months ended December 31, 2018 and the fiscal year ended September 30, 2018, the unrecognized tax benefits for WGL and Washington Gas decreased by approximately $9.4 million, $7.7 million and $4.4 million, respectively, relating to uncertain tax positions, primarily due to the change in tax accounting for repairs.repairs and closed periods. If the amounts of unrecognized tax benefits are eventually realized, it would not materially impact the effective tax rate. It is reasonably possible that the amount of the unrecognized tax benefit with respect to some of WGL’s and Washington Gas’ uncertain tax positions will significantly increase or decrease in the next 12 months, if the IRS were to finalize and issue its proposed revenue procedure for gas distribution repair deductions.
Amounts of Interest and Penalties Recognized
WGL and Washington Gas recognizerecognizes any accrued interest associated with uncertain tax positions in interest expense and recognizes any accrued penalties associated with uncertain tax positions in other expenses in the statements of income. During the fiscal year ended September 30, 2018, 2017, and 2016, there was no accrued interest expense associated with uncertain tax positions.calendar
WGL Holdings, Inc
Washington Gas Light Company
Part II
Item 8. Financial Statements and Supplementary Data (continued)
Notes to Consolidated Financial Statements
year ended December 31, 2019, three months ended December 31, 2018 and the fiscal years ended September 30, 2018 and 2017, there were no accrued interest expense or penalties associated with uncertain tax positions.
NOTE 9.10. PENSION AND OTHER POST-RETIREMENT BENEFIT PLANSPLANS Washington Gas maintains a qualified, trusteed, non-contributory defined benefit pension plan (qualified pension plan) covering most active and vested former employees of Washington Gas and certain employees of WGL subsidiaries. The non-contributory defined benefit pension plan is closed to all employees hired on or after January 1, 2010 and instead employees are eligible to receive supplemental contributions to their defined-contribution savings plan.
Several executive officers of Washington Gas also participate in a defined benefit supplemental executive retirement plan (DB SERP), a non-qualified pension plan. The DB SERP was closed to new entrants beginning January 1, 2010 and instead, executive officers are eligible to participate in a defined contribution SERP (DC SERP). In addition, effective January 1, 2010, Washington Gas established a non-funded defined benefit restoration plan (DB restoration) for the purpose of providing supplemental pension and pension-related benefits to a select group of management employees. There are rabbi trusts associated with the DB SERP and DB restoration plans that were funded pursuant to the Merger Agreement. The rabbi trusts can be used to make payments to the participants or the payments can be made from operating funds. As of September 30, 2018,At December 31, 2019, the rabbi trust balance associated with these two plans was $60.5 million. $20.2were $40.0 million, of which $19.5 million was recorded in “Current Assets-Other” and $40.3$20.5 million was recorded in “Deferred Charges and Other Assets - Other”, along with other rabbi trust balances. Washington Gas accounts for the qualified pension plan, DB SERP and DB restoration plans under the provisions of ASC Topic 715, Compensation-Retirement Benefits.
WGL subsidiaries offerWashington Gas offers defined-contribution savings plans to all eligible employees. These plans allow participants to defer on a pre-tax or after-tax basis, a portion of their salaries for investment in various alternatives. We makemade matching contributions to the amounts contributed by employees in accordance with the specific plan provisions. Total matching contributions to our savings plans were $5.6of $5.2 million, $5.1$1.1 million, $5.0 million, and $5.1$4.6 million during the calendar year ended December 31, 2019, three months ended December 31, 2018, and fiscal years ended September 30, 2018 2017 and 2016,2017, respectively. All employees not earning benefits in the qualified pension plan receive an employer provided supplemental contribution ranging from 4% to 6% depending on years of service. Total supplemental contributions to the planplans were $3.4$3.2 million, $2.9$0.7 million, $2.7 million, and $2.6$2.2 million during the calendar year ended December 31, 2019, three months ended December 31, 2018, and fiscal years ended September 30, 2018 2017 and 2016,2017, respectively.
Washington Gas provides certain healthcare and life insurance benefits for retired employees of Washington Gas and certain employees of WGL subsidiaries. Substantially all employees of Washington Gas may become eligible for such benefits if they attain retirement status while working for Washington Gas. For eligible retirees and dependents not yet receiving Medicare benefits, Washington Gas provides medical, prescription drug and dental benefits through Preferred Provider Organization (PPO) or Health Maintenance Organization (HMO) plans, through the Washington Gas Light Company Retiree Medical Plan (Retiree Medical Plan). For Medicare-eligible retirees age 65 and older, eligible retirees and dependents participate in a special tax-free HRAHealth Reimbursement Account plan (HRA plan) effective January 1, 2015. Participating retirees and dependents receive an annual subsidy to help purchase supplemental medical, prescription drug and dental coverage in the marketplace. As part of the new HRA plan, participants who enroll in a Medicare Part D prescription drug plan and meet the thresholdmarketplace as well as additional reimbursement for Medicare catastrophic prescription drug coverage will be eligible for an additional reimbursement of their out-of-pocket prescription drug costs in excess of the threshold.costs. Washington Gas accounts for healthcare and life insurance benefits under the provisions of ASC Topic 715.
On September 25, 2015, the Retiree Medical Plan was amended to limit the aggregate cost of applicable employer-sponsored coverage, thereby avoiding the 40% excise tax enacted by the Patient Protection and Affordable Care Act of 2010. The resolution, which was effective September 30, 2015 applies to plan years beginning on or after January 1, 2018, and includes a limit of $11,850 per participant, with a maximum limit of $30,950 for family coverage. This amendment resulted in a prior service credit of $26.1 million.2018.
Almost all costs associated with Washington Gas’ defined benefit post-retirement plans have historically been, and are expected to be, recovered through Washington Gas’ rates. Therefore, in accordance with ASC Topic 980 and ASC Topic 715, Washington Gas established a regulatory asset/liability for the substantial majority of the unrecognized costs/income associated with its defined benefit post-retirement plans. To the extent these amounts will not be recovered through Washington Gas’ rates, they are recorded directly to “Accumulated other comprehensive loss, net of taxes.”
Obligations and Assets
Washington Gas uses a measurement date of September 30December 31 for its pension and retiree healthcarehealth care and life insurance benefit plans.benefits plans upon the changing of fiscal years in 2018. Previously, Washington Gas used a measurement date of September 30. The following table provides certain information about Washington Gas’ post-retirement benefits:
WGL Holdings, Inc
Washington Gas Light Company
Part II
Item 8. Financial Statements and Supplementary Data (continued)
Notes to Consolidated Financial Statements
| | | Post-Retirement Benefits | Post-Retirement Benefits | Post-Retirement Benefits | |
| | | | | | Health and Life | Pension Benefits(a) | | Health and Life Benefits |
| | | Calendar Year Ended
December 31, | Three Months Ended December 31, | Fiscal Years Ended September 30, | | Calendar Year Ended
December 31, | Three Months Ended December 31, | Fiscal Years Ended September 30, |
| (In millions) | Pension Benefits(a) | | Benefits | 2019 | 2018 | 2017 | | 2019 | 2018 | 2017 |
| Year Ended September 30, | 2018 | | 2017 | | 2018 | | 2017 | |
Change in projected benefit obligation(b) | | | | | | | | | | | |
| Benefit obligation at beginning of year | $ | 1,047.5 |
| | $ | 1,069.3 |
| | $ | 309.0 |
| | $ | 324.3 |
| |
| Benefit obligation at beginning of period | | $ | 971.8 |
| $ | 989.8 |
| $ | 1,047.5 |
| $ | 1,069.3 |
| | $ | 277.9 |
| $ | 283.3 |
| $ | 309.0 |
| $ | 324.3 |
|
| Service cost | 14.9 |
| | 16.5 |
| | 5.3 |
| | 5.8 |
| 12.3 |
| 3.0 |
| 14.9 |
| 16.5 |
| | 5.0 |
| 1.3 |
| 5.3 |
| 5.8 |
|
| Interest cost | 39.6 |
| | 38.4 |
| | 11.7 |
| | 11.7 |
| 41.2 |
| 10.6 |
| 39.6 |
| 38.4 |
| | 11.9 |
| 3.0 |
| 11.7 |
| 11.7 |
|
| Change in plan benefits | — |
| | — |
| | — |
| | 1.1 |
| 0.2 |
| 0.2 |
| — |
| — |
| | — |
| — |
| — |
| 1.1 |
|
| Actuarial loss (gain) | (65.2 | ) | | (28.2 | ) | | (28.7 | ) | | (18.9 | ) | 103.6 |
| (17.3 | ) | (65.2 | ) | (28.2 | ) | | (12.3 | ) | (6.2 | ) | (28.7 | ) | (18.9 | ) |
| Retiree contributions and rebates | — |
| | — |
| | 1.9 |
| | 1.8 |
| |
| Plan participants' contribution | | — |
| — |
| — |
| — |
| | 1.6 |
| 0.9 |
| 1.9 |
| 1.8 |
|
| Settlements | | (19.4 | ) | — |
| — |
| — |
| | — |
| — |
| — |
| — |
|
| Benefits paid | (47.0 | ) | | (48.5 | ) | | (15.9 | ) | | (16.8 | ) | (50.6 | ) | (14.5 | ) | (47.0 | ) | (48.5 | ) | | (15.8 | ) | (4.4 | ) | (15.9 | ) | (16.8 | ) |
Projected benefit obligation at end of year(b) | $ | 989.8 |
| | $ | 1,047.5 |
| | $ | 283.3 |
| | $ | 309.0 |
| |
| Other | | 0.8 |
| — |
| — |
| — |
| | 0.9 |
| — |
| — |
| — |
|
Projected benefit obligation at end of period(b) | | $ | 1,059.9 |
| $ | 971.8 |
| $ | 989.8 |
| $ | 1,047.5 |
| | $ | 269.2 |
| $ | 277.9 |
| $ | 283.3 |
| $ | 309.0 |
|
| Change in plan assets | | | | | | | |
| | |
| |
| Fair value of plan assets at beginning of year | $ | 872.5 |
| | $ | 850.0 |
| | $ | 540.5 |
| | $ | 505.0 |
| |
| Fair value of plan assets at beginning of period | | $ | 807.0 |
| $ | 863.9 |
| $ | 872.5 |
| $ | 850.0 |
| | $ | 528.8 |
| $ | 569.3 |
| $ | 540.5 |
| $ | 505.0 |
|
| Actual return on plan assets | 38.8 |
| | 68.6 |
| | 43.0 |
| | 48.1 |
| 176.7 |
| (42.3 | ) | 38.8 |
| 68.6 |
| | 123.4 |
| (32.0 | ) | 43.0 |
| 48.1 |
|
| Company contributions | 1.8 |
| | 4.4 |
| | 5.0 |
| | 8.2 |
| 21.5 |
| 0.4 |
| 1.8 |
| 4.4 |
| | — |
| 1.3 |
| 5.0 |
| 8.2 |
|
| Retiree contributions and rebates | — |
| | — |
| | 1.9 |
| | 1.8 |
| |
| Plan participants' contribution | | — |
| — |
| — |
| — |
| | 1.6 |
| 0.9 |
| 1.9 |
| 1.8 |
|
| Settlements | | (19.4 | ) | — |
| — |
| — |
| | — |
| — |
| — |
| — |
|
| Expenses | (2.2 | ) | | (2.0 | ) | | (5.2 | ) | | (5.8 | ) | — |
| (0.5 | ) | (2.2 | ) | (2.0 | ) | | — |
| (6.3 | ) | (5.2 | ) | (5.8 | ) |
| Benefits paid | (47.0 | ) | | (48.5 | ) | | (15.9 | ) | | (16.8 | ) | (50.6 | ) | (14.5 | ) | (47.0 | ) | (48.5 | ) | | (15.8 | ) | (4.4 | ) | (15.9 | ) | (16.8 | ) |
| Fair value of plan assets at end of year | $ | 863.9 |
| | $ | 872.5 |
| | $ | 569.3 |
| | $ | 540.5 |
| |
| Funded status at end of year | $ | (125.9 | ) | | $ | (175.0 | ) | | $ | 286.0 |
| | $ | 231.5 |
| |
| Fair value of plan assets at end of period | | $ | 935.2 |
| $ | 807.0 |
| $ | 863.9 |
| $ | 872.5 |
| | $ | 638.0 |
| $ | 528.8 |
| $ | 569.3 |
| $ | 540.5 |
|
| Funded status at end of period | | (124.7 | ) | (164.8 | ) | (125.9 | ) | (175.0 | ) | | 368.8 |
| 250.9 |
| 286.0 |
| 231.5 |
|
| Allocation to affiliates | | (0.8 | ) | (1.6 | ) | (1.3 | ) | (1.7 | ) | | 2.3 |
| 1.4 |
| 1.7 |
| 1.2 |
|
| Adjusted funded status at end of period | | $ | (123.9 | ) | $ | (163.2 | ) | $ | (124.6 | ) | $ | (173.3 | ) | | $ | 366.5 |
| $ | 249.5 |
| $ | 284.3 |
| $ | 230.3 |
|
| Total amounts recognized on balance sheet | | | | | | | |
| | |
| |
| Non-current asset | $ | — |
| | $ | — |
| | $ | 286.0 |
| | $ | 231.5 |
| $ | — |
| $ | — |
| $ | — |
| $ | — |
| | $ | 366.5 |
| $ | 249.5 |
| $ | 284.3 |
| $ | 230.3 |
|
| Current liability | (20.2 | ) | | (6.5 | ) | | — |
| | — |
| (19.6 | ) | (20.2 | ) | (20.2 | ) | (6.5 | ) | | — |
| — |
| — |
| — |
|
| Non-current liability | (105.7 | ) | | (168.5 | ) | | — |
| | — |
| (104.3 | ) | (143.0 | ) | (104.4 | ) | (166.8 | ) | | — |
| — |
| — |
| — |
|
| Total recognized | $ | (125.9 | ) | | $ | (175.0 | ) | | $ | 286.0 |
| | $ | 231.5 |
| $ | (123.9 | ) | $ | (163.2 | ) | $ | (124.6 | ) | $ | (173.3 | ) | | $ | 366.5 |
| $ | 249.5 |
| $ | 284.3 |
| $ | 230.3 |
|
(a)The DB SERP and DB Restoration, included in pension benefits in the table above, does not include the amounts funded in rabbi trust.
(b)For the Health and Life Benefits, the change in projected benefit obligation represents the accumulated benefit obligation.
The following table provides the projected benefit obligation (PBO) and accumulated benefit (ABO) for the qualified pension plan, DB SERP and DB Restoration at September 30, 2018 and 2017.
|
| | | | | | | | | | | | | | | | | | | | | | | |
| Projected and accumulated benefit obligation |
| (In millions) | Qualified Pension Plan | | DB SERP | | DB Restoration |
| September 30, | 2018 | | 2017 | | 2018 | | 2017 | | 2018 | | 2017 |
| Projected benefit obligation | $ | 923.6 |
| | $ | 983.1 |
| | $ | 62.2 |
| | $ | 60.2 |
| | $ | 4.0 |
| | $ | 4.2 |
|
| Accumulated benefit obligation | $ | 859.1 |
| | $ | 905.8 |
| | $ | 60.7 |
| | $ | 57.5 |
| | $ | 3.0 |
| | $ | 3.0 |
|
AMOUNTS RECOGNIZED IN REGULATORY ASSETS/LIABILITIES AND ACCUMULATED OTHER COMPREHENSIVE INCOME
The following table provides amounts recorded to regulatory assets, regulatory liabilities and accumulated other comprehensive loss/(income) at September 30, 2018 and 2017:
WGL Holdings, Inc
Washington Gas Light Company
Part II
Item 8. Financial Statements and Supplementary Data (continued)
Notes to Consolidated Financial Statements
The following table provides the projected benefit obligation (PBO) and accumulated benefit obligation (ABO) for the qualified pension plan, DB SERP and DB Restoration at December 31, 2019 and 2018. |
| | | | | | | | | | | | | | | |
| Unrecognized Costs/Income Recorded on the Balance Sheet |
| (In millions) | Pension Benefits | | Health and Life Benefits |
| September 30, | 2018 | | 2017 | | 2018 | | 2017 |
| Actuarial net loss (gain) | $ | 61.0 |
| | $ | 136.1 |
| | $ | (64.5 | ) | | $ | (21.8 | ) |
| Prior service cost (credit) | 0.9 |
| | 1.2 |
| | (107.2 | ) | | (124.9 | ) |
| Total | $ | 61.9 |
| | $ | 137.3 |
| | $ | (171.7 | ) | | $ | (146.7 | ) |
Regulatory asset (liability)(a) | $ | 48.2 |
| | $ | 119.6 |
| | $ | (160.5 | ) | | $ | (137.2 | ) |
Pre-tax accumulated other comprehensive loss (gain)(b) | 13.7 |
| | 17.7 |
| | (11.2 | ) | | (9.5 | ) |
| Total | $ | 61.9 |
| | $ | 137.3 |
| | $ | (171.7 | ) | | $ | (146.7 | ) |
|
| | | | | | | | | | | | | | | | | | |
| Projected and accumulated benefit obligation |
| | Qualified Pension Plan | DB SERP | DB Restoration |
| | December 31, | December 31, | December 31, |
| (In millions) | 2019 | 2018 | 2019 | 2018 | 2019 | 2018 |
| Projected benefit obligation | $ | 1,002.3 |
| $ | 906.2 |
| $ | 52.3 |
| $ | 61.5 |
| $ | 5.4 |
| $ | 4.1 |
|
| Accumulated benefit obligation | $ | 943.2 |
| $ | 847.1 |
| $ | 52.3 |
| $ | 59.8 |
| $ | 4.8 |
| $ | 3.2 |
|
Amounts Recognized in Regulatory Assets/Liabilities and Accumulated Other Comprehensive Income (Loss)
The following table provides amounts recorded to regulatory assets, regulatory liabilities and accumulated other comprehensive loss (income) at December 31, 2019 and 2018:
|
| | | | | | | | | | | | |
| Unrecognized Costs/Income Recorded on the Balance Sheet |
| | Pension Benefits | Health and Life Benefits |
| | December 31, | December 31, |
| (In millions) | 2019 | 2018 | 2019 | 2018 |
| Actuarial net loss (gain) | $ | 55.2 |
| $ | 96.1 |
| $ | (137.3 | ) | $ | (26.0 | ) |
| Prior service cost (credit) | 1.0 |
| 1.0 |
| (87.0 | ) | (102.8 | ) |
Total(a) | $ | 56.2 |
| $ | 97.1 |
| $ | (224.3 | ) | $ | (128.8 | ) |
| Regulatory asset (liability) | $ | 39.4 |
| $ | 80.8 |
| $ | (199.7 | ) | $ | (121.1 | ) |
Pre-tax accumulated other comprehensive loss (income)(b) | 16.6 |
| 15.9 |
| (23.2 | ) | (6.9 | ) |
| Total | $ | 56.0 |
| $ | 96.7 |
| $ | (222.9 | ) | $ | (128.0 | ) |
(a)The regulatory liability recorded on our balance sheets at September 30, 2018 and 2017 is netPension benefits include amounts allocated to affiliates of a deferred income tax benefit of $0.2$0.2 million and $2.2$0.4 million at December 31, 2019 and 2018, respectively; Health and Life Benefits includes amounts allocated to affiliates of $1.4 million and $0.8 million at December 31, 2019 and 2018, respectively.
(b)The total amount of accumulated other comprehensive income recorded on our balance sheet at December 31, 2019 is net of an income tax expense of $1.7 million; The total accumulated other comprehensive loss recorded on our balance sheetssheet at September 30,December 31, 2018 and 2017 is net of an income tax benefit of $0.7 million and $3.6 million, respectively.$2.4 million.
The following table provides amounts that are included in regulatory assets/liabilities and accumulated other comprehensive loss associated with our unrecognized pension and other post-retirement benefit costs that were recognized as components of net periodic benefit cost before allocations to affiliates and capital during fiscalthe calendar year 2018.ended December 31, 2019. | | | Amounts Recognized During Fiscal Year 2018 | |
| Amounts Recognized During the Calendar Year Ended December 31, 2019 | | Amounts Recognized During the Calendar Year Ended December 31, 2019 |
| Regulatory assets/liabilities | | Accumulated other comprehensive loss | | Regulatory assets/liabilities | | Accumulated other
comprehensive income (loss) |
| (In millions) | Pension Benefits | | Health and Life Benefits | | Pension Benefits | | Health and Life Benefits | | Pension
Benefits | | Health and
Life Benefits | | Pension
Benefits | | Health and
Life Benefits |
| Actuarial net loss | $ | 13.5 |
| | $ | — |
| | $ | 2.1 |
| | $ | — |
| | $ | 3.7 |
| | $ | — |
| | $ | 1.6 |
| | $ | — |
|
| Prior service cost (credit) | 0.2 |
| | (16.5 | ) | | 0.1 |
| | (1.1 | ) | | 0.1 |
| | (15.0 | ) | | 0.2 |
| | (0.7 | ) |
| Total | $ | 13.7 |
| | $ | (16.5 | ) | | $ | 2.2 |
| | $ | (1.1 | ) | | $ | 3.8 |
| | $ | (15.0 | ) | | $ | 1.8 |
| | $ | (0.7 | ) |
The following table provides amounts that are included in regulatory assets/liabilities and accumulated other comprehensive loss associated with our unrecognized pension and other post-retirement benefit costs that are expected to be recognized as components of net periodic benefit cost before allocations to affiliates during fiscal year 20192020.
Washington Gas Light Company
Part II
Item 8. Financial Statements and Supplementary Data (continued)
Notes to Financial Statements
| | | Amounts to be Recognized During Fiscal Year 2019 | |
| Amounts to be Recognized During Calendar Year 2020 | | Amounts to be Recognized During Calendar Year 2020 |
| Regulatory assets/liabilities | | Accumulated other comprehensive loss | Regulatory assets/liabilities | | Accumulated other comprehensive income (loss) |
| (In millions) | Pension Benefits | | Health and Life Benefits | | Pension Benefits | | Health and Life Benefits | Pension Benefits | | Health and Life Benefits | | Pension Benefits | | Health and Life Benefits |
| Actuarial net loss | $ | 4.0 |
| | $ | — |
| | $ | 1.5 |
| | $ | — |
| |
| Actuarial net loss (gain) | | $ | 9.6 |
| | $ | (0.4 | ) | | $ | 4.9 |
| | $ | — |
|
| Prior service cost (credit) | 0.1 |
| | (15.7 | ) | | 0.1 |
| | (1.1 | ) | 0.1 |
| | (12.2 | ) | | 0.2 |
| | (1.4 | ) |
| Total | $ | 4.1 |
| | $ | (15.7 | ) | | $ | 1.6 |
| | $ | (1.1 | ) | $ | 9.7 |
| | $ | (12.6 | ) | | $ | 5.1 |
| | $ | (1.4 | ) |
Additionally, Washington Gas expects partial settlements of the DB SERP to occur in the first and third quarter of 2020, which will result in estimated losses of $1.1 million and $2.3 million, respectively.
Realized and unrealized gains and losses for assets under Washington Gas’ post-retirement benefit plans are spread over a period of five years. Each year, 20% of the prior five years’ asset gains and losses are recognized. The market-related value of assets is equal to the market value of assets less the following percentages of prior years’ realized and unrealized gains and losses on equities: 80% of the prior year, 60% of the second prior year, 40% of the third prior year and 20% of the fourth prior year.
Net Periodic Benefit Cost
WGL Holdings, Inc
Washington Gas Light Company
Part II
Item 8. Financial Statements and Supplementary Data (continued)
Notes to Consolidated Financial Statements
The components of the net periodic benefit costs (income) for calendar year ended December 31, 2019, three months ended December 31, 2018, and fiscal years ended September 30, 2018 2017 and 20162017 related to pension and other post-retirement benefits were as follows:follows | | Components of Net Periodic Benefit Costs (Income) | | | | Pension Benefits | Health and Life Benefits |
| | | Calendar Year Ended December 31, | Three Months Ended December 31, | Fiscal Years Ended September 30, | Calendar Year Ended December 31, | Three Months Ended December 31, | Fiscal Years Ended September 30, |
| (In millions) | Pension Benefits | | Health and Life Benefits | 2019 | 2018 | 2017 | 2019 | 2018 | 2017 |
| Year Ended September 30, | 2018 | | 2017 | | 2016 | | 2018 | | 2017 | | 2016 | |
| Service cost | $ | 14.9 |
| | $ | 16.5 |
| | $ | 14.2 |
| | $ | 5.3 |
| | $ | 5.8 |
| | $ | 4.6 |
| $ | 12.3 |
| $ | 3.0 |
| $ | 14.9 |
| $ | 16.5 |
| $ | 5.0 |
| $ | 1.3 |
| $ | 5.3 |
| $ | 5.8 |
|
| Interest cost | 39.6 |
| | 38.4 |
| | 41.3 |
| | 11.7 |
| | 11.7 |
| | 13.1 |
| 41.2 |
| 10.6 |
| 39.6 |
| 38.4 |
| 11.9 |
| 3.0 |
| 11.7 |
| 11.7 |
|
| Expected return on plan assets | (42.3 | ) | | (41.0 | ) | | (40.9 | ) | | (23.7 | ) | | (22.1 | ) | | (20.4 | ) | (43.0 | ) | (10.9 | ) | (42.3 | ) | (41.0 | ) | (24.4 | ) | (6.1 | ) | (23.7 | ) | (22.1 | ) |
| Recognized prior service cost (credit) | 0.3 |
| | 0.3 |
| | 0.3 |
| | (17.6 | ) | | (17.7 | ) | | (17.7 | ) | 0.3 |
| 0.1 |
| 0.3 |
| 0.3 |
| (15.8 | ) | (4.4 | ) | (17.6 | ) | (17.7 | ) |
| Recognized actuarial loss | 15.6 |
| | 22.0 |
| | 16.9 |
| | — |
| | 1.9 |
| | 1.2 |
| 5.3 |
| 1.4 |
| 15.6 |
| 22.0 |
| — |
| — |
| — |
| 1.9 |
|
| Net periodic benefit cost | 28.1 |
| | 36.2 |
| | 31.8 |
| | (24.3 | ) | | (20.4 | ) | | (19.2 | ) | |
| Amount allocated to construction projects | (4.7 | ) | | (6.4 | ) | | (5.6 | ) | | 4.0 |
| | 4.6 |
| | 4.1 |
| |
| Amount deferred as regulatory asset (liability)-net | 6.9 |
| | 6.9 |
| | 7.1 |
| | — |
| | — |
| | (0.2 | ) | |
| Settlement charge | | 5.5 |
| — |
| — |
| — |
| — |
| — |
| — |
| — |
|
| Other adjustments | | — |
| — |
| — |
| — |
| 0.7 |
| — |
| — |
| — |
|
| Net periodic benefit cost (income) | | 21.6 |
| 4.2 |
| 28.1 |
| 36.2 |
| (22.6 | ) | (6.2 | ) | (24.3 | ) | (20.4 | ) |
| Allocation to affiliates | | (1.8 | ) | (0.4 | ) | (4.2 | ) | (2.9 | ) | 2.6 |
| 0.8 |
| 3.1 |
| 1.4 |
|
| Adjusted net periodic benefit cost (income) | | 19.8 |
| 3.8 |
| 23.9 |
| 33.3 |
| (20.0 | ) | (5.4 | ) | (21.2 | ) | (19.0 | ) |
Amount allocated to construction projects(a) | | (1.9 | ) | (0.6 | ) | (4.7 | ) | (6.4 | ) | (0.8 | ) | (0.2 | ) | 4.0 |
| 4.6 |
|
| Amount deferred as regulatory asset (liability)-net allocations | | 0.6 |
| 1.5 |
| 5.9 |
| 6.9 |
| — |
| — |
| — |
| — |
|
| Amount charged (credited) to expense | $ | 30.3 |
| | $ | 36.7 |
| | $ | 33.3 |
| | $ | (20.3 | ) | | $ | (15.8 | ) | | $ | (15.3 | ) | $ | 18.5 |
| $ | 4.7 |
| $ | 25.1 |
| $ | 33.8 |
| $ | (20.8 | ) | $ | (5.6 | ) | $ | (17.2 | ) | $ | (14.4 | ) |
(a)On October 1, 2018, Washington Gas prospectively adopted ASU 2017-07. As a result, only the service cost component of net periodic benefit costs (income) is eligible for capitalization.
Amounts included in the line item “Amount deferred as regulatory asset/liability-net,” as shown in the table above, represent the amortization of previously unrecovered costs of the applicable pension benefits or the health and life benefits as approved in the District of Columbia through 2019. The amounts are fully amortized as of December 31, 2019.
ASSUMPTIONSWashington Gas Light Company
Part II
Item 8. Financial Statements and Supplementary Data (continued)
Notes to Financial Statements
On October 1, 2018, Washington Gas adopted ASU 2017-07. This standard requires entities to report the service cost component in the same financial statement line item as other compensation costs arising from services rendered by the pertinent employees during the period. The other components of net benefit cost are to be presented separately from service cost and outside of operating income. Washington Gas includes the other components in "Other Income (expense)-net" on the Statement of Operations. In addition, only the service cost component of net benefit cost is eligible for capitalization. Changes to the presentation of service costs and other components of net benefit cost were applied retrospectively. As a result of the retrospective adoption, we reclassified $11.3 million and $3.9 million, respectively, of net periodic benefit income from "Operation and maintenance" expense to "Other income (expense)-net" on the statements of operations for the fiscal years ended September 30, 2018 and 2017. Changes in capitalization practices were implemented prospectively.
Assumptions
The weighted average assumptions used to determine net periodic benefit obligations and net periodic benefit costs were as follows: |
| | | | | | | | |
| Benefit Obligations Assumptions |
| Pension Benefits | Health and Life Benefits |
| | Calendar Year Ended December 31, | Three Months Ended December 31, | Fiscal Years Ended September 30, | Calendar Year Ended December 31, | Three Months Ended December 31, | Fiscal Years Ended September 30, |
| | 2019 | 2018 | 2018 | 2017 | 2019 | 2018 | 2018 | 2017 |
Discount rate(a) | 3.4%-3.5% | 4.3%-4.4% | 4.3%-4.4% | 3.6%-3.9% | 3.5% | 4.4% | 4.4% | 3.9% |
| Rate of compensation increase | 3.0%-3.5% | 3.5%-4.1% | 3.5%-4.1% | 3.5%-4.1% | 3.5% | 4.1% | 4.1% | 4.1% |
|
| | | | | | | | | |
| Benefit Obligations Assumptions |
| | | | |
| Pension Benefits | | Health and Life Benefits |
| September 30, | 2018 | | 2017 | | 2018 | | 2017 |
Discount rate(a) | 4.30%-4.40% | | 3.60%-3.90% | | 4.40 | % | | 3.90 | % |
| Rate of compensation increase | 3.50%-4.10% | | 3.50%-4.10% | | 4.10 | % | | 4.10 | % |
| | | | | | | | |
(a)The increasedecrease in the discount rate in fiscalthe calendar year 2018ended December 31, 2019 compared to prior yearyears primarily reflects the increasedecrease in long-term interest rates.
| | Net Periodic Benefit Cost Assumptions | | | | | | | Pension Benefits | Health and Life Benefits |
| Pension Benefits | | Health and Life Benefits | Calendar Year Ended December 31, | Three Months Ended December 31, | Fiscal Years Ended September 30, | Calendar Year Ended December 31, | Three Months Ended December 31, | Fiscal Years Ended September 30, |
| Years Ended September 30, | 2018 | 2017 | 2016 | | 2018 | 2017 | 2016 | |
| | | 2019 | 2018 | 2017 | 2019 | 2018 | 2017 |
Discount rate(a) | 3.60%-3.90% |
| 3.40%-3.70% |
| 4.10%-4.50% |
| | 3.90 | % | 3.70 | % | 4.50 | % | 4.3%-4.4% |
| 4.3%-4.4% |
| 3.6%-3.9% |
| 3.4%-3.7% |
| 4.4 | % | 4.4 | % | 3.9 | % | 3.7 | % |
Expected long-term return on plan assets(b) | 5.75 | % | 5.75 | % | 6.00 | % | | 5.50 | % | 5.50 | % | 5.75 | % | 5.75 | % | 5.75 | % | 5.75 | % | 5.75 | % | 5.25 | % | 5.25 | % | 5.50 | % | 5.50 | % |
Rate of compensation increase(c) | 3.50%-4.10% |
| 3.50%-4.10% |
| 3.50%-4.10% |
| | 4.10 | % | 4.10 | % | 4.10 | % | 3.5% - 4.1% |
| 3.5%-4.1% |
| 3.5%-4.1% |
| 3.5%-4.1% |
| 4.1 | % | 4.1 | % | 4.1 | % | 4.1 | % |
(a) The changes in the discount rates over the last three fiscal yearsprior periods primarily reflect the changes in long-term interest rates.
(b) For health and life benefits, the expected returns for certain funds may be lower due to certain portions of income that are subject to an assumed income tax rate of 42.2%.
(c) The changes in the rate of compensation reflects the best estimates of actual future compensation levels including consideration of general price levels, productivity, seniority, promotion, and other factors such as inflation rates.
Discount Rate
Washington Gas determines the discount rate based on a portfolio of high quality fixed-income investments (AA- as assigned by Standard & Poor’s or Aa3 as assigned by Moody’s or better) whose cash flows would cover our expected benefit payments.
WGL Holdings, Inc
Washington Gas Light Company
Part II
Item 8. Financial Statements and Supplementary Data (continued)
Notes to Consolidated Financial Statements
Expected long-term return on plan assets
Washington Gas determines the expected long-term rate of return on plan assets by averaging the expected earnings for the target asset portfolio. In developing the expected rate of return assumption, Washington Gas evaluates an analysis of historical actual performance and long-term return projections, which gives consideration to our asset mix and anticipated length of obligation of our plan.
Mortality Assumptions
OnWashington Gas Light Company
Part II
Item 8. Financial Statements and Supplementary Data (continued)
Notes to Financial Statements
Beginning in October 27, 2014, the SOA published updatedbegan publishing annual updates to its mortality tables for U.S. plans, (RP-2014)starting with the RP-2014 base mortality table and the MP-2014 improvement scale. The improvement scale has been updated each year.
In October 2019, the SOA issued an updated base mortality table (the Private Retirement Plans Mortality table for 2012 (Pri-2012)) as well as an updated improvement scale (MP-2014), which both reflect improved longevity. Based upon an evaluation of the information provided by the SOA related to the RP-2014 tables(MP-2019). The white-collar Pri-2012 mortality table and the MP-2014MP-2019 improvement scale were used to determine the benefit obligation as wellof December 31, 2019.
The RP-2014 mortality table and MP-2018 improvement scale were used to determine the benefit obligation as recent additional studies of mortality improvement, we adopted the RP-2014 tables and adopted a modified improvement scale.December 31, 2018. We have modified the MP-2014 improvement scale to (a) adjust the ultimate long-term rate of mortality improvement from 1.00% to 0.75% per annum up to age 85 trending down to 0% between age 85 and age 115; and (b) shorten the convergence period from short term to ultimate rates of improvement from the 20-year period to a 15-year period. These mortality assumptions were used to determine the benefit obligations as of September 30, 2018 and 2017.
Healthcare cost trend
Washington Gas assumed the healthcare cost trend rates related to the accumulated post-retirement benefit obligation as of September 30, 2018,at December 31, 2019, for non-Medicare eligible retirees, to be 6.5%6.25% for fiscalcalendar year 2019.2020. Washington Gas expects the trend rate to decrease to 2.2%2.0% in fiscalcalendar year 2020 and remain at that level thereafter. The healthcare cost trend rate used to measure the accumulated post-retirement benefit obligation for non-Medicare eligible retirees as of September 30, 2017 was 6.3% for fiscal year 2018. This rate was expected to decrease to 6.0% in fiscal year 2019, 2.2% in fiscal year 20202021 and remain at that level thereafter.
| | Healthcare Trend | | (In millions) | One Percentage-Point Increase | | One Percentage-Point Decrease | One Percentage-Point Increase | | One Percentage-Point Decrease |
| Increase (decrease) total service and interest cost components | $ | 0.6 |
| | $ | (0.5 | ) | $ | 0.6 |
| | $ | (0.5 | ) |
| Increase (decrease) post-retirement benefit obligation | $ | 5.2 |
| | $ | (4.6 | ) | $ | 5.8 |
| | $ | (5.1 | ) |
For Medicare eligible retirees age 65 and older that will receive a subsidy each year as a benefit from the HRA plan, Washington Gas assumed no increase to the annual subsidy in fiscalcalendar years 20182020 - 2024, 4.0% increase in calendar year 2025 and 20192% increase in calendar year 2026 and a 3.0% increase thereafter in order to approximate possible future increases to the stipend. While the plan terms do not guarantee increases to the stipend, Washington Gas intends to review the stipend annually.
INVESTMENT POLICIES AND STRATEGIESInvestment Policies and Strategies
The investment objective of the qualified pension, healthcare, and life insurance benefit plans (“Plan” or “Plans”) is to allocate each Plan’s assets to appropriate investment asset classes (asset categories) so that the benefit obligations of each Plan are adequately funded, consistent with appropriate risk tolerance guidelines for the Plans’each Plan’s and Washington Gas’ tolerance for risk.
Washington Gas' portion of retired employee healthcare and life insurance benefits obligation is funded through two trusts: (i) the Washington Gas Light Company Post Retirement Benefit Master Trust for Retired Previously Union-Eligible Employees ("union-eligible trust") and (ii) the Washington Gas Light Company Post Retirement Benefit Master Trust for Retired Management Employees ("management trust").
In order to best achieve the investment objectives for each Plan, strategic allocation targets and ranges are established that control exposure to selected investment asset classes. TargetAt December 31, 2019, target qualified pension plan trust asset allocations are 32% U.S. Equities, 8% International Equities, 5% Real Estate and 55% Fixed Income. Target asset class allocations for the union-eligible and management trusts were modified during August 2018. At September 30, 2018, target union-eligible trust asset class allocations are 40% U.S. Large-Cap Equities and 60% Fixed Income and target management trust asset class allocations are 50% U.S. Large-Cap Equities and 50% Fixed Income. Actual asset balances are reviewed monthly and allowed to range within plus or minus 5% or less of the target allocations. Assets are generally rebalanced to target allocations before actual amounts fall below or rise above the allowable ranges.
WGL Holdings, Inc
Washington Gas Light Company
Part II
Item 8. Financial Statements and Supplementary Data (continued)
Notes to Consolidated Financial Statements
Asset/liability modeling (ALM) is used to test the benefits and risks of several potential strategic asset allocation mixes. Simulated investment performance results based on assumptions about expected return, volatility, and correlation characteristics of the selected asset classes are tested for their effects on contributions, pension expense, PBO funded status, and downside Value at Risk metrics over a ten-year planning time horizon. Important outcomes from past ALM studies include decisions to increase fixed income exposure, lengthen the duration of those fixed income assets and implement a dynamic asset allocation strategy that allows for the de-risking of the qualified pension plan portfolio over time. The dynamic asset allocation strategy resulted in a qualified pension plan portfolio de-risking during May 2017 when Fixed Income and U.S. Equities exposures were increased and reduced, respectively.
The most recent qualifiedQualified pension plan ALM study wasstudies were completed during February 2018.2018 and January 2020. An outcome of the 2018 ALM study was that the dynamic asset allocation strategy was adjusted so that the target fixed income allocation percentage will be increased by 10% (versus a 5% increase previously) for each 5% improvement in the qualified pension plan’s funded ratio, as measured by anratio. The 2020 ALM study indicated that the current target asset class allocations represent a prudent trade-off between risk and reward. As a result of the 2020 ALM study, no significant investment consultant.strategy changes were adopted.
A management trust ALM study was completed during January 2020. The 2018 ALM study did not result in any other significant changes
Washington Gas Light Company
Part II
Item 8. Financial Statements and Supplementary Data (continued)
Notes to Financial Statements
investment strategy.strategy changes.
Union-eligible trust ALM study was finished in January 2020. The outcome of this study was that target asset class allocations were adjusted from 40% U.S. Large-Cap Equities and 60% Fixed Income to 30% U.S. Large-Cap Equities and 70% Fixed Income starting January 2020.
Significant amounts of each various Plan's assets are managed by the same financial institution. Each Plan has a high exposure to U.S. based investments. There are no other significant risk concentrations related to investments in any entity, industry, country, commodity, or investment fund.
Commingled funds are employed in the management of qualified pension plan, management trust, and union-eligible trust assets. AIn addition, a publicly offerableoffered mutual fund and a separately managed portfolioportfolios are also employed in the management of a qualified pension plan trust andtrust. The management trust assets.also uses a separately managed portfolio.
U.S. and international equity assets are diversified across sectors, industries, and investment styles. Fixed income assets are primarily diversified across U.S. government and investment grade corporate debt instruments, with some exposure to foreign sovereign debt and minor exposure to non-investment-grade securities. Real estate is diversified geographically across the U.S. by property type.
The qualified pension plan’s investment policy allows the use of futures, options, and other derivatives for purposes of reducing portfolio risk and as a low-costlow- cost option for gaining market exposure, but derivatives may not be used for leverage. The qualified pension plan’s investment policy prohibits investments in Washington Gas securities. The prohibition applies to separately managed portfolios but does not apply to any commingled fund investments.
The following tables present the fair value of the pension plan assets and health and life insurance plan assets by asset category as of September 30, 2018at December 31, 2019 and 2017:2018.
|
| | | | | | | | | | | | |
| Pension Plan Assets |
| | | | | | % of |
| (In millions) | Level 1 | Level 2 | Total | | Total |
| At December 31, 2019 | | | | | |
| Cash and cash equivalents | $ | 4.2 |
| $ | — |
| $ | 4.2 |
| | 0.4 | % |
| Equity securities | | | | | |
| Preferred Securities | — |
| 0.2 |
| 0.2 |
| | — |
|
| Fixed income securities | | | | | |
| U.S. Treasuries | — |
| 145.2 |
| 145.2 |
| | 15.5 |
|
| U.S. Corporate Debt | — |
| 234.8 |
| 234.8 |
| | 25.1 |
|
| U.S. Agency Obligations and Government Sponsored Entities | — |
| 56.7 |
| 56.7 |
| | 6.1 |
|
| Asset-Backed Securities | — |
| 0.8 |
| 0.8 |
| | 0.1 |
|
| Municipalities | — |
| 9.9 |
| 9.9 |
| | 1.1 |
|
| Non-U.S. Corporate Debt | — |
| 45.1 |
| 45.1 |
| | 4.8 |
|
Other(a) | — |
| 6.3 |
| 6.3 |
| | 0.7 |
|
Mutual Funds(b) | 48.2 |
| — |
| 48.2 |
| | 5.2 |
|
Derivatives(c) | — |
| (0.1 | ) | (0.1 | ) | | — |
|
| Total investments in the fair value hierarchy | $ | 52.4 |
| $ | 498.9 |
| $ | 551.3 |
| | 59.0 | % |
Investments measured at net asset value using the NAV practical expedient(d)
| | | | | |
Commingled Funds and Pooled Separate Accounts(e) | | | 358.6 |
| | 38.3 | % |
Private Equity/Limited Partnership(f) | | | 42.8 |
| | 4.6 | % |
| Total fair value of plan investments | | | 952.7 |
| | 101.9 | % |
Net payable (g) | | | (17.5 | ) | | (1.9 | ) |
Total plan assets at fair value (h) | | | $ | 935.2 |
| | 100.0 | % |
Washington Gas Light Company
Part II
Item 8. Financial Statements and Supplementary Data (continued)
Notes to Consolidated Financial Statements
|
| | | | | | | | | | | | | | | |
| Pension Plan Assets |
| | | | | | | % of |
| ($ In millions) | Level 1 | Level 2 | Level 3 | Total | | Total |
| At September 30, 2018 | | | | | | |
| Cash and cash equivalents | $ | 2.2 |
| $ | — |
| $ | — |
| $ | 2.2 |
| | 0.3 | % |
| Equity securities | | | | | | |
| Preferred Securities | — |
| 2.1 |
| — |
| 2.1 |
| | 0.2 |
|
| Fixed income securities | | | | | | |
| U.S. Treasuries | — |
| 127.6 |
| — |
| 127.6 |
| | 14.8 |
|
| U.S. Corporate Debt | — |
| 227.8 |
| — |
| 227.8 |
| | 26.4 |
|
| U.S. Agency Obligations and Government Sponsored Entities | — |
| 28.3 |
| — |
| 28.3 |
| | 3.3 |
|
| Asset-Backed Securities | — |
| 0.5 |
| — |
| 0.5 |
| | 0.1 |
|
| Municipalities | — |
| 8.3 |
| — |
| 8.3 |
| | 1.0 |
|
| Non-U.S. Corporate Debt | — |
| 47.1 |
| — |
| 47.1 |
| | 5.5 |
|
Repurchase Agreement(a) | — |
| — |
| — |
| — |
| | — |
|
Other(b) | — |
| 5.2 |
| — |
| 5.2 |
| | 0.6 |
|
Mutual Funds(c) | 42.4 |
| — |
| — |
| 42.4 |
| | 4.9 |
|
Derivatives(d) | — |
| 1.1 |
| — |
| 1.1 |
| | 0.1 |
|
| Total investments in the fair value hierarchy | $ | 44.6 |
| $ | 448.0 |
| $ | — |
| $ | 492.6 |
| | 57.2 | % |
Investments measured at net asset value using the NAV practical expedient(e)
| | | | | |
|
|
Commingled Funds and Pooled Separate Accounts(f) | | | | 329.3 |
| | 38.0 | % |
Private Equity/Limited Partnership(g) | | | | 39.1 |
| | 4.5 | % |
| Total fair value of plan investments | | | | 861.0 |
| | 99.7 | % |
Net receivable(h) | | | | 2.9 |
| | 0.3 |
|
Total plan assets at fair value (i) | | | | $ | 863.9 |
| | 100.0 | % |
WGL Holdings, Inc
Washington Gas Light Company
Part II
Item 8. Financial Statements and Supplementary Data (continued)
Notes to Consolidated Financial Statements
| | Pension Plan Assets | | | | | % of | | | % of |
| ($ In millions) | Level 1 | Level 2 | Level 3 | Total | | Total | |
| At September 30, 2017 | | | | |
| (In millions) | | Level 1 | Level 2 | Total | | Total |
| At December 31, 2018 | | | | |
| Cash and cash equivalents | $ | 0.7 |
| $ | — |
| $ | — |
| $ | 0.7 |
| | 0.1 | % | $ | 0.7 |
| $ | — |
| $ | 0.7 |
| | 0.1 | % |
| Equity securities | | | | | | |
| Preferred Securities | — |
| 0.6 |
| — |
| 0.6 |
| | 0.1 |
| — |
| 1.9 |
| 1.9 |
| | 0.2 |
|
| Fixed income securities | |
| | | | | |
| U.S. Treasuries | — |
| 140.9 |
| — |
| 140.9 |
| | 16.2 |
| — |
| 133.2 |
| 133.2 |
| | 16.5 |
|
| U.S. Corporate Debt | — |
| 232.3 |
| — |
| 232.3 |
| | 26.6 |
| — |
| 216.4 |
| 216.4 |
| | 26.8 |
|
| U.S. Agency Obligations and Government Sponsored Entities | — |
| 20.0 |
| — |
| 20.0 |
| | 2.3 |
| — |
| 27.5 |
| 27.5 |
| | 3.4 |
|
| Asset-Backed Securities | — |
| 2.0 |
| — |
| 2.0 |
| | 0.2 |
| — |
| 0.5 |
| 0.5 |
| | 0.1 |
|
| Municipalities | — |
| 14.9 |
| — |
| 14.9 |
| | 1.7 |
| — |
| 8.3 |
| 8.3 |
| | 1.0 |
|
| Non-U.S. Corporate Debt | — |
| 48.1 |
| — |
| 48.1 |
| | 5.5 |
| — |
| 46.7 |
| 46.7 |
| | 5.8 |
|
Repurchase Agreement(a) | | 3.7 |
| | 3.7 |
| | 0.4 |
| |
Other(b) | — |
| 6.7 |
| — |
| 6.7 |
| | 0.8 |
| |
Mutual Funds(c) | 41.4 |
| — |
| — |
| 41.4 |
| | 4.7 |
| |
Derivatives(d) | — |
| 1.9 |
| — |
| 1.9 |
| | 0.2 |
| |
Other(a) | | — |
| 4.9 |
| 4.9 |
| | 0.6 |
|
Mutual Funds(b) | | 36.4 |
| — |
| 36.4 |
| | 4.5 |
|
Derivatives(c) | | — |
| 6.8 |
| 6.8 |
| | 0.8 |
|
| Total investments in the fair value hierarchy | $ | 42.1 |
| $ | 471.1 |
| $ | — |
| $ | 513.2 |
| | 58.8 | % | $ | 37.1 |
| $ | 446.2 |
| $ | 483.3 |
| | 59.8 | % |
Investments measured at net asset value using the NAV practical expedient(e) | |
|
| |
|
| |
Commingled Funds and Pooled Separate Accounts(f)
| | $ | 324.4 |
| | 37.2 | % | |
Private Equity/Limited Partnership(g)
| | $ | 37.6 |
| | 4.3 | % | |
Investments measured at net asset value using the NAV practical expedient(d)
| | | |
|
|
Commingled Funds and Pooled Separate Accounts(e) | | | 289.6 |
| | 35.9 | % |
Private Equity/Limited Partnership(f) | | | 35.3 |
| | 4.4 | % |
Total fair value of plan investments
| | 875.2 |
|
| 100.3 | % | | 808.2 |
| | 100.1 |
|
Net payable(h) | | (2.7 | ) | | (0.3 | ) | |
| Total plan assets at fair value | | $ | 872.5 |
| | 100.0 | % | |
Net payable(g) | | | (1.2 | ) | | (0.1 | )% |
Total plan assets at fair value (i) | | | $ | 807.0 |
| | 100.0 | % |
(a) This category includes Treasury Bills with a pre-commitment from the counterparty to repurchase the same securities on the next business day at an agreed-upon price.
(b) This category primarily includes non-U.S. government bonds as of September 30, 2018December 31, 2019 and 2017.2018.
(c)(b) At September 30,December 31, 2019 and 2018, and 2017, the investment in a mutual fund consisted primarily of common stock of non-U.S. based companies.
(d)(c)At September 30,December 31, 2019 and 2018, and 2017, this category included a combination of long-term U.S. Treasury interest rate future contracts, currency forwards, currency option interest rate swaps, and put and call options on both interest rate swaps and credit default swap index products.
(e)(d) In accordance with ASC Topic 820, these investments are measured at fair value using NAV per share as a practical expedient and, therefore, have not been classified in the fair value hierarchy. The fair value amounts presented in this table are intended to permit reconciliations of the fair value hierarchy to the statements of net assets available for plan benefits.benefits.
(f)(e) As of September 30, 2018 and 2017,At December 31, 2019, investments in commingled funds and a pooled separate account consisted of approximately 90% common stock U.S companies; 8% income producing properties located in the United States; and 2% short-term money market investments. At December 31, 2018 investments in commingled funds and a pooled separate account consisted of approximately 89% common stock U.S companies; 9% income producing properties located in the United States; and 1% short-term money market investments.
(g)(f)At September 30,December 31, 2019 and 2018, and 2017, investments in a private equity/limited partnership consisted of common stock of international companies.
(h)(g) At September 30, 2018 and 2017, this netNet payable primarily represents pending trades for investments purchased net of pending trades for investments sold and interest receivable.
(i)(h) This table does not include $20.2 million rabbi trust investments located in "Current Assets-Other", and $44.8 millionrabbi trust investments located in "Deferred Charges and Other Assets-Other" on our consolidated balance sheets. Refer to Note 14—15 — Fair Value Measurements for fair value of rabbi trust investments.
WGL Holdings, Inc
Washington Gas Light Company
Part II
Item 8. Financial Statements and Supplementary Data (continued)
Notes to Consolidated Financial Statements
| | Healthcare and Life Insurance Plan Assets | | | | | % of | | | % of |
| ($ In millions) | Level 1 | Level 2 | Level 3 | Total | | Total | |
| At September 30, 2018 | | | | |
| (In millions) | | Level 1 | Level 2 | Total | | Total |
| At December 31, 2019 | | | | |
| Cash and Cash Equivalents | $ | 2.9 |
| $ | — |
| $ | — |
| $ | 2.9 |
| | 0.5 | % | $ | 3.4 |
| $ | — |
| $ | 3.4 |
| | 0.5 | % |
| Fixed Income Securities | | | | | | |
| U.S Agency Obligations | — |
| 1.9 |
| — |
| 1.9 |
| | 0.3 |
| — |
| 2.2 |
| 2.2 |
| | 0.3 |
|
| U.S. Treasuries | — |
| 50.1 |
| — |
| 50.1 |
| | 8.8 |
| — |
| 55.5 |
| 55.5 |
| | 8.7 |
|
| U.S. Corporate Debt | — |
| 55.0 |
| — |
| 55.0 |
| | 9.8 |
| — |
| 56.3 |
| 56.3 |
| | 8.8 |
|
| Municipalities | — |
| 4.7 |
| — |
| 4.7 |
| | 0.8 |
| — |
| 5.9 |
| 5.9 |
| | 0.9 |
|
| Non-U.S. Corporate Debt | — |
| 9.1 |
| — |
| 9.1 |
| | 1.6 |
| — |
| 11.1 |
| 11.1 |
| | 1.7 |
|
Other(a) | — |
| 3.4 |
| — |
| 3.4 |
| | 0.6 |
| — |
| 2.9 |
| 2.9 |
| | 0.6 |
|
Total investments in the fair value hierarchy
| $ | 2.9 |
| $ | 124.2 |
| $ | — |
| $ | 127.1 |
| | 22.3 | % | $ | 3.4 |
| $ | 133.9 |
| $ | 137.3 |
| | 21.5 | % |
Investments measured at net asset value using the NAV practical expedient(b)
| | | | | | |
Commingled Funds(c) | | 441.6 |
| | 77.6 | % | | 499.6 |
| | 78.3 | % |
| Total fair value of plan investments | | 568.7 |
| | 99.9 | % | | 636.9 |
| | 99.8 | % |
Net receivable(d) | | 0.6 |
| | 0.1 |
| | 1.1 |
| | 0.2 |
|
| Total plan assets at fair value | | $ | 569.3 |
| | 100.0 | % | | $ | 638.0 |
| | 100.0 | % |
| | | | | |
| At September 30, 2017 | | | | |
| Cash and Cash Equivalents | $ | 2.6 |
| $ | — |
| $ | — |
| $ | 2.6 |
| | 0.5 | % | |
| Fixed Income Securities | | | | |
| U.S Agency Obligations | — |
| 1.7 |
| — |
| 1.7 |
| | 0.3 |
| |
| U.S. Treasuries | — |
| 36.0 |
| — |
| 36.0 |
| | 6.7 |
| |
| U.S. Corporate Debt | — |
| 41.9 |
| — |
| 41.9 |
| | 7.8 |
| |
| Municipalities | — |
| 3.6 |
| — |
| 3.6 |
| | 0.7 |
| |
| Non-U.S. Corporate Debt | — |
| 7.2 |
| — |
| 7.2 |
| | 1.3 |
| |
Other(a) | — |
| 2.8 |
| — |
| 2.8 |
| | 0.5 |
| |
Total investments in the fair value hierarchy
| $ | 2.6 |
| $ | 93.2 |
| $ | — |
| $ | 95.8 |
| | 17.8 | % | |
Investments measured at net asset value using the NAV practical expedient(b)
| | | | |
Commingled Funds(c)
| | 444.0 |
| | 82.1 | % | |
Total fair value of plan investments
| | 539.8 |
| | 99.9 | % | |
Net receivable(d)
| | 0.7 |
| | 0.1 |
| |
| Total plan assets at fair value | | $ | 540.5 |
| | 100.0 | % | |
|
| | | | | | | | | | | | |
| Healthcare and Life Insurance Plan Assets |
| | | | | | % of |
| (In millions) | Level 1 | Level 2 | Total | | Total |
| At December 31, 2018 | | | | | |
| Cash and Cash Equivalents | $ | 3.2 |
| $ | — |
| $ | 3.2 |
| | 0.6 | % |
| Fixed Income Securities | | | | | |
| U.S Agency Obligations | — |
| 1.9 |
| 1.9 |
| | 0.4 |
|
| U.S. Treasuries | — |
| 51.2 |
| 51.2 |
| | 9.7 |
|
| U.S. Corporate Debt | — |
| 51.6 |
| 51.6 |
| | 9.8 |
|
| Municipalities | — |
| 4.5 |
| 4.5 |
| | 0.8 |
|
| Non-U.S. Corporate Debt | — |
| 8.5 |
| 8.5 |
| | 1.6 |
|
Other(a) | — |
| 3.3 |
| 3.3 |
| | 0.6 |
|
Total investments in the fair value hierarchy
| $ | 3.2 |
| $ | 121.0 |
| $ | 124.2 |
| | 23.5 | % |
Investments measured at net asset value using the NAV practical expedient(b)
| | | | | |
Commingled Funds(c) | | | 403.3 |
| | 76.3 | % |
| Total fair value of plan investments | | | 527.5 |
| | 99.8 | % |
Net receivable(d) | | | 1.3 |
| | 0.2 |
|
| Total plan assets at fair value | | | $ | 528.8 |
| | 100.0 | % |
(a)At September 30,December 31, 2019 and 2018, and 2017, this category consisted primarily of non-U.S. government bonds.
(b)In accordance with ASC Topic 820, these investments are measured at fair value using Net Asset Value (NAV) per share as a practical expedient and, therefore, have not been classified in the fair value hierarchy. The fair value amounts presented in this table are intended to permit reconciliations of the fair value hierarchy to the statements of net assets available for plan benefits.
(c)At September 30,December 31, 2019, investments held by commingled funds in which the plan invests consisted of 58% of common stock of large-cap U.S. companies, 18% of US Govt fixed income securities and 24% corporate bonds. At December 31, 2018, investments held by commingled funds in which the plan invests consisted primarily of 58%54% of common stock of large-cap U.S. companies, 17%20% of U.S. Government fixed income securities and 25% of corporate bonds. At September 30, 2017, investments held by commingled funds in which the plan invests consisted primarily of 67% of common stock of large-cap U.S. companies,13% of U.S. Government fixed income securities and 20%26% of corporate bonds.
(d) At September 30, 2018 and 2017, this netNet receivable primarily represents pending trades for investments sold and interest receivable net of pending trades for investments purchased.
Valuation Methods
WGL Holdings, Inc
Washington Gas Light Company
Part II
Item 8. Financial Statements and Supplementary Data (continued)
Notes to Consolidated Financial Statements
Equity securities are traded on a securities exchange and are valued at the closing quoted market price as of the balance sheet date.
Mutual funds, commingled funds, pooled separate accounts and private equity/limited partnerships are valued at the quoted net asset value (NAV) per share, which is computed as of the close of business on the balance sheet date. Mutual funds with a publicly quoted NAV per share are classified as Level 1.
Commingled funds and pooled separate accounts are valued at the quoted NAV per unit, computed as of the close of business on the balance sheet date and are not classified in the fair value hierarchy.
The Private Equity/Limited Partnership funds is valued at the quoted NAV, which is computed monthly and allocated based on ownership interest in partners’ capital andremaining asset types are not classified in the fair value hierarchy.
Fixed income securities are valued using pricing models that consider various observable inputs such as benchmark yields, reported trades, broker quotes and issuer spreads to determine fair value.
The Plans may engage in repurchase transactions. Generally, in accordance with the terms of a repurchase agreement, the Plans take possession of Treasury Bills in exchange for cash and the counterparty is obligated to repurchase, and the Plan to resell, the same securities at an agreed-upon price and time. The repurchase agreements have a one-day maturity and a fair value equal to the Plan’s cash outlay at the time the agreement is executed.
Benefit Contribution
For the qualified pension plan, Washington Gas’ funding policy is to contribute an amount sufficient to satisfy the minimum annual funding requirements under the Pension Protection Act. Any contributions above the minimum annual funding requirements would be limited to amounts that are deductible under appropriate tax law. For the healthcare and life insurance benefit plans, Washington Gas’ funding policy is to contribute amounts that are collected from ratepayers.
During fiscalthe calendar year 2018,ended December 31, 2019, Washington Gas did not contribute to its qualified pension but did contribute $1.8$21.5 million to its DB SERP plan. During fiscalcalendar year 2019,2020, Washington Gas does not expect to make a contribution to its qualified pension plan and expects to contribute $20.2$19.6 million to its DB SERP, which is expected to be funded by the rabbi trust. During fiscalcalendar year 2018,2019, Washington Gas contributed $5.0 million todid not make contributions for its health and life insurance benefit plans. Washington Gas expectsdoes not expect to make a contribution of $1.3 million to its health and life insurance benefit plans during fiscalcalendar year 2019.2020.
Expected Benefit Payments
Expected benefit payments, including benefits attributable to estimated future employee service, which are expected to be paid over the next ten calendar years are as follows:
| | Expected Benefit Payments | | (In millions) | Pension Benefits | | Health and Life Benefits | Pension Benefits | | Health and Life Benefits |
| 2019 | $ | 68.2 |
| | $ | 16.6 |
| |
| 2020 | 53.1 |
| | 15.9 |
| $ | 68.6 |
| | $ | 16.1 |
|
| 2021 | 55.1 |
| | 15.9 |
| 52.7 |
| | 15.1 |
|
| 2022 | 56.2 |
| | 16.0 |
| 58.1 |
| | 14.9 |
|
| 2023 | 58.4 |
| | 16.1 |
| 55.2 |
| | 14.7 |
|
| 2024—2028 | 293.8 |
| | 81.5 |
| |
| 2024 | | 56.1 |
| | 14.4 |
|
| 2025—2029 | | 290.0 |
| | 72.9 |
|
REGULATORY MATTERSRegulatory Matters
A significant portion of the estimated pension and post-retirement medical and life insurance benefits apply to our regulated activities. Each regulatory commission having jurisdiction over Washington Gas requires it to fund amounts reflected in rates for post-retirement medical and life insurance benefits into irrevocable trusts.
District of Columbia Jurisdiction
The PSC of DC has approved a level of rates sufficient to recover annual costs associated with the qualified pension and other post-retirement benefits. Expenses of the SERP allocable to the District of Columbia are not recovered through rates. On
WGL Holdings, Inc
Washington Gas Light Company
Part II
Item 8. Financial Statements and Supplementary Data (continued)
Notes to Consolidated Financial Statements
May 15, 2013, the PSC of DC issued an order providing for recovery of unrecovered costs for pension and other post-retirement benefits as of the effective date of new rates. On March 3, 2017, the Commission issued an order that continued the amortization for prior unrecovered pension and other post-retirement benefits through 2019.
Maryland Jurisdiction
In Washington Gas’ most recent rate case that was finalized in December 2018, the PSC of MD denied recovery through rates of the expenses of the SERP, resulting in a reclassification of $2.9 million from "Regulatory assets" to "Accumulated other comprehensive loss" on the balance sheet. Prior to December 2018, the PSC of MD approved 50% of the expensesrecovery through rates of the SERP for recovery through rates.expenses. The PSC of MD has approved a level of rates sufficient to recover pension and other post-retirement benefit costs as determined under GAAP.
Virginia Jurisdiction
Washington Gas Light Company
Part II
Item 8. Financial Statements and Supplementary Data (continued)
Notes to Financial Statements
On September 28, 1995, the SCC of VA issued a generic order that allowed Washington Gas to recover most costs determined under GAAP for post-retirement medical and life insurance benefits in rates over twenty years. The SCC of VA, however, set a forty-year recovery period of the transition obligation. As prescribed by GAAP, Washington Gas amortizes these costs over a twenty-year period. With the exception of the transition obligation, the SCC of VA has approved a level of rates sufficient to recover annual costs for all pension and other post-retirement medical and life insurance benefit costs determined under GAAP.
WGL Holdings, Inc
Washington Gas Light Company
Part II
Item 8. Financial Statements and Supplementary Data (continued)
Notes to Consolidated Financial Statements
NOTE 10.11. STOCK-BASED COMPENSATION Stock-Based Compensation for Key Employees
We have stock-based awards outstanding in the form of performance sharesunits, restricted units and performance units.stock options. In March 2016, WGLDecember 2019, Washington Gas adopted a new Long-Term Incentive Plan which will be used for future grants. In addition, certain executives of Washington Gas may be awarded stock options under the AltaGas Share Option Plan.
Prior awards were granted under the WGL shareholder-approved Omnibus Plan, (2016 Plan) to replace, on a prospective basis, the Omnibus Incentive Plan (2007 Plan). Stock options, stock appreciation rights, restricted stock, deferred stock as a bonus or awardswhich included grants made in lieushares of obligations, dividend equivalents, other stock-based awards and cash awards may be granted under the 2016 Plan.WGL stock. Effective upon the Merger with AltaGas, WGL no longer has common stock outstanding and no new awards will be issued in WGL stock.
Description of Current Awards
Prior to the Merger with AltaGas, WGL hadWashington Gas has stock-based awards outstanding in the form of ALA performance sharesunits, performance units and restricted units. ALA performance units and performance units. All stock-based awards outstanding hadunits have a three-year vesting period, and were grantedare settled in fiscal years 2016, 2017cash and 2018. Performance shares are accounted for as equity awards, and performance units are accounted for as liability awards as theyawards. Restricted units have annual vesting over the three-year period, are settled in cash. Both awards were subject to certain market or performance conditions. Bothcash and are accounted for as deferred compensation under ASC 710.
ALA Performance Units
ALA performance units and performance shares provided for accelerated vesting upon a change in control of WGL under certain circumstances.
Performance Shares
Performance shares earned pursuant to the terms of the grant have typically been settled in an equivalent number of shares of WGL common stock and dividend equivalentsare paid in cash. We generally would issue new shares of commoncash and are valued at an average ALA stock to provide for redemption ofprice per performance shares; however, we may, from time to time, repurchase shares of our common stock on the open market in order to meet these requirements.unit at vesting.
ForThe ALA performance shares granted in fiscal years 2017 and 2016, half of the performance shares vestedunits vest from zero to 200 percent of the target award based on WGL'sAltaGas' total shareholder return relative to a selected peer group of companies, which is a market condition under ASC Topic 718 (TSR Award). The remaining half of the performance shares granted in fiscal years 2017 and 2016 vested if our non-GAAP operating earningsAltaGas' three-year adjusted funds from operation compounded growth per share on a diluted basis exceed dividends paid per share of common stock during the performance period, which is a performance condition under ASC Topic 718 (Dividend Coverage Award).
For half of the performance shares granted in fiscal year 2018, the actual award vested from zero to 200 percent of the target award based on our return on equity ratio achieved during the performance period, which is a performance condition under ASC Topic 718 (ROE Award). The remaining half of the performance shares granted in fiscal year 2018 were Dividend Coverage Awards.
We recognize compensation expense related to performance shares over the three year requisite service period. Compensation expense for performance shares that vest based on the satisfaction of a performance condition is recognized for awards that ultimately vest and is adjusted to the actual outcome of the performance condition. Compensation expense for performance shares that vest based on the satisfaction of a market condition is recognized at the grant date fair value if the requisite service is rendered, but is not adjusted to reflect the ultimate achievement of the market condition. The fair value of each performance unit that vests based on the satisfaction of a market condition is estimated using a Monte Carlo simulation model at the grant date.718.
The total intrinsic value of performance shares vested during the year ended September 30, 2018 and 2017 was $17.8 million and $10.2 million, respectively. The fair value of each performance unit that vests based on the satisfaction of a market condition is estimated using a Monte Carlo simulation model at the grant date.
Performance Units
Performance units earned pursuant to terms of the grant are paid in cash and are valued at $1.00 per performance unit.
For performance units granted in fiscal years 2017 and 2016, half of the performance units were TSR Awards and half were ROE Awards. All the performance units granted in fiscal year 2018 were ROE Awards.
OurALA performance units are accounted for as liability awards accounted for under ASC 710718 as they only settle in cash; therefore, we measure and record compensation expense for these awards based on their fair value at the end of each period until their vesting date. The percentage of the fair value that is accrued as compensation expense at the end of each period equals the percentage of the requisite service that has been rendered at that date. Consequently, fluctuations in earnings may result, that do not occur underresult.
Performance Units
Performance units earned pursuant to terms of the accounting requirements for ourgrant are paid in cash and are valued at $1.00 per performance shares.unit.
The fair valueA portion of eachthe performance unit that vestsunits vest from zero to 200 percent of the target award based on our return on equity ratio achieved during the satisfactionperformance period, which is a performance condition under ASC Topic 718 (ROE Award). The resulting payout is also adjusted from 80 to 120 percent by a modifier based on AltaGas' total shareholder return relative to a selected peer group of companies (TSR Modifier), which is a market condition is estimated using a Monte Carlo simulation model. The fair valueunder ASC Topic 718.
A portion of eachthe performance unit that vestsunits vest from zero to 200 percent of the target award based on our three-year adjusted funds from operation compounded growth during the satisfaction ofperformance period, which is a performance condition under ASC Topic 718 (AFFO Award). The resulting payout is $1.00. The amount of totalalso adjusted by a TSR Modifier.
Our performance units are accounted for as liability awards under ASC 718 as they only settle in cash; therefore, we measure and record compensation cost to be recognizedexpense for these performance units is a function of thisawards based on their fair value andat the numberend of awards vested as a resulteach period until their vesting date. The percentage of the performance condition beingfair value that is accrued as compensation expense at the end of each period equals the percentage of the requisite service that has been rendered at that date. Consequently, fluctuations in earnings may result.
Restricted Units
WGL Holdings, IncRestricted units earned pursuant to terms of the grant are paid in cash at the end of each year and are valued at $1.00 per restricted unit.
Washington Gas Light Company
Part II
Item 8. Financial Statements and Supplementary Data (continued)
Notes to Consolidated Financial Statements
metOne third of the restricted units vest at the end of each year in the three-year period if AltaGas pays a dividend during that period.
Our restricted units are accounted for under ASC 710 as they only settle in cash and do not have a market condition; therefore, we measure and record compensation expense for these awards based on the probable payment at the end of each period. The percentage of the probable payment that is accrued as compensation expense at the end of each period equals the percentage of the requisite service provided.that has been rendered at that date.
The following tables summarize information regarding performance unit and restricted unit activity during the calendar year ended December 31, 2019.
|
| | | | | | |
| Current Award Activity |
| Calendar Year Ended December 31, 2019 |
| Number of ALA Performance Units | Number of Performance Units | Number of Restricted Units |
Non-vested and outstanding, beginning of the year | — |
| 5,934,828 |
| 2,253,585 |
|
Granted | 27,707 |
| — |
| — |
|
Settled | — |
| — |
| — |
|
| Vested | — |
| — |
| (620,382 | ) |
Canceled/forfeited | — |
| (2,376,117 | ) | (692,789 | ) |
Non-vested and outstanding, end of year | 27,707 |
| 3,558,711 |
| 940,414 |
|
For the calendar year ended December 31, 2019, we recognized $1.6 million compensation expense related to the performance units and restricted units. As of September 30, 2017,December 31, 2019, total unrecognized compensation expense related to the performance unit and restricted unit awards is $1.9 million, which will be recognized over a period of 1.75 years. As of December 31, 2019, we recorded a current and deferred liability of $17.6$1.8 million related to our performance units. Thethe grants in “Deferred Credits-other” and a current liability was recordedof $0.2 million in "Accounts payable and other accrued liabilities-other". As of December 31, 2019, total unrecognized compensation expense related to the ALA performance unit award is $0.5 million.
For the calendar year ended December 31, 2019, we paid $0.6 million in cash to settle restricted unit awards.
Stock Options
At December 16, 2019, 143,561 stock options were granted. One third of the options vest at the end of each year in the three-year vesting period, and expire after six years. The option strike price was $18.78 Canadian Dollars.
Description of Prior Awards
Prior to the Merger with AltaGas, Washington Gas had stock-based awards outstanding in the form of performance shares and performance units. All stock-based awards outstanding had a three-year vesting period. Performance shares were accounted for as equity awards, and performance units were accounted for as liability awards as they were settled in cash. Both awards were subject to certain market or performance conditions and provided for accelerated vesting upon a change in control of WGL under certain circumstances. Upon the Merger with AltaGas, the awards granted in fiscal years 2017 and 2016 were accelerated and became fully vested. The awards granted in fiscal year 2018 were converted to a fixed cash amount and still require vesting over the three-year period. See the "Modification Event" section below for a more detailed discussion of $8.9 million atthe impact.
For the fiscal year ended September 30, 2017. The deferred liability2018, we recognized $15.8 million compensation expense, of which $7.7 million related to the modification event described below. A $4.9 million income tax benefit was recorded in “Deferred Credits-other” inrelated to the amount of $8.7 million, atcompensation expense.
For the fiscal year ended September 30, 2017.2017, we recognized stock-based compensation expense of $12.2 million and related income tax benefits of $6.1 million.
Performance Shares
For performance shares granted in fiscal years 2017 and 2016, half of the performance shares vested from zero to 200 percent of the target award based on WGL's total shareholder return relative to a selected peer group of companies (TSR Award). The
Washington Gas Light Company
Part II
Item 8. Financial Statements and Supplementary Data (continued)
Notes to Financial Statements
remaining half of the performance shares granted vested if our non-GAAP operating earnings per share on a diluted basis exceed dividends paid per share of common stock during the performance period (Dividend Coverage Award).
For performance shares granted in fiscal year 2018, half of the performance shares were ROE Awards. The remaining half of the performance shares granted in fiscal year 2018 were Dividend Coverage Awards.
The total intrinsic value of performance shares vested during the year ended September 30, 2018 and 2017 was $16.7 million and $9.9 million, respectively.
Performance Units
Performance units earned pursuant to terms of the grant were paid in cash and valued at $1.00 per performance unit.
For performance units granted in fiscal years 2017 and 2016, half of the performance units were TSR Awards and half were ROE Awards. All the performance units granted in fiscal year 2018 were ROE Awards.
During the fiscal year ended September 30, 2017, we paid $6.7 million in cash to settle performance unit awards. During the fiscal year ended September 30, 2018, we paid an additional $8.9$8.5 million in cash to settle performance unit awards that vested before the Merger.
Modification Event
Upon the Merger with AltaGas, the vesting for the stock-based awards granted in fiscal years 2017 and 2016 was accelerated and the awards were paid in cash, with no additional service required. All performance shares were converted into cash at a value of $88.25 per share. All performance units remained at a value of $1.00 per unit. The TSR Awards were paid at the greater of actual total shareholder return performance or the target award value. The ROE Awards and Dividend Coverage Awards were paid at the target award value. Any dividend equivalents for the performance share awards were also paid in cash. During the fiscal year ended September 30, 2018, we paid $30.0 million in cash to settle the fiscal year 2017 and 2016 awards that were accelerated.
The stock-based awards granted in fiscal year 2018 were converted to a fixed cash amount at the target award level, and still require vesting in accordance with the original three-year period.period, except for certain employees who may have a change in control event and accelerate vesting. All performance shares were converted into cash at a value of $88.25 per share. All performance units remained at a value of $1.00 per unit. These awards will beare accounted for under ASC Topic 710 for the remaining service period.
DuringFor the fiscalcalendar year ended September 30, 2018, we paid $32.4 million in cash to settleDecember 31, 2019 and the fiscal year 2017 and 2016 awards that were accelerated. For the fiscal yearthree months ended September 30,December 31, 2018, we recognized $20.3 million compensation expense of which $7.9$2.0 million related to a one-time chargeand $1.0 million, respectively, for the acceleration of the fiscal year 2017 and 2016 grants and conversion of the fiscal year 2018 grant to a fixed cash amount.grant. As of September 30,December 31, 2019 and 2018, the total unrecognized compensation expense related to stock-basedthese awards granted in fiscal year 2018 was $5.5$0.7 million and $2.7 million, respectively, which will be ratable overrecognized ratably through September 30, 2020, adjusted for forfeitures or accelerated vesting as a periodresult of 2 years. As of September 30,a change in control event. At December 31, 2018, we recorded a deferred liability of $3.4$3.7 million related to the grant in “Deferred Credits-other”.
During the fiscal year ended September 30, 2017, we paid $6.9 and a current liability of $2.9 million in cash to settle performance unit awards. For the fiscal years ended September 30, 2017"Accounts payable and 2016, we recognized stock-based compensation expense of $16.4 million and $11.5 million, respectively, andother accrued liabilities-other". At December 31, 2019, there was no deferred liability related income tax benefits of $6.5 million and $4.6 million, respectively.
The following table summarizes information regarding performance share activity during the fiscal year ended September 30, 2018.
|
| | | | | | |
| Performance Share Activity |
| Year Ended September 30, 2018 |
| Number of Shares | | Weighted Average Grant- Date Fair Value |
Non-vested and outstanding, beginning of year | 274,882 |
| | $ | 57.05 |
|
Granted | 64,796 |
| | 84.20 |
|
Settled | (105,748 | ) | | 44.44 |
|
| Accelerated due to merger | (159,778 | ) | | 64.94 |
|
Cancelled/forfeited | (10,074 | ) | | 66.24 |
|
Converted to a Cash Award (a)
| (64,078 | ) | | $ | 88.25 |
|
Non-vested and outstanding, end of year(a) | — |
| | $ | — |
|
(a) Due to the modification event, these shares were converted togrant, and a cash award at targetcurrent liability of $4.3 million "Accounts payable and are no longer performance-based.
The following table summarizes information regarding performance unit activity during the fiscal year ended September 30, 2018.
WGL Holdings, Inc
Washington Gas Light Company
Part II
Item 8. Financial Statements and Supplementary Data (continued)
Notes to Consolidated Financial Statements
other accrued liabilities-other".
|
| | |
Performance Unit Activity |
| Year Ended
September 30, 2018
|
| Number of Units |
Non-vested and outstanding, beginning of year
| 14,631,998 |
|
Granted
| 5,456,077 |
|
Settled
| (4,454,200 | ) |
Accelerated due to merger | (9,615,564 | ) |
Cancelled/forfeited
| (622,690 | ) |
Converted to a Cash Award (a)
| (5,395,621 | ) |
Non-vested and outstanding, end of year(a)
| — |
|
(a) Due to the modification event, these units are no longer performance-based and were converted to a fixed cash amount at a value of $1.00 per unit.The amount of total compensation cost to be recognized for these performance units is a function of this estimated fair value and the number of awards granted for which the requisite service is provided.
Stock Grants to Directors
Prior to the Merger with AltaGas, non-employee directors receivereceived a portion of their annual retainer fee in the form of WGL common stock through the Directors’ Stock Compensation Plan. Up to 270,000 shares of common stock may be awardedwere available under the plan. Shares granted to directors were approximately 9,000 10,000 and 13,00010,000 for the fiscal years ended September 30, 2018 2017 and 2016,2017, respectively. For those years, the weighted average fair value of the stock on the grant dates was $85.84 $76.28, and $62.99,$76.28, respectively. Shares awarded to the participants; (i) vest immediately and cannot be forfeited; (ii) may be sold or transferred (subject to WGL's stock ownership guidelines) and (iii) have voting and dividend rights. For each of the fiscal years ended September 30, 2018 2017 and 2016,2017, WGL recognized stock-based compensation expense related to stock grants of $0.8 million. No new common stock awards will be granted to directors.
NOTE 11.12. ENVIRONMENTAL MATTERS Washington Gas Light Company
Part II
Item 8. Financial Statements and Supplementary Data (continued)
Notes to Financial Statements
We are subject to federal, state and local laws and regulations related to environmental matters. These laws and regulations may require expenditures over a long time frame to control environmental effects. Almost all of the environmental liabilities we have recorded are for costs expected to be incurred to remediate sites where we or a predecessor affiliate operated MGPs.manufactured gas plants (MGPs). Estimates of liabilities for environmental response costs are difficult to determine with precision because of the various factors that can affect their ultimate level. These factors include, but are not limited to, the following:
the complexity of the site;
changes in environmental laws and regulations at the federal, state and local levels;
the number of regulatory agencies or other parties involved;
new technology that renders previous technology obsolete or experience with existing technology that proves ineffective;
the level of remediation required; and
variations between the estimated and actual period of time that must be dedicated to respond to an environmentally-contaminated site.
Washington Gas has identified up to ten sites where it or its predecessors may have operated MGPs. Washington Gas last used any such plant in 1984. In connection with these operations, we are aware that coal tar and certain other by-products of the gas manufacturing process are present at or near some former sites and may be present at others.
At September 30,December 31, 2019 and 2018, and 2017, Washington Gas reported a liability of $10.2$10.7 million and $7.7$11.3 million, respectively, on an undiscounted basis related to future environmental response costs. These estimates principally include the minimum liabilities associated with a range of environmental response costs expected to be incurred. At September 30,December 31, 2019 and 2018, and 2017, Washington Gas estimated the maximum liability associated with all of its sites to be approximately $27.3$30.7 million and $24.0$29.4 million, respectively. The estimates were determined by Washington Gas’ environmental experts, based on experience in remediating MGP sites and advice from legal counsel and environmental consultants. The variation between the recorded and estimated
WGL Holdings, Inc
Washington Gas Light Company
Part II
Item 8. Financial Statements and Supplementary Data (continued)
Notes to Consolidated Financial Statements
maximum liability primarily results from differences in the number of years that will be required to perform environmental response processes and the extent of remediation that may be required.
Washington Gas is currently remediating its East Station property, which islocated adjacent to the Anacostia River in Washington D.C., including ground water pump and treat, tar recovery, soil encapsulation and other treatment. Washington Gas is conducting a remedial investigation and feasibility study underUnder a 2012 consent decree with the District of Columbia and the federal government, Washington Gas is also conducting a remedial investigation and additionalfeasibility study on an adjacent property owned by the District of Columbia. Additional remediation may be required. required at this property.
In addition, manufactured gas waste was discovered at ananother adjoining property a parcelknown as the “Boat Club Property,” located to the east of land adjacent to East Station.the property owned by the District of Columbia, Washington Gas has agreed to work with the owners of the adjoining property to perform a site investigation ground water sampling, and report on the contamination at the sitefindings pursuant to oversight by the District of Columbia Department of Energy and Environment (DOEE). This property was subject to a July 12, 2019, Administrative Order from the DOEE. This Administrative Order has been withdrawn and a consent order is being negotiated.
Washington Gas received a letter in February 2016 from the District of ColumbiaDOEE and National Park Service regarding the Anacostia River Sediment Project, indicating that the District of Columbia is conducting a separate remedial investigation and feasibility study of the river to determine if and what cleanup measures may be required and to prepare a natural resource damage assessment. The sediment project draft remedial investigation reportOn December 27, 2019, DOEE issued on March 30, 2018an Anacostia River Sediment Project Proposed Plan, a River-wide Feasibility Study, and supporting documents for public comment. Although the Proposed Plan identifies East Station as one of seventeenfifteen potential environmental cleanup sites. Duringsites, DOEE is proposing to continue the fiscal year endedremediation of East Station under Washington Gas’ existing Consent Decree rather than as part of the Anacostia River Sediment Project. DOEE is proposing to issue an Interim Record of Decision for remediation of “Early Action Areas” (that do not include East Station) in the Anacostia River by September 30, 2017, Washington Gas received a request for information related to three Washington Gas properties.2020. We are not able to estimate the total amount of potential damagescosts or timing associated with the District of Columbia'sColumbia’s environmental investigation on the Anacostia River at this time. While an allocation method has not been established, Washington Gas has accrued an amount for estimated study costs based on a potential range of estimates.
Regulatory orders issued by the PSC of MD allow Washington Gas to recover the costs associated with the sites applicable to Maryland over the period ending in 2025. RateRegulatory orders issued by the PSC of DC allow Washington Gas a three-year recovery of prudently incurred environmental response costs and allow Washington Gas to defer additional costs incurred between rate cases. Regulatory orders from the SCC of VA have generally allowed the recovery of prudent environmental remediation costs to the extent they were included in the underlying financial data supporting an application for rate change.
At September 30,December 31, 2019 and 2018, and 2017, Washington Gas reported a regulatory asset of $5.0$7.0 million and $2.5$5.8 million, respectively, for the portion of environmental response costs that are expected to be recoverable in future rates.
Washington Gas Light Company
Part II
Item 8. Financial Statements and Supplementary Data (continued)
Notes to Financial Statements
NOTE 12.13. COMMITMENTS AND CONTINGENCIES
OPERATING LEASES
Minimum future rental payments under operating leases over the next five years and thereafter are as follows:
|
| | | |
Minimum Payments Under Operating Leases(a) |
| (In millions) | |
| 2019 | $ | 5.6 |
|
| 2020 | 9.2 |
|
| 2021 | 10.1 |
|
| 2022 | 9.6 |
|
| 2023 | 9.7 |
|
| Thereafter | 86.6 |
|
| Total | $ | 130.8 |
|
(a)During the fiscal year 2018, we moved our headquarter to the office located at 1000 Maine Ave., S.W. Washington, D.C. The operating lease of the previous office located at 101 Constitution Ave., N.W. Washington, D.C. ended in August 2018.
Rent expense totaled $9.0 million, $8.7 million and $8.4 million in fiscal years ended September 30, 2018, 2017 and 2016, respectively.
REGULATED UTILITY OPERATIONSCommitments
Natural Gas Contracts—Minimum Commitments
WGL Holdings, Inc
Washington Gas Light Company
Part II
Item 8. Financial Statements and Supplementary Data (continued)
Notes to Consolidated Financial Statements
At September 30, 2018,December 31, 2019, Washington Gas had service agreements with four pipeline companies that provide direct service for firm transportation and/or storage services. These agreements, which have expiration dates ranging from fiscalcalendar years 2020 to 2045,2044, require Washington Gas to pay fixed charges each month. Additionally, Washington Gas had agreements for other pipeline and peaking services with expiration dates ranging from 20202021 to 2027.2028. These agreements were entered into based on current estimates of growth of the Washington Gas system, together with other factors, such as current expectations of the timing and extent of unbundling initiatives in the Washington Gas service territory. In addition, Washington Gas has agreements for minimum contractual payments to purchase natural gas at prices based on market conditions with expiration dates ranging from 2020 to 2033.
The following table summarizes the minimum contractual payments that Washington Gas will make under its pipeline transportation, storage and peaking contracts, as well as minimum contractual payments to purchase natural gas at prices based on market conditions during the next five fiscalcalendar years and thereafter.
| | Washington Gas Contract Minimums | | (In millions) | Pipeline Contracts(a) | | Gas Purchase Commitments(b) | Pipeline Contracts | | Gas Purchase
Commitments(a) |
| 2019 | $ | 482.4 |
| | $ | 439.6 |
| |
| 2020 | 372.6 |
| | 387.0 |
| $ | 272.7 |
| | $ | 314.4 |
|
| 2021 | 364.7 |
| | 362.2 |
| 259.5 |
| | 356.6 |
|
| 2022 | 361.0 |
| | 348.2 |
| 254.4 |
| | 340.6 |
|
| 2023 | 360.5 |
| | 327.7 |
| 245.2 |
| | 317.9 |
|
| 2024 | | 212.8 |
| | 321.0 |
|
| Thereafter | 1,192.9 |
| | 2,672.5 |
| 791.4 |
| | 1,969.8 |
|
| Total | $ | 3,134.1 |
| | $ | 4,537.2 |
| $ | 2,036.0 |
| | $ | 3,620.3 |
|
(a)Represents minimum payments for natural gas transportation, storage and peaking contracts that have expiration dates through fiscal year 2045.
(b) Includes known and reasonably likely commitments to purchase natural gas. Cost estimates are based on forward market prices at September 30, 2018.December 31, 2019.
When a customer selects a third-party marketer to provide supply, Washington Gas generally assigns pipeline and storage capacity to unregulated third-party marketers to deliver gas to Washington Gas’ city gate. In order to provide the gas commodity to customers who do not select an unregulated third-party marketer, Washington Gas has a commodity acquisition plan to acquire the natural gas supply to serve the customers.
To the extent these commitments are to serve its customers, Washington Gas has rate provisions in each of its jurisdictions that would allow it to continue to recover these commitments in rates. Washington Gas also actively manages its supply portfolio to ensure its sales and supply obligations remain balanced. This reduces the likelihood that the contracted supply commitments would exceed supply obligations. However, to the extent Washington Gas were to determine that changes in regulation would cause it to discontinue recovery of these costs in rates, Washington Gas would be required to charge these costs to expense without any corresponding revenue recovery. If this occurred, depending upon the timing of the occurrence, the related impact on our financial position, results of operations and cash flows would likely be significant.
Merger Commitments
In connection with the Merger, Washington Gas and AltaGas have made commitments related to the terms of the PSC of DC settlement agreement and the conditions of approval from the PSC of MD and the SCC of VA. Among other things, these commitments included rate credits distributable to both residential and non-residential customers, gas expansion and other programs, various public interest commitments, and safety programs. As of December 31, 2019, the cumulative amount of merger commitments expensed was $136.6 million, of which, $17.0 million has not been paid. In addition, there are certain additional regulatory commitments that were and will be expensed as the costs are incurred, including the hiring of damage prevention trainers in each jurisdiction for a total of $2.4 million over 5 years; investing up to $70.0 million over a 10-year period to further extend natural gas service; and spending $8.0 million for leak mitigation within 3 years after the Merger close. Additionally, there are a number of operational commitments that will have an impact on the ongoing business of Washington Gas, including reductions of leak backlogs, conducting a root cause analysis related to customer service, increasing supplier
Washington Gas Light Company
Part II
Item 8. Financial Statements and Supplementary Data (continued)
Notes to Financial Statements
diversity, achieving synergy savings benefits, developing protocols for moving meters from inside to outside customers’ premises, as well as reporting and tracking related to all the commitments.
The following table presents the future payments of merger commitments by calendar years
|
| | | | | | | | | | | | | | | | | | | | | | | | | | | |
| Merger Commitments Payments |
| (In millions) | 2020 | | 2021 | | 2022 | | 2023 | | 2024 | | Thereafter | | Total |
| Merger commitments | $ | 6.3 |
| | $ | 2.9 |
| | $ | 1.5 |
| | $ | 1.5 |
| | $ | 1.5 |
| | $ | 3.3 |
| | $ | 17.0 |
|
Financial Guarantees
At December 31, 2019, there were no guarantees to external parties.
Contingencies
We account for contingent liabilities utilizing ASC Topic 450, Contingencies. By their nature, the amount of the contingency and the timing of a contingent event and any resulting accounting recognition are subject to our judgment of such events and our estimates of the amounts. Actual results related to contingencies may be difficult to predict and could differ significantly from the estimates included in reported earnings.
Silver Spring, Maryland Incident
Washington Gas has continually worked withOn April 23, 2019, the NTSB to support its investigationNational Transportation and Safety Board (NTSB) held a hearing during which it found, among other things, that the probable cause of the August 10, 2016, explosion and fire at an apartment complex on Arliss Street in Silver Spring, Maryland “was the failure of an indoor mercury service regulator with an unconnected vent line that allowed natural gas into the meter room where it accumulated and ignited from an unknown ignition source. Contributing to the accident was the location of the mercury service regulators where leak detection by odor was not readily available.” Washington Gas disagrees with the NTSB’s probable cause of which has not been determined. Additional information will be made available byfindings. Following this hearing, on June 10, 2019, the NTSB atissued an accident report.
In connection with the appropriate time. Aincident, a total of 4037 civil actions related to the incident have beenwere filed against WGL and Washington Gas in the Circuit Court for Montgomery County, Maryland. All of these suits seeksought unspecified damages for personal injury and/or property damage.
All personal injury and property damage claims asserted by residents at the Flower Branch Apartments have been settled and paid. The one action seeking class action statusCompany has been amendedreimbursed by its insurers for the amounts paid in the settlements.
Also, in connection with the incident, on September 5, 2019, the PSC of MD ordered the Company, within 30 days, to assert property damage(i) provide a detailed response to the NTSB’s probable cause findings and (ii) provide evidence regarding the status of a 2003 mercury regulator replacement program and, if the program was not completed, to show cause why the PSC of MD should not impose a civil penalty on the Company. See further discussion below in Regulatory Contingencies.
Antero Contract
In June 2019, a jury trial was held in the County Court for Denver, Colorado to consider a contractual dispute relating to gas pricing between Washington Gas and WGL Midstream (together, the Companies) and Antero Resources Corporation (Antero). Following the trial, the jury returned a verdict in favor of Antero for $95.9 million, of which $11.2 million was against Washington Gas, and $84.7 million against WGL Midstream. Following the official entry of the judgment, the Company filed an appeal on August 16, 2019.
As a result of this verdict, it was determined that a loss contingency is probable and Washington Gas has recorded an estimated liability of use claims. We maintain excess liability insurance coverage from highly-rated insurers, subject to$11.2 million in “Accounts payable and accrued liabilities” on the balance sheet at December 31, 2019, of which $2.6 million had already been recorded in a nominal self-insured retention. We believe that this coverage will be sufficient to cover any significant liability to it that may result from this incident. Management is unable to determine a range of potential losses that are reasonably possible of occurring and therefore we have notprior period. Washington Gas has also recorded a reservereceivable from our trading partner of $1.3 million in “Deferred charges and other assets-Other”, and sharing with customers as the contract relates to asset optimization of $4.7 million in “Regulatory assets - Gas costs”. In addition, Washington Gas has recorded an accrual for estimated court fees of $0.1 million, and an accrual of interest expense of $0.3 million associated with this incident.the liability.
For the calendar year ended December 31, 2019, the net pre-tax loss recorded as a result of the verdict was approximately $3.0 million in “Utility cost of gas” on Washington Gas was invited by the NTSB to be a party to the investigation and in that capacity, has continued to work closely with the NTSB to help determine the causeGas’ statements of this incident. operations.
Regulatory Contingencies
WGL Holdings, Inc
Washington Gas Light Company
Part II
Item 8. Financial Statements and Supplementary Data (continued)
Notes to Consolidated Financial Statements
Regulatory Contingencies
Certain legal and administrative proceedings incidental to our business, including regulatory contingencies, involve WGL and/or its subsidiaries.Washington Gas. In our opinion, we have recorded an adequate provision for probable losses or refunds to customers for regulatory contingencies related to these proceedings.
Application for Approval of Reduction of Distribution Rates
On January 12, 2018, Washington Gas filed applications to reduce customer rates in Maryland, Virginia, and the District of Columbia to reflect the impact of the Tax Act, including both the impact of the re-measurement of deferred tax assets and liabilities and reduction of the federal tax rate to 21%. Washington Gas began tracking the impact of the Tax Act on revenue requirements beginning January 1, 2018, recording all impacts to regulatory assets and liabilities. In Maryland and the PSCDistrict of MD approvedColumbia, rates have been adjusted for the application effective for bills rendered on or after February 1, 2018.
impact of the Tax Act. In Virginia, the SCC of VA dismissed the application was dismissed on March 15, 2018 and2018. Washington Gas will filefiled a new general rate case inon July 2018. On June 29,31, 2018 incorporating the PSCeffects of DC approved the settlement agreement, reflecting an annual reduction in Washington Gas’ distribution rates of $8.3 million, effective for service rendered on or after July 1, 2018. The settling parties were directed to file a joint proposal, by August 1, 2018, depicting the regulatory liability balance for the period January 1, 2018 through June 30, 2018, which will be refunded to customers through a one-time bill credit beginning with Washington Gas’ December 2018 billing cycle.
Washington Gas has recorded regulatory liabilities, representing the amounts owed to customers for reduced rates between January 1, 2018 and September 30, 2018 of $13.0 million and $5.1 million, for Virginia and the District of Columbia respectively. Please refer to Note 8— Income taxes for more information.Tax Act.
Virginia Jurisdiction
Virginia Rate Case.Case - 2018. On April 17, 2017,July 31, 2018, Washington Gas filed an application with the SCC of VA a unanimous settlement as to a specific annual revenue increase but not as to a specific return on equity, specific accounting adjustments, or specific ratemaking methodologies, except as otherwise set forth therein. The Stipulation set forth, for purposes of settlement, a base rate increase of $34 million (of which $14.1 million represents incremental base rate revenues over and above the inclusion of SAVE Plan costs which were previously recovered through monthly surcharges). For purposes of the settlement, the mid-point of the return on equity range of 9.0%-10.0% will be used in any application or filing, other than a change inits base rates effective December 1, 2016. On June 30, 2017, the Chief Hearing Examiner issued a report recommending thatfor natural gas service by $37.6 million, which includes $14.7 million of revenue associated with natural gas pipeline replacement initiatives previously approved by the SCC of VA approveand paid by customers through a monthly rider. Additionally, the Stipulation.requested revenue increase incorporated the effects of The Tax Act. Interim rates became effective, subject to refund, for usage in the January 2019 billing cycle. On September 8, 2017, Washington Gas received16, 2019, the HE issued a final order fromreport that made certain recommendations, to which the Company responded on October 21, 2019. Thereafter, on December 20, 2019, the SCC of VA accepting settlementissued a Final Order that accepted some of the HE’s findings and either rejected or made adjustments to others. The Final order included approval of (i) an increase in base rates of $13.2 million to reflect the transfer of $101.9 million of SAVE investment from the SAVE Rider to rate base (no additional revenue increase); and (ii) amortization of unprotected plant-related and non-plant-related excess deferred income tax over 8 years.
For the calendar year ended December 31, 2019, Washington Gas made the following pre-tax adjustments based on the HE’s recommendations and Commission's Final Order: (i) reduced “Operating revenues” by $7.9 million to accrue additional amounts of liability subject to minor modifications to Washington Gas’ System Expansion Proposals. All parties agreed to a Revised Stipulation filed on September 20, 2017, reflectingrefund; (ii) reduced “Operating revenues” by $9.0 million associated with the SCC of VA’s denial of onerevised amortization of the System Expansion ProposalsTax Act liability; and (iii) wrote off $2.0 million in “Regulatory Assets - Other” and charged to “Operation and maintenance” expense. Additionally, the Company reduced income tax expense by $8.5 million related to the amortization of excess deferred income tax, and recorded $5.5 million after-tax impairment of a tax regulatory asset related to flow through income taxes. The total impact from the adjustments for the calendar year 2019 was a $18.9 million reduction in "Income before income taxes" and a $10.9 million reduction in "Net Income" on Washington Gas’ withdrawalGas' statements of operations.
On January 9, 2020, Washington Gas filed a petition for reconsideration regarding the Commission’s decision to disallow recovery through base rates of the second one. The SCC of VA issued its final order approving the revised stipulation on September 25, 2017. Refunds$7.1 million regulatory asset related to customers, which have been accrued by Washington Gas at December 31, 2017, were completed on February 7, 2018.previously flowed through income taxes. On August 3, 2018,January 30, 2020, the Commission issued a final orderits Order on Reconsideration denying the Company’s petition, and directing Washington Gasthe Company to issue rate refunds, with interest,as well as to all customers whenbegin return of regulatory liabilities over a twelve-month period, within 90 days of the substitutiondate of final rates resultedthe Order on Reconsideration.
Maryland Jurisdiction
Maryland Show-Cause Order. Following the NTSB hearing that examined the August 10, 2016, explosion and fire at an apartment complex in an amount greater thanSilver Spring, Maryland, on September 5, 2019, the amount collected duringPSC of MD ordered the interim period. Washington Gas has bookedCompany, within 30 days, to (i) provide a receivabledetailed response to the NTSB’s probable cause findings, and (ii) provide evidence regarding the status of $0.9 million ata 2003 mercury regulator replacement program, and if the program was not completed, to show cause why the Commission should not impose a civil penalty on the Company. On September 30, 2018 related16, 2019, the PSC of MD granted the Company a 14-day extension to this matter.file its Response to the Show-Cause Order. On October 18, 2019, the Company filed its Response to the Show-Cause Order, (i) providing a detailed response to the NTSB’s probable cause findings and (ii) providing evidence regarding the status of a 2003 mercury regulator replacement program and why the Commission should not impose a civil penalty on the Company.
NON-UTILITY OPERATIONSOn November 18, 2019 the Technical Staff of the PSC of MD, OPC, Montgomery County, MD and AOBA filed written comments on the Company’s Response to the Show-Cause Order. Technical Staff commented that the PSC of MD may impose a civil penalty but did not expressly recommend same. Montgomery County, MD, OPC and AOBA requested that the PSC of MD impose a civil penalty on the Company.
WGL Energy Services enters into contracts to purchase natural gas and electricity designed to match the duration of its sales commitments, and to secure a margin on estimated sales over the terms of existing sales contracts. WGL Midstream enters into contracts to acquire, invest in, manage and optimize natural gas storage and transportation assets.
The following table summarizes the minimum commitments and contractual obligations of WGL Energy Services and WGL Midstream for the next five fiscal years and thereafter.
WGL Holdings, Inc
Washington Gas Light Company
Part II
Item 8. Financial Statements and Supplementary Data (continued)
Notes to Consolidated Financial Statements
|
| | | | | | | | | | | | | | | | | | | | | | | |
| Contract Minimums |
| WGL Energy Services | | WGL Midstream | | |
| (In millions) | Gas Purchase Commitments(a) | | Pipeline Contracts(b) | | Electric Purchase Commitments(c) | | Gas Purchase Commitments(d) | | Pipeline Contracts(b) | | Total |
| 2019 | $ | 190.4 |
| | $ | 3.2 |
| | $ | 328.8 |
| | $ | 1,203.2 |
| | $ | 216.6 |
| | $ | 1,942.2 |
|
| 2020 | 100.2 |
| | 1.7 |
| | 213.8 |
| | 1,279.9 |
| | 220.3 |
| | 1,815.9 |
|
| 2021 | 42.0 |
| | 1.1 |
| | 97.0 |
| | 1,156.9 |
| | 209.4 |
| | 1,506.4 |
|
| 2022 | 12.2 |
| | 0.3 |
| | 32.9 |
| | 1,111.3 |
| | 205.3 |
| | 1,362.0 |
|
| 2023 | 3.3 |
| | 0.3 |
| | 1.9 |
| | 1,113.2 |
| | 197.1 |
| | 1,315.8 |
|
| Thereafter | 0.4 |
| | 0.3 |
| | 0.3 |
| | 17,740.2 |
| | 2,174.1 |
| | 19,915.3 |
|
| Total | $ | 348.5 |
| | $ | 6.9 |
| | $ | 674.7 |
| | $ | 23,604.7 |
| | $ | 3,222.8 |
| | $ | 27,857.6 |
|
(a) Represents fixed price commitments with city gate equivalent deliveries.
(b) Represents minimum payments for natural gas transportation and storage contracts that have expiration dates through fiscal year 2044.
(c) Represents electric purchase commitments that are based on existing fixed price and fixed volume contracts. Includes $31.6 millionOn December 17, 2019 the PSC of commitments related to renewable energy credits.
(d)Includes known and reasonably likely commitments to purchase natural gas. Cost estimates are based on forward market prices as of September 30, 2018. Certain of our gas purchase agreements have optionality,MD held a public hearing near the apartment complex at Arliss Street, at which may cause increases in these commitments.
Financial Guarantees
WGL has guaranteed payments primarily for certain commitments on behalf of some of its subsidiaries. WGL has also guaranteed payments for certain of our external partners. At September 30, 2018, there were no guarantees to external parties.
Antero Contract
Washington Gas and WGL Midstream contracted in June 2014 with Antero Resources Corporation (Antero) to buy gas from Antero at invoiced prices based on an index, and at a delivery point, specified in the contracts. Since deliveries began, however, the index price paid has been more than the fair market value at the same physical delivery point, resulting in losses to date of $29.6 million. Accordingly, Washington Gas and WGL Midstream notified Antero that it sought to apply a provision of the contracts that would permit a new index to be established. Antero objected, claimingresidents requested that the contract provisions permitting re-pricing did not apply, unless Antero itself choseCompany accelerate and complete its mercury service regulator program and that the Company absorb the cost of same.
The Company intends to sell gas at cheaper prices atfile comments with the delivery point (which Antero claimed it had not). The dispute was arbitrated in January 2017,PSC of MD responding to all written comments and resident testimony. Management believes that the arbitral tribunal ruled in favorlikelihood of Anteroa civil penalty is probable and has accrued $330,000 to reflect the minimum liability expected to result from the proceeding. Though the Company is unable to estimate the maximum possible penalty, other parties recommended penalties ranging from $32.0 million (AOBA argued the Company should absorb all costs of removal and relocation of mercury service regulators) to $123.3 million (OPC argued the Company should absorb all costs of removal and relocation of mercury service regulators and pay a fine of $25,000 per day for each day mercury service regulators remain on the applicability of the re-pricing mechanism. However, the tribunal ruled that it lacked authority to determine whether Antero was in breach of its obligation to deliver gas to Washington Gas and WGL Midstream at a point where they could obtain the higher pricing. Accordingly, Washington Gas and WGL Midstream filed suit in state court in Colorado for a determination of this issue. The state court initially granted Antero's motion to dismiss the case and we subsequently filed an appeal. In October 2018, the Court of Appeals reversed the state court's decision and should remand the lawsuit to the trial court within the next 30 to 60 days.
Separately, Antero has initiated suit against Washington Gas and WGL Midstream, claiming that they have failed to purchase specified daily quantities of gas and seeking alleged cover damages exceeding $100 million as of April 4, 2018, according to Antero's complaint. Washington Gas and WGL Midstream oppose both the validity and amount of Antero’s claim. WGL believes any loss associated with these claims to be remote and therefore, no accrual was made as of September 30, 2018. The jury trial has been tentatively scheduled for March 2019. In December 2017, WGL Midstream amended its purchase contract with Antero and, effective February 1, 2018, is no longer obligated to purchase gas at the delivery point that is the subject of these disputes.
MERGER RELATED COMMITMENTS
For a discussion of merger related commitments, refer to Note 20 — Merger with AltaGas Ltd. of the Notes to Consolidated Financial Statements.Company’s system).
NOTE 13. DERIVATIVE AND WEATHER-RELATED INSTRUMENTS
WGL Holdings, Inc
Washington Gas Light Company
Part II
Item 8. Financial Statements and Supplementary Data (continued)
Notes to Consolidated Financial Statements
14. DERIVATIVES
DERIVATIVE INSTRUMENTS
Regulated Utility OperationsDerivative Instruments
Washington Gas enters into contracts that qualify as derivative instruments and are accounted for under ASC Topic 815. These derivative instruments are recorded at fair value on our balance sheets and Washington Gas does not currently designate any derivatives as hedges under ASC Topic 815. Washington Gas’ derivative instruments relate to: (i) Washington Gas’ asset optimization program; (ii) managing price risk associated with the purchase of gas to serve utility customers and (iii) managing interest rate risk.
Asset Optimization.Washington Gas optimizes the value of its long-term natural gas transportation and storage capacity resources during periods when these resources are not being used to physically serve utility customers. Specifically, Washington Gas utilizes its transportation capacity assets to benefit from favorable natural gas prices between different geographic locations and utilizes its storage capacity assets to benefit from favorable natural gas prices between different time periods. As part of this asset optimization program, Washington Gas enters into physical and financial derivative transactions in the form of forward, futures and option contracts with the primary objective of securing operating margins that Washington Gas will ultimately realize. The derivative transactions entered into under this program are subject to mark-to-market accounting treatment under ASC Topic 820.
Regulatory sharing mechanisms provide for the annual realized profit from these transactions to be shared between Washington Gas'Gas’ shareholders and customers; therefore, changes in fair value are recorded through earnings, or as regulatory assets or liabilities to the extent that it is probable that realized gains and losses associated with these derivative transactions will be included in the rates charged to customers when they are realized. Unrealized gains and losses recorded to earnings may cause significant period-to-period volatility; this volatility does not change the operating margins that Washington Gas expects to ultimately realize from these transactions through the use of its storage and transportation capacity resources.
Washington Gas has a collaborative arrangement with a third party to facilitate the asset optimization program. The collaborative arrangement allocates a tiered percentage of profits or losses to the third party as compensation for its participation. The costs recorded by Washington Gas related to the collaborative arrangement totaled $6.0 million, $2.1 million, $9.5 million and $13.0 million for the calendar year ended December 31, 2019, three months ended December 31, 2018, and fiscal years ended September 30, 2018 and 2017, respectively. These amounts were recorded in “Utility cost of gas” on Washington Gas’ statements of operations. Either party may terminate the collaborative arrangement through the delivery of a termination notice. In such an event, Washington Gas may make a payment upon termination.
All physically and financially settled contracts under our asset optimization program are reported on a net basis in the statements of incomeoperations in “Utility cost of gas.”gas”. Total net margins recorded to “Utility cost of gas” after sharing and management fees associated with all asset optimization transactions for the calendar year ended December 31, 2019 was a net gain of $18.5 million including an unrealized gain of $5.4 million and $3.0 million loss related to Antero contract. During the three months ended December 31, 2018, we recorded a net gain of $1.1 million including an unrealized loss of $4.2 million. During the fiscal year ended September 30, 2018, waswe recorded a net gain of $34.3 million including an unrealized gain of $10.4 million. During the fiscal year ended September 30,31, 2017, we recorded a net gain of $82.9 million including an unrealized gain of $49.3 million. During the fiscal year ended September 30, 2016, we recorded a net gain of $43.8 million including an unrealized gain of $12.0 million.
Managing Price Risk.To manage price risk associated with acquiring natural gas supply for utility customers, Washington Gas enters into physical and financial derivative transactions in the form of forward, option and other contracts, as authorized by its regulators. Any gains and losses associated with these derivatives are recorded as regulatory liabilities or assets, respectively, to reflect the rate treatment for these economic hedging activities.
Washington Gas Light Company
Part II
Item 8. Financial Statements and Supplementary Data (continued)
Notes to Financial Statements
Managing Interest-Rate Risk.Washington Gas may utilize derivative instruments that are designed to minimize the risk of interest-rate volatility associated with planned issuances of debt securities. Any gains and losses associated with these types of derivatives are recorded as regulatory liabilities or assets, respectively, and amortized in accordance with regulatory requirements, typically over the life of the related debt.
Non-Utility Operations
Trading Activities. WGL Midstream enters into derivative contracts for the purpose of optimizing its storage At December 31, 2019 and transportation capacity as well as managing the transportation and storage assets on behalf of third parties. WGL Midstream2018, Washington Gas does not designate these derivatives as hedges under ASC Topic 815; therefore, changes in the fair value of these derivative instruments are reflected in the earnings of our non-utility operations and may cause significant period-to-period volatility in earnings.
Managing Price Risk. WGL Energy Services enters into certain derivative contracts as part of its strategy to manage the price risk associated with the sale and purchase of natural gas and electricity. WGL Energy Services elects "normal purchases and normal sales" treatment for a portion of these physical contracts related to the purchase of natural gas and electricity to serve its customers and therefore, they are not subject to the fair value accounting requirements of ASC Topic 815. Derivative instruments not designated as "normal purchases and normal sales" are recorded at fair value on our consolidated balance sheets, and changes in the fair value of these derivative instruments are reflected in the earnings of our non-utility operations,
WGL Holdings, Inc
Washington Gas Light Company
Part II
Item 8. Financial Statements and Supplementary Data (continued)
Notes to Consolidated Financial Statements
which may cause significant period-to-period volatility in earnings. WGL Energy Services does not designate derivatives as hedges under ASC Topic 815.
Managing Interest-Rate Risk. WGL utilizes derivative instruments that are designed to limit the risk of interest-rate volatility associated with future debt issuances.
WGL had $250 million of 30-year forward startinghave any interest rate swaps which settled in January 2018. Through December 2016, WGL had designated these interest rate swaps as cash flow hedges in anticipation of a 30-year debt issuance in January 2018 and reported the effective portion of changes in fair value as a component of other comprehensive income (loss). As a result of certain covenants related to the proposed merger with AltaGas, in January 2017, WGL de-designated these hedges as it was no longer probable that the debt would be issued and any further changes in the fair value of the interest rate swaps were recorded in interest expense. Subsequent to the Merger on July 6, 2018, the debt issuance is no longer reasonably possible of occurring and, therefore, the $6.4 million net of tax gain recorded in accumulated other comprehensive income that was associated with the cash flow hedges through December 31, 2016 was recorded to income during the quarter ending September 30, 2018. In January 2018, WGL settled these swaps for a gain of $13.8 million. For the twelve months ended September 30, 2018, we recorded income of $19.4 million to interest expense related to these swaps. Refer to Note 20—Merger With AltaGas LTD. for a discussion of the Merger. derivatives.
WGL's comprehensive income (loss) also includes amounts for settled hedges related to prior debt issuances, which are being amortized to income over the life of the outstanding debt. The amortization was minimal for the twelve months ended September 30, 2018 and 2017.
WGL Holdings, Inc
Washington Gas Light Company
Part II
Item 8. Financial Statements and Supplementary Data (continued)
Notes to Consolidated Financial Statements
Consolidated Operations
Reflected in the tables below is information for WGL as well as Washington Gas. The information for WGL includes derivative instruments for both utility and non-utility operations.
At September 30, 2018 and 2017, respectively, the absolute notional amounts of our derivatives were as follows:
|
| | | | | | | |
| Absolute Notional Amounts |
| of Open Positions on Derivative Instruments |
| Derivative transactions | Notional Amounts |
| September 30, 2018 | WGL Holdings | | Washington Gas |
Natural Gas (In millions of therms) | | | |
| Asset optimization & trading | 26,943.0 |
| | 13,580.0 |
|
| Retail sales | 110.8 |
| | — |
|
| Other risk-management activities | 1,421.8 |
| | 1,066.0 |
|
Electricity (In millions of kWhs) | | | |
| Retail sales | 8,449.2 |
| | — |
|
Other risk-management activities(a) | 27,833.9 |
| | — |
|
Interest Rate Swaps (In millions of dollars) | $ | — |
| | $ | — |
|
| September 30, 2017 | | | |
Natural Gas (In millions of therms) | | | |
| Asset optimization & trading | 21,663.5 |
| | 11,223.0 |
|
| Retail sales | 124.3 |
| | — |
|
| Other risk-management activities | 1,546.7 |
| | 1,181.0 |
|
Electricity (In millions of kWhs) | | | |
| Retail sales | 10,011.7 |
| | — |
|
Other risk-management activities(a) | 22,962.1 |
| | — |
|
Interest Rate Swaps (In millions of dollars) | 250.0 |
| | $ | — |
|
(a) Comprised primarily of financial swaps, financial transmission rights and physical forward purchases.
WGL Holdings, Inc
Washington Gas Light Company
Part II
Item 8. Financial Statements and Supplementary Data (continued)
Notes to Consolidated Financial Statements
The following tables presenttable presents the balance sheet classification for all derivative instruments as of September 30, 2018at December 31, 2019 and 2017.
|
| | | | | | | | | | | | | | | | |
WGL Holdings, Inc. Balance Sheet Classification of Derivative Instruments(b) |
| (In millions) | | | | | | |
| As of September 30, 2018 | Gross Derivative Assets | | Gross Derivative Liabilities | | | Netting of Collateral | | Total(a) |
| Current Assets—Derivatives | $ | 39.6 |
| | $ | (3.2 | ) | | | $ | — |
| | $ | 36.4 |
|
| Deferred Charges and Other Assets—Derivatives | 21.8 |
| | (1.2 | ) | | | — |
| | 20.6 |
|
| Accounts Payable | — |
| | (0.9 | ) | | | — |
| | (0.9 | ) |
| Current Liabilities—Derivatives | 23.1 |
| | (55.6 | ) | | | 9.8 |
| | (22.7 | ) |
| Deferred Credits—Derivatives | 9.8 |
| | (142.1 | ) | | | 11.8 |
| | (120.5 | ) |
| Total | $ | 94.3 |
| | $ | (203.0 | ) | | | $ | 21.6 |
| | $ | (87.1 | ) |
| As of September 30, 2017 | | | | | | | | |
| Current Assets—Derivatives | $ | 26.6 |
| | $ | (11.3 | ) | | | $ | — |
| | $ | 15.3 |
|
| Deferred Charges and Other Assets—Derivatives | 38.9 |
| | (0.4 | ) | | | (0.1 | ) | | 38.4 |
|
| Accounts Payable | 1.0 |
| | | | | | | 1.0 |
|
| Current Liabilities—Derivatives | 10.9 |
| | (57.0 | ) | | | 2.1 |
| | (44.0 | ) |
| Deferred Credits—Derivatives | 19.2 |
| | (148.8 | ) | | | 7.0 |
| | (122.6 | ) |
| Total | $ | 96.6 |
| | $ | (217.5 | ) | | | $ | 9.0 |
| | $ | (111.9 | ) |
|
| | | | | |
| Absolute Notional Amounts |
| of Open Positions on Derivative Instruments |
| | | December 31, 2019 | December 31, 2018 |
| Natural Gas (In millions of therms) | | | |
| Asset optimization & trading | | 11,671.0 |
| 13,051.0 |
|
| Other risk-management activities | | 976.0 |
| 1,072.0 |
|
The following table presents the balance sheet classification for all derivative instruments at December 31, 2019 and 2018.
| | Washington Gas Light Company Balance Sheet Classification of Derivative Instruments(b) | |
Balance Sheet Classification of Derivative Instruments(b) | | Balance Sheet Classification of Derivative Instruments(b) |
| (In millions) | | | | | | | | | | | | | | |
| As of September 30, 2018 | Gross
Derivative
Assets | | Gross
Derivative
Liabilities | | Netting of
Collateral | | Total(a) | |
| December 31, 2019 | | Gross
Derivative
Assets | | Gross
Derivative
Liabilities | | Netting of
Collateral | | Total(a) |
| Current Assets—Derivatives | $ | 17.8 |
| | $ | (0.4 | ) | | $ | — |
| | $ | 17.4 |
| $ | 2.9 |
| | $ | 3.7 |
| | $ | — |
| | $ | 6.6 |
|
| Deferred Charges and Other Assets—Derivatives | 8.7 |
| | — |
| | — |
| | 8.7 |
| 9.9 |
| | 0.5 |
| | — |
| | $ | 10.4 |
|
| Current Liabilities—Derivatives | 2.6 |
| | (20.2 | ) | | 2.8 |
| | (14.8 | ) | 0.7 |
| | (11.0 | ) | | 6.2 |
| | $ | (4.1 | ) |
| Deferred Credits—Derivatives | (1.6 | ) | | (102.6 | ) | | — |
| | (104.2 | ) | (0.5 | ) | | (97.2 | ) | | — |
| | $ | (97.7 | ) |
| Total | $ | 27.5 |
| | $ | (123.2 | ) | | $ | 2.8 |
| | $ | (92.9 | ) | $ | 13.0 |
| | $ | (104.0 | ) | | $ | 6.2 |
| | $ | (84.8 | ) |
| As of September 30, 2017 | | | | | | | | |
| December 31, 2018 | | | | | | | | |
| Current Assets—Derivatives | $ | 7.5 |
| | $ | (2.4 | ) | | $ | — |
| | $ | 5.1 |
| $ | 25.7 |
| | $ | (6.2 | ) | | $ | — |
| | $ | 19.5 |
|
| Deferred Charges and Other Assets—Derivatives | 16.5 |
| | (0.3 | ) | | — |
| | 16.2 |
| 11.3 |
| | — |
| | — |
| | 11.3 |
|
| Current Liabilities—Derivatives | — |
| | (30.3 | ) | | — |
| | (30.3 | ) | 1.1 |
| | (21.4 | ) | | — |
| | (20.3 | ) |
| Deferred Credits—Derivatives | — |
| | (112.3 | ) | | — |
| | (112.3 | ) | — |
| | (116.8 | ) | | — |
| | (116.8 | ) |
| Total | $ | 24.0 |
| | $ | (145.3 | ) | | $ | — |
| | $ | (121.3 | ) | $ | 38.1 |
|
| $ | (144.4 | ) |
| $ | — |
|
| $ | (106.3 | ) |
(a) WGLWashington Gas has elected to offset the fair value of recognized derivative instruments against the right to reclaim or the obligation to return collateral for derivative instruments executed under the same master netting arrangement in accordance with ASC Topic 815. All recognized derivative contracts and associated financial collateral subject to a master netting arrangement or similar that is eligible for offset under ASC Topic 815 have been presented net in the balance sheet.
(b) WGL and Washington Gas did not have derivative instruments outstanding that were designated as hedging instruments at December 31, 2019 and 2018.
The following tables present all gains and losses associated with derivative instruments for the calendar year ended December 31, 2019, three months ended December 31, 2018, and fiscal years ended September 30, 2018 orand 2017.
WGL Holdings, Inc
Washington Gas Light Company
Part II
Item 8. Financial Statements and Supplementary Data (continued)
Notes to Consolidated Financial Statements
The following tables present all gains and losses associated with derivative instruments for the years ended September 30, 2018, 2017 and 2016.
|
| | | | | | | | | | | | | | | | | | | | | | | |
| Gains and (Losses) on Derivative Instruments |
| (In millions) | WGL Holdings, Inc. | | Washington Gas |
| Fiscal Year Ended September 30, | 2018 | | 2017 | | 2016 | | 2018 | | 2017 | | 2016 |
| Recorded to income | | | | | | | | | | | |
| Operating revenues—non-utility | $ | (30.1 | ) | | $ | 30.8 |
| | $ | 5.8 |
| | $ | — |
| | $ | — |
| | $ | — |
|
| Utility cost of gas | (2.1 | ) | | 50.1 |
| | 12.1 |
| | (2.1 | ) | | 50.1 |
| | 12.1 |
|
| Non-utility cost of energy-related sales | 20.3 |
| | 33.5 |
| | 33.5 |
| | — |
| | — |
| | — |
|
| Interest income (expense) | 19.2 |
| | (5.8 | ) | | (0.2 | ) | | — |
| | — |
| | — |
|
| Recorded to regulatory assets | | | | | | | | | | | |
| Gas costs | (7.6 | ) | | 77.2 |
| | 13.9 |
| | (7.6 | ) | | 77.2 |
| | 13.9 |
|
Other (a) | — |
| | — |
| | (7.3 | ) | | — |
| | — |
| | (7.3 | ) |
Recorded to other comprehensive income(b) | (6.4 | ) | | 49.6 |
| | (39.3 | ) | | — |
| | — |
| | — |
|
| Total | $ | (6.7 | ) | | $ | 235.4 |
| | $ | 18.5 |
| | $ | (9.7 | ) | | $ | 127.3 |
| | $ | 18.7 |
|
(a) Represents the settlement of Washington Gas' forward starting interest rate swap in September 2016.
(b) Represents the effective portion of our cash flow hedges. Includes $0.2 million, $0.2 million, and $0.2 million of amortization of the losses related to interest rate hedges for WGL for September 30, 2018, 2017, and 2016 respectively. |
| | | | | | | | | | | | | | | |
| Washington Gas Light Company Gains and (Losses) on Derivative Instruments |
| (In millions) | Twelve Months Ended December 31, | | Three Months Ended December 31, | | Fiscal Years Ended September 30, |
| | 2019 | | 2018 | | 2018 | | 2017 |
| Recorded to income | | | | | | | |
| Utility cost of gas | 5.5 |
| | (3.2 | ) | | (2.1 | ) | | 50.1 |
|
| Recorded to regulatory assets | | | | | | | |
| Gas costs | 14.0 |
| | (6.0 | ) | | (7.6 | ) | | 77.2 |
|
| Total | $ | 19.5 |
| | $ | (9.2 | ) | | $ | (9.7 | ) | | $ | 127.3 |
|
Collateral
WGLWashington Gas utilizes standardized master netting agreements, which facilitate the netting of cash flows into a single net exposure for a given counterparty. As part of these master netting agreements, cash, letters of credit and parent company guarantees may be required to be posted or obtained from counterparties in order to mitigate credit risk related to both derivatives and non-derivative positions. Under WGL’sWashington Gas’ offsetting policy, collateral balances are offset against the related counterparties’ derivative positions to the extent the application would not result in the over-collateralization of those derivative positions on the balance sheet.
The table below presents collateral not offset against derivative assets and liabilities at September 30, 2018 and 2017, respectively.
|
| | | | | | | |
Collateral Not Offset Against Derivative Assets and Liabilities (In millions) |
| September 30, 2018 | Collateral deposits posted with counterparties | | Cash collateral held representing an obligation |
| Washington Gas | $ | 10.6 |
| | $ | 2.7 |
|
| WGL Energy Services | 20.6 |
| | — |
|
| WGL Midstream | 28.9 |
| | 0.4 |
|
| September 30, 2017 | | | |
| Washington Gas | $ | 3.7 |
| | $ | 0.1 |
|
| WGL Energy Services | 23.7 |
| | — |
|
| WGL Midstream | 44.4 |
| | 1.6 |
|
Any collateral posted that is not offset against derivative assets and liabilities is included in “Other prepayments” inon the accompanying balance sheets.sheet. Collateral received and not offset against derivative assets and liabilities is included in “Customer deposits and advance payments” inon the accompanying balance sheets.sheet.
At December 31, 2019 and 2018, Washington Gas had $5.2 million and $7.4 million, respectively, in collateral deposits posted with counterparties that are not offset against derivative asset and liabilities. At December 31, 2019 and 2018, Washington Gas had $0.1 million and $0.2 million, respectively, cash collateral held representing an obligation, and are not offset against derivative asset and liabilities.
Certain derivative instruments of WGL, Washington Gas WGL Energy Services and WGL Midstream contain contract provisions that require collateral to be posted if the credit rating of Washington Gas or WGL falls below certain levels or if counterparty exposure to WGL, Washington Gas WGL Energy Services or WGL Midstream exceeds a certain level (credit-related contingent features). Due to counterparty exposure levels, at September 30,At December 31, 2019 and 2018, WGL Energy Services posted $11.7 million of collateral related to its derivative liabilities that contained credit-related contingent features. At September 30, 2017, WGL Energy Services posted $8.6 million of collateral related to these aforementioned derivative liabilities. At both September 30, 2018 and 2017, WGLWashington Gas was not required to post collateral related to a derivative liability that contained a credit-related contingent feature. At both September 30, 2018 and 2017, Washington Gas and WGL Midstream were not required to
WGL Holdings, Inc
Washington Gas Light Company
Part II
Item 8. Financial Statements and Supplementary Data (continued)
Notes to Consolidated Financial Statements
post any collateral related to their respective derivative liabilities that contained credit-related contingent features. The following table shows the aggregate fair value of all derivative instruments with credit-related contingent features that are in a liability position, as well as the maximum amount of collateral that would be required if the most intrusive credit-risk-related contingent features underlying these agreements were triggered on September 30,December 31, 2019 and 2018, and 2017, respectively.
| | Potential Collateral Requirements for Derivative Liabilities with Credit-Risk-Contingent Features | Potential Collateral Requirements for Derivative Liabilities with Credit-Risk-Contingent Features | Potential Collateral Requirements for Derivative Liabilities
with Credit-Risk-Contingent Features |
| (In millions) | WGL Holdings, Inc. | | Washington Gas | December 31, 2019 | | December 31, 2018 |
| September 30, 2018 | | | | |
| Derivative liabilities with credit-risk-contingent features | $ | 5.7 |
| | $ | 0.4 |
| $ | 0.4 |
| | $ | 1.1 |
|
| Maximum potential collateral requirements | 0.7 |
| | 0.4 |
| 0.4 |
| | 1.0 |
|
| September 30, 2017 | | | | |
| Derivative liabilities with credit-risk-contingent features | $ | 25.0 |
| | $ | 2.8 |
| |
| Maximum potential collateral requirements | 21.9 |
| | 2.8 |
| |
We do not enter into derivative contracts for speculative purposes.
Concentration of Credit Risk
We are exposed to credit risk from derivative instruments with wholesale counterparties, which is represented by the fair value of these instruments at the reporting date. We actively monitor and work to minimize counterparty concentration risk through various practices. At September 30, 2018,December 31, 2019, three counterparties each represented over 10% of Washington Gas’ credit exposure to wholesale derivative counterparties for a total credit risk of $29.2 million; four counterparties each represented over 10% of WGL Energy Services’ credit exposure to wholesale counterparties for a total credit risk of $1.1 million; and two counterparties represented over 10% of WGL Midstream’s credit exposure to wholesale counterparties for a total credit risk of $12.3$25.7 million.
WEATHER-RELATED INSTRUMENTS
WGL Energy Services utilizes weather-related instruments for managing the financial effects of weather risks. These instruments cover a portion of WGL Energy Services’ estimated revenue or energy-related cost exposure to variations in heating or cooling degree days. These contracts provide for payment to WGL Energy Services of a fixed-dollar amount for every degree day over or under specific levels during the calculation period depending upon the type of contract executed. During the years ended September 30, 2018, 2017 and 2016, WGL Energy Services recorded pre-tax gains of $3.2 million, $1.4 million and $1.7 million, respectively, related to these instruments included in "Non-utility cost of energy related sales" in the accompanying consolidated statements of income.
NOTE 14.15. FAIR VALUE MEASUREMENTS
Recurring Basis
We measure the fair value of our financial assets and liabilities using a combination of the income and market approaches in accordance with ASC Topic 820. These financial assets and liabilities primarily consist of derivatives recorded on our balance sheet under ASC Topic 815 and short-term investments, commercial paper and long-term debt outstanding required to be
Washington Gas Light Company
Part II
Item 8. Financial Statements and Supplementary Data (continued)
Notes to Financial Statements
disclosed at fair value. Under ASC Topic 820, fair value is defined as the exit price, representing the amount that would be received in the sale of an asset or paid to transfer a liability in an orderly transaction between market participants at the measurement date. To value our financial instruments, we use market data or assumptions that market participants would use, including assumptions about credit risk (both our own credit risk and the counterparty’s credit risk) and the risks inherent in the inputs to valuation.
We enter into derivative contracts in the futures and over-the-counter (OTC) wholesale and retail markets. These markets are the principal markets for the respective wholesale and retail contracts. Our relevant market participants are our existing counterparties and others who have participated in energy transactions at our delivery points. These participants have access to the same market data as WGL.Washington Gas. Valuations are generally based on pricing service data or indicative broker quotes depending on
WGL Holdings, Inc
Washington Gas Light Company
Part II
Item 8. Financial Statements and Supplementary Data (continued)
Notes to Consolidated Financial Statements
the market location. We measure the net credit exposure at the counterparty level where the right to set-off exists. The net exposure is determined using the mark-to-market exposure adjusted for collateral, letters of credit and parent guarantees. We use published default rates from Standard & Poor’s Ratings Services and Moody’s Investors Service as inputs for determining credit adjustments.
ASC Topic 820 establishes a fair value hierarchy that prioritizes the inputs used to measure fair value. The hierarchy gives the highest priority to unadjusted quoted prices in active markets for identical assets or liabilities and the lowest priority to unobservable inputs. The three levels of the fair value hierarchy under ASC Topic 820 are described below:
Level 1. Level 1 of the fair value hierarchy consists of assets or liabilities that are valued using observable inputs based upon unadjusted quoted prices in active markets for identical assets or liabilities at the reporting date. WGLWashington Gas did not have any Level 1 derivatives at September 30, 2018 and 2017.December 31, 2019 or 2018.
Level 2. Level 2 of the fair value hierarchy consists of assets or liabilities that are valued using directly or indirectly observable inputs either corroborated with market data or based on exchange traded market data. Level 2 includes fair values based on industry-standard valuation techniques that consider various assumptions: (i) quoted forward prices, including the use of mid-market pricing within a bid/ask spread; (ii) discount rates; (iii) implied volatility and (iv) other economic factors. Substantially all of these assumptions are observable throughout the full term of the instrument, can be derived from observable data or are supported by observable levels at which transactions are executed in the relevant market. At September 30,December 31, 2019 and 2018, and 2017, Level 2 financial assets and liabilities included energy-related physical and financial derivative transactions such as forward, option and other contracts for deliveries at active market locations, as well as our interest rate swaps.locations.
Level 3. Level 3 of the fair value hierarchy consists of assets or liabilities that are valued using significant unobservable inputs at the reporting date. These unobservable assumptions reflect our assumptions about estimates that market participants would use in pricing the asset or liability, including natural gas basis prices and annualized volatilities of natural gas prices, and electricity congestion prices. A significant change to any one of these inputs in isolation could result in a significant upward or downward fluctuation in the fair value measurement. These inputs may be used with industry standard valuation methodologies that result in our best estimate of fair value for the assets or liabilities at the reporting date.
Our Commodity and Market Risk Analysis and Mitigation (RA&M)(C&MR) Group determines the valuation policies and procedures. The RA&MC&MR Group reports to WGL’s Chief Financial Officer.AltaGas’ Vice President of Commodity Risk. In accordance with WGL’sWashington Gas valuation policy, we may utilize a variety of valuation methodologies to determine the fair value of Level 3 derivative contracts, including internally developed valuation inputs and pricing models. The prices used in our valuations are corroborated using multiple pricing sources, and we periodically conduct assessments to determine whether each valuation model is appropriate for its intended purpose. The RA&MC&MR Group also evaluates changes in fair value measurements on a daily basis.
At September 30,December 31, 2019 and 2018, and 2017, Level 3 derivative assets and liabilities included: (i) physical contracts valued at illiquid market locations with no observable market data; (ii) long-dated positions where observable pricing is not available over the majority of the life of the contract; (iii) contracts valued using historical spot price volatility assumptions and (iv) valuations using indicative broker quotes for inactive market locations.
The following tables settable sets forth financial instruments recorded at fair value as of September 30,at December 31, 2019 and 2018, and 2017, respectively. A financial instrument’s classification within the fair value hierarchy is based on the lowest level of any input that is significant to the fair value measurement. Our assessment of the significance of a particular input to the fair value measurement requires judgment and may affect the valuation of fair value assets and liabilities and their placement within the fair value hierarchy.
WGL Holdings, Inc
Washington Gas Light Company
Part II
Item 8. Financial Statements and Supplementary Data (continued)
Notes to Consolidated Financial Statements
|
| | | | | | | | | | | | | | | |
WGL Holdings, Inc. Fair Value Measurements Under the Fair Value Hierarchy |
| (In millions) | Level 1 | | Level 2 | | Level 3 | | Total |
| At September 30, 2018 | | | | | | | |
| Assets | | | | | | | |
| Natural gas related derivatives | $ | — |
| | $ | 26.7 |
| | $ | 53.6 |
| | $ | 80.3 |
|
| Electricity related derivatives | — |
| | 4.4 |
| | 9.6 |
| | 14.0 |
|
| Total Assets | $ | — |
| | $ | 31.1 |
| | $ | 63.2 |
| | $ | 94.3 |
|
| Liabilities | | | | | | | |
| Natural gas related derivatives | $ | — |
| | $ | (30.6 | ) | | $ | (147.8 | ) | | $ | (178.4 | ) |
| Electricity related derivatives | — |
| | (0.1 | ) | | (24.5 | ) | | (24.6 | ) |
| Total Liabilities | $ | — |
| | $ | (30.7 | ) | | $ | (172.3 | ) | | $ | (203.0 | ) |
| At September 30, 2017 | | | | | | | |
| Assets | | | | | | | |
| Natural gas related derivatives | $ | — |
| | $ | 18.4 |
| | $ | 52.8 |
| | $ | 71.2 |
|
| Electricity related derivatives | — |
| | 0.1 |
| | 15.5 |
| | 15.6 |
|
| Interest rate derivatives | — |
| | 9.8 |
| | — |
| | 9.8 |
|
| Total Assets | $ | — |
| | $ | 28.3 |
| | $ | 68.3 |
| | $ | 96.6 |
|
| Liabilities | | | | | | | |
| Natural gas related derivatives | $ | — |
| | $ | (15.5 | ) | | $ | (167.4 | ) | | $ | (182.9 | ) |
| Electricity related derivatives | — |
| | (4.1 | ) | | (21.7 | ) | | (25.8 | ) |
| Interest rate derivatives | — |
| | (8.8 | ) | | — |
| | (8.8 | ) |
| Total Liabilities | $ | — |
| | $ | (28.4 | ) | | $ | (189.1 | ) | | $ | (217.5 | ) |
|
| | | | | | | | | | | | | | | |
Washington Gas Light Company Fair Value Measurements Under the Fair Value Hierarchy |
| (In millions) | Level 1 | | Level 2 | | Level 3 | | Total |
| At September 30, 2018 | | | | | | | |
| Assets | | | | | | | |
| Natural gas related derivatives | $ | — |
| | $ | 3.9 |
| | $ | 23.6 |
| | $ | 27.5 |
|
| Total Assets | $ | — |
| | $ | 3.9 |
| | $ | 23.6 |
| | $ | 27.5 |
|
| Liabilities | | | | | | | |
| Natural gas related derivatives | $ | — |
| | $ | (5.5 | ) | | $ | (117.7 | ) | | $ | (123.2 | ) |
| Total Liabilities | $ | — |
| | $ | (5.5 | ) | | $ | (117.7 | ) | | $ | (123.2 | ) |
| At September 30, 2017 | | | | | | | |
| Assets | | | | | | | |
| Natural gas related derivatives | $ | — |
| | $ | 7.0 |
| | $ | 17.0 |
| | $ | 24.0 |
|
| Total Assets | $ | — |
| | $ | 7.0 |
| | $ | 17.0 |
| | $ | 24.0 |
|
| Liabilities | | | | | | | |
| Natural gas related derivatives | $ | — |
| | $ | (5.7 | ) | | $ | (139.6 | ) | | $ | (145.3 | ) |
| Total Liabilities | $ | — |
| | $ | (5.7 | ) | | $ | (139.6 | ) | | $ | (145.3 | ) |
|
| | | | | | | | | | | | | | | |
Fair Value Measurements Under the Fair Value Hierarchy |
| (In millions) | Level 1 | | Level 2 | | Level 3 | | Total |
| At December 31, 2019 | | | | | | | |
| Assets | $ | — |
| | $ | 0.8 |
|
| $ | 12.2 |
| | $ | 13.0 |
|
| Liabilities | $ | — |
| | $ | (7.0 | ) | | $ | (97.0 | ) | | $ | (104.0 | ) |
| At December 31, 2018 | | | | | | | |
| Assets | $ | — |
| | $ | 9.8 |
| | $ | 28.3 |
| | $ | 38.1 |
|
| Liabilities | $ | — |
| | $ | (9.5 | ) | | $ | (134.9 | ) | | $ | (144.4 | ) |
The following table includes quantitative information about the significant unobservable inputs used in the fair value measurement of our Level 3 financial instruments and the respective fair values of the net derivative asset and liability positions, by contract type, as of September 30, 2018at December 31, 2019 and 2017.
WGL Holdings, Inc
Washington Gas Light Company
Part II
Item 8. Financial Statements and Supplementary Data (continued)
Notes to Consolidated Financial Statements
2018.
|
| | | | | | | | |
Quantitative Information about Level 3 Fair Value Measurements |
| (In millions) | | Net Fair Value
September 30, 2018 | | Valuation Techniques | | Unobservable Inputs | | Range |
| | | | | | | | |
WGL Holdings, Inc. | | | | | | | | |
Natural gas related derivativesDecember 31, 2019 | | ($90.6)84.8) | | Discounted Cash Flow | | Natural Gas Basis Price (per (per dekatherm)
| | ($1.810) 0.905)- $3.886$2.523 |
| December 31, 2018 | | ($3.6) | | Option Model | | Natural Gas Basis Price
(per dekatherm)
| | ($0.985) - $3.710 |
| |
| | | | Annualized Volatility of Spot Market Natural Gas | | 37.5% - 901.0% |
Electricity related derivatives | | ($14.9)106.6) | | Discounted Cash Flow | | Electricity Congestion Price
(per megawatt hour)
| | ($6.257) - $64.650 |
| | | | | | | | |
Washington Gas Light Company | | | | | | | | |
Natural gas related derivatives | | ($94.1) | | Discounted Cash Flow | | Natural Gas Basis Price (per (per dekatherm)
| | ($1.003) 1.028)- $3.886 |
| | | | | | | | |
| | Net Fair Value
September 30, 2017 | | | | | | |
| | | | | | | | |
| | | | | | | | |
Natural gas related derivatives | | ($112.4) | | Discounted Cash Flow | | Natural Gas Basis Price
(per dekatherm)
| | ($2.095) - $2.805 |
| | ($2.2) | | Option Model | | Natural Gas Basis Price
(per dekatherm)
| | ($2.095) - $2.358 |
| | | | | | Annualized Volatility of Spot Market Natural Gas | | 28.7% - 566.8% |
Electricity related derivatives | | ($6.2) | | Discounted Cash Flow | | Electricity Congestion Price
(per megawatt hour)
| | ($2.736) - $56.5 |
| | | | | | | | |
Washington Gas Light Company | | | | | | | | |
Natural gas related derivatives | | ($122.6) | | Discounted Cash Flow | | Natural Gas Basis Price
(per dekatherm)
| | ($1.928) - $2.805$5.34 |
WGL Holdings, Inc
Washington Gas Light Company
Part II
Item 8. Financial Statements and Supplementary Data (continued)
Notes to Consolidated Financial Statements
The following tables aretable is a summary of the changes in the fair value of our natural gas related derivative instruments that are measured at net fair value on a recurring basis in accordance with ASC Topic 820 using significant Level 3 inputs during the calendar year ended December 31, 2019, three months ended December 31, 2018, and fiscal years ended September 30, 2018 and 2017, respectively.
| | Reconciliation of Fair Value Measurements Using Significant Level 3 Inputs | | | WGL Holdings Inc. | | Washington Gas Light Company | Calendar Year Ended December 31, | Three Months Ended December 31, | Fiscal Years Ended September 30, |
| (In millions) | Natural Gas Related Derivatives | | Electricity Related Derivatives | | Total | | Total - Natural Gas
Related
Derivatives | 2019 | 2018 | 2018 | 2017 |
| Fiscal Year Ended September 30, 2018 | | | | | | | | |
| Balance at October 1, 2017 | $ | (114.6 | ) | | $ | (6.2 | ) | | $ | (120.8 | ) | | $ | (122.6 | ) | |
| Balance at beginning of period | | $ | (106.6 | ) | $ | (94.1 | ) | $ | (122.6 | ) | $ | (251.6 | ) |
| Realized and unrealized gains (losses) | | | | | | | | |
| Recorded to income | (22.4 | ) | | (6.0 | ) | | (28.4 | ) | | (4.5 | ) | 7.2 |
| (4.4 | ) | (4.5 | ) | 44.2 |
|
| Recorded to regulatory assets—gas costs | (10.0 | ) | | — |
| | (10.0 | ) | | (10.0 | ) | 17.8 |
| (5.8 | ) | (10.0 | ) | 69.7 |
|
| Transfers into Level 3 | (6.8 | ) | | — |
| | (6.8 | ) | | (6.9 | ) | (6.7 | ) | — |
| (6.9 | ) | (0.4 | ) |
| Transfers out of Level 3 | 9.6 |
| | — |
| | 9.6 |
| | 8.9 |
| 7.9 |
| — |
| 8.9 |
| (0.4 | ) |
| Purchases | — |
| | 2.9 |
| | 2.9 |
| | — |
| |
| Settlements | 50.0 |
| | (5.6 | ) | | 44.4 |
| | 41.0 |
| (4.4 | ) | (2.3 | ) | 41.0 |
| 15.9 |
|
| Balance at September 30, 2018 | $ | (94.2 | ) | | $ | (14.9 | ) | | $ | (109.1 | ) | | $ | (94.1 | ) | |
| Fiscal Year Ended September 30, 2017 | | | | | | | | |
| Balance at October 1, 2016 | $ | (264.1 | ) | | $ | (9.1 | ) | | $ | (273.2 | ) | | $ | (251.6 | ) | |
| Realized and unrealized gains (losses) | | | | | | | | |
| Recorded to income | 62.0 |
| | (7.6 | ) | | 54.4 |
| | 44.2 |
| |
| Recorded to regulatory assets—gas costs | 69.7 |
| | — |
| | 69.7 |
| | 69.7 |
| |
| Transfers into Level 3 | (0.8 | ) | | — |
| | (0.8 | ) | | (0.4 | ) | |
| Transfers out of Level 3 | (0.7 | ) | | — |
| | (0.7 | ) | | (0.4 | ) | |
| Purchases | — |
| | 1.0 |
| | 1.0 |
| | — |
| |
| Settlements | 19.3 |
| | 9.5 |
| | 28.8 |
| | 15.9 |
| |
| Balance at September 30, 2017 | $ | (114.6 | ) | | $ | (6.2 | ) | | $ | (120.8 | ) | | $ | (122.6 | ) | |
| Balance at end of period | | $ | (84.8 | ) | $ | (106.6 | ) | $ | (94.1 | ) | $ | (122.6 | ) |
Transfers between different levels of the fair value hierarchy may occur based on fluctuations in the valuation inputs and on the level of observable inputs used to value the instruments from period to period. It is our policy to show both transfers into and out of the different levels of the fair value hierarchy at the fair value as of the beginning of the period. Transfers out of Level 3 during the fiscal year ended September 30, 2018 and 2017 were due to valuations that experienced an increase in observable market inputs. Transfers into Level 3 during the fiscal year ended September 30, 2018 were due to an increase in unobservable market inputs, primarily pricing points.
WGL Holdings, Inc
Washington Gas Light Company
Part II
Item 8. Financial Statements and Supplementary Data (continued)
Notes All amounts recorded to Consolidated Financial Statements
The table below sets forthincome are from the line items on the statementsutility cost of income to which amounts are recorded for the fiscal years ended September 30, 2018, 2017 and 2016, respectively, related to fair value measurements using significant Level 3 inputs.
|
| | | | | | | | | | | | | | | | |
| Realized and Unrealized Gains (Losses) Recorded to Income for Level 3 Measurements |
| | WGL Holdings, Inc. | | Washington Gas Light Company |
| (In millions) | Natural Gas Related Derivatives | | Electricity Related Derivatives | | | Total | | Total - Natural Gas
Related
Derivatives |
| Fiscal Year Ended September 30, 2018 | | | | | | | | |
| Operating revenues—non-utility | $ | (17.5 | ) | | $ | (17.1 | ) | | | $ | (34.6 | ) | | $ | — |
|
| Utility cost of gas | (4.5 | ) | | — |
| | | (4.5 | ) | | (4.5 | ) |
| Non-utility cost of energy-related sales | (0.4 | ) | | 11.1 |
| | | 10.7 |
| | — |
|
| Total | $ | (22.4 | ) | | $ | (6.0 | ) | | | $ | (28.4 | ) | | $ | (4.5 | ) |
| Fiscal Year Ended September 30, 2017 | | | | | | | | |
| Operating revenues—non-utility | $ | 12.2 |
| | $ | (17.5 | ) | | | $ | (5.3 | ) | | $ | — |
|
| Utility cost of gas | 44.2 |
| | — |
| | | 44.2 |
| | 44.2 |
|
| Non-utility cost of energy-related sales | 5.6 |
| | 9.9 |
| | | 15.5 |
| | — |
|
| Total | $ | 62.0 |
| | $ | (7.6 | ) | | | $ | 54.4 |
| | $ | 44.2 |
|
| Fiscal Year Ended September 30, 2016 | | | | | | | | |
| Operating revenues—non-utility | $ | 8.2 |
| | $ | (26.5 | ) | | | $ | (18.3 | ) | | $ | — |
|
| Utility cost of gas | 4.0 |
| | — |
| | | 4.0 |
| | 4.0 |
|
| Non-utility cost of energy-related sales | 6.1 |
| | 5.1 |
| | | 11.2 |
| | — |
|
| Total | $ | 18.3 |
| | $ | (21.4 | ) | | | $ | (3.1 | ) | | $ | 4.0 |
|
Unrealized gains (losses) attributable to derivative assets and liabilities measured using significant Level 3 inputs were recorded as follows for the calendar year ended December 31, 2019, three months ended December 31, 2018, and fiscal years ended September 30, 2018 2017 and 2016,2017, respectively:
WGL Holdings, Inc
Washington Gas Light Company
Part II
Item 8. Financial Statements and Supplementary Data (continued)
Notes to Consolidated Financial Statements
|
| | | | | | | | | | | | | | | | |
| Unrealized Gains (Losses) Recorded for Level 3 Measurements |
| | WGL Holdings, Inc. | | Washington Gas Light Company |
| (In millions) | Natural Gas Related Derivatives | | Electricity Related Derivatives | | | Total | | Total - Natural Gas
Related
Derivatives |
| Fiscal Year Ended September 30, 2018 | | | | | | | | |
| Recorded to income | | | | | | | | |
| Operating revenues—non-utility | $ | (14.6 | ) | | $ | (20.9 | ) | | | $ | (35.5 | ) | | $ | — |
|
| Utility cost of gas | 2.3 |
| | — |
| | | 2.3 |
| | 2.3 |
|
| Non-utility cost of energy-related sales | 4.1 |
| | 15.7 |
| | | 19.8 |
| | — |
|
| Recorded to regulatory assets—gas costs | 0.2 |
| | — |
| | | 0.2 |
| | 0.2 |
|
| Total | $ | (8.0 | ) | | $ | (5.2 | ) | | | $ | (13.2 | ) | | $ | 2.5 |
|
| Fiscal Year Ended September 30, 2017 | | | | | | | | |
| Recorded to income | | | | | | | | |
| Operating revenues—non-utility | $ | 12.6 |
| | $ | 0.8 |
| | | $ | 13.4 |
| | $ | — |
|
| Utility cost of gas | 31.0 |
| | — |
| | | 31.0 |
| | 31.0 |
|
| Non-utility cost of energy-related sales | (0.4 | ) | | 9.4 |
| | | 9.0 |
| | — |
|
| Recorded to regulatory assets—gas costs | 51.0 |
| | — |
| | | 51.0 |
| | 51.0 |
|
| Total | $ | 94.2 |
| | $ | 10.2 |
| | | $ | 104.4 |
| | $ | 82.0 |
|
| Fiscal Year Ended September 30, 2016 | | | | | | | | |
| Recorded to income | | | | | | | | |
| Operating revenues—non-utility | $ | 9.9 |
| | $ | (2.3 | ) | | | $ | 7.6 |
| | $ | — |
|
| Utility cost of gas | 0.3 |
| | — |
| | | 0.3 |
| | 0.3 |
|
| Non-utility cost of energy-related sales | (0.4 | ) | | 13.2 |
| | | 12.8 |
| | — |
|
| Recorded to regulatory assets—gas costs | (2.6 | ) | | — |
| | | (2.6 | ) | | (2.6 | ) |
| Total | $ | 7.2 |
| | $ | 10.9 |
| | | $ | 18.1 |
| | $ | (2.3 | ) |
|
| | | | |
Unrealized Gains (Losses) Recorded for Level 3 Measurements
|
| | Calendar Year Ended December 31, | Three Months Ended December 31, | Fiscal Years Ended September 30, |
(In millions)
| 2019 | 2018 | 2018 | 2017 |
| Recorded to income | | | | |
| Utility cost of gas | $9.9 | $(4.0) | $2.3 | $31.0 |
| Recorded to Regulatory | | | | |
| Gas costs | 21.6 | (5.3) | 0.2 | 51.0 |
| Total | $31.5 | $(9.3) | $2.5 | $82.0 |
The following tablestable presents the carrying amounts recorded at amortized cost on Washington Gas' balance sheets and estimated fair values of our financial instruments at September 30, 2018December 31, 2019 and 2017.2018.
|
| | | | | | | | | | | | | | | |
WGL Holdings, Inc. Fair Value of Financial Instruments |
| September 30, 2018 | | September 30, 2017 |
| (In millions) | Carrying Amount | | Fair Value | | Carrying Amount | | Fair Value |
Money market funds(a) | $ | 117.9 |
| | $ | 117.9 |
| | $ | 11.8 |
| | $ | 11.8 |
|
Commercial paper (b) | $ | 587.5 |
| | $ | 585.7 |
| | $ | 505.0 |
| | $ | 505.0 |
|
Project financing (b) | $ | 82.2 |
| | $ | 82.2 |
| | $ | 54.8 |
| | $ | 54.8 |
|
Long-term debt(c) | $ | 1,879.9 |
| | $ | 1,912.8 |
| | $ | 1,430.9 |
| | $ | 1,577.3 |
|
WGL Holdings, Inc
Washington Gas Light Company
Part II
Item 8. Financial Statements and Supplementary Data (continued)
Notes to Consolidated Financial Statements
| | | Washington Gas Light Company Fair Value of Financial Instruments | |
| Fair Value of Financial Instruments | | Fair Value of Financial Instruments |
| September 30, 2018 | | September 30, 2017 | December 31, 2019 | | December 31, 2018 |
| (In millions) | Carrying Amount | | Fair Value | | Carrying Amount | | Fair Value | Carrying Amount | | Fair Value | | Carrying Amount | | Fair Value |
Money market funds(a) | $ | 67.3 |
| | $ | 67.3 |
| | $ | 4.8 |
| | $ | 4.8 |
| $ | 55.1 |
| | $ | 55.1 |
| | $ | 69.7 |
| | $ | 69.7 |
|
Commercial paper (b) | $ | 95.0 |
| | $ | 95.0 |
| | $ | 123.0 |
| | $ | 123.0 |
| $ | 399.5 |
| | $ | 399.5 |
| | $ | 296.0 |
| | $ | 296.0 |
|
Project financing (b) | $ | 68.5 |
| | $ | 68.5 |
| | $ | 43.8 |
| | $ | 43.8 |
| $ | — |
| | $ | — |
| | $ | 15.5 |
| | $ | 15.5 |
|
Current maturities of long-term debt
| | $ | — |
| | $ | — |
| | $ | 50.0 |
| | $ | 50.0 |
|
Long-term debt(c) | $ | 1,084.9 |
| | $ | 1,120.2 |
| | $ | 1,134.5 |
| | $ | 1,271.0 |
| $ | 1,330.9 |
| | $ | 1,480.8 |
| | $ | 1,035.0 |
| | $ | 1,096.3 |
|
(a) The balance as of September 30, 2018at December 31, 2019 includes $52.9 million and $2.3$11.0 million money market funds located in Cash"Cash and Cash equivalent for WGL and Washington Gas, respectively ,and $20.2cash equivalents", $19.5 million rabbi trust investmentsinvestment located in "Current Assets-Other", and $44.8$24.6 million rabbi trust investments located in "Deferred Charges and Other Assets-Other" of the accompanying balance sheets for both WGL and Washington Gas .sheets; The balance as of September 2017 isat December 31, 2018 includes $4.4 million money market funds located in Cash and Cash Equivalent. The amounts in cash"Cash and cash equivalent may be offset by outstanding checks.equivalents", $20.2 million rabbi trust investment located in "Current Assets-Other" and $45.1 million rabbi trust investments located in "Deferred Charges and Other Assets-Other".
(b) Balance isThe balance at December 31, 2019 includes $299.5 million located in notes"Notes payable and project financing", and $100.0 million located in “Long-term debt” on the accompanying balance sheets; The balance at December 31, 2018 was located in "Notes payable and project financing" on the balance sheets.
(c) Includes adjustments for current maturities and unamortized discounts, as applicable. The amount excludes the commercial paper.
Our money market funds are Level 1 valuations and their carrying amount approximates fair value. Other short-term investments are primarily overnight investment accounts; their carrying amount approximates fair value based on Level 2 inputs. The maturity of our commercial paper outstanding at both September 30, 2018 and 2017 is under 30 days. Due to the short term nature of these notes, the carrying cost of our commercial paper approximates fair value using Level 2 inputs. Due to the nature of our project financing arrangements, the carrying cost approximates fair value using Level 2 inputs. Neither WGL’s nor Washington Gas’Due to the short term nature of current maturities of long-term debt, is actively traded.the carrying cost approximates fair value using Level 2 inputs. The fair value of long-term debt was estimated based on valuation techniques whenusing indirectly observable inputs corroborated with market data is not available. Our long-term debt fair value measurementand therefore is classified as Level 3.
Non Recurring Basis
During the second quarter of fiscal year 2018, WGL Midstream recorded an other than temporary impairment charge of $34.0 million to its equity method investment in Constitution based on the estimated fair value of the investment of $4.0 million. WGL Midstream utilized income and market approaches to determine the fair value of its investment in Constitution, which fall into Level 3 of the fair value hierarchy because of the significant unobservable inputs utilized in these valuation approaches, including consideration of the severity and duration of any decline in fair value of our investment in the project. Our key inputs included, but were not limited to, significant management judgments and estimates, including projections of the timing and amount of the project’s cash flows, determination of a discount rate for the income approach, market multipliers, probability weighting of potential outcomes of legal and regulatory proceedings, and weighting of the valuations produced by the income and market approaches. For more information, see Note 16 - Other Investments of the Notes to Consolidated Financial Statements.
Additionally, Washington Gas recorded a $38.0 million impairment to Property, Plant and Equipment in connection with an agreement not to seek recovery of certain costs incurred under the Formal Case 1027 mechanical coupling program.2.
NOTE 15. OPERATING SEGMENT REPORTING
We have four reportable operating segments: regulated utility, retail energy-marketing, commercial energy systems and midstream energy services. The division of these segments into separate revenue generating components is based upon regulation, products and services. Our chief operating decision maker is our Chief Executive Officer and we evaluate segment performance based on Earnings Before Interest and Taxes (EBIT). EBIT is defined as earnings before interest and taxes net of amounts attributable to non-controlling interests. Items we do not include in EBIT are interest expense, intercompany financing activity, dividends on Washington Gas preferred stock, and income taxes. EBIT includes transactions between reportable segments. We also evaluate our operating segments based on other relevant factors, such as penetration into their respective markets and return on equity.
Our four segments are summarized below.
WGL Holdings, Inc
Washington Gas Light Company
Part II
Item 8. Financial Statements and Supplementary Data (continued)
Notes to Consolidated Financial Statements
Regulated Utility – The regulated utility segment is our core business. It consists of Washington Gas and Hampshire. Washington Gas provides regulated gas distribution services (including the sale and delivery of natural gas) to end use customers and natural gas transportation services to an unaffiliated natural gas distribution company in West Virginia under a FERC approved interstate transportation service operating agreement. Hampshire provides regulated interstate natural gas storage services to Washington Gas under a FERC approved interstate storage service tariff.
Retail Energy-Marketing – The retail energy-marketing segment consists of WGL Energy Services, which sells natural gas and electricity directly to retail customers in competition with regulated utilities and unregulated gas and electricity marketers.
Commercial Energy Systems – The commercial energy systems segment consists of WGL Energy Systems which provides clean and energy efficient solutions including commercial solar, energy efficiency and combined heat and power projects and other distributed generation solutions to government and commercial clients. In addition, this segment comprises the operations of WGSW, a holding company formed to invest in alternative energy assets.
Midstream Energy Services – The midstream energy services segment consists of WGL Midstream, which specializes in the investment, management, development and optimization of natural gas storage and transportation midstream infrastructure projects.
Administrative and business development activity costs associated with WGL and Washington Gas Resources and activities and transactions that are not significant enough on a stand-alone basis to warrant treatment as an operating segment, and that do not fit into one of our four operating segments, are aggregated as “Other Activities” in the Operating Segment Financial Information presented below. Results for other activities primarily relate to external costs associated with the merger with AltaGas.
The following tables present operating segment information for the fiscal years ended September 30, 2018, 2017 and 2016.
WGL Holdings, Inc
Washington Gas Light Company
Part II
Item 8. Financial Statements and Supplementary Data (continued)
Notes to Consolidated Financial Statements
|
| | | | | | | | | | | | | | | | | | | | | | | | | | | |
| Operating Segment Financial Information |
| (In thousands) |
Operating Revenues(a) | | Depreciation and Amortization | | Equity in Earnings of Unconsolidated Affiliates | | EBIT | | Total Assets | | Capital Expenditures | | Equity Method Investments |
| Fiscal Year Ended September 30, 2018 | | | | | | | | | | | | | |
| Regulated utility | $ | 1,248,063 |
| | $ | 136,905 |
| | $ | — |
| | $ | 7,922 |
| | $ | 5,178,937 |
| | $ | 396,521 |
| | $ | — |
|
| Retail energy-marketing | 1,009,698 |
| | 1,084 |
| | — |
| | 31,491 |
| | 420,171 |
| | 386 |
| | — |
|
Commercial energy systems(b) | 79,809 |
| | 24,510 |
| | — |
| | 34,878 |
| | 1,014,612 |
| | 119,499 |
| | — |
|
| Midstream energy services | 40,551 |
| | 17 |
| | (5,791 | ) | | 29,422 |
| | 1,038,380 |
| | — |
| | 769,998 |
|
| Other activities | — |
| | — |
| | — |
| | (40,000 | ) | | 478,437 |
| | — |
| | — |
|
Eliminations(c) | (36,356 | ) | | 60 |
| | — |
| | (4,369 | ) | | (882,450 | ) | | — |
| | — |
|
| Total consolidated | $ | 2,341,765 |
| | $ | 162,576 |
| | $ | (5,791 | ) | | $ | 59,344 |
| | $ | 7,248,087 |
| | $ | 516,406 |
| | $ | 769,998 |
|
| Fiscal Year Ended September 30, 2017 | | | | | | | | | | | | | |
| Regulated utility | $ | 1,166,968 |
| | $ | 131,231 |
| | $ | — |
| | $ | 266,307 |
| | $ | 4,984,121 |
| | $ | 408,308 |
| | $ | — |
|
| Retail energy-marketing | 1,107,151 |
| | 1,141 |
| | — |
| | 53,195 |
| | 513,415 |
| | 614 |
| | — |
|
Commercial energy systems (b) | 95,178 |
| | 21,690 |
| | 7,303 |
| | 40,834 |
| | 1,031,921 |
| | 107,552 |
| | 9,578 |
|
| Midstream energy services | 31,339 |
| | 25 |
| | 12,913 |
| | 37,689 |
| | 699,560 |
| | 60 |
| | 384,623 |
|
| Other activities | — |
| | — |
| | — |
| | (19,865 | ) | | 409,938 |
| | — |
| | — |
|
Eliminations(c) | (45,912 | ) | | 51 |
| | — |
| | 965 |
| | (1,012,946 | ) | | — |
| | — |
|
| Total consolidated | $ | 2,354,724 |
| | $ | 154,138 |
| | $ | 20,216 |
| | $ | 379,125 |
| | $ | 6,626,009 |
| | $ | 516,534 |
| | $ | 394,201 |
|
| Fiscal Year Ended September 30, 2016 | | | | | | | | | | | | | |
| Regulated utility | $ | 1,070,904 |
| | $ | 116,129 |
| | $ | — |
| | $ | 228,219 |
| | $ | 4,636,954 |
| | $ | 393,501 |
| | $ | — |
|
| Retail energy-marketing | 1,238,480 |
| | 1,154 |
| | — |
| | 64,968 |
| | 486,778 |
| | 8,104 |
| | — |
|
| Commercial energy systems | 89,072 |
| | 15,201 |
| | 7,620 |
| | 21,992 |
| | 885,734 |
| | 128,780 |
| | 66,100 |
|
| Midstream energy services | 6,619 |
| | 107 |
| | 6,186 |
| | 7,807 |
| | 485,099 |
| | — |
| | 237,391 |
|
| Other activities | — |
| | — |
| | — |
| | (3,184 | ) | | 273,738 |
| | — |
| | — |
|
Eliminations(c) | (55,516 | ) | | (25 | ) | | — |
| | (504 | ) | | (718,853 | ) | | — |
| | — |
|
| Total consolidated | $ | 2,349,559 |
| | $ | 132,566 |
| | $ | 13,806 |
| | $ | 319,298 |
| | $ | 6,049,450 |
| | $ | 530,385 |
| | $ | 303,491 |
|
(a) Operating revenue amounts in the “Eliminations” row represent total intersegment revenues associated with sales from the regulated utility segment to the retail energy-marketing segment. Midstream Energy Services’ cost of energy related sales is netted with its gross revenues.
(b) As of August 2016, Commercial energy systems' operating revenues include revenues from non-controlling interest. Commercial energy systems' EBIT is adjusted for the effects of non-controlling interest.
(c) Intersegment eliminations include any mark-to market valuations associated with trading activities between WGL Midstream and WGL Energy Services, intercompany loans and a timing difference between Commercial Energy Systems’ recognition of revenue for the sale of Renewable Energy Credits (RECs) to Retail Energy-Marketing and Retail Energy-Marketing’s recognition of the associated expense. Retail Energy-Marketing has recorded a portion of the REC’s purchased as inventory to be used in future periods at which time they will be expensed.
The following table provides a reconciliation from EBIT to net income applicable to common stock.
|
| | | | | | | | | | | |
| Fiscal Year Ended September 30, |
| (In thousands) | 2018 | | 2017 | | 2016 |
| Total consolidated EBIT | $ | 59,344 |
| | $ | 379,125 |
| | $ | 319,298 |
|
| Interest expense | 62,133 |
| | 74,026 |
| | 52,310 |
|
| Income tax expense (benefit) | (53,452 | ) | | 111,159 |
| | 98,074 |
|
| Dividends on Washington Gas Light Company preferred stock | 1,320 |
| | 1,320 |
| | 1,320 |
|
| Net income applicable to common stock | $ | 49,343 |
|
| $ | 192,620 |
|
| $ | 167,594 |
|
WGL Holdings, Inc
Washington Gas Light Company
Part II
Item 8. Financial Statements and Supplementary Data (continued)
Notes to Consolidated Financial Statements
NOTE 16. OTHER INVESTMENTSWGL has both solar and pipeline investments and accounts for its interests in legal entities as either a: (i) variable interest entity (VIE) or a (ii) voting interest entity (non-VIE). A VIE is a legal entity with one of the following characteristics: (i) has insufficient at-risk equity to fund its activities without additional subordinated financial support from any other party or parties; (ii) the equity holders of which, as a group, lack the characteristics of a controlling financial interest; or (iii) the entity is structured with non-substantive voting rights.
The determination of whether or not to consolidate a VIE under GAAP requires a significant amount of judgment. This includes, but is not limited to, consideration of our contractual relationships with the entity, the legal structure of the entity, the voting power of the equity holders, the obligation of the equity holders to absorb losses of the entity and their rights to receive any expected residual returns.
Under the VIE model, we have a controlling financial interest in a VIE (i.e., are the primary beneficiary) and would consolidate the entity when we have current or potential rights that give us the power to direct the activities of a VIE that most significantly impact the VIE’s economic performance combined with a variable interest that gives us the right to receive potentially significant benefits or the obligation to absorb potentially significant losses. When changes occur to the design of an entity, we reconsider whether the entity is a VIE. We also continuously evaluate whether we have a controlling financial interest in a VIE.
Under the voting interest model, we consolidate an entity when we have a controlling financial interest by holding directly or indirectly, more than 50% of the voting rights or by exercising control through substantive participating rights. However, we consider substantive rights held by other partners in determining if we hold a controlling financial interest, and in some cases, may not consolidate the entity despite owning more than 50% of the voting rights. We reevaluate whether we have a controlling financial interest in these entities when our voting or substantive participating rights change. Where we do not have a controlling financial interest, we apply the equity method of accounting.
We have investments in both consolidated and unconsolidated entities which are described in detail below. The unconsolidated investments are accounted for under the equity method of accounting with profits and losses included in “Equity in earnings of unconsolidated affiliates” in the accompanying Condensed Consolidated Statements of Income, and the unconsolidated investment balances included in “Investments in unconsolidated affiliates” in the accompanying Condensed Consolidated Balance Sheets. Consolidated investments are accounted for under the principles of consolidation with profits and losses included in the appropriate revenues and expenses lines in the accompanying Condensed Consolidated Statements of Income, and the consolidated investment balances are included in the appropriate assets and liabilities lines in the accompanying Condensed Consolidated Balance Sheets. Profits and losses associated with non-controlling interests are included in “Net income (loss) attributable to non-controlling interest” in the accompanying Condensed Consolidated Statements of Income and are recorded to "Non-controlling interest" in the accompanying Condensed Consolidated Balance Sheets.
WGL uses the Hypothetical Liquidation at Book Value (HLBV) methodology to determine its earnings or losses for certain equity method investments as well as for the non-controlling interests in consolidated investments when the governing structuring agreement over the equity investment results in different liquidation rights and priorities than what is reflected by the underlying ownership interest percentage. For investments accounted for under the HLBV method, simply applying the percentage ownership interest to GAAP net income in order to determine earnings or losses does not accurately represent the income allocation and cash flow distributions that will ultimately be received by the investors. The HLBV calculation may vary in its complexity depending on the capital structure and the tax considerations for the investments.
When applying HLBV, WGL determines the amount that it would receive if an equity investment entity were to liquidate all of its assets at book value (as valued in accordance with GAAP) and distribute that cash to the investors based on the contractually defined liquidation priorities. The change in WGL's claim on the investee's book value at the beginning and end of the reporting period (adjusted for contributions and distributions) is WGL’s share of the earnings or losses from the equity investment for the period.
Consolidated Investments
Variable Interest Entity Investments - Solar
At September 30, 2018, WGL's subsidiary, WGSW, Inc. was the primary beneficiary of SFGF LLC (SFGF), SFRC, LLC (SFRC), SFGF II, LLC (SFGF II), ASD Solar LP (ASD) and SFEE LLC (SFEE), because of its ability to direct the activities most significant to the economic performance of those entities plus the right to receive potentially significant benefits or the obligation to absorb potentially significant losses. Accordingly, we have consolidated these VIE's.
WGL Holdings, Inc
Washington Gas Light Company
Part II
Item 8. Financial Statements and Supplementary Data (continued)
Notes to Consolidated Financial Statements
SFGF, SFRC, and SFGF II
WGSW, along with its various tax equity partners, formed the tax equity partnerships SFGF, SFRC, and SFGF II to acquire, own, and operate distributed generation solar projects nationwide. WGSW is the managing member of these investments and will provide cash equal to the purchase price of the solar projects less any contributions from the tax-equity partner for projects sold into the partnerships. WGL Energy Systems is the developer of the projects and sells them to the partnerships and is the operations and maintenance provider.
Profits and losses are allocated between the partners under the HLBV method of accounting and the portion allocated to the tax equity partner is included in “Net income (loss) attributable to non-controlling interest” on the accompanying Condensed Consolidated Statements of Income and is recorded to "Non-controlling interest" on the accompanying Condensed Consolidated Balance Sheets.
As of September 30, 2018, WGSW has contributed $16.8 million, $29.0 million and $47.4 million to SFGF, SFRC, and SFGF II, respectively.
ASD
WGSW is the limited partner in ASD, a limited partnership formed to own and operate a portfolio of residential solar projects, primarily rooftop photovoltaic power generation systems. As the limited partner, WGSW provided funding to the partnership through the funding commitment period that ended in January 2014 for a total of $72.6 million.
Prior to July 10, 2017, ASD was being consolidated by the general partner, Solar Direct LLC (Solar Direct). Solar Direct is a wholly owned subsidiary of American Solar Direct Inc. (ASDI). In June 2017, ASDI filed for Chapter 7 bankruptcy because of financial difficulties. To ensure continuing operations of the partnership and minimal disruptions to the customers, WGSW petitioned the Bankruptcy Court to remove Solar Direct as manager of ASD operations and to approve the appointment of SF ASD, a wholly owned subsidiary of WGL Energy Systems, formed to take over the management and operations of the partnership, as manager of ASD operations. On July 10, 2017, the Bankruptcy Court granted the bankruptcy trustee's emergency motion to assign management rights and control of ASD to SF ASD and WGSW consolidated ASD as a result.
SFEE
On November 23, 2016, WGSW and a tax equity partner formed SFEE to acquire distributed generation solar projects that were to be developed and sold by a third-party developer or WGL Energy Systems. New projects were to be designed and constructed under long-term power purchase agreements. On November 8, 2017, WGSW terminated the Master Purchase Agreement between SFEE and the third-party developer. The termination triggered a reassessment of the method of accounting for SFEE and, as a result, SFEE is considered a VIE and is consolidated by WGSW. As of September 30, 2018, WGSW has contributed $6.5 million into the tax equity partnership.
The following table summarizes the fair value amounts of SFEE’s assets and liabilities, as well as the estimated fair value of the non-controlling interest as of the date of consolidation.
|
| | | | |
| Fair Value of SFEE at Date of Consolidation |
| (in millions) | | Fair Value |
| Property, plant and equipment | | 10.1 |
|
| Other assets | | $ | 0.1 |
|
| Total assets | | $ | 10.2 |
|
| Net assets | | $ | 10.2 |
|
| Non-controlling interest | | $ | 0.6 |
|
| WGSW equity interest | | $ | 9.6 |
|
Property, plant and equipment represents commercial solar assets for SFEE stated at cost. This amount was determined to be equal to the fair value provided by a third-party appraisal.
Balance Sheet Location of Consolidated Investment
The carrying amounts and classification of the consolidated VIEs’ assets and liabilities included in our consolidated balance sheet at September 30, 2018 and September 30, 2017 are as follows:
WGL Holdings, Inc
Washington Gas Light Company
Part II
Item 8. Financial Statements and Supplementary Data (continued)
Notes to Consolidated Financial Statements
|
| | | | | | | |
| WGL Holdings, Inc. |
| Balance Sheet Location of Consolidated Investments |
| (in millions) | | September 30, 2018 | September 30, 2017 |
| Current assets | | $ | 12.5 |
| $ | 4.4 |
|
| Property, Plant and Equipment | | 248.8 |
| 121.7 |
|
| Total assets | | $ | 261.3 |
| $ | 126.1 |
|
| Current liabilities | | 0.9 |
| 0.2 |
|
| Deferred credits | | 1.7 |
| 0.8 |
|
| Total liabilities | | $ | 2.6 |
| $ | 1.0 |
|
Unconsolidated Investments
Variable Interest Entity Investments-Pipelines
Meade
In 2014, WGL through its subsidiary WGL Midstream, entered into a limited liability company agreement and formed Meade Pipeline Co LLC (Meade), a Delaware limited liability company, with Transcontinental Gas Pipe Line Company, LLC (Transco) to invest in a regulated pipeline, a segment of Transco's Atlantic Sunrise project, called Central Penn Pipeline (Central Penn). Central Penn is an approximately 185-mile pipeline originating in Susquehanna County, Pennsylvania and extending to Lancaster County, Pennsylvania that has the capacity to transport and deliver up to approximately 1.7 million dekatherms per day of natural gas. WGL Midstream planned to invest an estimated $450 million for a 55% interest in Meade, and WGL Midstream indirectly owns 21% of the pipeline. On October 4, 2018, FERC issued its authorization to place the pipeline into service and Central Penn began operations on October 6, 2018.
In August 2018, Meade executed an agreement with Transco to participate in an expansion of the Central Penn Pipeline (Leidy South) with an estimated capital investment of up to $50 million by WGL Midstream. Leidy South is expected to add an estimated 580,000 dekatherms per day of natural gas to the capacity of Central Penn through the addition of compression at new and existing stations. Meade will own 40% of the expanded capacity and WGL Midstream will indirectly own 22% of the expanded capacity through its 55% ownership interest in Meade. Leidy South is anticipated to be in-service as early as the fourth quarter of 2021 assuming all necessary regulatory approvals are received in a timely manner.
At September 30, 2018 and 2017, WGL Midstream held a $447.0 million and $146.7 million, equity method investment in Meade, respectively. Although WGL Midstream holds greater than a 50% interest in Meade, Meade is not consolidated by WGL Midstream and WGL Midstream accounts for its investment in Meade under the equity method of accounting. WGL Midstream is not the primary beneficiary of Meade as it does not have the power to direct the activities most significant to the economic performance of Meade. WGL Midstream utilizes HLBV in its application of equity method of accounting for this investment and any profits and losses are included in “Equity in earnings of unconsolidated affiliates” in the accompanying Condensed Consolidated Statements of Income and are added to or subtracted from the carrying amount of WGL’s investment balance. Since inception, WGL Midstream recorded $12.5 million of capitalized interest during the construction of Central Penn. The interest was recorded as a basis adjustment and will be amortized over the life of the asset.
Our maximum financial exposure to loss because of our involvement with this VIE is equal to WGL Midstream's capital contributions.
Non-Variable Investment Entity Investments-Pipelines
Mountain Valley Pipeline
In March 2015, WGL Midstream acquired a 7% equity interest in Mountain Valley Pipeline, LLC (Mountain Valley). On October 24, 2016, WGL Midstream acquired an additional 3% equity interest in Mountain Valley by assuming all of Vega Midstream MVP LLC's (Vega Energy) interest in the joint venture. WGL Midstream now owns a 10% interest in Mountain Valley.
The proposed pipeline to be developed, constructed, owned and operated by Mountain Valley, will transport approximately 2.0 million dekatherms of natural gas per day and connects with EQT Corporation's Equitrans system in Wetzel County, West Virginia to Transcontinental Gas Pipe Line Company LLC's Station 165 in Pittsylvania County, Virginia.
At September 30, 2018 and 2017, WGL Midstream held a $182.1 million and $63.0 million equity method investment in Mountain Valley, respectively. WGL Midstream expects to invest approximately $352.0 million in scheduled capital
WGL Holdings, Inc
Washington Gas Light Company
Part II
Item 8. Financial Statements and Supplementary Data (continued)
Notes to Consolidated Financial Statements
contributions through the in-service date of the pipeline based on its pro rata share of project costs. The equity method is considered appropriate because Mountain Valley is an LLC with specific ownership accounts and ownership between five and fifty percent resulting in WGL Midstream maintaining a more than minor influence over the partnership operating and financing policies. Profits and losses are allocated under the HLBV method of accounting and are included in “Equity in earnings of unconsolidated affiliates” in the accompanying Condensed Consolidated Statements of Income and are added to or subtracted from the carrying amount of WGL’s investment balance.
In April 2018, WGL Midstream entered into a separate agreement with Mountain Valley to acquire a 5% equity interest in a lateral project to build an interstate natural gas pipeline (the MVP Southgate project). The proposed pipeline will receive gas from the Mountain Valley Pipeline mainline in Pittsylvania County, Virginia and extend approximately 73 miles south to new delivery points in Rockingham and Alamance counties, North Carolina. The total commitment by WGL Midstream is expected to be approximately $17.0 million.
Stonewall System
WGL Midstream has a 30% equity interest in an entity that owns and operates certain assets known as the Stonewall Gas Gathering System (the Stonewall System). The Stonewall System has the capacity to gather up to 1.4 billion cubic feet of natural gas per day from the Marcellus production region in West Virginia and connects with an interstate pipeline system that serves markets in the mid-Atlantic region.
At September 30, 2018 and 2017, WGL Midstream held a $137.4 million and $136.7 million equity method investment in the Stonewall System, respectively. The equity method is considered appropriate because the Stonewall System is an LLC with specific ownership accounts and ownership between five and fifty percent resulting in WGL Midstream maintaining a more than minor influence over the partnership operating and financing policies. Profits and losses are allocated under the HLBV method of accounting and are included in “Equity in earnings of unconsolidated affiliates” in the accompanying Condensed Consolidated Statements of Income and are added to or subtracted from the carrying amount of WGL’s investment balance.
The carrying amount of WGL Midstream's investment in the Stonewall System exceeded the amount of the underlying equity in net assets by $10.0 million as of September 30, 2018, which is being amortized over the life of the assets.
Constitution
WGL Midstream owns a 10% interest in Constitution. The Constitution pipeline is proposed to transport natural gas from the Marcellus region in northern Pennsylvania to major northeastern markets. Constitution is accounted for under the equity method of accounting; any profits and losses are included in “Equity in earnings of unconsolidated affiliates” in the accompanying Condensed Consolidated Statements of Income and are added to or subtracted from the carrying amount of WGL’s investment balance. The equity method is considered appropriate because Constitution is an LLC with specific ownership accounts and ownership between five and fifty percent resulting in WGL Midstream maintaining a more than minor influence over the partnership operating and financing policies.
In December 2014, Constitution received approval from the FERC to construct and operate the proposed pipeline. However, on April 22, 2016, the New York State Department of Environmental Conservation (NYSDEC) denied Constitution’s application for a Section 401 Certification for the pipeline, which is necessary for the construction and operation of the pipeline. In October 2017, Constitution filed a petition for declaratory order requesting FERC to find that, by operation of law, the Section 401 certification requirement for the New York State portion of Constitution’s pipeline project was waived due to the failure by the NYSDEC to act on Constitution’s Section 401 application within a reasonable period of time as required by the express terms of the statute. On January 11, 2018, the FERC denied the petition. On January 16, 2018, Constitution petitioned the U.S. Supreme Court to review the judgment of the Second Circuit Court, asserting that the Second Circuit Court’s decision conflicts with the decisions of the U.S. Supreme Court and federal Courts of Appeals on an important question of federal law. On February 12, 2018, Constitution filed a request for rehearing with FERC, which was denied on July 19, 2018. On April 30, 2018, the U.S. Supreme Court denied Constitution’s petition for writ of certiorari.
The project’s sponsors remain committed to the project, and as such, on June 25, 2018, Constitution requested FERC grant a 24-month extension on construction of the pipeline. On September 14, 2018 Constitution filed a petition for review of prior FERC rulings with the DC Court of Appeals.
We evaluate our investment in Constitution for other than temporary impairment. Our impairment assessment uses income and market approaches in determining the fair value of our investment in Constitution. Refer to Note 14 - Fair Value Measurements. During the second quarter of fiscal year 2018, we recorded an other than temporary impairment charge of $34.0 million to “Equity in earnings of unconsolidated affiliates” and recorded a reversal to “Operation and maintenance” expense of a previously recognized expense of $3.0 million in light of the FERC's denial of Constitution's petition on January 11, 2018. We evaluated our remaining investment at September 30, 2018 and determined that there was no additional impairment. There could be additiona
WGL Holdings, Inc
Washington Gas Light Company
Part II
Item 8. Financial Statements and Supplementary Data (continued)
Notes to Consolidated Financial Statements
l losses in the value of the investment beyond the impairment charge already taken. However, we believe that recoveries from the sale of the inventories held by Constitution will mostly offset these expenditures. We also continue to incur legal fees associated with the project. At September 30, 2018 and 2017, WGL Midstream held a $3.8 million and $38.1 million equity method investment in Constitution, respectively.
The following tables present summary information about our unconsolidated investments:
|
| | | | | | | | | | | | | | | | |
| WGL Holdings, Inc. |
| Balance Sheet Location of Unconsolidated Investments |
| | Solar | | Pipelines | | |
| (in millions) | | Non-VIEs(a) | | VIEs(b) | | Non-VIEs(c) | | Total |
| September 30, 2018 | | | | | | | | |
| Assets | | | | | | | | |
| Investments in unconsolidated affiliates | | $ | — |
| | $ | 447.0 |
| | $ | 323.0 |
| | $ | 770.0 |
|
| Total assets | | $ | — |
| | $ | 447.0 |
| | $ | 323.0 |
| | $ | 770.0 |
|
| September 30, 2017 | | | | | | | | |
| Assets | | | | | | | | |
| Investments in unconsolidated affiliates | | $ | 9.6 |
| | $ | 146.7 |
| | $ | 237.9 |
| | $ | 394.2 |
|
| Total assets | | $ | 9.6 |
| | $ | 146.7 |
| | $ | 237.9 |
| | $ | 394.2 |
|
(a)Balance relates to interest held in SFEE on September 30, 2017
(b)Balance relates to equity method investment in Meade.
(c)Balance relates to equity method investments in Constitution, Mountain Valley Pipeline and Stonewall System.
Equity Method Investment Summarized Financial Information
WGL follows the equity method of accounting to recognize its interest in the net assets and net earnings of the pipeline investments on an on-going basis. We present summarized financial information below, aggregated for all of our equity method investments for the periods in which we were invested in the entity. The amounts below represent the aggregate financial position and results of operations of 100 percent of each of WGL's equity method investments.
|
| | | | | | | | | | |
| WGL Holdings, Inc. |
| Summarized Financial Statements |
| (in thousands) | | | |
| | | | | |
| As of September 30, | | 2018 | 2017 | |
| Current assets | | $ | 1,298,488 |
| $ | 236,622 |
| |
| Non-current assets | | 3,902,251 |
| 1,646,752 |
| |
| Total assets | | $ | 5,200,739 |
| $ | 1,883,374 |
| |
| | | | | |
| Current liabilities | | $ | 730,720 |
| $ | 63,068 |
| |
| Non-current liabilities | | 6,445 |
| 166 |
| |
| Total liabilities | | $ | 737,165 |
| $ | 63,234 |
| |
| | | | | |
| For the fiscal year ended September 30, | | 2018 | 2017 | 2016 |
| Operating revenues | | $ | 91,778 |
| $ | 85,999 |
| $ | 64,412 |
|
| Operating income | | 64,160 |
| 47,580 |
| 26,580 |
|
| Net income | | 157,760 |
| 64,685 |
| 33,161 |
|
NOTE 17.16. RELATED PARTY TRANSACTIONS
Corporate Service Allocation
Related Party Transactions with AltaGas LTD.
WGL Holdings, Inc
Washington Gas Light Company
Part II
Item 8. Financial Statements and Supplementary Data (continued)
Notes to Consolidated Financial Statements
As a subsidiary of AltaGas and effective with the close of the Merger Close on July 6, 2018, WGLWashington Gas is charged a proportionate share of corporate governance and other shared services costs from AltaGas, primarily related to human resources, employee benefits, finance, legal, accounting, tax, information technology services, and office services. AltaGas charges Washington Gas for the total shared service costs and Washington Gas in turn allocates a portion of the costs to WGL’s subsidiaries.
WGL’s consolidatedother subsidiariesat the lower of cost or market. Washington Gas records a payable of the total shared service costs areallocated to all of WGL's subsidiaries in "Payable to associated companies" and a receivable of the shared service costs allocated to WGL’s other subsidiaries in “Receivables from associated companies” on the balance sheet.
Washington Gas Light Company
Part II
Item 8. Financial Statements and Supplementary Data (continued)
Notes to Financial Statements
At December 31, 2019, Washington Gas recorded as “Operations and maintenance” expense, with an offsetting payablea$5.0 million liability to AltaGas in “Current liabilities- other” on WGL’s consolidated balance sheet. As of September 30, 2018, the total liability was $5.1 million“Payables to associated companies,” reflecting WGL’sWashington Gas’ unpaid shared service cost payable to AltaGas. The total shared service expense forAltaGas, and a receivable of $5.3 million to “Receivables from associated companies” on the year ended September 30, 2018 was $5.1 million. Washington Gas reflects a liability in Washington Gas’ balance sheet in “Payables to associated companies” for the same shared service costs from AltaGas.
In addition, Washington Gas records a receivable from WGL’s other subsidiaries related to the shared service costs allocated to WGL’s subsidiariessubsidiaries. The net expenses of $18.2 million was included in “Receivables“Operation and maintenance” on the statements of operations for the calendar year ended December 31, 2019, reflecting the shared service cost allocated to Washington Gas.
At December 31, 2018, Washington Gas recorded a receivable from associated companies”companies of $0.6 million on the balance sheet related to the shared service costs allocated to WGL's subsidiaries, and $4.5 million net expenses included in "Operation and maintenance" of the statements of operations for the three months ended December 31, 2018, reflecting the shared service cost allocated to Washington Gas’Gas. There is no payable balance sheet. The total receivable was $1.1 millionrelated to the shared service cost as of September 30,December 31, 2018. The total shared service expense for the year ended September 30, 2018 was $4.0 million and was recorded in “Operations and maintenance” expense in Washington Gas’ statements of income.
We did not have related transactions with AltaGas during the fiscal year 2017.
Related Party Transactions with Other Affiliates
WGL and its subsidiaries engage in inter-company transactions in the ordinary course of business. Inter-company transactions and balances have been eliminated from the consolidated financial statements of WGL, except as described below.In addition, Washington Gas provides accounting, treasury, legal and other administrative and general support to affiliates,WGL’s subsidiaries, and files consolidated tax returns that include affiliated taxable transactions. Effective upon the approvals by the SCC of Virginia and beginning in January 2019 and June 2019, respectively, Washington Gas also provides accounting, legal, tax and other administrative and general support to various AltaGas U.S. entities and AltaGas. Washington Gas bills its affiliates to which it provides services in accordance with regulatory requirements for the actual cost of providing these services, which approximates their market value. To the extent such billings are outstanding, they are reflected in “Receivables from associated companies” on Washington Gas’ balance sheets.sheet. Washington Gas assigns or allocates these costs directly to its affiliates and, therefore, does not recognize revenues or expenses associated with providing these services. Washington Gas believes that allocations based on broad measures of business activity are appropriate for allocating expenses resulting from common services. Affiliate entities are allocated a portion of common services based on a formula driven by appropriate indicators of activity, as approved by management.
Project Financing
Washington Gas previously obtained third-party project financing on behalf of the federal government to provide funds during the construction of certain energy management services projects entered into under Washington Gas’ area-wide contract. Washington Gas recorded a contract asset in “Unbilled revenues” representing the government’s obligation and an account payable to WGL Energy Systems in “Payable to associated companies” for the construction work performed for the same amount. Refer to Note 6 — Short Term Debt of the Notes to Financial Statements for further discussions of the project financing.
Related Party Transactions with Hampshire
Hampshire owns full and partial interests in underground natural gas storage facilities, including pipeline delivery facilities located in and around Hampshire County, West Virginia, and operates those facilities to serve Washington Gas, which purchases all of the storage services of Hampshire. Washington Gas includes the cost of these services in the bills sent to its customers and records the cost of the services in "Operation and maintenance" in its statements of operations. Hampshire operates under a “pass-through” cost of service-based tariff approved by the FERC and adjusts its billing rates to Washington Gas on a periodic basis to account for changes in its investment in utility plant and associated expenses. The arrangement between Hampshire and Washington Gas is classified as an operating lease. A ROU asset and lease liability was not recognized upon the adoption of ASC 842 because all the costs associated with the arrangement are variable. Washington Gas recorded $7.4 million, $1.7 million, $6.9 million, and $6.8 million of the expenses related to the cost of services provided by Hampshire in Washington Gas' statements of operations for the calendar year ended December 31, 2019, three months ended December 2018, and calendar year ended September 30, 2018 and 2017, respectively. The outstanding balance not cleared between Washington Gas and Hampshire at the end of the reporting period was recorded in "Receivables from associated companies" of Washington Gas' balance sheet. Refer to Note 3- Leases for further discussion of ASC 842.
Other Related Party Transactions
In connection with billing for unregulated third-party marketers, including WGL Energy Services and with other miscellaneous billing processes, Washington Gas collects cash on behalf of affiliates and transfers the cash in a reasonable time period. Cash collected by Washington Gas on behalf of its affiliates but not yet transferred is recorded in “Payables to associated companies” on Washington Gas’ balance sheets.
Washington Gas previously obtained third-party project financing on behalf of the federal government to provide funds during the construction of certain energy management services projects entered into under Washington Gas' area-wide contract. In December 2016, WGL Energy Systems entered into an agreement to obtain third-party financing and receive funds directly from the third-party lender during the construction period associated with the related energy management service projects. Washington Gas will continue to record a receivable in "Unbilled revenues" representing the government’s obligation and will record an inter-company payable to WGL Energy Systems in "Notes payable and project financing" for the construction work performed for the same amount. Refer to Note 4-Short Term Debt of the Notes to Consolidated Financial Statements for further discussions of the project financing.
The following table presents the receivables and payables from associated companies as of September 30, 2018 and September 30, 2017.
|
| | | | | | | |
Washington Gas Light Company Receivables / Payables from Associated Companies |
| (In millions) | September 30, 2018 | | September 30, 2017 |
Receivables from associated companies(a) | $ | 1.1 |
| | $ | 32.4 |
|
Payables to associated companies(a) | $ | 16.4 |
| | $ | 94.8 |
|
(a)The receivable and payable do not include the transactions related to shared service cost billed from AltaGas.sheet.Washington Gas provides gas balancing services related to storage, injections, withdrawals and deliveries to all energy marketers participating in the sale of natural gas on an unregulated basis through the customer choice programs that operate in its service territory.territory, These balancing services include the sale of natural gas supply commodities related to various peaking
WGL Holdings, Inc
Washington Gas Light Company
Part II
Item 8. Financial Statements and Supplementary Data (continued)
Notes to Consolidated Financial Statements
arrangements contractually supplied to Washington Gas and then partially allocated and assigned by Washington Gas to the energy marketers, including WGL Energy Services. Washington Gas records revenues in " Operating revenue" of its statements
Washington Gas Light Company
Part II
Item 8. Financial Statements and Supplementary Data (continued)
Notes to Financial Statements
of operations for these balancing services pursuant to tariffs approved by the appropriate regulatory bodies. These related party amounts related to balancing services provided to WGL Energy Services have been eliminated in the consolidated financial statements of WGL. The following table shows the amounts Washington Gas charged WGL Energy Services for balancing services.
| | Washington Gas - Gas Balancing Service Charges | | | Years Ended September 30, | Calendar Year Ended December 31, | Three Month Ended December 31, | Fiscal Years Ended September 30, |
| (In millions) | 2018 | | 2017 | | 2016 | 2019 | 2018 | 2017 |
| Gas balancing service charge | $ | 18.5 |
| | $ | 23.6 |
| | $ | 26.8 |
| $ | 20.0 |
| $ | 4.6 |
| $ | 18.5 |
| $ | 23.6 |
|
As a result of these balancing services, an imbalance is created for volumes of natural gas received by Washington Gas that are not equal to the volumes of natural gas delivered to customers of the energy marketers. Washington Gas recorded a $2.1 million payable to WGL Energy Services recognized receivables from Washington Gas of $1.5 million and a $1.4$0.7 million receivable from WGL Energy Service at September 30,December 31, 2019 and 2018, and 2017, respectively, related to an imbalance in gas volumes. Due to regulatory treatment, these receivablesThe receivable and payable are not eliminatedrecorded in the consolidated financial statements of WGL."Accounts receivable" and "Accounts payable and other accrued liabilities" on Washington Gas' balance sheet. Refer to Note 1—Accounting Policies of the Notes to Consolidated Financial Statements for further discussion of these imbalance transactions.
Washington Gas participates in a purchase of receivables (POR) program as approved by the PSC of MD and separate program approved by the PSC of DC, whereby it purchases receivables from participating energy marketers at approved discount rates. In addition, WGL Energy Services is one of the energy marketers that participates in these POR programs with certain Maryland, District of Columbia and Pennsylvania utilities, whereby it sells its receivables to various utilities, including Washington Gas, at approved discount rates. The receivables purchased by Washington Gas are included in “Accounts receivable” in the accompanying balance sheet. Any activity between Washington GasAt December 31, 2019 and WGL Energy Services related to the POR program has been eliminated in the accompanying financial statements for WGL. At September 30, 2018, and 2017, Washington Gas had balances of $2.8$7.9 million and $3.2$6.4 million, respectively, of purchased receivables from WGL Energy Services. Additionally, Washington Gas expects to implement a program in the District of Columbia to participate in a POR program in January 2019.
WGL Holdings, Inc
Washington Gas Light Company
Part II
Item 8. Financial Statements and Supplementary Data (continued)
Notes to Consolidated Financial Statements
NOTE 18.17. ACCUMULATED OTHER COMPREHENSIVE INCOME (LOSS)
The following tables showtable shows the changes in accumulated other comprehensive income (loss) for WGL and Washington Gas by component for the calendar year ended December 31, 2019, three months ended December 31, 2018, and fiscal years ended September 30, 2018 and 2017. |
| | | | | | | | | | | | | | | |
| Changes in Accumulated Other Comprehensive Income (Loss) by Component |
| Calendar Year
Ended
December 31, | | Three Months Ended December 31, | | Fiscal Years Ended September 30, |
| (In thousands) | 2019 | | 2018 | | 2018 | | 2017 |
| Beginning Balance | $ | (6,627 | ) | | $ | (1,830 | ) | | $ | (4,522 | ) | | $ | (7,830 | ) |
Amortization of prior service credit (a)(b) | (649 | ) | | (226 | ) | | (675 | ) | | (767 | ) |
Amortization of actuarial loss (a)(b) | 1,590 |
| | 351 |
| | 1,704 |
| | 2,255 |
|
Actuarial gain (loss) arising during the period (a)
| 14,672 |
| | (6,597 | ) | | 4,620 |
| | 3,977 |
|
| Current-period other comprehensive income (loss) | 15,613 |
|
| (6,472 | ) |
| 5,649 |
|
| 5,465 |
|
| Income tax expense (benefit) related to pension and other post-retirement benefit plans | 4,077 |
| | (1,675 | ) | | 2,957 |
| | 2,157 |
|
| Ending Balance | $ | 4,909 |
|
| $ | (6,627 | ) |
| $ | (1,830 | ) | | $ | (4,522 | ) |
|
| | | | | | | |
WGL Holdings, Inc. Changes in Accumulated Other Comprehensive Loss by Component |
| September 30, |
| (In thousands) | 2018 | | 2017 |
| Beginning Balance | $ | (5,997 | ) | | $ | (38,539 | ) |
Qualified cash flow hedging instruments (a) | (6,341 | ) | | 49,610 |
|
Change in prior service cost (b) | (675 | ) | | (767 | ) |
Amortization of actuarial gain (b) | 6,324 |
| | 6,232 |
|
| Current-period other comprehensive income (loss) | (692 | ) | | 55,075 |
|
| Income tax expense related to other comprehensive income | 1,523 |
| | 22,533 |
|
| Ending Balance | $ | (8,212 | ) | | $ | (5,997 | ) |
(a) Cash flow hedging instruments represent interest rate swap agreements related to debt issuances. Refer to Note 13—Derivative and Weather-related Instruments for further discussion of the interest rate swap agreements.
(b)These accumulated other comprehensive income (loss) components are included in the computation of net periodic benefit cost. Refer to Note 9—Pension and other post-retirement benefit plans for additional details.
|
| | | | | | | |
Washington Gas Light Company Changes in Accumulated Other Comprehensive Loss by Component |
| September 30, |
| (In thousands) | 2018 | | 2017 |
| Beginning Balance | $ | (4,522 | ) | | $ | (7,830 | ) |
Change in prior service cost (a) | (675 | ) | | (767 | ) |
Amortization of actuarial gain (loss) (a) | 6,324 |
| | 6,232 |
|
| Current-period other comprehensive income | 5,649 |
| | 5,465 |
|
| Income tax expense benefit related to other comprehensive income | 2,957 |
| | 2,157 |
|
| Ending Balance | $ | (1,830 | ) | | $ | (4,522 | ) |
(a) These accumulated other comprehensive income (loss) components are included in the computation of net periodic benefit cost. Refer to Note 9—10 — Pension and other post-retirement benefit plans for additional details.
(b) Amortization of prior service cost and amortization of actuarial gain (loss) represent the amounts reclassified out of AOCI to “Other income (expense)” of statements of operations for the reporting periods.
WGL Holdings, Inc
Washington Gas Light Company
Part II
Item 8. Financial Statements and Supplementary Data (continued)
Notes to Consolidated Financial Statements
NOTE 19.18. SUPPLEMENTAL CASH FLOW INFORMATION
The following tables detailtable details the changes in operating assets and liabilities from operating activities, cash payments that have been included in the determination of earnings and non-cash investing and financing activities:
|
| | | | | | | | | | | | | | |
| | Calendar Year Ended December 31, | Three Months Ended December 31, | | Fiscal Years Ended September 30, |
| (In thousands) | 2019 | 2018 | | 2018 | | 2017 |
| CHANGES IN OPERATING ASSETS AND LIABILITIES | | | | | | |
| Accounts receivable and unbilled revenues | $ | (16,494 | ) | $ | (222,098 | ) | | $ | (13,557 | ) | | $ | (107,195 | ) |
| Receivables from associated companies | (7,602 | ) | (1,874 | ) | | 30,135 |
| | (18,563 | ) |
| Gas costs and other regulatory assets/liabilities—net | 26,374 |
| 40,028 |
| | 27,994 |
| | 3,430 |
|
| Storage gas | 15,952 |
| (2,550 | ) | | (8,626 | ) | | (10,280 | ) |
| Prepaid taxes | (7,383 | ) | (9,461 | ) | | 5,618 |
| | (6,524 | ) |
| Accounts payable and other accrued liabilities | (56,925 | ) | 61,029 |
| | 18,378 |
| | 17,921 |
|
| Payables to associated companies | 240 |
| 20,662 |
| | (73,296 | ) | | 29,074 |
|
| Customer deposits and advance payments | (14,318 | ) | (29,288 | ) | | 19,464 |
| | (16,742 | ) |
| Accrued taxes | (4,670 | ) | 1,024 |
| | 14,619 |
| | (4,831 | ) |
| Other current assets | (13,591 | ) | (28 | ) | | (14,605 | ) | | (4,123 | ) |
| Other current liabilities | (2,474 | ) | (121 | ) | | 154 |
| | 280 |
|
| Deferred gas costs—net | 33,044 |
| (51,936 | ) | | (8,306 | ) | | 2,467 |
|
| Deferred assets—other | 4,981 |
| 483 |
| | (5,895 | ) | | (15,088 | ) |
| Deferred liabilities—other | (28,004 | ) | (7,072 | ) | | (21,499 | ) | | (4,667 | ) |
| Pension and other post-retirement benefits | (15,677 | ) | (638 | ) | | (14,521 | ) | | (9,806 | ) |
| Other—net | — |
| — |
| | 893 |
| | 3,409 |
|
| Changes in operating assets and liabilities | $ | (86,547 | ) | $ | (201,840 | ) | | $ | (43,050 | ) | | $ | (141,238 | ) |
| SUPPLEMENTAL DISCLOSURES OF CASH FLOW INFORMATION | | | | | | |
| Income taxes paid (refunded)—net | $ | 15,623 |
| $ | 3,782 |
| | $ | (2,983 | ) | | $ | — |
|
| Interest paid | $ | 57,922 |
| $ | 4,982 |
| | $ | 57,036 |
| | $ | 50,539 |
|
| SUPPLEMENTAL DISCLOSURES OF NON-CASH INVESTING AND FINANCING ACTIVITIES: | | | | | | |
| Extinguishment of project debt financing | $ | (15,460 | ) | $ | (53,018 | ) | | $ | (28,312 | ) | | $ | (27,927 | ) |
| Capital expenditure accruals included in accounts payable and other accrued liabilities | $ | 26,590 |
| $ | 33,245 |
| | $ | 53,367 |
| | $ | 37,049 |
|
The following table provides a reconciliation of cash, cash equivalents, and restricted cash reported within Washington Gas’ balance sheets that sums to the total of such amounts shown on the statements of cash flows
|
| | | | | | | | | | | |
| For the year ended September 30, | 2018 | | 2017 | | 2016 |
| (In thousands) | | | | | |
| CHANGES IN OPERATING ASSETS AND LIABILITIES | | | | | |
| Accounts receivable and unbilled revenues—net | $ | (41,294 | ) | | $ | (108,236 | ) | | $ | (105,720 | ) |
| Gas costs and other regulatory assets/liabilities—net | 27,994 |
| | 3,430 |
| | (31,075 | ) |
| Storage gas | 55,714 |
| | (36,852 | ) | | 4,311 |
|
| Prepaid taxes | (1,197 | ) | | 1,848 |
| | (76,779 | ) |
| Accounts payable and other accrued liabilities | 35,000 |
| | 51,307 |
| | 31,792 |
|
| Customer deposits and advance payments | 18,264 |
| | (20,543 | ) | | (2,513 | ) |
| Accrued taxes | 13,494 |
| | 1,985 |
| | 1,805 |
|
| Other current assets | 1,678 |
| | (30,123 | ) | | (24,502 | ) |
| Other current liabilities | (3,448 | ) | | 10,673 |
| | (5,532 | ) |
| Deferred gas costs—net | (8,306 | ) | | 2,467 |
| | (5,104 | ) |
| Deferred assets—other | (8,821 | ) | | (18,538 | ) | | (22,312 | ) |
| Deferred liabilities—other | (7,608 | ) | | (29,407 | ) | | 2,076 |
|
| Pension and other post-retirement benefits | (14,458 | ) | | (9,950 | ) | | (10,244 | ) |
| Other—net | 1,288 |
| | 3,002 |
| | 3,821 |
|
| Changes in operating assets and liabilities | $ | 68,300 |
| | $ | (178,937 | ) | | $ | (239,976 | ) |
| SUPPLEMENTAL DISCLOSURES OF CASH FLOW INFORMATION | | | | | |
| Income taxes paid (refunded)—net | $ | (1,143 | ) | | $ | (10,002 | ) | | $ | (10,723 | ) |
| Interest paid | $ | 88,115 |
| | $ | 66,023 |
| | $ | 51,838 |
|
| SUPPLEMENTAL DISCLOSURES OF NON-CASH INVESTING AND FINANCING ACTIVITIES: | | | | | |
| Extinguishment of project debt financing | $ | (28,312 | ) | | $ | (27,927 | ) | | $ | — |
|
| Capital expenditure accruals included in accounts payable and other accrued liabilities | $ | 91,927 |
| | $ | 54,212 |
| | $ | 84,132 |
|
| Dividends paid in common stock | $ | — |
| | $ | 1,362 |
| | $ | 4,011 |
|
| Stock based compensation | $ | 12,389 |
| | $ | 6,564 |
| | $ | 6,742 |
|
| Transfer of investments to fixed assets (excluding ASD) | $ | 10,054 |
| | $ | 30,114 |
| | $ | — |
|
| Transfer of notes receivables to investments | $ | — |
| | $ | 10,031 |
| | $ | — |
|
| | | | | | |
| EFFECTS OF ASD CONSOLIDATION: | | | | | |
| Elimination of equity method investment | $ | — |
| | $ | (66,719 | ) | | $ | — |
|
| Consolidation of property, plant and equipment | $ | — |
| | $ | 48,248 |
| | $ | — |
|
| Elimination of unamortized investment tax credits | $ | — |
| | $ | 19,322 |
| | $ | — |
|
| Accounts receivable and other | $ | — |
| | $ | 956 |
| | $ | — |
|
| Gain on consolidation | $ | — |
| | $ | (1,807 | ) | | $ | — |
|
|
| | | | | | | | | | | | |
| | December 31, | September 30, |
| (in thousands) | 2019 | 2018 | 2018 | 2017 |
| Cash and cash equivalents | $ | 17,069 |
| $ | 6,082 |
| $ | 1 |
| $ | 1 |
|
| Restricted cash included in Current assets-Other | $ | 19,464 |
| $ | 20,207 |
| $ | 20,207 |
| $ | — |
|
| Restricted cash included in Deferred charges and other assets-Other | $ | 24,615 |
| $ | 45,134 |
| $ | 44,775 |
| $ | — |
|
| Total cash, cash equivalents and restricted cash shown in the statement of cash flows | $ | 61,148 |
| $ | 71,423 |
| $ | 64,983 |
| $ | 1 |
|
WGL Holdings, Inc
Washington Gas Light Company
Part II
Item 8. Financial Statements and Supplementary Data (continued)
Notes to Consolidated Financial Statements
Washington Gas
|
| | | | | | | | | | | |
| For the year ended September 30, | 2018 | | 2017 | | 2016 |
| (In thousands) | | | | | |
| CHANGES IN OPERATING ASSETS AND LIABILITIES | | | | | |
| Accounts receivable, unbilled revenues and receivables from associated companies—net | $ | 16,578 |
| | $ | (125,758 | ) | | $ | (78,304 | ) |
| Gas costs and other regulatory assets/liabilities—net | 27,994 |
| | 3,430 |
| | (31,075 | ) |
| Storage gas | (8,626 | ) | | (10,280 | ) | | 12,016 |
|
| Prepaid taxes | 5,618 |
| | (6,524 | ) | | 13,539 |
|
| Accounts payable and other accrued liabilities, including payables to associated companies | (54,918 | ) | | 46,995 |
| | 31,408 |
|
| Customer deposits and advance payments | 19,464 |
| | (16,742 | ) | | (7,514 | ) |
| Accrued taxes | 14,619 |
| | (4,831 | ) | | 5,980 |
|
| Other current assets | (14,605 | ) | | (4,123 | ) | | 3,912 |
|
| Other current liabilities | 154 |
| | 280 |
| | (1,318 | ) |
| Deferred gas costs—net | (8,306 | ) | | 2,467 |
| | (5,104 | ) |
| Deferred assets—other | (5,895 | ) | | (15,088 | ) | | (22,057 | ) |
| Deferred liabilities—other | (21,499 | ) | | (4,667 | ) | | (56,865 | ) |
| Pension and other post-retirement benefits | (14,521 | ) | | (9,806 | ) | | (10,251 | ) |
| Other—net | 893 |
| | 3,409 |
| | 2,107 |
|
| Changes in operating assets and liabilities | $ | (43,050 | ) | | $ | (141,238 | ) | | $ | (143,526 | ) |
| SUPPLEMENTAL DISCLOSURES OF CASH FLOW INFORMATION | | | | | |
| Income taxes paid (refunded)—net | $ | (2,983 | ) | | $ | — |
| | $ | (19,004 | ) |
| Interest paid | $ | 57,036 |
| | $ | 50,539 |
| | $ | 40,972 |
|
| SUPPLEMENTAL DISCLOSURES OF NON-CASH INVESTING AND FINANCING ACTIVITIES: | | | | | |
| Extinguishment of project debt financing | $ | (28,312 | ) | | $ | (27,927 | ) | | $ | — |
|
| Capital expenditure accruals included in accounts payable and other accrued liabilities | $ | 53,367 |
| | $ | 37,049 |
| | $ | 43,687 |
|
The following tables provides a reconciliation of cash, cash equivalents, and restricted cash reported within WGL’s consolidated balance sheets and Washington Gas’ balance sheets that sums to the total of such amounts shown on the statements of cash flows.
|
| | | |
| WGL HOLDINGS INC. |
| (in thousands) | |
| Cash and cash equivalents | $ | 57,969 |
|
| Restricted cash included in Current Assets-Other | $ | 20,207 |
|
| Restricted cash included in Deferred Charges and Other Assets-Other | $ | 44,775 |
|
| Total cash, cash equivalents and restricted cash shown in the statement of cash flows | $ | 122,951 |
|
|
| | | |
| WASHINGTON GAS |
| (in thousands) | |
| Cash and cash equivalents | $ | 1 |
|
| Restricted cash included in Current assets-Other | $ | 20,207 |
|
| Restricted cash included in Deferred Charges and Other Assets-Other | $ | 44,775 |
|
| Total cash, cash equivalents and restricted cash shown in the statement of cash flows | $ | 64,983 |
|
WGL Holdings, Inc
Washington Gas Light Company
Part II
Item 8. Financial Statements and Supplementary Data (continued)
Notes to Consolidated Financial Statements
Restricted cash included in "Current assets—Other" and "Deferred charges and other assets—Other" on the balance sheets represents amount of investment in rabbi trusts to fund deferred compensation, pension and other post-retirement benefits for certain management personnel and directors. The rabbi trusts were funded pursuant to the agreement of merger with AltaGas, which was closed on July 6, 2018.AltaGas. The funds in the rabbi trusts can only be used to pay for plan participant benefits and other plan expenses such as investment fees or trustee fees. The funds are currently invested in money market funds.funds at end of December 31, 2019 and 2018, and September 30, 2018. We did not have any restricted cash at end of September 30, 2017. Refer to Note 9-10 — Pension and Other Post-Retirement Benefit Plans for further discussion of rabbi trusts.
NOTE 19. COMPARATIVE DATA The following table presents financial information for calendar years ended December 31, 2019 and 2018 and three months ended December 31, 2018 and 2017. |
| | | | | | | | | | | | |
| | Calendar Years Ended December 31, | Three Months Ended December 31, |
| (In thousands) | 2019
| 2018 (Unaudited) | 2018
| 2017 (Unaudited) |
| OPERATING REVENUES | $ | 1,330,651 |
| $ | 1,272,694 |
| $ | 402,101 |
| $ | 377,470 |
|
| OPERATING EXPENSES | | | | |
| Utility cost of gas | 461,574 |
| 438,939 |
| 156,641 |
| 124,745 |
|
| Operation and maintenance | 404,961 |
| 564,536 |
| 102,728 |
| 82,372 |
|
| Depreciation and amortization | 142,565 |
| 136,373 |
| 34,948 |
| 33,646 |
|
| General taxes and other assessments | 149,618 |
| 146,747 |
| 38,552 |
| 39,983 |
|
| Total Operating Expenses | 1,158,718 |
| 1,286,595 |
| 332,869 |
| 280,746 |
|
| OPERATING INCOME | 171,933 |
| (13,901 | ) | 69,232 |
| 96,724 |
|
| Other income (expense) — net | 9,478 |
| (5,127 | ) | 3,494 |
| 1,029 |
|
| Interest expense | 62,567 |
| 59,237 |
| 15,706 |
| 14,973 |
|
| INCOME (LOSS) BEFORE INCOME TAXES | 118,844 |
| (78,265 | ) | 57,020 |
| 82,780 |
|
| INCOME TAX EXPENSE (BENEFIT) | 19,032 |
| (42,870 | ) | 7,847 |
| 24,854 |
|
| NET INCOME (LOSS) | $ | 99,812 |
| $ | (35,395 | ) | $ | 49,173 |
| $ | 57,926 |
|
| Loss on preferred stock extinguishment | 556 |
| — |
| — |
| — |
|
| Dividends on preferred stock | 1,169 |
| 1,320 |
| 330 |
| 330 |
|
| NET INCOME (LOSS) APPLICABLE TO COMMON STOCK | $ | 98,087 |
| $ | (36,715 | ) | $ | 48,843 |
| $ | 57,596 |
|
WGL Holdings, Inc
Washington Gas Light Company
Part II
Item 8. Financial Statements and Supplementary Data (continued)
Notes to Consolidated Financial Statements
NOTE 20. MERGER WITH ALTAGAS LTD.On January 25, 2017, WGL entered into an agreement and plan of merger (Merger Agreement) to combine with AltaGas in an all cash transaction. The merger was consummated on July 6, 2018. The Merger Agreement provided for the merger of the Merger Sub, a newly formed indirect wholly owned subsidiary of AltaGas with and into WGL, whereby WGL became an indirect wholly owned subsidiary of AltaGas. Upon consummation of the merger, each share of WGL common stock issued and outstanding immediately prior to the closing was converted automatically into the right to receive $88.25 (Merger Consideration) in cash per share, without interest, less any applicable withholding taxes and ceased to be outstanding. Shares of WGL common stock held by WGL, AltaGas, the Merger Sub or any subsidiaries were not entitled to receive the Merger Consideration. Each share of the Merger Sub's issued and outstanding common stock at the time of the consummation of the merger was converted into one share of WGL common stock for a total of 100 WGL post-Merger shares owned by Wrangler 1 LLC, an indirect wholly owned subsidiary of AltaGas (Wrangler 1). As a result of the Merger, WGL's common stock was delisted from the New York Stock Exchange.
In connection with the Merger, WGL established Wrangler SPE LLC, the SPE for the purposes of owning the common stock of Washington Gas in a bankruptcy remote entity. The SPE is a wholly owned subsidiary of WGL. Following the consummation of the merger, all of Washington Gas’ outstanding shares of common stock are now owned by the SPE. The merger had no effect on the Washington Gas preferred stock, which continues to be outstanding.
Merger Related Costs
The following table
summarizes pre-tax merger commitments, legal expense, acceleration of stock-based compensation,presents cash flows for calendar years ended December 31, 2019 and
other merger related costs (collectively referred to as merger related costs) that we recorded in connection with the Merger. For the fiscal year2018 and three months ended
September 30,December 31, 2018
both WGL and
Washington Gas recorded merger related cost of $13.5 million in "Other income (expense)—net" and $223.2 million and $186.7 million, respectively, in “Operation and maintenance” in WGL's Consolidated Statements of Income and Washington Gas' Statements of Income.2017. |
| | | |
| WGL Holdings, Inc. |
| MERGER RELATED COSTS |
| (in millions) |
| Costs Description | Amount |
Merger commitments (1) | $ | 139.6 |
|
Property plant & equipment impairment (2) | 38.0 |
|
| Finance and legal advisory costs | 29.7 |
|
| Key employee retention payments | 11.6 |
|
Acceleration of stock-based compensation(3) | 8.4 |
|
Severance costs(4) | 6.7 |
|
Other | 2.7 |
|
| Total | $ | 236.7 |
|
` |
| | | | | | | | | | | | |
| | Calendar Years Ended December 31, | Three Months Ended December 31, |
| (In thousands) | 2019
| 2018 (Unaudited) | 2018
| 2017 (Unaudited) |
| OPERATING ACTIVITIES | | | | |
| Net income (loss) | $ | 99,812 |
| $ | (35,395 | ) | $ | 49,173 |
| $ | 57,926 |
|
| ADJUSTMENTS TO RECONCILE NET INCOME TO NET CASH PROVIDED BY OPERATING ACTIVITIES | | | | |
| Depreciation and amortization | 142,565 |
| 136,373 |
| 34,948 |
| 33,646 |
|
| Amortization of: | | | | |
| Other regulatory assets and liabilities—net | 8,491 |
| 7,142 |
| 1,859 |
| 1,634 |
|
| Debt related costs | 1,501 |
| 1,561 |
| 382 |
| 401 |
|
| Deferred income taxes—net | 19,690 |
| (25,809 | ) | 8,012 |
| 7,386 |
|
| Accrued/deferred pension and other post-retirement benefit cost | (1,466 | ) | 8,399 |
| (330 | ) | 2,398 |
|
| Compensation expense related to stock-based awards | 3,626 |
| 15,902 |
| 1,353 |
| 4,518 |
|
| Provision for doubtful accounts | 17,266 |
| 22,236 |
| 5,940 |
| 3,928 |
|
| Impairment loss | 2,042 |
| 40,422 |
| 2,453 |
| — |
|
| Unrealized (gain) loss on derivative contracts | (5,429 | ) | (7,625 | ) | 4,200 |
| 1,446 |
|
| Amortization of investment tax credits | (658 | ) | (688 | ) | (165 | ) | (179 | ) |
| Other non-cash charges (credits)—net | 2,436 |
| (2,706 | ) | (453 | ) | (197 | ) |
| Changes in operating assets and liabilities | (86,547 | ) | (103,526 | ) | (201,840 | ) | (141,364 | ) |
| Net Cash Provided by (Used In) Operating Activities | 203,329 |
| 56,286 |
| (94,468 | ) | (28,457 | ) |
| FINANCING ACTIVITIES | | | | |
| Capital contributions from parent | — |
| 402,728 |
| 100,000 |
| 100,000 |
|
| Long-term debt issued | 298,482 |
| — |
| — |
| — |
|
| Long-term debt retired | (50,000 | ) | (50,000 | ) | (50,000 | ) | — |
|
| Debt issuance costs | (3,130 | ) | (130 | ) | — |
| (236 | ) |
| Long-term commercial paper issued (retired)—net | 100,000 |
| — |
| — |
| — |
|
| Notes payable issued (retired)—net | 3,483 |
| 134,001 |
| 200,999 |
| 39,000 |
|
| Project financing | — |
| 53,018 |
| — |
| — |
|
| Dividends on common stock and preferred stock | (100,736 | ) | (90,820 | ) | (24,078 | ) | (22,166 | ) |
| Payment for preferred stock extinguishment | (28,729 | ) | — |
| — |
| — |
|
| Other financing activities—net | — |
| — |
| — |
| (6,197 | ) |
| Net Cash Provided by Financing Activities | 219,370 |
| 448,797 |
| 226,921 |
| 110,401 |
|
| INVESTING ACTIVITIES | | | | |
| Capital expenditures (excluding AFUDC) | (432,974 | ) | (443,550 | ) | (126,013 | ) | (75,293 | ) |
| Insurance proceeds related to investing properties | — |
| 3,238 |
| — |
| — |
|
| Net Cash Used in Investing Activities | (432,974 | ) | (440,312 | ) | (126,013 | ) | (75,293 | ) |
| INCREASE (DECREASE) IN CASH, CASH EQUIVALENTS AND RESTRICTED CASH | (10,275 | ) | 64,771 |
| 6,440 |
| 6,651 |
|
| Cash, Cash Equivalents and Restricted Cash at Beginning of the Year | 71,423 |
| 6,652 |
| 64,983 |
| 1 |
|
| Cash, Cash Equivalents and Restricted Cash at End of the Year | $ | 61,148 |
| $ | 71,423 |
| $ | 71,423 |
| $ | 6,652 |
|
| SUPPLEMENTAL DISCLOSURES OF CASH FLOW INFORMATION | | | | |
| Income taxes paid (refunded)—net | 15,623 |
| 1,757 |
| 3,782 |
| (958 | ) |
| Interest paid | 57,922 |
| 59,041 |
| 4,982 |
| 2,977 |
|
| SUPPLEMENTAL DISCLOSURES OF NON-CASH INVESTING AND FINANCING ACTIVITIES: | | | | |
| Extinguishment of project debt financing | (15,460 | ) | (81,330 | ) | (53,018 | ) | — |
|
| Capital expenditure accruals included in accounts payable and other accrued liabilities | 26,590 |
| 33,245 |
| 33,245 |
| 25,325 |
|
(1) See the Merger Commitments table below for details of merger related commitments.
(2) Net property, plant and equipment impairment recorded in connection with an agreement not to seek recovery of certain costs incurred under the Formal Case 1027 mechanical coupling program.
(3) See Note 10-Stock-Based Compensation for further discussion of the acceleration of incentive compensation.
(4) Severance costs are related to the retirement of senior executives following the merger.
Merger Commitments
Approval of the merger across all jurisdictions was conditioned upon AltaGas and WGL agreeing to certain financial commitments including: customer bill credits, funding for low-income weatherization and energy efficiency initiatives, public safety programs, energy educational programs, gas expansion fund contributions, workplace development initiatives, charitable contributions, and other required commitments. The commitments will be funded by AltaGas within various timeframes from 30 days to 10 years after the merger close. In addition, the commitments related to Maryland are subject to a Most Favored Nation (MFN) provision that m
WGL Holdings, Inc
Washington Gas Light Company
Part II
Item 8. Financial Statements and Supplementary Data (continued)
Notes to Consolidated Financial Statements
ay change the amount or nature of the commitments. The following table listsprovides a reconciliation of cash, cash equivalents, and restricted cash reported within WGL’s consolidated balance sheets that sums to the total commitments,of such amounts shown on the amounts paid, and future expected payments asstatements of cash flows |
| | | | | | | | | |
| (In thousands) |
December 31, 2019
|
December 31, 2018
|
December 31, 2017 (Unaudited) |
| Cash and cash equivalents | $ | 17,069 |
| $ | 6,082 |
| $ | 6,652 |
|
| Restricted cash included in Current assets-Other | 19,464 |
| 20,207 |
| — |
|
| Restricted cash included in Deferred charges and other assets-Other | 24,615 |
| 45,134 |
| — |
|
| Total cash, cash equivalents and restricted cash shown in the statement of cash flows | $ | 61,148 |
| $ | 71,423 |
| $ | 6,652 |
|
NOTE 20. QUARTERLY FINANCIAL INFORMATION (Unaudited) All adjustments necessary for a fair presentation have been included in the quarterly information provided below. Due to the seasonal nature of our business, we report substantial variations in operations on a quarterly basis.
|
| | | | | | | | | | | | | | | | |
| | Quarters Ended |
| (In thousands) | | March 31 | | June 30 | | September 30(a) | | December 31 |
| 2019 | | | | | | | | |
| Operating revenues | | $ | 593,653 |
| | $ | 198,484 |
| | $ | 122,305 |
| | $ | 416,209 |
|
| Operating income (loss) | | $ | 152,580 |
| | $ | (10,138 | ) | | $ | (73,050 | ) | | 102,541 |
|
| Net income (loss) | | $ | 112,996 |
| | $ | (20,591 | ) | | $ | (65,799 | ) | | $ | 73,206 |
|
| Net income (loss) applicable to common stock | | $ | 112,666 |
| | $ | (20,921 | ) | | $ | (65,799 | ) | | $ | 72,141 |
|
| 2018 | | | | | | | | |
| Operating revenues | | $ | 532,040 |
| | $ | 199,512 |
| | $ | 139,041 |
| | $ | 402,101 |
|
| Operating income (loss) | | $ | 148,978 |
| | $ | (6,649 | ) | | $ | (225,462 | ) | | 69,232 |
|
| Net income (loss) | | $ | 108,084 |
| | $ | (11,499 | ) | | $ | (181,153 | ) | | $ | 49,173 |
|
| Net income (loss) applicable to common stock | | $ | 107,754 |
| | $ | (11,829 | ) | | $ | (181,483 | ) | | $ | 48,843 |
|
2018. |
| | | | | | | | | | | | | | | | | | | | | | | | |
| WGL Holdings, Inc. |
| MERGER COMMITMENTS |
| (in millions) | | Expected Future Payments |
| Commitment Description | Total Commitment Amount | Amount paid in FY 2018 | 2019 | 2020 | 2021 | 2022 | 2023 | 2024-2027 |
| Customer bill credits | $ | 56.8 |
| $ | 56.8 |
| $ | — |
| $ | — |
| $ | — |
| $ | — |
| $ | — |
| $ | — |
|
| Gas expansion fund contributions | 34.2 |
| — |
| 34.2 |
| — |
| | | | |
| Energy customer or education programs | 22.8 |
| 22.8 |
| — |
| — |
| — |
| — |
| — |
| — |
|
| Charitable contributions | 13.5 |
| 0.4 |
| 1.5 |
| 1.5 |
| 1.5 |
| 1.5 |
| 1.5 |
| 5.6 |
|
| Work place development initiatives | 7.4 |
| — |
| 3.7 |
| 3.7 |
| — |
| — |
| — |
| — |
|
| Low-income weatherization and energy efficiency initiatives | 4.2 |
| — |
| 2.1 |
| 2.1 |
| — |
| — |
| — |
| — |
|
| Public safety programs | 0.7 |
| — |
| 0.7 |
| — |
| — |
| — |
| — |
| — |
|
| Total merger commitments | $ | 139.6 |
| $ | 80.0 |
| $ | 42.2 |
| $ | 7.3 |
| $ | 1.5 |
| $ | 1.5 |
| $ | 1.5 |
| $ | 5.6 |
|
The following additional commitments by2018, Washington Gas will have an impact on our consolidated financial statements when the transactions are incurred in the future:
| |
1) | Hiring of three damage prevention trainers in each jurisdiction for a total of $2.4recorded $200.2 million over 5 years; |
| |
2) | Investment of $70.0 million over a 10-year period to further extend natural gas service to areas within Washington Gas's service territory, which will be incorporated into Washington Gas's ongoing capital plan; |
| |
3) | Spending $8.0 million on leak mitigation and reducing leak backlogs within 3 years after the Merger close; and |
4) Development of 15MW of either electric grid energy storage or Tier 1 renewable resources within 5 years.
In addition, there are a number of operational commitments that will have an impact on the ongoing business of Washington Gas, including reductions of leak backlogs, conducting a root cause analysismerger related to customer service, increasing supplier diversity, achieving synergy savings benefits, developing protocols for moving meters from inside to outside customers’ premises, as well as reporting and tracking related to all the commitments.
Other Merger Related Items
Pursuantcosts due to the Merger agreement, Washington Gas contributed $66.7 million that was funded by AltaGas to rabbi trusts formed to fully satisfy certain outstanding employee benefit obligations immediately prior to the Merger close. See Note 9—Pension and Other Post-Retirement Benefit Plans for further discussion of the rabbi trusts.with AltaGas.
WGL Holdings, Inc.
Washington Gas Light Company
Part II
REPORT OF INDEPENDENT REGISTERED PUBLIC ACCOUNTING FIRMReport of Independent Registered Public Accounting Firm
To the shareholderShareholder and the Board of Directors of WGL Holdings, Inc.Washington Gas Light Company
Opinion on the Financial Statements
We have audited the accompanying consolidated balance sheets of Washington Gas Light Company (the Company) as of December 31, 2019 and consolidated2018 and the related statements of capitalization of WGL Holdings, Inc. and subsidiaries ("WGL") as of September 30, 2018 and 2017, the related consolidated statements of income,operations, comprehensive income changes in, common shareholder's equity and cash flows for each of the year ended December 31, 2019 and three years in the periodmonths ended September 30,December 31, 2018, the related notes, and the schedule listed in the Index at Item 15 (collectively referred to as the “financial statements”). In our opinion, the financial statements present fairly, in all material respects, the financial position of WGL as of September 30,the Company at December 31, 2019 and 2018, and 2017, and the results of its operations and its cash flows for each of the year ended December 31, 2019 and three years in the periodmonths ended September 30,December 31, 2018, in conformity with accounting principlesU.S. generally accepted accounting principles.
Adoption of Accounting Standards Update (ASU) No. 2016-02, Leases(Topic 842)
As discussed in Note 3 to the United Statesfinancial statements, the Company changed its method of America.accounting for leases due to the adoption of ASU No. 2016-02, Leases (Topic 842), and the amendments in ASU’s 2018-01, 2018-11, and 2018-20, effective January 1, 2019.
Basis for Opinion
These financial statements are the responsibility of WGL’sthe Company's management. Our responsibility is to express an opinion on WGL’sthe Company’s financial statements based on our audits. We are a public accounting firm registered with the Public Company Accounting Oversight Board (United States) (PCAOB) and are required to be independent with respect to WGLthe Company in accordance with the U.S. federal securities laws and the applicable rules and regulations of the Securities and Exchange Commission and the PCAOB.
We conducted our audits in accordance with the standards of the PCAOB. Those standards require that we plan and perform the audit to obtain reasonable assurance about whether the financial statements are free of material misstatement, whether due to error or fraud. WGLThe Company is not required to have, nor were we engaged to perform, an audit of its internal control over financial reporting. As part of our audits we are required to obtain an understanding of internal control over financial reporting but not for the purpose of expressing an opinion on the effectiveness of the WGL’sCompany's internal control over financial reporting. Accordingly, we express no such opinion.
Our audits included performing procedures to assess the risks of material misstatement of the financial statements, whether due to error or fraud, and performing procedures that respond to those risks. Such procedures included examining, on a test basis, evidence regarding the amounts and disclosures in the financial statements. Our audits also included evaluating the accounting principles used and significant estimates made by management, as well as evaluating the overall presentation of the financial statements. We believe that our audits provide a reasonable basis for our opinion.
/s/ DeloitteErnst & ToucheYoung LLP
Mclean, Virginia
November 19, 2018
We have served as WGL'sWashington Gas Light Company’s auditor since 2002.2018.
Tysons, Virginia
February 28, 2020
WGL Holdings, Inc.
Washington Gas Light Company
Part II
REPORT OF INDEPENDENT REGISTERED PUBLIC ACCOUNTING FIRM
To the shareholder and the Board of Directors of Washington Gas Light Company
Opinion on the Financial Statements
We have audited the accompanying balance sheets and statements of capitalization of Washington Gas Light Company ("Washington Gas") as of September 30, 2018 and 2017, the related statements of income, comprehensive income, common shareholder’s equity, and cash flows for each of the threetwo years in the period ended September 30, 2018, the related notes, and the schedule listed in the Index at Item 15 (collectively referred to as the “financial statements”) of Washington Gas Light Company ("Washington Gas"). In our opinion, the financial statements present fairly, in all material respects, the financial positionresults of operations and cash flows of Washington Gas as of September 30, 2018 and 2017, and the results of its operations and its cash flows for each of the threetwo years in the period ended September 30, 2018, in conformity with accounting principles generally accepted in the United States of America.
Basis for Opinion
These financial statements are the responsibility of Washington Gas’ management. Our responsibility is to express an opinion on Washington Gas’ financial statements based on our audits. We are a public accounting firm registered with the Public Company Accounting Oversight Board (United States) (PCAOB) and are required to be independent with respect to Washington Gas in accordance with the U.S. federal securities laws and the applicable rules and regulations of the Securities and Exchange Commission and the PCAOB.
We conducted our audits in accordance with the standards of the PCAOB. Those standards require that we plan and perform the audit to obtain reasonable assurance about whether the financial statements are free of material misstatement, whether due to error or fraud. Washington Gas is not required to have, nor were we engaged to perform, an audit of its internal control over financial reporting. As part of our audits, we are required to obtain an understanding of internal control over financial reporting but not for the purpose of expressing an opinion on the effectiveness of Washington Gas’ internal control over financial reporting. Accordingly, we express no such opinion.
Our audits included performing procedures to assess the risks of material misstatement of the financial statements, whether due to error or fraud, and performing procedures that respond to those risks. Such procedures included examining, on a test basis, evidence regarding the amounts and disclosures in the financial statements. Our audits also included evaluating the accounting principles used and significant estimates made by management, as well as evaluating the overall presentation of the financial statements. We believe that our audits provide a reasonable basis for our opinion.
/s/ Deloitte & Touche LLP
Mclean,McLean, Virginia
November 19, 2018 (March 1, 2019, as to the effects of the adoption of ASU2017-07 during the three months ended December 31, 2018).
We have servedbegan serving as Washington Gas' auditor sincein 2002. In 2018 we became the predecessor auditor.
WGL Holdings, Inc.
Washington Gas Light Company
Part II
Item 8. Financial Statements and Supplementary Data (concluded)
SUPPLEMENTARY FINANCIAL INFORMATION (Unaudited)QUARTERLY FINANCIAL DATA
All adjustments necessary for a fair presentation have been included in the quarterly information provided below. Due to the seasonal nature of our business, we report substantial variations in operations on a quarterly basis.
|
| | | | | | | | | | | | | | | |
| | Quarter Ended |
| (In thousands) | December 31 | | March 31(a) | | June 30 | | September 30(b) |
Fiscal Year 2018(a)(b) | | | | | | | |
WGL Holdings, Inc. | | | | | | | |
| Operating revenues | $ | 652,440 |
| | $ | 886,451 |
| | $ | 423,465 |
| | $ | 379,409 |
|
| Operating income | $ | 116,567 |
| | $ | 194,173 |
| | $ | (3,068 | ) | | $ | (257,011 | ) |
| Net income | $ | 132,592 |
| | $ | 131,508 |
| | $ | (55,327 | ) | | $ | (187,627 | ) |
| Net income applicable to common stock | $ | 138,040 |
| | $ | 135,550 |
| | $ | (49,006 | ) | | $ | (175,241 | ) |
Washington Gas Light Company | | | | | | | |
| Operating revenues | $ | 377,470 |
| | $ | 523,040 |
| | $ | 199,512 |
| | $ | 139,041 |
|
| Operating income (loss) | $ | 99,545 |
| | $ | 151,799 |
| | $ | (3,828 | ) | | $ | (222,641 | ) |
| Net income (loss) | $ | 57,926 |
| | $ | 108,084 |
| | $ | (11,499 | ) | | $ | (181,153 | ) |
| Net income (loss) applicable to common stock | $ | 57,596 |
| | $ | 107,754 |
| | $ | (11,829 | ) | | $ | (181,483 | ) |
Fiscal Year 2017(c) | | | | | | | |
| WGL Holdings, Inc. | | | | | | | |
| Operating revenues | $ | 609,487 |
| | $ | 841,750 |
| | $ | 474,364 |
| | $ | 429,123 |
|
| Operating income (loss) | $ | 104,713 |
| | $ | 197,597 |
| | $ | 22,855 |
| | $ | 15,848 |
|
| Net income (loss) | $ | 55,767 |
| | $ | 117,955 |
| | $ | 4,036 |
| | $ | 105 |
|
| Net income (loss) applicable to common stock | $ | 57,972 |
| | $ | 123,064 |
| | $ | 8,265 |
| | $ | 3,319 |
|
| Washington Gas Light Company | | | | | | | |
| Operating revenues | $ | 333,986 |
| | $ | 475,021 |
| | $ | 203,186 |
| | $ | 154,775 |
|
| Operating income (loss) | $ | 103,008 |
| | $ | 165,858 |
| | $ | 11,464 |
| | $ | (12,018 | ) |
| Net income (loss) | $ | 55,461 |
| | $ | 93,610 |
| | $ | (1,671 | ) | | $ | (15,608 | ) |
| Net income (loss) applicable to common stock | $ | 55,131 |
| | $ | 93,280 |
| | $ | (2,001 | ) | | $ | (15,938 | ) |
(a)During the second quarter of fiscal year 2018, WGL recorded an other than temporary impairment charge of $34.0 million related to its investment in Constitution Pipeline.
(b)During the fourth quarter of fiscal year 2018, WGL recorded $234.0 million expenses of merger related cost due to the Merger with AltaGas.
(c)During the fiscal year ended September 30, 2017, there were no substantial variations in operations.
WGL Holdings, Inc.
Washington Gas Light Company
Part II
ITEM 9. CHANGES IN AND DISAGREEMENTS WITH ACCOUNTANTS ON ACCOUNTING AND FINANCIAL DISCLOSURE
None.
ITEM 9A. CONTROLS AND PROCEDURES—WGL Holdings, Inc.PROCEDURES
EVALUATION OF DISCLOSURE CONTROLS AND PROCEDURES
Senior management, including the President and Chief Executive Officer and the Executive Vice President and Chief Financial Officer of WGL, evaluated the effectiveness of WGL’s disclosure controls and procedures as of September 30, 2018. Based on this evaluation, the President and Chief Executive Officer and the Executive Vice President and Chief Financial Officer have concluded that WGL’s disclosure controls and procedures were effective as of September 30, 2018.
MANAGEMENT’S REPORT ON INTERNAL CONTROL OVER FINANCIAL REPORTING
Management of WGL is responsible for establishing and maintaining adequate internal control over financial reporting as defined in Rules 13a-15(f) and 15d-15(f) under the Securities Exchange Act of 1934. WGL’s internal control over financial reporting is designed to provide reasonable assurance regarding the reliability of financial reporting and the preparation of financial statements for external purposes in accordance with generally accepted accounting principles in the United States of America.
Because of the inherent limitations of internal control over financial reporting, including the possibility of human error and the circumvention or overriding of controls, material misstatements may not be prevented or detected on a timely basis. Accordingly, even internal controls determined to be effective can provide only reasonable assurance with respect to financial statement preparation and presentation. Furthermore, projections of any evaluation of the effectiveness to future periods are subject to the risk that such controls may become inadequate due to changes in conditions, or that the degree of compliance with the policies or procedures may deteriorate.
Management has assessed the effectiveness of WGL’s internal control over financial reporting as of September 30, 2018 based upon the criteria set forth in the Internal Control—Integrated Framework (2013) issued by the Committee of Sponsoring Organizations of the Treadway Commission. Based on its assessment, management has concluded that WGL maintained effective internal control over financial reporting as of September 30, 2018.
This annual report on Form 10-K does not include an attestation report of WGL’s registered public accounting firm regarding internal control over financial reporting pursuant to rules of the Securities and Exchange Commission that permit WGL to provide only this management’s report in this annual report on Form 10-K.
CHANGES IN INTERNAL CONTROL OVER FINANCIAL REPORTING
There have been no changes in the internal control over financial reporting of WGL during the quarter ended September 30, 2018 that have materially affected, or are reasonably likely to materially affect, the internal control over financial reporting of WGL.
WGL Holdings, Inc.
Washington Gas Light Company
Part II
ITEM 9A. CONTROLS AND PROCEDURES—Washington Gas Light Company
EVALUATION OF DISCLOSURE CONTROLS AND PROCEDURESEvaluation Of Disclosure Controls And Procedures
Senior management, including the President and Chief Executive Officer and the Executive Vice President and Chief Financial Officer of Washington Gas, evaluated the effectiveness of Washington Gas’ disclosure controls and procedures as of September 30, 2018.December 31, 2019. Based on this evaluation, the President and Chief Executive Officer and the Executive Vice President and Chief Financial Officer have concluded that Washington Gas’ disclosure controls and procedures were effective as of September 30, 2018.December 31, 2019.
MANAGEMENT’S REPORT ON INTERNAL CONTROL OVER FINANCIAL REPORTINGManagement's Report On Internal Control Over Financial Reporting
Management of Washington Gas is responsible for establishing and maintaining adequate internal control over financial reporting as defined in Rules 13a-15(f) and 15d-15(f) under the Securities Exchange Act of 1934. Washington Gas’ internal control over financial reporting is designed to provide reasonable assurance regarding the reliability of financial reporting and the preparation of financial statements for external purposes in accordance with generally accepted accounting principles in the United States of America.
Because of the inherent limitations of internal control over financial reporting, including the possibility of human error and the circumvention or overriding of controls, material misstatements may not be prevented or detected on a timely basis. Accordingly, even internal controls determined to be effective can provide only reasonable assurance with respect to financial statement preparation and presentation. Furthermore, projections of any evaluation of the effectiveness to future periods are subject to the risk that such controls may become inadequate due to changes in conditions, or that the degree of compliance with the policies or procedures may deteriorate.
Management has assessed the effectiveness of Washington Gas’ internal control over financial reporting as of September 30, 2018December 31, 2019 based upon the criteria set forth in the Internal Control—Integrated Framework (2013) issued by the Committee of Sponsoring Organizations of the Treadway Commission. Based on its assessment, management has concluded that Washington Gas maintained effective internal control over financial reporting as of September 30, 2018.December 31, 2019.
This annual report on Form 10-K does not include an attestation report of Washington Gas’ registered public accounting firm regarding internal control over financial reporting pursuant to rules of the Securities and Exchange Commission that permit Washington Gas to provide only this management’s report in this annual report on Form 10-K.SEC.
CHANGES IN INTERNAL CONTROL OVER FINANCIAL REPORTINGChanges In Internal Control Over Financial Reporting
There have been no changes in the internal control over financial reporting of Washington Gas during the quarter ended September 30, 2018December 31, 2019 that have materially affected, or are reasonably likely to materially affect, the internal control over financial reporting of Washington Gas.
WGL Holdings, Inc.
Washington Gas Light Company
Part II
ITEM 9B. OTHER INFORMATION
Item 5.02. Departure of Directors or Certain Officers; Election of Directors; Appointment of Certain Officers; Compensatory Arrangements of Certain Officers.
On November 16, 2018, Washington Gas entered into an amendment of the letter agreement entered into with Vincent L. Ammann, Jr., its Executive Vice President and Chief Financial Officer, to provide that, upon Mr. Ammann’s retirement, vesting of long-term incentive awards granted to Mr. Ammann in October 2017 will accelerate in full and be paid out in accordance with the terms of the governing award agreements. The amendment is included as Exhibit 10.62 to this Annual Report on Form 10-K.None.
WGL Holdings, Inc.
Washington Gas Light Company
Part III
ITEM 10. DIRECTORS, EXECUTIVE OFFICERS AND CORPORATE GOVERNANCE OF THE REGISTRANTSREGISTRANT Directors of Washington Gas Light Company

Adrian P. ChapmanAge: 61
Washington Gas Director Since: July 2018
Board Committees: N/A
Adrian P. Chapman is Presidentmeets the conditions set forth in General Instruction I(1) of Form 10-K and Chief Executive Officerhas omitted the information called for by this Item pursuant to General Instruction I(2) of each of WGL Holdings, Inc. and Washington Gas.
Bringing more than 36 years of leadership experience in the energy industry, Mr. Chapman has driven operational success and sustained growth in a variety of management and executive roles at the company throughout his career with one of the nation’s premier energy companies. As President and CEO of Washington Gas, he is responsible for overseeing all functions and activities of the regulated natural gas utility such as operations, customer service, engineering, construction, field operations, safety, rates, gas acquisition, information technology, and human resources.
Mr. Chapman also serves in leadership roles with other AltaGas energy entities, including as Executive Vice President at AltaGas Services (U.S.) Inc., President and CEO of AltaGas Utility Holdings (U.S.) Inc., and, as noted above, President and CEO of WGL Holdings, Inc.
Prior to being appointed to these executive positions, Mr. Chapman served as President and Chief Operating Officer of WGL Holdings, Inc. and Washington Gas since October 1, 2009. Before his term as COO, he held a range of executive management roles and led several teams that contributed to the company’s development, including Vice President of Operations, Regulatory Affairs and Energy Acquisition, Manager of Interruptible Customer Sales, Manager of Economic Analysis, and Director of Regulatory Affairs.
Mr. Chapman is the incoming Chair of the Board of Directors of the Southern Gas Association, is a member of the Leadership Council of the American Gas Association and past chair of the AGA Rate and Strategic Issues Committee. He is also a member of the Board of Directors of the Virginia Early Childhood Foundation and the Community Foundation of Northern Virginia. He is a past member of the Governor of Maryland’s Workforce Investment Board and past Chairman of the Board of LEAD Virginia and a graduate of the LEAD Virginia Class of 2006, a statewide leadership program. Mr. Chapman is also the Goodwill of Greater Washington Board Chair and past Chairman of the Board of Directors of the Fairfax County Virginia Chamber of Commerce.
Mr. Chapman has been a director of Washington Gas since July 2018. He received his Bachelor of Arts degree in Economics from the College of William and Mary in Virginia and his Master of Arts degree in Economics from George Mason University.
Particular experience, attributes or skills that qualify candidate for Board membership:
|
| |
| Leadership Experience
With over 36 years of energy industry experience at several levels of executive and senior management, Mr. Chapman is well positioned to lead our management team and provide essential insight and guidance to the Board on the day-to-day operations of the Company. Mr. Chapman’s service on the boards of local non-profit and charitable organizations provides a crucial connection between the Company and the communities we serve.
|
| Risk Management/Assessment
Mr. Chapman’s financial background in the energy industry contributes to his skills in risk assessment, mitigation, compliance, and internal controls.
.
|
| Strategic Planning
Through Mr. Chapman’s experience in executive management and his considerable involvement in civic, community and charitable activities with a focus in the Northern Virginia area, Mr. Chapman has gained significant strategic planning, operational and corporate governance insights.
|
| Industry Experience
Mr. Chapman’s extensive energy experience and comprehensive understanding of many aspects of the natural gas industry provides the Board with invaluable insight.
|
WGL Holdings, Inc.
Washington Gas Light Company
Part III

James W. Dyke, Jr.Age: 71
Director Since: September 2003
Board Committees: Governance & Environment, Health and Safety Committee (Chair), Human Resources Committee
James W. Dyke, Jr.retired on March 31, 2013 after 20 years as a partner in the Virginia law firm of McGuire Woods LLP, where he specialized in corporate, education, voting rights, government relations and municipal law. On April 8, 2013, he became a Senior Adviser to McGuire Woods Consulting LLC. In addition to his legal career, Mr. Dyke has extensive professional experience in government and public relations. Among other appointments, he served as Secretary of Education for the Commonwealth of Virginia from 1990 to 1993 and as Domestic Policy Adviser to former Vice President Walter Mondale. Mr. Dyke has assumed leadership positions in several business and community organizations, including serving as former Chairman of the Fairfax County, Virginia Chamber of Commerce, the Northern Virginia Business Roundtable and the Emerging Business Forum. During 2010, Mr. Dyke was also Chair of the Greater Washington Board of Trade and he is a former member of the board of directors of the Washington Metropolitan Area Transit Authority (WMATA) and the Commonwealth Transportation Board (CTB).
Mr. Dyke has been a director of Washington Gas since September 2003. Mr. Dyke has B.A. and J.D. degrees from Howard University. In addition, he holds honorary degrees from St. Paul’s College, Virginia State University, the University of Richmond, Randolph-Macon College and the Northern Virginia Community College.
Particular experience, attributes or skills that qualify candidate for Board membership:
|
| |
| Leadership Experience
Mr. Dyke has over 35 years of legal experience and significant leadership positions and deep-rooted affiliations with a diverse array of business and philanthropic organizations in the Washington, DC metropolitan area.
|
| Risk Management/Assessment
Mr. Dyke’s legal expertise contributes to his skills in the areas of risk management, compliance, internal controls, legislative and administrative issues and general corporate transactions.
|
| Government Experience
Mr. Dyke has significant governmental experience nationally and in the Commonwealth of Virginia that enable him to bring invaluable insight to the Board.
|
| Strategic Planning
Mr. Dyke lives and works in WGL’s operating territory and has held leadership positions with several local non-profit organizations and, as a result, has significant community ties within the region. In addition, through his extensive involvement in civic, community and charitable activities, Mr. Dyke has gained additional strategic planning and corporate governance insights.
|

Linda R. GoodenAge: 65
Director Since: April 2013
Board Committees: Human Resources Committee (Chair), Audit Committee
Other Public Company Boards: Automatic Data Processing, Inc.; General Motors Co.; The Home Depot, Inc.
Linda R. Goodenretired in 2013 as Executive Vice President of Lockheed Martin Corp.’s Information Systems & Global Solutions, a $9 billion business with 30,000 employees that provides integrated information technology solutions, systems and services globally to civil, defense, intelligence and other government customers, after more than 34 years with the company. Ms. Gooden was responsible for establishing and managing the first major contractor cyber center in Maryland. She led the development of cyber solutions for federal defense, intelligence, and commercial customers.
Ms. Gooden has been inducted into the prestigious Career Communications Hall of Fame. She was named one of Fortune’s 50 Most Powerful Women in Business for three consecutive years and one of the 100 Most Powerful Executives in Corporate America by Black Enterprise magazine in 2009. In 2010, Ms. Gooden was appointed by U.S. President Barack Obama to the National Security Telecommunications Advisory Committee.
WGL Holdings, Inc.
Washington Gas Light Company
Part III
Ms. Gooden serves on the boards of: the American Heart Association; the Armed Forces Communications and Electronics Association International; TechAmerica; the University Systems of Maryland Board of Regents; Automatic Data Processing, Inc.; General Motors Co.; and The Home Depot, Inc.
Ms. Gooden has been a director of Washington Gas since April 2013. Ms. Gooden has a B.A. degree in Computer Science from Youngstown State and a B.A. degree in Business Administration from the University of Maryland. She also has an M.B.A. degree from the University of Maryland.
Particular experience, attributes or skills that qualify candidate for Board membership:
|
| |
| Leadership Experience
Ms. Gooden’s experience as a senior executive officer of a Fortune 100 company demonstrates her leadership capability and general business acumen.
.
|
| Risk Management/Assessment
In addition to her deep understanding of operations and strategy, Ms. Gooden has sophisticated risk management, cyber-security and information technology experience that is extremely valuable to the decision-making processes of the Board.
|
| Government Experience
Ms. Gooden has experience as a presidential appointee to the National Security Telecommunications Advisory Committee.
|
| Strategic Planning
Ms. Gooden provides the Board with extensive experience in operations and strategic planning. Ms. Gooden’s experience also demonstrates her extensive knowledge of governance and complex financial issues faced by public companies.
|
| High Level Financial Literacy
Ms. Gooden provides the Board with extensive experience in corporate finance.
|

Phillip R. KnollAge: 64
Director Since: July 2018
Board Committees: N/A
Phillip R. Knoll is currently acting as interim co-Chief Executive Officer of AltaGas. Mr. Knoll is a Professional Engineer with over 35 years of varied experience in the energy sector, primarily related to energy infrastructure businesses, including deep midstream, pipeline and utility experience. Most recently, he has provided consulting services through Knoll Energy Inc. Prior thereto, his senior executive leadership roles have included CEO of Corridor Resources Inc. (2010 to 2014), Group Vice President, Duke Energy Gas Transmission, Chair, Management Committee and President for Maritimes & Northeast Pipeline, as well as senior roles at Westcoast Energy Inc., TransCanada Pipelines Limited and Alberta Natural Gas Company Ltd.
Mr. Knoll currently serves as a director and a member of the Audit Committee of AltaGas, a director of Heritage Gas Limited (an AltaGas company) and a director of Corridor Resources Ltd. Mr. Knoll also previously served as a director for Bankers Petroleum Ltd. from 2008 to 2015.
Mr. Knoll has been a director of Washington Gas since July 2018. Mr. Knoll holds a Bachelor of Applied Science from the Technical University of Nova Scotia in Chemical Engineering.
WGL Holdings, Inc.
Washington Gas Light Company
Part III
Particular experience, attributes or skills that qualify candidate for Board membership: |
| |
| Leadership Experience
Mr. Knoll brings over three decades of experience in the energy sector, having served as President, Chief Executive Officer and other senior executive positions at several energy companies, as well as a director of AltaGas and one of its subsidiaries and other oil and gas companies.
|
| Risk Management/Assessment
Mr. Knoll’s engineering and technical background in the energy infrastructure business contributes to his skills in risk assessment, mitigation, compliance, and internal controls.
|
| Strategic Planning
Mr. Knoll’s leadership experience in key roles throughout his career has allowed him to gain strategic planning, operational and corporate governance insights, making him an important adviser to the Board and the Company.
|
| Industry Experience
Mr. Knoll brings significant business and operational expertise in the energy sector. His extensive energy experience and comprehensive knowledge of many aspects of the industry provides the Board with an indispensable perspective
|

John E. LoweAge: 57
Director Since: July 2018
Board Committees: Governance & Environment, Health and Safety Committee
John E. Lowe is Executive Vice President of AltaGas and is primarily responsible for its strategy, government and regulatory affairs, and First Nations relationships. Mr. Lowe began his employment at AltaGas in 2011, as President of AltaGas Utility Group Inc., with accountability for the utility businesses, including change of control approvals, in Canada and the United States. In 2013, he was appointed Executive Vice President responsible for corporate development, acquisitions, joint ventures, and the development of clean energy projects. Before joining AltaGas, Mr. Lowe was a partner with the law firm of Burnet, Duckworth and Palmer LLP.
Mr. Lowe has been a director of Washington Gas since July 2018. Mr. Lowe received his Bachelor of Laws from Dalhousie University and a Bachelor of Arts from the University of Alberta. He is a member of the Law Society of Alberta.
Particular experience, attributes or skills that qualify candidate for Board membership:
|
| |
| Leadership Experience
Mr. Lowe brings many years of senior management experience through serving in different capacities at AltaGas, as well as his years as a partner at a large law firm.
|
| Risk Management/Assessment
Mr. Lowe’s legal expertise and extensive experience gained during private practice contribute to his skills in the areas of risk management, compliance, internal controls, legislative and administrative issues and general corporate transactions.
|
| Strategic Planning
Mr. Lowe provides the Board with extensive experience in operations and strategic planning, particularly in the government and regulatory environment.
|
| Industry Experience
Mr. Lowe brings significant business expertise in the energy sector.
|
WGL Holdings, Inc.
Washington Gas Light Company
Part III

Dale S. RosenthalAge: 62
Director Since: October 2014
Board Committees: Audit Committee (Chair)
Dale S. Rosenthalwas Division President of Clark Financial Services Group until the end of 2017, where she set strategy for Clark’s entry into the alternative energy space, leveraging Clark Construction’s core turnkey construction competence into alternative energy development, finance, and management. She was Clark’s Chief Financial Officer for eight years, leading all of the financial functions of Clark, a multi-billion dollar company. She served on the board of directors of the Strathmore Foundation for the Performing Arts and the Greater Washington Board of Trade. She is a member of the Cornell University Board of Trustees.
Ms. Rosenthal has been a director of Washington Gas since October 2014. She has a J.D. and M.B.A. from Harvard University and a B.A. in Economics from Cornell University.
Particular experience, attributes or skills that qualify candidate for Board membership:
|
| |
| Leadership Experience
Ms. Rosenthal brings many years of senior management and new business development experience in both the private and non-profit sectors to the Board.
|
| Risk Management/Assessment
Ms. Rosenthal’s financial and legal background in the construction industry contributes to her skills in risk assessment, mitigation, compliance, and internal controls.
|
| Strategic Planning
Ms. Rosenthal’s formal business training, extensive experience in business development and experience as a strategist in the alternative energy sector provide her with significant strategic planning skills.
|
| Industry Experience
Ms. Rosenthal brings significant business expertise in the alternative energy sector.
|
| High Level Financial Literacy
Ms. Rosenthal has managed financial budgeting and reporting in corporate and non-profit organizations.
|

John (Jack) F. Stark, Chairman of the BoardAge: 67
Director Since: July 2018
Board Committees: Governance & Environment, Health and Safety Committee, Audit Committee
Other Public Company Boards: TC Pipelines GP, Inc.
Jack F. Stark served as Chief Financial Officer of Imergy Power Systems, an energy storage systems company, from December 2013 to July 2016.1 He was the CFO of BrightSource Energy Inc., a provider of technology for use in large-scale solar thermal power plants, from May 2007 to November 2013. Prior to 2007, he held the following positions: CFO of Silicon Valley Bancshares Financial Group; Vice-President of Business Operations and Technology at Itron Inc.; Senior Vice-President and CFO at Silicon Energy Corporation and Senior Vice-President and CFO of GATX Capital. Mr. Stark also held senior management roles at PG&E Corporation for over 20 years where he was involved with financial activities, energy risk management, contract and regulatory negotiations and gas supply operations.
Mr. Stark also serves on the board of directors of AltaGas Services (U.S.) Inc., a wholly owned subsidiary of AltaGas Ltd., and AltaGas Utility Holdings (U.S.) Inc., a wholly owned subsidiary of AltaGas Services (U.S.) Inc. Mr. Stark is on the board of directors of TC Pipelines GP, Inc., a subsidiary of TransCanada Corporation, as well as on the board of directors of Greenlots, Inc., a supplier of technology for electric vehicle charging. From November 2015 to October 2017, he served on the board of directors of TerraForm Power, Inc. and TerraForm Global, Inc.
Mr. Stark has been a director of Washington Gas since July 2018. Mr. Stark earned a Bachelor of Arts in Economics and Masters in Economics from the University of California, Santa Barbara. He also holds an M.B.A. in Finance from the University of California, Berkeley.
WGL Holdings, Inc.
Washington Gas Light Company
Part III
Particular experience, attributes or skills that qualify candidate for Board membership:
|
| |
| Leadership Experience
Mr. Stark brings over three decades of experience in the finance and energy industries, having served as chief financial officer and a senior executive at several energy and gas companies.
|
| Industry Experience
Mr. Stark brings significant business expertise in the finance and energy sectors.
|
| Risk Management/Assessment
Mr. Stark’s financial and business background in the energy industry and his significant leadership experience contribute to his skills in risk assessment, mitigation, compliance, and internal controls, making him an important adviser to the Board and the Company.
|
| Strategic Planning
Mr. Stark serves a key leadership role on the Board and provides the Board with extensive experience in operations and strategic planning. With his financial background and experience, Mr. Stark demonstrates his extensive knowledge of governance and complex financial issues faced by public companies.
|
| High Level Financial Literacy
Mr. Stark has a significant level of financial literacy, having served as chief financial officer of several companies.
|
(1) Imergy Power Systems entered into insolvency proceedings in 2016.
Directors of WGL Holdings, Inc.

Vincent L. Ammann, Jr.Age: 59
Director Since: July 2018
Board Committees: N/A
Vincent L. Ammann, Jr., is Executive Vice President and Chief Financial Officer for WGL Holdings, Inc. and Washington Gas. He is responsible for the administration and supervision of all financial functions including accounting, taxes, investor relations, risk management and treasury management.
He began his career in the Detroit office of Deloitte Haskins & Sells (currently, Deloitte & Touche). He was later assigned to the firm's Washington, D.C.-based Public Utilities Services Group which provided research and consulting services to industry clients.
Since leaving Deloitte in 1990, Mr. Ammann has held several of key leadership positions with public utilities. In addition to serving as Vice President, Accounting, for Connecticut Energy Corp., the parent company for Southern Connecticut Gas Co., Mr. Ammann led several of administrative departments at the utility and a non-regulated technology affiliate. After Energy East acquired Connecticut Energy and a neighboring gas utility company, Connecticut Natural Gas Corp., he was named Senior Vice President, Finance and Administration for both utilities.
Mr. Ammann joined Washington Gas in 2004 as Assistant to the Chief Financial Officer and was elected to the office of Vice President in 2005. He was elected Vice President and Chief Financial Officer in 2006. He is a member of the American Institute of Certified Public Accountants and is Chairman of the American Gas Association Finance Committee.
Mr. Ammann has been a director of WGL since July 2018. He holds a B.A. in Business Administration from the University of Michigan and an M.B.A. from the University of Connecticut.
WGL Holdings, Inc.
Washington Gas Light Company
Part III
Particular experience, attributes or skills that qualify candidate for Board membership:
|
| |
| Leadership Experience
Mr. Ammann brings many years of senior management experience through serving in key leadership roles at various utility companies.
|
| Risk Management/Assessment
Mr. Ammann's many years of experience as a chief financial officer have provided him with extensive experience in risk assessment, mitigation, compliance, and internal controls.
|
| Industry Experience
Having spent most of his career in the public utilities space Mr. Ammann brings significant business expertise in the energy sector to bear in his service on the Board.
|
| High Level Financial Literacy
Mr. Ammann has a significant level of financial literacy, having served as chief financial officer of several companies.
|

Nancy C. FloydAge: 62
Director Since: June 2011
Board Committees: Audit Committee (Chair)
Nancy C. Floydis the founder and managing director of Nth Power, a San Francisco-based venture capital firm focused on advanced energy technologies, energy efficiency and sustainability. Nth Power has invested $420 million in 56 companies. Ms. Floyd has served on the boards of the American Council on Renewable Energy and the Center for Resource Solutions. She is an active member of Environmental Entrepreneurs (E2), a national community of individual business leaders who advocate sound environmental policy while building economic prosperity. Prior to founding Nth Power, Ms. Floyd launched two high-growth energy and telecommunications companies: NFC Energy Corporation in 1982, an early wind development company, and PacTel Spectrum Services in 1985, both of which were successfully sold. She has also worked on energy and telecommunications issues for the chairman of the Vermont Public Service Board.
Ms. Floyd has been a director of WGL since June 2011. Ms. Floyd has a B.A. degree in Government from Franklin and Marshall College and an M.A. degree in Political Science from the Rutgers University Eagleton Institute of Politics.
Particular experience, attributes or skills that qualify candidate for Board membership:
|
| |
| Leadership Experience
Ms. Floyd brings many years of key senior management experience to the Board.
|
| Risk Management/Assessment
Ms. Floyd’s business experience has given her significant risk management experience that provides the Board with a valuable perspective.
|
| Government Experience
As a result of her past work with the Vermont Public Service Board, Ms. Floyd can provide important insight with respect to regulatory and policy matters relevant to public utilities, which enhances the Board’s overall knowledge and experience.
|
| Strategic Planning
Ms. Floyd’s experience as a business founder and manager demonstrates significant strategic planning skills.
|
| Industry Experience
Ms. Floyd brings a deep understanding of energy efficiency and renewable energy applications. Her comprehensive knowledge of many aspects of the energy industry provides the Board with a valuable perspective.
|
WGL Holdings, Inc.
Washington Gas Light Company
Part III

Terry D. McCallisterAge: 62
Director Since: October 2009
Board Committees: Audit
Terry D. McCallister served as Chairman of the Board and Chief Executive Officer of WGL and of Washington Gas Light Company from October 2009 to July 2018. Prior to this, he served as President and Chief Operating Officer of WGL and Washington Gas, joining Washington Gas in 2000 as Vice President of Operations. He has also held various leadership positions with Southern Natural Gas and Atlantic Richfield Company.
Mr. McCallister served on the Board of Directors of the American Gas Association and the Southern Gas Association and was Chairman of the Board of Directors of the Gas Technology Institute for 10 years. Mr. McCallister has served on the National Petroleum Council, and on the boards of several business and community organizations, including, among others, the Greater Washington Board of Trade, the Federal City Council, the Alliance to Save Energy, the Smithsonian National Zoo, the National Symphony Orchestra and the INOVA Health System Foundation.
In addition to his service on the WGL Board, Mr. McCallister also serves on the Boards of Directors of AltaGas, AltaGas Services (U.S.) Inc. and AltaGas Utility Holdings (U.S.) Inc.
Mr. McCallister has a B.S. in Engineering Management from the University of Missouri-Rolla and is a graduate of the University of Virginia's Darden School of Business Executive Program.
Particular experience, attributes or skills that qualify candidate for Board membership:
|
| |
| Leadership Experience
With nearly 40 years of energy industry experience at several levels of management, Mr. McCallister serves in a key leadership role on the Board.
|
| Strategic Planning
Given his recent tenure as Chief Executive Officer, Mr. McCallister provides the Board with in-depth knowledge of each area of our business and the energy industry generally, which is critical to shaping the company's strategy going forward.
.
|
| Industry Experience
Mr. McCallister’s extensive energy experience and comprehensive understanding of many aspects of the natural gas industry provides the Board with crucial insight.
|
| High Level Financial Literacy
Mr. McCallister's role as chief executive officer of a public company with supervisory responsibility for the chief financial officer has provided him with extensive insights with respect to corporate financial matters.
|
Executive Officers of WGL and Washington Gas
Information related to the Executive Officers of each of WGL and Washington Gas is included in Part I of this Form 10-K.
Section 16(a) Beneficial Ownership Reporting Compliance
Section 16(a) of the Exchange Act requires our executive officers and directors to file reports of securities ownership and changes in such ownership with the SEC. Based on our records and information, we believe that all persons required to file such forms have done so during FY 2018.
Code of Conduct
The Companies’ have adopted a code of conduct that applies to each of the CEO, CFO and CAO. The Companies are also subject to the AltaGas Code of Business Ethics. The code of conduct and the Code of Business Ethics are available on each of WGL and Washington Gas’ websites at www.wglholdings.com and www.washingtongas.com, under “Corporate Governance” and “Corporate Information”/“Governance,” respectively. The code of conduct and Code of Business Ethics are also available in print to any person, without charge, upon written request to Corporate Secretary, WGL Holdings, Inc./Washington Gas, 1000 Maine Ave., SW, Washington, DC 20024.
WGL Holdings, Inc.
Washington Gas Light Company
Part III
Shareholder Recommendations
There have been no material changes to the procedures by which security holders may recommend nominees to the Washington Gas Board of Directors. The Governance & Environment, Health & Safety Committee will consider director nominees recommended by shareholders. Notice of such recommendation should be sent in writing to the Chairman of the Governance Committee, c/o the Secretary of Washington Gas, 1000 Maine Ave., SW; Washington DC 20024. The recommendation must identify the writer as a shareholder of Washington Gas and provide sufficient detail for the Governance & Environment, Health and Safety Committee to consider the recommended individual’s qualifications. The Governance & Environment, Health and Safety Committee will evaluate the qualifications of candidates recommended by shareholders using the same criteria as used for other Board candidates. The recommendation must be timely and include all information specified in our bylaws.
Audit Committees
Each Registrant has a separately-designated standing Audit Committee established in accordance with Section 3(a)(58)(A) of the Exchange Act. The Audit Committee members of WGL are: Nancy C. Floyd (Chair) and Terry D. McCallister. The Audit Committee members of Washington Gas are: Dale S. Rosenthal (Chair), Linda R. Gooden and Jack F. Stark. Members of each of the Audit Committees are independent under the rules of the Securities and Exchange Commission (the “SEC”) and the NYSE Listed Company Manual. The Board has determined that each member of the Audit Committee meets the qualifications of an “audit committee financial expert,” as that term is defined by rules of the SEC.
ITEM 11. EXECUTIVE COMPENSATION
HR Committee Interlocks and Insider Participation
The HR Committee of Washington Gas currently is composedmeets the conditions set forth in General Instruction I(1) of two independent, non-employee directors. Prior to completion ofForm 10-K and has omitted the Merger, the HR Committee of Washington Gas was composed of four independent, non-employee directors. During FY2018, no current or former member of the Washington Gas HR Committee was an officer or employee of WGL or any of its subsidiaries. No former or current member of the Washington Gas Board or the Washington Gas HR Committee has served, at any time since October 1, 2017, as an executive officer of any entity that at such time had one or more of WGL’s executive officers serving as a member of that entity’s board of directors or compensation committee.
Prior to completion of the Merger, the WGL HR Committee was composed of four independent, non-employee directors. Following the Merger, the WGL HR Committee was dissolved and compensation decisions, if any, are now handledinformation called for by the WGL Board, which is composed of one independent, non-employee director. Mr. Ammann, who became a WGL director upon completion of the Merger, currently serves as Executive Vice President and Chief Financial Officer of WGL. Mr. McCallister continued to serve as a director of WGL following his retirement as Chief Executive Officer of WGL in connection with the Merger. Mr. Ammann also serves as Executive Vice President and Chief Financial Officer of Washington Gas and a member of the Board of Directors of WGL, while Mr. Chapman, who serves as President and Chief Executive Officer of WGL, serves as a director of Washington Gas. Other than compensation received for their executive roles, Messrs. Chapman and Ammann have no transactions reportablethis Item pursuant to Item 404General Instruction I(2) of Regulation S-K.
WGL Holdings, Inc.
Washington Gas Light Company
Part III
HUMAN RESOURCES COMMITTEE REPORT OF WASHINGTON GAS*
The following Compensation Discussion and Analysis section has been prepared by the management of WGL. WGL is responsible for the Compensation Discussion and Analysis and for the disclosure controls relating to executive compensation. The Compensation Discussion and Analysis is not a report or disclosure of the HR Committee.
The HR Committee has reviewed and discussed with management the Compensation Discussion and Analysis section of this Form 10-K. Based upon this review and its discussions, the HR Committee recommended to the Board that the following Compensation Discussion and Analysis section be included in this Form 10-K.
HUMAN RESOURCES COMMITTEE
Linda R. Gooden (Chair)
BOARD OF DIRECTORS REPORT RELATED TO THE COMPENSATION DISCUSSION AND ANALYSIS OF WGL*
The following Compensation Discussion and Analysis section has been prepared by the management of WGL. WGL is responsible for the Compensation Discussion and Analysis and for the disclosure controls relating to executive compensation. The Compensation Discussion and Analysis is not a report or disclosure of the WGL Board.
The WGL Board has reviewed and discussed with management the Compensation Discussion and Analysis section of this Form 10-K. Based upon this review and its discussions, the WGL Board approved the inclusion of the following Compensation Discussion and Analysis section in this Form 10-K.
BOARD OF DIRECTORS
Vincent L. Ammann, Jr.
Nancy C. Floyd
Terry D. McCallister
|
|
* Notwithstanding anything to the contrary set forth in any of WGL’s filings under the Securities Act of 1933, as amended, or the Exchange Act, as amended, that might incorporate other filings with the SEC, including this Form 10-K, in whole or in part, the Human Resources Committee Report shall not be deemed to be incorporated by reference into any such filings.
|
WGL Holdings, Inc.
Washington Gas Light Company
Part III
COMPENSATION DISCUSSION AND ANALYSIS
This Compensation Discussion and Analysis (“CD&A”) provides information about the principles underlying our executive compensation programs and the key executive compensation decisions that were made for FY2018, including the most important factors relevant to those decisions. This CD&A is intended to provide additional context and background for the compensation earned by and awarded to the following officers, whom we refer to as the Named Executive Officers, or NEOs, for FY2018, as reported in the Summary Compensation Table that follows this discussion:
|
| |
Name | Title |
Adrian P. Chapman | President and Chief Executive Officer |
Vincent L. Ammann, Jr. | Executive Vice President and Chief Financial Officer |
Luanne S. Gutermuth | Executive Vice President and Chief Administrative Officer |
Leslie T. Thornton | Senior Vice President and Merger Transition Counsel |
William R. Ford | Vice President and Chief Accounting Officer |
Terry D. McCallister | Former Chairman of the Board and Chief Executive Officer1
|
1 Following the Merger, Mr. McCallister retired from WGL effective July 6, 2018. He continues to serve as a director on the Board of WGL.
The Named Executive Officers of WGL held or hold corresponding positions at Washington Gas and are or were all employees of Washington Gas. Prior to the Merger, the HR Committee of WGL had the same composition as the HR Committee of Washington Gas. References throughout this CD&A to "Joint HR Committee" refer to the HR Committees of each of WGL and Washington Gas prior to the Merger. Following the Merger, the HR Committee of WGL was dissolved, leaving only the HR Committee at Washington Gas. References throughout this CD&A to "HR Committee" refer to the Washington Gas HR Committee following the Merger. Decisions of the Joint HR Committee pre-Merger and the HR Committee post-Merger relating to the compensation of the Named Executive Officers were and are made on the basis of the Named Executive Officers’ contributions to, and the performance of, WGL and its consolidated subsidiaries including Washington Gas. Accordingly, this CD&A is written from the perspective of WGL. References in this Compensation Discussion and Analysis to “WGL,” “we,” “us,” and “our” are to WGL and its consolidated subsidiaries, unless specifically indicated otherwise.
This CD&A is presented in three parts: 1) FY2018 Named Executive Officer pay in general, 2) impact of the Merger on Named Executive Officer pay, and 3) FY2019 compensation.
WGL Holdings, Inc.
Washington Gas Light Company
Part III
FY2018 Named Executive Officer Pay in General
Program Highlights
Our FY2018 executive compensation program was market-based, performance-oriented and reasonable as evidenced by the following:
|
| | |
l | Our pay philosophy is conservative. |
| |
| | |
| o | Our FY2018 program was targeted at the size-adjusted 50th percentile of the utilities marketplace. Use of a utilities market rather than general industry results in lower market benchmarks.
|
| | |
| o | The Joint HR Committee’s consultant size-adjusted the market data to be appropriate to our revenue size relative to the total compensation peer group.
|
| | |
| o | We took retirement benefits into account when comparing target total compensation to the size-adjusted 50th percentile. That is, if retirement benefits were above-market, we reduced long-term incentive opportunities to offset them.
|
| | |
| o | Executive perquisites were few and low-value.
|
| | |
l | Our short-term incentive (“STI”) program has had moderate actual payouts and is regarded favorably by our regulators. |
| |
| o | The plan pays a maximum of 150% of target. |
| | |
| o | The factor that relates to WGL’s performance, which we refer to as the Corporate Factor, was 107.5% of target for FY2018 and averaged 119.2% of target for the past three fiscal years.
|
| | |
| o | Our design, which used 13 performance measures, achieved favorable regulatory treatment due to its focus on the delivery of safe, reliable and reasonably priced natural gas service to customers. We believe that favorable regulatory treatment reflects the fact that our plan adds value for all of our stakeholders, including shareholders.
|
| | |
l | Our long-term incentive (“LTI”) plan was entirely performance-based.
|
| | |
| o | FY2018 grants of long-term incentives used two metrics:
1) how our 3-year consolidated return on equity compared to the weighted average return on equity authorized by our three regulatory commissions. This measure is intended to reward the achievement of 3-year consolidated operating earnings, including for our non-utility operations, that meets or exceeds the earnings opportunity in our utility operations.
2) whether our operating earnings per share exceed our dividends per share.
|
| | |
| These two metrics were the only metrics used in our FY2018 grants because relative TSR grants (used in prior years) could have resulted in an above-target payout solely due to consummation of the Merger. |
| | |
| o | We have not granted solely time-based restricted stock since 1996 or stock options since 2006.
|
Response to Shareholder Advisory Vote on Executive Compensation
Prior to the Merger, each year at WGL’s annual meeting, shareholders have had the opportunity to cast an advisory vote to approve our executive compensation program (a “say-on-pay” vote). Historically the Joint HR Committee has considered the outcome of the shareholder advisory vote when making decisions relating to the compensation of our Named Executive Officers and our executive compensation program design, structure and policies. At our 2016 and 2017 annual meetings, the favorable voting results on our executive compensation program were 96.7% and 97.4%, respectively, suggesting strong shareholder support for the philosophy, design and structure of our executive compensation program pre-Merger. Following the Merger, WGL did not hold an annual meeting as it had become an indirect wholly-owned subsidiary of AltaGas. In August 2018, Washington Gas held a shareholder meeting where 99% of its outstanding voting equity securities were voted in favor of the compensation of our NEOs. The HR Committee will continue to consider the results of any shareholder advisory votes on executive compensation when making decisions about our executive compensation program.
WGL Holdings, Inc.
Washington Gas Light Company
Part III
What We Pay and Why: Elements of Compensation
For FY2018, we had three main elements of direct compensation: base salary, annual incentive and long-term equity compensation. The majority of target direct compensation for our Named Executive Officers was performance-based and not guaranteed. We also provided various retirement and benefit programs and modest business-related perquisites. The dashboard below provides a snapshot and describes why we provided each element.
COMPENSATION DASHBOARD
TARGET TOTAL DIRECT COMPENSATION(1)
|
| | |
LONG-TERM EQUITY COMPENSATION
• Consists of performance shares and performance units
• Entirely performance-based and not guaranteed.
• Goals:
◦ Directly tie executive incentives to our ROE results compared to the utility's weighted average authorized ROE and dividend coverage.
◦ Retain key talent.
• At target, represented 48% of target total direct compensation for Named Executive Officers in FY 2018.
|
| |
(1)Chart depicts the relative percentages of each element of target direct compensation for the Named Executive Officer as a group on a weighted basis. The relative percentages of each element of direct compensation will vary for each Named Executive Officer.
WGL Holdings, Inc.
Washington Gas Light Company
Part III
OTHER ELEMENTS OF COMPENSATION
|
| | | | |
WELFARE BENEFITS | | PERQUISITES | | RETIREMENT PROGRAMS |
| | | | |
Provide a safety net to protect against financial catastrophes that can result from illness, disability or death.
Include medical, dental, disability, life insurance and severance plans.
Named Executive Officers generally participate in the same benefit plans as the broader employee population.
| | We believe the benefit WGL receives from providing perquisites significantly outweighs the cost of providing them.
Additional detail and the business rationale for each perquisite are described on page 194.
| | Provide for basic retirement needs and serve as an additional means to attract and retain employees.
Include pension plans, retirement savings plans and deferred compensation plans.
For additional details, see “Retirement Benefits” beginning on page 192.
|
Objectives of Executive Compensation Program
Our FY2018 executive compensation program was intended to achieve the following fundamental objectives:
•attract and retain qualified executives
•focus executives’ attention on specific strategic and operating objectives of WGL;
•pre-Merger, align executives’ interests with the long-term interests of WGL’s shareholders; and
align management’s interests with the customers of its regulated utility subsidiary (Washington Gas) by rewarding the provision of safe and reliable gas delivery to customers at a reasonable cost, and align management’s interests with the customers of its non-utility entities and the communities in which we operate.
To accomplish these objectives, the Joint HR Committee provided the Named Executive Officers competitive total compensation opportunities based on the size-adjusted 50th percentile of the range of compensation paid by similar utility industry companies for positions of similar responsibility. Actual pay reflected WGL’s short and long-term performance and each individual’s performance, as well as various Merger impacts discussed later in this CD&A.
Elements of Executive Compensation Program
Each element of the executive compensation program is structured to help achieve one or more of the compensation objectives described above. Decisions with respect to one element of pay generally do not impact other elements of pay, with the exception that above-market retirement benefits reduce LTI opportunities so that total target compensation remains near market compensation.
There is no pre-established policy or target for the allocation between cash and non-cash compensation or between short-term and long-term compensation. Rather, the Joint HR Committee used market data and its business judgment to determine the appropriate level and mix of incentive compensation.
Analysis
Key Analytic Tools
The Joint HR Committee (and post-Merger, the HR Committee) used specific analytic tools and business judgment to form recommendations and decisions regarding FY2018 executive compensation matters. To facilitate the Joint HR Committee’s decision-making process for FY2018, the Joint HR Committee’s independent executive compensation adviser, a partner at Meridian Compensation Partners, LLC (“Meridian” or the “adviser”), prepared an executive compensation market study, compensation tally sheets for each executive, pay and performance comparisons, an incentives risk evaluation and information on executive compensation trends. These materials were delivered to the Joint HR Committee members in advance of Joint HR Committee meetings and were the subject of discussion between Joint HR Committee members and the adviser.
In addition, in November 2018, the HR Committee received and considered comprehensive reports from management on corporate and individual executive performance. Corporate performance was discussed with the HR Committee just before our financial results for FY2018 were being released to the public. The HR Committee considered our corporate performance as measured by our reported financial results for FY2018 and by the corporate scorecard for FY2018.
Prior to the beginning of the fiscal year, the Joint HR Committee approved specific weightings for each corporate scorecard goal as a means to evaluate corporate performance. There were 13 items on the corporate scorecard for FY2018. Details regarding the targets and results for our corporate scorecard are reported elsewhere in this CD&A.
Individual performance of our Named Executive Officers was also evaluated by the HR Committee and our management. Several specific individual performance factors, described elsewhere in this Form 10-K were considered by the HR Committee.
WGL Holdings, Inc.
Washington Gas Light Company
Part III
The HR Committee members also had direct knowledge of the performance of several of the executives through regular and special reports by these executives to the Board and Board committees. Our CEO discussed the performance of our other executives in detail with the HR Committee.
Human Resources Committee Decisions
The Joint HR Committee (and post-Merger, the HR Committee) sets compensation for the Chief Executive Officer and makes compensation recommendations to the full Board for the other Named Executive Officers and certain other senior executives. The following describes the basis on which the Joint HR Committee (and post-Merger, the HR Committee) made decisions and recommendations for FY2018.
Market Data and Total Compensation Peer Groups
Our philosophy is to provide pay opportunities for each component of pay and for total compensation at the size-adjusted 50th percentile of the utilities market. In support of compensation decisions, the adviser collects and analyzes comprehensive market data on base salary, short and long-term incentives and the sum of those components. The adviser separately analyzed the market competitiveness of our executive retirement benefits and the prevalence of perquisites. (See prior year proxy statements for methodology details.) Given the pendency of the Merger and certain understandings in the Merger Agreement, however, in September 2017, all NEOs received a 3% base salary increase with no changes to short-term or long-term incentive opportunities.
The base salary that was paid to each Named Executive Officer for FY2018 is the amount reported for such officer in column (c) of the Summary Compensation Table that appears later in this Form 10-K. STI target opportunities and the target payout for performance units under the LTI program are reflected in column (d) of the Grants of Plan-Based Awards Table that appears later in this Form 10-K, and target payouts for performance shares under the LTI program (denominated in the number of shares to be issued) are reflected in column (g) of the Grants of Plan-Based Awards Table.
Short-Term Incentive Compensation
Purpose of Short-Term Incentives
The STI program is designed to reward the level of performance of officers of WGL and its subsidiaries. We choose to pay it to encourage higher annual corporate and individual performance.
Short-Term Incentive Awards
FY2018 STI target percentages of base salary that could be earned for the achievement of corporate and individual performance goals were as set forth in the table below and are multiplied by each Named Executive Officer’s base salary at October 1, 2017. All percentages were the same as in FY2017.
|
| | | |
Named Executive Officer | | Target Short-Term Incentive
Compensation as
Percent of Base Salary1
|
|
Chapman | | 75 | % |
Ammann | | 60 | % |
Gutermuth | | 60 | % |
Thornton | | 55 | % |
Ford | | 40 | % |
McCallister | | 90 | % |
1As set in September 2017. For information regarding post-Merger adjustments to these percentages for certain NEOs, please refer to the section entitled “Employment/Retention Agreements” on page 196.
For tax purposes, the Joint HR Committee set a limitation on FY2018 STI payouts for Messrs. McCallister and Chapman of 0.76% and 0.41% of FY2018 net income, respectively. The HR Committee then used negative discretion to arrive at actual, lower FY2018 payouts based on our performance for the year.
The amounts listed in columns (c), (d) and (e) of the “Grants of Plan-Based Awards” table in this Form 10-K show the potential range of STI cash awards for FY2018 for each Named Executive Officer. Payouts could be higher or lower than target depending on FY2018 corporate and individual performance, ranging from 0% to 150% of target per the scale below.
WGL Holdings, Inc.
Washington Gas Light Company
Part III
|
| | | | | | |
| Item | | Corporate | | Individual | | Total |
| Weighting | | 75% | | 25% | | 100% |
| Corporate or Individual Factor, as applicable | | maximum 1.5 | | maximum 1.5 | | 0 |
| Individual Factor applied again to the corporate portion | | maximum 1.0 | | 0 | | 0 |
| Maximum payout as % of target | | 112.5% | | 37.5% | | 150% |
FY 2018 Corporate Performance
At its September 19, 2017 meeting, the Joint HR Committee approved FY2018 performance goals and targets that governed payouts under the plan. The corporate performance goals making up our FY2018 corporate scorecard recognize that shareholders in a regulated utility achieve their investing objectives when customers are well-served through reliable, efficient operations. WGL’s FY2018 performance goals included multiple metrics in eight corporate performance categories related to: rewarding investors, safe delivery, customer value, performance improvement, supplier diversity, sustainability, employer of choice and reliable supply. As noted above, for FY2018, the Joint HR Committee approved a formulaic calculation for the Corporate Factor, involving the assignment of specific weightings for each corporate scorecard goal. Under this methodology, each scorecard goal is assigned a specific percentage weighting, which collectively total 100%. An indicative corporate factor is then determined as follows (using straight line interpolation between the values indicated):
|
| | | |
| Percent met or exceeded (by weighting) | | Indicative Corporate Factor |
|
| At least 95% | | 1.5 |
|
| 70% | | 1.0 |
|
| 50% | | 0.6 |
|
| Less than 50% | | — |
|
In most cases, the indicative corporate factor will be the Corporate Factor. However, the HR Committee retains discretion to reduce the Corporate Factor (including to set the Corporate Factor at zero) as it deems appropriate. The HR Committee might exercise this negative discretion, for example, if WGL’s financial performance for the fiscal year was significantly below expectations or if WGL’s performance was otherwise substantially below expectations in a way that was not adequately reflected by the application of this methodology.
The corporate scorecard goals measure the results of short-term activities that drive the long-term strategic objectives of WGL. The performance targets are intended to challenge WGL and its executive officers to achieve significant accomplishments in each of these areas. Set forth below are the FY2018 performance goals and a brief discussion of the relationship between each goal and shareholder interests.
Reward Investors. This category includes a goal for utility return on equity (“ROE”) and a goal for non-utility earnings. Our utility ROE performance goal measures the ability of our natural gas utility business to earn the weighted average ROE allowed by our three regulatory commissions in the District of Columbia, Maryland and Virginia. Non-utility earnings is a measure of the ability of WGL to deliver earnings against our goals through non-utility activities.
Safe Delivery. This category includes an Employee Work Safety goal and a System Safety/Pipeline Integrity goal. The safe delivery of natural gas is fundamental to our business, is an essential foundation for sustainable success, and reflects our safety culture. Low employee injury rates reduce our costs due to injury (medical, worker’s compensation and costs associated with backfilling vacancies) and increases our employees’ availability for work. In addition, lower injury levels improve overall health and well-being, bolstering employee morale and retention. Our focus on system safety and pipeline integrity measures enables us to maximize the return on our system investments by limiting costly emergency repairs and remediation, ensuring the system’s ability to serve existing customers reliably and meet the demands of meter growth, achieving favorable regulatory treatment, limiting liability and helping to ensure that investments in our pipeline, such as investments in our accelerated pipe replacement programs, are eligible for regulatory cost recovery.
Customer Value. This category includes a customer satisfaction goal, a new meter additions goal and a service level achievement of key contracts goal. Customer satisfaction, based on surveys of customers who have interacted with us during the year, is a key measure of our success in delivering core services to our customers, and is critical to achieving positive regulatory treatment and growing our customer base. Our new meter additions goal focuses management on one of the principal drivers of revenue opportunity for our natural gas utility business. Our service level achievement of key contracts measures service provider performance against established metrics and reflects WGL’s management of those providers.
O&M per Customer. This metric measures the level of our operation and maintenance cost (“O&M”) per customer. Managing our O&M per customer helps to ensure the efficiency of our operations as we maintain and grow the number of active customer meters
WGL Holdings, Inc.
Washington Gas Light Company
Part III
Supplier Diversity. We have set significant goals to increase our spending with diverse-owned businesses. By supporting expanded opportunities for minority and woman-owned businesses, we increase competition and vendor options in the marketplace, which benefits WGL and the communities that we serve. These goals are consistent with commitments we have made to our regulators and demonstrate our continued commitment to promoting diversity.
Sustainability. This metric tracks our pipeline replacement spending as a leading indicator of fugitive methane emissions reductions, our continuing commitment to environmentally responsible operations, with LEED Gold certifications for our Washington, DC Headquarters and Northwest Station, the reduction in our fleet emissions, customer energy savings (as carbon emissions equivalent reductions) and creating a culture and corporate processes that support their achievement. We believe this goal demonstrates our commitment to being a leading provider of clean energy solutions to our customers and reinforces our WGL Energy Answers brand position.
Employer of Choice. This category includes an employee engagement goal and a community involvement goal. We believe a high level of employee engagement improves employee performance, morale and retention, which lead to higher levels of customer satisfaction and, ultimately, to financial success. Our community involvement goal helps to ensure that our employees are connected to the communities they serve and improves customer relationships and loyalty.
Reliable Supply. The percentage of our customers who experience no unplanned interruptions in service is a key performance metric for our utility operations. Low outage levels are fundamental to our business, and are essential to high customer satisfaction, favorable regulatory treatment and our ability to grow and create new revenue opportunities.
CORPORATE SCORECARD RESULTS IN FY 2018
The table below sets forth WGL’s performance against our performance goals, and indicates the relative weightings used to determine the Corporate Factor for FY2018.
|
| | | | | | | | | |
| | Corporate Goals | | FY 2018 Target | | FY 2018 Results | | Met or Exceeded | | Weighting |
| 1. | Reward Investors(1) | | | | | | | | |
| | Utility ROE | | Greater than or equal to the allowed utility ROE of 9.46% | | 9.53% | | Yes | | 10% |
| | Non-Utility Earnings | | Greater than or equal to 100% of targeted non-utility earnings | | 79.0% | | No | | 10% |
| | | | | | | | | | |
| 2. | Safe Delivery | | | | | | | | |
| | Employee Work Safety | | Less than or equal to a DART(2) rate of 0.90 | | 1.71 | | No | | 10% |
| | System Safety/Pipeline Integrity | | Greater than or equal to 100% | | 110.0% | | Yes | | 10% |
| | | | | | | | | | |
| 3. | Customer Value | | | | | | | | |
| | Customer Satisfaction | | Greater than or equal to 85% | | 87.4% | | Yes | | 10% |
| | New Meter Additions | | Greater than or equal to 12,500 new meters | | 12,581 | | Yes | | 6.25% |
| | Service Level Achievement of Key Contracts | | Greater than or equal to 90% | | 92.7% | | Yes | | 6.25% |
| | | | | | | | | | |
| 4. | O & M Per Customer | | Less than or equal $285 | | $292 | | No | | 6.25% |
| | | | | | | | | | |
| 5. | Supplier Diversity | | Greater than or equal to 26% | | 26.1% | | Yes | | 6.25% |
| | | | | | | | | | |
| 6. | Sustainability | | Greater than or equal to 95% | | 98.3% | | Yes | | 6.25% |
| | | | | | | | | | |
| 7. | Employer of Choice | | | | | | | | |
| | Employee engagement | | 96% completion of designated activities by business units | | 100.0% | | Yes | | 6.25% |
| | Community involvement | | Greater than or equal to 12,000 hours of community service by WGL employees and family | | 14,005 | | Yes | | 6.25% |
| | | | | | | | | | |
| 8. | Reliable Supply | | | | | | | | |
| | System Reliability | | Percentage of customers who experience no unplanned service interruptions of at least 99.7% | | 99.91% | | Yes | | 6.25% |
| | Goals Met or Exceeded | | | | | | 10 out of 13 | | 73.75% |
WGL Holdings, Inc.
Washington Gas Light Company
Part III
(1)Utility ROE is calculated by dividing net income of our utility segment, adjusted for after-tax non-GAAP adjustments, by the average common equity for the fiscal year, also adjusted for after-tax non-GAAP adjustments. Non-utility earnings is equal to the adjusted EBIT of our non-utility operating segments, which is defined as net income before interest and taxes, less amounts attributable to non-controlling interest, adjusted for non-GAAP adjustments. For a discussion of our non-GAAP adjustments, see Appendix A.
(2)DART” refers to Days Away/Restricted or Job Transfer.
For FY2018, 10 of 13 scorecard goal targets, constituting 73.75% by weighting, were met or exceeded, resulting in an indicative corporate factor of 1.075. Based on these results, on November 7, 2018, Adrian P. Chapman, who became WGL's President and CEO on July 6, 2018 following the close of the Merger, recommended, and the HR Committee approved, a Corporate Factor of 1.075 for FY2018.
FY 2018 Individual Performance
Named Executive Officers had individual goals for FY 2018 which encompassed:
•their contributions to meeting established corporate and departmental goals;
•managing resources within established departmental budgets; and
•effectiveness in areas of leadership, planning and teamwork.
After a comprehensive performance appraisal of each Named Executive Officer and a review of their individual achievements, contributions to the corporate scorecard results and personal effectiveness in leading their respective areas of responsibility, Mr. Chapman recommended an Individual Factor specific to each Named Executive Officer except for himself. The HR Committee discussed and approved the Individual Factors recommended by the CEO for these Named Executive Officers.
In executive session, the HR Committee developed an Individual Factor of 1.45 for Mr. Chapman. The other Named Executive Officers received the following Individual Factors: Ammann: 1.4, Gutermuth: 1.5, Thornton: 1.1, and Ford: 1.1. Mr. McCallister retired on July 6, 2018, at which time he received a pro-rata target STI payout of $612,284 in respect of his FY2018 STI award; thus, no individual factor was determined for Mr. McCallister. Mr. Chapman’s individual factor reflects the achievement of 10 of the 13 goals on the corporate scorecard and the successful completion of the Merger in July of 2018. During the critical immediate post-Merger phase, Mr. Chapman has overseen the smooth transition of the company to its status as an indirect, wholly-owned subsidiary of AltaGas, ensuring minimal management changes and high-level engagement with the newly re-constituted Boards of Directors of the companies.
In addition to providing exceptional leadership through the time-consuming post-Merger integration process, Mr. Chapman has also guided the organization in its achievement of the majority of its corporate goals for the year, including those related to supplier diversity, system reliability, community involvement, customer growth, and sustainability. His individual factor also reflects our continued execution on our 7-10% operating earnings growth plan while maintaining an effective and strong control environment and reflects the achievement of the company’s goals related to pipeline safety and customer satisfaction. Under Mr. Chapman’s leadership, the organization has continued to refine its strategies and implement plans to grow all facets of WGL’s business while effectively managing associated costs and risks.
As a part of WGL’s continuing commitment to always remain a good corporate citizen, Mr. Chapman continues to represent the organization both nationally with leadership roles in organizations such as the American Gas Association and within the local community with his participation in the Greater Washington Board of Trade and the Greater Washington Partnership. Finally, to ensure continued strong leadership of the company and the continuation of its commitment to its strong corporate values going forward, Mr. Chapman has also dedicated time and resources to the continuation of the organization’s strong succession planning and leadership development process.
The amounts of STI awards relating to FY2018 (less the pro-rated portions paid in connection with the close of the Merger) will be paid in December 2018 and are set forth under column (g) of the Summary Compensation Table in this Form 10-K, entitled Non-Equity Incentive Plan Compensation. The amounts of such STI awards for the Named Executive Officers range from 108.1% to 118.1% of target. For information on the impact of the Merger on STI and the partial payments related thereto, please refer to the section entitled “Impact of Merger” on page 194.
Clawback Policy - Forfeiture and Recoupment of Short-Term Incentives
We have a Forfeiture and Recoupment Policy to recoup short-term incentive awards paid to certain officers of WGL and its subsidiaries, including the Named Executive Officers, under certain circumstances. Pursuant to this policy, the Board, upon the recommendation of the HR Committee, if applicable, may direct that all or a portion of any STI payout made to these officers be recovered if such payout was based on materially inaccurate financial statements or any other materially inaccurate performance metric criteria.
WGL Holdings, Inc.
Washington Gas Light Company
Part III
The Board of WGL or the HR Committee, as applicable, will determine whether such recovery will be effectuated by: (i) seeking repayment from the officer, (ii) reducing the amount that would otherwise be payable to the officer under any compensatory plan, program or arrangement maintained by WGL, (iii) withholding payment of future increases in compensation (including the payment of any discretionary bonus amount) or grants of compensatory awards that would otherwise have been made in accordance with WGL’s otherwise applicable compensation practices, or (iv) any combination of the foregoing. In each instance in which the potential for recovery of STI exists, WGL will not seek recovery after a period of 24 months following the first public issuance or filing with the SEC (whichever occurs first) of a financial report containing the materially inaccurate statement or reporting the achievement of the performance metric that is later deemed to have been materially inaccurate.
Long-Term Incentive Compensation
Purpose of Long-Term Incentive Awards
Historically the LTI program has been designed to reward our senior executives for our performance for shareholders, as measured by (i) performance of an investment in our common stock relative to comparable investments in other utilities, (ii) the extent to which our consolidated business, including our non-utility businesses, earns a return that equals or exceeds the utility’s earnings opportunity and (iii) achieving earnings sufficient to cover our dividends. For FY2018, given that the Merger with AltaGas was pending at the time awards were made, the grants made on October 1, 2017 were in the following form:
•25% Dividend Coverage Shares
•25% ROE Ratio Shares
•50% ROE Ratio Units
This mix preserved the performance-based nature of the program and its economic value, while recognizing that TSR between grant date and merger close date is not an important measure of performance. We choose to provide long-term incentive opportunities to achieve the following goals:
•Align executives’ interests with shareholder interests.
•Maintain consistency with market practice
•Promote common stock ownership (pre-Merger).
•Encourage retention through vesting provisions.
Per the terms of the Merger Agreement, no changes were made to the LTI target percentages for NEOs for FY2018.
Award Size Determinations
The target values of the LTI awards for Named Executive Officers issued at the beginning of FY2018 (for the FY2018-2020 performance period) were determined by the Joint HR Committee based on the size-adjusted 50th percentile of the market data for total target compensation provided by its adviser prior to FY2017 compensation decisions, taking into consideration the aggregate amount of base salary, STI awards and the value of retirement benefits, and considering internal pay equity.
|
| | | |
Named Executive Officer | | Long Term Incentive Compensation as Percent of Base Salary |
Chapman | | 180 | % |
Ammann | | 130 | % |
Gutermuth | | 110 | % |
Thornton | | 110 | % |
Ford | | 70% |
|
McCallister | | 235 | % |
To arrive at the actual award size for performance shares and performance units, we divided the executive officer’s target value applicable to performance shares and performance units (for each, 50% of the total LTI award) by the value of one performance share or performance unit, as appropriate, on the date of grant. The value of a performance share was equal to the closing price of a share of common stock of WGL on the last day of the prior fiscal year ($84.20 for FY2018 grants) and the value of a performance unit was $1.
Performance Share and Performance Unit Awards
Performance share awards were denominated in shares of WGL common stock. Performance unit awards are denominated in dollars. Post-Merger, both types of awards are to be paid out in cash.
WGL Holdings, Inc.
Washington Gas Light Company
Part III
Performance shares and performance units granted in FY2018 were set to be paid out at the end of the performance period if certain long-term performance criteria were achieved and the Named Executive Officer remained an employee. In the event of the Named Executive Officer’s retirement during the performance period, awards would be prorated based on the number of months worked in the performance period. If the Named Executive Officer left WGL before the performance period ended for any other reason, he or she would forfeit any payouts for the performance period. Upon death or disability, however, the HR Committee had discretion to prorate awards based on the number of months worked in the performance period. For information on the impacts of a change in control to performance shares and performance units, please see the section entitled “Severance/Change in Control Provisions” below.
Return on Equity (ROE) Performance Shares and Performance Units. Three-quarters of the value of LTI grants for FY 2018 (50% units and 25% shares) was set to be driven by our return on equity (ROE) ratio. ROE ratio is calculated as follows:
|
| |
ROE Ratio = | Average consolidated non-GAAP ROE |
| Weighted average utility authorized ROE |
Average consolidated non-GAAP ROE is the average of actual consolidated non-GAAP ROE for the three fiscal years in the performance period. Consolidated non-GAAP ROE for each fiscal year is calculated as non-GAAP operating earnings divided by average non-GAAP equity. Average non-GAAP equity for any fiscal year is equal to the average of common equity at the end of that year and at the end of the prior year, in each case, as adjusted for after-tax non-GAAP adjustments. The weighted average utility authorized ROE is the weighted average ROE allowed by Washington Gas’ three regulatory commissions in the District of Columbia, Maryland and Virginia.
Dividend Coverage Performance Shares. One-quarter of the value of LTI grants for FY2018 was issued in the form of performance shares for which the measure of performance was whether our non-GAAP operating earnings per share on a diluted basis for the performance period exceed dividends per share of common stock declared during the period. Non-GAAP operating earnings per share is equal to non-GAAP operating earnings divided by the weighted average number of shares of common stock outstanding during the performance period.
Return on Equity Performance Units - Performance/Payout Relationship
The table below shows the performance and payout scale for ROE performance unit and performance share grants made to the Named Executive Officers on October 1, 2017. |
| |
| ROE Ratio | Payout of Performance Units
(% of Target Awarded) |
| 120% or greater | 200% |
| 110% | 150% |
| 100% | 100% |
| 90% | 50% |
| Less than 90% | -% |
Generally, the percentile rank would not have fallen directly on one of the ranks listed in the left column. When this occurs, performance would have been interpolated between the percents listed in the columns on a straight-line basis.
Dividend Coverage Performance Shares - Performance/Payout Relationship
Dividend coverage performance share grants made to the Named Executive Officers on October 1, 2017 would have paid out at 100% of target if our non-GAAP operating earnings per share on a diluted basis for the performance period exceed dividends per share of common stock declared during the period; otherwise the dividend coverage performance shares would have paid out at 0%.
Retirement Benefits
Retirement benefits are designed to reward continued service. We choose to offer them to provide post-employment security to our employees and because they are an essential part of a total compensation package that is competitive with those offered by other companies, particularly other gas and electric utilities.
We provide retirement benefits to the Named Executive Officers under the terms of qualified and non-qualified defined-benefit and defined-contribution retirement plans. Retirement benefit programs available to the Named Executive Officers are:
tax-qualified employee benefit plans that are available to our employees, including the Washington Gas Light Company Savings Plan (which we refer to, together with the Washington Gas Light Company Capital Appreciation Plan/ Union Employees’ Savings Plan, as the “401(k) Plans”), and the Washington Gas Light Company Employees’ Pension Plan (the “Pension Plan”);
WGL Holdings, Inc.
Washington Gas Light Company
Part III
•the defined benefit Washington Gas Light Company Supplemental Executive Retirement Plan (“DB SERP”);
the Washington Gas Light Company Defined Contribution Supplemental Executive Retirement Plan (“DC SERP”);
the Washington Gas Light Company Defined Contribution Restoration Plan (the “Defined Contribution Restoration Plan” or “DC Restoration Plan”); and
the Washington Gas Light Company Defined Benefit Restoration Plan (the “Defined Benefit Restoration Plan” or “DB Restoration Plan”).
The 401(k) Plans are tax-qualified retirement plans in which the Named Executive Officers participate on the same terms as our other participating employees. Officers who do not participate in the Pension Plan receive an enhanced benefit under our 401(k) Plans.
The Pension Plan is a tax-qualified, non-contributory pension plan covering active employees (including certain executive officers) and vested former employees of Washington Gas and certain affiliates hired before July 1, 2009. Effective July 1, 2009, the Pension Plan was closed to new management employee entrants. Each of the Named Executive Officers, except for Ms. Thornton, participates in the Pension Plan.
The DB SERP is a defined benefit plan that allows accrual of a higher benefit than the qualified plan. This plan was intended to allow us to: (i) attract mid-career executive hires by replacing foregone pension benefits at former employers, and (ii) be competitive with pensions provided to executives at peer companies, aiding in the retention of our executive officers. The DB SERP was closed to new participants on December 31, 2009.
On December 18, 2009, the DC SERP was adopted. Employees hired or promoted after December 31, 2009 are eligible to participate in the DC SERP. Employees who were executives on December 31, 2009 had the option either to remain in the DB SERP or to join the DC SERP. Closing the DB SERP to new participants and creating the DC SERP enabled WGL to: (i) reduce its risk, (ii) provide greater predictability of its long-term financial obligations, and (iii) align executive compensation with prevailing market practices. On December 19, 2009, the Board also adopted the Defined Benefit Restoration Plan and the Defined Contribution Restoration Plan. The Defined Benefit Restoration Plan provides supplemental pension benefits to employees selected by the Board of Directors who are not participants in the DB SERP. The Defined Contribution Restoration Plan provides supplemental retirement benefits to employees who are not participants in the DB SERP and whose base salary exceeds the limit set forth in Section 401(a)(17) of the Internal Revenue Code. The benefits provided under the DC SERP were designed to be at the market median and competitive with those offered by other gas and electric utilities.
Messrs. McCallister, Chapman and Ammann participate in the DB SERP. Ms. Gutermuth, Ms. Thornton and Mr. Ford participate in the DC SERP and DC Restoration, and Ms. Gutermuth and Mr. Ford also participate in the DB Restoration.
The DB SERP, DC SERP, DB Restoration and DC Restoration each include “clawback” provisions that require a participant to forfeit benefit payments under certain circumstances. Under this clawback provision, if a plan participant willfully performs any act or willfully fails to perform any act, and such act or such failure to act may result in material discredit or substantial detriment to WGL, then upon a majority vote of the Board, the participant (and his or her surviving spouse or other beneficiary) will forfeit any benefit payments owing on and after a date fixed by the Board. After this fixed date, WGL will have no further obligation under the plan to the participant, his or her spouse or any beneficiary. Also, under the clawback provision, if a participant has received a lump-sum benefit, the participant or the beneficiary would be required to return a proportionate share of that lump sum payment to Washington Gas.
See “Pension and Other Retirement Benefits” later in this Form 10-K for a discussion of other aspects of the Pension Plan, the DB SERP, the DC SERP, the Defined Benefit Restoration Plan and the Defined Contribution Restoration Plan.
Severance/Change in Control Protections
Pursuant to the WGL Holdings, Inc. and Washington Gas Light Company Change in Control Severance Plan for Certain Executives (the “CIC Plan”), certain executive officers are entitled to limited severance benefits in the event of a change in control of WGL or Washington Gas, including the Merger (except for those who have waived their CIC benefits as part of a retention agreement (see discussion under “Employment/Retention Agreements” on page 196)). These benefits include a cash severance benefit equal to a pro-rata STI payment and two or three years’ worth of target-level compensation upon the occurrence of both a change in control and either: (i) an involuntary termination of employment or (ii) a voluntary termination with good reason (commonly referred to as a “double-trigger”). For information regarding the impact of the Merger on the CIC Plan for the NEOs, please refer to the section entitled “Employment/Retention Agreements” on page 196.
Change-in-control severance provisions were designed to reward executives for remaining employed with us during a time when their prospects for continued employment following a corporate transaction may be uncertain. We chose to provide such
WGL Holdings, Inc.
Washington Gas Light Company
Part III
protections so that executives would remain with WGL and focused on shareholders’ and customers’ interests during the change in control. This strategy served to retain a stable executive team during the transition process.
Because historically the Named Executive Officers did not have employment agreements that provided for fixed positions or duties, fixed base salaries or actual or target annual bonuses, a “good reason” termination severance trigger was appropriate to prevent potential acquirers from having an incentive to cause voluntary termination of a Named Executive Officer’s employment to avoid paying any severance benefits at all. The “good reason” termination severance trigger under the CIC Plan included material demotions and material reductions in salary and annual bonus opportunities.
In addition to the CIC Plan, all LTI grants outstanding at the Merger and grants made in early FY2019 reflected double-trigger vesting upon a change in control for those executives still eligible for the CIC Plan.
For executive officers that were first covered by the CIC Plan prior to January 1, 2011 (including all of the Named Executive Officers except for Ms. Thornton), the CIC Plan provided that, if a change in control payment exceeds the limit for deductible payments under Section 280G of the Internal Revenue Code by 10% or more, reimbursement will be made for the full amount of any excise taxes (but not income taxes) imposed, and for all taxes due on the amount of that reimbursement. This provision was intended to preserve the level of change in control severance protections determined to be appropriate. Pursuant to an amendment to the CIC Plan on November 12, 2015, the excise tax reimbursement provisions would have expired on September 30, 2018 unless a change in control transaction had occurred or was then pending. Given that the Merger took place on July 6, 2018, the new provision was moot for that transaction. Current calculations indicate that no excise tax gross-up actually applies to any executive, however.
The CIC Plan remains in effect for two years with respect to the Merger.
See “Potential Payments Upon Termination or Change in Control - Change in Control Severance Plan for Certain Executives” later in this Form 10-K for a discussion of the other aspects of the CIC Plan.
Perquisites
Our limited perquisites are not designed to reward any particular performance or behavior. We choose to provide them to Named Executive Officers only when the perquisite provides competitive value and promotes retention of executives, or when the perquisite provides shareholder value.
We have a program of income tax, estate and financial planning services for our executive officers. We pay the actual cost of these services provided to the executive officer up to a pre-determined ceiling. We also pay the cost of certain other perquisites for executive officers, including parking at our offices, a vehicle allowance or, in the case of Mr. McCallister during FY2018, transportation to and from our offices, and an annual physical examination. Benefits available to the Named Executive Officers are noted in the footnotes to the Summary Compensation Table. The values of perquisites provided to each Named Executive Officer in FY2018 are included as a component of the figure that is reported in Column (i) of the Summary Compensation Table in this Form 10-K.
Impact of Merger
The Merger had specific impacts on compensation including early payment of a portion of FY2018 short-term incentive, vesting of outstanding long-term incentives with accompanying payment or deferral depending on the award, and employment, retention or separation agreements with specific executives. Each is discussed below.
Short-Term Incentives
At Merger, each Named Executive Officer received a prorated payment of the FY2018 target short-term incentive as detailed in the table below. For those executives remaining employed through the end of the fiscal year, this amount was subtracted from the final short-term incentive payout earned for the complete fiscal year, with the remainder to be paid in December 2018. Full FY2018 values are set forth under column (g) of the Summary Compensation Table in this Form 10-K, entitled Non-Equity Incentive Plan Compensation.
WGL Holdings, Inc.
Washington Gas Light Company
Part III
|
| | | | |
| Named Executive Officer | | Prorated Target STI Payout |
|
| Chapman | | $ | 331,360 |
|
| Ammann | | $ | 222,977 |
|
| Gutermuth | | $ | 219,684 |
|
| Thornton | | $ | 171,107 |
|
| Ford | | $ | 86,528 |
|
| McCallister | | $ | 612,271 |
|
Outstanding Long-Term Incentive Awards
Pursuant to the Merger Agreement, outstanding FY2016 and FY2017 LTI awards fully vested and were paid shortly after the Merger. Amounts were paid in cash whether originally payable in cash or shares.
TSR performance units and shares were converted based on relative TSR performance through the Merger at the merger consideration share price. Per the award agreements, no four-quarter averaging was used to determine the final payout. Based on relative TSR performance against the applicable long-term incentive peer groups, FY 2016 TSR awards were earned at 127.8% of target while FY2017 awards were earned at 200% of target.
ROE ratio performance units were converted at Target.
Dividend coverage performance shares were converted at Target and at the merger consideration share price.
Further, all outstanding, unvested FY2018 LTI awards were converted to cash at Target. The converted cash amounts will continue to vest based on the original vesting schedule outlined in the award agreements.
Vested amounts for the FY2016 and FY2017 awards and converted amounts for the FY2018 awards by executive are shown below.
|
| | | | | | | | | | | | | | | | | | |
| | FY 2016 Awards | | |
| Named Executive Officer | ROE Ratio Units | Dividend Coverage Shares | TSR Units | TSR Shares | Dividend Equivalent | Lump Sum Cash Payment |
| Chapman | $ | 250,200 |
| $ | 382,829 |
| $ | 319,756 |
| $ | 489,258 |
| $ | 58,525 |
| $ | 1,500,568 |
|
| Ammann | $ | 151,125 |
| $ | 231,303 |
| $ | 193,138 |
| $ | 295,638 |
| $ | 35,363 |
| $ | 906,567 |
|
| Gutermuth | $ | 123,750 |
| $ | 189,384 |
| $ | 158,153 |
| $ | 242,070 |
| $ | 28,955 |
| $ | 742,312 |
|
| Thornton | $ | 107,250 |
| $ | 164,145 |
| $ | 137,066 |
| $ | 209,771 |
| $ | 25,093 |
| $ | 643,325 |
|
| Ford | $ | 47,250 |
| $ | 72,277 |
| $ | 60,386 |
| $ | 92,398 |
| $ | 11,051 |
| $ | 283,362 |
|
| McCallister | $ | 498,788 |
| $ | 763,274 |
| $ | 637,451 |
| $ | 975,427 |
| $ | 116,684 |
| $ | 2,991,624 |
|
|
| | | | | | | | | | | | | | | | | | |
| | FY 2017 Awards | | |
| Named Executive Officer | ROE Ratio Units | Dividend Coverage Shares | TSR Units | TSR Shares | Dividend Equivalent | Lump Sum Cash Payment |
| Chapman | $ | 252,436 |
| $ | 355,294 |
| $ | 504,872 |
| $ | 710,589 |
| $ | 48,583 |
| $ | 1,871,774 |
|
| Ammann | $ | 152,764 |
| $ | 214,977 |
| $ | 305,528 |
| $ | 429,954 |
| $ | 29,396 |
| $ | 1,132,619 |
|
| Gutermuth | $ | 127,880 |
| $ | 180,030 |
| $ | 255,760 |
| $ | 360,060 |
| $ | 24,617 |
| $ | 948,347 |
|
| Thornton | $ | 108,633 |
| $ | 152,937 |
| $ | 217,266 |
| $ | 305,874 |
| $ | 20,913 |
| $ | 805,623 |
|
| Ford | $ | 48,116 |
| $ | 67,688 |
| $ | 96,232 |
| $ | 135,375 |
| $ | 9,256 |
| $ | 356,667 |
|
| McCallister | $ | 507,600 |
| $ | 714,472 |
| $ | 1,015,200 |
| $ | 1,428,944 |
| $ | 97,697 |
| $ | 3,763,913 |
|
WGL Holdings, Inc.
Washington Gas Light Company
Part III
|
| | | | | | | | | | | | | | |
| | | FY 2018 |
| Named Executive Officer | | ROE Ratio Shares | | Dividend Coverage | ROE Ratio Units | | Converted Cash Amount |
| Chapman | | $ | 272,604 |
| | $ | 272,605 |
| $ | 520,200 |
| | 1,065,409 |
|
| Ammann | | $ | 164,851 |
| | $ | 164,851 |
| $ | 314,600 |
| | 644,302 |
|
| Gutermuth | | $ | 138,023 |
| | $ | 138,023 |
| $ | 263,450 |
| | 539,496 |
|
| Thornton | | $ | 117,284 |
| | $ | 117,285 |
| $ | 223,850 |
| | 458,419 |
|
| Ford | | $ | 51,891 |
| | $ | 51,891 |
| $ | 99,050 |
| | 202,832 |
|
McCallister1 | | 548,033 |
| | 548,032 |
| 1,045,750 |
| | 2,141,815 |
|
1 As per his separation agreement discussed below, Mr. McCallister’s FY2018 awards were accelerated and will be paid out in early 2019.
Employment/Retention Agreements
We entered into various employment, retention or termination agreements with certain executives at or shortly after the Merger.
Chapman Agreement
On July 6, 2018, WGL appointed Mr. Chapman Chief Executive Officer of each of WGL and Washington Gas. In connection with his appointments, Mr. Chapman entered into a letter agreement with Washington Gas which provides for an annual salary of $630,000, a target STI opportunity of 85% of salary and an expected LTI award grant value of 180% of his then-current salary. In connection with the agreement, Mr. Chapman received a retention bonus of $3,059,500 in exchange for relinquishing certain severance rights he had under the CIC Severance Plan.
Ammann Agreement
On July 6, 2018, WGL appointed Mr. Ammann Executive Vice President of WGL and Washington Gas, respectively. Mr. Ammann also retained his title as Chief Financial Officer of each of WGL and Washington Gas. In connection with his appointments, Mr. Ammann entered into a letter agreement with Washington Gas which provides for an annual salary of $525,000, a target STI opportunity of 70% of salary and an expected LTI award grant value of 130% of his then-current salary. In connection with the agreement, Mr. Ammann received a retention bonus of $2,348,200 in exchange for relinquishing certain severance rights he had under the CIC Severance Plan.
Gutermuth Agreement
On July 6, 2018, WGL appointed Ms. Gutermuth Executive Vice President and Chief Administrative Officer of WGL and Washington Gas. On July 11, 2018, Ms. Gutermuth entered into a letter agreement with Washington Gas which provides for an annual salary of $479,000, a target STI opportunity of 60% of salary and an expected LTI award grant value of 110% of her then-current salary. In connection with the agreement, Ms. Gutermuth received a retention bonus of $1,557,800, payable in two annual installments, in exchange for relinquishing certain severance rights she had under the CIC Severance Plan.
Thornton Agreement
On July 6, 2018, Ms. Thornton, who served as Senior Vice President, General Counsel and Corporate Secretary until October 15, 2018, entered into a letter agreement to extend the 90-day period during which she must tender her resignation in order for it to be considered a Good Reason Resignation (as defined in the CIC Severance Plan) through November 30, 2018. At the time of the filing of this 10-K, Ms. Thornton is serving as Senior Vice President and Merger Transition Counsel of WGL and Washington Gas while helping to transition her duties to her successor. Ms. Thornton plans to retire from her positions with WGL and Washington Gas on or before November 30, 2018.
Ford Agreement
On July 6, 2018, Mr. Ford entered into a letter agreement with Washington Gas which provides for an annual salary of $283,000 and a target STI opportunity of 40% of salary. In connection with the agreement, Mr. Ford received a retention bonus of $817,400 in exchange for relinquishing certain severance rights he had under the CIC Severance Plan.
McCallister Separation Agreement
On July 6, 2018, Mr. McCallister retired from his officer positions of Chairman of the WGL Board, Chairman of the Washington Gas Board and Chief Executive Officer. Pursuant to a service agreement, Mr. McCallister continued to serve as
WGL Holdings, Inc.
Washington Gas Light Company
Part III
Chairman of the WGL Board in a non-officer capacity through July 20, 2018 to assist with the transition following the Merger. As compensation for the transition services, Mr. McCallister received a lump sum cash payment of $34,231.
In connection with his retirement, Mr. McCallister also entered into a separation agreement which provides that his retirement constitutes a “Good Reason Resignation” under the CIC severance plan. In connection with his Good Reason Resignation, Mr. McCallister received the following:
A lump sum cash severance payment of $5,685,284 which equals the sum of three times his base salary and target short-term incentive opportunity plus the prorated FY2017 bonus payment described above
Continued medical and dental coverage under WGL’s plans for an 18-month period (at WGL’s cost), and a benefit continuation payment to cover the cost of such coverage for the next 18-month period, and an additional cash payment to compensate for any income taxes payable in connection with the continued coverage and payments
Reimbursement of up to $25,000 in outplacement services
Payment of his FY2018 LTI converted cash balance, as discussed above.
FY2019 Compensation
Post-Merger, the HR Committee will continue the role previously played by the Joint HR Committee, setting the compensation for the Chief Executive Officer and making compensation recommendations to the full Board for other senior executives. Decisions made by the HR Committee for FY2019 include those below.
FY2019 Short-Term Incentive Compensation
The FY2019 short-term incentive design will be essentially the same as for FY2018. Payouts will depend on the achievement of corporate and individual performance goals, will range from 0% - 150% of target opportunity using a similar scale as in FY2018, and will maintain all 13 corporate FY2018 performance factors. Two additional factors will be added to measure achievement of predetermined Merger commitment goals and supply chain savings.
FY2019 Long-Term Incentive Compensation
The long-term incentive program was redesigned for FY2019 because WGL no longer has independently traded public stock. Whereas the prior program granted a combination of performance units and performance shares, the FY2019 program is solely based on units as further described below.
80% of the Named Executive Officer awards will be performance units earned based on performance against ROE Ratio and Adjusted Funds from Operations (AFFO) goals on an equally weighted basis. Participants will have the ability to earn 0% - 200% of the target number of units based on achievement of the ROE Ratio and AFFO goals. The number of units earned will then have the ability to be modified +/- 20% based on the relative total shareholder return performance of AltaGas stock against comparator groups. The maximum payout opportunity cannot exceed 220% of target, even when including the modifier. Performance units will continue to vest on the third anniversary of the grant date.
20% of the Named Executive Officer awards will be in the form of restricted units. One-third of the restricted unit granted will vest on each of the first three anniversary dates of the grant assuming AltaGas pays a dividend over the 12- month period prior to each vesting date. If AltaGas does not pay a dividend during each year of the performance period, the restricted units which would have otherwise vested will be forfeited.
Timing of Compensation
We granted FY2018 LTI awards effective October 1, 2017, the first day of the fiscal year. Short-term incentive payouts were made in December following the end of the fiscal year. The HR Committee has the discretion to make awards at any time.
Following is a discussion of the timing of compensation decisions for FY2018:
Base salary changes for FY2018 were determined at the September 19, 2017 Joint HR Committee meeting and the September 20, 2017 Board meeting and implemented on October 1, 2018;
Short and long-term incentive goals for FY2018 were set at the September 19, 2017 Joint HR Committee meeting and the September 20, 2016 Board meeting;
Performance share and performance unit grants were approved at the September 19, 2017 Joint HR Committee meeting for grants effective on October 1, 2017; and
STI payments for FY2018 were approved at the HR Committee meeting held on November 7, 2018 and the Board meeting held on November 7, 2018.
Impact of Prior Compensation
WGL Holdings, Inc.
Washington Gas Light Company
Part III
Amounts realizable from prior compensation did not serve to increase or decrease FY2018 compensation amounts. The Joint HR Committee’s primary focus was on achieving market-level compensation opportunities.
Factors Considered in Decisions to Increase or Decrease Compensation Materially
As described above, market data, retention needs, performance and internal pay equity have been the primary factors considered in decisions to increase or decrease compensation opportunities materially. Corporate performance and individual performances are the primary factors in determining the ultimate value of those compensation opportunities.
Role of Executive Officers
Mr. McCallister, our former Chairman and CEO, recommended to the Joint HR Committee the compensation opportunities for the other Named Executive Officers. Mr. McCallister was not involved in determining his own compensation. In determining STI payouts for FY2018, Mr. Chapman, our current CEO, recommended a specific Individual Factor for each Named Executive Officer, except for himself. None of the other Named Executive Officers had any role in determining their executive compensation.
Other Compensation Matters
Historically, we have not had any written or unwritten employment agreements with any of the Named Executive Officers. Each Named Executive Officer has historically been an employee at will. In connection with the consummation of the Merger, certain compensatory agreements were entered into with the Named Executive Officers. For information on these agreements, please refer to the Impact of Merger section in this CD&A or the Current Report on Form 8-K filed with the SEC on July 12, 2018.
Compensation Risk Evaluation
For FY2018, Meridian conducted an update of a risk evaluation of WGL’s compensation policies and practices for all employees, including executives. Meridian has updated the risk evaluation every year since it was first conducted in 2011. Management reviewed the evaluation results with the HR Committee and Meridian. The goal of the evaluation was to identify any features of WGL’s compensation policies and practices that could encourage excessive risk-taking. The evaluation utilized a process that inventoried existing incentive plans and their salient features and examined design and administrative features of these plans to determine risk-aggravating or risk-mitigating factors.
In order to focus employees on performance objectives that promote the best interests of WGL and its shareholder, short-term and long-term incentive-based compensation is linked to the achievement of measurable financial and business goals and, in the case of short-term incentives, individual performance goals. The risk evaluation conducted by Meridian found that these arrangements are coupled with compensation design elements and other controls that discourage business decision-making focused solely on compensation consequences, and thus mitigate risk.
Based on the results of the evaluation, we believe that our executive compensation program reflects an appropriate mix of compensation elements and balances current and long-term performance objectives, cash and equity compensation, and risks and rewards associated with executive roles. The following features of our executive incentive compensation program illustrate this point:
Our performance goals and objectives reflect a balanced mix of performance measures to avoid excessive weight on a certain goal or performance measure;
•Our annual and long-term incentives provide a defined and capped range of payout opportunities;
Total direct compensation levels are heavily weighted towards long-term, equity-based incentive awards with vesting schedules that fully materialize over a number of years; and
Equity incentive awards are granted annually so executives always have unvested awards that could decrease significantly in value if our business is not managed for the long term.
Based on the above combination of program features, we believe that: (i) our executives are encouraged to manage WGL in a prudent manner, and (ii) our incentive programs are not designed in a manner to encourage our senior business leaders to take risks that are inconsistent with the best interests of WGL’s customers, shareholder and other stakeholders.
CEO PAY RATIO
As required by Section 953(b) of the Dodd-Frank Wall Street Reform and Consumer Protection Act, and Item 402(u) of Regulation S-K, we are providing the following information about the relationship of the median annual total compensation of all of our employees and the annual total compensation of our CEO, Mr. Chapman. For FY 2018, the median of the annual total compensation of all employees of WGL (other than Mr. Chapman) was $118,654. The annual total compensation of Mr. Chapman was $6,769,835, which reflects his total annual compensation as reported in the Summary Compensation Table for the period in F
WGL Holdings, Inc.
Washington Gas Light Company
Part III
Y 2018 in which he served as CEO included elsewhere in this Form 10-K and annualized to approximate what Mr. Chapman’s total annual compensation would have been if he served as CEO for the entire fiscal year. Based on this information, for fiscal 2018, the ratio of the annual total compensation of Mr. Chapman to the median of the annual total compensation of all employees of the WGL (other than Mr. Chapman) was 57.06 to 1.
As disclosed in our Current Report on Form 8-K filed with the SEC on July 12, 2018 in connection with the closing of the Merger and CEO transition, Mr. Chapman was granted a special retention bonus of $3,059,500 in July 2018. Excluding that special retention bonus, Mr. Chapman’s annual total compensation for the period in FY 2018 in which he served as CEO and annualized to approximate what Mr. Chapman’s total annual compensation would have been if he served as CEO for the entire fiscal year, would have been $3,710,335 in fiscal 2018, and the ratio of his annual total compensation to the median of the annual total compensation of all employees of WGL (other than Mr. Chapman) would have been 31.27 to 1, which we believe is more representative of a typical CEO pay year.
The ratios of the annual total compensation of Mr. Chapman to the median of the annual total compensation of all employees of WGL (other than Mr. Chapman) presented above are reasonable estimates calculated in a manner consistent with Item 402(u) of Regulation S-K. These ratios are not comparable to the ratios reported by other public companies, because each company uses its own assumptions, methodologies and estimates when computing the ratios.
To identify the median of the annual total compensation of all our employees, as well as to determine the annual total compensation of our median employee and Mr. Chapman, we took the following steps:
We determined that, as of September 30, 2018, our employee population consisted of approximately 1,686 individuals, with all of these individuals located in the United States. This population consisted of our full-time, part-time, and temporary employees, and does not include any independent contractors that we have engaged.
To identify the median employee from our employee population, we compared the amount of total compensation (consisting of salaries and overtime) of our employees as reflected in our payroll records as of September 30, 2018. We identified our median employee using this compensation measure, which was consistently applied to all employees included in the calculation.
Once we identified our median employee, we combined all of the elements of such employee’s compensation for FY 2018 in accordance with the requirements of Item 402(c)(2)(x) of Regulation S-K, resulting in annual total compensation of $118,654.
For the annual total compensation of Mr. Chapman, we used the amount reported in the “Total” column (column (j)) of our 2018 Summary Compensation Table included in this Form 10-K for the period in FY 2018 in which he served as CEO, and annualized it to approximate what Mr. Chapman’s total annual compensation would have been if he served as CEO for the entire fiscal year. Both Mr. McCallister and Mr. Chapman served as CEO during 2018. In accordance with instruction 10 to Item 402(u), we have elected to use Mr. Chapman’s compensation for purposes of the pay ratio disclosure as Mr. Chapman was serving as CEO on September 30, 2018, the date selected by us to identify the median employee.
This information is being provided for compliance purposes. Neither the HR Committee, which oversees executive compensation, nor the management of WGL used the pay ratio measure in making any compensation decisions.
COMPENSATION OF EXECUTIVE OFFICERS
The following tables and related footnotes and discussion present information about compensation for the Named Executive Officers. The “Summary Compensation Table” on the next page quantifies the value of the different forms of compensation awarded to, earned by, or paid to Named Executive Officers in FY 2016, FY 2017 and FY 2018.
The Summary Compensation Table should be read in conjunction with the tables and narrative descriptions that follow. The “Grants of Plan-Based Awards in FY 2018” table and the description of the material terms of the performance shares and performance units granted in FY 2018 that follows it provide information regarding the long-term equity incentives awarded to Named Executive Officers that are reported in the Summary Compensation Table. The “Stock Vested in FY 2018” section provides further information on the Named Executive Officers’ potential realizable value and actual value realized with respect to their equity awards.
The “Pension and Other Retirement Benefits” and “Non-Qualified Deferred Compensation” tables and the related description of the material terms of the retirement plans describe each Named Executive Officer’s retirement benefits and deferred compensation to provide context to the amounts listed in the Summary Compensation Table.
WGL Holdings, Inc.
Washington Gas Light Company
Part III
Summary Compensation Table for 2018
The following table presents information about compensation for the Named Executive Officers. It includes compensation awarded to, earned by or paid to the Named Executive Officers during FY 2016, FY 2017 and FY 2018. Each of the below-named individuals was also an executive officer of Washington Gas, our utility subsidiary.
The compensation shown in the following table was paid to the individual by Washington Gas.
|
| | | | | | | | | | | | | | | | | | | | | | | | | | | | | |
Name and Principal Position(1) (a) | Fiscal Year (b) | | Salary
(c) |
| | Bonus(2) (d) |
| | Stock Awards(3) (e) |
| | Non-Equity Incentive Compensation(4) ($) (g) |
| | Change in Pension Value and Non-qualified Deferred Compensation Earnings(5) ($) (h) |
| | All Other Compensation(6) ($) (i) |
| | Total ($) (j) |
|
| Adrian P. Chapman | 2018 | | $ | 588,873 |
| | $ | 3,059,500 |
| | $ | 1,040,388 |
| | $ | 534,742 |
| | $ | 258,258 |
| | $ | 1,246,947 |
| | $ | 6,728,708 |
|
| President and Chief | 2017 | | $ | 561,000 |
| | $ | 65,000 |
| | $ | 1,085,482 |
| | $ | 453,000 |
| | $ | 378,650 |
| | $ | 38,450 |
| | $ | 2,581,582 |
|
| Executive Officer | 2016 | | $ | 556,000 |
| | $ | — |
| | $ | 1,084,302 |
| | $ | 542,000 |
| | $ | 1,432,814 |
| | $ | 39,331 |
| | $ | 3,654,447 |
|
| Vincent L. Ammann, Jr. | 2018 | | $ | 494,364 |
| | $ | 2,348,200 |
| | $ | 629,171 |
| | $ | 356,779 |
| | $ | 418,322 |
| | $ | 758,380 |
| | $ | 5,005,216 |
|
| Executive Vice President | 2017 | | $ | 470,000 |
| | $ | 40,000 |
| | $ | 656,840 |
| | $ | 315,000 |
| | $ | 688,096 |
| | $ | 31,115 |
| | $ | 2,201,051 |
|
| and Chief Financial Officer | 2016 | | $ | 465,000 |
| | $ | — |
| | $ | 655,034 |
| | $ | 329,000 |
| | $ | 1,016,318 |
| | $ | 30,513 |
| | $ | 2,495,865 |
|
| Luanne S. Gutermuth | 2018 | | $ | 479,000 |
| | $ | — |
| | $ | 526,828 |
| | $ | 339,491 |
| | $ | 28,221 |
| | $ | 714,629 |
| | $ | 2,088,169 |
|
| Executive Vice President and | 2017 | | $ | 465,000 |
| | $ | 35,000 |
| | $ | 549,954 |
| | $ | 322,000 |
| | $ | 240,638 |
| | $ | 95,710 |
| | $ | 1,708,302 |
|
| and Chief Administrative Officer | 2016 | | $ | 450,000 |
| | $ | — |
| | $ | 536,352 |
| | $ | 290,000 |
| | $ | 396,861 |
| | $ | 83,187 |
| | $ | 1,756,400 |
|
| Leslie T. Thornton | 2018 | | $ | 407,000 |
| | $ | — |
| | $ | 447,654 |
| | $ | 242,038 |
| | $ | — |
| | $ | 638,557 |
| | $ | 1,735,249 |
|
| Senior Vice President and | 2017 | | $ | 395,000 |
| | $ | 35,000 |
| | $ | 467,187 |
| | $ | 223,000 |
| | $ | — |
| | $ | 117,437 |
| | $ | 1,237,624 |
|
Merger Transition Counsel
| 2016 | | $ | 390,000 |
| | $ | — |
| | $ | 464,855 |
| | $ | 276,000 |
| | $ | — |
| | $ | 112,182 |
| | $ | 1,243,037 |
|
| William R. Ford | 2018 | | $ | 283,000 |
| | $ | 817,400 |
| | $ | 198,069 |
| | $ | 122,398 |
| | $ | 54,984 |
| | $ | 283,530 |
| | $ | 1,759,381 |
|
| Vice President and | | | | | | | | | | | | | | | |
| Chief Accounting Officer | | | | | | | | | | | | | | | |
| Terry D. McCallister | 2018 | | $ | 712,097 |
| | $ | — |
| | $ | 2,091,514 |
| | $ | 612,284 |
| | $ | 3,593,348 |
| | $ | 7,784,407 |
| | $ | 14,793,650 |
|
| Former Chairman of the | 2017 | | $ | 864,000 |
| | $ | 110,181 |
| | $ | 2,182,762 |
| | $ | 876,000 |
| | $ | 982,032 |
| | $ | 36,526 |
| | $ | 5,051,501 |
|
| Board and Chief Executive Officer | 2016 | | $ | 849,000 |
| | $ | — |
| | $ | 2,161,740 |
| | $ | 993,000 |
| | $ | 2,271,170 |
| | $ | 31,309 |
| | $ | 6,306,219 |
|
(1)The principal positions shown are as of October 15, 2018. Please note that column (f) “Option Awards” has been omitted in accordance with SEC rules because no such compensation was awarded to, earned by, or paid to the Named Executive Officers during FY 2018, FY 2017 or FY 2016.
(2)Bonus consists of a cash retention bonus paid to the executive upon close of the Merger.
(3)Stock awards consist of performance shares and performance units. For a description of the vesting conditions of performance shares and performance units, see “Performance Share and Performance Unit Awards” in the CD&A. These amounts represent the aggregate grant date fair value of the performance share and performance unit awards computed in accordance with FASB ASC Topic 718. The amounts in column (e) include the sum of the values for performance shares and performance units. In FY 2018, the following Named Executive Officers were granted performance units having the following grant date fair values: Mr. Chapman - $520,200; Mr. Ammann - $314,600; Ms. Gutermuth - $263,450; Ms. Thornton - $223,850; Mr. Ford - $99,050; and Mr. McCallister - $1,045,750. In FY 2017, the following Named Executive Officers were granted performance units having the following grant date fair values: Mr. Chapman - $542,737; Mr. Ammann - $328,443; Ms. Gutermuth - $274,942; Ms. Thornton - $233,561; and Mr. McCallister - $1,091,340. In FY 2016, the following Named Executive Officers were granted performance units having the following grant date fair values: Mr. Chapman - $542,183; Mr. Ammann - $327,488; Ms. Gutermuth - $268,166; Ms. Thornton - $232,411; and Mr. McCallister - $1,080,874. The aggregate grant date fair values of the awards in column (e), assuming that maximum payouts are achieved, are as follows: FY 2018: Mr. Chapman - $1,820,681; Mr. Ammann - $1,101,057; Ms. Gutermuth - $921,966; Ms. Thornton - $783,405; Mr. Ford - $346,629; and Mr. McCallister - $3,660,146. FY 2017: Mr. Chapman - $1,918,534; Mr. Ammann - $1,160,943; Ms. Gutermuth - $972,001; Ms. Thornton - $825,714; and Mr. McCallister - $3,857,904. FY 2016: Mr. Chapman - $1,918,433; Mr. Ammann - $1,158,916; Ms. Gutermuth - $948,944; Ms. Thornton - $822,444; and Mr. McCallister - $3,824,691. For a discussion of the assumptions and methodologies used to calculate the amounts in column (e), see the discussion of performance shares and performance units contained in Note 11 (Stock-Based Compensation) to the WGL Consolidated Financial Statements, included elsewhere in this Form 10-K. The actual amount ultimately realized by a Named Executive Officer from the disclosed awards listed under column (e) will likely vary based on a number of factors, including our actual operating performance, stock price fluctuations, and differences from the valuation assumptions used and the timing of applicable vesting. For information regarding the treatment of stock awards pursuant to the Merger, please refer to the "Impact of the Merger" section of the CD&A included in this Form 10-K.
(4)The amounts shown in column (g) constitute the short-term incentive payouts made to the Named Executive Officers as described in the CD&A. A partial payout of the FY 2018 short-term incentive amount triggered upon close of the Merger was paid in August of 2018; the remaining amounts payable with respect to the FY 2018 short-term incentive plan will be paid in December 2018.
(5)Column (h) reflects pension accruals for the officers, except for Ms. Thornton, and payments received by Mr. McCallister during FY2018 related to his pension and SERP ($13,627). Ms. Thornton is not a participant in the Pension Plan. There are no above market or preferential earnings on compensation deferred on a basis that is not tax-qualified, including such earnings on non-qualified contribution plans. The pension accrual amounts represent the difference in present value (measured at the respective fiscal year-end dates shown in the table) based on assumptions shown in the text following the “Pension and Other Retirement Benefits” table set forth later in this Form 10-K.
WGL Holdings, Inc.
Washington Gas Light Company
Part III
(6)The amounts in column (i) represent the values of perquisites and matching contributions under the 401(k) Plan and, with respect to Mses. Gutermuth and Thornton and Mr. Ford, the amount of company contributions under the DC SERP and the Defined Contribution Restoration Plan. The value of perquisites is set forth in the “Perquisites” table. Also included in column (i) is the additional value realized by each Named Executive Officer related to the acceleration of the officer's 2016 and 2017 long-term incentive awards, which is calculated as the difference between the originally reported grant date fair value of the award and the amount paid out to the individual upon the close of the Merger and, for purposes of the Summary Compensation Table, includes dividend equivalents. The Named Executive Officers received the following amounts as additional value realized in connection with the acceleration of the 2016 and 2017 awards: Mr. Chapman - $1,202,558; Mr. Ammann - $727,311; Ms. Gutermuth - $604,353; Ms. Thornton - $516,906; Mr. Ford - $228,439; and Mr. McCallister - $2,411,035. Mr. McCallister realized an additional $50,301 with respect to the payout of his 2018 award. The following Named Executive Officers received the following amounts as matching contributions under the 401(k) Plan during FY 2018: Mr. Chapman - $10,671; Mr. Ammann - $11,000; Ms. Gutermuth - $11,000; Ms. Thornton - $9,421; Mr. Ford - $9,808; and Mr. McCallister - $10,954. The following Named Executive Officers received the following amounts as matching contributions under the 401(k) Plan during FY 2017: Mr. Chapman - $10,357; Mr. Ammann - $10,800; Ms. Gutermuth - $10,800; Ms. Thornton - $10,800; and Mr. McCallister - $10,707. The following Named Executive Officers received the following amounts as matching contributions under the 401(k) Plan during FY 2016: Mr. Chapman - $10,302; Mr. Ammann - $10,600; Ms. Gutermuth - $10,600; Ms. Thornton - $10,600; and Mr. McCallister - $10,510. The company contributions to the DC SERP and the Defined Contribution Restoration Plan for Ms. Gutermuth were $69,374 for FY2018, $61,328 for FY 2017 and $50,634 for FY 2016. The company contributions to the DC SERP, the Defined Contribution Restoration Plan and the enhanced benefit under the 401(k) Plan for Ms. Thornton were $91,690 in FY2018, $87,201 in FY 2017 and $82,708 in FY 2016. The company contributions to the DC SERP and the Defined Contribution Restoration Plan for Mr. Ford were $29,482 in FY 2018. In addition to the foregoing items, the amount reported for Mr. McCallister includes amounts paid or payable to him in connection with change in control severance benefits ($5,148,418), his service agreement with Washington Gas entered into in connection with the Merger ($34,232), fees paid for service on the WGL Board ($5,910) and amounts payable for remaining unused vacation ($92,423).
(7) Mr. Ford was not a named executive officer prior to FY 2018.
Perquisites
We have a program of income tax, estate and financial planning services for our executive officers. We pay the actual cost of these services provided to the executive up to a pre-determined ceiling depending on the level of the executive officer. The highest amount provided to any executive under the income tax, estate and financial planning program is $10,000 per year. We also pay the cost of certain other perquisites for executive officers, including: parking at our headquarters building, a vehicle allowance (or, in the case of our former Chief Executive Officer during FY2018, transportation to and from our offices), and an annual physical examination. The Named Executive Officers also have limited ability to obtain company tickets to sporting and entertainment events for personal use, for which there is no incremental cost to WGL.
The following table sets forth the incremental value of perquisites for the Named Executive Officers in FY 2018 included in the “All Other Compensation” column (i) of the Summary Compensation Table above.
FY 2018 INCREMENTAL COST OF PERQUISITES PROVIDED TO NAMED EXECUTIVE OFFICERS
|
| | | | | | | | | | | | | | | | | | | | | | | | | | | | |
| Name and Principal Position | Fiscal Year | Tax and Financial Counseling ($) |
| | Vehicle Allowance/ Transpor-tation ($) |
| | Parking ($) |
| | Physical ($) |
| | Insurance ($) |
| | Tax Gross-up ($) |
| | Total ($) |
|
| Adrian P. Chapman | 2018 | $ | 10,018 |
| | $ | 8,400 |
| | $ | 7,260 |
| | $ | 2,272 |
| | $ | 2,400 |
| | $ | 3,368 |
| | $ | 33,718 |
|
| President and Chief | | | | | | | | | | | | | | |
| Operating Officer | | | | | | | | | | | | | | |
| Vincent L. Ammann, Jr. | 2018 | $ | 3,805 |
| | $ | 8,400 |
| | $ | 3,660 |
| | $ | — |
| | $ | 2,400 |
| | $ | 1,804 |
| | $ | 20,069 |
|
| Senior Vice President and | | | | | | | | | | | | | | |
| Chief Financial Officer | | | | | | | | | | | | | | |
| Luanne S. Gutermuth | 2018 | $ | 10,160 |
| | $ | 8,400 |
| | $ | 3,660 |
| | $ | 3,500 |
| | $ | 2,400 |
| | $ | 1,782 |
| | $ | 29,902 |
|
| Senior Vice President, Shared | | | | | | | | | | | | | | |
Services and Chief Human Resources Officer | | | | | | | | | | | | | | |
| Leslie T. Thornton | 2018 | $ | 4,500 |
| | $ | 8,400 |
| | $ | 4,020 |
| | $ | — |
| | $ | 2,138 |
| | $ | 1,482 |
| | $ | 20,540 |
|
| Senior Vice President and | | | | | | | | | | | | | | |
| Merger Transition Counsel | | | | | | | | | | | | | | |
| William R. Ford | 2018 | $ | — |
| | $ | 8,400 |
| | $ | 3,660 |
| | $ | 2,138 |
| | $ | — |
| | $ | 1,603 |
| | $ | 15,801 |
|
| Vice President and | | | | | | | | | | | | | | |
| Chief Accounting Officer | | | | | | | | | | | | | | |
| Terry D. McCallister | 2018 | $ | 13,473 |
| | $ | 378 |
| | $ | 6,050 |
| | $ | 3,883 |
| | $ | 1,985 |
| | $ | 5,366 |
| | $ | 31,135 |
|
| Former Chairman of the | | | | | | | | | | | | | | |
| Board and Chief Executive Officer | | | | | | | | | | | | | | |
WGL Holdings, Inc.
Washington Gas Light Company
Part III
The amounts set forth in the “tax gross-up” column in the above table represent the amount of taxes paid by WGL on behalf of officers relating to life insurance coverage with benefits in excess of $50,000. We provide the executive officers (and all employees) life insurance equal to one times the employees’ salary. Under the Internal Revenue Code, the cost of the first $50,000 of life insurance paid by us is not taxable income to the employee. However, the premium we paid for insurance in excess of $50,000 is taxable income (imputed income) to the employee. WGL “grosses up” the income of the Named Executive Officers for the taxes on this imputed income (i.e., we pay the taxes for the Named Executive Officers on this imputed income). The imputed income amount and the amount of the tax gross-up are both taxable income to the Named Executive Officer. The amounts under the column entitled, “Insurance” in the above table represent the premiums paid by WGL for the respective Named Executive Officer’s long-term care and imputed income for life insurance.
Grants of Plan-Based Awards in FY 2018
The following Grants of Plan-Based Awards table sets forth information concerning the range of short-term incentive opportunities and opportunities under grants of performance shares and performance units to our Named Executive Officers during FY 2018. The grants in the following table were made under the 2016 Plan.
WGL Holdings, Inc.
Washington Gas Light Company
Part III
|
| | | | | | | | | | | | | | | | | | | | | | | |
| | | | Estimated Future Payouts Under
Non-Equity Incentive Plan Awards(1) | | Estimated Future Payouts Under Equity Incentive Plan Awards(2) |
| Name (a) | | Grant Date (b) | Threshold(3)
($) (c) | | Target
($) (c) | | Maximum ($) (e) | | Threshold Number of Shares of Stock(4) (#) (f) | | Target Number of Shares of Stock (#) (g) | | Maximum Number of Shares of Stock (#) (h) | | Grant
Date Fair
Value of
Stock(5)
($) (l) |
| Adrian P. Chapman | | | | | | | | | | | | | | | |
| Short-term Incentive | | N/A | $ | 160,137 |
| | $ | 457,533 |
| | $ | 686,300 |
| | | | | | | | |
| Dividend Coverage Performance Shares | | 10/1/2017 | | | | | | | 3,089 | | 3,089 | | 3,089 | | $ | 260,094 |
|
| Return on Equity Performance Shares | | 10/1/2017 | | | | | | | 1,545 | | 3,089 | | 6,178 | | $ | 260,094 |
|
| Return on Equity Performance Units | | 10/1/2017 | $ | 260,100 |
| | $ | 520,200 |
| | $ | 1,040,400 |
| | | | | | | | |
| Vincent L. Ammann, Jr. | | | | | | | | | | | | | | | |
| Short-term Incentive | | N/A | $ | 107,988 |
| | $ | 308,566 |
| | $ | 462,849 |
| | | | | | | | |
| Dividend Coverage Performance Shares | | 10/1/2017 | | | | | | | 1,868 | | 1,868 | | 1,868 | | $ | 157,286 |
|
| Return on Equity Performance Shares | | 10/1/2017 | | | | | | | 934 | | 1,868 | | 3,736 | | $ | 157,286 |
|
| Return on Equity Performance Units | | 10/1/2017 | $ | 157,300 |
| | $ | 314,600 |
| | $ | 629,200 |
| | | | | | | | |
| Luanne S. Gutermuth | | | | | | | | | | | | | | | |
| Short-term Incentive | | N/A | $ | 100,590 |
| | $ | 287,400 |
| | $ | 431,100 |
| | | | | | | | |
| Dividend Coverage Performance Shares | | 10/1/2017 | | | | | | | 1,564 | | 1,564 | | 1,564 | | $ | 131,689 |
|
| Return on Equity Performance Shares | | 10/1/2017 | | | | | | | 782 | | 1,564 | | 3,128 | | $ | 131,689 |
|
| Return on Equity Performance Units | | 10/1/2017 | $ | 131,725 |
| | $ | 263,450 |
| | $ | 526,900 |
| | | | | | | | |
| Leslie T. Thornton | | | | | | | | | | | | | | | |
| Short-term Incentive | | N/A | $ | 78,358 |
| | $ | 223,850 |
| | $ | 335,775 |
| | | | | | | | |
| Dividend Coverage Performance Shares | | 10/1/2017 | | | | | | | 1,329 | | 1,329 | | 1,329 | | $ | 111,902 |
|
| Return on Equity Performance Shares | | 10/1/2017 | | | | | | | 665 | | 1,329 | | 2,658 | | $ | 111,902 |
|
| Return on Equity Performance Units | | 10/1/2017 | $ | 111,925 |
| | $ | 223,850 |
| | $ | 447,700 |
| | | | | | | | |
| William R. Ford | | | | | | | | | | | | | | | |
| Short-term Incentive | | N/A | $ | 39,620 |
| | $ | 113,200 |
| | $ | 169,800 |
| | | | | | | | |
| Dividend Coverage Performance Shares | | 10/1/2017 | | | | | | | 588 | | 588 | | 588 | | $ | 49,510 |
|
| Return on Equity Performance Shares | | 10/1/2017 | | | | | | | 294 | | 588 | | 1,176 | | $ | 49,510 |
|
| Return on Equity Performance Units | | 10/1/2017 | $ | 49,525 |
| | $ | 99,050 |
| | $ | 198,100 |
| | | | | | | | |
| Terry D. McCallister | | | | | | | | | | | | | | | |
| Short-term Incentive | | N/A | $ | 214,299 |
| | $ | 612,284 |
| | $ | 918,426 |
| | | | | | | | |
| Dividend Coverage Performance Shares | | 10/1/2017 | | | | | | | 6,210 | | 6,210 | | 6,210 | | $ | 522,882 |
|
| Return on Equity Performance Shares | | 10/1/2017 | | | | | | | 3,105 | | 6,210 | | 12,420 | | $ | 522,882 |
|
| Return on Equity Performance Units | | 10/1/2017 | $ | 522,875 |
| | $ | 1,045,750 |
| | $ | 2,091,500 |
| | | | | | | | |
Note that columns: (i) “All Other Stock Awards,” (j) “All Other Option Awards: Number of Securities,” and (k) “Exercise Price of Option Awards,” have been omitted in accordance with SEC rules because no such compensation was awarded to, earned by, or paid to the Named Executive Officers during FY 2018.
No consideration was paid by any of the Named Executive Officers for the awards listed in the “Grants of Plan-Based Awards” table.
(1)Amounts in these columns represent the threshold, target and maximum payouts under our short-term incentive program based on FY 2018 performance, and the threshold, target and maximum payouts under our performance unit program for the 36-month performance period from October 1, 2017 through September 30, 2020.
(2)Amounts in these columns represent the threshold, target and maximum payouts under our performance share program for the 36-month performance period from October 1, 2017 through September 30, 2020.
WGL Holdings, Inc.
Washington Gas Light Company
Part III
(3)Threshold payout for non-equity incentive awards (as it relates to performance units) reflect payout amounts if the ROE Ratio achieved is 90%. Threshold payout for non-equity incentive awards (as it relates to short-term incentive awards) equal to 35% of the target award and are based on the minimum individual factor and corporate factors for which a payout will be made. Although performance unit grants are considered equity incentive plan awards, the estimated future payouts under these grants are included in these columns because awards are denominated in dollars and paid out in cash, rather than shares of stock.
(4)Threshold payout for equity incentive awards (as it relates to performance shares) reflect payout amounts if our ROE Ratio achieved is 90% and the dividend coverage performance shares vest.
(5)Amounts in this column represent the aggregate grant date fair value computed in accordance with FASB ASC Topic 718 of performance unit and performance share awards granted in FY 2018. The values of these awards, assuming that the highest level of performance conditions is achieved, are as follows: ROE performance shares: Mr. Chapman - $520,188; Mr. Ammann - $314,571; Ms. Gutermuth - $263,378; Ms. Thornton - $223,804; Mr. Ford - $99,020; and Mr. McCallister - $1,045,764; dividend coverage performance shares: Mr. Chapman - $260,094; Mr. Ammann - $157,286; Ms. Gutermuth - $131,689; Ms. Thornton - $111,902; Mr. Ford - $49,510; and Mr. McCallister - $522,882; ROE performance units: Mr. Chapman - $1,040,400; Mr. Ammann - $629,200; Ms. Gutermuth - $526,900; Ms. Thornton - $447,700; Mr. Ford - $198,100; and Mr. McCallister - $2,091,500. For a discussion of the assumptions and methodologies used to calculate the amounts reported, see the discussion of performance shares and performance units contained in Note 11 (Stock Based Compensation) to WGL’s Consolidated Financial Statements, included as part of this Form 10-K.
Options
WGL has not granted stock options since October 1, 2006 because WGL’s compensation program changed to eliminate granting stock options and to begin granting performance shares and performance units, and none of the Named Executive Officers owned stock options during FY 2018.
Outstanding Equity Awards at FY 2018 Year-End
The Outstanding Equity Awards at Year End table has been omitted from this Form 10-K because all equity awards outstanding at the time of the merger were either vested upon close of the Merger or were converted to cash awards. No equity awards were outstanding as of the end of the fiscal year.
Stock Vested in FY 2018
The following table provides information about the value realized by the Named Executive Officers on stock awards vesting during FY 2018.
|
| | | | | | | |
| | Stock Awards |
| Name (a) | Number of Shares Acquired on Vesting(1) (#) (d) | | Shares Withheld to Cover Taxes (#) | | Value Realized on
Vesting(2) ($) (e) |
|
| Adrian P. Chapman | 21,960 | | 0 | | $ | 1,937,970 |
|
| Vincent L. Ammann, Jr. | 13,279 | | 0 | | $ | 1,171,872 |
|
| Luanne S. Gutermuth | 11,009 | | 0 | | $ | 971,544 |
|
| Leslie T. Thornton | 9,436 | | 0 | | $ | 832,727 |
|
| William R. Ford | 4,167 | | 0 | | $ | 367,738 |
|
| Terry D. McCallister | 43,990 | | 0 | | $ | 3,882,118 |
|
(1)The information in the above table reflects the vesting of performance shares. The vesting of the shares was accelerated in connection with the close of the Merger. The shares were deemed to be issued on July 6, 2018 and then were canceled in exchange for the right to receive the merger consideration of $88.25 per share.
(2)The amounts shown in column (e) for the shares vested in connection with equal the product of (i) the Merger consideration price paid for the WGL Holdings common stock outstanding as of the close of the Merger ($88.25) multiplied by (ii) the number of shares acquired upon vesting as set forth in column (d).
Non-Qualified Deferred Compensation
The following table presents information regarding the contributions to and earnings on the Named Executive Officers’ deferred compensation balances during FY 2018, and also shows the total deferred amounts for the Named Executive Officers at the end of FY 2018.
WGL Holdings, Inc.
Washington Gas Light Company
Part III
|
| | | | | | | | | | | | | | | | | | | | |
| Name (a) | | Plan | | Executive Contributions in Last FY (b) |
| | Registrant Contributions in Last FY ($) (c) |
| | Aggregate Earnings in Last FY ($) (d) |
| | Aggregate Withdrawals / Distributions ($) (e) |
| | Aggregate Balance at Last FYE ($) (f) |
|
| Adrian P. Chapman | | n/a | | — |
| | — |
| | — |
| | — |
| | — |
|
| Vincent L. Ammann, Jr. | | n/a | | — |
| | — |
| | — |
| | — |
| | — |
|
Luanne S. Gutermuth(1) | | DC SERP DC Restoration | | — |
| | $ | 69,374 |
| | $ | 36,249 |
| | — |
| | $ | 480,535 |
|
Leslie T. Thornton (2) | | DC SERP DC Restoration | | | | $ | 77,940 |
| | $ | 22,671 |
| | | | $ | 452,398 |
|
William R. Ford (3) | | DC SERP DC Restoration | | — |
| | $ | 29,482 |
| | $ | 15,697 |
| | — |
| | $ | 281,147 |
|
| Terry D. McCallister | | n/a | | — |
| | __ |
| | __ |
| | — |
| | __ |
|
(1)Ms. Gutermuth received the indicated amounts as a participant in the DC SERP and the DC Restoration Plan. The terms of these plans are described under the “Pension and Other Retirement Benefits” section of this Form 10-K. The amount indicated under column (f) reflects the $448,660 in the DC SERP, in which Ms. Gutermuth was 100% vested as of the end of FY 2018, and $31,875 in the DC Restoration Plan, in which Ms. Gutermuth was 100% vested as of the end of FY 2018.
(2)Ms. Thornton received the indicated amounts as a participant in the DC SERP and the DC Restoration Plan. The terms of these plans are described under the “Pension and Other Retirement Benefits” section of this Form 10-K. The amount indicated under column (f) reflects $392,133 in the DC SERP, in which Ms. Thornton was 100% vested as of the end of FY 2018, and $60,265 in the DC Restoration Plan, in which Ms. Thornton was 100% vested as of the end of FY 2018.
(3)Mr. Ford received the indicated amounts as a participant in the DC SERP and the DC Restoration Plan. The terms of these plans are described under the “Pension and Other Retirement Benefits” section of this Form 10-K. The amount indicated under column (f) reflects $280,830 in the DC SERP, in which Mr. Ford was 100% vested as of the end of FY 2018, and $316 in the DC Restoration Plan, in which Mr. Ford was 100% vested as of the end of FY 2018.
Pension and Other Retirement Benefits
The following table and related discussion describes the present value of accumulated benefits payable under the Pension Plan (a qualified plan), the DB SERP (a non-qualified plan) and the Defined Benefit Restoration Plan (a non-qualified plan).
|
| | | | | | | | |
| Name (a) | | Plan Name (b) | | Number of Years Credited Service (#) (c) | | Present Value of Accumulated Benefit ($) (d) |
|
| Adrian P. Chapman | | Pension Plan | | 37.0 | | $ | 1,519,776 |
|
| | | DB SERP | | 30.0 | | $ | 6,525,950 |
|
| Vincent L. Ammann, Jr. | | Pension Plan | | 15.0 | | $ | 640,665 |
|
| | | DB SERP | | 29.0 | | $ | 4,491,596 |
|
| Luanne S. Gutermuth | | Pension Plan | | 20.5 | | $ | 796,586 |
|
| | | DB Restoration | | 20.5 | | $ | 602,633 |
|
| William R. Ford | | Pension Plan | | 13.5 | | $ | 688,215 |
|
| | | DB Restoration | | 13.5 | | $ | 24,358 |
|
| Terry D. McCallister | | Pension Plan | | 18.5 | | $ | 1,047,361 |
|
| | | DB SERP | | 30.0 | | $ | 16,301,617 |
|
Ms. Thornton is not a participant under the Pension Plan, the DB SERP or the DB Restoration plan.
WGL Holdings, Inc.
Washington Gas Light Company
Part III
The following actuarial assumptions were used in determining the amounts set forth in the “Pension and Other Retirement Benefits” table: |
| | | | | | |
| Measurement Date | | September 30, 2018 |
| | September 30, 2017 |
|
| Discount Rate | | | | |
| DB SERP and DB Restoration | | 4.30 | % | | 3.60 | % |
| Pension Plan | | 4.40 | % | | 3.90 | % |
| Pre-retirement Mortality | | None |
| | None |
|
| Post-retirement Mortality | | RP-2014 mortality tables with a base year of 2006 projected using the MP-2014 mortality improvement scale, adjusted to converge over 15 years to an ultimate rate of 0.75% at age 85, grading to 0% at age 115 in 2022 |
| | RP-2014 mortality tables with a base year of 2006 projected using the MP-2014 mortality improvement scale, adjusted to converge over 15 years to an ultimate rate of 0.75% at age 85, grading to 0% at age 115 in 2022 |
|
| Retirement Age | | 65 |
| | 65 |
|
| Payment Form | | | | |
| Amount Earned After 12/31/2004 for DB | | Actual 409A Lump Sum Election |
| | Actual 409A Lump Sum Election |
|
| SERP and DB Restoration | | Reflecting a 2.10% Interest Rate |
| | Reflecting a 2.10% Interest Rate |
|
| Qualified Pension Plan and Pre-409A DB SERP | | Qualified Joint & Survivor Annuity |
| | Qualified Joint & Survivor Annuity |
|
For a discussion of the assumptions and methodologies used to calculate the amounts reported in the “Pension and Other Retirement Benefits” table above, see the discussion contained in Note 9 (Pension and Other Post-Retirement Benefit Plans)
to WGL’s Consolidated Financial Statements, and Management’s Discussion and Analysis of Financial Condition and Results of Operations included as part this Form 10-K.
Summary of Retirement Benefits
Washington Gas provides retirement benefits to the Named Executive Officers under the terms of qualified and non-qualified defined-benefit and defined-contribution retirement plans.
Retirement benefits provide post-employment security to our employees. As of the end of FY 2018, the following primary retirement benefit programs were available to the Named Executive Officers:
the 401(k) Plan, a tax-qualified defined-contribution plan in which the Named Executive Officers participate on the same terms as our other participating employees;
the Pension Plan, a tax-qualified, non-contributory pension plan covering all active employees (including executive officers) and vested former employees of Washington Gas;
the DB SERP, a non-qualified defined-benefit retirement plan which provides the Named Executive Officers a benefit up to 60% of the individual’s final average compensation, as determined under that plan;
the DC SERP, a non-qualified defined-contribution retirement plan;
the Defined Benefit Restoration Plan, a non-qualified defined-benefit retirement plan; and
the Defined Contribution Restoration Plan, a non-qualified defined-contribution retirement plan.
Pension Plan and 401(k) Plans
Each Named Executive Officer participates in the Pension Plan, except for Ms. Thornton. The Pension Plan is a tax-qualified, non-contributory pension plan covering active employees (including certain executive officers) and vested former employees of Washington Gas and certain affiliates. The Pension Plan is now closed to new entrants. Participation in the Pension Plan was closed: (i) to employees hired on or after January 1, 2009 who are covered under the collective bargaining agreements with the International Brotherhood of Teamsters and Office and Professional Employees International Union Local 2, (ii) to management employees first hired on or after July 1, 2009, (iii) to Hampshire Gas Company employees first hired on or after January 1, 2010, and (iv) to employees first hired on or after January 1, 2010 who are covered by the collective bargaining agreement between Washington Gas and the International Brotherhood of Electrical Workers, Local 1900. Instead of Pension Plan benefits, employees hired after the aforementioned dates receive an enhanced benefit in the form of an employer contribution under the 401(k) Plans. This enhanced benefit provides a company contribution between 4%-6% of base compensation (depending on length of service) to subject employees. Executive officers receive this benefit on the same terms as our other participating employees. Ms. Thornton joined the company after 2009 and therefore receives the enhanced 401(k) plan benefit.
WGL Holdings, Inc.
Washington Gas Light Company
Part III
The Pension Plan provides an unreduced retirement benefit at termination of employment at the normal retirement age of 65. A participant must have five years of accredited service under the Pension Plan to vest in a pension benefit. The Pension Plan accrued benefit is calculated using a formula based on accredited service and highest three years (High Three) of average compensation. High Three average compensation is the average of the employee’s rate of annual basic compensation on December 31 of each of three calendar years of accredited service preceding that reflects the employee’s highest compensation prior to the employee’s normal retirement date, early or disability retirement date, actual date of retirement or date of termination of employment, whichever is applicable. Annual basic compensation consists of the regular annual salary or wages of an employee, excluding bonuses, compensation for overtime or other extra or special compensation, but including commissions, bonuses and other forms of incentive compensation paid to salesmen. The rate of High Three average compensation is multiplied by the percentage rate that applies to the participant’s years of accredited service. Bargaining units representing certain Washington Gas employees have negotiated different percentages for their members. A change was made to the formula for calculating the retirement benefit for management employees and for employees covered by the collective bargaining agreement with the International Brotherhood of Electrical Workers, Local 1900 who retire on or after January 1, 2010 and for employees covered by Office and Professional Employees International Union Local 2 who retire on or after January 1, 2009. The retirement benefit for these employees will be determined by using the average of the retiree’s highest three years of earnings, rather than the average of the retiree’s last three years of earnings. The benefit for the International Brotherhood of Teamsters, Local 96 is still based on the employees last three years of final average compensation.
An early retirement benefit, discounted for age, is available to employees at age 55 with five years of accredited service. Employees age 55 or older having any combination of age and accredited service that equals 90 or more and employees with 30 years of accredited service may retire early without discounting their pension for age. As of the date of this Form 10-K, of the Named Executive Officers, Mr. Chapman, our President and Chief Executive Officer, Mr. Ammann, our Chief Financial Officer, Ms. Gutermuth, our Chief Administrative Officer, and Mr. Ford, our Chief Accounting Officer, are eligible to receive an early retirement benefit.
The normal form of pension benefit is a joint and survivor annuity for an employee with an eligible spouse and a single-life annuity for an unmarried employee. Participants may elect among various payment options that will be the actuarial equivalent of the normal form of retirement benefit. There is no lump sum optional form of payment under the current Pension Plan.
Defined Benefit Supplemental Executive Retirement Plan
Each Named Executive Officer, except Mses. Gutermuth and Thornton and Mr. Ford, participates in the DB SERP, which is a non-qualified, unfunded defined benefit retirement plan. The purpose of the DB SERP is to provide an additional incentive to attract and retain key employees designated by the Board. The Board of Washington Gas designates participants in the DB SERP.
The DB SERP provides a retirement benefit that supplements the benefit payable under the Pension Plan. The benefit amount is based on years of benefit service and the average of the participant’s highest rates of annual basic compensation, including any short-term incentive awards, on December 31 of the three years out of the final five years of the participant’s service as a participant. Benefit service under the DB SERP consists of years of accredited service under the Pension Plan, plus the number of years of plan service under the DB SERP, to a maximum of 30 years. There is a vesting schedule for the benefit that varies depending upon the point in time the individual became a participant in the DB SERP.
At normal retirement, the DB SERP participant is entitled to an annual benefit equal to the participant’s vested percentage of an amount equal to 2% of final average compensation multiplied by the number of years of benefit service, reduced by the amount of the normal retirement benefit paid under the Pension Plan and the amount of any other supplemental pension benefit provided by Washington Gas. Participants in the CIC Plan, described elsewhere in this Form 10-K, may earn extra years of benefit service under the DB SERP in certain events of termination following a change in control, up to the maximum of 30 years of benefit service.
The DB SERP provides an unreduced retirement benefit at termination of employment at the normal retirement age of 65.
An early retirement benefit, discounted for age, is available to participants at age 55 with 10 years of benefit service. As of the date of this Form 10-K, the two Named Executive Officers who participate in the DB SERP, Mr. Chapman, our President and Chief Executive Officer, and Mr. Ammann, our Chief Financial Officer, are eligible to receive an early retirement benefit under the DB SERP. Mr. McCallister, our former Chief Executive Officer, has commenced his benefit under this plan following his retirement.
A participant in the DB SERP can elect the same forms of benefit available under the Pension Plan, and in addition can elect a lump sum payment form. For DB SERP benefits earned through December 31, 2004, the lump sum amount is limited to the amount of the benefit attributable to short-term incentive compensation. For benefits earned on and after January 1, 2005, participants may elect a lump sum benefit in any percentage.
WGL Holdings, Inc.
Washington Gas Light Company
Part III
The lump sum amount is an actuarial determination based on the participant’s life expectancy discounted using the yield on the zero-coupon U.S. Treasury security with maturity equal to the maturity of each year’s payment. The lump sum shall equal the sum of the discounted payments.
The DB SERP is unfunded. Accordingly, all benefits constitute an unfunded contractual payment obligation of the company and a participant’s right to receive payments under the DB SERP will be no greater than the right of an unsecured general creditor of the company.
Defined Contribution Supplemental Executive Retirement Plan
The DC SERP provides supplemental retirement benefits to executive officers who: (i) are not participants in the DB SERP; and (ii) are selected by the Board to participate in the DC SERP. Subject to certain conditions, the DC SERP provides the following benefits to participating employees: (i) a company credit equal to 6% of total pay (base salary and incentive pay); (ii) matching credit equal to 4% of annual short-term incentive pay only; and (iii) for employees who do not participate in the Pension Plan, an incentive credit equal to 4-6% of annual short-term incentive pay only depending on years of service. Benefits will be credited each pay period to a bookkeeping account maintained on behalf of the participant. Participant accounts will be credited with notional earnings and reduced for notional losses based upon the performance of investment alternatives selected by participants. Benefits will be paid in a lump sum upon the participant’s termination of employment or disability (whichever occurs first). The DC SERP is unfunded. Accordingly, all benefits constitute an unfunded contractual payment obligation of the company and a participant’s right to receive payments under the DC SERP will be no greater than the right of an unsecured general creditor of the company. Mses. Gutermuth and Thornton and Mr. Ford are participants in the DC SERP, and Ms. Thornton receives the additional incentive credit for employees who do not participate in the Pension Plan.
Defined Contribution Restoration Plan
The Defined Contribution Restoration Plan provides supplemental retirement benefits to employees: (i) who are not participants in the DB SERP; and (ii) whose base pay exceeds the limit set forth under Section 401(a)(17) of the Internal Revenue Code (i.e., $270,000 in 2017). Subject to certain conditions, the Defined Contribution Restoration Plan provides the following benefits to participating employees: (i) a base pay matching credit equal to 4% of the portion of the participant’s base pay only that exceeds the limit in Section 401(a)(17) of the Internal Revenue Code, and (ii) for employees who do not participate in the Pension Plan, a base pay restoration credit equal to 4-6% of the portion of the participant’s base pay only that exceeds the limit Section 401(a) (17) of the Internal Revenue Code. The actual percentage is based on years of service. Benefits are credited each pay period to a bookkeeping account maintained on behalf of the participant.
Participant accounts are credited with notional earnings and reduced for notional losses based upon the performance of investment alternatives selected by participants. Participants generally will be 100% vested in their Defined Contribution Restoration Plan benefits at all times except in the case of certain terminations of employment. Benefits will be paid in a lump sum upon a participant’s termination of employment or disability (whichever occurs first). The Defined Contribution Restoration Plan is unfunded. Accordingly, all benefits constitute an unfunded contractual payment obligation of the company and a participant’s right to receive payments under the Defined Contribution Restoration Plan will be no greater than the right of an unsecured general creditor of the company. Mses. Gutermuth and Thornton and Mr. Ford are participants in the Defined Contribution Restoration Plan.
Defined Benefit Restoration Plan
The Defined Benefit Restoration Plan provides supplemental retirement benefits to employees designated by the Board of Washington Gas who are not also participants in the DB SERP. The Defined Benefit Restoration Plan provides a retirement benefit that supplements the benefit payable under the Pension Plan. With certain exceptions, benefits under the plan vest over five years. Ms. Gutermuth and Mr. Ford are participants in the Defined Benefit Restoration Plan.
At normal retirement, the Defined Benefit Restoration Plan participant is entitled to an annual benefit equal to the benefit under the Pension Plan, calculated (i) by including annual incentive compensation in the definition of final average compensation, (ii) based on the final three calendar years of accredited service, and (iii) without regard to the limits on compensation set forth in Section 401(a)(17) of the Internal Revenue Code; and then reduced by the amount of the normal retirement benefit paid under the Pension Plan.
The Defined Benefit Restoration Plan provides an unreduced retirement benefit at termination of employment at the normal retirement age of 65. An early retirement benefit, discounted for age, is available to vested participants at age 55.
In general, a participant in the Defined Benefit Restoration Plan can elect the same forms of benefit available under the Pension Plan, and in addition can elect a lump sum payment form. The Defined Benefit Restoration Plan is unfunded. Accordingly, all benefits constitute an unfunded contractual payment obligation of the company and a participant’s right to receive payments under the Defined Benefit Restoration Plan will be no greater than the right of an unsecured general creditor of the company.
WGL Holdings, Inc.
Washington Gas Light Company
Part III
POTENTIAL PAYMENTS UPON TERMINATION OR CHANGE IN CONTROL
Change in Control Severance Plan for Certain Executives
Each of the Named Executive Officers listed in the Summary Compensation Table in this Form 10-K participated in the CIC Plan prior to the Merger. Change in control protections under that Plan provided severance pay and, in some situations, vesting or payment of long-term incentive awards, upon the Merger. The change in control provisions under the CIC Plan were effective during the period of one year prior to, and two years following, a change in control of WGL or Washington Gas. The CIC Plan incorporated the definition of a change in control as defined in the Change in Control Policy (“CIC Policy”). The Merger qualified as a Change in Control.
For the two years following a change in control, the Named Executive Officers are entitled to compensation (base salary, annual incentives, savings and retirement plans, welfare benefit plans, expenses, fringe benefits, office and vacation) consistent with that in place prior to the change in control or available after the change in control if more beneficial. Annual base salary is defined as the amount equal to the highest base salary rate in effect during the period beginning 12 months immediately preceding a change in control and ending on the date of the Named Executive Officer’s termination. The annual incentive bonus is equal to each executive’s target annual bonus for the fiscal year in which the Named Executive Officer’s employment is terminated.
As part of individual agreements entered into shortly after the Merger, certain CIC benefits were waived by Messrs. Chapman, Ammann and Ford (see discussion under “Employment/Retention Agreements" on page 196). CIC benefits remaining at fiscal year end were those detailed below, in the event the Named Executive Officer is terminated during the effective period for reasons other than cause, death or disability, or if the Named Executive Officer resigns for good reason:
for Mses. Gutermuth and Thornton, salary replacement benefits equal to the sum of the executive’s annual base salary plus annual target incentive bonus multiplied by two, net of any retention payment that has already been received;
for Mses. Gutermuth and Thornton, the product of the executive’s annual bonus and a fraction, the numerator of which is the number of days in the current fiscal year through the termination date, and the denominator of which is 365;
medical and dental replacement benefits for three years for Messrs. McCallister, Chapman, and Ammann and Ms. Thornton; and such benefits for two years for Ms. Gutermuth and Mr. Ford;
an additional three years of benefit service under the DB SERP for Messrs. Chapman and Ammann, provided, in no event shall such additional service, when added to the executive’s DB SERP benefit service, exceed the maximum of 30 years (Mses. Gutermuth and Thornton and Mr. Ford do not participate in the DB SERP; their benefits under the DC SERP, and for Ms. Gutermuth, the DB Restoration, were 100% vested upon the Merger);
outplacement services of up to $25,000; provided that such services are incurred by the executive within 12 months of his or her termination.
Mr. McCallister received payout of his CIC benefits upon termination in connection with the Merger is no longer eligible for further payments.
If a change in control payment exceeds the limit for deductible payments under Section 280G of the Internal Revenue Code by 10% or more, reimbursement will be made for the full amount of any excise taxes imposed on severance payments and any other payments under Section 4999 of the Internal Revenue Code and for all taxes due on the amount of that reimbursement. This excise tax gross-up provision was intended to preserve the level of change in control severance protections determined to be appropriate. On November 17, 2010, the Board eliminated the reimbursement by the company of excise taxes imposed on such severance payments for any executive officers that become covered by the terms of the CIC Plan on or after January 1, 2011. Ms. Thornton is not eligible for a tax gross-up because she became covered under the CIC Plan after January 1, 2011.
As part of the Merger, all outstanding FY2016 and FY2017 awards were vested and paid shortly after the Merger and FY2018 awards were converted to a dollar value (see discussion under “Impact of Merger” on page 194). With the exception of Mr. McCallister's FY2018 award, which will be paid to in early 2019, the FY2018 converted awards remain outstanding and subject to double-trigger vesting upon termination within the effective period. Together, the CIC Plan and the CIC Policy provide that a “qualified termination” triggers the receipt of severance benefits. Generally, a “qualified termination” of a participant in the CIC Plan means an involuntary termination of the participant (other than as a result of death, disability or for cause) or any termination of employment by the participant in the CIC Plan that is not initiated by the company and that is caused by any one or more of the following events, if such event occurs during the change in control effective period:
WGL Holdings, Inc.
Washington Gas Light Company
Part III
assignment to the participant, without his or her consent, of duties inconsistent in any material respect with the executive’s then current position or duties (including, for Messrs. Chapman and Ammann and Ms. Thornton, not having their current position at the most senior resulting entity following the change in control), or any other action by the company which would cause him or her to violate ethical or professional obligations, or which results in a significant diminution in such position or duties;
the participant, without his or her consent, being required to relocate to a principal place of employment that is both more than 35 miles from his or her existing principal place of employment, and farther from the participant’s current residence than his or her existing principal place of employment;
the company materially reduces, without his or her consent, the participant’s base salary rate or target bonus opportunity, or materially reduces the aggregate value of other incentives and retirement opportunity, or fails to allow the participant to participate in all welfare benefit plans, incentive, savings and retirement plan, fringe benefit plans and vacation benefits applicable to other senior executives; or
the company fails to obtain a satisfactory agreement from any successor entity to assume and agree to perform the company’s obligations to the Named Executive Officer under the CIC Plan.
A Named Executive Officer will not be able to receive severance benefits for a qualified termination if the executive continues in employment with the company for more than 90 days following the later of the occurrence or knowledge of an event or events that would constitute a qualified termination. Also, the Named Executive Officer will not be entitled to receive severance benefits under the CIC Plan if the Named Executive Officer’s employment with the company terminates because of a change in control and the Named Executive Officer accepts employment, or has the opportunity to continue employment, with a successor entity (other than under terms and conditions which would constitute a qualified termination).
The severance benefits available under the CIC Plan are not additive or cumulative to severance or termination benefits that a Named Executive Officer might also be entitled to receive under the terms of any other arrangement or agreement with the company. As a condition of participating in the CIC Plan, the Named Executive Officer must expressly agree that the CIC Plan supersedes all prior plans or agreements providing for severance benefits.
The following table lists the amounts the Named Executive Officers were eligible to receive from the company under the CIC Plan as a result of the Merger and subsequent employment and retention agreements if the Named Executive Officer’s employment was terminated either involuntarily without cause or as a result of a good reason termination effective as of September 30, 2018, the end of FY2018. The amounts would be payable in a single lump sum and, to the extent required to comply with Section 409A of the Internal Revenue Code, would not be paid to the Named Executive Officer prior to the date that is six months from the date of termination.
INCREMENTAL PAYMENTS DUE TO CHANGE IN CONTROL
(Assuming termination of employment on September 30, 2018)
|
| | | | | | | | | | | | | | | | | | | | |
| Payments Due to Change In Control | | Chapman | | Ammann | | Gutermuth | | Thornton | | Ford |
Cash severance(1) | | $ | — |
| | $ | — |
| | $ | 1,557,800 |
| | $ | 1,892,550 |
| | $ | — |
|
| Additional value due to vesting of FY2018 converted cash units | | $ | 1,065,409 |
| | $ | 644,302 |
| | $ | 539,496 |
| | $ | 458,419 |
| | $ | 202,832 |
|
Additional SERP amount due to service credits(2) | | $ | — |
| | $ | 231,720 |
| | $ | — |
| | $ | — |
| | $ | — |
|
| Medical and dental continuation (estimate) | | $ | 50,964 |
| | $ | 50,964 |
| | $ | 52,108 |
| | $ | 29,739 |
| | $ | 33,976 |
|
| Outplacement (maximum) | | $ | — |
| | $ | — |
| | $ | — |
| | $ | 25,000 |
| | $ | — |
|
Cutback to avoid excise tax(3)
| | $ | — |
| | $ | — |
| | $ | — |
| | $ | (525,977 | ) | | $ | — |
|
| TOTAL | | $ | 1,116,373 |
| ) | $ | 926,986 |
| | $ | 2,149,404 |
| | $ | 1,879,448 |
| | $ | 236,808 |
|
(1) For Ms. Gutermuth, represents accelerated payment of the retention bonus entered into as part of her post-Merger retention agreement.
(2) DB SERP calculations were made using a 4.3% discount rate.
(3) Reduction in severance to avoid excise tax. For Ms. Thornton, the reduction creates a better net result.
**Mr. McCallister is omitted from the table above as he terminated his employment on July 6, 2018 and was not eligible for CIC payments on September 30, 2018.
Incremental Payments Due to Other Terminations
Other than the CIC Plan which remains in effect for two years with respect to the Merger, the company has no employment contracts and no guaranteed severances for terminations other than related to the Merger effective period.
WGL Holdings, Inc.
Washington Gas Light Company
Part III
DIRECTOR COMPENSATION
Cash compensation for non-employee directors’ service on the Boards of WGL and Washington Gas during FY 2018 consisted primarily of an annual retainer. Non-employee directors serving prior to the consummation of the Merger also received an annual equity award of WGL Holdings common stock under the WGL Holdings Directors’ Stock Compensation Plan, as amended (the “Directors’ Stock Plan”). Management directors do not receive compensation for their service as directors.
Director Annual Retainer
Non-employee directors of each of WGL and Washington Gas receive an annual cash retainer (paid quarterly), which is paid by Washington Gas. Directors were offered the opportunity to receive all or a portion of their cash compensation (including annual retainer and additional fees described below) on a deferred basis under the WGL Holdings and Washington Gas Deferred Compensation Plan for Outside Directors, which is described below under the heading “Director Deferred Compensation Plan.”
Directors’ Stock Plan
Prior to the Merger, pursuant to the terms of the Directors’ Stock Plan, shares of WGL common stock were awarded to each non-employee director annually. The amount of WGL Holdings common stock awarded to each non-employee director for 2018 was equal to $95,024.88 in value. The Directors’ Stock Plan was administered by the Joint HR Committee but has been terminated following the Merger. Employee directors were not eligible to participate in this plan. The shares of common stock awarded under the plan were immediately vested and non-forfeitable. Beginning in FY 2017, Directors were offered the opportunity to receive all or a portion of their annual equity retainer on a deferred basis under the WGL Holdings and Washington Gas Deferred Compensation Plan for Outside Directors, which is described below under the heading “Director Deferred Compensation Plan.”
The table below presents information regarding the total compensation paid to non-employee directors of each of WGL and Washington Gas during FY 2018.
COMPENSATION PAID TO DIRECTORS IN FY 2018
|
| | | | | | | | | | | | | | | | |
| Name (a) | | Fees Earned or Paid in Cash ($) (b) |
| | Stock Awards(1) ($) (c) |
| | Change in Pension Value and Non-qualified Deferred Compensation Earnings(2) ($) (f) |
| | Total ($) (h) |
|
Michael D. Barnes(3) | | $ | 95,525 |
| | $ | 95,025 |
| | $ | — |
| | $ | 190,550 |
|
George P. Clancy, Jr.(3) | | $ | 95,525 |
| | $ | 95,025 |
| | $ | 83,392 |
| | $ | 273,942 |
|
James W. Dyke, Jr.(4) | | $ | 137,897 |
| | $ | 95,025 |
| | $ | — |
| | $ | 232,922 |
|
Nancy C. Floyd(3) | | $ | 101,435 |
| | $ | 95,025 |
| | $ | — |
| | $ | 196,460 |
|
Linda R. Gooden(4) | | $ | 139,397 |
| | $ | 95,025 |
| | $ | 8,816 |
| | $ | 243,238 |
|
James F. Lafond(3) | | $ | 96,525 |
| | $ | 95,025 |
| | $ | 123,815 |
| | $ | 315,365 |
|
Debra L. Lee(3) | | $ | 95,525 |
| | $ | 95,025 |
| | $ | — |
| | $ | 190,550 |
|
Dale S. Rosenthal(4) | | $ | 136,897 |
| | $ | 95,025 |
| | $ | 14,358 |
| | $ | 246,280 |
|
John (Jack) F. Stark(5) | | $ | 47,287 |
| | $ | — |
| | $ | — |
| | $ | 47,287 |
|
Columns (d) “Option Awards”, (e) “Non-Equity Incentive Plan Compensation” and (g) “All Other Compensation” have been omitted in accordance with SEC rules because no such compensation was awarded to, earned by, or paid to directors during FY 2017. Compensation for Mr. McCallister’s Board service following consummation of the Merger is included in the Summary Compensation Table on page 200. None of Adrian Chapman, John Lowe, Phillip Knoll, David Harris or Vincent Ammann, each of whom served or serves on the WGL Board and/or Washington Gas Board during FY2018, received compensation for their Board service.
(1)On January 2, 2018, each of the non-employee directors serving on the Boards of WGL and Washington Gas at that time received an award of 1,107 shares of WGL Holdings common stock in accordance with the terms of the Directors’ Stock Plan. The amounts reported for stock awards reflect the aggregate grant date fair value computed in accordance with FASB ASC Topic 718. The grant date fair value of each equity award computed in accordance with FASB ASC Topic 718 was $85.84 per share. For a discussion of assumptions and methodologies used to calculate the amounts in column (c), see Note 10 (Stock-Based Compensation) to the consolidated financial statements, included as part of this Form 10-K.
(2)Amounts in this column only reflect earnings on non-qualified deferred compensation. Mr. Barnes, who terminated his service on the Board on July 6, 2018 in connection with the Merger, is the only director that has any retirement benefits. As described below under “Director Retirement Plan,” Mr. Barnes’ retirement benefits were frozen and, therefore, there was no change in value.
(3) Resigned from the Boards of each of WGL and Washington Gas on July 6, 2018 in connection with the Merger. Ms. Floyd continues to serve on the WGL Board.
(4) Resigned from the WGL Board on July 6, 2018 in connection with the Merger, but continues to serve on the Washington Gas Board.
WGL Holdings, Inc.
Washington Gas Light Company
Part III
(5) Joined the Washington Gas Board on July 6, 2018 in connection with the Merger.
Non-Employee Director Compensation Decisions
Non-employee directors are compensated in accordance with the terms of our director compensation program. The director compensation program in effect through FY 2016 was determined based on a 2014 Meridian study of similar programs at peers. In 2016, Meridian compared the program of director pay to survey data. Based on that work, for FY 2017, based on the 2016 study, the Board increased the cash retainer to $90,000, increased the Governance Committee Chairman retainer to $10,000 per year, and increased the equity retainer to $95,000 per year.
Following consummation of the Merger, non-employee directors of Washington Gas are paid an annual cash retainer of $175,000 paid quarterly in arrears. The Chairman of the Board receives an additional annual cash retainer of $25,000. As Ms. Floyd and Mr. McCallister receive compensation for their Board service on the Boards of Directors of other entities within the AltaGas family of companies, each is paid an annual cash retainer of $25,000 paid quarterly in arrears for their service on the WGL Board.
The Board may take action at any time to amend the amount or type of compensation it receives. A director who is employed by WGL or AltaGas does not receive compensation for his or her role as a director. Other than conducting the director pay review discussed above, Meridian has no role in determining the compensation of the Board.
Director Deferred Compensation Plan
Non-employee directors of WGL and Washington Gas are eligible to defer up to 100% of their cash and, beginning in FY 2017, equity Board compensation under the WGL Holdings and Washington Gas Light Company Deferred Compensation Plan for Outside Directors, as amended and restated (the “Director Deferred Compensation Plan”). This includes the deferral of the payment of annual Board and committee cash retainers, Board and committee meeting fees, fees for attending director education programs and awards under the Directors Stock Plan. Deferrals are set at percentage increments of 10%. Interest is earned on deferred cash amounts, compounded quarterly.
The interest rate on cash amounts deferred on or after January 1, 2013 is equal to the weighted average interest rate of all of the outstanding debt of WGL and its subsidiaries, including Washington Gas, because, in any one year, the liability that WGL and Washington Gas has to directors is a consolidation of fees deferred over a number of years by directors. Therefore, the funds displace other long-term borrowings that WGL and Washington Gas would have otherwise utilized. The interest rate earned on compensation deferred after January 1, 2013 is determined on January 1 each year. The applicable interest rate for calendar year 2018 is expected to be 4.21%. The interest rate on amounts that were deferred prior to January 1, 2013 is equal to the weekly average yield to maturity for 10-year U.S. Government fixed interest rate securities issued at the time of the deferral, with a minimum rate of 8% per year.
Stock awards that were deferred received notional dividends, which were deemed to be immediately reinvested in additional shares of WGL Holdings common stock, and are thus paid in stock. Following the Merger, all deferred stock awards were converted to deferred cash amounts at a rate of $88.25/share.
Directors may elect to defer distribution of their compensation for a minimum period of one year following the end of the year in which compensation is deferred or until the director’s retirement from the Board. Deferred compensation may be distributed earlier than the time period specified by a director in the event of the director’s retirement, disability, death or upon the occurrence of a severe financial hardship. Directors may elect to receive payment of deferred amounts in a lump sum or, for cash awards only, in equal annual installments up to a ten-year period. Directors must elect the time and method of distribution at the same time they submit a deferral application. Payments commence within 30 days of the event that triggers payout.
The amount of early withdrawals or accelerated payments made in connection with a severe financial hardship is limited in accordance with applicable tax laws. The administrator of the Director Deferred Compensation Plan has the sole discretion to determine whether such an early withdrawal or accelerated payment in the event of a severe financial hardship will be permitted.
Director Retirement Plan
A retirement plan for non-employee directors of Washington Gas, which was originally adopted in 1995, was terminated by the board of directors of Washington Gas effective January 1, 1998, subject to vesting of benefits earned by the directors as of that date. Of the directors serving during FY 2018 and current directors, only Mr. Barnes has vested benefits under this plan. These benefits will be paid out in a fixed amount of $10,200 per year to Mr. Barnes for a ten-year period, which commenced following his retirement from the Board in July 2018.
Donations to Civic Organizations and Charities
Washington Gas has a long-standing tradition of supporting charitable and civic organizations within the Washington, D.C. metropolitan area by contributing financial donations and employee volunteer resources. None of these donations in FY 2018 were made in the name of a director of WGL Holdings or Washington Gas.
WGL Holdings, Inc.
Washington Gas Light Company
Part III
Appendix A
Reconciliation of Non-GAAP Financial Measures (Unaudited)
The tables below reconcile operating earnings (loss) on a consolidated basis to GAAP net income (loss) applicable to common stock and adjusted EBIT on a segment basis to EBIT. Management believes that operating earnings (loss) and adjusted EBIT provide a meaningful representation of our earnings from ongoing operations on a consolidated and segment basis, respectively. These measures facilitate analysis by providing consistent and comparable measures to help management, investors and analysts better understand and evaluate our operating results and performance trends, and assist in analyzing period-to-period comparisons. Additionally, we use these non-GAAP measures to report to the board of directors and to evaluate management’s performance.
To derive our non-GAAP measures, we adjust for the accounting recognition of certain transactions (non-GAAP adjustments) based on at least one of the following criteria:
To better match the accounting recognition of transactions with their economics;
To better align with regulatory view/recognition;
To eliminate the effects of:
| |
i. | Significant out of period adjustments; |
| |
ii. | Other significant items that may obscure historical earnings comparisons and are not indicative of performance trends; and |
| |
iii. | For adjusted EBIT, other items which may obscure segment comparisons. |
There are limits in using operating earnings (loss) and adjusted EBIT to analyze our consolidated and segment results, respectively, as they are not prepared in accordance with GAAP and may be different than non-GAAP financial measures used by other companies. In addition, using operating earnings (loss) and adjusted EBIT to analyze our results may have limited value as they exclude certain items that may have a material impact on our reported financial results. We compensate for these limitations by providing investors with the attached reconciliations to the most directly comparable GAAP financial measures.
The following tables represent the reconciliation of non-GAAP operating earnings to GAAP net income (loss) applicable to common stock:
|
| | | | | | | |
| | Fiscal Year Ended September 30, |
| (In thousands, except per share data) | 2018 | | 2017 |
| Operating earnings (loss) | $ | 195,112 |
| | $ | 160,244 |
|
Non-GAAP adjustments(1) | (261,297 | ) | | 55,368 |
|
De-designated interest rate swaps(2) | 19,382 |
| | (5,570 | ) |
Income tax effect of non-GAAP adjustments(3) | 67,403 |
| | (17,422 | ) |
| Re-measurement impact of Tax Cuts and Jobs Act | 28,743 |
| | — |
|
| Net income (loss) applicable to common stock | $ | 49,343 |
| | $ | 192,620 |
|
| Diluted average common shares outstanding | — |
| | 51,475 |
|
| Operating earnings (loss) per share |
|
| | $ | 3.11 |
|
| Per share effect of non-GAAP adjustments |
|
| | 0.63 |
|
| Diluted earnings (loss) per average common share |
|
| | $ | 3.74 |
|
(1)Refer to the reconciliations of adjusted EBIT to EBIT below for further details on our non-GAAP adjustments. Note that non-GAAP adjustments associated with interest expense or income taxes are shown separately and are not included in the reconciliation from adjusted EBIT to EBIT.
(2)Non-GAAP adjustment related to mark-to-market valuations on forward starting interest rate swaps that were designated as hedges for the anticipated issuance of 30-year debt. Due to the Merger with AltaGas, the related debt issuance will no longer occur.
(3)Non-GAAP adjustments are presented on a gross basis and the income tax effects of those adjustments are presented separately. The income tax effects of non-GAAP adjustments, both current and deferred, are calculated at the individual company level based on the applicable composite tax rate for each period presented, with the exception of transactions not subject to income taxes. Additionally, the income tax effect of non-GAAP adjustments includes investment tax credits related to distributed generation assets.
The following tables summarize non-GAAP adjustments by operating segment and present a reconciliation of adjusted EBIT to EBIT. EBIT is defined as earnings before interest and taxes, less amounts attributable to non-controlling interest. Items we do not include in EBIT are interest expense, inter-company financing activity, dividends on Washington Gas preferred stock, and income taxes.
WGL Holdings, Inc.
Washington Gas Light Company
Part III
|
| | | | | | | | | | | | | | | | | | | | | | | | | | | | |
| Fiscal Year Ended September 30, 2018 |
| (In thousands) | | Regulated Utility | | Retail Energy- Marketing | | Commercial Energy Systems | | Midstream Energy Services | | Other Activities(k) | |
Eliminations | | Total |
| Adjusted EBIT | | $ | 207,959 |
| | $ | 37,343 |
| | $ | 46,533 |
| | $ | 40,464 |
| | $ | (7,284 | ) | | $ | (4,374 | ) | | $ | 320,641 |
|
| Non-GAAP adjustments: | | | | | | | | | | | | | | |
Unrealized mark-to-market valuations on energy-related derivatives(a) | | 10,379 |
| | (2,540 | ) | | — |
| | (8,269 | ) | | — |
| | 5 |
| | (425 | ) |
Storage optimization program(b) | | (3,429 | ) | | — |
| | — |
| | — |
| | — |
| | — |
| | (3,429 | ) |
DC weather impact(c) | | (2,710 | ) | | — |
| | — |
| | — |
| | — |
| | — |
| | (2,710 | ) |
Distributed generation asset related investment tax credits(d) | | — |
| | — |
| | (6,695 | ) | | — |
| | — |
| | — |
| | (6,695 | ) |
Change in measured value of inventory(e) | | — |
| | — |
| | — |
| | (2,178 | ) | | — |
| | — |
| | (2,178 | ) |
Merger related costs(f) | | (26,661 | ) | | (3,312 | ) | | (2,210 | ) | | (595 | ) | | (32,716 | ) | | — |
| | (65,494 | ) |
Merger commitments(g) | | (139,647 | ) | | — |
| | — |
| | — |
| | — |
| | — |
| | (139,647 | ) |
Asset impairment(h) | | (37,969 | ) | | — |
| | — |
| | — |
| | — |
| | — |
| | (37,969 | ) |
Unrecovered government contract costs(i) | | — |
| | — |
| | (2,750 | ) | | — |
| | — |
| | — |
| | (2,750 | ) |
| Total non-GAAP adjustments | | $ | (200,037 | ) | | $ | (5,852 | ) | | $ | (11,655 | ) | | $ | (11,042 | ) | | $ | (32,716 | ) | | $ | 5 |
| | $ | (261,297 | ) |
| EBIT | | $ | 7,922 |
| | $ | 31,491 |
| | $ | 34,878 |
| | $ | 29,422 |
| | $ | (40,000 | ) | | $ | (4,369 | ) | | $ | 59,344 |
|
| | | | | | | | | | | |
| Fiscal Year Ended September 30, 2017 |
| (In thousands) | | Regulated Utility | | Retail Energy- Marketing | | Commercial Energy Systems | | Midstream Energy Services | | Other Activities(k) | |
Eliminations | | Total |
| Adjusted EBIT | | $ | 227,228 |
| | $ | 41,597 |
| | $ | 47,586 |
| | $ | 10,880 |
| | $ | (4,862 | ) | | $ | 1,328 |
| | $ | 323,757 |
|
| Non-GAAP adjustments: | | | | | | | | | | | | | | |
Unrealized mark-to-market valuations on energy-related derivatives(a) | | 49,338 |
| | 11,598 |
| | — |
| | 18,823 |
| | — |
| | (363 | ) | | 79,396 |
|
Storage optimization program (b) | | 1,496 |
| | — |
| | — |
| | — |
| | — |
| | — |
| | 1,496 |
|
DC weather impact(c) | | (11,755 | ) | | — |
| | — |
| | — |
| | — |
| | — |
| | (11,755 | ) |
Distributed generation asset related investment tax credits(d) | | — |
| | — |
| | (6,752 | ) | | — |
| | — |
| | — |
| | (6,752 | ) |
Change in measured value of inventory(e) | | — |
| | — |
| | — |
| | 7,986 |
| | — |
| | — |
| | 7,986 |
|
Merger related costs(f) | | — |
| | — |
| | — |
| | — |
| | (12,902 | ) | | — |
| | (12,902 | ) |
Third party guarantee(j) | | — |
| | — |
| | — |
| | — |
| | (2,101 | ) | | — |
| | (2,101 | ) |
| Total non-GAAP adjustments | | $ | 39,079 |
| | $ | 11,598 |
| | $ | (6,752 | ) | | $ | 26,809 |
| | $ | (15,003 | ) | | $ | (363 | ) | | $ | 55,368 |
|
| EBIT | | $ | 266,307 |
| | $ | 53,195 |
| | $ | 40,834 |
| | $ | 37,689 |
| | $ | (19,865 | ) | | $ | 965 |
| | $ | 379,125 |
|
(a) Adjustments to eliminate unrealized mark-to-market gains (losses) for our energy-related derivatives for our regulated utility and retail energy-marketing operations as well as certain derivatives related to the optimization of transportation capacity for the midstream energy services segment. With the exception of certain transactions related to the optimization of system capacity assets as discussed in footnote (b) below, when these derivatives settle, the realized economic impact is reflected in our non-GAAP results, as we are only removing interim unrealized mark-to-market amounts.
(b) Adjustments to shift the timing of storage optimization margins for the regulated utility segment from the periods recognized for GAAP purposes to the periods in which such margins are recognized for regulatory sharing purposes. In addition, lower-of-cost or market adjustments related to system and non-system storage optimization are eliminated for non-GAAP reporting because the margins will be recognized for regulatory purposes when the withdrawals are made at the unadjusted historical cost of storage inventory.
(c) Eliminates the estimated financial effects of warm or cold weather in the District of Columbia, as measured consistent with our regulatory tariff. Washington Gas has regulatory weather protection mechanisms in Maryland and Virginia designed to neutralize the estimated financial effects of weather. Utilization of normal weather is an industry standard, and it is our practice to evaluate our rate-regulated revenues by utilizing normal weather and to provide estimates and guidance on the basis of normal weather.
(d) To reclassify the amortization of deferred investment tax credits from income taxes to operating income for the commercial energy systems segment. These credits are a key component of the operating success of this segment and therefore are included within adjusted EBIT to help management and investors better assess the segment's performance.
(e) For our midstream energy services segment, adjustments to reflect storage inventory at market or at a value based on the price used to value the physical forward sales contract that is economically hedging the storage inventory. Adjusting our storage optimization inventory in this fashion better aligns the settlement of both our physical and financial transactions and allows investors and management to better analyze the results of our non-utility asset optimization strategies. Additionally, this adjustment also includes the net effect of certain sharing mechanisms on the difference between the changes in our non-GAAP storage inventory valuations and the unrealized gains and losses on derivatives not subject to non-GAAP adjustments.
(f) Adjustment to eliminate external transaction costs and other allocated, nonrecurring costs associated with the Merger Agreement with AltaGas.
(g) Represents Regulatory Commitments incurred due to the Merger with AltaGas.
(h) Represents an impairment of PP&E in connection with an agreement not to seek recovery of certain costs incurred under the Formal Case 1027 mechanical coupling program.
(i) Represents unrecovered government contracting costs under the Small Business Administration's Business Development 8(a) Program.
(j) Guarantee on behalf of a third-party associated with a solar investment.
(k) Activities and transactions that are not significant enough on a standalone basis to warrant treatment as an operating segment and that do not fit into one of our four operating segments.
WGL Holdings, Inc.
Washington Gas Light Company
Part III
ITEM 12. SECURITY OWNERSHIP OF CERTAIN BENEFICIAL OWNERS AND MANAGEMENT AND RELATED STOCKHOLDER MATTERS EQUITY COMPENSATION PLAN INFORMATION
The table below presents information regarding compensation plans under which common stockWashington Gas meets the conditions set forth in General Instruction I(1) of WGL has been authorized for issuance as of September 30, 2018. The company has shares reserved under three plans: the Directors’ Stock Plan, the 2016 Omnibus Incentive Compensation Plan (the “2016 Plan”) and the 2007 Omnibus Incentive Compensation Plan (the “2007 Plan”). Total shares shown in the below table include 54,582 shares available for future issuance under the Directors’ Stock Plan, 488,490 shares available for issuance under the 2007 Plan and 2,064,006 shares available for issuance under the 2016 Plan. No further grants will be made under any of these plans given the close of the Merger on July 6, 2018.
|
| | | | |
| | Plan Category | Number of securities to be issued upon exercise of outstanding options, warrants and rights | Weighted average exercise price of outstanding options warrants and rights(b) | Number of securities remaining available for future issuance under equity compensation plans (excluding securities reflected in column (a) (c) |
| |
| |
| |
| |
| |
| |
| | Equity compensation plans approved by security holders | 0 | 0 | 2,607,078 |
| | Equity compensation plans not approved by security holders | 0 | 0 | 0 |
| | TOTAL | 0 | 0 | 2,607,078 |
Security Ownership of Management and Certain Beneficial Owners
As of the filing of this Form 10-K WGL had outstanding 100 sharesand has omitted the information called for by this Item pursuant to General Instruction I(2) of common stock, all of which were owned by Wrangler 1 LLC.
As of the filing of this Form 10-K, Washington Gas had outstanding 46,479,536 shares of common stock, all of which were owned by Wrangler SPE LLC.
As of the filing of this Form 10-K, Washington Gas had outstanding the following shares of preferred stock:
|
| |
• | 150,000 shares of Serial Preferred Stock, $4.80 Series; |
• | 70,600 shares of Serial Preferred Stock, $4.25 Series; and |
• | 60,000 shares of Serial Preferred Stock, $5.00 Series. |
To the knowledge of Washington Gas, based on the most recent publicly available information at the time of the preparation of this 10-K, no person was the beneficial owner of more than five percent of the shares outstanding of any series of preferred stock.
As of the filing of this Form 10-K, no shares of common stock of WGL or Washington Gas or preferred stock of Washington Gas were held by any director or executive officer of Washington Gas.
WGL is unaware of any arrangement the operation of which may at a subsequent date result in a change in control of WGL.10-K.
ITEM 13. CERTAIN RELATIONSHIPS AND RELATED TRANSACTIONS, AND DIRECTOR INDEPENDENCE Policies and Procedures for Review, Approval or Ratification of Related-Person Transactions
Our policies and procedures forWashington Gas meets the review, approval or ratification of related person transactions areconditions set forth in our Related Person Transactions Policy. In summary, a related person transaction is a consummated or currently proposed transaction in which we were or are to be a participantGeneral Instruction I(1) of Form 10-K and has omitted the amount involved exceeds $120,000, and in which a related person (i.e., any director, executive officer, nomineeinformation called for director, beneficial owner of more than 5% of our common stock, or any member of the immediate family of such person) has or will have a direct or indirect material interest.
The Governance & Environment, Health and Safety Committee is responsible for reviewing and approving all material transactions with any related person. This obligation is set forth in the Governance & Environment, Health and Safety Committee charter.
To identify related party transactions, each year we submit and require our directors and officers to complete director and officer questionnaires identifying any transactions with us in which the officer or director or their family members have an interest. We also distribute questionnaires to directors, executive officers and others within the company to identify related party transactions for purposes of meeting accounting and disclosure requirements under Financial Accounting Standards Board (“FASB”) Accounting Standards Codification (“ASC”) 850. We review related party transactions due to the potential for a conflict of interest. A conflict of interest occurs when an individual’s private interest interferes, or appears to interfere, in any way with the company’s interests. Our code of conduct requires all directors, officers and employees who may have a potential or apparent conflict of interest to notify their supervisor or the company’s Compliance Officer.
We expect our directors, officers and employees to act and make decisions that are in the company’s best interests and we encourage them to avoid situations that present a conflict between our interests and their own personal interests. Our directors, officers and employees are prohibited from taking any action that may make it difficult for them to perform their duties, responsibilities and services to the company in an objective and fair manner. In addition, we are prohibited from extending personal loans to, or guaranteeing the personal obligations of, any director or officer.
No Material Related Person Transactions During FY 2018
There were no material related person transactions during FY 2018 and no transactions were considered or reviewed for approval in connection with our Related Person Transactions Policy.
Director Independence
The WGL Board has determined that Nancy C. Floyd is independentby this Item pursuant to the guidelines set forth by the NYSE. The General Instruction I(2) of Form 10-K.
Washington Gas Board has determined that Messrs. Stark and Dyke and Mses. Gooden and Rosenthal are each independent pursuant to the guidelines set forth by the NYSE. In determining independence, the Boards considered the specific criteria for independence as set forth in the NYSE ListedLight Company Manual and also the facts and circumstances of any other relationships of individual directors with WGL, Washington Gas or their affiliates. In addition, all members of the Washington Gas Audit Committee and the Washington Gas Human Resources Committee are independent. Messrs. Stark and Dyke are independent members of the Washington Gas Governance & Environment, Health and Safety Committee. Ms. Floyd is an independent member of the WGL Audit Committee.
ITEM 14. PRINCIPAL ACCOUNTANT FEES AND SERVICES FY 2018 AND FY 2017 AUDIT FIRM FEE SUMMARY
Aggregate fees billed by (a) Deloitte & Touche LLP (“Deloitte”), the company’s independent public accounting firm billed the company the following fees for the fiscal yearyears ended September 30, 2018 and 2017:2017, for services rendered with respect to the fiscal years ended September 30, 2018 and 2017, and (b) Ernst & Young LLP ("EY"), the company's independent registered public accounting firm for the calendar year ended December 31, 2019 and three months ended December 31, 2018, for services rendered with respect to the calendar year ended December 31, 2019 and three months ended December 31, 2018, respectfully, are below.
| | | | FY 2018 |
| | FY 2017 |
| Calendar Year | | Three Months | | Fiscal Years |
| | | Ended December 31, | | Ended December 31, | | Ended September 30, |
(amounts in dollars)
| | 2019 | | 2018 | | 2018 | | 2017 |
Audit Fees(1) | $ | 3,714,391 |
| | $ | 2,516,005 |
| $ | 1,342,192 |
| | $ | 642,479 |
| | $ | 1,709,225 |
| | $ | 1,335,278 |
|
Audit Related Fees(2) | $ | 180,000 |
| | $ | 240,490 |
| $ | 272,000 |
| | $ | — |
| | $ | — |
| | $ | 102,000 |
|
Tax Fees(3) | $ | 113,741 |
| | $ | 144,566 |
| $ | 20,462 |
| | $ | — |
| | $ | 370,064 |
| | $ | 240,490 |
|
All Other Fees(4) | $ | 11,400 |
| | $ | 14,388 |
| $ | — |
| | $ | — |
| | $ | 13,670 |
| | $ | 14,388 |
|
| TOTAL FEES | $ | 4,019,532 |
| | $ | 2,915,449 |
| $ | 1,634,654 |
| | $ | 642,479 |
| | $ | 2,092,959 |
| | $ | 1,692,156 |
|
Services Provided by Deloitte and EY
All services rendered by Deloitte and EY are permissible under applicable laws and regulations and were pre-approved by the Audit Committee of WGL or Washington Gas, as appropriate, or by the Chair of the appropriate Audit Committee by delegated authority as required by law. The fees paid to Deloitte and EY for services are describedlisted in the above table underare described in the categories listed below.
WGL Holdings, Inc.
Washington Gas Light Company
Part III
(1)Audit Fees - . These are fees for professional services performed by (a) Deloitte for the audit of the company’s annual financial statements and review of financial statements included in the company’s quarterly filings on Form 10-Q, and services that are normally provided in connection with statutory and regulatory filings or engagements. For FYengagements during the fiscal years ended September 30, 2018 and FY 2017 and (b) EY for the total audit fees include $641,673 and $653,037, respectively, to perform an assessment of the company’s internal control overannual financial reporting as required by Section 404statements and review of financial statements included in the Sarbanes-Oxley Act of 2002.company’s quarterly filings on Form 10-Q, and services that are normally provided in connection with statutory and regulatory filings or engagements during the calendar year ended December 31, 2019 and three month ended December 31, 2018.
(2)Audit Related FeesFees. - These are fees for services performed by (a) Deloitte related to the audit.audit of the company’s annual financial statements for the fiscal years ended September 30, 2018 and 2017 and (b) EY related to the audit of the company's financial statements for the calendar year ended December 31, 2019 and three month ended December 31, 2018.
(3) Tax Fees.Tax Fees - These are fees for professional services performed by (a) Deloitte with respect to tax compliance, tax advice and tax planning. Thisplanning during the fiscal years ended September 30, 2018 and 2017 and (b) EY with respect to tax compliance, tax advice and tax planning during the calendar year ended December 31, 2019 and three month ended December 31, 2018. In each case, this includes review of tax returns for the company and its consolidated subsidiaries.Company.
(4)All Other FeesFees. - These are fees for other permissible work performed by (a) Deloitte that does not meetduring the above category descriptions.fiscal years ended September 30, 2018 and 2017 and (b) EY during the calendar year ended December 31, 2019 and three month ended December 31, 2018.
These services are actively monitored (as to both spending level and work content) by the WGL and Washington Gas Audit CommitteesCommittee to maintain the appropriate objectivity and independence in Deloitte’s and EY's core work, which is the audit of the company’s consolidated financial statements and the assessment of internal controls in accordance with Section 404 of the Sarbanes-Oxley Act of 2002.
Pre-Approval Policy for Audit and Non-Audit Services
In accordance with the provisions of the Sarbanes-Oxley Act of 2002, all audit and non-audit services provided to the company by its independent public accounting firm must be pre-approved by the appropriate Audit Committee. The Sarbanes-Oxley Act of 2002 permits eachthe Audit Committee to delegate to one of its members the authority to approve audit and non-audit services by the company’s independent public accounting firm when the Audit Committee is not in session. EachUntil December 31, 2019 when the Audit Committee has adopted a new charter, the Audit Committee maintained a policy that allowsallowed the Chair of the Audit Committee to approve audit-related services provided by the company’sCompany’s independent public accounting firm between meetings of the Audit Committee if the fees for the services dodid not exceed $100,000. The Chair of the Audit Committee willwould report as soon as possible to the other Audit Committee members if the Chair iswas required to use this delegated authority between Audit
Washington Gas Light Company
Part III
Committee meetings. However, under eachthe policy, the entire Audit Committee mustwas required to approve any non-audit related services to be provided by the company’sCompany’s independent public accounting firm prior to the provision of such services. All services reported in the preceding schedule for FYcalendar year ended December 31, 2019 and fiscal years ended September 30, 2018 and FY 2017 were pre-approved by either the full Audit CommitteesCommittee or by the Chair of the appropriate Audit Committee, by delegated authority.
WGL Holdings, Inc.
Washington Gas Light Company
Part IV
Item 15. Exhibits and Financial Statement Schedules
ITEM 15. EXHIBITS AND FINANCIAL STATEMENT SCHEDULES
Financial Statement Schedules
(a)(1)
All of the financial statements and financial statement schedules filed as a part of the annual report on Form 10-K are included in Item 8.
(a)(2)
Schedule II should be read in conjunction with the financial statements in this report. Schedules not included herein have been omitted because they are not applicable or the required information is shown in the financial statements or notes thereto.
|
| | |
Schedule/ Exhibit | | Description |
| | |
| II | | Valuation and Qualifying Accounts and Reserves for the calendar year ended December 31, 2019, three months ended December 31, 2018 and for the fiscal years ended September 30, 2018 2017 and 2016—WGL Holdings, Inc. |
| |
| | Valuation and Qualifying Accounts and Reserves for the years ended September 30, 2018, 2017 and 2016—Washington Gas Light Company.2017. |
| | |
| (a)(3) | | Exhibits |
| | |
| | | Exhibits Filed Herewith: |
| | | |
| | Separation Agreement and General Release entered into by and between Terry D. McCallister, Chairman and Chief Executive Officer, and Washington Gas Light Company, dated July 6, 2018.*Description of Securities Registered under Section 12 of the Securities Exchange Act of 1934, as amended. |
| | | |
| | Service Agreement entered into by and between Terry D. McCallister and Washington Gas Light Company, dated July 6, 2018.*Consent of Deloitte & Touche LLP |
| |
| | Consent of Ernst & Young LLP |
| | | |
| | Terms of Employment and Retention for Adrian P. Chapman, Chief Executive Officer and President, dated July 6, 2018.* |
| | |
| | Terms of Employment and Retention for Vincent L. Ammann, Jr., Executive Vice President and Chief Financial Officer, dated July 6, 2018.* |
| | |
| | Terms of Employment and Retention for Luanne Gutermuth, Executive Vice President and Chief Administrative Officer, dated July 9, 2018.* |
| | |
| | Change in Control Severance Plan Agreement for Leslie T. Thornton, dated July 5, 2018.* |
| | |
| | Terms of Employment and Retention for William R. Ford, Vice President and Chief Accounting Officer, dated July 6, 2018.* |
| | |
| | Amendment to Terms of Employment and Retention for Vincent L. Ammann, Jr., Executive Vice President and Chief Financial Officer, dated November 16, 2018.* |
| | |
| | Subsidiaries of WGL Holdings, Inc. |
| |
| | Consent of Deloitte & Touche LLP. |
| |
| | Power of Attorney for WGL Holdings, Inc. |
| | |
| | Power of Attorney for Washington Gas Light Company |
| | | |
| | Certification of Adrian P. Chapman, theDonald M. Jenkins, President and Chief Executive Officer of WGL Holdings, Inc.,Washington Gas Light Company, pursuant to Section 302 of the Sarbanes-Oxley Act of 2002. |
| | |
| | Certification of Vincent L. Ammann, Jr.,Douglas I. Bonawitz, the ExecutiveSenior Vice President, and Chief Financial Officer of WGL Holdings, Inc., pursuant to Section 302 of the Sarbanes-Oxley Act of 2002. |
| |
WGL Holdings, Inc.
Washington Gas Light Company
Part IV
Item 15. Exhibits and Financial Statement Schedules (continued)
|
| | |
Schedule/
Exhibit
| | Description |
| | Certification of Adrian P. Chapman, the President and Chief Executive Officer of Washington Gas Light Company, pursuant to Section 302 of the Sarbanes-Oxley Act of 2002. |
| |
| | Certification of Vincent L. Ammann, Jr., the Executive Vice President and Chief Financial OfficerTreasurer of Washington Gas Light Company, pursuant to Section 302 of the Sarbanes-Oxley Act of 2002. |
| | |
| | Certification of Adrian P. Chapman,Donald M. Jenkins, the President, and Douglas I. Bonawitz, the Senior Vice President, Chief ExecutiveFinancial Officer and Vincent L. Ammann, Jr., the Executive Vice President and Chief Financial Officer,Treasurer, pursuant to Section 906 of the Sarbanes-Oxley Act of 2002. |
| | |
| 101.INS | | XBRL Instance Document |
| | |
| 101.SCH | | XBRL Schema Document |
| | |
| 101.CAL | | XBRL Calculation Linkbase Document |
| | |
| 101.LAB | | XBRL Labels Linkbase Document |
| | |
| 101.PRE | | XBRL Presentation Linkbase Document |
| | |
| 101.DEF | | XBRL Definition Linkbase Document |
| | |
| | * Designates a compensatory plan or arrangement.
|
Washington Gas Light Company
Part IV
Item 15. Exhibits and Financial Statement Schedules (continued)
|
| | |
Schedule/ Exhibit | | Description |
| | |
| | | Exhibits Incorporated by Reference: |
| |
2 | | Plan of Acquisition, Reorganization, Arrangement, Liquidation or Succession |
| | |
| | Agreement and Plan of Merger, dated as of January 25, 2017, among WGL Holdings, Inc., Wrangler Inc. and AltaGas, Ltd. (incorporated by reference to Exhibit 2.1 to WGL Holdings, Inc.'s Form 8-K filed January 27, 2017). |
| | |
| | Subscription Agreement for Series A Non-Voting Non-Convertible Perpetual Preferred Stock, dated as of January 25, 2017, by and between WGL Holdings, Inc. and AltaGas Ltd. (incorporated by reference to Exhibit 2.2 to WGL Holdings, Inc.'s Form 8-K filed January 27, 2017). |
| | |
| | Letter Agreement, dated January 11, 2018, by and between WGL Holdings, Inc. and AltaGas Ltd. (incorporated by reference to Exhibit 2.1 to WGL Holdings, Inc.'s Form 10-Q for the quarter ended December 31, 2017 filed February 8, 2018). |
| | |
| 3 | | Articles of Incorporation & Bylaws: |
| | |
| | Washington Gas Light Company Charter (incorporated by reference to Exhibit 4 to Registration Statement on Washington Gas Light Company's Form S-3 filed July 21, 1995). |
| | |
| | Articles of Incorporation of WGL Holdings, Inc. (incorporated by reference to Appendix B to Registration Statement on WGL Holdings, Inc.'s Form S-4 filed February 2, 2000). |
| |
| | |
| | Bylaws of WGL Holdings, Inc., as amended effective July 6, 2018 (incorporated by reference to Exhibit 3.1 to WGL Holdings, Inc.’s Form 8-K filed July 12, 2018). |
| | |
| | Bylaws of Washington Gas Light Company, as amended effective July 6, 2018 (incorporated by reference to Exhibit 3.2 to Washington Gas Light Company’s Form 8-K filed July 12, 2018). |
| | |
| 4 | | Instruments Defining the Rights of Security Holders including Indentures: |
| | |
| | Indenture Agreement dated August 28, 2014, entered into by and between WGL Holdings, Inc. and The Bank of New York Mellon, as Trustee (incorporated by reference to Exhibit 4.1 to WGL Holdings, Inc.'s Form 8-K filed October 15, 2014). |
| | |
| | First Supplemental Indenture relating to 2.25% Senior Notes due 2019, dated October 24, 2014, by and between WGL Holdings, Inc. and The Bank of New York Mellon, as Trustee (incorporated by reference to Exhibit 4.2 to WGL Holdings, Inc.'s Form 8-K filed October 24, 2014). |
| | |
WGL Holdings, Inc.
Washington Gas Light Company
Part IV
Item 15. Exhibits and Financial Statement Schedules (continued)
|
| | |
| | Second Supplemental Indenture relating to 4.60% Senior Notes due 2044, dated October 24, 2014, by and between WGL Holdings, Inc. and The Bank of New York Mellon, as Trustee (incorporated by reference to Exhibit 4.3 to WGL Holdings, Inc.'s Form 8-K filed October 24, 2014). |
| | |
4.4 | | Indenture, dated September 1, 1991 between Washington Gas Light Company and The Bank of New York, as Trustee, regarding issuance of unsecured notes (incorporated by reference to an exhibit to Washington Gas Light Company's Form 8-K filed September 19, 1991). |
| | |
4.54.2 | | Supplemental Indenture, dated September 1, 1993 between Washington Gas Light Company and The Bank of New York, as Trustee, regarding the addition of a new section to the Indenture dated September 1, 1991 (incorporated by reference to an exhibit to Washington Gas Light Company's Form 8-K filed September 10, 1993). |
| | | |
| | Terms Agreement, dated September 13, 2016, between Washington Gas Light Company, MUFG Securities Americas Inc., Wells Fargo Securities, LLC, BB&T Securities, LLC, TD Securities (USA) LLC and The Williams Capital Group, L.P. (incorporated by reference to Exhibit 1.1 to Washington Gas Light Company's Form 8-K filed September 19, 2016). |
| | | |
| | Terms Agreement, dated September 13, 2017, between Washington Gas Light Company, MUFG Securities Americas Inc. and RBC Capital Markets, LLC (incorporated by reference to Exhibit 1.1 to Washington Gas Light Company's Form 8-K filed September 19, 2017). |
| | | |
| | Indenture,Terms Agreement, dated November 29, 2017, by andSeptember 10, 2019, between WGL Holdings,Washington Gas Light Company, MUFG Securities Americas Inc. and The BankTD Securities (USA) LLC, as representatives of New York Mellon, as Trusteethe agents (incorporated by reference to Exhibit 4.11.2 to WGL Holdings, Inc.’sWashington Gas Light Company’s Form 8-K filed December 1, 2017)September 16, 2019). |
| | | |
| | First Supplemental Indenture, dated November 29, 2017, by and between WGL Holdings, Inc. and The Bank of New York Mellon, as Trustee (incorporated by reference to Exhibit 4.2 to WGL Holdings, Inc.’s Form 8-K filed December 1, 2017). |
| | |
| | Form of Floating Rate Note due 2019 (incorporated by reference to Exhibit 4.3 to WGL Holdings, Inc.’s Form 8-K filed December 1, 2017). |
| | |
| | Second Supplemental Indenture, dated March 14, 2018, by and between WGL Holdings, Inc. and The Bank of New York Mellon, as Trustee (incorporated by reference to Exhibit 4.2 to WGL Holdings, Inc.’s Form 8-K filed March 16, 2018). |
| | |
| | Form of Floating Rate Note due 2020 (incorporated by reference to Exhibit 4.3 to WGL Holdings, Inc.’s Form 8-K filed March 16, 2018). |
| | |
| 10 | | Material Contracts |
| | | |
| | Limited Liability Company Agreement of Meade Pipeline Co. LLC entered into on February 14, 2014, by and between WGL Midstream, Inc., COG Holdings LLC, Vega Midstream MPC LLC, River Road Interests LLC, and VED NPI I, LLC (incorporated by reference to Exhibit 10.1 to WGL Holdings, Inc.'s Form 10-Q for the quarter ended March 31, 2014 filed May 8, 2014). |
| |
| | Construction and Ownership Agreement entered into on February 14, 2014, by and between Transcontinental Gas Pipe Line Company, LLC and Meade Pipeline Co. LLC (incorporated by reference to Exhibit 10.2 to WGL Holdings, Inc.'s Form 10-Q for the quarter ended March 31, 2014 filed May 8, 2014). |
| |
| | Lease Agreement between Transcontinental Gas Pipe Line Company, LLC and Meade Pipeline Co. LLC (incorporated by reference to Exhibit 10.3 to WGL Holdings, Inc.'s Form 10-Q for the quarter ended March 31, 2014 filed May 8, 2014). |
| | |
| | | Other Services Contracts |
| | |
| | Master Services Agreement, effective June 19, 2007, with Accenture LLP, related to business process outsourcing, and service technology enhancements (incorporated by reference to Exhibit 10.1 to WGL Holdings, Inc.'s Form 10-Q for the quarter ended June 30, 2007 filed August 9, 2007). Portions of this exhibit were omitted pursuant to a request for confidential treatment submitted to the Securities and Exchange Commission. |
| | |
| | | Gas transportation and storage contracts |
| | |
| | Amended Service Agreement, effective October 31, 2008, with Columbia Gas Transmission, LLC related to Firm Storage Service Transportation (incorporated by reference to Exhibit 10.1 to WGL Holdings, Inc.'s Form 10-K for the fiscal year ended September 30, 2009 filed November 25, 2009) (consolidated into Agreement 100303). |
| | |
WGL Holdings, Inc.
Washington Gas Light Company
Part IV
Item 15. Exhibits and Financial Statement Schedules (continued)
|
| | |
| | Service Agreement, effective October 31, 2008, with Columbia Gas Transmission, LLC related to Firm Storage Service Transportation (incorporated by reference to Exhibit 10.3 to WGL Holdings, Inc.'s Form 10-Q for the quarter ended June 30, 2009 filed August 7, 2009) (consolidated into Agreement 100303). |
| | |
| | Service Agreement, effective November 1, 2005, with Columbia Gas Transmission, LLC related to Firm Storage Service Transportation (Agreement 85038) (incorporated by reference to Exhibit 10.3 to WGL Holdings, Inc.'s Form 10-K for the fiscal year ended September 30, 2005 filed December 14, 2005) (consolidated into Agreement 100303). |
| | |
| | Service Agreement, renegotiated and effective June 1, 2004, as amended, with Columbia Gas Transmission, LLC related to Storage Service (incorporated by reference to Exhibit 10.8 to WGL Holdings, Inc.'s Form 10-K for the fiscal year ended September 30, 2004 filed December 14, 2004) (Agreement 78839) (consolidated into Agreement 100303). |
| | |
| | Service Agreement, renegotiated and effective June 1, 2004, as amended, with Columbia Gas Transmission, LLC related to Storage Service (incorporated by reference to Exhibit 10.8 to WGL Holdings, Inc.'s Form 10-K for the fiscal year ended September 30, 2004 filed December 14, 2004) (Agreement 78840) (consolidated into Agreement 100303). |
| | |
| | Service Agreement, effective October 31, 2008, with Columbia Gas Transmission, LLC related to Firm Storage Service (incorporated by reference to Exhibit 10.1 to WGL Holdings, Inc.'s Form 10-Q for the quarter ended June 30, 2009 filed August 7, 2009) (consolidated into Agreement 4409). |
| |
| | Service Agreement, effective November 1, 2005, with Columbia Gas Transmission, LLC related to Firm Storage Service (Agreement 85037) (incorporated by reference to Exhibit 10.2 to WGL Holdings, Inc.'s Form 10-K for the fiscal year ended September 30, 2005 filed December 14, 2005) (consolidated into Agreement 4409). |
| |
| | Service Agreement, renegotiated and effective June 1, 2004, as amended, with Columbia Gas Transmission, LLC related to Firm Storage Service (incorporated by reference to Exhibit 10.7 to WGL Holdings, Inc.'s Form 10-K for the fiscal year ended September 30, 2004 filed December 14, 2004) (Agreement 78844) (consolidated into Agreement 4409). |
| |
| | Service Agreement, renegotiated and effective June 1, 2004, as amended, with Columbia Gas Transmission, LLC related to Firm Storage Service (incorporated by reference to Exhibit 10.7 to WGL Holdings, Inc.'s Form 10-K for the fiscal year ended September 30, 2004 filed December 14, 2004) (Agreement 78845) (consolidated into Agreement 4409). |
| | |
| | Service Agreement, renegotiated and effective June 1, 2004, as amended, with Columbia Gas Transmission, LLC related to Firm Storage Service (incorporated by reference to Exhibit 10.7 to WGL Holdings, Inc.'s Form 10-K for the fiscal year ended September 30, 2004 filed December 14, 2004) (Agreement 78846) (consolidated into Agreement 4409). |
| |
| | Service Agreement, effective November 1, 2008, with Columbia Gas Transmission, LLC related to Firm Transportation Service (incorporated by reference to Exhibit 10.2 to WGL Holdings, Inc.'s Form 10-Q for the quarter ended June 30, 2009 filed August 7, 2009) (consolidated into Agreement 4484). |
| |
| | Service Agreement, effective November 1, 2005, with Columbia Gas Transmission, LLC related to Firm Transportation Service (Agreement 85036) (incorporated by reference to Exhibit 10.4 to WGL Holdings, Inc.'s Form 10-K for the fiscal year ended September 30, 2005 filed December 14, 2005) (consolidated into Agreement 4484). |
| |
| | Service Agreement, renegotiated and effective June 1, 2004, as amended, with Columbia Gas Transmission, LLC related to Firm Transportation Service (incorporated by reference to Exhibit 10.9 to WGL Holdings, Inc.'s Form 10-K for the fiscal year ended September 30, 2004 filed December 14, 2004) (Agreement 78834) (consolidated into Agreement 4484). |
| |
| | Service Agreement, renegotiated and effective June 1, 2004, as amended, with Columbia Gas Transmission, LLC related to Firm Transportation Service (incorporated by reference to Exhibit 10.9 to WGL Holdings, Inc.'s Form 10-K for the fiscal year ended September 30, 2004 filed December 14, 2004) (Agreement 78835) (consolidated into Agreement 4484). |
| |
| | Service Agreement, renegotiated and effective June 1, 2004, as amended, with Columbia Gas Transmission, LLC related to Firm Transportation Service (incorporated by reference to Exhibit 10.9 to Form 10-K for the fiscal year ended September 30, 2004 filed December 14, 2004) (Agreement 78836) (consolidated into Agreement 4484). |
| |
| | Management Contracts, Compensatory Plans or Arrangements with Executive Officers and Directors |
| | |
WGL Holdings, Inc.
Washington Gas Light Company
Part IV
Item 15. Exhibits and Financial Statement Schedules (continued)
|
| | |
| | Form of Performance Share Award Agreement, as amended on October 21, 2014 (incorporated by reference to Exhibit 10.1 to WGL Holdings, Inc.'s Form 10-K for the fiscal year ended September 30, 2014 filed November 21, 2014).* |
| | |
| | Form of Performance Units Award Agreement, as amended on October 21, 2014 (incorporated by reference to Exhibit 10.2 to WGL Holdings, Inc.'s Form 10-K for the fiscal year ended September 30, 2014 filed November 21, 2014).* |
| | |
| | Form of Performance Unit Award Agreement (Total Shareholder Return) (incorporated by reference to Exhibit 10.1 to WGL Holdings, Inc.'s Form 10-Q for the quarter ended December 31, 2015 filed February 5, 2016).* |
| | |
| | Form of Performance Unit Award Agreement (Return on Equity) (incorporated by reference to Exhibit 10.2 to WGL Holdings, Inc.'s Form 10-Q for the quarter ended December 31, 2015 filed February 5, 2016).* |
| | |
| | Form of Performance Share Award Agreement (Total Shareholder Return) (incorporated by reference to Exhibit 10.3 to WGL Holdings, Inc.'s Form 10-Q for the quarter ended December 31, 2015 filed February 5, 2016).* |
| | |
| | Form of Performance Share Award Agreement (Dividend Coverage) (incorporated by reference to Exhibit 10.4 to WGL Holdings, Inc.'s Form 10-Q for the quarter ended December 31, 2015 filed February 5, 2016).* |
| |
| | Washington Gas Light Company Defined Contribution Supplemental Executive Retirement Plan (incorporated by reference to Exhibit 10.1 to Washington Gas Light Company's Form 10-Q for the quarter ended December 31, 2009 filed February 5, 2010).* |
| |
| | Washington Gas Light Company Defined Contribution Restoration Plan (incorporated by reference to Exhibit 10.2 to Washington Gas Light Company's Form 10-Q for the quarter ended December 31, 2009 filed February 5, 2010).* |
| |
| | Washington Gas Light Company Defined Benefit Restoration Plan (incorporated by reference to Exhibit 10.3 to Washington Gas Light Company's Form 10-Q for the quarter ended December 31, 2009 filed February 5, 2010).* |
| |
| | WGL Holdings, Inc. and Washington Gas Light Company Change in Control Severance Plan for Certain Executives, as amended on September 24, 2008 (incorporated by reference to Exhibit 10.1 to WGL Holdings, Inc.'s Form 10-K for the fiscal year ended September 30, 2008 filed December 1, 2008).* |
| | |
| | Amendment 2015-1 to the WGL Holdings, Inc. and Washington Gas Light Company Change in Control Severance Plan for Certain Executives, dated November 12, 2015 (incorporated by reference to Exhibit 99.1 to WGL Holdings, Inc.'s Form 10-Q for the quarter ended December 31, 2015 filed February 5, 2016).* |
| | |
| | WGL Holdings, Inc. and Washington Gas Light Company Change in Control Policy, dated December 15, 2006, as amended September 22, 2015 (incorporated by reference to Exhibit 99.1 to WGL Holdings, Inc.'s Form 8-K filed on January 20, 2016).* |
| |
| | Washington Gas Light Company Supplemental Executive Retirement Plan, amended and restated effective January 1, 2005, as further amended on September 24, 2008 (incorporated by reference to Exhibit 10.3 to Washington Gas Light Company's Form 10-K for the fiscal year ended September 30, 2008 filed December 1, 2008).* |
| | |
| | WGL Holdings, Inc. 2016 Omnibus Incentive Compensation Plan (incorporated by reference to Appendix B of WGL Holdings, Inc.’s Definitive Proxy Statement on Schedule 14A filed January 20, 2016).* |
| |
| | WGL Holdings, Inc. Omnibus Incentive Compensation Plan (incorporated by reference to Exhibit 10.2 to WGL Holdings, Inc.'s Form 8-K filed December 21, 2006).* |
| |
| | WGL Holdings, Inc. and Washington Gas Light Company Deferred Compensation Plan for Outside Directors, adopted December 18, 1985, and amended as of November 1, 2000 (incorporated by reference to Exhibit 10.2 to WGL Holdings, Inc.'s Form 10-K for the fiscal year ended September 30, 2001 filed December 20, 2001).* |
| | |
| | Form of ROE Performance Units (FY 2018 Series) Award under WGL Holdings, Inc. 2016 Omnibus Incentive Compensation Plan (incorporated by reference to Exhibit 10.1 to WGL Holdings, Inc.'s Form 8-K filed September 29, 2017).* |
| | |
| | Form of Dividend Coverage Performance Shares (FY 2018 Series) Award under WGL Holdings, Inc. 2016 Omnibus Incentive Compensation Plan (incorporated by reference to Exhibit 10.2 to WGL Holdings, Inc.'s Form 8-K filed September 29, 2017).* |
| | |
WGL Holdings, Inc.
Washington Gas Light Company
Part IV
Item 15. Exhibits and Financial Statement Schedules (continued)
|
| | |
| | Form of ROE Performance Shares (FY 2018 Series) Award under WGL Holdings, Inc. 2016 Omnibus Incentive Compensation Plan (incorporated by reference to Exhibit 10.3 to WGL Holdings, Inc.'s Form 8-K filed September 29, 2017).* |
| | |
| | Securities Distribution Agreements |
| | | |
| | Equity Distribution Agreement, dated November 24, 2015, by and among WGL Holdings, Inc., Wells Fargo Securities, LLC, BB&T Capital Markets, a division of BB&T Securities, LLC and RBC Capital Markets, LLC (incorporated by reference to Exhibit 1.1 to WGL Holdings, Inc.'s Form 8-K filed November 24, 2015). |
| | |
| | Distribution Agreement, dated September 10, 2015,January 8, 2019, by and among Washington Gas Light Company and BB&T Capital Markets, a division of BB&T Securities, LLC, Mitsubishi UFJ Securities (USA), Inc., TD Securities (USA) LLC, The Williams Capital Group, L.P., U.S. Bancorp Investments, Inc., Wells Fargo Securities, LLC and RBC Capital Markets, LLC,as agent, relating to the issuance and sale by Washington Gas Light Companyfrom time to time of up to $600,000,000$725,000,000 aggregate principal amount of the Company's Medium-Term Notes, Series KL (incorporated by reference to Exhibit 99.11.1 to Washington Gas Light Company's Form 8-K filed September 16, 2015)January 14, 2019). |
| | | |
| | | Debt and Credit Agreements |
| | | |
| | Note Purchase Agreement, dated December 15, 2014, between the Washington Gas Light Company, New York Life Insurance and Annuity Corporation and New York Life Insurance Company (incorporated by reference to Exhibit 10.1 to Washington Gas Light Company's Form 8-K filed December 17, 2014). |
| |
| | Note Purchase Agreement dated November 2, 2009, entered into by and among Washington Gas Light Company and certain purchasers, for the issuance and sale by Washington Gas Light Company of $50 million of 4.76% notes due November 1, 2019 (incorporated by reference to Exhibit 4.1 to Washington Gas Light Company's Form 8-K filed November 6, 2009). |
| |
| | Form of Note issued in connection with the Note Purchase Agreement dated November 2, 2009, by and among Washington Gas Light Company and certain purchasers, regarding the issuance and sale by Washington Gas Light Company of $50 million of 4.76% notes due November 1, 2019 (incorporated by reference to Exhibit 4.2 to Washington Gas Light Company's Form 8-K filed November 6, 2009). |
| |
| | First Amendment to Credit Agreement, dated December 19, 2014, between WGL Holdings, Inc. the lenders party thereto, and Wells Fargo Bank, National Association, as administrative agent for the Lenders (incorporated by reference to Exhibit 10.1 to WGL Holdings, Inc.'s Form 8-K filed December 19, 2014). |
| | |
| | First Amendment to Credit Agreement, dated December 19, 2014, between Washington Gas Light Company, the lenders party thereto, and Wells Fargo Bank, National Association, as administrative agent for the Lenders (incorporated by reference to Exhibit 10.2 to Washington Gas Light Company's Form 8-K filed December 19, 2014). |
| | |
| | Credit Agreement dated as of April 3, 2012 among WGL Holdings, Inc., the lenders parties thereto, Wells Fargo Bank, National Association, as administrative agent; The Bank of Tokyo-Mitsubishi UFJ, Ltd. as syndication agent; Branch Banking and Trust Company and TD Bank, N.A., as documentation agents; and Wells Fargo Securities, LLC, The Bank of Tokyo-Mitsubishi UFJ, Ltd., BB&T Capital Markets and TD Bank, N.A. as joint lead arrangers and joint book runners (incorporated by reference to Exhibit 10.1 to WGL Holdings, Inc.'s Form 10-Q for the quarter ended March 31, 2012 filed May 3, 2012). |
| |
| | Credit Agreement dated as of April 3, 2012 among Washington Gas Light Company, the lenders parties thereto, Wells Fargo Bank, National Association, as administrative agent; The Bank of Tokyo-Mitsubishi UFJ, Ltd. as syndication agent; Branch Banking and Trust Company and TD Bank, N.A., as documentation agents; and Wells Fargo Securities, LLC, The Bank of Tokyo-Mitsubishi UFJ, Ltd., BB&T Capital Markets and TD Bank, N.A. as joint lead arrangers and joint book runners (incorporated by reference to Exhibit 10.2 to WGL Holdings, Inc.'s Form 10-Q for the quarter ended March 31, 2012 filed May 3, 2012). |
| | |
| | Credit Agreement, dated as of February 18, 2016, among WGL Holdings, Inc., the lender parties thereto, U.S. Bank National Association, as Administrative Agent, TD Bank, N.A., as Syndication Agent, Branch Banking and Trust Company, as Documentation Agent, and U.S. Bank National Association and TD Bank, N.A., as joint lead arrangers and joint book runners (incorporated by reference to Exhibit 10.1 to WGL Holdings, Inc.'s Form 8-K filed February 19, 2016). |
| | |
| | Second Amendment to Credit Agreement and Commitment Increase, dated as of June 23, 2017, among WGL Holdings, Inc., the lenders party thereto, and Wells Fargo Bank, National Association, as administrative agent for the Lenders (incorporated by reference to Exhibit 10.1 to WGL Holdings, Inc.'s Form 8-K filed June 29, 2017). |
| | |
WGL Holdings, Inc.
Washington Gas Light Company
Part IV
Item 15. Exhibits and Financial Statement Schedules (continued)
|
| | |
| | Second Amendment to Credit Agreement, dated as of June 23, 2017, among Washington Light Company, the lenders party thereto, and Wells Fargo Bank, National Association, as administrative agent for the Lenders (incorporated by reference to Exhibit 10.2 to Washington Gas Light Company's Form 8-K filed June 29, 2017). |
| | |
| | Third Amendment to Credit Agreement, dated May 16, 2018, between WGL Holdings, Inc., the lenders party thereto, and Wells Fargo Bank, National Association, as administrative agent for the lenders (incorporated by reference to Exhibit 10.1 to WGL Holdings, Inc.’s Form 8-K filed May 22, 2018). |
| | |
| | Third Amendment to Credit Agreement, dated May 16, 2018, between Washington Gas Light Company, the lenders party thereto, and Wells Fargo Bank, National Association, as administrative agent for the lenders (incorporated by reference to Exhibit 10.2 to Washington Gas Light Company’s Form 8-K filed May 22, 2018). |
| | |
| | Stockholder Agreement, dated as of July 6, 2018, between Washington Gas Light Company and Wrangler SPE LLC (incorporated by reference to Exhibit 10.1 to WGL Holdings, Inc.’s Form 8-K filed July 12, 2018). |
| | | |
| | Amended and Restated Credit Agreement, dated as of July 19, 2019 among Washington Gas Light Company, and the lenders parties thereto, Wells Fargo Bank, National Association, as administrative agent; Branch Banking and Trust Company, MUFG Bank, Ltd. and TD Bank, N.A., as co-syndication agents; and Wells Fargo Securities LLC, BB&T Capital Markets, MUFG Bank, Ltd. and TD Securities (USA) LLC, as joint lead arrangers and joint book runners (incorporated by reference to Exhibit 10.1 to Washington Gas Light Company’s Form 8-K filed July 25, 2019). |
| | |
| | |
Washington Gas Light Company
Part IV
Item 15. Exhibits and Financial Statement Schedules (continued)
|
| | |
Schedule/ Exhibit | | Description |
| | Agent Accession Letter, dated September 10, 2019, between Washington Gas Light Company, MUFG Securities Americas Inc., TD Securities (USA) LLC, CIBC World Markets Corp., RBC Capital Markets, LLC, U.S. Bancorp Investments, Inc. and The Williams Capital Group, L.P. (incorporated by reference to Exhibit 1.1 to Washington Gas Light Company’s Form 8-K filed September 16, 2019). |
| | |
| 16 | | Letter re change in certifying accountant |
| | |
| | Letter from Deloitte & Touche LLP, dated October 12, 2018 (incorporated by reference to Exhibit 16.1 to Washington Gas Light Company form 8-K filed October 15, 2018). |
| | |
| 18 | | Letter re change in accounting principles |
| | | |
| | Preferability Letter Regarding Change in Accounting Principles for WGL Holdings, Inc. (incorporated by reference to Exhibit 18.1 to WGL Holdings, Inc.'s Form 10-Q for the quarter ended December 31, 2017 filed February 8, 2018). |
| | |
| | Preferability Letter Regarding Change in Accounting Principles for Washington Gas (incorporated by reference to Exhibit 18.2 to WGL Holdings, Inc.'s Form 10-Q for the quarter ended December 31, 2017 filed February 8, 2018). |
| | |
| | * Designates a compensatory plan or arrangement. |
Washington Gas Light Company
Part IV
| | | WGL Holdings, Inc. and Subsidiaries | |
Schedule II—Valuation and Qualifying Accounts and Reserves | | Years Ended September 30, 2018, 2017 and 2016 | |
| Calendar Year Ended December 31, 2019, Three Months Ended December 31, 2018, and Fiscal Years Ended September 30, 2018 and 2017 | | Calendar Year Ended December 31, 2019, Three Months Ended December 31, 2018, and Fiscal Years Ended September 30, 2018 and 2017 |
| | Balance at | Additions Charged To | | Balance | | Balance at | Additions Charged To | | Balance at |
| | Beginning | Costs and | Other | |
| at End of | | Beginning | Costs and | Other | | End of |
| (In thousands) | | of Period | Expenses(a) | Accounts(b) | Deductions(c) |
| Period | | of Period | Expenses(a) | Accounts(b) | Deductions(c) |
| Period |
| 2018 | | | | | |
| Calendar Year Ended December 31, 2019 | | | | |
Valuation and Qualifying Accounts Deducted from Assets in the Balance Sheet: Allowance for Doubtful Accounts | | $ | 32,025 |
| $ | 22,730 |
| $ | 1,431 |
| $ | 16,100 |
| $ | 40,086 |
| | $ | 29,461 |
| $ | 16,572 |
| $ | 2,565 |
| $ | 29,890 |
| $ | 18,708 |
|
| 2017 | | | | | |
| Three Months Ended December 31, 2018 | | | | |
Valuation and Qualifying Accounts Deducted from Assets in the Balance Sheet: Allowance for Doubtful Accounts | | $ | 27,339 |
| $ | 17,205 |
| $ | 1,841 |
| $ | 14,360 |
| $ | 32,025 |
| | $ | 29,622 |
| $ | 5,902 |
| $ | 581 |
| $ | 6,644 |
| $ | 29,461 |
|
| 2016 | | | | | |
| Fiscal Year Ended September 30, 2018 | | | | | |
Valuation and Qualifying Accounts Deducted from Assets in the Balance Sheet: Allowance for Doubtful Accounts | | $ | 26,224 |
| $ | 13,051 |
| $ | 3,856 |
| $ | 15,792 |
| $ | 27,339 |
| | $ | 23,741 |
| $ | 19,946 |
| $ | 1,409 |
| $ | 15,474 |
| $ | 29,622 |
|
| Fiscal Year Ended September 30, 2017 | | | | | |
Valuation and Qualifying Accounts Deducted from Assets in the Balance Sheet: Allowance for Doubtful Accounts | | | $ | 20,220 |
| $ | 14,320 |
| $ | 1,821 |
| $ | 12,620 |
| $ | 23,741 |
|
(a)Represent the amount of bad debt expense recorded to the income statement.
(b)Recoveries on receivables previously written off as uncollectible and unclaimed customer deposits, overpayments, etc. non refundable.
(c) Includes deductions for accounts charged-off.
|
| | | | | | | | | | | | | | | | |
| Washington Gas Light Company |
| Schedule II—Valuation and Qualifying Accounts and Reserves |
| Years Ended September 30, 2018, 2017 and 2016 |
| | Balance at | Additions Charged To | | Balance at |
| | Beginning | Costs and | Other | | End of |
| (In thousands) | | of Period | Expenses(a) | Accounts(b) | Deductions(c) |
| Period |
| 2018 | | | | | | |
Valuation and Qualifying Accounts Deducted from Assets in the Balance Sheet: Allowance for Doubtful Accounts | | $ | 23,741 |
| $ | 19,946 |
| $ | 1,409 |
| $ | 15,474 |
| $ | 29,622 |
|
| 2017 | | | | | | |
Valuation and Qualifying Accounts Deducted from Assets in the Balance Sheet: Allowance for Doubtful Accounts | | $ | 20,220 |
| $ | 14,320 |
| $ | 1,821 |
| $ | 12,620 |
| $ | 23,741 |
|
| 2016 | | | | | | |
Valuation and Qualifying Accounts Deducted from Assets in the Balance Sheet: Allowance for Doubtful Accounts | | $ | 19,254 |
| $ | 10,946 |
| $ | 3,806 |
| $ | 13,786 |
| $ | 20,220 |
|
(a)Represent the amount of bad debt expense recorded to the income statement.
(b)Recoveries on receivables previously written off as uncollectible and unclaimed customer deposits, overpayments, etc. non refundable.
(c) Includes deductions for accounts charged-off.
Washington Gas Light Company
Part IV
ITEM 16. FORM 10-K SUMMARY
Not Applicable.
SIGNATURES
Pursuant to the requirements of Section 13 or 15(d) of the Securities Exchange Act of 1934, the Registrant has duly caused this report to be signed on its behalf by the undersigned, thereunto duly authorized.
|
|
| WASHINGTON GAS LIGHT COMPANY |
| |
/s/ Vincent L. Ammann, Jr.Douglas I. Bonawitz |
Vincent L. Ammann, Jr.Douglas I. Bonawitz |
ExecutiveSenior Vice President, and |
| Chief Financial Officer and Treasurer |
Date: November 19, 2018February 28, 2020
Pursuant to the requirements of the Securities Exchange Act of 1934, this report has been signed below by the following persons on behalf of the registrantsregistrant and in the capacities and on the dates indicated.
|
| | | | |
| Signature | | Title | | Date |
| | | | | |
/s/ Adrian P. ChapmanDonald M. Jenkins | | President and Chief Executive Officer- US Utilities and Director | | November 19, 2018February 28, 2020 |
(Adrian P. Chapman)Donald M. Jenkins) | | (Principal Executive Officer) | | |
| | | | | |
/s/ Vincent L. Ammann, Jr.Douglas I. Bonawitz | | ExecutiveSenior Vice President, and Chief Financial Officer and Treasurer | | November 19, 2018February 28, 2020 |
(Vincent L. Ammann, Jr.)Douglas I. Bonawitz) | | (Principal Financial Officer) | | |
| | | | | |
/s/ William R. FordGunnar J. Gode | | Vice President and Chief Accounting OfficerController | | November 19, 2018February 28, 2020 |
(William R. Ford)Gunnar J. Gode) | | (Principal Accounting Officer) | | |
| | | | | |
| * | | Chairman of the Board | | November 19, 2018February 28, 2020 |
(John F. Stark)Randall L. Crawford) | | | | |
| | | | | |
| * | | Director | | November 19, 2018February 28, 2020 |
| (James W. Dyke, Jr.) | | | | |
| | | | | |
| * | | Director | | November 19, 2018February 28, 2020 |
| (Linda R. Gooden) | | | | |
| | | | | |
| * | | Director | | November 19, 2018February 28, 2020 |
(Phillip R. Knoll)M. Elise Hyland) | | | | |
| | | | | |
| * | | Director | | November 19, 2018February 28, 2020 |
(John E. Lowe)Dale S. Rosenthal) | | | | |
| | | | | |
| * | | Director | | November 19, 2018February 28, 2020 |
(DaleDeborah S. Rosenthal)Stein) | | | | |
| | | | | |
/s/ Vincent L. Ammann, Jr.Douglas I. Bonawitz | | | | November 19, 2018February 28, 2020 |
(Vincent L. Ammann, Jr.)Douglas I. Bonawitz) | | | | |
| Attorney-in-Fact | | | | |