UNITED STATES SECURITIES AND EXCHANGE COMMISSION
Washington, D.C. 20549
FORM 10-K
| | | | | |
| ☒ | Annual Report Pursuant to Section 13 or 15(d) of the Securities Exchange Act of 1934 |
FOR THE FISCAL YEAR ENDEDFor the Fiscal Year Ended December 31, 20212023
or
| | | | | |
| ☐ | Transition Report Pursuant to Section 13 or 15(d) of the Securities Exchange Act of 1934 |
Commission file number 001-06714
Graham Holdings Company
(Exact name of registrant as specified in its charter)
| | | | | | | | |
| Delaware | | 53-0182885 |
| (State or other jurisdiction of incorporation or organization) | | (I.R.S. Employer Identification No.) |
| |
| 1300 North 17th Street, Arlington, Virginia | | 22209 |
| (Address of principal executive offices) | | (Zip Code) |
Registrant’s Telephone Number, Including Area Code: (703) 345-6300
Securities Registered Pursuant to Section 12(b) of the Act:
| | | | | | | | | | | | | | |
| Title of each class | | Trading Symbol(s) | | Name of each exchange on which registered |
Class B Common Stock, par value
$1.00 per share | | GHC | | New York Stock Exchange |
Indicate by check mark if the registrant is a well-known seasoned issuer, as defined in Rule 405 of the Securities Act. Yes ☒ No ☐
Indicate by check mark if the registrant is not required to file reports pursuant to Section 13 or Section 15(d) of the Act. Yes ☐ No ☒
Indicate by check mark whether the registrant (1) has filed all reports required to be filed by Section 13 or 15(d) of the Securities Exchange Act of 1934 during the preceding 12 months (or for such shorter period that the registrant was required to file such reports), and (2) has been subject to such filing requirements for the past 90 days. Yes ☒ No ☐
Indicate by check mark whether the registrant has submitted electronically every Interactive Data File required to be submitted pursuant to Rule 405 of Regulation S-T (§232.405 of this chapter) during the preceding 12 months (or for such shorter period that the registrant was required to submit such files). Yes ☒ No ☐
Indicate by check mark whether the registrant is a large accelerated filer, an accelerated filer, a non-accelerated filer, a smaller reporting company, or an emerging growth company. See the definitions of “large accelerated filer,” “accelerated filer,” “smaller reporting company” and “emerging growth company” in Rule 12b-2 of the Exchange Act.
| | | | | | | | | | | | | | | | | | | | | | | | | | | | | |
| Large Accelerated Filer | ☒ | Accelerated
filer | ☐ | Non-accelerated
filer | ☐ | Smaller reporting
company | ☐ | Emerging growth
company | ☐ |
If an emerging growth company, indicate by check mark if the registrant has elected not to use the extended transition period for complying with any new or revised financial accounting standards provided pursuant to Section 13(a) of the Exchange Act. ☐
Indicate by check mark whether the registrant has filed a report on and attestation to its management’s assessment of the effectiveness of its internal control over financial reporting under Section 404(b) of the Sarbanes-Oxley Act (15 U.S.C. 7262(b)) by the registered public accounting firm that prepared or issued its audit report. Yes ☒ No ☐
If securities are registered pursuant to Section 12(b) of the Act, indicate by check mark whether the financial statements of the registrant included in the filing reflect the correction of an error to previously issued financial statements. ☒
Indicate by check mark whether any of those error corrections are restatements that required a recovery analysis of incentive-based compensation received by any of the registrant’s executive officers during the relevant recovery period pursuant to §240.10D-1(b). ☒
Indicate by check mark whether the registrant is a shell company (as defined in Rule 12b-2 of the Act). Yes ☐ No ☒
Aggregate market value of the registrant’s common equity held by non-affiliates on June 30, 2021,2023, based on the closing price for the Company’s Class B Common Stock on the New York Stock Exchange on such date: approximately $2,500,000,000.$2,000,000,000.
Shares of common stock outstanding at February 18, 2022:16, 2024:
Class A Common Stock – 964,001 shares
Class B Common Stock – 3,939,9773,498,459 shares
Documents partially incorporated by reference:
Definitive Proxy Statement for the registrant’s 20222024 Annual Meeting of Stockholders
(incorporated in Part III to the extent provided in Items 10, 11, 12, 13 and 14 hereof).
GRAHAM HOLDINGS COMPANY 20212023 FORM 10-K
| | | | | | | | | | | |
| Item 1. | | Business | |
| | | Education | |
| | | Television Broadcasting | |
| | Manufacturing | |
| Manufacturing | Healthcare | |
| | Automotive | |
| | HealthcareOther Activities | |
| | AutomotiveCompetition | |
| | Other ActivitiesExecutive Officers | |
| | Competition | |
| | | Executive OfficersHuman Capital | |
| | | Human Capital | |
| | Forward-Looking Statements | |
| | | Available Information | |
| Item 1A. | | Risk Factors | |
| Item 1B. | |
Unresolved Staff Comments | |
Item 2.1C. | | Properties | |
Item 3. | | Legal ProceedingsCybersecurity | |
| Item 2. | | Properties | |
| Item 3. | | Legal Proceedings | |
| Item 4. | | Mine Safety Disclosures | |
| Item 5. | | Market for the Registrant’s Common Equity, Related Stockholder Matters and Issuer Purchases of Equity Securities | |
| Item 6. | | Reserved | |
| Item 7. | | Management’s Discussion and Analysis of Financial Condition and Results of Operations | |
| Item 7A. | | Quantitative and Qualitative Disclosures About Market Risk | |
| Item 8. | | Financial Statements and Supplementary Data | |
| Item 9. | | Changes in and Disagreements With Accountants on Accounting and Financial Disclosure | |
| Item 9A. | | Controls and Procedures | |
| Item 9B. | | Other Information | |
| Item 9C. | | Disclosure Regarding Foreign Jurisdictions that Prevent Inspections | |
| Item 10. | | Directors, Executive Officers and Corporate Governance | |
| Item 11. | | Executive Compensation | |
| Item 12. | | Security Ownership of Certain Beneficial Owners and Management and Related Stockholder Matters | |
| Item 13. | | Certain Relationships and Related Transactions and Director Independence | |
| Item 14. | | Principal Accounting Fees and Services | |
| Item 15. | | Exhibits and Financial Statement Schedules | |
| Item 16. | | Form 10-K Summary | |
| INDEX TO EXHIBITS | |
| SIGNATURES | |
| INDEX TO FINANCIAL INFORMATION | |
| Management’s Discussion and Analysis of Results of Operations and Financial Condition (Unaudited) |
| Financial Statements: |
| |
| Report of Independent Registered Public Accounting Firm |
| Consolidated Statements of Operations for the Three Years Ended December 31, 2021 |
| Consolidated Statements of Comprehensive Income for the Three Years Ended December 31, 2021 |
| Consolidated Balance Sheets at December 31, 2021 and 2020 |
| Consolidated Statements of Cash Flows for the Three Years Ended December 31, 2021 |
| Consolidated Statements of Changes in Common Stockholders’ Equity for the Three Years Ended December 31, 2021 |
| Notes to Consolidated Financial Statements |
PART I
Item 1. Business.
Graham Holdings Company (the Company) is a diversified education and mediaholding company whose operations include educational services;services, television broadcasting; online, podcast, printbroadcasting, manufacturing, healthcare, automotive dealerships and local TV news; manufacturing; home health and hospice care; and automotive dealerships. The Company’sother businesses. Through Kaplan, Inc. (Kaplan) subsidiary, the Company provides a wide variety of educational services to students, schools, colleges, universities and businesses, both domestically and outside the United States (U.S.)., including academic preparation programs for international students, English-language programs, operations support services for pre-college, certificate, undergraduate and graduate programs, exam preparation for high school and graduate students and for professional certifications and licensures, career and academic advisement services to businesses, and operates a United Kingdom (U.K.) sixth-form college that prepares students for A-level examinations. The Company’s media operations comprise the ownership and operation of television broadcasting (through the ownershipsegment owns and operation ofoperates seven television broadcast stations) plus Slatestations and Foreign Policy magazines; City Cast, a daily local news podcast and newsletter company; and Pinna, an ad-free audio streaming service for children.provides social media management tools designed to connect newsrooms with their users. The Company’s manufacturing companies comprise the ownership of a supplier of pressure treatedpressure-treated wood, ana manufacturer of electrical solutions, company, a manufacturer of lifting solutions, and a supplier of certain parts used in electric utilities and industrial systems. The Company’s home health and hospice operations providehealthcare segment provides home health, hospice and palliative services.services, in-home specialty pharmacy infusion therapies, applied behavior analysis therapy, physician services for allergy, asthma and immunology patients, in-home aesthetics, and healthcare software-as-a-service technology. The Company’s automotive business comprise four dealerships.comprises eight dealerships and valet repair services. The Company also owns restaurants,Company’s other businesses include an online art gallery and in-person art fair business; an online commerce platform featuring original art and designs on an array of consumer products; an owner and operator of websites; restaurants; a custom framing company, a cybersecurity training company,company; a marketing solutions provider,provider; a customer data and analytics software company,company; Slate and Foreign Policy magazines; and a consumer internet company that builds creator-driven brands in lifestyle, homedaily local news podcast and art design categories.newsletter company.
Financial information concerning the principal segments of the Company’s business for the past three fiscal years is contained in Note 19 to the Company’s Consolidated Financial Statements appearing elsewhere in this Annual Report on Form 10-K. Revenues for each segment are shown in Note 19 gross of intersegment sales. Consolidated revenues are reported net of intersegment sales, which did not exceed 0.1% of consolidated operating revenues.
The Company’s operations in geographic areas outside the U.S. consist primarily of Kaplan’s non-U.S. operations. During each of the fiscal years 2021, 20202023, 2022 and 2019,2021, these operations accounted for approximately 22%21%, 22%20% and 24%22%, respectively, of the Company’s consolidated revenues, and the identifiable assets attributable to non-U.S. operations represented approximately 19%20% and 21% of the Company’s consolidated assets at December 31, 20212023 and 2020,2022, respectively.
EDUCATION
Kaplan a subsidiary of the Company, provides an extensive range of education and related services worldwide for students, universities and professionals. In 2021,businesses. Kaplan servedproducts and services reach learners directly or through Kaplan’s many relationships. These relationships include approximately 700,000 students and professionals worldwide and had associations with approximately 12,30015,000 companies and commercial relationships with approximately 4,0003,300 universities, colleges, schools and school districts, acrosswhich, along with individual students and professionals, pay for Kaplan’s products and services. In 2023, Kaplan was the globe. provider for the educational needs of approximately 1.2 million students and professionals worldwide who engaged with Kaplan services and materials in-person, online, through their schools (K-12, college, or university) or through their employer education or coaching programs. In 2023, Kaplan’s reach also included sales of 1.8 million units of book/study aid products to individuals, businesses, schools, colleges and universities.
Kaplan conducts its operationsbusiness through threetwo operating segments: Kaplan International (KI), and Kaplan North America Higher Education, Kaplan North America Supplemental Education and Kaplan International. As more fully described below, Kaplan consolidated its former Kaplan Higher Education, Kaplan Test Preparation and Kaplan Professional segments into one(KNA). KNA conducts business Kaplan North America, operating through two operating segments, Higher Education and Supplemental Education. In addition, the results of the Kaplan Corporate segment includeconsist of results of Kaplan’s investment activities in education technology companies. The following table presents revenues for each of Kaplan’s segments:
| | | | | | | | | | | | | | | | | |
| |
| Year Ended December 31 |
| (in thousands) | 2021 | | 2020 | | 2019 |
| Kaplan International | $ | 726,875 | | | $ | 653,892 | | | $ | 750,245 | |
| Kaplan North America Higher Education | 317,854 | | | 316,095 | | | 305,672 | |
| Kaplan North America Supplemental Education | 309,069 | | | 327,087 | | | 388,814 | |
| Kaplan Corporate and Intersegment Eliminations | 7,447 | | | 8,639 | | | 7,019 | |
| Total Kaplan Revenue | $ | 1,361,245 | | | $ | 1,305,713 | | | $ | 1,451,750 | |
In 2020, Kaplan combined its three segments based in the United States (Kaplan Higher Education, Kaplan Test Preparation and Kaplan Professional) into one business known as Kaplan North America. The combination reinforces Kaplan’s interconnected products and services, increases competitiveness in Kaplan’s markets and drives efficiencies.
Kaplan International
Kaplan International (KI)KI operates businesses in Europe and the Middle East, North America and the Asia Pacific region, each of which is discussed below.
Europe and the Middle East. In Europe, KI operates the following businesses, all of which are based in the United Kingdom (U.K.)U.K. and Ireland: Kaplan UK, KI Pathways, Kaplan Languages Group, Mander Portman Woodward,
Dublin Business School, Kaplan Open Learning and BridgeU. In the Middle East, Kaplan Professional Middle East is based in the United Arab Emirates.
The Kaplan UK business in Europe, through Kaplan Financial Limited, is a provider of apprenticeship training and test preparation services for accounting and financial services professionals, including those studying for ACCA, CIMA and ICAEW qualifications. Headquartered in London, England, Kaplan UK has 14 training centers located throughout the U.K. In 2021,2023, Kaplan UK provided courses to over 47,00048,000 students in accountancy and financial
services. In addition,2018, the Solicitors Regulation Authority (SRA) awarded Kaplan UK has beenthe contract to become the sole authorized assessment provider for the Solicitors Regulation Authority ofQualifying Examination (SQE) for all candidates seeking to become a solicitor in England and Wales. The first SQE assessments undertook place in 2021. The former Qualified Lawyers Transfer Scheme (QLTS) exam for candidates seeking to become solicitors of England and Wales who are already qualified lawyers in certain recognized jurisdictions. In 2021 Kaplan UK became the sole authorized assessment provider for the Solicitors Qualifying Examination forjurisdictions has now been discontinued as all candidates seekingare required to become a solicitor in England and Wales. Kaplan UK is headquartered in London, England, and has 19 training centers located throughouttake the U.K.SQE.
The KI Pathways business offers academic preparation programs especially designed for international students who wish to study for degrees fromat universities in English-speaking countries. KI Pathways also recruits international students for enrollment in certain U.S., U.K. and Canadian university partner programs. In 2021,2023, university preparation programs were delivered in Australia, Japan, Myanmar, Singapore, the U.K. and the U.K.U.S.
The Kaplan Languages Group business provides English-language training, academic preparation programs and test preparation for English proficiency exams, principally for students wishing to study and travel in English-speaking countries. As of December 31, 2021,2023, the Kaplan Languages Group operated 1920 English-language schools, with 1213 located in the U.K., Ireland and Canada and seven located in the U.S. In 2021,2023, the Kaplan Languages Group served approximately 10,30028,000 students for in-class and online English-language instruction. Through the Alpadia language schools located in France, Germany and Switzerland, Kaplan Languages Group also offers French and German language training to adolescents (from 16+) and adults, French and German language training.adults. Alpadia also operates language camps for juniors (from 8+) and teens during the fall, spring and summer seasons in the U.K., France, Germany and Switzerland. As of December 31, 2023, the Alpadia language schools served approximately 8,200 students.
Mander Portman Woodward (MPW) is a U.K. independent sixth-form college that prepares domestic and international students for the A-level examinations that are requiredU.K. universities require for admission to U.K. universities.admission. MPW operatescomprises three fifth- and sixth-form colleges in London, Cambridge and Birmingham.
KI also operates Dublin Business School in Ireland, a higher education institution, and Kaplan Open Learning in the U.K., an online learning institution.institution working in partnership with the University of Essex and the University of Liverpool. At the end of 2021,2023, these institutions enrolled an aggregate of approximately 10,40011,500 students.
In 2021,2023, Kaplan Professional Middle East, a financial training business operating in Dubai,the United Arab Emirates and Saudi Arabia, taught approximately 3,9004,700 students.
U.K. Immigration Regulations. Certain KI businesses serve a significant number of international students; therefore, the abilityit is critical that these businesses are able to sponsor international students to come to the U.K. is critical to these businesses. Pursuant to regulations administered by theThe United Kingdom Visas and Immigration Department (UKVI), administers certain regulations pursuant to which the KI Pathways business is required to hold or operate sponsorship licenses. KI Pathways is required to hold Student Route sponsorship licenses for international students to be permitted to enter the U.K. to study the courses that KI Pathways delivers. One of the Kaplan Languages Group schools also has a Student Route license to enable it to teach international students, although students at these schools generally choose toaged 16 and above who enter the U.K. on a Visitor or Short Term Student visa as opposed to a Student Route visa.Visa to enroll in the courses KI Pathways delivers.
Each Student Route license holder is required to have passed the annual Basic Compliance Assessment (BCA) and hold Educational Oversight accreditation, which requires a current and satisfactory full risk assessment, audit or review by the appropriate governing academic standards body. Student Route license holders are also required to pass the annual Basic Compliance Assessment (BCA). For the tenthtwelfth consecutive year, all KI institutions have retained Educational Oversight accreditation, with high grades across colleges, and all Student Route annual BCA renewals have been approved with high scores in the core measurable requirements. Kaplan Languages Group has oneStudents at English language schools generally choose to enter the U.K. English-language school listed on the Kaplana Visitor or Short Term Student master license.visa. The MPW schools each hold current Student Route and Child Student Route (applicable to students aged 4-17) licenses and have performed well consistently, with good records in their Office for Standards in Education, Children’s Services and Skills (OFSTED) and Independent Schools Inspectorate (ISI) Educational Oversight inspections.inspections by their applicable oversight bodies.
The Higher Education and Research Act 2017 (HERA) significantly reformed the regulation of the higher education sector in the U.K., including the formation ofcreated a new regulator for higher education in England, the Office for Students (OfS). Students enrolled at Pathways institutions registered with the OfS are, subject to the institution meeting certain compliance requirements, given many of the same student privileges as students of universities in the U.K. All of KI’s other higher education businesses in the U.K., excluding Glasgow International College and University of York International Pathway College, retained registration with the OfS in 20212023 to ensure that they could continue operating and retain their Student Route sponsor licenses and/or continue to accept students funded by U.K. student loans. Glasgow International College, which is located in Scotland, is not regulated by the OfS and remains overseen by the Quality Assurance Agency for Higher Education (QAA). The University of York International
Pathway College forms part of the University of York’s OfS registration. No assurance can be given that each KI business in the U.K. will be able to maintain its Student Route or Child Student route license and Educational Oversight or OfS/QAA registration. Maintenance of each of these approvals requires compliance with several core metrics that may be difficult to sustain. The loss by one or more institutions of either the Student Route or Child Student route license, or Educational Oversight accreditation or OfS/QAA registration would have a material adverse effect on KI Europe’s operating results.
Impact of Brexit. On June 23, 2016, the U.K. held a referendum in which voters approved a proposal that the U.K. leave the European Union (EU), commonly referred to as “Brexit.” The U.K.’s withdrawal became effective on December 31, 2020. The impact of Brexit on KI over time will depend on the long-term effects of the terms of the U.K.’s withdrawal from the EU. If the U.K. is no longer viewed as a favorable study destination, KI’s ability to recruit international students will be adversely impacted, which would materially adversely affect KI’s results of operations and cash flows. In November 2021, the EU granted the U.K. an adequacy decision under the General Data Protection Regulation (GDPR) for an initial period of four years.
Revised U.K. immigration rules became effective on January 1, 2021, as the Brexit transition was completed. All international students, including EEA and Swiss students studying in the U.K. for more than six months, are required to obtain a Student Route visa unless they are undertaking an English language course in which case they can apply for a Visit Visa for up to six months or a Short Term Study visa of up to 11 months. Free movement ceased between the EEA (together with Switzerland) and the U.K.; students from these countries entering the U.K. are now subject to the same U.K. immigration rules as students from outside the EEA and Switzerland. EEA and Swiss nationals commencing a higher education course in England from August 2021 no longer qualify for home fee status or have access to financial support from Student Finance England. It is unclear how international student recruitment agents and prospective international students view the U.K. as a study destination after the introduction of any new immigration requirements, and the U.K.’s exit from the EU. The introduction of revised immigration rules has historically increased, and may continue to increase, KI’s operating costs in the U.K. The introduction of new visa and other administrative requirements for entry into the U.K., Brexit and the perception of the U.K. as a less favorable study destination may have a materially adverse impact on KI’s ability to recruit international students and KI’s results of operations and cash flows.
Asia Pacific. In the Asia Pacific region, Kaplan operates businesses primarily in Singapore, Australia, New Zealand and the People’s Republic of China, including the Hong Kong Special Administrative Region (Hong Kong).
Singapore. In Singapore, Kaplan operates two business units:businesses: Kaplan Higher Education and KHEA-GenesisKaplan Financial (which comprises the former Kaplan Financial and Kaplan ProfessionalHigher Education Academy (KHEA)-Genesis business units)unit). During 2021,2023, the Kaplan Higher Education and KHEA-Genesis (Financial)Kaplan Financial divisions served more than 9,1006,900 students from Singapore and approximately 3,4003,100 students from other countries throughout Asia and Western Europe. KHEA-Genesis (Professional)Kaplan Financial provided short courses to approximately 400600 professionals, managers, executives and businesspeople in 2021.2023.
Kaplan Singapore’s Higher Education business provides students with the opportunity to earn bachelor’s and postgraduate degrees in various fields on either a part-time or full-time basis. Kaplan Singapore’s students receive degrees from affiliated educational institutions in Australia, Ireland and the U.K. In addition, this division offers pre-university and diploma programs.
Kaplan Singapore’s KHEA-Genesis (Financial)Kaplan Financial business provides preparatory courses for professional qualifications in accountancy and finance, such as the Association of Chartered Certified Accountants (ACCA) and Chartered Financial Analyst (CFA). Kaplan Singapore’s Professional business, through Kaplan Learning Institute, an authorized SkillsFuture Singapore (SSG) Approved Training Organization (ATO), provided professionals with various skills training through workforce skills qualifications (WSQ) courses. Kaplan Learning Institute ceased offering such courses and voluntarily deregistered Kaplan Learning Institute as a private education institution on March 9, 2020, following a notice in June 2019 from SSG suspending Kaplan Singapore Professional’s WSQ ATO status and revoking accreditation and funding for all WSQ courses effective July 1, 2019. These actions have adversely affected and will continue to adversely affect Kaplan Singapore’s revenues and operating results.
On October 7, 2020, Kaplan Higher Education Academy (KHEA) was granted approval by SSG to deliver WSQ courses as an ATO for a period of two years. KHEA-Genesis (Professional) started offering WSQ courses in the second quarter of 2021.
In June 2021, the Committee for Private Education (CPE) in Singapore instructed Kaplan Singapore to cease new enrollments for three marketing diploma programs on bothin a full and part-time basis due to noncompliance with minimum entry level requirements for admission and to teach out existing students in these programs. On August 23, 2021, the CPE issued the same instructions with respect to the Kaplan Foundation diploma and four information technology diploma programs on both a full and part-time basis. In November 2021, the CPE issued the same instructions with respect to a further 23 full-time or part-timenumber of diploma programs. Post regulatory action,In 2022, Kaplan Singapore is currently still able to offer 449 programs that are registered with the CPE, out of which there are 16 diplomas, 361 bachelors and the balance of which are certificate and postgraduate courses. Kaplan Singapore will
applysuccessfully applied for re-registration of certain diploma programs in 2022. The impact from regulatory actions by theand additional full-time and part-time programs. In May 2022, CPE will have a significant adverse impact onalso renewed Kaplan Singapore’s revenues, operating resultsregistration as a private education institution for a four-year period expiring in 2026. In 2023, Kaplan Singapore successfully renewed the certification required for private education institutions to enroll international students and cash flows in the future. No assurance can be given that applications for re-registration of the impacted programs will be successful. An inability to re-register one or more impacted programs could have a further material adverse effect on Kaplan Singapore’s revenues, operating results and cash flows.offer certain programs.
Australia. In Australia, Kaplan delivers a broad range of financial services programs from certificate level through master’s level, together with professional development offerings through Kaplan Professional, as well asand higher education programs in business, accounting, business analytics, hospitality, and tourism and managementinformation technology through Kaplan Business School. In 2021,2023, these businesses provided courses to approximately 4,5009,700 students through face-to-face and online or hybrid classroomprograms. Kaplan Professionals offered programs (within Kaplan Business School) andto approximately 30,00026,000 students through online or distance-learning programs offered by Kaplan Professional.programs. In 2021,2023, Kaplan Professional also had approximately 34,00038,000 subscribers for Ontrack, its continuing professional development platform for financial services professionals.
Kaplan Australia’s English-language business, which operates across five locations in Australia and one location in New Zealand, taught approximately 300 students in 2021. In July 2021, after the last student completed their course, the New Zealand English language business suspended its operations indefinitely. During 2021, due to the ongoing border closure, the Australian English businesses faced significant falls in student numbers leading to a consolidation of the four schools into one, with just the Sydney school offering online classes to a small number of remaining students. The Kaplan Australia Pathways business is also part of KI Pathways. In 2021,2023, it consisted of Murdoch Institute of Technology,College, the University of Newcastle College of International Education and the University of Adelaide College, and offered face-to-face pathways and foundational education in 2021 to approximately 1,0001,600 students wishing to enter Murdoch University, the University of Newcastle and the University of Adelaide. The contract with Murdoch University to run the Murdoch Institute of Technology expired in June 2021. In January 2021, Kaplan Australiaassociated universities. New programs were launched during 2023 at the University of Newcastle College of International Education, as part of a seven-year collaboration with the University of Newcastle. In March 2021, the University of AdelaideEducation. Murdoch College commenced delivery of teaching. In October 2021, English foundation studies and Murdoch University preparation courses in February 2023, and diploma programs in business and IT were approved by Australia’s national regulator, Tertiary Education Quality and Standards Agency (TEQSA), and will begin in early 2024. Offering other planned programs is dependent on regulatory approval. Kaplan Australia ceased to offer any standalone English language courses in 2023 as planned.
Kaplan International New Zealand obtained approval to establishoperates a new pathways college in Aukland in partnership with Massey University, College, which is scheduled to begin diploma and graduate diploma courses in July and October 2022, respectively.known as Massey University College. Kaplan Australia also owns Red Marker Pty Ltd., a machine learning and artificial intelligence-based provider of legal risk detection for digital, advertising and marketing content. Red Marker supports a wide variety of industries, including financial services, telecoms, automotive, pharmaceutical, food and beverage, media and government bodies. Red Marker’s Artemis product detects potentially noncompliant content as it is being created, helping advisers and licensees to identify and remediate compliance risks.
Hong Kong. In Hong Kong, Kaplan operates three main business units: Kaplan Financial, Kaplan Language Training and Kaplan Higher Education, serving approximately 10,6006,500 students annually.
Kaplan Hong Kong’s Financial division delivers preparatory courses to approximately 8,9005,650 students and business executives wishing to earn professional qualifications in accountancy, financial markets designations and other professional fields.
Kaplan Hong Kong’s Language Training division offers test preparation for both overseas study and college applications, including TOEFL, IELTS, SAT and GMAT, to approximately 500160 students.
Kaplan Hong Kong’s Higher Education division offers both full-timepart-time and part-timefull-time programs to approximately 1,200local students studying for degreesin Hong Kong and international students from leading Western universities. StudentsEurope; providing students with the opportunity to earn doctorate, master’sdiplomas, bachelor’s and bachelor’spostgraduate degrees in Hong Kong. Kaplan also offers a proprietary pre-college diploma program throughvarious fields from affiliated educational institutions in Australia, the Kaplan BusinessU.K. and Accountancy School.Germany.
In 2014, Kaplan Holdings Limited (Hong Kong) signed a joint venture agreement with CITIC Press Corporation. Under the terms of the agreement, the parties incorporated a joint venture company, Kaplan CITIC Education Co. Limited, 49% of which is owned by Kaplan Holdings Limited. The joint venture company is carrying out the publishing and distribution of Kaplan Financial training products in the People’s Republic of China.
Each of Kaplan’s international businesses is subject to unique and often complex regulatory environments in the countries in which they operate, and the degree of consistency in the application and interpretation of such regulations can vary significantly in certain jurisdictions.
Kaplan North America
As previously discussed, in 2020 Kaplan combined its segments into one business named Kaplan North America (KNA),KNA is comprised of two segments, Kaplan North America Higher Education (comprising primarily former Kaplan Higher Education (KHE) products and services) and Kaplan North America Supplemental Education (comprising primarily former Kaplan Test Preparation (KTP) and former Kaplan Professional (KP) products and services).Education.
Kaplan North AmericaThrough its Higher Education
Until March 22, 2018, through the KHE segment, Kaplan provided postsecondary education and Supplemental Education units, KNA provides operations support services to institutions of higher education for online courses and programs as well as directly providing courses, programs and training to pre-college, certificate, undergraduate and graduate students, through Kaplan University’s (KU) online and fixed-facility colleges. KU provided a wide array of certificate, diploma and degree programs designed to meet the needs of students seeking to advance their education and career goals. On March 22, 2018, certain subsidiaries of Kaplan contributed the institutional assets and operations of KU to a new university: an Indiana nonprofit, public-benefit corporation affiliated with Purdue University, known as Purdue University Global (Purdue Global). As part of the transfer to Purdue Global, KU transferred students, academic personnel, faculty and operations, property leases for KU’s campuses and learning centers, and Kaplan-owned academic curricula and content related to KU courses. Kaplan also indemnified Purdue for certain pre-closing liabilities. At the same time, KU and Purdue Global entered into a Transition and Operations Support Agreement, which was amended on July 29, 2019 (TOSA), pursuant to which KNA provides key non-academic operations support to Purdue Global. Kaplan received nominal upfront cash consideration upon the transfer of the institutional assets and operations of KU. The combination of the KHE, KTP and KP segments into one KNA business did not change Kaplan’s or Purdue Global’s obligations under the TOSA.
The transfer of KU did notprofessionals. These include any of the assets of the KU School of Professional and Continuing Education (now managed by KNA), which provides professional training and exam preparation for professional certifications and licensures. The transfer also did not include the transfer of other Kaplan businesses.
KNA also provideslicensures both direct to students and professionals and through agreements with institutions and corporate partner employees, online pre-college summer programs in partnership with traditional universities, and pre-college and graduate entrance exam test preparation services. KNA’s non-academic operations support services for online pre-college, certificate, undergraduate and graduate programs are provided to institutions such asincluding Purdue University, Purdue University Global, Creighton University, Wake Forest University and Lynn University. These are the same types of services and operations previously provided by the KHE segment which is now a part of the KNA business.
Kaplan North America Higher Education
Transition and Support Operations Support Agreement (TOSA).for Purdue University Global. KNA provides operations support functions to Purdue University Global (Purdue Global) which operates largely online as an Indiana public university affiliated with Purdue University. The operations support activities that KNA provides to Purdue Global (and other institutions of higher education, including Purdue University) include technology support, help-deskhelpdesk functions, human resources support for transferred faculty and employees, admissions support, financial aid processing, marketing and advertising, back-office business functions, certain test preparation and domesticother non-academic functions.
The support functions provided to Purdue Global are provided under a Transition and international student recruiting services.
Operations Support Agreement (TOSA), which was entered into in March 2018 at the time Kaplan transferred the institutional assets and academic operations of Kaplan University (its postsecondary education operations) to Purdue Global. The TOSA was amended in July 2019. Pursuant to the TOSA, KNA is not entitled to receive any reimbursement of costs incurred in providing support functions, or any fee, unless and until Purdue Global has first covered all of its operatingacademic costs (subject to a cap). If Purdue Global achieves cost efficiencies in its operations, KNAPurdue Global may be entitled to an additional payment equal to 20% of such cost efficiencies (Purdue Efficiency Payment). In addition, during each of Purdue Global’s first five years until 2023, prior to any payment to KNA, Purdue Global iswas entitled to a priority payment of $10 million per year beyond costs (Purdue Priority Payment). To the extent that Purdue Global’s revenue is insufficient to pay the Purdue Priority Payment, KNA is required to advance an amount to Purdue Global to cover such insufficiency. Upon closing of the transaction, Kaplan paid to Purdue Global an advance in the amount of $20 million, representing, and in lieu of, a Purdue Priority Payment for each of the fiscal years ending June 30, 2019, and June 30, 2020. Kaplan is entitled to reimbursement of this advance, subject to available cash or upon termination of the TOSA.
To the extent that there is sufficient revenue, to pay the Purdue Efficiency Payment, Purdue Global will beis reimbursed for its operatingacademic costs (subject to a cap) and will beis paid theany Purdue Efficiency Payment and Purdue Priority Payment.Payment, if due. To the extent that there is remaining revenue, KNA willis then be reimbursed for its operating costs (subject to a cap) of providing the support activities.functions. If KNA achieves cost efficiencies in its operations, then KNA may be entitled to an additional payment equal to 20% of such cost efficiencies (KNA Efficiency Payment). The TOSA, as amended, reflects the parties’ intent that, subject to available cash (calculated as cash balance minus cash deficiencies, if any, projected for the next six-month period based on applicable budget), KNA is entitled to receive a feepayment equal to 12.5% (increasing(increased to 13% frombeginning on June 30, 2023 and through June 30, 2027) of Purdue Global’s revenue, which served as the deferred purchase price for the transfer of KUKaplan University to Purdue Global (Deferred Purchase Price). Separately, KNA is entitled to a fee for services provided equal to 8% of KNA’s costs of providing such services to Purdue Global (Contributor Service Fee). KNA’s Contributor Service Fee is deducted from any amounts owed to KNA for the Deferred Purchase Price. Together these payments are known as “Contributor Compensation.” In each case, the Contributor Compensation remains subject to available cash and thecertain limitations of payment carryon unpaid amounts carrying over from year to year.
After the first five years of the TOSA, KNA and Purdue Global will be entitled to paymentsIn addition, beginning in a manner consistent with the structure described above, except that (i) Purdue Global will no longer be entitled to the Purdue Priority Payment and (ii)2023, to the extent that there are sufficient revenues after payment of the KNA Efficiency Payment (if any), Purdue Global will beis entitled to an annual payment equal to 10% of the remaining revenue after the KNA Efficiency Payment (if any) is paid, subject to certain other adjustments.
The TOSA has a 30-year initial term, which will automatically renew for five-year periods unless terminated. After the sixth year, Purdue Global has the right to terminate the agreement upon payment of an early termination fee equal to 125% of Purdue Global’s total revenue earned during the preceding 12-month period, which payment would be made pursuant to a 10-year note, and at the election of Purdue Global, for no additional consideration, it may receive for no additional
consideration certain tangible assets used exclusively by KNA exclusively to provide the support activitiesfunctions pursuant to the TOSA. At the end of the 30-year term, if Purdue Global does not renew the TOSA, Purdue Global will be obligated to make a
final payment of 75% of its total revenue earned during the preceding 12-month period, which payment will be made pursuant to a 10-year note, and, at the election of Purdue Global, it may receive for no additional consideration, it may receive certain assets used exclusively by KNA exclusively to provide the support activities pursuant to the TOSA. Either party may terminate the TOSA at any time if Purdue Global generates (i) $25 million in cash operating losses for three consecutive years or (ii) aggregate cash operating losses greater than $75 million at any point during the initial term. Operating loss is defined as the amount by which the sum of (1) Purdue Global’s and KNA’s respective costs in performing academic and support functions and (2) the $10 million Purdue Priority Payment in each of the first five years following March 22, 2018, exceeds the revenue Purdue Global generates for the applicable fiscal year. Upon termination for any reason, Purdue Global will retain the assets that Kaplan contributed pursuant to the TOSA. Each party also has certain termination rights in connection with a material default or material breach of the TOSA by the other party. Short of termination, Purdue Global has the right to take over from Kaplan (in-source) the provision of certain back-office support functions at any time with nine-months’nine months’ notice. Those functions include technology support, human resources, facility and property management, finance and accounting, communications, and default management. In 2022, Purdue Global began working with KNA to provide, pursuant to the TOSA, certain human resources, finance and accounting, facility management, and communications services itself, in-house.
Postsecondary Online Managed Services. In addition to services provided to Purdue Global through the TOSA, KNA provides specific non-academic managed services to university online programs at institutions including Wake Forest, Creighton University, Lynn University and Purdue University. These services include analytics, technology support, marketing, student advising and admissions support, and curriculum development support.Kaplan receives payment from university clients for these services, which may be based in part on the revenue of the programs Kaplan supports.
Pre-college Programs. KNA’s Prelum provides online pre-college programs for high school students to explore careers and courses in partnership with leading postsecondary institutions. The programs also enable KNA’s university partners to build a relationship with prospective students and to introduce them to their academic offerings, unique educational approach and culture. KNA’s Prelum programs have served thousands of students all over the world and in all 50 states, and include more than 50 programs in partnership with eight university partners including Wake Forest, Rice University, Columbia University Business School, Georgetown University, and Parsons Paris.
Higher Education Regulatory Environment. KNA no longer owns or operates KUKaplan University or any other institution participating in student financial aid programs created under Title IV of the U.S. Federal Higher Education Act of 1965 (Higher Education Act), as amended (Title IV). KNA provides services to Purdue Global, Purdue University, Wake Forest University, Lynn University, Creighton University, and other Title IV participating institutions that may require KNA to comply with certain laws and regulations, including applicable statutory provisions of Title IV. Currently, KNA also provides financial aid services to Purdue Global and, as such,(but no other institution). Due to the provision of these services to Purdue Global, pursuant to current U.S. Department of Education (ED) guidance, KNA meets the definition of a “third-party servicer”“Third-Party Servicer” contained in the Title IV regulations to Purdue Global (but no other institution as of the date of this report).regulations. As a third-party servicer,Third-Party Servicer, KNA is subject to applicable statutory provisions of Title IV and U.S. Department of Education (ED)ED regulations that, among other things, require KNA to be jointly and severally liable with its Title IV participating client institution(s)Purdue Global to the ED for any violation by such client institutionKNA or Purdue Global of any Title IV statute or ED regulation or requirement. Changes to the ED’s guidance on Third-Party Servicers including a change to the definition of what entity or services fall within the scope of the Third-Party Servicer regulations could cause KNA to be considered a Third-Party Servicer for other university clients. KNA is also subject to other federal and state laws, including, but not limited to, federal and state consumer protection laws and rules prohibiting unfair or deceptive marketing practices, data privacy, data protection and information security requirements established by federal state and foreign governments, including, for example, the Federal Trade Commission and the applicable provisions of the Family Educational Rights and Privacy Act regarding the privacy of student records. KNA’s failure to comply with these and other federal and state laws and regulations could result in adverse consequences to KNA’s business, including, for example:
•The imposition on KNA and/or Kaplan of fines, other sanctions or liabilities, including, without limitation, repayment obligations for Title IV funds to the ED or the termination or limitation on Kaplan’s eligibility to provide services as a third-party servicerThird-Party Servicer to any Title IV participating institution;
•Adverse effects on KNA’s business and results of operations from a reduction or loss in KNA’s revenues under the TOSA or any other agreement with any Title IV participating institution if a client institution loses or has limits placed on its Title IV eligibility, accreditation, operations or state licensure, or is subject to fines, repayment obligations or other adverse actions due to noncompliance by KNA (or the institution) with Title IV, accreditor, federal or state agency requirements;
•Liability under the TOSA or any other agreement with any Title IV participating institution for noncompliance with federal, state or accreditation requirements arising from KNA’s conduct; and
•Liability for noncompliance with Title IV or other federal or state laws and regulations occurring prior to the transfer of KUKaplan University to Purdue.
The laws, regulations and other requirements applicable to KNA or any KNA client institutions are subject to change and to interpretation. For example, borrower defense to repayment regulations that allow students to discharge certain federal loans and provide a Negotiated Rulemaking began in October 2021 that covered, in part, rules relatedprocess for the ED to recover the discharged amounts from the students’ school, and closed school loan discharges may create liability for Kaplan as a past owner of Title IV eligible institutions. The ED also finalized changes to the borrower defense regulations which expand the types of claims that can be made by students, reinstating the ability of the ED to repayment adjudicationconsider claims as a group, removing limitation periods on claims, and changing the process and recoveryfor seeking recoupment from institutions, closed school loan discharges, disability loan discharges, public loan forgiveness, income driven repayment plans and arbitration agreements. Asinstitutions. In addition, as part of this currenta Negotiated Rulemaking, in a session that began in January 2022,new rules and changes to existing rules were finalized by the ED also proposedin the fourth quarter of 2022 and became effective on July 1, 2023. Included in these new rules is a change to the Title IV definition of “Nonprofit”“nonprofit” institution to generally exclude from that definition any institution that is an obligor on a debt owed to a former owner of the institution or that maintains a revenue-based service agreement with a former owner of the institution. The ED intends to apply this new definition to public institutions as well as private nonprofit institutions. Such regulatory changes as well asincluding those described above could subject Purdue GlobalKaplan or its partner institutions to additional regulatory requirements. Any resulting new rules or changes to existing rules are not likely to be effective until July 1, 2023.requirements and liabilities.
Incentive compensation. Under the ED’s incentive compensation rule, an institution participating in Title IV programs may not provide any commission, bonus or other incentive payment to any person or entity engaged in any student recruiting or admission activities or in making decisions regarding the awarding of Title IV funds if such
payment is based directly or indirectly on success in securing enrollments or financial aid. KNA is a third party providing bundled services to Title IV participating institutions that include recruiting and, in the case of Purdue Global, financial aid services. As such, KNA is also subject to the incentive compensation rules as applied to the institutions it serves and cannot provide any commission, bonus or other incentive payment to any covered employees, subcontractors or other partiesparty engaged in certain student recruiting, admission or financial aid activities based on success in securing enrollments or financial aid. In addition, tuition revenue sharingrevenue-sharing payments to KNA under the TOSA (as well as any other agreement with any Title IV participating institution) must comply with the ED’s revenue sharing guidance provided by the ED related to bundled services agreements. For more information, see Item 1A. Risk Factors. Failure to Comply with the ED’s Title IV Incentive Compensation Rule Could Subject Kaplan to Liabilities, Sanctions and Fines.
Misrepresentations. A Title IV participating institution is required to comply with the ED regulations related to misrepresentations and with related federal and state laws. These laws and regulations are broad in scope and may extend to statements by servicers, such as KNA, that provide marketing or certain other services to such institutions. The laws and regulations may also apply to KNA’s employees and agents with respect to statements addressing the nature of an institution’s programs, financial charges or the employability of its graduates. Additionally, failure to comply with these and other federal and state laws and regulations regarding misrepresentations and marketing practices could result in the imposition on KNA or its client institutions of fines, other sanctions or liabilities, including, without limitation, federal student aid repayment obligations to the ED, the termination or limitation on KNA’s eligibility to provide services as a third-party servicer to Title IV participating institutions, the termination or limitation of a client institution’s eligibility to participate in the Title IV programs, or legal action by students or other third parties. A violation of misrepresentation regulations or other federal or state laws and regulations applicable to the services KNA provides to its client institutions arising out of statements by KNA, its employees or agents could require KNA to pay the costs associated with indemnifying its client institutions from applicable losses resulting from the violation and could result in fines, other sanctions or liabilities imposed on KNA.
Compliance by client institutions with Title IV program requirements and other federal, state and accreditation requirements. KNA currently provides services to education institutions that are heavily regulated bysubject to federal and state laws and regulations and subject to extensive accrediting body requirements. Presently, aA material portion of KNA’s revenues areis attributable to deferred purchase price and service fees it receives under the TOSA with Purdue Global, which are dependent upon revenues generated by Purdue Global and dependent upon Purdue Global’s eligibility to participate in the Title IV federal student aid program. To maintain Title IV eligibility, Purdue Global and KNA’s other client institutions must be certified by the ED as eligible institutions, maintain authorizations by applicable state education agencies and be accredited by an accrediting commission recognized by the ED. Purdue Global and KNA’s other client institutions must also comply with the extensive statutory and regulatory requirements of the Higher Education Act and other state and federal laws and accrediting standards relating to their financial aid management, educational programs, financial strength, disbursement and return of Title IV funds, facilities, recruiting practices, representations made by the school and other parties, and various other matters. Additionally, Purdue Global and other client institutions are subject to laws and regulations that, among other things, limit student default rates on the repayment of Title IV loans, permit borrower defenses to repayment of Title IV loans based on certain conduct of the institution, establish specific measures of financial responsibility and administrative capability, regulate the addition of new campuses
and programs and other institutional changes; require compliance with state professional licensure board requirements to the extent applicable to institutional programs and require state authorization and institutional and programmatic accreditation. If the ED finds that Purdue Global or other client institutions have failed to comply with Title IV requirements or improperly disbursed or retained Title IV program funds, it may take one or more of a number of actions, including, but not limited to:
•fining the school;
•requiring the school to repay Title IV program funds;
•limiting or terminating the school’s eligibility to participate in Title IV programs;
•initiating an emergency action to suspend the school’s participation in Title IV programs without prior notice or opportunity for a hearing;
•transferring the school to a method of Title IV payment that would adversely affect the timing of the institution’s receipt of Title IV funds;
•requiring the school to submit a letter of credit;
•denying or refusing to consider the school’s application for renewal of its certification to participate in the Title IV programs or for approval to add a new campus or educational program; and
•referring the matter for possible civil or criminal investigation.
If Purdue Global or other client institutions lose or have limits placed on their Title IV eligibility, accreditation or state licensure, or if they are subject to fines, repayment obligations or other adverse actions due to their or KNA’s noncompliance with Title IV regulations, accreditor or state agency requirements or other state or federal laws, KNA’s financial results of operations could be adversely affected. After acquiring KU,Kaplan University, on August 3, 2018, Purdue Global received an updated Provisional Program Participation Agreement (PPPA) from the ED which is necessary for continued participation in the federal Title IV programs after the change in ownership from Kaplan to Purdue. The PPPA expired on June 30, 2021, but continuescontinued in effect until the ED issues theextended, replaced by a final approved Program Participation Agreement.Agreement, or specifically terminated. On October 15, 2021, Purdue Global received from the ED a new PPPA granting provisional certification until June 30, 2022. This PPPA was again extended month to month until August 18, 2022, when the ED granted a new provisional certification until June 30, 2024. Under this most recent PPPA, Purdue Global must apply for and receive approval for expansion or any substantial change before it may award, disburse or distribute Title IV funds based on the substantial change. Substantial changes generally include, but are not limited to: (a) the establishment of an additional location; (b) an increase in the level of academic offering beyond those listed in the institution'sinstitution’s Eligibility and Certification Approval Report (ECAR);Report; (c) the addition of any educational program (including degree, non-degree or short-term training programs), or (d) the addition of any new degree program. In addition, the institution must pay any liabilities found in a currently open program review prior to the expiration of the PPPA. Purdue Global must also inform the ED on a quarterly basis of any governmental investigations involving the university and provide the ED with a summary of any student complaints. The provisional certification ends upon the ED'sED’s notification to the institution of the ED'sED’s decision to grant or deny a six-year certification to participate in the Title IV, Higher Education Act (HEA) programs.
Compliance, regulatory actions, reviews and litigation. KNA and its client institutions are subject to reviews, audits, investigations and other compliance reviews conducted by various regulatory agencies and auditors, including, among others, the ED, the ED’s Office of the Inspector General, accrediting bodies and state and various other federal agencies. These compliance reviews could result in findings of noncompliance with statutory and regulatory requirements that could, in turn, result in the imposition of fines, liabilities, civil or criminal penalties or other sanctions against KNA and its client institutions. Separately, if KNA provides financial aid services to more than one Title IV participating institution (i.e., one or more participating institutions in addition to Purdue Global), itor if the ED expands the current interpretation of the definition of Third-Party Servicer to include services in addition to providing financial aid services, KNA will be required to arrange for an independent auditor to conduct an annual Title IV compliance audit of KNA’s compliance with applicable ED requirements. KNA’s client institutions are also required to arrange for an independent auditor to conduct an annual Title IV compliance audit of their compliance with applicable ED requirements, including requirements related to services provided by KNA.
OnIn May 6, 2021, Kaplan received a notice from the ED that it would be conducting a fact-finding process pursuant to the borrower defense to repayment (BDTR) regulations to determine the validity of more than 800 BDTR claims and a request for documents related to several of Kaplan’s previously owned schools. Beginning in JulyIn 2021, Kaplan started receiving the claims and related information requests. In total, Kaplan received 1,449 borrower defense applications that seekfrom the ED seeking discharge of approximately $35 million in loans. Most claims received areloans, excluding interest, from former KUKaplan University students. The ED’s process for adjudicating these claims is subject to the borrower defense regulations but itIt is not clear to what extent the ED will exclude claims based on the underlying statutes of limitations, evidence provided by Kaplan, prior settlements with these students relieving their debt outside of the BDTR process, or any prior investigation related to schools attended by the student applicants. The ED’s process
for adjudicating these claims is subject to the borrower defense regulations including those finalized in 2022 and effective July 1, 2023. Compared to the previous rule, the new rule in part, expands actions that can give rise to claims for discharge; provides that the borrower’s claim will be presumed true if the institution does not provide any responsive evidence; provides an easier process for group claims; and relies on current program review penalty hearing processes for discharge recoupment. Under the rule, the recoupment process applies only to loans first disbursed after July 1, 2023; however, the discharge process and standards apply to any pending application regardless of the loan date.
Kaplan believes it has substantive as well as procedural defenses to the borrower defense claims that would bar any student discharge or school liability including that the claims are barred by the applicable statute of limitations, are unproven, incomplete and fail to meet regulatory filing requirements. Kaplan expects to vigorously defend any attempt by the ED to hold Kaplan liable for any ultimate student discharges and is respondingdischarges. Kaplan responded to allthe initial set of claims in 2021 with documentary and narrative evidence to refute the allegations, demonstrate their lack of merit, and support the denial of all such claims by the ED. Kaplan intends to similarly respond to any new claims that apply to Kaplan University or prior Kaplan-owned schools. If the claims are successful, the ED may seek reimbursement for the amount discharged from Kaplan. If the ED initiates a reimbursement action against Kaplan following approval of former students’ BDTR applications, Kaplan may be subject to significant liability.
On September 3, 2015,As part of the Sweet v. Cardona settlement described below, the ED agreed to review any borrower defense applications submitted between June 23, 2022, and November 15, 2022 on an expedited basis. In January 2024, Kaplan soldwas informed that the ED received applications during this time period regarding former Kaplan University and Purdue Global students and Kaplan has begun to Education Corporationreceive them. Unknown at this time is the total discharge amount sought or how much of America (ECA) substantiallythat amount would apply to Kaplan University students. The Sweet v. Cardona settlement requires the ED to adjudicate applications received during the designated time period pursuant to the requirements of the 2016 Borrower Defense Regulation. To the extent these applications apply to Kaplan University, Kaplan anticipates that it will have defenses similar to those described above. As noted, if the claims are successful, the ED may seek reimbursement for the amount discharged from Kaplan. If the ED initiates a reimbursement action against Kaplan following approval of additional former students’ borrower defense to repayment applications, Kaplan may be subject to significant liability.
In November 2022 the Northern District of California approved the settlement agreement in the lawsuit Sweet v. Cardona. The Plaintiffs in that lawsuit claimed that the ED failed to properly consider and decide pending BDTR claims. As part of the settlement, the ED agreed to discharge loans of borrowers who attended 150 specific schools, including all schools formerly owned by Kaplan, and who had BDTR claims pending as of the June 22, 2022 settlement execution date. This discharge will likely cover each of the first set of applications the ED sent to Kaplan and to which Kaplan previously responded. The ED and the Court made clear that these discharges as part of a settlement are not determinations that the pending BDTR claims are valid and the fact of the settlement discharge cannot be used as evidence of any determination of wrongdoing by the institutions. However, despite the fact that the loans are discharged per the settlement, the ED may still attempt to separately adjudicate the associated BDTR claims and follow the regulatory process for seeking recoupment from the institutions for such claims. As noted above, this settlement likely also applies to the resolution, future adjudication, and possible discharge of the newly noticed claims. As also noted, the ED could attempt to recoup from Kaplan some or all of any discharged amount for the assets of the prior KHE Campuses. The transaction included the transfer of certain real estate leases that were guaranteed or purportedly guaranteed by Kaplan. ECA is currently in receivership, has terminated all of its higher education operations and has sold most, if not all, of its remaining assets (including New England College of Business). Additionally, the receiver has repudiated all of ECA’s real estate leases. Although ECA is required to indemnify Kaplan for any amounts Kaplan must pay due to ECA’s failure to fulfill its obligations under the real estate leases guaranteed by Kaplan, ECA’s current financial condition and the amount of secured and unsecured creditor claims outstanding against ECA make it unlikely that Kaplan will recover from ECA. In the second half of 2018, the Company recorded an estimated $17.5 million in losses on guarantor lease obligations in connection with this transaction in other non-operating expense. The Company recorded an additional estimated $1.1 million in non-operating expense in 2019, $1 million in non-operating expense in 2020, and $1.1 million in non-operating expense in 2021; in each case consisting of legal fees and lease costs. The Company continues to monitor the status of these obligations.newly noticed claims.
In addition, Kaplan could be the subject of future compliance reviews or lawsuits related to formerly owned KUKaplan University and KHEKaplan Higher Education (KHE) schools in connection with the pre-sale conduct of such schools that could result in monetary liabilities or fines or other sanctions against Kaplan.
Kaplan North America Supplemental Education
In 2021, KNA’s supplemental education included all products of the former KTP and KP segments, includingSupplemental Education includes exam preparation, professional licensure and certification, and corporate training and continuing education. KNA offers a wide array of programs and services across various markets focusing on lifetime value creation and professional lifecycles. These markets are discussed below.
In 2023, KNA served over 943,000 students through its exam preparation, professional licensure and certification, and corporate training and continuing education programs and related products (such as tutoring, online question banks and online practice tests), excluding sales of test prep books by third-party retailers. Virtually all KNA exam preparation programs are offered online, typically in a live online classroom or a self-study format, although some programs are offered in person. Private tutoring services are provided online. In 2023, KNA served approximately 3,200 business-to-business clients, including approximately 158 Fortune 500 companies.
PrecollegePre-college and Social Sciences. KNA provides exam preparation for high school and graduate students under the Kaplan Test Prep, Manhattan Prep and Barron’s Educational Series brands for a broad range of standardized, high-stakes tests, including the SAT, ACT, GMAT and GRE. KNA also provides admissions consulting, tutoring and other advisory services.
Healthcare. KNA provides exam preparation for the medical college admissions test (MCAT) and professional licensure exam preparation for physicians (USMLE), nurses (NCLEX), pharmacists (NAPLEX), dentists (NBDE) and physician assistants (PANCE). Under the brand i-Human Patients, KNA offers online, simulated patient interaction training for medical health professionals, which is typically purchased by medical, nursing and physician assistant schools. KNA’s USMLE in-person programs are accredited and the Student and Exchange Visitor Program (SEVP) is approved for F-1 students and operateoperates under the Kaplan Medical Prep & Achieve brand. InUnder the brand, Projects in Knowledge, 2021, KNA acquired aoffers continuing medical education business for physicians, nurses and pharmacists which is accredited by Joint Accreditation for Interprofessional Continuing Education and operated under the brand Projects in Knowledge.Education.
Legal Government and Social Justice.Government. KNA offers exam preparation for the law school admissions test (LSAT) and state bar licensure exam preparation for lawyers in 50 jurisdictions through Kaplan Bar Review and Preliminary Multistate Bar Review (PMBR). For the military, KNA offers the Armed Services Vocational Aptitude Battery (ASVAB) that measures developed abilities and helps predict future academic and occupational success in the military and in 2021, Kaplan acquired Bluejacketeer which offers practice test questions for Navy advancement exams on a subscription basis.basis through the brand, Bluejacketeer.
Business and Financial. Professional licensure products are operated under the brands Dearborn Real Estate Education, Kaplan Real Estate Education, Bob Hogue School of Real Estate, Kaplan Financial Education and Kaplan Schweser. KNA helps professionals obtain certifications, licenses and designations to enable them to advance their careers. Additionally, KNA collaborates with organizations to solve their talent management challenges through customized corporate learning and development solutions. Through live and online instruction, KNA provides professional license test preparation, licensing and continuing education, as well as leadership and professional development programs to businesses and individuals in the accounting, insurance, securities, real estate, financial services and wealth management areas.
Technology and Engineering. KNA offers data science and analytics online courses and training for corporations under the brand name Metis. In 2022, Metis expects to focus on providing courses and programs to educational institutions for their students rather than direct to student sales. KNA also offers licensing exam preparation for engineers, architects and designers under the brand name PPI.
Publishing. Kaplan Publishing focuses on Kaplan Test Prep, Barron's,Barron’s, and Manhattan Prep test preparation and reference resources sold through retail channels. At the end of 2021,2023, Kaplan Publishing had 1,1821,100 products available in print and digital formats, including 368305 digital products. In total, KNA test prep prepares students for more than 233 standardized tests, the large majority of which are U.S. focused.
In 2021, KNA served over 220,000 students through its exam preparation programs and related products (such as tutoring, online question banks and online practice tests), excluding sales of test prep books by third-party retailers. KNA exam preparation programs are taught online and at Kaplan-branded locations and at numerous other locations, such as hotels, high schools, universities and companies throughout the U.S., including Puerto Rico, as well as in Canada, Mexico and the U.K. KNA also licenses material for certain programs to third parties. Since the end of the first quarter of 2020, virtually all KNA exam preparation programs have been offered online, typically in a live online classroom or a self-study format, while some programs have continued in person. Private tutoring services are provided online and, in select markets, in person. In 2022, KNA expects to offer more in-person courses for select exam preparation offerings.
In 2021, KNA served approximately 2,700 business-to-business clients including approximately 120 Fortune 500 companies. In 2021, approximately 218,000 students used KNA’s professional licensure exam preparation offerings.
TELEVISION BROADCASTING
Graham Media Group, Inc. (GMG), a subsidiary of the Company, owns seven television stations located in Houston, TX; Detroit, MI; Orlando, FL; San Antonio, TX; Jacksonville, FL; and Roanoke, VA, as well as SocialNewsDesk, a provider of social media management tools designed to connect newsrooms with their users. The following table sets forth certain information with respect to each of the Company’s television stations:
| | | | | | | | | | | | | | | | | | | | | | | | | | | | | | | | |
Station, Location and
Year Commercial
Operation Commenced | | National
Market
Ranking (a) | | Primary
Network
Affiliation | | Expiration
Date of FCC
License | | Expiration Date
of Network
Agreement | | Total Commercial
Stations
in DMA (b) |
| KPRC, Houston, TX, 1949 | | 6th | | 9thNBC | | NBC | | Aug. 1, 20222030 | | Dec. 31, 20222025 | | 1714 |
| WDIV, Detroit, MI, 1947 | | 15th14th | | NBC | | Oct. 1, 2029 | | Dec. 31, 20222025 | | 108 |
| WKMG, Orlando, FL, 1954 | | 16th | | 17thCBS | | CBS | | Feb. 1, 2029 | | June 30, 20222026 | | 1813 |
| KSAT, San Antonio, TX, 1957 | | 31st | | ABC | | Aug. 1, 20222030 | | March 31, 2026 | | 1512 |
| WJXT, Jacksonville, FL, 1947 | | 43rd41st | | None | | Feb. 1, 2029 | | — | | 98 |
| WCWJ, Jacksonville, FL, 1966 | | 43rd41st | | CW | | Feb. 1, 2029 | | Aug. 31, 2025 | | 98 |
| WSLS, Roanoke, VA, 1952 | | 70th | | 71st | NBC | | Oct. 1, 2028 | | Dec. 31, 20222025 | | 87 |
_________________________________________________________________________________
(a) Source: 2021/20222023/2024 Local Television Market Universe Estimates, the Nielsen Company, November 20212023 and effective January 1, 2022,2024, based on television homes in DMA (see note (b) below).
(b) Full-power commercial TV stations, Designated Market Area (DMA) is a market designation of the Nielsen Company that defines each television market exclusive of another, based on measured viewing patterns.
Revenue from broadcasting operations is derived primarily from the sale of advertising time to local, regional and national advertisers. In 2021,2023, advertising revenue accounted for 57.7%55% of the total for GMG’s operations. Advertising revenue is sensitive to a number of factors, some specific to a particular station or market and others more general in nature. These factors include a station’s audience share and market ranking; seasonal fluctuations in demand for airtime; annual or biannual events, such as sporting events and political elections; and broader economic and other market trends, including alternative advertising platforms, among others.
Regulation of Broadcasting and Related Matters
GMG’s television broadcasting operations are subject to the jurisdiction of the U.S. Federal Communications Commission (FCC) under the U.S. Federal Communications Act of 1934, as amended (the Communications Act). Each GMG television station holds an FCC license that is renewable upon application for an eight-year period. As shown in the table above, the current terms of the GMG station licenses expire in 2022 through 2029.between 2028 and 2030. GMG expects the FCC to grant future license renewal applications for its stations in due course, but cannot provide any assurances that the FCC will do so.
Digital Television (DTV) and Spectrum Issues. Each GMG station (and each full-power television station nationwide) broadcasts only in a digital format, which allows transmission of HDTV programming and multiple channels of standard-definition television programming (multicasting).
Television stations may receive interference from a variety of sources, including interference from other broadcast stations, that is below a threshold established by the FCC. That interference could limit viewers’ ability to receive television stations’ signals. The amount of interference toreceived by television stations could increase in the future because of the FCC’s decision to allow electronic devices, known as “white space” devices, to operate in the television frequency band on an unlicensed basis on channels not used by nearby television stations.
In November 2017, the FCC voted to adopt rules authorizing broadcast television stations to voluntarily transition to a new technical standard, called Next Generation TV (NextGenTV) or ATSC 3.0. The new standard is designed to allow broadcasters to provide consumers with better sound and picture quality; hyper-localized programming, including news and weather; enhanced emergency alertsalerts; and improved mobile reception. The ATSC 3.0 standard allows for the use of targeted advertising and more efficient use of spectrum by, for example, by allowing for more multicast streams to be aired on the same six-megahertz channel. ATSC 3.0 is not backward compatible with existing television equipment, and the FCC’s rules require full-power television stations that transition to the new standard to continue broadcasting a signal in the existing DTV standard (ATSC 1.0) until the FCC phases out the requirement in a future order. A transitioning station’s DTV-formatted content must be substantially similar to the programming aired on its ATSC 3.0 channel until July17, 2023, five years fromJuly 17, 2027, to ensure that viewers continue to have access to the datesame DTV-formatted programming during the rulestransition to the NextGen TV standard. GMG is broadcasting in the original 2017 FCC order were finalized. In June 2020, the FCC re-affirmed this sunset date, but stated that it would open a proceeding one year priorATSC 3.0 standard in Detroit (WDIV-TV), Orlando (WKMG-TV), Houston (KPRC-TV) and Roanoke (WSLS-TV). GMG is preparing to the sunset date to determine whether the date should be extended.
GMG launched its firstlaunch an ATSC 3.0 stream in December 2020 for station WDIV-TV in Detroit; priorSan Antonio (KSAT-TV) to thebe followed by a launch WDIV-TV had applied for and was granted authority by the FCC to effectuate anof ATSC 3.0 simulcasting arrangement with WMYD (licensed to Scripps Broadcasting Holdings, LLC) in the Detroit area. In 2021, two GMG
stations each entered into simulcasting arrangements. First, in June 2021, GMG station WKMG-TV (Orlando) applied forJacksonville (WJXT-TV and was granted authority by the FCC to effectuate an ATSC 3.0 simulcasting arrangement with another station in the Orlando area (WRBW-DT, licensed to Fox Television Stations, LLC)WCWJ-TV). The station’s ATSC 3.0 stream was then launched along with the rest of the market on June 30, 2021. Second, in November 2021, GMG station KPRC-TV (Houston) applied for and was granted authority by the FCC to effectuate an ATSC 3.0 simulcasting arrangement with another station in the Houston area (KIAH, licensed to Tribune Media Company). The station’s ATSC 3.0 stream was then launched on December 2, 2021. As required by the FCC rules, each of the respective station’s stream is in addition to such station’s current DTV stream, which viewers continue to be able to view.
In connection with the transition to ATSC 3.0, which is an internet protocol-based standard, the FCC has updated its rules to reflect how broadcasters may use their spectrum in non-traditional ways (Broadcast Internet). In June 2020, the FCC issued a Declaratory Ruling clarifying that the television ownership rules would not apply to the lease of broadcast spectrum for Broadcast Internet purposes, and in December 2020, the FCC voted to adopt rules that specifically apply its existing framework regarding derogation of service and use of spectrum for ancillary and supplementary purposes to Broadcast Internet; i.e., a broadcaster must continue to air at least one free, over-the-air television signal in SDTV format, and if a broadcaster opts to use its spectrum for Broadcast Internet services, it will incur a five percent fee based on the gross revenue received by the broadcaster. It is too soon to predict precisely how the use of broadcast spectrum for Broadcast InternetATSC 3.0 services could impact the broadcast industry.
In April 2017,recent years, the FCC announcedhas authorized the completion of an incentive auction in which certain broadcast television stations bid to relinquish spectrum or move to a different spectrum band in exchange for a share of the revenues obtained by auctioning the reallocated broadcast spectrum for use, by wirelessbroadband providers. None and other unlicensed devices of GMG’s stations participated in the incentive auction. However, certain GMG stations—specifically, WDIV, WSLS, WCWJ and WJXT—were required to move to new channel allotments in order to free up a nationwide blockbands of spectrum for wireless broadband use. The FCC adopted rules requiring this “repacking” ofthat have historically been used by broadcast television stations to new channels to be completed within 39 months after the incentive auction closed, with earlier deadlines set for particular stations in order to stagger the transition to new channels. The WSLS transition was completed on September 11, 2019, the WCWJ and WJXT transitions were completed on January 16, 2020, and the WDIV transition was completed on September 16, 2020 (following tolling of its assigned deadline due to delays related to the COVID-19 pandemic).
GMG’s repacked stationssatellite operators. Broadcasters have been eligible to seek reimbursement for repacking-related costs and have been receiving reimbursement payments through the FCC’s process. Congress has capped the overall funds available for repack-related reimbursements. The initial legislation authorizing the incentive auction provided only $1.75 billion in total for all such reimbursements. Congress later made available an additional $1 billion in reimbursement funds, with $600 million in available funds allocated to 2018 and $400 million allocated to 2019.
To date, each repacked commercial television station, including each of the repacked GMG stations, has been allocated a reimbursement amount equal to approximately 94% of the station’s estimated repacking costs, as verified by the FCC’s fund administrator. Receipt of the allocated funds is subject to FCC approval of particular requests for reimbursement of actual costs fully incurred. By October 8, 2021, stations that transitioned in the first half of the 39-month post-auction repack had to submit all remaining invoices for incurred expenses. WSLS, which transitioned in the first half of the post-auction repack, complied with this deadline. The remaining GMG stations must submit all remaining invoices, to the extent there are any, in 2022. As of December 31, 2021, the repacked GMG stations have received approximately $19.6 million in FCC reimbursements since 2018.
In March 2020, the FCC announced the reformation of the 3.7-4.2 GHz band (C-band) through a public auction of the lower 280 megahertz of these frequencies (3.7-3.98 GHz). This auction, which concluded February 2021, allows winning bidders to use the 3.7-3.98 GHz frequencies for wireless broadband services. However, this spectrum reallocation requires the relocation of incumbent C-band satellite operations—including those used to deliver programming to television stations—to a “repacked” 4.0-4.2 GHz band. In exchange for a portion of the auction proceeds, satellite operators have chosen to relocate their operations pursuant to an “accelerated” relocation timeline.
GMG’s television stations receive programming from the relocating satellite operators, and this requires the transition of operations at GMG stations through the installation of antenna filters, repointing and retuning of antennas, and other activities. Although GMG elected to have the satellite operators manage these transition efforts, GMG coordinated with the satellite operators and submitted various filings tourged the FCC to confirm the transition eligibilityensure that broadcast operations are protected against interference from unlicensed devices operating in those bands. In November 2023, GMG timely filed a certification identifying all of its stations and ensurecurrent, active authorizations in the stations remain protected from harmful interference post-transition.
The first phase12.7-13.25 GHz band of the “accelerated” C-band transition concluded December 5, 2021, and the deadline for the second phase is December 5, 2023. GMG anticipates that the satellite operators andspectrum, as required by the FCC may request additional information aboutas it considers whether to allow unlicensed devices to operate in that band. The extent to which GMG’s stationsbroadcast business will be affected by the FCC action allowing unlicensed devices to complete the second phaseoperate in bands of the transition.
spectrum used by broadcasters is not yet known.Carriage of Local Broadcast Signals. Congress has established, and periodically has extended or otherwise modified, various statutory copyright licensing regimes governing the local and distant carriage of broadcast television signals on cable and satellite systems. The CompanyGMG cannot predict whether or how Congress may maintain or modify these regimes in the future, or what net effect such decisions would have on the Company’sits broadcast operations or on the Company overall.operations.
The Communications Act and the FCC rules allow a commercial television broadcast station, under certain circumstances, to insist on mandatory carriage of its signal on cable systems serving the station’s market area (must carry). Alternatively, stations may elect, at three-year intervals, to forgo must-carry rights and allow their signals to be carried by cable systems only pursuant to a “retransmission consent” agreement. Commercial television stations may also may elect either mandatory carriage or retransmission consent with respect to the carriage of their signals on direct broadcast satellite (DBS) systems that provide “local-into-local” service (i.e., distribute the signals of local television stations to viewers in the local market area). Stations that elect retransmission consent may negotiate for compensation from cable orand DBS systems in exchange for the right to carry their signals. Each of GMG’s television stations has elected retransmission consent for both cable and DBS operators, and each is carried on all of the major cable and DBS systems serving each station’s respective local market pursuant to retransmission consent agreements. Retransmission consent elections must be made every three years. The most recent election deadline was October 1, 2020;2023; all GMG stations elected retransmission consent for both cable and DBS operators. The 2020 election process was less time-intensive than prior processes, as the FCC in July 2019 moved to an electronic election system that now allows broadcasters to post their carriage elections online and to send notices to covered MVPDs electronically. The next election deadline is October 1, 2023 and will follow the same process.
Recent statutory changes have required the FCC to modify its rules governing retransmission consent negotiations. The Television Viewer Protection Act, enacted on December 20, 2019, made changes to the “good faith” standards
for retransmission consent negotiations, calling for the FCC to implement regulations requiring “large station groups” (groups of television broadcast stations that have a national audience reach of more than 20%) to negotiate in good faith with MVPDMultichannel Video Programming Distributor (MVPD) “buying groups” (entities that negotiate on behalf of multiple small MVPDs). GMG does not qualify as a “large station group” under the statute and therefore willis not be subject to this obligation. While GMG does not anticipate that these recent changesrules will materially affect its bargaining position in retransmission consent negotiations, if Congress or the FCC were to enact further changes to the retransmission consent rules (such as by requiring small station groups like GMG to negotiate with MVPD buying groups, mandating continued carriage of a station’s signal by an MVPD during a retransmission consent dispute, or otherwise giving MVPDs heightened bargaining power), such changes could have a material effect on retransmission consent revenues.
In 2014, the FCC opened a proceeding to consider whether certain internet-based programming distribution services, called “virtual” MVPDs, should be classified as MVPDs and thus subject to the retransmission consent rules. More than nine years later, the FCC has taken no action in that proceeding. Because the retransmission consent rules at present do not apply to virtual MVPDs such as YouTube TV, Hulu + Live TV, and DIRECTV Stream, the broadcast networks negotiate agreements with virtual MVPDs that are presented to their affiliates as “opt-in” agreements, and local affiliates of the broadcast networks are unable to negotiate directly with virtual MVPDs to reach agreements for the carriage of their signals. Unless the FCC rules that virtual MVPDs should be classified as MVPDs, GMG may be unable to negotiate carriage agreements with these distribution services that include the payment of market-based retransmission fees. The current rules are significant to GMG stations as virtual MVPD subscriber numbers continue to increase.
The FCC has also considered proposals to alter its rules governing network non-duplication and syndicated exclusivity. InNearly ten years ago, in March 2014, the FCC solicited comments on a proposal to eliminate its network non-duplication and syndicated exclusivity rules, which restrict the ability of cable operators, direct broadcast satellite systems and other distributors classified by the FCC as MVPDs to import the signals of out-of-market television stations with duplicate programming during retransmission consent disputes or otherwise. The FCC has not acted on that proposal to date. If Congress or the FCC were to enact further changes to the exclusivity rules, such changes could materially affect the GMG stations’ bargaining position in future retransmission consent negotiations.
Ownership Limits. The Communications Act and the FCC’s rules limit the number and types of media outlets in which a single person or entity may have an attributable interest. The FCC is required by statute to review its media ownership rules (with the exception of the national television ownership rule, discussed below) every four years to determine whether those rules remain necessary in the public interest as thea result of competition. This process is referred to as the quadrennial review. In November 2017, the FCC conducted such a review and voted to eliminate certain of its ownership limit restrictions and to modify others. This FCC decision was challenged in court, and the Third Circuit Court of Appeals set aside the FCC’s decision inThe media November 2019. However, the FCC appealed the Third Circuit court’s decision, and on April 1, 2021, the U.S. Supreme Court reversed that decision. This means that the media ownership rules now reflect the November 2017 changes. The current ownership rule most relevant to GMG is the local television ownership rule. The rule prohibits one broadcaster from owning (or having an attributable interest in) two full-power television stations licensed to the same Nielsen DMA if both of them are ranked among the top four stations in the market, unless the broadcaster can demonstrate to the FCC that the combination serves the public interest. Ownership of more than two top-four, full-power television stations is generally prohibited.
The FCC’s most recentCommission initiated the 2018 quadrennial review in December 2018 and completed it via a Report and Order dated December 26, 2023 (Order). The Order largely retains the current local television ownership rule without significant substantive change, with one exception: going forward, the rule generally will prohibit a broadcaster from acquiring a second (or additional) top-four network affiliation and placing it on a station’s multicast stream or on a commonly owned low power television station in the same market. The Order exempts from this restriction ownership of its media ownership rules wastwo or more top-four network affiliations resulting from organic growth of a station’s market share or from a network’s choice to move an affiliation between stations in a market. The 2022 quadrennial, which the FCC initiated in December 2018. That proceeding2022, is pending.
It remains open. In June 2021,to be seen whether and how the FCC solicited comments to refreshorder resolving the record, but no2018 quadrennial review might affect the FCC’s action has been taken in that proceeding to date.the 2022 proceeding. GMG’s ability to enter into certain transactions in the future may be affected by ownership rules articulated in the 2018 quadrennial review and/or by the resolution of the current FCC2022 quadrennial review proceeding.
Under the national television ownership rule, a single person or entity may have an attributable interest in an unlimited number of television stations nationwide, as long as the aggregate audience reach of such stations does not exceed 39% of nationwide television households and as long as such interest complies with the FCC’s other
ownership restrictions. In 2016, the FCC eliminatedThat calculation takes into account the 50% Ultra High Frequency (UHF) discount, under which stations broadcasting on UHF channels are credited with only half the number of households in their market for purposes of calculating compliance with the 39% cap. However, the FCC reversed that decision in early 2017, concluding that the UHF discount should not be altered except in connection with a broader review of the national ownership cap. The reinstatement of the UHF discount was upheld by the D.C. Circuit in the summer of 2018.market. In December 2017, the FCC initiated a rule makingrule-making proceeding seeking comments regarding its authority to modify or eliminate the national television ownership cap, which was set at 39% by statute, as well as the potential elimination of the UHF discount. That proceeding remains open.
Programming. Six of GMG’s seven stations are affiliated with one or more of the national television networks that provide a substantial amount of programming to their television station affiliates. The expiration dates of GMG’s affiliation agreements are set forth in the table at the beginning of this Television Broadcasting section. WJXT, one of GMG’s Jacksonville stations, has operated as an independent station since 2002. In addition, each of the GMG stations receives programming from syndicators and other third-party programming providers. GMG’s performance depends in part on the quality and availability of third-party programming broadcast by its stations, and any substantial decline in the quality or availability of this programming could materially affect the ability of GMG and its competitors to attract viewers, generate advertising revenues, or enter into certain transactions in the future.
Public Interest Obligations. To satisfy FCC requirements, stations are generally are expected to air a specified number of hours of programming intended to serve the educational and informational needs of children and to complete reports on a quarterlyan annual basis concerning children’s programming. In July 2019, the FCC modified these rules to provide broadcasters with more flexibility in meeting the public interest obligations. Among other things, thesethe current rules allow up to 52 hours per year of children’s programming to consist of educational specials and/or short-form programming. The prior rules required all qualifying programming to be regularly scheduled and aired in 30-minute blocks. While stations are required to air the substantial majority of their educational and informational children’s programming on their primary program stream, under the current rules they may now air up to 13 hours per quarter of regularly scheduled weekly programming on a multicast stream. In addition, the FCC requires stations to limit the amount of advertising that appears during certain children’s programs.
TheOther FCC has other regulations and policies to ensure that broadcast licensees operate in the public interest, including rules requiring the disclosure of certain information and documents in an online public inspection file; rules requiring the closed-captioning of programming to assist television viewing by the hearing impaired; video description rules to assist television viewing by the visually impaired; rules concerning the captioning of video programming distributed via the internet; rules governing the broadcast of emergency alerts; and rules concerning the volume of commercials. Compliance with these rules imposes additional costs on the GMG stations that could affect GMG’s operations.
Political Advertising. The FCC regulates the sale of advertising by GMG’s stations to candidates for public office and imposes other obligations regarding the broadcast of political announcements more generally, including the disclosuresdisclosure of certain information related to such advertising in the station’s online public inspection file. The application of these regulations may limit the advertising revenues of GMG’s television stations during the periods preceding elections. Failure to comply with the political advertising rules may result in enforcement actions by the FCC. The Company has procedures in place regarding compliance with the FCC’s political advertising rules, but cannot predict how the FCC’s future application of these rules will affect GMG’s stations.
Broadcast Indecency. The FCC’s policies prohibit the broadcast of indecent and profane material during certain hours of the day, and the FCC may impose monetary forfeitures when it determines that a television station has violated that policy. Broadcasters have repeatedly challenged these rules, in court, arguing, among other things, that the FCC has failed to justify its indecency decisions adequately, that the FCC’s policy is too subjective to guide broadcasters’ programming decisions and that its enforcement approach otherwise violates the First Amendment. In June 2012, the U.S. Supreme Court held that certain fines against broadcasters for “fleeting expletives” were unconstitutional because the FCC failed to provide advance notice to broadcasters of what the FCC deemed to be indecent, but it also upheld the FCC’s authority to regulate broadcast decency. The Company cannot predict how GMG’s stations may be affected by the FCC’s current or future interpretation and enforcement of its indecency policies.
Other Matters. In addition to the matters described above, the FCC is conducting proceedings concerning various other matters, the outcome of which could adversely affect the profitability of GMG’s television broadcasting operations.
MANUFACTURING
Hoover Treated Wood Products, Inc.
Hoover Treated Wood Products, Inc. (Hoover) is a supplier of pressure impregnatedpressure-impregnated kiln-dried lumber and plywood products for fire-retardant and preservative applications. Hoover, founded in 1955 and acquired by the Company in
2017, is headquartered in Thomson, GA. It operates 1011 facilities across the country and services a stocking distributor network of more than 100 locations spanning the U.S. and Canada.
Group Dekko Inc.
Group Dekko Inc. (Dekko) is an electrical solutions company that focuses on innovative power charging and data systems; industrial and commercial indoor lighting solutions; and the manufacture of electrical components and assemblies for medical equipment, transportation, industrial and appliance products. Dekko, founded in 1952, is headquartered in Fort Wayne, IN, and operates 1311 facilities in fivefour states and Mexico.
Joyce/Dayton Corp.
Joyce/Dayton Corp. (Joyce/Dayton) is a leading manufacturer of screw jacks, linear actuators and related linear motion products and lifting systems in North America. Joyce/Dayton provides its lifting and positioning products to customers across a diverse range of industrial end markets, including renewable energy, metals and metalworking, oil and gas, satellite antennae and material handling sectors.
Forney Corporation
Forney Corporation (Forney) is a global supplier of burners, igniters, dampers, and controls for combustion processes in electric utility and industrial applications. Forney is headquartered in Addison, TX, and its manufacturing plant is in Monterrey, Mexico. Forney’s customers include power plants and industrial systems around the world.
HEALTHCARE
Graham Healthcare Group
Graham Healthcare Group (GHG) provides home health, hospice, palliative, home infusion and other healthcare services. GHG served approximately 120,000 patients in 2023. Its home health, palliative and hospice operations provides services to more than 50,000approximately 80,000 patients annually. GHG operates 13annually across the states of Michigan, Illinois, Pennsylvania, Kansas, Missouri, Ohio, and Florida. GHG’s brands include Residential Home Health, Residential Hospice, Allegheny (AHN) Healthcare@Home, and Mary Free Bed at Home and across these companies there are 18 home care, sevenhealth, 12 hospice, and twosix palliative care operating units in Michigan, Illinois, Pennsylvania and Florida. Sixunits. Sixteen of GHG’s 1936 operating units are operated through joint ventures with health systems and physician groups. Thegroups and the remainder are wholly ownedwholly-owned. Home health, palliative and operated under the “Residential” brand name. Home healthhospice services include a wide range of health care services that are provided wherever home may be and social services deliveredare tailored to the unique needs and goals of the patients. Home health care helps patients gain independence and remain safe at home to recovering, disabled and chronically or terminally ill persons in need of medical, nursing, social or therapeutic treatment and assistance with the essential activities of daily living.as active community members. Hospice care focuses on relieving symptomssupports patients and supporting patients with a life expectancy of six months or less. Hospice care involves an interdisciplinary approach to the provision of medical care, pain management andtheir families’ unique physical, emotional, and spiritual support, with an emphasisneeds, while focusing on comfort, not curing. Hospice services can be provided in the patient’s home, as well as in free-standing hospice facilities, hospitals, nursing homes and other long-term care facilities. Palliative care is a specialized form of medicine provided by nurse practitioners that aims to enhance theoptimizing quality of life, comfort, and dignity. Palliative care complements curative treatments and is provided by in-home nurse practitioners who aim to treat advanced pain and uncomfortable symptoms of patients and their families who are faced with serious illness. It focuses on increasing comfort through prevention and treatment of distressing symptoms. In addition to expert symptom management, palliative care focuses on clear communication, advance planning and coordination of care. Each GHG operating unit offers care coordination, healthcare solutions and clinical expertise.disease. All home health, palliative, and hospice operationsoperating units are Medicare certified and accredited by the Accreditation Commission for Health Care (ACHC) or are in the process of being ACHC accredited. GHG derives 90% of its revenues for home health, palliative, and hospice services from Medicare. The remaining sources of revenue are from Medicaid, commercial insurance, and private payers.payors.
In 2019, GHG acquired two business units, Clinical Specialty Infusions, LLC (CSI Pharmacy) located in Texarkana, Texas,additionally manages and Clarus Care, LLC (Clarus) in Nashville, Tennessee.operates five companies across the healthcare industry: CSI Pharmacy, Clarus, Impact Medical, Skin Clique, and Surpass Behavioral Health.
CSI Pharmacy, headquartered in Nash, Texas, is a nationwide specialty home infusion pharmacy licensed in 3848 states that servesserving patients suffering from chronic and rare illness. CSI Pharmacy specializes in treating rare diseases with biologics and plasma-derived therapies, with revenues derived primarily from intravenous immunoglobulin (IVIG) therapy. CSI Pharmacy delivers products to patients’ houseshomes and employs nurses to provide the specialized infusion therapies to patients.
Clarus, based in the home on a monthly basis. ClarusNashville, Tennessee, provides call management solutions to physician groups and hospitals. Clarus replaces traditional human-staffed answering services with a SaaS-based solution. Clarus streamlines calls,call handling, provider call coverage management, eliminates patient hold times, and manages referrals and new appointments. The solution eliminates delays, call routing errors, and malpractice risk inherent with traditional call centers.
In December 2021, GHG acquired two businesses, one of which expanded GHG’s home health operations into Florida and WeissImpact Medical operates a full servicefull-service physician practice dedicated to providing advanced care for allergies, asthma, and immunology throughout New Jersey, New York, and the surrounding areas.
Skin Clique is a concierge in-home provider of aesthetic products and services. Skin Clique generates much of its revenue from neurotoxin injections and the remaining revenue from skin peels, skin consultations, Ultherapy, dermal fillers, and medical grade skin care products. Skin Clique, based in Riverdale, New Jersey. Weiss has expertiseCharleston, South Carolina, serves clients across approximately 30 states.
Surpass Behavioral Health operates approximately 16 Applied Behavior Analysis (ABA) clinics throughout Kentucky, South Carolina, Illinois, Georgia, and Pennsylvania as well as a school program in all allergicPennsylvania and immunologic conditions,a positive behavior support program in Kentucky. Surpass Behavioral Health is headquartered in Nashville, Tennessee. The majority of its revenue is center-based, with a smaller portion coming from school settings, and specializes in challenging cases. It is often able to help patients even after they have seen numerous other specialists. The practice also offers infusion services.the remaining from telehealth and adult programs.
AUTOMOTIVE
Graham Automotive LLC
The Company owns a 90% interest in foureight automotive dealerships. In January 2019,dealerships in the Washington, D.C. area: Honda of Tysons Corner in Virginia, Lexus of Rockville in Maryland, Jeep in Bethesda, Maryland, Ford of Manassas in Virginia, Toyota of Woodbridge and Chrysler-Dodge-Jeep-Ram of Woodbridge in Virginia, and in September 2023, the Company acquired a 90% interest in two automobile dealershipsa Toyota dealership in the Washington, D.C. area, Honda of Tysons CornerHenrico, VA, and in Virginia and Lexus of Rockville in Maryland. The two dealerships are established automotive retailers. In December 2019, the Company2023, opened a new Jeep dealershipKia franchise in Bethesda, MD. In December 2021, the Company acquired a 90% interest in an automobile dealership, Ford of Manassas in Virginia.Maryland. The Company has a management services agreement with an entity affiliated with
Christopher J. Ourisman, a member of the Ourisman Automotive Group family of dealerships, to operate and manage the operations of the dealerships. The Company also owns Roda (formerly CarCare To Go,Go), which provides valet repair services to and from a network of dealership service centers in the Washington, D.C. area.
OTHER ACTIVITIES
Leaf Group Ltd.Saatchi Online, Inc. (Saatchi Art Group)
In June 2021,Saatchi Online, Inc. (Saatchi Art Group) including SaatchiArt.com (Saatchi Art) and its art fair event brand, The Other Art Fair, provides an online art gallery where a global community of artists exhibit and sell their original artwork directly to consumers through an online gallery as well as through virtual reality and in-person art fairs hosted in the Company acquired Leaf Group Ltd. (Leaf)U.S., headquartered in Santa Monica, California. Leafthe U.K. and Australia. Saatchi Art’s online art gallery features a wide selection of original paintings, drawings, sculptures and photography.
Society6, LLC
Society6 is a diversified consumer internet company that builds creator-driven brands in lifestyle and home and art design categories. Through its Society6 Group, Leaf operates leadingan online art and design marketplacesmarketplace where large communities of artists and designers can market and sell their original art and designs printed on a wide variety of products. Its made-to-order marketplaces, consisting of Society6.com (Society6) and its wholesale channel (collectively,Deny Designs (together, Society6 Group), provide artists and designers with an online commerce platform to feature and sell their original art and designs on an array of consumer products primarily in the home décor category. Society6 Group’s wholesale channel sells products to trade and hospitality clients, as well as retail distribution partners. Through Leaf’s Saatchi Art Group, including SaatchiArt.com (Saatchi Art) and its art fair event brand, The Other Art Fair,
World of Good Brands
World of Good Brands (WGB), (formerly Leaf provides an online art gallery where a global community of artists exhibit and sell their original artwork directly to consumers through a curated online gallery, virtual reality or in-person at art fairs hosted in the United Kingdom, Australia, Canada and the United States. Saatchi Art’s online art gallery features a wide selection of original paintings, drawings, sculptures and photography. Leaf’s Media GroupMedia), consists of a diverse portfolio of media properties that educate and inform consumers across a wide variety of life topics, including fitness and wellness brands such as Well+Good and Livestrong.com Hunker in the home and design space and Only In Your State in the travel sector. Together with these premium brands, LeafWGB owns and operates or hosts and operates over 45 websites focused on specific categories or interests. LeafWGB generates the majority of its media revenue from the sale of advertising.
Clyde’s Restaurant Group
In July 2019, the Company acquired Clyde’s Restaurant Group (Clyde’s). Clyde’s,, founded in 1963, owns and operates 1112 restaurants and entertainment venues in the Washington, D.C. metropolitan area, including sevensix Clyde’s locations, Old Ebbitt Grill, The Hamilton, Hamilton Live, 1789 Restaurant, Fitzgerald’s and The Tombs. Clyde’s has three new restaurants under development and/or construction with planned openings in 2024 and 2025.
Framebridge, Inc.
In May 2020, the Company acquired an additional interest in Framebridge, Inc. (Framebridge), a custom framing service company, that resulted in the Company’s ownership of approximately 93% of Framebridge. The CEO of Framebridge continues to hold an approximately 7% ownership stake in Framebridge. Framebridge provides high-quality, affordable and fast custom framing directly to consumers. Through its website, app and retail locations, Framebridge offers consumers the option to drop off or ship artwork, pictures and other personal objects directly to Framebridge to be custom framed and then delivered directly to a customer or a retail store for in-store pick up. Framebridge is headquartered in Washington, D.C., has 5six retail locations in the Washington, D.C./Maryland/Northern Virginia market, three locationsnine in Manhattan and Brooklyn, NY,the New York metropolitan area, three in the Chicago, market, two locations in Atlanta, GA, one each in the Boston, andone in Philadelphia, markets, and two manufacturing facilities in Kentucky and New Jersey.
Code3
Code3 is a marketing and insights company that manages digital advertising for global and mid-market brands and early-stage companies. It delivers media, creative and data services to transform consumer and performance data into planning, content, media activation and measurement to maximize ROI. Code3 works across platforms such as Facebook, Instagram, Amazon, Google, Twitter,TikTok, Twitter/X, Pinterest, Snapchat, YouTube, as well as direct digital media relationships and YouTube.streaming TV and audio solutions. The legacy business surrounding the Audience Intelligence Platform (AIP) has been operated since the beginning of 2021 as a separate software company under the name, Decile LLC. “Code3” is the trade name of Social Code, LLC and Marketplace Strategy, LLC.
Decile LLC
Decile LLC (Decile) is a customer data and analytics software company that helps marketers extract value from their proprietary first-party customer and sales data. Decile provides software and services to help its business clients better understand customer personas, customer acquisition costs, customerand retention, unit economicsproduct analytics and how to increase profitable growth.
The Slate Group LLC
The Slate Group LLC (Slate) publishes Slate, an online magazine. Slate features articles and podcasts analyzing news, politics and contemporary culture and adds new material on a daily basis. Content is supplied by the magazine’s own editorial staff, as well as by independent contributors. As measured by The Slate Group, Slate had an average of more than 2111 million unique visitors per month and averaged more than 5534 million page views per month across desktop and mobile platforms in 2021.2023. The Slate Group owns an interest in E2J2 SAS, a company incorporated in France that produces two French-language news magazine websites at slate.fr and slateafrique.com. The Slate Group provides content, technology and branding support.
Pinna
Pinna is an audio-first children’s media company offering an on-demand subscription service that delivers curated audio programming for children, all in one place, including podcasts, audio shows, audiobooks and music. The service offers children an ad-free, screen-free way to play and listen. Pinna creates and produces award-winning, original shows and partners with best-in-class brands and top creative talent to deliver age-appropriate, high-quality, highly entertaining audio experiences for three- to 12-year-olds.
The FP Group
The FP Group produces Foreign Policy magazine and the ForeignPolicy.com website, which cover developments in national security, international politics, global economics and related issues. The site features blogs, unique news content, and specialized channels and newsletters, and podcasts focusing on regions and topics of interest. The FP Group provides insight and analysis into global affairs for government, military, business, media and academic leaders. FP Events also produces a growing number of live and virtual events, bringing together government, military, business and investment leaders to discuss important regional and topical developments and their implications.
CyberVista LLC
CyberVista LLC (CyberVista) is a cybersecurity training company headquartered in Arlington, VA. Its training solutions span cyber protection, operations, cloud and hardware/software. Its Resolve executive training suite helps large company boards and executives prepare for and mitigate cyber threats. Customers include Fortune 500 companies, leading cybersecurity providers and the defense industrial base.
City Cast LLC
City Cast LLC (City Cast) is a network of daily local news podcasts in cities around the country, accompanied by a daily email newsletter about local communities, includingcommunities. The podcasts and newsletters cover local news, events and places. Currently City Cast is available in Chicago, IL; Denver, CO; Houston, TX; Salt Lake City, UT; Pittsburgh, PA; Washington, D.C.; Madison, WI; Portland, OR; Philadelphia, PA; Las Vegas, NV; Boise, ID; Austin, TX; and Pittsburgh.Nashville, TN.
COMPETITION
KaplanEDUCATION
Kaplan’s businesses operate in fragmented and competitive markets. Each of KIKI’s businesses competes in disaggregated markets with other for-profit institutions and companies (ranging in size from large for-profit universities to small competitors offering English-language courses) and, in certain instances, with government-supported schools and institutions that provide similar training and educational programs. Competitive factors vary by business and include program offerings, ranking of university partners, convenience, quality of instruction, reputation, placement rates, student services and cost. KI derives its competitive advantage from, among other things, delivering high-quality education and training experiences to students, having name brandname-brand recognition across multiple markets, developing strong relationships with corporate clients and recruitment partners and offering competitive pricing. KNA competes with companies that provide various education technology solutions, consumer test and licensure preparation and course delivery, corporate training, university administrative support for online programs and courses, curriculum development, overall online program development and analytics for colleges and universities, as well as support for corporate, employer and employee education programs. The market for KNA’s services and products, and especially its higher education services and products, is dynamic and rapidly evolving, and several competitors offer a mix of some of the same products and services or are seeking to move into the markets in which KNA operates. Competitive factors in these KNA markets include 1) the ability to deliver a wide range
of educational services and programs to clients across all levels of programs and administrative functions; 2) cost effectiveness; 3) expertise in marketing, recruitment and program delivery; 4) student outcomes and satisfaction; 5) the ability to invest in start-up and scaling initiatives; 6) reputation; and 7) compliance with laws and the ability to navigate complex regulatory requirements. KNA’s ability to effectively compete in the higher education services markets will depend in large part on its successful delivery and navigation of these factors. While the competitive landscape is expanding, KNA’s resources, capabilities and experience are key differentiators in the market. Similarly, KNA’s supplemental education products and services compete with a wide range of national, regional, local, online and location-based competitors. CompetitorsIn the area of test prep, competitors vary by test, with many focused on preparing students for a single high-stakes test. For its curricular and assessment services, KNA has a number of national competitors as well as competitors focused on preparation for particular tests. Competitive factors for the supplemental education products vary by product line and include price, features, modality, schedule and reputation. Although KNA faces intense competition and shifting consumer preferences in these areas, particularly with respect to online test preparation, where some new competitors are offering lower-cost and free test preparation products, KNA and particularly Kaplan Test Prep, remains aremain leading namenames in test preparation owing in part to itstheir technical expertise and capabilities, quality of instructors, content, curricula, longevity and reputation in the industry. KNA’s professional licensure training and preparation and corporate training products and services offer a broad portfolio of products, many within highly regulated and mature industries, including securities, insurance, real estate and
wealth management, where competition includes a wide variety of national, regional and local companies seeking the same market share and resulting in deep price discounting and commoditization of offerings.
Graham Media GroupTELEVISION BROADCASTING
GMG competes for audiences and advertising revenues with television and radio stations, cable systems, video services offered by telephone and broadband companies serving the same or nearby areas, DBS services, digital media services, and, to a lesser degree, with other media providers, such as newspapers and magazines. Cable systems operate in substantially all of the areas served by the Company’s television stations, where they compete for television viewers by importing out-of-market television signals; by distributing pay-cable, advertiser-supported, and other programming that isare originated for cable systems; and by offering movies and other programming on an on-demand, digital or pay-per-view basis. In addition, DBS services provide nationwide distribution of television programming, including pay-per-view programming and programming packages unique to DBS, using digital transmission technologies. Moreover, to the extent that competing television stations in the Company’s television markets continue to transition to ATSC 3.0, such stations may pose an increased competitive challenge to the Company’s stations in the future, such as by offering an increased number of multicast channels or by offering advanced features.
Competition continues to increase from established and emerging online distribution platforms. Movies and televisionother video programming are increasingly are available on an on-demand basis through a variety of online platforms, which include free access onto the websites and apps of the major TV networks, ad-supported viewing on platforms such as Hulu, and subscription-based access through services such as Netflix. In addition, online-only subscription services offering live television services have been launched both by traditional pay-TV competitors (such as DISH and DirecTV)DIRECTV) and newerother entrants (such as YouTube TV and Fubo). The Company has entered into agreements for some of its stations to be distributed via certain of these services, typically through opt-in agreements negotiated by the stations’ affiliated networks. Participation in these services has given the Company’s stations access to new distribution platforms. At the same time, competition from these various platforms could adversely affect the viewership of the Company’s television stations via traditional platforms and/or the Company’s strategic position in negotiations with pay-TV services. In addition, the networks’ increased role in negotiating online distribution arrangements for their affiliated stations, together with the networks’ imposition of higher fees on affiliated stations in exchange for broadcast and traditional pay-TV retransmission rights, may have broader effects on the overall network-affiliate relationship, which the Company cannot predict.
MANUFACTURING
Hoover Treated Wood Products, Inc.
Hoover’s predominant product line is fire-retardant treatedfire-retardant-treated wood products for building interior applications that are specified by architects in accordance with building code requirements for multi-family residential, commercial and institutional nonresidential buildings. Hoover’s fire-retardant product lines are sold through a stocking distributor network of more than 100 locations spanning the U.S. and Canada. Hoover’s competitors are licensees of other chemical suppliers to the wood treatingwood-treating industry who compete with Hoover’s stocking distributors on a local basis. The primary areas of competition are product availability and price, although brand loyalty due to product quality is significant. Wood products are commodities with volatile market pricing; however, Hoover’s reputation for quality products and its unique distribution model, which provides superior product availability, enable Hoover to maintain a leading position across the continent.
Group Dekko, Inc.
Dekko has three distinct product families that compete in fragmented, competitive global markets: power and data distribution for office and furniture products, lighting solutions, and electrical harness manufacturing. These products are sold through dealer and distribution channels and original equipment manufacturer (OEM) customers, focused primarily on the North American market. While all markets and products are price sensitive, technology, engineering solutions, quality and delivery performance are critical in purchase decisions. Dekko’s multiple long-term relationships, high-quality manufacturing facilities, engineering support and reputation as a solutions provider, in addition to being a product supplier, all contribute to sustaining its competitive advantages.
HEALTHCARE
Graham Healthcare Group
The home health and hospice industries are extremely competitive and fragmented, consisting of both for-profit and nonprofit companies. According to the Medicare Payment Advisory Commission’s July 20212023 Data Book, there are approximately 11,45611,353 Medicare-certified home health providersagencies and approximately 4,840 hospice providers5,358 hospices in the U.S., with the number of active home healthcare providers rapidly increasing. GHG markets its services to physicians, discharge planners and social workers at hospitals, nursing homes, senior living communities and physicians’ offices through a direct sales model. GHG differentiates its offerings based on
response time, clinical programming, clinical outcomes and patient satisfaction. Throughout the three states in which it operates, GHG competes primarily with both privately owned and hospital-operated home health and hospice service providers. The competitive landscape for other healthcare services provided by GHG is highly fragmented, with competition from a number of small providers and a few national companies.
AUTOMOTIVE
Graham Automotive LLC
The retail automotive industry is highly competitive and fragmented. Automobile dealerships compete with dealerships offering the same brands as well as those offering other manufacturers’ brands. Competitors include small local dealerships and large national multi-franchise automotive dealership groups. In addition to competition for vehicle sales, dealerships compete for parts and service business with other dealerships, automotive parts retailers and independent mechanics. The principal competitive factors in vehicle sales are price, selection of vehicles, location of dealerships and quality of customer service. The principal competitive factors in parts and service sales are price, the use of factory-approved replacement parts, factory-trained technicians and the quality of customer service.
LeafOTHER ACTIVITIES
Leaf operates inSaatchi Online, Inc. (Saatchi Art Group)
Saatchi Art Group competes with a wide variety of online and brick-and-mortar companies selling comparable products. Its online art gallery and in-person art fair business compete with traditional offline art galleries, art consultants and online platforms selling original artwork, such as Artfinder, Artspace, Rise Art, Singulart, eBay and Amazon Art, home retailers that sell wall art such as West Elm, Crate and Barrel, and Restoration Hardware and various art fairs that feature reasonably priced artwork from emerging artists, such as The Affordable Art Fair.
Society6, LLC
Operating an e-commerce marketplace is highly competitive, and developing industries that are characterized by rapid technological change, a variety of business models and frequent disruption of incumbents by innovative entrants. Its art and design marketplaces, Society6 Group and Saatchi Artexpects competition to increase in the future. Society6 Group competecompetes with a wide variety of online and brick-and-mortar companies selling comparable products. Its made-to-order marketplace business Society6 Group, primarily competes with companies that also utilize a made-to-order business model whereby consumer products featuring artist designs are produced by third-party fulfillment partners and shipped directly to customers, such as Redbubble, Zazzle, Art.com, Shutterfly and Minted, as well as companies that offer broader home décor and apparel products, such as Amazon, Etsy, Wayfair, Urban Outfitters and West Elm. Its online art galleryWayfair. Additionally, Society6 Group is facing, and in-person art fair business, Saatchi Art Group, competes with traditional offline art galleries, art consultants and online platforms selling original artwork,will likely continue to face, increased international competition from brands offering ultra-low-cost goods, such as Artfinder, Artspace, Rise Art, Singulart, eBayShein and Amazon Art, as well as various art fairsTemu.
World of Good Brands
WGB operates in highly competitive and developing industries that feature reasonably priced artwork from emerging artists, such as The Affordable Art Fair. Leaf’s marketplaces must successfully attract, retainare characterized by rapid technological change, a variety of business models and engage both buyers and sellers to use our platforms and attend our fairs. The principal competitive factors for such marketplaces include the quality, price and uniquenessfrequent disruption of the products, artwork or services being offered; the selection of goods and artists featured; the ability to source numerous products efficiently and cost-effectively with respect to its made-to-order products; customer service; the convenience and ease of the shopping experience; and its reputation and brand strength. Competition is expected to continue to intensify as online and offline businesses increasingly compete with each other and the barriers to enter online channels are reduced. For properties within its Media Group, Leafincumbents by innovative entrants. WGB faces intense competition from a wide range of competitors.competitors, including those of much larger scale. These markets are rapidly evolving and highly fragmented, and competition could increase in the future as more companies enter the space. The Media GroupWGB competes for advertisers on the basis of a number of factors, including return on marketing expenditures, price of ourits offerings, and the ability to deliver large audiences or precise types of segmented audiences. Principal competitors in this space currently include various online media companies ranging from large internet media companies to specialized and enthusiast properties that focus on particular areas of consumer interest, as well as social media outlets such as Facebook, TikTok, YouTube, Snapchat, Instagram and Pinterest, where brands and advertisers are focusing a significant portion of their online advertising spend in order to connect with their customers. Some of its competitors have larger audiences and more financial resources and many of its competitorsthem are making significant investments in order to compete with various aspects of this business. Many of Leaf’sWGB’s current competitors have, and potential competitors may have, substantially greater financial, marketing and other resources than Leaf;WGB; greater technical capabilities; greater brand recognition; longer operating histories; differentiated products and services; and larger customer bases. These resources may help some of these competitors and potential competitors respond more quickly as the industry and technology evolves,
evolve, focus more on product innovation, adopt more aggressive pricing policies and devote substantially more resources to website and system development.
Clyde’s Restaurant Group
The restaurant industry is highly competitive. Clyde’s competes with national and regional chains and independent, locally owned restaurants for customers and personnel. The principal basisbases for competition are types of food and service, quality, price, location, brand and attractiveness of facilities.
Framebridge, Inc.
Framebridge operates in a highly fragmented market. Competitors include small local retail operations and a few national retail chains. The competitive factors in the framing industry are price, selection and convenience. Framebridge’s centralized manufacturing, clear and transparent pricing, retail stores that are optimized for foot traffic and a curated buying experience rather than framing workshops, and strong e-commerce and digital capabilities contribute to its competitive advantages.
Code3
The business of managed digital advertising is highly competitive. Public multinational advertising agencies may exacerbate price competition in an attempt to protect existing relationships with advertising clients in traditional media formats such as television. Public and private advertising technology companies, digital media agencies and newer market entrants such as consulting firms also compete on price, service and technology offerings. Code3 seeks to maintain a competitive advantage and maximize its clients’ return on advertising budgets by utilizing a combination of best-in-class third-party technologies, artificial intelligence (AI), and the deep expertise of its employees, who manage media spending on the largest digital platforms and a full-service creative team with a nuanced understanding of digital media.
Decile LLC
Decile faces competition from lower-cost providers that provide a narrower data analytics and reporting offering. In addition, at higher price points aimed at larger marketers ($50M+ annual revenue), there are several large customer data platform (CDP) competitors that attempt to unify many disparate sources of data to improve omnichannel advertising outcomes. Decile seeks to maintain a competitive advantage by simplifying the connection between dataproviding a better view of high-value customers and marketingpersonas and bridging the gap between financialtheir associated value and marketing analyticsmaking it easier for clients to help marketers extract the most value out of their customer and sales data, all atactivate those customers in a competitive price.more personalized way. Decile’s additional third-party data enrichment capabilities and data scienceadvanced analytics serve as key differentiators in the mid-market space where those capabilities are not available at a competitive price.
The Slate Group LLC
As a digital media company, Slate operates in highly competitive markets for subscribers, audiences and advertisers. For written work, Slate faces competition from other online publishers, especially magazines and newspapers. In podcasting, Slate faces competition from other podcast networks, as well as traditional radio networks. In the face of stiff competition, Slate is able to attract and retain a large educated, affluent audience and subscriber base by creating high-quality content, and is then able to compete for advertisers who wish to reach that audience on trusted, brand-safe properties.
PinnaCity Cast LLC
PinnaCity Cast is currently the only ad-free, audio on-demand streaming service designed justnational network of daily local podcasts and newsletters. City Cast faces significant competition in all aspects of its business. Several companies operate large national networks of local daily newsletters, notably Axios and 6am City, both of which have many more subscribers than City Cast. There are also single-city daily newsletters–often created by the local newspaper–in every city where City Cast is located. On the podcasting side, public radio stations in most City Cast markets create local podcasts, as do some commercial radio stations. City Cast competes for children that offers multiple audio formats in one space that compliesadvertising dollars with the Children’s Online Privacy Protection Act (COPPA). The market for children’s subscriptionall these newsletter and podcast competitors, as well as with local radio, newspaper, TV and digital media entertainment is large. It includes media subscription services for families, subscription services for children, online learning/gaming destinations, audiobooks and podcasts for children, gaming subscriptions and free digital content. Key differentiators for Pinna include its access to multiple formats and its offering of curated best-in-class brands and original shows all in one ad-free COPPA-compliant place.outlets.
EXECUTIVE OFFICERS
The executive officers of the Company, each of whom is elected annually by the Board of Directors, are as follows:
Donald E. Graham, age 76, has been78, Chairman Emeritus, served as Chairman of the Board of the Company sincefrom September 1993 until May 2023 and served as Chief Executive Officer of the Company from May 1991 until November 2015. Mr. Graham served as President of the Company from May 1991 until September 1993 and prior to that had been a Vice President of the Company for more than five years. Mr. Graham also served as Publisher of The Washington Post (the Post) from 1979 until September 2000 and as Chairman of the Post from September 2000 to February 2008.
Timothy J. O’Shaughnessy, age 40,42, became Chief Executive Officer of the Company in November 2015. From November 2014 until November 2015, he served as President of the Company. He was elected to the Board of Directors in November 2014. From 2007 to August 2014, Mr. O’Shaughnessy served as chief executive officer of LivingSocial, an e-commerce and marketing company that he co-founded in 2007. Mr. O’Shaughnessy is the son-in-law of Donald E. Graham, Chairman Emeritus of the Company.
Andrew S. Rosen, age 61,63, became Executive Vice President of the Company in April 2014. He became Chairman of Kaplan, Inc. in November 2008 and served as Chief Executive Officer of Kaplan, Inc. from November 2008 to April 2014 and from August 2015 to the present. Mr. Rosen has spent nearly 36more than 37 years at the Company and its affiliates. He joined the Company in 1986 as a staff attorney with the Post and later served as assistant counsel at Newsweek.Newsweek. He moved to Kaplan in 1992 and held numerous leadership positions there before being named Chairman and Chief Executive Officer of Kaplan, Inc.
Wallace R. Cooney, age 59,61, became Senior Vice President–Finance and Chief Financial Officer of the Company in April 2017. Mr. Cooney served as the Company’s Vice President–Finance and Chief Accounting Officer from 2008 to 2017. He joined the Company in 2001 as Controller.
Jacob M. Maas, age 45,47, became Executive Vice President of the Company in January 2022, prior to which he served as Senior Vice President–Planning and Development beginning October 2015. Prior to joining the Company, he served as executive vice president of operations and head of corporate development at LivingSocial, an e-commerce and marketing company that he joined as chief financial officer in 2008.
Nicole M. Maddrey, age 57,59, became Senior Vice President, General Counsel and Secretary of the Company in April 2015. Ms. Maddrey joined the Company in 2007 as Associate General Counsel. Prior to joining the Company, Ms. Maddrey served as Special Counsel in the Division of Corporation Finance at the U.S. Securities and Exchange Commission.
Marcel A. Snyman, age 47,49, became Vice President and Chief Accounting Officer of the Company in January 2018. Mr. Snyman served as Controller of the Company from 2016 to 2018, prior to which he served as Assistant Controller beginning in April 2014 and Director of Accounting Policy beginning in July 2008.
Sandra M. Stonesifer, age 37,39, became Vice President–Chief Human Resources Officer of the Company in January 2021. Prior to joining the Company, Ms.Mrs. Stonesifer was a consultant with S-Squared Consulting, an organization development consulting company.
HUMAN CAPITAL
The Company employs approximately 18,00019,900 people worldwide, of which approximately 12,350 were12,511 are employed in the United StatesU.S. and approximately 5,650 were7,390 are employed outside the United States.U.S. Employment across each of the Company’s businesses is further discussed below.
Worldwide, Kaplan employs approximately 6,1007,015 people on a full-time basis in 27 countries. Kaplan also employs substantial numbers of part-time employees who serve in instructional and administrative capacities. Kaplan’s part-time workforce comprises approximately 4,0003,533 individuals in 1716 countries. Collectively, in the U.S. and Canada, 52approximately 95 Kaplan employees are represented by a union. In countries where Kaplan has a presence but union membership is not disclosed to the employer – employer–the U.K., Australia, and Singapore – Singapore–there may be union union–represented employees as well.
Graham Media GroupGMG has approximately 1,012946 employees, including 968913 full-time employees and 4433 part-time employees, of whom approximately 10595 are represented by a union.
In the Manufacturingmanufacturing segment, Hoover has approximately 356477 full-time employees, of whom 15 are represented by a union, and one part-time employee.union. Dekko has approximately 1,1851,164 full-time employees and approximately two part-time employees, none of whom is represented by a union. Joyce/Dayton has approximately 165181 full-time employees and two part-time employees, none of whom is represented by a union. Forney has approximately 109107 full-time employees. Of those employees, of whom 4345 are represented by a union.union, all of whom are employed in Mexico.
In the Healthcarehealthcare segment, Graham Healthcare GroupGHG has approximately 1,1591,861 full-time employees and 243524 part-time employees. None of these employees is represented by a union.
Graham Automotive employs approximately 412950 full-time employees. Noneemployees, none of these employeeswhom is represented by a union.
In the Other Businesses segment, Leaf Group employs 390other businesses, Saatchi Art, Society6 and WGB employ approximately 261 full-time and part-time employees collectively, none of whom is represented by a union. Clyde’s has approximately 148181 full-time employees and 1,3421,630 part-time employees, none of whom is represented by a union. Framebridge has approximately 782482 employees including 243 seasonaland 60 part-time employees, none of whom is represented by a union. Code3 has approximately 236143 full-time employees, none of whom is
represented by a union. Decile has 3439 full-time employees, none of whom is represented by a union. Slate employs 125 full-time employees and three part-time employees, of whom approximately 53 are represented by a union. The FP Group has approximately 62 full-time employees, approximately 15 of whom are represented by a union. City Cast employs 66 full-time employees and two part-time employees, none of whom is represented by a union. Slate employs 123 full-time employees and seven part-time employees, of whom approximately 57 are represented by a union. Pinna employs 10 full-time employees, none of whom is represented by a union. The FP Group has 56 full-time employees and four part-time employees. CyberVista employs 37 full-time employees and 11 part-time employees, none of whom is represented by a union.
The parent Company has approximately 7284 full-time employees, and one part-time employee, none of whom is represented by a union.
The Company recognizes the importance of attracting, developing, and retaining highly qualified employees throughout each of its businesses. The following is a description of the Company’s efforts to manage and promote human capital within its organization.
Oversight and Management. The Company’s human resources organization and the human resource organizations of its various businesses manage employment-related matters, including recruiting and hiring, training, compensation, workplace safety, performance management, support for specific needs including supporting employees who are caregivers or working remotely, and creating diversity, equity, and inclusion strategies. The Compensation Committee of the Board of Directors provides oversight of certain human capital matters, including compensation and benefits, executive development, workforce diversity and inclusion initiatives, and succession planning.
The Company’s culture of trust and integrity is led and driven by senior management and supported by our internal practices, regular communications, and ongoing training efforts. Employees and stakeholders are encouraged to address any concerns with their managers and business leaders. The Company also provides a dedicated communication channel, the Ethics Hotline, to report possible violations of the Code of Business Conduct or concerns about ethics or integrity in the workplace. The Company’s Ethics Hotline is independently operated by a third party and anonymity is ensured upon request. Reports are forwarded to appropriate individuals within the Company for investigation. Every allegation is professionally and confidentially handled.
Compensation and Benefits. The Company offers strong compensation and benefits programs to its employees. In 2021 the Company utilized a market pay tool to ensure all our units have access to high-quality market compensation data that enables them to set fair and equitable compensation rates. Depending on the business unit, employee benefits may include healthcare and insurance benefits, health savings and flexible spending accounts, paid time off, family leave, employee assistance programs, tuition assistance programs, a matching gifts program, bonuses, long-term incentive compensation plans, Company-paid pension contributions and a 401(k) Plan. The Company offers discounts on courses and programs offered by Purdue Global to all full-time employees through the Gift of Knowledge program. The Company also offers a small group of eligible employees certain equity-based grants under the Company’s incentive compensation planIncentive Compensation Plan with vesting and performance conditions to facilitate the attraction, retention, motivation and reward of key employees and to align their interests with those of the Company’s stockholders.
Health and Safety. The health and safety of the Company’s employees is paramount. The Company’s health and safety programs are designed to address multiple jurisdictions and regulations as well as the specific risks and unique working environments of each of the Company’s businesses. In response to the COVID-19 pandemic, the Company’s businesses have adopted return to office and vaccination policies and procedures that are most appropriate for their businesses based on their industry and health risks as well as federal, state and local guidance and regulation. At this time the majority of our workforce is required to be vaccinated against COVID-19 for in-person work.
Training and Talent Development. The Company is committed to the continued growth and development of its employees across all businesses. While development opportunities vary across the Company’s businesses, the Company seeks to offer a variety of learning opportunities, including virtual learning, as well as on-the-job mentoring and coaching. AllU.S. employees complete core harassment and discrimination training and ethics training and all employees are offered specific skills training designed to support the growth and advancement of their professional skills.
For example, CyberVista conducts web-basedGHG offers ongoing resources and support to all clinical field employees to ensure they are confident in their ability to advance in their careers. In 2023, they launched a career mobility resource center where employees can access career promoting resources across various job functions. In 2023, Joyce/Dayton continued conducting assessments for all current and new employees to gain insight into individual strengths, foster effective team dynamics, and support ongoing business success. Additionally, key leadership team members completed a six-month immersive leadership program to enhance their strategic leadership skills.
At GMG, employees have access to several development and training programs, including Boss School, a management training session, PROduce! for first-time managers. Leafhigh potential producers to enhance their innovative mindset and leadership skills, and access to several other resources that provide individual learning and group activities on a variety of leadership and workplace collaboration topics.
Kaplan offers personalized and immersive learning experiences to support employees, managers, and leaders in building capabilities and driving personal and business growth. In 2023, Kaplan Languages Group hashosted its annual “Learning at Work Week”, a series of sessions where employees can explore topics ranging from developing their careers in the language travel sector to new product development and managing quality in schools. Additionally, they conducted a comprehensive training needs analysis and deployed several continuous learning platforms, including a diversity and inclusion learning platform; an eLearning and development platform; and a performance management platform. Leaf Group’s leadership development program includes personal assessments and one-on-one coaching for senior leadership. Joyce/Dayton conducted leadership assessments for executives and managers as well as a personal assessment tool to improve organizational communication. GMG has established learning and development opportunities to support its mission to be the authentic, local voice in the communities they serve. GMG proudly offers in-house leadership programs such as ‘Boss School’ which focusestrainings focused on key skillsareas, including Diversity, Equity and knowledgeInclusion (DEI) for new managers, unconscious bias awareness, conflict resolution, change management, and critical thinking skills. To further support their commitment to tailored individual development, Kaplan offers four days a continuingyear of study leave for employees to invest in professional development program for experienced producers.activities.
Diversity and Inclusion. Diversity and inclusion remainsremain a high priority within the Company and in 2021 several new initiatives were launched at both the corporate level and at our business units. These initiatives are focused on supporting the retention and training of a diverse workforce across the Company. The Company encouragesrequires all business units to set actionable goals and promote policies prioritizing diversity, equity and inclusion (DEI), and offers coursesinclusion. The progress on inclusive leadership and unconscious bias as part of Company-wide training options. In 2021, the Company chose to focus its global efforts on learning and strategy-building. The Company’s business units participated in a corporate-funded training program to establish DEIthose goals focused on attracting, retaining, developing and engaging underrepresented talent. The outcomes of the exercise were reportedis presented to the Board in November 2021. Following the completion of the program, aannually. The GHC Diversity, Equity and Inclusion Council, was formeda panel of DEI practitioners from across the business units, continues to meet to build community and accountability and support ongoing progress at each individual businessprogress. Additionally, the Company has an internal podcast focused on sharing insights and collectively across the Company.best practices about DEI with all employees.
The Company is committed to a culture in which its diverse employee base can thrive in an inclusive and respectful environment. As of December 2021,2023, the diversity of the Company’s employees in the U.S. was: 54% female; 46% male; 63% White; 14%15% Hispanic or Latino; 13% Black or African American; 14% Hispanic or Latino; 7%6% Asian; and 2%3% Other.
The Company’s businesses have launched various initiatives to support their individual DEI efforts.diversity, equity and inclusion strategies in ways that are tailored to their employees, customers, and products. For example, GMG launchedKaplan focuses on improving diversity, equity and inclusion in its workforce through a strategy that includednumber of external partnerships as well as educating current employees and leaders on their DEI roles. In 2023, DEI-focused education campaigns were infused throughout newsletters, the adoption of new training tools, the creation of employee resource groups, virtual employee learning activities around JuneteenthKaplan INSPIRE: Global Inclusion Week, panel discussions, and other celebration events, and talent sourcing focused on attracting underrepresented talent. At Kaplan, they have prioritized educating managers and employees on DEI best practices and expectations, including creation of a Globalupdated Inclusive Leader training. Kaplan’s talent teams worked with organizations committed to recruit, train, and Inclusive Colleague trainingmentor diverse and under-represented youth for all current and new employees.careers across different sectors. Kaplan also sponsors diversity appreciation monthscontinues to advance diverse representation across Kaplan by conducting a ‘Race in the Workplace’ survey to gather data points that include social activities and discussion forums around relevant topics that raise awareness and increase understanding of diversity.help create an environment where ethnically diverse employees thrive. Kaplan continues to beexplore ways they can cultivate diversity across their supplier networks by educating functional leaders on how to incorporate supplier diversity dashboards and metrics, sourcing guidance and identification of diverse suppliers, and raising awareness of organizations that could attract even more diverse suppliers. In 2023, Code3 established several dedicated spaces and Diversity, Equity, Inclusion and Belonging (DEIB) Roundtables to foster a sense of belonging among employees and gain valuable real-time feedback about their culture. Additionally, they launched a committee dedicated to highlighting areas of the business where they want to incorporate DEIB principles and elevate underrepresented-owned brands they serve.
Community Impact. The Company has a long history of investing in the communities it serves. In addition to philanthropy managed at the corporate level, the Company’s businesses engage in charitable works, community and civic activities, and volunteer projects in the communities they serve. While the Company’s businesses operate in a variety of industries in markets around the world, the Company is unified in its connection to the places where its teams live and work.
In 2023, the Corporate office provided approximately $1.4 million in financial support to 77 non-profit and civic organizations in the areas of education, health and human services, civics and community, and culture and art. Corporate philanthropy is primarily focused on providing resources, access and services to the most underserved members of the community. The Company has forged deep relationships with its partners in service and philanthropy, and it works closely in collaboration with them to support their very important work.
The service-oriented nature of the Company’s businesses, along with its core values, enables its businesses to authentically engage in service through its normal business activities. For example, at the education segment, Kaplan is the primary donor and supporter of The Kaplan Educational Foundation (KEF), an independent public charity founded by Kaplan executives to help promote racial equalityequity through higher education. Other business unitsThe program has provided academic, financial, and social support to low-income underserved students working with the City University of New York (CUNY) and other community colleges in the New York area, to help high-achieving, underrepresented community college students prepare for, gain acceptance to, pay for, and succeed at top four-year institutions such as Stanford University, Yale University, Brown University, Morehouse College, Smith College, and numerous others. The Foundation relies on Kaplan grants, in-kind service, donations from the Kaplan community, and volunteers from Kaplan’s employee base. A number of KEF alumni have established strategic diversitybeen hired by Kaplan as full-time employees or served as interns at Kaplan over the years; and inclusion initiativesmany have secured post-graduation employment with Fortune 500 and multinational corporations.
Additionally at Kaplan, through a partnership with ACT, Inc., maker of the ACT® college admissions test, Kaplan provides free ACT prep for low-income students. In 2023, Kaplan enrolled approximately 150,000 students who qualified as such – according to eligibility in waysACT’s fee waiver program – delivering over $17 million in free ACT prep to low-income students.
In the U.K., Kaplan Financial UK supports RefuAid, a charitable fund in the U.K. that speakhelps refugees with language tuition, education, finance, or meaningful employment, by providing free accountancy and English language training to enable them to get their professional qualification and find work in accounting. Additionally, at Kaplan International Pathways, Kaplan provides funding support for Plan International U.K., a development and humanitarian organization that advances children’s rights and equality for girls, through three programs across sub-Saharan Africa: supporting 1,000 girls, aged 9–16, across 16 schools in Senegal in improving their education, giving 483 young women in Sierra Leone the chance to become teachers, and working with communities across 11 Zimbabwean districts to offer a way back into education for 16,500 out-of-school girls.
At GMG, its stations and their employees are committed to their unique environmentlocal communities by providing educational, public affairs and human capital needs.special broadcasts addressing current affairs and issues related to their communities. Additionally, each media hub elevates the work of several non-profit and community organizations by spotlighting their work in the community, hosting community forums to voice and address community concerns, volunteering at local classrooms to conduct science experiments and partnering with local organizations to assist people who have been impacted by natural disasters. For example, GHG has committedstations WJXT and WCWJ in Jacksonville, FL promoted awareness of a variety of
community issues and related fund-raising events, such as the Wolfson Children’s Challenge to building a career pathingraise funds and mentorship programprovide awareness of services for all field-based positionsstudents who are deaf or hard of hearing; the Annual Kilwins Jacksonville Ice Cream Run in which 725 runners raised over $100,000 in funds to help families in need; the Walk to Defeat ALS to raise awareness of ALS which raised over $181,000 to help support people in the community with ALS; Kick for the Kids – a back to school shoe drive for children in need at which 1,004 students received new shoes for school; and, Wreaths Across America whereby employees especially underrepresented talent, achievevolunteered at Jacksonville National Cemetery and laid 200 wreaths on the headstones of fallen soldiers. At station WDIV, the station sponsored BookStock – a used book and media sale that raised over $2 million for education and literacy programs in the Metro Detroit area. Station WDIV also teamed up with the U.S. Marine Corp to sponsor two Toys for Tots drives to help collect toys for underprivileged children in the Metro Detroit area. Each year WDIV partners with DTE Energy for a “Gift of Warmth Telethon” to raise money for the Heat and Warmth Fund. “THAW” helps neighbors in an energy crisis pay their career advancement goals. Mostutility bills. Neighbors include seniors, unemployed, underemployed and people with disabilities. This annual telethon raises over $1 million dollars each year.
At the Company’s healthcare segment, GHG partners with We Honor Veterans to serve the unique hospice needs of veterans and their families. Additionally, GHG is proud to be a regional corporate sponsor for the Walk to End Alzheimer’s, a disease that directly impacts many of the Company’s businesses have incorporated diversity, equitycommunities and inclusion related questions in their engagement surveys and are beginning to gather and analyze their human capital data to better understand existing conditions, set goals, and measure progress moving forward.patients that GHG serves.
FORWARD-LOOKING STATEMENTS
All public statements made by the Company and its representatives that are not statements of historical fact, including certain statements in thisthe Company’s Annual Report on Form 10-K and elsewhere in the Company’s 20212023 Annual Report to Stockholders, are “forward-looking statements” within the meaning of the Private Securities Litigation Reform Act of 1995. Forward-looking statements include comments aboutare based on expectations, related to the durationforecasts, and severity of the COVID-19 pandemic and its effects onassumptions by the Company’s operations, financialmanagement and involve a number of risks, uncertainties, and other factors that could cause actual results liquidity and cash flows. Other forward-looking statements includeto differ from those stated, including, without limitation, comments about expectations related to acquisitions or dispositions or related business activities, including the TOSA, the Company’s business strategies and objectives, anticipated results of license renewal applications, the prospects for growth in the Company’s various business operations, and the Company’s future financial performance. As with any projection or forecast, forward-looking statements are subject to various risksperformance, and uncertainties, including the risks and uncertainties described in Item 1A of thisthe Company’s Annual Report on Form 10-K, that could cause actual results or events to differ materially from those anticipated in such statements.10-K. Accordingly, undue reliance should not be placed on any forward-looking statement made by or on behalf of the Company. The Company assumes no obligation to update any forward-looking statement after the date on which such statement is made, even if new information subsequently becomes available.
AVAILABLE INFORMATION
The Company’s internet address is www.ghco.com. The Company makes available free of charge through its website its Annual Report on Form 10-K, quarterly reports on Form 10-Q, current reports on Form 8-K, definitive proxy statements on Schedule 14A and amendments to those reports filed or furnished pursuant to Section 13(a) or 15(d) of the Securities Exchange Act of 1934 (Exchange Act) as soon as reasonably practicable after such documents are electronically filed with the Securities and Exchange Commission (SEC). In addition, the Company’s Certificate of Incorporation, its Corporate Governance Guidelines, the Charters of the Audit and Compensation Committees of the Company’s Board of Directors and the codes of conduct adopted by the Company and referred to in Item 10 of this Annual Report on Form 10-K are all available on the Company’s website; printed copies of such documents may be obtained by any stockholder upon written request to the Secretary, Graham Holdings Company at 1300 North 17th Street, Arlington, VA 22209. The contents of the Company’s website are not incorporated by reference into this Form 10-K and shall not be deemed “filed” under the Exchange Act.
The SEC website, www.sec.gov, contains the reports, proxy statements and information statements and other information regarding issuers that file electronically with the SEC.
Item 1A. Risk Factors.
SUMMARY RISK FACTORS
This risk factor summary does not contain all of the information that may be important to you, and you should read this risk factor summary together with the more detailed discussion of risks and uncertainties set forth following this section under the heading “Risk Factors,” as well as elsewhere in this Annual Report on Form 10-K. Additional risks, beyond those summarized below or discussed elsewhere in this Annual Report on Form 10-K, may apply to the Company’s business, activities or operations as currently conducted or as may be conducted in the future. These risks include, but are not limited to, the following:
Risks Related to the COVID-19 Pandemic
• The Company’s Business, Results of Operations and Cash Flows Have Been and Will Continue to Be Adversely Impacted by the Effects of the COVID-19 Pandemic.
Risks Related to the Company’s Education Business
• Changes in International Laws and Regulations, Travel Restrictions and Sanctions.
•Difficulties of Managing Properties in the U.K.
• Difficulties ofin Managing Foreign Operations and Failure to Comply with Foreign Regulatory Requirements.
• Changes in U.K. Tax Laws.
• Failure to Comply with Statutory and Regulatory Requirements as a Third-Party Servicer to Title IV Participating Institutions.
• Failure to Comply with the ED’s Title IV Incentive Compensation Rule.
• Failure to Comply with the ED’s Title IV Misrepresentation Regulations.
• Compliance Reviews, Program Reviews, Audits and Investigations, Including in Connection with Borrower Defense to Repayment Claims.
• Noncompliance with Regulations by KNA’s Client Institutions.
• Kaplan May FailFailure to Realize the Anticipated Benefits of the Purdue Global Transaction.
• Regulatory Changes and Developments.
• ChangesReductions in the Extent to WhichUse of Standardized Tests Are Used in the Admissions Process by Colleges or Graduate Schools and Increased Competition.
• Postponement and Cancellation of Examinations and Changes in the Extent to Which Licensing and Proficiency Examinations Are Used to Qualify Individuals to Pursue Certain Careers.
• Liability under Real Estate Lease Guarantees for Certain Real Estate Leases that were Assigned to Education Corporation of America.Used.
Risks Related to the Company’s Television Broadcasting and Media Businesses
• Changing Perceptions aboutAbout the Effectiveness of Television Broadcasting in Delivering Advertising.
• Increased Competition Resulting from Technological Innovations in News, Information and Video Programming Distribution Systems and Changing Consumer Behavior.
• Changes in the Nature and Extent of Government Regulations.
• Transition to New Technical Standards for Broadcast Television Stations.
• Potential Liability for Intellectual Property Infringement.
Changes in MVPD Subscriber Numbers, Retransmission Consent Fees, “Reverse Retransmission Consent” Payments to the Networks, and Broadcast Exclusivity.Risks Related to the Company’s Manufacturing Businesses
• Failure to Comply with Environmental, Health, Safety and Other Laws Applicable to the Company’s Manufacturing Operations.
• The Company May Be Subject to Liability Claims.
• Failure to Recruit and Retain Production Staff Needed to Meet Customer Demand.
• Potential Liability Claims.
Risks Related to the Company’s Healthcare Business
• Extensive Regulation of the Healthcare Industry.
•Federal and State Changes to Reimbursement and Other Aspects of Medicare and Medicaid.
•Continued Nursing Staffing Shortages.
•Negative Impact on Medicare Reimbursement from Value-based Purchasing Requirements.
•Limited Ability to Control Rates Received for Services.
Risks Related to the Company’s Automotive Businesses
• Termination or Non-renewal of a Dealership Agreement by an Automobile ManufacturerAgreements and Limitations on the Company’s Ability to Acquire Additional Dealerships.
• Changes Affecting Automobile Manufacturers.
• Changes to State Dealer Franchise Laws to Permit Manufacturers to Enter the Retail Market Directly and Technological Innovations.
• Changes in a Manufacturer’s Incentive Programs.
•Changes in Environmental Regulations Governing the Operations of the Automotive Business.
•Changes in Economic Conditions and Vehicle Inventories.
Risks Related to the Company’s Other Businesses
•Failure by Saatchi Art Group, Society6 and WGB to Attract and Retain Artists, Customers and Visitors, and Successfully Drive Traffic to Leaf’stheir Marketplaces and Media Properties and Expand its Customer Base for its Marketplaces.Properties.
•Failure by WGB to Effectively Distribute Leaf’s Media Content on Social Media Platforms or Effectively Optimize itsand Mobile Solutions in Order to Improve User Experience or Comply with Requirements of Leaf’s Advertising Partners.
• Leaf’s Businesses Face Significant Competition.Devices.
• Failure to Recruit and Retain Employees in the Company’s Restaurants.
• Food-Borne Illness Concerns and Damage to the Company’s Reputation.
• Concentration of the Company’s Restaurants in the Washington, D.C. Region.
Risks Related to the Company’s Stock Ownership and Operations
• As a Controlled Company, the Rights of Class B Common Stockholders are Limited.
• Pandemics or Other Outbreaks of Disease.
• Failure to Comply with Environmental and Health and Safety Laws.
• Failure to Successfully Integrate Acquired Businesses.
• Goodwill and Other Intangible Assets Impairment.
• Changes in International Income Tax Laws.
Risks Related to Cybersecurity, Information TechnologyPrivacy, Artificial Intelligence and Data ManagementIntellectual Property
• System Disruptions and Security Threats to the Company’s Information Technology Infrastructure.
• Failure to Comply with Privacy Laws or Regulations.
Financial Risks• Artificial Intelligence Concerns.
• Failure to Successfully Integrate Acquired Businesses.
• Changes in Business Conditions.Potential Liability for Intellectual Property Infringement.
RISK FACTORS
The Company faces a number of risks and uncertainties in connection with its operations. Described below are the most material risks faced by the Company. These risks and uncertainties may not be the only ones faced by the Company. Additional risks and uncertainties not presently known, or currently deemed immaterial, may adversely affect the Company in the future. In addition to the other information included in this Annual Report on Form 10-K, investors should carefully consider the following risk factors. If any of the events or developments described below occurs, it could have a material adverse effect on the Company’s business, financial condition or results of operations.
Risks Related to the COVID-19 Pandemic
• The Company’s Business, Results of Operations and Cash Flows Have Been and Will Continue to Be Adversely Impacted by the Effects of the COVID-19 Pandemic, the Significance of Which Will Depend on the Longevity and Severity of the Pandemic.
The COVID-19 pandemic and measures taken to prevent its spread, such as travel restrictions, shelter in place orders and mandatory closures, have materially affected the Company’s businesses, including the demand for its products and services. Travel restrictions and school closures have impeded and will continue to impede the ability of students to travel to undertake overseas study or to accept a place or remain in their student halls of residence as long as they remain in place, and have reduced student applications for programs offered by Kaplan International’s (KI) operations and halls of residence, including Kaplan Languages Group, KI Pathways, Kaplan Australia, Kaplan Singapore, MPW and certain KNA preparation programs that recruit foreign students. Instruction moving online reduced demand for halls of residence for international students and where such demand continued to exist in the first half of 2021, students sought discounts for periods they had not been able to stay in their accommodations due to COVID-19 travel restrictions. Further lockdowns or other measures in response to COVID-19 variants could negatively affect demand for housing and may result in residents again seeking discounts for periods they had not been able to stay in their accommodations. Travel restrictions, decreased enrollments and delays and cancellations of standardized tests have, and are expected to continue to, materially adversely affect the Company’s revenues, operating results and cash flows. Manufacturing restrictions, including plant closures and disruptions in the Company’s supply chains, declines in demand for products and advertising, restaurant and live art fair closures, competition for labor and COVID-19 absenteeism, and other developments related to the COVID-19 pandemic have also adversely impacted the Company’s media, manufacturing, healthcare, automotive and other businesses. For example, at certain periods during the pandemic, the Company had to temporarily close all of its restaurants and entertainment venues pursuant to government orders, before later obtaining permission to resume indoor dining services. The long-term impact of the pandemic on public demand for crowded dining facilities cannot be predicted. Moreover, the Company cannot predict the duration or scope of the COVID-19 pandemic and what actions will be taken by governmental authorities and other third parties in response to the pandemic and new variants. On January 13, 2022, the U.S. Supreme Court blocked the Occupational Safety and Health Administration (OSHA) emergency temporary standard (ETS) requiring all employers with at least 100 employees to mandate vaccination or weekly testing for unvaccinated employees. In a separate decision, the U.S. Supreme Court allowed the federal Centers for Medicare & Medicaid Services (CMS) to enforce a vaccination mandate for healthcare employees at facilities receiving Medicare or Medicaid payments. Additional vaccine mandates may be announced in jurisdictions in which the Company’s businesses operate. Vaccination mandates and other government mandated restrictions, such as density limitations and travel restrictions, may result in employee attrition and difficulty in meeting labor needs. The Company expects the COVID-19 pandemic and related developments to negatively impact its financial results and such impact is expected to be material to the Company’s financial results, operations and cash flows. Additionally, to the extent the COVID-19 pandemic adversely affects the Company’s business operations, financial condition or operating results, it may also have the effect of heightening many of the other risks described in this “Risk Factors” section.
Risks Related to the Company’s Education Business
• Changes in International Laws and Regulations and Travel Restrictions Have Materially Adversely Affected and Together with Changes in Immigration Laws or Sanctions Could Continue to Materially Adversely Affect International Student Enrollments and Kaplan’s Business.
Kaplan is subject to a wide range of laws and regulations relating to its international operations. These include domestic laws with extraterritorial reach, such as the U.S. Foreign Corrupt Practices Act, international laws, such as the U.K. Bribery Act, as well as the local regulatory regimes of the countries in which Kaplan operates. These laws and regulations change frequently. Failure to comply with these laws and regulations could result in significant penalties or the revocation of Kaplan’s authority to operate in the applicable jurisdiction, each of which could have a material adverse effect on Kaplan’s operating results.
In response to the COVID-19 pandemic, many governments have imposed studentstudent travel restrictions (applicable to exit and entry), made recommendations for their students to return home and closed physical campus locations, and many state and professional bodies have postponed or canceled examination dates related to state examinations and professional education programs, all of which have materially adversely affected Kaplan International’s operations and resulted in significant losses at Kaplan Languages Group.Group during the pandemic. The emergence of new variants of COVID-19, and consequential changes to travel and study arrangements could further negatively affect Kaplan International and its operating results.
Further changes to the regulatory environment, including changes to government policy or practice in oversight and enforcement, or other factors, including geopolitical instability, imposition or extension of international sanctions, a natural disaster or a pandemic in either the students’ countries of origin or countries in which they desire to study, could continue to negatively affect Kaplan’s ability to attract and
retain students and negatively affect Kaplan’s operating results. Additionally, increasingly, governments have begun imposing sales taxes on digital services, such as education, offered in their jurisdictions by foreign providers. Any significant changes to the availability of government funding for education, visa policies for students and their dependents, or other administrative immigration requirements, or the tax environment, including changes to tax laws, policies and practices, in any one or more countries in which KI operates or makes its services available could negatively affect its operating results.
KI’s operations, institutions and programs in the U.S. may be subject to state-level regulation and oversight by state regulatory agencies, whose approval or exemption from approval is necessary to allow an institution to operate in the state. These agencies may establish standards for instruction, qualifications of faculty, location and nature of facilities, financial policies and responsibilityresponsibilities and other operational matters. Institutions that seek to admit international students are required to be federally certified and legally authorized to operate in the state in which the institution is physically located in order to be allowed to issue the relevant documentation to permit international students to obtain a visa.
A substantial portion of KI’s revenue comes from programs that prepare international students to study and travel in English-speaking countries. In 2021,2023, university preparation programs were principally delivered in Australia, Singapore and the U.K. KI’s ability to enroll students in these programs is directly dependent on its ability to comply with complex regulatory environments. For example, the impact of Brexit on KI over time will depend on the agreed terms of the U.K.’s withdrawal from the EU. Uncertainty over the impact and terms of Brexit trade deals may materially diminish interest in traveling to the U.K. for study. If the U.K. is no longer viewed as a favorable study destination,
KI’s ability to recruitenroll international students would be adversely impacted, which would materially adversely affectin programs in the U.K., Singapore, Australia, and other countries and to recruit students for study with KI’s results of operationspartners is directly dependent on the laws and cash flows.
Revised U.K.regulations governing student immigration. Changes have already been proposed to Australian and Canadian student immigration rules, became effective on January 1, 2021, as the Brexit transition was completed. Effective January 1, 2021, all international students, including EEA and Swiss students studying inare under consideration for the U.K. for more than six months, are included in the Student Route, unless they are undertaking an English language course underOverall, there is a Short-Term Study visatrend of up to 11 months. Free movement ceased between the EEA (together with Switzerland)tightening of student immigration regulations and the U.K.; students from these countries entering the U.K. are now subject to the same U.K. immigration rules as students from outside the EEA and Switzerland. EEA and Swiss nationals commencing a higher education course in England from August 2021 will no longer qualify for home fee status or have access to financial support from Student Finance England. It is unclear how international student recruitment agents and prospective international students may view the U.K. as a study destination after the introduction of any new immigration requirements and the U.K.’s exit from the EU. The introduction of revised immigration rules has historically increased, and may continue to increase, KI’s operating costs in the U.K. The introduction of new visa and other administrative requirements for entry into the U.K., Brexit and the perception of the U.K. as a less favorable study destination may have a materially adverse impact on KI’s ability to recruit international students and KI’s results of operations and cash flows.visas worldwide.
Changes to levels of direct and indirect government funding for international education programs would also materially affect the success of KI’s operations. For example, if access to student loans or other funding were to be lost for KI operations that admit students who are entitled to receive the benefit of this funding, Kaplan’s operating results could be materially adversely affected.
In January 2021, President Biden reversed a previously enacted ban on travel from certain countiescountries to the U.S. and directed the State Department to restart visa processing for individuals from the affected countries. There have since been new, unrelated travel restrictions intoin the U.S. due to COVID-19, and those restrictions can be expected to continue changing. On September 25, 2020, the previous U.S. presidential administration proposed significant changes to the visa rules governing entry of non-immigrant academic students and exchange visitors. In July 2021, the Biden administration formally withdrew the notice of proposed rulemaking regarding these changes. Nevertheless, negative perceptions regarding travel to the U.S. could continue to have a significant negative impact on KI’s ability to recruit international students, and Kaplan’s business could be materially adversely and materially affected. In 2018, the Australian government introduced legislation that requires higher-level education standards, a compulsory national exam and increased continuing professional development requirements for all financial advisers in Australia. It had been expected that the new requirements could result in financial advisers leaving the industry, which would have resulted in a loss of those existing students for Kaplan Professional Australia. Although advisers did leave the industry, the market leading position of Kaplan Professional meant that its student numbers actually increased. In 2021, the numbers of advisers pursuing compulsory education upgrades slowed as advisers focused on completing the national exam requirement before a year-end deadline. As predicted, there has been a loss of existing advisers as a result of their unwillingness to meet the new standards. Although Kaplan Professional was able to increase its market share due, in part, to the increased annual continuing education development requirements, the legislation has had a negative impact on results of operations.
•Difficulties of Managing Properties in the U.K. Could Materially Impact Kaplan’s Expenses
Kaplan has a number of real estate investments in the U.K., usually on long-term leases. The U.K. has substantially updated its building and fire safety laws in the last few years. As the tenant, Kaplan is required to keep the buildings in repair. Kaplan usually benefits from a package of contractor and subcontractor arrangements in relation to defects that arise as a result of poor construction or failure to adhere to property regulations. If, however, the entities who have entered into these collateral agreements become insolvent, Kaplan, as the tenant, may be expected to remedy the relevant defect. The relevant costs may be material.
• Difficulties in Managing Foreign Operations and Failure to Comply with Foreign Regulatory Requirements Have Negatively Impacted and Could Continue to Negatively Affect Kaplan’s Business.
Kaplan has operations and investments in a growing number of foreign countries and regions, including Australia, Canada, the People’s Republic of China, Colombia, France, Germany, Hong Kong, India, Ireland, Japan, Myanmar (in which operations are in the process of being closed), New Zealand, Nigeria, Saudi Arabia, Singapore, the U.K. and the United Arab Emirates. Operating in foreign countries and regions presents a number of inherent risks, including the difficulties of complying with unfamiliar laws and regulations, effectively managing and staffing foreign operations, successfully navigating local customs and practices, preparing for potential political and economic instability and adapting to currency exchange rate fluctuations. Countries have also increasingly begun imposing national data protection laws, which increases compliance costs and creates additional legal risk in relation to operating internationally. Failure to effectively manage these risks could have a material adverse effect on Kaplan’s operating results.
In June 2021, the Committee for Private Education (CPE)CPE in Singapore instructed Kaplan Singapore to cease new enrollments for three marketing diploma programs on both a full and part-time basis due to noncompliance with minimum entry level requirements for admission and to teach out existing students in these programs. On August 23, 2021, the CPE issued the same instructions with respect to the Kaplan Foundation diploma and four information technology diploma programs on both a full and part-time basis. In November 2021, the CPE issued the same instructions with respect to a further 23 full-time or part-timecertain diploma programs. Post regulatory action, Kaplan Singapore is currently still able to offer 449 programs that are registered with the CPE, out of which there are 16 diploma programs, 361 bachelors programs, with the balance comprising certificate and postgraduate courses. Kaplan Singapore will applysuccessfully applied for re-registration of certain diploma and additional full-time and part-time programs in 2022. TheIn May 2022, CPE also renewed Kaplan Singapore’s registration as a private education institution for a four-year period expiring in 2026. In 2023, Kaplan Singapore successfully renewed the certification required for private education institutions to enroll international students and offer certain programs. As enrollments in diploma programs and undergraduate degree programs are not yet at levels existing prior to the regulatory actions in 2021, the impact from regulatory actions by the CPE will continue to have a significantan adverse impact on Kaplan Singapore’s revenues, operating results and cash flows in the future. No assurance can be given that applications for re-registration of the impacted programs will be successful. An inability to re-register one or more impacted programs could have a further material adverse effect on Kaplan Singapore’s revenues, operating results and cash flows.future while enrollment levels stabilize.
• Changes in U.K. Tax Laws Could Have a Material Adverse Effect on Kaplan International.
The UK Pathways Colleges located in England were required to register with the Office for Students (OfS)OfS to ensure they could continue operating as English higher education providers. The UK Pathways Colleges (excluding Glasgow and York) were entered on the OfS register of approved providers with Approved Fee Cap Status in August 2020. These colleges now operate under the regulatory oversight of the OfS. Colleges registered with the OfS under Approved Fee Cap status do not charge students Value Added Tax (VAT) on tuition fees based on a statutory exemption available to Approved Fee Cap providers. The York College forms part of the University of York’s Approved Fee Cap registration. If KI Pathways were to lose its Approved Fee Cap status with the OfS, KI Pathways Colleges’ financial results may be materially adversely impacted.
The Glasgow College is not currently included in the OfS registration as it is located in Scotland. Under a different statutory VAT exemption, bodies whichthat qualify for VAT purposes as “colleges of a university” are able to exempt their tuition fees from VAT, and UK Pathways Glasgow International College applies this status. In 2019;2019, a tax case was determined by the U.K. Supreme Court on the meaning of “college of a university.” The U.K. Supreme Court decided the case in the college’s favor. The result was more favorable to private providers working in collaboration with a university. The U.K. Supreme Court emphasized five principal tests for a private provider to meet, for it to be sufficiently integrated with a university, to qualify as a “college of a university” even if it does not have a constitutional link to the university. Although the focus on these five tests has now been incorporated into official Her Majesty'sHis Majesty’s Revenue and Customs (HMRC) guidance, it is not yet clear how HMRC will apply the Supreme Court judgment and the five key tests in practice. If the HMRC’s application of the Supreme Court judgment and the five key tests deemsdeem Glasgow International College not to constitute a “college of a university” and not entitled to a VAT exemption, KI Pathways Colleges’ financial results may be materially adversely impacted if they are not able to meet any new requirements.
Following the departure of the U.K. from the EUEuropean Union (EU) on December 31, 2020, the U.K. may further develop its VAT rules in this complex area separate from the EU rules.rules but has not yet done so. Kaplan iscontinues to closely monitoringmonitor this area.
The next U.K. general election will be no later than January 28, 2025, but is expected to be held in 2024. If the Labour Party forms a new government following this election, their policy is to end the VAT exemption for private schools and may make other changes to U.K. tax laws which increase the tax costs of these schools. KI management presently believes it is likely that such a change would only affect MPW but would need to carefully review the implementation of this policy.
• Failure to Comply with Statutory and Regulatory Requirements as a Third-Party Servicer to Title IV Participating Institutions Could Result in Monetary Liabilities or Subject Kaplan to Other Material Adverse Consequences.
KNA provides services to Purdue Global, Purdue University and other Title IV participating institutions. KNA also providesincluding financial aid services, to Purdue Global, and as such, KNA meets the definition ofis a “third-party servicer”“Third-Party Servicer” for Purdue Global containedas currently defined by the ED and in the Title IV regulations. As a result, KNA is subject to applicable statutory provisions of Title IV and ED regulations that, among other things, require Kaplan to be jointly and severally liable with its Title IV participating client institution(s) to the ED for any violation by such client institution(s) of any Title IV statute or ED regulation or requirement. Separately, if the ED expands the definition of what services or entities fall within the Third-Party Servicer regulations, and/or, if KNA provides financial aid services to more than one Title IV participating institution, it will be required to arrange for an independent auditor to conduct an annual Title IV audit of KNA’s
compliance with applicable ED requirements. KNA provides non-financial aid services to institutions such as Purdue University, Wake Forest University, and other Title IV participating institutions. As such, if the Third-Party Servicer regulations or the interpretation of those regulations by the ED change, KNA could be considered a Third-Party Servicer to its multiple client institutions as well.
KNA is also subject to other federal and state laws, including federal and state consumer protection laws and rules prohibiting unfair or deceptive marketing practices; data privacy, data protection and information security requirements established by federal, state and foreign governments, including, for example, the Federal Trade Commission; and applicable provisions of the Family Educational Rights and Privacy Act regarding the privacy of student records.
Failure to comply with these and other federal and state laws and regulations could result in adverse consequences, including, for example:
•The imposition on Kaplan of fines, other sanctions or liabilities, including repayment obligations for Title IV funds to the ED or the termination or limitation of Kaplan’s eligibility to provide services as a third-party servicerThird-Party Servicer to any Title IV participating institution if KNA fails to comply with statutory or regulatory requirements applicable to such service providers;
•Adverse effects on Kaplan’s business and operations from a reduction or loss in KNA’s revenues under the TOSA or any other agreement with any Title IV participating institution if a client institution loses or has limits placed on its Title IV eligibility, accreditation, operations or state licensure or is subject to fines, repayment obligations or other adverse actions owing to noncompliance by KNA (or the institution) with Title IV, accreditor, federal or state agency requirements;
•Liability under the TOSA or any other agreement with any Title IV participating institution for noncompliance with federal, state or accreditation requirements arising from KNA’s conduct; and
•Liability for noncompliance with Title IV or other federal or state requirements occurring prior to the transfer of KUKaplan University to Purdue.
Although KNA endeavors to comply with all U.S. Federalfederal and state laws and regulations, KNA cannot guarantee that its implementation of the relevant rules will be upheld by the ED or other agencies or upon judicial review. The laws, regulations and other requirements applicable to KNA and its client institutions are subject to change and to interpretation. In addition, there are other factors related to KNA’s client institutions’ compliance with federal, state and accrediting agency requirements, some of which are outside of KNA’s control, that could have a material adverse effect on KNA’s client institutions’ revenues and, in turn, on KNA’s operating results.
• Failure to Comply with the ED’s Title IV Incentive Compensation Rule Could Subject Kaplan to Liabilities, Sanctions and Fines.
Under the ED’s incentive compensation rule, an institution participating in Title IV programs may not provide any commission, bonus or other incentive payment to any person or entity engaged in any student recruiting or admission activities or in making decisions regarding the awarding of Title IV funds if such payment is based directly or indirectly on success in securing enrollments or financial aid. KNA is a third party providing bundled services to Title IV participating institutions, including recruiting and, in the case of Purdue Global, financial aid services. As such, KNA is also subject to the incentive compensation rule and cannot provide any commission, bonus or other incentive payment to any covered employees, subcontractors or other parties engaged in certain student recruiting, admission or financial aid activities based on success in securing enrollments or financial aid. In addition, Purdue Global’sKNA’s client Title IV institutions’ payments to KNA (including payments under the TOSA (as well as any other agreement with any Title IV participating institution)Purdue Global) must comply with revenue sharing guidance provided by the ED related to bundled services agreements. In 2011 guidance, the ED provided that in certain arrangements with Title IV participating institutions where student recruiting services are “bundled” with other non-recruiting services, revenue sharing may be allowable despite the incentive compensation rule’s general prohibition on such revenue sharing with entities or individuals that provide recruiting services. Because this guidance is not codified in any rule or law, but is instead an ED opinionguidance on the applicability of the
incentive compensation rule, such guidance can be revoked at any time and without notice. SomeThe ED has indicated it is considering a change to this guidance as some lawmakers and states, such as California, have publicly called for the revocation of this guidance or sought to introduce federal and state legislation seeking to prevent any such revenue sharing.sharing with entities that engage in recruiting students. The change of control of the executive branch and Congress in 2021 could increaseincreased the likelihood of changes to this guidance and to the incentive compensation rule.rule or limitations on the bundled service allowance through additional federal rulemaking. As previously described, the TOSA revenue sharing fee provisions are defined as deferred purchase price payments rather than payments for services. KNA’s services under the TOSA are paid for as a percentage of KNA’s costs of delivering those services to Purdue Global. KNA cannot predict how the ED or a federal court will interpret, revise or enforce all aspects of the incentive compensation rule or the bundled service revenue sharing guidance in the future or how they would be applied to the TOSA or any of KNA’s agreements by the ED or in any litigation. Any revisions or changes in interpretation or enforcement could require KNA and its client institutions to change their practices or renegotiate the tuition revenue sharing payment terms of KNA’s agreements with such client institutions and could have a material adverse effect on Kaplan’s business and results of operations. Additionally, failure to comply with the incentive compensation rule could result in litigation or enforcement actions against KNA or its clients and could result in liabilities, fines or other sanctions against KNA or its clients, which could have a material adverse effect on Kaplan’s business and results of operations.
• Failure to Comply with the ED’s Title IV Misrepresentation Regulations Could Subject Kaplan to Liabilities, Sanctions and Fines.
A Title IV participating institution is required to comply with the ED regulations related to misrepresentations and with related federal and state laws. These laws and regulations are broad in scope and may extend to statements by servicers, such as KNA, that provide marketing or certain other services to such institutions. These laws and regulations may also apply to KNA’s employees and agents, with respect to statements addressing the nature of an institution’s programs, financial charges or the employability of its graduates. KNA provides certain marketing and other services to Title IV participating institutions. On October 31, 2022, the ED published a new final rule governing the “Borrower Defense to Repayment” rules that became effective July 1, 2023. Among other things, the final rule refines the standard for aggressive and deceptive recruitment tactics that might constitute misrepresentation and provides additional bases for future borrowers’ defense claims against their current or former institutions. The failure to comply with these or other federal and state laws and regulations regarding misrepresentation and marketing practices could result in the imposition on KNA or its client institutions of fines, other sanctions or liabilities, including federal student aid repayment obligations to the ED, the termination or limitation of Kaplan’s eligibility to provide services as a third-party servicer to Title IV participating institutions, the termination or limitation of a client institution’s eligibility to participate in the Title IV programs, or legal action by students or other third parties. A violation of misrepresentation regulations or other federal or state laws and regulations applicable to the services KNA provides to its client institutions arising out of statements by KNA, its employees or agents could require KNA to pay the costs associated with indemnifying its client institutions from applicable losses resulting from the violation or could result in termination by such client institutions of their services agreements with KNA.
• Compliance Reviews, Program Reviews, Audits and Investigations, Including in Connection with Borrower Defense to Repayment Claims, Could Result in Findings of Noncompliance with Statutory and Regulatory Requirements and Result in Liabilities, Sanctions and Fines.
KNA and its client institutions are subject to reviews, audits, investigations and other compliance reviews conducted by various regulatory agencies and auditors, including, among others, the ED, the ED’s Office of the Inspector General, accrediting bodies and state and various other federal agencies. These compliance reviews can result in findings of noncompliance with statutory and regulatory requirements that can, in turn, result in the imposition of fines, liabilities, civil or criminal penalties or other sanctions against KNA and its client institutions, which could have an adverse effect on Kaplan’s financial results and operations. Separately, if KNA provides financial aid services to more than one Title IV participating institution, it will be required to arrange for an independent auditor to conduct an annual Title IV compliance audit of KNA’s compliance with applicable ED requirements. KNA’s client institutions are also required to arrange for an independent auditor to conduct an annual Title IV audit of their compliance with applicable ED requirements, including requirements related to services provided by KNA.
On September 3, 2015, Kaplan sold substantially all of the assets of the former Kaplan Higher Education Campuses (KHE Campuses). As part of the transaction, similar to the transfer of KU,Kaplan University, Kaplan retained liability for the pre-sale conduct of the KHE schools. Although Kaplan no longer owns KUKaplan University or the former KHE Campuses, Kaplan may be liable to the current owners of KUKaplan University and the former KHE Campuses, for the pre-sale conduct of the schools, and the pre-sale conduct of the schools has been and could be the subject of future compliance reviews, regulatory proceedings or lawsuits that could result in monetary liabilities or fines or other sanctions.
OnIn May 6, 2021, Kaplan received a notice from the ED that it would be conducting a fact-finding process pursuant to the borrower defense to repayment regulations to determine the validity of more than 800 borrower defense to repayment claims and a
request for documents related to several of Kaplan’s previously owned schools. Beginning in JulyIn 2021, Kaplan started receiving thereceived claims and related information requests. In total, Kaplan received 1,449 borrower defense applications that seekrequests seeking discharge of approximately $35 million in loans. Most claims received areloans, excluding interest, from former KUKaplan University students. Kaplan believes it has defenses that would bar any student discharge or school liability including that the claims are barred by the applicable statute of limitations, unproven, incomplete and fail to meet regulatory filing requirements. The ED’s process for adjudicating these claims is subject to the borrower defense regulations but it is not clear to what extent the ED will exclude claims based on the underlying statutes of limitations, evidence provided by Kaplan, or any prior investigation related to schools attended by the student applicants. On August 16, 2022, the ED announced the approval of discharges for just under 100 borrowers who had enrolled in the medical assistant or medical billing and coding program at Kaplan Career Institute’s Kenmore Square location in Massachusetts from July 1, 2011 to February 16, 2012, when the institution stopped enrolling new students. These are borrowers the Massachusetts Attorney General identified as part of an investigation in 2013-2015. The location closed in February 2013. To date, the ED has not sought to recoup any discharged amount from Kaplan. Although the ED did not announce the total amount discharged, Kaplan believes it has defensesto be approximately $200,000. Kaplan believes that would bareach of the students subject to discharge was likely previously covered by Kaplan’s prior settlement with the Massachusetts Attorney General through which they should have received refunds of all or part of their tuition.
As part of the Sweet v. Cardona settlement described below, the ED agreed to review any student discharge or school liability includingborrower defense applications submitted between June 23, 2022, and November 15, 2022 on an expedited basis. In January 2024, Kaplan was informed that the ED received applications during this time period regarding former Kaplan University and Purdue Global students and Kaplan has begun to receive them. Unknown at this time is the total discharge amount sought or how much of that amount would apply to Kaplan University students. The Sweet v. Cardona settlement requires the ED to adjudicate applications received during the designated time period pursuant to the requirements of the 2016 Borrower Defense Regulation. To the extent these applications apply to Kaplan University, Kaplan anticipates that it will have defenses similar to those described above.
The settlement agreement in Sweet v. Cardona, a case brought by plaintiffs against the ED and described below, discharges all pending BDTR claims are barred byagainst Kaplan filed through the applicable statutedate of limitations, unproven, incomplete and failthe settlement agreement in June 2022. Although the ED may argue that it has the right to meet regulatory filing requirements.separately adjudicate those BDTR claims to attempt to seek recoupment from Kaplan, it is not clear whether a federal court would hold that the Sweet settlement resolves or moots all such claims. As noted above, the Sweet settlement also applies to claims filed prior to November 15, 2022. Although those post-June 23, 2022 claims were not automatically discharged, the settlement commits the ED to adjudicate those claims prior to January 2026.
In any case, Kaplan expects to vigorously defend any attempt by the ED to hold Kaplan liable for any ultimate student discharges and is respondingresponded to allthe prior claims with documentary and narrative evidence to refute the allegations, demonstrate their lack of merit and support the denial of all such claims by the ED. IfKaplan will similarly respond to all future claims it receives. As noted, if the claims are successful, the ED may seek reimbursement for the amount discharged from Kaplan. If the ED initiates a reimbursement action against Kaplan following approval of additional former students’ borrower defense to repayment applications, Kaplan may be subject to significant liability.
• Noncompliance with Regulations by KNA’s Client Institutions May Adversely Impact Kaplan’s Results of Operations.
KNA currently provides services to higher education institutions that are heavily regulated by federal and state laws and regulations and by accrediting bodies. Currently, a substantial portion of KNA’s revenue is attributable to service fees and deferred purchase price payments it receives under its agreement with Purdue Global, which, in the case of the deferred purchase price, are dependent upon revenue generated by Purdue Global and upon Purdue Global’s eligibility to participate in the Title
IV federal student aid program. To maintain Title IV eligibility, Purdue Global and KNA’s other client institutions must be certified by the ED as eligible institutions, maintain authorizations by applicable state education agencies and be accredited by an accrediting commission recognized by the ED. Purdue Global and KNA’s other client institutions must also comply with the extensive statutory and regulatory requirements of the Higher Education Act and other state and federal laws and accrediting standards relating to their financial aid management, educational programs, financial strength, disbursement and return of Title IV funds, facilities, recruiting practices, representations made by the school and other parties, and various other matters. Additionally, Purdue Global and other client institutions are subject to laws and regulations that, among other things, limit student default rates on the repayment of Title IV loans; permit borrower defenses to repayment of Title IV loans based on certain conduct of the institution; establish specific measures of financial responsibility and administrative capability; regulate the addition of new campuses and programs and other institutional changes; require compliance with state professional licensure board requirements to the extent applicable to institutional programs; require compliance with the Title IV definition of nonprofit institution; and require state authorization and institutional and programmatic accreditation. In addition, the Coronavirus Aid, Relief, and Economic Security (CARES) Act, the Consolidated Appropriations Act of 2021 and subsequent guidance from the ED have created
changes in the administration of federal financial assistance programs, the interpretation of which may not yet be fully understood.
If the ED finds that Purdue Global or any other KNA client institution has failed to comply with Title IV requirements or improperly disbursed or retained Title IV program funds, it may take one or more of a number of actions, includingincluding: fining the school, requiring the school to repay Title IV program funds, limiting or terminating the school’s eligibility to participate in Title IV programs, initiating an emergency action to suspend the school’s participation in the Title IV programs without prior notice or opportunity for a hearing, transferring the school to a method of Title IV payment that would adversely affect the timing of the institution’s receipt of Title IV funds, requiring the school to submit a letter of credit, denying or refusing to consider the school’s application for renewal of its certification to participate in the Title IV programs or for approval to add a new campus or educational program, requiring the institution to comply with additional regulatory requirements reserved for schools not meeting the definition of a nonprofit institution including 90/10 and Gainful Employment requirements, and/or referring the matter for possible civil or criminal investigation. There can be no assurance that the ED will not take any of these or other actions in the future, whether as a result of lawsuits, program reviews or otherwise. In addition, on October 15, 2021,August 18, 2022 the ED granted Purdue Global received from the ED a new PPPA granting provisional certification (“PPPA”) until June 30, 2022.2024. Under this most recent PPPA, Purdue Global must apply for and receive approval for expansion or any substantial change before it may award, disburse or distribute Title IV funds based on the substantial change. Substantial changes generally include, but are not limited to: (a) the establishment of an additional location; (b) an increase in the level of academic offering beyond those listed in the institution'sinstitution’s Eligibility and Certification Approval Report (ECAR);Report; (c) the addition of any educational program (including degree, non-degree or short-term training programs), or (d) the addition of any new degree program. In addition, the institution must pay any liabilities found in a currently open program review prior to the expiration of the PPPA. Purdue Global must also quarterly inform the ED of any governmental investigations involving the university as well as provide a summary of any student complaints. The provisional certification ends upon the ED'sED’s notification to the institution of the ED'sED’s decision to grant or deny a six-year certification to participate in the Title IV, HEAHigher Education Act programs. If Purdue Global or another KNA client institution loses or has limits placed on its Title IV eligibility, accreditation or state licensure, or if Purdue Global or another KNA client institution is subject to fines, repayment obligations or other adverse actions owing to its or Kaplan’s noncompliance with Title IV regulations, accreditor or state agency requirements, or other state or federal laws, Kaplan’s financial results of operations could be adversely affected. Additionally, as a prior owner of Title IV institutions, KNA may retain certain liability for student loans related to the current or future BDTR applications described above or future similar applications.
In turn, any of the aforementioned consequences could have a material adverse effect on Kaplan’s operating results even though such institution’s compliance is affected by circumstances beyond Kaplan’s control, including, for example:
•a reduction or loss in KNA’s revenues under the TOSA or other client agreements if Purdue Global or any other KNA client institution loses or has limits placed on its Title IV eligibility, accreditation or state licensure;
•a reduction or loss in KNA’s revenues under the TOSA or other client agreements if Purdue Global or any other client institution is subject to fines, repayment obligations or other adverse actions owing to noncompliance by Purdue Globalthe institution (or Kaplan) with Title IV, accreditor or state agency requirements;
•the imposition on KNA of fines or repayment obligations to the ED or the termination or limitation on Kaplan’s eligibility to provide services to Purdue Global or other Title IV participating institutions if findings of noncompliance by Purdue Global or such other institution result in a determination that Kaplan failed to comply with statutory or regulatory requirements applicable to service providers; and
•liability under the TOSA or other client agreements for noncompliance with federal, state or accreditation requirements arising from KNA’s conduct.
• Kaplan May Fail to Realize the Anticipated Benefits of the Purdue Global Transaction.
Kaplan’s ability to realize the anticipated benefits of the Purdue Global transaction will depend, in part, on its ability to successfully and efficiently provide services to Purdue Global. Achieving the anticipated benefits is subject to a
number of uncertainties, including whether the services can be provided in the manner and at the cost Kaplan anticipated and whether Purdue Global is able to realize anticipated student enrollment levels. If Kaplan is unable to effectively execute its post-transaction strategy, it may take longer than anticipated to achieve the benefits of the transaction or it may not realize those benefits at all. In 2022 Purdue Global began working with KNA to provide certain human resources, finance and accounting, facility management, and communications services itself, in-house. The TOSA (Kaplan’s service agreement with Purdue Global) acknowledges that the Purdue Global Board of Trustees controls the university. While the TOSA provides financial protections to Kaplan to ensure payment of certain of its fees, actions by Purdue Global that change university policies, direct the provision of certain non-
academic service functions, or increase costs associated with the non-academic service functions could impact Kaplan’s ability to achieve the benefits of the transaction.
• Regulatory Changes and Developments Could Negatively Impact Kaplan’s Results of Operations.
Any legislative, regulatory or other development that has the effect of materially reducing the amount of Title IV financial assistance or other federal, state or private financial assistance available to the students of Purdue Global or any other client institution could have a material adverse effect on Kaplan’s business and results of operations. In addition, any development that has the effect of making the terms on which Title IV financial assistance or other financial assistance funds are available to Purdue Global’s or other client institutions’ students materially less attractive could have a material adverse effect on Kaplan’s business and results of operations.
The laws, regulations and other requirements applicable to KNA or any KNA client institutions are subject to change and to interpretation. Regulatory activityRegulations drafted as a result of the 2021 Negotiated Rulemaking and released in 2022 mayand effective in July 2023 include possible restrictions on revenue sharingrevenue-sharing arrangements withbetween universities and former university owners, as discussed above, whichabove. This could impact KNA Higher Education managed service provider contracts with Purdue Purdue Global,Global. In addition, any change in general to the currently allowed revenue sharing requirements or limitations could impact other KNA client institutions such as Wake Forest, Purdue, Creighton, or Lynn (or others). These and other client institutions. Additional regulatory, policy or legal changes could include imposing outcome metrics on universities, a form of free community college, and changes to the financial aid system, and the reinstatement of broader borrower defenses toincluding broad loan repayment.forgiveness. In addition, athe 2021 Negotiated Rulemaking beganalso resulted in October 2021new rules that covered,cover, in part, rules related to the borrower defense to repayment adjudication process and recovery from institutions, closed school loan discharges, disability loan discharges, public loan forgiveness, income drivenincome-driven repayment plans and arbitration agreements. As part of this current Rulemaking, in a session that began in January 2022, theThe ED also proposed a change tochanged the Title IV definition of “Nonprofit”“nonprofit” institution to generally exclude from that definition any institution that is an obligor on a debt owed to a former owner of the institution or maintains a revenue-based service agreement with a former owner of the institution. Such regulatory changes as well as those described above could subject Purdue Global to additional regulatory requirements. Any resultingThe new rules orand changes to existing rules are not likely to bebecame effective until July 1, 2023. In addition, there are other factors related to Purdue Global’s and other client institutions’ compliance with federal, state and accrediting agency requirements—many of which are largely outside of Kaplan’s control—that could have a material adverse effect on Purdue Global’s and other client institutions’ revenues and, in turn, on Kaplan’s operating results, including, for example:
Reduction in Title IV or other federal, state or private financial assistance: KNA receives revenue based on its agreements with client institutions and particularly revenue from Purdue Global under the TOSA. Purdue Global is expected to derive a significant percentage of its tuition revenues from its participation in Title IV programs. Any legislative, regulatory or other development that materially reduces the amount of Title IV, federal, state or private financial assistance available to the students of Purdue Global and other client institutions could have a material adverse effect on Kaplan’s business and results of operations. In addition, any development that makes the terms of such financial assistance less attractive could have a material adverse effect on Kaplan’s business and results of operations.
Compliance reviews and litigation: Institutions participating in the Title IV programs, including Purdue Global and other client institutions, are subject to program reviews, audits, investigations and other compliance reviews conducted by various regulatory agencies and auditors, including, among others, the ED, the ED’s Office of the Inspector General, accrediting bodies and state and various other federal agencies, as well as annual audits by an independent certified public accountant of compliance with Title IV statutory and regulatory requirements. Purdue Global and other client institutions may also may be subject to various lawsuits and claims related to a variety of matters, including but not limited to alleged violations of federal and state laws and accrediting agency requirements. These compliance reviews and litigation matters could extend to activities conducted by KNA on behalf of Purdue Global or other client institutions and to KNA itself as a third-party servicer subject to Title IV regulations.
Legislative and regulatory change: Congress periodically revises the Higher Education Act and other laws and enacts new laws governing the Title IV programs and annually determines the funding level for each Title IV program and may make changes in the laws at any time. The ED and other federal and state agencies may also may issue new regulations and guidance or change their interpretation of regulations at any time. For example, on September 23, 2019,October 27, 2022 and October 31, 2022 the ED released new final regulations (effective July 1, 2023) that further change the borrower defense regulations, including changes affecting the ability of student borrowers to obtain discharges of their obligations to repay certain Title IV loans that were first disbursed on or after July 1, 2020, and loans disbursed between July 2017 and July 1, 2020. The2023; relating to recoupment of BDTR discharges from institutions; adding a new regulations, among other things, expanddefinition for nonprofit institutions that limits the ability of borrowerssuch institutions to obtain loan discharges based on substantial misrepresentations. Applicationcontract with former owners; and, establishing new accountability rules for colleges and universities undergoing changes in ownership. The application of these regulations to Purdue Global or other client institutions could materially affect revenue and result in liabilities to the ED. In addition, application of these regulations
to KNA for loans disbursed between July 1, 2017, and March 22, 2018, the close of the Purdue Global transaction, could materially affect Kaplan’s revenues. Additionally, changes to the ability of students to discharge loans owing to prior school closures could
impose liability on Kaplan for loans made to students at institutions previously owned by Kaplan and closed during Kaplan’s ownership. ED also published final regulations on September 2, 2020, regarding distance education and various other matters. Any action by Congress or the ED that significantly reduces funding for Title IV programs or the ability of Purdue Global or other client institutions to receive funding through these programs could reduce Purdue Global’s or other client institutions’ enrollments and tuition revenues and, in turn, the revenues KNA receives under the TOSA or other agreements. Any action by Congress or the ED that impacts the ability of Purdue Global to contract with KNA to receive a share of revenue as deferred payment for the sale of KUKaplan University or the ability of KNA to contract with any client institution to provide bundled services in exchange for a share of tuition revenue could require KNA to modify the TOSA, other agreements or its practices and could impact the revenues KNA may receive under such agreements. Congress, the ED and other federal and state regulators may create new laws or take actions that may require Purdue Global, other client institutions or KNA to modify practices in ways that could have a material adverse effect on Kaplan’s business and results of operations.
Increased regulatory scrutiny of postsecondary education and service providers: The increased scrutiny of online schools that offer programs similar to those offered by Purdue Global or other client institutions and of service providers that provide services similar to Kaplan’s has resulted, and may continue to result, in additional enforcement actions, investigations and lawsuits by the ED, other federal agencies, Congress, state Attorneys General and state licensing agencies.agencies, or private plaintiffs. Recent enforcement actions have resulted in substantial liabilities, restrictions and sanctions and in some cases have led to the loss of Title IV eligibility and closure of institutions. The change of control of the executive branch and Congress in 2021 could increase the amount of regulation and scrutiny of service companies like Kaplan and online schools like Kaplan’s client institutions.institutions, and has resulted in new regulations as described in part above. This increased activity and other current and future activity may result in further legislation, rulemaking and other governmental actions affecting the amount of student financial assistance for which Purdue Global’s or other client institutions’ students are eligible, or Kaplan’s participation in Title IV programs as a third-party servicer to Purdue Global or such other client institutions. In addition, increased scrutiny and legislative proposals restricting the ability of entities like KNA that provide certain admissions relatedadmissions-related services to Title IV participating institutions under revenue sharing arrangements could impact KNA agreements. Such scrutiny could result in requests to Kaplan for information or negative publicity that could adversely affect KNA and its client institutions.
• ChangesReductions in the Extent to WhichUse of Standardized Tests Are Used in the Admissions Process by Colleges or Graduate Schools and Increased Competition Could Reduce Demand for KNA Supplemental Education Test Preparation Offerings.
KNA Supplemental Education Exam Preparation provides courses that prepare students for a broad range of admissions examinations that are considered by colleges and graduate schools. Historically, colleges and graduate schools have required standardized tests as part of the admissions process. As a result of the COVID-19 pandemic, a number ofCertain colleges and graduate schools have waived standardized tests as part of the admissions process for the upcoming academic year or longer. These changes have had a negative impact on KNA’s results of operations for the test preparation products. In addition, there had already been some movementmoved away from the historical reliance on standardized admissions tests among certain colleges, which have phased out admissions tests, are in the process of phasing out admissions tests or have adopted “test-optional” admissions policies. Moreover, as a part of a settlement in a lawsuit brought by students in 2019, a large public university will no longer use the SAT and ACT for admissions or scholarship decisions for its system of 10 schools. Any significant reductiontests. Reductions in the use of standardized tests in the college or graduate school admissions processes have had and could continue to have an adverse effect on Kaplan’sKNA’s operating results.
Additionally, KNA faces increased competition from competitors offering lower-cost or free test prep products that may be used by students to piece together alternatives to traditional comprehensive test prep programs. Kaplan’s operating results may be adversely affected if student demand for KNA’s traditional comprehensive programs shifts to KNA’s lower-cost, standalonestand-alone offerings, or if competitors offer lower-cost, standalonestand-alone offerings or free test prep products that are more attractive to students than KNA’s products.
• Postponement and Cancellation of Examinations and Changes in the Extent to Which Licensing and Proficiency Examinations Are Used to Qualify Individuals to Pursue Certain Careers Could Reduce Demand for Kaplan’s Offerings.
A material portion of KNA’s and KI’s revenue comes from preparing individuals for licensing or technical proficiency examinations in various fields. Any significant relaxation or elimination of licensing or technical proficiency requirements in those fields served by KNA’s and KI’s businesses could negatively affect Kaplan’s operating results. As a result of the COVID-19 pandemic, a number of professional certification examinations have been cancelled or
permanently altered. While the impact of these changes on Kaplan’s operations improved in 2021 relative to 2020, further changes and impacts on student timing due to the pandemic may impact Kaplan’s results.
• Liability under Real Estate Lease Guarantees for Certain Real Estate Leases that were Assigned to Education Corporation of America Could Have a Material Adverse Effect on the Company’s Results.
On September 3, 2015, Kaplan sold to ECA substantially all of the assets of the KHE Campuses. The transaction included the transfer of certain real estate leases that were guaranteed or purportedly guaranteed by Kaplan. ECA is currently in receivership, has terminated all of its higher-education operations and has sold most, if not all, of its remaining assets (including New England College of Business). Additionally, the receiver has repudiated all of ECA’s real estate leases. Although ECA is required to indemnify Kaplan for any amounts Kaplan must pay due to ECA’s failure to fulfill its obligations under the real estate leases guaranteed by Kaplan, ECA’s current financial condition and the amount of secured and unsecured creditor claims outstanding against ECA make it unlikely that Kaplan will recover from ECA. If Kaplan is not successful in mitigating these liabilities, the Company’s results could be materially adversely impacted. In the second half of 2018, the Company recorded an estimated $17.5 million in losses on guarantor lease obligations in connection with this transaction in other non-operating expense. The Company recorded an additional estimated $1.1 million in non-operating expense in 2019 and $1 million in non-operating expense in 2020, and $1.1 million in non-operating expense in 2021, in each case consisting of legal fees and lease costs. The Company continues to monitor the status of these obligations.
Risks Related to the Company’s Television Broadcasting and Media Businesses
• Changing Perceptions aboutAbout the Effectiveness of Television Broadcasting in Delivering Advertising Could Adversely Affect the Profitability of Television Broadcasting.
Historically, television broadcasting has been viewed as a cost-effective method of delivering various forms of advertising. There can be no guarantee that this historical perception will guide future decisions by advertisers. To the extent that advertisers shift advertising expenditures, including local advertising, away from broadcast television to other media outlets, including digital distribution platforms, the profitability of the Company’s television broadcasting business could be adversely affected.
• Increased Competition Resulting from Technological Innovations in News, Information and Video Programming Distribution Systems and Changing Consumer Behavior Could Adversely Affect the Company’s Operating Results.
The continuing growth and technological expansion of internet-based services has increased competitive pressure on the Company’s media businesses. Examples of such developments include online delivery of programming via online platforms, including both ad-supported and subscription video programming services and the national broadcast networks’ direct-to-consumer services, technologies that enable users to fast-forward or skip advertisements, and devices that allow users to consume content on demand and in remote locations while avoiding traditional commercial advertisements or cable and satellite subscriptions. Changing consumer behavior may also put pressure on the Company’s media businesses to change traditional distribution methods. The Company obtains significant revenue from its retransmission consent agreements with traditional cable and satellite distributors. These payments are calculated on a per-subscriber basis, andso that payments to the Company may decrease as customers “cut the cord” and cancel their cable and satellite subscriptions. The Company also receives payments for the distribution of its stations’ signals on certain online “over-the-top” services,internet-based services; however, these revenues may be less than those received from traditional cable and satellite distribution. Anticipating and adapting to changes in technology and consumer behavior on a timely basis will affect the ability of the Company’s media businesses’ abilitybusinesses to continue to increase their revenue. The development and deployment of new technologies and changing consumer behavior have the potential to negatively and significantly affect the Company’s media businesses in ways that cannot now be reliably predicted and that may have a material adverse effect on the Company’s operating results.
• Changes in the Nature and Extent of Government Regulations Could Adversely Affect the Company’s Television Broadcasting Business and Other Businesses.
The Company’s television broadcasting business operates in a highly regulated environment. Complying with applicable regulations has significantly increased, and may continue to increase, the costs, and has reduced the revenues, of the business. Changes in regulations have the potential to negatively impact the television broadcasting business, not only by increasing compliance costs and reducing revenues through restrictions on certain types of advertising, limitations on pricing flexibility, or other means, but also by possibly creating more favorable regulatory environments for the providers of competing services.services, including unregulated digital programming distribution platforms. In addition, changes to the FCC’s rules governing broadcast ownership may affect the Company’s ability to expand its television broadcasting business and/or may enable the Company’s competitors to improve their market positions through consolidation. More generally, all of the Company’s businesses could have their profitability or their competitive positions adversely affected by significant changes in applicable regulations.
regulations could adversely affect the profitability and/or competitive positions of the Company’s businesses.• Transition to New Technical Standards for Broadcast Television Stations May Alter the Competitive Environment in the Company’s Stations’ Markets or Cause the Company to Incur Increased Costs.
The Company cannot predict how the market will react toevolve as the new broadcast television station technical standard, ATSC 3.0, as the period for voluntary transition to the new standard has only recently begun, and some of the market rollouts originally planned for 2020 or 2021 have been delayed by the COVID-19 pandemic. Equipment manufacturers began releasing certain TV set models with built-in ATSC 3.0-capable receivers in 2020, but ATSC 3.0-capable consumer devices are not yet widelyis made available in a growing number of television markets across the U.S. As part of the voluntary transition, many station groups are beginning to test ATSC 3.0 streams. Notably, there is a large consortium led by Pearl TV (of which GMG is a member) that has been leading test trials in the Phoenix, Detroit, Portland and other markets.country; today, ATSC 3.0 streams are now available in more than 40 markets across the country.70 markets. Competing stations that transition to ATSC 3.0 may increase competition for the Company’s stations and/or create competitive pressure for the Company’s stations to launch ATSC 3.0 streams. As noted above, GMG stations’stations WDIV-TV, WKMG-TV, WSLS-TV, and KPRC-TV have begun broadcasting ATSC 3.0 streams, overand it is anticipated that KSAT-TV, WJXT-TV and WCWJ-TV will launch ATSC 3.0 streams this year. The pace of transition to the courseATSC 3.0 broadcasting standard may also be affected by the availability of ATSC 3.0-capable consumer devices. Equipment manufacturers began releasing certain TV models with built-in ATSC 3.0-capable receivers in 2020, and 2021. an increasing number of external tuners or converter boxes are available, but ATSC 3.0-capable consumer devices are not yet widely available or in use in the U.S. The ongoing transition to ATSC 3.0 may cause the Company to incur substantial costs over time. More generally, the deployment of ATSC 3.0 may have other material effects on the Company’s media businesses that cannot now be reliably predicted and that may have a material adverse effect on the Company’s operating results.
• Potential Liability for Intellectual Property InfringementChanges in MVPD Subscriber Numbers, Retransmission Consent Fees, “Reverse Retransmission Consent” Payments to the Networks, and Broadcast Exclusivity Could Adversely Affect the Company’s Businesses.Revenues.
TheAs the number of subscribers to traditional cable, satellite and telecommunications services declines, the Company periodicallyfaces the possibility of declining revenues under its existing retransmission agreements, which typically provide for payment to the Company on a per-subscriber basis. Those subscribers who “cut the cord” and move to internet-based streaming services may not generate the same revenues as the Company receives claims from third parties allegingunder its existing retransmission consent agreements, because the distribution agreements that apply to “virtual” MVPDs are negotiated by the national networks, and the per-subscriber fees paid to network-affiliated stations are determined by the network rather than by the Company in direct negotiation with those distributors.
At the same time, the Company’s businesses infringe onnetwork affiliation agreements typically require payments to the intellectual property rightsnetworks with which GMG stations are affiliated in the form of others. It is likely that“reverse retransmission consent fees,” which require the Company willto share a specified portion of retransmission consent fees with the respective networks. As reverse retransmission consent fee payments required to be paid to the networks escalate, the Company potentially could retain smaller shares of revenues generated by its retransmission consent agreements. The reverse retransmission consent fee obligations are sometimes structured as annual flat fees. In those cases, as the number of subscribers to traditional MVPD platforms decreases, the Company alone bears the costs and risks of declining retransmission consent revenues.
As the national networks have launched and continue to be subject to similar claims, particularly as they relate toinvest in their direct-to-consumer platforms, an increasing amount of network programming that was once available exclusively on an in-market network-affiliated station is now being made available on ad-supported or subscription services, either exclusively or simultaneously with its media businesses. Other parts of the Company’s businessover-the-air broadcast. The diminishing program exclusivity provided by network affiliation could also be subject to such claims. Addressing intellectual product claims is a time-consumingdecrease local broadcasters’ leverage in retransmission consent negotiations with MVPDs.
Taken together, these factors together could adversely affect GMG’s revenues and expensive endeavor, regardless of the merits of the claims. In order to resolve such claims, the Company may have to change its method of doing business, enter into licensing agreements or incur substantial monetary liability. It is also possible that one of the Company’s businesses could be enjoined from using the intellectual property at issue, causing it to significantly alter its operations. Although the Company cannot predict the impact at this time, if any such claim is successful, the outcome would likely affect the business utilizing the intellectual property at issue and could have a material adverse effect on that business’s operating results or prospects.results.
Risks Related to the Company’s Manufacturing Businesses
• Failure to Comply with Environmental, Health, SafetyRecruit and Other Laws ApplicableRetain Production Staff Needed to Meet Customer Demand Could Have a Material Adverse Effect on the Company’s Manufacturing Operations Could Negatively Impact the Company’s Business.Businesses.
The Company’s manufacturing operations are subjectexperiencing a highly competitive market for production labor that may limit its ability to extensive federal, state and local laws and regulations relatingmeet customer demand. If staffing cannot be hired at a cost-efficient wage rate relative to the environment, as well as health and workplace safety, including those set forth by the OSHA, the Environmental Protection Agency (EPA) and state and local regulatory authorities in the U.S. Such laws and regulations affect operations and require compliance with various environmental registrations, licenses, permits, inspections and other approvals. The Company incurs substantial costs to comply with these regulations, and any failure to comply may expose the Company to civil, criminal and administrative fees, fines, penalties and interruptions in operations that could have a material adverse impact on the Company’s results of operations, financial position or cash flows.product pricing, volume will be impacted.
• The Company May Be Subject to Liability Claims That Could Have a Material Adverse Effect on Its Business.
The Company’s manufacturing operations are subject to hazards inherent in manufacturing and production-related facilities. An accident involving these operations or equipment may result in losses due to personal injury; loss of life; damage or destruction of property, equipment or the environment; or a suspension of operations. Insurance may not protect the Company against liability for certain kinds of events, including those involving pollution or losses resulting from business interruption. Any damages caused by the Company’s operations that are not covered by insurance, or are in excess of policy limits, could materially adversely affect the Company’s results of operations, financial position or cash flows.
• Failure to Recruit and Retain Production Staff Needed to Meet Customer Demand Could Have a Material Adverse Effect on the Company’s Manufacturing Businesses.
The Company’s manufacturing operations are experiencing a highly competitive market for production labor that may limit its ability to meet customer demand. If staffing cannot be hired at a cost-efficient wage rate relative to product pricing, volume will be impacted. In addition, COVID-19 absenteeism and potential vaccine mandates announced in jurisdictions in which the Company’s manufacturing businesses operate, will result in employee attrition and difficulty in meeting labor needs. Both factors impacting labor availability could have an adverse effect on future revenues and costs, which could be material.
Risks Related to the Company’s Healthcare Business
• Extensive Regulation of the Healthcare Industry Could Adversely Affect the Company’s Healthcare Businesses and Results of Operations.
The home health and hospice industries are subject to extensive federal, state and local laws, with regulations affecting a wide range of matters, including licensure and certification, quality of services, qualifications of personnel, confidentiality and security of medical records, relationships with physicians and other referral sources, operating policies and procedures, and billing and coding practices. These laws and regulations change frequently, and the manner in which they will be interpreted is subject to change in ways that cannot be predicted.
Reimbursement for services by third-party payers,payors, including Medicare, Medicaid and private health insurance providers, may decline, while authorization, audit and compliance requirements continue to add to the cost of providing those services.
Managed-care organizations, hospitals, physician practices and other third-party payerspayors continue to consolidate in response to the evolving regulatory environment, thereby enhancing their ability to influence the delivery of healthcare services and decreasing the number of organizations serving patients. This consolidation could adversely impact GHG’s businesses if they are unable to maintain their ability to participate in established networks. In addition, CSI Pharmacy and Weiss Medical both face risks from manufacturer supply shortages, competitive vertical integration and pricing power, and government intervention on drug pricing.
GHG is also subject to periodic and routine reviews, audits and investigations by federal and state government agencies and private payers,payors, which could result in negative findings that adversely impact the business. CMSThe federal Centers for Medicare and Medicaid Services (CMS) increasingly uses third-party, for-profit contractors to conduct these reviews, many of which share in the amounts that CMS denies. These reviews, audits and investigations consume significant staff and financial resources and may take years to resolve.
•Federal and State Changes to Reimbursement and Other Aspects of Medicare and Medicaid Could Have a Material Adverse Effect on the Company’s Healthcare Business
The Company’s Healthcare business derives revenue primarily from Medicare. Payments received from Medicare are subject to changes made through federal legislation. When changes are implemented, internal billing processes and procedures must be modified, which can require significant time and expense. These changes can include changes to base payments, adjustments for home health services, changes to cap limits and per diem rates for hospice services, changes to Medicare eligibility and documentation requirements and changes designed to restrict utilization. Health care reform and legislation and continuing efforts of governmental payors to contain health care costs could decrease payments made for services. Within the Medicare program, the hospice benefit is often specifically targeted for cuts. Reimbursement payments under governmental payor programs, including Medicare supplemental insurance policies, may not remain at levels comparable to present levels or be sufficient to cover the costs allocable to patients eligible for reimbursement pursuant to these programs. Any such changes, including retroactive adjustments, could have a material adverse effect on our business and consolidated financial condition, results of operations and cash flows.
•Continued Nursing Staffing Shortages Could Adversely Affect the Growth of the Company’s Healthcare Businesses.
The country’s severe shortage of nurses could adversely affect GHG’s ability to meet customer demand and may impact its ability to take on new business. In addition, competition to attract new nurses necessitates offering increased wages and benefits, which increases costs.
• Value-based Purchasing Could Negatively Impact Medicare Reimbursement.
Both private and government payors are increasingly looking to value-based purchasing to lower costs. Value-based purchasing focuses on quality of outcomes and care efficiency, rather than quantity of care. Effective January 1, 2023, under the 2022 Home Health final rule for Medicare home health providers, value-based purchasing was expanded to all 50 states. Under the expanded model, home health agencies receive adjustments to their Medicare fee-for-service payments based on their performance against a set of quality measures, relative to their peers’ performance. Performance on these quality measures in a specified year (performance year) impacts payment adjustments in a later year (payment year). The Home Health Final Rule for 2024, published on November 1, 2023, contained many changes that will impact the home health value-based purchasing model in 2025. However, the value-based purchasing model will remain unchanged in 2024, with the baseline year of 2022 still in effect. CMS could also create a similar plan for hospice providers in the future. Private and government payors’ implementation of value-based purchasing requirements could negatively impact Medicare reimbursement and have an adverse effect on GHG’s financial condition, results of operations and overall cash flows.
•The Company’s Healthcare Business is Limited in its Ability to Control Rates Received for its Services Which Could Materially Adversely Affect its Business if it is Unable to Maintain or Reduce Costs to Provide Such Services.
Medicare is the primary payor for the Company’s Healthcare business and rates are established through federal legislation. Additionally, non-Medicare rates are difficult to negotiate because such payors are under pressure to reduce their own costs. As a result, the Healthcare business must manage costs in order to achieve a desired level of profitability including, but not limited to, centralization of various processes, utilization of technology and management of the number of employees utilized. If the Healthcare business is unable to streamline its processes and reduce costs, its business and consolidated financial condition, results of operations and cash flows could be materially adversely affected.
Risks Related to the Company’s Automotive Businesses
•Termination or Non-renewal of a Dealership Agreement by an Automobile Manufacturer and Limitations on the Company’s Ability to Acquire Additional Dealerships Could Adversely Affect the Company’s Automotive Business and Results of Operations.
The Company’s automobile dealerships are dependent on maintaining strong relationships with manufacturers, and the Company’s ownership and operation of automobile dealerships is subject to its ability to comply with various requirements established by automobile manufacturers. The Company’s dealerships operate under separate agreements with each applicable automobile manufacturer. Manufacturers may terminate their agreements for a variety of reasons, including a dealership’s failure to meet a manufacturer’s standards for financial and sales performance, customer satisfaction, facilities and the quality of dealership management; and any unapproved change in ownership or management. These agreements also limit the Company’s ability to acquire multiple dealerships of the same brand within a particular market and preclude the Company from establishing new dealerships within an area already served by another dealer of the same vehicle brand. In addition, dealerships controlled by related parties of the management team operating the Company’s dealerships may restrict the
Company’s ability to acquire new dealerships within an area in which such dealerships operate. Manufacturers also have the right of first refusal if the Company seeks to sell dealerships and may limit the Company’s ability to transfer ownership of a dealership without the prior approval of the manufacturer. Failure to maintain ownership of the dealerships in compliance with manufacturer agreements could constitute a breach of the agreements and could result in termination or non-renewal of existing dealer agreements. If one of the Company’s manufacturers does not renew its dealer agreement or terminates the agreement, the Company’s dealership would be unable to sell or distribute new vehicles or perform manufacturer authorizedmanufacturer-authorized warranty service, which would adversely affect the Company’s automotive business.
•Changes Affecting Automobile Manufacturers Could Adversely Affect the Company’s Automotive Business.
The Company’s dealerships are dependent on the products and services offered by the brand of automobiles that its dealerships sell. The ability of the Company’s dealerships to sell and service these brands may be adversely
affected by negative conditions faced by manufacturers such as negative changes to a manufacturer’s financial condition, negative publicity concerning a manufacturer or vehicle model, declines in consumer demand or brand preferences, changes in consumer preferences driven by fuel price volatility, disruptions in production and delivery, including those caused by natural disasters or labor strikes, new laws or regulations, including more stringent fuel economy and greenhouse gas emission standards, and technological innovations in ride-sharing, electric vehicles and autonomous driving. The ability of the Company’s dealerships to align with manufacturers and adapt to evolving consumer demand for electric vehicles could adversely affect new and used vehicle sales volumes, parts and service revenue and results of operations.
•Changes to State Dealer Franchise Laws to Permit Manufacturers to Enter the Retail Market Directly and Technological Innovations Could Adversely Impact the Company’s Traditional Dealership Model.
Changes to state dealer franchise laws to permit the sale of new vehicles without the involvement of franchised dealers could adversely affect the Company’s dealerships. Certain manufacturers have been challenging state dealer franchise laws in many states and some have expressed interest in selling directly to customers. The Company’s dealership model could be adversely affected if new vehicle sales are allowed to be conducted on the internet without the involvement of franchised dealers.
•Changes in a Manufacturer’s Incentive Programs Could Adversely Affect the Dealerships’ Sales Volume and Profit Margins.
Automobile manufacturers offer various marketing and sales incentive programs to promote and support new vehicle sales. These programs include customer rebates, dealer incentives on new vehicles, employee pricing, manufacturer floor plan interest assistance, advertising assistance and product warranties. A reduction or discontinuation of a manufacturer’s incentive programs could adversely affect vehicle demand and results of operations.
•Changes in Environmental Regulations Governing the Operations of the Automotive Business Could Result in Increased Costs.
The Company is subject to a wide range of environmental laws and regulations, including those governing discharges into the air and water, the operation and removal of above-ground and underground storage tanks, the use, handling, storage and disposal of hazardous substances and other materials, and the investigation and remediation of environmental contamination at facilities that are owned or operated. The business involves the generation, use, handling and contracting for recycling or disposal of hazardous or toxic substances or wastes, including environmentally sensitive materials such as motor oil, filters, transmission fluid, antifreeze, refrigerant, batteries, solvents, lubricants, tires and fuel. The Company has incurred, and will continue to incur, capital and operating expenditures and other costs in complying with such laws and regulations and changes to such regulations could result in increased costs.
•Changes in Economic Conditions and Vehicle Inventories Are Difficult to Predict and May Adversely Impact the Results of Operations of the Company’s Dealerships.
Sales of new and used vehicles are cyclical. Historically there have been periods of downturns characterized by weak demand due to general economic conditions, excess supplies, consumer confidence, discretionary income and credit availability. Recently, supply shortages have led to a period of higher average new and used selling prices as a result of strong consumer demand and inventory shortages related to supply chain disruptions and production delays at vehicle manufacturers. These conditions may deteriorate in the future. Changes in these conditions could materially adversely impact sales and related margins of new and used vehicles, parts and repair and maintenance services.
Risks Related to the Company’s Other Businesses
•If Leaf isSaatchi Art Group, Society6 and WGB are Unable to Attract and Retain Artists, Customers and Visitors, and Successfully Drive Traffic to itstheir Marketplaces and Media Properties and Expand its Customer Base for its Marketplaces, itstheir Business and Results of Operations Would be Adversely Affected.
Saatchi Art Group’s business and results of operation depend upon attracting and retaining artists whose artwork adds value to the marketplaces and that consumers want to purchase, and upon attracting customers who convert into new and repeat purchasers. Saatchi Art Group must continue to ensure there is a strong value proposition for artists to join and remain in the marketplace due to the quality of the service offered and the sales commissions they can generate. Society6 Group’s business and results of operation depend upon attracting and retaining artists who upload quality content that consumers want to purchase and upon attracting and retaining customers who convert into new and repeat purchasers. Their ability to attract new customers, some of whom may already purchase similar products from competitors, depends in part on their ability to successfully drive traffic to their marketplaces using social media platforms, email marketing campaigns and promotions, paid referrals, and search engines.
In order for Leaf’s businessesWGB’s business to grow, LeafWGB must attract new visitors and customers to its marketplaces and media properties and retain its existing visitors and customers. Leaf’svisitors. WGB’s success in attracting traffic to its media properties and converting these visitors into repeat users depends, in part, upon Leaf’sWGB’s ability to identify, create and distribute high-quality and reliable content through engaging products and Leaf’sWGB’s ability to meet rapidly changing consumer demand. LeafWGB may not be able to identify and create the desired content or produce an engaging user experience in a cost-effective or timely manner, if at all. LeafWGB depends on search engines, primarily Google, to direct a significant amount of traffic to its media and marketplace properties, and LeafWGB utilizes search engine optimization efforts to help generate search referral traffic to its media and marketplace
properties. Changes in the methodologies or algorithms used by search engines to display results could cause WGB’s properties to receive less favorable placements in the search results. If LeafWGB is unable to successfully modify its search engine optimization practices in response to changes regularly implemented by search engine algorithms and in search query trends, or
if LeafWGB is unable to generate increased or diversified traffic from other sources such as social media, email, direct navigation and online marketing activities, LeafWGB could experience substantial declines in traffic to its media properties and to its partners’ media properties, which would adversely impact Leaf’sWGB’s business and results of operations. One of the key factors to growing the marketplace platforms for Society6 Group and Saatchi Art Group is expanding their new and repeat customer base. Their ability to attract new customers, some of whom may already purchase similar products from competitors, depends in part on Leaf’s ability to successfully drive traffic to Leaf’s marketplaces using social media platforms, email marketing campaigns and promotions, paid referrals and search engines.
•If LeafWGB is Unable to Effectively Distribute its Media Content on Social Media Platforms or Effectively Optimize its Mobile Solutions in Order to Improve User Experience or Comply with Requirements of Leaf’s Advertising Partners, Leaf’sDevices, WGB’s Business and Results of Operation Could Be Negatively Impacted.
The number of people who access the internet through mobile devices such as smartphones and tablets, rather than through desktop or laptop computers, has increased substantially in recent years. Additionally, individuals are increasingly consuming publisher content through social media platforms. If LeafWGB cannot effectively distribute its media content, products and services on these devices or through these platforms, LeafWGB could experience a decline in visits and traffic and a corresponding decline in revenue. The significant increase in consumptionConsumption of Leaf’sWGB’s media content on mobile devices andrather than through social media platforms depressesdesktop or laptop computers decreases revenue per one thousand visits, or RPVs.visits. As a result of these factors, the increasing use of mobile devices and social media platforms to access Leaf’sWGB’s content could negatively impact its business and results of operations.
Further, consumers are increasingly conducting online shopping on mobile devices, including smartphones and tablets, rather than on desktop or laptop computers. Although Leaf continually strives to improve the mobile experience for users accessing its marketplaces through mobile devices, the smaller screen size and reduced functionality associated with some mobile device interfaces may make the use of Leaf’s marketplace platforms more difficult or less appealing to its members. Historically, visits to Leaf’s marketplaces on mobile devices have not converted into purchases as often as visits made through desktop or laptop computers, and the average order value for mobile transactions has been lower than desktop transactions. If conversion rates and average order values for mobile transactions on Leaf’s marketplaces do not increase, the revenue and results of operations of Society6 Group and Saatchi Art Group may be adversely affected.
•Leaf’s Businesses Face Significant Competition, Which Leaf Expects Will Continue to Intensify, and Leaf May Not Be Able to Maintain or Improve its Competitive Position or Market Share.
Leaf’s Society6 Group and Saatchi Art Group businesses compete with a wide variety of online and brick-and-mortar companies selling comparable products. Leaf expects competition to continue to intensify given the low barrier of entry into online channels and the increase in conversion and competition between online and offline businesses. Leaf’s Media Group faces intense competition from a wide range of competitors. Leaf’s current principal competitors include online media properties, some of which have much larger audiences than Leaf, for online marketing budgets. Leaf also competes with companies and individuals that provide specialized consumer information online, including through enthusiast websites, message boards and blogs. Many of Leaf’s current and potential competitors enjoy substantial competitive advantages, such as greater brand recognition, greater technical capabilities, access to larger customer bases and, in some cases, the ability to combine their online marketing products with traditional offline media such as newspapers or magazines. These companies may use these advantages to offer similar products and services at a lower price, develop different products to compete with Leaf’s current offerings and respond more quickly and effectively than Leaf can to new or changing opportunities, technologies, standards or customer requirements. For example, if Google chose to compete more directly with Leaf as a publisher of similar content, Leaf may face the prospect of the loss of business or other adverse financial consequences due to Google’s significantly greater customer base, financial resources, distribution channels and patent portfolio.
•Failure to Recruit and Retain Employees in the Company’s Restaurants Could Adversely Impact the Company’s Restaurant Business.
Historically, competition among restaurant companies for qualified management and staff has been very high. The Company’s ability to recruit and retain managers and staff to operate the Company’s restaurants is critical to a customer’s dining experience. Failure to recruit and retain employees, low levels of unemployment or high turnover levels could negatively affect the Company’s restaurant business. Tipped wage legislation is presenting new challenges to balance menu pricing, service standards, staffing levels, operating costs and public awareness as new wage laws are implemented.
•Food-Borne Illness Concerns and Damage to the Company’s Reputation Could Harm the Company’s Restaurant Business.
Historically, reports of food-borne illness or food safety issues at restaurants, even if caused by food suppliers or distributors, have had negative effects on restaurant sales. Because food safety issues could be experienced at the source by food suppliers or distributors, food safety could, in part, be out of the Company’s control. Even instances of food-borne
illness at a location served by one of the Company’s competitors could result in negative publicity regarding the food service industry generally and could negatively impact restaurant revenue. Regardless of the source or cause, negative publicity about food-borne illness or other food safety issues could adversely impact the Company’s reputation. Similarly, publicity about litigation, violence, complaints, or government investigations could have a negative effect on restaurant sales.
• Concentration of the Company’s Restaurants in the Washington, D.C. Region Subjects the Company'sCompany’s Restaurant Business to Regional Economic Conditions.
The concentration of the Company’s restaurants in the Washington, D.C. region subjects it to adverse economic conditions and trends in the region that are out of the Company'sCompany’s control. For example, increases in the level of unemployment, a temporary government shutdown or a decrease in tourism would decrease customers’ disposable income available for discretionary spending. These and other national, regional and local economic pressures could result in decreases in customer traffic and lower sales and profits.
Risks Related to the Company’s Stock Ownership and Operations
• As a Controlled Company, the Rights of Class B Common Stockholders are Limited
The Company has two classes of shares, Class A Common Stock and Class B Common Stock. Class B Common Stock has limited voting rights, including the right to elect 30% of the Company’s Board of Directors, to vote on the reservation of shares for option grants and on the acquisition of the stock or assets of other companies under certain circumstances. The descendants of Katharine Graham and trusts for the benefit of those descendants own the majority of the shares of Class A Common Stock and have the right to vote for 70% of the Board of Directors and to vote on all other matters. As a result, control of the Company has been and is expected to remain with members of the Graham family. In addition, the Company is a “controlled company” under the corporate governance rules of the New York Stock Exchange (NYSE) and as such, the Company is exempt from certain corporate governance requirements of the NYSE.
• Pandemics or Other Outbreaks of Disease, Such as the COVID-19 Pandemic, Have Had, and Future Outbreaks, Could Have, Adverse Impacts on the Company’s Business, Results of Operations and Cash Flows.
Pandemics and other disease outbreaks, such as the COVID-19 pandemic, have materially affected, and may in the future, materially adversely affect the Company’s businesses, including the demand for its products and services. As a result of the COVID-19 pandemic, travel restrictions and school closures impeded the ability of students to travel to undertake overseas study resulting in reduced enrollments for programs offered by Kaplan International, reduced demand for student housing and delays and cancellations of standardized tests. The COVID-19 pandemic also led to plant closures and disruptions in the Company’s supply chains, declines in demand for products and advertising, closures of the Company’s restaurants and live art fairs, and increased competition for labor and absenteeism affecting the Company’s media, manufacturing, healthcare, automotive and other businesses. The adverse impact of a new health crisis could include, and in the past has included, reduced demand for the Company’s products and services, supply chain disruptions, asset impairment charges, labor disruptions and manufacturing, restaurant and other closures. Additionally, to the extent a pandemic or other health crisis adversely affects the Company’s business operations, financial condition or operating results, it may also have the effect of heightening many of the other risks described in this “Risk Factors” section.
•Failure to Comply with Environmental and Health and Safety Laws Applicable to the Company’s Operations Could Negatively Impact the Company’s Businesses.
The Company’s operations are subject to extensive federal, state and local laws and regulations relating to the environment, as well as health and workplace safety, including those set forth by the Occupational Safety and Health Administration (OSHA), the Environmental Protection Agency (EPA) and state and local regulatory authorities in the U.S. as well as similar laws and regulations internationally where the Company operates. Such laws and regulations affect operations and require compliance with various environmental registrations, licenses, permits, inspections and other approvals. In the U.K., the Company will be subject to new registration requirements under the U.K. Building Safety Act in 2022 with respect to its dormitories as well as compliance with existing U.K. and local legislation regarding licensing occupancy of such dormitories. The Company incurs substantial costs to comply with these regulations, and any failure to comply may expose the Company to civil, criminal and administrative fees, fines, penalties and interruptions in operations that could have a material adverse impact on the Company’s results of operations, financial position or cash flows.
Environmental laws and regulations to which the Company is subject include those governing discharges into the air and water, the operation and removal of above-ground and underground storage tanks, the use, handling, storage and disposal of hazardous substances and other materials, and the investigation and remediation of environmental contamination at facilities that are owned or operated. The Company may be subject to liability, for example, in the automotive business, because the business involves the generation, use, handling and contracting for recycling or disposal of hazardous or toxic substances or wastes, including environmentally sensitive materials such as motor oil, filters, transmission fluid, antifreeze, refrigerant, batteries, solvents, lubricants, tires and fuel. In addition, climate change could cause increases in hurricanes, floods, wildfires, and other risks that could produce losses affecting our businesses. Although in connection with certain acquisitions, the Company has obtained indemnification for certain environmental liabilities and insurance policies, such rights and policies may not be sufficient to reimburse the Company for all losses that it might incur. The Company has incurred, and will continue to incur, capital and operating expenditures and other costs in complying with such laws and regulations and changes to such regulations, including any new regulations related to climate change, could give rise to additional compliance or remedial costs.
• Failure to Successfully Integrate Acquired Businesses Could Negatively Affect the Company’s Business.
Acquisitions involve various inherent risks and uncertainties, including difficulties in efficiently integrating the service offerings, accounting and other administrative systems of an acquired business; the challenges of assimilating and retaining key personnel; the consequences of diverting the attention of senior management from existing operations; the possibility that an acquired business does not meet or exceed the financial projections that supported the purchase price; and the possible failure of the due diligence process to identify significant business risks or liabilities associated with the acquired business. A failure to effectively manage growth and integrate acquired businesses could have a material adverse effect on the Company’s operating results.
• Changes in Business Conditions Have Caused and May in the Future Cause Goodwill and Other Intangible Assets to Become Impaired.
Goodwill generally represents the purchase price paid in excess of the fair value of net tangible and intangible assets acquired in a business combination. Goodwill is not amortized and remains on the Company’s balance sheet indefinitely unless there is an impairment or a sale of a portion of the business. Goodwill is subject to an impairment test on an annual basis and when circumstances indicate that an impairment is more likely than not. Such
circumstances include an adverse change in the business climate for one of the Company’s businesses or a decision to dispose of a business or a significant portion of a business. Each of the Company’s businesses faces uncertainty in its business environment due to a variety of factors, including challenges in operating environments created by the COVID-19 pandemic and changes in demand for products and services. In the third quarter of 2023, the Company recorded a goodwill impairment of $50.2 million at WGB and $47.8 million at Dekko. Additional declines in revenue could result in adverse changes in projections for future operating results or other key assumptions, such as projected revenue, profit margin, capital expenditures or cash flows associated with fair value estimates and could lead to additional future impairments, which could be material. The Company may experience other unforeseen circumstances that adversely affect the value of the Company’s goodwill or intangible assets and trigger an evaluation of the amount of the recorded goodwill and intangible assets. There also exists a reasonable possibility that changes to the discounted cash-flow model used to perform the quantitative goodwill impairment review, including a decrease in the assumed projected cash flows or long-term growth rate, or an increase in the discount rate assumption, could result in an impairment charge. Future write-offs of goodwill or other intangible assets as a result of an impairment in the business could materially adversely affect the Company’s results of operations and financial condition.
•Changes in International Income Tax Laws Could Subject the Company to Increased Taxes and Increased Compliance Costs
Many countries have proposed or enacted changes to their tax laws to implement a minimum 15% tax rate on certain multinational companies based on a set of rules known as Pillar Two issued by the Organization for Economic Co-operation and Development (OECD). Global tax developments, such as Pillar Two, could subject the Company to increased taxes and increased compliance costs.
Risks Related to Cybersecurity, Information TechnologyPrivacy, Artificial Intelligence and Data ManagementIntellectual Property
• System Disruptions and Security Threats to the Company’s Information Technology Infrastructure Could Have a Material Adverse Effect on Its Businesses and Results of Operations.
The Company relies extensively on information technology systems, networks and services, including internet sites, data hosting and processing facilities and tools and other hardware, software and technical platforms, some of which are managed, hosted, provided and/or used by third parties or their vendors, to assist in conducting the Company’s business.
The Company’s systems and the third-party systems on which it relies are subject to damage or interruption from a number of causes, including but not limited to power outages; computer and telecommunications failures; computer viruses; industry-wide software supply chain vulnerabilities, security breaches; cyberattacks, including phishing and other forms of social engineering, hacking, denial-of-service attacks, cyber extortion, including the use of ransomware;ransomware and other actions or attempts to exploit vulnerabilities; catastrophic events such as fires, floods, earthquakes, tornadoes and hurricanes; infectious disease outbreaks (such as COVID-19); acts of war or terrorism; and design or usage errors by our employees, contractors or third-party service providers. The techniques used by computer hackers and cyber criminals to obtain unauthorized access to data or to sabotage computer systems change frequently, continue to grow in sophistication and volume, and may not be detected until after an incident has occurred. These techniques include using artificial intelligence (AI), including generative AI to enhance their attacks, which may increase our cybersecurity risk. Although the Company and the third-party service providers seek to maintain their respective systems effectively and to successfully address the risk of compromise of the integrity, security and consistent operations of these systems, such efforts may not be successful. As a result, the Company or its service providers could experience errors, interruptions, delays or cessations of service in key portions of the Company’s information technology infrastructure, which could significantly disrupt its operations, including manufacturing production delays, and be costly, time-consuming and resource-intensive to remedy. Any security breach or unauthorized access also could result in a misappropriation of the Company’s proprietary information or the proprietary information of the Company’s users, customers or partners, which could result in significant legal and financial exposure and damage to the Company’s reputation. If an actual or perceived breach of the Company’s security occurs, or if the Company’s consumer facingconsumer-facing sites become the subject of external attacks that affect or disrupt service or availability, the market perception of the effectiveness of the Company’s security measures could be harmed and the Company could lose users, customers, advertisers or partners, all of which could have a material adverse effect on the Company’s business, financial condition and results of operations. Any security breach at a company providing services to the Company or the Company’s users, including third-party payment processors, could have similar effects and the Company may not be fully indemnified for the costs it may incur as a result of any such breach. To the extent that such vulnerabilities require remediation, such remedial measures could require significant resources and may not be implemented before such vulnerabilities are exploited. As the cybersecurity landscape evolves, the Company may also find it necessary to make significant further investments to protect data and infrastructure, including continuing to evaluate control changes and investments needed to support an increased remote workforce. Any of these events could have a material adverse effect on the
Company’s businesses and results of operations. Sustained or repeated system failures or security breaches that interrupt the Company’s ability to process information in a timely manner or that result in a breach of proprietary or personal information could have a material adverse effect on the Company’s operations and reputation. In addition, minor incidents, even if dealt with promptly, could lead to severe legal, financial and reputational issues, such as investigations by authorities, enforcement, lawsuits and negative publicity, and a collection of incidents, though not considered material individually at the time they occur, may be deemed material later in the aggregate.
• Failure to Comply with Privacy Laws or Regulations Could Have an Adverse Effect on the Company’s Businesses.
Various U.S. federal, state and international laws and regulations govern the collection, use, retention, sharing and security of consumerpersonal data. This area of the law is evolving, and interpretations of applicable laws and regulations differ. Legislative activity in the privacy area may result in new laws that are relevant to the Company’s operations, including restrictions on the collection, use and sharing of consumerpersonal data that could limit our ability to use the data for marketing or advertising, and could result in exposure to material liability. For example, general data privacy regulations adopted by the European UnionEU known as the General Data Protection Regulation (GDPR), became effective in May 2018. These regulations require certain of the Company’s operations to meet extensive requirements regarding the handling of personal data, including its use, protection and transfer. In addition, the GDPR provides the legal right for persons whose data is stored to request access to or correction or deletion of their
personal data, among other rights. Failure to meet the applicable requirements in the GDPR could result in fines of up to 4% of the Company’s annual global revenues. In addition to the GDPR in Europe, new privacy laws and regulations are rapidly developing and being implemented elsewhere around the globe, including amendments to the scope, penalties and other provisions of existing data protection laws. Failure to comply with these international data protection laws and regulations could have a negative impact on the Company’s reputation and subject the Company to significant fines, penalties or other liabilities or restrict the Company’s ability to continue operating its existing business processes, all of which may increase the cost of operations, reduce customer growth, or otherwise harm the Company’s business.
The California Consumer Privacy Act of 2018 (CCPA), which became effective on January 1, 2020, provided a new private right of action for data breaches and requires companies that process personal information pertaining to California residents to make disclosures to consumers about their data collection, use and sharing practices and allows consumers to opt out of certain data sharing with third parties. The enforcement of the CCPA by the California Attorney General commenced on July 1, 2020. In November 2020, the California Privacy Rights Act (CPRA) was approved by California voters, and goeswent into effect on January 1, 2023. The CPRA includesincluded new requirements that arewere not in the CCPA. In 2020,Similar privacy laws also went into effect in Virginia, Colorado, Connecticut and ColoradoUtah during 2023, other privacy laws have been passed similar laws that are effective January 1, 2023will go into effect in 2024 and July 1, 2023, respectively. In addition,2025, and data privacy bills have beencontinue to be introduced in various U.Sat the state legislatures, including, but not limited to Washington, New York and Florida.level. There are also comprehensive privacy bills that have been introduced at the U.S. federal level. In addition to the comprehensive privacy laws and bills, the recent emergence of new AI tools has raised some additional information security and privacy issues. There are currently numerous bills for new laws to regulate the use of AI both at the U.S. federal and state level, and in other locations in which the Company does business such as the EU. The passage of any additional laws could result in further uncertainty and cause the Company to incur additional costs and expenses in order to comply. Compliance with the GDPR, the CCPA, the CPRA and other applicable international and U.S. privacy laws can be costly and time-consuming. If the Company fails to properly respond to security breaches of its or its third-party’s information technology systems or fails to properly respond to consumeran individual’s requests under these laws, the Company could experience damage to its reputation, adverse publicity, loss of consumer confidence, reduced sales and profits, complications in executing the Company’s growth initiatives and regulatory and legal risk, including criminal penalties or civil liabilities.
Claims of failure to comply with the Company’s privacy policies or applicable laws or regulations could form the basis of governmental or private party actions against the Company and could result in significant penalties. Additionally, evolving concerns regarding data privacy may cause the Company’s customers and potential customers to resist providing the data necessary to allow the Company to deliver its solutions effectively. Even the perception that personal information is not satisfactorily protected or does not meet regulatory requirements could inhibit sales and any failure to comply with such laws and regulations could lead to significant fines, penalties or other liabilities. Such claims and actions could cause damage to the Company’s reputation and could have an adverse effect on the Company’s businesses.
Financial Risks
•Failure to Successfully Integrate AcquiredUncertainty in the Development, Deployment, and use of AI in the Company’s Products and Services, as well as its Businesses More Broadly, Could NegativelyAdversely Affect the Company’s Business.Business and Reputation.
Acquisitions involve various inherent risksThe Company is building and uncertainties,expects to use systems and tools that incorporate AI-based technologies, including difficultiesgenerative AI, for its customers and workforce. The development, adoption and use of generative AI technology remains in efficiently integratingearly stages, and effective or inadequate AI or generative AI development or deployment practices by the service offerings, accountingCompany or third parties could result in unintended consequences. For example, AI algorithms that the Company uses may be flawed or may be (or perceived to be) based on datasets that are biased or insufficient. In addition there is uncertainty around the validity and other administrative systemsenforceability of an acquired business;intellectual property rights related to the challengesCompany’s
development, deployment and use of assimilatingAI. Compliance with new or changing laws, regulations or industry standards relating to AI may impose significant operational costs and retaining key personnel;may limit the consequencesCompany’s ability to develop, deploy or use AI technologies. Failure to appropriately respond to this evolving landscape may result in legal liability, regulatory action or brand and reputational harm.
•Potential Liability for Intellectual Property Infringement Could Adversely Affect the Company’s Businesses.
The Company periodically receives claims from third parties alleging that the Company’s businesses infringe on the intellectual property rights of divertingothers. It is likely that the attention of senior management from existing operations; the possibility that an acquired business does not meet or exceed the financial projections that supported the purchase price; and the possible failureCompany will continue to be subject to similar claims, particularly as they relate to its media businesses. Other parts of the due diligence processCompany’s business could also be subject to identify significant business risks or liabilities associated withsuch claims. Addressing intellectual property claims is a time-consuming and expensive endeavor, regardless of the acquired business.merits of the claims. In June 2021,order to resolve such claims, the Company acquired Leaf, a diversified consumer internet companymay have to change its method of doing business, enter into licensing agreements with copyright holders, or incur substantial monetary liability. It is also possible that builds creator-driven brands in lifestyleone of the Company’s businesses could be enjoined from using the intellectual property at issue, causing it to significantly alter its operations. Although the Company cannot predict the impact at this time, if any such claim is successful, the outcome would likely affect the business utilizing the intellectual property at issue and home and art design categories. A failure to effectively manage growth and integrate acquired businesses such as Leaf could have a material adverse effect on the Company’s operating results.
• Changes in Business Conditions Have Caused and May in the Future Cause Goodwill and Other Intangible Assets to Become Impaired.
Goodwill generally represents the purchase price paid in excess of the fair value of net tangible and intangible assets acquired in a business combination. Goodwill is not amortized and remains on the Company’s balance sheet indefinitely unless there is an impairment or a sale of a portion of the business. Goodwill is subject to an impairment test on an annual basis and when circumstances indicate that an impairment is more likely than not. Such circumstances include an adverse change in the business climate for one of the Company’s businesses or a decision to dispose of a business or a significant portion of a business. Each of the Company’s businesses faces uncertainty in its business environment due to a variety of factors, including challenges in operating environments created by the COVID-19 pandemic. In the first quarter of 2020, the Company recorded a goodwill and indefinite-lived intangible asset impairment charge at Clyde’s and an indefinite-lived intangible asset impairment charge at the auto dealerships. In the third quarter of 2021, the Company recorded a goodwill impairment charge at Dekko. Additional COVID-19 disruptions could result in future adverse changes in projections for futurebusiness’s operating results or other key assumptions, such as projected revenue, profit margin, capital expenditures or cash flows associated with fair value estimates and could lead to additional future impairments, which could be material. The Company may experience other unforeseen circumstances that adversely affect the value of the Company’s goodwill or intangible
assets and trigger an evaluation of the amount of the recorded goodwill and intangible assets. There also exists a reasonable possibility that changes to the discounted cash-flow model used to perform the quantitative goodwill impairment review, including a decrease in the assumed projected cash flows or long-term growth rate, or an increase in the discount rate assumption, could result in an impairment charge. Future write-offs of goodwill or other intangible assets as a result of an impairment in the business could materially adversely affect the Company’s results of operations and financial condition.prospects.
Item 1B. Unresolved Staff Comments.
Not applicable.
Item 1C. Cybersecurity.
Cybersecurity Risk Management and Strategy.
The Company is a holding company and its business units are decentralized. Together with its business units, the Company maintains a risk-based information security program establishing administrative, technical, and physical safeguards that are designed for the size, scope and type of the Company’s businesses.
The information security program is designed to protect the confidentiality, integrity, and availability of the Company’s information systems and data, and safeguard information systems and data in accordance with applicable local, state, federal or international laws, regulations, or standards.
The Company’s information security program is risk-based; the Company and its business units perform business impact assessments and risk assessments on a regular basis to calibrate areas of focus. Cybersecurity risks are evaluated as a part of the broader risk management activities at the Company.
The Company and its business units leverage several information security controls frameworks, standards and best practices with the International Organization for Standardizations (ISO) 27001 used as the overarching framework. The ISO 27001 establishes a multi-pronged information security standard for organizations to manage information security risks, build cyber resilience, and improve operations.
Third-party service provider risk management is one of many components of the Company’s information security program. The Company and its business units use a risk-based approach to identifying and overseeing cybersecurity risks presented by third parties that could adversely impact the Company. This approach may include, but is not limited to, reviewing and assessing providers’ cybersecurity maturity, conducting diligence on certain providers’ information security programs, and/or imposing contractual obligations on the provider depending on the type and quantity of data involved, the access provided to Company systems, the type of provider and the criticality of outsourced operations.
The Company maintains an incident response plan that is distributed to its business units for customization according to their specific operations and internal reporting structures. The Company leverages third-party cybersecurity experts to review the response plan and facilitate incident response exercises for its business units. The Company licenses third-party software that provides incident response simulation capabilities and playbooks and makes that available to its business units and also retains a third-party cybersecurity firm to provide assistance if needed during a cybersecurity incident.
The Company and its business units engage third parties to assess various aspects of the information security program, provide threat intelligence, perform external audits, perform penetration testing, and provide other services as needed.
The Company and its business units have not been materially affected by risks from cybersecurity threats, For a discussion of whether and how any risks from cybersecurity threats are reasonably likely to materially affect the Company, see Item 1A Risk Factors.
Governance.
The Board of Directors has delegated oversight of risks related to cybersecurity to the Audit Committee which reports on its risk management activities, including risks arising from cybersecurity threats, to the full Board. The Company’s Vice President of Information Security and Privacy reports to the Audit Committee on an annual basis. In addition, the Audit Committee receives quarterly updates as part of the disclosure control process and updates, as needed, for significant issues.
The annual report to the Audit Committee includes an overview of multiple topics, such as current cybersecurity threats; other cybersecurity risks, including operational, legal/regulatory, and reputational risks; a status summary of company-wide metrics relating to information security controls (e.g., controls addressing vulnerability and patch management, web and mobile application security, administrative access, incident response capability, compliance activities, disaster recovery, sensitive data inventory, and phishing prevention); and planned information security initiatives.
At the Company’s corporate level, the Information Security and Privacy team monitors the prevention, detection and remediation of cybersecurity incidents and coordinates with the Company’s business units to assess information security posture and risk. This coordination includes, for example, performing business impact assessments, conducting risk assessments, and testing and evaluating key aspects of business units’ information security programs, the results of which are reported to the Company’s senior management and the Audit Committee as appropriate.
The Company’s Information Security and Privacy team is led by the VP of Information Security and Privacy who reports to the Company’s Chief Financial Officer. She joined the Company in 2003 and has more than 30 years of relevant experience. Before joining the Company, she served as the federal government and southeast region leader of Guardent (now part of Verisign), a security and privacy consulting and managed security services company. Prior to Guardent, she worked at PricewaterhouseCoopers LLP in the Technology Risk Services consulting practice.She is a strategic advisor to several organizations in the information security and privacy field and is a Certified Information Systems Security Professional (CISSP), and a Certified Information Privacy Professional (CIPP).
Members of the Company’s Information Security and Privacy team have an average of more than 20 years of information security and compliance experience, spanning diverse environments and industries, government agencies, and public and private companies. All members of the core team maintain cybersecurity certifications and attend regular training programs relating to information security, privacy and compliance.
The Company views information security as a shared responsibility. It requires employees to complete information security and privacy awareness training and sends out regular communications on information security and privacy topics. Developers are trained regularly on secure coding practices and the Company mandates that every business unit perform phishing exercises quarterly. Some employees receive additional in-depth training related to their individual job responsibilities.
Item 2. Properties.
The Company leases space for its corporate offices in Arlington, VA. The lease expires in 2024, subject to an option ofVA.
In the Company to extend.
Directly or through its subsidiaries,education segment, Kaplan owns a total of four commercial properties: a six-story building located at 131 West 56th Streetseven properties, including six in New York City, used by KNA as an education center primarily for medical students; an office condominium in Chapel Hill, NC, used by KNA; a three-story building in Berkeley, CA, used for classroom space by KNAthe U.S. totaling approximately 46,319 square feet and KI North America; and, in August 2021, MPW purchased a buildingone property in South Kensington, London, intendedU.K. used for academicschool and dormitory space. KIKaplan also leases facilities used for offices, instruction and student dormitories in the U.S., the U.K., Ireland, Germany, France, Switzerland, Spain, Singapore, Australia and India. In 2017, Kaplan International entered into a 135-year lease of land in Liverpool, U.K. on which it completed the construction of college andand/or dormitory space that opened in January 2020. Kaplan International’s other significant space is dormitory space leased in Nottingham, Glasgow, Bournemouth and Brighton, U.K.
In the U.S., KNAtelevision broadcasting segment, Graham Media Group owns all six of its studio facilities in Houston, TX, Detroit, MI, Orlando, FL, San Antonio, TX, Jacksonville, FL, and Roanoke, VA. GMG owns the tower facilities in its San Antonio, TX, Detroit, MI, and Roanoke, VA markets and jointly owns the transmitter facilities in Jacksonville, FL, Orlando, FL, and Houston, TX.
In the healthcare segment, Graham Healthcare Group leases space in Fort Lauderdale, FL,49 facilities for corporate offices, data and call centers and employee-training facilities, which leases expire in 2024. In addition, KNA leases corporate offices in La Crosse, WI, under a lease expiring in 2023 and in Pittsburgh under a lease expiring in 2024. KNA has 18 smaller leases in the U.S. and also delivers classes at schools, colleges, hotelsnursing and other premises for which KNA is not a leaseholder. Kaplan, Inc. leases office space in Alpharetta, GA, pursuantacross 15 states to a lease that expires in 2024. The Kaplan Languages Group business maintains 14support its home health, hospice, pharmacy infusion, physician practices and behavioral services and leases for office12 facilities through its joint ventures with health systems and instructional space in the U.S.
Overseas, Dublin Business School’s facilities in Dublin, Ireland, are located in three buildings which are rented under leases expiring between 2028 and 2029. Kaplan Publishing has an office and distribution warehouse in Wokingham, Berkshire, U.K., under a lease expiring in 2027. Kaplan Financial’s largest leaseholds are office and instructional spaces in London, U.K., expiring in 2033, and two leases, expiring in 2030; office and instructional space in Birmingham, U.K., expiring in 2027; two locations in Manchester, U.K. comprising an office for central support services expiring in 2027, and office and instructional space expiring in 2027; office and instructional space in Singapore, comprising two separate leases and expiring between 2022 and 2023; and office and instructional space in Hong Kong expiring in 2025. Palace House in London, U.K., is primarily occupied by the KI Pathways business and KI corporate offices comprising several separate leases expiring in 2032. Kaplan has leases expiring in 2027 for education space in Nottingham, U.K. Itphysician groups. GHG also leases dormitory space as the main tenant of a student residential building in Nottingham, U.K. Kaplan has two separate leases in Glasgow, Scotland for dormitory space that was constructed and opened to students in 2012 which leases expire in 2032. Kaplan has further entered into a lease for a residential college in Bournemouth, England, and a lease in Brighton, U.K., for dormitory space which expires in 2040. In Australia, Kaplan leases one location in Melbourne, three locations in Sydney, one location in Brisbane, and three locations in Adelaide under leases expiring between 2022 through 2031.
The operations of each of the Company’s television stations are owned by subsidiaries of the Company, as are the related tower sites, except in Houston, Orlando and Jacksonville, where the tower sites are 50% owned.
Hoover owns nine U.S. properties: a 29-acre site in Thomson, GA; a 35-acre site in Pine Bluff, AR; a 60-acre site in Milford, VA; a 15-acre site in Detroit, MI; a 14-acre site in Bakersfield, CA; a 17-acre site in Oxford, PA; a 15-acre site in Halifax, NC; an 11-acre site in Belington, WV; and a 65-acre site in Havana, FL. In addition, Hoover leases a 10-acre site in Winston, OR, on a long-term lease with renewal terms available through December 31, 2044. Hoover’s corporate, sales and accounting office, and research, engineering and development offices are also located on the Thomson, GA, campus.
Dekko owns four U.S. properties: manufacturing buildings in Garrett, IN and Avilla, IN; a manufacturing and warehouse space in Ardmore, AL; and a warehouse space in El Paso, TX. In addition, Dekko owns two buildings in Juarez, Mexico, one of which consists of manufacturingproperties that are used for pharmacy infusion services (Nash, TX) and office spacehome health and the other consists of manufacturing and office space. In the U.S., Dekko leases headquarters and innovation center space in Fort Wayne, IN, under a lease that expires in 2029; manufacturing and warehouse space in North Webster, IN, under a lease that expires in 2022; warehouse space in Kendallville, IN, under a lease that expires in 2022; manufacturing, warehouse and office space in Shelton, CT and in Fallston, NC, under leases that expire 2022-2024; and office space in Grand Rapids, MI, that expires in 2024.hospice administrative services (Lapeer, MI).
In the manufacturing segment, Hoover owns 11 properties in AR, CA, FL, GA, MI, NC, PA, TX, VA, WA, and WV. Dekko owns 5 properties in IN, TX, AL and Juarez, Mexico; and Joyce/Dayton owns three properties:3 properties in OH and IN, which are used for manufacturing, warehouse and office space. The remaining office and manufacturing facilities are leased, including one manufacturing facility in Monterrey, Mexico.
In the automotive segment, Graham Automotive owns properties for its corporate headquartersHonda of Tysons Corner dealership in Kettering, OH,VA, Toyota of Woodbridge dealership in VA, Chrysler-Dodge-Jeep-Ram of Woodbridge dealership in VA, and Toyota of Richmond dealership in VA. It leases 12 additional properties that serve as the sales and service departments for its Lexus of Rockville, Ourisman Jeep, Ford of Manassas, and Kia of Bethesda dealerships, along with a service facility for Roda.
The businesses that comprise the Company’s other businesses lease space for their operations, including office space and retail locations in DC, MD, VA, NY, NJ, IL, GA, MA and PA, and manufacturing facilities in Portland, IN,KY and Clayton, OH. It also leases a manufacturing facilityNJ for Framebridge; restaurant facilities in Newington, CT.
Forney leases corporateDC, MD, and VA for Clyde’s; office space in Addison, TX under a lease that expires in 2024,NY and leases a distribution center in Laredo, TX, under a lease that expires in August 2022. Forney’s manufacturing facility in Monterrey, Mexico, is in a building that contains office and manufacturing space under a lease that expires in 2022. Forney also leases offices in Shanghai, China, under a lease that expires in December 2022.
The corporate office of GHG is located in leasedDC for Slate; office space in Troy, MI. GHG also leases a small office in Nashville, TN. GHG leases small office spaces in Mechanicsburg, PA; Williamsport, PA; Harrisburg, PA; Kingston, PA; Milford, PA; Stroudsburg, PA; New Castle, PA; Warrendale, PA; Shiloh, IL; Marion, IL; Glen Carbon, IL; Troy, MI; Grand Rapids, MI; Lansing, MI; Lapeer, MI; Zephyrhills, FL; Osprey; FL; Palmetto, FL; Downers Grove, IL;DC for Foreign Policy; and Nashville, TN. In addition, GHG leases space for a hospice for nursing offices at Edward and Elmhurst hospitals in northern Illinois. GHG leases office space for Weiss Medical in Riverdale, NJ. GHG also has leased office space in Mars, PA, which expires in October 2022. GHG also owns property in Benton, IL.CA, CO, the U.K. and Australia for Saatchi Art Group, Society6 and WGB.
Graham Automotive ownsThe Company considers its properties suitable for the Honda dealership space in Tysons Corner, VA. Graham Automotive leases space in Rockville, MD,conduct of its respective businesses and adequate for its Lexus dealership, Bethesda MD for its Jeep dealership, and Manassas, VA for its Ford dealership. Thesecurrent use. The Company believes that suitable additional or alternative space is available at commercially reasonable terms as leases expire between 2036or premises become unavailable. However, it recognizes that replacements for student dormitory space leased by Kaplan International may be difficult to 2060, including renewal options.
Leaf leases office space in Santa Monica, California that serves as its corporate headquarters. The lease for its Santa Monica facility expires in July 2024. Leaf also leases additionalobtain due to high demand and alternative transmitter facilities could be costly and purchase service memberships in Denver, Colorado, New York, New York and London, United Kingdom.
Clyde’s leases restaurant facilities in Maryland, Virginia and Washington, D.C., under non-cancellable lease agreements. The restaurant facilities average just over 15,000 square feet, ranging from 10,000require a significant amount of time to 30,000 square feet. Renewal options are available on many of the leases for one or more periods of five to 10 years each. Final lease expiration dates range from 2022 to 2051.
Framebridge leases retail locations in Washington, D.C. (2), Bethesda, MD (1), Northern Virginia, VA (2), Chicago, IL (3), Brooklyn, NY (2), Atlanta, GA (2), Manhattan, NY (1), Boston suburb (1), Philadelphia suburb (1) and two manufacturing facilities in Richmond, KY and Moorestown, NJ.
Code3 leases office space in New York, NY; Los Angeles, CA; and Cleveland, OH.
The Slate Group leases office space in Brooklyn, NY, and Washington, D.C.construct.
Item 3. Legal Proceedings.
Information with respect to legal proceedings may be found in Note 18, “Contingencies and other commitmentsOther Commitments - Litigation, Legal and Other Matters” to the consolidated financial statements in Part II of this Annual Report, which is incorporated herein by reference.
Item 4. Mine Safety Disclosures.
Not applicable.
PART II
Item 5. Market for the Registrant’s Common Equity, Related Stockholder Matters and Issuer Purchases of Equity Securities.
Market Information and Holders
The Company’s Class B Common Stock is traded on the New York Stock ExchangeNYSE under the symbol “GHC.” The Company’s Class A Common Stock is not publicly traded.
At January 31, 2022,2024, there were 27 holders of record of the Company’s Class A Common Stock and 339319 holders of record of the Company’s Class B Common Stock.
Purchases of Equity Securities by the Issuer and Affiliated Purchasers
During the quarter ended December 31, 2021,2023, the Company purchased shares of its Class B Common Stock as set forth in the following table:
| | | | | | | | | | | | | | | | | | | | | | | |
| Period | Total Number
of Shares
Purchased | | Average
Price Paid
per Share | | Total Number of Shares
Purchased as Part of
Publicly Announced Plan* | | Maximum Number of Shares That May Yet Be Purchased Under the Plan* |
| 2021 | | | | | | | |
| October | 12,730 | | | $ | 601.02 | | | 12,730 | | | 314,910 | |
| November | 12,957 | | | 597.04 | | | 12,957 | | | 301,953 | |
| December | 31,771 | | | 580.93 | | | 31,771 | | | 270,182 | |
| Total | 57,458 | | | $ | 589.01 | | | 57,458 | | | |
| | | | | | | | | | | | | | | | | | | | | | | |
| Period | Total Number
of Shares
Purchased | | Average Price Paid per Share(1) | | Total Number of Shares Purchased as Part of Publicly Announced Plan(2) | | Maximum Number of Shares That May Yet Be Purchased Under the Plan(2) |
| 2023 | | | | | | | |
| October 1 - 31 | 39,091 | | | $ | 591.21 | | | 39,091 | | | 297,575 | |
| November 1 - 30 | 25,166 | | | 617.93 | | | 25,166 | | | 272,409 | |
| December 1 - 31 | 36,006 | | | 669.13 | | | 36,006 | | | 236,403 | |
| Total | 100,263 | | | $ | 625.90 | | | 100,263 | | | |
____________
*(1) Average price paid per share includes costs associated with repurchases, including commissions and excise taxes.
(2) On September 10, 2020,May 4, 2023, the Company’s Board of Directors authorized the Company to purchase, on the open market or otherwise, up to 500,000 shares of its Class B Common Stock. This authorization includes shares that remained under the previous authorization. There is no expiration date for this authorization. All purchases made during the quarter ended December 31, 2021,2023, were open market transactions.transactions and some of these shares were purchased under a 10b5-1 plan.
Performance Graph
The following graph is a comparison of the yearly percentage change in the Company’s cumulative total shareholder return with the cumulative total return of the Standard & Poor’s 500 Stock Index (S&P 500 Index) and a custom peer group index comprised of a composite group of education and television broadcasting companies. The Standard & Poor’sS&P 500 Stock Index is comprised of 500 U.S. companies in the industrial, transportation, utilities and financial industries and is weighted by market capitalization. The custom peer group of composite companies includes Adtalem Global Education Inc., Chegg, Inc., The E.W. Scripps Company, Grand Canyon Education Inc., Nexstar Media Group Inc., Gray Television Inc., New Oriental Education & Technology Group Inc., Pearson plc and Tegna Inc. The graph reflects the investment of $100 on December 31, 2016,2018, in the Company’s Class B Common Stock, the Standard & Poor’s 500 Stock Index and the custom peer group index of composite companies. For purposes of this graph, it has been assumed that dividends were reinvested on the date paid in the case of the Company, and on a quarterly basis in the case of the Standard & Poor’sS&P 500 Index and the custom peer group index of composite companies.
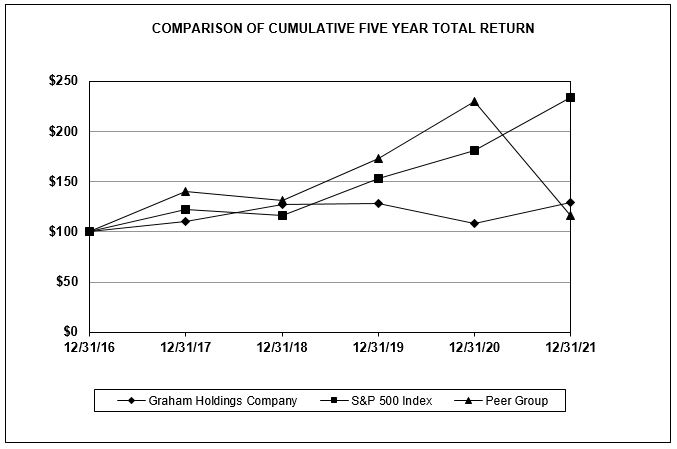

| | December 31 | December 31 | 2016 | | 2017 | | 2018 | | 2019 | | 2020 | | 2021 | December 31 | 2018 | | 2019 | | 2020 | | 2021 | | 2022 | | 2023 |
| Graham Holdings Company | Graham Holdings Company | 100.00 | | | 110.05 | | | 127.41 | | | 128.13 | | | 108.51 | | | 129.40 | |
| S&P 500 Index | S&P 500 Index | 100.00 | | | 121.83 | | | 116.49 | | | 153.17 | | | 181.35 | | | 233.41 | |
| Composite Peer Group | Composite Peer Group | 100.00 | | | 140.02 | | | 131.41 | | | 173.42 | | | 229.65 | | | 116.07 | |
|
Item 6. Reserved.
Item 7. Management’s Discussion and Analysis of Financial Condition and Results of Operations.
See the information contained under the heading “Management’s Discussion and Analysis of Results of Operations and Financial Condition,” which is included in this Annual Report on Form 10-K and listed in the index to financial information on page 4951 hereof.
Item 7A. Quantitative and Qualitative Disclosures About Market Risk.
The Company is exposed to market risk in the normal course of its business due primarily to its ownership of marketable equity securities, which are subject to equity price risk; to its borrowing and cash-management activities, which are subject to interest rate risk; and to its non-U.S. business operations, which are subject to foreign exchange rate risk.
Equity Price Risk. The Company has common stock investments in several publicly traded companies (as discussed in Note 4 to the Company’s Consolidated Financial Statements) that are subject to market price volatility. The fair value of these common stock investments totaled $810.0$690.2 million at December 31, 2021.2023.
Interest Rate Risk. The Company manages the risk associated with interest rate movements through the use of a combination of variable and fixed-rate debt.
At December 31, 2021,2023, the Company had $400 million principal amount of 5.75% unsecured fixed-rate notes due June 1, 2026 (the Notes). At December 31, 2021,2023, the aggregate fair value of the Notes, based upon quoted market prices, was $417.5$400.4 million. There were no earnings or liquidity risks associated with the Company’s Notes. The fair value of the Notes varies with fluctuations in market interest rates. A 100 basis point decrease in market interest rates would increase the fair value of the Notes by $9.5$9.0 million at December 31, 20212023 using a yield to par call.maturity. A 100 basis point increase in market interest rates would decrease the fair value of the Notes by $9.3$8.8 million at December 31, 2021,2023, using a yield to par call.maturity. The Company also had approximately $13$26 million of other fixed-rate debt, primarily relating to the healthcare business (as discussed in Note 11 to the Company’s Consolidated Financial Statements).business.
At December 31, 2021,2023, the Company had approximately $290$538 million of variable-rate debt, including floor plan facility obligations. Approximately $24.6$74.6 million of this debt is hedged by an interest rate swap. The Company is subject to earnings and liquidity risks for changes in the interest rate on the unhedged portion of this debt. A 100 basis point increase in the applicable floating rates for the unhedged portions of our variable-rate debt would increase annual interest expense by approximately $2.6$4.6 million.
Foreign Exchange Rate Risk. The Company is exposed to foreign exchange rate risk primarily at its Kaplan international operations, and the primary exposure relates to the exchange rate between the U.S. dollar and the British pound, the Australian dollar, and the Singapore dollar. In 2021, 20202023, 2022 and 20192021 the Company reported net foreign currency losses of $0.2$1.1 million, $2.2$2.0 million and $1.1$0.2 million, respectively.
If the values of the British pound, the Australian dollar, and the Singapore dollar relative to the U.S. dollar had been 10% lower than the values that prevailed during 2021,2023, the Company’s pre-tax income for 20212023 would have been approximately $13$15 million lower. Conversely, if such values had been 10% higher, the Company’s reported pre-tax income for 20212023 would have been approximately $13$15 million higher.
Item 8. Financial Statements and Supplementary Data.
See the Company’s Consolidated Financial Statements at December 31, 2021,2023, and for the periods then ended, together with the report of PricewaterhouseCoopers LLP thereon, which are included in this Annual Report on Form 10-K and listed in the index to financial information on page 4951 hereof.
Item 9. Changes in and Disagreements With Accountants on Accounting and Financial Disclosure.
Not applicable.
Item 9A. Controls and Procedures.
Evaluation of Disclosure Controls and Procedures
An evaluation was performed by the Company’s management, with the participation of the Company’s Chief Executive Officer (principal executive officer) and the Company’s Chief Financial Officer (principal financial officer), of the effectiveness of the Company’s disclosure controls and procedures (as defined in Exchange Act Rules 13a-15(e) and 15d-15(e)), as of December 31, 2021.2023. Based on that evaluation, the Company’s Chief Executive Officer and Chief Financial Officer have concluded that the Company’s disclosure controls and procedures, as
designed and implemented, are effective in ensuring that information required to be disclosed by the Company in the reports that it files or submits under the Exchange Act is recorded, processed, summarized and reported within the time periods specified in the Securities and Exchange Commission’s rules and forms and is accumulated and communicated to management, including the Chief Executive Officer and Chief Financial Officer, in a manner that allows timely decisions regarding required disclosure.
Management’s Report on Internal Control Over Financial Reporting
Management of Graham Holdings Company is responsible for establishing and maintaining adequate internal control over financial reporting (as defined in Exchange Act Rules 13a-15(f) and 15d-15(f)). The Company’s internal control over financial reporting is designed to provide reasonable assurance regarding the reliability of financial reporting and the preparation of financial statements for external purposes in accordance with generally accepted accounting principles.
The Company’s management assessed the effectiveness of internal control over financial reporting as of December 31, 2021.2023. In making this assessment, management used the criteria set forth in Internal Control -Integrated Framework issued by the Committee of Sponsoring Organizations of the Treadway Commission (COSO) in 2013. Management has concluded that as of December 31, 2021,2023, the Company’s internal control over financial reporting was effective based on these criteria.
As permitted under Securities and Exchange Commission guidelines for newly acquired businesses, management’s assessment of the effectiveness of internal control over financial reporting as of December 31, 2023 excluded the Ourisman Toyota of Richmond dealership, which was acquired by our automotive subsidiary on September 27, 2023. The operating results of this Toyota dealership are included in our consolidated financial statements for the periods subsequent to acquisition and represent less than 1% of total assets and approximately 1% of revenue as of and for the year ended December 31, 2023. This Toyota dealership will be included in management’s assessment of internal control over financial reporting in fiscal year 2024.
The effectiveness of the Company’s internal control over financial reporting as of December 31, 2021,2023, has been audited by PricewaterhouseCoopers LLP, an independent registered public accounting firm, as stated in their report included herein.
Changes in Internal Control Over Financial Reporting
There has been no change in the Company’s internal control over financial reporting during the quarter ended December 31, 2021,2023, that has materially affected, or is reasonably likely to materially affect, the Company’s internal control over financial reporting.
Item 9B. Other Information.
Not applicable.Rule 10b5-1 Trading Plans
For the three months ended December 31, 2023, none of the Company’s directors or officers (as defined in Rule 16a-1(f) of the Exchange Act) adopted, modified or terminated a “Rule 10b5-1 trading arrangement” or “non-Rule 10b5-1 trading arrangement,” as defined in Item 408 of Regulation S-K.
Item 9C. Disclosure Regarding Foreign Jurisdictions that Prevent Inspections.
Not applicable.
PART III
Item 10. Directors, Executive Officers and Corporate Governance.
The information contained under the heading “Executive Officers” in Item 1 hereof and the information contained under the headings “Nominees for Election by Class A Shareholders,” “Nominees for Election by Class B Shareholders,” “Audit Committee” and “Section 16(a) Beneficial Ownership Reporting Compliance” in the definitive Proxy Statement for the Company’s 20222024 Annual Meeting of Stockholders is incorporated herein by reference thereto.
The Company has adopted codes of conduct that constitute “codes of ethics” as that term is defined in paragraph (b) of Item 406 of Regulation S-K and that apply to the Company’s principal executive officer, principal financial officer, principal accounting officer or controller and to any persons performing similar functions. Such codes of conduct are posted on the Company’s website, the address of which is ghco.com, and the Company intends to satisfy the disclosure requirements under Item 5.05 of Form 8-K with respect to certain amendments to, and waivers of the requirements of, the provisions of such codes of conduct applicable to the officers and persons referred to above by posting the required information on its website.
In addition to the certifications of the Company’s Chief Executive Officer and Chief Financial Officer filed as exhibits to this Annual Report on Form 10-K, on May 20, 2021,31, 2023, the Company’s Chief Executive Officer submitted to the New York Stock Exchange the annual certification regarding compliance with the NYSE’s corporate governance listing standards required by Section 303A.12(a) of the NYSE Listed Company Manual.
Item 11. Executive Compensation.
The information contained under the headings “Director Compensation,” “Compensation Committee Interlocks and Insider Participation,” “Executive Compensation” and “Compensation Committee Report” in the definitive Proxy Statement for the Company’s 20222024 Annual Meeting of Stockholders is incorporated herein by reference thereto.
Item 12. Security Ownership of Certain Beneficial Owners and Management and Related Stockholder Matters.
The information contained under the heading “Stock Holdings of Certain Beneficial Owners and Management” in the definitive Proxy Statement for the Company’s 20222024 Annual Meeting of Stockholders is incorporated herein by reference thereto.
Item 13. Certain Relationships and Related Transactions and Director Independence.
The information contained under the headings “Transactions With Related Persons, Promoters and Certain Control Persons” and “Controlled Company” in the definitive Proxy Statement for the Company’s 20222024 Annual Meeting of Stockholders is incorporated herein by reference thereto.
Item 14. Principal Accounting Fees and Services.
The information contained under the heading “Audit Committee Report” in the definitive Proxy Statement for the Company’s 20222024 Annual Meeting of Stockholders is incorporated herein by reference thereto.
PART IV
Item 15. Exhibits and Financial Statement Schedules.
The following documents are filed as part of this report:
1. Financial Statements. As listed in the index to financial information on page 4951 hereof.
2. Exhibits. As listed in the index to exhibits on page 4648 hereof.
Item 16. Form 10-K Summary.
Not applicable.
INDEX TO EXHIBITS
| | | | | | | | |
| Exhibit Number | | Description |
| | |
| 2.1 | | |
| 3.1 | | |
| 3.2 | | |
| 3.3 | | |
| 4.1 | | |
| 4.2 | | First Supplemental Indenture, dated as of March 24, 2020, among Graham Healthcare Group, Inc., a Delaware corporation, a subsidiary of the Company, and The Bank of New York Mellon Trust Company, N.A., as trustee (incorporated(incorporated by reference to Exhibit 4.1 to the Company’s Quarterly Report on Form 10-Q for the quarter ended March 31, 2020). |
| 4.3 | | Second Supplemental Indenture,, dated as of January 6, 2022, among Graham Automotive LLC, a Delaware limited liability company,, a subsidiary of Graham Holdings Company, a Delaware corporation,, and The Bank of New York Mellon Trust Company, N.A., as trusteetrustee (incorporated by reference to Exhibit 4.3 to the Company’s Annual Report on Form 10-K for the fiscal year ended December 31, 2021). |
| 4.4 | | |
| 10.1 | | Amended and Restated Five Year Credit Agreement, dated as of May 30, 2018, among the Company, and the foreign borrowers from time to time party thereto, and certain of its domestic subsidiaries as guarantors, the several lenders from time to time party thereto, Wells Fargo Bank, National Association, as Administrative Agent and JPMorgan Chase Bank, N.A., as Syndication Agent (incorporated by reference to Exhibit 4.2 to the Company’s Quarterly Report on Form 10-Q for the quarter ended June 30, 2018). |
| 10.2 | | First Amendment,, dated as of November 23, 2021, to Amended and Restated Five Year Credit Agreement, dated as of May 30,, 2018, 2018, among the Company, and the foreign borrowers from time to time party thereto, and certain of its domestic subsidiaries as guarantors, the several lenders from time to time party thereto, Wells Fargo Bank, National Association, as Administrative Agent and JPMorgan Chase Bank, N.A., as Syndication Agent.Agent (incorporated by reference to Exhibit 10.2 to the Company’s Annual Report on Form 10-K for the fiscal year ended December 31, 2021). |
| 10.3 | | Second Amended and Restated Five Year Credit Agreement, dated as of May 3, 2022, among the Company, Kaplan U.K. Limited, and the foreign borrowers from time to time party thereto, and certain of its domestic subsidiaries as guarantors, the several lenders from time to time party thereto, Wells Fargo Bank, National Association, as Administrative Agent and JPMorgan Chase Bank, N.A., as Syndication Agent (incorporated by reference to Exhibit 10.1 to the Company’s Quarterly Report on Form 10-Q for the quarter ended March 31, 2022). |
| 10.4 | | First Amendment to Second Amended and Restated Five Year Credit Agreement, dated as of July 28, 2023, among the Company, Kaplan U.K. Limited, and the foreign borrowers from time to time party thereto, and certain of its domestic subsidiaries as guarantors, the several lenders from time to time party thereto, Wells Fargo Bank, National Association, as Administrative Agent and JPMorgan Chase Bank, N.A., as Syndication Agent (incorporated by reference to Exhibit 10.1 to the Company’s Quarterly Report on Form 10-Q for the quarter ended June 30, 2023). |
| 10.5 | | |
| | | | | | | | |
10.4Exhibit Number | | Description |
| | |
| 10.6 | | First Amendment, dated as of July 29, 2019, to the Transition and Operations Support Agreement, dated March 22, 2018, by and among Kaplan Higher Education, LLC, Iowa College Acquisition, LLC and Purdue University Global, Inc. (the “First Amendment”), with The Trustees of Purdue University as a party to the First Amendment solely for the purposes of continuing to be bound by the Purdue Provisions (as defined therein) (incorporated by reference to Exhibit 10.1 to the Company’s Quarterly Report on Form 10-Q for the quarter ended September 30, 2019).+ |
10.510.7 | | |
10.610.8 | | |
10.710.9 | | |
10.810.10 | | |
| | | | | | | | |
Exhibit Number10.11 | | Description |
| | |
10.9 | | |
10.1010.12 | | |
10.1110.13 | | |
| 21 | | |
| 23 | | |
| 24 | | |
| 31.1 | | |
| 31.2 | | |
| 32 | | |
| 97 | | |
| 101.INS | | Inline XBRL Instance Document - the instance document does not appear in the Interactive Data File because its XBRL tags are embedded within the Inline XBRL document |
| 101.SCH | | Inline XBRL Taxonomy Extension Schema Document |
| 101.CAL | | Inline XBRL Taxonomy Extension Calculation Linkbase Document |
| 101.DEF | | Inline XBRL Taxonomy Extension Definition Linkbase Document |
| 101.LAB | | Inline XBRL Taxonomy Extension Label Linkbase Document |
| 101.PRE | | Inline XBRL Taxonomy Extension Presentation Linkbase Document |
| 104 | | Cover Page Interactive Data File, formatted in Inline XBRL and included as Exhibit 101 |
*A management contract or compensatory plan or arrangement required to be included as an exhibit hereto pursuant to Item 15(b) of Form 10-K.
**Graham Holdings Company hereby undertakes to furnish supplementally a copy of any omitted exhibit or schedule to such agreement to the SEC upon request.
+ Select portions of this exhibit have been omitted pursuant to a request for confidential treatment and have been filed separately with the SEC.
SIGNATURES
Pursuant to the requirements of Section 13 or 15(d) of the Securities Exchange Act of 1934, the Registrant has duly caused this report to be signed on its behalf by the undersigned, thereunto duly authorized, on February 25, 2022.23, 2024.
| | | | | | | | |
| | | GRAHAM HOLDINGS COMPANY |
| | | (Registrant) |
| | |
| By | /s/ Wallace R. Cooney |
| | | Wallace R. Cooney |
| | | Chief Financial Officer |
Pursuant to the requirements of the Securities Exchange Act of 1934, this report has been signed below by the following persons on behalf of the Registrant and in the capacities indicated on February 25, 2022:23, 2024:
| | | | | | | | |
| Timothy J. O’Shaughnessy | President, Chief Executive Officer (Principal Executive Officer) and Director | |
| Wallace R. Cooney | Chief Financial Officer (Principal Financial Officer) | |
| Marcel A. Snyman | Principal Accounting Officer | |
| Anne M. Mulcahy | Chair of the Board | |
| Donald E. Graham | Chairman of the BoardEmeritus | |
| Tony Allen | Director | |
| Danielle Conley | Director | |
| Christopher C. Davis | Director | |
| Thomas S. Gayner | Director | |
Anne M. Mulcahy | Director | |
| G. Richard Wagoner, Jr. | Director | |
| Katharine Weymouth | Director | |
| | | | | | | | |
| | By | /s/ Wallace R. Cooney |
| | | Wallace R. Cooney |
| | | Attorney-in-Fact |
An original power of attorney authorizing Timothy J. O’Shaughnessy, Wallace R. Cooney and Nicole M. Maddrey, and each of them, to sign all reports required to be filed by the Registrant pursuant to the Securities Exchange Act of 1934 on behalf of the above-named directors and officers has been filed with the Securities and Exchange Commission.
INDEX TO FINANCIAL INFORMATION
GRAHAM HOLDINGS COMPANY
| | | | | |
| Management’s Discussion and Analysis of Results of Operations and Financial Condition (Unaudited) | |
| |
| |
| Financial Statements: | |
| |
| |
| |
| Report of Independent Registered Public Accounting Firm (PCAOB ID 238) | |
| |
Consolidated Statements of Operations for the Three Years Ended December 31, 20212023 | |
| |
Consolidated Statements of Comprehensive Income (Loss) for the Three Years Ended December 31, 20212023 | |
| |
Consolidated Balance Sheets at December 31, 20212023 and 20202022 | |
| |
Consolidated Statements of Cash Flows for the Three Years Ended December 31, 20212023 | |
| |
Consolidated Statements of Changes in Common Stockholders’ Equity for the Three Years Ended December 31, 20212023 | |
| |
| Notes to Consolidated Financial Statements | |
| |
| Organization and Nature of Operations | |
| Summary of Significant Accounting Policies | |
| Acquisitions and Dispositions of Businesses | |
| Investments | |
| Accounts Receivable, Accounts Payable, Vehicle Floor Plan Payable and Accrued Liabilities | |
Inventories and Contracts in Progress and Vehicle Floor Plan Payable | |
| Property, Plant and Equipment | |
| Leases | |
| Goodwill and Other Intangible Assets | |
| Income Taxes | |
| Debt | |
| Fair Value Measurements | |
| Revenue From Contracts With Customers | |
| Capital Stock, Stock Awards and Stock Options | |
| Pensions and Other Postretirement Plans | |
| Other Non-Operating Income | |
| Accumulated Other Comprehensive Income (Loss) | |
| Contingencies and Other Commitments | |
| Business Segments | |
| Summary of Quarterly Operating Results (Unaudited) | |
| |
| |
All schedules have been omitted either because they are not applicable or because the required information is included in the Consolidated Financial Statements or the notes thereto referred to above.
MANAGEMENT’S DISCUSSION AND ANALYSIS OF RESULTS OF OPERATIONS AND FINANCIAL CONDITION
This analysis should be read in conjunction with the Consolidated Financial Statements and the notes thereto. Refer to Item 7. Management’s Discussion and Analysis of Financial Condition and Results of Operations in the Graham Holdings Company's 2020Company’s 2022 Annual Report on Form 10-K for management’s discussion and analysis of financial condition and results of operations for the year ended December 31, 20202022 compared to the year ended December 31, 2019.2021.
OVERVIEW
Graham Holdings Company (the Company) is a diversified education and mediaholding company whose operations include educational services;services, television broadcasting; online, podcast, printbroadcasting, manufacturing, healthcare and local TV newsautomotive dealerships. The Company has seven reportable segments and other content; social-media advertising services; manufacturing; automotive dealerships; restaurantsa group of companies that make up Other Businesses. The Company’s business units are diverse and entertainment venues; custom framing; home healthsubject to different trends and hospice care; and a consumer internet company. risks.
Education is the largest business, and throughoperating division of the Company, making up 36% of the Company’s consolidated revenues in 2023. Through its subsidiary Kaplan, Inc., the Company provides extensive worldwide education services for individuals, schools and businesses. The Company’s second largest business is television broadcasting. In 2021, the Company completed an acquisition of a consumer internet company. The Company’s business units are diverse and subject to different trends and risks.
The Company’s education division is the largest operating division of the Company, accounting for 43% of the Company’s consolidated revenues in 2021. The Company has devoted significant resources and attention to this division for many years, given its geographic and product diversity;diversity, the investment opportunities and growth prospects during this time;time, and challenges related to government regulation. Kaplan is organized into the following three operating segments: Kaplan International, Kaplan Higher Education (KHE) and Supplemental Education.
Kaplan International reported revenue increasesgrowth for 20212023 due largely to growthincreases at Pathways, Australia, Languages and UK Professional, and Pathways, partially offset by declinesa decline at Languages.Singapore. Kaplan International operating results improvedincreased in 20212023 due to a reduction in losses at Languages and improved results at Australia, Pathways and Languages, partially offset by a decline at UK Professional.
KHEKHE’s revenue grewand operating results increased in 2021,2023 due to an increase in the Purdue University Global (Purdue Global) fee recorded and an increase in revenue from other higher education institutions. KHE recorded $34.8 million and $31.6 million in fees from Purdue Global in its Higher Education operating results in 2021 and 2020, respectively, based on an assessment of its collectability under the Transition and Operations Support Agreement (TOSA).
recorded. Supplemental Education revenues decreaseddeclined in 20212023 due to a decline in retail comprehensivelower demand for graduate and pre-college test preparation programs, while demand and classroom-based course offerings, offset in part by growth in securities, insurance and real estate programs. Supplemental Educationfor professional programs remained stable; operating incomeresults improved in 20212023 due to savings from restructuring activities implemented in 2020.reduced headcount.
Kaplan made two acquisitions in 2021; two acquisitions in 2020; and one acquisition in 2019.
The Company’s second largest business is television broadcasting. The Company’s television broadcasting division reported lower revenues and operating income in 2021,2023, due largely to a significant decreasesreduction in political advertising partially offset by increased local and national advertising revenues, which were adversely impacted in 2020 by reduced demand related to the COVID-19 pandemic, increased retransmission revenues, and increased revenue from summer Olympics-related advertising revenue at the Company’s NBC affiliates.2022 election cycle. Retransmission revenues, net of network fee expense, trended down modestly in 2023 with this trend expected to continue in the future due largely to adverse subscriber trends from cord cutting. In recent years, the television broadcasting division has consistently generated significantly higher operating income amounts and operating income margins than the education division and the Company’s other businesses.reporting segments.
The Company’s manufacturing division has provided meaningful operating cash flow over the last few years, despite reducedalthough revenues and operating results at Dekko have been adversely impacted by lower product demand, due toparticularly in the COVID-19 pandemic at certain businesses. The Company’s healthcare businesscommercial office electrical products sector. Graham Healthcare Group (GHG) has grown substantially over the last few years due toand provided meaningful operating cash flow from acquisitions and internal growthgrowth. GHG has expanded from its home health and acquisitions, with a meaningful increase in operating results in the past two years.
With the recent acquisitions of Leaf, Framebridge, three automotive dealerships and Clyde’s Restaurant Group, and recent acquisitions at healthcare and manufacturing, the Company has invested inhospice operations into new lines of business, largely from significant growth at CSI Pharmacy Holding Company, LLC (CSI), which provides nursing care and prescription services for patients receiving in-home infusion treatments. Automotive revenues, operating income and operating cash flow grew in 2023 due to acquisitions, internal growth and a favorable operating environment.
The Company’s other businesses include several investment stage businesses as well as investments into new lines of business over the last few years. In total, there are ten operating business units that make up this group in three categories: retail, media and specialty. The largest of these businesses from a revenue standpoint is Clyde’s Restaurant Group (CRG), followed by the combined three former Leaf businesses, and then Framebridge, a custom framing service company. In 2023, CRG, Slate and Foreign Policy each reported positive operating income, while the other businesses each reported operating losses, which were significant at the combined three former Leaf businesses and Framebridge.
The Company generates a significant amount of cash from its businesses that is used to support its operations, pay down debt and fund capital expenditures, share repurchases, dividends, acquisitions and other investments.
RESULTS OF OPERATIONS
Net income attributable to common shares was $352.1$205.3 million ($70.4543.82 per share) for the year ended December 31, 2021,2023, compared to $300.4$67.1 million ($58.1313.79 per share) for the year ended December 31, 2020.2022.
The COVID-19 pandemic and measures taken to prevent its spread significantly impacted the Company’s results for 2020 and 2021, largely from reduced demand for the Company’s products and services. This significant adverse impact is expected to continue into 2022, although at a reduced level. The Company’s management has taken a variety of measures to reduce costs and to implement changes to business operations. The Company cannot predict the severity or duration of the pandemic, the extent to which demand for the Company’s products and services will be adversely affected or the degree to which financial and operating results will be negatively impacted.
Items included in the Company’s net income for 20212023 are listed below:
•a $3.9$7.0 million net credit related to fair value changes in contingent consideration from prior acquisitions ($0.78(after-tax impact of $6.5 million, or $1.38 per share);
•a $1.0 million reduction to operating expenses from property, plant and equipment gains in connection with the spectrum repacking mandate of the Federal Communications Commission (FCC) (after-tax impact of $0.8 million, or $0.16 per share);
•$31.699.1 million in goodwill and other long-lived asset impairment charges (after-tax impact of $26.0$88.9 million, or $5.19$18.97 per share);
•$12.69.9 million in expenses related to non-operating Separation Incentive Programs (SIPs) at other businesses and the education and television broadcasting divisions (after-tax impact of $7.3 million, or $1.57 per share);
•$138.1 million in net earningsgains on marketable equity securities (after-tax impact of $102.7 million, or $21.93 per share);
•$16.0 million in net losses of affiliates whose operations are not managed by the Company (after-tax impact of $9.3$11.9 million, or $1.86$2.53 per share);
•a non-operating gain of $10.0 million on the sale of Pinna (after-tax impact of $7.4 million, or $1.59 per share);
•Non-operating gains, net, of $3.4 million from write-ups, sales and impairments of cost method investments (after-tax impact of $2.5 million, or $0.54 per share);
•a $4.6 million credit to interest expense resulting from gains realized related to the termination of interest rate swaps (after-tax impact of $3.3 million, or $0.72 per share); and
•$4.110.1 million in interest expense to adjust the fair value of the mandatorily redeemable noncontrolling interest (after-tax impact of $4.0$9.6 million, or $0.80 per share);
•$1.1 million in expenses related to a non-operating Separation Incentive Program (SIP) at manufacturing (after-tax impact of $0.8 million, or $0.16 per share);
•$243.1 million in net gains on marketable equity securities (after-tax impact of $179.7 million, or $35.96 per share);
•Non-operating gains, net, of $13.6 million from write-ups, sales and impairments of cost and equity method investments (after-tax impact of $10.1 million, or $2.02 per share);
•$0.2 million in non-operating foreign currency losses (after-tax impact of $0.1 million, or $0.03 per share); and
•a $17.2 million deferred tax benefit arising from a change in the estimated deferred state income tax rate related to the Company’s pension and other postretirement plans ($3.45$2.05 per share).
Items included in the Company’s net income for 20202022 are listed below:
•a $6.1 million net credit related to fair value changes in contingent consideration from prior acquisitions (after-tax impact of $6.1 million or $1.25 per share);
◦$27.9129.0 million in goodwill and other long-lived asset impairment charges (after-tax impact of $20.2$117.0 million, or $3.92$24.06 per share); recorded in the fourth quarter;
•◦$16.13.6 million in restructuring chargesexpenses related to a non-operating SIP at the education division (after-tax impact of $11.9$2.7 million, or $2.31$0.56 per share) recorded in the fourth quarter;
◦$139.6 million in net losses on marketable equity securities (after-tax impact of $102.8 million, or $21.14 per share);
•◦$5.7 million in accelerated depreciation at other businesses (after-tax impact of $4.1 million, or $0.80 per share);
•a $2.9 million reduction to operating expenses from property, plant and equipment gains in connection with the spectrum repacking mandate of the FCC (after-tax impact of $2.3 million, or $0.44 per share);
•$2.111.8 million in net losses of affiliates whose operations are not managed by the Company (after-tax impact of $1.6$8.7 million, or $0.31$1.79 per share);
•a fourth quarter gain of $18.4 million on the sale of CyberVista (after-tax impact of $13.5 million, or $2.78 per share);
•Non-operating gains, net, of $9.5 million from write-ups, sales and impairments of cost and equity method investments (after-tax impact of $7.1 million, or $1.45 per share); and
◦$8.516.5 million in interest expense in the fourth quarter to adjust the fair value of the mandatorily redeemable noncontrolling interest ($1.64 per share);
•$11.5 million in expenses related to non-operating SIP activity at the education division and other businesses (after-tax impact of $8.5$15.4 million, or $1.64 per share);
•$60.8 million in net gains on marketable equity securities (after-tax impact of $44.7 million, or $8.64 per share);
•a fourth quarter gain of $209.8 million on the sale of Megaphone (after-tax impact of $154.2 million, or $29.84 per share);
•Non-operating losses, net, of $1.5 million from impairments, sales and write-ups of cost and equity method investments (after-tax impact of $1.1 million, or $0.21 per share);
•$2.2 million in non-operating foreign currency losses (after-tax impact of $1.6 million, or $0.31 per share); and
•$2.9 million in income tax expense related to stock compensation ($0.56$3.17 per share).
Revenue for 20212023 was $3,186.0$4,414.9 million, up 10%12% from $2,889.1$3,924.5 million in 2020.2022. Revenues increased at education, manufacturing, healthcare automotive and other businesses,automotive, partially offset by a decreasedeclines at television broadcasting.broadcasting, manufacturing and other businesses. Operating costs and expenses for the year increased to $3,108.6$4,345.5 million in 2021,2023, from $2,788.7$3,840.6 million in 2020.2022. Expenses in 20212023 increased across all divisions.at education, television broadcasting, manufacturing, healthcare and automotive, partially offset by a decrease at other businesses. The Company reported operating income for 20212023 of $77.4$69.4 million, compared to $100.4$83.9 million in 2020. Operating2022. The decrease in operating results declinedis due to goodwill impairment charges at World of Good Brands (WGB, formerly Leaf Media) and Dekko and declines at television broadcasting and manufacturing, partially offset by improvementsincreases at education, healthcare and automotive.automotive, and reduced losses at other businesses due to goodwill and other long-lived asset impairment charges in 2022 at Society6 and Saatchi Art (both formerly included in Leaf Marketplace).
Division Results
Education
Education division revenue in 20212023 totaled $1,361.2$1,587.6 million, up 4%11% from $1,305.7$1,427.9 million in 2020.2022. Kaplan reported operating income of $50.6$104.5 million for 2021,2023, an increase from $11.6$82.9 million in 2020. The COVID-19 pandemic adversely impacted Kaplan’s operating results beginning in February 2020 and continued through 2021.2022.
Kaplan serves a large number of students who travel to other countries to study a second language, prepare for licensure, or pursue a higher education degree. Government-imposed travel restrictions and school closures arising from COVID-19 had a significant negative impact on the ability of international students to travel and attend Kaplan’s programs, particularly Kaplan International’s Language programs. In addition, most licensing bodies and administrators of standardized exams postponed or canceled scheduled examinations due to COVID-19, resulting in a significant number of students deciding to defer their studies, negatively impacting Kaplan’s exam preparation education businesses. Overall, if COVID-19 restrictions persist, then Kaplan’s revenues and operating results in 2022 could be adversely impacted, particularly at Kaplan International Languages.
To help mitigate the adverse impact of COVID-19, Kaplan implemented a number of cost reduction and restructuring activities across its businesses. Related to these restructuring activities, for 2021, Kaplan recorded $3.3 million in lease impairment charges (including $1.9 million in property, plant and equipment write-downs). In 2020, Kaplan recorded $13.5 million in lease restructuring costs (including $3.6 million of accelerated depreciation expense) and $6.2 million in severance restructuring costs. Kaplan also recorded $12.3 million in lease impairment charges in connection with these plans in 2020 (including $2.2 million in property, plant and equipment write-downs). Further, Kaplan recorded $12.8 million in non-operating pension expense in 2020 related to workforce reductions completed in the second and third quarters.
In 2020, Kaplan also accelerated the development and promotion of various online programs and solutions, rapidly transitioned most of its classroom-based programs online and addressed the individual needs of its students and partners, substantially reducing the disruption from COVID-19 while simultaneously adding important new product offerings and operating capabilities. Further, in the fourth quarter of 2020,2023, Kaplan combinedmodified its three primary divisions based in the United States (Kaplan Test Prep,segment reporting for Kaplan Professional, and Kaplan Higher Education) into one business known as Kaplan North America (KNA). This combination was designed to enhance Kaplan’s competitiveness by better leveraging its diversified academic and professional portfolio, as well as its relationships with students, universities and businesses. For financial reporting purposes, KNA is reported in two segments:India, a shared services center that supports Higher Education (previously included in Kaplan corporate and Supplemental Education (combining Kaplan Test Prep and Kaplan Professional (U.S.) into one reporting segment).other); prior periods have been reclassified to conform with the current presentation.
A summary of Kaplan’s operating results is as follows:
| | | | | | | | | | | | | | | | | |
| Year Ended December 31 | | |
| (in thousands) | 2021 | | 2020 | | % Change |
| Revenue | | | | | |
| Kaplan international | $ | 726,875 | | | $ | 653,892 | | | 11 | |
| Higher education | 317,854 | | | 316,095 | | | 1 | |
| Supplemental education | 309,069 | | | 327,087 | | | (6) | |
| Kaplan corporate and other | 14,759 | | | 12,643 | | | 17 | |
| Intersegment elimination | (7,312) | | | (4,004) | | | — | |
| | $ | 1,361,245 | | | $ | 1,305,713 | | | 4 | |
| Operating Income (Loss) | | | | | |
| Kaplan international | $ | 33,457 | | | $ | 15,248 | | | — | |
| Higher education | 24,134 | | | 24,364 | | | (1) | |
| Supplemental education | 36,919 | | | 19,705 | | | 87 | |
| Kaplan corporate and other | (24,715) | | | (18,266) | | | (35) | |
| Amortization of intangible assets | (16,001) | | | (17,174) | | | 7 | |
| Impairment of long-lived assets | (3,318) | | | (12,278) | | | 73 | |
| Intersegment elimination | 97 | | | 5 | | | — | |
| | $ | 50,573 | | | $ | 11,604 | | | — | |
| | | | | | | | | | | | | | | | | |
| Year Ended December 31 | | |
| (in thousands) | 2023 | | 2022 | | % Change |
| Revenue | | | | | |
| Kaplan international | $ | 966,879 | | | $ | 816,239 | | | 18 | |
| Higher education | 326,961 | | | 310,407 | | | 5 | |
| Supplemental education | 292,776 | | | 301,625 | | | (3) | |
| Kaplan corporate and other | 11,012 | | | 9,853 | | | 12 | |
| Intersegment elimination | (10,047) | | | (10,209) | | | — | |
| | $ | 1,587,581 | | | $ | 1,427,915 | | | 11 | |
| Operating Income (Loss) | | | | | |
| Kaplan international | $ | 87,530 | | | $ | 72,066 | | | 21 | |
| Higher education | 38,942 | | | 24,819 | | | 57 | |
| Supplemental education | 22,472 | | | 21,069 | | | 7 | |
| Kaplan corporate and other | (29,891) | | | (18,806) | | | (59) | |
| Amortization of intangible assets | (14,076) | | | (16,170) | | | 13 | |
| Impairment of long-lived assets | (477) | | | — | | | — | |
| Intersegment elimination | (29) | | | (45) | | | — | |
| | $ | 104,471 | | | $ | 82,933 | | | 26 | |
Kaplan International includes postsecondary education, professional training and language training businesses largely outside the United States. Kaplan International revenue increased 11%18% in 2021 (5%2023 (18% on a constant currency basis). TheThe increase in 2023 is due largely to growth at Pathways, Australia, Languages and UK Professional, and Pathways, partially offset by declinesa decline at Languages.Singapore. Kaplan International reported operating income of $33.5$87.5 million in 2021,2023, compared to $15.2$72.1 million in 2020. The2022. The increase in operating results is due largely to a reduction in losses at Languages and improved results at Australia, Pathways and Languages, partially offset by a decline at UK Professional. Overall, Kaplan International’s operating results were negatively impacted by $43 million and $55 million in losses, respectively, incurred at Languages from continued significant COVID-19 disruptions in 2021 and 2020. In addition, Kaplan International’s 2020 results include $4.5 million of lease restructuring costs (including $1.6 million in accelerated depreciation expense) and $4.4 million of severance restructuring costs. If a continuation of travel restrictions imposed as a result of COVID-19 persists, Kaplan expects the disruption of its Languages business operating environment to continue into 2022.
Higher Education primarily includes the results of Kaplan as a service provider to higher education institutions. In 2021, Higher Education revenue increased 1%5% in 2023 due largely to an increase in the Purdue Global fee recorded and an increase in revenue from other higher education institutions.recorded. In 20212023 and 2020,2022, Kaplan recorded a portion of the fee with Purdue Global based on an assessment of its collectability under the TOSA. Enrollments at Purdue Global for 2023 finished 4% higher compared with the end of 2022. The Company will continue to assess the collectability of the fee with Purdue Global on a quarterly basis to make a determination as to whether to record all or part of the fee in the future and whether to make adjustments to fee amounts recognized in earlier periods. During 20212023 and 2020,2022, Kaplan recorded $34.8$50.3 million and $31.6$38.9 million, respectively, in fees from Purdue Global in its Higher Education operating results. Kaplan HigherHigher Education recorded $3.6 millionresults improved in lease restructuring costs2023 due to an increase in 2020, of which $0.2 million was accelerated depreciation expense.the Purdue Global fee recorded and improved results from other higher education development programs.
Supplemental Education includes Kaplan’s standardized test preparation programs and domestic professional and other continuing education businesses. In November 2021, Supplemental Education acquired two small businesses. Supplemental Education revenue decreased 6%revenue declined 3% in 2021 due to a decline2023, driven mostly by softness in retail comprehensiveReal Estate, Securities and Medical Licensure test preparation, demand and classroom-based course offerings, offset in part by growth in securities, insuranceCFP, CFA, Architecture and real estate programs. Operating results increased 87%Engineering and MCAT test preparation and publishing activities. Overall, demand for graduate and pre-college test preparation programs has declined due to the strength of U.S. employment markets and the decline in 2021test takers, while demand for professional programs remained stable. Operating results improved in 2023 due to savings from restructuring activitiesreduced headcount, partially offset by lower revenues.
In the fourth quarter of 2022, Kaplan implemented in 2020,a SIP to reduce the number of employees at Supplemental Education and $5.4 million of lease restructuring costs ($1.8 million ofHigher Education, which was accelerated depreciation) and $1.8funded by the assets of the Company’s pension plan. In connection with the SIP, the Company recorded $3.6 million in severance restructuring costs incurrednon-operating pension expense in 2020.the fourth quarter of 2022.
Kaplan corporate and other represents unallocated expenses of Kaplan, Inc.’s corporate office, other minor businesses and certain shared activities. Overall, Kaplan corporate and other expenses increased in 20212023 due to normalization ofhigher incentive compensation costs compared to 2020, which included salary abatements and reduced incentive compensation accruals.2022.
Television Broadcasting
A summary of television broadcasting’s operating results is as follows:
| | | |
| | | | | | | Year Ended December 31 | | | | | | | Year Ended December 31 | | |
| (in thousands) | (in thousands) | | 2021 | | 2020 | | % Change | (in thousands) | | | | | | | 2023 | | 2022 | | % Change |
| Revenue | Revenue | | $ | 494,177 | | | $ | 525,212 | | | (6) | |
| Operating Income | Operating Income | | 149,422 | | | 194,498 | | | (23) | |
Graham Media Group, Inc. (GMG) owns seven television stations located in Houston, TX; Detroit, MI; Orlando, FL; San Antonio, TX; Jacksonville, FL; and Roanoke, VA, as well as SocialNewsDesk, a provider of social media management tools designed to connect newsrooms with their users. Revenue at the television broadcasting division decreased 6%12% to $494.2$472.4 million in 2021,2023, from $525.2$535.7 million in 2020.2022. The revenue decreasedecline is due primarily to an $89.0a $57.8 million decline in political advertising revenue. The revenue partially offset by increased localdecline is also due to winter Olympics and national advertising revenues, which were adversely impacted in 2020 by reduced demand related to the COVID-19 pandemic, a $12.3 million increase in retransmission revenues, and increased revenue from summer Olympics-relatedSuper Bowl advertising revenue at the Company’s NBC affiliates. The increase in local and national television advertising was from growthaffiliates in the home products, health and fitness, and sports betting categories. In 2021 and 2020, the television broadcasting division recorded $1.0 million and $2.9 million, respectively,first quarter of 2022, as well as a small decline in reductionsretransmission revenues. Operating income for 2023 declined 34% to operating expenses related to property, plant and equipment gains due to new equipment received at no cost in connection with the spectrum repacking mandate of the FCC. Operating income for 2021 was down 23% to $149.4$133.9 million, from $194.5$201.9 million in 2020,2022, due to reduced revenues and higher network fees. WhileWhile per subscriber rates from cable, satellite and satelliteOTT providers have grown, overall cable and satellite subscribers are down due to cord cutting, resulting in low growth in retransmission revenue net of network fees in 2021, which2023 to be down modestly compared with 2022, and this trend is expected toto continue in the future.
Operating margin at the television broadcasting division was 30%28% in 20212023 and 37%38% in 2020.2022.
Graham Media Group’s broadcastGMG's media hubs continued to sustain their competitiveness among local news stations remained well-positioned and competitive in their markets, despite overall viewing declines from a heightened 2020. On average forrespective markets. In the year,traditional broadcasting space, KSAT in San Antonio and WJXT in Jacksonville once again ranked number onewrapped up the year with top-rated news broadcasts at 6 a.m., 6 p.m., and late evenings within the crucial 25-54 demographic. Throughout 2023, KPRC in Houston secured a strong second-place position in morning, evening, and late newscasts. Similarly, WDIV in Detroit achieved the top-rated news broadcast at 6 p.m. and secured a second-place finish in both 6 a.m. and 11 p.m. newscasts. At 11 p.m., WKMG delivered its most competitive performance among their key newscasts, securing a third-place finish. Additionally, the 6 a.m. and 6 p.m. newscasts claimed the fourth position in the keyOrlando market. In Roanoke, WSLS delivered a third-place finish at 6 a.m., 6 p.m. and late newscasts among11 p.m. On the all-important 25 to 54 demographic. WDIVdigital front, GMG's streaming platforms reported sustained growth in Detroit endedlive stream hours watched. GMG's Insider membership registrations maintained an upward trajectory, and the year as a dominant number one at 6 p.m. and in late news, while number two in the mornings. KPRC wrapped up 2021 as a solid number two in evening and late newscasts, third at
6 a.m. with minimal separation from competitors. WKMG grew market position in morning and late news, finishing number two while remaining third at 6 p.m. WSLS remained third in key newscasts for the year, while syndication remained a strength for WCWJ in daytime and early fringe. Our local station’s websites finishedmedia sites concluded another year as the number oneleading local media sitesplatforms in their respective markets.
Manufacturing
A summary of manufacturing’s operating results is as follows:
| | | |
| | | | | | | Year Ended December 31 | | | | | | | Year Ended December 31 | | |
| (in thousands) | (in thousands) | | 2021 | | 2020 | | % Change | (in thousands) | | | | | | | 2023 | | 2022 | | % Change |
| Revenue | Revenue | | $ | 458,125 | | | $ | 416,137 | | | 10 | |
| Operating (Loss) Income | Operating (Loss) Income | | (16,048) | | | 12,328 | | | — | |
Manufacturing includes four businesses: Hoover, a supplier of pressure impregnated kiln-dried lumber and plywood products for fire retardant and preservative applications; Dekko, a manufacturer of electrical workspace solutions, architectural lighting and electrical components and assemblies; Joyce/Dayton, a manufacturer of screw jacks and other linear motion systems; and Forney, a global supplier of products and systems that control and monitor combustion processes in electric utility and industrial applications.
Manufacturing revenues increased 10%decreased 8% in 20212023 due to significantlylower revenues at Hoover and Dekko, partially offset by increased revenues at Joyce and Forney. The revenue decline in 2023 at Hoover from substantially higheris due to lower wood prices and a decrease in 2021 and increased revenues at Joyce/Dayton,overall product demand, partially offset by lower revenues at Forney and declinesincreased rates. Revenues declined at Dekko fromdue largely to lower product demand, particularly in the commercial office electrical products and hospitality sectors. Wood prices have been highly volatile in 2021 and 2020; overall,sector. Overall, Hoover results includeincluded wood gains on inventory sales in 20212023 and 2020 from generally increasing wood prices during these years. Manufacturing2022, with gains in 2023 higher than the prior year. Manufacturing operating results declined in 20212023 due primarily to $28.0a $47.8 million in goodwill and other long-lived asset impairment charges; $26.7 million of this charge was recorded at Dekko, in the third quarter of 2021, due toresulting from continued sustained weakness in demand for certain Dekko power and data products, relatedprimarily in the commercial office sector. Excluding the impairment charge at Dekko, manufacturing results were down in 2023, due to declines at Dekko, partially offset by improved results at Hoover, Joyce and Forney. Excluding the COVID-19 pandemic, increases in laborimpact of wood gains and commodity costs and related supply chain challenges. Excluding these impairment charges, manufacturinglosses, Hoover results were down modestly in 2021 due to declines at Dekko and Forney, partially offset by overall improved results at Hoover. The Company’s manufacturing businesses are operating in a highly competitive market for production labor, resulting in substantial wage increases and higher labor costs in 2021.2023.
In the second quarter of 2021, Dekko announced a plan to relocate its manufacturing operations in Shelton, CT to other Dekko manufacturing facilities, which was substantially completed by the end of 2021. In connection with this activity, Dekko implemented a SIP for the affected employees, resulting in $1.1 million in non-operating SIP expense recorded in the second quarter of 2021, to be funded by the assets of the Company's pension plan.
Healthcare
A summary of healthcare’s operating results is as follows:
| | | |
| | | | | | | Year Ended December 31 | | | | | | | Year Ended December 31 | | |
| (in thousands) | (in thousands) | | 2021 | | 2020 | | % Change | (in thousands) | | | | | | | 2023 | | 2022 | | % Change |
| Revenue | Revenue | | $ | 223,030 | | | $ | 198,196 | | | 13 | |
| Operating Income | Operating Income | | 26,806 | | | 26,107 | | | 3 | |
The Graham Healthcare Group (GHG)GHG provides home health and hospice services in fourseven states. In December 2021, GHG acquired two small businesses, one of which expanded GHG’s home health operations into Florida. GHGalso provides other healthcare services, including nursing care and prescription services for patients receiving in-home infusion treatments through its 75%86.7% interest in CSI Pharmacy Holding Company, LLC (CSI).CSI. In May 2022, GHG acquired two small businesses, one of which expanded GHG’s home health operations into Kansas and Missouri. In July 2022, GHG acquired a 100% interest in a multi-state provider of Applied Behavior Analysis clinics and in August 2022, GHG acquired two small businesses, which expanded GHG’s hospice services into Missouri and Ohio. Healthcare revenues increased 13%41% in 2021,2023, largely due to significant growth at CSI and from businesses acquired in 2022, along with growth in home health and hospice services.
In January 2022, GHG implemented a pension credit retention program in order to improve employee retention and utilize the Company’s surplus pension assets. The increaseGHG program offers a pension credit up to $50,000 per employee, cliff vested after three years of continuous employment for certain existing employees and new employees. GHG recorded pension expense of $13.5 million and $10.5 million related to this program in 2023 and 2022, respectively.
The improvement in GHG operating results in 20212023 is due largely to improved results fromat CSI and in home health services, partiallyand hospice, partly offset by a decline in resultsincreased net losses from hospice services. GHG is operating in a highly competitive market for nurses and clinical staffing, resulting in substantial compensation increases in 2021. In certain cases, this challenging competitive market has adversely impacted GHG’s ability to meet existing customer demand.newly acquired businesses.
In the second quarter of 2020, GHG received $7.4 million from the Federal Coronavirus Aid, Relief, and Economic Security Act (CARES Act) Provider Relief Fund. GHG did not apply for these funds; they were disbursed to GHG as a Medicare provider under the CARES Act. Under the Department of Health and Human Services guidelines, these funds may be used to offset revenue reductions and expenses incurred in connection with the COVID-19 pandemic. Of this amount, GHG recorded $5.7 million in revenue in the second and third quarters of 2020, to partially offset the impact of revenue reductions due to the COVID-19 pandemic from the curtailment of elective procedures by health systems and other factors. The remaining amount of $1.7 million was recorded as a credit to operating costs in the
second quarter of 2020 to partially offset the impact of costs incurred to procure personal protective equipment for GHG employees and other COVID-19 related costs.
The Company also holds interests in four home health and hospice joint ventures managed by GHG, whose results are included in equity in earnings of affiliates in the Company’s Consolidated Statements of Operations. In 20212023 and 2020,2022, the Company recorded equity in earnings of $10.2 $9.9 million and $9.7$8.1 million, respectively, from these joint ventures. During the first quarter of 2022, GHG, through its Residential Home Health Illinois and Residential Hospice Illinois affiliates, acquired an interest in the home health and hospice assets of NorthShore University HealthSystem, an integrated healthcare delivery system serving patients throughout the Chicago, IL area. The transaction resulted in a decrease to GHG’s interest in Residential Hospice Illinois and a $0.6 million non-operating gain was recorded in the first quarter of 2022 related to the change in interest.
Automotive
A summary of automotive’s operating results is as follows:
| | | |
| | | | | | | Year Ended December 31 | | | | | | | Year Ended December 31 | | |
| (in thousands) | (in thousands) | | 2021 | | 2020 | | % Change | (in thousands) | | | | | | | 2023 | | 2022 | | % Change |
| Revenue | Revenue | | $ | 327,069 | | | $ | 258,144 | | | 27 | |
| Operating Income (Loss) | | 11,771 | | | (6,196) | | | — | |
| Operating Income | |
Automotive includes foureight automotive dealerships in the Washington, D.C. metropolitan area:area and Richmond, VA: Ourisman Lexus of Rockville, Ourisman Honda of Tysons Corner, Ourisman Jeep Bethesda, and Ourisman Ford of Manassas. On December 28, 2021, the CompanyManassas, and Toyota of Woodbridge and Ourisman Chrysler-Dodge-Jeep-Ram (CDJR) of Woodbridge, which were acquired Ford of Manassas located in Manassas, VAon July 5, 2022 from the BattlefieldLustine Automotive Group.Group, and Ourisman Toyota of Richmond, which was acquired on September 27, 2023 from McGeorge Toyota. The automotive group was awarded a Kia Open Point dealership in Bethesda, MD which commenced operations at the end of December 2023. Christopher J. Ourisman, a member of the Ourisman Automotive Group family of dealerships, and his team of industry professionals operates and manages the dealerships; the Company holds a 90% stake.
Revenues for 20212023 increased 27%47% due to the acquisitions of the Toyota of Woodbridge, CDJR of Woodbridge and Toyota of Richmond dealerships and sales growth at each the other dealerships, except for the Jeep dealership, which had lower revenues due to a decline in new vehicle sales. Additionally, all of the three legacy dealerships due partly to significantly reduced demandreported sales growth for salesservices and serviceparts in the first half of 2020 at the onset of the COVID-19 pandemic in March 2020, and higher average new and used car selling prices as a result of strong consumer demand and inventory shortages related to supply chain disruptions and production delays at vehicle manufacturers. In the first quarter of 2020, the Company’s automotive dealerships recorded a $6.7 million intangible asset impairment charge as a result of the pandemic and the related recessionary conditions. 2023. Operating results for 20212023 improved significantly fromdue largely to the prior yearToyota of Woodbridge, CDJR of Woodbridge and Toyota of Richmond acquisitions, and improved results at the Honda and Lexus dealerships, partially offset by declines at the Jeep dealership due primarily to increaseda reduction in new vehicle sales and related margins, and declines at the Ford dealership in addition to the impairment charge recorded in the first quarter of 2020.margins on new vehicle sales.
Other Businesses
A summary of revenue by category for other businesses:
| | | | | | | | | | | | | | | | | |
| Year Ended December 31 | | |
| (in thousands) | 2023 | | 2022 | | % Change |
| Operating Revenues | | | | | |
Retail (1) | $ | 124,323 | | | $ | 163,570 | | | (24) | |
Media (2) | 106,236 | | | 126,095 | | | (16) | |
Specialty (3) | 139,094 | | | 126,419 | | | 10 | |
| $ | 369,653 | | | $ | 416,084 | | | (11) | |
____________ | | | | | |
| (1) | Includes Society6 and Saatchi Art (formerly Leaf Marketplace) and Framebridge |
| (2) | Includes WGB (formerly Leaf Media), Code3, Slate, Foreign Policy, Pinna and City Cast |
| (3) | Includes CRG, Decile and CyberVista |
Overall, revenue from other businesses declined 11% in 2023. Retail revenue declined largely due to significantly lower revenue at Society6, partially offset by revenue growth at Framebridge. Media revenue declined due to lower revenue at WGB and Code3, partially offset by revenue growth at Slate, Foreign Policy and City Cast. Specialty revenue increased due to revenue growth at CRG. Excluding the former Leaf businesses, revenues from other businesses increased in 2023.
Overall, operating results at other businesses improved in 2023 due largely to $129.0 million in goodwill and other long-lived assets impairment charges at the former Leaf businesses recorded in the fourth quarter of 2022, partially offset by a $50.2 million goodwill impairment charge recorded at WGB in the third quarter of 2023. Excluding these impairment charges, operating results declined in 2023, due to increased losses at the former Leaf businesses, Framebridge, Decile and City Cast, partially offset by improved results at Slate, Foreign Policy, CRG and Code3, and a reduction in losses due to the sales of CyberVista and Pinna.
Leaf Group
On June 14, 2021, the Company closed on the acquisition of all outstanding shares of common stock ofacquired Leaf Group Ltd. (Leaf) at $8.50 per share in an all cash transaction valued at approximately $322 million. Leaf Group,, a consumer internet company, headquartered in Santa Monica, CA, is a consumer internet company that builds enduring, creator-driven brands that reach passionate audiences in large and growing lifestyle categories, including fitness and wellness (Well+Good Livestrong.com and MyPlate App)Livestrong.com), and home, art and design (Saatchi Art, Society6 and Hunker).
TheIn the second quarter of 2023, the Company restructured Leaf operating results for the period June 14, 2021 to December 31, 2021 areinto three stand-alone businesses: Society6 (formerly included in other businesses. Leaf has three major operating divisions: Society6 Group andMarketplace), Saatchi Art Group (Marketplace businesses)(formerly included in Leaf Marketplace) and WGB (formerly Leaf Media). The transition process for this restructuring involves various cost reduction initiatives, including elimination of shared services costs and functions; transitioning financial and human resources systems; and rationalizing physical facilities and data centers. In the first and second quarters of 2023, Leaf implemented a SIP to reduce the number of employees, which was funded by the assets of the Company’s pension plan; $2.9 million and $3.9 million in related non-operating pension expense was recorded in the first and second quarters of 2023, respectively. Each of Society6, Saatchi Art and WGB is continuing with the transition and cost reduction process, which is expected to be largely completed by the end of the second quarter of 2024.
Revenues at each of the three Leaf businesses declined in 2023, with substantial declines at Society6 and WGB. Revenue decreases at Society6 are due to declines in traffic, conversion rates and related sales for both direct to consumer and business to business categories; revenue declines at WGB are due to reduced traffic and the Media Group.soft digital advertising market for both direct and programmatic categories. Overall, the former Leaf businesses reported ansignificant operating losslosses for 2023 and 2022. Excluding impairment charges, losses increased in 2023.
As a result of the second halfsubstantial digital advertising revenue declines and continued significant operating losses at WGB, the Company recorded a $50.2 million goodwill impairment charge in the third quarter of 2021.2023. As a result of the substantial revenue declines and significant operating losses at the former Leaf businesses in the fourth quarter of 2022, the Company recorded $129.0 million in goodwill and intangible asset impairment charges.
Clyde’s Restaurant Group
Clyde’s Restaurant Group (CRG)CRG owns and operates eleven12 restaurants and entertainment venues in the Washington, D.C. metropolitan area, including Old Ebbitt Grill and The Hamilton. As a result of the COVID-19 pandemic, CRG temporarily closed all of its restaurants and venues in March 2020 through mid-June 2020, pursuant to government orders, maintaining limited operations for delivery and pickup. CRG recorded a $9.7 million goodwill and intangible assets impairment charge in the first quarter of 2020. In June 2020, CRG made the decision to close its restaurant and entertainment venue in Columbia, MD effective July 19, 2020, resulting in accelerated depreciation of property, plant and equipment totaling $5.7 million recorded in the second and third quarters of 2020. In December 2020, CRG temporarily closed its restaurant dining rooms in Maryland and the District of Columbia for the second time, reopening again for limited indoor dining service in mid-February 2021. Dining restrictions from government orders were substantially lifted for all of CRG’s operations by the end of the second quarter of 2021.
Overall, CRG incurred significant operating losses in 2021 and 2020 due to limited revenues and costs incurred to maintain its facilities and support its employees; however, the losses incurred in 2021 were significantly lower than the losses in 2020. While CRG operations have been adversely impacted as a result of the pandemic, bothBoth revenues and operating results improved substantially in 2021 as2023 due to strong guest traffic, modest price increases, and the year progressed.absence of any significant adverse impact from the COVID-19 pandemic. Operating results in 2022 benefited from a favorable rent concession recorded in the second quarter of 2022.
CRG plans to open new restaurants in Baltimore, MD; Washington, D.C.; and Reston, VA in mid 2024, late 2024 and late 2025, respectively.
Framebridge
On May 15, 2020, the Company acquired Framebridge Inc.,is a custom framing service company, headquartered in Washington, D.C., with two retail locations in the D.C. metropolitan area and a manufacturing facility in Richmond, KY. At the end of 2021, Framebridge had fifteen22 retail locations in the Washington, D.C., New York City, Atlanta, GA, Philadelphia, PA, Boston, MA and Chicago, IL areas and threeand two manufacturing facilities in Kentucky and New Jersey. Framebridge expectscontinues to open four additional storesactively explore opportunities for further store expansion. Revenues increased in the first half of 2022. Framebridge revenues in 2021 increased from the prior year; however, revenues were down modestly in the fourth quarter of 20212023 due to limited production capacity relatedan increase in retail revenue from same-store sales growth and operating additional retail stores compared to the challenging labor market and COVID-19 related workforce absences. In the fourth quartersame periods of 2021, Framebridge prioritized the production of holiday guaranteed orders successfully and continue to manage a significant backlog of orders into the first quarter of 2022. Framebridge2022. Framebridge is an investment stage business and reported significant operating losses in 2021.2023 and 2022.
Code3Other
Other businesses also include Code3, is a performance marketing agency focused on driving performance for brands through three core elements of digital success: media, creative and commerce. Code3 revenues were relatively flat in 2021 compared to 2020, with strong growth in creative and commerce revenues, offset by a decline in marketing spending by some advertising clients. Code3 reported overall operating losses in 2021 and 2020. In the second quarter of 2021, Code3 recorded a $1.6 million lease impairment charge (including $0.4 million in property, plant and equipment write-downs). Excluding this impairment charge, Code3 reported operating income for 2021. In the second quarter of 2020, Code3 recorded a $1.5 million lease impairment charge (including $0.1 million in property, plant and equipment write-downs) in connection with a restructuring plan that included other cost reduction initiatives. These initiatives included the approval of a SIP that reduced the number of employees at Code3, resulting in $1.0 million in non-operating pension expense in the second quarter of 2020.
Megaphone
Megaphone was sold by the Company to Spotify in December 2020.
Other
Other businesses also include; Slate and Foreign Policy, which publish online and print magazines and websites; and fourtwo investment stage businesses, CyberVista, Decile and Pinna, as well asCity Cast. Losses from City Cast, a local daily podcast business that began operationsDecile and Code3 in 2021. All of these businesses reported revenue increases in 2021. Losses from each of these six businesses in 20212023 adversely affected operating results.results, while Slate and Foreign Policy each reported an operating profit.
Overall,Other businesses also included Pinna, which was sold in June 2023 when the Company entered into a merger agreement with Realm of Possibility, Inc. (Realm), a provider of audio entertainment services, to merge Pinna with Realm in return for 2021, operating revenues for other businesses increased due largely to increases froma noncontrolling financial interest in the Leaf and Framebridge acquisitions and increases at CRG, partially offset by declines duemerged entity. In connection with the merger, the Company recorded a $10.0 million non-cash, non-operating gain related to the sale of Megaphonetransaction. The Company held a noncontrolling interest in December 2020. Operating results declined in 2021 due to increased losses at Framebridge and losses at Leaf, partially offset by improvements at CRG, in additionRealm prior to the goodwilltransaction and other long-lived asset impairment chargescontinues to hold a noncontrolling interest in Realm following the transaction. The Company’s investment in Realm is reported as an equity method investment.
Other businesses also included CyberVista, which was sold in October 2022 when the Company announced a strategic merger of CyberVista and CyberWire, a B2B cybersecurity audio network to form a new parent company, N2K Networks. In connection with the merger, the Company recorded an $18.4 million non-cash, non-operating gain. The Company’s investment in N2K Networks is reported as an equity method investment.
In the first and second quarters of 2023, Code3 implemented a SIP to reduce the number of employees, which was funded by the assets of the Company’s pension plan; $1.9 million in related non-operating pension expense was recorded in the first quarterhalf of 2020 at CRG.2023.
Corporate Office
Corporate office includes the expenses of the Company’s corporate office, and certain continuing obligations related to prior business dispositions. Corporate office expenses increaseddispositions, and a net credit recorded in 2021 due primarily to higher compensation costs, offset by a credit related to theeach of 2023 and 2022 from fair value changechanges in contingent consideration related to the Framebridge acquisition.
Equity in EarningsLosses of Affiliates
At December 31, 2021,2023, the Company held an approximate 12%18% interest in Intersection Holdings, LLC (Intersection), a company that provides digital marketing and advertising services and products for cities, transit systems, airports, and other public and private spaces.spaces; a 49.9% interest in N2K Networks on a fully diluted basis; and a 42.2% interest in Realm on a fully diluted basis. The Company also holds interests in several other affiliates, including a number of home health and hospice joint ventures managed by GHG and two joint ventures managed by Kaplan. TheOverall, the Company recorded equity in earningslosses of affiliates of $17.9 million and $6.7$5.2 million for 2021 and 2020, respectively.2023, compared to $2.8 million for 2022. These amounts include $12.6$16.0 million and $11.8 million in net earnings losses for 20212023 and $2.1 million in net losses for 20202022, respectively, from affiliates whose operations are not managed by the Company; this includes losses from the Company’s investment in Intersection for 2021. The Company also recorded $6.4 million in write-downs in equity in earnings of affiliates related to one of its investments in the third quarter of 2021 and $3.6 million in write-downs in equity in earnings of affiliates related to two of its investments in the first quarter of 2020.
The recessionary environment resulting from the COVID-19 pandemic adversely impacted the underlying businesses of Intersection due to lower marketing spending by advertising clients. The decline in revenues adversely impacted the operating results and liquidity of the business since the onset of the COVID-19 pandemic.
The Company concluded that these events are not indicative of an other than temporary decline in the value of its investment to an amount less than its carrying value. Given the uncertain economic impact of the COVID-19 pandemic, it is possible that an other than temporary impairment charge could occur in the future should Intersection fail to execute on its operating strategy to address the decline in revenues and operating results. Further, the Company recorded a $30.5 million loss in equity earnings related to Intersection in 2021 and expects to record additional losses in 2022.
Net Interest Expense and Related Balances
In October 2021,connection with the acquisition of the Toyota of Richmond dealership, in September 2023, the automotive subsidiary of the Company borrowed $24.75 million and entered into a credit agreement with Truist Bank, which includes (i) a $75.2 million real estate term loan, (ii) a $65.0 million capital term loan, (iii) an undrawn $50.0 million delayed draw term loan available upon request and (iv) establishment of a revolving floor plan credit facility. Additionally, the automotive subsidiary entered into interest rate swapswaps to fix the interest rate that the Company will pay on the debt$75.2 million real estate term loan at 4.118%6.42% per annum; theannum. The proceeds from this borrowing were used to finance the acquisition of the Toyota of Richmond dealership and to repay the outstanding balance of the automotive subsidiary debtcommercial notes that was due on January 31, 2029.were maturing in 2031 and 2032. The automotive subsidiary is requiredrelated interest rate swaps were also terminated, resulting in a realized gain of $4.6 million recorded as a credit to repayinterest expense during the loan over a 10-year period by making monthly installment payments and one final payment on October 1, 2031. Additionally, in connection with the Ford automotive dealership acquisition, in December 2021, the automotive subsidiary borrowed $22.5 million, which bears interest at SOFR plus 2.05% per annum. The automotive subsidiary is required to repay the loan over a 10-year period by making monthly installment payments.third quarter of 2023.
The Company incurred net interest expense of $30.5$56.2 million in 2021,2023, compared to $34.4$51.2 million in 2020.2022. The Company recorded net interest expense of $4.1$10.1 million and $16.5 million in 20212023 and 2022, respectively, to adjust the fair value of the mandatorily redeemable noncontrolling interest at GHG. The Company recordedExcluding these adjustments, the increase in net interest expense of $8.5 millionrelates primarily to adjustincreased debt at the fair value ofautomotive dealerships and higher interest rates on the mandatorily redeemable noncontrolling interest at GHG in the fourth quarter of 2020.Company’s variable debt.
At December 31, 2021,2023, the Company had $667.5$811.8 million in borrowings outstanding at an average interest rate of 4.3%6.4%, and cash, marketable equity securities and other investments of $983.3$898.9 million. At December 31, 2021,2023, the Company had $209.6$97.9 million outstanding on its $300 million revolving credit facility. At December 31, 2020,2022, the Company had $512.6$726.4 million in borrowings outstanding at an average interest rate of 5.1%5.7%, and cash, marketable equity securities and other investments of $1,010.6$812.8 million.
Non-Operating Pension and Postretirement Benefit Income, Net
The Company recorded net non-operating pension and postretirement benefit income of $109.2$133.8 million in 2021,2023, compared to $59.3$197.9 million in 2020.2022.
In the secondfourth quarter of 2021,2023, the Company recorded $1.1$0.2 million in expenses related to a non-operating SIP at manufacturing.the television broadcasting division. In the thirdsecond quarter of 2020,2023, the Company recorded $7.8$5.5 million in expenses related to non-operating SIPs at other businesses and the education and television broadcasting divisions. In the first quarter of 2023, the Company recorded $4.1 million in expenses related to non-operating SIPs at other businesses. In the fourth quarter of 2022, the Company recorded $3.6 million in expenses related to a non-operating SIP at the education division. In the second quarter of 2020, the Company recorded $6.0 million in expenses related to a non-operating SIP at the education division and other businesses.
Gain (Loss) on Marketable Equity Securities, Net
The Company recognized $243.1 million and $60.8$138.1 million in net gains on marketable equity securities in 2021 and 2020, respectively.2023 compared to $139.6 million in net losses in 2022.
Other Non-Operating Income
The Company recorded total other non-operating income, net, of $32.6$19.1 million in 2021,2023, compared to $214.5$33.5 million in 2020.2022. The 20212023 amounts included $11.8a non-cash gain of $10.0 million in fair value increases on cost method investments; $9.4the sale of Pinna; $5.6 million in gains on sales of cost method investments; $3.8 million in gains related to sales of businesses and contingent considerationconsideration; a $3.1 million increase in the fair value of cost method investments; a $1.0 million gain on sales of cost method investments, and other items.items; partially offset by $1.1 million in foreign currency losses and a $0.5 million impairment on a cost method investment. The 20202022 amounts included $213.3a non-cash gain of $18.4 million on the sale of CyberVista; $4.3 millionin net gains related to sales of businesses and contingent consideration; $4.2a $6.9 million increase in the fair value increases onof cost method investments; $3.7$3.3 million in gains on sales of cost method investments; a $0.6 million gain on acquiring a controlling interest insale of an equity affiliate; $1.4 million net gain on sales of equity affiliatesaffiliate, and other items; partially offset by $7.3 million in impairments on cost method investments; and $2.2$2.0 million in foreign currency losses.losses and a $1.3 million impairment on a cost method investment.
Provision for Income Taxes
The Company’s effective tax raterates for 2021 was 21.4%.2023 and 2022 were 29.2% and 42.1%, respectively. The Company’s effective tax rate for 2021 was favorablyrates in 2023 and 2022 were unfavorably impacted by a $17.2 million deferred tax adjustment arising from a change in the estimated deferred state income tax rate attributable to the apportionment formula used in the calculation of deferred taxespermanent differences related to the Company’s pensiongoodwill and other postretirement plans.intangible asset impairment charges and the interest expense recorded to adjust the fair value of the mandatorily redeemable noncontrolling interest at GHG. Excluding this $17.2 million benefit,the impact of these items, the overall income tax raterates for 2021 was 25.2%.2023 and 2022 were 24.0% and 24.1%, respectively.
The Company’s effective tax rate for 2020 was 26.3%. In 2020, the Company recorded income tax expense related to stock compensation of $2.9 million. Excluding this $2.9 million expense, the overall income tax rate for 2020 was 25.6%.
FINANCIAL CONDITION: LIQUIDITY AND CAPITAL RESOURCES
The Company considers the following when assessing its liquidity and capital resources:
| | | | As of December 31 | | As of December 31 |
| (In thousands) | (In thousands) | 2021 | | 2020 | (In thousands) | 2023 | | 2022 |
| Cash and cash equivalents | Cash and cash equivalents | $ | 145,886 | | | $ | 413,991 | |
| Restricted cash | Restricted cash | 12,957 | | | 9,063 | |
| Investments in marketable equity securities and other investments | Investments in marketable equity securities and other investments | 824,445 | | | 587,582 | |
| Total debt | Total debt | 667,501 | | | 512,555 | |
Cash generated by operations is the Company’s primary source of liquidity. The Company maintains investments in a portfolio of marketable equity securities, which is considered when assessing the Company’s sources of liquidity. An additional source of liquidity includes the undrawn portion of the Company’s $300 million five-year revolving credit facility, amounting to $90.4$202.1 million at December 31, 2021.2023.
In March 2020, the U.S. government enacted legislation, including the CARES Act to provide stimulus in the form of financial aid to businesses affected by the COVID-19 pandemic. Under the CARES Act, employers could defer the payment of the employer share of FICA taxes due for the period beginning on March 27, 2020, and ending December 31, 2020. The Company deferred $21.5 million of FICA payments under this program, with $10.7 million of the deferred payments still payable at December 31, 2021. The remaining deferred balance is due by December 31, 2022.
The CARES Act also included provisions to support healthcare providers in the form of grants and changes to Medicare and Medicaid payments. In the second quarter of 2020, GHG received $7.4 million under the CARES Act as a general distribution from the Provider Relief Fund to provide relief for lost revenues and expenses incurred in connection with COVID-19. In addition to the above distribution, in April 2020, GHG applied for and received $31.5 million under the expanded Medicare Accelerated and Advanced Payment Program, modified by the CARES Act. The Department of Health and Human Services (HHS) started to recoup this advance in April 2021 by withholding a portion of the amount reimbursed for claims submitted for services provided after the beginning of the recoupment period. During 2021, an amount of $18.9 million was withheld by HHS and the Company expects the remaining balance of $12.6 million to be withheld from claims submitted in the first half of 2022.
Governments in other jurisdictions where the Company operates also provided relief to businesses affected by the COVID-19 pandemic in the form of job retention schemes, payroll assistance, deferral of income and other tax payments, and loans. For the years ended December 31, 2021, and 2020, Kaplan has recorded benefits totaling $4.7 million and $12.2 million, respectively, related to job retention and payroll schemes, mostly at Kaplan International.
During 2021,2023, the Company’s cash and cash equivalents decreasedincreased by $268.1$0.6 million, due to the acquisition of Leaf and several other businesses, the purchase of marketable equity securities, deferred payments on previous acquisitions, capital expenditures, dividend payments and share repurchases, which was partially offset by cash generated from operations, the net proceeds from the sale of marketable equity securities, net proceeds from vehicle floor plan payable, and net issuance of borrowings.borrowings, which were offset by share repurchases, acquisitions, capital expenditures, a loan to a related party, additional investments in marketable equity securities and equity affiliates, and dividend payments. In 2021,2023, the Company’s borrowings increased by $154.9$85.5 million, primarily due to additional borrowingsthe issuance of the term loan and new loans at the automotive subsidiary, offset by repayments under the revolving credit facility and commercial notes at the automotive subsidiary, which were partially offset by repayments.subsidiary.
TheAs of December 31, 2023 and 2022, the Company had no money market investments as of December 31, 2021, compared to $268.8$5.6 million at December 31, 2020, which areand $7.7 million, that were included in cash and cash equivalents. At December 31, 2021,2023, the Company held approximately $119$138 million in cash and cash equivalents in businesses domiciled outside the U.S., of which approximately $8 million is not available for immediate use in operations or for distribution. Additionally, Kaplan’s business operations outside the U.S. retain cash balances to support ongoing working capital requirements, capital expenditures, and regulatory requirements. As a result, the Company considers a significant portion of the cash and cash equivalents balance held outside the U.S. as not readily available for use in U.S. operations.
At December 31, 2021,2023, the fair value of the Company’s investments in marketable equity securities was $810.0$690.2 million, which includes investments in the common stock of sevenfour publicly traded companies. The Company purchased $48.0$4.6 million of marketable equity securities during 2021.2023, excluding $1.5 million that was purchased in December 2022, but settled in January 2023. During 2021,2023, the Company sold marketable equity securities that generated proceeds of $65.5$62.0 million. At December 31, 2021,2023, the net unrealized gain related to the Company’s investments totaled $536.8$464.2 million.
In April 2023, the Company entered into a term note agreement to loan Intersection $30.0 million at an interest rate of 9% per annum. The principal and interest on the note are payable in monthly installments over 5 years with the final payment due by May 2028. The outstanding balance on this loan was $28.8 million as of December 31, 2023.
The Company had working capital of $680.8$619.6 million and $824.5$534.1 million at December 31, 20212023 and 2020,2022, respectively. The Company maintains working capital levels consistent with its underlying business requirements and consistently generates cash from operations in excess of required interest or principal payments.
At December 31, 20212023 and 2020,2022, the Company had borrowings outstanding of $667.5$811.8 million and $512.6$726.4 million, respectively. The Company’s borrowings at December 31, 20212023 were mostly from $400.0 million of 5.75%
unsecured notes due June 1, 2026, $209.6$97.9 million in outstanding borrowings under the Company’s revolving credit facility, a term loan of $147.5 million, and real estate and capital term loans of $137.6 million at the automotive subsidiary. The Company’s borrowings at December 31, 2022 were mostly from $400.0 million of 5.75% unsecured notes due June 1, 2026, $200.2 million in outstanding borrowings under the Company’s revolving credit facility and commercial notes of $47.0$116.6 million at the Automotive subsidiary. The Company’s borrowings at December 31, 2020 were mostly from $400.0 million of 5.75% unsecured notes due June 1, 2026, £55 million in outstanding borrowings under the Company’s revolving credit facility and a commercial note of $25.3 million at the Automotiveautomotive subsidiary. The interest on the $400.0 million of 5.75% unsecured notes is payable semiannuallysemi-annually on June 1 and December 1.
On July 28, 2023, the Company entered into a $150 million term loan with each of the lenders party thereto, Wells Fargo Bank, N.A., JPMorgan Chase Bank N.A., Bank of America, N.A., HSBC Bank USA, N.A., and PNC Bank, N.A. The term loan is payable in quarterly installments of $1.875 million which started in December 2023 with a final payment of the principal balance due on May 30, 2027. The term loan bears interest at variable rates based on Secured Overnight Financing Rate (SOFR) plus 1.75% per annum. The Company may redeem the term loan in whole or in part with no penalty at any time. The existing financial covenants of the credit agreement governing the revolving credit facility are unchanged following the addition of the term loan.
On September 26, 2023, the Company’s automotive subsidiary entered into a credit agreement with Truist Bank, which includes (i) a $75.2 million real estate term loan, (ii) a $65.0 million capital term loan, (iii) a $50.0 million delayed draw term loan, and (iv) establishment of a revolving floor plan credit facility. The real estate term loan is payable in monthly installments of $0.3 million and bears interest at variable rates based on SOFR plus 1.75% per annum, and the capital term loan is payable in monthly installments of $0.5 million and bears interest at variable rates based on SOFR plus 2.00% per annum. The monthly installment payments on the real estate and capital term loans commenced on November 1, 2023, with final payments of the outstanding principal balances due on September 26, 2028. Subject to terms and conditions set forth in the credit agreement, the automotive subsidiary may also request borrowings of delayed draw term loans for which the proceeds may be used to (i) finance the acquisition of automobile dealerships (delayed draw capital loan) and (ii) finance the acquisition of real estate (delayed draw real estate loan). The delayed draw term loan bears interest at variable rates based on SOFR plus an applicable margin based on the type of delayed draw term loan requested. The delayed draw term loan availability period terminates on September 26, 2025. The automotive subsidiary did not borrow against the delayed draw term loan as of December 31, 2023.
On the same date, the Company’s automotive subsidiary entered into three interest rate swap agreements with a total notional value of $75.2 million and a maturity date of September 26, 2028. The interest rate swap agreements
will pay the automotive subsidiary interest on the $75.2 million notional amount based on SOFR and the automotive subsidiary will pay the counterparty a fixed rate of 4.67% per annum. The new interest rate swap agreements were entered into to convert the variable rate borrowing under the real estate term loan into a fixed rate borrowing. Based on the terms of the new interest rate swap agreements and underlying borrowings, the new interest rate swaps were determined to be effective and thus qualify as cash flow hedges. Including a 1.75% applicable margin, the overall interest rate that the Company will pay on the $75.2 million real estate term loan is fixed at 6.42% per annum.
The automotive subsidiary used the net proceeds from the real estate and capital term loans to finance the acquisition of the Toyota of Richmond dealership and to repay the outstanding balances of the commercial notes maturing in 2031 and 2032. The interest rate swap agreements maturing in 2031 and 2032 were also terminated resulting in realized gains of $4.6 million that reduced interest expense during the third quarter of 2023.
During 20212023 and 2020,2022, the Company had average borrowings outstanding of approximately $545.2$745.0 million and $512.4$689.9 million, respectively, at average annual interest rates of approximately 4.8%6.1% and 5.1%4.8%, respectively. The Company incurred net interest expense of $30.5$56.2 million and $34.4$51.2 million, respectively, during 20212023 and 2020.2022. Included in the 20212023 and 20202022 interest expense is an amount of $4.1$10.1 million and $8.5$16.5 million, respectively, to adjust the fair value of the mandatorily redeemable noncontrolling interest (see Note 11).
On June 3, 2021,August 17, 2023, Moody’s affirmed the Company’s credit rating and revisedmaintained the outlook from Negative toas Stable. On April 27, 2021,4, 2023, Standard & Poor’s affirmed the Company’s credit rating and revisedmaintained the outlook from Negative toas Stable.
The Company’s current credit ratings are as follows:
| | | | | | | | | | | |
| Moody’s | | Standard & Poor’s |
| Long-term | Ba1 | | BB |
| Outlook | Stable | | Stable |
The Company expects to fund its estimated capital needs primarily through existing cash balances and internally generated funds, and, as needed, from borrowings under its revolving credit facility. As of December 31, 2021,2023, the Company had $209.6$97.9 million outstanding under the $300 million revolving credit facility, which borrowing was used to purchase land and buildings at Kaplan International’s sixth-form college in London, U.K. and at the automotive division in the third quarter of 2021, to repay the £60 million Kaplan UK credit facility that matured at the end of June 2020 and, to a lesser extent, to repurchase stock and fund various acquisitions during the fourth quarter of 2021.facility. In management’s opinion, the Company will have sufficient financial resources to meet its business requirements in the next 12 months, including working capital requirements, capital expenditures, interest payments, potential acquisitions and strategic investments, dividends and stock repurchases.
In summary, the Company’s cash flows for each period were as follows:
| | | | Year Ended December 31 | | Year Ended December 31 |
| (In thousands) | (In thousands) | 2021 | | 2020 | | 2019 | (In thousands) | 2023 | | 2022 | | 2021 |
| Net cash provided by operating activities | Net cash provided by operating activities | $ | 202,426 | | | $ | 210,663 | | | $ | 165,164 | |
| Net cash (used in) provided by investing activities | (494,635) | | | 199,371 | | | (236,735) | |
| Net cash provided by (used in) financing activities | 31,027 | | | (204,002) | | | 18,734 | |
| Net cash used in investing activities | |
| Net cash (used in) provided by financing activities | |
| Effect of currency exchange rate change | Effect of currency exchange rate change | (3,029) | | | 2,978 | | | 2,766 | |
| Net (decrease) increase in cash and cash equivalents and restricted cash | $ | (264,211) | | | $ | 209,010 | | | $ | (50,071) | |
| Net increase (decrease) in cash and cash equivalents and restricted cash | |
Operating Activities. Cash provided by operating activities is net income adjusted for certain non-cash items and changes in assets and liabilities. The Company’s net cash flow provided by operating activities were as follows:
| | | | Year Ended December 31 | | Year Ended December 31 |
| (In thousands) | (In thousands) | 2021 | | 2020 | | 2019 | (In thousands) | 2023 | | 2022 | | 2021 |
| Net Income | Net Income | $ | 353,327 | | | $ | 299,968 | | | $ | 327,879 | |
| Adjustments to reconcile net income to net cash provided by operating activities: | Adjustments to reconcile net income to net cash provided by operating activities: | | | | | | Adjustments to reconcile net income to net cash provided by operating activities: | | | |
| Depreciation, amortization and goodwill and other long-lived asset impairment | Depreciation, amortization and goodwill and other long-lived asset impairment | 162,225 | | | 161,207 | | | 121,648 | |
| Amortization of lease right-of-use asset | Amortization of lease right-of-use asset | 73,752 | | | 89,956 | | | 84,185 | |
| Net pension benefit, settlement, and special separation benefit expense | (91,898) | | | (41,573) | | | (137,909) | |
| Net pension benefit and special separation benefit expense | |
| | Other non-cash activities | |
| Other non-cash activities | |
| Other non-cash activities | Other non-cash activities | (183,742) | | | (229,134) | | | (34,714) | |
| Change in operating assets and liabilities | Change in operating assets and liabilities | (111,238) | | | (69,761) | | | (195,925) | |
| Net Cash Provided by Operating Activities | Net Cash Provided by Operating Activities | $ | 202,426 | | | $ | 210,663 | | | $ | 165,164 | |
Net cash provided by operating activities consists primarily of cash receipts from customers, less disbursements for costs, benefits, income taxes, interest and other expenses.
For 20212023 compared to 2020,2022, the decreaseincrease in net cash provided by operating activities is primarily due to changes in operating assets and liabilities, partially offset by higherlower net income, net of non-cash adjustments. Changes in operating assets and liabilities were primarily driven by a decrease in the collection of accounts receivable and partial
repayment of advances related to the CARES Act, partially offset by other increases in accounts payable and accrued liabilities and deferred revenue.liabilities. The change in non-cash activities is largely the result of fluctuations in the share prices of the Company’s investments in marketable equity securities with gains in 2023 compared to losses in 2022.
For 20202022 compared to 2019,2021, the increase in net cash provided by operating activities is primarily due to higher net income, net of non-cash adjustments, partially offset by changes in operating assets and liabilities. Changes in operating assets and liabilities were driven by higher purchases of inventories and decreases in accounts payable and accrued liabilities, partially offset by an increase in the collection of accounts receivable, the advance received by GHG under the expanded Medicare Accelerated and Advanced Payment Program as modified by the CARES Act, and the deferral of FICA payments under the CARES Act.receivable.
Investing Activities. The Company’s net cash flow (used in) provided byused in investing activities were as follows:
| | | | Year Ended December 31 | | Year Ended December 31 |
| (In thousands) | (In thousands) | 2021 | | 2020 | | 2019 | (In thousands) | 2023 | | 2022 | | 2021 |
| Purchases of property, plant and equipment | |
| Investments in certain businesses, net of cash acquired | Investments in certain businesses, net of cash acquired | $ | (351,882) | | | $ | (20,080) | | | $ | (179,421) | |
| Purchases of property, plant and equipment | (162,537) | | | (69,591) | | | (93,504) | |
| Net proceeds from sales of marketable equity securities | Net proceeds from sales of marketable equity securities | 17,463 | | | 73,771 | | | 11,804 | |
| Loan to related party | |
| Investments in equity affiliates, cost method and other investments | Investments in equity affiliates, cost method and other investments | (8,531) | | | (12,367) | | | (27,529) | |
| Net proceeds from sales of businesses, property, plant and equipment and other assets | 10,295 | | | 225,570 | | | 54,495 | |
| | Other | Other | 557 | | | 2,068 | | | (2,580) | |
| Net Cash (Used in) Provided by Investing Activities | $ | (494,635) | | | $ | 199,371 | | | $ | (236,735) | |
| Other | |
| Other | |
| Net Cash Used in Investing Activities | |
Capital Expenditures. The 2023 and 2022 capital expenditures are lower than 2021 due to significant land and building purchases at Kaplan International’s sixth-form college in London, U.K. and at the automotive subsidiary in 2021. The amounts reflected in the Company’s Statements of Cash Flows are based on cash payments made during the relevant periods, whereas the Company’s capital expenditures for 2023, 2022 and 2021 disclosed in Note 19 to the Consolidated Financial Statements include assets acquired during the year. The Company estimates that its capital expenditures will be in the range of $95 million to $105 million in 2024.
Acquisitions. During 2023, the Company acquired five businesses: one in automotive, three small businesses in healthcare and one in other businesses for $83.3 million in cash and contingent consideration and the assumption of floor plan payables. In September 2023, the Company’s automotive subsidiary acquired a Toyota automotive dealership, including the real property for the dealership operations. In addition to a cash payment and the assumption of $2.2 million in floor plan payables, the automotive subsidiary borrowed $37.0 million to finance the acquisition. During 2022, the Company acquired seven businesses: five in healthcare and two in automotive, for $143.2 million in cash and contingent consideration and the assumption of floor plan payables. GHG acquired two small businesses in August 2022, a 100% interest in a multi-state provider of Applied Behavioral Analysis clinics in July 2022, and two small businesses in May 2022. In July 2022, the Company’s automotive subsidiary acquired two automotive dealerships, including the real property for the dealership operations. In addition to a cash payment and the assumption of $10.9 million in floor plan payables, the automotive subsidiary borrowed $77.4 million to finance the acquisition. During 2021, the Company acquired six businesses: two small businesses in its education division, two small businesses in healthcare, one new auto dealership in automotive, and all the outstanding shares of Leaf for cash and the assumption of $9.2 million in liabilities related to their pre-acquisition stock compensation plan, which will be paid in the future.plan. Leaf isoperations are included in other businesses. During 2020, the Company acquired three businesses: two small businesses in its education division and an additional interest in Framebridge, Inc., which is included in other businesses. The Framebridge purchase price included $54.3 million in deferred payments and contingent consideration based on the acquiree achieving certain revenue milestones in the future. During 2019, the Company acquired eight businesses: one in education, three in healthcare, one in manufacturing, two in automotive, and one in other businesses for $211.8 million in cash and contingent consideration and the assumption of $25.8 million in floor plan payables.
Capital Expenditures. The 2021 capital expenditures are higher than 2020 and 2019 primarily due to land and building purchases at Kaplan International’s sixth-form college in London, U.K. and at the automotive division. The 2020 and 2019 capital expenditures include spending in connection with spectrum repacking at the Company’s television stations in Detroit, MI, Jacksonville, FL, and Roanoke, VA, as mandated by the FCC; these spectrum repacking expenditures were largely reimbursed to the Company by the FCC. The 2020 capital expenditures are lower than 2019 due to the completion of the construction of an academic and student residential facility in connection with Kaplan’s Pathways program in Liverpool, U.K. The amounts reflected in the Company’s Statements of Cash Flows are based on cash payments made during the relevant periods, whereas the Company’s capital expenditures for 2021, 2020 and 2019 disclosed in Note 19 to the Consolidated Financial Statements include assets acquired during the year. The Company estimates that its capital expenditures will be in the range of $80 million to $90 million in 2022.
Net Proceeds from Sales of Investments and Businesses.Marketable Equity Securities. During 2021, 20202023, 2022 and 2019,2021, the Company sold marketable securities that generated proceeds of $65.5$62.0 million, $93.8$102.0 million and $19.3$65.5 million, respectively. The Company purchased $48.04.6 million, $20.0$42.1 million, of which $1.5 million was settled in January 2023, and $7.5$48.0 million of marketable equity securities during 2023, 2022 and 2021, 2020 and 2019, respectively.
Loan to related party. In December 2020,April 2023, the Company completedentered into a term note agreement to loan Intersection $30.0 million at an interest rate of 9% per annum. The principal and interest on the salenote are payable in monthly installments over 5 years with the final payment due by May 2028. The outstanding balance on this loan was $28.8 million as of Megaphone;December 31, 2023.
Investment in Equity Affiliates. During 2023, the total net proceeds from the sale were $223.0 million. In November 2019, Kaplan UK completed the saleCompany made additional investments in Intersection and Realm. During 2022, GHG invested an additional $18.5 million in two affiliates to fund their acquisition of a small business which was included in Kaplan International. The Company sold itsan interest in Gimlet Media during February 2019;a health system in Illinois and the total proceeds fromCompany also made an additional investment of $5.0 million in N2K Networks, the sale were $33.5 million.new parent entity formed through the CyberVista transaction.
Financing Activities. The Company’s net cash flow (used in) provided by (used in) financing activities were as follows:
| | | | | | | | | | | | | | | | | |
| | Year Ended December 31 |
| (In thousands) | 2021 | | 2020 | | 2019 |
| Issuance (repayments) of borrowings | $ | 20,539 | | | $ | (81,276) | | | $ | 32,548 | |
| Net borrowing under revolving credit facilities | 134,696 | | | 76,241 | | | — | |
| Net (repayments of) proceeds from vehicle floor plan payable | (10,563) | | | (14,160) | | | 14,384 | |
| Common shares repurchased | (55,683) | | | (161,829) | | | (2,103) | |
| Dividends paid | (30,136) | | | (29,970) | | | (29,553) | |
| Other | (27,826) | | | 6,992 | | | 3,458 | |
| Net Cash Provided by (Used in) Financing Activities | $ | 31,027 | | | $ | (204,002) | | | $ | 18,734 | |
| | | | | | | | | | | | | | | | | |
| | Year Ended December 31 |
| (In thousands) | 2023 | | 2022 | | 2021 |
| Issuance of borrowings, net | $ | 171,643 | | | $ | 62,815 | | | $ | 20,539 | |
| Net borrowing under revolving credit facilities | (104,244) | | | 3,000 | | | 134,696 | |
| Net proceeds from (repayments of) vehicle floor plan payable | 73,732 | | | 26,230 | | | (10,563) | |
| Common shares repurchased | (193,160) | | | (71,386) | | | (55,683) | |
| Dividends paid | (30,953) | | | (30,712) | | | (30,136) | |
| Other | (16,853) | | | (8,054) | | | (27,826) | |
| Net Cash (Used in) Provided by Financing Activities | $ | (99,835) | | | $ | (18,107) | | | $ | 31,027 | |
Borrowings and Vehicle Floor Plan Payable. In September 2023, the Company’s automotive subsidiary entered into a credit agreement with Truist Bank which includes (i) a $75.2 million real estate term loan, (ii) a $65.0 million capital term loan, (iii) a $50.0 million delayed draw term loan, and (iv) establishment of a revolving floor plan credit facility. The automotive subsidiary used the net proceeds from the real estate and capital term loans to acquire an automotive dealership, including the real property for the dealership operations, and to repay the outstanding balances of the commercial notes maturing in 2031 and 2032. On July 28, 2023, the Company entered into a $150 million term loan and used the proceeds to repay the U.S. dollar borrowings of the $300 million revolving credit facility. In July 2022, the Company’s automotive subsidiary amended its commercial note to, among other things, increase the aggregate loan amount to $71.6 million and entered into three commercial notes in an aggregate amount of $27.2 million. The additional borrowings were used to acquire two automotive dealerships, including the real property for the dealership operations. In 2021, the Company borrowed against the $300 million revolving credit facility, which borrowing was used to purchase land and buildings at Kaplan International’s sixth-form college in London, U.K. and at the automotive divisionsubsidiary and, to a lesser extent, to repurchase stock and fund various acquisitions during the fourth quarter of 2021. In addition, the automotive subsidiary borrowed $47.3 million, which was used to repay the outstanding balance of the term loan due on January 31, 2029 and fund the acquisition of an automotive dealership in the fourth quarter. In 2020,2023, 2022, and 2021, the Company borrowed £60 million against the $300 million revolving credit facility and used the proceeds to repay the £60 million outstanding balance under the Kaplan Credit Agreement that matured at the end of June 2020. The Company repaid £5 million of these borrowings in the fourth quarter of 2020. In 2019, the Company had cash inflows from borrowings to fund the acquisition of two businesses at automotive and healthcare and usedvehicle floor vehicle plan financing to fund the purchase of new, used and service loaner vehicles at its automotive subsidiary. The proceeds from (repayments of) the vehicle floor plan payable fluctuates with changes in the amount of vehicle inventory held by the automotive dealerships.
Common Stock Repurchases. During 2021, 2020,2023, 2022, and 2019,2021, the Company purchased a total of 93,969, 406,112,325,134, 121,761, and 3,39293,969 shares, respectively, of its Class B common stock at a cost of approximately $195.0 million, $71.4 million, and $55.7 million, $161.8respectively, including commissions and accrued excise tax of $1.8 million and $2.1 million, respectively.for 2023 purchases. On September 10, 2020,May 4, 2023, the Board of Directors authorized the Company to acquire up to 500,000 shares of its Class B common stock. The Company did not announce a ceiling price or time limit for the purchases. At December 31, 2021,2023, the Company had remaining authorization from the Board of Directors to purchase up to 270,182236,403 shares of Class B common stock.
Dividends. The annual dividend rate per share was $6.60, $6.32 and $6.04 $5.80in 2023, 2022 and $5.56 in 2021, 2020 and 2019, respectively. The Company expects to pay a dividend of $6.32$6.88 per share in 2022.2024.
Other. In 2023 and 2022, the Company paid $5.3 million and $5.7 million related to contingent consideration and deferred payments from prior acquisitions. In 2021, the Company paid $30.9 million related to contingent consideration and deferred payments from prior acquisitions, mostly for the 2020 acquisition of Framebridge. In December 2023, the Company acquired some of the minority-owned shares of CSI for a total amount of $20.0 million. The Company paid cash of $5.0 million and entered into a promissory note with the minority owners for the remaining $15.0 million. In March 2021, Hoover’s minority shareholders put their remaining outstanding shares to the Company, which had a redemption value of $3.5 million.
In 2020, the Company received $25.1 million in proceeds from the exercise of stock options. In March 2019, a Hoover minority shareholder put some shares to the Company, which had a redemption value of $0.6 million.
Contractual Obligations. The following reflects a summary of the Company’s contractual obligations as of December 31, 2021:2023:
| | (in thousands) | (in thousands) | 2022 | | 2023 | | 2024 | | 2025 | | 2026 | | Thereafter | | Total | (in thousands) | 2024 | | 2025 | | 2026 | | 2027 | | 2028 | | Thereafter | | Total |
| Debt and interest | Debt and interest | $ | 33,092 | | | $ | 241,678 | | | $ | 35,212 | | | $ | 28,626 | | | $ | 415,938 | | | $ | 36,537 | | | $ | 791,083 | |
| Finance leases | |
| Operating leases | Operating leases | 107,541 | | | 79,854 | | | 64,030 | | | 50,392 | | | 45,897 | | | 296,514 | | | 644,228 | |
Programming purchase commitments (1) | 8,821 | | | 4,952 | | | 213 | | | 177 | | | — | | | — | | | 14,163 | |
Television broadcasting commitments (1) | |
| IT software and services | |
Other purchase obligations (2) | Other purchase obligations (2) | 97,789 | | | 44,696 | | | 24,615 | | | 12,016 | | | 6,820 | | | 25,366 | | | 211,302 | |
Long-term liabilities (3) | Long-term liabilities (3) | 2,820 | | | 2,729 | | | 2,596 | | | 2,494 | | | 2,433 | | | 10,786 | | | 23,858 | |
| Total | Total | $ | 250,063 | | | $ | 373,909 | | | $ | 126,666 | | | $ | 93,705 | | | $ | 471,088 | | | $ | 369,203 | | | $ | 1,684,634 | |
___________________
(1) Includes network fees, employment agreements and programming purchase commitments for the Company’s television broadcasting business that are reflected in the Company’s Consolidated Financial Statements and commitments to purchase programming to be produced in future years.business.
(2) Includes purchase obligations related to employment agreements, capital projects and other legally binding commitments. Other purchase orders made in the ordinary course of business are excluded from the table above. Any amounts for which the Company is liable under purchase orders are reflected in the Company’s Consolidated Balance Sheets as accounts payable and accrued liabilities.
(3) Primarily made up of multiemployer pension plan withdrawal obligations and postretirement benefit obligations other than pensions. The Company has other long-term liabilities excluded from the table above, including obligations for deferred compensation, long-term incentive plans and long-term deferred revenue.
In management’s opinion, the Company will have sufficient financial resources to meet its business requirements in the next 12 months, including working capital requirements, capital expenditures, interest payments, potential acquisitions and strategic investments, dividends and stock repurchases.
Other. The Company does not have any off-balance-sheet arrangements or financing activities with special-purpose entities (SPEs).entities.
CRITICAL ACCOUNTING POLICIES AND ESTIMATES
The preparation of financial statements in conformity with generally accepted accounting principles requires management to make estimates and judgments that affect the amounts reported in the financial statements. On an ongoing basis, the Company evaluates its estimates and assumptions. The Company bases its estimates on historical experience and other assumptions believed to be reasonable under the circumstances, the results of which form the basis for making judgments about the carrying value of assets and liabilities that are not readily apparent from other sources. Actual results could differ from these estimates.
An accounting policy is considered to be critical if it is important to the Company’s financial condition and results and if it requires management’s most difficult, subjective and complex judgments in its application. For a summary of all of the Company’s significant accounting policies, see Note 2 to the Company’s Consolidated Financial Statements.
Revenue Recognition, Trade Accounts Receivable and Allowance for Credit Losses. Education revenue is primarily derived from postsecondary education services, professional education and test preparation services. Revenue, net of any refunds, corporate discounts, scholarships and employee tuition discounts is recognized ratably over the instruction period or access period for higher education and supplemental education services.
At Kaplan International and Kaplan Supplemental Education, estimates of average student course length are developed for each course, along with estimates for the anticipated level of student drops and refunds from test performance guarantees, and these estimates are evaluated on an ongoing basis and adjusted as necessary. As Kaplan’s businesses and related course offerings have changed, including more online programs, the complexity and significance of management’s estimates have increased.
KHE provides non-academic operations support services to Purdue Global pursuant to a TOSA, which includes technology support, help-deskhelpdesk functions, human resources support for faculty and employees, admissions support, financial aid administration, marketing and advertising, back-office business functions, and certain student recruitment services. KHE is not entitled to receive any reimbursement of costs incurred in providing support services, or any fee, unless and until Purdue Global has first covered all of its operatingacademic costs (subject to a cap), received payment for cost efficiencies, if any, and during the first five years of the TOSA, receive a priority payment of $10 million per year in addition to the operating cost reimbursements and cost efficiency payments. KHE will receive reimbursement for its operating costs of providing the support services after payment of Purdue Global’s operating costs, cost efficiency payments, and priority payment. If there are sufficient revenues, KHE may be entitled to a cost efficiency payment, if any, and an additional fee equal to 12.5% of Purdue Global’s revenue. Subject to certain limitations, a portion of the fee that is earned by KHE in one year may be carried over to subsequent years for payment to Kaplan.
The support fee and reimbursement for KHE support costs are entirely dependent on the availability of cash at the end of Purdue Global’s fiscal year (June 30), and therefore, all consideration in the contract is variable. The Company uses significant judgment to forecast the operating results of Purdue Global, the availability of cash at the end of each fiscal year, and the consideration it expects to receive from Purdue Global annually. Key assumptions used in the forecast model include student census and degree enrollment data, Purdue Global and KHE expenses, changes to working capital, contractually stipulated minimum payments, and lead conversion rates. The forecast is updated as uncertainties are resolved. The Company reviews and updates the assumptions regularly, as a
significant change in one or more of these estimates could affect the revenue recognized. Changes to the estimated variable consideration were not material for the year ended December 31, 2021.2023.
A Kaplan International business has a contract with an examination body through August 20322029 comprised of two performance obligations, one to build and create a professional exam and another to manage the delivery of that exam to qualified candidates. The first obligation was completed in 2021. The second obligation began after the first obligation was completed and is expected to continue through the end of the contract term. Revenues are recognized for both of these obligations usingby allocating the transaction price based on forecasted financial results and the use of a market-based profit margin applied to costs incurred during the financial reporting period. This profit margin, determined at contract inception, is different for each obligation as a result of the different value created by each distinct obligation. The forecast, including key assumptions such as expected candidate volumes and related exam-management expenses, is updated as future uncertainties are resolved, which may result in changes to the profit margin associated with each performance obligation.transaction price. The Company reviews and updates the assumptions regularly, as a significant change in one or more of these estimates could affect revenue recognized. Changes to the estimated variable consideration were not material for the year ended December 31, 2021.2023.
The determination of whether revenue should be reported on a gross or net basis is based on an assessment of whether the Company acts as a principal or an agent in the transaction. In certain cases, the Company is considered the agent, and the Company records revenue equal to the net amount retained when the fee is earned. In these cases, costs incurred with third-party suppliers isare excluded from the Company’s revenue. The Company assesses whether it obtained control of the specified goods or services before they are transferred to the customer as part of this assessment. In addition, the Company considers other indicators such as the party primarily responsible for fulfillment, inventory risk and discretion in establishing price.
Accounts receivable have been reduced by an allowance that reflects the current expected credit losses associated with the receivables. This estimated allowance is based on historical write-offs, current macroeconomic conditions, reasonable and supportable forecasts of future economic conditions and management’s evaluation of the financial condition of the customer. The Company generally considers an account past due or delinquent when a student or customer misses a scheduled payment. The Company writes off accounts receivable balances deemed uncollectible against the allowance for credit losses following the passage of a certain period of time, or generally when the account is turned over for collection to an outside collection agency.
Goodwill and Other Intangible Assets. The Company has a significant amount of goodwill and indefinite-lived intangible assets that are reviewed at least annually for possible impairment.
| | As of December 31 |
| As of December 31 | | | As of December 31 |
| (in millions) | (in millions) | 2021 | | 2020 | (in millions) | 2023 | | 2022 |
| Goodwill and indefinite-lived intangible assets | Goodwill and indefinite-lived intangible assets | $ | 1,791.8 | | | $ | 1,605.2 | |
| Total assets | Total assets | 7,425.5 | | | 6,444.1 | |
| Percentage of goodwill and indefinite-lived intangible assets to total assets | Percentage of goodwill and indefinite-lived intangible assets to total assets | 24 | % | | 25 | % | Percentage of goodwill and indefinite-lived intangible assets to total assets | 24 | % | | 27 | % |
The Company performs its annual goodwill and intangible assets impairment test as of November 30. Goodwill and other intangible assets are reviewed for possible impairment between annual tests if an event occurred or circumstances changed that would more likely than not reduce the fair value of the reporting unit or other intangible assets below its carrying value.
Goodwill
The Company tests its goodwill at the reporting unit level, which is an operating segment or one level below an operating segment. The Company initially performs an assessment of qualitative factors to determine if it is necessary to perform a quantitative goodwill impairment test. The Company quantitatively tests goodwill for impairment if, based on its assessment of the qualitative factors, it determines that it is more likely than not that the fair value of a reporting unit is less than its carrying amount, or if it decides to bypass the qualitative assessment. The quantitative goodwill impairment test compares the estimated fair value of a reporting unit with its carrying amount, including goodwill. An impairment charge is recognized for the amount by which the carrying amount exceeds the reporting unit’s fair value.
InThe Company performed an interim impairment review of goodwill at the Dekko and WGB reporting units in the third quarter of 2021,2023 as a result of continued sustained weakness in demand for certain Dekko power and data products, primarily in the commercial office space market, and substantial digital advertising revenue declines and continued significant operating losses at WGB. The Company recorded a $47.8 million and $50.2 million goodwill impairment charge at the Dekko and WGB reporting units, respectively, as a result of the emergence of the COVID-19 Delta variant and continued weak product demand in the commercial office electrical products and hospitality sectors caused by the COVID-19 pandemic, the Company performed an interim review of the goodwill and indefinite-lived intangibles of the Dekko reporting unit. As a result of the impairment review, the Company recorded a $26.7 million goodwill impairment charge.reviews. The Company estimated the fair value of the reporting unitunits by utilizing a discounted cash flow model. The carrying value of theeach reporting unit exceeded theits estimated fair value, resulting in a goodwill impairment charge for the amount by which the carrying value exceeded the estimated fair value after taking into account the effect of deferred
income taxes. As a result of the impairment charge, no goodwill remains at the Dekko reporting unit. Dekko is included in manufacturing.manufacturing and WGB in other businesses.
The Company had 20 reporting units as of December 31, 2021.2023. The reporting units with significant goodwill balances as of December 31, 2021,2023, were as follows, representing 89%94% of the total goodwill of the Company:
| | | | | |
| (in millions) | Goodwill |
| Education | |
| Kaplan international | $ | 621.3598.0 | |
| Higher education | 63.2 | |
| |
| |
| Supplemental education | 170.6171.6 | |
| Television broadcasting | 190.8 | |
Leaf | 162.0 | |
| Healthcare | 118.3135.0 | |
| Automotive | 129.3 | |
| |
| Hoover | 91.3 | |
DekkoFramebridge | 47.860.9 | |
| |
| Total | $ | 1,465.31,440.1 | |
As of November 30, 2021,2023, in connection with the Company’s annual impairment testing, the Company decided to perform the quantitative goodwill impairment process at all of the reporting units with the exception of Framebridge, for which it performed a qualitative assessment.units. The Company’s policy requires the performance of a quantitative impairment review of the goodwill at least once every three years. The Company used a discounted cash flow model, and, where appropriate, a market value approach was also utilized to supplement the discounted cash flow model to determine the estimated fair value of its reporting units. The Company made estimates and assumptions regarding future cash flows, discount rates, long-term growth rates and market values to determine each reporting unit’s estimated fair value. The methodology used to estimate the fair value of the Company’s reporting units on November 30, 2021,2023, was consistent with the one used during the 20202022 annual goodwill impairment test.
The Company made changes to certain of its assumptions utilized in the discounted cash flow models for 20212023 compared with the prior year to take into account changes in the economic environment, regulations and their impact on the Company’s businesses. The key assumptions used by the Company were as follows:
• Expected cash flows underlying the Company’s business plans for the periods 20222024 through 20262028 were used. The Company used expected cash flows for the periods 20222024 through 20312033 for the Hoover and Framebridge reporting unit.units. The expected cash flows took into account historical growth rates, the effect of the changed economic outlook at the Company’s businesses, industry challenges and an estimate for the possible impact of any applicable regulations.
• Cash flows beyond 20262028 and 2033, where applicable, were projected to grow at a long-term growth rate, which the Company estimated between 1.5% and 3% for each reporting unit.
• The Company used a discount rate of 10%9% to 17%22% to risk adjust the cash flow projections in determining the estimated fair value.
The fair value of each of the reporting units exceeded its respective carrying value as of November 30, 2021.2023.
The estimated fair valuevalues of the DekkoFramebridge and WGB reporting unit at the manufacturing businessesunits exceeded itstheir carrying valuevalues by a margin of less than 25% following a. The Company recorded goodwill impairment recordedimpairments at the WGB reporting unit in the third quarter of 2021.2023 and 2022. The total goodwill at thisthese reporting unitunits was $47.8$68.4 million as of December 31, 2021,2023, or 3%4% of the total goodwill of the Company. There exists a reasonable possibility that a decrease in the assumed projected cash flows or long-term growth rate, or an increase in the discount rate assumption used in the discounted cash flow model of thisthese reporting unit,units, could result in an additional impairment charge.charges.
The estimated fair value of the Company’s other reporting units with significant goodwill balances exceeded their respective carrying values by a margin in excess of 25%. It is possible that impairment charges could occur in the future, givenas changes in market conditions and the inherent variability in projecting future operating performance. Additional COVID-19 disruptionsperformance could result in future adverse changes in projections for future operating results or other key assumptions, such as projected revenue, profit margin, capital expenditures or cash flows associated with fair value estimates and could lead to additional future impairments, which could be material.
Indefinite-Lived Intangible Assets
The Company initially assesses qualitative factors to determine if it is more likely than not that the fair value of its indefinite-lived intangible assets is less than its carrying value. The Company compares the fair value of the indefinite-lived intangible asset with its carrying value if the qualitative factors indicate it is more likely than not that
the fair value of the asset is less than its carrying value or if it decides to bypass the qualitative assessment. The Company records an impairment loss if the carrying value of the indefinite-lived intangible assets exceeds the fair value of the assets for the difference in the values. The Company uses a discounted cash flow model, and, in certain cases, a market value approach is also utilized to supplement the discounted cash flow model to determine the estimated fair value of the indefinite-lived intangible assets. The Company makes estimates and assumptions regarding future cash flows, discount rates, long-term growth rates and other market values to determine the estimated fair value of the indefinite-lived intangible assets. The Company’s policy requires the performance of a quantitative impairment review of the indefinite-lived intangible assets at least once every three years.
The Company’s intangible assets with an indefinite life are principally from trade names, franchise rights and FCC licenses. The fair value of all the indefinite-lived intangible assets exceeded their respective carrying values as of November 30, 2021.2023. The estimated fair values of indefinite-lived intangible assets with a total carrying value of $74.0 million exceeded their carrying value by a margin of less than 10%. There is alwaysexists a reasonable possibility that impairment charges could occur in the future, givenas changes in market conditions and the inherent variability in projecting future operating performance. Additional COVID-19 disruptionsperformance could result in future adverse changes in projections for future operating results or other key assumptions, such as projected revenue, profit margin, capital expenditures or cash flows associated with fair value estimates and could lead to additional future impairments, which could be material.
Pension Costs. The Company sponsors a defined benefit pension plan for eligible employees in the U.S. Excluding curtailment gains, settlement gains and special termination benefits, the Company’s net pension credit was $111.3 million, $170.2 million and $93.0 million $55.4 millionfor 2023, 2022 and $52.7 million for 2021, 2020 and 2019, respectively. The Company’s pension benefit obligation and related credits are actuarially determined and are significantly impacted significantly by the Company’s assumptions related to future events, including the discount rate, expected return on plan assets and rate of compensation increases. The Company evaluates these critical assumptions at least annually and, periodically, evaluates other assumptions involving demographic factors, such as retirement age, mortality and turnover, and updates them to reflect its experience and expectations for the future. Actual results in any given year will often differ from actuarial assumptions because of economic and other factors.
The Company assumed a 6.25% expected return on plan assets for 2021, 20202023, 2022 and 2019.2021. The Company’s actual return (loss) on plan assets was 23.2% in 2023, (23.4%) in 2022 and 24.4% in 2021, 25.4% in 2020 and 23.9% in 2019.2021. The 10-year and 20-year actual returns on plan assets on an annual basis were 13.7%7.7% and 10.0%8.9%, respectively.
Accumulated and projected benefit obligations are measured as the present value of future cash payments. The Company discounts those cash payments using the weighted average of market-observed yields for high-quality fixed-income securities with maturities that correspond to the payment of benefits. Lower discount rates increase present values and generally increase subsequent-year pension costs; higher discount rates decrease present values and decrease subsequent-year pension costs. The Company’s discount rate at December 31, 2023, 2022 and 2021, 2020was 5.2%, 5.5% and 2019, was 2.9%, 2.5% and 3.3%, respectively, reflecting market interest rates.
Changes in key assumptions for the Company’s pension plan would have had the following effects on the 20212023 pension credit, excluding curtailment gains, settlement gains and special termination benefits:
• Expected return on assets – A 1% increase or decrease to the Company’s assumed expected return on plan assets would have increased or decreased the pension credit by approximately $22.1$24.5 million.
• Discount rate – A 1% decrease to the Company’s assumed discount rate would have decreased the pension credit by approximately $0.6$8.7 million. A 1% increase to the Company’s assumed discount rate would have increased the pension credit by approximately $18.0$7.2 million.
The Company’s net pension credit includes an expected return on plan assets component, calculated using the expected return on plan assets assumption applied to a market-related value of plan assets. The market-related value of plan assets is determined using a five-year average market value method, which recognizes realized and unrealized appreciation and depreciation in market values over a five-year period. The value resulting from applying this method is adjusted, if necessary, such that it cannot be less than 80% or more than 120% of the market value of plan assets as of the relevant measurement date. As a result, year-to-year increases or decreases in the market-related value of plan assets impact the return on plan assets component of pension credit for the year.
At the end of each year, differences between the actual return on plan assets and the expected return on plan assets are combined with other differences in actual versus expected experience to form a net unamortized actuarial gain or loss in accumulated other comprehensive income. Only those net actuarial gains or losses in excess of the deferred realized and unrealized appreciation and depreciation are potentially subject to amortization.
The types of items that generate actuarial gains and losses that may be subject to amortization in net periodic pension (credit) cost include the following:
• Asset returns that are more or less than the expected return on plan assets for the year;
• Actual participant demographic experience different from assumed (retirements, terminations and deaths during the year);
• Actual salary increases different from assumed; and
• Any changes in assumptions that are made to better reflect the anticipated experience of the plan or to reflect current market conditions on the measurement date (discount rate, longevity increases, changes in expected participant behavior and expected return on plan assets).
Amortization of the unrecognized actuarial gain or loss is included as a component of pension credit for a year if the magnitude of the net unamortized gain or loss in accumulated other comprehensive income exceeds 10% of the greater of the benefit obligation or the market-related value of assets (10% corridor). The amortization component is equal to that excess divided by the average remaining service period of active employees expected to receive benefits under the plan. At the end of 2018,2020, the Company had no net unamortized actuarial gains in accumulated other comprehensive income subject to amortization outside the 10% corridor, and therefore, no amortized gain was included in the pension credit for 2019.
During 2019, there were significant pension asset gains offset by a decrease in the discount rate and the purchase of a group annuity contract that resulted in no net unamortized actuarial gains in accumulated other comprehensive income subject to amortization outside the 10% corridor, and therefore, no amortized gain amount was included in the pension credit for 2020.
During 2020, there were significant pension asset gains offset by a further decrease in the discount rate that resulted in net unamortized actuarial gains in accumulated other comprehensive income subject to amortization outside the 10% corridor, and therefore, an amortized gain of $7.9 million was included in the pension credit for 2021.
During 2021, there were significant pension asset gains and an increase in the discount rate that resulted in net unamortized actuarial gains in accumulated other comprehensive income subject to amortization outside the 10% corridor, and therefore, an amortized gain of $68.7 million was included in the pension credit for 2022.
During 2022, there were significant pension asset losses partially offset by an increase in the discount rate that resulted in net unamortized actuarial gains in accumulated other comprehensive income subject to amortization outside the 10% corridor, and therefore, an amortized gain of $39.8 million was included in the pension credit for 2023.
During 2023, there were significant pension asset gains partially offset by a decrease in the discount rate. The Company currently estimates that there will be net unamortized actuarial gains in accumulated other comprehensive income subject to amortization outside the 10% corridor, and therefore, an amortized gain amount of $68.9$50.1 million is included in the estimated pension credit for 2022.
Overall, the Company estimates that it will record a net pension credit of approximately $179$118.0 million in 2022.2024.
Note 15 to the Company’s Consolidated Financial Statements provides additional details surrounding pension costs and related assumptions.
Accounting for Income Taxes.
Valuation Allowances
Deferred income taxes arise from temporary differences between the tax and financial statement recognition of assets and liabilities. In evaluating its ability to recover deferred tax assets within the jurisdiction from which they arise, the Company considers all available positive and negative evidence, including scheduled reversals of deferred tax liabilities, projected future taxable income, tax planning strategies and recent financial operations. These assumptions require significant judgment about forecasts of future taxable income.
As of December 31, 2021,2023, the Company had state income tax net operating loss carryforwards of $1,026.1$1,106.9 million, which will expire at various future dates. Also at December 31, 2021,2023, the Company had $87.1$112.7 million of non-U.S. income tax loss carryforwards, of which $44.2$63.4 million may be carried forward indefinitely; $12.2$45.1 million of losses that, if unutilized, will expire in varying amounts through 2026;2028; and $30.7$4.2 million of losses that, if unutilized, will start to expire after 2026.2028. At December 31, 2021,2023, the Company has established approximately $57.6$66.3 million in total valuation allowances, primarily against deferred state tax assets, net of U.S. Federal income taxes, and non-U.S. deferred tax assets, as the Company believes that it is more likely than not that the benefit from certain state and non-U.S. net operating loss carryforwards and other deferred tax assets will not be realized. The Company has established valuation allowances against state income tax benefits recognized, without considering potentially offsetting deferred tax liabilities established with respect to prepaid pension cost and goodwill. Prepaid pension cost and goodwill have not been considered a source of future taxable income for realizing deferred tax benefits recognized since these temporary differences are not likely to reverse in the foreseeable future. However, certain deferred state tax assets have an indefinite life. As a result, the Company has considered deferred tax liabilities for prepaid pension cost and goodwill as a source of future taxable income for realizing those deferred state tax assets. The valuation allowances established against state and non-U.S. income tax benefits recorded may increase or
decrease within the next 12 months, based on operating results, the market value of investment holdings or business and tax planning strategies; as a result, the Company is unable to estimate the potential tax impact, given the uncertain operating and market environment. The Company will be monitoring future operating results and projected future operating results on a quarterly basis to determine whether the valuation allowances provided against state and non-U.S. deferred tax assets should be increased or decreased, as future circumstances warrant.
Recent Accounting Pronouncements. See Note 2 to the Company’s Consolidated Financial Statements for a discussion of recent accounting pronouncements.
REPORT OF INDEPENDENT REGISTERED PUBLIC ACCOUNTING FIRMReport of Independent Registered Public Accounting Firm
To theBoard of Directors and Stockholders of Graham Holdings Company
Opinions on the Financial Statements and Internal Control over Financial Reporting
We have audited the accompanying consolidated balance sheets of Graham Holdings Company and its subsidiaries (the “Company”) as of December 31, 20212023 and 2020,2022, and the related consolidated statements of operations, of comprehensive income (loss), of changes in common stockholders' equity and of cash flows for each of the three years in the period ended December 31, 2021,2023, including the related notes (collectively referred to as the “consolidated financial statements”). We also have audited the Company's internal control over financial reporting as of December 31, 2021,2023, based on criteria established in Internal Control - Integrated Framework (2013) issued by the Committee of Sponsoring Organizations of the Treadway Commission (COSO).
In our opinion, the consolidated financial statements referred to above present fairly, in all material respects, the financial position of the Company as of December 31, 20212023 and 2020,2022, and the results of its operations and its cash flows for each of the three years in the period ended December 31, 20212023 in conformity with accounting principles generally accepted in the United States of America. Also in our opinion, the Company maintained, in all material respects, effective internal control over financial reporting as of December 31, 2021,2023, based on criteria established in Internal Control - Integrated Framework (2013) issued by the COSO.
Basis for Opinions
The Company's management is responsible for these consolidated financial statements, for maintaining effective internal control over financial reporting, and for its assessment of the effectiveness of internal control over financial reporting, included in Management’s Report on Internal Control Over Financial Reporting appearing under Item 9A. Our responsibility is to express opinions on the Company’s consolidated financial statements and on the Company's internal control over financial reporting based on our audits. We are a public accounting firm registered with the Public Company Accounting Oversight Board (United States) (PCAOB) and are required to be independent with respect to the Company in accordance with the U.S. federal securities laws and the applicable rules and regulations of the Securities and Exchange Commission and the PCAOB.
We conducted our audits in accordance with the standards of the PCAOB. Those standards require that we plan and perform the audits to obtain reasonable assurance about whether the consolidated financial statements are free of material misstatement, whether due to error or fraud, and whether effective internal control over financial reporting was maintained in all material respects.
Our audits of the consolidated financial statements included performing procedures to assess the risks of material misstatement of the consolidated financial statements, whether due to error or fraud, and performing procedures that respond to those risks. Such procedures included examining, on a test basis, evidence regarding the amounts and disclosures in the consolidated financial statements. Our audits also included evaluating the accounting principles used and significant estimates made by management, as well as evaluating the overall presentation of the consolidated financial statements. Our audit of internal control over financial reporting included obtaining an understanding of internal control over financial reporting, assessing the risk that a material weakness exists, and testing and evaluating the design and operating effectiveness of internal control based on the assessed risk. Our audits also included performing such other procedures as we considered necessary in the circumstances. We believe that our audits provide a reasonable basis for our opinions.
As described in Management’s Report on Internal Control Over Financial Reporting, management has excluded Ourisman Toyota of Richmond from its assessment of internal control over financial reporting as of December 31, 2023 because it was acquired by the Company in a purchase business combination during 2023. We have also excluded Ourisman Toyota of Richmond from our audit of internal control over financial reporting. Ourisman Toyota of Richmond is a majority-owned subsidiary whose total assets and total revenues excluded from management’s assessment and our audit of internal control over financial reporting represent less than 1% and approximately 1%, respectively, of the related consolidated financial statement amounts as of and for the year ended December 31, 2023.
Definition and Limitations of Internal Control over Financial Reporting
A company’s internal control over financial reporting is a process designed to provide reasonable assurance regarding the reliability of financial reporting and the preparation of financial statements for external purposes in accordance with generally accepted accounting principles. A company’s internal control over financial reporting includes those policies and procedures that (i) pertain to the maintenance of records that, in reasonable detail, accurately and fairly reflect the transactions and dispositions of the assets of the company; (ii) provide reasonable assurance that transactions are recorded as necessary to permit preparation of financial statements in accordance with generally accepted accounting principles, and that receipts and expenditures of the company are being made
only in accordance with authorizations of management and directors of the company; and (iii) provide reasonable assurance regarding prevention or timely detection of unauthorized acquisition, use, or disposition of the company’s assets that could have a material effect on the financial statements.
Because of its inherent limitations, internal control over financial reporting may not prevent or detect misstatements. Also, projections of any evaluation of effectiveness to future periods are subject to the risk that controls may become inadequate because of changes in conditions, or that the degree of compliance with the policies or procedures may deteriorate.
Critical Audit Matters
The critical audit matter communicated below is a matter arising from the current period audit of the consolidated financial statements that was communicated or required to be communicated to the audit committee and that (i) relates to accounts or disclosures that are material to the consolidated financial statements and (ii) involved our especially challenging, subjective, or complex judgments. The communication of critical audit matters does not alter in any way our opinion on the consolidated financial statements, taken as a whole, and we are not, by communicating the critical audit matter below, providing a separate opinion on the critical audit matter or on the accounts or disclosures to which it relates.
Interim Goodwill Impairment Assessments – Hoover and DekkoAssessment - Framebridge Reporting UnitsUnit
As described in Notes 2 and 9 to the consolidated financial statements, the Company’s consolidated goodwill balance was $1,649.6$1,525.2 million as of December 31, 2021. As2023, and as disclosed by management, the goodwill associated with the Hoover and DekkoFramebridge reporting unitsunit was $91.3$60.9 million and $47.8 million, respectively as of December 31, 2021.2023. Management reviews goodwill for possible impairment at least annually, as of November 30, or between annual tests if an event occurs or circumstances change that would more likely than not reduce the fair value of the reporting unit below its carrying value. An impairment charge is recognized for the amount by which the carrying value exceeds the reporting unit’s fair value. Management reviewsThe quantitative goodwill impairment analysis at Framebridge indicated the estimated fair value of the reporting unit exceeded its carrying value as of September 30, 2023, the interim goodwill utilizingimpairment assessment date. Management uses a discounted cash flow model. Tomodel, and, where appropriate, a market value approach is also utilized to supplement the discounted cash flow model, to determine the estimated fair value of the reporting unit, managementunits. Management makes assumptions regarding estimated future cash flows, discount rates, long-term growth rates, and market values.values to determine the estimated fair value of each reporting unit.
The principal considerations for our determination that performing procedures relating to the interim goodwill impairment assessmentsassessment of the Hoover and DekkoFramebridge reporting unitsunit is a critical audit matter are (i) the significant judgment by management when determiningdeveloping the fair value estimate of the Framebridge reporting units;unit (ii) a high degree of auditor judgment, subjectivity, and effort in performing procedures and evaluating management’s significant assumptions related to the estimated future cash flows and significant assumptions related to revenues, profit margins, and the discount rate;rate used in the discounted cash flow model; and (iii) the audit effort involved the use of professionals with specialized skill and knowledge.
Addressing the matter involved performing procedures and evaluating audit evidence in connection with forming our overall opinion on the consolidated financial statements. These procedures included testing the effectiveness of controls relating to management’s goodwill impairment assessment, including controls over the valuation of the Company’sFramebridge reporting units. unit.These procedures also included, among others,(i) testing management’s process for determiningdeveloping the fair value estimate of the Hoover and DekkoFramebridge reporting units;unit; (ii) evaluating the appropriateness of the discounted cash flow model;model used by management; (iii) testing the completeness and accuracy of underlying data used in the discounted cash flow model; and (iv) evaluating the reasonableness of the significant assumptions related to revenues, profit margins,the estimated future cash flows and the discount rate.rate used in the discounted cash flow model. Evaluating management’s assumptionsassumption related to revenues and profit marginsthe estimated future cash flows involved evaluating whether the assumptionsassumption used wereby management was reasonable considering (i) the currentpast and pastpresent performance of the Framebridge reporting unit; (ii) relevant industry forecasts and macroeconomic conditions; (iii)the consistency with external market and industry data; (iv) management’s historical forecasting accuracy; (v) consistencyand (iii) whether the assumption was consistent with evidence obtained in other areas of the audit; and (vi) the Company’s objectives and strategies.audit. Professionals with specialized skill and knowledge were used to assist in evaluating (i) the appropriateness of the discounted cash flow model and (ii) the reasonableness of the discount rate assumption.
/s/ PricewaterhouseCoopers LLP
Washington, District of Columbia
February 25, 202223, 2024
We have served as the Company’s auditor since 1946.
GRAHAM HOLDINGS COMPANY
CONSOLIDATED STATEMENTS OF OPERATIONS
| | | | | | | | | | | | | | | | | |
| | Year Ended December 31 |
| (in thousands, except per share amounts) | 2021 | | 2020 | | 2019 |
| Operating Revenues | | | | | |
| Sales of services | $ | 2,089,800 | | | $ | 2,056,228 | | | $ | 2,111,035 | |
| Sales of goods | 1,096,174 | | | 832,893 | | | 821,064 | |
| 3,185,974 | | | 2,889,121 | | | 2,932,099 | |
| Operating Costs and Expenses | | | | | |
| Cost of services sold (exclusive of items shown below) | 1,243,384 | | | 1,239,241 | | | 1,315,928 | |
| Cost of goods sold (exclusive of items shown below) | 871,137 | | | 672,865 | | | 632,318 | |
| Selling, general and administrative | 831,853 | | | 715,401 | | | 717,659 | |
| Depreciation of property, plant and equipment | 71,415 | | | 74,257 | | | 59,253 | |
| Amortization of intangible assets | 57,870 | | | 56,780 | | | 53,243 | |
| Impairment of goodwill and other long-lived assets | 32,940 | | | 30,170 | | | 9,152 | |
| | 3,108,599 | | | 2,788,714 | | | 2,787,553 | |
| Income from Operations | 77,375 | | | 100,407 | | | 144,546 | |
| Equity in earnings of affiliates, net | 17,914 | | | 6,664 | | | 11,664 | |
| Interest income | 3,409 | | | 3,871 | | | 6,151 | |
| Interest expense | (33,943) | | | (38,310) | | | (29,779) | |
| Non-operating pension and postretirement benefit income, net | 109,230 | | | 59,315 | | | 162,798 | |
| Gain on marketable equity securities, net | 243,088 | | | 60,787 | | | 98,668 | |
| Other income, net | 32,554 | | | 214,534 | | | 32,431 | |
| Income Before Income Taxes | 449,627 | | | 407,268 | | | 426,479 | |
| Provision for Income Taxes | 96,300 | | | 107,300 | | | 98,600 | |
| | | | | |
| | | | | |
| Net Income | 353,327 | | | 299,968 | | | 327,879 | |
| Net (Income) Loss Attributable to Noncontrolling Interests | (1,252) | | | 397 | | | (24) | |
| | | | | |
| | | | | |
| Net Income Attributable to Graham Holdings Company Common Stockholders | $ | 352,075 | | | $ | 300,365 | | | $ | 327,855 | |
| | | | | |
| | | | | |
| | | | | |
| | | | | |
| Per Share Information Attributable to Graham Holdings Company Common Stockholders | | |
| |
|
| | | | | |
| | | | | |
| Basic net income per common share | $ | 70.65 | | | $ | 58.30 | | | $ | 61.70 | |
| Basic average number of common shares outstanding | 4,951 | | | 5,124 | | | 5,285 | |
| | | | | |
| | | | | |
| Diluted net income per common share | $ | 70.45 | | | $ | 58.13 | | | $ | 61.21 | |
| Diluted average number of common shares outstanding | 4,965 | | | 5,139 | | | 5,327 | |
See accompanying Notes to Consolidated Financial Statements.
GRAHAM HOLDINGS COMPANY
CONSOLIDATED STATEMENTS OF COMPREHENSIVE INCOME
| | | | | | | | | | | | | | | | | |
| | Year Ended December 31 |
| (in thousands) | 2021 | | 2020 | | 2019 |
| Net Income | $ | 353,327 | | | $ | 299,968 | | | $ | 327,879 | |
| Other Comprehensive Income, Before Tax | | | | | |
| Foreign currency translation adjustments: | | | | | |
| Translation adjustments arising during the year | (16,052) | | | 31,642 | | | 5,371 | |
| Adjustment for sale of a business with foreign operations | — | | | — | | | 2,011 | |
| | (16,052) | | | 31,642 | | | 7,382 | |
| Pension and other postretirement plans: | | | | | |
| Actuarial gain | 519,595 | | | 365,164 | | | 231,104 | |
| Prior service cost | (2) | | | (69) | | | (5,725) | |
| Amortization of net actuarial (gain) loss included in net income | (5,486) | | | 1,219 | | | (2,046) | |
| Amortization of net prior service cost (credit) included in net income | 3,170 | | | 2,680 | | | (4,142) | |
| | | | | |
| Settlements included in net income | (120) | | | — | | | (91,676) | |
| | | | | |
| | | | | |
| | 517,157 | | | 368,994 | | | 127,515 | |
| Cash flow hedges gain (loss) | 349 | | | (1,282) | | | (1,344) | |
| Other Comprehensive Income, Before Tax | 501,454 | | | 399,354 | | | 133,553 | |
| Income tax expense related to items of other comprehensive income | (133,380) | | | (99,335) | | | (34,087) | |
| Other Comprehensive Income, Net of Tax | 368,074 | | | 300,019 | | | 99,466 | |
| Comprehensive Income | 721,401 | | | 599,987 | | | 427,345 | |
| Comprehensive (income) loss attributable to noncontrolling interests | (1,252) | | | 397 | | | (24) | |
| Total Comprehensive Income Attributable to Graham Holdings Company | $ | 720,149 | | | $ | 600,384 | | | $ | 427,321 | |
See accompanying Notes to Consolidated Financial Statements.
GRAHAM HOLDINGS COMPANY
CONSOLIDATED BALANCE SHEETS
| | | | | | | | | | | |
| | As of December 31 |
| (In thousands, except share amounts) | 2021 | | 2020 |
| Assets | | | |
| Current Assets | | | |
| Cash and cash equivalents | $ | 145,886 | | | $ | 413,991 | |
| Restricted cash | 12,175 | | | 9,063 | |
| Investments in marketable equity securities and other investments | 824,445 | | | 587,582 | |
| Accounts receivable, net | 607,471 | | | 537,156 | |
| Inventories and contracts in progress | 141,471 | | | 120,622 | |
| | | |
| Prepaid expenses | 81,741 | | | 75,523 | |
| Income taxes receivable | 32,744 | | | 29,313 | |
| Other current assets | 1,241 | | | 942 | |
| | | |
| Total Current Assets | 1,847,174 | | | 1,774,192 | |
| Property, Plant and Equipment, Net | 468,126 | | | 378,286 | |
| Lease Right-of-Use Assets | 437,969 | | | 462,560 | |
| Investments in Affiliates | 155,444 | | | 155,777 | |
| Goodwill, Net | 1,649,582 | | | 1,484,750 | |
| Indefinite-Lived Intangible Assets | 142,180 | | | 120,437 | |
| Amortized Intangible Assets, Net | 247,120 | | | 204,646 | |
| Prepaid Pension Cost | 2,306,514 | | | 1,708,305 | |
| Deferred Income Taxes | 7,900 | | | 8,396 | |
| Deferred Charges and Other Assets (includes $782 and $0 of restricted cash) | 163,516 | | | 146,770 | |
| | | |
| Total Assets | $ | 7,425,525 | | | $ | 6,444,119 | |
| | | |
| Liabilities and Equity | | | |
| Current Liabilities | | | |
| Accounts payable and accrued liabilities | $ | 583,629 | | | $ | 520,236 | |
| Deferred revenue | 358,720 | | | 331,021 | |
| Income taxes payable | 4,585 | | | 5,140 | |
| Current portion of lease liabilities | 77,655 | | | 86,797 | |
| Current portion of long-term debt | 141,749 | | | 6,452 | |
| | | |
| Total Current Liabilities | 1,166,338 | | | 949,646 | |
| | | |
| Accrued Compensation and Related Benefits | 175,391 | | | 201,918 | |
| Other Liabilities | 36,497 | | | 48,768 | |
| Deferred Income Taxes | 676,706 | | | 521,274 | |
| Mandatorily Redeemable Noncontrolling Interest | 13,661 | | | 9,240 | |
| Lease Liabilities | 405,200 | | | 428,849 | |
| Long-Term Debt | 525,752 | | | 506,103 | |
| | | |
| Total Liabilities | 2,999,545 | | | 2,665,798 | |
Commitments and Contingencies (Note 18) | 0 | | 0 |
| Redeemable Noncontrolling Interests | 14,311 | | | 11,928 | |
| | | |
| | | |
Preferred Stock, $1 par value; 977,000 shares authorized, none issued | — | | | — | |
| | | |
| Common Stockholders’ Equity | | | |
| Common stock | | | |
Class A Common stock, $1 par value; 7,000,000 shares authorized; 964,001 shares issued and outstanding | 964 | | | 964 | |
| Class B Common stock, $1 par value; 40,000,000 shares authorized; 19,035,999 shares issued; 3,942,065 and 4,018,832 shares outstanding | 19,036 | | | 19,036 | |
| Capital in excess of par value | 389,456 | | | 388,159 | |
| Retained earnings | 7,126,761 | | | 6,804,822 | |
| Accumulated other comprehensive income, net of taxes | | | |
| Cumulative foreign currency translation adjustment | (6,298) | | | 9,754 | |
| Unrealized gain on pensions and other postretirement plans | 979,157 | | | 595,287 | |
| Cash flow hedges | (1,471) | | | (1,727) | |
Cost of 15,093,934 and 15,017,167 shares of Class B common stock held in treasury | (4,108,022) | | | (4,056,993) | |
| Total Common Stockholders’ Equity | 4,399,583 | | | 3,759,302 | |
| Noncontrolling Interests | 12,086 | | | 7,091 | |
| Total Equity | 4,411,669 | | | 3,766,393 | |
| Total Liabilities and Equity | $ | 7,425,525 | | | $ | 6,444,119 | |
See accompanying Notes to Consolidated Financial Statements.
GRAHAM HOLDINGS COMPANY
CONSOLIDATED STATEMENTS OF CASH FLOWSOPERATIONS
| | | | | | | | | | | | | | | | | |
| | Year Ended December 31 |
| (In thousands) | 2021 | | 2020 | | 2019 |
| Cash Flows from Operating Activities | | | | | |
| Net Income | $ | 353,327 | | | $ | 299,968 | | | $ | 327,879 | |
| Adjustments to reconcile net income to net cash provided by operating activities: | | | | | |
| Depreciation, amortization and goodwill and other long-lived asset impairment | 162,225 | | | 161,207 | | | 121,648 | |
| Amortization of lease right-of-use asset | 73,752 | | | 89,956 | | | 84,185 | |
| Net pension benefit, settlement, and special separation benefit expense | (91,898) | | | (41,573) | | | (137,909) | |
| Gain on marketable equity securities and cost method investments, net | (254,844) | | | (57,669) | | | (103,748) | |
| Credit loss expense and provision for other receivables | 6,824 | | | 10,667 | | | 22,726 | |
| Stock-based compensation expense, net | 5,659 | | | 6,348 | | | 6,278 | |
| Contingent consideration fair value measurements and accretion | (4,207) | | | 2,895 | | | — | |
| | | | | |
| Foreign exchange loss | 179 | | | 2,153 | | | 1,070 | |
| | | | | |
| Gain on disposition and write-downs of businesses, property, plant and equipment, investments and other assets, net | (8,554) | | | (214,926) | | | (28,346) | |
| | | | | |
| Equity in earnings of affiliates, net of distributions | 4,917 | | | 6,592 | | | (2,678) | |
| Provision for deferred income taxes | 65,046 | | | 14,377 | | | 69,751 | |
| | | | | |
| Change in operating assets and liabilities: | | | | | |
| Accounts receivable | (59,292) | | | 61,328 | | | (53,602) | |
| Inventories | 4,551 | | | 3,786 | | | (5,317) | |
| Accounts payable and accrued liabilities | 32,397 | | | (32,714) | | | (47,069) | |
| Deferred revenue | 19,086 | | | (25,728) | | | 30,487 | |
| Income taxes receivable/payable | (8,689) | | | 3,310 | | | 1,828 | |
| Lease liabilities | (85,147) | | | (91,478) | | | (88,597) | |
| Other assets and other liabilities, net | (14,144) | | | 11,735 | | | (33,655) | |
| Other | 1,238 | | | 429 | | | 233 | |
| Net Cash Provided by Operating Activities | 202,426 | | | 210,663 | | | 165,164 | |
| Cash Flows from Investing Activities | | | | | |
| Investments in certain businesses, net of cash acquired | (351,882) | | | (20,080) | | | (179,421) | |
| Purchases of property, plant and equipment | (162,537) | | | (69,591) | | | (93,504) | |
| Proceeds from sales of marketable equity securities | 65,499 | | | 93,775 | | | 19,303 | |
| Purchases of marketable equity securities | (48,036) | | | (20,004) | | | (7,499) | |
| Net proceeds from sales of businesses, property, plant and equipment and other assets | 10,295 | | | 225,570 | | | 54,495 | |
| Investments in equity affiliates, cost method and other investments | (8,531) | | | (12,367) | | | (27,529) | |
| | | | | |
| Loans to related party | — | | | — | | | (3,500) | |
| | | | | |
| | | | | |
| | | | | |
| Other | 557 | | | 2,068 | | | 920 | |
| Net Cash (Used in) Provided by Investing Activities | (494,635) | | | 199,371 | | | (236,735) | |
| Cash Flows from Financing Activities | | | | | |
| Net borrowings under revolving credit facilities | 134,696 | | | 76,241 | | | — | |
| Issuance of borrowings | 70,184 | | | 2,084 | | | 41,250 | |
| Common shares repurchased | (55,683) | | | (161,829) | | | (2,103) | |
| Repayments of borrowings | (49,645) | | | (83,360) | | | (8,702) | |
| Deferred payments of acquisitions | (30,866) | | | (19,348) | | | (2,255) | |
| Dividends paid | (30,136) | | | (29,970) | | | (29,553) | |
| Net (repayments of) proceeds from vehicle floor plan payable | (10,563) | | | (14,160) | | | 14,384 | |
| Issuance of noncontrolling interest | 3,777 | | | — | | | 6,000 | |
| Purchase of noncontrolling interest | (3,508) | | | — | | | (550) | |
| Proceeds from (repayments of) bank overdrafts | 3,410 | | | 1,636 | | | (185) | |
| Proceeds from exercise of stock options | — | | | 25,129 | | | 481 | |
| | | | | |
| Other | (639) | | | (425) | | | (33) | |
| Net Cash Provided by (Used in) Financing Activities | 31,027 | | | (204,002) | | | 18,734 | |
| Effect of Currency Exchange Rate Change | (3,029) | | | 2,978 | | | 2,766 | |
| Net (Decrease) Increase in Cash and Cash Equivalents and Restricted Cash | (264,211) | | | 209,010 | | | (50,071) | |
| Cash and Cash Equivalents and Restricted Cash at Beginning of Year | 423,054 | | | 214,044 | | | 264,115 | |
| Cash and Cash Equivalents and Restricted Cash at End of Year | $ | 158,843 | | | $ | 423,054 | | | $ | 214,044 | |
| Supplemental Cash Flow Information | | | | | |
| Cash paid during the year for: | | | | | |
| Income taxes | $ | 39,000 | | | $ | 91,000 | | | $ | 28,000 | |
| Interest | $ | 30,000 | | | $ | 31,000 | | | $ | 30,000 | |
| | | | | | | | | | | | | | | | | |
| | Year Ended December 31 |
| (in thousands, except per share amounts) | 2023 | | 2022 | | 2021 |
| Operating Revenues | | | | | |
| Sales of services | $ | 2,484,327 | | | $ | 2,328,869 | | | $ | 2,089,800 | |
| Sales of goods | 1,930,550 | | | 1,595,624 | | | 1,096,174 | |
| 4,414,877 | | | 3,924,493 | | | 3,185,974 | |
| Operating Costs and Expenses | | | | | |
| Cost of services sold (exclusive of items shown below) | 1,468,114 | | | 1,346,519 | | | 1,243,384 | |
| Cost of goods sold (exclusive of items shown below) | 1,634,820 | | | 1,311,199 | | | 871,137 | |
| Selling, general and administrative | 1,007,381 | | | 921,739 | | | 831,853 | |
| Depreciation of property, plant and equipment | 86,064 | | | 73,297 | | | 71,415 | |
| Amortization of intangible assets | 50,039 | | | 58,851 | | | 57,870 | |
| Impairment of goodwill and other long-lived assets | 99,066 | | | 128,990 | | | 32,940 | |
| | 4,345,484 | | | 3,840,595 | | | 3,108,599 | |
| Income from Operations | 69,393 | | | 83,898 | | | 77,375 | |
| Equity in (losses) earnings of affiliates, net | (5,183) | | | (2,837) | | | 17,914 | |
| Interest income | 7,122 | | | 3,226 | | | 3,409 | |
| Interest expense | (63,301) | | | (54,403) | | | (33,943) | |
| Non-operating pension and postretirement benefit income, net | 133,812 | | | 197,939 | | | 109,230 | |
| Gain (loss) on marketable equity securities, net | 138,067 | | | (139,589) | | | 243,088 | |
| Other income, net | 19,094 | | | 33,500 | | | 32,554 | |
| Income Before Income Taxes | 299,004 | | | 121,734 | | | 449,627 | |
| Provision for Income Taxes | 87,300 | | | 51,300 | | | 96,300 | |
| Net Income | 211,704 | | | 70,434 | | | 353,327 | |
| Net Income Attributable to Noncontrolling Interests | (6,416) | | | (3,355) | | | (1,252) | |
| Net Income Attributable to Graham Holdings Company Common Stockholders | $ | 205,288 | | | $ | 67,079 | | | $ | 352,075 | |
| | | | | |
| Per Share Information Attributable to Graham Holdings Company Common Stockholders | | |
| |
|
| Basic net income per common share | $ | 43.96 | | | $ | 13.83 | | | $ | 70.65 | |
| Basic average number of common shares outstanding | 4,639 | | | 4,823 | | | 4,951 | |
| Diluted net income per common share | $ | 43.82 | | | $ | 13.79 | | | $ | 70.45 | |
| Diluted average number of common shares outstanding | 4,654 | | | 4,836 | | | 4,965 | |
See accompanying Notes to Consolidated Financial Statements.
GRAHAM HOLDINGS COMPANY
CONSOLIDATED STATEMENTS OF CHANGES IN COMMON STOCKHOLDERS’ EQUITYCOMPREHENSIVE INCOME (LOSS)
| | | | | | | | | | | | | | | | | | | | | | | | | | | | | | | | |
| (in thousands) | Class A
Common
Stock | Class B
Common
Stock | Capital in
Excess of
Par Value | Retained
Earnings | Accumulated Other Comprehensive Income | Treasury
Stock | Noncontrolling
Interest | Total Equity | | Redeemable Noncontrolling Interest |
| As of December 31, 2018 | $ | 964 | | $ | 19,036 | | $ | 378,837 | | $ | 6,236,125 | | $ | 203,829 | | $ | (3,922,009) | | $ | — | | $ | 2,916,782 | | | $ | 4,346 | |
| Net income for the year | | | | 327,879 | | | | | 327,879 | | | |
| Issuance of noncontrolling interest | | | | | | | 6,556 | | 6,556 | | | |
| Acquisition of redeemable noncontrolling interest | | | | | | | | — | | | 1,715 | |
| Net loss attributable to noncontrolling interest | | | | 152 | | | | (152) | | — | | | |
| Acquisition of noncontrolling interest | | | | | | | 1,153 | | 1,153 | | | |
| Net income attributable to redeemable noncontrolling interests | | | | (176) | | | | | (176) | | | 176 | |
| Change in redemption value of redeemable noncontrolling interests | | | 32 | | | | | | 32 | | | (32) | |
| Dividends paid on common stock | | | | (29,553) | | | | | (29,553) | | | |
| Repurchase of Class B common stock | | | | | | (2,103) | | | (2,103) | | | |
| Issuance of Class B common stock, net of restricted stock award forfeitures | | | (3,721) | | | | 3,960 | | | 239 | | | |
| Amortization of unearned stock compensation and stock option expense | | | 6,521 | | | | | | 6,521 | | | |
| Other comprehensive income, net of income taxes | | | | | 99,466 | | | | 99,466 | | | |
| Purchase of redeemable noncontrolling interest | | | | | | | | — | | | (550) | |
| As of December 31, 2019 | 964 | | 19,036 | | 381,669 | | 6,534,427 | | 303,295 | | (3,920,152) | | 7,557 | | 3,326,796 | | | 5,655 | |
| Net income for the year | | | | 299,968 | | | | | 299,968 | | | |
| | | | | | | | | | |
| Net loss attributable to noncontrolling interest | | | | 386 | | | | (386) | | — | | | |
| Acquisition of redeemable noncontrolling interest | | | | | | | | — | | | 6,005 | |
| | | | | | | | | | |
| Net loss attributable to redeemable noncontrolling interests | | | | 11 | | | | | 11 | | | (11) | |
| Change in redemption value of redeemable noncontrolling interests | | | | | | | 273 | | 273 | | | 279 | |
| Distribution to noncontrolling interest | | | | | | | (353) | | (353) | | | |
| Dividends paid on common stock | | | | (29,970) | | | | | (29,970) | | | |
| Repurchase of Class B common stock | | | | | | (161,829) | | | (161,829) | | | |
| Issuance of Class B common stock, net of restricted stock award forfeitures | | | (411) | | | | 24,988 | | | 24,577 | | | |
| Amortization of unearned stock compensation and stock option expense | | | 6,901 | | | | | | 6,901 | | | |
| Other comprehensive income, net of income taxes | | | | | 300,019 | | | | 300,019 | | | |
| As of December 31, 2020 | 964 | | 19,036 | | 388,159 | | 6,804,822 | | 603,314 | | (4,056,993) | | 7,091 | | 3,766,393 | | | 11,928 | |
| Net income for the year | | | | 353,327 | | | | | 353,327 | | | |
| Noncontrolling interest capital contribution | | | | | | | 3,350 | | 3,350 | | | |
| Net income attributable to noncontrolling interests | | | | (1,943) | | | | 1,943 | | — | | | |
| Acquisition of redeemable noncontrolling interest | | | | | | | | — | | | 6,617 | |
| Net loss attributable to redeemable noncontrolling interests | | | | 691 | | | | | 691 | | | (691) | |
| Change in redemption value of redeemable noncontrolling interests | | | 292 | | | | | 257 | | 549 | | | (35) | |
| Distribution to noncontrolling interest | | | | | | | (555) | | (555) | | | |
| Dividends paid on common stock | | | | (30,136) | | | | | (30,136) | | | |
| Repurchase of Class B common stock | | | | | | (55,683) | | | (55,683) | | | |
| Issuance of Class B common stock, net of restricted stock award forfeitures | | | (5,593) | | | | 4,654 | | | (939) | | | |
| Amortization of unearned stock compensation and stock option expense | | | 6,598 | | | | | | 6,598 | | | |
| Other comprehensive income, net of income taxes | | | | | 368,074 | | | | 368,074 | | | |
| Purchase of redeemable noncontrolling interest | | | | | | | | — | | | (3,508) | |
| As of December 31, 2021 | $ | 964 | | $ | 19,036 | | $ | 389,456 | | $ | 7,126,761 | | $ | 971,388 | | $ | (4,108,022) | | $ | 12,086 | | $ | 4,411,669 | | | $ | 14,311 | |
| | | | | | | | | | | | | | | | | |
| | Year Ended December 31 |
| (in thousands) | 2023 | | 2022 | | 2021 |
| Net Income | $ | 211,704 | | | $ | 70,434 | | | $ | 353,327 | |
| Other Comprehensive Income (Loss), Before Tax | | | | | |
| Foreign currency translation adjustments: | | | | | |
| | | | | |
| | | | | |
| Translation adjustments arising during the year | 21,927 | | | (48,340) | | | (16,052) | |
| Pension and other postretirement plans: | | | | | |
| Actuarial gain (loss) | 380,593 | | | (727,097) | | | 519,595 | |
| Prior service credit (cost) | 11,263 | | | — | | | (2) | |
| Amortization of net actuarial gain included in net income | (42,146) | | | (70,833) | | | (5,486) | |
| Amortization of net prior service cost included in net income | 1,641 | | | 2,864 | | | 3,170 | |
| | | | | |
| Settlement included in net income | (1,087) | | | — | | | (120) | |
| | | | | |
| | | | | |
| | 350,264 | | | (795,066) | | | 517,157 | |
| Cash flow hedges (loss) gain | (5,630) | | | 4,765 | | | 349 | |
| Other Comprehensive Income (Loss), Before Tax | 366,561 | | | (838,641) | | | 501,454 | |
| Income tax (expense) benefit related to items of other comprehensive income (loss) | (88,375) | | | 203,404 | | | (133,380) | |
| Other Comprehensive Income (Loss), Net of Tax | 278,186 | | | (635,237) | | | 368,074 | |
| Comprehensive Income (Loss) | 489,890 | | | (564,803) | | | 721,401 | |
| Comprehensive income attributable to noncontrolling interests | (6,416) | | | (3,355) | | | (1,252) | |
| Total Comprehensive Income (Loss) Attributable to Graham Holdings Company | $ | 483,474 | | | $ | (568,158) | | | $ | 720,149 | |
See accompanying Notes to Consolidated Financial Statements.
GRAHAM HOLDINGS COMPANY
CONSOLIDATED BALANCE SHEETS
| | | | | | | | | | | |
| | As of December 31 |
| (In thousands, except share amounts) | 2023 | | 2022 |
| Assets | | | |
| Current Assets | | | |
| Cash and cash equivalents | $ | 169,897 | | | $ | 169,319 | |
| Restricted cash | 31,994 | | | 20,467 | |
| Investments in marketable equity securities and other investments | 697,028 | | | 622,408 | |
| Accounts receivable, net | 525,087 | | | 531,941 | |
| Inventories and contracts in progress | 297,211 | | | 226,811 | |
| Prepaid expenses | 119,933 | | | 97,450 | |
| Income taxes receivable | 6,848 | | | 9,313 | |
| Other current assets | 1,298 | | | 1,547 | |
| | | |
| Total Current Assets | 1,849,296 | | | 1,679,256 | |
| Property, Plant and Equipment, Net | 560,314 | | | 503,000 | |
| Lease Right-of-Use Assets | 409,183 | | | 429,403 | |
| Investments in Affiliates | 186,480 | | | 186,419 | |
| Goodwill, Net | 1,525,194 | | | 1,560,953 | |
| Indefinite-Lived Intangible Assets | 187,862 | | | 178,934 | |
| Amortized Intangible Assets, Net | 112,194 | | | 161,422 | |
| Prepaid Pension Cost | 2,113,638 | | | 1,658,046 | |
| Deferred Income Taxes | 10,578 | | | 6,812 | |
| Deferred Charges and Other Assets (includes $0 and $646 of restricted cash) | 232,991 | | | 189,132 | |
| | | |
| Total Assets | $ | 7,187,730 | | | $ | 6,553,377 | |
| | | |
| Liabilities and Equity | | | |
| Current Liabilities | | | |
| Accounts payable, vehicle floor plan payable and accrued liabilities | $ | 694,521 | | | $ | 574,287 | |
| Deferred revenue | 396,754 | | | 341,296 | |
| Income taxes payable | 7,406 | | | 3,766 | |
| Current portion of lease liabilities | 64,247 | | | 70,007 | |
| Current portion of long-term debt | 66,751 | | | 155,813 | |
| | | |
| Total Current Liabilities | 1,229,679 | | | 1,145,169 | |
| | | |
| Accrued Compensation and Related Benefits | 137,275 | | | 134,921 | |
| Other Liabilities | 32,076 | | | 37,506 | |
| Deferred Income Taxes | 600,124 | | | 466,275 | |
| Mandatorily Redeemable Noncontrolling Interest | 40,764 | | | 30,845 | |
| Lease Liabilities | 376,677 | | | 393,626 | |
| Long-Term Debt | 745,082 | | | 570,547 | |
| | | |
| Total Liabilities | 3,161,677 | | | 2,778,889 | |
Commitments and Contingencies (Note 18) | | | |
| Redeemable Noncontrolling Interests | 24,185 | | | 21,827 | |
Preferred Stock, $1 par value; 977,000 shares authorized, none issued | — | | | — | |
| | | |
| Common Stockholders’ Equity | | | |
| Common stock | | | |
Class A Common stock, $1 par value; 7,000,000 shares authorized; 964,001 shares issued and outstanding | 964 | | | 964 | |
Class B Common stock, $1 par value; 40,000,000 shares authorized; 19,035,999 shares issued; 3,514,809 and 3,822,601 shares outstanding | 19,036 | | | 19,036 | |
| Capital in excess of par value | 372,040 | | | 390,438 | |
| Retained earnings | 7,337,463 | | | 7,163,128 | |
| Accumulated other comprehensive income, net of taxes | | | |
| Cumulative foreign currency translation adjustment | (32,711) | | | (54,638) | |
| Unrealized gain on pensions and other postretirement plans | 649,185 | | | 388,591 | |
| Cash flow hedges | (2,137) | | | 2,198 | |
Cost of 15,521,190 and 15,213,398 shares of Class B common stock held in treasury | (4,368,103) | | | (4,178,334) | |
| Total Common Stockholders’ Equity | 3,975,737 | | | 3,731,383 | |
| Noncontrolling Interests | 26,131 | | | 21,278 | |
| Total Equity | 4,001,868 | | | 3,752,661 | |
| Total Liabilities and Equity | $ | 7,187,730 | | | $ | 6,553,377 | |
See accompanying Notes to Consolidated Financial Statements.
GRAHAM HOLDINGS COMPANY
CONSOLIDATED STATEMENTS OF CASH FLOWS
| | | | | | | | | | | | | | | | | |
| | Year Ended December 31 |
| (In thousands) | 2023 | | 2022 | | 2021 |
| Cash Flows from Operating Activities | | | | | |
| Net Income | $ | 211,704 | | | $ | 70,434 | | | $ | 353,327 | |
| Adjustments to reconcile net income to net cash provided by operating activities: | | | | | |
| Depreciation, amortization and goodwill and other long-lived asset impairment | 235,169 | | | 261,138 | | | 162,225 | |
| Amortization of lease right-of-use asset | 67,734 | | | 67,568 | | | 73,752 | |
| Net pension benefit and special separation benefit expense | (101,398) | | | (166,611) | | | (91,898) | |
| (Gain) loss on marketable equity securities and cost method investments, net | (140,671) | | | 134,011 | | | (254,844) | |
| Credit loss expense and provision for other receivables | 6,045 | | | 2,958 | | | 6,824 | |
| Stock-based compensation expense, net of forfeitures | 6,712 | | | 6,121 | | | 5,659 | |
| Accretion expense and change in fair value of contingent consideration liabilities | (6,593) | | | (5,105) | | | (4,207) | |
| | | | | |
| Foreign exchange loss | 1,141 | | | 2,023 | | | 179 | |
| | | | | |
| Gain on disposition of businesses, property, plant and equipment, investments and other assets, net | (11,811) | | | (24,220) | | | (8,554) | |
| | | | | |
| Equity in losses (earnings) of affiliates, net of distributions | 20,751 | | | 13,503 | | | 4,917 | |
| Provision for (benefit from) deferred income taxes | 43,765 | | | (3,844) | | | 65,046 | |
| | | | | |
| Change in operating assets and liabilities: | | | | | |
| Accounts receivable | 8,231 | | | 45,518 | | | (47,430) | |
| Inventories | (62,873) | | | (64,324) | | | 4,551 | |
| Accounts payable and accrued liabilities | 24,695 | | | (33,588) | | | 32,397 | |
| Deferred revenue | 38,497 | | | 18,219 | | | 7,224 | |
| Income taxes receivable/payable | 6,152 | | | 6,766 | | | (8,689) | |
| Lease liabilities | (71,471) | | | (78,471) | | | (85,147) | |
| Other assets and other liabilities, net | (12,166) | | | (21,275) | | | (14,144) | |
| Other | (3,738) | | | 4,783 | | | 1,238 | |
| Net Cash Provided by Operating Activities | 259,875 | | | 235,604 | | | 202,426 | |
| Cash Flows from Investing Activities | | | | | |
| Purchases of property, plant and equipment | (93,447) | | | (82,684) | | | (162,537) | |
| Investments in certain businesses, net of cash acquired | (78,149) | | | (130,106) | | | (351,882) | |
| Proceeds from sales of marketable equity securities | 61,979 | | | 102,040 | | | 65,499 | |
| Loan to related party | (30,000) | | | — | | | — | |
| | | | | |
| Investments in equity affiliates, cost method and other investments | (14,050) | | | (38,894) | | | (8,531) | |
| Purchases of marketable equity securities | (6,162) | | | (40,518) | | | (48,036) | |
| | | | | |
| Net proceeds from sales of businesses, property, plant and equipment and other assets | 4,294 | | | 5,057 | | | 10,295 | |
| | | | | |
| | | | | |
| | | | | |
| Other | 2,560 | | | 1,039 | | | 557 | |
| Net Cash Used in Investing Activities | (152,975) | | | (184,066) | | | (494,635) | |
| Cash Flows from Financing Activities | | | | | |
| Issuance of borrowings | 293,387 | | | 77,299 | | | 70,184 | |
| Common shares repurchased | (193,160) | | | (71,386) | | | (55,683) | |
| Repayments of borrowings | (121,744) | | | (14,484) | | | (49,645) | |
| Net borrowings under revolving credit facilities | (104,244) | | | 3,000 | | | 134,696 | |
| Net proceeds from (repayments of) vehicle floor plan payable | 73,732 | | | 26,230 | | | (10,563) | |
| Dividends paid | (30,953) | | | (30,712) | | | (30,136) | |
| Deferred payments of acquisitions | (5,328) | | | (5,731) | | | (30,866) | |
| | | | | |
| Distributions paid to noncontrolling interests | (5,306) | | | (2,978) | | | (639) | |
| Purchase of noncontrolling interest | (4,988) | | | (1,200) | | | (3,508) | |
| Issuance of noncontrolling interest | 3,931 | | | 4,918 | | | 3,777 | |
| Proceeds from sale of noncontrolling interest | — | | | 3,200 | | | — | |
| | | | | |
| | | | | |
| | | | | |
| | | | | |
| | | | | |
| | | | | |
| Other | (5,162) | | | (6,263) | | | 3,410 | |
| Net Cash (Used in) Provided by Financing Activities | (99,835) | | | (18,107) | | | 31,027 | |
| Effect of Currency Exchange Rate Change | 4,394 | | | (1,842) | | | (3,029) | |
| Net Increase (Decrease) in Cash and Cash Equivalents and Restricted Cash | 11,459 | | | 31,589 | | | (264,211) | |
| Cash and Cash Equivalents and Restricted Cash at Beginning of Year | 190,432 | | | 158,843 | | | 423,054 | |
| Cash and Cash Equivalents and Restricted Cash at End of Year | $ | 201,891 | | | $ | 190,432 | | | $ | 158,843 | |
| Supplemental Cash Flow Information | | | | | |
| Cash paid during the year for: | | | | | |
| Income taxes | $ | 39,000 | | | $ | 48,000 | | | $ | 39,000 | |
| Interest | $ | 51,000 | | | $ | 37,000 | | | $ | 30,000 | |
See accompanying Notes to Consolidated Financial Statements.
GRAHAM HOLDINGS COMPANY
CONSOLIDATED STATEMENTS OF CHANGES IN COMMON STOCKHOLDERS’ EQUITY
| | | | | | | | | | | | | | | | | | | | | | | | | | | | | | | | |
| (in thousands) | Class A
Common
Stock | Class B
Common
Stock | Capital in
Excess of
Par Value | Retained
Earnings | Accumulated Other Comprehensive Income | Treasury
Stock | Noncontrolling
Interest | Total Equity | | Redeemable Noncontrolling Interest |
| As of December 31, 2020 | $ | 964 | | $ | 19,036 | | $ | 388,159 | | $ | 6,804,822 | | $ | 603,314 | | $ | (4,056,993) | | $ | 7,091 | | $ | 3,766,393 | | | $ | 11,928 | |
| Net income for the year | | | | 353,327 | | | | | 353,327 | | | |
| Noncontrolling interest capital contribution | | | | | | | 3,350 | | 3,350 | | | |
| Net income attributable to noncontrolling interests | | | | (1,943) | | | | 1,943 | | — | | | |
| Acquisition of redeemable noncontrolling interest | | | | | | | | — | | | 6,617 | |
| | | | | | | | | | |
| Net loss attributable to redeemable noncontrolling interests | | | | 691 | | | | | 691 | | | (691) | |
| Change in redemption value of redeemable noncontrolling interests | | | 292 | | | | | 257 | | 549 | | | (35) | |
| Distribution to noncontrolling interest | | | | | | | (555) | | (555) | | | |
| Dividends paid on common stock | | | | (30,136) | | | | | (30,136) | | | |
| Repurchase of Class B common stock | | | | | | (55,683) | | | (55,683) | | | |
| Issuance of Class B common stock, net of restricted stock award forfeitures | | | (5,593) | | | | 4,654 | | | (939) | | | |
| Amortization of unearned stock compensation and stock option expense | | | 6,598 | | | | | | 6,598 | | | |
| Other comprehensive income, net of income taxes | | | | | 368,074 | | | | 368,074 | | | |
| Purchase of redeemable noncontrolling interest | | | | | | | | — | | | (3,508) | |
| As of December 31, 2021 | 964 | | 19,036 | | 389,456 | | 7,126,761 | | 971,388 | | (4,108,022) | | 12,086 | | 4,411,669 | | | 14,311 | |
| Net income for the year | | | | 70,434 | | | | | 70,434 | | | |
| | | | | | | | | | |
| Noncontrolling interest capital contributions | | | | | | | 3,900 | | 3,900 | | | 1,050 | |
| Acquisition of noncontrolling interest | | | | | | | 512 | | 512 | | | |
| Sale of equity in subsidiary | | | 146 | | | | | 3,054 | | 3,200 | | | |
| Net income attributable to noncontrolling interests | | | | (3,384) | | | | 3,384 | | — | | | |
| Acquisition of redeemable noncontrolling interest | | | | | | | | — | | | 2,164 | |
| Net loss attributable to redeemable noncontrolling interests | | | | 29 | | | | | 29 | | | (29) | |
| Change in redemption value of redeemable noncontrolling interests | | | (6,027) | | | | | 247 | | (5,780) | | | 6,281 | |
| Distribution to noncontrolling interests | | | | | | | (1,905) | | (1,905) | | | (750) | |
| Dividends paid on common stock | | | | (30,712) | | | | | (30,712) | | | |
| Repurchase of Class B common stock | | | | | | (71,386) | | | (71,386) | | | |
| Issuance of Class B common stock, net of restricted stock award forfeitures | | | (733) | | | | 1,074 | | | 341 | | | |
| Amortization of unearned stock compensation and stock option expense | | | 7,596 | | | | | | 7,596 | | | |
| Other comprehensive loss, net of income taxes | | | | | (635,237) | | | | (635,237) | | | |
| Purchase of redeemable noncontrolling interest | | | | | | | | — | | | (1,200) | |
| As of December 31, 2022 | 964 | | 19,036 | | 390,438 | | 7,163,128 | | 336,151 | | (4,178,334) | | 21,278 | | 3,752,661 | | | 21,827 | |
| Net income for the year | | | | 211,704 | | | | | 211,704 | | | |
| Noncontrolling interest capital contributions | | | | | | | 3,520 | | 3,520 | | | |
| | | | | | | | | | |
| Purchase of equity from noncontrolling interest | | | (5,742) | | | | | 754 | | (4,988) | | | |
| Net income attributable to noncontrolling interests | | | | (3,512) | | | | 3,512 | | — | | | |
| | | | | | | | | | |
| Net income attributable to redeemable noncontrolling interests | | | | (2,904) | | | | | (2,904) | | | 2,904 | |
| Change in redemption value of redeemable noncontrolling interests | | | (15,441) | | | | | 518 | | (14,923) | | | 15,660 | |
| Distribution to noncontrolling interests | | | | | | | (3,451) | | (3,451) | | | (1,241) | |
| Dividends paid on common stock | | | | (30,953) | | | | | (30,953) | | | |
| Repurchase of Class B common stock | | | | | | (195,002) | | | (195,002) | | | |
| Issuance of Class B common stock, net of restricted stock award forfeitures | | | (4,110) | | | | 5,233 | | | 1,123 | | | |
| Amortization of unearned stock compensation and stock option expense | | | 6,895 | | | | | | 6,895 | | | |
| Other comprehensive income, net of income taxes | | | | | 278,186 | | | | 278,186 | | | |
| Purchase of redeemable noncontrolling interest | | | | | | | | — | | | (14,965) | |
| As of December 31, 2023 | $ | 964 | | $ | 19,036 | | $ | 372,040 | | $ | 7,337,463 | | $ | 614,337 | | $ | (4,368,103) | | $ | 26,131 | | $ | 4,001,868 | | | $ | 24,185 | |
See accompanying Notes to Consolidated Financial Statements.
GRAHAM HOLDINGS COMPANY
NOTES TO CONSOLIDATED FINANCIAL STATEMENTS
1. ORGANIZATION AND NATURE OF OPERATIONS
Graham Holdings Company (the Company), is a diversified educationholding company whose operations include educational services, television broadcasting, manufacturing, healthcare, automotive dealerships and media company. The Company’sother businesses.
Through Kaplan, subsidiaryInc. (Kaplan), the Company provides a wide variety of educational services to students, schools, colleges, universities and businesses, both domestically and outside the United States (U.S.). , including academic preparation programs for international students, English-language programs, operations support services for pre-college, certificate, undergraduate and graduate programs, exam preparation for high school and graduate students and for professional certifications and licensures, career and academic advisement services to businesses, and operates a United Kingdom (U.K.) sixth-form college that prepares students for A-level examinations.
The Company’s television broadcasting segment owns and operates seven television broadcasting stations and provides social media operationsmanagement tools designed to connect newsrooms with their users.
The Company’s manufacturing companies comprise the ownership of a supplier of pressure treated wood, a manufacturer of electrical solutions, a manufacturer of lifting solutions, and operationa supplier of 7 television broadcasting stations.parts used in electric utilities and industrial systems.
Education—Kaplan, Inc.The Company’s healthcare segment provides an extensive range of educationalhome health, hospice and palliative services, in-home specialty pharmacy infusion therapies, applied behavior analysis therapy, physician services for studentsallergy, asthma and professionals. Kaplan’s various businesses comprise 3 categories: Kaplan International, Higher Education (KHE)immunology patients, in-home aesthetics, and Supplemental Education.healthcare software-as-a-service technology.
Media—The Company’s diversified media operations comprise television broadcasting, several websitesautomotive business comprises eight dealerships and print publications, podcast contentvalet repair services.
The Company’s other businesses include an online art gallery and in-person art fair business; an online commerce platform featuring original art and designs on an array of consumer products; an owner and operator of websites; restaurants; a custom framing company; a marketing solutions provider.
Television broadcasting.provider; a customer data and analytics software company; As of December 31, 2021, the Company owned 7 television stations located in Houston, TX; Detroit, MI; Orlando, FL; San Antonio, TX; Roanoke, VA;Slate and 2 stations in Jacksonville, FL. All stations are network-affiliated except for WJXT in Jacksonville, FL.
Manufacturing—The Company’s manufacturing businesses include Hoover, Dekko, Joyce/DaytonForeign Policy magazines; and Forney.
Other—The Company’s other business operations include automotive dealerships, restaurantsa daily local news podcast and entertainment venues, consumer internet brands, custom framing services and home health and hospice services.newsletter company.
2. SUMMARY OF SIGNIFICANT ACCOUNTING POLICIES
Basis of Presentation and Principles of Consolidation. The accompanying Consolidated Financial Statements have been prepared in accordance with generally accepted accounting principles (GAAP) in the U.S. and include the assets, liabilities, results of operations and cash flows of the Company and its majority-owned and controlled subsidiaries. All significant intercompany accounts and transactions have been eliminated in consolidation.
Revision of Prior Period Amounts. In the fourth quarter of 2023, the Company identified misstatements previously reported in accounts receivable and deferred revenue that should not have been recorded and certain balances previously reported in deferred revenue that should have been classified within accounts payable and accrued liabilities. The Company determined that these adjustments were not material to the previously issued financial statements, and as a result, the Company revised the Consolidated Balance Sheet and Consolidated Statements of Cash Flows. The impact of these misstatements to the previously reported Consolidated Balance Sheet as of
December 31, 2022 and Consolidated Statements of Cash Flows for the years ended December 31, 2022 and 2021 is shown below. These misstatements had no impact on the previously issued Statements of Operations.
See Note 20 for the impact on the Company’s previously issued Condensed Consolidated Statements of Cash Flows for each of the year-to-date interim periods in 2023.
| | | | | | | | | | | | | | | | | |
| As of December 31, 2022 |
| (In thousands) | As Previously Reported | | Adjustments | | As Revised |
| Assets | | | | | |
| Accounts receivable, net | $ | 560,779 | | | $ | (28,838) | | | $ | 531,941 | |
| Total Current Assets | 1,708,094 | | | (28,838) | | | 1,679,256 | |
| Total Assets | $ | 6,582,215 | | | $ | (28,838) | | | $ | 6,553,377 | |
| Liabilities and Equity | | | | | |
| Accounts payable, vehicle floor plan payable and accrued liabilities | $ | 563,005 | | | $ | 11,282 | | | $ | 574,287 | |
| Deferred Revenue | 381,416 | | | (40,120) | | | 341,296 | |
| Total Current Liabilities | 1,174,007 | | | (28,838) | | | 1,145,169 | |
| Total Liabilities | 2,807,727 | | | (28,838) | | | 2,778,889 | |
| Total Liabilities and Equity | $ | 6,582,215 | | | $ | (28,838) | | | $ | 6,553,377 | |
| | | | | | | | | | | | | | | | | | | | | | | | | | | | | | | | | | | |
| Year Ended December 31, 2022 | | Year Ended December 31, 2021 |
| (In thousands) | As Previously Reported | | Adjustments | | As Revised | | As Previously Reported | | Adjustments | | As Revised |
| Change in operating assets and liabilities: | | | | | | | | | | | |
| Accounts receivable | $ | 41,635 | | | $ | 3,883 | | | $ | 45,518 | | | $ | (59,292) | | | $ | 11,862 | | | $ | (47,430) | |
| Accounts payable and accrued liabilities | (44,870) | | | 11,282 | | | (33,588) | | | 32,397 | | | — | | | 32,397 | |
| Deferred Revenue | 33,384 | | | (15,165) | | | 18,219 | | | 19,086 | | | (11,862) | | | 7,224 | |
| Net Cash Provided by Operating Activities | $ | 235,604 | | | $ | — | | | $ | 235,604 | | | $ | 202,426 | | | $ | — | | | $ | 202,426 | |
| | | | | | | | | | | |
Use of Estimates. The preparation of financial statements in conformity with GAAP requires management to make estimates and judgments that affect the amounts reported in the financial statements. Management bases its estimates and assumptions on historical experience and on various other factors that are believed to be reasonable under the circumstances. Due to the inherent uncertainty involved in making estimates, actual results reported in future periods may be affected by changes in those estimates. On an ongoing basis, the Company evaluates its estimates and assumptions.
The Company assessed certain accounting matters that generally require consideration of forecasted financial information, in context with the information reasonably available to the Company and the unknown future impacts of the novel coronavirus (COVID-19) pandemic as of December 31, 2021 and through the date of this filing. The accounting matters assessed included, but were not limited to, the Company’s carrying value of goodwill and other long-lived assets, allowance for doubtful accounts, inventory valuation and related reserves, fair value of financial assets, valuation allowances for tax assets and revenue recognition. Other than the goodwill and other long-lived asset impairment charges (see Notes 9, 12 and 19), there were no other impacts to the Company’s consolidated financial statements as of and for the year ended December 31, 2021 resulting from our assessments. The Company’s future assessment of the magnitude and duration of COVID-19, as well as other factors, could result in material impacts to the Company’s consolidated financial statements in future reporting periods.
Business Combinations. The purchase price of an acquisition is allocated to the assets acquired, including intangible assets, and liabilities assumed, based on their respective fair values at the acquisition date. Acquisition-related costs are expensed as incurred. The excess of the cost of an acquired entity over the net of the amounts assigned to the assets acquired and liabilities assumed is recognized as goodwill. The net assets and results of operations of an acquired entity are included in the Company’s Consolidated Financial Statements from the acquisition date.
Cash and Cash Equivalents. Cash and cash equivalents consist of cash on hand, short-term investments with original maturities of three months or less and investments in money market funds with weighted average maturities of three months or less.
Restricted Cash. Restricted cash represents amounts required to be held by non-U.S. higher education institutions for prepaid tuition pursuant to foreign government regulations. These regulations stipulate that the Company has a fiduciary responsibility to segregate certain funds to ensure these funds are only used for the benefit of eligible students.
Concentration of Credit Risk. Cash and cash equivalents are maintained with several financial institutions domestically and internationally. Deposits held with banks may exceed the amount of insurance provided on such deposits. Generally, these deposits may be redeemed upon demand and are maintained with financial institutions with investment-grade credit ratings. The Company routinely assesses the financial strength of significant customers, and this assessment, combined with the large number and geographical diversity of its customers, limits the Company’s concentration of risk with respect to receivables from contracts with customers.
Allowance for Credit Losses. Accounts receivable have been reduced by an allowance that reflects the current expected credit losses associated with the receivables. The current expected credit losses are estimated based on historical write-offs, current macroeconomic conditions and reasonable and supportable forecasts of future economic conditions. Reserves are also established against specific receivables based on aging category, historical
collection experience and management’s evaluation of the financial condition of the customer. The Company generally considers an account past due or delinquent when a student or customer misses a scheduled payment. The Company writes off accounts receivable balances deemed uncollectible against the allowance for credit losses following the passage of a certain period of time, or generally when the account is turned over for collection to an outside collection agency.
Investments in Equity Securities. The Company measures its investments in equity securities at fair value with changes in fair value recognized in earnings. The Company elected the measurement alternative to measure cost method investments that do not have readily determinable fair value at cost less impairment, adjusted by observable price changes with any fair value changes recognized in earnings. If the fair value of a cost method investment declines below its cost basis and the decline is considered other than temporary, the Company will record a write-down, which is included in earnings. The Company uses the average cost method to determine the basis of the securities sold.
Fair Value Measurements. Fair value measurements are determined based on the assumptions that a market participant would use in pricing an asset or liability based on a three-tiered hierarchy that draws a distinction between market participant assumptions based on (i) observable inputs, such as quoted prices in active markets (Level 1); (ii) inputs other than quoted prices in active markets that are observable either directly or indirectly (Level 2); and (iii) unobservable inputs that require the Company to use present value and other valuation techniques in the determination of fair value (Level 3). Financial assets and liabilities are classified in their entirety based on the lowest level of input that is significant to the fair value measure. The Company’s assessment of the significance of a particular input to the fair value measurements requires judgment and may affect the valuation of the assets and liabilities being measured and their placement within the fair value hierarchy.
For assets that are measured using quoted prices in active markets, the total fair value is the published market price per unit multiplied by the number of units held, without consideration of transaction costs. Assets and liabilities that are measured using significant other observable inputs are primarily valued by reference to quoted prices of similar assets or liabilities in active markets, adjusted for any terms specific to that asset or liability.
The Company measures certain assets—including goodwill; intangible assets; property, plant and equipment; lease right-of-use assets; cost and equity-method investments—at fair value on a nonrecurring basis when they are deemed to be impaired. The fair value of these assets is determined with valuation techniques using the best information available and may include quoted market prices, market comparables and discounted cash flow models.
Fair Value of Financial Instruments. The carrying amounts reported in the Company’s Consolidated Financial Statements for cash and cash equivalents, restricted cash, accounts receivable, accounts payable and accrued liabilities, the current portion of deferred revenue and the current portion of debt approximate fair value because of the short-term nature of these financial instruments. The fair value of long-term debt is determined based on a number of observable inputs, including the current market activity of the Company’s publicly traded notes, trends in investor demands and market values of comparable publicly traded debt. The fair value of interest rate hedges areis determined based on a number of observable inputs, including time to maturity and market interest rates.
Inventories and Contracts in Progress. Inventories and contracts in progress are stated at the lower of cost or net realizable values and are based on the first-in, first-out (FIFO) method. Inventory costs include direct material, direct and indirect labor, and applicable manufacturing overhead. The Company allocates manufacturing overhead based on normal production capacity and recognizes unabsorbed manufacturing costs in earnings. The provision for excess and obsolete inventory is based on management’s evaluation of inventories on hand relative to historical usage, estimated future usage and technological developments.
Vehicle inventory is based on the specific identification method. The cost of new and used vehicle inventories includes the cost of any equipment added, reconditioning and transportation. In certain instances, vehicle manufacturers provide incentives which are reflected as a reduction in the carrying value of each vehicle purchased.
Property, Plant and Equipment. Property, plant and equipment is recorded at cost and includes interest capitalized in connection with major long-term construction projects. Replacements and major improvements are
capitalized; maintenance and repairs are expensed as incurred. Depreciation is calculated using the straight-line method over the estimated useful lives of the property, plant and equipment: 3 to 20 years for machinery and equipment; 20 to 50 years for buildings. The costs of leasehold improvements are amortized over the lesser of their useful lives or the terms of the respective leases.
Evaluation of Long-Lived Assets. The recoverability of long-lived assets and finite-lived intangible assets is assessed whenever adverse events or changes in circumstances indicate that recorded values may not be recoverable. A long-lived asset is considered not to not be recoverable when the undiscounted estimated future cash flows are less than the asset’s recorded value. An impairment charge is measured based on estimated fair market value, determined primarily using estimated future cash flows on a discounted basis. Losses on long-lived
assets to be disposed of are determined in a similar manner, but the fair market value would be reduced for estimated costs to dispose.
Goodwill and Other Intangible Assets. Goodwill is the excess of purchase price over the fair value of identified net assets of businesses acquired. The Company’s intangible assets with an indefinite life are principally from trade names and trademarks, franchise agreements and Federal Communications Commission (FCC) licenses. Amortized intangible assets are primarily student and customer relationships and trade names and trademarks, with amortization periods up to 15 years. Costs associated with renewing or extending intangible assets are insignificant and expensed as incurred.
The Company reviews goodwill and indefinite-lived intangible assets at least annually, as of November 30, for possible impairment. Goodwill and indefinite-lived intangible assets are reviewed for possible impairment between annual tests if an event occurs or circumstances change that would more likely than not reduce the fair value of the reporting unit or indefinite-lived intangible asset below its carrying value. The Company tests its goodwill at the reporting unit level, which is an operating segment or one level below an operating segment. The Company initially assesses qualitative factors to determine if it is necessary to perform the goodwill or indefinite-lived intangible asset quantitative impairment review. The Company reviews the goodwill and indefinite-lived assets for impairment using the quantitative process if, based on its assessment of the qualitative factors, it determines that it is more likely than not that the fair value of a reporting unit or indefinite-lived intangible asset is less than its carrying value, or if it decides to bypass the qualitative assessment. The Company reviews the carrying value of goodwill and indefinite-lived intangible assets utilizinguses a discounted cash flow model, and, where appropriate, a market value approach is also utilized to supplement the discounted cash flow model.model, to determine the estimated fair value of its reporting units and indefinite-lived intangible assets. The Company makes assumptions regarding estimated future cash flows, discount rates, long-term growth rates and market values to determine the estimated fair value of each reporting unit and indefinite-lived intangible asset. If these estimates or related assumptions change in the future, the Company may be required to record impairment charges.
Investments in Affiliates. The Company uses the equity method of accounting for its investments in and earnings or losses of affiliates that it does not control, but over which it exerts significant influence. Significant influence is generally deemed to exist if the Company has an ownership interest in the voting stock of an investee between 20% and 50%. The Company also uses the equity method of accounting for its investments in a partnership or limited liability company with specific ownership accounts, if the Company has an ownership interest of 3% or more. The Company considers whether the fair values of any of its equity method investments have declined below their carrying values whenever adverse events or changes in circumstances indicate that recorded values may not be recoverable. If the Company considered any such decline to be other than temporary (based on various factors, including historical financial results, product development activities and the overall health of the affiliate’s industry), a write-down would be recorded to estimated fair value. The Company records its share of the earnings or losses of its affiliates from their most recent available financial statements. In some instances, the reporting period of the affiliates’ financial statements lag the Company’s reporting period, but such lag is never more than three months.
Revenue Recognition. The Company identifies a contract for revenue recognition when there is approval and commitment from both parties, the rights of the parties and payment terms are identified, the contract has commercial substance and the collectability of consideration is probable. The Company evaluates each contract to determine the number of distinct performance obligations in the contract, which requires the use of judgment.
Education Revenue. Education revenue is primarily derived from postsecondary education and supplementary education services provided both domestically and abroad. Generally, tuition and other fees are paid upfront and recorded in deferred revenue in advance of the date when education services are provided to the student. In some instances, installment billing is available to students, which reduces the amount of cash consideration received in advance of performing the service. The contractual terms and conditions associated with installment billing indicate that the student is liable for the total contract price; therefore, mitigating the Company’s exposure to losses associated with nonpayment. The Company determined the installment billing does not represent a significant financing component.
Kaplan International. Kaplan International provides higher education, professional education, and test preparation services and materials to students primarily in the United Kingdom (U.K.)U.K., Singapore, and Australia. Some Kaplan International contracts consist of 1one performance obligation that is a combination of indistinct promises to the student, while other Kaplan International contracts include multiple performance obligations as the promises in the
contract are capable of being both distinct and distinct within the context of the contract. NaNOne Kaplan International business offers an option whereby students receive future services at a discount that is accounted for as a material right.
The transaction price is stated in the contract and known at the time of contract inception; therefore, no variable consideration exists. Revenue is allocated to each performance obligation based on its standalone selling price. Any discounts within the contract are allocated across all performance obligations unless observable evidence exists that the discount relates to a specific performance obligation or obligations in the contract. Kaplan International generally determines standalone selling prices based on prices charged to students.
Revenue is recognized ratably over the instruction period or access period for higher education, professional education and test preparation services. Kaplan International generally uses the time elapsed method, an input measure, as it best depicts the simultaneous consumption and delivery of these services. Course materials determined to be a separate performance obligation are recognized at the point in time when control transfers to the student, generally when the products are delivered to the student.
NaNOne Kaplan International business has a contract with a customer consisting of 2two performance obligations which consisted entirely of variable consideration at contract inception. The Company allocates revenue to each performance obligation based on the expected cost plus a margin. The margin was determined by a market assessment.assessment performed at contract inception. Revenue is recognized over time, using an input method, as the customer simultaneously benefits from the services as delivery occurs. The Company records a contract asset associated with this Kaplan International contract as the right to revenue is dependent on something other than the passage of time.
Kaplan Higher Education (KHE). KHE primarily provides non-academic operations support services to Purdue University Global (Purdue Global) pursuant to a Transition and Operations Support Agreement (TOSA). This contract has a 30-year term and consists of 1one performance obligation, which represents a series of daily promises to provide support services to Purdue Global. The transaction price is entirely made up of variable consideration related to the reimbursement of KHE support costs and the KHE fee. The TOSA outlines a payment structure, which dictates how cash will be distributed at the end of Purdue Global’s fiscal year, which is the 30th of June. The collectability of the KHE support costs and KHE fee is entirely dependent on the availability of cash at the end of the fiscal year. This variable consideration is constrained based on fiscal year forecasts prepared for Purdue Global. The forecasts are updated throughout the fiscal year until the uncertainty is ultimately resolved, which is at the end of each Purdue Global fiscal year. As KHE’s performance obligation is made up of a series, the variable consideration is allocated to the distinct service period to which it relates, which is the Purdue Global fiscal year.
Support services revenue is recognized over time based on the expenses incurred to date and the percentage of expected reimbursement. KHE fee revenue is also recognized over time based on the amount of Purdue Global revenue recognized to date and the percentage of fee expected to be collected for the fiscal year. The Company used these input measures as Purdue Global simultaneously receives and consumes the benefits of the services provided by KHE.
Kaplan Supplemental Education. Supplemental Education offers test preparation services and materials to students, as well as professional training and exam preparation for professional certifications and licensures to students. Generally, Supplemental Education contracts consist of multiple performance obligations as promises for these services are distinct within the context of the contract. The transaction price is stated in the contract and known at the time of contract inception, therefore no variable consideration exists. Revenue is allocated to each performance obligation based on its standalone selling price. Supplemental Education generally determines standalone selling prices based on the prices charged to students and professionals. Any discounts within the contract are allocated across all performance obligations unless observable evidence exists that the discount relates to a specific performance obligation in the contract.
Supplemental Education services revenue is recognized ratably over the period of access to the education materials. An estimate of the average access period is developed for each course, and this estimate is evaluated on an ongoing basis and adjusted as necessary. The time elapsed method, an input measure, is used as it best depicts the simultaneous consumption and availability of access to the services. Revenue associated with distinct course materials is recognized at the point in time when control transfers to the student, generally when products are delivered to the student.
Supplemental Education offers a guarantee on certain courses that gives students the ability to repeat a course if they are not satisfied with their exam score. The Company accounts for this guarantee as a separate performance obligation.
Television Broadcasting Revenue. Television broadcasting revenue at Graham Media Group (GMG) is primarily comprised of television and internet advertising revenue and retransmission revenue.
Television Advertising Revenue. GMG accounts for the series of advertisements included in television advertising contracts as 1one performance obligation and recognizes advertising revenue over time. The Company elected the right to invoice practical expedient, an output method, as GMG has the right to consideration that equals the value provided to the customer for advertisements delivered to date. As a result of the election to use the right to invoice practical expedient, GMG does not determine the transaction price or allocate any variable consideration at contract inception. Rather, GMG recognizes revenue commensurate with the amount to which GMGit has the right to invoice the customer. Payment is typically received in arrears within 60 days of revenue recognition.
Retransmission Revenue. Retransmission revenue represents compensation paid by cable, satellite and other multichannel video programming distributors (MVPDs) to retransmit GMG’s stations’ broadcasts in their designated
market areas. The retransmission rights granted to MVPDs are accounted for as a license of functional intellectual property as the retransmitted broadcast provides significant standalone functionality. As such, each retransmission contract with an MVPD includes 1one performance obligation for each station’s retransmission license. GMG recognizes revenue using the usage-based royalty method, in which revenue is recognized in the month the broadcast is retransmitted based on the number of MVPD subscribers and the applicable per userper-user rate identified in the retransmission contract. Payment is typically received in arrears within 60 days of revenue recognition.
Manufacturing Revenue. Manufacturing revenue consists primarily of product sales generated by 4four businesses: Hoover, Dekko, Joyce, and Forney. The Company has determined that each item ordered by the customer is a distinct performance obligation as it has standalone value and is distinct within the context of the contract. For arrangements with multiple performance obligations, the Company initially allocates the transaction price to each obligation based on its standalone selling price, which is the retail price charged to customers. Any discounts within the contract are allocated across all performance obligations unless observable evidence exists that the discount relates to a specific performance obligation or obligations in the contract.
The Company sells some products and services with a right of return. This right of return constitutes variable consideration and is constrained from revenue recognition on a portfolio basis, using the expected value method until the refund period expires.
The Company recognizes revenue when or as control transfers to the customer. Some manufacturing revenue is recognized ratably over the manufacturing period, if the product created for the customer does not have an alternative use tofor the Company and the Company has an enforceable right to payment for performance completed to date. The determination of the method by which the Company measures its progress toward the satisfaction of its performance obligations requires judgment. The Company measures its progress for these products using the units delivered method, an output measure. These arrangements represented 19%, 21%, 23% and 28%21% of the manufacturing revenue recognized for the years ended December 31, 2021, 20202023, 2022 and 2019,2021, respectively.
Other manufacturing revenue is recognized at the point in time when control transfers to the customer, generally when the products are shipped. Some customers have a bill and holdbill-and-hold arrangement with the Company. Revenue for bill and hold arrangements is recognized when control transfers to the customer, even though the customer does not have physical possession of the goods. Control transfers when the bill-and-hold arrangement has been requested from the customer, the product is identified as belonging to the customer and is ready for physical transfer, and the product cannot be directed for use by anyone but the customer.
Payment terms and conditions vary by contract, although terms generally include a requirement of payment within 90 days of delivery.
The Company evaluated the terms of the warranties and guarantees offered by its manufacturing businesses and determined that these should not be accounted for as a separate performance obligation as a distinct service is not identified.
Healthcare Revenue. The Company contracts with patients to provide home health or hospice services. Payment is typically received from third-party payors such as Medicare, Medicaid, and private insurers. The payor is a third party to the contract that stipulates the transaction price of the contract. The Company identifies the patient as the party who benefits from its healthcare services and as such, the patient is its customer.
The Centers for Medicare and Medicaid Services released a revised reimbursement structure under the Patient Driven Groupings Model (PDGM) for Medicare claims for home healthcare services effective for new and modified revenue contracts beginning on or after January 1, 2020. Home health services contracts generally have 1one performance obligation to provide home health services to patients. Under the PDGM model, theThe Company recognizes revenue using the right to invoice practical expedient, an output method, as the contractual right to revenue corresponds directly with the transfer of services to the patient. Given the election of the practical expedient, the Company does not determine the transaction price or allocate any variable consideration at contract inception. Rather, the Company recognizes revenue commensurate with the amount to which it has the right to invoice the customer, which is a function of the average length of stay within each of the two 30 day30-day payment
periods. Payment is typically received from Medicare within 30 days after a claim is filed. Medicare is the most common third-party payor for home health services.
Home health revenue contracts may be modified to account for changes in the patient’s plan of care. The Company identifies contract modifications when the modification changes the existing enforceable rights and obligations. As modifications to the plan of care modify the original performance obligation, the Company accounts for the contract modification as an adjustment to revenue (either as an increase in or a reduction of revenue) on a cumulative catch-up basis.
Hospice services contracts generally have 1one performance obligation to provide healthcare services to patients. The transaction price reflects the amount of revenue the Company expects to receive in exchange for providing these services. As the transaction price for healthcare services is known at the time of contract inception, no variable consideration exists. Hospice service revenue is recognized ratably over the period of care. The Company generally uses the time-elapsed method, an input measure as it best depicts the simultaneous delivery and
consumption of healthcare services. Payment is received from third-party payors for hospice services within 60 days after a claim is filed, or in some cases in two installments, one during the contract and one after the services have been provided. Medicare is the most common third-party payor.
Other Revenue. The Company recognizes revenue associated with management services it provides to its affiliates. The Company accounts for the management services provided as 1one performance obligation and recognizes revenue over time as the services are delivered. The Company uses the right to invoice practical expedient, an output method, as the Company’s right to revenue corresponds directly with the value delivered to the affiliate. As a result of the election to use the right to invoice practical expedient, the Company does not determine the transaction price or allocate any variable consideration at contract inception. Rather, the Company recognizes revenue commensurate with the amount to which it has the right to invoice the affiliate, which is based on contractually identified percentages. Payment is received monthly in arrears.
Automotive Revenue. The automotive subsidiary generates revenue primarily through the sale of new and used vehicles, the arrangement of vehicle financing, insurance and other service contracts (F&I revenue) and the performance of vehicle repair and maintenance services.
New and used vehicle revenue contracts generally contain 1one performance obligation to deliver the vehicle to the customer in exchange for the stated contract consideration. Revenue is recognized at the point in time when control of the vehicle passes to the customer. F&I revenue is recognized at the point in time when the agreement between the customer and financing, insurance or service provider is executed. As the automotive subsidiary acts as an agent in these F&I revenue transactions, revenue is recognized net of any financing, insurance and service provider costs. Repair and maintenance services revenue is recognized over time, as the service is performed.
Other Revenue. Restaurant Revenue. Restaurant revenues consistsconsist of sales generated by Clyde’s Restaurant Group (CRG). Food and beverage revenue, net of discounts and taxes, is recognized at the point in time when it is delivered to the customer. Proceeds from the sale of gift cards are recorded as deferred revenue and recognized as revenue upon redemption by the customer.
Custom Framing Services Revenue. Framebridge sells custom framing solutions to customers. Custom framing services revenue, net of discounts and taxes, is recognized when the products are delivered to the customer. Proceeds from the sale of gift cards are recorded as deferred revenue and recognized as revenue upon redemption by the customer.
Code3 Revenue. Code3 generates media management revenue in exchange for providing social media marketing solutions to its clients. The Company determined that Code3 contracts generally have 1one performance obligation made up of a series of promises to manage the client’s media spend on advertising platforms for the duration of the contract period.
Code3 recognizes revenue, net of media acquisition costs, over time as media management services are delivered to the customer. Generally, Code3 recognizes revenue using the right to invoice practical expedient, an output method, as Code3’s right to revenue corresponds directly with the value delivered to its customer. As a result of the election to use the right to invoice practical expedient, Code3 does not determine the transaction price or allocate any variable consideration at contract inception. Rather, Code3 recognizes revenue commensurate with the amount to which it has the right to invoice the customer which is a function of the cost of social media placement plus a management fee, less any applicable discounts. Payment is typically received within 100 days of revenue recognition.
Code3 evaluates whether it is the principal (i.e. presents revenue on a gross basis) or agent (i.e. presents revenue on a net basis) in its contracts. Code3 presents revenue for media management services, net of media acquisition costs, as an agent, as Code3 does not control the media before placement on social media platforms.
Leaf GroupWorld of Good Brands (WGB) Revenue.Leaf Group (Leaf) generates revenue through its media and marketplace businesses. Media revenue Revenue is primarily derived from advertisements displayed on Leaf’sWGB’s online media properties. Revenue is recognized over time as the performance obligation is delivered. Revenue is generally recognized based on an output measure including impressions delivered, cost per click or time-based advertisements.
Marketplace revenueSociety6 Revenue. Revenue is primarily derived from the sale of products from Society6 and Saatchi Art Group.products. Each product ordered is generally is accounted for as an individual performance obligation. Product revenue, net of discounts and taxes, is recognized when control of the promised good is transferred to the customer.
Saatchi Revenue. Commissions revenue is primarily derived through the sale of artwork through Saatchi’s online art gallery or in-person art fairs. Each individual art piece ordered is generally accounted for as an individual performance obligation. Revenue is recognized net of artist fees when control of the promised good is transferred to the customer.
Other Revenue. Other revenue primarily includes advertising, circulation and subscription revenue from Slate, Megaphone, Decile, Pinna and Foreign Policy. The Company accounts for other advertising revenues consistently with the advertising revenue streams addressed above. Circulation revenue consists of fees that provide customers access to online and print publications. The Company recognizes circulation and subscription revenue ratably over the subscription period beginning on the date that the publication or product is made available to the customer. Circulation revenue contracts are generally annual or monthly subscription contracts that are paid in advance of the delivery of performance obligations.
Revenue Policy Elections. The Company has elected to account for shipping and handling activities that occur after the customer has obtained control of the good as a fulfillment cost rather than as an additional promised service. Therefore, revenue for these performance obligations is recognized when control of the good transfers to the customer, which is when the good is ready for shipment. The Company accrues the related shipping and handling costs over the period when revenue is recognized.
The Company has elected to exclude from the measurement of the transaction price all taxes assessed by a governmental authority that are both imposed on and concurrent with a specific revenue-producing transaction and collected by the entity from a customer.
Revenue Practical Expedients. The Company does not disclose the value of unsatisfied performance obligations for (i) contracts with an original expected length of one year or less, (ii) contracts for which the amount of revenue recognized is based on the amount to which the Company has the right to invoice the customer for services performed, (iii) contracts for which the consideration received is a usage-based royalty promised in exchange for a license of intellectual property and (iv) contracts for which variable consideration is allocated entirely to a wholly unsatisfied promise to transfer a distinct good or service that forms part of a single performance obligation.
Costs to Obtain a Contract. The Company incurs costs to obtain a contract that are both incremental and expected to be recovered as the costs would not have been incurred if the contract was not obtained and the revenue from the contract exceeds the associated cost. The revenue guidance provides a practical expedient to expense sales commissions as incurred in instances where the amortization period is one year or less. The amortization period is defined in the guidance as the contract term, inclusive of any expected contract renewal periods. The Company has elected to apply this practical expedient to all contracts except for contracts in its education division. In the education division, costs to obtain a contract are amortized over the applicable amortization period except for cases in which commissions paid on initial contracts and renewals are commensurate. The Company amortizes these costs to obtain a contract on a straight-line basis over the amortization period. These expenses are included as cost of services or products in the Company’s Consolidated Statements of Operations.
Leases. The Company has operating leases for substantially all of its educational facilities, corporate offices and other facilities used in conducting its business, as well as certain equipment. The Company determines if an arrangement is a lease at inception. Operating leases are included in lease right-of-use (ROU) assets, current portion of lease liabilities, and lease liabilities on the Company’s Consolidated Balance Sheets. ROU assets represent the Company’s right to use an underlying asset for the lease term and lease liabilities represent the Company’s obligation to make lease payments arising from the lease. Operating lease ROU assets and liabilities are recognized at the lease commencement date based on the present value of lease payments over the lease term. ROU assets also include any initial direct costs, prepaid lease payments and lease incentives received, when applicable. As most of the Company’s leases do not provide an implicit rate, the Company used its incremental borrowing rate based on the information available at the lease commencement date in determining the present value of lease payments. The Company used the incremental borrowing rate on December 31, 2018 for operating leases that commenced prior to that date.
The Company’s lease terms may include options to extend or terminate the lease by one to 10 years or more when it is reasonably certain that the option will be exercised. Leases with a term of twelve months or less are not recorded on the balance sheet; however, lease expense for these leases is recognized on a straight-line basis. The Company has elected the practical expedient to not separate lease components from nonlease components. As such, lease expense includes these nonlease components, when applicable. Fixed lease expense is recognized on a straight-line basis over the lease term. Variable lease expense is recognized when incurred. The Company’s lease
agreements do not contain any significant residual value guarantees or restrictive covenants. In some instances, the Company subleases its leased real estate facilities to third parties. The Company has several restaurant leases with an entity affiliated with some of CRG’s senior managers and some automotive leases with an entity affiliated with automotive’s minority shareholder.
As of December 31, 2021 and 2020, the Company had $4.0 million and $5.9 million, respectively,Finance leases are included in net, property, plant and equipment, net, accounts payable and currentaccrued liabilities and other liabilities on the Company’s Consolidated Balance Sheets. The Company primarily has finance lease liabilities related toleases for its vehicle fleet at the healthcare subsidiary and service loaner vehicles at the automotive subsidiary. Service loaner vehicles are generally purchased from the lessor within six months of contract commencement and upon purchase,
the vehicles are placed into used vehicle inventory at cost. TheAs of December 31, 2023 and 2022, the Company does not have any other significant financing leases.had $10.9 million and $5.4 million, respectively, in net, property, plant and equipment and current finance lease liabilities related to service loaner vehicles at the automotive subsidiary.
Pensions and Other Postretirement Benefits. The Company maintains various pension and incentive savings plans. Most of the Company’s employees are covered by these plans. The Company also provides healthcare and life insurance benefits to certain retired employees. These employees become eligible for benefits after meeting age and service requirements.
The Company recognizes the overfunded or underfunded status of a defined benefit postretirement plan as an asset or liability in its Consolidated Balance Sheets and recognizes changes in that funded status in the year in which the changes occur through comprehensive income. The Company measures changes in the funded status of its plans using the projected unit credit method and several actuarial assumptions, the most significant of which are the discount rate, the expected return on plan assets and the rate of compensation increase. The Company uses a measurement date of December 31 for its pension and other postretirement benefit plans.
Self-Insurance. The Company uses a combination of insurance and self-insurance for a number of risks, including claims related to employee healthcare and dental care, disability benefits, workers’ compensation, general liability, property damage and business interruption. Liabilities associated with these plans are estimated based on, among other things, the Company’s historical claims experience, severity factors and other actuarial assumptions. The expected loss accruals are based on estimates, and, while the Company believes that the amounts accrued are adequate, the ultimate loss may differ from the amounts provided.
Income Taxes. The Company accounts for income taxes under the asset and liability method, which requires the recognition of deferred tax assets and liabilities for the expected future tax consequences of events that have been included in the financial statements. Under this method, deferred tax assets and liabilities are determined based on the differences between the financial statements and tax basis of assets and liabilities using enacted tax rates in effect for the year in which the differences are expected to reverse. The effect of a change in tax rates on deferred tax assets and liabilities is recognized in income in the period that includes the enactment date.
The Company records net deferred tax assets to the extent that it believes these assets will more likely than not be realized. In making such determination, the Company considers all available positive and negative evidence, including future reversals of existing taxable temporary differences, projected future taxable income, tax planning strategies and recent financial operations; this evaluation is made on an ongoing basis. In the event the Company were to determine that it was able to realize net deferred income tax assets in the future in excess of their net recorded amount, the Company would record an adjustment to the valuation allowance, which would reduce the provision for income taxes.
The Company recognizes a tax benefit from an uncertain tax position when it is more likely than not that the position will be sustained upon examination, including resolutions of any related appeals or litigation processes, based on the technical merits. The Company records a liability for the difference between the benefit recognized and measured for financial statement purposes and the tax position taken or expected to be taken on the Company’s tax return. Changes in the estimate are recorded in the period in which such determination is made.
Foreign Currency Translation. Income and expense accounts of the Company’s non-U.S. operations where the local currency is the functional currency are translated into U.S. dollars using the current rate method, whereby operating results are converted at the average rate of exchange for the period, and assets and liabilities are converted at the closing rates on the period end date. Gains and losses on translation of these accounts are accumulated and reported as a separate component of equity and other comprehensive income. Gains and losses on foreign currency transactions, including foreign currency denominated intercompany loans on entities with a functional currency in U.S. dollars, are recognized in the Consolidated Statements of Operations.
Equity-Based Compensation. The Company measures compensation expense for awards settled in shares based on the grant date fair value of the award. The Company measures compensation expense for awards settled in cash, or that may be settled in cash, based on the fair value at each reporting date. The Company recognizes the expense over the requisite service period, which is generally the vesting period of the award. Stock award forfeitures are accounted for as they occur.
Earnings Per Share. Basic earnings per share is calculated under the two-class method. The Company treats restricted stock as a participating security due to its nonforfeitable right to dividends. Under the two-class method, the Company allocates to the participating securities their portion of dividends declared and undistributed earnings
to the extent the participating securities may share in the earnings as if all earnings for the period had been distributed. Basic earnings per share is calculated by dividing the income available to common stockholders by the weighted average number of common shares outstanding during the period. Diluted earnings per share is calculated similarly except that the weighted average number of common shares outstanding during the period includes the dilutive effect of the assumed exercise of options and restricted stock issuable under the Company’s
stock plans. The dilutive effect of potentially dilutive securities is reflected in diluted earnings per share by application of the treasury stock method.
Mandatorily Redeemable Noncontrolling Interest. The Company’s mandatorily redeemable noncontrolling interest represents the noncontrolling interestownership portion of a group of minority shareholders, consisting of a group of senior managers of the healthcare business, in GHC One LLC (GHC One), a subsidiarysubsidiaries of Graham Healthcare Group (GHG). The minority shareholders must liquidate their 5% interest in GHC One upon its required liquidation in 2026. This interest is reported as a noncurrent liability at December 31, 2021 and 2020 in the Consolidated Balance Sheets. The Company presents this liability at fair value, which is computed quarterly at the current redemption value. Changes in the redemption value is recorded as interest expense or income in the Company’s Consolidated Statement of Operations.
Redeemable Noncontrolling Interest. The Company’s redeemable noncontrolling interest represents the noncontrolling interest in CSI Pharmacy Holding Company, LLC (CSI), which is 75% owned, Framebridge, which is 93.4% owned, and Weiss, which is 50.1% owned. CSI’s minority shareholders may put up to 50% of their shares to the Company. The first put period begins in 2022. A second put period for another tranche of shares begins in 2024. The minority shareholder of Framebridge has an option to put 20% of the shares to the Company annually starting in 2024. The minority shareholder of Weiss has an option to put 10% of the shares to the Company annually starting in 2026 and may put all of the shares starting in 2033. In March 2021, Hoover’s minority shareholders put the remaining outstanding shares to the Company. Following the redemption, the Company owns 100% of Hoover. Prior to the redemption, the Company owned 98.01% of Hoover. The Company presents the redeemable noncontrolling interests at the greater of its carrying amount or redemption value at the end of each reporting period in the Consolidated Balance Sheets. Changes in the redemption value are recorded to capital in excess of par value in the Company’s Consolidated Balance Sheets.
Comprehensive Income. Comprehensive income consists of net income, foreign currency translation adjustments, net changes in cash flow hedges, and pension and other postretirement plan adjustments.
Recently Adopted and Issued Accounting Pronouncements. In March 2020, the FASB issued guidance providing optional practical expedients and exceptions to ease the potential accounting impacts associated with the discontinuation of the London Interbank Offered Rate (LIBOR) or by other reference rates expected to be discontinued. The Company adopted the contract modification practical expedient in the fourth quarter of 2021 as it is in the process of modifying any contracts that reference a discontinuing reference rate. This guidance is not expected to have a significant impact on the Company’s Consolidated Financial Statements.
Other new accounting pronouncements issued but not effective until after December 31, 2021, are not expected to have a material impact on the Company’s Consolidated Financial Statements.
3. ACQUISITIONS AND DISPOSITIONS OF BUSINESSES
Acquisitions. During 2021, the Company acquired 6 businesses: 2 in education, 2 in healthcare, 1 in automotive, and 1 in other businesses for $392.4 million in cash and contingent consideration and the assumption of floor plan payables. The assets and liabilities of the companies acquired were recorded at their estimated fair values at the date of the acquisition.
On June 14, 2021, the Company acquired all of the outstanding common shares of Leaf Group Ltd. for $308.6 million in cash and the assumption of $9.2 million in liabilities related to their previous stock compensation plan, which will be paid in the future. Leaf is a consumer internet company that builds creator-driven brands in lifestyle and home and art design categories. The acquisition is expected to provide benefits in the future by diversifying the Company’s business operations and providing operating synergies with other business units. The Company includes Leaf in other businesses.
Kaplan acquired certain assets of Projects in Knowledge, a continuing medical education provider for healthcare professionals, and another small business in November 2021. These acquisitions are expected to build upon Kaplan’s existing customer base in the medical and test preparation fields. Both business are included in Kaplan’s supplemental education division.
In December 2021, GHG acquired 2 businesses, a home health business in Florida and a 50.1% interest in Weiss, a physician practice specializing in allergies, asthma and immunology. The minority shareholder of Weiss has an option to put 10% of the shares to the Company annually starting in 2026 and may put all of the shares starting in 2033. The fair value of the redeemable noncontrolling interest in Weiss was $6.6 million at the acquisition
date, determined using an income approach. These acquisitions are expected to expand the market the healthcare division serves and are included in healthcare.
On December 28, 2021, the Company’s automotive subsidiary acquired a Ford automotive dealership for cash and the assumption of $16.2 million in floor plan payables (see Note 6). In connection with the acquisition, the automotive subsidiary of the Company borrowed $22.5 million to finance the acquisition (see Note 11). The dealership will be operated and managed by an entity affiliated with Christopher J. Ourisman, a member of the Ourisman Automotive Group family of dealerships. The acquisition expands the Company’s automotive business operations and is included in automotive.
During 2020, the Company acquired 3 businesses: 2 in education and 1 in other businesses for $96.8 million in cash and contingent consideration. The assets and liabilities of the companies acquired were recorded at their estimated fair values at the date of acquisition.
In the first three months of 2020, Kaplan acquired 2 small businesses; 1 in its supplemental education division and 1 in its international division.
In May 2020, the Company acquired an additional interest in Framebridge, Inc. for cash and contingent consideration that resulted in the Company obtaining control of the investee. Following the acquisition, the Company owns 93.4% of Framebridge. The Company previously accounted for Framebridge under the equity method, and included it in Investments in Affiliates on the Consolidated Balance Sheet (see Note 4). The contingent consideration is primarily based on Framebridge achieving revenue milestones within a specific time period. The fair value of the contingent consideration at the acquisition date was $50.6 million, determined using a Monte Carlo simulation. The fair value of the redeemable noncontrolling interest in Framebridge was $6.0 million as of the acquisition date, determined using a market approach. The minority shareholder has an option to put 20% of the minority shares annually starting in 2024. The acquisition is expected to provide benefits in the future by diversifying the Company’s business operations and is included in other businesses.
During 2019, the Company acquired 8 businesses: 1 in education, 3 in healthcare, 1 in manufacturing, 2 in automotive and 1 in other businesses for $211.8 million in cash and contingent consideration and the assumption of $25.8 million in floor plan payables. The assets and liabilities of the companies acquired were recorded at their estimated fair values at the date of acquisition.
On January 31, 2019, the Company acquired an interest in 2 automotive dealerships for cash and the assumption of floor plan payables (see Note 6). In connection with the acquisition, the automotive subsidiary of the Company borrowed $30 million to finance the acquisition and entered into an interest rate swap to fix the interest rate on the debt at 4.7% per annum. The Company has a 90% interest in the automotive subsidiary. The Company also entered into a management services agreement with an entity affiliated with Christopher J. Ourisman, a member of the Ourisman Automotive Group family of dealerships. Mr. Ourisman and his team operate and manage the dealerships. The Company paid a fee of $2.3 million for the year ended December 31, 2019 in connection with the management services provided under this agreement. In addition, the Company advanced $3.5 million to the minority shareholder, an entity controlled by Mr. Ourisman, at an interest rate of 6% per annum. The minority shareholder has the option to acquire up to an additional 10% interest in the automotive subsidiary. The acquisition is expected to provide benefits in the future by diversifying the Company’s business operations and is included in automotive.
In July 2019, GHG acquired a 100% interest in a small business which is expected to provide certain strategic benefits in the future and is included in healthcare. On July 11, 2019, Kaplan acquired a 100% interest in Heverald, the owner of ESL Education, Europe’s largest language-travel agency and Alpadia, a chain of German and French language schools and junior summer camps. The acquisition is expected to provide synergies within Kaplan’s International English business and is included in Kaplan’s international division.
On July 31, 2019, the Company closed its acquisition of Clyde’s Restaurant Group. At the date of acquisition, CRG owned and operated 13 restaurants and entertainment venues in the Washington, D.C. metropolitan area, including Old Ebbitt Grill and The Hamilton. In connection with the acquisition, the Company entered into several leases with an entity affiliated with some of CRG’s senior managers. The acquisition is expected to provide benefits in the future by diversifying the Company’s business operations and is included in other businesses.
In September 2019, Joyce/Dayton Corp. acquired the assets of a small business. The acquisition is expected to complement current product offerings and is included in manufacturing.
On December 1, 2019, GHG acquired 75% of the preferred shares of CSI Pharmacy Holding Company, LLC. In connection with the acquisition, CSI entered into an $11.25 million Term Loan to finance the acquisition. CSI is a specialty and home infusion pharmacy, which provides intravenous immunoglobulin therapies to patients. The minority shareholders may put up to 50% of their preferred shares to GHG and the first put period begins in 2022. A second put period for another tranche of preferred shares begins in 2024. The fair value of the redeemable
noncontrolling interest in CSI was $1.7 million at the acquisition date, determined using an income approach. The acquisition is expected to expand the product offerings of the healthcare division.
Acquisition-related costs for acquisitions that closed during 2021, 2020 and 2019 were $3.0 million, $1.1 million and $3.0 million, respectively, and were expensed as incurred. The aggregate purchase price of these acquisitions was allocated as follows, based on acquisition date fair values to the following assets and liabilities:
| | | | | | | | | | | | | | | | | | | | | |
| | | Purchase Price Allocation |
| | | Year Ended December 31 |
| (in thousands) | | 2021 | | 2020 | | 2019 |
| | | | | | | |
| Accounts receivable | | | $ | 18,835 | | | $ | 745 | | | $ | 6,762 | |
| Inventory | | | 25,420 | | | 3,496 | | | 34,134 | |
| Property, plant and equipment | | | 12,661 | | | 3,346 | | | 56,391 | |
| Lease right-of-use assets | | | 26,333 | | | 6,580 | | | 98,505 | |
| Goodwill | | | 205,003 | | | 73,951 | | | 84,669 | |
| Indefinite-lived intangible assets | | | 22,200 | | | — | | | 46,900 | |
| Amortized intangible assets | | | 100,800 | | | 14,589 | | | 21,291 | |
| Other assets | | | 4,899 | | | 975 | | | 8,308 | |
| Deferred income taxes | | | 42,850 | | | 15,958 | | | (2,703) | |
| Floor plan payables | | | (16,198) | | | — | | | (25,755) | |
| | | | | | | |
| Other liabilities | | | (52,421) | | | (14,917) | | | (42,555) | |
| Current and noncurrent lease liabilities | | | (26,286) | | | (6,593) | | | (99,131) | |
| Redeemable noncontrolling interest | | | (6,617) | | | (6,005) | | | (1,715) | |
| Noncontrolling interest | | | — | | | — | | | (1,154) | |
| Aggregate purchase price, net of cash acquired | | | $ | 357,479 | | | $ | 92,125 | | | $ | 183,947 | |
The 2021 fair values recorded were based upon valuations and the estimates and assumptions used in such valuations are subject to change within the measurement period (up to one year from the acquisition date). The recording of deferred tax assets or liabilities, working capital and the final amount of residual goodwill and other intangibles are not yet finalized. The 2019 values above reflect a measurement period adjustment related to the lease right-of-use assets, current and noncurrent lease liabilities and the finalization of working capital. Goodwill is calculated as the excess of the consideration transferred over the net assets recognized and represents the estimated future economic benefits arising from other assets acquired that could not be individually identified and separately recognized. The goodwill recorded due to these acquisitions is attributable to the assembled workforces of the acquired companies and expected synergies. The Company expects to deduct $79.4 million, $3.2 million and $70.7 million of goodwill for income tax purposes for the acquisitions completed in 2021, 2020 and 2019, respectively.
The acquired companies were consolidated into the Company’s financial statements starting on their respective acquisition dates. The Company’s Consolidated Statements of Operations include aggregate revenue and operating loss of $132.4 million and $14.2 million, respectively, for the year ended December 31, 2021. The following unaudited pro forma financial information presents the Company’s results as if the current year acquisitions had occurred at the beginning of 2020. The unaudited pro forma information also includes the 2020 acquisitions as if they occurred at the beginning of 2019 and the 2019 acquisitions as if they had occurred at the beginning of 2018:
| | | | | | | | | | | | | | | | | |
| Year Ended December 31 |
| (in thousands) | 2021 | | 2020 | | 2019 |
| Operating revenues | $ | 3,513,689 | | | $ | 3,323,427 | | | $ | 3,089,712 | |
| Net income | 358,890 | | | 279,810 | | | 304,734 | |
These pro forma results were based on estimates and assumptions, which the Company believes are reasonable, and include the historical results of operations of the acquired companies and adjustments for depreciation and amortization of identified assets and the effect of pre-acquisition transaction related expenses incurred by the Company and the acquired entities. The pro forma information does not include efficiencies, cost reductions and synergies expected to result from the acquisitions. They are not the results that would have been realized had these entities been part of the Company during the periods presented and are not necessarily indicative of the Company’s consolidated results of operations in future periods.
Sale of Businesses. In December 2020, the Company completed the sale of Megaphone which was included in other businesses. In November 2019, Kaplan UK completed the sale of a small business which was included in Kaplan International. As a result of these sales, the Company reported gains (losses) in other non-operating income (see Note 16).
Other Transactions. In March 2019, a Hoover minority shareholder put some shares to the Company, which had a redemption value of $0.6 million. Following the redemption, the Company owned 98.01% of Hoover. In March 2021, Hoover’s minority shareholders put the remaining outstanding shares to the Company, which had a redemption value of $3.5 million. Following the redemption, the Company owns 100% of Hoover.
During 2019, the Company established GHC One LLC (GHC One) and GHC Two LLC (GHC Two) as a vehiclevehicles to invest in a portfolio of healthcare businesses together with athe group of senior managers of GHG. As athe holder of preferred units, the Company is obligated to contribute 95% of the capital required for the acquisition of portfolio investments with the remaining 5% of the capital coming from the group of senior managers. The operating agreementagreements of GHC One requiresand GHC Two require the dissolution of the entityentities on March 31, 2026, and March 31, 2029, respectively, at which time the net assets will be distributed to its members. As a preferred unit holder, the Company will receive an amount up to its contributed capital plus a preferred annual return of 8% (guaranteed return) after the group of senior managers has received athe redemption of their 5% interest in net assets (manager return). All distributions in excess of the manager and guaranteed return will be paid to common unit holders, which currently comprise the group of senior managers of GHG. The Company may convert its preferred units to common units at any time after which it will receive 80% of all distributions in excess of the manager return, with the remaining 20% of excess distributions going to the group of senior managers as holders of the other common units. The mandatorily redeemable noncontrolling interest is reported as a noncurrent liability at December 31, 2023 and 2022 in the Consolidated Balance Sheets. The Company presents this liability at fair value, which is computed quarterly at the current redemption value. Changes in the redemption value are recorded as interest expense or income in the Company’s Consolidated Statement of Operations.
Redeemable Noncontrolling Interest. The Company’s redeemable noncontrolling interest represents the noncontrolling interest in CSI Pharmacy Holding Company, LLC (CSI), which is 86.7% owned, Framebridge, which is 93.4% owned, Weiss, which is 50.1% owned and Skin Clique, which is 51% owned.
CSI’s minority shareholders may put up to 50% of their shares to the Company. The first put period began in 2022. A second put period for another tranche of shares begins in 2024. In December 2023, the Company acquired some of the minority-owned shares of CSI for a total amount of $20.0 million. Prior to the redemption, the Company owned 76.5% of CSI. In November 2022, a CSI minority shareholder put some shares to the Company, which had a redemption value of $1.2 million. Prior to the redemption, the Company owned 75% of CSI. The minority shareholder of Framebridge has an option to put 20% of the shares to the Company annually starting in 2024. The minority shareholder of Weiss has an option to put 10% of the shares to the Company annually starting in 2026 and may put all of the shares starting in 2033. The minority shareholders of Skin Clique have the option to put all or a portion of their shares to the Company starting in 2029 and ending in 2032. In March 2021, Hoover’s minority shareholders put the remaining outstanding shares to the Company. Following the redemption, the Company owns 100% of Hoover. Prior to the redemption, the Company owned 98.01% of Hoover. The Company presents the redeemable noncontrolling interests at the greater of its carrying amount or redemption value at the end of each reporting period in the Consolidated Balance Sheets. Changes in the redemption value are recorded as capital in excess of par value in the Company’s Consolidated Balance Sheets.
Comprehensive Income. Comprehensive income consists of net income, foreign currency translation adjustments, net changes in cash flow hedges, and pension and other postretirement plan adjustments.
Recently Adopted and Issued Accounting Pronouncements. In September 2022, the Financial Accounting Standards Board (FASB) issued new guidance that requires a buyer in a supplier finance program to disclose certain qualitative and quantitative information about the program’s nature, activity during the period, changes made from period to period, and potential magnitude. The standard was adopted by the Company in the first quarter of 2023 and did not have a significant impact on its Consolidated Financial Statements.
In November 2023, the FASB issued new guidance that requires enhanced disclosures related to reportable segments that includes, among other disclosures, identifying significant segment expenses on an annual and interim basis. The guidance is effective for fiscal years beginning after December 15, 2023, and interim periods within fiscal years beginning after December 15, 2024. Early adoption is permitted and the guidance must be applied retrospectively to all prior periods presented in the financial statements. The Company is in the process of evaluating the impact of this new guidance on the disclosures within its Consolidated Financial Statements.
In December 2023, the FASB issued new guidance that requires enhanced income tax disclosures related to the rate reconciliation, information on income taxes paid and other items. The guidance is effective for annual periods beginning after December 15, 2024. Early adoption is permitted. The standard permits both prospective and retrospective application. The Company is in the process of evaluating the impact of this new guidance on the disclosures within its Consolidated Financial Statements.
Other new accounting pronouncements issued but not effective until after December 31, 2023, are not expected to have a material impact on the Company’s Consolidated Financial Statements.
3. ACQUISITIONS AND DISPOSITIONS OF BUSINESSES
Acquisitions. During 2023, the Company acquired five businesses: three in healthcare, one in automotive, and one in other businesses for $83.3 million in cash and contingent consideration and the assumption of floor plan payables. The assets and liabilities of the companies acquired were recorded at their estimated fair values at the date of acquisition.
In January 2023, GHG acquired two small businesses which are included in healthcare.
In July 2023, the Company acquired one small business which is included in other businesses.
In September 2023, the Company’s automotive subsidiary acquired a Toyota automotive dealership, including the real property for the dealership operations. In addition to a cash payment and the assumption of $2.2 million in floor plan payables, the automotive subsidiary borrowed $37.0 million to finance the acquisition. The dealership is operated and managed by an entity affiliated with Christopher J. Ourisman, a member of the Ourisman Automotive Group family of dealerships. This acquisition expands the Company’s automotive business operations and is included in automotive.
In December 2023, GHG acquired one small business which is included in healthcare.
During 2022, the Company acquired seven businesses: five in healthcare and two in automotive, for $143.2 million in cash and contingent consideration and the assumption of floor plan payables. The assets and liabilities of the companies acquired were recorded at their estimated fair values at the date of acquisition.
In May 2022, GHG acquired two small businesses which are included in healthcare.
On July 5, 2022, the Company’s automotive subsidiary acquired two automotive dealerships, including the real property for the dealership operations. In addition to a cash payment and the assumption of $10.9 million in floor plan payables, the automotive subsidiary borrowed $77.4 million to finance the acquisition. The dealerships are operated and managed by an entity affiliated with Christopher J. Ourisman, a member of the Ourisman Automotive Group family of dealerships. These acquisitions expand the Company’s automotive business operations and are included in automotive.
In July 2022, GHG acquired a 100% interest in a multi-state provider of Applied Behavior Analysis clinics. The acquisition is expected to expand the product offerings of the healthcare division and is included in healthcare.
In August 2022, GHG acquired two small businesses which are included in healthcare.
During 2021, the Company acquired six businesses: two in education, two in healthcare, one in automotive, and one in other businesses for $392.4 million in cash and contingent consideration and the assumption of floor plan payables. The assets and liabilities of the companies acquired were recorded at their estimated fair values at the date of the acquisition.
On June 14, 2021, the Company acquired all of the outstanding common shares of Leaf Group Ltd. (Leaf) for $308.6 million in cash and the assumption of $9.2 million in liabilities related to their previous stock compensation plan, which was paid subsequent to the acquisition. Leaf is a consumer internet company that builds creator-driven brands in lifestyle and home and art design categories. The acquisition was expected to provide benefits in the future by diversifying the Company’s business operations and providing operating synergies with other business units. The Company includes the Leaf operations in other businesses.
Kaplan acquired certain assets of Projects in Knowledge, a continuing medical education provider for healthcare professionals, and another small business in November 2021. These acquisitions are expected to build upon Kaplan’s existing customer base in the medical and test preparation fields. Both businesses are included in Kaplan’s supplemental education division.
In December 2021, GHG acquired two businesses, a home health business in Florida and a 50.1% interest in Weiss, a physician practice specializing in allergies, asthma and immunology. The minority shareholder of Weiss has an option to put 10% of the shares to the Company annually starting in 2026 and may put all of the shares starting in 2033. The fair value of the redeemable noncontrolling interest in Weiss was $6.6 million at the acquisition date, determined using an income approach. These acquisitions are expected to expand the market the healthcare division serves and are included in healthcare.
On December 28, 2021, the Company’s automotive subsidiary acquired a Ford automotive dealership for cash and the assumption of $16.6 million in floor plan payables. In connection with the acquisition, the automotive subsidiary of the Company borrowed $22.5 million to finance the acquisition. The dealership is operated and managed by an entity affiliated with Christopher J. Ourisman, a member of the Ourisman Automotive Group family of dealerships. The acquisition expands the Company’s automotive business operations and is included in automotive.
Acquisition-related costs for acquisitions that closed during 2023, 2022 and 2021 were $1.2 million, $1.7 million and $3.0 million, respectively, and were expensed as incurred. The aggregate purchase price of these acquisitions was allocated as follows, based on acquisition date fair values to the following assets and liabilities:
| | | | | | | | | | | | | | | | | | | | | |
| | | Purchase Price Allocation |
| | | Year Ended December 31 |
| (in thousands) | | 2023 | | 2022 | | 2021 |
| | | | | | | |
| Accounts receivable | | | $ | 68 | | | $ | 3,172 | | | $ | 17,878 | |
| Inventory | | | 5,224 | | | 21,278 | | | 25,383 | |
| Property, plant and equipment | | | 29,859 | | | 36,255 | | | 13,126 | |
| Lease right-of-use assets | | | — | | | 4,773 | | | 25,890 | |
| Goodwill | | | 45,968 | | | 53,946 | | | 204,151 | |
| Indefinite-lived intangible assets | | | 6,300 | | | 41,800 | | | 22,200 | |
| Amortized intangible assets | | | 235 | | | 1,200 | | | 99,800 | |
| Other assets | | | 4 | | | 404 | | | 4,911 | |
| Deferred income taxes | | | — | | | 2,535 | | | 44,975 | |
| Floor plan payables | | | (2,215) | | | (10,908) | | | (16,636) | |
| | | | | | | |
| Other liabilities | | | (935) | | | (3,798) | | | (52,567) | |
| Current and noncurrent lease liabilities | | | (1,184) | | | (5,865) | | | (25,593) | |
| Redeemable noncontrolling interest | | | — | | | (2,164) | | | (6,616) | |
| Noncontrolling interest | | | — | | | (512) | | | — | |
| Aggregate purchase price, net of cash acquired | | | $ | 83,324 | | | $ | 142,116 | | | $ | 356,902 | |
The 2021 fair values include measurement period adjustments related to accounts receivable, goodwill, amortized intangible assets, current and noncurrent lease liabilities, deferred income taxes and contingent consideration. Goodwill is calculated as the excess of the consideration transferred over the net assets recognized and represents the estimated future economic benefits arising from other assets acquired that could not be individually identified and separately recognized. The goodwill recorded due to these acquisitions is attributable to the assembled workforces of the acquired companies and expected synergies. The Company expects to deduct $45.0 million, $39.7 million and $80.6 million of goodwill for income tax purposes for the acquisitions completed in 2023, 2022 and 2021, respectively.
The acquired companies were consolidated into the Company’s financial statements starting on their respective acquisition dates. The Company’s Consolidated Statements of Operations include aggregate revenue and operating income of $45.2 million and $2.2 million, respectively, for the year ended December 31, 2023. The following unaudited pro forma financial information presents the Company’s results as if the current year acquisitions had occurred at the beginning of 2022. The unaudited pro forma information also includes the 2022 acquisitions as if they occurred at the beginning of 2021 and the 2021 acquisitions as if they had occurred at the beginning of 2020:
| | | | | | | | | | | | | | | | | |
| Year Ended December 31 |
| (in thousands) | 2023 | | 2022 | | 2021 |
| Operating revenues | $ | 4,529,817 | | | $ | 4,252,847 | | | $ | 3,827,486 | |
| Net income | 218,394 | | | 87,571 | | | 376,478 | |
These pro forma results were based on estimates and assumptions, which the Company believes are reasonable, and include the historical results of operations of the acquired companies and adjustments for depreciation and amortization of identified assets and the effect of pre-acquisition transaction-related expenses incurred by the Company and the acquired entities. The pro forma information does not include efficiencies, cost reductions and synergies expected to result from the acquisitions. They are not the results that would have been realized had these entities been part of the Company during the periods presented and are not necessarily indicative of the Company’s consolidated results of operations in future periods.
Disposition of Businesses. In June 2023, the Company entered into an agreement to merge the Pinna business with Realm of Possibility, Inc. (Realm) in return for an additional noncontrolling financial interest in Realm (the Pinna transaction). The Company deconsolidated the Pinna subsidiary, which was included in other businesses, and continues to account for its interest in Realm under the equity method of accounting (see Notes 4 and 16).
In October 2022, the Company entered into an agreement to merge the CyberVista business with CyberWire, Inc. in return for a noncontrolling financial interest in the merged entity, N2K Networks, Inc. (the CyberVista transaction). The Company deconsolidated the CyberVista subsidiary, which was included in other businesses, and accounts for its continuing interest in N2K Networks under the equity method of accounting (see Notes 4 and 16).
Other Transactions. In December 2023, the Company acquired some of the minority-owned shares of CSI for a total amount of $20.0 million. The Company paid cash of $5.0 million and entered into a promissory note with the
minority owners for the remaining $15.0 million at an interest rate of 8% per annum. The note is included in other indebtedness (see Note 11) and payable in quarterly installments with the final payment due by January 1, 2027. Following the redemption, the Company owns 86.7% of CSI.
In November 2022, a CSI minority shareholder put some shares to the Company, which had a redemption value of $1.2 million. Following the redemption, the Company owned 76.5% of CSI. In March 2021, Hoover’s minority shareholders put the remaining outstanding shares to the Company, which had a redemption value of $3.5 million. Following the redemption, the Company owns 100% of Hoover.
As of December 31, 2021,2023, the Company holds a controlling financial interest in GHC One and GHC Two and therefore includes the assets, liabilities, results of operations and cash flows in its consolidated financial statements. GHC One acquired CSI and another small business during 2019, and2019. GHC Two acquired Weiss during 2021.2021 and a provider of Applied Behavior Analysis clinics and another small business in 2022. The Company accounts for the minority ownership of the group of senior managers in GHC One and GHC Two as a mandatorily redeemable noncontrolling interest (see Note 2).
4. INVESTMENTS
Money Market Investments. As of December 31, 2021,2023 and 2022, the Company had no money market investments compared to $268.8of $5.6 million at December 31, 2020,and $7.7 million, respectively, that are classified as cash and cash equivalents in the Company’s Consolidated Balance Sheets.
Investments in Marketable Equity Securities. Investments in marketable equity securities consist of the following:
| | As of December 31 |
| As of December 31 | | | As of December 31 |
| (in thousands) | (in thousands) | 2021 | | 2020 | (in thousands) | 2023 | | 2022 |
| Total cost | Total cost | $ | 273,201 | | | $ | 232,847 | |
| Gross unrealized gains | Gross unrealized gains | 537,915 | | | 340,255 | |
| Gross unrealized losses | Gross unrealized losses | (1,119) | | | — | |
| Total Fair Value | Total Fair Value | $ | 809,997 | | | $ | 573,102 | |
At December 31, 20212023 and 2020,2022, the Company owned 44,430 and 28,00055,430 shares respectively, in Markel CorporationGroup Inc. (Markel) valued at $54.8$78.7 million and $28.9$73.0 million, respectively. The Co-ChiefChief Executive Officer of Markel, Mr. Thomas S. Gayner, is a member of the Company’s Board of Directors.Directors. As of December 31, 2021, there was no marketable equity security holding that2023, the Company owned 422 Class A and 482,945 Class B shares in Berkshire Hathaway valued at $401.2 million, which exceeded 5% of the Company’s total assets.
The Company purchased $48.0$4.6 million, $20.0$42.1 million, of which $1.5 million was settled in January 2023, and $7.5$48.0 million of marketable equity securities during 2021, 20202023, 2022 and 2019,2021, respectively.
During 2021, 20202023, 2022 and 2019,2021, the gross cumulative realized net gains from the sales of marketable equity securities were $46.0$13.0 million, $23.0$58.1 million and $9.5$46.0 million, respectively. The total proceeds from such sales were $65.5$62.0 million, $93.8$102.0 million and $19.3$65.5 million, respectively.
The net gain (loss) on marketable equity securities comprised the following:
| | Year ended December 31 |
| Year Ended December 31 | | | Year Ended December 31 |
| (in thousands) | (in thousands) | 2021 | | 2020 | | 2019 | (in thousands) | 2023 | | 2022 | | 2021 |
| Gain on marketable equity securities, net | $ | 243,088 | | | $ | 60,787 | |
| $ | 98,668 | |
| Gain (loss) on marketable equity securities, net | |
| Less: Net (gains) losses in earnings from marketable equity securities sold and donated | Less: Net (gains) losses in earnings from marketable equity securities sold and donated | (17,830) | | | 13,382 | | | (2,810) | |
| Net unrealized gains in earnings from marketable equity securities still held at the end of the year | $ | 225,258 | |
| $ | 74,169 | |
| $ | 95,858 | |
| Net unrealized gains (losses) in earnings from marketable equity securities still held at the end of the year | |
Investments in Affiliates. In June 2023, the Company entered into an agreement to merge the Pinna business with Realm in return for an additional noncontrolling financial interest in Realm. The Company held an equity interest in Realm prior to the merger transaction, which was accounted for under the equity method. Following the merger transaction, the Company’s convertible note in Realm was converted into equity and the Company also made an additional investment in Realm. As of December 31, 2021,2023, the Company held a 42.2% interest in Realm on a fully diluted basis, and continues to account for its investment under the equity method.
As of December 31, 2023, the Company held a 49.9% interest in N2K Networks on a fully diluted basis, and accounts for its investment under the equity method. The Company holds two of the five seats of N2K Networks’ governing board with the other shareholders retaining substantive participation rights to control the financial and operating decisions of N2K Networks through their representation on the board.
As of December 31, 2023, the Company held an approximate 12%18% interest in Intersection Holdings, LLC (Intersection), and accounts for its investment under the equity method. The Company holds two of the ten seats of Intersection’s governing board, which allows the Company to exercise significant influence over Intersection. In April 2023, the Company entered into a term note agreement to loan Intersection $30.0 million at an interest rate of 9% per annum. The principal and interest on the note are payable in monthly installments over 5 years with the final payment due by May 2028. The outstanding balance on this loan was $28.8 million as of December 31, 2023.
As of December 31, 2021,2023, the Company also held investments in several other affiliates; GHG held a 40% interest in Residential Home Health Illinois, a 42.5%40% interest in Residential Hospice Illinois, a 40% interest in the joint venture formed between GHG and a Michigan hospital, and a 40% interest in the joint venture
formed between GHG and Allegheny Health Network (AHN). During the first quarter of 2022, GHG invested an additional $18.5 million in the Residential Home Health Illinois and Residential Hospice Illinois affiliates to fund their acquisition of certain home health and hospice assets of the NorthShore University HealthSystem. The transaction diluted GHG’s interest in Residential Hospice Illinois resulting in a $0.6 million gain on sale of investment in affiliate (see Note 16). For the years ended December 31, 2023, 2022 and 2021, 2020 and 2019, the CompanyGHG recorded $10.9$15.6 million, $9.6$13.9 million and $9.3$10.9 million, respectively, in revenue for services provided to the affiliates of GHG.its affiliates.
The Company had $52.5$36.9 million and $26.1$49.1 million in its investment account that represents cumulative undistributed income in its investments in affiliates as of December 31, 20212023 and 2020,2022, respectively.
In the third quarter of 2021, the Company recorded an impairment charge of $6.6 million on 1one of its investments in affiliates as a result of the challenging economic environment for this business following an announcement by the Chinese government to reform the education sector for private education companies. In the first quarter of 2020, the Company recorded impairment charges of $3.6 million on 2 of its investments in affiliates as a result of the challenging economic environment for these businesses, of which $2.7 million related to the Company’s investment in Framebridge. It is reasonably possible that further COVID-19 disruptions could result in additional impairment charges related to the Company’s investments in affiliates should the impact of COVID-19 not dissipate or have a worsening adverse impact on our affiliates in future periods. The Company records its share of the earnings or losses of its affiliates from their most recent available financial statements. In some instances, the reporting period of the affiliates’ financial statements lags the Company’s financial reporting period, but such lag is never more than three months. It is possible that the Company’s results of operations for the year ended December 31, 2021 does not capture the impact of the COVID-19 pandemic on the earnings or losses of the affiliates whose financial results are recorded on a lag basis.
In May 2020, the Company made an additional investment in Framebridge (see Note 3) that resulted in the Company obtaining control of the investee. The results of operations, cash flows, assets and liabilities of Framebridge are included in the consolidated financial statements of the Company from the date of the acquisition. Timothy J. O’Shaughnessy, President and Chief Executive Officer of Graham Holdings Company, was a personal investor in Framebridge and served as Chairman of the Board prior to the acquisition of the additional interest. The Company acquired Mr. O’Shaughnessy’s interest under the same terms as the other Framebridge investors.
In February 2019, the Company sold its interest in Gimlet Media. In connection with this sale, the Company recorded a gain of $29.0 million in the first quarter of 2019. The total proceeds from the sale were $33.5 million.
Additionally, Kaplan International Holdings Limited (KIHL) held a 45% interest in a joint venture formed with University of York. KIHL loaned the joint venture £22 million, which loan is repayable over 25 years at an interest rate of 7% and guaranteed by the University of York. The outstanding balance on this loan was £19.9 million as of December 31, 2023. The loan is repayable by December 2041.
Summarized Financial Data of Nonconsolidated Affiliates. The Company'sCompany’s investments in affiliates consists of investments in private equity funds and other operating entities that it does not control, but over which it exerts significant influence. The following tables present summarized financial data for the Company'sCompany’s nonconsolidated affiliates. The amounts included in the tables below present 100% of the balance sheets and the results of operations of such nonconsolidated affiliates accounted for under the equity method.
The Company’s ownership in private equity fund partnerships varies between approximately 4% and 10%; the Company’s related investment balance included in Investments in Affiliates was $72.8$56.6 million and $41.1$68.9 million as of December 31, 20212023 and 2020,2022, respectively.
The summarized balance sheet data of the private equity fund investments consists of the following:
| | As of December 31 |
| As of December 31 | | | As of December 31 |
| (in thousands) | (in thousands) | 2021 | | 2020 | (in thousands) | 2023 | | 2022 |
| Investments in securities, at estimated fair value | Investments in securities, at estimated fair value | $ | 2,039,368 | | | $ | 1,500,192 | |
| Other currents assets | 28,590 | | | 24,111 | |
| Other current assets | |
| Total assets | Total assets | $ | 2,067,958 | | | $ | 1,524,303 | |
| Total liabilities | Total liabilities | 4,790 | | | 7,488 | |
| Total partners’ capital | Total partners’ capital | 2,063,168 | | | 1,516,815 | |
| Total liabilities and partners’ capital | Total liabilities and partners’ capital | $ | 2,067,958 | | | $ | 1,524,303 | |
The summarized operating data of the private equity fund investments was as follows:
| | Year ended December 31 |
| Year Ended December 31 | | | Year Ended December 31 |
| (in thousands) | (in thousands) | 2021 | | 2020 | | 2019 | (in thousands) | 2023 | | 2022 | | 2021 |
| Net investment loss | Net investment loss | $ | (13,324) | | | $ | (15,301) | | | $ | (13,691) | |
| Net realized gain on investments | Net realized gain on investments | 190,368 | | | 440 | | | 79,443 | |
| Net change in unrealized appreciation on investments | 1,043,627 | | | 525,588 | | | 150,641 | |
| Increase in net assets from operations | $ | 1,220,671 | | | $ | 510,727 | | | $ | 216,393 | |
| Net change in unrealized (depreciation) appreciation on investments | |
| (Decrease) increase in net assets from operations | |
The summarized balance sheet data of the operating entity investments consists of the following:
| | As of December 31 |
| As of December 31 | | | As of December 31 |
| (in thousands) | (in thousands) | 2021 | | 2020 | (in thousands) | 2023 | | 2022 |
| Current assets | Current assets | $ | 203,274 | | | $ | 164,526 | |
| Noncurrent assets | Noncurrent assets | 569,505 | | | 566,053 | |
| Total assets | Total assets | $ | 772,779 | | | $ | 730,579 | |
| Current liabilities | Current liabilities | 219,220 | | | 428,735 | |
| Noncurrent liabilities | Noncurrent liabilities | 329,965 | | | 264,807 | |
| Total liabilities | Total liabilities | $ | 549,185 | | | $ | 693,542 | |
| Noncontrolling interests | Noncontrolling interests | $ | (80,604) | | | $ | (103,829) | |
The summarized operating data of the operating entity investments was as follows:
| | Year ended December 31 |
| Year Ended December 31 | | | Year Ended December 31 |
| (in thousands) | (in thousands) | 2021 | | 2020 | | 2019 | (in thousands) | 2023 | | 2022 | | 2021 |
| Net sales | Net sales | $ | 358,928 | | | $ | 312,194 | | | $ | 438,168 | |
| Gross profit | Gross profit | 146,312 | | | 11,217 | | | 103,510 | |
| Net income (loss) | 135,241 | | | (206,504) | | | (125,146) | |
| Net income (loss) attributable to the entity | 102,829 | | | (148,394) | | | (81,268) | |
| Net (loss) income | |
| Net (loss) income attributable to the entity | |
Cost Method Investments. The Company held investments without readily determinable fair values in a number of equity securities that are accounted for as cost method investments, which are recorded at cost, less impairment, and adjusted for observable price changes for identical or similar investments of the same issuer. The carrying value of these investments was $48.9$74.0 million and $35.7$66.7 million as of December 31, 20212023 and 2020,2022, respectively. During the years ended December 31, 2021, 20202023, 2022 and 2019,2021, the Company recorded gains of $11.8$3.1 million $4.2, $6.9 million and $5.1$11.8 million, respectively, to those equity securities based on observable transactions. For the yearyears ended December 31, 2020,2023 and 2022, the Company recorded impairment losses of $7.3$0.5 million and $1.3 million, respectively, to those securities.
5. ACCOUNTS RECEIVABLE, ACCOUNTS PAYABLE, VEHICLE FLOOR PLAN PAYABLE AND ACCRUED LIABILITIES
Accounts receivable consist of the following:
| | As of December 31 |
| As of December 31 | | | As of December 31 |
| (in thousands) | (in thousands) | 2021 | | 2020 | (in thousands) | 2023 | | 2022 |
| | Receivables from contracts with customers, less estimated credit losses of $21,836 and $21,494 | $ | 589,582 | | | $ | 519,577 | |
| Receivables from contracts with customers, less estimated credit losses of $24,667 and $21,387 | |
| Receivables from contracts with customers, less estimated credit losses of $24,667 and $21,387 | |
| Receivables from contracts with customers, less estimated credit losses of $24,667 and $21,387 | |
| Other receivables | Other receivables | 17,889 | | | 17,579 | |
| | | $ | 607,471 | | | $ | 537,156 | |
The changes in estimated credit losses waswere as follows:
| | (in thousands) | (in thousands) | Balance at
Beginning of Period | | Additions –
Charged to
Costs and
Expenses | | Deductions | | Balance at
End of
Period | (in thousands) | Balance at
Beginning of Period | | Additions –
Charged to
Costs and
Expenses | | Deductions | | Balance at
End of
Period |
| | 2023 | |
| 2023 | |
| 2023 | |
| | 2022 | |
| | 2022 | |
| | 2022 | |
| | | 2021 | 2021 | $ | 21,494 | | | $ | 6,824 | | | $ | (6,482) | | | $ | 21,836 | |
| | 2021 | |
| | 2020 | 14,276 | | | 10,667 | | | (3,449) | | | 21,494 | |
| 2021 | |
| | 2019 | 14,775 | | | 1,706 | | | (2,205) | | | 14,276 | |
|
Accounts payable, vehicle floor plan payable and accrued liabilities consist of the following:
| | As of December 31 |
| As of December 31 | | | As of December 31 |
| (in thousands) | (in thousands) | 2021 | | 2020 | (in thousands) | 2023 | | 2022 |
| Accounts payable | Accounts payable | $ | 126,985 | | | $ | 106,215 | |
| Vehicle floor plan payable | |
| Accrued compensation and related benefits | Accrued compensation and related benefits | 179,307 | | | 135,493 | |
| Other accrued liabilities | Other accrued liabilities | 277,337 | | | 278,528 | |
| | | $ | 583,629 | | | $ | 520,236 | |
Cash overdrafts of $5.5 million and $2.1$0.5 million are included in accounts payable and accrued liabilities at December 31, 20212023 and 2020, respectively.2022.
6. INVENTORIES, CONTRACTS IN PROGRESS AND VEHICLE FLOOR PLAN PAYABLE
Inventories and contracts in progress consist of the following:
| | | | | | | | | | | |
| As of December 31 |
| (in thousands) | 2021 | | 2020 |
| Raw materials | $ | 54,944 | | | $ | 45,382 | |
| Work-in-process | 11,506 | | | 10,402 | |
| Finished goods | 72,796 | | | 64,061 | |
| Contracts in progress | 2,225 | | | 777 | |
| | $ | 141,471 | | | $ | 120,622 | |
The Company finances new, used and usedservice loaner vehicle inventory through standardized floor plan facilities with Truist Bank and Toyota Motor Credit Corporation (Truist and Toyota floor plan facility) and Ford Motor Credit Company (Ford floor plan facility). The Truist floor plan facility bore interest at variable rates that were based on LIBOR plus 1.15% per annum. On December 28, 2021,September 26, 2023, the Company entered into an amendeda credit agreement with Truist modifying the interest rateBank (see Note 11) to, Secured Overnight Financing Rate (SOFR) plus 1.19% per annum.among other things, establish a new revolving floor plan credit facility with an aggregate capacity of $115.0 million. The FordTruist and Toyota floor plan facility bears interest at variable rates that are based on the prime rate, with a floor of 3.5%,Secured Overnight Financing Rate (SOFR) plus 1.5%1.25% per annum. In connection with the establishment of the Truist and Toyota floor plan facility, the previous Truist floor plan facility, dated July 5, 2022, was repaid and terminated. At December 31, 2023, the floor plan facilities bore interest at variable rates that are based on SOFR and prime-based interest rates. The weighted average interest rate for the floor plan facilities was 1.1%6.2%, 1.7%3.2% and 3.3%1.1% for the years ended December 31, 2023, 2022 and 2021, 2020 and 2019, respectively. As of December 31, 2021, the aggregate capacity under the floor plan facilities was $70.9 million, of which $31.6 million had been utilized, and is included in accounts payable and accrued liabilities in the Consolidated Balance Sheet. Changes in the vehicle floor plan payable are reported as cash flows from financing activities in the Consolidated Statements of Cash Flows.
The floor plan facility isfacilities are collateralized by vehicle inventory and other assets of the relevant dealership subsidiary, and containscontain a number of covenants, including, among others, covenants restricting the dealership subsidiary with respect to the creation of liens and changes in ownership, officers and key management personnel. The Company was in compliance with all of these restrictive covenants as of December 31, 2021.2023.
The floor plan interest expense related to the vehicle floor plan arrangements is offset by amounts received from manufacturers in the form of floor plan assistance capitalized in inventory and recorded against cost of goods sold in the Consolidated Statements of Operations when the associated inventory is sold. For the years ended December 31, 2021, 20202023, 2022 and 2019,2021, the Company recognized a reduction in cost of goods sold of $2.7$6.7 million, $2.1$4.6 million and $1.8$2.7 million, respectively, related to manufacturer floor plan assistance.
Activity related to floor plan facilities associated with new vehicles is as follows:
| | | | | |
| (in thousands) | 2023 |
| Obligations outstanding at the beginning of the year | $ | 69,190 | |
| Additions | 646,083 | |
| Settlements | (586,344) | |
| Obligations outstanding at the end of the year | $ | 128,929 | |
6. INVENTORIES AND CONTRACTS IN PROGRESS
Inventories and contracts in progress consist of the following:
| | | | | | | | | | | |
| As of December 31 |
| (in thousands) | 2023 | | 2022 |
| Raw materials | $ | 63,884 | | | $ | 68,494 | |
| Work-in-process | 15,387 | | | 15,718 | |
| Finished goods | 215,283 | | | 140,548 | |
| Contracts in progress | 2,657 | | | 2,051 | |
| | $ | 297,211 | | | $ | 226,811 | |
7. PROPERTY, PLANT AND EQUIPMENT
Property, plant and equipment consist of the following:
| | As of December 31 |
| As of December 31 | | | As of December 31 |
| (in thousands) | (in thousands) | 2021 | | 2020 | (in thousands) | 2023 | | 2022 |
| Land | Land | $ | 73,651 | | | $ | 19,394 | |
| Buildings | Buildings | 211,758 | | | 176,653 | |
| Machinery, equipment and fixtures | Machinery, equipment and fixtures | 419,778 | | | 398,334 | |
| Leasehold improvements | Leasehold improvements | 215,640 | | | 229,512 | |
| Construction in progress | Construction in progress | 19,517 | | | 25,301 | |
| 940,344 | | | 849,194 | |
| Less accumulated depreciation | (472,218) | | | (470,908) | |
| $ | 468,126 | | | $ | 378,286 | |
| 1,120,102 | |
| Less: accumulated depreciation | |
| $ | |
Depreciation expense was $86.1 million, $73.3 million, and $71.4 million $74.3 million,in 2023, 2022 and $59.3 million in 2021, 2020 and 2019, respectively.
The Company capitalized $2.1 million of interest related to the construction of buildings in 2019.
The Company recorded property, plant and equipment impairment charges of $0.3 million and $2.4 million $2.3 millionin 2023 and $0.3 million in 2021, 2020 and 2019, respectively. The Company estimated the fair value of the property, plant and equipment using income and market approaches.
8. LEASES
Operating Leases. The components of operating lease expense were as follows:
| | | Year ended December 31 |
| | Year Ended December 31 | |
| | Year Ended December 31 | |
| | Year Ended December 31 | |
| (in thousands) | (in thousands) | | 2021 | | 2020 | 2019 | |
| Operating lease cost | Operating lease cost | | $ | 96,078 | | | $ | 113,669 | | $ | 104,007 | | |
| Operating lease cost | |
| Operating lease cost | |
| Short-term and month-to-month lease cost | |
| Short-term and month-to-month lease cost | |
| Short-term and month-to-month lease cost | Short-term and month-to-month lease cost | | 17,724 | | | 21,862 | | 19,267 | | |
| Variable lease cost | Variable lease cost | | 20,889 | | | 18,718 | | 20,582 | | |
| Variable lease cost | |
| Variable lease cost | |
| Sublease income | |
| Sublease income | |
| Sublease income | Sublease income | | (16,918) | | | (18,508) | | (20,108) | | |
| Total net lease cost | Total net lease cost | | $ | 117,773 | | | $ | 135,741 | | $ | 123,748 | | |
| Total net lease cost | |
| Total net lease cost | |
The Company recorded impairment charges of $0.8 million and $3.9 million $11.4 millionin 2023 and $1.1 million in 2021, 2020 and 2019, respectively. The Company estimated the fair value of the right-of-useROU assets using an income approach.
In connection with the sale of the KHE Campuses (KHEC) business, the Company is the guarantor of several leases for which it has established ROU assets and lease liabilities. Any net lease cost or sublease income related to these leases is recorded in other non-operating income. The total net lease cost related to these leases was $0.1 million, $0.8 million and $0.8 million for 2021, 2020 and 2019, respectively.
Supplemental information related to operating leases was as follows:
| | Year ended December 31 |
| Year Ended December 31 | |
| Year Ended December 31 | |
| Year Ended December 31 | |
| (in thousands) | (in thousands) | 2021 | | 2020 | 2019 | |
| Cash Flow Information: | Cash Flow Information: | | |
| Cash Flow Information: | |
| Cash Flow Information: | |
| Operating cash flows from operating leases (payments) | |
| Operating cash flows from operating leases (payments) | |
| Operating cash flows from operating leases (payments) | Operating cash flows from operating leases (payments) | $ | 105,164 | | | $ | 113,664 | | $ | 112,671 | | |
| Right-of-use assets obtained in exchange for new operating lease liabilities (noncash) | Right-of-use assets obtained in exchange for new operating lease liabilities (noncash) | 59,409 | | | 27,031 | | 236,714 | | |
| Right-of-use assets obtained in exchange for new operating lease liabilities (noncash) | |
| Right-of-use assets obtained in exchange for new operating lease liabilities (noncash) | |
| | | | As of December 31 | |
| | As of December 31 | |
| | | As of December 31 | |
| | | 2021 | 2020 | |
| | | As of December 31 | |
| | | 2023 | |
| | | 2023 | |
| | | 2023 | |
| Balance Sheet Information: | Balance Sheet Information: | | | |
| Balance Sheet Information: | |
| Balance Sheet Information: | |
| Lease right-of-use assets | |
| Lease right-of-use assets | |
| Lease right-of-use assets | Lease right-of-use assets | | $ | 437,969 | | $ | 462,560 | | |
| | Current lease liabilities | Current lease liabilities | | $ | 77,655 | | $ | 86,797 | | |
| | Current lease liabilities | |
| | Current lease liabilities | |
| Noncurrent lease liabilities | |
| Noncurrent lease liabilities | |
| Noncurrent lease liabilities | Noncurrent lease liabilities | | 405,200 | | 428,849 | | |
| Total lease liabilities | Total lease liabilities | | $ | 482,855 | | $ | 515,646 | | |
| | Weighted average remaining lease term (years) | | 10.6 | 9.9 | |
| Weighted average discount rate | | 4.6 | % | 4.4 | % | |
| Total lease liabilities | |
| Total lease liabilities | |
| | | | | | | | | | | | | | | | | | | |
| Weighted average remaining lease term (years) | | | 10.6 | | 10.7 | | |
| Weighted average discount rate | | | 5.2 | % | | 4.9 | % | | |
At December 31, 2021,2023, maturities of operating lease liabilities were as follows:
| | (in thousands) | (in thousands) | December 31, 2021 | (in thousands) | December 31, 2023 |
| 2022 | $ | 97,501 | |
| 2023 | 79,854 | |
| 2024 | 2024 | 64,030 | |
| 2025 | 2025 | 50,392 | |
| 2026 | 2026 | 45,897 | |
| 2027 | |
| 2028 | |
| Thereafter | Thereafter | 296,514 | |
| Total payments | Total payments | 634,188 | |
| Less: Imputed interest | Less: Imputed interest | (151,333) | |
| Total | Total | $ | 482,855 | |
As of December 31, 2021,2023, the Company has entered into operating leases, including educational and other facilities, that have not yet commenced thatand have minimum lease payments of $6.6$23.3 million. These operating leases will commence in fiscal year 20222024 with lease terms of two5 to 1120 years.
Finance Leases. The components of financing lease expense were as follows:
| | | | | | | | | | | | | | | | | | | |
| Year Ended December 31 | | | | | | | | | | |
| (in thousands) | 2023 | 2022 | | | | | | |
| | | | | | | | | | | | | |
| Finance lease cost: | | | | | | | | | | | | | |
| Amortization of right-of-use assets | $ | 5,687 | | $ | 2,351 | | | | | | | | | | | | |
| Interest on lease liabilities | 989 | | 317 | | | | | | | | | | | | |
| Finance lease cost | 6,676 | | 2,668 | | | | | | | | | | | | |
| Variable lease cost | 133 | | 85 | | | | | | | | | | | | |
| Total net lease cost | $ | 6,809 | | $ | 2,753 | | | | | | | | | | | | |
Supplemental information related to finance leases was as follows: | | | | | | | | | | | | | |
| Year Ended December 31 | | | | | |
| (in thousands) | 2023 | 2022 | | | | | |
| | | | | | | |
| Cash Flow Information: | | | | | | | |
| Operating cash flows from finance leases | $ | 989 | | $ | 317 | | | | | | |
| Financing cash flows from finance leases (payments) | 10,376 | | 6,237 | | | | | | |
| Right-of-use assets obtained in exchange for new finance lease liabilities (noncash) | 20,265 | | 9,182 | | | | | | |
| | | | | | | |
| As of December 31 | | | | | |
| 2023 | 2022 | | | | | |
| | | | | | | |
| Balance Sheet Information: | | | | | | | |
| Property, plant and equipment, net | $ | 22,831 | | $ | 13,835 | | | | | | |
| | | | | | | |
| Current lease liabilities | $ | 17,357 | | $ | 8,697 | | | | | | |
| Noncurrent lease liabilities | 6,571 | | 5,362 | | | | | | |
| Total lease liabilities | $ | 23,928 | | $ | 14,059 | | | | | | |
| | | | | | | | |
| Weighted average remaining lease term (years) | 1.8 | 2.0 |
| Weighted average discount rate | 6.3 | % | 4.6 | % |
At December 31, 2023, maturities of finance lease liabilities were as follows:
| | | | | |
| (in thousands) | December 31, 2023 |
| 2024 | $ | 17,960 | |
| 2025 | 5,194 | |
| 2026 | 1,702 | |
| 2027 | 22 | |
| 2028 | 11 | |
| Total payments | 24,889 | |
| Less: Imputed interest | (961) | |
| Total | $ | 23,928 | |
9. GOODWILL AND OTHER INTANGIBLE ASSETS
TheIn the third quarter of 2023, due to continued sustained weakness in demand for certain Dekko power and data products primarily in the commercial office space market, the Company changedperformed an interim review of the presentationgoodwill of its segmentsthe Dekko reporting unit. As a result of the impairment review, the Company recorded a $47.8 million goodwill impairment charge. Also in the third quarter of 20212023, as a result of the substantial digital advertising revenue declines and continued significant operating losses at WGB, the Company performed an interim review of the goodwill of the WGB reporting unit. As a result of the impairment review, the Company recorded a $50.2 million goodwill impairment charge. The Company estimated the fair value of the reporting units by utilizing a discounted cash flow model. The carrying value of the reporting units exceeded their estimated fair values, resulting in goodwill impairment charges for the amount by which the carrying values exceeded their estimated fair values after taking into account the effect of deferred income taxes. Dekko is included in manufacturing and WGB is included in other businesses.
In the fourth quarter of 2022, as a result of the weakened current outlook for digital advertising and consumer demand for art and related goods following 7 reportable segments: Kaplan International, Higher Education, Supplemental Education, Television Broadcasting, Manufacturing, Healthcaresubstantial declines in revenues and Automotive (see Note 19).significant operating losses at the Leaf businesses, the Company recorded goodwill and amortized intangible asset impairment charges of $129.0 million at the Leaf Media (renamed WGB) and Leaf Marketplace (includes Society6 and Saatchi Art) reporting units. The Company estimated the fair value of the reporting units and amortized intangible assets by utilizing a discounted cash flow model. The carrying values of the reporting units and amortized intangible assets exceeded their estimated fair values, resulting in goodwill and intangible asset impairment charges for the amount by which the carrying values exceeded their estimated fair values after taking into account the effect of deferred income taxes. WGB, Society6 and Saatchi Art (collectively the Leaf businesses) are included in other businesses.
In the third quarter of 2021, as a result of the emergence of the COVID-19 Delta variant and continued weak product demand in the commercial office electrical products and hospitality sectors caused by the COVID-19 pandemic, the Company performed an interim review of the goodwill and indefinite-lived intangibles of the Dekko reporting unit. As a result of the impairment review, the Company recorded a $26.7 million goodwill impairment charge. The Company estimated the fair value of the reporting unit by utilizing a discounted cash flow model. The carrying value of the reporting unit exceeded the estimated fair value, resulting in a goodwill impairment charge for
the amount by which the carrying value exceeded the estimated fair value after taking into account the effect of deferred income taxes. Dekko is included in manufacturing.
In the first quarter of 2020, as a result of the uncertainty and challenging operating environment created by the COVID-19 pandemic, the Company performed an interim review of the goodwill, indefinite-lived intangibles and other long-lived assets of the CRG and automotive dealership reporting units and asset groups. As a result of the impairment reviews, the Company recorded a $9.7 million goodwill and indefinite-lived intangible asset impairment charge at CRG and a $6.7 million indefinite-lived intangible asset impairment charge at the auto dealerships. The Company estimated the fair value of the reporting units and indefinite-lived intangible assets by utilizing a discounted cash flow model. The carrying value of the CRG reporting unit and the indefinite-lived intangible assets exceeded the estimated fair value, resulting in a goodwill and indefinite-lived intangible asset impairment charge for the amount by which the carrying value exceeded the estimated fair value. CRG is included in other businesses and the automotive dealerships are included in automotive.
Additional COVID-19 disruptions could result in future adverse changes in projections for future operating results or other key assumptions, such as projected revenue, profit margin, capital expenditures or cash flows associated with fair value estimates and could lead to additional future impairments, which could be material.
In the fourth quarter of 2019, Television Broadcasting recorded an intangible asset impairment charge of $7.8 million related to FCC licenses at 2 of its stations, due to a decline in local market conditions. The fair value of the intangible asset was estimated using an income approach.
Amortization of intangible assets for the years ended December 31, 2023, 2022 and 2021, 2020 and 2019, was $57.9$50.0 million, $56.8$58.9 million and $53.2$57.9 million, respectively. Amortization of intangible assets is estimated to be approximately $59 million in 2022, $51 million in 2023, $39$37 million in 2024, $31$29 million in 2025, $26$20 million in 2026, $6 million in 2027, $3 million in 2028 and $41$17 million thereafter.
The changes in the carrying amount of goodwill, by segment, were as follows:
| | (in thousands) | (in thousands) | Education | | Television
Broadcasting | | Manufacturing | | Healthcare | | Automotive | | Other
Businesses | | Total | (in thousands) | Education | | Television
Broadcasting | | Manufacturing | | Healthcare | | Automotive | | Other
Businesses | | Total |
| As of December 31, 2019 | | | | | | | |
| As of December 31, 2021 | | As of December 31, 2021 | | | | | | | | | | | | | |
| Goodwill | Goodwill | $ | 1,140,958 | | | $ | 190,815 | | | $ | 234,993 | | | $ | 98,421 | | | $ | 39,121 | | | $ | 30,423 | | | $ | 1,734,731 | |
| Accumulated impairment losses | Accumulated impairment losses | (331,151) | | | — | | | (7,616) | | | — | | | — | | | (7,685) | | | (346,452) | |
| | | 809,807 | | | 190,815 | | | 227,377 | | | 98,421 | | | 39,121 | | | 22,738 | | | 1,388,279 | |
| Measurement period adjustment | Measurement period adjustment | 154 | | | — | | | — | | | — | | | — | | | — | | | 154 | |
| Acquisitions | Acquisitions | 13,022 | | | — | | | — | | | — | | | — | | | 60,928 | | | 73,950 | |
| Impairment | Impairment | — | | | — | | | — | | | — | | | — | | | (6,878) | | | (6,878) | |
| | Foreign currency exchange rate changes | Foreign currency exchange rate changes | 29,245 | | | — | | | — | | | — | | | — | | | — | | | 29,245 | |
| As of December 31, 2020 | | | | | | | |
| | Foreign currency exchange rate changes | |
| | Foreign currency exchange rate changes | |
| As of December 31, 2022 | | As of December 31, 2022 | | | | | | | | | | | | | |
| Goodwill | Goodwill | 1,183,379 | | | 190,815 | | | 234,993 | | | 98,421 | | | 39,121 | | | 91,351 | | | 1,838,080 | |
| Accumulated impairment losses | Accumulated impairment losses | (331,151) | | | — | | | (7,616) | | | — | | | — | | | (14,563) | | | (353,330) | |
| | | 852,228 | | | 190,815 | | | 227,377 | | | 98,421 | | | 39,121 | | | 76,788 | | | 1,484,750 | |
| | Measurement period adjustment | |
| Acquisitions | Acquisitions | 16,342 | | | — | | | — | | | 19,908 | | | 6,705 | | | 162,048 | | | 205,003 | |
| Impairment | Impairment | — | | | — | | | (26,686) | | | — | | | — | | | — | | | (26,686) | |
| | Foreign currency exchange rate changes | Foreign currency exchange rate changes | (13,485) | | | — | | | — | | | — | | | — | | | — | | | (13,485) | |
| As of December 31, 2021 | |
| | Foreign currency exchange rate changes | |
| | Foreign currency exchange rate changes | |
| As of December 31, 2023 | |
| Goodwill | |
| Goodwill | |
| Goodwill | Goodwill | 1,186,236 | | | 190,815 | | | 234,993 | | | 118,329 | | | 45,826 | | | 253,399 | | | 2,029,598 | |
| Accumulated impairment losses | Accumulated impairment losses | (331,151) | | | — | | | (34,302) | | | — | | | — | | | (14,563) | | | (380,016) | |
| | | $ | 855,085 | | | $ | 190,815 | | | $ | 200,691 | | | $ | 118,329 | | | $ | 45,826 | | | $ | 238,836 | | | $ | 1,649,582 | |
The changes in carrying amount of goodwill at the Company’s education division were as follows:
| | (in thousands) | (in thousands) | Kaplan
International | | Higher
Education | | Supplemental Education | | Total | (in thousands) | Kaplan
International | | Higher
Education | | Supplemental Education | | Total |
| As of December 31, 2019 | | | | | |
| As of December 31, 2021 | | As of December 31, 2021 | | | | | | | |
| Goodwill | Goodwill | $ | 595,604 | | | $ | 174,564 | | | $ | 370,790 | | | $ | 1,140,958 | |
| Accumulated impairment losses | Accumulated impairment losses | — | | | (111,324) | | | (219,827) | | | (331,151) | |
| | | 595,604 | | | 63,240 | | | 150,963 | | | 809,807 | |
| Measurement period adjustment | Measurement period adjustment | 154 | | | — | | | — | | | 154 | |
| Acquisitions | 9,788 | | | — | | | 3,234 | | | 13,022 | |
| | | Foreign currency exchange rate changes | Foreign currency exchange rate changes | 29,203 | | | — | | | 42 | | | 29,245 | |
| As of December 31, 2020 | |
| | Foreign currency exchange rate changes | |
| | Foreign currency exchange rate changes | |
| As of December 31, 2022 | |
| Goodwill | |
| Goodwill | |
| Goodwill | Goodwill | 634,749 | | | 174,564 | | | 374,066 | | | 1,183,379 | |
| Accumulated impairment losses | Accumulated impairment losses | — | | | (111,324) | | | (219,827) | | | (331,151) | |
| | | 634,749 | | | 63,240 | | | 154,239 | | | 852,228 | |
| | Acquisitions | — | | | — | | | 16,342 | | | 16,342 | |
| | | Foreign currency exchange rate changes | Foreign currency exchange rate changes | (13,481) | | | — | | | (4) | | | (13,485) | |
| As of December 31, 2021 | | | | |
| | Foreign currency exchange rate changes | |
| | Foreign currency exchange rate changes | |
| As of December 31, 2023 | |
| Goodwill | |
| Goodwill | |
| Goodwill | Goodwill | 621,268 | | | 174,564 | | | 390,404 | | | 1,186,236 | |
| Accumulated impairment losses | Accumulated impairment losses | — | | | (111,324) | | | (219,827) | | | (331,151) | |
| | | $ | 621,268 | | | $ | 63,240 | | | $ | 170,577 | | | $ | 855,085 | |
Other intangible assets consist of the following:
| | | | | | | | | | | | | | | | | | | | | | | | | | | | | | | | | | | | | | | | | |
| | | | As of December 31, 2021 | | As of December 31, 2020 |
| (in thousands) | Useful
Life
Range | | Gross
Carrying
Amount | | Accumulated
Amortization | | Net
Carrying
Amount | | Gross
Carrying
Amount | | Accumulated
Amortization | | Net
Carrying
Amount |
| Amortized Intangible Assets | | | | | | | | | | | | | |
| Student and customer relationships | 2–10 years | | $ | 300,027 | | | $ | 206,714 | | | $ | 93,313 | | | $ | 294,077 | | | $ | 178,075 | | | $ | 116,002 | |
| Trade names and trademarks | 2–15 years (1) | | 158,365 | | | 68,113 | | | 90,252 | | | 109,809 | | | 54,766 | | | 55,043 | |
| Network affiliation agreements | 10 years | | 17,400 | | | 8,628 | | | 8,772 | | | 17,400 | | | 6,888 | | | 10,512 | |
| Databases and technology | 3–6 years | | 36,585 | | | 26,464 | | | 10,121 | | | 34,864 | | | 19,924 | | | 14,940 | |
| Noncompete agreements | 2–5 years | | 1,000 | | | 991 | | | 9 | | | 1,000 | | | 937 | | | 63 | |
| Other | 1–8 years | | 68,500 | | | 23,847 | | | 44,653 | | | 24,800 | | | 16,714 | | | 8,086 | |
| | | | $ | 581,877 | | | $ | 334,757 | | | $ | 247,120 | | | $ | 481,950 | | | $ | 277,304 | | | $ | 204,646 | |
| Indefinite-Lived Intangible Assets | | | | | | | | | | | | | |
| | | | | | | | | | | | | |
| | | | | | | | | | | | | |
| Trade names and trademarks | | | $ | 86,972 | | | | | | | $ | 87,429 | | | | | |
| Franchise agreements | | | 44,058 | | | | | | | 21,858 | | | | | |
| FCC licenses | | | 11,000 | | | | | | | 11,000 | | | | | |
| Licensure and accreditation | | | 150 | | | | | | | 150 | | | | | |
| | | | $ | 142,180 | | | | | | | $ | 120,437 | | | | | |
____________
| | | | | |
(1) | As of December 31, 2020, the trade names and trademarks’ maximum useful life was 10 years. |
| | | | | | | | | | | | | | | | | | | | | | | | | | | | | | | | | | | | | | | | | |
| | | | As of December 31, 2023 | | As of December 31, 2022 |
| (in thousands) | Useful
Life
Range | | Gross
Carrying
Amount | | Accumulated
Amortization | | Net
Carrying
Amount | | Gross
Carrying
Amount | | Accumulated
Amortization | | Net
Carrying
Amount |
| Amortized Intangible Assets | | | | | | | | | | | | | |
| Student and customer relationships | 2–10 years | | $ | 283,098 | | | $ | 236,776 | | | $ | 46,322 | | | $ | 297,766 | | | $ | 230,429 | | | $ | 67,337 | |
| Trade names and trademarks | 2–15 years | | 143,389 | | | 90,558 | | | 52,831 | | | 148,102 | | | 81,078 | | | 67,024 | |
| Network affiliation agreements | 10 years | | 17,400 | | | 13,348 | | | 4,052 | | | 17,400 | | | 10,367 | | | 7,033 | |
| Databases and technology | 3–6 years | | 36,538 | | | 35,712 | | | 826 | | | 36,216 | | | 32,219 | | | 3,997 | |
| | | | | | | | | | | | | |
| Other | 1–8 years | | 41,327 | | | 33,164 | | | 8,163 | | | 44,644 | | | 28,613 | | | 16,031 | |
| | | | $ | 521,752 | | | $ | 409,558 | | | $ | 112,194 | | | $ | 544,128 | | | $ | 382,706 | | | $ | 161,422 | |
| Indefinite-Lived Intangible Assets | | | | | | | | | | | | | |
| Franchise agreements | | | $ | 92,158 | | | | | | | $ | 85,858 | | | | | |
| Trade names and trademarks | | | 84,533 | | | | | | | 81,905 | | | | | |
| FCC licenses | | | 11,000 | | | | | | | 11,000 | | | | | |
| | | | | | | | | | | | | |
| Other | | | 171 | | | | | | | 171 | | | | | |
| | | | $ | 187,862 | | | | | | | $ | 178,934 | | | | | |
10. INCOME TAXES
Income before income taxes consists of the following:
| | Year Ended December 31 |
| Year Ended December 31 | | | Year Ended December 31 |
| (in thousands) | (in thousands) | 2021 | | 2020 | | 2019 | (in thousands) | 2023 | | 2022 | | 2021 |
| U.S. | U.S. | $ | 421,420 | | | $ | 403,295 | | | $ | 390,144 | |
| Non-U.S. | Non-U.S. | 28,207 | | | 3,973 | | | 36,335 | |
| $ | 449,627 | | | $ | 407,268 | | | $ | 426,479 | |
| $ | |
The provision for income taxes consists of the following:
| | (in thousands) | (in thousands) | Current | | Deferred | | Total | (in thousands) | Current | | Deferred | | Total |
| Year Ended December 31, 2023 | | Year Ended December 31, 2023 | | | |
| U.S. Federal | |
| State and Local | |
| Non-U.S. | |
| $ | |
| Year Ended December 31, 2022 | | Year Ended December 31, 2022 | | | | | |
| U.S. Federal | |
| State and Local | |
| Non-U.S. | |
| $ | |
| Year Ended December 31, 2021 | Year Ended December 31, 2021 | | | | | | Year Ended December 31, 2021 | | | | | |
| U.S. Federal | U.S. Federal | $ | 20,806 | | | $ | 64,356 | | | $ | 85,162 | |
| State and Local | State and Local | 4,354 | | | (435) | | | 3,919 | |
| Non-U.S. | Non-U.S. | 6,094 | | | 1,125 | | | 7,219 | |
| $ | 31,254 | | | $ | 65,046 | | | $ | 96,300 | |
| Year Ended December 31, 2020 | | | | |
| U.S. Federal | $ | 77,882 | | | $ | 6,669 | | | $ | 84,551 | |
| State and Local | 8,083 | | | 4,954 | | | 13,037 | |
| Non-U.S. | 6,958 | | | 2,754 | | | 9,712 | |
| $ | 92,923 | | | $ | 14,377 | | | $ | 107,300 | |
| Year Ended December 31, 2019 | | | | |
| U.S. Federal | $ | 16,500 | | | $ | 63,838 | | | $ | 80,338 | |
| State and Local | 2,949 | | | 6,630 | | | 9,579 | |
| Non-U.S. | 9,400 | | | (717) | | | 8,683 | |
| $ | 28,849 | | | $ | 69,751 | | | $ | 98,600 | |
| $ | |
The provision for income taxes differs from the amount of income tax determined by applying the U.S. Federal statutory rate of 21% to the income before taxes as a result of the following:
| | Year Ended December 31 |
| Year Ended December 31 | | | Year Ended December 31 |
| (in thousands) | (in thousands) | 2021 | | 2020 | | 2019 | (in thousands) | 2023 | | 2022 | | 2021 |
| U.S. Federal taxes at statutory rate (see above) | U.S. Federal taxes at statutory rate (see above) | $ | 94,422 | | | $ | 85,526 | | | $ | 89,561 | |
| State and local taxes, net of U.S. Federal tax | State and local taxes, net of U.S. Federal tax | 2,238 | | | 15,366 | | | (4,064) | |
| Valuation allowances against state tax benefits, net of U.S. Federal tax | Valuation allowances against state tax benefits, net of U.S. Federal tax | 859 | | | (5,067) | | | 11,632 | |
| Stock-based compensation | (24) | | | 2,048 | | | (1,743) | |
| Valuation allowances against other non-U.S. income tax benefits | Valuation allowances against other non-U.S. income tax benefits | 4,042 | | | 2,445 | | | 1,202 | |
| Goodwill impairments | |
| Other, net | Other, net | (5,237) | | | 6,982 | | | 2,012 | |
| Provision for Income Taxes | Provision for Income Taxes | $ | 96,300 | | | $ | 107,300 | | | $ | 98,600 | |
The Company’s effective tax rate for 2021 was favorably impacted by a $17.2 million deferred tax adjustment arising from a change in the estimated deferred state income tax rate attributable to the apportionment formula used in the calculation of deferred taxes related to the Company’s pension and other postretirement plans. This benefit is included in the overall state tax provision for 2021 of $2.2 million reflected above.
Deferred income taxes consist of the following:
| | As of December 31 |
| As of December 31 | | | As of December 31 |
| (in thousands) | (in thousands) | 2021 | | 2020 | (in thousands) | 2023 | | 2022 |
| Employee benefit obligations | Employee benefit obligations | $ | 64,258 | | | $ | 72,787 | |
| Accounts receivable | Accounts receivable | 3,554 | | | 3,795 | |
| State income tax loss carryforwards | State income tax loss carryforwards | 63,050 | | | 53,499 | |
| State capital loss carryforwards | State capital loss carryforwards | 107 | | | 289 | |
| State income tax credit carryforwards | State income tax credit carryforwards | 511 | | | 281 | |
| U.S. Federal income tax loss carryforwards | U.S. Federal income tax loss carryforwards | 69,509 | | | 18,272 | |
| U.S. Federal foreign income tax credit carryforwards | U.S. Federal foreign income tax credit carryforwards | 970 | | | 992 | |
| Non-U.S. income tax loss carryforwards | Non-U.S. income tax loss carryforwards | 18,877 | | | 15,802 | |
| Non-U.S. capital loss carryforwards | Non-U.S. capital loss carryforwards | 3,707 | | | 3,925 | |
| Leases | Leases | 63,715 | | | 74,240 | |
| Other | Other | 6,396 | | | 6,214 | |
| Deferred Tax Assets | Deferred Tax Assets | 294,654 | | | 250,096 | |
| Valuation allowances | Valuation allowances | (57,603) | | | (47,217) | |
| Deferred Tax Assets, Net | Deferred Tax Assets, Net | 237,051 | | | 202,879 | |
| Prepaid pension cost | Prepaid pension cost | 594,372 | | | 457,644 | |
| Unrealized gain on marketable equity securities | Unrealized gain on marketable equity securities | 138,868 | | | 88,371 | |
| Goodwill and other intangible assets | Goodwill and other intangible assets | 103,497 | | | 90,921 | |
| Property, plant and equipment | Property, plant and equipment | 15,451 | | | 15,807 | |
| Leases | Leases | 51,668 | | | 61,148 | |
| Non-U.S. withholding tax | Non-U.S. withholding tax | 2,001 | | | 1,866 | |
| Deferred Tax Liabilities | Deferred Tax Liabilities | 905,857 | | | 715,757 | |
| Deferred Income Tax Liabilities, Net | Deferred Income Tax Liabilities, Net | $ | 668,806 | | | $ | 512,878 | |
The Company has $1,026.1$1,106.9 million of state income tax net operating loss carryforwards available to offset future state taxable income.income as of December 31, 2023. During 2021, the Company recorded $115.4 million of state income tax loss carryforwards as a result of the Leaf acquisition. State income tax loss carryforwards, if unutilized, will start to expire approximately as follows:
| | (in millions) | (in millions) | | (in millions) | |
| 2022 | $ | 1.9 | |
| 2023 | 7.5 | |
| 2024 | 2024 | 7.5 | |
| 2025 | 2025 | 18.3 | |
| 2026 | 2026 | 14.5 | |
| 2027 and after | 976.4 | |
| 2027 | |
| 2028 | |
| 2029 and after | |
| Total | Total | $ | 1,026.1 | |
The Company has recorded at December 31, 2021, $63.1$64.4 million in deferred state income tax assets, net of U.S. Federal income tax, with respect to these state income tax loss carryforwards.carryforwards as of December 31, 2023. The Company has established $35.4
$45.8 million in valuation allowances against these deferred state income tax assets, since the Company has determined that it is more likely than not that some of these state income tax losses may not be fully utilized in the future to reduce state taxable income.
The Company has $331.0$278.2 million of U.S. Federal income tax loss carryforwards obtained as a result of prior stock acquisitions.acquisitions as of December 31, 2023. During 2021, the Company recorded $262.5 million of U.S. Federal income tax loss carryforwards as a result of the Leaf acquisition. U.S. Federal income tax loss carryforwards are expected to be fully utilized as follows:
| | (in millions) | (in millions) | | (in millions) | |
| 2022 | $ | 27.9 | |
| 2023 | 27.4 | |
| 2024 | 2024 | 27.4 | |
| 2025 | 2025 | 24.4 | |
| 2026 | 2026 | 13.6 | |
| 2027 and after | 210.3 | |
| 2027 | |
| 2028 | |
| 2029 and after | |
| Total | Total | $ | 331.0 | |
The Company has established at December 31, 2021, $69.5$58.4 million in U.S. Federal deferred tax assets with respect to these U.S. Federal income tax loss carryforwards.carryforwards as of December 31, 2023.
For U.S. Federal income tax purposes, the Company has established U.S. Federal deferred tax assets with respect to $1.0$1.1 million of foreign tax credits available to be credited against future U.S. Federal income tax liabilities that will start to expire in 20232024 if unutilized. The Company has recorded a full$1.1 million in valuation allowanceallowances against these deferred tax assets since the Company determined that it is more likely than not that these foreign tax credit carryforwards may not be utilized in the future to reduce U.S. Federal income taxes.
The Company has $87.1$112.7 million of non-U.S. income tax loss carryforwards as a result of operating losses and carryforwards that were obtained in part through prior stock acquisitions that are available to offset future non-U.S. taxable income and has recorded, with respect to these losses, $18.9$23.9 million in non-U.S. deferred income tax assets. The Company has established $14.9$12.3 million in valuation allowances against the deferred tax assets for the portion of non-U.S. tax losses that may not be utilized to reduce future non-U.S. taxable income. The $87.1$112.7 million of non-U.S. income tax loss carryforwards consist of $44.2$63.4 million in losses that may be carried forward indefinitely; $12.2$45.1 million of losses that, if unutilized, will expire in varying amounts through 2026;2028; and $30.7$4.2 million of losses that, if unutilized, will start to expire after 2026.2028.
The Company has $12.4$10.2 million of non-U.S. capital loss carryforwards that may be carried forward indefinitely and are available to offset future non-U.S. capital gains. The Company recorded a $3.7$3.1 million non-U.S. deferred income tax asset for these non-U.S. capital loss carryforwards and has established a full valuation allowance against this non-U.S. deferred tax asset since the Company has determined that it is more likely than not that the capital loss carryforwards may not be utilized to reduce taxable income in the future.
Deferred tax valuation allowances and changes in deferred tax valuation allowances were as follows:
| | | | | | | | | | | | | | | | | | | | | | | |
| (in thousands) | Balance at Beginning of Period | | Tax Expense and Revaluation | | Deductions | | Balance at End of
Period |
| Year ended | | | | | | | |
| December 31, 2021 | $ | 47,217 | | | $ | 13,915 | | | $ | (3,529) | | | $ | 57,603 | |
| December 31, 2020 | 46,243 | | | 7,303 | | | (6,329) | | | 47,217 | |
| December 31, 2019 | 33,120 | | | 14,512 | | | (1,389) | | | 46,243 | |
| | | | | | | | | | | | | | | | | | | | | | | |
| (in thousands) | Balance at Beginning of Period | | Tax Expense and Revaluation | | Deductions | | Balance at End of
Period |
| Year Ended | | | | | | | |
| December 31, 2023 | $ | 62,816 | | | $ | 9,786 | | | $ | (6,304) | | | $ | 66,298 | |
| December 31, 2022 | 57,603 | | | 7,460 | | | (2,247) | | | 62,816 | |
| December 31, 2021 | 47,217 | | | 13,915 | | | (3,529) | | | 57,603 | |
The Company has established $37.5$49.6 million in valuation allowances against deferred state tax assets recognized, net of U.S. Federal tax. As stated above, approximately $35.4$45.8 million of the valuation allowances, net of U.S. Federal income tax, relate to state income tax loss carryforwards. In most instances, the Company has established valuation allowances against deferred state income tax assets without considering potentially offsetting deferred tax liabilities established with respect to prepaid pension cost and goodwill. Prepaid pension cost and goodwill have not been considered a source of future taxable income for realizing those deferred state tax assets recognized sincebecause these temporary differences are not likely to reverse in the foreseeable future. However, certain deferred state tax assets have an indefinite life. As a result, the Company has considered deferred tax liabilities for prepaid pension cost and goodwill as a source of future taxable income for realizing those deferred state tax assets with indefinite lives. The valuation allowances established against deferred state income tax assets may increase or decrease within the next 12 months, based on operating results or the market value of investment holdings. In 2021, theThe Company released $1.8 million in valuation allowances against deferred state income tax assets at the healthcare division as the healthcare division generated positive operating results that support the realization of these deferredwill
tax assets, net of the federal benefit. The Company will monitor future results on a quarterly basis to determine whether the valuation allowances provided against deferred state tax assets should be increased or decreased as future circumstances warrant.
The Company has established $19.1$15.5 million in valuation allowances against non-U.S. deferred tax assets, and, as stated above, $14.9$12.3 million of the non-U.S. valuation allowances relate to non-U.S. income tax loss carryforwards and $3.7$3.1 million relate to non-U.S. capital loss carryforwards. Valuation allowances established against non-U.S. deferred tax assets are recorded at the education division and other businesses. These non-U.S. valuation allowances may increase or decrease within the next 12 months, based on operating results. As a result, the Company is unable to estimate the potential tax impact, given the uncertain operating environment. The Company will monitor future education division and other businesses’ operating results and projected future operating results on a quarterly basis to determine whether the valuation allowances provided against non-U.S. deferred tax assets should be increased or decreased as future circumstances warrant.
The Company estimates that unremitted non-U.S. subsidiary earnings, when distributed, will not be subject to tax except to the extent non-U.S. withholding taxes are imposed. Approximately $2.0 million of deferred tax liabilities remain recorded on the books at December 31, 20212023, with respect to future non-U.S. withholding taxes the Company estimated may be imposed on future cash distributions.
U.S. Federal and state tax liabilities may be recorded if the investment in non-U.S. subsidiaries becomebecomes held for sale instead of being held indefinitely, but the calculation of the tax due is not practicable.
On March 27,The 2020 the Coronavirus Aid, Relief, and Economic Security (CARES) Act was enacted, which included several technical corrections to the Tax Cuts and Jobs Act and provisions allowing certain net operating losses generated by businesses in 2018, 2019, and 2020 to be carried back five years. Overall, the CARES Act had limited impact on the Company’s tax provision for the year ended December 31, 2021.
On July 1, 2015 (the Distribution Date), the Company completed the spin-off of Cable ONE as an independent, publicly traded company. The transaction was structured as a tax-free spin-off of Cable ONE to the stockholders of the Company. Since July 1, 2015, Cable ONE has been an independent public company trading on the New York Stock Exchange under the symbol “CABO”. In connection with the CARES Act, Cable ONE has the ability to carryback its 2019 taxable losses to the tax period from January 1, 2015 to June 30, 2015, the period in which Cable ONE was included in the Company’s 2015 tax return. As a result, the Company amended its 2015 tax returns in order to accommodate Cable ONE’s request to carryback its 2019 taxable losses. The Company expects that this action will have no impact on the results or the financial position of the Company. To reflect the expected refund due to Cable ONE, the Company has included a $15.9 million current income tax receivable and a corresponding liability to Cable ONE on its balance sheet as of December 31, 2021.
The 2018 U.S. Federal tax return and subsequent years remain open to IRS examination. The Company files income tax returns with the U.S. Federal government and in various state, local and non-U.S. governmental jurisdictions, with the consolidated U.S. Federal tax return filing considered the only major tax jurisdiction.
The Company endeavors to comply with tax laws and regulations where it does business, but cannot guarantee that, if challenged, the Company’s interpretation of all relevant tax laws and regulations will prevail and that all tax benefits recorded in the financial statements will ultimately be recognized in full.
The following summarizes the Company’s unrecognized tax benefits, excluding interest and penalties, for the respective periods:
| | Year Ended December 31 |
| Year Ended December 31 | | | Year Ended December 31 |
| (in thousands) | (in thousands) | 2021 | | 2020 | | 2019 | (in thousands) | 2023 | | 2022 | | 2021 |
| Beginning unrecognized tax benefits | Beginning unrecognized tax benefits | $ | 1,898 | | | $ | 1,572 | | | $ | 2,483 | |
| Increases related to current year tax positions | Increases related to current year tax positions | 1,061 | | | 742 | | | — | |
| Increases related to prior year tax positions | Increases related to prior year tax positions | 45 | | | 656 | | | 1,072 | |
| Decreases related to prior year tax positions | Decreases related to prior year tax positions | — | | | — | | | — | |
| Decreases related to settlement with tax authorities | Decreases related to settlement with tax authorities | — | | | (1,072) | | | (1,291) | |
| Decreases due to lapse of applicable statutes of limitations | Decreases due to lapse of applicable statutes of limitations | — | | | — | | | (692) | |
| Ending unrecognized tax benefits | Ending unrecognized tax benefits | $ | 3,004 | | | $ | 1,898 | | | $ | 1,572 | |
The unrecognized tax benefits relate to federal and state research and development tax credits applicable to the 20192020 to 20212023 tax periods, as well as state income tax filing positions applicable to the 2012 to 20142018 and 2020 tax periods. In making these determinations, the Company presumes that taxing authorities pursuing examinations of the Company’s compliance with tax law filing requirements will have full knowledge of all relevant information, and, if necessary, the Company will pursue resolution of disputed tax positions by appeals or litigation. Although the Company cannot predict the timing of resolution with tax authorities, the Company estimates that some of the
unrecognized tax benefits may change in the next 12 months due to settlement with the tax authorities. The Company expects that a $1.8$1.3 million federal tax benefit and a $1.3$2.0 million state tax benefit, net of $0.3$0.4 million federal tax expense, will reduce the effective tax rate in the future if the unrecognized tax benefits are recognized.
The Company classifies interest and penalties related to uncertain tax positions as a component of interest and other expenses, respectively. As of December 31, 2021,2023, the Company has not accrued $0.4 million of interest related to the unrecognized tax benefits. The Company has not accrued any penalties related to the unrecognized tax benefits.
In December 2021, the Organization for Economic Co-operation and Development (OECD) issued a set of rules known as “Pillar Two” with the intent to ensure that global companies pay a minimum corporate income tax of 15% in jurisdictions in which the global companies operate. Many non-U.S. countries (including the U.K. and European Union member countries) enacted legislation to adopt certain aspects of Pillar Two effective January 1, 2024, and additional elements are expected to be adopted in future years. While the U.S. has not adopted Pillar Two, rules implemented by participating countries will apply to the Company’s worldwide operations in 2024. The Company does not have material operations in jurisdictions with tax rates lower than 15% and does not expect Pillar Two to
have a material impact on the Company’s consolidated financial statements. The Company will continue to assess the relevant tax legislation and guidance to determine its impact.
11. DEBT
The Company’s borrowings consist of the following:
| | As of December 31 |
| | | | | | | As of December 31 | | | | | | | | | As of December 31 |
| (in thousands) | (in thousands) | Maturities | | Stated Interest Rate | | Effective Interest Rate | | 2021 | | 2020 | (in thousands) | Maturities | | Stated Interest Rate | | Effective Interest Rate | | 2023 | | 2022 |
Unsecured notes (1) | Unsecured notes (1) | 2026 | | 5.75% | | 5.75% | | $ | 396,830 | | | $ | 396,112 | |
| Revolving credit facility | Revolving credit facility | 2023 | | 1.52% - 3.75% | | 1.63% | | 209,643 | | | 74,686 | |
| | Truist Bank commercial note | 2029 | | 2.08% - 2.14% | | 2.12% | | — | | | 25,250 | |
Term loan (2) | |
Real estate term loan (3) | |
Capital term loan (4) | |
Truist Bank commercial note (2)(5) | Truist Bank commercial note (2)(5) | 2031 | | 1.84% - 1.85% | | 1.87% | | 24,504 | | | — | |
| Truist Bank commercial note | Truist Bank commercial note | 2032 | | 2.10% | | 2.10% | | 22,500 | | | — | |
| Pinnacle Bank term loan | 2024 | | 4.15% | | 4.18% | | 9,558 | | | 10,692 | |
| Pinnacle Bank line of credit | 2022 | | 3.25% | | 3.56% | | — | | | 2,295 | |
Truist Bank commercial note (6) | |
| | Other indebtedness | |
| | Other indebtedness | |
| | Other indebtedness | Other indebtedness | 2023 - 2030 | | 0.00% - 16.00% | | 4,466 | | | 3,520 | |
| Total Debt | Total Debt | | 667,501 | | | 512,555 | |
| Less: current portion | Less: current portion | | (141,749) | | | (6,452) | |
| Total Long-Term Debt | Total Long-Term Debt | | $ | 525,752 | | | $ | 506,103 | |
(1) The carrying value is net of $3.2$1.7 million and $3.9$2.5 million of unamortized debt issuance costs as of December 31, 20212023 and 2020,2022, respectively.
(2) The carrying value is net of $0.6 million of unamortized debt issuance costs as of December 31, 2023.
(3) The carrying value is net of $0.1 million of unamortized debt issuance costs as of December 31, 2023.
(4) The carrying value is net of $0.8 million of unamortized debt issuance costs as of December 31, 2023.
(5) The carrying value is net of $0.1 million of unamortized debt issuance costs as of December 31, 20212022.
(6) The carrying value is net of $0.1 million of unamortized debt issuance costs as of December 31, 2022.
The Company’s $400 million senior unsecured fixed-rate notes (the Notes), due June 1, 2026, are guaranteed, jointly and severally, on a senior unsecured basis, by certain of the Company’s existing and future domestic subsidiaries, as described in the terms of the indenture. The Notes have a coupon rate of 5.75% per annum, payable semi-annually on June 1 and December 1. The Company may redeem the Notes in whole or in part at any time at the respective redemption prices described in the indenture. At December 31, 20212023 and 2020,2022, the fair value of the Notes, based on quoted market prices (Level 2 fair value assessment), totaled $417.5$400.4 million and $421.7$395.1 million, respectively.
InOn May 2018,3, 2022, the Company entered into an amended $300 million unsecured five-yearthe revolving credit facility (the Revolving Credit Facility) that is guaranteed, jointly and severally, by certainto, among other things, (i) extend the maturity of the Company’s existing and future domestic subsidiaries. The Revolving Credit Facility matures onfacility to May 30, 2023; bears interest at the Company’s option, either at (a) a fluctuating2027, (ii) eliminate borrowings under separate U.S. dollar and multicurrency tranches, (iii) update certain interest rate equal to the highest of Wells Fargo’s prime rate, 0.5 percent above the Federal funds rate or the one-month Eurodollar rate plus 1%, or (b) the Eurodollar ratebenchmarks including replacing USD London Interbank Offered Rate (LIBOR) with SOFR for borrowings denominated in U.S. dollars, (iv) incorporate a sub-facility for the applicable currencyissuance of letters of credit, and interest period as defined in the agreement, which is generally a periodic rate equal to LIBOR, CDOR, BBSY or SOR plus an(v) allow for applicable margin that depends on the Company’s consolidated debtfor borrowings to consolidatedbe determined and adjusted EBITDA; and has a commitment feequarterly based on the Company’s leverage ratio, of between 0.15% and 0.25% on the undrawn portion. On November 23, 2021, the Company amended the Revolving Credit Facility to, among other things, update the benchmark interest rates for borrowings denominated in (i) U.S. dollars under its U.S. dollar tranche to be based on SOFR on or before the USD LIBOR transition date and (ii) British Pound (GBP) and Singapore dollars under its multicurrency tranche to be based on Sterling Overnight Index Average (SONIA) and Singapore Overnight Rate Average (SORA), respectively. The Company is required to maintain a Total Net Leverage Ratio of not greater than 3.5 to 1.0 and a consolidated interest coverage ratio of at least 3.5 to 1.0 based upon the ratio of consolidated adjusted EBITDA to consolidated interest expense as determined pursuant to the credit agreement.Ratio. The outstanding balance on the Company’s $300 million unsecured revolving credit facility was $209.6$97.9 million as of December 31, 2021,2023, consisting of U.S. dollar borrowings of $137$34 million under its U.S. dollar tranche with interest payable at either 1 month USD LIBORSOFR plus 1.50%1.375% or prime rate plus 0.5%0.375%, as applicable, and £54British Pound (GBP) borrowings of £50 million under its multicurrency tranche with interest payable at SONIADaily Sterling Overnight Index Average (SONIA) plus 1.50%1.375%.
On DecemberJuly 28, 2021,2023, the Company’s automotive subsidiaryCompany entered into a commercial note$150 million term loan with Truisteach of the lenders party thereto, Wells Fargo Bank, in an aggregate amountN.A., JPMorgan Chase Bank N.A., Bank of $22.5 million.America, N.A., HSBC Bank USA, N.A., and PNC Bank, N.A. The commercial noteterm loan is payable over a 10-year period in monthlyquarterly installments of $0.2$1.875 million plus accrued and unpaid interest, due on the first day of each month,which started in December 2023 with a final payment of the outstanding principal balance on January 1, 2032. The commercial note bears interest at variable
rates based on SOFR plus 2.05% per annum. The commercial note contains terms and conditions, including remedies in the event of a default by the automotive subsidiary.
On October 21, 2021, the Company’s automotive subsidiary entered into a commercial note with Truist Bank in an aggregate principal amount of $24.75 million. The commercial note is payable over a 10-year period in monthly installments of $0.1 million, plus accrued and unpaid interest, due on the first day of each month, with a final payment of the outstanding principal balance on October 1, 2031.May 30, 2027. The commercial noteterm loan bears interest at variable rates based on SOFR plus 1.8%1.75% per annum. The commercial note containsCompany may redeem the term loan in whole or in part with no penalty at any time. The existing financial covenants of the credit agreement governing the revolving credit facility are unchanged following the addition of the term loan.
On September 26, 2023, the Company’s automotive subsidiary entered into a credit agreement with Truist Bank, which includes (i) a $75.2 million real estate term loan, (ii) a $65.0 million capital term loan, (iii) a $50.0 million delayed draw term loan, and (iv) establishment of a revolving floor plan credit facility (see Note 5). The real estate term loan is payable in monthly installments of $0.3 million and bears interest at variable rates based on SOFR plus 1.75% per annum, and the capital term loan is payable in monthly installments of $0.5 million and bears interest at variable rates based on SOFR plus 2.00% per annum. The monthly installment payments on the real estate and capital term loans commenced on November 1, 2023, with final payments of the outstanding principal balances due
on September 26, 2028. Subject to terms and conditions including remediesset forth in the event of a default bycredit agreement, the automotive subsidiary. subsidiary may also request borrowings of delayed draw term loans for which the proceeds may be used to (i) finance the acquisition of automobile dealerships (delayed draw capital loan) and (ii) finance the acquisition of real estate (delayed draw real estate loan). The delayed draw term loan bears interest at variable rates based on SOFR plus an applicable margin based on the type of delayed draw term loan requested. The delayed draw term loan availability period terminates on September 26, 2025. The automotive subsidiary useddid not borrow against the net proceeds from this commercial note to repay the outstanding balance on the cdelayed draw term loan as of December 31, 2023.
ommercial note due in 2029. On the same date, the Company’s automotive subsidiary rolled its existingentered into three interest rate swap into a new interest rate swap agreementagreements with a total notional value of $24.75$75.2 million and a maturity date of October 1, 2031.September 26, 2028. The new interest rate swap agreementagreements will pay the automotive subsidiary variable interest on the $24.75$75.2 million notional amount basedbased on SOFR plus 1.8% per annum and the automotive subsidiary will pay the counterparty a fixed rate of 4.118%4.67% per annum. The newnew interest rate swap agreement wasagreements were entered into to convert the variable rate borrowing under this commercial notethe real estate term loan into a fixed rate borrowing. Based on the terms of the new interest rate swap agreementagreements and the underlying borrowing,borrowings, the new interest rate swap wasswaps were determined to be effective and thus qualifiesqualify as a cash flow hedgehedges. .Including a 1.75% applicable margin, the overall interest rate that the Company will pay on the $75.2 million real estate term loan is fixed at 6.42% per annum.
On January 26, 2021,The automotive subsidiary used the GHG subsidiary amended its loan facility with Pinnacle Banknet proceeds from the real estate and capital term loans to decreaserepay the principaloutstanding balances of the term loan to $10.6 million, bearing interest at 4.15% per annum,commercial notes maturing in 2031 and increase the two-year line of credit expiring on December 2, 2022 to $6.0 million, bearing interest at the greater of (a) 3.25% and (b) the sum of one-month LIBOR as in effect on the first business day of each month plus an applicable2032. The interest rate swap agreements maturing in 2031 and 2032 were also terminated resulting in realized gains of 2.75%.$4.6 million that reduced interest expense during the third quarter of 2023.
The fair value of the Company’s other debt, which is based on Level 2 inputs, approximates its carrying value as of December 31, 20212023 and 2020.2022. The Company is in compliance with all financial covenants of the Revolving Credit Facility, commercial notes,revolving credit facility and Pinnacle Bank term loan and line of creditloans as of December 31, 2021.2023.
During 20212023 and 2020,2022, the Company had average borrowings outstanding of approximately $545.2$745.0 million and $512.4$689.9 million, respectively, at average annual interest rates of approximately 4.8%6.1% and 5.1%4.8%, respectively. The Company incurred net interest expense of $56.2 million, $51.2 million and $30.5 million $34.4 millionduring 2023, 2022 and $23.6 million during 2021, 2020 and 2019, respectively.
For the years ended December 31, 20212023, 2022 and 2020,2021, the Company recorded interest expense of $4.1$10.1 million, $16.5 million and $8.5$4.1 million, respectively, to adjust the fair value of the mandatorily redeemable noncontrolling interest. For the year ended December 31, 2019, the Company recorded interest income of $0.1 million to adjust the fair value of the mandatorily redeemable noncontrolling interest. Fair value adjustments are presented within interest expense and interest income in the Company’s Consolidated Statements of Operations and are reclassified to present the net change in fair value for each reporting period. The fair value of the mandatorily redeemable noncontrolling interest was based on the fair value of the underlying subsidiaries owned by GHC One and GHC Two, after taking into account any debt and other noncontrolling interests of its subsidiary investments. The fair value of the owned subsidiaries is determined by reference to either a discounted cash flow or EBITDA multiple, which approximates fair value (Level 3 fair value assessment).
12. FAIR VALUE MEASUREMENTS
The Company’s financial assets and liabilities measured at fair value on a recurring basis were as follows:
| | As of December 31, 2021 |
| As of December 31, 2023 | | | As of December 31, 2023 |
| (in thousands) | (in thousands) | Level 1 | | Level 2 | | Level 3 | | Total | (in thousands) | Level 1 | | Level 2 | | Level 3 | | Total |
| Assets | Assets | | | | | | Assets | | | | | | | |
| Marketable equity securities (1) | $ | 809,997 | | | $ | — | | | $ | — | | | $ | 809,997 | |
Other current investments (2) | 7,230 | | | 7,218 | | | — | | | 14,448 | |
Money market investments (1) | |
Marketable equity securities (2) | |
Other current investments (3) | |
| | Total Financial Assets | Total Financial Assets | $ | 817,227 | | | $ | 7,218 | | | $ | — | | | $ | 824,445 | |
| Total Financial Assets | |
| Total Financial Assets | |
| Liabilities | Liabilities | | | | | | Liabilities | | | | | | | |
Deferred compensation plan liabilities (3) | $ | — | | | $ | 31,589 | | | $ | — | | | $ | 31,589 | |
| Contingent consideration liabilities (4) | Contingent consideration liabilities (4) | — | | | — | | | 14,881 | | | 14,881 | |
Interest rate swap (5) | — | | | 2,049 | | | — | | | 2,049 | |
Contingent consideration liabilities (4) | |
Contingent consideration liabilities (4) | |
Interest rate swaps (5) | |
Foreign exchange swap (6) | Foreign exchange swap (6) | — | | | 484 | | | — | | | 484 | |
Mandatorily redeemable noncontrolling interest (7) | Mandatorily redeemable noncontrolling interest (7) | — | | | — | | | 13,661 | | | 13,661 | |
| Total Financial Liabilities | Total Financial Liabilities | $ | — | | | $ | 34,122 | | | $ | 28,542 | | | $ | 62,664 | |
| | As of December 31, 2020 |
| As of December 31, 2022 | | | As of December 31, 2022 |
| (in thousands) | (in thousands) | Level 1 | | Level 2 | | Level 3 | | Total | (in thousands) | Level 1 | | Level 2 | | Level 3 | | Total |
| Assets | Assets | | | | | | Assets | | | | | | | |
Money market investments (8) | $ | — | | | $ | 268,841 | | | $ | — | | | $ | 268,841 | |
Marketable equity securities (1) | 573,102 | | | — | | | — | | | 573,102 | |
Other current investments (2) | 10,397 | | | 4,083 | | | — | | | 14,480 | |
| Money market investments (1) | |
Marketable equity securities (2) | |
Other current investments (3) | |
Interest rate swaps (8) | |
| Total Financial Assets | Total Financial Assets | $ | 583,499 | | | $ | 272,924 | | | $ | — | | | $ | 856,423 | |
| Liabilities | Liabilities | | | | | | Liabilities | | | | | | | |
Deferred compensation plan liabilities (3) | $ | — | | | $ | 31,178 | | | $ | — | | | $ | 31,178 | |
| Contingent consideration liabilities (4) | Contingent consideration liabilities (4) | — | | | — | | | 37,174 | | | 37,174 | |
Interest rate swap (5) | — | | | 2,342 | | | — | | | 2,342 | |
Contingent consideration liabilities (4) | |
Contingent consideration liabilities (4) | |
| Foreign exchange swap (6) | |
Foreign exchange swap (6) | |
Foreign exchange swap (6) | Foreign exchange swap (6) | — | | | 259 | | | — | | | 259 | |
Mandatorily redeemable noncontrolling interest (7) | Mandatorily redeemable noncontrolling interest (7) | — | | | — | | | 9,240 | | | 9,240 | |
| Total Financial Liabilities | Total Financial Liabilities | $ | — | | | $ | 33,779 | | | $ | 46,414 | | | $ | 80,193 | |
____________
| | | | | |
| (1) | | | | | The Company’s money market investments are included in cash and cash equivalents and the value considers the liquidity of the counterparty. |
(1)(2) | The Company’s investments in marketable equity securities are held in common shares of U.S. and Canadian corporations that are actively traded on U.S. and Canadian stock exchanges. Price quotes for these shares are readily available. |
(2)(3) | Includes U.S. Government Securities, corporate bonds, mutual funds and time deposits. These investments are valued using a market approach based on the quoted market prices of the security or inputs that include quoted market prices for similar instruments and are classified as either Level 1 or Level 2 in the fair value hierarchy. |
(3) | Includes Graham Holdings Company’s Deferred Compensation Plan and supplemental savings plan benefits under the Graham Holdings Company’s Supplemental Executive Retirement Plan, which are included in accrued compensation and related benefits. These plans measure the market value of a participant’s balance in a notional investment account that is comprised primarily of mutual funds, which are based on observable market prices. However, since the deferred compensation obligations are not exchanged in an active market, they are classified as Level 2 in the fair value hierarchy. Realized and unrealized gains (losses) on deferred compensation are included in operating income. |
| (4) | Included in Accounts payable, vehicle floor plan payable and accrued liabilities and Other Liabilities. The Company determined the fair value of the contingent consideration liabilities using either a Monte Carlo simulation, Black-Scholes model, or probability-weighted analysis depending on the type of target included in the contingent consideration requirements (revenue, EBITDA, client retention). All analyses included estimated financial projections for the acquired businesses and acquisition-specific discount rates. |
| (5) | Included in Other Liabilities. The Company utilized a market approach model using the notional amount of the interest rate swap multiplied by the observable inputs of time to maturity and market interest rates. |
| (6) | Included in Accounts payable, vehicle floor plan payable and accrued liabilities, and valued based on a valuation model that calculates the differential between the contract price and the market-based forward rate. |
| (7) | The fair value of the mandatorily redeemable noncontrolling interest is based on the fair value of the underlying subsidiaries owned by GHC One and GHC Two, after taking into account any debt and other noncontrolling interests of its subsidiary investments. The fair value of the owned subsidiaries is determined using enterprise value analyses which include an equal weighing between guideline public company and discounted cash flow analyses. |
| (8) | Included in Deferred Charges and Other Assets. The Company’s moneyCompany utilized a market investments are included in cash and cash equivalents and the value considers the liquidityapproach model using a notional amount of the counterparty.interest rate swaps multiplied by the observable inputs of time to maturity and market interest rates. |
| |
The following table provides a reconciliation of changes in the Company’s financial liabilities measured at fair value on a recurring basis, using Level 3 inputs:
| | (in thousands) | (in thousands) | Contingent consideration liabilities | | Mandatorily redeemable noncontrolling interest | (in thousands) | Contingent consideration liabilities | | Mandatorily redeemable noncontrolling interest |
| As of December 31, 2019 | $ | 13,546 | | | $ | 829 | |
| Acquisition of business | 50,609 | | | — | |
Changes in fair value (1) | (2,051) | | | 8,483 | |
| Accretion of value included in net income (1) | 2,895 | | | — | |
| Settlements or distributions | (28,061) | | | (72) | |
| Foreign currency exchange rate changes | 236 | | | — | |
| As of December 31, 2020 | 37,174 | | | 9,240 | |
| As of December 31, 2021 | |
| Acquisition of business | Acquisition of business | 1,868 | | | — | |
Changes in fair value (1) | Changes in fair value (1) | (5,482) | | | 4,077 | |
| Capital contributions | Capital contributions | — | | | 427 | |
Accretion of value included in net income (1) | Accretion of value included in net income (1) | 1,275 | | | — | |
| Settlements or distributions | Settlements or distributions | (19,942) | | | (83) | |
| Foreign currency exchange rate changes | (12) | | | — | |
| As of December 31, 2021 | $ | 14,881 | | | $ | 13,661 | |
| | As of December 31, 2022 | |
| As of December 31, 2022 | |
| As of December 31, 2022 | |
| Acquisition of business | |
Changes in fair value (1) | |
| Capital contributions | |
Accretion of value included in net income (1) | |
| Settlements or distributions | |
| | As of December 31, 2023 | |
| As of December 31, 2023 | |
| As of December 31, 2023 | |
| | | | | |
| (1) | Changes in fair value and accretion of value of contingent consideration liabilities are included in Selling, general and administrative expenses and the changes in fair value of mandatorily redeemable noncontrolling interest is included in Interest expense in the Company’s Consolidated Statements of Operations. |
For the years ended December 31, 2021, 20202023, 2022 and 2019,2021, the Company recorded goodwill and other long-lived asset impairment charges of $32.999.1 million, $30.2$129.0 million and $9.2$32.9 million, respectively (see Note 19). The remeasurement of goodwill and other long-lived assets is classified as a Level 3 fair value assessment due to the significance of unobservable inputs developed in the determination of the fair value. The Company used a discounted cash flow model to determine the estimated fair value of the reporting unit,units, indefinite-lived intangible assets, and other long-lived assets. AWhere appropriate, a market value approach was also utilized to supplement the discounted cash flow model. The Company made estimates and assumptions regarding future cash flows, royalty rates, discount rates, market values, and long-term growth rates.For the years ended December 31, 2021, 20202023, 2022 and 2019,2021, the Company recorded gains of $11.83.1 million, $4.2$6.9 million and $5.1$11.8 million, respectively, to equity securities that are accounted for as cost method investments based on observable transactions for identical or similar investments of the same issuer. For the yearyears ended December 31, 2020,2023 and 2022, the Company recorded impairment losses of $7.3$0.5 million and $1.3 million, respectively, to equity securities that are accounted for as cost method investments.
For the yearsyear ended December 31, 2021, and 2020, the Company recorded impairment charges of $6.6 million on 1one of its investments in affiliates and $3.6 million on 2 of its investments in affiliates, respectively (see Note 4).
13. REVENUE FROM CONTRACTS WITH CUSTOMERS
The Company generated 78%79%, 78%81% and 76%78% of its revenue from U.S. domestic sales in 2021, 20202023, 2022 and 2019,2021, respectively. The remaining 22%21%, 22%19%, and 24%22% of revenue was generated from non-U.S. sales.
In 2021, 20202023, 2022 and 2019,2021, the Company recognized 67%54%, 73%58%, and 73%67%, respectively, of its revenue over time as control of the services and goods transferred to the customer. The remaining 33%46%, 27%42% and 27%33%, respectively, of revenue was recognized at a point in time, when the customer obtained control of the promised goods.
The determination of the method by which the Company measures its progress towards the satisfaction of its performance obligations requires judgment and is described in the Summary of Significant Accounting Policies (Note 2).
In the second quarter of 2020, GHG received $7.4 million under the CARES Act as a general distribution from the Provider Relief Fund to provide relief for lost revenues and expenses incurred in connection with COVID-19. The healthcare revenues for the year ended December 31, 2020 includes $5.7 million for lost revenues related to COVID-19 (see Note 19).
Contract Assets. As of December 31, 2021,2023, the Company recognized a contract asset of $17.7$39.8 million related to a contract at a Kaplan International business, which is included in Deferred Charges and Other Assets. The Company expects to recognize an additional $495.9$311.6 million related to the remaining performance obligation in the contract over the next elevensix years. As of December 31, 2020,2022, the contract asset was $8.7$26.3 million.
Deferred Revenue. The Company records deferred revenue when cash payments are received or due in advance of the Company’s performance includingwhich includes some payments that are refundable due to the contractual right of the customer to cancel the agreement. As of December 31, 2023 and 2022, 20% and 18% of the Company’s
deferred revenue consisted of prepaid amounts which are refundable. The following table presents the change in the Company’s deferred revenue balance during the year ended December 31, 2021:2023:
| | As of | |
| December 31,
2021 | | December 31,
2020 | % |
| As of December 31 | |
| (in thousands) | |
| (in thousands) | |
| (in thousands) | (in thousands) | December 31,
2021 | | December 31,
2020 | Change | 2023 | | 2022 | % Change |
| Deferred revenue | Deferred revenue | | 6 | Deferred revenue | $ | 400,347 | | | $ | | $ | 345,387 | | 16 | 16 |
In April 2020, GHG received $31.5 million under the expanded Medicare Accelerated and Advanced Payment Program modified by the CARES Act as a result of COVID-19. The Department of Health and Human Services began to recoup this advance 365 days after the payment was issued and forissued. The advance had been recouped in full as of December 31, 2022. For the yearyears ended December 31, 2022 and 2021, GHG recognized $12.6 million and $18.9 million of the balance was recognized asin revenue for claims submitted for eligible services. The remaining amount is included in the current deferred revenue balance on the Consolidated Balance Sheet as of December 31, 2021. As of December 31, 2020, the $31.5 million balance was included in the current and noncurrent deferred revenue balances on the Consolidated Balance Sheet.services, respectively.
The majority of the change in the deferred revenue balance is due to increased enrollment in the Kaplan International division as a result of recovery from COVID-19 and current year acquisitions, offset by the advanced Medicare payment.division. During the year ended December 31, 2021,2023, the Company recognized $278.6$302.2 millionfrom the Company’s deferred revenue balance as of December 31, 2020.2022, including $54.3 million of prepaid amounts which were refundable at the prior year-end.
Revenue allocated to remaining performance obligations represents deferred revenue amounts that will be recognized as revenue in future periods. As of December 31, 2021,2023, the deferred revenue balance related to certain medical and nursing qualifications with an original contract length greater than twelve months at Kaplan Supplemental Education was $8.8 million.$7.1 million. Kaplan Supplemental Education expects to recognize 72%73% of this revenue over the next twelve months and the remainder thereafter.
Costs to Obtain a Contract. The following table presents changes in the Company’s costs to obtain a contract asset:
| | (in thousands) | (in thousands) | Balance at
Beginning
of Year | | Costs Associated with New Contracts | | Less: Costs Amortized During the Year | | Other | | Balance
at
End of
Year | (in thousands) | Balance at
Beginning
of Year | | Costs Associated with New Contracts | | Less: Costs Amortized During the Year | | Other | | Balance
at
End of
Year |
| 2023 | |
| 2022 | |
| 2021 | 2021 | $ | 24,363 | | | $ | 61,214 | | | $ | (59,116) | | | $ | (380) | | | $ | 26,081 | |
| 2020 | 31,020 | | | 51,891 | | | (58,855) | | | 307 | | | 24,363 | |
| 2019 | 21,311 | | | 66,607 | | | (57,741) | | | 843 | | | 31,020 | |
|
The majority of other activity was related to currency translation adjustments in 2021, 2020,2023, 2022, and 2019.2021.
14. CAPITAL STOCK, STOCK AWARDS AND STOCK OPTIONS
Capital Stock. Each share of Class A common stock and Class B common stock participates equally in dividends. The Class B stock has limited voting rights and as a class has the right to elect 30% of the Board of Directors; the Class A stock has unlimited voting rights, including the right to elect a majority of the Board of Directors.
During 2021, 2020,2023, 2022, and 20192021 the Company purchased a total of 93,969, 406,112,325,134, 121,761, and 3,39293,969 shares, respectively, of its Class B common stock at a cost of approximately $195.0 million, $71.4 million, and $55.7 million, $161.8 million,respectively, including commissions and $2.1 million, respectively.excise taxes. On September 10, 2020,May 4, 2023, the Board of Directors authorized the Company to purchase up to 500,000 shares of its Class B Common Stock. This authorization includes shares that remained under the previous authorization. The Company did not announce a ceiling price or time limit for the purchases. At December 31, 2021,2023, the Company had remaining authorization from the Board of Directors to purchase up to 270,182236,403 shares of Class B common stock.
Stock Awards. In 2012, the Company adopted an incentive compensation plan (the 2012 Plan), which, among other provisions, authorizes the awarding of Class B common stock to key employees in the form of stock awards, stock options and other awards involving the actual transferissuance of shares. All stock awards, stock options and other awards involving the actual transfer of shares issued subsequent to the adoption of this plan are covered under this incentive compensation plan. Stock awards made under the 2012 Plan are primarily subject to the general restriction that stock awarded to a participant will be forfeited and revert to Company ownership if the participant’s employment terminates before the end of a specified period of service to the Company. At December 31, 2023, there were 191,474 shares reserved for issuance under the 2012 Plan, which were all subject to stock awards and stock options outstanding.
In 2022, the Company adopted a new incentive compensation plan (the 2022 Plan), which, among other provisions, authorizes the awarding of Class B common stock to key employees and non-employee Directors in the form of stock awards, stock options and other awards involving the issuance of shares. All stock awards, stock options and other awards involving the issuance of shares issued subsequent to the adoption of this plan are covered under this new incentive compensation plan. Stock awards made under the 2022 Plan are primarily subject to the general restriction that stock awarded to a participant will be forfeited and revert to Company ownership if the participant’s employment terminates before the end of a specified period of service to the Company. The number of Class B
common shares authorized for issuance under the 20122022 Plan is 772,588500,000 shares. At December 31, 2021,2023, there were 545,000498,924 shares reserved for issuance under the 2012 incentive compensation plan.2022 Plan. Of this number, 214,76014,220 shares were subject to stock awards and stock options outstanding, and 330,240484,704 shares were available for future awards.
Activity related to stock awards under the 2012these incentive compensation planplans for the year ended December 31, 20212023 was as follows:
| | | | Number of Shares | | Average Grant-Date Fair Value | | Number of Shares | | Average Grant-Date Fair Value |
| Beginning of year, unvested | Beginning of year, unvested | 27,240 | | | $ | 584.24 | |
| Awarded | Awarded | 20,258 | | | 539.36 | |
| Vested | Vested | (12,871) | | | 522.17 | |
| Forfeited | Forfeited | (3,056) | | | 598.44 | |
| End of Year, unvested | End of Year, unvested | 31,571 | | | 579.37 | |
For the share awards outstanding at December 31, 2021,2023, the aforementioned restriction is expected to lapse in 2023 for 12,820 shares, 2025 for 16,75113,429 shares and 2027 for 2,00016,220 shares. Also, early in 2024, the Company issued stock awards of 1,006 shares. Stock-based compensation costs resulting from Company stock awards were $3.9 million, $4.1$3.4 million and $4.2$3.9 million in 2021, 20202023, 2022 and 2019,2021, respectively.
As of December 31, 2021,2023, there was $9.8$8.9 million of total unrecognized compensation expense related to these awards. That cost is expected to be recognized on a straight-line basis over a weighted average period of 2.32.1 years.
Stock Options. Stock options granted under the 2012 Planincentive compensation plans cannot be less than the fair value on the grant date, generally vest over six years and have a maximum term of ten years.
Activity related to options outstanding for the year ended December 31, 20212023 was as follows:
| | | | Number of Shares | | Average Option Price | | Number of Shares | | Average Option Price |
| Beginning of year | Beginning of year | 183,189 | | | $ | 612.16 | |
| Granted | Granted | — | | | — | |
| Exercised | Exercised | — | | | — | |
| Expired or forfeited | Expired or forfeited | — | | | — | |
| End of Year | End of Year | 183,189 | | | 612.16 | |
|
Of the shares covered by options outstanding at the end of 2021, 118,1392023, 136,415 are now exercisable; 13,209 are expected to become exercisable in 2022; 13,211 are expected to become exercisable in 2023; 12,876 are expected to become exercisable in 2024; 12,877 are expected to become exercisable in 2025; and 12,877 are expected to become exercisable in 2026. For 2021, 20202023, 2022 and 2019,2021, the Company recorded expense of $1.7$1.2 million, $2.2$1.2 million and $2.0$1.7 million, respectively, related to stock options. Information related to stock options outstanding and exercisable at December 31, 2021,2023, is as follows:
| | | | | Options Outstanding | | Options Exercisable | | | Options Outstanding | | Options Exercisable |
| Range of Exercise Prices | Range of Exercise Prices | | Shares Outstanding at 12/31/2021 | | Weighted
Average
Remaining
Contractual
Life (years) | | Weighted
Average
Exercise
Price | | Shares Exercisable at 12/31/2021 | | Weighted
Average
Remaining
Contractual
Life (years) | | Weighted
Average
Exercise
Price | Range of Exercise Prices | | Shares Outstanding at 12/31/2023 | | Weighted
Average
Remaining
Contractual
Life (years) | | Weighted
Average
Exercise
Price | | Shares Exercisable at 12/31/2023 | | Weighted
Average
Remaining
Contractual
Life (years) | | Weighted
Average
Exercise
Price |
| $244 | | 1,931 | | | 0.9 | | $ | 243.85 | | | 1,931 | | | 0.9 | | $ | 243.85 | |
| 427 | | 77,258 | | | 8.7 | | 426.86 | | | 12,876 | | | 8.7 | | 426.86 | |
| | $427 | |
| $427 | |
| $427 | |
| | 719 | |
| | 719 | |
| | 719 | 719 | | 77,258 | | | 2.8 | | 719.15 | | | 77,258 | | | 2.8 | | 719.15 | |
| 805–872 | 805–872 | | 26,742 | | | 4.0 | | 865.02 | | | 26,074 | | | 3.9 | | 865.51 | |
| | | | | 183,189 | | | 5.5 | | 612.16 | | | 118,139 | | | 3.7 | | 711.83 | |
| | |
| | |
At December 31, 2021,2023, the intrinsic value for all options outstanding, exercisable and unvested was $16.4$19.2 million, $3.4$8.7 million and $13.1$10.4 million, respectively. The intrinsic value of a stock option is the amount by which the market value of the underlying stock exceeds the exercise price of the option. The market value of the Company’s stock was $629.83$696.52 at December 31, 2021.2023. At December 31, 2021,2023, there were 65,05038,630 unvested options related to this plan with an average exercise price of $431.16$426.86 and a weighted average remaining contractual term of 8.76.7 years. At December 31, 2020,2022, there were 82,38551,841 unvested options with an average exercise price of $453.97$429.57 and a weighted average remaining contractual term of 9.47.7 years.
As of December 31, 2021,2023, total unrecognized stock-based compensation expense related to stock options was $5.7$3.2 million, which is expected to be recognized on a straight-line basis over a weighted average period of approximately 4.72.7 years. There were no3,060 options exercised during 2021. There were 77,258 options exercised during 2020.2023. The total intrinsic value of options exercised during 2020 was $11.1 million; a tax benefit from these stock option exercises of $2.9 million was realized. There were 1,743 options exercised during 2019. The total intrinsic value of
options exercised during 20192023 was $0.6$0.5 million; a tax benefit from these option exercises of $0.2$0.1 million was realized.
During 2020, the Company granted 77,258 There were 5,084 options at an exercise price above the fair market value of its common stock at the date of grant.exercised during 2022. The weighted average grant-date fairtotal intrinsic value of options grantedexercised during 20202022 was $93.79. $1.2 million; a tax benefit from these option exercises of $0.3 million was realized. There were no options exercised during 2021.
No options were granted during 20212023, 2022 or 2019.
The fair value of options at date of grant was estimated using the Black-Scholes method utilizing the following assumptions:
2021. | | | | | | | | | |
| | | 2020 | | | |
| Expected life (years) | 8 | | | |
| Interest rate | 0.53% | | | |
| Volatility | 27.70% | | | |
| Dividend yield | 1.45% | | | |
Other Awards. In 2022, the Company granted a stock award to an executive officer that is subject to price-based vesting conditions. The stock award provides the executive officer the right to receive 1,000 shares of the Company’s Class B common stock each time the Company’s closing share price exceeds a certain share price target for a 90 consecutive day period; the award period expires on December 31, 2027. The grant date fair value of the stock award totaled $3.5 million, which was estimated using a Monte Carlo simulation. The grant date fair value is recognized over the derived service period of each tranche. No shares related to this award vested in 2023 or 2022. The Company recognized $1.1 million and $1.3 million in stock-based compensation expense related to this award in 2023 and 2022, respectively.
For the year ended December 31, 2023, the Company recognized expense of $0.4 million related to the issuance and vesting of 731 shares to non-employee Directors under the 2022 Plan. For the year ended December 31, 2022, the Company recognized expense of $0.2 million for 345 shares issued and vested under the same plan.
The Company also maintains a stock option plan at Kaplan. Under the provisions of this plan, options are issued with an exercise price equal to the estimated fair value of Kaplan’s common stock, and options vest ratably over the number of years specified (generally four to five years) at the time of the grant. Upon exercise, an option holder may receive Kaplan shares or cash equal to the difference between the exercise price and the then fair value.
At December 31, 2021,2023, a Kaplan senior manager holdsheld 7,206 Kaplan restricted shares. The fair value of Kaplan’s common stock is determined by the Company’s compensation committee of the Board of Directors, and in January 2022,2024, the committee set the fair value price at $1,425$1,700 per share. No options were awarded during 2021, 2020,2023, 2022, or 2019;2021; no options were exercised during 2021, 20202023, 2022 or 2019;2021; and no options were outstanding at December 31, 2021.2023.
Kaplan recorded stock compensation expense of $1.3$1.0 million, in 2021, and a stock compensation credit of $1.1$1.0 million and $1.3 million in 20202023, 2022 and 2019,2021, respectively. At December 31, 2021,2023, the Company’s accrual balance related to the Kaplan restricted shares totaled $10.3$12.3 million. There were no payouts in 2021, 20202023, 2022 or 2019.2021.
Earnings Per Share. The Company’s unvested restricted stock awards contain nonforfeitable rights to dividends and, therefore, are considered participating securities for purposes of computing earnings per share pursuant to the two-class method. The diluted earnings per share computed under the two-class method is lower than the diluted earnings per share computed under the treasury stock method, resulting in the presentation of the lower amount in diluted earnings per share. The computation of earnings per share under the two-class method excludes the income attributable to the unvested restricted stock awards from the numerator and excludes the dilutive impact of those underlying shares from the denominator.
The following reflects the Company’s net income and share data used in the basic and diluted earnings per share computations using the two-class method:
| | Year Ended December 31 |
| Year Ended December 31 | | | Year Ended December 31 |
| (in thousands, except per share amounts) | (in thousands, except per share amounts) | 2021 | | 2020 | | 2019 | (in thousands, except per share amounts) | 2023 | | 2022 | | 2021 |
| Numerator: | Numerator: | |
| Numerator for basic earnings per share: | Numerator for basic earnings per share: | |
| Numerator for basic earnings per share: | |
| Numerator for basic earnings per share: | |
| Net income attributable to Graham Holdings Company common stockholders | |
| Net income attributable to Graham Holdings Company common stockholders | |
| Net income attributable to Graham Holdings Company common stockholders | Net income attributable to Graham Holdings Company common stockholders | $ | 352,075 | | | $ | 300,365 | | | $ | 327,855 | |
| Less: Dividends paid–common stock outstanding and unvested restricted shares | Less: Dividends paid–common stock outstanding and unvested restricted shares | (30,136) | | | (29,970) | | | (29,553) | |
| Undistributed earnings | Undistributed earnings | 321,939 | | | 270,395 | | | 298,302 | |
| Percent allocated to common stockholders | Percent allocated to common stockholders | 99.36 | % | | 99.45 | % | | 99.45 | % | Percent allocated to common stockholders | 99.34 | % | | 99.43 | % | | 99.36 | % |
| 319,867 | | | 268,917 | | | 296,665 | |
| 173,182 | |
| Add: Dividends paid–common stock outstanding | Add: Dividends paid–common stock outstanding | 29,946 | | | 29,812 | | | 29,387 | |
| Numerator for basic earnings per share | Numerator for basic earnings per share | 349,813 | | | 298,729 | | | 326,052 | |
| Add: Additional undistributed earnings due to dilutive stock options | Add: Additional undistributed earnings due to dilutive stock options | 5 | | | 4 | | | 13 | |
| Numerator for diluted earnings per share | Numerator for diluted earnings per share | $ | 349,818 | | | $ | 298,733 | | | $ | 326,065 | |
| Denominator: | Denominator: | |
| Denominator for basic earnings per share: | Denominator for basic earnings per share: | |
| Denominator for basic earnings per share: | |
| Denominator for basic earnings per share: | |
| Weighted average shares outstanding | |
| Weighted average shares outstanding | |
| Weighted average shares outstanding | Weighted average shares outstanding | 4,951 | | | 5,124 | | | 5,285 | |
| Add: Effect of dilutive stock options | Add: Effect of dilutive stock options | 14 | | | 15 | | | 42 | |
| Denominator for diluted earnings per share | Denominator for diluted earnings per share | 4,965 | | | 5,139 | | | 5,327 | |
| Graham Holdings Company Common Stockholders: | Graham Holdings Company Common Stockholders: | | | | | | Graham Holdings Company Common Stockholders: | | | |
| Basic earnings per share | Basic earnings per share | $ | 70.65 | | | $ | 58.30 | | | $ | 61.70 | |
| Diluted earnings per share | Diluted earnings per share | $ | 70.45 | | | $ | 58.13 | | | $ | 61.21 | |
| |
Earnings per share amounts may not recalculate due to rounding.
Diluted earnings per share excludes the following weighted average potential common shares, as the effect would be antidilutive, as computed under the treasury stock method:
| | Year Ended December 31 |
| Year Ended December 31 | | | Year Ended December 31 |
| (in thousands) | (in thousands) | 2021 | | 2020 | | 2019 | (in thousands) | 2023 | | 2022 | | 2021 |
| Weighted average restricted stock | Weighted average restricted stock | 13 | | | 12 | | | 12 | |
|
The 2021, 20202023, 2022 and 20192021 diluted earnings per share amounts exclude the effects of 104,000, 181,258105,000, 105,000 and 104,000 stock options and contingently issuable shares outstanding, respectively, as their inclusion would have been antidilutive due to a market condition.
In 2021, 20202023, 2022 and 2019,2021, the Company declared regular dividends totaling $6.04, $5.80$6.60, $6.32 and $5.56$6.04 per share, respectively.
15. PENSIONS AND OTHER POSTRETIREMENT PLANS
The Company maintains various pension and incentive savings plans and contributed to multiemployer plans on behalf of certain union-represented employee groups. Most of the Company’s employees are covered by these plans. The Company also provides healthcare and life insurance benefits to certain retired employees. These employees become eligible for benefits after meeting age and service requirements.
The Company uses a measurement date of December 31 for its pension and other postretirement benefit plans.
In December 2019, the Company purchased an irrevocable group annuity contract from an insurance company for $216.8 million to settle $212.1 million of the outstanding defined benefit pension obligation related to certain retirees and beneficiaries. The purchase of the group annuity contract was funded from the assets of the Company’s pension plans As a result of this transaction, the Company was relieved of all responsibility for these pension obligations and the insurance company is now required to pay and administer the retirement benefits owed to approximately 3,800 retirees and beneficiaries, with no change to the amount, timing or form of monthly retirement benefit payments. As a result, the Company recorded a one-time settlement gain of $91.7 million.
Defined Benefit Plans. The Company’s defined benefit pension plans consist of various pension plans and a Supplemental Executive Retirement Plan (SERP) offered to certain executives of the Company.
In the secondfirst quarter of 2021,2023, the Company recorded $1.1$4.1 million in expenses related to a Separation Incentive Program (SIP)Programs (SIPs) for certain Dekko employees, which will be funded from the assets of the Company’s pension plans.
In the second quarter of 2020, the Company recorded $6.0 million in expenses related to a SIP for certain Kaplan,Leaf and Code3 and Decile employees, which was funded from the assets of the Company’s pension plans. In the thirdsecond quarter of 2020,2023, the Company recorded $7.8$5.5 million in expenses related to SIPs for certain Kaplan, GMG, Leaf, Code3 and Pinna employees, which was funded from the assets of the Company’s pension plans. In the fourth quarter of 2023, the Company recorded $0.2 million in expenses related to a SIP for certain GMG employees, which was funded from the assets of the Company’s pension plans.
In January 2022, a pension credit retention program was implemented by the Company for certain Graham Healthcare Group employees; the program offers a pension credit up to $50,000 per employee, cliff vested after
three years of continuous employment for certain existing employees and new employees. The Company recorded $13.5 million and $10.5 million in pension service cost expense in 2023 and 2022 related to this program.
In the fourth quarter of 2022, the Company recorded $3.6 million in expenses related to a SIP for certain Kaplan employees, which was funded from the assets of the Company’s pension plans.
In the second quarter of 2019,2021, the Company offeredrecorded $1.1 million in expenses related to a SIP for certain KaplanDekko employees, which was funded from the assets of the Company’s pension plans. The Company recorded $6.4 million in expense related to the SIP for 2019.
The following table sets forth obligation, asset and funding information for the Company’s defined benefit pension plans:
| | Pension Plans |
| As of December 31 |
| Pension Plans | | | Pension Plans |
| As of December 31 | | | As of December 31 |
| (in thousands) | (in thousands) | 2021 | | 2020 | (in thousands) | 2023 | | 2022 |
| Change in Benefit Obligation | Change in Benefit Obligation | |
| Benefit obligation at beginning of year | |
| Benefit obligation at beginning of year | |
| Benefit obligation at beginning of year | Benefit obligation at beginning of year | $ | 1,095,117 | | | $ | 1,020,356 | |
| Service cost | Service cost | 22,991 | | | 22,656 | |
| Interest cost | Interest cost | 26,917 | | | 32,587 | |
| Amendments | Amendments | 2 | | | 69 | |
| Actuarial loss | 5,660 | | | 78,900 | |
| Actuarial loss (gain) | |
| | Benefits paid | |
| Benefits paid | |
| Benefits paid | Benefits paid | (63,510) | | | (73,232) | |
| Special termination benefits | Special termination benefits | 1,132 | | | 13,781 | |
| | | Benefit Obligation at End of Year | |
| | Benefit Obligation at End of Year | |
| | Benefit Obligation at End of Year | Benefit Obligation at End of Year | $ | 1,088,309 | | | $ | 1,095,117 | |
| Change in Plan Assets | Change in Plan Assets | | | | Change in Plan Assets | | | |
| Fair value of assets at beginning of year | Fair value of assets at beginning of year | $ | 2,803,422 | | | $ | 2,312,706 | |
| Actual return on plan assets | Actual return on plan assets | 654,911 | | | 563,948 | |
| Benefits paid | Benefits paid | (63,510) | | | (73,232) | |
| | Fair Value of Assets at End of Year | Fair Value of Assets at End of Year | $ | 3,394,823 | | | $ | 2,803,422 | |
| Fair Value of Assets at End of Year | |
| Fair Value of Assets at End of Year | |
| Funded Status | Funded Status | $ | 2,306,514 | | | $ | 1,708,305 | |
| | SERP |
| As of December 31 |
| SERP | | | SERP |
| As of December 31 | | | As of December 31 |
| (in thousands) | (in thousands) | 2021 | | 2020 | (in thousands) | 2023 | | 2022 |
| Change in Benefit Obligation | Change in Benefit Obligation | | | | Change in Benefit Obligation | | | |
| Benefit obligation at beginning of year | Benefit obligation at beginning of year | $ | 122,299 | | | $ | 116,193 | |
| Service cost | Service cost | 1,022 | | | 954 | |
| Interest cost | Interest cost | 2,943 | | | 3,678 | |
| | Actuarial (gain) loss | (7,640) | | | 7,448 | |
| Actuarial loss (gain) | |
| Actuarial loss (gain) | |
| Actuarial loss (gain) | |
| Benefits paid | Benefits paid | (5,918) | | | (5,974) | |
| | Benefit Obligation at End of Year | Benefit Obligation at End of Year | $ | 112,706 | | | $ | 122,299 | |
| Change in Plan Assets | | |
| Fair value of assets at beginning of year | $ | — | | | $ | — | |
| Employer contributions | 5,918 | | | 5,974 | |
| Benefits paid | (5,918) | | | (5,974) | |
| Fair Value of Assets at End of Year | $ | — | | | $ | — | |
| | Benefit Obligation at End of Year | |
| | Benefit Obligation at End of Year | |
| | Funded Status | Funded Status | $ | (112,706) | | | $ | (122,299) | |
| | Funded Status | |
| | Funded Status | |
The changechanges in the Company’s benefit obligations for the pension plans wasand SERP in 2023 were primarily due to the benefits paid during the year. The change in the benefit obligations for the Company’s SERP was due toyear offset by the recognition of an actuarial gainloss resulting from an increasea decrease to the discount rate used to measure the benefit obligation and special termination benefits paid during the year.provided to employees.
The accumulated benefit obligation for the Company’s pension plans at December 31, 20212023 and 2020,2022, was $1,052.7$880.3 million and $1,064.3$843.6 million, respectively. The accumulated benefit obligation for the Company’s SERP at
December 31, 20212023 and 2020,2022, was $112.2$89.4 million and $121.7$88.0 million, respectively. The amounts recognized in the Company’s Consolidated Balance Sheets for its defined benefit pension plans are as follows:
| | Pension Plans | | SERP |
| As of December 31 | | As of December 31 |
| Pension Plans | | | Pension Plans | | SERP |
| As of December 31 | | | As of December 31 | | As of December 31 |
| (in thousands) | (in thousands) | 2021 | | 2020 | | 2021 | | 2020 | (in thousands) | 2023 | | 2022 | | 2023 | | 2022 |
| Noncurrent asset | Noncurrent asset | $ | 2,306,514 | | | $ | 1,708,305 | | | $ | — | | | $ | — | |
| | Current liability | Current liability | — | | | — | | | (6,334) | | | (6,495) | |
| Current liability | |
| Current liability | |
| Noncurrent liability | Noncurrent liability | — | | | — | | | (106,372) | | | (115,804) | |
| Recognized Asset (Liability) | Recognized Asset (Liability) | $ | 2,306,514 | | | $ | 1,708,305 | | | $ | (112,706) | | | $ | (122,299) | |
Key assumptions utilized for determining the benefit obligation are as follows:
| | Pension Plans | | SERP |
| As of December 31 | | As of December 31 |
| Pension Plans | | | Pension Plans | | SERP |
| As of December 31 | | | As of December 31 | | As of December 31 |
| | | 2021 | | 2020 | | 2021 | | 2020 | | 2023 | | 2022 | | 2023 | | 2022 |
| Discount rate | Discount rate | 2.9% | | 2.5% | | 2.9% | | 2.5% | Discount rate | 5.2% | | 5.5% | | 5.1% | | 5.5% |
| Rate of compensation increase – age graded | Rate of compensation increase – age graded | 5.0%–1.0% | | 5.0%–1.0% | | 5.0%–1.0% | | 5.0%–1.0% | Rate of compensation increase – age graded | 5.0%–1.0% | | 5.0%–1.0% | | 5.0%–1.0% | | 5.0%–1.0% |
| Cash balance interest crediting rate | Cash balance interest crediting rate | 1.41% with phase in to 2.90% in 2024 | | 1.41% with phase in to 2.50% in 2023 | | — | | — | Cash balance interest crediting rate | 4.28% with phase in to 5.20% in 2025 | | 4.28% with phase in to 5.50% in 2025 | | — | | — |
The Company made no contributions to its pension plans in 20212023 and 2020,2022, and the Company does not expect to make any contributions in 2022.2024. The SERP is unfunded, therefore, the Company made contributions to its SERPactual benefit payments of $6.3 million and $5.9 million and $6.0 millionto beneficiaries for the years ended December 31, 20212023 and 2020,2022, respectively. As the plan is unfunded, the Company makes contributions to the SERP based on actual benefit payments.
At December 31, 2021,2023, future estimated benefit payments, excluding charges for early retirement programs, are as follows:
| | (in thousands) | (in thousands) | Pension Plans | | SERP | (in thousands) | Pension Plans | | SERP |
| 2022 | $ | 61,330 | | | $ | 6,425 | |
| 2023 | 61,487 | | | 6,706 | |
| 2024 | 2024 | 62,710 | | | 6,897 | |
| 2025 | 2025 | 63,299 | | | 7,029 | |
| 2026 | 2026 | 63,102 | | | 7,118 | |
| 2027–2031 | 316,913 | | | 35,476 | |
| 2027 | |
| 2028 | |
| 2029–2033 | |
The total (benefit) cost arising from the Company’s defined benefit pension plans consists of the following components:
| | Pension Plans |
| Year Ended December 31 |
| Pension Plans | | | Pension Plans |
| Year Ended December 31 | | | Year Ended December 31 |
| (in thousands) | (in thousands) | 2021 | | 2020 | | 2019 | (in thousands) | 2023 | | 2022 | | 2021 |
| Service cost | Service cost | $ | 22,991 | | | $ | 22,656 | | | $ | 20,422 | |
| Interest cost | Interest cost | 26,917 | | | 32,587 | | | 46,821 | |
| Expected return on assets | Expected return on assets | (137,878) | | | (113,427) | | | (122,790) | |
| | Amortization of prior service cost | Amortization of prior service cost | 2,846 | | | 2,830 | | | 2,882 | |
| Amortization of prior service cost | |
| Amortization of prior service cost | |
| Recognized actuarial gain | Recognized actuarial gain | (7,906) | | | — | | | — | |
| Net Periodic Benefit for the Year | Net Periodic Benefit for the Year | (93,030) | | | (55,354) | | | (52,665) | |
| | Settlement | — | | | — | | | (91,676) | |
| | Special separation benefit expense | |
| | Special separation benefit expense | |
| | Special separation benefit expense | Special separation benefit expense | 1,132 | | | 13,781 | | | 6,432 | |
| | Total Benefit for the Year | Total Benefit for the Year | $ | (91,898) | | | $ | (41,573) | | | $ | (137,909) | |
| | Total Benefit for the Year | |
| | Total Benefit for the Year | |
| Other Changes in Plan Assets and Benefit Obligations Recognized in Other Comprehensive Income | Other Changes in Plan Assets and Benefit Obligations Recognized in Other Comprehensive Income | | | | | | Other Changes in Plan Assets and Benefit Obligations Recognized in Other Comprehensive Income | | | |
| Current year actuarial gain | $ | (511,373) | | | $ | (371,621) | | | $ | (245,402) | |
| Current year prior service cost | 2 | | | 69 | | | 5,725 | |
| Current year actuarial (gain) loss | |
| Current year prior service (credit) cost | |
| Amortization of prior service cost | Amortization of prior service cost | (2,846) | | | (2,830) | | | (2,882) | |
| Recognized net actuarial gain | Recognized net actuarial gain | 7,906 | | | — | | | — | |
| Curtailment and settlement | — | | | — | | | 91,676 | |
| | Total Recognized in Other Comprehensive Income (Before Tax Effects) | |
| Total Recognized in Other Comprehensive Income (Before Tax Effects) | |
| Total Recognized in Other Comprehensive Income (Before Tax Effects) | Total Recognized in Other Comprehensive Income (Before Tax Effects) | $ | (506,311) | | | $ | (374,382) | | | $ | (150,883) | |
| Total Recognized in Total Benefit and Other Comprehensive Income (Before Tax Effects) | Total Recognized in Total Benefit and Other Comprehensive Income (Before Tax Effects) | $ | (598,209) | | | $ | (415,955) | | | $ | (288,792) | |
| | SERP |
| Year Ended December 31 |
| SERP | | | SERP |
| Year Ended December 31 | | | Year Ended December 31 |
| (in thousands) | (in thousands) | 2021 | | 2020 | | 2019 | (in thousands) | 2023 | | 2022 | | 2021 |
| Service cost | Service cost | $ | 1,022 | | | $ | 954 | | | $ | 858 | |
| Interest cost | Interest cost | 2,943 | | | 3,678 | | | 4,314 | |
| | | Amortization of prior service cost | |
| | Amortization of prior service cost | |
| | Amortization of prior service cost | Amortization of prior service cost | 331 | | | 331 | | | 339 | |
| Recognized actuarial loss | Recognized actuarial loss | 5,930 | | | 5,267 | | | 2,314 | |
| | Total Cost for the Year | Total Cost for the Year | $ | 10,226 | | | $ | 10,230 | | | $ | 7,825 | |
| | Total Cost for the Year | |
| | Total Cost for the Year | |
| Other Changes in Benefit Obligations Recognized in Other Comprehensive Income | Other Changes in Benefit Obligations Recognized in Other Comprehensive Income | |
| Current year actuarial (gain) loss | $ | (7,640) | | | $ | 7,448 | | | $ | 15,544 | |
| Current year actuarial loss (gain) | |
| Current year actuarial loss (gain) | |
| Current year actuarial loss (gain) | |
| | Amortization of prior service cost | |
| Amortization of prior service cost | |
| Amortization of prior service cost | Amortization of prior service cost | (331) | | | (331) | | | (339) | |
| Recognized net actuarial loss | Recognized net actuarial loss | (5,930) | | | (5,267) | | | (2,314) | |
| | Total Recognized in Other Comprehensive Income (Before Tax Effects) | Total Recognized in Other Comprehensive Income (Before Tax Effects) | $ | (13,901) | | | $ | 1,850 | | | $ | 12,891 | |
| | Total Recognized in Other Comprehensive Income (Before Tax Effects) | |
| | Total Recognized in Other Comprehensive Income (Before Tax Effects) | |
| Total Recognized in Total Cost and Other Comprehensive Income (Before Tax Effects) | Total Recognized in Total Cost and Other Comprehensive Income (Before Tax Effects) | $ | (3,675) | | | $ | 12,080 | | | $ | 20,716 | |
The costs for the Company’s defined benefit pension plans are actuarially determined. Below are the key assumptions utilized to determine periodic cost:
| | Pension Plans | | SERP |
| Year Ended December 31 | | Year Ended December 31 |
| 2021 | | 2020 | | 2019 | | 2021 | | 2020 | | 2019 |
| Pension Plans | | | Pension Plans | | SERP |
| Year Ended December 31 | | | Year Ended December 31 | | Year Ended December 31 |
| 2023 | | | 2023 | | 2022 | | 2021 | | 2023 | | 2022 | | 2021 |
| Discount rate | Discount rate | 2.5% | | 3.3% | | 4.3% | | 2.5% | | 3.3% | | 4.3% | Discount rate | 5.5% | | 2.9% | | 2.5% | | 5.5% | | 2.9% | | 2.5% |
| Expected return on plan assets | Expected return on plan assets | 6.25% | | 6.25% | | 6.25% | | — | | — | | — | Expected return on plan assets | 6.25% | | 6.25% | | — | | — |
| Rate of compensation increase – age graded | Rate of compensation increase – age graded | 5.0%–1.0% | | 5.0%–1.0% | | 5.0%–1.0% | | 5.0%–1.0% | | 5.0%–1.0% | | 5.0%–1.0% | Rate of compensation increase – age graded | 5.0%–1.0% | | 5.0%–1.0% | | 5.0%–1.0% | | 5.0%–1.0% |
| Cash balance interest crediting rate | Cash balance interest crediting rate | 1.41% with phase in to 2.50% in 2023 | | 2.77% with phase in to 3.30% in 2022 | | 3.45% with phase in to 4.30% in 2021 | | — | | — | | — | Cash balance interest crediting rate | 4.28% with phase in to 5.50% in 2025 | | 1.41% with phase in to 2.90% in 2024 | | 1.41% with phase in to 2.50% in 2023 | | — | | — |
Accumulated other comprehensive income (AOCI) includes the following components of unrecognized net periodic cost for the defined benefit plans:
| | Pension Plans | | | Pension Plans | | SERP |
| As of December 31 | | | As of December 31 | | As of December 31 |
| (in thousands) | | (in thousands) | 2023 | | 2022 | | 2023 | | 2022 |
| Unrecognized actuarial gain | |
| Unrecognized prior service (credit) cost | |
| | Pension Plans | | SERP |
| As of December 31 | | As of December 31 |
| (in thousands) | 2021 | | 2020 | | 2021 | | 2020 |
| Unrecognized actuarial (gain) loss | $ | (1,342,623) | | | $ | (839,156) | | | $ | 19,111 | | | $ | 32,681 | |
| Unrecognized prior service cost | 4,511 | | | 7,355 | | | 36 | | | 367 | |
| | Gross Amount | |
| Gross Amount | |
| Gross Amount | Gross Amount | (1,338,112) | | | (831,801) | | | 19,147 | | | 33,048 | |
| Deferred tax liability (asset) | Deferred tax liability (asset) | 355,078 | | | 224,586 | | | (5,340) | | | (8,923) | |
| Net Amount | Net Amount | $ | (983,034) | | | $ | (607,215) | | | $ | 13,807 | | | $ | 24,125 | |
Defined Benefit Plan Assets. The Company’s defined benefit pension obligations are funded by a portfolio made up of private investment funds, a U.S. stock index fund, and a relatively small number of stocks and high-quality fixed-income securities that are held by a third-party trustee. The assets of the Company’s pension plans were allocated as follows:
| | As of December 31 |
| 2021 | | 2020 |
| As of December 31 | | | As of December 31 |
| 2023 | | | 2023 | | 2022 |
| U.S. equities | U.S. equities | 61 | % | | 58 | % | U.S. equities | 59 | % | | 59 | % |
| Private investment funds | Private investment funds | 17 | % | | 18 | % | Private investment funds | 17 | % | | 16 | % |
| U.S. stock index fund | 9 | % | | 9 | % |
| International equities | International equities | 9 | % | | 8 | % | International equities | 14 | % | | 11 | % |
| U.S. fixed income | U.S. fixed income | 4 | % | | 7 | % | U.S. fixed income | 7 | % | | 7 | % |
| U.S. stock index fund | | U.S. stock index fund | 3 | % | | 7 | % |
| | | 100 | % | | 100 | % | | 100 | % | | 100 | % |
The Company manages approximately 39%40% of the pension assets internally, of which the majority is invested in private investment funds with the remaining investments in Berkshire Hathaway and Markel stock, a U.S. stock index fund, and short-term fixed-income securities. The remaining 61%60% of plan assets are managed by 2two investment companies. The goal of the investment managers is to produce moderate long-term growth in the value of these assets, while protecting them against large decreases in value. Both investment managers may invest in a combination of equity and fixed-income securities and cash. The managers are not permitted to invest in securities of the Company or in alternative investments. One investment manager cannot invest more than 15% of the assets at the time of
at the time of purchase in the stock of Alphabet and Berkshire Hathaway, and no more than 30%35% of the assets it manages in specified international exchanges at the time the investment is made. The other investment manager cannot invest more than 20% of the assets at the time of purchase in the stock of Berkshire Hathaway, and no more than 15% of the assets it manages in specified international exchanges at the time the investment is made, and no less than 10% of the assets could be invested in fixed-income securities. Excluding the exceptions noted above, the investment managers cannot invest more than 10% of the assets in the securities of any other single issuer, except for obligations of the U.S. Government, without receiving prior approval from the Planplan administrator.
In determining the expected rate of return on plan assets, the Company considers the relative weighting of plan assets, the historical performance of total plan assets and individual asset classes and economic and other indicators of future performance. In addition, the Company may consult with and consider the input of financial and other professionals in developing appropriate return benchmarks.
The Company evaluated its defined benefit pension plan asset portfolio for the existence of significant concentrations (defined as greater than 10% of plan assets) of credit risk as of December 31, 2021.2023. Types of concentrations that were evaluated include, but are not limited to, investment concentrations in a single entity, type of industry, foreign country and individual fund. At December 31, 2021,2023, the pension plan held investments in 1one common stock and 1one private investment fund that exceeded 10% of total plan assets, valued at $998.8$1,011.1 million, or approximately 29%34% of total plan assets. At December 31, 2020,2022, the pension plan held investments in 1one common stock and 1one private investment fund that exceeded 10% of total plan assets, valued at $850.6$842.6 million, or approximately 30%33% of total plan assets. Assets also included $82.4 million of Markel shares at December 31, 2023.
The Company’s pension plan assets measured at fair value on a recurring basis were as follows:
| | As of December 31, 2023 | | | As of December 31, 2023 |
| (in thousands) | | (in thousands) | Level 1 | | Level 2 | | Level 3 | | Total |
| Cash equivalents | |
| Equity securities | |
U.S. equities (1) | |
U.S. equities (1) | |
U.S. equities (1) | |
International equities (2) | |
| | | As of December 31, 2021 |
| (in thousands) | Level 1 | | Level 2 | | Level 3 | | Total |
| Cash equivalents and other short-term investments | $ | 2,159 | | | $ | 145,683 | | | $ | — | | | $ | 147,842 | |
| Equity securities | |
| U.S. equities | 2,067,152 | | | — | | | — | | | 2,067,152 | |
| International equities | 301,640 | | | — | | | — | | | 301,640 | |
| Private investment funds | — | | | — | | | 573,970 | | | 573,970 | |
| U.S. stock index fund | — | | | — | | | 302,478 | | | 302,478 | |
| | Total Investments | Total Investments | $ | 2,370,951 | | | $ | 145,683 | | | $ | 876,448 | | | $ | 3,393,082 | |
| | Total Investments | |
| | Total Investments | |
Short-term investment funds measured at NAV (3) | |
Private investment funds measured at NAV (4) | |
U.S. stock index fund measured at NAV (5) | |
| Receivables, net | Receivables, net | | | | 1,741 | |
| Total | Total | | | | $ | 3,394,823 | |
| | | | | | | | | | | | | | | | | | | | | | | |
| As of December 31, 2020 |
| (in thousands) | Level 1 | | Level 2 | | Level 3 | | Total |
| Cash equivalents and other short-term investments | $ | 2,218 | | | $ | 197,655 | | | $ | — | | | $ | 199,873 | |
| Equity securities | | | | | | | |
| U.S. equities | 1,614,879 | | | — | | | — | | | 1,614,879 | |
| International equities | 233,818 | | | — | | | — | | | 233,818 | |
| Private investment fund | — | | | — | | | 496,458 | | | 496,458 | |
| U.S. stock index fund | — | | | — | | | 256,291 | | | 256,291 | |
| | | | | | | |
| | | | | | | |
| | | | | | | |
| Total Investments | $ | 1,850,915 | | | $ | 197,655 | | | $ | 752,749 | | | $ | 2,801,319 | |
| Receivables, net | | | | | | | 2,103 | |
| Total | | | | | | | $ | 2,803,422 | |
Cash equivalents and other short-term investments. | | | | | | | | | | | | | | | | | | | | | | | |
| As of December 31, 2022 |
| (in thousands) | Level 1 | | Level 2 | | Level 3 | | Total |
| Cash equivalents | $ | 1,980 | | | $ | — | | | $ | — | | | $ | 1,980 | |
| Equity securities | | | | | | | |
U.S. equities (1) | 1,507,609 | | | — | | | — | | | 1,507,609 | |
International equities (2) | 270,872 | | | — | | | — | | | 270,872 | |
| | | | | | | |
| | | | | | | |
| | | | | | | |
| | | | | | | |
| | | | | | | |
| Total Investments | $ | 1,780,461 | | | $ | — | | | $ | — | | | $ | 1,780,461 | |
Short-term investment funds measured at NAV (3) | | | | | | | 170,062 | |
Private investment funds measured at NAV (4) | | | | | | | 406,600 | |
U.S. stock index fund measured at NAV (5) | | | | | | | 168,532 | |
| Receivables, net | | | | | | | 2,689 | |
| Total | | | | | | | $ | 2,528,344 | |
____________
| | | | | |
| (1) | U.S. equities. These investments are primarily held in U.S. Treasury securities and registered money market funds. These investments are held in common and preferred stock of U.S. corporations and American Depositary Receipts (ADRs) traded on U.S. exchanges. Common and preferred shares and ADRs are traded actively on exchanges, and price quotes for these shares are readily available. These investments are classified as Level 1 in the valuation hierarchy. |
| (2) | International equities. These investments are held in common and preferred stock issued by non-U.S. corporations. Common and preferred shares are traded actively on exchanges, and price quotes for these shares are readily available. These investments are classified as Level 1 in the valuation hierarchy. |
| (3) | Short-term investment funds. These investments include commingled funds that are primarily held in U.S. Treasury securities. The funds are valued using the net asset value (NAV) provided by the administrator of the funds and reviewed by the Company. |
| (4) | Private investment funds. This category includes a commingled fund and a private investment fund. The commingled fund invests in a diversified mix of publicly traded securities (U.S. and international stocks) and private companies. The private investment fund invests in non-public companies. The funds are valued using the NAV provided by the administrator of the funds and reviewed by the Company. The NAV is based on the value of the underlying assets owned by the fund, minus liabilities and divided by the number of units outstanding. |
| |
| (5) | U.S. stock index fund. This fund consists of investments held in common stock, plus an uninvested cash portion comprising less than 1% of fund value, that together are designed to track the performance of the S&P 500 Index. The fund is valued using the NAV provided by the administrator of the fund and reviewed by the Company. The NAV is based on the value of the underlying assets owned by the fund, minus liabilities and divided by the number of units outstanding. |
The following table sets forth a market approach based on the quoted market pricessummary of the security or inputs that include quoted market prices for similar instruments and are classified as either Level 1 or Level 2 in the valuation hierarchy.Plan’s investments with a reported NAV:
U.S. equities. These investments are held in common and preferred stock of U.S. corporations and American Depositary Receipts (ADRs) traded on U.S. exchanges. Common and preferred shares and ADRs are traded actively on exchanges, and price quotes for these shares are readily available. These investments are classified as Level 1 in the valuation hierarchy. | | | | | | | | | | | | | | | | | |
| (in thousands) | Fair Value | Unfunded Commitment | Redemption Frequency | Other Redemption Restriction | Redemption
Notice
Period |
| Short-term investment funds | | | | | |
| 2023 | $ | 197,712 | | $ | — | | Immediate | None | None |
| 2022 | $ | 170,062 | | $ | — | | Immediate | None | None |
| Private investment funds | | | | | |
| 2023 | $ | 509,647 | | $ | 16,515 | | (1) | (1) | 90 days |
| 2022 | $ | 406,600 | | $ | 20,673 | | (1) | (1) | 90 days |
| U.S. stock index fund | | | | | |
| 2023 | $ | 84,767 | | $ | — | | Immediate | None | 1 day |
| 2022 | $ | 168,532 | | $ | — | | Immediate | None | 1 day |
International equities. These investments are held in common and preferred stock issued by non-U.S. corporations. Common and preferred shares are traded actively on exchanges, and price quotes for these shares are readily available. These investments are classified as Level 1 in the valuation hierarchy.____________
| | | | | |
| (1) | Five percent of the NAV of the investment in the commingled fund may be redeemed annually starting at the 12-month anniversary of the investment, subject to certain limitations. Additionally, the investment in the commingled fund may be redeemed in part, or in full, at the 60-month anniversary of the investment, or at any subsequent 36-month anniversary date following the initial 60-month anniversary. The investment in the private investment fund is generally not redeemable until the dissolution of the fund. |
Private investment funds. This category includes a commingled fund and a private investment fund. The commingled fund invests in a diversified mix of publicly-traded securities (U.S. and international stocks) and private companies. The private investment fund invests in non-public companies. These investment funds have restrictions that limit the Company’s ability to liquidate its investments. The investment in the commingled fund may be redeemed in part, or in full, at the 60-month anniversary of the investment, or at any subsequent 36-month anniversary date following the initial 60-month anniversary. The investment in the private investment fund is generally not redeemable until the dissolution of the fund. The funds are valued using the net asset value (NAV) provided by the administrator of the funds and reviewed by the Company. The NAV is based on the value of the underlying assets owned by the fund, minus liabilities and divided by the number of units outstanding. These investments are classified as Level 3 in the valuation hierarchy.
U.S. stock index fund. This fund consists of investments held in a diversified mix of securities (U.S. and international stocks, and fixed-income securities) and a combination of other collective funds that together are designed to track the performance of the S&P 500 Index. The fund is valued using the NAV provided by the administrator of the fund and reviewed by the Company. The NAV is based on the value of the underlying assets owned by the fund, minus liabilities and divided by the number of units outstanding. The investment in this fund may be redeemed daily, subject to the restrictions of the fund. This investment is classified as Level 3 in the valuation hierarchy.
The following table provides a reconciliation of changes in pension assets measured at fair value on a recurring basis, using Level 3 inputs:
| | | | | | | | | | | |
| (in thousands) | Private
Investment Funds | | U.S. Stock
Index Fund |
| As of December 31, 2019 | $ | 151,854 | | | $ | 322,229 | |
| Purchases, sales, and settlements, net | 130,000 | | | (100,000) | |
| Actual return on plan assets: | | | |
| Losses relating to assets sold | — | | | (5,763) | |
| Gains relating to assets still held at year-end | 214,604 | | | 39,825 | |
| As of December 31, 2020 | 496,458 | | | 256,291 | |
| Purchases, sales, and settlements, net | 3,912 | | | (25,000) | |
| Actual return on plan assets: | | | |
| Gains relating to assets sold | — | | | 3,715 | |
| Gains relating to assets still held at year-end | 73,600 | | | 67,472 | |
| As of December 31, 2021 | $ | 573,970 | | | $ | 302,478 | |
Other Postretirement Plans. In 2023, the Company purchased a contract from an insurance company to settle its outstanding retiree life insurance obligation for $1.7 million. As a result, the Company recorded a settlement gain of $1.1 million.
The following table sets forth obligation, asset and funding information for the Company’s other postretirement plans:
| | Postretirement Plans |
| As of December 31 |
| Postretirement Plans | | | Postretirement Plans |
| As of December 31 | | | As of December 31 |
| (in thousands) | (in thousands) | 2021 | | 2020 | (in thousands) | 2023 | | 2022 |
| Change in Benefit Obligation | Change in Benefit Obligation | | | | Change in Benefit Obligation | | | |
| Benefit obligation at beginning of year | Benefit obligation at beginning of year | $ | 5,587 | | | $ | 6,816 | |
| | Interest cost | Interest cost | 92 | | | 167 | |
| Interest cost | |
| Interest cost | |
| | Actuarial gain | |
| Actuarial gain | |
| Actuarial gain | Actuarial gain | (582) | | | (991) | |
| | Benefits paid, net of Medicare subsidy | Benefits paid, net of Medicare subsidy | (375) | | | (405) | |
| Benefits paid, net of Medicare subsidy | |
| Benefits paid, net of Medicare subsidy | |
| Settlement | |
| Benefit Obligation at End of Year | Benefit Obligation at End of Year | $ | 4,722 | | | $ | 5,587 | |
| Change in Plan Assets | | | |
| Fair value of assets at beginning of year | $ | — | | | $ | — | |
| Employer contributions | 375 | | | 405 | |
| Benefits paid, net of Medicare subsidy | (375) | | | (405) | |
| Fair Value of Assets at End of Year | $ | — | | | $ | — | |
| | Funded Status | Funded Status | $ | (4,722) | | | $ | (5,587) | |
| | Funded Status | |
| | Funded Status | |
The change in the benefit obligation for the Company’s other postretirement plans in 2023 was primarily due to updated claims experience based on actual premium rates, the recognitionsettlement of an actuarial gain resulting from an increase to the discount rate used to measure the benefit obligation, and benefits paid during the year.
retiree life insurance obligation.The amounts recognized in the Company’s Consolidated Balance Sheets for its other postretirement plans are as follows:
| | Postretirement Plans |
| As of December 31 |
| Postretirement Plans | | | Postretirement Plans |
| As of December 31 | | | As of December 31 |
| (in thousands) | (in thousands) | 2021 | | 2020 | (in thousands) | 2023 | | 2022 |
| Current liability | Current liability | $ | (671) | | | $ | (797) | |
| Noncurrent liability | Noncurrent liability | (4,051) | | | (4,790) | |
| Recognized Liability | Recognized Liability | $ | (4,722) | | | $ | (5,587) | |
The discount rates utilized for determining the benefit obligation at December 31, 20212023 and 2020,2022, for the postretirement plans were 2.23%4.53% and 1.78%4.76%, respectively. The assumed healthcare cost trend rate used in measuring the postretirement benefit obligation at December 31, 2021,2023, was 6.17%7.50% for pre-age 65, decreasing to 4.5% in the year 2032 and thereafter. The assumed healthcare cost trend rate used in measuring the postretirement benefit obligation at December 31, 2021,2023, was 6.52%8.04% for post-age 65, decreasing to 4.5% in the year 2032 and thereafter. The assumed healthcare cost trend rate used in measuring the postretirement benefit obligation at December 31, 2021,2023, was 8.00%11.25% for Medicare Advantage, decreasing to 4.5% in the year 2032 and thereafter.
The Company made contributions to itsCompany’s postretirement benefit plans are unfunded, therefore, the Company made actual benefit payments of $0.4$0.2 million to beneficiaries for each of the years ended December 31, 20212023 and 2020. As the plans are unfunded, the Company makes contributions to its postretirement plans based on actual benefit payments.2022.
At December 31, 2021,2023, future estimated benefit payments are as follows:
| | (in thousands) | (in thousands) | Postretirement
Plans | (in thousands) | Postretirement
Plans |
| 2022 | $ | 671 | |
| 2023 | $ | 590 | |
| 2024 | 2024 | $ | 485 | |
| 2025 | 2025 | $ | 393 | |
| 2026 | 2026 | $ | 335 | |
| 2027–2031 | $ | 2,474 | |
| 2027 | |
| 2028 | |
| 2029–2033 | |
The total benefit arising from the Company’s other postretirement plans consists of the following components:
| | | | | | | | | | | | | | | | | |
| Postretirement Plans |
| Year Ended December 31 |
| (in thousands) | 2021 | | 2020 | | 2019 |
| | | | | |
| Interest cost | $ | 92 | | | $ | 167 | | | $ | 289 | |
| | | | | |
| | | | | |
| Amortization of prior service credit | (7) | | | (481) | | | (7,363) | |
| Recognized actuarial gain | (3,510) | | | (4,048) | | | (4,360) | |
| Net Periodic Benefit for the Year | (3,425) | | | (4,362) | | | (11,434) | |
| | | | | |
| Settlement | (120) | | | — | | | — | |
| Total Benefit for the Year | $ | (3,545) | | | $ | (4,362) | | | $ | (11,434) | |
| Other Changes in Benefit Obligations Recognized in Other Comprehensive Income | | | | | |
| Current year actuarial gain | $ | (582) | | | $ | (991) | | | $ | (1,246) | |
| | | | | |
| Amortization of prior service credit | 7 | | | 481 | | | 7,363 | |
| Recognized actuarial gain | 3,510 | | | 4,048 | | | 4,360 | |
| Settlement | 120 | | | — | | | — | |
| Total Recognized in Other Comprehensive Income (Before Tax Effects) | $ | 3,055 | | | $ | 3,538 | | | $ | 10,477 | |
| Total Recognized in Benefit and Other Comprehensive Income (Before Tax Effects) | $ | (490) | | | $ | (824) | | | $ | (957) | |
| | | | | | | | | | | | | | | | | |
| Postretirement Plans |
| Year Ended December 31 |
| (in thousands) | 2023 | | 2022 | | 2021 |
| | | | | |
| Interest cost | $ | 149 | | | $ | 98 | | | $ | 92 | |
| | | | | |
| | | | | |
| Amortization of prior service credit | (5) | | | (7) | | | (7) | |
| Recognized actuarial gain | (2,343) | | | (2,843) | | | (3,510) | |
| Net Periodic Benefit for the Year | (2,199) | | | (2,752) | | | (3,425) | |
| | | | | |
| Settlement | (1,087) | | | — | | | (120) | |
| Total Benefit for the Year | $ | (3,286) | | | $ | (2,752) | | | $ | (3,545) | |
| Other Changes in Benefit Obligations Recognized in Other Comprehensive Income | | | | | |
| Current year actuarial gain | $ | (414) | | | $ | (1,205) | | | $ | (582) | |
| | | | | |
| Amortization of prior service credit | 5 | | | 7 | | | 7 | |
| Recognized actuarial gain | 2,343 | | | 2,843 | | | 3,510 | |
| Settlement | 1,087 | | | — | | | 120 | |
| Total Recognized in Other Comprehensive Income (Before Tax Effects) | $ | 3,021 | | | $ | 1,645 | | | $ | 3,055 | |
| Total Recognized in Benefit and Other Comprehensive Income (Before Tax Effects) | $ | (265) | | | $ | (1,107) | | | $ | (490) | |
The costs for the Company’s postretirement plans are actuarially determined. The discount rate utilized to determine the periodic cost for the years ended December 31, 2023, 2022 and 2021 2020was 4.76%, 2.23% and 2019 were 1.78%, 2.68% and 3.69%. AOCI included the following components of unrecognized net periodic benefit for the postretirement plans:
| | As of December 31 |
| As of December 31 | | | As of December 31 |
| (in thousands) | (in thousands) | 2021 | | 2020 | (in thousands) | 2023 | | 2022 |
| Unrecognized actuarial gain | Unrecognized actuarial gain | $ | (13,642) | | | $ | (16,690) | |
| Unrecognized prior service credit | Unrecognized prior service credit | (12) | | | (19) | |
| Gross Amount | Gross Amount | (13,654) | | | (16,709) | |
| Deferred tax liability | Deferred tax liability | 3,724 | | | 4,512 | |
| Net Amount | Net Amount | $ | (9,930) | | | $ | (12,197) | |
Multiemployer Pension Plans. In 2021, 20202023, 2022 and 2019,2021, the Company contributed to 1one multiemployer defined benefit pension plan under the terms of a collective-bargaining agreement that covered certain union-represented employees. The Company’s total contributions to the multiemployer pension plan amounted to $0.1 million in each year for 2021, 20202023, 2022 and 2019.2021.
Savings Plans. The Company recorded expense associated with retirement benefits provided under incentive savings plans (primarily 401(k) plans) of approximately $13.0 million in 2023, $11.6 million in 2022 and $10.9 million in 2021, $8.8 million in 2020 and $9.8 million in 2019.2021.
16. OTHER NON-OPERATING INCOME
A summary of non-operating income is as follows:
| | Year Ended December 31 | | | Year Ended December 31 |
| (in thousands) | | (in thousands) | 2023 | | 2022 | | 2021 |
| Net gain on sale of businesses | |
| Net gain on cost method investments | |
| Foreign currency loss, net | |
| Gain on sale of cost method investments | |
| Impairment of cost method investments | |
| | Year Ended December 31 |
| (in thousands) | 2021 | | 2020 | | 2019 |
| Net gain on cost method investments | $ | 11,756 | | | $ | 4,209 | | | $ | 5,080 | |
| Gain on sale of cost method investments | 9,355 | | | 1,039 | | | 267 | |
| Net gain (loss) on sale of businesses | 3,789 | | | 213,302 | | | (564) | |
| Foreign currency loss, net | (179) | | | (2,153) | | | (1,070) | |
| Impairment of cost method investments | — | | | (7,327) | | | — | |
| Gain on acquiring a controlling interest in an equity affiliate | — | | | 3,708 | | | — | |
| Gain on sale of equity affiliates | — | | | 1,370 | | | 28,994 | |
| Gain on sale of investment in affiliates | |
| Gain on sale of investment in affiliates | |
| Gain on sale of investment in affiliates | |
| | Other, net | Other, net | 7,833 | | | 386 | | | (276) | |
| | Other, net | |
| | Other, net | |
| Total Other Non-Operating Income | Total Other Non-Operating Income | $ | 32,554 | | | $ | 214,534 | | | $ | 32,431 | |
The gainsgain on cost method investments result from observable price changes in the fair value of the underlying equity securities accounted for under the cost method (see Notes 4 and 12).
For the years ended December 31, 2021, 20202023, 2022 and 2019,2021, the Company recorded contingent consideration gains of $3.9$5.6 million, $3.5$4.3 million and $1.4$3.9 million, respectively, related to the disposition of Kaplan University (KU) in 2018.
In the second quarter of 2020,2023, the Company made an additional investment in Framebridgerecorded a $10.0 million gain related to the Pinna transaction (see Notes 3 and 4) that resulted in the Company obtaining control of the investee.. The Company remeasured its previously held equity interest in Framebridge at the acquisition-date fair value and recorded a gain of $3.7 million. The fair value was determined usingused a market approach by usingto determine the sharefair value indicatedof the noncontrolling financial interest received in Realm in exchange for the transaction.Pinna business.
In the fourth quarter of 2020,2022, the Company recorded a $209.8an $18.4 million gain onrelated to the sale of Megaphone.
InCyberVista transaction (see Notes 3 and 4). The Company used a market approach to determine the first quarter of 2019, the Company recorded a $29.0 million gain on the salefair value of the Company’snoncontrolling financial interest retained in CyberVista through its interest in Gimlet Media.N2K Networks.
17. ACCUMULATED OTHER COMPREHENSIVE INCOME (LOSS)
The other comprehensive income (loss) consists of the following components:
| | Year Ended December 31, 2023 | | | Year Ended December 31, 2023 |
| Before-Tax | | | Before-Tax | | Income | | After-Tax |
| (in thousands) | | (in thousands) | Amount | | Tax | | Amount |
| Foreign currency translation adjustments: | |
| | | Year Ended December 31, 2021 |
| Translation adjustments arising during the year | |
| | Before-Tax | | Income | | After-Tax |
| (in thousands) | Amount | | Tax | | Amount |
| Foreign currency translation adjustments: | |
| | Translation adjustments arising during the year | |
| | Translation adjustments arising during the year | Translation adjustments arising during the year | $ | (16,052) | | | $ | — | | | $ | (16,052) | |
| | Pension and other postretirement plans: | Pension and other postretirement plans: | |
| | Pension and other postretirement plans: | |
| | Pension and other postretirement plans: | |
| Actuarial gain | Actuarial gain | 519,595 | | | (133,915) | | | 385,680 | |
| Prior service cost | (2) | | | 1 | | | (1) | |
| Actuarial gain | |
| Actuarial gain | |
| Prior service credit | |
| Amortization of net actuarial gain included in net income | Amortization of net actuarial gain included in net income | (5,486) | | | 1,414 | | | (4,072) | |
| Amortization of net prior service cost included in net income | Amortization of net prior service cost included in net income | 3,170 | | | (817) | | | 2,353 | |
| | Settlement included in net income | |
| Settlement included in net income | |
| Settlement included in net income | Settlement included in net income | (120) | | | 30 | | | (90) | |
| | | 517,157 | | | (133,287) | | | 383,870 | |
| Cash flow hedge: | |
| Gain for the year | 349 | | | (93) | | | 256 | |
| 350,264 | |
| | 350,264 | |
| | 350,264 | |
| Cash flow hedges: | |
| Loss for the year | |
| Loss for the year | |
| Loss for the year | |
| Other Comprehensive Income | Other Comprehensive Income | $ | 501,454 | | | $ | (133,380) | | | $ | 368,074 | |
| | Year Ended December 31, 2022 | | | Year Ended December 31, 2022 |
| Before-Tax | | | Before-Tax | | Income | | After-Tax |
| (in thousands) | | (in thousands) | Amount | | Tax | | Amount |
| Foreign currency translation adjustments: | |
| | | Year Ended December 31, 2020 |
| Translation adjustments arising during the year | |
| | Before-Tax | | Income | | After-Tax |
| (in thousands) | Amount | | Tax | | Amount |
| Foreign currency translation adjustments: | |
| | Translation adjustments arising during the year | |
| | Translation adjustments arising during the year | Translation adjustments arising during the year | $ | 31,642 | | | $ | — | | | $ | 31,642 | |
| | Pension and other postretirement plans: | Pension and other postretirement plans: | |
| Actuarial gain | 365,164 | | | (98,594) | | | 266,570 | |
| Prior service cost | (69) | | | 19 | | | (50) | |
| Amortization of net actuarial loss included in net income | 1,219 | | | (329) | | | 890 | |
| | Pension and other postretirement plans: | |
| | Pension and other postretirement plans: | |
| Actuarial loss | |
| Actuarial loss | |
| Actuarial loss | |
| | Amortization of net actuarial gain included in net income | |
| Amortization of net actuarial gain included in net income | |
| Amortization of net actuarial gain included in net income | |
| Amortization of net prior service cost included in net income | Amortization of net prior service cost included in net income | 2,680 | | | (724) | | | 1,956 | |
| | (795,066) | |
| | 368,994 | | | (99,628) | | | 269,366 | |
| | (795,066) | |
| | (795,066) | |
| Cash flow hedges: | Cash flow hedges: | |
| Loss for the year | (1,282) | | | 293 | | | (989) | |
| Other Comprehensive Income | $ | 399,354 | | | $ | (99,335) | | | $ | 300,019 | |
| Gain for the year | |
| Gain for the year | |
| Gain for the year | |
| Other Comprehensive Loss | |
| | Year Ended December 31, 2021 | | | Year Ended December 31, 2021 |
| Before-Tax | | | Before-Tax | | Income | | After-Tax |
| (in thousands) | | (in thousands) | Amount | | Tax | | Amount |
| Foreign currency translation adjustments: | |
| | | Year Ended December 31, 2019 |
| Translation adjustments arising during the year | |
| | Before-Tax | | Income | | After-Tax |
| (in thousands) | Amount | | Tax | | Amount |
| Foreign currency translation adjustments: | |
| | Translation adjustments arising during the year | Translation adjustments arising during the year | $ | 5,371 | | | $ | — | | | $ | 5,371 | |
| Adjustment for sale of a business with foreign operations | 2,011 | | | — | | | 2,011 | |
| | 7,382 | | | — | | | 7,382 | |
| | Translation adjustments arising during the year | |
| Pension and other postretirement plans: | Pension and other postretirement plans: | |
| Actuarial gain | |
| Actuarial gain | |
| Actuarial gain | Actuarial gain | 231,104 | | | (62,398) | | | 168,706 | |
| Prior service cost | Prior service cost | (5,725) | | | 1,546 | | | (4,179) | |
| Amortization of net actuarial gain included in net income | Amortization of net actuarial gain included in net income | (2,046) | | | 552 | | | (1,494) | |
| Amortization of net prior service credit included in net income | (4,142) | | | 1,118 | | | (3,024) | |
| Amortization of net prior service cost included in net income | |
| | Settlement included in net income | Settlement included in net income | (91,676) | | | 24,752 | | | (66,924) | |
| | 127,515 | | | (34,430) | | | 93,085 | |
| Cash flow hedges: | |
| Loss for the year | (1,344) | | | 343 | | | (1,001) | |
| Settlement included in net income | |
| | Settlement included in net income | |
| 517,157 | |
| Cash flow hedge: | |
| Gain for the year | |
| Gain for the year | |
| Gain for the year | |
| Other Comprehensive Income | Other Comprehensive Income | $ | 133,553 | | | $ | (34,087) | | | $ | 99,466 | |
The accumulated balances related to each component of other comprehensive income (loss) are as follows:
| | (in thousands, net of taxes) | (in thousands, net of taxes) | Cumulative
Foreign
Currency
Translation
Adjustment | | Unrealized Gain
on Pensions
and Other
Postretirement
Plans | | Cash Flow
Hedges | | Accumulated
Other
Comprehensive
Income | (in thousands, net of taxes) | Cumulative
Foreign
Currency
Translation
Adjustment | | Unrealized Gain
on Pensions
and Other
Postretirement
Plans | | Cash Flow
Hedges | | Accumulated
Other
Comprehensive
Income |
| As of December 31, 2019 | $ | (21,888) | | | $ | 325,921 | | | $ | (738) | | | $ | 303,295 | |
| As of December 31, 2021 | |
| Other comprehensive income (loss) before reclassifications | Other comprehensive income (loss) before reclassifications | 31,642 | | | 266,520 | | | (1,476) | | | 296,686 | |
| Net amount reclassified from accumulated other comprehensive income | Net amount reclassified from accumulated other comprehensive income | — | | | 2,846 | | | 487 | | | 3,333 | |
| Net other comprehensive income (loss) | Net other comprehensive income (loss) | 31,642 | | | 269,366 | | | (989) | | | 300,019 | |
| | As of December 31, 2020 | 9,754 | | | 595,287 | | | (1,727) | | | 603,314 | |
| As of December 31, 2022 | |
| As of December 31, 2022 | |
| As of December 31, 2022 | |
| | Other comprehensive income (loss) before reclassifications | (16,052) | | | 385,679 | | | (375) | | | 369,252 | |
| Other comprehensive income before reclassifications | |
| Other comprehensive income before reclassifications | |
| Other comprehensive income before reclassifications | |
| Net amount reclassified from accumulated other comprehensive income | Net amount reclassified from accumulated other comprehensive income | — | | | (1,809) | | | 631 | | | (1,178) | |
| Net other comprehensive income (loss) | Net other comprehensive income (loss) | (16,052) | | | 383,870 | | | 256 | | | 368,074 | |
| | As of December 31, 2021 | $ | (6,298) | | | $ | 979,157 | | | $ | (1,471) | | | $ | 971,388 | |
| As of December 31, 2023 | |
| As of December 31, 2023 | |
| As of December 31, 2023 | |
The amounts and line items of reclassifications out of Accumulated Other Comprehensive Income (Loss) are as follows:
| | Year Ended December 31 | | | Year Ended December 31 | | Affected Line Item in the Consolidated Statements of Operations |
| (in thousands) | |
| | | Year Ended December 31 | | Affected Line Item in the Consolidated Statements of Operations |
| (in thousands) | 2021 | | 2020 | | 2019 | |
| Foreign Currency Translation Adjustments: | |
| Adjustment for sales of businesses with foreign operations | $ | — | | | $ | — | | | $ | 2,011 | | | Other income, net |
| | Pension and Other Postretirement Plans: | Pension and Other Postretirement Plans: | |
| | Amortization of net actuarial (gain) loss | (5,486) | | | 1,219 | | | (2,046) | | | (1) |
| Amortization of net prior service cost (credit) | 3,170 | | | 2,680 | | | (4,142) | | | (1) |
| | Settlement gains | (120) | | | — | | | (91,676) | | | (1) |
| | Pension and Other Postretirement Plans: | |
| | | (2,436) | | | 3,899 | | | (97,864) | | | Before tax |
| | 627 | | | (1,053) | | | 26,422 | | | Provision for income taxes |
| | (1,809) | | | 2,846 | | | (71,442) | | | Net of tax |
| | Pension and Other Postretirement Plans: | |
| | Amortization of net actuarial gain | |
| | Amortization of net actuarial gain | |
| | Amortization of net actuarial gain | | $ | (42,146) | | | $ | (70,833) | | | $ | (5,486) | | | (1) |
| Amortization of net prior service cost | | Amortization of net prior service cost | 1,641 | | | 2,864 | | | 3,170 | | | (1) |
| | Settlement gains | |
| Settlement gains | |
| Settlement gains | | (1,087) | | | — | | | (120) | | | (1) |
| | (41,592) | |
| | (41,592) | |
| | (41,592) | | | | (67,969) | | | (2,436) | | | Before tax |
| 10,649 | | | 10,649 | | | 17,482 | | | 627 | | | Provision for income taxes |
| (30,943) | | | (30,943) | | | (50,487) | | | (1,809) | | | Net of tax |
| | Cash Flow Hedges | |
| Cash Flow Hedges | |
| Cash Flow Hedges | Cash Flow Hedges | | | (5,363) | | | 393 | | 393 | | | 631 | | 631 | | | Interest expense | | Interest expense |
| | 631 | | | 474 | | | (146) | | | Interest expense |
| | — | | | 13 | | | 51 | | | Provision for income taxes |
| Total reclassification for the year | |
| | 631 | | | 487 | | | (95) | | | Net of tax |
| Total reclassification for the year | Total reclassification for the year | $ | (1,178) | | | $ | 3,333 | | | $ | (69,526) | | | Net of tax |
| | Total reclassification for the year | | $ | (36,306) | | | $ | (50,094) | | | $ | (1,178) | | | Net of tax |
____________
(1) These accumulated other comprehensive income components are included in the computation of net periodic pension and postretirement plan cost (see Note 15) and are included in non-operating pension and postretirement benefit income in the Company’s Consolidated Statements of Operations.
18. CONTINGENCIES AND OTHER COMMITMENTS
Litigation, Legal and Other Matters. The Company and its subsidiaries are subject to complaints and administrative proceedings and are defendants in various civil lawsuits that have arisen in the ordinary course of their businesses, including contract disputes; actions alleging negligence, libel, defamation and invasion of privacy; trademark, copyright and patent infringement; real estate lease and sublease disputes; violations of employment laws and applicable wage and hour laws; and statutory or common law claims involving current and former students and employees. Although the outcomes of the legal claims and proceedings against the Company cannot be predicted with certainty, based on currently available information, management believes that there are no existing claims or proceedings that are likely to have a material effect on the Company’s business, financial condition, results of operations or cash flows. However, based on currently available information, management believes it is reasonably possible that future losses from existing and threatened legal, regulatory and other proceedings in excess of the amounts recorded could reach approximately $15$10 million.
In 2015, Kaplan sold substantially all of the assets of the KHEC business to Education Corporation of America. In 2018, certain subsidiaries of Kaplan contributed the institutional assets and operations of KU to a new university: an Indiana nonprofit, public-benefit corporation affiliated with Purdue University, known as Purdue University Global. Kaplan could be held liable to the current owners of KU and the KHEC schools related to the pre-sale conduct of the schools, and the pre-sale conduct of the schools has been and could be the subject of future compliance reviews, regulatory proceedings or lawsuits that could result in monetary liabilities or fines or other sanctions. On May 6, 2021, Kaplan received a notice from the Department of Education (ED)ED that it would be conducting a fact-finding
process pursuant to the borrower defense to repayment (BDTR) regulations to determine the validity of more than 800 BDTR claims and a request for documents related to several of Kaplan’s previously owned schools. Beginning in JulyIn 2021, Kaplan started receiving the claims and related information requests. In total, Kaplan received 1,449 borrower defense applications that seekfrom the ED seeking discharge of approximately $35 million in loans. Most claims received areloans, excluding interest, from former KUKaplan University students. The ED’s process for adjudicating these claims is subject to the borrower defense regulations but itIt is not clear to what extent the ED will exclude claims based on the underlying statutes of limitations, evidence provided by Kaplan, prior settlements with these students relieving their debt outside of the BDTR process, or any prior investigation related to schools attended by the student applicants. The ED’s process for adjudicating these claims is subject to the borrower defense regulations including those finalized in 2022 and effective July 1, 2023. Compared to the previous rule, the new rule in part, expands actions that can give rise to claims for discharge; provides that the borrower’s claim will be presumed true if the institution does not provide any responsive evidence; provides an easier process for group claims; and relies on current program review penalty hearing processes for discharge recoupment. Under the rule, the recoupment process applies only to loans first
disbursed after July 1, 2023; however, the discharge process and standards apply to any pending application regardless of the loan date.
Kaplan believes it has substantive as well as procedural defenses to the borrower defense claims that would bar any student discharge or school liability including that the claims are barred by the applicable statute of limitations, are unproven, incomplete and fail to meet regulatory filing requirements. Kaplan expects to vigorously defend any attempt by the ED to hold Kaplan liable for any ultimate student discharges and is respondingdischarges. Kaplan responded to allthe initial set of claims in 2021 with documentary and narrative evidence to refute the allegations, demonstrate their lack of merit, and support the denial of all such claims by the ED. Kaplan intends to similarly respond to any new claims that apply to Kaplan University or prior Kaplan-owned schools. If the claims are successful, the ED may seek reimbursement for the amount discharged from Kaplan. If the ED initiates a reimbursement action against Kaplan following approval of former students’ BDTR applications, Kaplan may be subject to significant liability.
As part of the Sweet v. Cardona settlement described below, the ED agreed to review any borrower defense applications submitted between June 23, 2022, and November 15, 2022 on an expedited basis. In January 2024, Kaplan was informed that the ED received applications during this time period regarding former Kaplan University and Purdue Global students and Kaplan has begun to receive them. Unknown at this time is the total discharge amount sought or how much of that amount would apply to Kaplan University students. The Sweet v. Cardona settlement requires the ED to adjudicate applications received during the designated time period pursuant to the requirements of the 2016 Borrower Defense Regulation. To the extent these applications apply to Kaplan University, Kaplan anticipates that it will have defenses similar to those described above. As noted, if the claims are successful, the ED may seek reimbursement for the amount discharged from Kaplan. If the ED initiates a reimbursement action against Kaplan following approval of additional former students’ borrower defense to repayment applications, Kaplan may be subject to significant liability.
In November 2022 the Northern District of California approved the settlement agreement in the lawsuit Sweet v. Cardona. The Plaintiffs in that lawsuit claimed that the ED failed to properly consider and decide pending BDTR claims. As part of the settlement, the ED agreed to discharge loans of borrowers who attended 150 specific schools, including all schools formerly owned by Kaplan, and who had BDTR claims pending as of the June 2021,22, 2022 settlement execution date. This discharge will likely cover each of the Committee for Private Education (CPE) in Singapore instructedfirst set of applications the ED sent to Kaplan Singapore to cease new enrollments for 3 marketing diploma programs on both a full and part-time basis due to noncompliance with minimum entry level requirements for admission and to teach out existing students inwhich Kaplan previously responded. The ED and the Court made clear that these programs. On August 23, 2021,discharges as part of a settlement are not determinations that the CPE issuedpending BDTR claims are valid and the same instructions with respectfact of the settlement discharge cannot be used as evidence of any determination of wrongdoing by the institutions. However, despite the fact that the loans are discharged per the settlement, the ED may still attempt to separately adjudicate the associated BDTR claims and follow the regulatory process for seeking recoupment from the institutions for such claims. As noted above, this settlement likely also applies to the resolution, future adjudication, and possible discharge of the newly noticed claims. As also noted, the ED could attempt to recoup from Kaplan Foundation diploma and 4 information technology diploma programs on both a full and part-time basis. some or all of any discharged amount for the newly noticed claims.
In November 2021,August 2018, Purdue University Global received an updated Provisional Program Participation Agreement (PPPA) from the CPE issued the same instructions with respect to a further 23 full-time or part-time diploma programs. Post regulatory action, Kaplan SingaporeED which is currently still able to offer 449 programs that are registered with the CPE, out of which there are 16 diplomas, 361 bachelors and the balance of which are certificate and postgraduate courses. Kaplan Singapore will applynecessary for re-registration of diploma programs in 2022. The impact from regulatory actions by the CPE will have a significant adverse impact on Kaplan Singapore’s revenues, operating results and cash flowscontinued participation in the future. No assurance can be givenfederal Title IV programs after the change in ownership from Kaplan to Purdue. The PPPA expired on June 30, 2021 but was extended to June 30, 2022. In August 2022, Purdue University Global received an extended PPPA that applications for re-registrationis effective through June 30, 2024. Under the extended PPPA, among other restrictions, Purdue University Global must also report information related to known governmental investigations and student complaints on a quarterly basis to the ED. The provisional certification ends upon the ED’s notification to the institution of the impacted programs will be successful. An inabilityED’s decision to re-register onegrant or more impacted programs could havedeny a further material adverse effect on Kaplan Singapore’s revenues, operating results and cash flows.six-year certification to participate in the Title IV, Higher Education Act programs.
Other Commitments. The Company’s broadcast subsidiaries are parties to certain agreements that commit them to purchase programming to be produced in future years. At December 31, 2021,2023, such commitments amounted to approximately $14.2$12.6 million. If such programs are not produced, the Company’s commitment would expire without obligation.
19. BUSINESS SEGMENTS
Basis of Presentation. The Company’s organizational structure is based on a number of factors that management uses to evaluate, view and run its business operations, which include, but are not limited to, customers, the nature of products and services and use of resources. The business segments disclosed in the Consolidated Financial Statements are based on this organizational structure and information reviewed by the Company’s management to evaluate the business segment results.
To meetIn the quantitative threshold related to revenue required for separate disclosure, the Company changed the presentation of its segments in the thirdsecond quarter of 2021 into2023, Kaplan modified its segment reporting for Kaplan India, a shared services center that supports Higher Education. Kaplan India was previously included in Kaplan corporate and other. Certain amounts in previously issued financial statements have been reclassified to conform to the following 7current presentation.
The Company has seven reportable segments: Kaplan International, Kaplan Higher Education, Kaplan Supplemental Education, Television Broadcasting, Manufacturing, Healthcare and Automotive. Segment operating results have been restated to reflect this change.
The Company evaluates segment performance based on operating income before amortization of intangible assets and impairment of goodwill and other long-lived assets. The accounting policies at the segments are the same as described in Note 2. In computing operating income before amortization by segment, the effects of amortization of intangible assets, impairment of goodwill and other long-lived assets, equity in earnings (losses) of affiliates, interest income, interest expense, non-operating pension and postretirement benefit income, other non-operating income and expense items and income taxes are excluded. Intersegment sales are not material.
Identifiable assets by segment are those assets used in the Company’s operations in each business segment. The investments in marketable equity securities and affiliates, and prepaid pension cost are not included in identifiable assets by segment. Investments in marketable equity securities are discussed in Note 4.
Education. Education products and services are provided by Kaplan, Inc. Kaplan International includes professional training and postsecondary education businesses largely outside the U.S., as well as English-language programs. KHE includes the results as a service provider to higher education institutions. Supplemental Education includes Kaplan’s standardized test preparation, domestic professional and other continuing education businesses.
As of December 31, 2021,2023, Kaplan had a total outstanding accounts receivable balance of $97.4$98.2 million from Purdue Global related to amounts due for reimbursements for services, fees earned and a deferred fee. Included in this
total, Kaplan has a $19.2$19.6 million long-term receivable balance due from Purdue Global at December 31, 2021,2023, related to the advance of $20.0 million during the initial KU Transaction.
Television Broadcasting. Television broadcasting operations are conducted through 7seven television stations serving the Detroit, Houston, San Antonio, Orlando, Jacksonville and Roanoke television markets. All stations are network-affiliated (except for WJXT in Jacksonville), with revenues derived primarily from sales of advertising time. In addition, the stations generate revenue from retransmission consent agreements for the right to carry their signals.
Manufacturing. Manufacturing operations include Hoover, a Thomson, GA-based supplier of pressure impregnated kiln-dried lumber and plywood products for fire retardant and preservative application; Dekko, a Garrett, IN-based manufacturer of electrical workspace solutions, architectural lighting, and electrical components and assemblies; Joyce/Dayton Corp., a Dayton, OH-based manufacturer of screw jacks and other linear motion systems; and Forney, a global supplier of products and systems that control and monitor combustion processes in electric utility and industrial applications.
Healthcare. Graham Healthcare Group provides home health, hospice and palliative services. GHG also provides other healthcare services, including nursing care and prescription services for patients receiving in-home infusion treatments.treatments, ABA therapy clinics, physician services for allergy, asthma and immunology patients, in-home aesthetics and healthcare software-as-a-service technology.
Automotive. Automotive includes 4 eight automotive dealerships in the Washington, D.C. metropolitan area and Richmond, VA, including Lexus of Rockville, Honda of Tysons Corner, Jeep of Bethesda, and Ford of Manassas,Manassas, which was acquired in December 2021.2021, Toyota of Woodbridge and Chrysler-Dodge-Jeep-Ram of Woodbridge, which were acquired in July 2022, and Toyota of Richmond, which was acquired in September 2023. The automotive group was awarded a Kia Open Point dealership in Bethesda, MD, which commenced operations at the end of December 2023. For the years ended December 2023, 2022 and 2021, the automotive group recorded expense of $7.3 million, $5.7 million and $3.6 million, respectively, for operating and management services provided by Christopher J. Ourisman and his team of industry professionals.
Other Businesses. Other businesses includes the following:
•Leaf Group, a consumer internet company, which was acquired in June 2021. In the second quarter of 2023, the Company restructured Leaf into three stand-alone businesses:
◦Society6 (formerly included in Leaf Marketplace), an online art and design marketplace.
◦Saatchi Art (formerly included in Leaf Marketplace), an online art gallery.
◦WGB (formerly Leaf Media), which consists of a diverse portfolio of media properties that educate and inform consumers across a wide variety of life topics.
•Clyde’s Restaurant Group owns and operates 1112 restaurants and entertainment venues in the Washington, D.C. metropolitan area.
•Framebridge, a custom framing service company.
•Code3, is a marketing and insights company that manages digital advertising campaigns.
•Framebridge, a custom framing service company, which was acquired in May 2020.
•Thecampaigns; the Slate Group and Foreign Policy Group, which publish online and print magazines and websites; and fourtwo investment stage businesses, CyberVista, Decile Pinna and City Cast. Other businesses also includes Megaphone,CyberVista, which was soldmerged with another entity in December 2020.October 2022 resulting in the deconsolidation of the subsidiary and Pinna, which merged with another entity in June 2023 resulting in the deconsolidation of the subsidiary.
Corporate Office. Corporate office includes the expenses of the Company’s corporate office, defined benefit pension expense, and certain continuing obligations related to prior business dispositions.
Geographical Information. The Company’s non-U.S. revenues in 2021, 20202023, 2022 and 20192021 totaled approximately $709930 million, $642$776 million and $691$709 million, respectively, primarily from Kaplan’s operations outside the U.S. Additionally, revenues in 2021, 20202023, 2022 and 20192021 totaled approximately $404$543 million $375, $448 million, and $384$404 million, respectively, from Kaplan’s operations in the U.K. The Company’s long-lived assets in non-U.S. countries (excluding goodwill and other intangible assets), totaled approximately $476$492 million and $442$477 million at December 31, 20212023 and 2020,2022, respectively.
Restructuring. During 2020,Kaplan developed and implemented a number of initiatives across its businesses to help mitigate the negative revenue impact arising from COVID-19 and to re-align its program offerings to better pursue opportunities from the disruption. These initiatives include employee salary and work-hour reductions; temporary furlough and other employee reductions; reduced discretionary spending; facility restructuring to reduce its classroom and office facilities; reduced capital expenditures; and accelerated development and promotion of various online programs and solutions.
In 2020, Kaplan recorded restructuring costs related to severance, the exit of classroom and office facilities, and approved Separation Incentive Programs that reduced the number of employees at all of Kaplan’s divisions.
In 2020, Code3 and Decile recorded restructuring costs in connection with a restructuring plan that included the exit of an office facility, an approved Separation Incentive Program to reduce the number of employees, and other cost reduction initiatives to mitigate the adverse impact of COVID-19 on advertising demand.
Restructuring related costs across all businesses in 2020 were recorded as follows:
| | | | | | | | | | | | | | | | | | | | | | | | | |
| (in thousands) | Kaplan International | Higher Education | | | Supplemental Education | Kaplan Corporate | Total Education | Other Businesses | Total |
| Severance | $ | 4,366 | | $ | — | | | | $ | 1,797 | | $ | — | | $ | 6,163 | | $ | — | | $ | 6,163 | |
| Facility related costs: | | | | | | | | | |
| Operating lease cost | 2,905 | | 3,451 | | | | 3,586 | | — | | 9,942 | | — | | 9,942 | |
| Accelerated depreciation of property, plant and equipment | 1,620 | | 152 | | | | 1,801 | | — | | 3,573 | | — | | 3,573 | |
Total Restructuring Costs Included in Segment Income (Loss) from Operations (1) | $ | 8,891 | | $ | 3,603 | | | | $ | 7,184 | | $ | — | | $ | 19,678 | | $ | — | | $ | 19,678 | |
| Impairment of other long-lived assets: | | | | | | | | | |
| Lease right-of-use assets | $ | 3,976 | | $ | 2,062 | | | | $ | 4,005 | | $ | — | | $ | 10,043 | | $ | 1,405 | | $ | 11,448 | |
| Property, plant and equipment | 1,248 | | 174 | | | | 813 | | — | | 2,235 | | 86 | | 2,321 | |
| Non-operating pension and postretirement benefit income, net | 1,100 | | 2,233 | | | | 8,566 | | 883 | | 12,782 | | 999 | | 13,781 | |
| Total Restructuring Related Costs | $ | 15,215 | | $ | 8,072 | | | | $ | 20,568 | | $ | 883 | | $ | 44,738 | | $ | 2,490 | | $ | 47,228 | |
(1) These amounts are included in the segments’ Income (Loss) from Operations before Amortization of Intangible Assets and Impairment of Goodwill and Other Long-Lived Assets.
Total accrued restructuring costs at Kaplan were $1.2 million and $4.7 million as of December 31, 2021 and 2020, respectively.
In June 2020, CRG made the decision to close its restaurant and entertainment venue in Columbia, MD effective July 19, 2020 and recorded accelerated depreciation of property, plant and equipment totaling $5.7 million for the year ended December 31, 2020.
Company information broken down by operating segment and education division:
| | Year Ended December 31 |
| Year Ended December 31 | | | Year Ended December 31 |
| (in thousands) | (in thousands) | 2021 | | 2020 | | 2019 | (in thousands) | 2023 | | 2022 | | 2021 |
| Operating Revenues | Operating Revenues | | | | | | Operating Revenues | | | |
| Education | Education | $ | 1,361,245 | | | $ | 1,305,713 | | | $ | 1,451,750 | |
| Television broadcasting | Television broadcasting | 494,177 | | | 525,212 | | | 463,464 | |
| Manufacturing | Manufacturing | 458,125 | | | 416,137 | | | 449,053 | |
| Healthcare | Healthcare | 223,030 | | | 198,196 | | | 161,768 | |
| Automotive | Automotive | 327,069 | | | 258,144 | | | 236,319 | |
| Other businesses | Other businesses | 324,353 | | | 187,347 | | | 170,412 | |
| Corporate office | Corporate office | — | | | — | | | — | |
| Intersegment elimination | Intersegment elimination | (2,025) | | | (1,628) | | | (667) | |
| | | $ | 3,185,974 | | | $ | 2,889,121 | | | $ | 2,932,099 | |
| Income (Loss) from Operations before Amortization of Intangible Assets and Impairment of Goodwill and Other Long-Lived Assets | Income (Loss) from Operations before Amortization of Intangible Assets and Impairment of Goodwill and Other Long-Lived Assets | |
| Education | Education | $ | 69,892 | | | $ | 41,056 | | | $ | 63,680 | |
| Education | |
| Education | |
| Television broadcasting | Television broadcasting | 154,862 | | | 199,938 | | | 166,076 | |
| Manufacturing | Manufacturing | 36,926 | | | 40,427 | | | 46,809 | |
| Healthcare | Healthcare | 29,912 | | | 30,327 | | | 14,319 | |
| Automotive | Automotive | 11,771 | | | 502 | | | 531 | |
| Other businesses | Other businesses | (76,153) | | | (72,915) | | | (33,317) | |
| Corporate office | Corporate office | (59,025) | | | (51,978) | | | (51,157) | |
| $ | 168,185 | | | $ | 187,357 | | | $ | 206,941 | |
| $ | |
| Amortization of Intangible Assets and Impairment of Goodwill and Other Long-Lived Assets | Amortization of Intangible Assets and Impairment of Goodwill and Other Long-Lived Assets | |
| Education | |
| Education | |
| Education | Education | $ | 19,319 | | | $ | 29,452 | | | $ | 15,608 | |
| Television broadcasting | Television broadcasting | 5,440 | | | 5,440 | | | 13,408 | |
| Manufacturing | Manufacturing | 52,974 | | | 28,099 | | | 26,342 | |
| Healthcare | Healthcare | 3,106 | | | 4,220 | | | 6,411 | |
| Automotive | Automotive | — | | | 6,698 | | | — | |
| Other businesses | Other businesses | 9,971 | | | 13,041 | | | 626 | |
| Corporate office | Corporate office | — | | | — | | | — | |
| | | $ | 90,810 | | | $ | 86,950 | | | $ | 62,395 | |
| Income (Loss) from Operations | Income (Loss) from Operations | |
| Education | Education | $ | 50,573 | | | $ | 11,604 | | | $ | 48,072 | |
| Education | |
| Education | |
| Television broadcasting | Television broadcasting | 149,422 | | | 194,498 | | | 152,668 | |
| Manufacturing | Manufacturing | (16,048) | | | 12,328 | | | 20,467 | |
| Healthcare | Healthcare | 26,806 | | | 26,107 | | | 7,908 | |
| Automotive | Automotive | 11,771 | | | (6,196) | | | 531 | |
| Other businesses | Other businesses | (86,124) | | | (85,956) | | | (33,943) | |
| Corporate office | Corporate office | (59,025) | | | (51,978) | | | (51,157) | |
| | | $ | 77,375 | | | $ | 100,407 | | | $ | 144,546 | |
| Equity in Earnings of Affiliates, Net | 17,914 | | | 6,664 | | | 11,664 | |
| Equity in (Losses) Earnings of Affiliates, Net | |
| Interest Expense, Net | Interest Expense, Net | (30,534) | | | (34,439) | | | (23,628) | |
| Non-Operating Pension and Postretirement Benefit Income, Net | Non-Operating Pension and Postretirement Benefit Income, Net | 109,230 | | | 59,315 | | | 162,798 | |
| Gain on Marketable Equity Securities, net | 243,088 | | | 60,787 | | | 98,668 | |
| Gain (Loss) on Marketable Equity Securities, net | |
| Other Income, Net | Other Income, Net | 32,554 | | | 214,534 | | | 32,431 | |
| Income Before Income Taxes | Income Before Income Taxes | $ | 449,627 | | | $ | 407,268 | | | $ | 426,479 | |
|
| | Year Ended December 31 |
| Year Ended December 31 | | | Year Ended December 31 |
| (in thousands) | (in thousands) | 2021 | | 2020 | | 2019 | (in thousands) | 2023 | | 2022 | | 2021 |
| Depreciation of Property, Plant and Equipment | Depreciation of Property, Plant and Equipment | | | | | | Depreciation of Property, Plant and Equipment | | | |
| Education | Education | $ | 32,113 | | | $ | 31,759 | | | $ | 25,655 | |
| Television broadcasting | Television broadcasting | 14,018 | | | 13,830 | | | 12,817 | |
| Manufacturing | Manufacturing | 9,808 | | | 10,333 | | | 10,036 | |
| Healthcare | Healthcare | 1,313 | | | 1,665 | | | 2,314 | |
| Automotive | Automotive | 2,156 | | | 2,017 | | | 2,180 | |
| Other businesses | Other businesses | 11,376 | | | 13,947 | | | 5,376 | |
| Corporate office | Corporate office | 631 | | | 706 | | | 875 | |
| | | $ | 71,415 | | | $ | 74,257 | | | $ | 59,253 | |
| Pension Service Cost | Pension Service Cost | | | | | | Pension Service Cost | | | |
| Education | Education | $ | 9,357 | | | $ | 10,024 | | | $ | 10,385 | |
| Television broadcasting | Television broadcasting | 3,575 | | | 3,263 | | | 3,025 | |
| Manufacturing | Manufacturing | 1,282 | | | 1,424 | | | 80 | |
| Healthcare | Healthcare | 561 | | | 543 | | | 492 | |
| Automotive | Automotive | — | | | — | | | — | |
| Other businesses | Other businesses | 1,755 | | | 1,698 | | | 1,640 | |
| Corporate office | Corporate office | 6,461 | | | 5,704 | | | 4,800 | |
| | | $ | 22,991 | | | $ | 22,656 | | | $ | 20,422 | |
| Capital Expenditures | Capital Expenditures | | | | | | Capital Expenditures | | | |
| Education | Education | $ | 100,780 | | | $ | 33,553 | | | $ | 57,246 | |
| Television broadcasting | Television broadcasting | 6,803 | | | 13,470 | | | 19,362 | |
| Manufacturing | Manufacturing | 7,190 | | | 8,034 | | | 11,218 | |
| Healthcare | Healthcare | 3,671 | | | 2,481 | | | 2,303 | |
| Automotive | Automotive | 31,124 | | | 3,181 | | | 1,402 | |
| Other businesses | Other businesses | 13,176 | | | 5,075 | | | 2,301 | |
| Corporate office | Corporate office | 25 | | | 80 | | | 115 | |
| | | $ | 162,769 | | | $ | 65,874 | | | $ | 93,947 | |
Asset information for the Company’s business segments is as follows:
| | | | As of December 31 | | As of December 31 |
| (in thousands) | (in thousands) | 2021 | | 2020 | (in thousands) | 2023 | | 2022 |
| Identifiable Assets | Identifiable Assets | | | | Identifiable Assets | | | |
| Education | Education | $ | 2,026,782 | | | $ | 1,975,104 | |
| Television broadcasting | Television broadcasting | 448,627 | | | 453,988 | |
| Manufacturing | Manufacturing | 486,304 | | | 551,611 | |
| Healthcare | Healthcare | 194,823 | | | 160,654 | |
| Automotive | Automotive | 238,200 | | | 151,789 | |
| Other businesses | Other businesses | 689,872 | | | 365,744 | |
| Corporate office | Corporate office | 68,962 | | | 348,045 | |
| | | $ | 4,153,570 | | | $ | 4,006,935 | |
| Investments in Marketable Equity Securities | Investments in Marketable Equity Securities | 809,997 | | | 573,102 | |
| Investments in Affiliates | Investments in Affiliates | 155,444 | | | 155,777 | |
| Prepaid Pension Cost | Prepaid Pension Cost | 2,306,514 | | | 1,708,305 | |
| | Total Assets | Total Assets | $ | 7,425,525 | | | $ | 6,444,119 | |
| Total Assets | |
| Total Assets | |
The Company’s education division comprises the following operating segments:
| | Year Ended December 31 |
| Year Ended December 31 | | | Year Ended December 31 |
| (in thousands) | (in thousands) | 2021 | | 2020 | | 2019 | (in thousands) | 2023 | | 2022 | | 2021 |
| Operating Revenues | Operating Revenues | | | | | | Operating Revenues | | | |
| Kaplan international | Kaplan international | $ | 726,875 | | | $ | 653,892 | | | $ | 750,245 | |
| Higher education | Higher education | 317,854 | | | 316,095 | | | 305,672 | |
| Supplemental education | Supplemental education | 309,069 | | | 327,087 | | | 388,814 | |
| Kaplan corporate and other | Kaplan corporate and other | 14,759 | | | 12,643 | | | 9,480 | |
| Intersegment elimination | Intersegment elimination | (7,312) | | | (4,004) | | | (2,461) | |
| | | $ | 1,361,245 | | | $ | 1,305,713 | | | $ | 1,451,750 | |
| Income (Loss) from Operations before Amortization of Intangible Assets and Impairment of Long-Lived Assets | Income (Loss) from Operations before Amortization of Intangible Assets and Impairment of Long-Lived Assets | |
| Kaplan international | Kaplan international | $ | 33,457 | | | $ | 15,248 | | | $ | 42,129 | |
| Kaplan international | |
| Kaplan international | |
| Higher education | Higher education | 24,134 | | | 24,364 | | | 13,960 | |
| Supplemental education | Supplemental education | 36,919 | | | 19,705 | | | 34,487 | |
| Kaplan corporate and other | Kaplan corporate and other | (24,715) | | | (18,266) | | | (26,891) | |
| Intersegment elimination | Intersegment elimination | 97 | | | 5 | | | (5) | |
| $ | 69,892 | | | $ | 41,056 | | | $ | 63,680 | |
| $ | |
| Amortization of Intangible Assets | Amortization of Intangible Assets | $ | 16,001 | | | $ | 17,174 | | | $ | 14,915 | |
| Impairment of Long-Lived Assets | Impairment of Long-Lived Assets | $ | 3,318 | | | $ | 12,278 | | | $ | 693 | |
| Income (Loss) from Operations | Income (Loss) from Operations | | | | | | Income (Loss) from Operations | | | |
| Kaplan international | Kaplan international | $ | 33,457 | | | $ | 15,248 | | | $ | 42,129 | |
| Higher education | Higher education | 24,134 | | | 24,364 | | | 13,960 | |
| Supplemental education | Supplemental education | 36,919 | | | 19,705 | | | 34,487 | |
| Kaplan corporate and other | Kaplan corporate and other | (44,034) | | | (47,718) | | | (42,499) | |
| Intersegment elimination | Intersegment elimination | 97 | | | 5 | | | (5) | |
| | | $ | 50,573 | | | $ | 11,604 | | | $ | 48,072 | |
| Depreciation of Property, Plant and Equipment | Depreciation of Property, Plant and Equipment | | | | | | Depreciation of Property, Plant and Equipment | | | |
| Kaplan international | Kaplan international | $ | 21,472 | | | $ | 19,562 | | | $ | 15,394 | |
| Higher education | Higher education | 3,658 | | | 3,082 | | | 2,883 | |
| Supplemental education | Supplemental education | 6,544 | | | 8,724 | | | 7,132 | |
| Kaplan corporate and other | Kaplan corporate and other | 439 | | | 391 | | | 246 | |
| | | $ | 32,113 | | | $ | 31,759 | | | $ | 25,655 | |
| Pension Service Cost | Pension Service Cost | | | | | | Pension Service Cost | | | |
| Kaplan international | Kaplan international | $ | 291 | | | $ | 433 | | | $ | 454 | |
| Higher education | Higher education | 4,440 | | | 4,150 | | | 4,535 | |
| Supplemental education | Supplemental education | 3,814 | | | 4,207 | | | 4,734 | |
| Kaplan corporate and other | Kaplan corporate and other | 812 | | | 1,234 | | | 662 | |
| | | $ | 9,357 | | | $ | 10,024 | | | $ | 10,385 | |
| Capital Expenditures | Capital Expenditures | | | | | | Capital Expenditures | | | |
| Kaplan international | Kaplan international | $ | 92,532 | | | $ | 24,085 | | | $ | 48,362 | |
| Higher education | Higher education | 3,629 | | | 3,234 | | | 3,463 | |
| Supplemental education | Supplemental education | 4,297 | | | 6,030 | | | 5,362 | |
| Kaplan corporate and other | Kaplan corporate and other | 322 | | | 204 | | | 59 | |
| | | $ | 100,780 | | | $ | 33,553 | | | $ | 57,246 | |
Asset information for the Company’s education division is as follows:
| | | | As of December 31 | | As of December 31 |
| (in thousands) | (in thousands) | 2021 | | 2020 | (in thousands) | 2023 | | 2022 |
| Identifiable Assets | Identifiable Assets | |
| Kaplan international | Kaplan international | $ | 1,493,868 | | | $ | 1,455,722 | |
| Kaplan international | |
| Kaplan international | |
| Higher education | Higher education | 187,789 | | | 187,123 | |
| Supplemental education | Supplemental education | 286,877 | | | 274,687 | |
| Kaplan corporate and other | Kaplan corporate and other | 58,248 | | | 57,572 | |
| | | $ | 2,026,782 | | | $ | 1,975,104 | |
20. SUMMARY OF QUARTERLY OPERATING RESULTS (UNAUDITED)
Quarterly results of operations for the year ended December 31, 2023, are as follows:
| | | | | | | | | | | | | | | | | | | | | | | |
| (in thousands, except per share amounts) | First
Quarter | | Second
Quarter | | Third
Quarter | | Fourth
Quarter |
| | | | | | | |
| | | | | | | |
| | | | | | | |
| Operating Revenues | $ | 1,031,546 | | | $ | 1,104,999 | | | $ | 1,111,519 | | | $ | 1,166,813 | |
| | | | | | | |
| | | | | | | |
| | | | | | | |
| Cost of Services and Goods Sold (exclusive of item shown below) | 727,214 | | | 767,854 | | | 781,587 | | | 826,279 | |
| | | | | | | |
| | | | | | | |
| | | | | | | |
| | | | | | | |
| Other Operating Expenses | 276,676 | | | 279,090 | | | 387,044 | | | 299,740 | |
| | | | | | | |
| Income (Loss) from Operations | 27,656 | | | 58,055 | | | (57,112) | | | 40,794 | |
| | | | | | | |
| | | | | | | |
| | | | | | | |
| | | | | | | |
| | | | | | | |
| | | | | | | |
| | | | | | | |
| | | | | | | |
| | | | | | | |
| Net Income (Loss) | 52,977 | | | 124,171 | | | (21,134) | | | 55,690 | |
| | | | | | | |
| | | | | | | |
| Net Income (Loss) Attributable to Graham Holdings Company Common Stockholders | $ | 52,272 | | | $ | 122,788 | | | $ | (23,031) | | | $ | 53,259 | |
| | | | | | | |
| | | | | | | |
| | | | | | | |
| | | | | | | |
| | | | | | | |
| | | | | | | |
| Basic net income (loss) per common share | $ | 10.91 | | | $ | 25.96 | | | $ | (5.02) | | | $ | 11.76 | |
| | | | | | | |
| Diluted net income (loss) per common share | $ | 10.88 | | | $ | 25.89 | | | $ | (5.02) | | | $ | 11.72 | |
| | | | | | | |
Quarterly results of operations for the year ended December 31, 2022, are as follows:
| | | | | | | | | | | | | | | | | | | | | | | |
| (in thousands, except per share amounts) | First
Quarter | | Second
Quarter | | Third
Quarter | | Fourth
Quarter |
| | | | | | | |
| | | | | | | |
| | | | | | | |
| Operating Revenues | $ | 914,721 | | | $ | 933,302 | | | $ | 1,012,438 | | | $ | 1,064,032 | |
| | | | | | | |
| | | | | | | |
| | | | | | | |
| Cost of Services and Goods Sold (exclusive of item shown below) | 615,501 | | | 631,828 | | | 694,757 | | | 715,632 | |
| | | | | | | |
| | | | | | | |
| | | | | | | |
| | | | | | | |
| Other Operating Expenses | 259,249 | | | 262,146 | | | 258,149 | | | 403,333 | |
| | | | | | | |
| Income (Loss) from Operations | 39,971 | | | 39,328 | | | 59,532 | | | (54,933) | |
| | | | | | | |
| | | | | | | |
| | | | | | | |
| | | | | | | |
| | | | | | | |
| | | | | | | |
| | | | | | | |
| | | | | | | |
| | | | | | | |
| Net Income (Loss) | 96,566 | | | (66,615) | | | 33,840 | | | 6,643 | |
| | | | | | | |
| | | | | | | |
| Net Income (Loss) Attributable to Graham Holdings Company Common Stockholders | $ | 95,624 | | | $ | (67,485) | | | $ | 32,780 | | | $ | 6,160 | |
| | | | | | | |
| | | | | | | |
| | | | | | | |
| | | | | | | |
| | | | | | | |
| | | | | | | |
| Basic net income (loss) per common share | $ | 19.50 | | | $ | (13.95) | | | $ | 6.78 | | | $ | 1.28 | |
| | | | | | | |
| Diluted net income (loss) per common share | $ | 19.45 | | | $ | (13.95) | | | $ | 6.76 | | | $ | 1.28 | |
| | | | | | | |
The sum of the four quarters may not necessarily be equal to the annual amounts reported in the Consolidated Statements of Operations due to rounding.
As disclosed in Note 2, in the fourth quarter of 2023, the Company identified misstatements in our previously issued Condensed Consolidated Balance Sheets which had a related impact to the changes in assets and liabilities within operating cash flows. The Company determined that these adjustments were not material to the previously issued financial statements, but have provided the impact on our previously issued Condensed Consolidated Statements of Cash Flows for each of the year-to-date interim periods in 2023 as shown below. These amounts will be revised in the respective 2024 10-Q filings.
| | | | | | | | | | | | | | | | | |
| Three Months Ended March 31, 2023 |
| (In thousands) | As Previously Reported | | Adjustments | | As Revised |
| Change in operating assets and liabilities: | | | | | |
| Accounts receivable | $ | 54,245 | | | $ | (7,001) | | | $ | 47,244 | |
| | | | | |
| Deferred Revenue | (2,387) | | | 7,001 | | | 4,614 | |
| Net Cash Provided by Operating Activities | $ | 22,811 | | | $ | — | | | $ | 22,811 | |
| | | | | | | | | | | | | | | | | |
| Six Months Ended June 30, 2023 |
| (In thousands) | As Previously Reported | | Adjustments | | As Revised |
| Change in operating assets and liabilities: | | | | | |
| Accounts receivable | $ | 93,496 | | | $ | (10,270) | | | $ | 83,226 | |
| | | | | |
| Deferred Revenue | (58,505) | | | 10,270 | | | (48,235) | |
| Net Cash Provided by Operating Activities | $ | 62,239 | | | $ | — | | | $ | 62,239 | |
| | | | | | | | | | | | | | | | | |
| Nine Months Ended September 30, 2023 |
| (In thousands) | As Previously Reported | | Adjustments | | As Revised |
| Change in operating assets and liabilities: | | | | | |
| Accounts receivable | $ | 15,629 | | | $ | (3,248) | | | $ | 12,381 | |
| | | | | |
| Deferred Revenue | 44,822 | | | 3,248 | | | 48,070 | |
| Net Cash Provided by Operating Activities | $ | 202,526 | | | $ | — | | | $ | 202,526 | |