UNITED STATES SECURITIES AND EXCHANGE COMMISSION
WASHINGTON, D.C. 20549
FORM 10-K
(Mark One)
| | | | | | | | |
| ☒ | | ANNUAL REPORT PURSUANT TO SECTION 13 OR 15(d) OF THE SECURITIES EXCHANGE ACT OF 1934 |
For the fiscal year ended December 31, 20202023
OR
| | | | | | | | |
| ☐ | | TRANSITION REPORT PURSUANT TO SECTION 13 OR 15(d) OF THE SECURITIES EXCHANGE ACT OF 1934 |
For the transition period from _______ to _______
Commission file number 1-3932
WHIRLPOOL CORPORATION
(Exact name of registrant as specified in its charter)
| | | | | | | | | | | |
| Delaware | | 38-1490038 |
| (State of Incorporation) | | (I.R.S. Employer Identification No.) |
| | | |
| 2000 North M-63 | | |
| Benton Harbor, | Michigan | | 49022-2692 |
| (Address of principal executive offices) | | (Zip Code) |
Registrant's telephone number, including area code (269) 923-5000
Securities registered pursuant to Section 12(b) of the Act:
| | | | | | | | | | | | | | | | | | | | |
| Title of each class | | Trading symbol(s) | | Name of each exchange on which registered |
| Common stock, par value $1 per share | | WHR | | Chicago Stock Exchange | and | New York Stock Exchange |
Securities registered pursuant to Section 12(g) of the Act: NONE
| | | | | | | | | | | | | | |
| Indicate by check mark if the registrant is a well-known seasoned issuer, as defined in Rule 405 of the Securities Act. | Yes | ☒ | No | ☐ |
| Indicate by check mark if the registrant is not required to file reports pursuant to Section 13 or Section 15(d) of the Exchange Act. | Yes | ☐ | No | ☒ |
| Indicate by check mark whether the registrant (1) has filed all reports required to be filed by Section 13 or 15(d) of the Exchange Act during the preceding 12 months (or for such shorter period that the registrant was required to file such reports), and (2) has been subject to such filing requirements for the past 90 days. | Yes | ☒ | No | ☐ |
| Indicate by check mark whether the registrant has submitted electronically every Interactive Data File required to be submitted pursuant to Rule 405 of Regulation S-T (§ 232.405 of this chapter) during the preceding 12 months (or for such shorter period that the registrant was required to submit such files). | Yes | ☒ | No | ☐ |
| | | | | | | | | | | |
| Indicate by check mark whether the registrant is a large accelerated filer, an accelerated filer, a non-accelerated filer, a smaller reporting company, or an emerging growth company. See the definitions of "large accelerated filer," "accelerated filer," "smaller reporting company," and "emerging growth company" in Rule 12b-2 of the Exchange Act. | | |
| (Check one) | | | |
| Large accelerated filer | ☒ | Accelerated filer | ☐ |
| Non-accelerated filer | ☐ (Do not check if a smaller reporting company) | Smaller reporting company | ☐ |
| | Emerging growth company | ☐ |
If an emerging growth company, indicate by check mark if the registrant has elected not to use the extended transition period for complying with any new or revised financial accounting standards provided pursuant to Section 13(a) of the Exchange Act. ☐
| | | | | | | | | | | | | | |
| Indicate by check mark whether the registrant has filed a report on and attestation to its management’s assessment of the effectiveness of its internal control over financial reporting under Section 404(b) of the Sarbanes-Oxley Act (15 U.S.C. 7262(b)) by the registered public accounting firm that prepared or issued its audit report. | Yes | ☒ | No | ☐ |
| If securities are registered pursuant to Section 12(b) of the Act, indicate by check mark whether the financial statements of the registrant included in the filing reflect the correction of an error to previously issued financial statements. | Yes | ☐ | No | ☒ |
| Indicate by check mark whether any of those error corrections are restatements that required a recovery analysis of incentive-based compensation received by any of the registrant's executive officers during the relevant recovery period pursuant to §240.10D-1(b). | Yes | ☐ | No | ☒ |
| Indicate by check mark whether the registrant is a shell company (as defined in Rule 12b-2 of the Act). | Yes | ☐ | No | ☒ |
The aggregate market value of voting common stock of the registrant held by stockholders not including voting stock held by directors and executive officers of the registrant and certain employee plans of the registrant (the exclusion of such shares shall not be deemed an admission by the registrant that any such person is an affiliate of the registrant) at the close of business on June 30, 20202023 (the last business day of the registrant's most recently completed second fiscal quarter) was $7,850,245,364.$7,941,546,633.
On February 5, 2021,9, 2024, the registrant had 62,979,52554,643,756 shares of common stock outstanding.
DOCUMENTS INCORPORATED BY REFERENCE
Portions of the following documents are incorporated herein by reference into the Part of the Form 10-K indicated:
| | | | | |
| Document | Part of Form 10-K into which incorporated |
ThePortions of the registrant's proxy statement for the 20212024 annual meeting of stockholders (the "Proxy Statement") to be filed pursuant to Regulation 14A within 120 days after the registrant's fiscal year end of December 31, 2023 are incorporated by reference into Part III of this Annual Report on From 10-K. | Part III |
WHIRLPOOL CORPORATION
ANNUAL REPORT ON FORM 10-K
For the fiscal year ended December 31, 20202023
TABLE OF CONTENTS
| | | | | | | | |
| | | PAGE |
| |
| Item 1. | | |
| Item 1A. | | |
| Item 1B. | | |
| Item 1C. | | |
| Item 2. | | |
| Item 3. | | |
| Item 4. | | |
| | |
| |
| Item 5. | | |
| Item 6. | | |
| Item 7. | | |
| Item 7A. | | |
| Item 8. | | |
| Item 9. | | |
| Item 9A. | | |
| Item 9B. | | |
| Item 9C. | | |
| | |
| |
| Item 10. | | |
| Item 11. | | |
| Item 12. | | |
| Item 13. | | |
| Item 14. | | |
| | |
| |
| Item 15. | | |
| Item 16. | | |
| | |
| |
The Private Securities Litigation Reform Act of 1995 provides a safe harbor for forward-looking statements made by us or on our behalf. Certain statements contained in this annual report, including those within the forward-looking perspective section within the Management's Discussion and Analysis section, do not relate strictly to historical or current facts and may contain forward-looking statements that reflect our current views with respect to future events and financial performance. Such statements can be identified by the use of terminology such as "may," "could," "will," "should," "possible," "plan," "predict," "forecast," "potential," "anticipate," "estimate," "expect," "project," "intend," "believe," "may impact," "on track," "guarantee," "seek," and the negative of these words and words and terms of similar substance. These forward-looking statements should be considered with the understanding that such statements involve a variety of risks and uncertainties, known and unknown including those identified below, under “Item 1A. Risk Factors,” and elsewhere herein. Unless otherwise indicated, the terms "Whirlpool," "the Company," "we," "us," and "our" refer to Whirlpool Corporation and its consolidated subsidiaries.
| | | | | |
Our Company
LifeImproving life at home has been at the heart of our business for 110112 years – it is why we exist and why we are passionate about what we do.
|
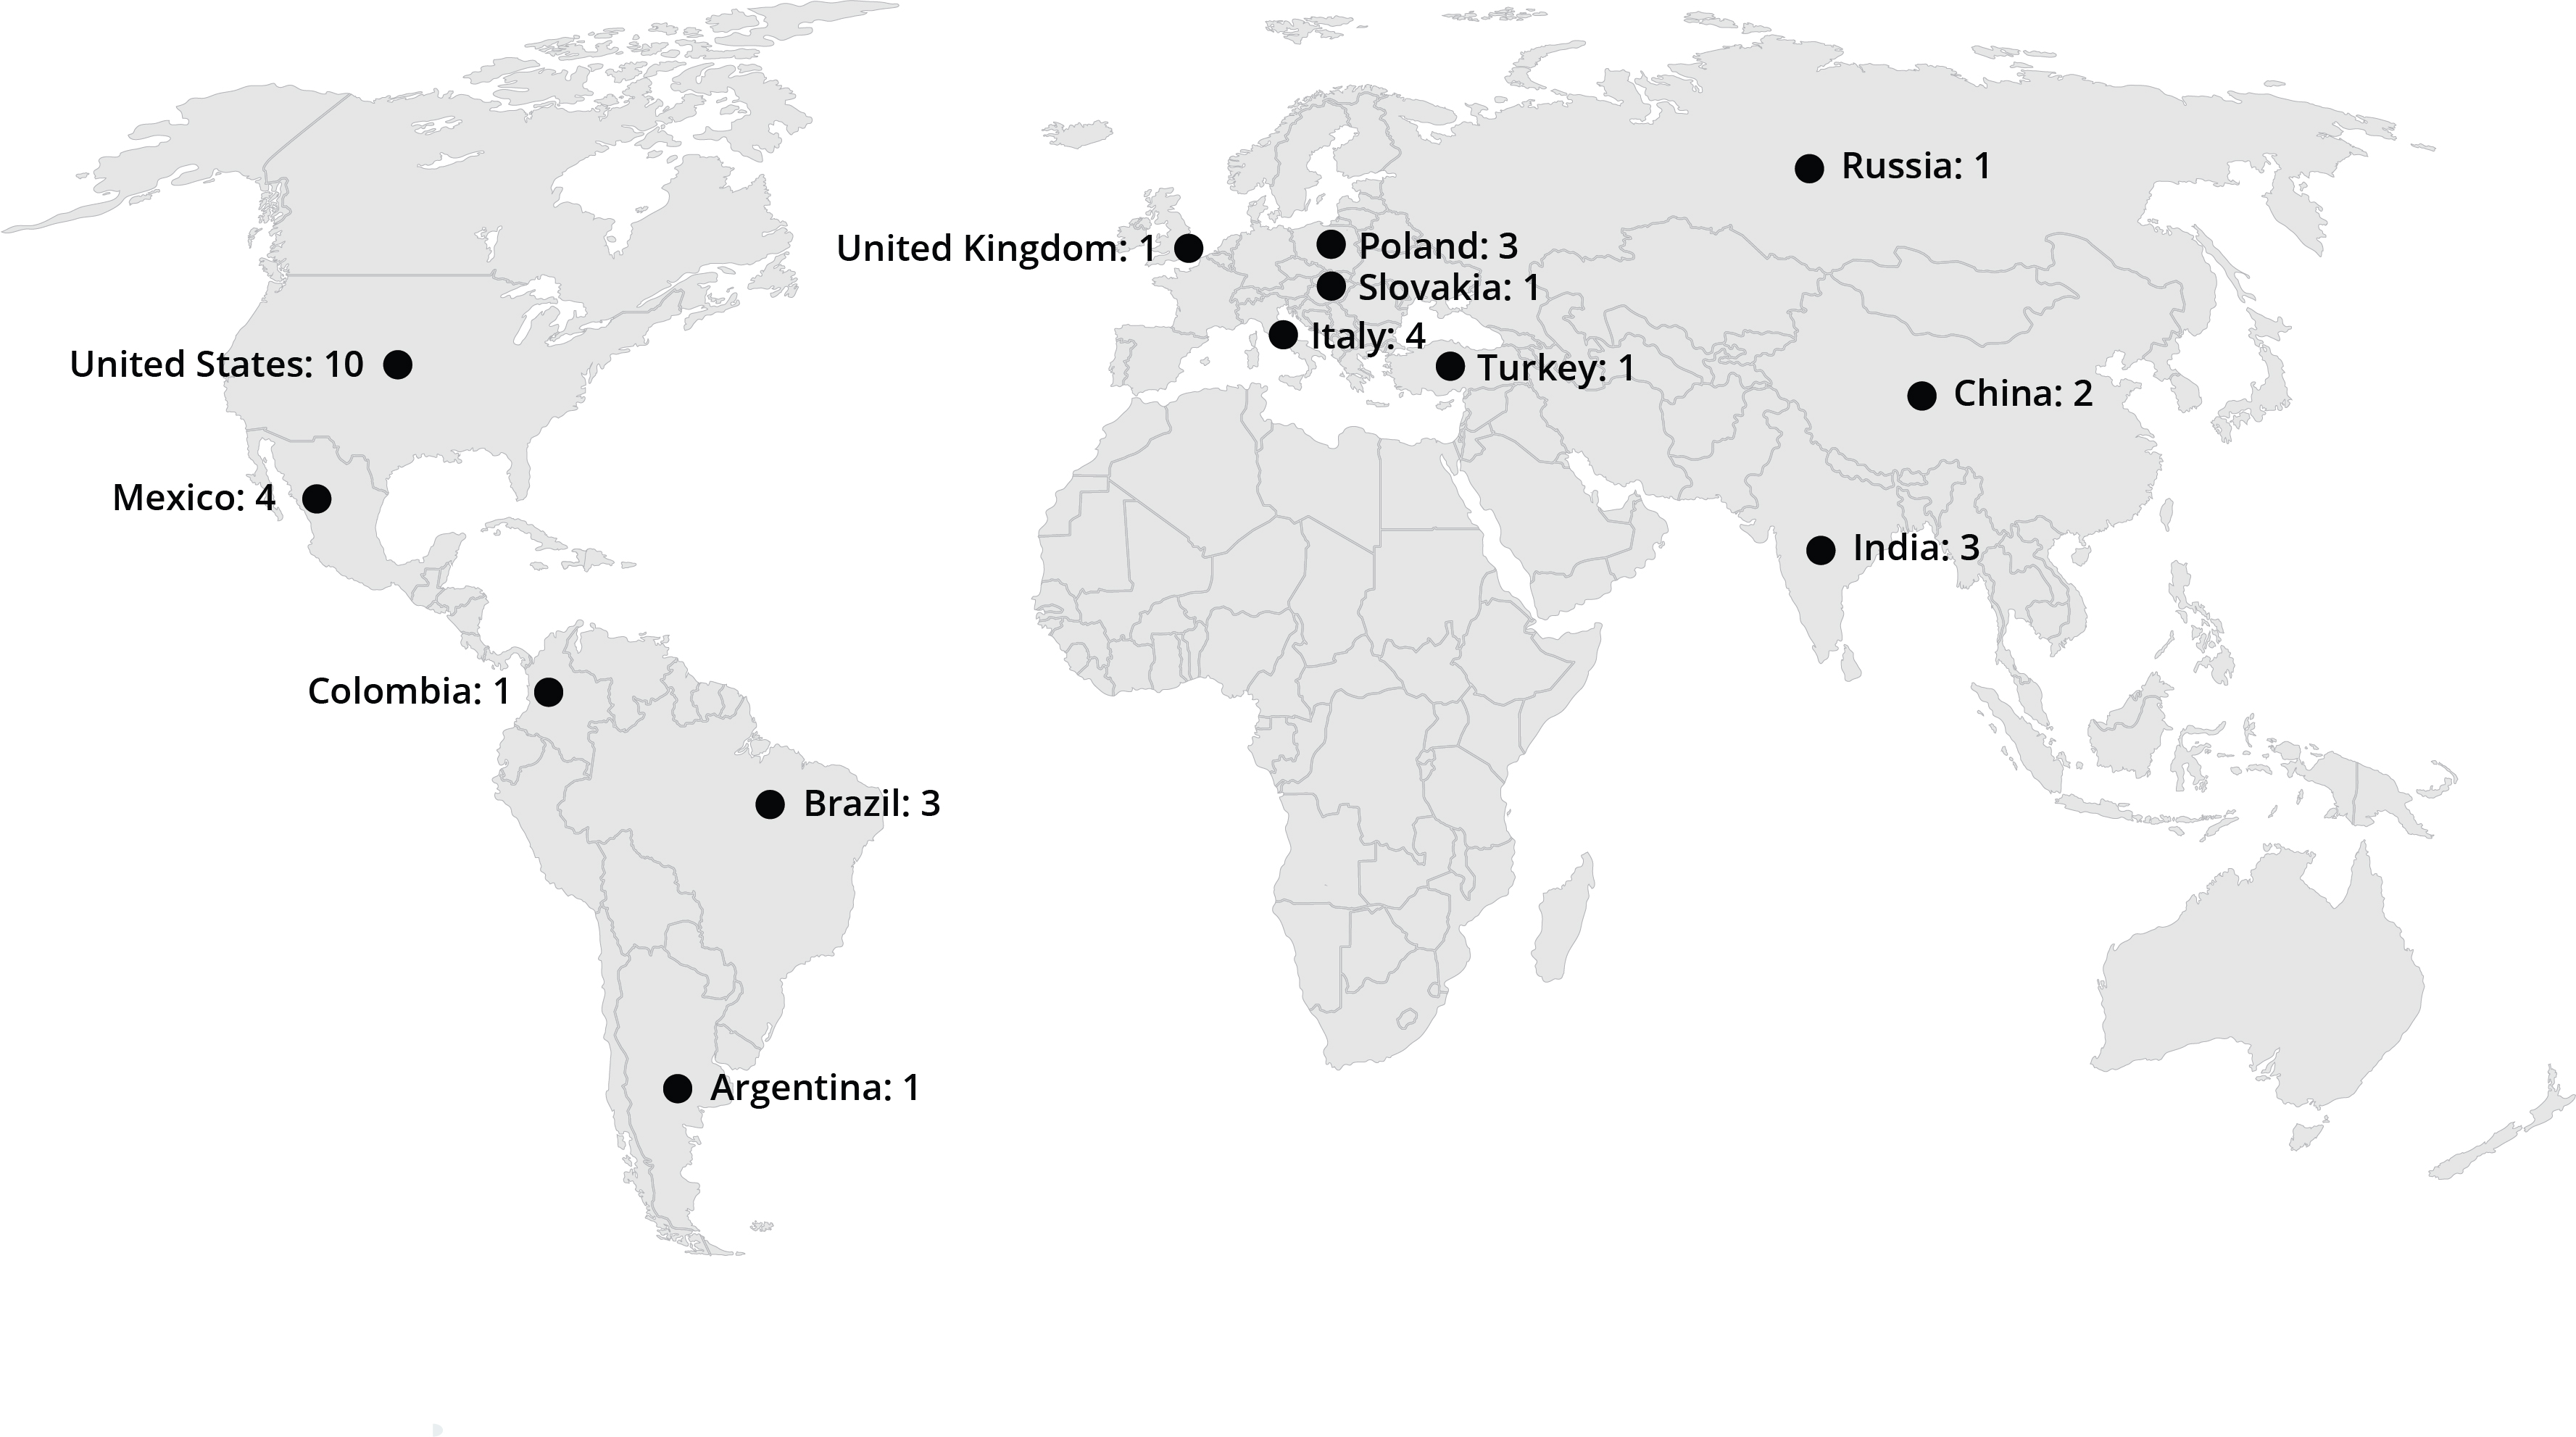
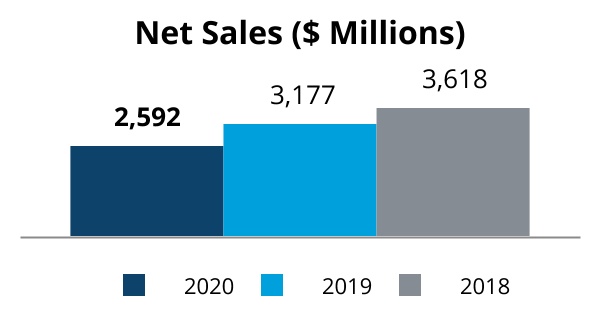
Whirlpool Corporation ("Whirlpool"), committed to being the world's leadingbest kitchen and laundry appliance company, in constant pursuit of improving life at home, was incorporated in 1955 under the laws of Delaware and was founded in 1911. Whirlpool manufactures products in 1310 countries and markets products in nearly every country around the world. We have received worldwide recognition for accomplishments in a variety of business and social efforts, including leadership, diversity, innovative product design, business ethics, environmental sustainability, social responsibility and community involvement. We conductWhirlpool had approximately $19 billion in annual net sales and 59,000 employees in 2023.
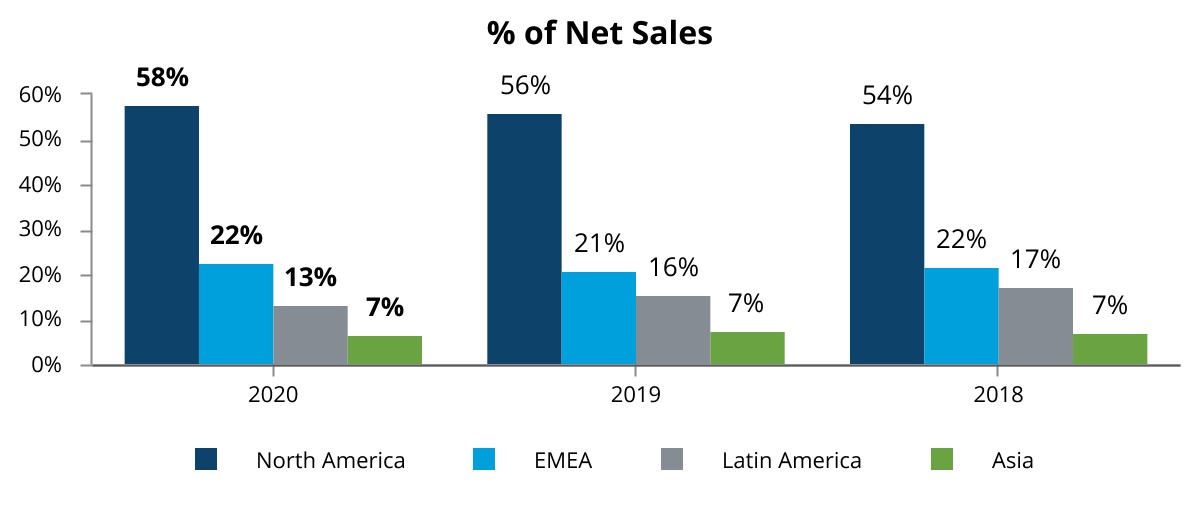
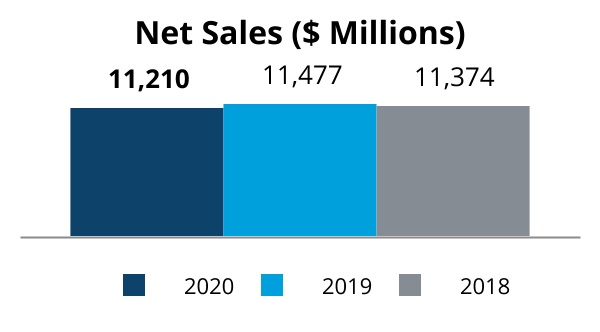
In 2023, we conducted our business through four operating segments, which we define based on geography. Whirlpool Corporation'sWhirlpool's operating and reportable segments consistin 2023 consisted of North America,America; Europe, Middle East and Africa ("EMEA"),; Latin America and Asia. Beginning January 1, 2024, we are conducting our business through five operating segments, which consist of Major Domestic Appliances (“MDA”) North America; MDA Europe, MDA Latin America; MDA Asia; and Small Domestic Appliances (“SDA”) Global. For additional information, see Note 14 to the Consolidated Financial Statements.
On January 16, 2023, Whirlpool had approximately $19 billionentered into a contribution agreement with Arçelik A.Ş (“Arcelik”) in annual salesalignment with Whirlpool’s portfolio transformation. Under the terms of the agreement, Whirlpool will contribute its European major domestic appliance business, and approximately 78,000 employeesArcelik will contribute its European major domestic appliance, consumer electronics, air conditioning, and small domestic appliance businesses into the newly formed entity of which Whirlpool will own 25% and Arcelik 75%, subject to an adjustment mechanism based on certain financial matters. Separately, Whirlpool subsequently reached an agreement for the sale of Whirlpool’s Middle East and Africa business to Arcelik. These transactions impact businesses that are collectively referred to as the European major domestic appliance business which was classified as held for sale in 2020.the fourth quarter of 2022. Whirlpool will retain ownership of its EMEA KitchenAid small domestic appliance business.
The transactions are expected to close by April 2024 and include nine Whirlpool production sites located in Italy, Poland, Slovakia, and the UK, as well as two Arcelik production facilities in Romania. The Europe transaction is subject to certain closing conditions, including regulatory approvals from the European Commission, Germany, Austria and China, which have been received, and the UK which remains. On February 8, 2024, the U.K. Competition and Markets Authority (“CMA”) provisionally cleared the Transaction. The CMA is expected to issue its final decision by March 26, 2024. For additional information, see Note 15 to the Consolidated Financial Statements.
The MDA Europe business will be deconsolidated upon the completion of the European contribution agreement transaction with Arcelik, and it does not qualify for reporting as discontinued operations.
As used herein, and except where the context otherwise requires, "Whirlpool," "the Company," "we," "us," and "our" refer to Whirlpool Corporation and its consolidated subsidiaries. The world's leading kitchen and laundry appliance company claim is based on most recently available publicly reported annual revenues among leading appliance manufacturers.
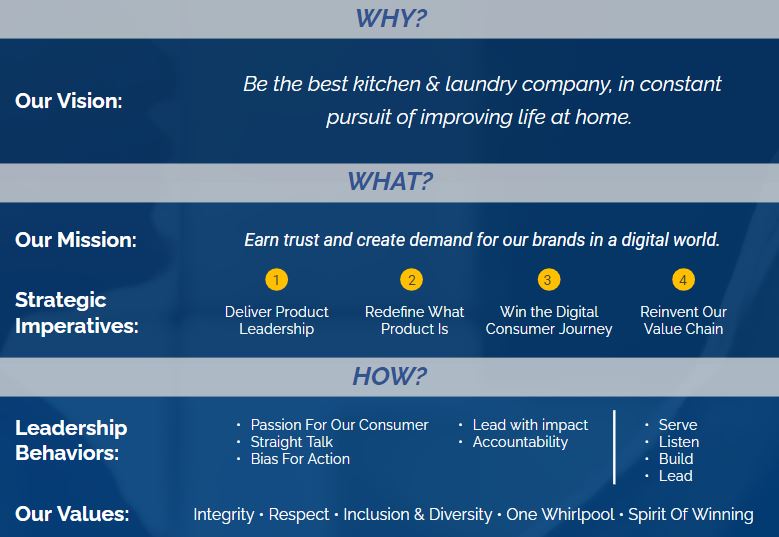
Our Strategic Architecture
Our strategic architecture is the foundational component that drives our shareholder value creation. In 2020, our strategic architecture guided our response to unprecedented COVID-19-related uncertainty, which focused on keeping employees safe, plants operating,creation and liquidity accessible.strategy. Below are the key components of our strategic architecture.
Unique Global PositionPortfolio Transformation
Whirlpool Corporation is committed to delivering significant, long-term value to both our consumers and our shareholders. For consumers,In 2023 we delivercontinued our multi-year portfolio transformation journey, which we expect to transform the company into a higher-growth and higher-margin business. In reflection of this, we have successfully integrated the InSinkErator business into our North America operations and are nearing the expected completion of the contribution agreement transaction with Arcelik for our European major domestic appliance business. Our value through innovative, high-quality productscreating approach is enabled by three strong pillars: small appliances, major appliances in the Americas and India and commercial appliances, and we are committed to investing in businesses that solve everyday problems while saving time, energysupport higher growth and water. Forhigher margins. In recognition of our shareholders,portfolio transformation, including our pending European transaction, we seek to deliver differentiated value throughhave reorganized our four strategic pillars: global leading scale, best brand portfolio, proven track record of innovation and best cost position.
| | | | | | | | | | | | | | | | | | | | | | | | | | | | | | | | | | | | | | | | | | | | | | | | | | | | | |
Global Leading Scale | | Best Brand
Portfolio | | Proven Track Record of Innovation | | Best Cost
Position |
| | | | | | |
| | | |
| | | | |
| | | | |
| | | | |
| | | | |

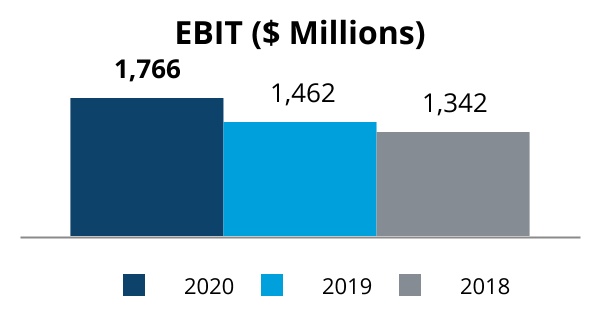
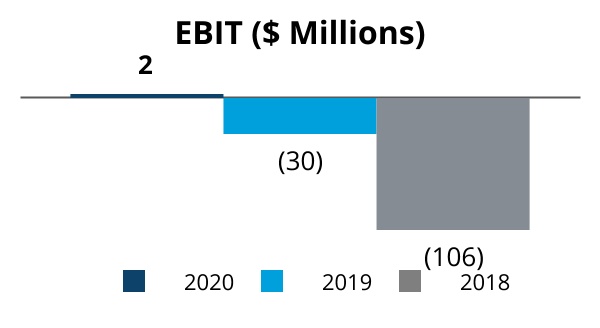
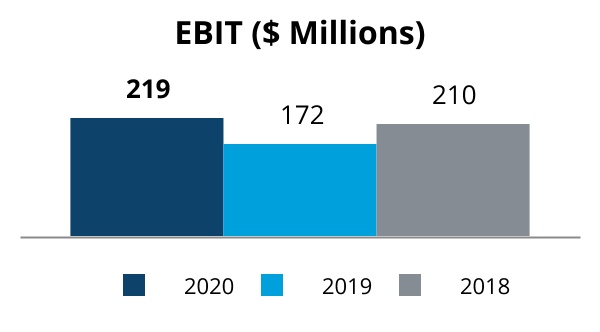
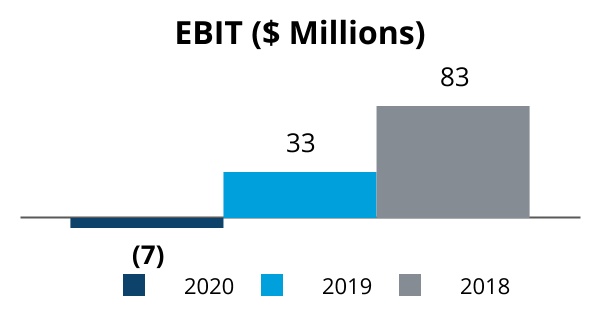
Global Leading ScaleReconciliations to equivalent GAAP net earnings measures are not provided as EBIT percentages presented above represent our expectations for these business lines and are not provided with respect to results for any specific period.
We are committed to being the world's leadingbest kitchen and laundry appliance company.
Our leading positionglobal footprint includes a balance of developed countries and emerging markets, including a leading position in many of the key countries in which we expect to operate. We believeFollowing the contribution of our European major domestic appliance business, we are well positionedexpect to continue to convert demandwin in the Americas with our leading position in multiple countries and leading U.S. builder share, alongside over 100 new product introductions in 2023 and accelerating growth in India.
Our Sustained Investment in Innovation
Whirlpool Corporation has been responsible for a number of first-to-market innovations. These include the first electric wringer washer in 1911, the first residential stand mixer in 1919, the first countertop microwave in 1967, the first energy and water efficient top-load washer in 1998 and the first top-load clothes washer with a removable agitator in 2021, among others. In 2023, we launched more than 100 new products throughout the world, demonstrating our commitment to innovation, including the KitchenAidGo cordless system, a 70 centimeter built-in bottom mount refrigerator with leading capacity and noise reduction, and our over-the-range flush microwave hood combination. We also unveiled our SlimTechinsulation technology, which we expect to deliver benefits ranging from increased capacity and quieter performance to the potential for increased sustainability and design flexibility. Ever mindful of our impact on the planet, our holistic innovation approach uses Design for Sustainability principles in our global platforms and connects product sustainability directly with our business goals. For example, our InSinkErator food disposers can reduce from landfills up to 600 pounds of food waste generated by the average family of four. We are proud of our track record of innovation and our progress on sustainable innovation with eco-efficient products that reduce environmental impacts.
We are committed to continue innovating for a new generation of consumers. Our world-class innovation pipeline has driven consistent innovation over the last few years, driven by a passionate culture of employees focused on bringing new technologies to market.
As the shift to digital continues, consumers continue to desire connected appliances which fit seamlessly into profitable growth.the larger home ecosystem. As a leading connected appliance manufacturer, we are excited to bring connected products and technologies to market, including voice control with a compatible smart home assistant, food recognition and automatic laundry detergent replenishment and over-the-air updates to qualified connected appliances. These digitally-enabled products and services will increasingly enhance the appliance experience for our consumers, as demonstrated by our highly rated mobile apps.
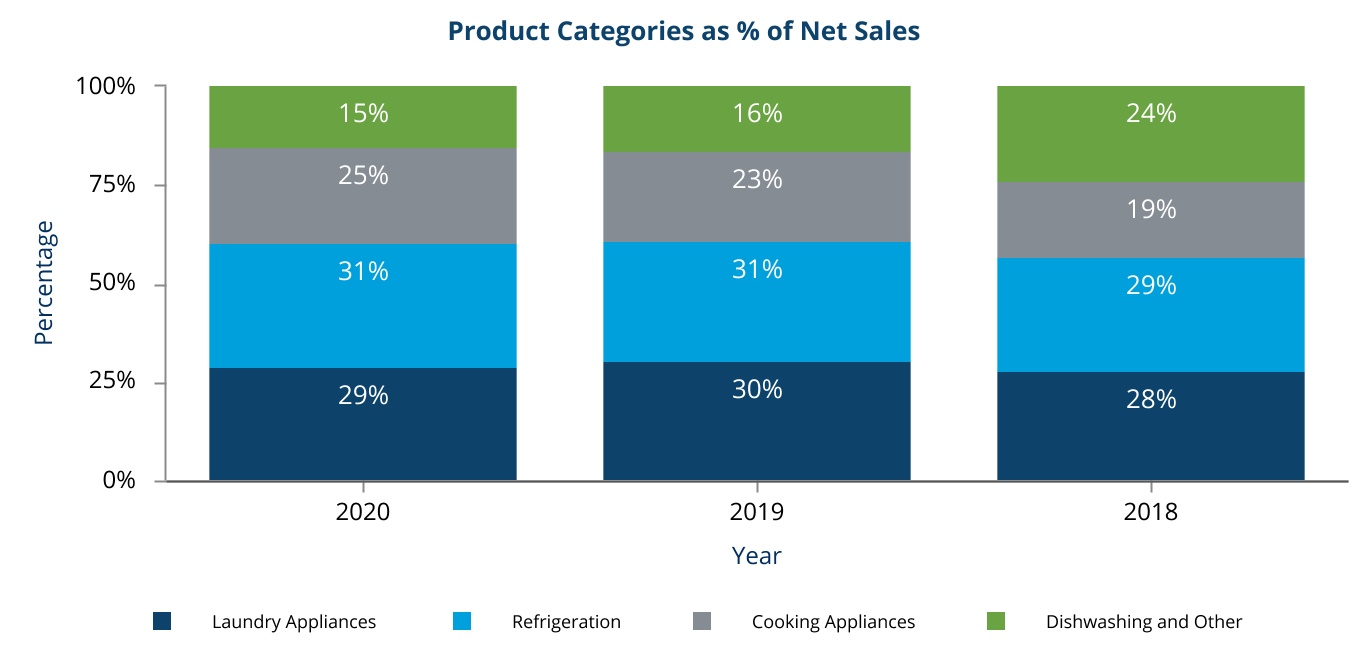
Whirlpool manufactures and markets a full line of major home appliances and related products. Our principal products are laundry appliances, refrigerators and freezers, cooking appliances, and dishwashers. Additionally, the Company has a strong portfolio of small domestic appliances, including the KitchenAid stand mixer, and a strong line of commercial laundry appliances. We have successfully integrated the InSinkErator business into our North America operations, expanding our portfolio of products to include food waste disposers and instant hot water dispensers for home and commercial use. InSinkErator net sales are reported under the 'Other' product category which are aggregated under the 'Dishwashing and Other' category on the chart below. KitchenAid Small Domestic Appliance net sales are reported under the 'Cooking Appliances' product category.
The following chart provides the percentage of net sales for each of our product categories which accounted for 10% or more of our consolidated net sales over the last three years:
Best Brand Portfolio
We have the best brand portfolio in the industry, including fivewith multiple brands with more than $1 billion in revenue. The Company is driving purposeful innovation to meet the evolving needs of consumers through its iconic brand portfolio, demonstrating our commitment to being the best kitchen and laundry company improving life at home for our consumers.
We aim to position these desirable brands across many consumer segments. Our sales are led by our global brands including Whirlpool and KitchenAid. Whirlpool is trusted throughout the world as a brand that delivers innovative care daily. Our KitchenAid brand brings a combination of innovation and design that inspires and fuels the passion of chefs, bakers and kitchen enthusiasts worldwide. These two brands are the backbone of our strategy to offer differentiated products that provide exceptional performance and desirable features while remaining affordable to consumers.
Additionally, we have a number of strong regional and local brands, including Maytag, Consul, Brastemp, Consul,Amana, Bauknecht, JennAir, Hotpoint*, Indesit,and andInSinkErator, Bauknecht.among others. These brands add to our impressive depth and breadth of
appliance kitchen and laundry product offerings and help us provide products that are tailored to local consumer needs and preferences.
•Whirlpool ownership of the Hotpoint Our best brand portfolio in the EMEAindustry, paired with our robust investment in research and Asia Pacific regions is not affiliated with the Hotpoint brand solddevelopment and consumer insights, positions us well to meet trends in the Americas.consumer preferences and market demand.
Proven Track Record of Innovation
Whirlpool Corporation has been responsible forWe have a number of first-to-market innovations. These include the first electric wringer washer in 1911, the first residential stand mixer in 1919, the first countertop microwave in 1967 and the first energy and water efficient top-load washer in 1998. We are proud of our track record of innovation.
While we are proud of that legacy, we are also committed to innovating for a new generation of consumers. Our world-class innovation pipeline has accelerated over the last few years, driven by consistent innovation funding and a passionate culture of employees focused on bringing new technologies to market. This year,cost optimization and productivity, which we launched more than 100 new products throughout the world,call productivity for growth, and we are committed to further accelerating our pace of innovation, including our new global dishwasher architecture featuring the largest capacity 3rd rack dishwasher, Red Dot Award-winning built-in induction cooktop in Europe, new premium top load laundry in North America featuring the Load & Go dispenser, pretreat station and connected options, and lastly we entered the consumables detergent business with the launch of our ultra concentrated Swash detergent.
As the shift to digital continues, consumers continue to desire connected appliances which fit seamlessly into the larger home ecosystem. We are excited to bring new connected products and technologies to market, including voice control, food recognition and automatic laundry detergent replenishment. Whether developed internally or with one of our many collaborators, we believe these digitally-enabled products and services will increasingly enhance the appliance experience for our consumers.
Whirlpool manufactures and markets a full line of major home appliances and related products. Our principal products are laundry appliances (including commercial laundry appliances), refrigerators and freezers, cooking appliances, dishwashers, mixers and other small domestic appliances. Prior to the divestiture of our Embraco business on July 1, 2019, we also produced compressors for refrigeration systems. The following chart provides the percentage of net sales for each of our product categories which accounted for 10% or more of our consolidated net sales over the last three years:
Best Cost Position
As the world's leading kitchen and laundry appliance company, we have a cost benefit on everything we do based on scale, and are committed to a relentlessit includes continuous focus on cost efficiency. Our globalSince 2017, we have delivered substantial gains through reduced complexity in all aspects of our business: research, design, reduced architectures, and reduced footprint. The regional scale enables our local-for-local production model. We are focusedmodel as we continue to focus on producing as efficiently as possible and at scale throughout the world.possible.
As the globalmacro environment continues to change, we believe our demonstrated ability to execute cost takeout allows us to effectively cope with macroeconomic challenges, and we see additional opportunities to further streamline our cost structure. For example,Throughout 2023 we are on acontinued to manage our fixed cost base across manufacturing, logistics and selling, general and administrative expenses while at the same time continuing our portfolio transformation journey. We also continue our journey to reduce the complexity of our designsdesign and product platforms. ThisWe believe this initiative, among many others, will enable us to utilize increased modular production and improved scale in global procurement, and further streamline our day-to-day manufacturing operations.procurement.
We believe our cost position is clearly differentiated in the appliance industry and we are committed to even further improvement, creating strong levels of value for our shareholders, regardless of the external environment. In 2020,
*Whirlpool ownership of the Hotpoint brand in response to COVID-19, we took immediatethe EMEA and decisive action as we announced and executed our cost take-out program, a key driver of our margin expansion duringAsia Pacific regions is not affiliated with the year.Hotpoint brand sold in the Americas.
Value Creation Framework
Our long-term value creation framework is built upon the strong foundation we have in place: our industry-leading brand portfolio and robust product innovation pipeline, supported by our global operating platform and executed by our exceptional employees throughout the world. We measure these
Our long-term value-creation components by focusing on the following key metrics:
| | | | | | | | | | | | | | | | | | | | | | | | | | | | | | | | |
| Profitable Growth | | | Margin Expansion | | | Cash Conversion |
| | | | |
| Innovation-fueled growth at or above
the market | | | Drive cost and price/mix to grow profitability | | | Asset efficiency converts profitable growth to cash |
| ~3% | | | ~10% | | | 6%+ |
| Annual Organic
Net Sales Growth | | | Ongoing EBIT Margin | | | FCF as % of Net Sales |
| | | | | | | | | | |
goals reflect our agile and resilient business model, which enables us to succeed in any operating environment with profitable growth, margin expansion, and cash conversion.Capital Allocation Strategy
We take a balanced approach to capital allocation by focusing on the following key metrics:
| | | | | |
Fund innovation and Growth | Target |
Capital Expenditures | ~3% of net sales |
Research & Development | ~3% of net sales |
Mergers & Acquisitions | Pursue opportunistic M&A with high ROIC |

| | | | | |
Return to Shareholders | Target |
Dividends | ~30% of trailing 12-month ongoing net earnings |
Share Repurchase | Moderate share repurchases; ~$530M authorization remaining (1)
|
Targeted Capital Structure | Maintain strong investment grade rating |
| Gross Debt/EBITDA of 2.0x |
(1)AsIn 2023, we continued our 68th year of December 31, 2020
quarterly dividends, with $384 million in dividends paid in 2023. We continue to prioritize debt repayments, with $500 million of debt repayment in the fourth quarter of 2023. In November 2023, we announced our intention to reduce our ownership interest in our Whirlpool of India subsidiary while maintaining a majority interest, and we expect to utilize the proceeds to further reduce debt levels in 2024. We remain committed to funding innovation and growth and are confident in our ability to effectively managegenerate strong free cash flow. Our free cash flow generation, coupled with our business through macroeconomic volatility and expectbalance sheet strength, provides us the flexibility to continue delivering long-term value forsupport our commitment to returning cash to shareholders.
Regional Business Summary
Overview below includes a summary of our current operating segments relevant for the periods presented in the Consolidated Financial Statements of 2023. Beginning January 1, 2024, we have realigned our operating segments. For additional information, see Note 14 to the Consolidated Financial Statements.
| | | | | |
| North America | •In the United States and Canada, we market and distribute major home appliances and other consumer products primarily under the Whirlpool, KitchenAid, Maytag, KitchenAid,Amana, InSinkErator, JennAir, Amana, Roper, Affresh,affresh, Swash, everydrop and Gladiator brand names primarily to retailers, distributors and builders, as well as enddirectly to consumers. We also market small domestic appliances under the KitchenAid brand name primarily to retailers, distributors and distributors
•In Canada, we market and distribute major home appliances primarily under the Whirlpool, Maytag, JennAir, Amana, Speed Queen and KitchenAid brand names.directly to consumers.
•We sell some products to other manufacturers, distributors, and retailers for resale in North America under those manufacturers' and retailers' respective brand names. |
|
Europe, Middle East and Africa
| •In Europe, we market and distribute our major homedomestic appliances primarilyto retailers, distributors and directly to consumers under the Whirlpool, Indesit, Hotpoint*, Bauknecht, Indesit, Ignis, Maytag and Privileg brand names. We also market major homedomestic appliances and small domestic appliances under the KitchenAidbrand name primarily to retailers and distributors.distributors, as well as directly to consumers for small domestic appliances.
•We market and distribute products under the Whirlpool, Bauknecht, Maytag, Indesit, Amana and Ignis brand names to distributors and dealers in Africa and the Middle East; we exited our commercial operations in Turkey in the second quarter of 2019.East.
•In addition2023, we entered into the contribution agreement with Arçelik to contribute our operations in WesternEuropean major domestic appliance business into a newly formed European appliance company and Central Eastern Europe,into a separate agreement for the sale of the Middle East and Russia, we have a manufacturing operation in TurkeyNorth Africa business, and a sales subsidiary in Morocco.expect to close both transactions by April 2024. |
|
| Latin America | •In Latin America, we produce, market and distribute our major home appliances, small domestic appliances and other consumer products primarily under the Consul, Brastemp, Whirlpool, KitchenAid, Acros, Maytag and Eslabon de Lujo brand names primarily to retailers, distributors and directly to consumers.
•We also serve the countries of Brazil, Mexico, Bolivia, Paraguay, Uruguay, Venezuela,Argentina, Colombia, Chile, and certain Caribbean and Central America countries, where we manage appliancesvia sales and distribution through accredited distributors.
•In July 2019, our Latin America operations sold our compressors business to a third party.
|
|
| Asia | •In Asia, we have organized the marketingmarket and distribution ofdistribute our major home appliances and small domestic appliances in multiple countries, primarily China andnotably in India.
•We market and distribute our products in Asia primarily under the Whirlpool, Elica, Maytag, KitchenAid, Ariston,and Indesit, Bauknecht, Diqua, and Royalstar brand names through a combination of direct sales to appliance retailers and chain stores and through full-service distributors to a large network of retail stores. As
•In May 2021, we sold our rights to use the Sanyo brand name expiredmajority interest in the fourth quarter of 2019 (withWhirlpool China and subsequently retained a limited rightnon-controlling interest. Whirlpool China continues to sell existing inventories until the second quarter of 2020),Whirlpool-branded products through a licensing agreement in China. In September 2021, we have facilitated brand transition with investment to drive Whirlpool brand awarenessacquired a majority interest in China.Elica PB India. |
|
*Whirlpool ownership of the Hotpoint brand in the EMEA and Asia Pacific regions is not affiliated with the Hotpoint brand sold in the Americas.
Competition
Competition in the major home appliance industry is intense, including competitors such as Arcelik, BSH (Bosch), Electrolux, Haier, Kenmore,Hisense, LG, Mabe, Midea, Panasonic and Samsung, among others, many of which are increasingly expanding beyond their existing manufacturing footprint. The competitive environment includes the impact of a changing retail environment, including the shifting of consumer purchase practices towards e-commerce and other channels. Moreover, our customer base includes large, sophisticated trade customers who have many choices and demand competitive products, services and prices.prices, and many of whom have their own brands which compete with our products. We believe that we can best compete in the current environment by focusing on introducing new and innovative products, building strong brands, enhancing trade customer and consumer value with our product and service offerings, meeting or exceeding our emissions and product efficiency commitments, optimizing our regional footprint and trade distribution channels, increasing productivity, improving quality, lowering costs, and taking other efficiency-enhancing measures.
Seasonality
The Company's quarterly revenues have historically been affected by a variety of seasonal factors, including holiday-driven promotional periods. In each fiscal year,Historically, the Company's total revenue and operating margins are typicallyhave been highest in the third and fourth quarter.quarter, and this pattern is more pronounced in our Small Domestic Appliance Global business. In 2020,2022 and 2021, we realized a seasonality pattern that differed from historical periods due to the COVID-19 pandemic.pandemic, supply chain disruptions, and other macroeconomic factors. In 2021, we expect2023, the seasonalityCompany returned to a seasonal pattern of revenuesrevenue and operating margins that was more heavily weighted to be altered by the pandemic.second half of the year, and we expect that pattern to continue into 2024.
Raw Materials and Purchased Components
We are generally not dependent upon any one source for raw materials or purchased componentsOur supplier performance is essential to our business. In areas where a single supplier is used, alternative sources are generally available and can be developed within the normal manufacturing environment. Some supply disruptions and unanticipated costs have been and may be incurred in transitioning to a new supplier if a prior single supplier relationship was abruptly interrupted or terminated. In the event of a disruption, we have been able and believe that we willwould be able to leverage our scale to qualify and use alternate materials, though sometimes at premium costs,costs. In 2022 and that such raw materials and components will be available in adequate quantities to meet forecasted production schedules. In 2020,2021, our industry was impacted by COVID-19 pandemic related supply constraints with our suppliers, factories, and logistics providers.providers, based in significant part on geopolitical developments and macroeconomic factors beyond our control. More specifically, in the fourth quarter of 2022, we experienced a one-off supply chain disruption driving revenue decline in the North America operating segment. In 2021, pandemic related2023, supply chain constraints and disruptions may continue to impact our business operations.inflation moderated, while geopolitical and macroeconomic factors remained volatile in certain countries.
Working Capital
The companyCompany maintains varying levels of working capital throughout the year to support business needs and customer requirements through various inventory management techniques, including demand forecasting and planning. We ended 2020 with an elevated backlog of orders that we expect to normalize throughout 2021. Please seeSee the Financial Condition and Liquidity section of the “Management's Discussion and Analysis” section of this Annual Report on Form 10-K for additional information on our working capital requirements and processes.
Trademarks, Licenses and Patents
We consider the trademarks, copyrights, patents, and trade secrets we own, and the licenses we hold, in the aggregate, to be a valuable asset. Whirlpool is the owner of a number of trademarks in the United States and foreign countries. The mostmost important trademarks to North America are Whirlpool, Maytag, JennAir, KitchenAid, InSinkErator,and Amana. Amana. The most important trademarks to Latin America are Consul, Brastemp, Whirlpool, KitchenAid and Acros. The most important trademark to Asia is Whirlpool.
The most important trademarks to EMEA are Whirlpool, KitchenAid, Bauknecht, Indesit, Hotpoint*and Ignis. The most important trademarks to Latin America are Consul, Brastemp, Whirlpool,KitchenAid and AcrosIgnis. The most importantIn connection with the European major domestic appliance transaction with Arcelik, ownership of the Bauknecht, Indesit, Hotpoint* and Ignis trademarks will transfer to Asia are Whirlpool and Royalstar (the newly formed company, which is licensedalso granted a license to us). sell Whirlpool-branded products in Europe as further set forth below.
We receive royalties from licensing our trademarks to third parties towho manufacture, sell and service certain products bearing the Whirlpool, Maytag, KitchenAidand Amanaand Amanabrand names. As part of the transaction with Arcelik involving the contribution of our European major domestic appliance business, we agreed to a multi-year licensing of the Whirlpool brand to the newly formed company for sales in Europe. We continually apply for and obtain patents globally. The primary purpose in obtaining patents is to protect our designs, technologies, products and services.
Government Regulation and Protection of the Environment
At Whirlpool, we believe our vision to be the world’s best kitchen and laundry company, in constant pursuit of improving life at home, is an urgent call to action. Our commitment to sustainability is guided by this belief and brought to life through the choices and investments we make: to protect our shared environment, to support our employees’ continuous growth and ensure their safety, and to always do our best to uplift our communities. And we are uniquely placed to achieve that.
We know that an environmentally sustainable Whirlpool is a more competitive Whirlpool - a company better positioned for long-term success. Our Environmental, Social and Governance (ESG) strategy is an integral part of our long-term, globally aligned strategic imperatives and operating priorities. It is deeply embedded in our vision, mission and values as an organization. We continuously seek to identify ways to broaden our commitments to ESG efforts and make progress on our goal of making our homes, our communities and our operations better today and in the future.
We are committed to developing innovative products that drive efficiencies in water and energy use and save our consumers’ time. Because we consider consumer preferences and cultural influences, and differences in infrastructure and availability of resources (such as water and energy) in regions where we operate, our approach and impact vary by region. In developed countries such as the U.S. and in Europe, our journey in providing efficient appliances has been one of continuous success over decades of delivering on innovation while not sacrificing performance. In developing countries we are committed to providing solutions specific to those areas, while minimizing the water and energy use of those products. It is these purposeful innovations that have improved the lives of millions of our consumers in meaningful ways. We are also committed to a 20 percent reduction in emissions linked to the use of our products (scope 3 category 11) across the globe by 2030, compared to 2016 levels. This target has been approved by the Science Based Targets initiative, and builds on the Company's earlier reduction in emissions across all scopes since 2005.
In 2021, the Company announced a global commitment to reach a net zero emissions target in its plants and operations (scopes 1 and 2) by 2030, which is expected to cover more than 20 of Whirlpool Corporation's manufacturing sites and its large distribution centers around the world, exclusive of the European manufacturing sites. We expect to achieve this target by generating and consuming renewable energy, including installation of wind turbines, solar panels and investing in off-site renewables through virtual power purchase agreements, improvements in energy efficiency and leveraging carbon removal to offset emissions that cannot be avoided. As of 2023, we are in process of operationalizing two virtual power purchase agreements, which are expected to cover 100% of the electricity consumed by U.S. sites. We are also taking actions to reduce waste material across all global manufacturing facilities, and in 2023 we achieved the gold level for Zero Waste to Landfill (ZWtL) for two new manufacturing sites and maintained Gold or Platinum Level at 100% of our other large global manufacturing sites.
*Whirlpool ownership of the Hotpoint brand in the EMEA and Asia Pacific regions is not affiliated with the Hotpoint brand sold in the Americas.
Government RegulationWe continued a carbon offsetting initiative based on our use of advanced formulation blowing agents with lower global warming potential in refrigerators produced in North America. These conversions allow us to generate tradable environmental assets and Protection ofoperate in the Environment
We know thatvoluntary carbon offsets market by following an environmentally sustainable Whirlpoolapproved American Carbon Registry (ACR) methodology. ACR is a more competitive Whirlpool —leading carbon offset program that has developed environmentally rigorous, science-based offset methodologies for years. Our ACR-registered carbon offsets are sold to external buyers via a company better positionedbroker, and the funds are used to further our initiatives in reducing our carbon footprint through sustainable product development and emissions offsetting. The amount received for long-term success. Our commitment to environmental responsibility is embeddedACR credit sales in our operations,2023 was immaterial. Offset activation, verification, and brokerage was also immaterial in 2023 and is focused on our three pillars: sustainable plants, sustainable products, and sustainable practices. not expected to be material in 2024.
We comply with all laws and regulations regarding protection of the environment, and in many cases where laws and regulations are less restrictive, we have established and are following our own standards, consistent with our commitment to environmental responsibility.
We These compliance requirements tend to pair well with our ESG focus and we believe that we are in compliance, in all material respects, with presently applicable governmental provisions relating to environmental protection in the countries in which we have manufacturing operations. Compliance with these environmental laws and regulations did not have a material effect on capital expenditures, earnings, or our competitive position during 20202023 and is not expected to be material in 2021.2024.
The entire major home appliance industry, including Whirlpool, must contend with the adoption of stricter government energy and environmental standards. These standards have been and continue to be phased in over the past several years and continue to be phased in, and include the general phase-out of ozone-depleting chemicals used in refrigeration, and energy and related standards for selected major appliances, regulatory restrictions on the materials content specified for use in our products by some jurisdictions and mandated recycling of our products and packaging materials at the end of their useful lives. Compliance with these various standards, as they become effective, will increase costs or require some product redesign. However, we believe, based on our understanding of the current state of proposed regulations, that we will be able to develop, manufacture, and market products that comply with these regulations.
Whirlpool participates in environmental assessmentsVarious municipal, state, and cleanup atfederal regulators have discussed, proposed, or enacted new regulations or bans on appliances that utilize natural gas citing climate change and other concerns, which would impose transition costs and impact our product mix and product offerings, among other impacts. We also believe that transition to a numberlower-carbon economy presents opportunities for our business, given our broad-based product portfolio of locations globally. These include operatingresource-efficient appliances, including a full line of electric, natural gas and non-operating facilities, previously owned properties and waste sites, including "Superfund" (under the Comprehensive Environmental Response, Compensation and Liability Act (CERCLA)) sites. However, based upon our evaluation of the facts and circumstances relating to these sites along with the evaluation of our technical consultants, we do not presently anticipate any material adverse effect on our financial statements arising out of the resolution of these matters or the resolution of any other known governmental proceeding regarding environmental protection matters.induction-based appliances.
Our operations are also subject to numerous legal and regulatory requirements concerning product energy usage, data privacy, cybersecurity, employment conditions and worksite health and safety. These requirements often provide broad discretion to government authorities, and they could be interpreted or revised in ways that delay production or make production more costly. The costs to comply, or associated with any noncompliance, are, or can be, significant and variablevary from period to period.
Additionally, in line with the guidelines provided by health organizations around the world and consistent with our commitment to employee health and safety as our highest priority, we have added various health and safety measures in our manufacturing, service, sales and administrative offices, warehouse and distribution spaces in response to the COVID-19 pandemic. These actions include provision of personal protection equipment to employees, increased manufacturing line spacing or protective barriers to accommodate physical distancing guidelines, temperature screening and increased enablement of remote working. We may incur significant COVID-19-related expenses for additional actions in the future, in line with our commitment to employee health and safety.
Human Capital Management
At Whirlpool, our enduring values guide everything we do. We are committed to the highest standards of ethical and legal conduct and have created an environment where open and honest communication is the expectation, not the exception. We hold our employees to this standard and offer the same in return. Our Integrity Manual was created to helphelps our employees follow our commitment to win the
right way. Additionally, our Supplier Code of Conduct formalizes the key principles under which Whirlpool’s suppliers are required to operate.
Our Human Capital Strategy is built around three pillars:
Extraordinary PerformanceEffective and Efficient Organization
Our employees are a critical driver of Whirlpool’s global business results. On December 31, 2020,2023, Whirlpool employed approximately 78,00059,000 employees across 1348 countries, with 27 percent32% located within
the United States. Outside of the United States, our largest employee populations were located within Brazil Mexico and China.Mexico. We regularly monitor various key performance indicators aroundensure that we are aligning our people strategies with the human capitalorganization’s strategic priorities, of attracting, retaining, and engaging our global talent. In addition, we enableenabling the execution of our strategic priorities by providingattracting, developing, engaging and retaining our global talent.
Through our organizational effectiveness practices, we ensure that our organizational design, processes and governance are fit for purpose. We provide all employees with access to training and developmentlearning opportunities to improve critical skill sets.skills, in order to develop the capabilities required to succeed now and into the future.
Great PeopleBest Talent and Leadership
We havebelieve that our talent is a long traditioncompetitive advantage. We invest in attracting the best talent, developing employees’ skills and capabilities, and retaining top talent. We provide robust and challenging career opportunities for employees, which ensures that we build a deep succession bench for our leadership roles.
Development of measuring employee engagement throughleadership acumen within Whirlpool Corporation is critical in ensuring People Leaders at all levels are capable and confident in their ability to bring out the best in our annual employee engagement survey. In 2020,people. At Whirlpool, we migratedbelieve in “Leaders Teaching Leaders'' where our senior leaders are expected to step up and embrace their role in developing our next generation of leaders. As a new survey platform to facilitate more frequent measurements of employee engagement and utilized the platform for a global well-being pulse survey strategy in response to COVID-19. We are committed to continued pulse surveys beginning in 2021 with coverage of broader engagement and well-being topics.
Whirlpool offers a variety of programs globally to protect the health and safetyresult, all of our employees. While we maintain targets for year-over-year reductionformal leadership development programs are internally designed and facilitated by Whirlpool leaders themselves. The benefits of this strategy are multifold; our senior leaders grow continually by playing the total recordable incident raterole of teachers, our next-level leaders learn from their role models’ personal experiences and serious injuries,in turn, our goalorganization builds a leadership engine. Leadership development is always zero. In 2020, we focused ona crucial component of our overall organizational strategy, and will continue to be an area of focus in the immediate demands within the context of COVID-19 challenges. Where possible, employees were moved to a remote work environment. In addition, we implemented additional safeguards in our plants consistent with the guidelines provided by the Centers for Disease Control and Prevention (CDC) and other health organizations around the world.coming years.
Winning Culture
OurWe continually strive to foster a “family feel” culture is underpinned bywhere we are accountable to each other. This means that we live our enduring values which have long been pillared by inclusion and diversity.conduct ourselves in a way that is consistent with the Whirlpool Leadership Model behaviors.
We leverage a multi-faceted employee listening strategy to better understand our employees’ experience and needs, including regular employee engagement pulse surveys that cover broader engagement, belonging and wellbeing topics.
Our employees’ safety and wellbeing is of the utmost importance. Whirlpool has a proud history of prioritizingproviding our employees with comprehensive and competitive benefits packages and we continue to invest in our employees' health and wellbeing. Our global wellbeing strategy focuses on six main pathways– Be healthy; Be you; Be balanced; Be curious; Be prepared; and Be connected, to further empower and support our employees to “Be Well” in all aspects of their lives. In addition, we provide access for all our employees to clinical counselors and guidance on relationships, finances, retirement planning, legal issues such as gender and racialemotional needs. All global employees, regardless of their full-time or part-time status, are eligible for this free well-being benefit.
Whirlpool offers a variety of programs globally to protect the health and safety of our employees. While we maintain targets for year-over-year reduction of the total recordable incident rate and serious injuries, our goal is always zero.
Whirlpool believes in creating a culture of inclusion where all employees feel a sense of belonging. Inclusion and Diversity has been an enduring value at Whirlpool for decades. Our efforts to appreciate all perspectives and backgrounds enables us to understand our diverse consumer base, improve our products so they can be used by everyone, and make our communities stronger. Our value of Inclusion and Diversity includes focused actions to build a diverse workforce, an inclusive workplace and a vibrant ecosystem. Around the world, nineteen Employee Resource Groups support our inclusive culture by providing opportunities for employees to connect with one another, grow personally and professionally, and give back to their communities.
In 2020, Whirlpool committed to an action-based pledge focused on equality amongand fairness, with specific workstreams focused on actions we can take within our people. Forcompany and our communities. Since the past 18 years, Whirlpool Corporation has achievedannouncement of this pledge, we have invested in programs that help drive sustainable, positive impact for employees and local communities. In 2023, these investments included supporting our local community through a perfect 100park restoration on the Corporate Equality Index, marking nearly two decades of commitment to inclusion in the workplace. This broad organizational commitment was again demonstrated in 2020 with extensive participation in our second annual global inclusion week. Additionally, Whirlpool’s employee resource groups (ERGs) continue to raise awareness forJuneteenth Day of Impact , and through the grand opening of an inclusive culture, representing eight under-represented groups80-unit apartment complex in North America; two in our Europe, Middle East, Africa region; four in the Latin America region; and one in Asia.
And, importantly, in 2020 we furthered our commitment by establishing a pledge to Equality and Fairness for our United States Black colleagues. At its core, the pledge is a zero tolerance policy for racial marginalization within the Company. The pledge is a multi-year U.S. based action plan, with regular messaging across the entire organization. While our actions focus on our “four walls” and our local communities, we hope that these actions will have a ripple effect on society at large. In addition, Whirlpool Corporation announced that its Chairman and CEO Marc Bitzer is a founding member of OneTen, a coalition of leading executives with the mission to train, hire and advance one million Black Americans over the next 10 years into family-sustaining jobs withBenton Harbor. This apartment complex, named Emma Jean Hull Flats, provides high quality housing opportunities for advancement.local residents, including discounted leasing for hometown heroes such as emergency personnel and teachers.
Also in 2023 as a part of our pledge for equality and fairness, we continued to enhance our relationship with Florida A&M University. This relationship provides an opportunity for Whirlpool employees to engage with students through mentoring and engineering projects, while also opening opportunities for recruiting top engineering talent from an esteemed Historically Black College & University (HBCU). Hosting a Habitat for Humanity build near Florida A&M University’s campus allowed students, faculty, and local residents to engage with Whirlpool’s employees in new ways.
For additional information, please see Whirlpool’s investor website (www.whirlpoolcorp.com), and forthcoming 20212024 Proxy Statement and 2023 Sustainability Report, which we expect to release in early March 2021.Report. The contents of our Sustainability Report, Proxy Statement (except where noted herein), and investorthe Company's website are not incorporated by reference into this Annual Report on Form 10-K or in any other report or document we file with the SEC.
Other Information
For information about the challenges and risks associated with our foreign operations, see "Risk Factors" under Item 1A.
Whirlpool is a major supplier of laundry, refrigeration, cooking and dishwasher home appliances to Lowe's, a North American retailer. Net sales attributableSales to Lowe's in 2020, 2019 and 2018, wererepresented approximately 13%, 13%14%, and 12%, respectively,13% of our consolidated net sales.sales in 2023, 2022 and 2021, respectively. Lowe's also represented approximately 14%38% and 37% of our consolidated accounts receivable as of December 31, 20202023 and 2019,2022, respectively. See Note 16 to the Consolidated Financial Statements.
For additional information, on our global restructuring plans, and the impact of these plans on our operating segments, see Note 14 to the Consolidated Financial Statements.
Information About Our Executive Officers
The following table sets forth the names and ages of our executive officers on February 11, 2021,14, 2024, the positions and offices they held on that date, and the year they first became executive officers:
| | Name | Name | | Office | | First Became
an Executive
Officer | | Age | Name | | Office | | First Became
an Executive
Officer | | Age |
| Marc R. Bitzer | Marc R. Bitzer | | Chairman of the Board, President and Chief Executive Officer | | 2006 | | 56 | Marc R. Bitzer | | Chairman of the Board and Chief Executive Officer | | 2006 | | 59 |
| James W. Peters | James W. Peters | | Executive Vice President and Chief Financial Officer | | 2016 | | 51 | James W. Peters | | Executive Vice President and Chief Financial Officer and President, Whirlpool Asia | | 2016 | | 54 |
| João C. Brega | | Executive Vice President and President, Whirlpool Latin America | | 2012 | | 57 |
| Joseph T. Liotine | | Executive Vice President and President, Whirlpool North America | | 2014 | | 48 |
| Carey Martin | | Carey Martin | | Executive Vice President and Chief Human Resources Officer | | 2023 | | 47 |
| Gilles Morel | Gilles Morel | | Executive Vice President and President, Whirlpool Europe, Middle East & Africa | | 2019 | | 55 | Gilles Morel | | Executive Vice President and President, Whirlpool Europe, Middle East & Africa | | 2019 | | 58 |
| Shengpo (Samuel) Wu | | Executive Vice President and President, Whirlpool Asia | | 2019 | | 54 |
| Juan Carlos Puente | | Juan Carlos Puente | | Executive Vice President and President, Whirlpool Latin America | | 2023 | | 49 |
| Ava Harter | | Ava Harter | | Executive Vice President and Chief Legal Officer | | 2023 | | 54 |
| Ludovic Beaufils | | Ludovic Beaufils | | Executive Vice President and General Manager, KitchenAid Small Appliances | | 2024 | | 51 |
| Alessandro Perucchetti | | Alessandro Perucchetti | | Executive Vice President and President, Whirlpool North America | | 2024 | | 48 |
The executive officers named above were elected by our Board of Directors to serve in the office indicated until the first meeting of the Board of Directors following the annual meeting of stockholders in 20212024 and until a successor is chosen and qualified or until the executive officer's earlier resignation or removal.
Each of our executive officers has held the position set forth in the table above or has served Whirlpool in various executive or administrative capacities for at least the past five years, except for Mr. WuMorel and Mr. Morel. Prior to joining Whirlpool in February 2017, Mr. Wu for the previous five years served as President and Chief Executive Officer, Asia Pacific, of Osram GmbH, and before joining Osram in 2012, worked for Honeywell Process Solutions and General Electric in various leadership roles.Ms. Harter. Prior to joining Whirlpool in April 2019, Mr. Morel served for two years as CEO of Northern and Central Europe for Groupe Savencia. Prior to that, he worked for 27 years at Mars Inc. in various leadership positions, most recently as Regional President, Europe & Eurasia for Mars Chocolate. Prior to joining Whirlpool in December 2020, Ms. Harter served as senior vice president, general counsel, and corporate secretary of Owens Corning since 2015. Prior to her role at Owens Corning, Ms. Harter held roles of increasing responsibility with General Electric, The Dow Chemical Company, Jones Day, and Thompson Hine LLP.
Available Information
Financial results and investor information (including Whirlpool's Form 10-K, 10-Q, and 8-K reports) are accessible at Whirlpool's investor website: investors.whirlpoolcorp.com.investors.whirlpoolcorp.com. Copies of our Form 10-K, 10-Q, and 8-K reports and amendments, if any, are available free of charge through our website on the same day they are filed with, or furnished to, the Securities and Exchange Commission.
We routinely post important information for investors on our website, whirlpoolcorp.com, in the "Investors" section. We also intend to update the Hot Topics Q&A portion of this webpagewebsite as a means of disclosing material, non-public information and for complying with our disclosure obligations under Regulation FD. Accordingly, investors should monitor the Investors section of our website, in addition to following our press releases, SEC filings, public conference calls,
presentations and webcasts. The information contained on, or that may be accessed through, our webpagewebsite is not incorporated by reference into, and is not a part of, this document.
This report contains statements referring to Whirlpool that are not historical facts and are considered "forward-looking statements" within the meaning of the Private Securities Litigation Reform Act of 1995. These statements, which are intended to take advantage of the "safe harbor" provisions of the Private Securities Litigation Reform Act of 1995, are based on current projections about operations, industry conditions, financial condition and liquidity. Words that identify forward-looking statements include words such as "may," "could," "will," "should," "possible," "plan," "predict," "forecast," "potential," "anticipate," "determine," "estimate," "expect," "project," "intend," "believe," "may impact," "on track," "may affect," “guarantee”, “seek” and the negative of these words and words and terms of similar substance used in connection with any discussion of future operating or financial performance, an acquisition or merger, or our businesses. In addition, any statements that refer to expectations, projections, or other characterizations of future events or circumstances, including any underlying assumptions, are forward-looking statements. Those statements are not guarantees and are subject to risks, uncertainties, and assumptions that are difficult to predict. Therefore, actual results could differ materially and adversely from these forward-looking statements.
We have listed below what we believe to be the most significant pandemic-related, strategic, operational, financial, legal and compliance, and general risks relating to our business.
COVID-19 PANDEMIC RISKS
Our financial condition and results of operations have been impacted and may in the future be adversely affected by the ongoing COVID-19 outbreak.
We continue to closely monitor the impact of the global COVID-19 pandemic on all aspects of our operations and regions, including its effect on our consumers, employees, trade customers, suppliers and distribution channels. In 2020, the pandemic created significant business disruption and economic uncertainty which adversely impacted our manufacturing operations, supply chain, and distribution channels. While the immediate impacts of the COVID-19 pandemic have been assessed, the long-term magnitude and duration of the disruption and resulting decline in global business activity remains uncertain. Many factors that have impacted us and others that will impact us in the future, such as availability of effective treatments and vaccines, are out of our control. The adverse impact of the pandemic is expected to continue and may materially affect our financial statements in future periods.
The impacts of the pandemic include, but are not limited to, the following:
•Production shutdowns and slowdowns because of COVID as well as COVID-related government orders and supply or labor shortages, in individual or collective groups of factories in impacted countries, which have and could in the future result in increased costs and decreased efficiency, and which have and could impact our ability to respond to rapid changes in demand;
•Uncertainty regarding the timing for our production facilities to return to pre-COVID operational speed and production capacity;
•Lack of availability of component materials in our supply chain and an increase in raw material and component costs;
•Recent and potential future reductions in trade customer sales volume, potential trade customer financial restructuring or insolvency, and increases in accounts receivable balances with our trade customer base;
•Potential future impairment in value of certain tangible or intangible assets could be recorded as a result of weaker economic conditions;
•Significant disruption of global financial markets, which could have a negative impact on our ability to access capital in the future, and which, together with operational impacts noted above, necessitated certain liquidity creation and preservation actions as a precautionary measure in 2020;
•Fluctuations in forecasted earnings before tax and corresponding volatility in our effective tax rate;
•Uncertainty with respect to the application of economic stimulus legislation in the U.S. and abroad, including uncertainty regarding impacts to our current global tax positions and future tax planning;
•Operational risk, including but not limited to data privacy and cybersecurity incidents, as a result of salaried workforce extended remote work arrangements, and operational delays as a result of salaried employee furlough and collective vacation actions in certain countries, and restrictions on employee travel;
•Operational disruption if key employees terminate their employment or become ill, as well as diversion of our management team's attention from non-COVID-19 related matters;
•Potential investigations, legal claims or litigation against us for actions we have taken or may take, or decisions we have made or may make, as a consequence of the pandemic; and
•Potential delays in resolving pending legal matters as a result of court, administrative and other closures and delays in many of our regions.
We have not yet determined with certainty the extent to which our existing insurance will respond to these impacts. In addition, we cannot predict the impact that COVID-19 will have on our trade customers, suppliers, consumers, and each of their financial conditions; however, any material effect on these parties could adversely impact us. The impact of COVID-19 may also exacerbate other risks discussed in Item 1A. Risk Factors in this Annual Report on Form 10-K, any of which could have a material adverse effect on our financial statements.
STRATEGIC RISKS
We face intense competition in the major home appliance industry and failure to successfully compete could negativelyadversely affect our business and financial performance.
Each of our operating segments, including our newly reorganized small domestic appliance business effective from January 1, 2024, operates in a highly competitive business environment and faces intense competition from a significant number of competitors, many of which have strong consumer brand equity. Several of these competitors, such as those set forth in the Business section of this annual report,Annual Report on Form 10-K, are large, well-established companies, ranking among the Global Fortune 150.500. We also face competition that may be able to quickly adapt to changing consumer preferences, particularly in the connected appliance space.space, or may be able to adapt more quickly to changes brought about by supply chain constraints, inflationary pressures, currency fluctuations, geopolitical uncertainty, epidemics or pandemics, increased interest rates or other factors. Moreover, our customer base includes large, sophisticated trade customers who have many choices and demand competitive products, services and prices, and which have and may in the future merge, consolidate, form alliances or further increase their relative purchasing scale. Competition in the global appliance industry is based on a number of factors including selling price, product features and design, consumer taste, performance, innovation, reputation, energy efficiency, service, quality, cost, distribution, and financial incentives, such as promotional funds, sales incentives, volume rebates and terms. Many of our competitors are increasingly expanding beyond their existing manufacturing footprints. Our competitors, especially global competitors with low-cost sources of supply, vertically integrated business models and/or highly protected home countries outside the United States, have aggressively priced their products and/or introduced new products to increase market share and expand into new geographies. Many of our competitors have established and may expand their presence in the rapidly changing retail environment, including the shiftingcontinued shift of consumer purchasing practices towards e-commerce and other channels, and the increasing global prevalence of direct-to-consumer sales models. In addition, technological innovation is a significant competitive factor for our products.products, as consumers continually look for new product features that save time, effort, water and energy. We may further be exposed to competitive risks related to the adoption and application of new technologies by established participants or new entrants, and competitive risks from uncertainty driven by changes to trade laws, regulations and policies, including tariffs, sanctions, and import/export controls. If we are unable to successfully
unable to successfully compete in this highly competitive environment, our business and financial performance could be negativelyadversely affected.
The loss of, or substantial decline in, volume of sales to any of our key trade customers, major buying groups, and/or builders could adversely affect our financial performance.
We sell to a sophisticated customer base of large trade customers, including large domestic and international trade customers, that have significant leverage as buyers over their suppliers. Most of our products are not sold through long-term contracts, allowing trade customers to change volume among suppliers like us. As the trade customers continue to become larger through merger, consolidation or organic growth, they have sought and may seek to use their position to improve their profitability by various means, including improved efficiency, lower pricing, and increased promotional programs. IfAs has occurred in the past, if we are unable to meet their demand requirements, our volume growth and financial results could be negativelyadversely affected. We also continue to pursue direct-to-consumer sales globally, including the launch of direct-to-consumer sales on manymost of our brand websites in recent years, which may impact our relationships with existing trade customers. The loss or substantial decline in volume of sales to our key trade customers, major buying groups, builders, or any other trade customers to which we sell a significant amount of products, has adversely affected and in the future could adversely affect our financial performance. Additionally, the loss of market share or financial difficulties, including bankruptcy and financial restructuring, by these trade customers could have a material adverse effect on our financial statements.
Failure to maintain our reputation and brand image could negativelyadversely impact our business.
Our brands have worldwide recognition, and our success depends on our ability to maintain and enhance our brand image and reputation. Maintaining, promoting and growing our brands depends on our marketing efforts, including advertising and consumer campaigns, as well as product innovation. We could be adversely impacted if we fail to achieve any of these objectives or if, whether or not justified, the reputation or image of our company or any of our brands is tarnished or receives negative publicity. In addition, adverse publicity about regulatory or legal action against us, product safety concerns, data privacy breaches or quality issues, inability to meet our net zero or other sustainability goals, or negative association with any one brand could damage our reputation and brand image, undermine our customers' confidence in us and reduce long-term demand for our products, even if the regulatory or legal action is unfounded or not material to our operations.
In addition, our success in maintaining, extending and expanding our brand image depends on our ability to adapt to a rapidly changing media environment, including an ever-increasing reliance on social media and online dissemination of advertising campaigns. Inaccurate or negative posts, comments or commentsreviews have been and may continue to be made about us or our products on social networking and other websites that can spread rapidly through such forums, which could seriously damage our reputation and brand image. If we do not protect, maintain, extend and expand our brand image, then our financial statements could be materially and adversely affected.
An inability to effectively execute and manage our business objectives and global operating platform initiative could adversely affect our financial performance.
The highly competitive nature of our industry requires that we effectively execute and manage our business objectives including our global operating platform initiative. Our global operating platform initiative aims to reduce costs, expand margins, drive productivity and quality improvements, accelerate our rate of innovation, generate free cash flow and drive shareholder value. An inability to effectively control costs and drive productivity improvements could adversely affect our profitability. In addition, an inability to provide high-quality, innovative products could adversely affect our ability to maintain or increase our sales, which could negatively affect our revenues and overall financial performance.
Our abilityAn inability to understand consumers’ preferences and to timely identify, develop, manufacture, market, and sell products that meet customer demand could significantlyadversely affect our business.
Our success is dependent on anticipating and appropriately reacting to changes in consumer preferences, including the shifting of consumer purchasing practices towards e-commerce, direct-to-consumer and other channels, and on successful new product development, including in the eco-efficiency space, the connected appliance space and the digital space, (e.g. our Yummly recipe app), and process development and product relaunches in response to such changes. In addition, the adoption of generative artificial intelligence ("AI") technologies may bring challenges in terms of disruption to both our business model and our existing technology and products. We may further be exposed to competitive risks related to the adoption and application of new technologies by established participants or new entrants, and others. The speed of technological development may prove disruptive if we are unable to maintain the pace of innovation. To compete effectively we must also be responsive to technological change, potential regulatory developments, and public scrutiny. Our future results and our ability to maintain or improve our competitive position will depend on our capacity to gauge the direction of our key product categories and geographic regions and upon our ability to successfully and timely identify, develop, manufacture, market, and sell new or improved products in these changing environments.
Our intellectual property rights are valuable, and any inability to protect them could reduce the value of our products, services and brands.
We consider our intellectual property rights, including patents, trademarks, copyrights and trade secrets, and the licenses we hold, to be a significant and valuable aspect of our business. We attempt to protect our intellectual property rights through a combination of patent, trademark, copyright and trade secret laws, as well as licensing agreements and third partythird-party nondisclosure and assignment agreements.agreements, as well as agreements and policies with our employees and other parties (including non-compete agreements which may become subject to future regulatory action impacting many companies). Our failure to obtainsecure and maintain protection for or adequately protect our trademarks, products, new features of our products, or our processes may diminish our competitiveness.
We have applied for intellectual property protection in the United States and other key jurisdictions with respect to certain innovations and new products, design patents, product features, and processes. We cannot be assured that the U.S. Patent and Trademark Office or any similar authority in other jurisdictions will approve any of our patent applications. Additionally, the patents we own could be challenged or invalidated, others could design around our patents or the patents may not be of sufficient scope or strength to provide us with any meaningful protection or commercial advantage. Further, the laws of certain foreign countries in which we do business, or contemplate doing business in the future, do not recognize intellectual property rights or protect them to the same extent as United States law. These factors could weaken our competitive advantage with respect to our products, services, and brands in foreign jurisdictions, which could adversely affect our financial performance.
Moreover, while we do not believe that any of our products infringe on enforceable intellectual property rights of third parties, others have in the past and may in the future assert intellectual property rights that cover some of our technology, brands, products, or services. Any litigation regarding patents or other intellectual property could be costly and time-consuming and could divert the attention of our management and key personnel from our business operations. Claims of intellectual property infringement might also require us to enter into costly license agreements or modify our products or services. We also may be subject to significant damages, injunctions against the development and sale of certain products or services, or limited in the use of our brands.
In addition, advances in and growing adoption of AI technology may exacerbate intellectual property risks, including the risk that existing intellectual property laws and rights may not provide adequate protection given advances in AI technology. AI may also increase the risk of inadvertent disclosure of Whirlpool's trade secrets and other confidential information as well as the risk that Whirlpool inadvertently infringes upon others' intellectual property rights.
OPERATIONAL RISKS
We face risks associated with our divestitures, acquisitions, and other investments and risks associated with our increased presence in emerging markets.joint ventures.
From time to time, we make strategic divestitures, acquisitions, or divestitures, investments and participate in joint ventures. For example, in 20192022, we solddivested our Embraco compressor business. In addition,operations in Russia and acquired our InSinkErator business from Emerson Electric Co. During the fourth quarter of 2022, we acquired Indesitalso classified our European major domestic appliance business as held for sale, and signed an agreement in January 2023 to contribute our European major domestic appliance business to a majority interest in Hefei Sanyo in 2014.newly formed entity with Arcelik, which transaction we expect to complete by April 2024. These transactions, and other transactions that we have entered into or which we may enter into in the future, can involve significant challenges and risks, including that the transaction does not advance our business strategy or fails to produce a satisfactory return on our investment. We have encountered and may encounter difficulties in integrating acquisitions with our operations, undertaking post-
acquisitionpost-acquisition restructuring activities, applying our internal control processes to these acquisitions, managing strategic investments, and in overseeing the operations, systems, and controls of acquired companies. We have also experienced and may in the future experience entity governance and management difficulties where we hold only a minority or simple majority equity ownership position. Integrating acquisitions and carving out divestitures is often costly, may be dilutive to earnings and may require significant attention from management. There might also be differing or inadequate cybersecurity and data protection controls, which could impact our exposure to data security incidents and potentially increase anticipated costs or time to integrate the business. Furthermore, we may not realize the degree, or timing, of benefits we anticipate when we first enter into a transaction. While our evaluation of any potential transaction includes business, legal, regulatory and financial due diligence with the goal of identifying and evaluating the material risks involved, our due diligence reviews have not always or consistently identified and may not always or consistently in the future identify all of the issues necessary to accurately estimate the cost, time and potential loss contingencies of a particular transaction, including potential exposure to regulatory sanctions resulting from an acquisition target's previous activities, or costs associated with any quality issues with an acquisition target's legacy products.products or difficulties and costs associated with obtaining necessary regulatory approvals. In addition, certain liabilities have in the past and may be in the future retained by Whirlpool when closing a facility, divesting an entity or selling physical assets, and suchcertain of these retained liabilities have been in the past and may be in the future material. For example, we agreed to retain certain liabilities relating to Embraco antitrust, tax, environmental, labor and products in connection with the Embraco sale.sale in 2019. In addition, the current and proposed changes to the U.S. and foreign regulatory approval process and requirements in connection with an acquisition may cause approvals to take longer than anticipated to obtain, not be forthcoming or contain burdensome conditions, which may jeopardize, delay or reduce the anticipated benefits of the transaction to us and could impede the execution of our business strategy.
The ability of our suppliers to deliver parts, components and manufacturing equipment to our manufacturing facilities according to schedule and quality required may impact our ability to manufacture without disruption and could affect product availability and sales.
We use a wide range of materials and components in the global production of our products, which come from numerous suppliers around the world. Because not all of our business arrangements provide for guaranteed supply, and our suppliers also are subject to the economic, social and political conditions in the countries in which they operate and, moreover, some key parts may be available only from single-source unaffiliated third-party suppliers or a limited group of suppliers, we are subject to supply chain risk. In addition, certain proprietary component parts used in some of our products are provided by single-source unaffiliated third-party suppliers. We would be unable to obtain these proprietary components for an indeterminate period of time if these single-source suppliers were to cease or interrupt production or otherwise fail to supply these components to us as agreed, which could adversely affect our product sales and operating results.
Our operations and those of our suppliers are subject to disruption for a variety of unexpected reasons, including, but not limited to, sudden changes in business conditions, supplier plant shutdowns or slowdowns, transportation delays due to port delays or any disruption on the supply chain, work stoppages, epidemics and pandemics, labor shortages, labor relations, global geopolitical instability, price inflation, governmental regulatory and enforcement actions, intellectual property claims against suppliers, disputes with suppliers, distributors or transportation providers, financial issues such as supplier bankruptcy, information technology failures, hazards such as fire, earthquakes, flooding, or other natural disasters, including due to climate change, and increased homeland security requirements in the U.S. and other countries. For example, we expect to continue to be impacted by supply chain issues, due to factors largely beyond our control: a global shortage of certain components, such as select semiconductors, a strain on raw materials and input cost inflation, all of which began easing towards the end of 2022, but could escalate again in future quarters. These issues have delayed and could in the future delay importation and increase the cost of products and/or components or require us to locate alternative providers to avoid disruption to customers. These alternatives have not always been and in the future may not be available on short notice and have in the past and in the future could result in higher transit costs and stock availability, which could have an adverse impact on our business and financial statements. Additionally, we are subject to our suppliers’ capabilities to accurately forecast and manage their production and supply chains and consistently supply us with parts and other raw materials, which can impact our operations given the combination of potential issues including sourcing thousands of parts globally from numerous suppliers in multiple countries.
The inability to timely convert our backlog due to supply chain disruptions subjects us to pricing and product availability risks and its conversion into revenue. If our suppliers are unable to effectively recover parts and components and we are unable to effectively manage the impacts of price inflation and timely convert our backlog, our financial statements could materially and adversely be affected.
The lack of availability of any parts, components or equipment has resulted and could in the future result in production delays and sales disruptions, as well as our ability to fulfill contractual obligations. Unexpected disruption risks as such cannot be completely eliminated due to our reliance on suppliers’ performance to consistently build and ship products to customers.
Our ability to continue to identify and to eliminate single failure points within the supply chain remains one of our priorities in order to reduce risks related to third party suppliers and macroeconomic, environmental, political or social potential unforecastable disruptions.
Insurance for certain disruptions may not be available, affordable or adequate. The effects of climate change, including extreme weather events, long-term changes in temperature levels and water availability may exacerbate these risks. Such disruption has in the past and could in the future interrupt our ability to manufacture certain products. Any significant supply chain disruption for the reasons stated above or otherwise could have a material adverse impact on our financial statements.
Our financial condition and results of operations have been impacted by the COVID-19 pandemic and may in the future be adversely affected by other public health emergencies, epidemics or pandemics.
Beginning in 2020, the pandemic created significant business disruption and economic uncertainty which has impacted us in subsequent years. A resurgence or development of new strains of COVID-19, or other public health emergencies, epidemics or pandemics, could negatively impact our global operations, trade customers, suppliers, consumers, and each of their financial conditions. The extent to which public health emergencies, epidemics or pandemics, could impact our business, results of operations, financial condition or liquidity is highly uncertain and may materially affect our financial statements in future periods, and may also exacerbate other risks discussed elsewhere in Item 1A. Risk Factors in this Annual Report on Form 10-K, any of which could have a material adverse effect on our financial statements.
We face risks associated with our presence in emerging markets.
Our growth plans include efforts to increase revenue from emerging markets, including through acquisitions. Local business practices in these countries may not comply with U.S. laws, local laws or other laws applicable to us or our compliance policies, and non-compliant practices may result in increased liability risks. For example, we may incur unanticipated costs, expenses or other liabilities as a result of an acquisition target's violation of applicable laws, such as the U.S. Foreign Corrupt Practices Act (FCPA), the U.K. Bribery Act, and/or similar worldwide anti-briberyanti-bribery/anti-corruption laws in non-U.S. jurisdictions. We may incur unanticipated costs or expenses, including post-closing asset impairment charges, expenses associated with eliminating duplicate facilities, litigation, and other liabilities. For example, we incurred significant impairment and restructuring expenses in the years following our acquisition of Indesit in 2014. In addition, our recent acquisitions have and future acquisitions may increase our exposure to other risks associated with operating internationally, including foreign currency exchange rate fluctuations; political, legal and economic instability; inflation; changes in tax rates and tax laws; and work stoppages and labor relations.relations, in addition to other risks discussed elsewhere in Item 1A. Risk Factors in this Annual Report on Form 10-K.
Risks associated with our international operations may decrease our revenues and increase our costs.
For the year ended December 31, 2020,2023, sales outside our North America region represented approximately 42%41% of our net sales. We expect that international sales will continue to account for a significant percentage of our net sales. Accordingly, we have faced and continue to face numerous risks associated with conducting international operations, any of which could negatively affect our financial performance. These risks include the following:
•COVID-19-relatedPandemic-related shutdowns, the timing, availability and effectiveness of treatments and vaccines, and other pandemic-related uncertainties in the countries in which we operate;
•Political, legal, and economic instability and uncertainty;uncertainty, including the ongoing conflict between Russia and Ukraine, Israel and Palestine, the Red Sea conflict and its impact on shipping and logistics and other global conflicts, including tensions between China and the United States;
•Foreign currency exchange rate fluctuations;
•Changes in foreign tax rules, regulations and other requirements, such as changes in tax rates and statutory and judicial interpretations of tax laws;
•Changes in diplomatic and trade relationships, including sanctions and related regulations resulting from the current political situation in countries in which we do business;
•Inflation and/or deflation;deflation, and changes in interest rates;
•Changes in foreign country regulatory requirements, including data privacy laws;
•Various import/export restrictions and disruptions and the availability of required import/export licenses;
•Imposition of tariffs and other trade barriers;
•Managing widespread operations and enforcing internal policies and procedures such as compliance with U.S. and foreign anti-bribery, anti-corruption regulations, and anti-money laundering regulations, such as the FCPA, U.K. Bribery Act, and antitrust laws;
•Labor disputes, labor shortages and work stoppages at our operations and suppliers;
•Government price controls;
•Trade customer insolvency and the inability to collect accounts receivable; and
•Limitations on the repatriation or movement of earnings and cashcash; and
As a•Various U.S. corporation, weand non-U.S. laws and regulations specific to and/or focused on requirements to ensure the non-use of forced labor and child labor within our supply chain, as well as compliance with various applicable human rights laws and regulations.
We are subject to the FCPA, U.K. Bribery Act, and other similar non-U.S. laws and regulations, which may place us at a competitive disadvantage to foreign companies that are not subject to similar regulations. Additionally, any suspicion or determination that we have violated the FCPA, U.K. Bribery Act, or other anti-bribery and/or anti-corruption laws could have a material adverse effect on us.
On August 31, 2022, we completed the sale of our Russian business to Arcelik and recorded a loss on disposal. We continue to closely monitor the impact of the ongoing conflict between Russia and Ukraine on all aspects of our operations, including most importantly, the safety and security of our employees in the region. The impact of the conflict between Russia and Ukraine and resulting sanctions and export controls, include, but are not limited to, macro financial impacts resulting from the exclusion of Russian financial institutions from the global banking system; operational risks, including potential logistics, sales, distribution, and energy related challenges; and reductions in consumer and trade customer demand. We cannot guarantee that a violation of sanctions or export controls will not occur in the future, and we may experience potential additional impacts in the future. Sanctions and export control laws may also have an indirect adverse effect on our business. Sanctions against Russia have contributed to adverse changes in the global price and availability of certain raw materials, which has and could reduce our sales and earnings or otherwise have an adverse effect on our operations, and any future additional export controls or sanctions imposed by the United States, United Kingdom, the European Union, or other countries could further exacerbate these effects. We may also experience potential additional impacts in the future.
We have not determined the extent to which any of the United States, European Union or other government actions may mitigate these impacts, if at all. Moreover, our insurance coverage may not respond to many of these impacts.
Risks associated with unanticipated social, political and/or economic events may materially and adversely impact our business.
Terrorist attacks, cyber events, armed conflicts (including the war in Ukraine discussed elsewhere in Risk Factors and other global conflicts), bank failures, civil unrest, espionage, natural disasters, governmental actions, epidemics and pandemics (including the impacts of COVID-19 discussed elsewhere in Risk Factors) have and could affect our domestic and international sales, disrupt our supply chain, and impair our ability to produce and deliver our products. SuchMany of such events have impacted and could directly impact our physical facilities or those of our suppliers or customers.
We have been and may be subject to information technology system failures, network disruptions, cybersecurity attacks and breaches in data security, which may materially adversely affect our operations, financial condition and operating results.
We depend on information technology to improve the effectiveness of our operations, and to interface with our customers, consumers and employees, as well asto maintain the continuity of our manufacturing operations, and to maintain financial accuracy and efficiency. In addition, we collect, store, have access to and otherwise process certain confidential or sensitive data, including proprietary business information, personal data or other information that is subject to privacy and security laws, regulations and/or customer-imposed controls. Our business processes and data sharing across functions, suppliers and vendors is dependent on information technology integration.system availability. Our systems may depend, directly or indirectly, on software developed by third parties (such as open source libraries or vendor software) and we may have limited visibility into the robustness of the security practices followed during design, development, or remediation of this third party software. The failure of any such systems, whether internal or third-party, during normal operation, system upgrades, implementations, or connections, could disrupt our operations by causing transaction errors, processing inefficiencies, delays or cancellation of customer orders, the loss of customers, impediments to the manufacture or shipment of products, other financial and business disruptions, oremployee relations issues, the
loss of or damage to intellectual property and the personally identifiableunauthorized disclosure or compromise of personal data of consumers and employees.employees or of commercially sensitive information.
In addition, we have outsourced certain information technology support services and administrative functions, such as system application maintenance and certain benefit plan administration functions to third-party service providers and may outsource otheradditional functions in the future to achieve cost savings and efficiencies.future. If these service providers do not perform effectively or experience failures, we may experience similar issues depending on the function involved. In addition, we may not achieve the expected cost savings of outsourcing and may incur additional costs to correct errors made by such service providers. Depending on the function involved, such errors may also lead to business disruption, processing inefficiencies or the loss of or damage to intellectual property and personally identifiable information through system compromise, or harm employee morale.
Our information systems, or those of our third-party service providers, have been in the past and could be in the future impacted by inappropriatemalicious activity of partiesthreat actors intent on extracting or corrupting information or disrupting business processes, or by inadvertent data security-compromisingunintentional data-compromising activities by our employees or service providers. SuchThe use of generative AI technologies could lead to the unauthorized disclosure of sensitive, proprietary, or confidential information, inadvertent infringement of intellectual property owned by third parties, and could lead to new potential cyberattack methods for third parties.
Unauthorized access has in the past and could in the future disrupt our business, and result in the loss of assets.assets, expose the company to potential litigation and/or regulatory liability, and adversely affect our reputation. Cyber attacks are becoming more sophisticated and include malicious software, including ransomware attacks, attempts to gain unauthorized access to data, social engineering and other electronic security breaches that have in the past and could in the future lead to disruptions in availability of critical systems, unauthorized release of confidential or otherwise protected information, and corruption of data. Our growth in the areas of direct-to-consumer sales and connected appliances and the(the "Internet of Things," as well asThings"), and increasingly advanced data processing capabilities, accompanied by increasing handling of consumer information, and our reliance on pandemic-driven
remote work arrangements, has increased these risks. These events have in the past and could in the future impact our customers, consumers, employees, third-partiesthird parties and reputation and have in the past and could in the future lead to financial losses from remediation actions, loss of business or potential litigation or regulatory liability or an increase in expense.expenses. While we have not yet experienced any material impacts from a cyber attack, any one or more future cyber attacks could have a material adverse effect on our financial statements. Further, market dynamics are increasingly driving heightened cybersecurity protections and mandating cybersecurity standards in our products, and we may incur additional costs to address these increased risks and to comply with such demands.
Product-related liability or product recall costs could adversely affect our business and financial performance.
We have been and may in the future be exposed to product-related liabilities, which in some instances may result in product redesigns, product recalls, or other corrective action. In addition, any claim, product recall or other corrective action that results in significant adverse publicity, particularly if those claims or recalls cause customers to question the safety or reliability of our products, may negativelyadversely affect our financial statements. For example, we have undertaken corrective action initiatives in EMEA related to certain legacy Indesit-designed washer and Indesit-produced dryers. We maintain product liability insurance, but it may not be adequate to cover losses related to product liability claims brought against us. Product liability insurance could become more expensive and difficult to maintain andor may not be available on commercially reasonable terms, if at all. We are now and may in the future be involved in class action litigation orand may be involved in product recalls for which we generally have not purchased insurance, and may be involved in other litigation or events for which insurance products may have limitations.
We regularly engage in investigations of potential quality and safety issues as part of our ongoing effort to deliver quality products to our customers. We are currently investigating certain potential quality and safety issues globally, and as appropriate, we undertake to effect repair or replacement of appliances in the event that an investigation leads to the conclusion that such action is warranted. Actual costs of these and any future issues depend upon several factors, including the number of consumers who respond to a particular recall, repair and administrative costs, whether the cost of any corrective action is borne by us or the supplier, and, if borne by us, whether we will be successful in recovering our costs from the supplier. The actual costs incurred as a result of these issues and any future issues could have a material adverse effect on our financial statements.
The ability of suppliers to deliver parts, components and manufacturing equipment to our manufacturing facilities, and our ability to manufacture without disruption, could affect our global business performance.
We use a wide range of materials and components in the global production of our products, which come from numerous suppliers around the world. Because not all of our business arrangements provide for guaranteed supply and some key parts may be available only from a single supplier or a limited group of suppliers, we are subject to supply and pricing risk. In addition, certain proprietary component parts used in some of our products are provided by single-source unaffiliated third-party suppliers. We would be unable to obtain these proprietary components for an indeterminate period of time if these single-source suppliers were to cease or interrupt production or otherwise fail to supply these components to us, which could adversely affect our product sales and operating results. Our operations and those of our suppliers are subject to disruption for a variety of reasons, including COVID-19-related supplier plant shutdowns or slowdowns, work stoppages, labor relations, intellectual property claims against suppliers, financial issues such as supplier bankruptcy, information technology failures, and hazards such as fire, earthquakes, flooding, or other natural disasters. Insurance for certain disruptions may not be available, affordable or adequate. The effects of climate change, including extreme weather events, long-term changes in temperature levels and water availability may exacerbate these risks. Such disruption has in the past and could in the future interrupt our ability to manufacture certain products. Any significant disruption could negatively impact our financial statements.
Our ability to attract, develop and retain executives and other qualified employees is crucial to our results of operations and future growth.
We depend upon the continued services and performance of our key executives, senior management and skilled personnel, particularly professionals with experience in our business, and operations, engineering, technology and the home appliance industry. While we strive to attract, develop and retain these individuals through execution of our human capital strategy, (see “Human Capital Management” in Item 1), we cannot be sure that any of these individuals will continue to be employed by us. In the case of talent losses, significant time is required to hire, develop and train skilled replacement personnel. For additional information about our human capital strategy, see "Human Capital Management" in Item 1 of this Annual Report on Form 10-K. We must also attract, develop, and retain individuals with the requisite engineering and technical expertise to develop new technologies and introduce new products particularlyand services.
Like many other companies, we are subject to fluctuations in the availability of qualified labor in certain key positions. As an example, in today's labor market, it is challenging to attract and retain qualified talent for key roles within the company, which could lead to increased wage inflation or impede our ability to execute certain key strategic initiatives as we increase investmentrespond to this labor shortage.
A shortage of key employees can jeopardize our ability to implement our business objectives, and changes in key executives can result in loss of continuity, loss of accumulated knowledge, departures of other key employees, disruptions to our digitaloperations and “Internet of Things” capabilities.inefficiencies during transition periods. In addition, if we are unable to enforce certain non-compete covenants and confidentiality provisions when key employees leave for a competitor, we may lose a competitive advantage arising from confidential and proprietary company information known to such former employees. An inability to hire, develop, transfer retained knowledge, engage and retain a sufficient number of qualified employees could materially hinder our business by, for example, delaying our ability to bring new products and services to market or impairing the success of our operations, which could adversely affect our results of operations.
A deterioration in labor relations could adversely impact our global business.
As of December 31, 2020,2023, we had approximately 78,000 employees.59,000 employees globally. We are subject to separate collective bargaining agreements with certain labor unions, as well as various other commitments regarding our workforce. We periodically negotiate with certain unions representing our employees and may be subject to work stoppages or may be unable to renew collective bargaining agreements on the same or similar terms, or at all. In addition, our global restructuring activities have in the past and may in the future be received negatively by governments and unions and attract negative media attention, which may delay the implementation of such plans. A deterioration in labor relations may have a material adverse effect on our financial statements.
FINANCIAL RISKS
Fluctuations and volatility in the cost and availability of raw materials and purchased components could adversely affect our operating results.results of operation.
The sources and prices of the primary materials (such as steel, resins, and base metals) used to manufacture our products and components containing those materials are susceptible to significant global and regional price fluctuations or availability due to inflation, supply and demand trends, the COVID-19 pandemic, transportation and fuel costs, port and shipping capacity, labor costs or disputes, government regulations, including increased homeland security requirements, and tariffs, changes in currency exchange rates and interest rates, price controls, the economic climate, severe weather, climate change and other unforeseen circumstances. For example, we experienced significant raw material inflation in 2021 and 2022, respectively, in addition to many other cost increases throughout our business. In addition, we engage in contract negotiations and enter into commodity swap contracts to manage risk associated with certain commodities purchases.purchases, and we have in the past and may in the future experience losses based on commodity price changes. Significant increases in materials costscost and availability and other costs now and in the future could have a material adverse effect on our financial statements. As an example, in recent years the company has experienced and may in the future experience significant levels of commodity, logistics and wage inflation across our businesses. We have responded to these inflationary factors with strong cost reduction initiatives and cost-based price increases. An inability to respond to inflationary pressures effectively could have a material adverse effect on our financial statements.
Foreign currency fluctuations may affect our financial performance.
We generate a significant portion of our revenue and incur a significant portion of our expenses in foreign currencies. Changes in the exchange rates of functional currencies of those operations affect the U.S. dollar value of our revenue and earnings from our foreign operations. We use currency forwards, net investment hedges, and options to manage our foreign currency transaction exposures. We cannot completely eliminate our exposure to foreign currency fluctuations, which have and may adversely affect our financial performance. In addition, because our consolidated financial results are reported in U.S. dollars, as we generate sales or earnings in other currencies, the translation of those results into U.S. dollars can result in a significant increase or decrease in the amount of those sales or earnings. Finally, the amount of legal contingencies related to foreign operations may fluctuate significantly based upon changes in exchange rates and usually cannot be managed with currency forwards, options or other arrangements. Such fluctuations in exchange rates can significantly increase or decrease the
amount of any legal contingency related to our foreign operations and make it difficult to assess and manage the potential exposure.
Goodwill and indefinite-lived intangible asset impairment charges have in the past and may in the future adversely affect our operating results.
We have a substantial amount of goodwill and indefinite-lived intangible assets, primarily trademarks, on our balance sheet. We test the goodwill and intangible assets for impairment on an annual basis and when events occur or circumstances change that indicate that the fair value of the reporting unit or intangible asset may be below its carrying amount. Fair value determinations require considerable judgment and are sensitive to inherent uncertainties and changes in estimates and assumptions regarding revenue growth rates, EBIT margins, capital expenditures, working capital requirements, tax rates, terminal growth rates, discount rates, royalty rates, benefits associated with a taxable transaction and synergies available to market participants. Declines in market conditions, a trend of weaker than anticipated financial performance for our reporting units or declines in projected revenue for our trademarks, a decline in our share price for a sustained period of time, an increase in the market-based weighted average cost of capital or a decrease in royalty rates, among other factors, are indicators that the carrying value of our goodwill or indefinite-lifeindefinite-lived intangible assets may not be recoverable. We recorded an immateriala goodwill impairment charge related tofor our EMEA reporting unit of $278 million and recorded an impairment charge of $106 million for certain other intangiblesintangible assets, each during the second quarter of 2022. In the fourth quarter of 2022, and in connection with the planned divestiture of our European major domestic appliance business, the remaining carrying value of $255 million for the year ended December 31, 2020EMEA trademarks
was classified as held for sale. During the fourth quarter of 2022, we completed the acquisition of the InSinkErator business and as a result recorded an increase in goodwill of $1.1 billion and an impairmentincrease of $747 million related to goodwill ($579 million) and other intangibles ($168 million) for the year ended December 31, 2018 related to the EMEA reporting unit.intangible assets of $1.6 billion. We may in the future be required to record a goodwill or intangible asset impairment charge that, if incurred, could have a material adverse effect on our financial statements.
Impairment of long-lived assets may adversely affect our operating results.
Our long-lived asset groups are subject to an impairment assessment when certain triggering events or circumstances indicate that their carrying value may be impaired. If the carrying value exceeds our estimate of future undiscounted cash flows of the operations related to the asset group, an impairment is recorded for the difference between the carrying amount and the fair value of the asset group. The results of these tests for potential impairment have in the past and may in the future be adversely affected by unfavorable market conditions, our financial performance trends, or an increase in interest rates, among other factors. If as a result of the impairment test we determine that the fair value of any of our long-lived asset groups is less than its carrying amount, we may incur an impairment charge that could have a material adverse effect on our financial statements.
We face inventory valuation risk.
We write down product and component inventories that have become obsolete or do not meet anticipated demand or net realizable value. No assurance can be given that, given the unpredictable pace of product obsolescence and business conditions with trade customers and in general, we will not incur additional inventory related charges. Such charges could negativelyadversely affect our financial statements.
Significant differences between actual results and estimates of the amount of future funding for our pension plans and postretirement health care benefit programs, and significant changes in funding assumptions or significant increases in funding obligations due to regulatory changes, could adversely affect our financial results.
We have both funded and unfunded defined benefit pension plans that cover certain employees around the world. We also have unfunded postretirement health care benefit plans for eligible retired employees. The Employee Retirement Income Security Act of 1974 (ERISA) and the Internal Revenue Code, as amended, govern the funding obligations for our U.S. pension plans, which are our principal pension plans. Our U.S. defined benefit plans were frozen on or before December 31, 2006 for substantially all participants. Since 2007, U.S. employees have been eligible for an enhanced employer contribution under Whirlpool'sour defined contribution (401(k)) plan.
As of December 31, 2020,2023, our projected benefit obligations under our pension plans and postretirement health and welfare benefit programs exceeded the fair value of plan assets by an aggregate of approximately $0.7$0.3 billion, including $0.5$0.2 billion of which was attributable to pension plans and $0.2$0.1 billionof which was attributable to postretirement health care benefits. Estimates for the amount and timing of the future funding obligations of these pension plans and postretirement health and welfare benefit plans are based on various assumptions, including discount rates, expected long-term rate of return on plan assets, life expectancies and health care cost trend rates. These assumptions are subject to change based on changes in interest rates on high quality bonds, stock and bond market returns, health care cost trend rates and regulatory changes, all of which are largely outside our control. Significant differences in results or significant changes in assumptions may materially affect our postretirement obligations and related future contributions and expenses.
Changes in the method of determining the London Interbank Offered Rate, or LIBOR, or the replacement of LIBOR with one or more alternative reference rates, could adversely affect our financial condition and results of operations.
Certain of our financial obligations and instruments are or may be made at variable interest rates that use LIBOR (or metrics derived from or related to LIBOR) as a benchmark. On July 27, 2017, the United Kingdom's Financial Conduct Authority announced that it intends to stop persuading or compelling banks to submit LIBOR rates after 2021. On November 18, 2020, ICE Benchmark Administration (“IBA”) announced that all LIBOR rates for certain currencies (other than U.S. Dollar LIBOR (“USD LIBOR”) would cease publication at the end of 2021. On November 30, 2020, IBA announced that, following a consultation period, it intends to announce that for USD LIBOR, it intends to cease publication of 1-week and 2-month LIBOR at the end of 2021 and that it does not intend to cease publication of other tenors of USD LIBOR until June 30, 2023. Regulators are generally supportive of these announcements and confident that USD LIBOR will remain a “representative” rate pursuant to procedures to be adopted, which could include new or alternative methods of determining LIBOR.
The pending cessation of LIBOR for various currencies at the end of 2021 (and in 2023 for certain tenors of USD LIBOR) will also result in replacement rates being used more widely, including in the instruments documenting certain of our financial obligations. For example, in the U.S., a group convened by the Federal Reserve Board and the Federal Reserve Bank of New York, called the Alternative Reference Rate Committee ("ARRC") and comprised of a diverse set of private sector entities, has identified the Secured Overnight Financing Rate (or "SOFR") as its preferred alternative rate for the U.S. LIBOR and the Federal Reserve Bank of New York has begun publishing SOFR daily. Many banks in the U.S. have begun entering into transactions where interest is determined based on SOFR or plan to do so during the course of 2021, as recommended by ARRC and certain regulators. Additionally, many financial contracts, including some which govern our financial obligations, include replacement alternatives for LIBOR upon the cessation of LIBOR. It is possible that some U.S. lenders will elect to use alternative rates other than SOFR. Central banks in several other jurisdictions have also announced plans for alternative reference rates for other currencies.
The potential consequences of these changes cannot be fully predicted and could have an adverse impact on the market value for LIBOR-linked securities, loans, and other financial obligations or extensions of credit held by or due to us, and could adversely affect our financial statements. Changes in market interest rates may influence our financing costs, returns on financial investments and the valuation of derivative contracts and could reduce our earnings and cash flows. In addition, any transaction process could involve, among other things, increased volatility or illiquidity in markets for instruments that rely on LIBOR, reductions in the value of certain instruments, mismatches between rates in hedging documentation and in the documentation for the underlying obligation being hedged, increased borrowing costs, uncertainty under applicable documentation, and/or difficult and costly consent processes.
LEGAL & COMPLIANCE RISKS
Unfavorable results of legal and regulatory proceedings could materially adversely affect our business and financial condition and performance.
We are or may in the future become subject to a variety of litigation and legal compliance risks relating to, among other things: products; intellectual property rights; income and indirect taxes; environmental matters;matters (including matters related to climate change); corporate matters; commercial
matters; credit matters; competition laws; distribution, marketing and trade practice matters; customs and duties; occupational health and safety (including matters related to the COVID-19 pandemic), industrial accidents, anti–bribery and anti–corruption regulations; energy regulations; data privacy and cybersecurity regulations; financial and securities regulations; and employment and benefit matters. For example, we are currently disputing certain income and indirect tax related assessments issued by the Brazilian authorities (see Note 8 and Note 15); we are disputing a proposed IRS income tax assessment in the United States Sixth Circuit Court of Appeals (see Note 15);authorities; and we are disputing certain income and indirect tax assessments in various legal proceedings in Italy, India and other jurisdictions globally. For additional information about certain income and indirect tax related assessments issued by the Brazilian authorities, see Note 7 to the Consolidated Financial Statements. Unfavorable outcomes regarding these assessments could have a material adverse effect on our financial statements in any particular reporting period. Results of legal and regulatory proceedings cannot be predicted with certainty and for some matters, such as class actions, no insurance is cost-effectively available. Regardless of merit, legal and regulatory proceedings may be both time-consuming and disruptive to our operations and could divert the attention of our management and key personnel from our business operations. Such proceedings could also generate significant adversenegative publicity and have a negative impact on our reputation and brand image, regardless of the existence or amount of liability. We estimate loss contingencies and establish accruals as required by generally accepted accounting principles,GAAP, based on our assessment of contingencies where liability is deemed probable and reasonably estimable, in light of the facts and circumstances known to us at a particular point in time. Subsequent developments in legal proceedings, volatility in foreign currency exchange rates and other factors may affect our assessment and estimates of the loss contingency recorded and could result in an adverse effect on our results of operations in the period in which a liability would be recognized or cash flows for the period in which amounts would be paid. Actual results may significantly vary from our reserves. We may experience additional delays in resolving these matters as a result of COVID-19-related administrative and judicial system temporary delays.
We are subject to, and could be further subject to, governmental investigations or actions by other third parties.
We are subject to various federal, foreign and state laws, including antitrust and product-related laws and regulations, violations of which can involve civil or criminal sanctions. Responding to governmental investigations or other actions may be both time-consuming and disruptive to our operations and could divert the attention of our management and key personnel from our business operations. For example, the second part of a French Competition Authority investigation, which is expected to focusfocused primarily on manufacturer interactions with retailers, is ongoing.currently expected to be completed in the first half of 2024 (see Note 7 to the Consolidated Financial Statements). The impact of these and other investigations and lawsuits could have a material adverse effect on our financial statements.statements and harm our reputation.
Changes in the legal and regulatory environment, including data privacy potential climateand protection, corporate governance and securities disclosure, and changes to tax and foreign trade laws, regulations and changes in taxes and tariffs,policy, could limit our business activities, increase our operating costs, reduce demand for our products or result in litigation.litigation or regulatory action.
The conduct of our businesses, and the production, distribution, sale, advertising, labeling, safety, transportation and use of many of our products, are subject to various laws and regulations administered by federal, state and local governmental agencies in the United States, as well as to foreign laws and regulations administered by government entities and agencies in countries in which we operate. Compliance with these regulations may require us to, among other things, change our manufacturing processes or product offerings, or undertake other costly activities. In addition, we operate in an environment in which there are different and potentially conflicting data privacy and data accessprotection laws in effect in the various U.S. states and foreign jurisdictions in which we operate and we must understand and comply with each law and standard in each of these jurisdictions while ensuring the data is secure.jurisdictions. For example, the European Union’s General Data Protection Regulation, which became effective in May 2018, the
California Consumer Privacy Act of 2018, which came into effect on January 1, 2020, and the California Privacy RightsBrazilian General Data Protection Law, and Enforcement Act, which will become effective on January 1, 2023,various other privacy and data protection laws that have been passed or are pending in other states and countries collectively impose or will impose new regulatory data privacy and protection standards forwith which we must comply. These expanding privacy and data protection laws may affect our collection, processing, and cross-border transfer of consumer information and other personal data, such as in connection with our growth in the areas of direct-to-consumer sales, Internet of Things, and the digital space. Some
of the laws allow for significant fines, reaching several percentage points of global corporate revenues or more. These laws and regulations may change, sometimes dramatically, as a result of political, economic or social events. Changes in laws, regulations or governmental policy and the related interpretations may alter the environment in which we do business and may impact our results or increase our costs or liabilities. Additionally, we could be subjected to future liabilities, fines or penalties or the suspension of production for failing to comply, or being alleged as failing to comply, with various laws and regulations, including environmental regulations. In addition, some jurisdictions are considering regulatory frameworks for generative artificial intelligence that implicate data protection laws.
Certain reforms and proposed reforms to U.S. federal corporate governance and securities laws may relate to or impact our business and may cause us to incur additional obligations and compliance costs. For example, new SEC rules regarding cybersecurity require disclosure on Form 8-K of the nature, scope and timing of any material cybersecurity incident and the reasonably likely impact of such incident.
Additionally, as a global company headquartered in the United States, we are exposed to the impact of U.S. and global tax changes, especially those that affect our effective corporate income tax rate and various non-income taxes that impact our business operations. It is possible that the U.S. or another jurisdiction could enact tax legislation in the future that could have a material impact on our tax rate, our operations or both.
The Organization for Economic Co-operation and Development (the “OECD”) continues to design its base erosion and profit shifting initiatives (the “BEPS”), which is intended to modernize the international tax system by, among other measures, ensuring that large multinational enterprises pay a minimum level of tax in each of the jurisdictions in which they operate.The minimum tax aspects of BEPS, referred to as “Pillar Two”, is scheduled to become effective in 2024. Pillar Two addresses the risk of profit shifting to entities in low tax jurisdictions by introducing a global minimum tax rate of 15%. While Pillar Two is not expected to have a material impact on our corporate income tax rate, it is expected to increase our costs incurred to track, collect, and report such taxes.
In addition, we incurthe current domestic and will continueinternational political environment, including government shutdowns and changes to trade laws, regulations and policies, including tariffs, sanctions, and import/export controls, has resulted in uncertainty surrounding the future state of the global economy. Many of our most significant competitors are global companies, and in an escalating global trade conflict or the imposition of tariffs, sanctions or other trade restrictions their respective governments may impose regulations or policies that are favorable to our competitors. The U.S. federal government may propose additional changes to international trade agreements, tariffs, taxes, and other government rules and regulations. These regulatory or policy changes could significantly impact our business and financial performance. For additional information about our consolidated tax provision, see Note 13 to the Consolidated Financial Statements.
The impact of climate change and climate change or other environmental regulation may adversely impact our business.
The effects of climate change, whether involving physical risks (such as extreme weather events, long-term changes in temperature levels, water availability and risk sea levels) or transition risks, could have an impact on our business and have in the past and could in the future impact our business and cause us to incur capital and other expenditures to comply with various laws and regulations, especially relating to the protection of the environment, human health and safety, and water and energy efficiency.efficiency, and may also exacerbate other risks discussed elsewhere in Item 1A. Risk Factors in this Annual Report on Form 10-K, which could have an adverse effect on our business. Climate change regulations at the federal, state or local level, or in international jurisdictions, or customer or consumer preferences or expectations, could require us to limit emissions, change our manufacturing processes or product offerings, or undertake other costly activities. Globally, a lack of harmonization in relation to ESG legal and regulatory reform across the jurisdictions in which we operate may affect our future implementation of, and compliance with,
rapidly developing ESG standards and requirements, such as the European Union's Corporate Sustainable Reporting Directive.
In addition, various municipal, state, and federal regulators have discussed, proposed, or enacted new regulations or bans on appliances that utilize natural gas citing climate change and other concerns, which would impose transition costs and impact our product mix and product offerings, among other impacts. We recognize that making changes to our supply chain, manufacturing processes and product offerings can and does introduce transition risks. Among these are the risk that our more efficient product offerings are not competitive in terms of price or consumer perception; the risk that our upstream suppliers are unable to deliver lower emissions sources of supply that are cost and quality-competitive; the risk that we fail to continually innovate to develop products and manufacturing processes with a lower carbon footprint; and, specific to our recycled plastics initiative (a pledge in EMEA to use an average 30% recycled plastic content by 2025), the risk that we fail to develop solutions to incorporate reformulated plastics materials that meet our rigorous quality and safety standards.
The entire major home appliance industry, including Whirlpool, must contend with the adoption of stricter government energy and related standards for selected major appliances, including recent issued U.S. Department of Energy appliance efficiency standards. Compliance with these various standards, as they become effective, is expected to increase costs or require some product redesign. We are also subject to global regulations related to chemical substances and materials in our products (such as the U.S. Toxic Substances Control Act), which may require us to modify the materials used in our products or undertake activities which may have a cost impact. There is also increased focus by governmental and non-governmental entities on sustainability matters. In addition, a number of governmental bodies have finalized, proposed or are contemplating additional legislative and regulatory changes in response to the potential effects of climate change. In particular, cleanup obligations that might arise at any of our manufacturing sites or the imposition of more stringent environmental laws in the future could adversely affect our business.
We have set rigorous science-based targets for greenhouse gas reductions and related sustainability goals, including a net zero emissions target in our plants and operations that was announced in 2021. These targets could prove more costly or difficult to achieve than we expect, and we may be unable to achieve these targets or any other sustainability goal or commitment at acceptable cost or at all. Whether as a result of cost, operational or technological limitations, or if such targets or our progress against them are not perceived to be sufficiently robust, any failure to achieve our sustainability goals or reduce our impact on the environment, any changes in the scientific or governmental metrics utilized to objectively measure success, or the perception that we have failed to act responsibly regarding climate change could result in negative publicity and adversely affect our reputation as well as our relationships with customers, investors and other stakeholders, which could in turn adversely affect our business operations, reputation, including a reduction in customer and reputation.consumer sentiment and negatively impact our financial condition, including our access to capital and cost of debt. In addition, not all of our competitors may seek to establish climate or other ESG targets and goals, or at a comparable level to ours, which could result in our competitors achieving competitive advantages through lower supply chain or operating costs, which could adversely affect our business, results of operations, financial condition and prospects.
Increasingly, different stakeholder groups have divergent views on sustainability and ESG matters, which increases the risk that any action or lack thereof with respect to sustainability or ESG matters will be perceived negatively by at least some stakeholders and adversely impact our reputation and business. Anti-ESG sentiment has gained some momentum across the United States, with several states having enacted or proposed "anti-ESG" policies or legislation. If we do not successfully manage ESG-related expectations across stakeholders, it could erode stakeholder trust, impact our reputation and adversely affect our business.
Additionally, any failure in our procedures to monitor climate-related regulatory and policy changes in the jurisdictions in which we could be subjectedoperate or in our processes and tools to future liabilities, fines or penalties or the suspensiontrack our greenhouse gas emissions and assess both operational and financial impacts of product production for failing to comply, or being alleged as failingclimate-related regulations, and any failure to comply with any such regulations and policies, could subject us to additional costs and
penalties and harm to our reputation. Violations of environmental, health and safety laws are subject to civil, and, in some cases, criminal sanctions. As a result of these various laws and regulations, including environmental regulations. Cleanup obligations that might arise at any of our manufacturing sitesuncertainties, we may incur unexpected interruptions to operations, fines, penalties or the imposition of more stringent environmental lawsother reductions in the futureincome which could also adversely affect us.
Additionally, as a global company based in the United States, we are exposed to the impact of U.S. tax changes, especially those that affect the effective corporate income tax rate. In addition, the current domestic and international political environment, including government shutdowns and changes to U.S. policies related to global trade and tariffs, has resulted in uncertainty surrounding the future state of the global economy. Many of our most significant competitors are global companies, and in an escalating global trade conflict or the imposition of tariffs, their respective governments may impose regulations that are favorable to our competitors. The U.S. federal government may propose additional changes to international trade agreements, tariffs, taxes, and other government rules and regulations. These regulatory changes could significantly impact our business, financial condition and financial performance. For additional information aboutresults of operations, and harm our consolidated tax provision, see Note 15 to the Consolidated Financial Statements, and for additional information about global trade and tariffs, please see "Other Matters" in the Management's Discussion and Analysis section of this Annual Report on Form 10-K.reputation.
GENERAL RISKS
We are exposed to risks associated with the uncertain global economy.
The current domestic and international political and economic environment are posing challenges to the industry in which we operate. A number of economic factors, including the impact of the COVID-19 pandemic, gross domestic product, availability of consumer credit, interest rates, consumer sentiment and debt levels, retail trends, housing starts, sales of existing homes, the level of mortgage refinancing and defaults, fiscal and credit market uncertainty, and foreign currency exchange rates, currency controls, inflation and deflation, generally affect demand for our products in the U.S. and other countries which we operate.
Economic uncertainty and related factors, including a potential recession, may exacerbate negative trends in business and consumer spending and has caused in the past and may cause in the future certain customers to push out, cancel, or refrain from placing orders for our products. Uncertain market conditions, inflation, increases in interest rates, difficulties in obtaining capital, or
reduced profitability has caused and may cause some customers to scale back operations, exit markets, merge with other retailers, or file for bankruptcy protection and potentially cease operations, which can also result in lower sales and/or additional inventory. These conditions have affected and may similarly affect key suppliers, which could impair their ability to deliver parts and result in delays for our products or added costs.
A decline in economic activity and conditions in certain areas in which we operate have had an adverse effect on our financial condition and results of operations in recent years, and future declines and adverse conditions could have a similar adverse effect. Regional, political and economic instability in countries in which we do business may adversely affect business conditions, disrupt our operations, and have an adverse effect on our financial condition and results of operations. For example,In addition, we expect to continue to be impacted by the effect of the UK's exit from the European Union (“Brexit”), despite their December 2020 trade agreement, remains uncertain and could adversely impact certain areas of our business, including, but not limited to, an increaseglobal supply chain issues discussed elsewhere in duties and delaysItem 1A. Risk Factors in the delivery of products, and adverse impacts to our suppliers and financing institutions.this Annual Report on Form 10-K.
Uncertainty about future economic and industry conditions also makes it more challenging for us to forecast our operating results, make business decisions, and identify and prioritize the risks that may adversely affect our businesses, sources and uses of cash, financial condition and results of operations. We may be required to implement additional cost reduction efforts, including restructuring activities, which may adversely affect our ability to capitalize on opportunities in a market recovery. In addition, our operations are subject to general credit, liquidity, foreign exchange, market and interest rate risks. Our ability to access liquidity or borrow to invest in our businesses, fund strategic acquisitions and refinance maturing debt obligations depends in part on access to the capital markets. For example, the United States Federal Reserve began raising its benchmark rate in March 2022, increasing the rate by a total of 5.25% since the start of 2022. Such increases and any future increases may, among other things, reduce the availability and increase the costs of obtaining new variable rate debt and refinancing existing indebtedness, and adversely affect our financial condition and results of operations. If inflation increases costs beyond our ability to control, we may not be able to adjust prices or use our portfolio strategy to sufficiently offset the effect without negatively impacting consumer demand or our gross margin.
If we do not timely and appropriately adapt to changes resulting from the uncertain macroeconomic environment and industry conditions, or to difficulties in the financial markets, or if we are unable to continue to access the capital markets, our financial statements may be materially and adversely affected.
| | | | | |
| ITEM 1B. | UNRESOLVED STAFF COMMENTS |
None.
Information Security Risk Management and Strategy
Our Board of Directors (“Board”) is responsible for overseeing risk management at Whirlpool, which is the responsibility of our Executive Vice President and Chief Financial Officer. Our risk management process is designed to identify, prioritize, and monitor risks that could affect our ability to execute our corporate strategy and fulfill our business objectives and to appropriately mitigate such risks.
As part of our risk management processes, we perform risk assessments in which we map and prioritize information security risks identified through the processes described above, including risks associated with our use of third-party service providers, based on probability, immediacy and potential magnitude. These assessments inform our risk mitigation strategies, which are reviewed regularly with the Board and management, and we view information security risks as one of the key risk categories we face. For example, our information technology and infrastructure has experienced and may in the future be vulnerable to cyberattacks (including ransomware attacks) or security incidents, and third parties have in the past and may in the future be able to access proprietary business information, and personal data that we collect, store and process. For more information regarding the information security-related risks we face, see the information in “Item 1A: Risk Factors” under the caption “We have been and may be subject to information technology system failures, network disruptions, cybersecurity attacks and breaches in data security, which may materially adversely affect our operations, financial condition and operating results”.
Our risk mitigation process assesses, prioritizes, and monitors information security risks and vulnerabilities and helps ensure risk mitigation efforts are embedded across our business. Among other things, our internal experts regularly conduct audits and tests of our information systems and our cybersecurity program is periodically assisted by established, independent third party consultants, who provide assistance through tabletop and other preparedness exercises. We also review information security threat information published by government entities and other organizations in which we participate and actively engage with suppliers, industry associations, key thought leaders and law enforcement communities as part of our continuous efforts to evaluate and enhance the effectiveness of our cybersecurity program. In 2022, we launched and required all salaried employees to complete a mandatory Global Cybersecurity and Privacy training, covering information security, end-user security policies, remote working, phishing and email security and digital threats. This training was enhanced with additional topics in 2023 around social media, social engineering, and breach response, among others. Additionally, we maintain regular publications on cyber awareness on our Company portal and conduct ongoing simulated phishing exercises. We use the findings from these and other processes to improve our information security practices, procedures and technologies. In 2023, we implemented additional management governance through the creation of a Global Cybersecurity and Data Privacy Steering Committee, which meets periodically to help ensure information security risks and vulnerabilities are being appropriately managed and mitigated. In addition, we maintain insurance to protect against potential losses arising from an information security incident.
While we have not yet experienced any material impacts from a cyber attack, any one or more future cyber attacks could materially adversely impact the Company, including a loss of trust among our customers and consumers, departures of key employees, general diminishment of our global reputation and financial losses from remediation actions, loss of business or potential litigation or regulatory liability. Further, evolving market dynamics are increasingly driving heightened cybersecurity protections and mandating cybersecurity standards for our products, and we may incur additional costs to address these increased risks and to comply with such demands.
In addition to the risk management processes identified above, Whirlpool also maintains active knowledge security and data privacy programs. Leveraging policies and governance, ongoing
training and awareness as well as strong controls and systems-based approaches, these programs help ensure that Whirlpool confidential information is protected and that the company complies with applicable data privacy and data protection laws in all countries where we do business.
Information Security Governance and Oversight
Our risk management process and information security risk mitigation framework enables our Board and management to establish a mutual understanding of the effectiveness of our information security risk management practices and capabilities, including the division of responsibilities for reviewing our information security risk exposure and risk tolerance, tracking emerging information risks and ensuring proper escalation of certain key risks for periodic review by the Board and its committees.
As part of its broader risk oversight activities, the Board oversees risks from information security threats, both directly and through the Audit Committee of the Board (the “Audit Committee”). As reflected in its charter, the Audit Committee assists the Board in its oversight of risk by periodically reviewing policies and guidelines with respect to risk assessment and risk management, including management reports on our processes to manage and report risks. As another element of its risk oversight activities, the Audit Committee receives reports quarterly from our Global Chief Information Officer (“CIO”) and Global Chief Information Security Officer (“CISO”) on the execution and effectiveness of our cybersecurity and privacy program, cybersecurity incidents, cyber resilience metrics and the global threat landscape. The Audit Committee also oversees our internal control over financial reporting, including with respect to financial reporting-related information systems.
Our CISO, who manages our cybersecurity program, reports to our CIO regularly on how certain information security risks are being managed and progress towards agreed mitigation goals, as well as any potential material risks from cybersecurity threats. The CIO and CISO discuss these matters with our Audit Committee who reports to the Board on the substance of its reviews and discussions. In addition to these discussions, each year our CIO and CISO present to our Board on cybersecurity related trends and program updates. Our CIO and CISO are also responsible for prioritizing risk mitigation activities and developing a culture of risk-aware practices with strong support from management. Both our CIO and CISO have extensive background and expertise in information security, having served in senior leadership positions in the information and information security spaces, respectively, for many years prior to joining Whirlpool.
The day-to-day monitoring, identification, and assessment of information security risks and incident response functions are managed centrally by our core cyber incident response team (the “CIRT”), which operationalizes our Cyber Incident Response Plan (the “Plan”). The Plan includes processes to triage, assess severity of, escalate, contain, investigate and remediate information security incidents, including those associated with our third-party service providers, as well as to comply with potentially applicable legal obligations and mitigate brand and reputational damage. Under the Plan, the CIRT may escalate matters as necessary to our CISO and CIO, Chief Legal Officer, and other senior leadership, depending on the severity classification of the incident.
In addition to the ordinary-course Board and Audit Committee reporting and oversight described above, we also maintain disclosure controls and procedures designed for prompt reporting to the Board and timely public disclosure, as appropriate, of material events covered by our risk management framework, including information security risks.
Our principal executive offices are located in Benton Harbor, Michigan. On December 31, 2020,2023, our principal manufacturing operations were carried on at 3534 locations in 1310 countries worldwide. We occupied a total of approximately 8266 million square feet devoted to manufacturing, service, sales and administrative offices, warehouse and distribution space. Over 44 million square feet of such space was occupied under lease. Whirlpool properties include facilities which are suitable and adequate for the manufacture and distribution of Whirlpool's products.
The Company's principal manufacturing locations by operating segment were as follows:
| | Operating Segment | Operating Segment | North America | Europe, Middle East and Africa | Latin America | Asia | Operating Segment | North America | Europe, Middle East and Africa | Latin America | Asia |
| Manufacturing Locations | Manufacturing Locations | 10 | 11 | 9 | 5 | Manufacturing Locations | 11 | 9 | 8 | 6 |
Information regarding legal proceedings can be found in Note 87 to the Consolidated Financial Statements and is incorporated herein by reference. Pursuant to the SEC regulation, the Company will use a threshold of $1 million for purposes of determining whether disclosure of certain environmental proceedings covered by the regulation is required.
| | | | | |
| ITEM 4. | MINE SAFETY DISCLOSURES |
Not applicable.
| | | | | |
| ITEM 5. | MARKET FOR REGISTRANT'S COMMON EQUITY, RELATED STOCKHOLDER MATTERS AND ISSUER PURCHASES OF EQUITY SECURITIES |
Whirlpool's common stock is listed on the New York Stock Exchange and the NYSE Chicago Stock Exchange under the ticker symbol WHR. As of February 5, 2021,9, 2024, the number of holders of record of Whirlpool common stock was approximately 8,409.7,426.
On July 25, 2017,April 19, 2021, our Board of Directors authorized an additionala share repurchase program of up to $2 billion. Forbillion, which has no expiration date. On February 14, 2022, the yearBoard of Directors authorized an additional $2 billion in share repurchases under the Company's ongoing share repurchase program. We did not repurchase any shares during the twelve months ended December 31, 2020, we repurchased 902,000 shares at an aggregate purchase price of approximately $121 million under this program.2023. At December 31, 2020,2023, there were approximately $531 million$2.6 billion in remaining funds authorized under this program.these programs.
Share repurchases are made from time to time on the open market as conditions warrant. These programs do not obligate us to repurchase any of our shares and they have no expiration date.
The following table summarizes repurchases of Whirlpool's common stock in the three months ended December 31, 2020:2023:
| | | | | | | | | | | | | | | | | |
| Period (Millions of dollars, except number and price per share) | Total Number of Shares Purchased | Average Price Paid per Share | Total Number of Shares Purchased as Part of Publicly Announced Plans or Programs | Approximate Dollar Value of Shares that May Yet Be Purchased Under the Plans |
October 1, 20202023 through October 31, 20202023 | — | | | $— | — | | $ | 5312,587 | |
November 1, 20202023 through November 30, 20202023 | — | | | — | — | | 5312,587 | |
December 1, 20202023 through December 31, 20202023 | — | | | — | — | | $2,587 | | 531 |
| Total | — | | | $ | — | | |
None.
| | | | | |
ITEM 6. | SELECTED FINANCIAL DATA |
FIVE-YEAR SELECTED FINANCIAL DATA
| | | | | | | | | | | | | | | | | | | | | | | | | | | | | | | | |
| (Millions of dollars, except share and employee data) | | 2020 | | 2019 | | 2018 | | 2017 | | 2016 |
| CONSOLIDATED OPERATIONS | | | | | | | | | | |
| Net sales | | $ | 19,456 | | | $ | 20,419 | | | $ | 21,037 | | | $ | 21,253 | | | $ | 20,718 | |
| Gross margin | | 3,850 | | | 3,533 | | | 3,537 | | | 3,602 | | | 3,692 | |
| Restructuring costs | | 288 | | | 188 | | | 247 | | | 275 | | | 173 | |
| Impairment of goodwill and other intangibles | | 7 | | | — | | | 747 | | | — | | | — | |
| (Gain) loss on sale and disposal of businesses | | (7) | | | (437) | | | — | | | — | | | — | |
| Depreciation and amortization | | 568 | | | 587 | | | 645 | | | 654 | | | 655 | |
| Operating profit | | 1,623 | | | 1,571 | | | 279 | | | 1,136 | | | 1,368 | |
| Earnings (loss) before income taxes | | 1,455 | | | 1,552 | | | (21) | | | 887 | | | 1,114 | |
| Net earnings (loss) | | 1,071 | | | 1,198 | | | (159) | | | 337 | | | 928 | |
| Net earnings (loss) available to Whirlpool | | 1,081 | | | 1,184 | | | (183) | | | 350 | | | 888 | |
| Capital expenditures | | 410 | | | 532 | | | 590 | | | 684 | | | 660 | |
| Dividends paid | | 311 | | | 305 | | | 306 | | | 312 | | | 294 | |
| Repurchase of common stock | | 121 | | | 148 | | | 1,153 | | | 750 | | | 525 | |
| CONSOLIDATED FINANCIAL POSITION | | | | | | | | | | |
| Current assets | | $ | 9,015 | | | $ | 7,398 | | | $ | 7,898 | | | $ | 7,930 | | | $ | 7,339 | |
| Current liabilities | | 8,330 | | | 8,369 | | | 9,678 | | | 8,505 | | | 7,662 | |
| Accounts receivable, inventories and accounts payable, net | | 461 | | | 89 | | | 256 | | | 856 | | | 918 | |
| Property, net | | 3,199 | | | 3,301 | | | 3,414 | | | 4,033 | | | 3,810 | |
Total assets(1) | | 20,350 | | | 18,881 | | | 18,347 | | | 20,038 | | | 19,153 | |
| Long-term debt | | 5,059 | | | 4,140 | | | 4,046 | | | 4,392 | | | 3,876 | |
Total debt(2) | | 5,369 | | | 4,993 | | | 6,027 | | | 5,218 | | | 4,470 | |
| Whirlpool stockholders' equity | | 3,799 | | | 3,195 | | | 2,291 | | | 4,198 | | | 4,773 | |
| PER SHARE DATA | | | | | | | | | | |
| Basic net earnings (loss) available to Whirlpool | | $ | 17.24 | | | $ | 18.60 | | | $ | (2.72) | | | $ | 4.78 | | | $ | 11.67 | |
| Diluted net earnings (loss) available to Whirlpool | | 17.07 | | | 18.45 | | | (2.72) | | | 4.70 | | | 11.50 | |
| Dividends | | 4.85 | | | 4.75 | | | 4.55 | | | 4.30 | | | 3.90 | |
Book value(3) | | 60.00 | | | 49.77 | | | 34.08 | | | 56.42 | | | 61.82 | |
| Closing Stock Price at December 31—NYSE | | 180.49 | | | 147.53 | | | 106.87 | | | 168.64 | | | 181.77 | |
| KEY RATIOS | | | | | | | | | | |
| Operating profit margin | | 8.3 | % | | 7.7 | % | | 1.3 | % | | 5.3 | % | | 6.6 | % |
Pre-tax margin(4) | | 7.5 | % | | 7.6 | % | | (0.1) | % | | 4.2 | % | | 5.4 | % |
Net margin(5) | | 5.6 | % | | 5.8 | % | | (0.9) | % | | 1.6 | % | | 4.3 | % |
Return on average Whirlpool stockholders' equity(6) | | 30.9 | % | | 43.2 | % | | (5.6) | % | | 7.8 | % | | 18.7 | % |
Return on average total assets(7) | | 5.5 | % | | 6.4 | % | | (1.0) | % | | 1.8 | % | | 4.7 | % |
| Current assets to current liabilities | | 1.1 | | | 0.9 | | | 0.8 | | | 0.9 | | | 1.0 | |
Total debt as a percent of invested capital(8) | | 53.3 | % | | 54.8 | % | | 65.3 | % | | 50.4 | % | | 43.8 | % |
Price earnings ratio(9) | | 10.6 | | | 8.0 | | | (39.3) | | | 35.9 | | | 15.8 | |
| OTHER DATA | | | | | | | | | | |
| Common shares outstanding (in thousands): | | | | | | | | | | |
| Average number - on a diluted basis | | 63,317 | | | 64,199 | | | 67,225 | | | 74,400 | | | 77,211 | |
| Year-end common shares outstanding | | 62,793 | | | 62,894 | | | 63,528 | | | 70,646 | | | 74,465 | |
| Year-end number of stockholders | | 8,449 | | | 8,804 | | | 9,248 | | | 9,960 | | | 10,528 | |
| Year-end number of employees | | 78,000 | | | 77,000 | | | 92,000 | | | 92,000 | | | 93,000 | |
Five-year annualized total return to stockholders(10) | | 7.3 | % | | (2.7) | % | | (5.1) | % | | 13.0 | % | | 33.6 | % |
(1)Total assets for 2020 and 2019 includes the impact related to ASC 842 for leases adopted as of January 1, 2019. See Note 3 to the Consolidated Financial Statements for additional information.
(2)Total debt includes notes payable, current maturities of long-term debt and long-term debt.
(3)Total Whirlpool stockholders' equity divided by average number of shares on a diluted basis.
(4)Earnings (loss) before income taxes, as a percent of net sales. 2019 includes the effect of a $437 million gain on sale and disposal of businesses, a $180 million gain related to Brazil indirect tax credits and a $105 million charge related to product warranty expense on EMEA-produced washers. See Note 8, Note 11, Note 14 and Note 17 to the Consolidated Financial Statements for additional information. 2018 includes the effect of a $747 million impairment charge of goodwill and other intangibles and a $103 million charge related to the French Competition Authority (FCA) settlement agreement. See Note 6 and Note 8 to the Consolidated Financial Statements for additional information.
(5)Net earnings (loss) available to Whirlpool, as a percent of net sales. 2019 includes the effect of a $437 million gain on sale and disposal of businesses, a $180 million gain related to Brazil indirect tax credits a $105 million charge related to product warranty expense on EMEA-produced washers. See Note 8, Note 11, Note 14 and Note 17 to the Consolidated Financial Statements for additional information. 2018 includes the effect of a $747 million impairment charge of goodwill and other intangibles and a $103 million charge related to the French Competition Authority (FCA) settlement agreement. See Note 6 and Note 8 to the Consolidated Financial Statements for additional information.
(6)Net earnings (loss) available to Whirlpool, divided by average Whirlpool stockholders' equity. 2019 includes the effect of a $437 million gain on sale and disposal of businesses, a $180 million gain related to Brazil indirect tax credits and a $105 million charge related to product warranty expense on EMEA-produced washers. See Note 8, Note 11, Note 14 and Note 17 to the Consolidated Financial Statements for additional information. 2018 includes the effect of a $747 million impairment charge of goodwill and other intangibles and a $103 million charge related to the French Competition Authority (FCA) settlement agreement. See Note 6 and Note 8 to the Consolidated Financial Statements for additional information.
(7)Net earnings (loss) available to Whirlpool, divided by average total assets. 2019 includes the effect of a $437 million gain on sale and disposal of businesses, a $180 million gain related to Brazil indirect tax credits and a $105 million charge related to product warranty expense on EMEA-produced washers. See Note 8, Note 11, Note 14 and Note 17 to the Consolidated Financial Statements for additional information. 2018 includes the effect of a $747 million impairment charge of goodwill and other intangibles and a $103 million charge related to the French Competition Authority (FCA) settlement agreement. See Note 6 and Note 8 to the Consolidated Financial Statements for additional information.
(8)Total debt divided by total debt and total stockholders' equity.
(9)Closing stock price divided by diluted net earnings (loss) available to Whirlpool.
(10)Stock appreciation plus reinvested dividends, divided by share price at the beginning of the period.
| | | | | |
| ITEM 7. | MANAGEMENT'S DISCUSSION AND ANALYSIS OF FINANCIAL CONDITION AND RESULTS OF OPERATIONS |
ThisThe following Management Discussion and Analysis of Financial Condition and Results of Operations (MD&A) is intended to promote understanding of the results of operations and financial condition of the Company and generally discusses the results of operations for the current year compared to prior two years. MD&A is provided as a supplement to, and should be read in connection with, the Consolidated Financial Statements and Notes to the Consolidated Financial Statements and Selected Financial Data included in this Form 10-K.
Certain references to particular information in the Notes to the Consolidated Financial Statements are made to assist readers.
OVERVIEW
Whirlpool delivered full-yearsaw GAAP net earnings available to Whirlpool of $1.1 billion$481 million (net earnings margin of 5.6%2.5%), or $17.07$8.72 per share, compared to GAAP net earningsloss available to Whirlpool of $1.2 billion$(1,519) (net earningsloss margin of 5.8%(7.7)%), or $18.45$(27.18) per share in the same prior-year period, primarily due to noncash loss related to the planned contribution of our European major domestic appliance business recorded in 2022. Whirlpool delivered ongoing (non-GAAP) earnings per share of $16.16 and full-year ongoing EBIT margin of 6.1%, compared to $19.64 and 6.9% in the same prior-year period.
On a GAAP basis, net earnings margins were impacted by increased restructuring costs. Instrong cost take out actions and improved supply chain performance, more than offset by negative price/mix, currency and continued marketing and technology investments, and the conclusion of the strategic review of EMEA in 2022. On an ongoing basis, Whirlpool's results were impacted primarily by the same prior-year period, the approximately $511 million gain on the saledrivers of our Embraco compressor business favorably impacted net earnings available to Whirlpool. Solid cashstrong cost take out actions and improved supply chain performance, more than offset by negative price/mix, currency and continued marketing and technology investments.
Cash provided by operating activities of $1.5 billion,$915 million, compared to $1.2$1.4 billion in 2019, was driven by higher earnings and working capital improvement.
Despite ongoing disruptions from COVID-19, Whirlpool delivered ongoing (non-GAAP) earnings per share of $18.55 and full-year ongoing EBIT margin of 9.1%, compared to $16.00 and 6.9% in the same prior-year period. These results were driven by positive price/mix, strong cost takeout, and raw material deflation, partially offset by increased brand investments and currency. In addition, we delivered record2022, alongside free cash flow (non-GAAP) of $1.2 billion$366 million in 2020,2023, compared to $912$820 million in 2019,2022, was primarily driven by stronglower earnings and lowerreduced working capital expenditures. Lastly, we strengthened our balance sheet and made strong progress toward our long-term gross debt leverage target. conversion.
Please see "Non-GAAP Financial Measures" elsewhere in this Management's Discussion and Analysis for a reconciliation of these non-GAAP financial measures to their equivalent GAAP measures.
We are very pleased with the successful execution of our go-to-market initiatives, new product introductions and the successful execution of our cost-takeout program. Lastly, the strong actions
MANAGEMENT'S DISCUSSION AND ANALYSIS OF FINANCIAL CONDITION AND
RESULTS OF OPERATIONS - (CONTINUED)
RESULTS OF OPERATIONS
The following table summarizes the consolidated results of operations:
| | | | | | | | | | | | | | | | | | | | | | | | | | | | | | | | |
| | December 31, |
| Consolidated - In Millions (except per share data) | | 2023 | | Better/(Worse) % | | 2022 | | Better/(Worse) % | | 2021 |
| Net sales | | $ | 19,455 | | | (1.4)% | | $ | 19,724 | | | (10.3)% | | $ | 21,985 | |
| Gross margin | | 3,170 | | | 3.2 | | 3,073 | | | (30.3) | | 4,409 | |
| Selling, general and administrative | | 1,993 | | | (9.5) | | 1,820 | | | 12.5 | | 2,081 | |
| Restructuring costs | | 16 | | | 23.8 | | 21 | | | 44.7 | | 38 | |
| Impairment of goodwill and other intangibles | | — | | | nm | | 384 | | | nm | | — | |
| (Gain) loss on sale and disposal of businesses | | 106 | | | nm | | 1,869 | | | nm | | (105) | |
| Interest and sundry (income) expense | | 71 | | | nm | | (19) | | | (88.1) | | (159) | |
| Interest expense | | 351 | | | (84.7) | | 190 | | | (8.6) | | 175 | |
| Income tax expense | | 77 | | | 70.9 | | 265 | | | 48.8 | | 518 | |
| Net earnings available to Whirlpool | | 481 | | | nm | | (1,519) | | | nm | | 1,783 | |
| Diluted net earnings available to Whirlpool per share | | $ | 8.72 | | | nm | | $ | (27.18) | | | nm | | $ | 28.36 | |
nm: not meaningful
Consolidated net sales for 2023 decreased by 1.4% compared to 2022, primarily driven by the unfavorable impact of product price/mix, partially offset by increased volume and the acquisition of the InSinkErator business. Excluding the impact of foreign currency, net sales for 2023 decreased 1.7% compared to 2022. Consolidated net sales for 2022 decreased 10.3% compared to 2021, primarily driven by lower volumes, divestiture of our Russia business and the impact of foreign currency, partially offset by the favorable impact of product/price mix. Excluding the impact of foreign currency, net sales for 2022 decreased 8.1% compared to 2021.
The chart below summarizes the balance of net sales by operating segment for 2023, 2022 and 2021, respectively.
The consolidated gross margin percentage for 2023 increased to 16.3% compared to 15.6% in 2022, primarily driven by decreased raw material costs and cost productivity, partially offset by unfavorable product/price mix. The consolidated gross margin percentage for 2022 decreased to 15.6% compared to 20.1% in 2021, primarily driven by lower volume, cost inflation and inventory reduction actions, partially offset by favorable product/price mix.
MANAGEMENT'S DISCUSSION AND ANALYSIS OF FINANCIAL CONDITION AND
RESULTS OF OPERATIONS - (CONTINUED)
taken in EMEA have returned the region to profitability, in line withResults of Operating Segments
In 2023, 2022 and 2021, respectively, our expectations, demonstrating the effectiveness of our strategic actions to date.
Our strong 2020 results demonstrate the agility and resiliency of our business model and the effectiveness of our COVID-19 response plan. This momentum provides us confidence that we will continue to deliver on our long-term financial goals in 2021.
RESULTS OF OPERATIONS
The following table summarizes the consolidated results of operations:
| | | | | | | | | | | | | | | | | | | | | | | | | | | | | | | | |
| | December 31, |
| Consolidated - In Millions (except per share data) | | 2020 | | Better/(Worse) % | | 2019 | | Better/(Worse) % | | 2018 |
| Net sales | | $ | 19,456 | | | (4.7)% | | $ | 20,419 | | | (2.9)% | | $ | 21,037 | |
| Gross margin | | 3,850 | | | 9.0 | | 3,533 | | | (0.1) | | 3,537 | |
| Selling, general and administrative | | 1,877 | | | 12.4 | | 2,142 | | | 2.1 | | 2,189 | |
| Restructuring costs | | 288 | | | (53.1) | | 188 | | | 23.9 | | 247 | |
| Impairment of goodwill and other intangibles | | 7 | | | nm | | — | | | nm | | 747 | |
| (Gain) loss on sale and disposal of businesses | | (7) | | | nm | | (437) | | | nm | | — | |
| Interest and sundry (income) expense | | (21) | | | (87.2) | | (168) | | | nm | | 108 | |
| Interest expense | | 189 | | | (0.8) | | 187 | | | 2.6 | | 192 | |
| Income tax expense | | 384 | | | (8.7) | | 354 | | | nm | | 138 | |
| Net earnings (loss) available to Whirlpool | | 1,081 | | | (8.8) | | 1,184 | | | nm | | (183) | |
| Diluted net earnings (loss) available to Whirlpool per share | | $ | 17.07 | | | (7.5)% | | $ | 18.45 | | | nm | | $ | (2.72) | |
nm: not meaningful
Consolidated net sales for 2020 decreased 4.7% compared to 2019, primarily driven by the divestiture of the Embraco compressor business, lower volumes and unfavorable foreign currency, partially offset by the favorable impact of product price/mix. Organic net sales (non-GAAP) for 2020 increased 1.1% compared to 2019. Consolidated net sales for 2019 decreased 2.9% compared to 2018, primarily driven by the divestiture of the Embraco compressor business, unfavorable foreign currency and unit volume declines, partially offset by the favorable impact of product price/mix. Organic net sales for 2019 increased 1.6% compared to 2018.
For additional information regarding non-GAAP financial measures including organic net sales and net sales excluding the impact of foreign currency, see the Non-GAAP Financial Measures section of this Management's Discussion and Analysis.
MANAGEMENT'S DISCUSSION AND ANALYSIS OF FINANCIAL CONDITION AND
RESULTS OF OPERATIONS - (CONTINUED)
The chart below summarizes the balance of net sales by operating segment for 2020, 2019 and 2018, respectively.
The consolidated gross margin percentage for 2020 increased to 19.8% compared to 17.3% in 2019, primarily driven by the favorable impact of product price/mix, cost reduction initiatives, raw material deflation, and a gain on sale-leaseback, partially offset by unfavorable foreign currency and lower unit volumes. The consolidated gross margin percentage for 2019 increased to 17.3% compared to 16.8% in 2018, primarily driven by the favorable impact of product price/mix, cost reduction initiatives in the EMEA region and a gain on sale-leaseback, partially offset by lower unit volumes, cost inflation (raw material, tariff and freight costs) in the North America region, unfavorable foreign currency and product warranty expense related to certain EMEA-produced washers.
Our operating segments arewere based uponon geographical region and arewere defined as North America, EMEA, Latin America and Asia. These regions also representrepresented our reportable segments. Beginning January 1, 2024, we are conducting our business through five operating segments, which consist of Major Domestic Appliances (“MDA”) North America; MDA Europe, MDA Latin America; MDA Asia; and Small Domestic Appliances (“SDA”) Global. The chief operating decision maker, who is the Company's Chairman and Chief Executive Officer, evaluates performance based on each segment's earnings (loss) before interest and taxes (EBIT), which we define as operating profit less interest and sundry (income) expense and excluding restructuring costs, asset impairment charges and certain other items that management believes are not indicative of the region's ongoing performance, if any. See Note 1614 to the Consolidated Financial Statements for additional information.
On January 16, 2023, Whirlpool entered into a contribution agreement with Arçelik A.Ş (“Arcelik”) related to our European major domestic appliance business which is reported within our EMEA reportable segment. The European disposal group met the criteria for held for sale accounting during the fourth quarter of 2022. The operations of the disposal group did not meet the criteria to be presented as discontinued operations. The transaction is expected to close by April 2024 and the results of European major domestic appliance business will be included in our financials until closing of the transaction. For additional information, see Note 15 to the Consolidated Financial Statements. Whirlpool will retain ownership of its EMEA KitchenAid Small Domestic Appliance business, which will be included in the SDA Global operating segment from January 1, 2024, onwards.
The following is a discussion of results for each of our operating segments. Each of our operating segments has been impacted by COVID-19 in the areas of manufacturing operations such as a decrease in production levels resulting in production level below normal capacity. Excess capacity costs were not material in 2020. Additionally, operating segments have been impacted by disruptions in supply chains and distribution channels, and demand,which largely stabilized in the first quarter of 2023, among other COVID-19 related impacts.macroeconomic impacts which continued throughout 2023.
MANAGEMENT'S DISCUSSION AND ANALYSIS OF FINANCIAL CONDITION AND
RESULTS OF OPERATIONS - (CONTINUED)
NORTH AMERICA
Net Sales Summary
Net sales for 20202023 decreased 2.3%0.4% compared to 20192022 primarily due to lower volumes.driven by the unfavorable impact of product price/mix, partially offset by increased volume and the acquisition of the InSinkErator business. Excluding the impact of foreign currency, net sales decreased 2.3%0.1% in 2020. Net2023. Net sales for 2019 increased 0.9%2022 decreased8.1% compared to 20182021 primarily driven by lower volume, partially offset by the favorable impact of product/price mix. Excluding the impact of foreign currency, net sales decreased 7.9% in 2022.
EBIT Summary
EBIT margin for 2023 was 9.7% compared to 11.5% for 2022. EBIT decreased primarily due to the favorableunfavorable impact of product price/mix, partially offset by lower volumes. Excluding thedecreased raw material inflation and favorable impact of foreign currency, net sales increased 1.1% in 2019.
EBIT Summary
cost productivity.EBIT margin for 20202022 was 15.8%11.5% compared to 12.7%17.8% for 2019.2021. EBIT increaseddecreased primarily due tocost inflation and lower volume, partially offset by the favorable impact of product price/product/price mix raw material deflation and cost reduction actions,.
EMEA
Net Sales Summary
Net sales for 2023 decreased 10.5% compared to 2022 primarily driven by lower volume, partially offset by the impact of lower volumes. EBIT margin for 2019 was 12.7% compared to 11.8% for 2018. EBIT increased primarily due to the favorable impact of product price/mix, partially offset by cost inflation (raw material, tariffs and freight costs).
EMEA
Net Sales Summary
Net sales for 2020 increased 2.1% compared to 2019 primarily due to the favorable impact of product price/mix, partially offset by the unfavorable impact of lower volumes. Excluding the impact of foreign currency, net sales increased 1.8% in 2020. Net sales for 2019 decreased 5.3% compared to 2018, primarily due to unfavorable impacts of foreign currency and product price/mix. Excluding the impact of foreign currency, net sales decreased 1.1%12.2% in 2019.2023. Net sales for 2022 decreased20.9% compared to 2021 primarily due to lower volume, unfavorable impact of foreign currency and divestiture of our Russia business, partially offset by product/price mix. Excluding the impact of foreign currency, net sales decreased 11.8% in 2022.
EBIT Summary
EBIT margin for 20202023 was 0.0%1.6% compared to (0.7%)(1.4)% for 2019.2022. EBIT increased primarily due to the cost reductions driven by fixed cost actions and favorable impact of raw material deflation, partially offset by foreign currency and increased marketing and technology investments. EBIT margin for 2019 was (0.7%) compared to (2.3%) for 2018. In 2019, EBIT increased primarily due to the favorable impactimpacts of held-for-sale treatment and reduced raw material inflation, partially offset by lower volume. EBIT margin for 2022 was (1.4)% compared to 2.0% for 2021. In 2022, EBIT decreased primarily due to cost reduction initiatives.
MANAGEMENT'S DISCUSSION AND ANALYSIS OF FINANCIAL CONDITION AND
RESULTS OF OPERATIONS - (CONTINUED)
LATIN AMERICA
Net Sales Summary
Net sales for 2020 decreased 18.4%2023 increased 9.0% compared to 20192022 primarily driven by the divestiture of the Embraco compressor business (completed in July 2019)higher volume and the unfavorableimpact of foreign currency. Excluding the impact of foreign currency, partially offset by volume growth. Organic net sales increased 22.8%6.8% in 2020.2023. Net sales for 20192022 decreased 12.2%1.3% compared to 20182021 primarily due to the divestiture of the Embraco compressor business and the unfavorable impact of foreign currency, partially offsetdriven by volume growth. Organic net sales Increased 9.3% in 2019.
EBIT Summary
EBIT margin for 2020 was 8.4% compared to 5.4% for 2019. EBIT increased primarily due to the favorable impact of product price/mix, raw material deflation and increased volumes, partially offset by the divestiture of the Embraco compressor business and the unfavorable impact of foreign currency. EBIT margin for 2019 was 5.4% compared to 5.8% for 2018. EBIT decreased primarily due to the divestiture of the Embraco compressor business and the unfavorable impact of foreign currency, partially offset by favorable product price/mix.
ASIA
Net Sales Summary
Net sales for 2020 decreased 16.5% compared to 2019 primarily due to lower volumes and the unfavorable impacts of foreign currency,volume, partially offset by the favorable impact of product price/mix.mix and the impact of foreign currency. Excluding the impact of foreign currency, net sales decreased 14.6%3.5% in 2020. Net sales for 2019 decreased 4.5% compared to 2018 primarily due to the unfavorable impacts of foreign currency and product price/mix, partially offset by volume growth. Excluding the impact of foreign currency, net sales decreased 1.5% in 2019.2022.
EBIT Summary
EBIT margin for 20202023 was (0.5)%6.0% compared to 2.2%6.4% for 2019.2022. EBIT margin decreased primarily due to cost inflation, partially offset by higher volume. EBIT margin for 2022 was 6.4% compared to 8.4% for 2021. EBIT margin decreased primarily due to cost inflation and lower volumes andvolume, partially offset by the unfavorablefavorable impacts of product price/mix, partially offset by cost takeout actions and raw material deflation. EBIT marginmix.
ASIA
Net Sales Summary
Net sales for 2019 was 2.2%2023 decreased 7.5% compared to 5.2% for 2018. EBIT decreased2022 primarily due to the unfavorable impacts of product price/mix and brand investmentsforeign currency, partially offset by higher volume. Excluding the impact of foreign currency, net sales decreased 3.3% in 2023. Net sales for 2022 decreased 11.2% compared to 2021 primarily due to the divestiture of Whirlpool China and unfavorable impact of foreign currency. Excluding the impact of foreign currency, net sales decreased 6.8% in 2022.
EBIT Summary
EBIT margin for 2023 was 2.7% compared to 4.9% for 2022. EBIT margin decreased primarily due to the unfavorable impact of product price/mix, partially offset by the favorable impactsimpact of volume growthraw material inflation and cost productivity in India.productivity. EBIT margin for 2022 was 4.9% compared to 5.4% for 2021. EBIT decreased primarily due to lower volume and cost inflation, partially offset by the favorable impact of product price/mix.
MANAGEMENT'S DISCUSSION AND ANALYSIS OF FINANCIAL CONDITION AND
RESULTS OF OPERATIONS - (CONTINUED)
Selling, General and Administrative
The following table summarizes selling, general and administrative expenses as a percentage of sales by operating segment:
| | December 31, |
| | December 31, | | | | December 31, |
| Millions of dollars | Millions of dollars | | 2020 | | As a %
of Net Sales | | 2019 | | As a %
of Net Sales | | 2018 | | As a %
of Net Sales | Millions of dollars | | 2023 | | As a %
of Net Sales | | 2022 | | As a %
of Net Sales | | 2021 | | As a %
of Net Sales |
| North America | North America | | $ | 733 | | | 6.5 | | % | | $ | 826 | | | 7.2 | | % | | $ | 787 | | | 6.9 | | % | North America | | $ | 936 | | | 8.2 | | 8.2 | | % | % | | $ | 837 | | | 7.3 | | 7.3 | | % | % | | $ | 860 | | | 6.9 | | 6.9 | | % | % |
| EMEA | EMEA | | 472 | | | 10.8 | | | 497 | | | 11.6 | | | 564 | | | 12.4 | | |
| Latin America | Latin America | | 233 | | | 9.0 | | | 306 | | | 9.6 | | | 369 | | | 10.2 | | |
| Latin America | |
| Latin America | |
| Asia | |
| Asia | |
| Asia | Asia | | 218 | | | 17.2 | | | 253 | | | 16.7 | | | 244 | | | 15.4 | | |
| Corporate/other | Corporate/other | | 221 | | | — | | | 260 | | | — | | | 225 | | | — | | |
| Corporate/other | |
| Corporate/other | |
| Consolidated | Consolidated | | $ | 1,877 | | | 9.6 | | % | | $ | 2,142 | | | 10.5 | | % | | $ | 2,189 | | | 10.4 | | % |
| Consolidated | |
| Consolidated | | | $ | 1,993 | | | 10.2 | | % | | $ | 1,820 | | | 9.2 | | % | | $ | 2,081 | | | 9.5 | | % |
Consolidated selling, general and administrative expenses as a percent of consolidated net sales in 2020 decreased2023 increased compared to 2019 due to fixed cost actions2022. The increase is primarily driven by impacts of portfolio transformation, increased employee compensation and reducedmarketing investments, in marketing.addition to a gain from a sale-leaseback transaction in the first quarter of 2022. Consolidated selling, general and administrative expenses as a percent of consolidated net sales in 2019 is comparable2022 decreased compared to 2018.2021. The decrease was primarily driven by a reduction in employee compensation related costs, reductions in marketing spend, a gain from the 2022 sale-leaseback transaction, divestiture of businesses and benefits of prior restructuring actions.
Restructuring
We incurred restructuring charges of $288$16 million, $188$21 million and $247$38 million for the years ended December 31, 2020, 20192023, 2022 and 2018,2021, respectively. For the full year 2021, we expect to incur approximately $100 million of restructuring charges, driven by our previously announced global cost reduction efforts.
See Note 14 to the Consolidated Financial Statements for additional information.
Impairment of Goodwill and Other Intangibles
We recorded an immaterialNo material impairment charge related tocharges of goodwill or other intangibles were recorded for the yearyears ended December 31, 2020 related to a brand in2023 or 2021, respectively.
In the EMEA reporting unit.
Wesecond quarter of 2022, we recorded an impairment chargeloss of $747$384 million related to goodwill ($579278 million) and other intangibles ($168106 million) for the year ended December 31, 2018 related to the EMEA reporting unit.
unit, and
See Note 65 and Note 1110 to the Consolidated Financial Statements and the Critical Accounting Policies and Estimates section of this Management's Discussion and Analysis for additional information.
(Gain) Loss on Sale and Disposal of Businesses
We recorded a pre-tax gainloss of $511$106 million onrelated to the saleplanned divestiture of the Embraco compressorour European major domestic appliance business for the yeartwelve months ended December 31, 2019. The2023, inclusive of a gain calculation is no longer subjectof $180 million in the fourth quarter of 2023. These adjustments are primarily due to change, as amounts forfair value fluctuations driven by seasonality of net working capital, and other customary post-closing adjustments have been finalized. A $7 million gain related to final purchase price adjustments waspartially offset by transaction costs. In the fourth quarter of 2022, we incurred a loss of $1.5 billion resulting in an aggregate loss on disposal of $1.6 billion for the transaction. This adjustment is recorded in the third quarterloss on sale and disposal of 2020.
We recorded a loss of $74 million for the year ended December 31, 2019 related to charges on the salebusinesses and reflects transaction costs and ongoing reassessment of the South Africa business ($63 million) andfair value less costs associated with the exitto sell of the Turkey domestic sales operations ($11 million).
See Note 17disposal group which will continue to be evaluated each reporting period until completion of the Consolidated Financial Statements for additional information.transaction.
MANAGEMENT'S DISCUSSION AND ANALYSIS OF FINANCIAL CONDITION AND
RESULTS OF OPERATIONS - (CONTINUED)
On June 27, 2022, our subsidiary Whirlpool EMEA SpA entered into a share purchase agreement with Arcelik to sell our Russian business to Arcelik for contingent consideration. On August 31, 2022, we completed the sale to Arcelik. We incurred a loss of $348 million for the twelve months ended December 31, 2022 related to the sale of the Russia business.
On May 6, 2021, the partial tender offer for Whirlpool China was completed and, subsequent to the deconsolidation of the entity, we recorded a gain of $284 million in the third quarter of 2021.
On June 30 2021, we completed the sale of our Turkish subsidiary and incurred a loss of $164 million in the second quarter of 2021. During the third quarter of 2021, an additional loss of $13 million related to the final purchase price adjustments was recorded, increasing the total loss to $177 million.
See Note 15 to the Consolidated Financial Statements for additional information.
Interest and Sundry (Income) Expense
Interest and sundry (income) expenses were $(21)$71 million, $(168)$(19) million and $108$(159) million for the years ended December 31, 2020, 20192023, 2022 and 2018,2021, respectively.
Interest and sundry (income) expense decreased $147 million in 2020 compared to 2019, primarily due to the prior year effect of Brazil indirect tax credits and trade customer insolvency claim settlement, partially offset by the favorable impact of foreign currency.
InterestNet interest and sundry income decreased $276$90 million in 20192023 compared to 2018,2022, primarily due to the effectreserves related to legacy EMEA legal matters.
Net interest and sundry income decreased $140 million in 2022 compared to 2021, primarily due to a substantial liquidation of Brazil indirect tax creditsan offshore subsidiary, resulting in a total charge of $84 million for a release of other comprehensive income on hedging and cumulative translation adjustments. The remaining decrease is primarily due to a gain of $42 million on previously held equity interest of 49% in Elica PB India recorded of $180 million, which reflects $196 million of indirect tax credits, net of related fees, partially offset by a trade customer insolvency claim settlement of €52.75 million (approximately $59 million as of December 31, 2019) and foreign currency.
See Note 8 to the Consolidated Financial Statements for additional information.in 2021.
Interest Expense
Interest expense was $189$351 million, $187$190 million and $192$175 million for the years ended December 31, 2020, 20192023, 2022 and 2018,2021, respectively. Interest expense increased in 2020 was comparable2023 compared to 20192022 primarily due to increase in long-term debt driven by the InSinkErator acquisition and 2018.higher average interest rates. Interest expense increased in 2022 compared to 2021 primarily due to increase in long-term debt driven by the InSinkErator acquisition.
For additional information, see Note 6 to the Consolidated Financial Statements.
Income Taxes
Income tax expense was $384$77 million, $354$265 million and $138$518 million for the years ended December 31, 2020, 20192023, 2022 and 2018,2021, respectively. The increasechange in tax expense in 20202023 compared to 2019 is primarily due to changes in valuation allowance,2022 includes legal entity restructuring tax benefits, and earnings dispersion related to the sale of Embraco.
The increase in tax expense in 2019 compared to 2018 is primarily due to higher earnings before tax, reduced foreign tax credits and the sale of Embraco, partially offset by net reductions in valuation allowances, and impacts from a statutory legal entity restructuring. As part of ongoing efforts to reduce costs and simplify the Company'ssimplifying its legal entity structure to reduce administrative costs associated with the Company completed in 2019 a statutory legal entity restructuring within our EMEA business.prior structure. The completion of the restructuring created a tax-deductible loss which was recognized in the fourth quarter of 2019,2023, and resulted in a $147$172 million net tax benefit.benefit, partially offset by increases in valuation allowances.
The decrease in tax expense in 2022 compared to 2021 is primarily due to overall lower level of earnings, partially offset by the impact of recorded impairments on the sale and disposal of businesses and goodwill which are not deductible, and increases in valuation allowances.
See Note 1513 to the Consolidated Financial Statements for additional information.
MANAGEMENT'S DISCUSSION AND ANALYSIS OF FINANCIAL CONDITION AND
RESULTS OF OPERATIONS - (CONTINUED)
FORWARD-LOOKING PERSPECTIVE
Earnings per diluted share presented below are net of tax, while each adjustment is presented on a pre-tax basis. The aggregate income tax impact of the taxable components of each adjustment is presented in the income tax impact line item at our anticipated 2021 full-year tax rate between 24.0% and 26.0%. Based on internal projections for the industry and broader economy, we currently estimate earnings per diluted share and industry demand for 20212024 to be within the following ranges:
| | | | | | | | | | | |
| 2021 |
| Current Outlook |
| Estimated earnings per diluted share, for the year ending December 31, 2021 | $17.80 | — | $18.80 |
| Including: | | | |
| Restructuring Expense | $(1.59) |
| Income Tax Impact | $0.39 |
| | | |
| Industry demand | | | |
North America | 4% | —% | 6% |
| EMEA | 2% | —% | 4% |
Latin America | 2% | —% | 4% |
| Asia | 6% | —% | 8% |
| | | | | | | | | | | |
| 2024 |
| Current Outlook |
| Estimated GAAP earnings per diluted share, for the year ending December 31 | $8.50 | — | $10.50 |
| | | |
| |
| |
| | | |
| Industry demand | | | |
MDA North America | 0% | —% | 2% |
MDA Latin America | 0% | —% | 3% |
| MDA Asia | 4% | —% | 6% |
| SDA Global | 2% | —% | 4% |
| MDA Europe (Q1) | (8)% | —% | (6)% |
For the full-year 2021,2024, we have incorporated our latest expectations of the following key trends in our guidance: subdued demand with gradual improvement throughout the year, strong net cost takeout actions delivering $300 million to $400 million of benefit, and margin expansion from our refocused portfolio following our contribution of the European major domestic appliance business. Our anticipated GAAP tax rate is approximately 24%. Additionally, we expect to generate cash from operating activities of $1.6 billionapproximately $1,150 - $1,250 and free cash flow of $1 billion or more,between $550 million and $650 million, including restructuring cash outlays of approximately $225$50 million and, with respect to free cash flow, capital expenditures of approximately $600 million.
The table below reconciles projected 20212024 cash provided by operating activities determined in accordance with GAAP to free cash flow, a non-GAAP measure. Management believes that free cash flow provides stockholders with a relevant measure of liquidity and a useful basis for assessing Whirlpool's ability to fund its activities and obligations. There are limitations to using non-GAAP financial measures, including the difficulty associated with comparing companies that use similarly named non-GAAP measures whose calculations may differ from our calculations. For 2021 weWe define free cash flow as cash provided by operating activities less capital expenditures and including proceeds from the sale of assets/businesses.expenditures. For additional information regarding non-GAAP financial measures, see the Non-GAAP Financial Measures section of Management's Discussion and Analysis.
| | | | | | | | | | | |
| 20212024 |
| Millions of dollars | Current Outlook |
Cash provided by (used in) operating activities(1) | $1,5501,150 - $1,250 |
Capital expenditures and proceeds from sale of assets/businesses | (550)~(600)
|
| Free cash flow | ~$1,000+550 - $650 |
(1)Financial guidance on a GAAP basis for cash provided by (used in) financing activities and cash provided by (used in) investing activities has not been provided because in order to prepare any such estimate or projection, the Company would need to rely on market factors and certain other conditions and assumptions that are outside of its control.
The projections above are based on many estimates and are inherently subject to change based on future decisions made by management and the Board of Directors of Whirlpool, and significant economic, competitive and other uncertainties and contingencies.
NON-GAAP FINANCIAL MEASURES
We supplement the reporting of our financial information determined under U.S. generally accepted accounting principles (GAAP) with certain non-GAAP financial measures, some of which we refer to as "ongoing" measures, including:
•Earnings before interest and taxes (EBIT)
•EBIT margin
MANAGEMENT'S DISCUSSION AND ANALYSIS OF FINANCIAL CONDITION AND
RESULTS OF OPERATIONS - (CONTINUED)
•EBIT margin
•Ongoing EBIT
•Ongoing earnings per diluted share
•Ongoing EBIT margin
•Sales excluding foreign currency
•Organic net sales (net sales excluding foreign currency and Embraco)
•Free cash flow
•Gross debt leverage
Ongoing measures, including ongoing earnings per diluted share and ongoing EBIT, exclude items that may not be indicative of, or are unrelated to, results from our ongoing operations and provide a better baseline for analyzing trends in our underlying businesses. EBIT margin is calculated by dividing EBIT by net sales. Ongoing EBIT margin isand EBIT margin are calculated by dividing ongoing EBIT and EBIT, respectively, by net sales for 2020, 2019 and 2018.sales. Sales excluding foreign currency is calculated by translating the current period net sales, in functional currency, to U.S. dollars using the prior-year period's exchange rate compared to the prior-year period net sales. Organic net sales is calculated by excluding divestitures and foreign currency. Management believes that organic net sales and sales excluding foreign currency provides stockholders with a clearer basis to assess our results over time, excluding the impact of exchange rate fluctuations, and influctuations. Management believes that Gross Debt Leverage (Gross Debt/Ongoing EBITDA) provides stockholders with a clearer basis to assess the case of organic net sales, excluding the impact of our Embraco compressor business divested in July 2019.Company's ability to pay off its incurred debt. We also disclose segment EBIT, which we define as operating profit less interest and sundry (income) expense and excluding restructuring costs, asset impairment charges and certain other items, if any, that management believes are not indicative of the region's ongoing performance, as the financial metric used by the Company's Chief Operating Decision Maker to evaluate performance and allocate resources in accordance with ASC 280, Segment Reporting.
Management believes that free cash flow provides stockholders with a relevant measure of liquidity and a useful basis for assessing Whirlpool's ability to fund its activities and obligations. The Company provides free cash flow related metrics, such as free cash flow as a percentage of net sales, as long-term management goals, not an element of its annual financial guidance, and as such does not provide a reconciliation of free cash flow and adjusted free cash flow to cash provided by (used in) operating activities, the most directly comparable GAAP measure, for these long-term goal metrics. Any such reconciliation would rely on market factors and certain other conditions and assumptions that are outside of the Company's control. Whirlpool does not provide a non-GAAP reconciliation for its other forward-lookingforward looking long-term value creation and other goals, such as organic net sales, EBIT, and gross debt/Ongoing EBITDA, as such reconciliationreconciliations related to longer-term metrics would rely on market factors and certain other conditions and assumptions that are outside of the company’s control.
We believe that these non-GAAP measures provide meaningful information to assist investors and stockholders in understanding our financial results and assessing our prospects for future performance, and reflect an additional way of viewing aspects of our operations that, when viewed with our GAAP financial measures, provide a more complete understanding of our business. Because non-GAAP financial measures are not standardized, it may not be possible to compare these financial measures with other companies' non-GAAP financial measures having the same or similar names. These non-GAAP financial measures should not be considered in isolation or as a substitute for reported net earnings (loss) available to Whirlpool, net sales, net earnings (loss) as a percentage of net sales (net earnings margin), net earnings (loss) per diluted share and cash provided by (used in) operating activities, the most directly comparable GAAP financial measures. We strongly encourage investors and stockholders to review our financial statements and publicly-filedpublicly filed reports in their entirety and not to rely on any single financial measure.
MANAGEMENT'S DISCUSSION AND ANALYSIS OF FINANCIAL CONDITION AND
RESULTS OF OPERATIONS - (CONTINUED)
Please refer to a reconciliation of these non-GAAP financial measures to the most directly comparable GAAP financial measures below.
| | | | | | | | | | | |
Total Whirlpool Organic Net Sales Reconciliation: in millions
| Twelve Months Ended December 31, |
| 2020 | 2019 | Change |
| Net sales | $ | 19,456 | | $ | 20,419 | | (4.7) | % |
| Less: Embraco net sales | — | | (635) | | |
| Add-Back: currency | 551 | | — | | |
| Organic net sales | $ | 20,007 | | $ | 19,784 | | 1.1 | % |
| | | | | | | | | | | |
Total Whirlpool Organic Net Sales Reconciliation: in millions
| Twelve Months Ended December 31, |
| 2019 | 2018 | Change |
| Net sales | $ | 20,419 | | $ | 21,037 | | (2.9) | % |
| Less: Embraco net sales | (635) | | (1,135) | | |
| Add-Back: currency | 430 | | — | | |
| Organic net sales | $ | 20,214 | | $ | 19,902 | | 1.6 | % |
| | | | | | | | | | | |
Latin America Organic Net Sales Reconciliation: in millions
| Twelve Months Ended December 31, |
| 2020 | 2019 | Change |
| Net sales | $ | 2,592 | | $ | 3,177 | | (18.4) | % |
| Less: Embraco net sales | — | | (635) | | |
| Add-Back: currency | 530 | | — | | |
| Organic net sales | $ | 3,122 | | $ | 2,542 | | 22.8 | % |
| | | | | | | | | | | |
Latin America Organic Net Sales Reconciliation: in millions
| Twelve Months Ended December 31, |
| 2019 | 2018 | Change |
| Net sales | $ | 3,177 | | $ | 3,618 | | (12.2) | % |
| Less: Embraco net sales | (635) | | (1,135) | | |
| Add-Back: currency | 171 | | — | | |
| Organic net sales | $ | 2,713 | | $ | 2,483 | | 9.3 | % |
MANAGEMENT'S DISCUSSION AND ANALYSIS OF FINANCIAL CONDITION AND
RESULTS OF OPERATIONS - (CONTINUED)
| | | | | | | | | | | |
Ongoing Earnings Before Interest & Taxes (EBIT) Reconciliation: in millions
| Twelve Months Ended December 31, |
| 2020 | 2019 | 2018 |
Net earnings (loss) available to Whirlpool (1) | $ | 1,081 | | $ | 1,184 | | $ | (183) | |
| Net earnings (loss) available to noncontrolling interests | (10) | | 14 | | 24 | |
| Income tax expense | 384 | | 354 | | 138 | |
| Interest expense | 189 | | 187 | | 192 | |
| Earnings before interest & taxes | $ | 1,644 | | $ | 1,739 | | $ | 171 | |
| Restructuring expense | 288 | | 188 | | 247 | |
| Corrective action recovery | (14) | | — | | — | |
| Product warranty and liability (income) expense | (30) | | 131 | | — | |
| (Gain) loss on sale and disposal of businesses | (7) | | (437) | | — | |
| Sale-leaseback, real estate and receivable adjustments | (113) | | (86) | | — | |
| Trade customer insolvency claim settlement | — | | 59 | | — | |
| Brazil indirect tax credit | — | | (180) | | — | |
| Impairment of goodwill and intangibles | — | | — | | 747 | |
| France antitrust settlement | — | | — | | 103 | |
| Trade customer insolvency | — | | — | | 30 | |
| Divestiture related transition costs | — | | — | | 21 | |
Ongoing EBIT(3) | $ | 1,768 | | $ | 1,414 | | $ | 1,319 | |
| | | | | | | | |
Ongoing Earnings Before Interest & Taxes (EBIT) Reconciliation: in millions
| Twelve Months Ended December 31, |
| 2023 | 2022 |
Net earnings (loss) available to Whirlpool (1) | $ | 481 | | $ | (1,519) | |
| Net earnings (loss) available to noncontrolling interests | 7 | | 8 | |
| Income tax expense | 77 | | 265 | |
| Interest expense | 351 | | 190 | |
| Earnings before interest & taxes | $ | 916 | | $ | (1,056) | |
| | |
Impairment of goodwill, intangibles and other assets (a) | — | | 396 | |
Impact of M&A transactions (b) | 181 | | 1,936 | |
Legacy EMEA legal matters (c) | 94 | | — | |
Substantial liquidation of subsidiary (d) | — | | 84 | |
| | |
| | |
| | |
| | |
| | |
| | |
| | |
Ongoing EBIT(2) | $ | 1,191 | | $ | 1,360 | |
(1)Net earnings margin is approximately 5.6%, 5.8%2.5% and (0.9)(7.7)% for the twelve months ended December 31, 2020, 20192023 and 2018,2022, respectively, and is calculated by dividing net earnings (loss) available to Whirlpool by consolidated net sales for the twelve months ended December 31, 2020, 20192023 and 2018,2022, respectively.
(2)Ongoing EBIT margin is approximately 9.1%,6.1% and 6.9% and 6.3% for the twelve months ended December 31, 2020, 20192023 and 2018,2022, respectively. Ongoing EBIT margin is calculated by dividing Ongoing EBIT by consolidated net sales for the twelve months ended December 31, 2020, 20192023 and 2018,2022, respectively.
(3)Additional information about each of our adjustments for ongoing EBIT is available under Supplemental Information on our Investor Relations website at investors.whirlpoolcorp.com. The contents of this website are not incorporated by reference into this Annual Report on Form 10-K or in any other report or document we file with the SEC.
| | | | | | | | |
| Ongoing Earnings Per Diluted Share Reconciliation: | Twelve Months Ended December 31, |
| 2020 | 2019 |
| Earnings per diluted share | $ | 17.07 | | $ | 18.45 | |
| Restructuring expense | 4.54 | | 2.93 | |
| Corrective action recovery | (0.22) | | — | |
| Sale-leaseback, real estate and receivable adjustments | (1.77) | | (1.34) | |
| (Gain) loss on sale and disposal of businesses | (0.10) | | (6.79) | |
| Product warranty and liability expense | (0.47) | | 2.04 | |
| Brazil indirect tax credit | — | | (2.80) | |
| Trade customer insolvency claim settlement | — | | 0.92 | |
| Income tax impact | (0.53) | | 0.75 | |
| Normalized tax rate adjustment | 0.03 | | 1.84 | |
| Ongoing earnings per diluted share | $ | 18.55 | | $ | 16.00 | |
| | | | | | | | |
| Ongoing Earnings Per Diluted Share Reconciliation: | Twelve Months Ended December 31, |
| 2023 | 2022 |
| Earnings per diluted share | $ | 8.72 | | $ | (27.18) | |
| | |
Impairment of goodwill and other intangibles (a) | — | | 7.08 | |
Impact of M&A transactions (b) | 3.27 | | 34.63 | |
Legacy EMEA legal matters (c) | 1.71 | | — | |
Substantial liquidation of subsidiary (d) | — | | 1.51 | |
| | |
| | |
| Income tax impact | 0.35 | | (1.89) | |
Normalized tax rate adjustment (e) | 2.11 | | 5.69 | |
Share count adjustment (f) | — | | (0.20) | |
| Ongoing earnings per diluted share | $ | 16.16 | | $ | 19.64 | |
| | | | | | | | | |
Free Cash Flow (FCF) Reconciliation: in millions | Twelve Months Ended December 31, |
| 2023 | 2022 | |
| | | |
| Cash provided by (used in) operating activities | $ | 915 | | $ | 1,390 | | |
| Capital expenditures | (549) | | (570) | | |
| | | |
| | | |
| | | |
| Free cash flow | $ | 366 | | $ | 820 | | |
| | | |
| Cash provided by (used in) investing activities | $ | (553) | | $ | (3,568) | | |
| Cash provided by (used in) financing activities | $ | (792) | | $ | 1,206 | | |
MANAGEMENT'S DISCUSSION AND ANALYSIS OF FINANCIAL CONDITION AND
RESULTS OF OPERATIONS - (CONTINUED)
| | | | | | | | | | | |
Free Cash Flow (FCF) Reconciliation: in millions | Twelve Months Ended December 31, |
| 2020 | 2019 | 2018 |
| Cash provided by (used in) operating activities | $ | 1,500 | | $ | 1,230 | | $ | 1,229 | |
| Capital expenditures | (410) | | (532) | | (590) | |
Proceeds from sale of assets and businesses (5) | 166 | | 1,174 | | 160 | |
Change in restricted cash (4) | (10) | | 40 | | 54 | |
Repayment of term loan (5) | — | | (1,000) | | — | |
| Free cash flow | $ | 1,246 | | $ | 912 | | $ | 853 | |
| | | |
| Cash provided by (used in) investing activities | $ | (237) | | $ | 636 | | $ | (399) | |
| Cash provided by (used in) financing activities | $ | (253) | | $ | (1,424) | | $ | (518) | |
(4)(a)See Note 4IMPAIRMENT OF GOODWILL, INTANGIBLES AND OTHER ASSETS - During the second quarter of 2022, the carrying value of the EMEA reporting unit and Indesit and Hotpoint* trademarks exceeded their fair values resulting in an impairment charge of $384 million which is recorded within Impairment of goodwill and other intangibles.
Additionally, during the fourth quarter of 2022, we recognized an impairment charge of $12 million related to the Consolidated Financial Statementsequity method investment in Brazil, which is recorded within Equity method investment income (loss), net of tax.
(b) IMPACT OF M&A TRANSACTIONS - On January 16, 2023, we signed a contribution agreement to contribute our European major domestic appliance business into a newly formed entity with Arçelik. In connection with the transaction, the Company recorded a non-cash loss on disposal of $1.5 billion in the fourth-quarter of 2022. The loss includes a write-down of the net assets of $1.2 billion of the disposal group to a fair value of $139 million and also includes $393 million of cumulative currency translation adjustments, $98 million release of other comprehensive loss on pension and $18 million of other transaction related costs. Whirlpool’s European major domestic appliance business met the criteria for additional information
(5)Proceeds fromheld-for-sale accounting during the salefourth-quarter of assets2022 and will be included in the Company’s results until closing of the transaction. We recorded a loss of $106 million related to the planned divestiture of our European major domestic appliance business for the twelve months ended December 31, 2019 include $1.02023, inclusive of a gain of $180 million in the fourth quarter of 2023, resulting in a total loss of $1.6 billion of net cash proceeds received to date for the transaction.
Additionally, we incurred other identifiable costs related to portfolio transformation, totaling $75 million in 2023, of which $57 million was recorded in the fourth quarter. This amount consisted of the following costs: an impairment charge of $27 million related to the equity method investment in Brazil, which is recorded within Equity method investment income (loss), net of tax, and an impairment charge along with other business closing-related costs of $20 million in North America, which is primarily recorded in Selling, General and Administrative expenses. Furthermore, during the fourth-quarter 2023, we incurred other unique transaction related costs of $10 million related to portfolio transformation for a total of $28 million for the twelve months ended December 31, 2023. These other transaction costs are recorded in Selling, General and Administrative expenses on our Consolidated Statements of Income (Loss).
During the second quarter of 2022, we entered into an agreement to sell our Russia business. We classified this disposal group as held for sale and recorded an impairment loss of $346 million for the write-down of the assets to their fair value. During the third quarter of 2022, the loss from disposal was adjusted by an immaterial amount resulting in a final loss amount of $348 million for the twelve months ended December 31, 2022.
Additionally, during the fourth-quarter 2022, we incurred unique transaction related costs of $25 million related to portfolio transformation for a total of $67 million for the twelve months ended December 31, 2022. These transaction costs are recorded in Selling, General and Administrative expenses on our Consolidated Statements of Income (Loss).
(c) LEGACY EMEA LEGAL MATTERS - During the first quarter of 2023, the Company accrued $62 million related to the Competition Investigation and Trade Customer Insolvency matters of our European major domestic appliance business. During the second quarter of 2023, the accrual was increased by $36 million resulting in an aggregate amount of $98 million for the six months ended June 30, 2023. An immaterial adjustment was made in the fourth quarter of 2023 related to these matters. For additional information, see Note 7 to the Consolidated Financial Statements.
* Whirlpool ownership of the Hotpoint brand in the EMEA and Asia Pacific regions is not affiliated with the Hotpoint brand sold in the Americas.
MANAGEMENT'S DISCUSSION AND ANALYSIS OF FINANCIAL CONDITION AND
RESULTS OF OPERATIONS - (CONTINUED)
(d) SUBSTANTIAL LIQUIDATION OF SUBSIDIARY - During the fourth quarter of 2022, the Company liquidated an offshore subsidiary and recorded a one-time charge of $84 million for a release of the other comprehensive income on hedging and cumulative translation adjustments.
(e) NORMALIZED TAX RATE ADJUSTMENT - For the full-year 2023, the Company calculated ongoing earnings per share using an adjusted tax rate of (6.7)%, which excludes certain tax related impacts of M&A transactions and certain tax related impacts to legal entity restructuring transactions. For the full-year 2022, the Company calculated ongoing earnings per share using an adjusted tax rate of 4.4%, which excludes the impacts of the non-tax deductible loss on sale of the Embraco compressor business; $1.0Russia business of $348 million and impairment of goodwill of $278 million recorded in the second quarter of 2022, along with the impact of M&A transactions of approximately $1.5 billion recorded in the fourth quarter of these proceeds2022.
(f) NORMALIZED SHARE COUNT ADJUSTMENT - As a result of our 2022 GAAP earnings loss, the impact of antidilutive shares was excluded from the loss per share calculation on a GAAP basis. The share count adjustment used in the calculation of the full-year ongoing earnings per diluted share includes basic shares outstanding of 55.9 million plus the impact of antidilutive shares of 0.6 million which were used to repay an outstanding term loan in August 2019.excluded on a GAAP basis.
FINANCIAL CONDITION AND LIQUIDITY
Our objective is to finance our business through operating cash flow and the appropriate mix of long-term and short-term debt. By diversifying the maturity structure, we avoid concentrations of debt, reducing liquidity risk. We have varying needs for short-term working capital financing as a result of the nature of our business. We regularly review our capital structure and liquiditythrough the lens of maintaining our strong investment grade credit rating. We also regularly review our capital allocation priorities, which include funding innovation and growth through capital and research and development expenditures as well asexpenditures; opportunistic mergers and acquisitions; and providing returns to shareholders through dividends and/or share repurchases; and debt repayment.
The Company believes that free cash flow provides stockholders with a relevant measure of liquidity and a useful basis for assessing Whirlpool's ability to fund its activities and obligations. Whirlpool has historically been able to leverage its strong free cash flow generation to fund our operations, pay for any debt servicing costs and allocate capital for reinvestment in our business, funding share repurchases and maintaining our strong investment grade rating.dividend payments.
Our short term potential uses of liquidity include funding our ongoing capital and research and development spending, restructuring activities,debt repayment, and returns to shareholders. We also have $298$800 million of term debt maturing in the next twelve months, and are currently evaluating our options in connection with this maturing debt, which may include repaymentwe expect to repay through a combination of refinancing, free cash flow generation orand cash on hand. Furthermore, in 2024 we expect to incur capital expenditures of approximately $600 million.
On November 30, 2023, the Company announced its intention to enter into one or more transactions to sell up to 24% of its ownership interest in Whirlpool of India Limited ("Whirlpool India") in 2024. The Company currently maintains a 75% ownership interest in Whirlpool India through a wholly-owned subsidiary, and intends to retain a controlling interest in Whirlpool India following completion of such transaction or transactions. The Company expects to use transaction proceeds to reduce debt levels, which will enhance balance sheet flexibility. This proposed transaction had no financial impact for the twelve months ended December 31, 2023.
The Company had cash and cash equivalents of approximately $2.9$1.6 billion at December 31, 2020,2023, of which approximately half72% was held by subsidiaries in foreign countries. For each of its foreign subsidiaries, the Company makes an assertion regarding the amount of earnings intended for permanent reinvestment, with the balance available to be repatriated to the United States. The cash held by foreign subsidiaries for permanent reinvestment is generally used to finance the subsidiaries' operational activities and expected future foreign investments. Our intent is to permanently reinvest these funds outside of the United States and our current plans do not demonstrate a need to repatriate the cash to fund our U.S. operations. However, if these funds were repatriated, we would be required to accrue and pay applicable United States taxes (if any) and withholding taxes payable
MANAGEMENT'S DISCUSSION AND ANALYSIS OF FINANCIAL CONDITION AND
RESULTS OF OPERATIONS - (CONTINUED)
to various countries. It is not practical to estimate the amount of the deferred tax liability associated with the repatriation of cash due to the complexity of its hypothetical calculation.
At December 31, 2020,2023, we had cash or cash equivalents greater than 1% of our consolidated assets in the United States, China, Brazil India and Mexico,India which represented 6.5%2.5%, 1.7%, 1.7%, 1.4%2.5% and 1.4%1.5%, respectively. In addition, we had third-party accounts receivable outside of the United States greater than 1% of our consolidated assets in Brazil and Italy,Mexico, which represented 1.8%1.7% and 1.1%1.2%, respectively .respectively. We continue to monitor general financial instability and uncertainty globally.
Notes payable primarily consists of short-term borrowings payable to banks, and commercial paper, which are generally used to fund working capital requirements. At December 31, 2020,2023, we had $12$17 million of notes payable outstanding. See Note 76 to the Consolidated Financial Statements for additional information.
MANAGEMENT'S DISCUSSION AND ANALYSIS OF FINANCIAL CONDITION AND
RESULTS OF OPERATIONS - (CONTINUED)
We monitor the credit ratings and market indicators of credit risk of our lending, depository, derivative counterparty banks and customers regularly, and take certain actionactions to manage credit risk. We diversify our deposits and investments in short-term cash equivalents to limit the concentration of exposure by counterparty.
In 2018, Whirlpool of India Limited (Whirlpool India), a majority-owned subsidiary of Whirlpool Corporation, acquired a 49% equity interest in Elica PB India for $22 million. Whirlpool India has an option to acquire the remaining equity interest in the future for fair value, and the non-Whirlpool India shareholders of Elica PB India received an option to sell their remaining equity interest to Whirlpool India in the future for fair value, which could be material to the financial statements depending on the performance of the venture. We account for our minority interest under the equity method of accounting.
Wealso continue to review customer conditions globally. At December 31, 2020, we had 173 million Brazilian reais (approximately $33 million at December 31, 2020) in short and long-term receivables due to us from Maquina de Vendas S.A., a trade customer in Brazil. In 2018, as part of their extrajudicial recovery plan, we agreed to receive payment of our outstanding receivable, plus interest, over eight years under a tiered payment schedule. During the third quarter of 2020, we received insurance proceeds of 129 million Brazilian reais (approximately $23 million at September 30, 2020) related to this matter. After consideration of the allowance for expected credit losses, we do not expect this matter to have a material impact on financial results in future periods.
In the past, when faced with a potential volume reduction from any one particular segment of our trade distribution network, we generally have been able to offset such declines through increased sales throughout our broad distribution network.
For additional information on transfers and servicing of financial assets, accounts payable outsourcing and guarantees, see Note 1 and Note 87 to the Consolidated Financial Statements.
Embraco Sale Transaction
On April 24, 2018, we and certain of our subsidiaries entered into a purchase agreement with Nidec Corporation, a leading manufacturer of electric motors incorporated under the laws of Japan, to sell our Embraco business unit (the "Transaction").
On June 26, 2019, Whirlpool and Nidec received the European Commission's final approval of the Transaction, and the parties closed the Transaction on July 1, 2019. At closing, pursuant to the purchase agreement and a subsequent agreement memorializing the purchase price adjustment, the Company received $1.1 billion inclusive of anticipated cash on hand at the time of closing, with final purchase price amounts subject to working capital and other customary post-closing adjustments. These adjustments have been finalized with an immaterial adjustment to the final purchase price amounts in 2020. Whirlpool has agreed to retain certain liabilities relating to tax, environmental, labor and products following closing of the Transaction.
On August 9, 2019, the Company repaid $1.0 billion pursuant to the Company's April 23, 2018 Term Loan Agreement by and among the Company, Citibank, N.A., as Administrative Agent, JPMorgan Chase Bank, N.A. as Syndication Agent, and certain other financial institutions, representing full repayment of amounts borrowed under the term loan. As previously disclosed, the Company agreed to repay this outstanding term loan amount with the net cash proceeds received from the sale of Embraco.
For additional information on the Embraco sale transaction, see Note 17 to the Consolidated Financial Statements.
MANAGEMENT'S DISCUSSION AND ANALYSIS OF FINANCIAL CONDITION AND
RESULTS OF OPERATIONS - (CONTINUED)
Share Repurchase Program
For additional information about our share repurchase program, see Note 1211 to the Consolidated Financial Statements.
Sources and Uses of Cash
We met our cash needs during 20202023 through cash flows from operations, cash and cash equivalents, and financing arrangements. Our cash, cash equivalents and restricted cash at December 31, 2020 increased $9822023 decreased $388 million compared to the same period in 2019.2022.
The following table summarizes the net increase (decrease) in cash, cash equivalents and restricted cash for the periods presented. Significant drivers of changes in our cash and cash equivalents balance during 20202023 are discussed below:
Cash Flow Summary
| | Millions of dollars | Millions of dollars | | 2020 | | 2019 | | 2018 | Millions of dollars | | 2023 | | 2022 | | 2021 |
| Cash provided by (used in): | Cash provided by (used in): | |
| Operating activities | Operating activities | | $ | 1,500 | | | $ | 1,230 | | | $ | 1,229 | |
| Operating activities | |
| Operating activities | |
| Investing activities | Investing activities | | (237) | | | 636 | | | (399) | |
| Financing activities | Financing activities | | (253) | | | (1,424) | | | (518) | |
| Effect of exchange rate changes | Effect of exchange rate changes | | (28) | | | (28) | | | (67) | |
| Less: change in cash classified as held for sale | |
| Net increase in cash, cash equivalents and restricted cash | Net increase in cash, cash equivalents and restricted cash | | $ | 982 | | | $ | 414 | | | $ | 245 | |
Cash Flows from Operating Activities
Cash provided by operating activities in 2020 increased2023 decreased compared to 2019.2022. The increasedecrease was primarily driven by strongreduced cash earnings partially offset byin 2023 and higher incremental working capital initiatives. Working capital was impacted by our ongoing accounts receivable and credit management actions along with inventory management. Additionally, working capital was impacted by increased accounts payable driven by higher year end production levels, partially offset byin the timing of our year end payment schedule.prior year.
MANAGEMENT'S DISCUSSION AND ANALYSIS OF FINANCIAL CONDITION AND
RESULTS OF OPERATIONS - (CONTINUED)
Cash provided by operating activities in 2019 was comparable2022 decreased compared to 2018. The impact of working capital primarily includes inventory reductions efforts, credit management activities and the divestiture of the Embraco compressor business. Net earnings includes the non-cash impacts from the gain on sale and disposal of businesses.
2021. The decrease inwas primarily driven by reduced cash provided by operating activities during 2018 primarily reflects $350 million of discretionary pension funding,earnings partially offset by the favorable cash impact of improved working capital impact from inventory reduction efforts, lower volumes and credit management activities. Net loss includeshedge settlements in the non-cash impacts from impairment of goodwill and other intangibles.prior period.
The timing of cash flows from operations varies significantly throughout the year primarily due to changes in production levels, sales patterns, promotional programs, funding requirements, credit management, as well as receivable and payment terms. Depending on the timing of cash flows, the location of cash balances, as well as the liquidity requirements of each country, external sources of funding are used to support working capital requirements.
Cash Flows from Investing Activities
Cash used in investing activities in 2023 decreased compared to 2022. The decrease was primarily driven by the $3 billion cash outflow for the purchase of the InSinkErator business that occurred in 2022.
The increase in cash used in investing activities during 20202022 primarily reflects the 2019 proceeds from$3 billion cash outflow for the salepurchase of the Embraco compressor business (approximately $1 billion), partially offset by a decrease in capital expenditures (approximately $122 million) and the proceeds from a real estate sale-leaseback transaction (approximately $139 million).
MANAGEMENT'S DISCUSSION AND ANALYSIS OF FINANCIAL CONDITION AND
RESULTS OF OPERATIONS - (CONTINUED)
The increase in cash provided by investing activities during 2019 primarily reflects proceeds from the sale of the Embraco compressor business (approximately $1 billion) along with proceeds from a real estate sale-leaseback transaction (approximately $140 million) and a decrease in capital expenditures (approximately $60 million)
The decrease in cash used in investing activities during 2018 primarily reflects proceeds from a real estate sale-leaseback transaction (approximately $130 million), a decrease in capital expenditures (approximately $95 million), and the proceeds related to held-to-maturity securities (approximately $60 million).InSinkErator business.
Cash Flows from Financing Activities
The decrease in cashCash used in financing activities increased during 20202023 compared to 2022. The increase was primarily reflects higherdriven by current year net debt issuance proceeds (increaserepayments of approximately $300 million), lower repayments$450 million and the $2.5 billion proceeds from borrowings of long-term debt (increase of approximately $400 million) net effect of reduced short-term debt (increase of approximately $400 million). Short-term debt reflectsrelated to the activity onInSinkErator acquisition in the $1 billion term loan that was borrowed in 2018 and repaid in 2019, offset by the reduced need to fund working capital through short term debt.
prior year. The increase in cash used inprovided by financing activities during 20192022 primarily reflects higher repaymentsthe proceeds of $2.5 billion from borrowings of long-term debt (increase of approximately $550 million), net effect of changes in short-term debt (increase of approximately $1.4 billion), partially offset by lower share repurchase activity (decrease of approximately $1 billion). Short-term debt reflectsrelated to the activity on the $1 billion term loan that was borrowed in 2018 and repaid in 2019, offset by changes in commercial paper for funding normal working capital requirements.
The decrease in cash used in financing activities during 2018 primarily reflects higher proceeds from borrowings of short-term debt (increase of approximately $300 million) and lower repayments of long-term debt (decrease of approximately $175 million), partially offset by higher share repurchase activity (increase of approximately $400 million). We also acquired a minority interest in Elica PB India.InSinkErator acquisition.
Dividends paid in financing activities approximated $300were $384 million, $390 million, and $338 million during 2020, 20192023, 2022 and 2018.2021, respectively.
Financing Arrangements
The Company had total committed credit facilities of approximately $4.2$5.7 billion and $6.2 billion at December 31, 2020.2023 and 2022, respectively. The facilities are geographically diverse and reflect the Company's global operations. The Company believes these facilities are sufficient to support its global operations. We had no borrowings outstanding under$2.0 billion and $2.5 billion drawn on the committed credit facilitiesterm loan at December 31, 20202023 and 2019,December 31, 2022, respectively. These funds were used to fund the InSinkErator acquisition in the fourth quarter of 2022 and were partially repaid in 2023.
See Note 76 to the Consolidated Financial Statements for additional information.
Dividends
In October 2020, our Board of Directors approved a 4.2% increase in our quarterly dividend on our common stock to $1.25 per share from $1.20 per share.
MANAGEMENT'S DISCUSSION AND ANALYSIS OF FINANCIAL CONDITION AND
RESULTS OF OPERATIONS - (CONTINUED)
CONTRACTUAL OBLIGATIONS AND FORWARD-LOOKING CASH REQUIREMENTS
The following table summarizes our expected cash outflows resulting from financial contracts and commitments:
| | | | | | | | | | | | | | | | | | | | | | | | | | | | | | | | |
| | | Payments due by period |
| Millions of dollars | | Total | | 2021 | | 2022 & 2023 | | 2024 & 2025 | | Thereafter |
Long-term debt obligations(1) | | $ | 7,448 | | | $ | 463 | | | $ | 831 | | | $ | 884 | | | $ | 5,270 | |
Operating lease obligations(2) | | 1,210 | | | 211 | | | 349 | | | 253 | | | 397 | |
Purchase obligations(3) | | 556 | | | 214 | | | 221 | | | 79 | | | 42 | |
United States and foreign pension plans(4) | | 107 | | | 18 | | | 37 | | | 40 | | | 12 | |
Other postretirement benefits(5) | | 136 | | | 25 | | | 49 | | | 19 | | | 43 | |
| | | | | | | | | | |
Total(6) | | $ | 9,457 | | | $ | 931 | | | $ | 1,487 | | | $ | 1,275 | | | $ | 5,764 | |
(1)Principal and interest payments related to long-term debt are includedOther material obligations include off-balance sheet arrangements arising in the table above. See Note 7 to the Consolidated Financial Statements for additional information.
(2)Operating lease obligations includes the impact of sale-leaseback transactions. See Note 1 to the Consolidated Financial Statements for additional information.
(3)Purchase obligations include our "take-or-pay" contracts with materials vendors and minimum payment obligations to other suppliers.
(4)Represents the minimum contributions required for foreign pension plans based on current interest rates, asset return assumptions, legislative requirements and other actuarial assumptions at December 31, 2020. See Note 9 to the Consolidated Financial Statements for additional information.
(5)Represents our portion of expected benefit payments under our retiree healthcare plans.
(6)This table does not include credit facility, short-term borrowings to banks and commercial paper borrowings. See Note 7 to the Consolidated Financial Statements for additional information. This table does not include future anticipated income tax settlements. See Note 15 to the Consolidated Financial Statements for additional information.
OFF-BALANCE SHEET ARRANGEMENTS
In the ordinarynormal course of business,business. They primarily consist of agreements we enter into agreements with financial institutions to issue bank guarantees, letters of credit and surety bonds. These agreements are primarily associated with unresolved tax matters in Brazil, as is customary under local regulations, and other governmental obligations and debt agreements. At December 31, 20202023 and 2019,2022, we had approximately $423$464 million and $333$401 million outstanding under these agreements, respectively.
For additional information about our off-balance sheet arrangements, see NoteAdditionally, we have material contractual obligations. They primarily consist of long-term debt obligations, operating lease obligations, purchase obligations, taxes, United States and foreign pension plans and other postretirement benefits. See Notes 1, 3, 6-9 and Note 813 to the Consolidated Financial Statements.Statements for additional information.
Dividends
On October 16, 2023, our Board of Directors approved a quarterly dividend on our common stock of $1.75 per share.
MANAGEMENT'S DISCUSSION AND ANALYSIS OF FINANCIAL CONDITION AND
RESULTS OF OPERATIONS - (CONTINUED)
CRITICAL ACCOUNTING POLICIES AND ESTIMATES
The preparation of financial statements, in conformity with GAAP, requires management to make certain estimates and assumptions.assumptions that affect the reported amounts of assets, liabilities, revenues, expenses, and related disclosures. We periodically evaluate these estimates and assumptions, which are based on historical experience, forecasted events, changes in the business environment and other factors that management believes to be reasonable under the circumstances. Actual results may differ materially from these estimates.
MANAGEMENT'S DISCUSSION AND ANALYSIS OF FINANCIAL CONDITION AND
RESULTS OF OPERATIONS - (CONTINUED)
estimates under different assumptions or conditions. Management believes the accounting policies below are critical in the portrayal of our financial condition and results of operations and require management's most difficult, subjective, or complex judgments.Pension and Other Postretirement Benefits
Accounting for pensions and other postretirement benefits involves estimating the costs of future benefits and attributing the cost over the employee's expected period of employment. The determination of our obligation and expense for these costs requires the use of certain assumptions. Those key assumptions include the discount rate, expected long-term rate of return on plan assets, life expectancy, and health care cost trend rates. These assumptions are subject to change based on interest rates on high quality bonds stock and bond marketsstock, and medical cost inflation, respectively.inflation. Actual results that differ from our assumptions are accumulated and amortized over future periods and therefore, generally affect our recognized expense and accrued liability in such future periods. While we believe that our assumptions are appropriate given current economic conditions and actual experience, significant differences in results or significant changes in our assumptions may materially affect our pension and other postretirement benefit obligations and related future expense.
Our pension and other postretirement benefit obligations at December 31, 20202023 and preliminary retirement benefit costs for 20212024 were prepared using the assumptions that were determined as of December 31, 2020.2023. The following table summarizes the sensitivity of our December 31, 20202023 retirement obligations and 20212024 retirement benefit costs of our United States plans to changes in the key assumptions used to determine those results:
| | | | | | | | | | | |
| | | Estimated increase (decrease) in |
| Millions of dollars | Percentage
Change | 20212024 Expense | PBO/APBO(1) for 20202023 |
| United States Pension Plans | | | |
| Discount rate | +/-50bps | 1/(2)(1) | (172)(84)/19091 |
| Expected long-term rate of return on plan assets | +/-50bps | (13)(11)/1311 | – |
| United States Other Postretirement Benefit Plan | | | |
| Discount rate | +/-50bps | 1/(1)0/0 | (7)(4)/84 |
(1)Projected benefit obligation (PBO) for pension plans and accumulated postretirement benefit obligation (APBO) for other postretirement benefit plans.
These sensitivities may not be appropriate to use for other years' financial results. Furthermore, the impact of assumption changes outside of the ranges shown above may not be approximated by using the above results. For additional information about our pension and other postretirement benefit obligations, see Note 98 to the Consolidated Financial Statements.
Income Taxes
We estimate our income taxes in each of the taxing jurisdictions in which we operate. This involves estimating actual current tax expense together with assessing any temporary differences resulting from the different treatment of certain items, such as the timing for recognizing expenses, for tax and accounting purposes. These differences may result in deferred tax assets or liabilities, which are included in our Consolidated Balance Sheets. We are required to assess the likelihood that deferred tax assets, which include net operating loss carryforwards, general business credits and deductible temporary differences, will be realizable in future years. Realization of our net operating loss and
MANAGEMENT'S DISCUSSION AND ANALYSIS OF FINANCIAL CONDITION AND
RESULTS OF OPERATIONS - (CONTINUED)
general business credit deferred tax assets is supported by specific tax planning strategies and, where possible, considers projections of future profitability. If recovery is not more likely than not, we provide a valuation allowance based on estimates of future taxable income in the various taxing jurisdictions, for the amount of deferred taxes that are ultimately realizable. If future taxable income is lower than expected or if tax planning strategies are not available as anticipated, we may record additional valuation allowances through income tax expense in the period such determination is made. Likewise, if we determine that we are able to realize our deferred tax assets in the future in excess of net recorded amounts, an adjustment to the deferred tax asset will benefit income tax expense in the period such determination is made.
MANAGEMENT'S DISCUSSION AND ANALYSIS OF FINANCIAL CONDITION AND
RESULTS OF OPERATIONS - (CONTINUED)
At December 31, 20202023 and 2019,2022, we had total deferred tax assets of $3.4$2.9 billion and $3.3$2.6 billion, respectively, net of valuation allowances of $214$490 million and $192$412 million, respectively. During 2019, the Company used proceeds from a bond offering to recapitalize various entities in EMEA which resulted in a reduction in the valuation allowance. In addition, theThe Company has established tax planning strategies and transfer pricing policies to provide sufficient future taxable income to realize these deferred tax assets. Our income tax expense has fluctuated considerably over the last five years. The tax expense has been influenced primarily by U.S. energy tax credits, foreign tax credits, audit settlements and adjustments, tax planning strategies, enacted legislation, and dispersion of global income. Future changes in the effective tax rate will be subject to several factors, including business profitability, tax planning strategies, and enacted tax laws.
We have various tax filings with applicable jurisdictions to defend our positions with regards to the timing and amount of deductions and credits as well as the allocation of income across various jurisdictions. We regularly inventory, evaluate and measure all uncertain tax positions taken or expected to be taken to ensure the timely recording of liabilities for tax positions that may not be sustained or may only be partially sustained upon examination by the relevant taxing authorities. We believe that our estimates and judgements with respect to uncertain tax positions are reasonable and accurate at the time they are developed. However, actual results may differ due to unforeseen future events and circumstances. If one or more of the applicable taxing authorities were to successfully challenge our right to realize some or all of the tax benefits we have recorded, it could have a material adverse effect on our financial statements.
In addition, we operate within multiple taxing jurisdictions and are subject to audit in these jurisdictions. These audits can involve complex issues, which may require an extended period of time to resolve and could result in outcomes that are unfavorable to the Company. For additional information about income taxes, see Note 1, Note 87 and Note 1513 to the Consolidated Financial Statements.
Warranty Obligations
The estimation of warranty obligations is determined in the same period that revenue from the sale of the related products is recognized. The warranty obligation is based on historical experience and represents our best estimate of expected costs at the time products are sold. Warranty accruals are adjusted for known or anticipated warranty claims as new information becomes available. New product launches require a greater use of judgment in developing estimates until historical experience becomes available. Future events and circumstances could materially change our estimates and require adjustments to the warranty obligations. For the year ended December 31, 2023 and 2022, warranty expense as a percentage of consolidated net sales approximated 1.2% and 1.4%, respectively. For additional information about warranty obligations, see Note 87 to the Consolidated Financial Statements.
Goodwill and Indefinite-Lived Intangibles
Certain business acquisitions have resulted in the recording of goodwill and trademark assets which are not amortized. At December 31, 20202023 and 2019,2022, we had goodwill of approximately $2.5$3.3 billion and $2.4$3.3 billion, respectively. We have trademark assets with a carrying value of approximately $1.9$2.8 billion and $2.8 billion at December 31, 20202023 and 2019,2022, respectively.
For additional information, see Notes 10 and 15 to the Consolidated Financial Statements.
MANAGEMENT'S DISCUSSION AND ANALYSIS OF FINANCIAL CONDITION AND
RESULTS OF OPERATIONS - (CONTINUED)
We perform our annual impairment assessment for goodwill and other indefinite-lived intangible assets as of October 1st1 or more frequently if events or changes in circumstances indicate that the asset might be impaired. We consider qualitative factors to assess if it is more likely than not that the fair value for goodwill or indefinite-lived intangible assets is below the carrying amount. We may also elect to bypass the qualitative assessment and perform a quantitative assessment.
In conducting a qualitative assessment, the Company analyzes a variety of events or factors that may influence the fair value of the reporting unit or indefinite-lived intangible, including, but not limited to: the results of prior quantitative assessments performed; changes in the carrying amount of the reporting unit or indefinite-lived intangible; actual and projected revenue and EBIT margin; relevant market data for both the Company and its peer companies; industry outlooks; macroeconomic conditions; liquidity; changes in key personnel; and the Company's competitive position. Significant judgment is used to evaluate the totality of these events and factors to make the determination of whether it is more likely than not that the fair value of the reporting unit or indefinite-lived intangible is less than its carrying value.
For our annual impairment assessment as of October 1, 2020,2023, the Company performed a qualitative impairment assessment for goodwill and elected to bypass the qualitative assessment and perform a quantitative assessment to evaluate goodwill and certain brand trademarks. The Company elected to perform a qualitative assessment on the other indefinite-lived intangible assets noting no events that indicated that the fair value was less than the carrying value that would require a quantitative impairment assessment.
MANAGEMENT'S DISCUSSION AND ANALYSIS OF FINANCIAL CONDITION AND
RESULTS OF OPERATIONS - (CONTINUED)
Goodwill Valuations
In performing a quantitative assessment,2023, we estimate each reporting unit's fair value primarily by using the income approach. The income approach uses each reporting unit's projection of estimated operating results and cash flows that are discountedevaluated goodwill using a market participant discount rate based on a weighted-average cost of capital. The financial projections reflect management's best estimate of economic and market conditions overqualitative assessment to determine whether it is more likely than not that the five-year projected period including forecasted revenue growth, EBIT margin, tax rate, capital expenditures, depreciation and amortization and changes in working capital requirements. Other assumptions include discount rate and terminal growth rate. For one of our reporting units we use a blended approach that includes a market capitalization methodology given publicly available information and a discounted cash flow approach. The estimated fair value of eachany reporting unit is compared to their respectiveless than its carrying values.
Additionallyamount. If we validate our estimates of fair value under the income approach by comparing the values to fair value estimates using a market approach. A market approach estimates fair value by applying cash flow multiples to the operating performance of each reporting unit. The multiples are derived from comparable publicly traded companies with operating and investment characteristics similar to the reporting units. We also corroboratedetermine that the fair value throughof the reporting unit may be less than its carrying amount, a market capitalization reconciliationgoodwill impairment test is performed to determine whetheridentify potential impairment. The goodwill impairment test compares a reporting unit’s fair value to its carrying amount. If the implied control premiumcarrying amount of a reporting unit exceeds the reporting unit’s fair value, then a goodwill impairment loss is reasonable based on recent market transactionsmeasured at the amount by which a reporting unit’s carrying amount exceeds its fair value, not to exceed the carrying amount of goodwill. Otherwise, we conclude that no impairment is indicated and other qualitative considerations.
Based on the results of our annual quantitative assessment performed as of October 1, 2020,no further testing is required. If the fair valuesvalue of our North America, Asia and Latin Americathe reporting units exceeded their respectiveunit exceeds its carrying values by 184%, 315% and 15%, respectively.amount, no impairment loss is measured.
Based on the quantitative assessment performed foras of May 31, 2022, the carrying value of the EMEA reporting unit theexceeded its fair value resulting in a goodwill impairment loss for the full carrying amount of $278 million during the reporting unit exceeded its carrying value by 11%. The EMEA reporting unit has goodwillsecond quarter of approximately $329 million at2022 and for the twelve months ended December 31, 2020.
In evaluating the EMEA reporting unit, significant weight was provided to forecasted EBIT margins and the discount rate used in the discounted cash flow model, as we determined that these items have the most significant impact on the fair value of this reporting unit.
•EBIT margins are expected to recover as we benefit from the recently announced strategic actions to rightsize and refocus our business, including improving our price/mix, driving share gains and executing on our cost takeout initiatives.
•The 5-year average forecasted EBIT margin in the discounted cash flow model was approximately 3%.
•We used a discount rate of 11.75% based on market participant assumptions.
We performed a sensitivity analysis on our EMEA reporting unit estimated fair value noting that a 100 basis point increase in the discount rate or a 10% reduction in the projected EBIT margins in the forecasted periods would result in an impairment charge of $18 million and $31 million, respectively.
If actual results are not consistent with management's estimates and assumptions, a material impairment charge of goodwill could occur, which would have a material adverse effect on our consolidated financial statements.2022.
Indefinite-Lived Intangible Valuations
In performing a quantitative assessment of indefinite-lived intangible assets other than goodwill, primarily trademarks, we estimate the fair value of these intangible assets using the relief-from-royalty method which requires assumptions related to projected revenues from our annual long-range plan; assumed royalty rates that could be payable if we did not own the trademark; and a market participant discount rate based on a weighted-average cost of capital. If the estimated fair value of the indefinite-lived intangible asset is less than its carrying value, we would recognize an impairment loss.
MANAGEMENT'S DISCUSSION AND ANALYSIS OF FINANCIAL CONDITION AND
RESULTS OF OPERATIONS - (CONTINUED)
Based on our quantitative impairment assessment asThe estimates of October 1, 2020, the carrying value of the Hotpoint* trademark exceeded its fair value by €6 million, approximately $7 million, and we recorded an intangible impairment chargefuture cash flows used in this amount during the fourth quarter of 2020. There were no other impairments of indefinite-lived intangible assets in 2020.
Becausedetermining the fair value assignedof intangible assets involve significant management judgment and are based upon assumptions about expected future operating performance, economic conditions, market conditions and cost of capital. Inherent in estimating the future cash flows are uncertainties beyond our control, such as changes in capital markets. The actual cash flows could differ materially from management's estimates due to the Hotpoint* trademark is recorded as of October 1, 2020, future impairments could result if the brand experiences further deteriorationchanges in business conditions, operating performance or if there is a significant change in other qualitative or quantitative factors, including a change in the royalty rate or discount rate.
The fair value of the Indesit trademark exceeded its carrying value of €190 million ($232 million) by 10%. We expect future fiscal year net sales for this brand to improve as we stabilize volumes, recover market share and benefit from our new product investments in the EMEA region.
The fair values of the Maytag and JennAir trademarks exceeded their carrying values of $1,021 million and $304 million by approximately 9% and 3%, respectively. We expect net sales for these brands to improve as we recover temporary volume loss from COVID-19 related supply chain disruptions and continue to execute our brand leadership strategy and benefit from our new product investments.
The fair values of all other trademarks exceeded their carrying values by more than 10%.
economic conditions. In performing the quantitative assessment on these assets, significant assumptions used in our relief-from-royalty model included revenue growth rates, assumed royalty rates and the discount rate, which are discussed further below.
MANAGEMENT'S DISCUSSION AND ANALYSIS OF FINANCIAL CONDITION AND
RESULTS OF OPERATIONS - (CONTINUED)
Revenue growth rates relate to projected revenues from our financial planning and analysis process and vary from brand to brand. Adverse changes in the operating environment or our inability to grow revenues at the forecasted rates may result in a material impairment charge. We performed a sensitivity analysis on our estimated fair values noting a 10% reduction of forecasted revenues in the Maytag, JennAir and Indesit trademarks would result in an impairment charge of approximately $20 million, $22 million, and €12 million ($15 million) respectively. A 10% reduction of forecasted revenues in the Hotpoint* brand would result in an impairment charge of €13 million ($16 million), in addition to the €6 million ($7 million) impairment charge in 2020.
In determining royalty rates for the valuation of our trademarks, we considered factors that affect the assumed royalty rates that would hypothetically be paid by a market participant for the use of trademarks. The most significant factors in determining the assumed royalty rates include the overall role and importance of the trademarks in the particular industry, the profitability of the products utilizing the trademarks, and the position of the trademarked products in the given product category. Based on this analysis, we determined a royalty rate of 3%, 3.5%, 4% and 6% for our Indesit, Hotpoint*, Maytag and JennAir trademarks, respectively. We performed a sensitivity analysis on our estimated fair values for Indesit, Maytag and JennAir noting a 50 basis point reduction of the royalty rates from each brand would result in an impairment charge of approximately €15 million ($18 million), $46 million, and $17 million respectively. A 50 basis point reduction of the royalty rate from Hotpoint* would result in a $34 million (€28 million) impairment charge, in addition to the €6 million ($7 million) impairment charge in 2020.
In developing discount rates for the valuation of our trademarks, we used a market participant discount rate based on a weighted-average cost of capital, adjusted for higher relative level of risks associated with doing business in other countries, as applicable, as well as the higher relative levels of risks associated with intangible assets. Based on this analysis, we determined the discount rates to be 14.75%, 15%, 9.75%, and 10.25% for Indesit, Hotpoint*, Maytag, and JennAir respectively. We performed a sensitivity analysis on our estimated fair values for Hotpoint*, Maytag and JennAir noting a 100 basis point increase in the discount rate would result in an impairment charge of approximately €9 million ($11 million), $41 million and $31 million, respectively, and a 150 basis
*Whirlpool ownership of the Hotpoint brand in the EMEA and Asia Pacific regions is not affiliated with the Hotpoint brand sold in the Americas.
MANAGEMENT'S DISCUSSION AND ANALYSIS OF FINANCIAL CONDITION AND
RESULTS OF OPERATIONS - (CONTINUED)
point increase in the discount rate for Indesit would result in an impairment charge of approximately
€2 million ($2 million). Hotpoint’s* impairment would be in addition to the impairment charge in 2020.
If actual results are not consistent with management's estimate and assumptions, a material impairment charge of our trademarks could occur, which could have a material adverse effect on our consolidated financial statements.
Maytag trademark
Our Maytag trademark is at risk at December 31, 2023. Lower-than-expected industry demand has affected Maytag similarly to the rest of the North America region; however, we expect future year revenues to improve as we recover from temporary volume loss and continue to execute our brand leadership strategy and benefit from new product investments. The fair value of the Maytag trademark exceeded its carrying value of $1,021 million by approximately 9%.
A 10% reduction of forecasted Maytag revenues would result in an impairment charge of approximately $24 million.
We determined a royalty rate of 4% for the Maytag trademark, noting that a 50 basis point reduction of the royalty rate would result in an impairment charge of approximately $60 million.
We determined a discount rate of 9.50% for Maytag, noting that a 50 basis point increase in the discount rate would result in a breakeven scenario.
InSinkErator trademark
Our InSinkErator trademark is at risk at December 31, 2023. The InSinkErator business was acquired in the fourth quarter of 2022 and is included in our North America operating segment. Lower-than-expected industry demand has affected the InSinkErator business similarly to the rest of the North America region. The long-term expectations for this newly acquired business have not changed, and the full value potential of the InSinkErator business is expected to be realized in the forthcoming years.
The fair value of the InSinkErator trademark exceeded its carrying value of $1,300 million by approximately 3%. We expect future fiscal year revenues for this brand to improve as we recover from temporary volume loss and continue to execute our brand leadership strategy and benefit from our new product investments.
A 10% reduction of forecasted InSinkErator revenues would result in an impairment charge of approximately $114 million.
We determined a royalty rate of 12% for the InSinkErator trademark, noting that a 50 basis point reduction of the royalty rate would result in an impairment charge of approximately $21 million.
We determined a discount rate of 8.25% for InSinkErator, noting that a 50 basis point increase in the discount rate would result in an impairment charge of approximately $98 million.
MANAGEMENT'S DISCUSSION AND ANALYSIS OF FINANCIAL CONDITION AND
RESULTS OF OPERATIONS - (CONTINUED)
Other indefinite-lived intangible assets
Based on our quantitative impairment assessment as of May 31, 2022, the carrying values of the Hotpoint* and Indesit trademarks exceeded their fair values by $36 million and $70 million, respectively, and we recorded intangible impairment charges for these amounts during the second quarter of 2022. The remaining carrying values of the Hotpoint* and Indesit trademarks were included in the European major domestic appliance disposal group which was classified as held for sale in the fourth quarter of 2022.
The fair values of all other trademarks exceeded their carrying values by an amount sufficient to not be deemed at risk. There were no other impairments of indefinite-lived intangible assets in 2023 or 2022.
For additional information about goodwill and indefinite-life intangible valuations, see Note 65 and Note 1110 to the Consolidated Financial Statements.
The estimates of future cash flows used in determining the fair value of goodwill and intangible assets involve significant management judgment and are based upon assumptions about expected future operating performance, economic conditions, market conditions and cost of capital. Inherent in estimating the future cash flows are uncertainties beyond our control, such as changes in capital markets. The actual cash flows could differ materially from management's estimates due to changes in business conditions, operating performance and economic conditions.
ISSUED BUT NOT YET EFFECTIVE ACCOUNTING PRONOUNCEMENTS
For additional information regarding recently issued accounting pronouncements, see Note 1 to the Consolidated Financial Statements.
OTHER MATTERS
For additional information regarding certain of our loss contingencies/litigation, see Note 87 to the Consolidated Financial Statements.
Grenfell Tower
On June 23, 2017, London's Metropolitan Police Service released Unfavorable outcomes in these proceedings could have a statement that it had identified a Hotpoint–branded refrigerator as the initial source of the Grenfell Tower fire in West London. U.K. authorities are conducting investigations, including regarding the cause and spread of the fire. The model in question was manufactured by Indesit Company between 2006 and 2009, prior to Whirlpool's acquisition of Indesit in 2014. We are fully cooperating with the investigating authorities. Whirlpool was named as a defendant in a product liability suit in Pennsylvania federal court related to this matter. The federal court dismissed the case with prejudice in September 2020. The dismissal is being appealed. In December 2020, lawsuits related to Grenfell Tower were filed in the U.K. against approximately 20 defendants, including Whirlpool Corporation and certain Whirlpool subsidiaries. As these matters are ongoing, we cannot speculate on their eventual outcomes or potential impactmaterial adverse effect on our financial statements; accordingly, we have not recordedstatements in any significant charges in 2019 or 2020. Additional claims may be filed related to this incident.particular reporting period.
Antidumping and Safeguard Petition
As previously reported, Whirlpool filed petitions in 2011 and 2015 alleging that Samsung, LG and Electrolux violated U.S. and international trade laws by dumping large residential washers into the U.S. Those petitions resulted in orders imposing antidumping duties on certain large residential washers imported from South Korea, Mexico, and China, and countervailing duties on certain large residential washers from South Korea. These orders could be subject to administrative reviews and possible appeals. In March 2019, the order covering certain large residential washers from Mexico was extended for an additional five years, while the order covering certain large residential washers from South Korea was revoked.
*Whirlpool ownership of In August 2022, the Hotpoint brand in the EMEA and Asia Pacific regions is not affiliated with the Hotpoint brand sold in the Americas.
MANAGEMENT'S DISCUSSION AND ANALYSIS OF FINANCIAL CONDITION AND
RESULTS OF OPERATIONS - (CONTINUED)
Whirlpool also filed a safeguard petition in May 2017 to address our concerns that Samsung and LG were evading U.S. trade laws by moving production from countries covered by antidumping orders. A safeguard remedy went into effect in February 2018, implementing tariffs on finishedorder covering certain large residential washers and certain covered parts for three years. In January 2021, the remedyfrom China was extended for two years until February 2023. During the fourth year of the remedy, beginning February 7, 2021, the remedy imposes a 15% tariff on the first 1.2 million large residential washers imported into the United States (under tariff) and a 35% tariff on such imports in excess of 1.2 million, and also imposes a 35% tariff on washer tub, drum, and cabinet imports in excess of 110,000. Consistent with modifications to the order approved in 2020, the 1.2 million under tariff is allocated by quarter (300,000 large residential washers per quarter). We cannot speculate on the modification's impact in future quarters, which will depend on Samsung and LG's U.S. production capabilities and import plans.an additional five years.
Raw Materials and Global Economy
The current domestic and international political environment have contributed to uncertainty surrounding the future state of the global economy. We have experienced raw material inflation in certain prior years based on the impact of U.S. tariffs and other global macroeconomic factors. WeDue to many factors beyond our control, including the conflict in Ukraine and related sanctions, the Israel-Palestinian conflict, the Red Sea conflict and its impact on shipping and logistics and government actions in China, among other factors, we expect to experience significantcontinue to be impacted by the following factors: a global shortage of certain components, such as semiconductors, a strain on raw material and input cost inflation, and freight cost increasesfluctuations in 2021,logistics availability, timing and costs, all of which began easing in 2023 but remain volatile. This could require us to modify our current business practices, and could have a material adverse effect on our financial statements in any particular reporting period.
Brexit
In 2016,
* Whirlpool ownership of the U.K. held a referendum, the outcome of which was an expressed public desire to exit the European Union (“Brexit”), which has resulted in greater uncertainty related to the free movement of goods, services, people and capital between the U.K. and the EU. On January 31, 2020, the U.K. officially exited the European Union and entered into a transition period to negotiate the final terms of Brexit, and on December 30, 2020, the U.K. and EU signed a Trade and Cooperation Agreement to govern the relationship between the U.K. and EU going forward. Many potential future impacts of Brexit remain unclear and could adversely impact certain areas of our business, including, but not limited to, an increase in duties and delaysHotpoint brand in the delivery of products,EMEA and adverse impacts to our suppliers and financing institutions. In order to mitigateAsia Pacific regions is not affiliated with the risks associated with Brexit, we are preparing for potential adverse impacts by collaborating across Company functions and working with external partners to develop and reviseHotpoint brand sold in the necessary contingency plans.Americas.
MANAGEMENT'S DISCUSSION AND ANALYSIS OF FINANCIAL CONDITION AND
RESULTS OF OPERATIONS - (CONTINUED)
FORWARD-LOOKING STATEMENTS
The Private Securities Litigation Reform Act of 1995 provides a safe harbor for forward-looking statements made by us or on our behalf. Certain statements contained in this annualquarterly report, including those within the forward-looking perspective section within thisthe Management's Discussion and Analysis section, and other written and oral statements made from time to time by us or on our behalf do not relate strictly to historical or current facts and may contain forward-looking statements that reflect our current views with respect to future events and financial performance. As such, they are considered "forward-looking statements" which provide current expectations or forecasts of future events. Such statements can be identified by the use of terminology such as "may," "could," "will," "should," "possible," "plan," "predict," "forecast," "potential," "anticipate," "estimate," "expect," "project," "intend," "believe," "may impact," "on track," "guarantee," "seek," and the negative of these words and words and terms of similar words or expressions.substance. Our forward-looking statements generally relate to our growth strategies, financial results, product development, and sales efforts. These forward-looking statements should be considered with the understanding that such statements involve a variety of risks and uncertainties, known and unknown, and may be affected by inaccurate assumptions. Consequently, no forward-looking statement can be guaranteed and actual results may vary materially.
This document contains forward-looking statements about Whirlpool Corporation and its consolidated subsidiaries ("Whirlpool") that speak only as of this date. Whirlpool disclaims any obligation to update these statements. Forward-looking statements in this document may include, but are not limited to, statements regarding future financial results, long-term value creation goals,
MANAGEMENT'S DISCUSSION AND ANALYSIS OF FINANCIAL CONDITION AND
RESULTS OF OPERATIONS - (CONTINUED)
restructuring and resegmentation expectations, productivity, raw material prices and related costs, supply chain, transaction-related closing and synergies expectations, asset impairment, litigation, ESG efforts, debt repayment expectations, and the impact of COVID-19 and the Russia/Ukraine, Israel and Red Sea conflicts on our operations. Many risks, contingencies and uncertainties could cause actual results to differ materially from Whirlpool's forward-looking statements. Among these factors are: (1) COVID-19 pandemic-related business disruptions and economic uncertainty; (2) intense competition in the home appliance industry, reflecting the impact of both new and established global competitors, including Asian and European manufacturers, and the impact of the changing retail environment, including direct-to-consumer sales; (3)(2) Whirlpool's ability to maintain or increase sales to significant trade customers and the ability of these trade customers to maintain or increase market share; (4)customers; (3) Whirlpool's ability to maintain its reputation and brand image; (5)(4) the ability of Whirlpool to achieve its business objectives and leverage its global operating platform, and accelerate the rate of innovation; (6)(5) Whirlpool’s ability to understand consumer preferences and successfully develop new products; (7)(6) Whirlpool's ability to obtain and protect intellectual property rights; (8)(7) acquisition, divestiture, and investment-related risks, including risks associated with our past acquisitions, and risks associated with our increased presence in emerging markets; (9) risks related to our international operations, including changes in foreign regulations, regulatory compliance and disruptions arising from political, legal and economic instability; (10) information technology system failures, data security breaches, data privacy compliance, network disruptions, and cybersecurity attacks; (11) product liability and product recall costs; (12)acquisitions; (8) the ability of suppliers of critical parts, components and manufacturing equipment to deliver sufficient quantities to Whirlpool in a timely and cost-effective manner; (9) COVID-19 pandemic, other public health emergency-related business disruptions and economic uncertainty; (10) Whirlpool's ability to navigate risks associated with our presence in emerging markets; (11) risks related to our international operations; (12) Whirlpool's ability to respond to unanticipated social, political and/or economic events; (13) ourinformation technology system failures, data security breaches, data privacy compliance, network disruptions, and cybersecurity attacks; (14) product liability and product recall costs; (15) Whirlpool's ability to attract, develop and retain executives and other qualified employees; (14)(16) the impact of labor relations; (15)(17) fluctuations in the cost of key materials (including steel, resins, copper and aluminum)base metals) and components and the ability of Whirlpool to offset cost increases; (16)(18) Whirlpool's ability to manage foreign currency fluctuations; (17)(19) impacts from goodwill impairment and related charges; (18)(20) triggering events or circumstances impacting the carrying value of our long-lived assets; (19)(21) inventory and other asset risk; (20)(22) health care cost trends, regulatory changes and variations between results and estimates that could increase future funding obligations for pension and postretirement benefit plans; (21) changes in LIBOR, or replacement of LIBOR with an alternative reference rate; (22)(23) litigation, tax, and legal compliance risk and costs, especially if materially different from the amount we expect to incur or have accrued for, and any disruptions caused by the same; (23)costs; (24) the effects and costs of governmental investigations or related actions by third parties; (24)(25) changes in the legal and regulatory environment including environmental, health and safety regulations, data privacy, and taxes and tariffs; (26) Whirlpool's ability to respond to the impact of climate change and (25)climate change regulation; and (27) the uncertain global economy and changes in economic conditions which affect demand for our products.conditions.
Additional information concerning these and other factors can be found in "Risk Factors" in Item 1A of this report.
MANAGEMENT'S DISCUSSION AND ANALYSIS OF FINANCIAL CONDITION AND
RESULTS OF OPERATIONS - (CONTINUED)
We undertake no obligation to update any forward-looking statement, and investors are advised to review disclosures in our filings with the SEC. It is not possible to foresee or identify all factors that could cause actual results to differ from expected or historic results. Therefore, investors should not consider the foregoing factors to be an exhaustive statement of all risks, uncertainties, or factors that could potentially cause actual results to differ from forward-looking statements.
Additional information concerning theseUnless otherwise indicated, the terms "Whirlpool," "the Company," "we," "us," and other factors can be found in "Risk Factors" in Item 1A of this report."our" refer to Whirlpool Corporation and its consolidated subsidiaries.
| | | | | |
| ITEM 7A. | QUANTITATIVE AND QUALITATIVE DISCLOSURES ABOUT MARKET RISK |
MARKET RISK
We have in place an enterprise risk management process that involves systematic risk identification and mitigation covering the categories of enterprise, strategic, financial, operational and compliance and reporting risks. The enterprise risk management process receives Board of Directors and management oversight, drives risk mitigation decision-making and is fully integrated into our internal audit planning and execution cycle.
We are exposed to market risk from changes in foreign currency exchange rates, domestic and foreign interest rates, and commodity prices, which can affect our operating results and overall financial condition. We manage exposure to these risks through our operating and financing
MANAGEMENT'S DISCUSSION AND ANALYSIS OF FINANCIAL CONDITION AND
RESULTS OF OPERATIONS - (CONTINUED)
activities and, when deemed appropriate, through the use of derivatives. Derivatives are viewed as risk management tools and are not used for speculation or for trading purposes. Derivatives are generally contracted with a diversified group of investment grade counterparties to reduce exposure to nonperformance on such instruments.
We use foreign currency forward contracts, currency options, currency swaps and cross-currency swaps to hedge the price risk associated with firmly committed and forecasted cross-border payments and receipts related to ongoing business and operational financing activities. At December 31, 2020,2023 and 2022, our most significant foreign currency exposures related to the Brazilian Real, Canadian Dollar and British Pound. We may also use forward or option contracts to hedge our investment in the net assets of certain international subsidiaries to offset foreign currency translation adjustments related to our net investment in those subsidiaries. These foreign currency contracts are sensitive to changes in foreign currency exchange rates. At December 31, 2020,2023, a 10% favorable or unfavorable exchange rate movement in each currency in our portfolio of foreign currency contracts would have resulted in an incremental unrealized gain of approximately $250$195 million or loss of approximately $273$215 million, respectively. Consistent with the use of these contracts to mitigate the effect of exchange rate fluctuations, such unrealized losses or gains would be offset by corresponding gains or losses, respectively, in the re-measurement of the underlying exposures.
We enter into interest rate swap and cross-currency swap agreements to manage our exposure to interest rate risk from probable long-term debt issuances or cross-currency debt. At December 31, 2020,2023, a 100 basis point increase or decrease in interest rates would have resulted in an incremental unrealized gain of approximately $32$3 million or unrealized loss of approximately $91$4 million, respectively, related to these contracts.
We enter into commodity swap contracts to hedge the price risk associated with firmly committed and forecasted commodities purchases, the prices of which are not fixed directly through supply contracts. At December 31, 2020,2023, a 10% favorable or unfavorable shift in commodity prices would have resulted in an incremental gain or loss of approximately $21$18 million, respectively, related to these contracts.
| | | | | |
| ITEM 8. | FINANCIAL STATEMENTS AND SUPPLEMENTARY DATA |
TABLE OF CONTENTS
| | | | | |
| PAGE |
| FINANCIAL STATEMENTS AND SUPPLEMENTARY DATA | |
| |
| |
| |
| |
| |
| | | | | | | | |
| PAGE |
| NOTES TO THE CONSOLIDATED FINANCIAL STATEMENTS | |
| 1. | | |
| 2. | | |
| 3. | | |
| 4. | | |
| 5. | | |
| 6. | | |
| 7. | | |
| 8. | | |
| 9. | | |
| 10. | | |
| 11. | | |
| 12. | | |
| 13. | | |
| 14. | | |
| 15. | | |
| 16. | | |
| 17. | | |
| 18. | | |
| | | | | | | | |
| PAGE |
| NOTES TO THE CONSOLIDATED FINANCIAL STATEMENTS | |
| 1 | | |
| 2 | | |
| 3 | | |
| | |
| 4 | | |
| 5 | | |
| 6 | | |
| 7 | | |
| 8 | | |
| 9 | | |
| 10 | | |
| 11 | | |
| 12 | | |
| | |
| 13 | | |
| 14 | | |
| 15 | | |
| | | | | |
| Report of Independent Registered Public Accounting Firm (PCAOB ID: 42) | |
WHIRLPOOL CORPORATION
CONSOLIDATED STATEMENTS OF INCOME (LOSS)
Year Ended December 31,
(Millions of dollars, except per share data)
| | | | | | | | | | | | | | | | | | | | |
| | 2020 | | 2019 | | 2018 |
| Net sales | | $ | 19,456 | | | $ | 20,419 | | | $ | 21,037 | |
| Expenses | | | | | | |
| Cost of products sold | | 15,606 | | | 16,886 | | | 17,500 | |
| Gross margin | | 3,850 | | | 3,533 | | | 3,537 | |
| Selling, general and administrative | | 1,877 | | | 2,142 | | | 2,189 | |
| Intangible amortization | | 62 | | | 69 | | | 75 | |
| Restructuring costs | | 288 | | | 188 | | | 247 | |
| Impairment of goodwill and other intangibles | | 7 | | | 0 | | | 747 | |
| (Gain) loss on sale and disposal of businesses | | (7) | | | (437) | | | 0 | |
| Operating profit | | 1,623 | | | 1,571 | | | 279 | |
| Other (income) expense | | | | | | |
| Interest and sundry (income) expense | | (21) | | | (168) | | | 108 | |
| Interest expense | | 189 | | | 187 | | | 192 | |
| Earnings before income taxes | | 1,455 | | | 1,552 | | | (21) | |
| Income tax expense (benefit) | | 384 | | | 354 | | | 138 | |
| Net earnings | | 1,071 | | | 1,198 | | | (159) | |
| Less: Net earnings (loss) available to noncontrolling interests | | (10) | | | 14 | | | 24 | |
| Net earnings available to Whirlpool | | $ | 1,081 | | | $ | 1,184 | | | $ | (183) | |
| Per share of common stock | | | | | | |
| Basic net earnings available to Whirlpool | | $ | 17.24 | | | $ | 18.60 | | | $ | (2.72) | |
| Diluted net earnings available to Whirlpool | | $ | 17.07 | | | $ | 18.45 | | | $ | (2.72) | |
| Weighted-average shares outstanding (in millions) | | | | | | |
| Basic | | 62.7 | | 63.7 | | 67.2 |
| Diluted | | 63.3 | | 64.2 | | 67.2 |
The accompanying notes are an integral part of these Consolidated Financial Statements.
WHIRLPOOL CORPORATION
CONSOLIDATED STATEMENTS OF COMPREHENSIVE INCOME (LOSS)
Year Ended December 31,
(Millions of dollars)
| | | | | | | | | | | | | | | | | | | | | | | |
| | 2020 | | 2019 | | 2018 |
| | | | | | | |
| Net earnings (loss) | | $ | 1,071 | | | $ | 1,198 | | | $ | (159) | |
| | | | | | |
| Other comprehensive income (loss), before tax: | | | | | | |
| Foreign currency translation adjustments | | (385) | | | 54 | | | (272) | |
| Derivative instruments: | | | | | | |
| Net gain (loss) arising during period | | (43) | | | 71 | | | 77 | |
| Less: reclassification adjustment for gain (loss) included in net earnings (loss) | | (126) | | | 88 | | | 107 | |
| Derivative instruments, net | | 83 | | | (17) | | | (30) | |
| | | | | | |
| | | | | | |
| | | | | | |
| Defined benefit pension and postretirement plans: | | | | | | |
| Prior service (cost) credit arising during period | | 156 | | | 9 | | | (5) | |
| Net gain (loss) arising during period | | (78) | | | (6) | | | (102) | |
| Less: amortization of prior service credit (cost) and actuarial (loss) | | (93) | | | (49) | | | (59) | |
| Defined benefit pension and postretirement plans, net | | 171 | | | 52 | | | (48) | |
| Other comprehensive income (loss), before tax | | (131) | | | 89 | | | (350) | |
| Income tax benefit (expense) related to items of other comprehensive income (loss) | | (60) | | | (12) | | | 5 | |
| Other comprehensive income (loss), net of tax | | $ | (191) | | | $ | 77 | | | $ | (345) | |
| | | | | | |
| Comprehensive income (loss) | | $ | 880 | | | $ | 1,275 | | | $ | (504) | |
| Less: comprehensive income (loss), available to noncontrolling interests | | (8) | | | 14 | | | 26 | |
| Comprehensive income (loss) available to Whirlpool | | $ | 888 | | | $ | 1,261 | | | $ | (530) | |
The accompanying notes are an integral part of these Consolidated Financial Statements.
WHIRLPOOL CORPORATION
CONSOLIDATED BALANCE SHEETS
At December 31,
(Millions of dollars)
| | | | | | | | | | | |
| 2020 | | 2019 |
| Assets | | | |
| Current assets | | | |
| Cash and cash equivalents | $ | 2,924 | | | $ | 1,952 | |
| Accounts receivable, net of allowance of $132 and $132, respectively | 3,109 | | | 2,198 | |
| Inventories | 2,187 | | | 2,438 | |
| | | |
| Prepaid and other current assets | 795 | | | 810 | |
| | | |
| Total current assets | 9,015 | | | 7,398 | |
| Property, net of accumulated depreciation of $6,780 and $6,444, respectively | 3,199 | | | 3,301 | |
| Right of use assets | 989 | | | 921 | |
| Goodwill | 2,496 | | | 2,440 | |
| Other intangibles, net of accumulated amortization of $673 and $593, respectively | 2,194 | | | 2,225 | |
| Deferred income taxes | 2,217 | | | 2,238 | |
| Other noncurrent assets | 240 | | | 358 | |
| Total assets | $ | 20,350 | | | $ | 18,881 | |
| Liabilities and stockholders' equity | | | |
| Current liabilities | | | |
| Accounts payable | $ | 4,834 | | | $ | 4,547 | |
| Accrued expenses | 637 | | | 652 | |
| Accrued advertising and promotions | 831 | | | 949 | |
| Employee compensation | 648 | | | 450 | |
| Notes payable | 12 | | | 294 | |
| Current maturities of long-term debt | 298 | | | 559 | |
| Other current liabilities | 1,070 | | | 918 | |
| | | |
| Total current liabilities | 8,330 | | | 8,369 | |
| Noncurrent liabilities | | | |
| Long-term debt | 5,059 | | | 4,140 | |
| Pension benefits | 516 | | | 542 | |
| Postretirement benefits | 166 | | | 322 | |
| Lease liabilities | 838 | | | 778 | |
| Other noncurrent liabilities | 732 | | | 612 | |
| Total noncurrent liabilities | 7,311 | | | 6,394 | |
| Stockholders' equity | | | |
| Common stock, $1 par value, 250 million shares authorized, 113 million shares issued, and 63 million and 63 million shares outstanding, respectively | 113 | | | 112 | |
| Additional paid-in capital | 2,923 | | | 2,806 | |
| Retained earnings | 8,639 | | | 7,870 | |
| Accumulated other comprehensive loss | (2,811) | | | (2,618) | |
| Treasury stock, 50 and 49 million shares, respectively | (5,065) | | | (4,975) | |
| Total Whirlpool stockholders' equity | 3,799 | | | 3,195 | |
| Noncontrolling interests | 910 | | | 923 | |
| Total stockholders' equity | 4,709 | | | 4,118 | |
| Total liabilities and stockholders' equity | $ | 20,350 | | | $ | 18,881 | |
The accompanying notes are an integral part of these Consolidated Financial Statements.
WHIRLPOOL CORPORATION
CONSOLIDATED STATEMENTS OF CASH FLOWS
Year Ended December 31,
(Millions of dollars)
| | | | | | | | | | | | | | | | | |
| 2020 | | 2019 | | 2018 |
| Operating activities | | | | | |
| Net earnings | $ | 1,071 | | | $ | 1,198 | | | $ | (159) | |
| Adjustments to reconcile net earnings to cash provided by (used in) operating activities: | | | | | |
| Depreciation and amortization | 568 | | | 587 | | | 645 | |
| Impairment of goodwill and other intangibles | 7 | | | 0 | | | 747 | |
| (Gain) loss on sale and disposal of businesses | (7) | | | (437) | | | 0 | |
| Changes in assets and liabilities: | | | | | |
| Accounts receivable | (940) | | | (87) | | | 79 | |
| Inventories | 241 | | | (39) | | | 73 | |
| Accounts payable | 341 | | | 140 | | | 210 | |
| Accrued advertising and promotions | (123) | | | 118 | | | 12 | |
| Accrued expenses and current liabilities | (287) | | | 22 | | | 162 | |
| Taxes deferred and payable, net | 156 | | | (116) | | | (67) | |
| Accrued pension and postretirement benefits | (30) | | | (81) | | | (434) | |
| Employee compensation | 303 | | | 106 | | | 44 | |
| Other | 200 | | | (181) | | | (83) | |
| Cash provided by (used in) operating activities | 1,500 | | | 1,230 | | | 1,229 | |
| Investing activities | | | | | |
| Capital expenditures | (410) | | | (532) | | | (590) | |
| Proceeds from sale of assets and business | 166 | | | 1,174 | | | 160 | |
| | | | | |
| Proceeds from held-to-maturity securities | 0 | | | 0 | | | 60 | |
| Investment in related businesses | 0 | | | 0 | | | (25) | |
| Other | 7 | | | (6) | | | (4) | |
| Cash provided by (used in) investing activities | (237) | | | 636 | | | (399) | |
| Financing activities | | | | | |
| Net proceeds from borrowings of long-term debt | 1,033 | | | 700 | | | 705 | |
| Repayments of long-term debt | (569) | | | (949) | | | (386) | |
| Net proceeds (repayments) from short-term borrowings | (330) | | | (723) | | | 653 | |
| Dividends paid | (311) | | | (305) | | | (306) | |
| Repurchase of common stock | (121) | | | (148) | | | (1,153) | |
| Purchase of noncontrolling interest shares | 0 | | | 0 | | | (41) | |
| Common stock issued | 44 | | | 8 | | | 17 | |
| Other | 1 | | | (7) | | | (7) | |
| Cash provided by (used in) financing activities | (253) | | | (1,424) | | | (518) | |
| Effect of exchange rate changes on cash, cash equivalents and restricted cash | (28) | | | (28) | | | (67) | |
| Increase (decrease) in cash, cash equivalents and restricted cash | 982 | | | 414 | | | 245 | |
| Cash, cash equivalents and restricted cash at beginning of year | 1,952 | | | 1,538 | | | 1,293 | |
| Cash, cash equivalents and restricted cash at end of year | $ | 2,934 | | | $ | 1,952 | | | $ | 1,538 | |
| Supplemental disclosure of cash flow information | | | | | |
| Cash paid for interest | $ | 193 | | | $ | 194 | | | $ | 183 | |
| Cash paid for income taxes | $ | 229 | | | $ | 469 | | | $ | 206 | |
| | | | | | | | | | | | | | | | | | | | |
| | 2023 | | 2022 | | 2021 |
| Net sales | | $ | 19,455 | | | $ | 19,724 | | | $ | 21,985 | |
| Expenses | | | | | | |
| Cost of products sold | | 16,285 | | | 16,651 | | | 17,576 | |
| Gross margin | | 3,170 | | | 3,073 | | | 4,409 | |
| Selling, general and administrative | | 1,993 | | | 1,820 | | | 2,081 | |
| Intangible amortization | | 40 | | | 35 | | | 47 | |
| Restructuring costs | | 16 | | | 21 | | | 38 | |
| Impairment of goodwill and other intangibles | | — | | | 384 | | | — | |
| Loss (gain) on sale and disposal of businesses | | 106 | | | 1,869 | | | (105) | |
| Operating profit (loss) | | 1,015 | | | (1,056) | | | 2,348 | |
| Other (income) expense | | | | | | |
| Interest and sundry (income) expense | | 71 | | | (19) | | | (159) | |
| Interest expense | | 351 | | | 190 | | | 175 | |
| Earnings (loss) before income taxes | | 593 | | | (1,227) | | | 2,332 | |
| Income tax expense (benefit) | | 77 | | | 265 | | | 518 | |
| Equity method investment income (loss), net of tax | | (28) | | | (19) | | | (8) | |
| Net earnings (loss) | | 488 | | | (1,511) | | | 1,806 | |
| Less: Net earnings (loss) available to noncontrolling interests | | 7 | | | 8 | | | 23 | |
| Net earnings (loss) available to Whirlpool | | $ | 481 | | | $ | (1,519) | | | $ | 1,783 | |
| Per share of common stock | | | | | | |
| Basic net earnings (loss) available to Whirlpool | | $ | 8.76 | | | $ | (27.18) | | | $ | 28.73 | |
| | | | | | |
| | | | | | |
| Diluted net earnings available to Whirlpool | | $ | 8.72 | | | $ | (27.18) | | | $ | 28.36 | |
| | | | | | |
| | | | | | |
| Weighted-average shares outstanding (in millions) | | | | | | |
| Basic | | 55.0 | | 55.9 | | 62.1 |
| Diluted | | 55.2 | | 55.9 | | 62.9 |
The accompanying notes are an integral part of these Consolidated Financial Statements.
WHIRLPOOL CORPORATION
CONSOLIDATED STATEMENTS OF CHANGES IN STOCKHOLDERS' EQUITYCOMPREHENSIVE INCOME (LOSS)
Year endedEnded December 31,
(Millions of dollars)
| | | | | | | | | | | | | | | | | | | | | | | | | | | | | | | | | | | | | | |
| | | | | Whirlpool Stockholders' Equity | | |
| | | Total | | Retained
Earnings | | Accumulated Other Comprehensive Income (Loss) | | Treasury Stock/
Additional Paid-In-Capital | | Common
Stock | | Non-
Controlling
Interests |
| Balances, December 31, 2017 | | $ | 5,128 | | | $ | 7,352 | | | $ | (2,331) | | | $ | (935) | | | $ | 112 | | | $ | 930 | |
| Comprehensive income | | | | | | | | | | | | |
| Net earnings (loss) | | (159) | | | (183) | | | — | | | — | | | — | | | 24 | |
| Other comprehensive income (loss) | | (345) | | | — | | | (347) | | | — | | | — | | | 2 | |
| Comprehensive income | | (504) | | | (183) | | | (347) | | | — | | | — | | | 26 | |
| Adjustment to beginning retained earnings | | $ | 72 | | | $ | 72 | | | | | | | | | |
| Adjustment to beginning accumulated other comprehensive loss | | $ | (17) | | | | | $ | (17) | | | | | | | |
| Stock issued (repurchased) | | (1,160) | | | — | | | — | | | (1,124) | | | — | | | (36) | |
| Dividends declared | | (314) | | | (308) | | | — | | | — | | | — | | | (6) | |
| Balances, December 31, 2018 | | 3,205 | | | 6,933 | | | (2,695) | | | (2,059) | | | 112 | | | 914 | |
| Comprehensive income | | | | | | | | | | | | |
| Net earnings (loss) | | 1,198 | | | 1,184 | | | — | | | — | | | — | | | 14 | |
| Other comprehensive income (loss) | | 77 | | | — | | | 77 | | | — | | | — | | | 0 | |
| Comprehensive income | | 1,275 | | | 1,184 | | | 77 | | | — | | | — | | | 14 | |
| Adjustment to beginning retained earnings | | 61 | | | 61 | | | — | | | — | | | — | | | — | |
| Stock issued (repurchased) | | (110) | | | — | | | — | | | (110) | | | — | | | 0 | |
| Dividends declared | | (313) | | | (308) | | | — | | | — | | | — | | | (5) | |
| Balances, December 31, 2019 | | 4,118 | | | 7,870 | | | (2,618) | | | (2,169) | | | 112 | | | 923 | |
| Comprehensive income | | | | | | | | | | | | |
| Net earnings | | 1,071 | | | 1,081 | | | — | | | — | | | — | | | (10) | |
| Other comprehensive income (loss) | | (191) | | | — | | | (193) | | | — | | | — | | | 2 | |
| Comprehensive income | | 880 | | | 1,081 | | | (193) | | | — | | | — | | | (8) | |
| | | | | | | | | | | | |
| Stock issued (repurchased) | | 28 | | | — | | | — | | | 27 | | | 1 | | | 0 | |
| Dividends declared | | (317) | | | (312) | | | — | | | — | | | — | | | (5) | |
| Balances, December 31, 2020 | | $ | 4,709 | | | $ | 8,639 | | | $ | (2,811) | | | $ | (2,142) | | | $ | 113 | | | $ | 910 | |
| | | | | | | | | | | | | | | | | | | | | | | |
| | 2023 | | 2022 | | 2021 |
| | | | | | | |
| Net earnings (loss) | | $ | 488 | | | $ | (1,511) | | | $ | 1,806 | |
| | | | | | |
| Other comprehensive income (loss), before tax: | | | | | | |
| Foreign currency translation adjustments | | 22 | | | 280 | | | 364 | |
| Derivative instruments: | | | | | | |
| Net (loss) gain arising during period | | (100) | | | 119 | | | 282 | |
| Less: reclassification adjustment for gain (loss) included in net earnings (loss) | | (36) | | | 93 | | | 255 | |
| Derivative instruments, net | | (64) | | | 26 | | | 27 | |
| | | | | | |
| | | | | | |
| | | | | | |
| Defined benefit pension and postretirement plans: | | | | | | |
| Prior service (cost) credit arising during period | | (1) | | | 5 | | | — | |
| Net gain (loss) arising during period | | (99) | | | (54) | | | 56 | |
| Less: amortization of prior service credit (cost) and actuarial (loss) | | (1) | | | (22) | | | (48) | |
| Defined benefit pension and postretirement plans, net | | (99) | | | (27) | | | 104 | |
| Other comprehensive income (loss), before tax | | (141) | | | 279 | | | 495 | |
| Income tax benefit (expense) related to items of other comprehensive income (loss) | | 53 | | | (12) | | | (41) | |
| Other comprehensive income (loss), net of tax | | $ | (88) | | | $ | 267 | | | $ | 454 | |
| | | | | | |
| Comprehensive income (loss) | | $ | 400 | | | $ | (1,244) | | | $ | 2,260 | |
| Less: comprehensive income (loss), available to noncontrolling interests | | 7 | | | 8 | | | 23 | |
| Comprehensive income (loss) available to Whirlpool | | $ | 393 | | | $ | (1,252) | | | $ | 2,237 | |
The accompanying notes are an integral part of these Consolidated Financial Statements.
NOTES TO THE WHIRLPOOL CORPORATION
CONSOLIDATED FINANCIAL STATEMENTSBALANCE SHEETS
At December 31,
(Millions of dollars)
| | | | | | | | | | | |
| 2023 | | 2022 |
| Assets | | | |
| Current assets | | | |
| Cash and cash equivalents | $ | 1,570 | | | $ | 1,958 | |
| Accounts receivable, net of allowance of $47 and $49, respectively | 1,529 | | | 1,555 | |
| Inventories | 2,247 | | | 2,089 | |
| | | |
| Prepaid and other current assets | 717 | | | 653 | |
| Assets held for sale | 144 | | | 139 | |
| Total current assets | 6,207 | | | 6,394 | |
| Property, net of accumulated depreciation of $5,259 and $4,808, respectively | 2,234 | | | 2,102 | |
| Right of use assets | 721 | | | 691 | |
| Goodwill | 3,330 | | | 3,314 | |
| Other intangibles, net of accumulated amortization of $440 and $400, respectively | 3,124 | | | 3,164 | |
| Deferred income taxes | 1,317 | | | 1,063 | |
| Other noncurrent assets | 379 | | | 396 | |
| | | |
| Total assets | $ | 17,312 | | | $ | 17,124 | |
| Liabilities and stockholders' equity | | | |
| Current liabilities | | | |
| Accounts payable | $ | 3,598 | | | $ | 3,376 | |
| Accrued expenses | 491 | | | 481 | |
| Accrued advertising and promotions | 603 | | | 623 | |
| Employee compensation | 238 | | | 159 | |
| Notes payable | 17 | | | 4 | |
| Current maturities of long-term debt | 800 | | | 248 | |
| Other current liabilities | 614 | | | 550 | |
| Liabilities held for sale | 587 | | | 490 | |
| Total current liabilities | 6,948 | | | 5,931 | |
| Noncurrent liabilities | | | |
| Long-term debt | 6,414 | | | 7,363 | |
| Pension benefits | 147 | | | 184 | |
| Postretirement benefits | 107 | | | 96 | |
| Lease liabilities | 612 | | | 584 | |
| Other noncurrent liabilities | 547 | | | 460 | |
| | | |
| Total noncurrent liabilities | 7,827 | | | 8,687 | |
| Stockholders' equity | | | |
| Common stock, $1 par value, 250 million shares authorized, 114 million and 114 million shares issued, respectively, and 55 million and 54 million shares outstanding, respectively | 114 | | | 114 | |
| Additional paid-in capital | 3,078 | | | 3,061 | |
| Retained earnings | 8,358 | | | 8,261 | |
| Accumulated other comprehensive loss | (2,178) | | | (2,090) | |
| Treasury stock, 60 million and 60 million shares, respectively | (7,010) | | | (7,010) | |
| Total Whirlpool stockholders' equity | 2,362 | | | 2,336 | |
| Noncontrolling interests | 175 | | | 170 | |
| Total stockholders' equity | 2,537 | | | 2,506 | |
| Total liabilities and stockholders' equity | $ | 17,312 | | | $ | 17,124 | |
The accompanying notes are an integral part of these Consolidated Financial Statements.
WHIRLPOOL CORPORATION
CONSOLIDATED STATEMENTS OF CASH FLOWS
Year Ended December 31,
(Millions of dollars)
| | | | | | | | | | | | | | | | | |
| 2023 | | 2022 | | 2021 |
| Operating activities | | | | | |
| Net earnings (loss) | $ | 488 | | | $ | (1,511) | | | $ | 1,806 | |
| Adjustments to reconcile net earnings to cash provided by (used in) operating activities: | | | | | |
| Depreciation and amortization | 361 | | | 475 | | | 494 | |
| Impairment of goodwill and other intangibles | — | | | 384 | | | — | |
| Loss (gain) on sale and disposal of businesses | 106 | | | 1,869 | | | (105) | |
| (Gain) loss on previously held equity interest | — | | | — | | | (42) | |
| Changes in assets and liabilities: | | | | | |
| Accounts receivable | 159 | | | 854 | | | (232) | |
| Inventories | (123) | | | (49) | | | (648) | |
| Accounts payable | 1 | | | (612) | | | 949 | |
| Accrued advertising and promotions | (37) | | | (51) | | | 70 | |
| Accrued expenses and current liabilities | 122 | | | 113 | | | 125 | |
| Taxes deferred and payable, net | (97) | | | 18 | | | 130 | |
| Accrued pension and postretirement benefits | (59) | | | (105) | | | (116) | |
| Employee compensation | 103 | | | (288) | | | 16 | |
| Other | (109) | | | 293 | | | (271) | |
| Cash provided by (used in) operating activities | 915 | | | 1,390 | | | 2,176 | |
| Investing activities | | | | | |
| Capital expenditures | (549) | | | (570) | | | (525) | |
| Proceeds from sale of assets and businesses | 10 | | | 77 | | | 302 | |
| | | | | |
| | | | | |
| Acquisition of businesses, net of cash acquired | (14) | | | (3,000) | | | (46) | |
| Cash held by divested businesses | — | | | (75) | | | (393) | |
| Other | — | | | — | | | 2 | |
| Cash provided by (used in) investing activities | (553) | | | (3,568) | | | (660) | |
| Financing activities | | | | | |
| Net proceeds from borrowings of long-term debt | 304 | | | 2,800 | | | 300 | |
| Net proceeds (repayments) of long-term debt | (750) | | | (300) | | | (300) | |
| Net proceeds (repayments) from short-term borrowings | 34 | | | (4) | | | (1) | |
| Dividends paid | (384) | | | (390) | | | (338) | |
| Repurchase of common stock | — | | | (903) | | | (1,041) | |
| | | | | |
| Common stock issued | 4 | | | 3 | | | 76 | |
| Other | — | | | — | | | (35) | |
| Cash provided by (used in) financing activities | (792) | | | 1,206 | | | (1,339) | |
| Effect of exchange rate changes on cash, cash equivalents and restricted cash | 45 | | | (20) | | | (67) | |
| Less: change in cash classified as held for sale | (3) | | | (94) | | | — | |
| Increase (decrease) in cash, cash equivalents and restricted cash | (388) | | | (1,086) | | | 110 | |
| Cash, cash equivalents and restricted cash at beginning of year | 1,958 | | | 3,044 | | | 2,934 | |
| Cash, cash equivalents and restricted cash at end of period | $ | 1,570 | | | $ | 1,958 | | | $ | 3,044 | |
| Supplemental disclosure of cash flow information | | | | | |
| Cash paid for interest | $ | 370 | | | $ | 161 | | | $ | 169 | |
| Cash paid for income taxes | $ | 175 | | | $ | 247 | | | $ | 388 | |
The accompanying notes are an integral part of these Consolidated Financial Statements.
WHIRLPOOL CORPORATION
CONSOLIDATED STATEMENTS OF CHANGES IN STOCKHOLDERS' EQUITY
Year ended December 31,
(Millions of dollars)
| | | | | | | | | | | | | | | | | | | | | | | | | | | | | | | | | | | | | | |
| | | | | Whirlpool Stockholders' Equity | | |
| | | Total | | Retained
Earnings | | Accumulated Other Comprehensive Income (Loss) | | Treasury Stock/
Additional Paid-In-Capital | | Common
Stock | | Non-
Controlling
Interests |
| Balances, December 31, 2020 | | $ | 4,795 | | | $ | 8,725 | | | $ | (2,811) | | | $ | (2,142) | | | $ | 113 | | | $ | 910 | |
| Comprehensive income | | | | | | | | | | | | |
| Net earnings (loss) | | 1,806 | | | 1,783 | | | — | | | — | | | — | | | 23 | |
| Other comprehensive income (loss) | | 454 | | | — | | | 454 | | | — | | | — | | | — | |
| Comprehensive income | | 2,260 | | | 1,783 | | | 454 | | | — | | | — | | | 23 | |
| | | | | | | | | | | | |
| Stock issued (repurchased) | | (938) | | | — | | | — | | | (939) | | | 1 | | | — | |
| Dividends declared | | (340) | | | (338) | | | — | | | — | | | — | | | (2) | |
| Acquisitions and Divestitures | | (764) | | | — | | | — | | | — | | | — | | | (764) | |
| Balances, December 31, 2021 | | 5,013 | | | 10,170 | | | (2,357) | | | (3,081) | | | 114 | | | 167 | |
| Comprehensive income | | | | | | | | | | | | |
| Net earnings (loss) | | (1,511) | | | (1,519) | | | — | | | — | | | — | | | 8 | |
| Other comprehensive income (loss) | | 267 | | | — | | | 267 | | | — | | | — | | | — | |
| Comprehensive income | | (1,244) | | | (1,519) | | | 267 | | | — | | | — | | | 8 | |
| | | | | | | | | | | | |
| Stock issued (repurchased) | | (868) | | | — | | | — | | | (868) | | | — | | | — | |
| Dividends declared | | (395) | | | (390) | | | — | | | — | | | — | | | (5) | |
| Acquisitions and Divestitures | | — | | | — | | | — | | | — | | | — | | | — | |
| Balances, December 31, 2022 | | 2,506 | | | 8,261 | | | (2,090) | | | (3,949) | | | 114 | | | 170 | |
| Comprehensive income | | | | | | | | | | | | |
| Net earnings | | 488 | | | 481 | | | — | | | — | | | — | | | 7 | |
| Other comprehensive income (loss) | | (88) | | | — | | | (88) | | | — | | | — | | | — | |
| Comprehensive income | | 400 | | | 481 | | | (88) | | | — | | | — | | | 7 | |
| | | | | | | | | | | | |
| Stock issued (repurchased) | | 17 | | | — | | | — | | | 17 | | | — | | | — | |
| Dividends declared | | (386) | | | (384) | | | — | | | — | | | — | | | (2) | |
| Acquisitions and divestitures | | — | | | — | | | — | | | — | | | — | | | — | |
| Balances, December 31, 2023 | | $ | 2,537 | | | $ | 8,358 | | | $ | (2,178) | | | $ | (3,932) | | | $ | 114 | | | $ | 175 | |
The accompanying notes are an integral part of these Consolidated Financial Statements.
NOTES TO THE CONSOLIDATED FINANCIAL STATEMENTS - (CONTINUED)
(1) SIGNIFICANT ACCOUNTING POLICIES
General Information
Whirlpool Corporation, a Delaware corporation, manufactures products in 1310 countries and markets products in nearly every country around the world under brand names such as Whirlpool, KitchenAid, Maytag, Consul, Brastemp, Amana, Bauknecht, JennAir, Indesit, InSinkErator, Yummly and Hotpoint*. We conduct our business through 4four operating segments, which we define based on geography. Whirlpool Corporation's operating and reportable segments consist of North America,America; Europe, Middle East and Africa ("EMEA"),; Latin America and Asia. Beginning January 1, 2024, we are conducting our business through five operating segments, which consist of Major Domestic Appliances (“MDA”) North America; MDA Europe, MDA Latin America; MDA Asia; and Small Domestic Appliances (“SDA”) Global.
On January 16, 2023, Whirlpool entered into a contribution agreement with Arçelik A.Ş (“Arcelik”) in alignment with Whirlpool’s portfolio transformation. Under the terms of the agreement, Whirlpool will contribute its European major domestic appliance business, and Arcelik will contribute its European major domestic appliance, consumer electronics, air conditioning, and small domestic appliance businesses into the newly formed entity of which Whirlpool will own 25% and Arcelik 75%, subject to an adjustment mechanism based on certain financial matters. Separately, Whirlpool agreed in principle to the sale of Whirlpool’s Middle East and Africa business to Arcelik. These transactions impact businesses that are collectively referred to as the European major domestic appliance business which was classified as held for sale in the fourth quarter of 2022. Whirlpool will retain ownership of its EMEA KitchenAid small domestic appliance business.
The transactions are expected to close by April 2024 and include nine Whirlpool production sites located in Italy, Poland, Slovakia, and the UK, as well as Arçelik’s two production facilities in Romania. For additional information, see Note 15 to the Consolidated Financial Statements.
The MDA Europe business will be deconsolidated upon the completion of the European contribution agreement transaction with Arcelik, and it does not qualify for reporting as discontinued operations.
Principles of Consolidation
The consolidated financial statements are prepared in conformity with GAAP, and include all majority-owned subsidiaries. All material intercompany transactions have been eliminated upon consolidation. We do not consolidate the financial statements of any company in which we have an ownership interest of 50% or less, unless that company is deemed to be a variable interest entity ("VIE") of which we are the primary beneficiary. VIEs are consolidated when the company is the primary beneficiary of these entities and has the ability to directly impact the activities of these entities. Our primary business purpose and involvement with VIEs is for product development and distribution.
Risks and Uncertainties
COVID-19During the first quarter of 2022, Russia commenced a military invasion of Ukraine, and the ensuing conflict has created disruption in the EMEA region and around the world. While we continued experiencing some of this disruption during the quarter, the duration and severity of the effects on our business and the global economy are inherently unpredictable. We continue to closely monitor the ongoing conflict which could materially impact our financial results in the future. We have some sales and distribution operations in Ukraine, however, the revenues and net assets are not material to our EMEA operating segment and consolidated results.
*Whirlpool ownership of the Hotpoint brand in the EMEA and Asia Pacific regions is not affiliated with the Hotpoint brand sold in the Americas.
NOTES TO THE CONSOLIDATED FINANCIAL STATEMENTS - (CONTINUED)
On June 27, 2022, our subsidiary Whirlpool EMEA SpA entered into a share purchase agreement with Arcelik to sell our Russian business to Arcelik for contingent consideration. The sale of the Russian business was completed on August 31, 2022. For additional information, see Note 15 to the Consolidated Financial Statements.
Furthermore, macroeconomic volatility, as well as ongoing international conflicts, continues to spread throughout the United States and otherimpact countries across the world, and the duration and severity of the effects are currently unknown. The pandemic has impacted the Company and could materially impact our financial results in the future.
The Consolidated Financial Statements presented herein reflect estimates and assumptions made by management at December 31, 20202023 and for the twelve months ended December 31, 2020.2023.
SuchThese estimates and assumptions affect, among other things, the Company’s goodwill, long-lived asset and indefinite-lived intangible asset valuation; inventory valuation; assessment of the annual effective tax rate; valuation of deferred income taxes and income tax contingencies; and the allowance for expected credit losses and bad debt. Events and changes in circumstances arising after February 11, 2021,14, 2024, including those resulting from the impacts of COVID-19,macroeconomic volatility, as well as the ongoing international conflicts, will be reflected in management’s estimates for future periods.
Goodwill and indefinite-lived intangible assets
We continue to monitor the significant global economic uncertainty as a result of COVID-19 to assess the outlook for demand for our products and the impact on our business and our overall financial performance. The goodwill in our EMEA reporting unit and ourOur IndesitMaytag , Hotpoint*and MaytagInSinkErator trademarks continue to beare at risk at December 31, 2020. In addition, we have concluded our JennAir trademark (carrying value of $304 million) to be at risk at December 31, 2020.2023. The goodwill in any of our other reporting units or other indefinite-lived intangible assets are not presently at risk for future impairment.
The potential impact of COVID-19 related demand disruptions, production impacts andor supply constraint impacts on our operating resultsconstraints along with a number of other factors could negatively effect revenues for the EMEA reporting unit in the short-term is uncertain,Maytag and InSinkErator trademarks, but we remain committed to the strategic actions necessary to realize the long-term forecasted EBIT marginsrevenues and expect that the macroeconomic environment will recover in the medium to long-term. The potential negative demand effect on revenues for the Indesit, Hotpoint*, Maytag and JennAir trademarks are also uncertain given the volatile environment, but we expect that demand and production levels will continue to recover.profitability of these trademarks.
A lack of recovery or further deterioration in market conditions, a sustained trend of weaker than expected financial performance in EMEA or for our Indesit, Hotpoint*, JennAirMaytag and MaytagInSinkErator trademarks, or a significant decline in the Company’s market capitalization, among other factors,
*Whirlpool ownership of the Hotpoint brand in the EMEA and Asia Pacific regions is not affiliated with the Hotpoint brand sold in the Americas.
NOTES TO THE CONSOLIDATED FINANCIAL STATEMENTS - (CONTINUED)
as a result of the COVID-19 pandemicmacroeconomic factors or other unforeseen events could result in an impairment charge in future periods which could have a material adverse effect on our financial statements.
Income taxes
Under U.S. GAAP, the Company calculates its quarterly tax provision based on an estimated effective tax rate for the year and then adjusts this amount by certain discrete items each quarter. Potential changing and volatile macroeconomic conditions could cause fluctuations in forecasted earnings before income taxes. As such, the Company's effective tax rate could be subject to volatility as forecasted earnings before income taxes are impacted by events which cannot be predicted. In addition, potential future economic deterioration brought on by the pandemic, ongoing conflicts in Ukraine, Israel and the Red Sea, and related sanctions or other factors, such as potential sales of businesses and new tax legislation may negatively impact the realizability and/or valuation of certain deferred tax assets.
Use of Estimates
We are required to make estimates and assumptions that affect the amounts reported in the Consolidated Financial Statements and accompanying Notes. The most significant assumptions are estimates in determining the fair value of goodwill and indefinite-lived intangible assets, assets held for sale, legal contingencies, income taxes and pension and other postretirement benefits. Actual results could differ materially from those estimates.
NOTES TO THE CONSOLIDATED FINANCIAL STATEMENTS - (CONTINUED)
Revenue Recognition
Revenue is recognized when performance obligations under the terms of a contract with our customers are satisfied, the sales price is determinable, and the risk and rewards of ownership are transferred. Generally the risk and rewards of ownership are transferred with the transfer of control of our products and services. For the majority of our sales, control is transferred to the customer as soon as products are shipped. For a portion of our sales, control is transferred to the customer upon receipt of products at the customer's location. Sales are net of allowances for product returns, which are based on historical return rates and certain promotions. See Note 2 to the Consolidated Financial Statements for additional information.
Sales Incentives
The cost of sales incentives is accrued at the date at which revenue is recognized by Whirlpool as a reduction of revenue. If new incentives are added after the product has been shipped, then they are accrued at that time, also as a reduction of revenue. These accrued promotions are recognized based on the expected value amount of incentives that will be ultimately claimed by trade customers or consumers. The expected value is the sum of probability-weighted amounts in a range of possible consideration amounts. If the amount of incentives cannot be reasonably estimated, an accrued promotion liability is recognized for the maximum potential amount. See Note 2 to the Consolidated Financial Statements for additional information.
Accounts Receivable and Allowance for Expected Credit Losses
We carry accounts receivable at sales value less an allowance for expected credit losses. We estimate our expected credit losses primarily by using an aging methodology and establish customer-specific reserves for higher risk trade customers. Our expected credit losses are evaluated and controlled within each geographic region considering the unique credit risk specific to the country, marketplace and economic environment. We take into account a combination of specific customer circumstances, credit conditions, market conditions, reasonable and supportable forecasts of future economic conditions and the history of write-offs and collections in developing the reserve. The adoption of the new credit loss standard did not have a material impact on the Consolidated Financial Statements. We evaluate items on an individual basis when determining accounts receivable write-offs. In general, our policy is to not charge interest on trade receivables after the invoice becomes past due. A receivable is considered past due if payment has not been received within agreed upon invoice terms.
Transfers and Servicing of Financial Assets
In an effort to manage economic and geographic trade customer risk, from time to time, the Company will transfer, primarily without recourse, accounts receivable balances of certain customers to financial institutions resulting in a nominal impact recorded in interest and sundry (income) expense. These transactions are accounted for as sales of the receivables resulting in the receivables being de-recognized from the Consolidated Balance Sheets. These transfers do not require continuing involvement from the Company.
Certain arrangements include servicing of transferred receivables by Whirlpool. Under these arrangements the Company received cash proceeds of $0.6 billion and $1.0 billion during the twelve months ended December 31, 2020 and December 31, 2019, respectively, from the sales of accounts receivables. These transfers primarily do not require continuing involvement from the Company. Outstanding accounts receivable transferred under arrangements where the Company continues to
NOTES TO THE CONSOLIDATED FINANCIAL STATEMENTS - (CONTINUED)
service the transferred asset were $30was $227 million and $348$80 million as of December 31, 20202023 and December 31, 2019,2022, respectively.The amount of cash proceeds received under these arrangements was $379 million and $80 million for the twelve months ended December 31, 2023 and December 31, 2022, respectively.
Freight and Warehousing Costs
We classify freight and warehousing costs within cost of products sold in our Consolidated Statements of Income (Loss).
NOTES TO THE CONSOLIDATED FINANCIAL STATEMENTS - (CONTINUED)
Cash and Cash Equivalents
All highly liquid debt instruments purchased with an initial maturity of three months or less are considered cash equivalents. Short-term investments are primarily comprised of money market funds and highly liquid, low risk investments with initial maturities less than 90 days. See Note 11 to the Consolidated Financial Statements for additional information.
Restricted Cash
As of December 31, 2020, restricted cash of $10 million represents contributions held as part of the Company's Charitable Foundation that was consolidated in 2020. As of December 31, 2019, the Company had 0 restricted cash. As of December 31, 2018, the Company had restricted cash of $40 million which represented cash required to be used to fund capital expenditures and technical resources to enhance Whirlpool China's research and development and working capital, as required by the terms of the Hefei Sanyo acquisition. See Note 410 to the Consolidated Financial Statements for additional information.
Fair Value Measurements
We measure fair value based on an exit price, representing the amount that would be received to sell an asset or paid to transfer a liability in an orderly transaction between market participants. As such, fair value is a market-based measurement that should be determined based on assumptions that market participants would use in pricing an asset or liability. As a basis for considering such assumptions, a three-tiered fair value hierarchy is established, which prioritizes the inputs used in measuring fair value as follows: (Level 1) observable inputs such as quoted prices in active markets; (Level 2) inputs, other than the quoted prices in active markets that are observable, either directly or indirectly; and (Level 3) unobservable inputs in which there is little or no market data, which require the reporting entity to develop its own assumptions. Certain investments are valued based on net asset value (NAV), which approximates fair value. Such basis is determined by referencing the respective fund's underlying assets. There are no unfunded commitments or other restrictions associated with these investments. We had Level 3 assets at December 31, 20202023 and 20192022 that included pension plan assets disclosed in Note 98 to the Consolidated Financial Statements. We had 0no Level 3 liabilities at December 31, 20202023 and 2019,2022, respectively.
We measured fair value for money market funds, available for sale investments and held-to-maturity securities using quoted market prices in active markets for identical or comparable assets. We measured fair value for derivative contracts, all of which have counterparties with high credit ratings, based on model driven valuations using significant inputs derived from observable market data. We also measured fair value for disposal groups held for sale based on the expected proceeds received from the sale. For assets measured at net asset values, we have 0no unfunded commitments or significant restraints. We measured fair value (non-recurring) for goodwill and other intangibles using a discounted cash flow model and a relief-from-royalty method, respectively, with inputs based on both observable and unobservable market data.
Inventories
United States production inventories are stated at last-in, first-out ("LIFO") cost.North America and EMEA reporting segments use the FIFO method of inventory valuation. Latin America and Asia inventories are stated at average cost. The remaining inventories are stated at first-in, first-out ("FIFO") cost. Costs include materials, labor and production overhead at normal production capacity. Costs do not exceed net realizable values. Changes in the amount that FIFO cost exceed LIFO cost are recognized in cost of goods sold. See Note 5 to the Consolidated Financial Statements for additional information about inventories.
NOTES TO THE CONSOLIDATED FINANCIAL STATEMENTS - (CONTINUED)
Property
Property is stated at cost, net of accumulated depreciation. For production machinery and equipment, we record depreciation based on units produced, unless units produced drop below a minimum threshold at which point depreciation is recorded using the straight-line method, excluding propertymethod. For certain acquired from the Hefei Sanyo acquisition and certain property acquired from the Indesit acquisition in 2014. For non-production assets and assets acquired from Hefei Sanyo and certain production assets, acquired from Indesit, we depreciate costs based on the straight-line method.
Property, plant and equipment associated with our European major domestic appliance business with a net book value of $952 million and $822 million at December 31, 2023 and December 31, 2022, respectively, has been classified as assets held for sale. Property, plant and equipment with a net book value of $141 million associated with our Russian business was removed as part of the deconsolidation of the Russian operations in the third quarter of 2022. For additional information, see Notes 10 and 15 to the Consolidated Financial Statements.
Property, plant and equipment and related accumulated depreciation of all divested businesses have been removed. For additional information, see Note 15 to the Consolidated Financial Statements.
NOTES TO THE CONSOLIDATED FINANCIAL STATEMENTS - (CONTINUED)
Depreciation expense for property, including accelerated depreciation classified as restructuring expense in our Consolidated Statements of Income (Loss), was $506$321 million, $518$440 million and $570$447 million in 2020, 20192023, 2022 and 2018,2021, respectively. Depreciation of our European major domestic appliance business has been suspended from December 2022 onwards due to the disposal group being classified as held for sale and measured at fair value less cost to sell.
The following table summarizes our property at December 31, 20202023 and 2019:2022:
| | Millions of dollars | Millions of dollars | | 2020 | | 2019 | | Estimated Useful Life | Millions of dollars | | 2023 | | 2022 | | Estimated Useful Life |
| Land | Land | | $ | 92 | | | $ | 97 | | | n/a | Land | | $ | 29 | | | $ | | $ | 32 | | | n/a | | n/a |
| Buildings | Buildings | | 1,517 | | | 1,540 | | | 10 to 50 years | Buildings | | 893 | | | 862 | | 862 | | | 10 to 50 years | | 10 to 50 years |
| Machinery and equipment | Machinery and equipment | | 8,370 | | | 8,108 | | | 3 to 20 years | Machinery and equipment | | 6,571 | | | 6,016 | | 6,016 | | | 3 to 20 years | | 3 to 20 years |
| Accumulated depreciation | Accumulated depreciation | | (6,780) | | | (6,444) | | |
| Property plant and equipment, net | Property plant and equipment, net | | $ | 3,199 | | | $ | 3,301 | | |
| Property plant and equipment, net | |
| Property plant and equipment, net | |
We classify gains and losses associated with asset dispositions in the same line item as the underlying depreciation of the disposed asset in the Consolidated Statements of Income (Loss).
During 2020, we primarily retired land and buildings related to a sale-leaseback transaction and machinery and equipment with a net book value of approximately $26 million that was no longer in use. During 2020, we recognized a gain of $113 million in cost of products sold ($74 million) and selling, general and administrative ($39 million) primarily related to the sale-leaseback transaction in the fourth quarter of 2020. These gains were related to manufacturing and warehousing operations and administrative offices, respectively. During 2019, we primarily retired land and buildings related to a sale-leaseback transaction and machinery and equipment with a net book value of approximately $41 million that was no longer in use. During 2019, we recognized a gain of $106 million in cost of products sold primarily related to the sale-leaseback transaction in the fourth quarter of 2019.
During the twelve months ended December 31, 2020,2023, we also disposed otherof buildings, machinery and equipment with a net book value of $16 million, compared to $25 million.million in prior year. The net loss on the disposals is immaterial for the twelve months ended December 31, 2023. The net gain on the other disposals were not material.was $54 million for the same period of 2022 and was primarily driven by a sale-leaseback transaction.
We record impairment losses on long-lived assets, excluding goodwill and indefinite-lived intangibles, when events and circumstances indicate the assets may be impaired and the estimated undiscounted future cash flows generated by those assets are less than their carrying amounts. There
Excluding assets held for sale, there were 0no significant impairments recorded during 2020, 20192023, 2022 and 2018.2021, respectively. For additional information, see Notes 10 and 15 to the Consolidated Financial Statements.
Capitalization of Internal Use Software Costs
We capitalize certain computer software development costs associated with qualifying application development stage activities or the acquisition of computer software for internal use. Capitalization is determined based on specific criteria, including whether the software is in the development stage and meets defined criteria for capitalization.
Capitalized software costs are recognized as part of property, plant, and equipment and are depreciated on a straight-line basis over the estimated useful lives of the software, generally not exceeding five years.
As of December 31, 2023 and December 31, 2022, capitalized software costs, net of accumulated depreciation, amounted to $135 million and $136 million, respectively. These amounts are included in the Machinery and Equipment category in the Property section of the Consolidated Balance Sheets. The depreciation expense recorded for these assets was $34 million, $39 million, and $47 million for the twelve months ended 2023, 2022, and 2021, respectively. There were no significant impairments recorded during 2023, 2022 and 2021, respectively.
Leases
We determine if an arrangement contains a lease at contract inception and determine the lease term by assuming the exercise of those renewal options that are reasonably assured. Leases with an initial term of 12 months or less are not recorded in the Consolidated Balance Sheets and we recognize lease expense for these leases on a straight-line basis over the lease term. We elect to not separate lease and non-lease components for all leases.
NOTES TO THE CONSOLIDATED FINANCIAL STATEMENTS - (CONTINUED)
As the Company's lease agreements normally do not provide an implicit interest rate, we apply the Company's incremental borrowing rate based on the information available at commencement date in determining the present value of future lease payments. Relevant information used in determining the Company's incremental borrowing rate includes the duration of the lease, location of the lease, and the Company's credit risk relative to risk-free market rates.
NOTES TO THE CONSOLIDATED FINANCIAL STATEMENTS - (CONTINUED)
Certain leases also include options to purchase the underlying asset at fair market value. If leased assets have leasehold improvements, typically the depreciable life of those leasehold improvements are limited by the expected lease term. Additionally, certain lease agreements include lease payment adjustments for inflation.
Sale-leaseback transactions
In the fourth quarter of 2020, the Company sold and leased back a group of non-core properties for net proceeds of approximately $139 million. The initial total annual rent for the properties is approximately $10 million per year over an initial 14 year lease term and is subject to annual rent increases. Under the terms of the lease agreement, the Company is responsible for all taxes, insurance and utilities and is required to adequately maintain the properties for the lease term. The Company has 4 sequential 5-year renewal options.
The transaction met the requirements for sale-leaseback accounting. Accordingly, the Company recorded the sale of the properties, which resulted in a gain of approximately $113 million ($89 million, net of tax) recorded in cost of products sold ($74 million) and selling, general and administrative expense ($39 million) in the Consolidated Statements of Income (Loss). The related land and buildings were removed from property, plant and equipment, net and the appropriate right-of-use asset and lease liabilities of approximately $128 million were recorded in the Consolidated Balance Sheets.
In the fourth quarter of 2019, the Company sold and leased back a group of non-core properties for net proceeds of approximately $140 million. The initial total annual rent for the properties is approximately $10 million per year over an initial 12 year lease term and is subject to annual rent increases. Under the terms of the lease agreement, the Company is responsible for all taxes, insurance and utilities and is required to adequately maintain the properties for the lease term. The Company has 5 sequential five-year renewal options.
The transaction met the requirements for sale-leaseback accounting. Accordingly, the Company recorded the sale of the properties, which resulted in a gain of approximately $111 million ($88 million, net of tax) recorded in cost of products sold ($95 million) and selling, general and administrative expense ($16 million) in the Consolidated Statements of Income (Loss). The related land and buildings were removed from property, plant and equipment, net and the appropriate right-of-use asset and lease liabilities of approximately $108 million were recorded in the Consolidated Balance Sheets.
Goodwill and Other Intangibles
We perform our annual impairment assessment for goodwill and indefinite-lived intangible assets as of October 1st and more frequently if indicators of impairment exist. We consider qualitative factors to assess if it is more likely than not that the fair value for goodwill or indefinite-lived intangible assets is below the carrying amount. We may also elect to bypass the qualitative assessment and perform a quantitative assessment.
In conducting a qualitative assessment, the Company analyzes a variety of events or factors that may influence the fair value of the reporting unit or indefinite-lived intangible asset, including, but not limited to: macroeconomic conditions, industry and market considerations, cost factors, overall financial performance, share price and other relevant factors.
Goodwill
We have 4four reporting units for which we assess for impairment which also represent our operating segments and are defined as North America, EMEA,America; Europe, Middle East and Africa; Latin America and Asia. In performingThe goodwill in any of our reporting units are not presently at risk for future impairment and a qualitative annual impairment assessment was performed in 2023. We evaluate goodwill using a qualitative assessment to determine whether it is more likely than not that the fair value of any reporting unit is less than its carrying amount, including goodwill.
When the qualitative assessment is not utilized and a quantitative assessment of goodwill,test is performed, we estimate each reporting unit's fair value using the best information available to us, including market information and discounted cash flow projections, also referred to as the income approach. The income approach uses the reporting unit's projections of estimated operating results and cash flows that are discounted using a market participant discount rate based on a weighted-average cost of capital. Additionally, we validate our estimates of fair value
NOTES TO THE CONSOLIDATED FINANCIAL STATEMENTS - (CONTINUED)
under the income approach by comparing the values to fair value estimates using a market approach.
There was 0The goodwill impairment test compares a reporting unit’s fair value to its carrying amount. If the fair value of the reporting unit exceeds its carrying amount, no impairment loss is measured. If the carrying amount of a reporting unit exceeds the reporting unit’s fair value, then a goodwill in 2020impairment loss is measured at the amount by which a reporting unit’s carrying amount exceeds its fair value, not to exceed the carrying amount of goodwill.
For additional information, see Notes 5 and 2019. In 2018, we recorded an impairment charge on goodwill of $579 million. See Note 6 and Note 1110 to the Consolidated Financial Statements for additional information about goodwill.Statements.
Intangible Assets
We perform a quantitative assessment of other indefinite-lived intangible assets, which are primarily comprised of trademarks. We estimate the fair value of these intangible assets using the relief-from-royalty method, which primarily requires assumptions related to projected revenues from our long-range plan, assumed royalty rates that could be payable if we did not own the trademark, and a market participant discount rate based on a weighted-average cost of capital.
Other definite-life intangible assets are amortized over their useful life and are assessed for impairment when impairment indicators are present.
We recorded an immaterial impairment charge on other intangibles in 2020For additional information, see Notes 5 and $168 million in 2018. There was 0 impairment on other intangibles in 2019. See Note 6 and Note 1110 to the Consolidated Financial Statements for additional information about other intangibles.Statements.
NOTES TO THE CONSOLIDATED FINANCIAL STATEMENTS - (CONTINUED)
Supply Chain Financing Arrangements
The Company has ongoing agreements globally with various third-parties to allow certain suppliers the opportunity to sell receivables due from us to participating financial institutions at the sole discretion of both the suppliers and the financial institutions. Additionally, in China, as a common practice, we pay suppliers with banker's acceptance drafts. Banker's acceptance drafts allow suppliers to sell their receivables to financial institutions at the sole discretion of both the supplier and the financial institution.
We have no economic interest in the sale of these receivables and no direct financial relationship with the financial institutions concerning these services. Our obligations to suppliers, including amounts due and scheduled payment terms, are not impacted. All outstanding balances under these programs are recorded in accounts payable on our Consolidated Balance Sheets. At December 31, 2020 and 2019,2023, approximately $1.2 billion and $1.2 billion, respectively, have been issued to participating financial institutions.
A downgrade in our credit rating or changes in the financial markets could limit the financial institutions’ willingness to commit funds to, and participate in, the programs. We do not believe such risk would have a material impact on our working capital or cash flows.
Derivative Financial Instruments
We use derivative instruments designated as cash flow, fair value and net investment hedges to manage our exposure to the volatility in material costs, foreign currency and interest rates on certain debt instruments. Changes in the fair value of derivative assets or liabilities (i.e., gains or losses) are recognized depending upon the type of hedging relationship and whether a hedge has been designated. For those derivative instruments that qualify for hedge accounting, we designate the hedging instrument, based upon the exposure being hedged, as a cash flow hedge, fair value hedge, or a hedge of a net investment in a foreign operation. For a derivative instrument designated as a fair value hedge, the gain or loss on the derivative is recognized in earnings immediately with the offsetting gain or loss on the hedged item. For a derivative instrument designated as a cash flow hedge, the effective portion of the derivative's gain or loss is initially reported as a component of Other Comprehensive Income (Loss) and is subsequently recognized in earnings when the hedged exposure affects earnings. For a derivative instrument designated as a hedge of a net investment in a foreign operation, the effective portion of the derivative's gain or loss is reported in Other Comprehensive Income (Loss) as part of the cumulative translation adjustment. Changes in fair value of derivative instruments that do not qualify for hedge accounting are recognized immediately in current net earnings. See Note 109 to the Consolidated Financial Statements for additional information about hedges and derivative financial instruments.
NOTES TO THE CONSOLIDATED FINANCIAL STATEMENTS - (CONTINUED)
Foreign Currency Translation and Transactions
Foreign currency denominated assets and liabilities are translated into United States dollars at exchange rates existing at the respective balance sheet dates. Translation adjustments resulting from fluctuations in exchange rates are recorded as a separate component of Accumulated Other Comprehensive Income (Loss). The results of operations of foreign subsidiaries are translated at the average exchange rates during the respective periods. Gains and losses resulting from foreign currency transactions are included in net earnings.
Research and Development Costs
Research and development costs are charged to expense and totaled $455$473 million, $541$465 million and $572$485 million in 2020, 20192023, 2022 and 2018,2021, respectively.
Advertising Costs
Advertising costs are charged to expense when the advertisement is first communicated and totaled $273$392 million, $335$329 million and $343$345 million in 2020, 20192023, 2022 and 2018,2021, respectively.
NOTES TO THE CONSOLIDATED FINANCIAL STATEMENTS - (CONTINUED)
Income Taxes and Indirect Tax Matters
We account for income taxes using the asset and liability method. Under this method, deferred tax assets and liabilities are recognized for the future tax consequences of temporary differences between the financial statement and tax basis of assets and liabilities using enacted rates. The effect of a change in tax rates on deferred tax assets is recognized in income in the period of the enactment date.
We recognize, primarily in other noncurrent liabilities, in the Consolidated Balance Sheets, the effects of uncertain income tax positions. Interest and penalties related to uncertain tax positions are reflected in income tax expense. We record liabilities, net of the amount, after determining it is more likely than not that the uncertain tax position will not be sustained upon examination based on its technical merits. We accrue for indirect tax contingencies when we determine that a loss is probable and the amount or range of loss is reasonably estimable.
Provision is made for taxes on undistributed earnings of foreign subsidiaries and related companies to the extent that such earnings are not deemed to be permanently invested.
See Note 1513 to the Consolidated Financial Statements for additional information.
Stock Based CompensationShare-based Incentive Plans
Stock basedShare-based compensation expense is based on the grant date fair value and is expensed over the period during which an employee is required to provide service in exchange for the award (generally the vesting period). The Company's stock based compensation includesShare-based incentive plans include stock options, performance stock units, and restricted stock units, among other award types. The fair value of stock options are determined using the Black-Scholes option-pricing model, which incorporates assumptions regarding the risk-free interest rate, expected volatility, expected option life, expected forfeitures and dividend yield. Expected forfeitures are based on historical experience. Stock options are granted with an exercise price equal to the closing stock price on the date of grant. The fair value of restricted stock units and performance stock units is generally based on the closing market price of Whirlpool common stock on the grant date. Stock basedShare-based compensation is recorded in selling, general and administrative expense on our Consolidated Statements of Income (Loss). See Note 1312 to the Consolidated Financial Statements for additional information.
Acquisitions
We include the results of operations of the businesses in which we acquire a controlling financial interest in our Consolidated Financial Statements beginning as of the acquisition date. On the acquisition date, we recognize, separate from goodwill, the assets acquired, including separately identifiable intangible assets, and the liabilities assumed based on the preliminary purchase price allocation. The excess of the consideration transferred over the fair values assigned to the net identifiable assets and liabilities of the acquired business is recognized as goodwill. Transaction costs are recognized separately from the acquisition and are expensed as incurred.
We may adjust preliminary amounts recognized at the acquisition date to their subsequently determined acquisition-date fair values during the measurement period which is twelve months from acquisition date.
For additional information, see Note 15 to the Consolidated Financial Statements.
Equity Method Investments
Whirlpool holds an equity interest of 20% in Whirlpool (China) Co., Ltd. (Whirlpool China), an entity which was previously controlled by the Company. We account for the remaining interest under equity method accounting and Whirlpool China and its subsidiaries continue to supply the Company in the normal course of business. Whirlpool China was also granted a license to sell Whirlpool-branded products in China.
The following tables summarize balances and transactions with Whirlpool China and its subsidiaries during the periods presented.
NOTES TO THE CONSOLIDATED FINANCIAL STATEMENTS - (CONTINUED)
BEFIEX Credits | | | | | | | | | | | | | | | | | |
| Millions of dollars | | | December 31, 2023 | | December 31, 2022 |
| Other noncurrent assets | Carrying value of equity interest | | $ | 187 | | | $ | 201 | |
| Accounts payable | Outstanding amounts due | | $ | 91 | | | $ | 75 | |
In previous years, our Brazilian operations earned tax credits under the Brazilian government's export incentive program (BEFIEX). These credits reduced Brazilian federal excise taxes on domestic sales, resulting in an increaseChanges in the operations' recorded net sales in 2017. From 2018 on, these creditscarrying value of the equity interest are reflected in interestdriven by earnings (loss) of the investee, the receipt of dividends, and sundry income in line with ASC 606. There was no material change to timing or amountthe effect of foreign exchange.
| | | | | | | | | | | | | | |
| | Twelve Months Ended December 31, |
| Millions of dollars | | 2023 | | 2022 |
| Purchases from Whirlpool China | | $ | 303 | | | $ | 376 | |
The licensing revenue recognition. We recognized export credits as they were monetized. See Note 8 and Note 15 to the Consolidated Financial Statements for additional information.
Out-of-Period Adjustment
During the third quarter of 2019, we recorded a net adjustment of $34 million related to prior years resultingoutstanding accounts receivable from the one time transition tax deemed repatriation on earnings of certain foreignWhirlpool China and its subsidiaries that were previously tax deferred and related impacts. This adjustment resulted in a decrease of net earnings available to Whirlpool of $34 million and a decrease of $0.53 in diluted earnings per share. The Company determined the impact was immaterial to prior periods and isare not material tofor the periods presented.
The Company’s share of the results of equity method investments and elimination of intra-entity results are included in the Equity method investment income (loss), net of tax in the Consolidated Statements of Income (Loss) forand Other noncurrent assets in the year endedConsolidated Balance Sheets.
The market value of our 20% investment in Whirlpool China, based on the quoted market price, is $191 million as of December 31, 2019.2023. Management has concluded that there are currently no indicators for an other-than-temporary impairment.
In addition, during the third quarter of 2019 we recorded an adjustment of $22 million related For additional information, see Note 15 to the first quarter of 2019 resulting from other foreign subsidiary income items and corresponding tax credit impacts. The Consolidated Statements of Income (Loss) for the year ended December 31, 2019 is not impacted by this adjustment.Financial Statements.
Related Party Transaction
In 2018, Whirlpool of India Limited (Whirlpool India)("Whirlpool India"), a majority-owned subsidiary of Whirlpool Corporation, acquired a 49% equity interest in Elica PB India for $22 million. On September 27, 2021, Whirlpool India entered into a share purchase agreement to acquire an additional 38% equity interest in Elica PB India for $57 million, which resulted in a controlling equity ownership of 87%. Following the closing of the transaction on September 29, 2021, Elica PB India is consolidated in Whirlpool Corporation's financial statements and is reported within our Asia reportable segment. The transaction resulted in a gain of approximately $42 million on the Company’s previously held equity interest. This gain was recorded within Interest and sundry (income) expense during the third quarter of 2021.
Goodwill of $100 million, which is not deductible for tax purposes, arose from this transaction and is allocated to the Asia reportable segment. The allocation has been made on the basis that the anticipated synergies identified will primarily benefit this reportable segment.
Elica PB India is a VIE for which the Company is the primary beneficiary. The carrying amount of customer relationships, which are included in Other intangible assets, net of accumulated amortization, amounts to $29 million as of December 31, 2023. Other assets or liabilities of Elica PB India are not material to the Consolidated Financial Statements of the Company.
Both Whirlpool India and the non-controlling interest shareholders retain an option for Whirlpool India to acquirepurchase the remaining equity interest in the future for fair value, and the non-Whirlpool India shareholders of Elica PB India received an option to sell their remaining equity interest to Whirlpool India in the future for fair value, which could be material to the financial statements of the Company, depending on the performance of the venture. We account for our minority interest under the equity method of accounting.
In the third quarter of 2019, we sold our 12.54% ownership interest in Elica S.p.A., the parent of Elica PB India, for a nominal amount.business.
Adoption of New Accounting Standards
On January 1, 2020 weWe adopted Accounting Standards Update ("ASU") No. 2016-13, "Financial Instruments - Credit Losses (Topic 326): Measurement of Credit Losses on Financial Instruments." The guidance in ASU 2016-13 creates a new impairment standard replacing the current "incurred loss" model. The incurred loss model required thatfollowing standards for a loss to be impaired and recognized on the financial statements it must be probable that it has been incurred at the measurement date. The new standard utilizes an "expected credit loss" model also referred to as "the current expected credit loss" (CECL) model. Under CECL, there is no threshold for impairment loss recognition, but it instead reflects a current estimate of all expected credit losses. The adoption of this standardyear ended December 31, 2023 which did not have a material impact to theon our Consolidated Financial Statements.Statements:
See Note 3 to the Consolidated Financial Statements for additional information. | | | | | | | | |
| Standard | | Effective Date |
| 2022-04 | Supplier Finance Programs (Subtopic 405-50): Disclosure of Supplier Finance Program Obligations | January 1, 2023 |
| | |
| | |
| | |
NOTES TO THE CONSOLIDATED FINANCIAL STATEMENTS - (CONTINUED)
We adopted the following standards, none of which had a material impact on our Consolidated Financial Statements:
| | | | | | | | |
Standard | | Effective Date |
2018-13 | Fair Value Measurement (Topic 820) Disclosure Framework - Changes to the Disclosure Requirements for Fair Value Measurement | January 1, 2020 |
2018-14 | Compensation - Retirement Benefits - Defined Benefit Plans - General (Subtopic 715-20): Disclosure Framework - Changes to the Disclosure Requirements for Defined Benefit Plans | January 1, 2020 |
2018-15 | Intangibles - Goodwill and Other - Internal-Use Software (Subtopic 350-40) Customer's Accounting for Implementation Costs Incurred In a Cloud Computing Arrangement That Is a Service Contract | January 1, 2020 |
2018-18 | Collaborative Arrangements (Topic 808) - Clarifying the Interaction between Topic 808 and Topic 606 | January 1, 2020 |
Accounting Pronouncements Issued But Not Yet Effective
In March 2020,November 2023, the FASB issued Update 2020-04, "Reference Rate Reform2023-07, "Segment Reporting (Topic 848)280): Facilitation of the Effects of Reference Rate Reform on Financial Reporting"Improvements to Reportable Segment Disclosures". This Update applies to all public entities that are required to report segment information in accordance with Topic 280. The amendments in this Update 2020-04 are electiveimprove reportable segment disclosure requirements, primarily through enhanced disclosures about significant segment expenses. The amendments in this Update do not change how a public entity identifies its operating segments, aggregates those operating segments, or applies the quantitative thresholds to determine its reportable segments. The new standard is effective for fiscal years beginning after December 15, 2023, and applyinterim periods within fiscal years beginning after December 15, 2024. Early adoption is permitted. The standard should be applied retrospectively to all prior periods presented in the financial statements. The Company is currently evaluating the impact of adopting this new standard.
In December 2023, the FASB issued Update 2023-09, "Income Taxes (Topic 740): Improvements to Income Tax Disclosures". This Update applies to all entities that have contracts, hedging relationships,are subject to Topic 740. The amendments in this Update improve income tax disclosures primarily related to the rate reconciliation and income taxes paid information as well as the effectiveness of certain other transactions that reference LIBOR or another reference rate expected to be discontinued due to reference rate reform.income tax disclosures. The new guidance provides the following optional expedients: simplify accounting analyses under current U.S. GAAPstandard is effective for contract modifications, simplify the assessment of hedge effectiveness, allow hedging relationships affected by reference rate reform to continue and allow a one-time election to sell or transfer debt securities classified as held to maturity that reference a rate affected by reference rate reform. In January 2021, the FASB issued Update 2021-01, "Reference Rate Reform (Topic 848): Scope". The update provides additional optional guidance on the transition from LIBOR to include derivative instruments that use an interest rate for margining, discounting or contract price alignment.annual periods beginning after December 15, 2024. Early adoption is permitted. The standard will ease, if warranted, the requirements for accounting for the future effects of the rate reform. An entity may elect to apply the amendments prospectively through December 31, 2022. We continue to monitorshould be applied on a prospective basis, but retrospective application is permitted. The Company is currently evaluating the impact the discontinuance of LIBOR or another reference rate will have on our contracts, hedging relationships and other transactions.
The FASB has issued the following relevant standards, which are not expected to have a material impact on our Consolidated Financial Statements:
| | | | | | | | |
Standard | | Effective Date |
2019-12 | Income Taxes (Topic 740) - Simplifying the Accounting for Income Taxes | January 1, 2021 |
2020-06 | Debt - Debt with Conversion and Other Options (Subtopic 470-20) and Derivatives and Hedging - Contracts in Entities Own Equity (Subtopic 815-40): Accounting for Convertible Instruments and Contracts in an Entities Own Equity | January 1, 2022 |
adopting this new standard.All other issued and not yet effective accounting standards are not relevant to the Company.
NOTES TO THE CONSOLIDATED FINANCIAL STATEMENTS - (CONTINUED)
(2) REVENUE RECOGNITION
Revenue from Contracts with Customers
In accordance with Topic 606, revenue is recognized when performance obligations under the terms of a contract with our customer are satisfied; generally this occurs with the transfer of control of our products or services. Revenue is measured as the amount of consideration we expect to receive in exchange for transferring products or providing services. Certain customers may receive cash and/or non-cash incentives, which are accounted for as variable consideration. To achieve the core principle, the Company applies the following five steps:
1. Identify the contract with a customer
A contract with a customer exists when (i) the Company enters into an agreement with a customer that defines each party's rights regarding the products or services to be transferred and identifies the payment terms related to these products or services, (ii) both parties to the contract are committed to perform their respective obligations, (iii) the contract has commercial substance, and (iv) the Company determines that collection of substantially all consideration for products or services that are transferred is probable based on the customer's intent and ability to pay the promised consideration. The Company applies judgment in determining the customer's ability and intention to pay, which is based on a variety of factors including the customer's payment history or, in the case of a new customer, published credit and financial information pertaining to the customer.
2. Identify the performance obligations in the contract
Performance obligations promised in a contract are identified based on the products or services that will be transferred to the customer that are both capable of being distinct, whereby the customer can benefit from the product or service either on its own or together with other resources that are readily available from third parties or from the Company, and are distinct in the context of the contract, whereby the transfer of the products or services is separately identifiable from other promises in the contract. To the extent a contract includes multiple promised products or services, the Company must apply judgment to determine whether promised products or services are capable of being distinct and distinct in the context of the contract. If these criteria are not met, the promised products or services are accounted for as a combined performance obligation. The
NOTES TO THE CONSOLIDATED FINANCIAL STATEMENTS - (CONTINUED)
Company has elected to account for shipping and handling activities as a fulfillment cost as permitted by the standard.
3. Determine the transaction price
The transaction price is determined based on the consideration to which the Company will be entitled in exchange for transferring products or services to the customer. To the extent the transaction price is variable, revenue is recognized at an amount equal to the consideration to which the Company expects to be entitled. This estimate includes customer sales incentives which are accounted for as a reduction to revenue and estimated primarily using the expected value method. Determining the transaction price requires significant judgment, which is discussed by revenue category in further detail below.
In practice, we do not offer extended payment terms beyond one year to customers. As such, we do not adjust our consideration for financing arrangements.
4. Allocate the transaction price to performance obligations in the contract
If the contract contains a single performance obligation, the entire transaction price is allocated to the single performance obligation. Contracts that contain multiple performance obligations require an allocation of the transaction price to each performance obligation based on a relative standalone selling price basis unless a portion of the variable consideration related to the contract is allocated
NOTES TO THE CONSOLIDATED FINANCIAL STATEMENTS - (CONTINUED)
entirely to a performance obligation. The Company determines standalone selling price based on the price at which the performance obligation is sold separately.
5. Recognize revenue when or as the Company satisfies a performance obligation
The Company generally satisfies performance obligations at a point in time. Revenue is recognized based on the transaction price at the time the related performance obligation is satisfied by transferring a promised product or service to a customer. The impact to revenue related to prior period performance obligations inis less than 1% of global consolidated revenues for the twelve months ended December 31, 2020 is immaterial.2023, 2022 and 2021, respectively.
Disaggregation of Revenue
The following table presents our disaggregated revenues by revenue source. We sell products within all major product categories in each operating segment. For additional information on the disaggregated revenues by geographical regions, see Note 1614 to the Consolidated Financial Statements.
Revenues related to our former compressor business were fully reflected in our Latin America segment through June 30, 2019. We completed the sale of our compressor business on July 1, 2019. For additional information on the sale of Embraco, see Note 17 to the Consolidated Financial Statements.
| | | | | | | | | | | | | | |
| | Twelve months ended |
| Millions of dollars | | 2020 | | 2019 |
| Major product categories: | | | | |
| Laundry | | $ | 5,675 | | | $ | 6,193 | |
| Refrigeration | | 6,058 | | | 6,229 | |
| Cooking | | 4,782 | | | 4,670 | |
| Dishwashing | | 1,605 | | | 1,598 | |
| Total major product category net sales | | $ | 18,120 | | | $ | 18,690 | |
| Compressors | | 0 | | | 557 | |
| Spare parts and warranties | | 913 | | | 979 | |
| Other | | 423 | | | 193 | |
| Total net sales | | $ | 19,456 | | | $ | 20,419 | |
The impact to revenue related to prior period performance obligations was not material for the year ended December 31, 2020.
| | | | | | | | | | | | | | | | | | | | |
| | Twelve months ended |
| Millions of dollars | | 2023 | | 2022 | | 2021 |
| Major product categories: | | | | | | |
| Laundry | | $ | 5,333 | | | $ | 5,133 | | | $ | 6,122 | |
| Refrigeration | | 5,794 | | | 6,248 | | | 6,677 | |
| Cooking | | 4,721 | | | 5,056 | | | 5,639 | |
| Dishwashing | | 1,729 | | | 1,822 | | | 1,890 | |
| Total major product category net sales | | $ | 17,577 | | | $ | 18,259 | | | $ | 20,327 | |
| Spare parts and warranties | | 953 | | | 923 | | | 1,187 | |
| Other | | 925 | | | 542 | | | 470 | |
| Total net sales | | $ | 19,455 | | | $ | 19,724 | | | $ | 21,985 | |
Major Product Category Sales
Whirlpool Corporation manufactures and markets a full line of home appliances and related products and services. Our major product categories include the following: refrigeration, laundry, cooking, and dishwashing. The refrigeration product category includes refrigerators, freezers, ice makers and refrigerator water filters. The laundry product category includes laundry appliances,
NOTES TO THE CONSOLIDATED FINANCIAL STATEMENTS - (CONTINUED)
commercial laundry products and related laundry accessories. The cooking category includes cooking appliances and other small domestic appliances. The dishwashing product category includes dishwasher appliances and related accessories.
For product sales, we transfer control and recognize a sale when we ship the product from our manufacturing facility to our customer or when the customer receives the product based upon agreed shipping terms. Each unit sold is considered an independent, unbundled performance obligation. We do not have any additional performance obligations other than product sales that are material in the context of the contract. The amount of consideration we receive and revenue we recognize varies due to sales incentives and returns we offer to our customers. When we give our
NOTES TO THE CONSOLIDATED FINANCIAL STATEMENTS - (CONTINUED)
customers the right to return eligible products, we reduce revenue for our estimate of the expected returns which is primarily based on an analysis of historical experience.
Spare Parts & Warranties
Spare parts are primarily sold to parts distributors and retailers, with a small number of sales to end consumers. For spare part sales, we transfer control and recognize a sale when we ship the product to our customer or when the customer receives product based upon agreed shipping terms. Each unit sold is considered an independent, unbundled performance obligation. We do not have any additional performance obligations other than spare part sales that are material in the context of the contract. The amount of consideration we receive and revenue we recognize varies due to sales incentives and returns we offer to our customers. When we give our customers the right to return eligible products, we reduce revenue for our estimate of the expected returns which is primarily based on an analysis of historical experience.
Warranties are classified as either assurance type or service type warranties. A warranty is considered an assurance type warranty if it provides the consumer with assurance that the product will function as intended. A warranty that goes above and beyond ensuring basicstandard functionality is considered a service type warranty. The Company offers certain limited warranties that are assurance type warranties and extended service arrangements that are service type warranties. Assurance type warranties are not accounted for as separate performance obligations under the revenue model. If a service type warranty is sold with a product or separately, revenue is recognized over the life of the warranty. The Company evaluates warranty offerings in comparison to industry standards and market expectations to determine appropriate warranty classification. Industry standards and market expectations are determined by jurisdictional laws, competitor offerings and customer expectations. Market expectations and industry standards can vary based on product type and geography. The Company primarily offers assurance type warranties.
Whirlpool sells certain extended service arrangements separately from the sale of products. Whirlpool acts as a sales agent under somea majority of these arrangements whereby the Company receives a fee that is recognized as revenue upon the sale of the extended service arrangement. The Company is also the principal for certain extended service arrangements. Revenue related to these arrangements is recognized ratably over the contract term.
Other Revenue
Other revenue sources include primarily the revenues from the InSinkErator business, acquired in the fourth quarter of 2022, subscription arrangements and licenses as described below.
The Company has a water filtration subscription business, operating under our Brastemp brand, in our Latin America segment which provides the consumerconsumers and businesses with a water filtration system that is delivered toinstalled in the consumer's home.or business's location. Our Brastempwater filtration subscription contracts represent a performance obligation that is satisfied over time and revenue is recognized as the performance obligation is completed. The installation and maintenance of the water filtration system are not distinct services in the context of the contract (i.e. the customer views all activities associated with the arrangement as one singular value proposition). The contract term is generally less than one year for these arrangements and revenue is recognized based on the monthly invoiced amount which directly corresponds to the value of our performance completed to date. On January 16, 2024, the Company entered into a share purchase agreement with a third-party
NOTES TO THE CONSOLIDATED FINANCIAL STATEMENTS - (CONTINUED)
We license our brands in arrangements that do not include other performance obligations. Whirlpool licensing provides a right of access to the Company's intellectual property throughout the license period. Whirlpool recognizes licensing revenue over the life of the license contract as the underlying sale or usage occurs. As a result, we recognize revenue for these contracts at the amount which directly corresponds to the value provided to the customer.
NOTES TO THE CONSOLIDATED FINANCIAL STATEMENTS - (CONTINUED)
Costs to Obtain or Fulfill a Contract
We do not capitalize costs to obtain a contract because a nominal number of contracts have terms that extend beyond one year. The Company does not have a significant amount of capitalized costs related to fulfillment.
Sales Tax and Indirect Taxes
The Company is subject to certain indirect taxes in certain jurisdictions including but not limited to sales tax, value added tax, excise tax and other taxes we collect concurrent with revenue-producing activities that are excluded from the transaction price, and therefore, excluded from revenue.
Allowance for Expected Credit Losses and Bad Debt Expense
We estimate our expected credit losses primarily by using an aging methodology and establish customer-specific reserves for higher risk trade customers. Our expected credit losses are evaluated and controlled within each geographic region considering the unique credit risk specific to the country, marketplace and economic environment. We take into account past events, current conditions and reasonable and supportable forecasts in developing the reserve. The adoption of the new credit loss standard did not have a material impact on the Consolidated Financial Statements.
The following table summarizes our allowance for doubtful accounts by operating segment for the twelve months ended December 31, 2020.2023.
| | Millions of dollars | Millions of dollars | December 31, 2019 | Charged to Earnings | Write-offs | Foreign Currency | December 31, 2020 |
| Millions of dollars | |
| Millions of dollars | |
| Accounts receivable allowance | |
| Accounts receivable allowance | |
| Accounts receivable allowance | Accounts receivable allowance | |
| North America | North America | $ | 4 | | $ | 4 | | $ | (1) | | $ | 0 | | $ | 7 | |
| North America | |
| North America | |
| EMEA | |
| EMEA | |
| EMEA | EMEA | 83 | | 5 | | (22) | | 1 | | 67 | |
| Latin America | Latin America | 33 | | 32 | | (17) | | (4) | | 44 | |
| Latin America | |
| Latin America | |
| Asia | Asia | 12 | | 1 | | 0 | | 1 | | 14 | |
| $ | 132 | | $ | 42 | | $ | (40) | | $ | (2) | | $ | 132 | |
| Asia | |
| Asia | |
| $ | |
| $ | |
| $ | |
| Financing receivable allowance | |
| Financing receivable allowance | |
| Financing receivable allowance | Financing receivable allowance | |
| Latin America | Latin America | $ | 29 | | $ | 0 | | $ | (2) | | $ | 0 | | $ | 27 | |
| Asia | 19 | | 0 | | 0 | | 2 | | 21 | |
| Latin America | |
| Latin America | |
| | | $ | 48 | | $ | 0 | | $ | (2) | | $ | 2 | | $ | 48 | |
| Consolidated | Consolidated | $ | 180 | | $ | 42 | | $ | (42) | | $ | 0 | | $ | 180 | |
| | Consolidated | |
| | Consolidated | |
(1) Starting from the fourth quarter of 2022, accounts receivable allowance of our European major domestic appliance business is transferred to assets held for sale. For additional information, see Note 15 to the Consolidated Financial Statements.
We recorded an immaterial amount of bad debt expense for the yearyears ended December 31, 20202023, 2022 and 2019,2021, respectively.
NOTES TO THE CONSOLIDATED FINANCIAL STATEMENTS - (CONTINUED)
(3) LEASES
Leases
We lease certain manufacturing facilities, warehouses/distribution centers, office space, land, vehicles, and equipment. At lease inception, we determine the lease term by assuming the exercise of those renewal options that are reasonably assured. Leases with an initial term of 12 months or less are not recorded in the Consolidated Balance Sheets and we recognize lease expense for these leases on a straight-line basis over the lease term. The Company had operating lease costs of approximately $236approximately $235 million, $218 millionand $214$234 million for the years ended December 31, 20202023, 2022 and December 31, 2019,2021, respectively.
Non-cancelable operating lease commitments that had not yet commenced were $49 million for the periods ended December 31, 2020 and December 31, 2019. These operating leases are expected to commence by the end of fiscal year 2021 with lease terms of up to 10 years.
NOTES TO THE CONSOLIDATED FINANCIAL STATEMENTS - (CONTINUED)
At December 31, 2020,2023 and 2022, we have 0no material leases classified as financing leases and weleases. We have approximately $1.2 billion$929 million of non-cancellable operating lease commitments, excluding variable consideration. consideration at December 31, 2023 and $889 million at December 31, 2022. The undiscounted annual future minimum lease payments are summarized by year in the table below:below and excludes lease payments related to our European major domestic appliance business classified as held for sale.
| | Maturity of Lease Liabilities | Maturity of Lease Liabilities | Operating Leases
(in millions) | Maturity of Lease Liabilities | Operating Leases
(in millions) |
| 2021 | $ | 210 | |
| 2022 | 180 | |
| 2023 | 159 | |
| 2024 | 2024 | 136 | |
| 2025 | 2025 | 107 | |
| 2026 | |
| 2027 | |
| 2028 | |
| Thereafter | Thereafter | 369 | |
| Total lease payments | Total lease payments | $ | 1,161 | |
| Less: interest | Less: interest | 149 | |
| Present value of lease liabilities | Present value of lease liabilities | $ | 1,012 | |
The long-term portion of the lease liabilities included in the amounts above is $838 million.$612 million as of December 31, 2023. The remainder of our lease liabilities are included in other current liabilities in the Consolidated Balance Sheets.
At December 31, 2020,2023 and December 31, 2022, the weighted average remaining lease term and weighted average discount rate for operating leases was 87 years and 4%5%, respectively. At December 31, 2019 the weighted average remaining lease term and weighted average discount rate for operating leases was 7 years and 4%, respectively.
During the year ended December 31, 20202023 the cash paid for amounts included in the measurement of the liabilities and the operating cash flows was $234 million.$236 million. The right of use assets obtained in exchange for new liabilities was $315$157 million partially offset by $68 million in terminations for the year ended December 31, 2020.2023.
During the year ended December 31, 20192022 the cash paid for amounts included in the measurement of the liabilities and the operating cash flows was $210 million.$219 million. The right of use assets obtained in exchange for new liabilities was $298$79 million partially offset by $68 million in terminations for the year ended December 31, 2019.2022.
As the Company's lease agreements normally do not provide an implicit interest rate, we apply the Company's incremental borrowing rate based on the information available at commencement date in determining the present value of future lease payments. Relevant information used in determining the Company's incremental borrowing rate includes the duration of the lease, location of the lease, and the Company's credit risk relative to risk-free market rates.
Many of our leases include renewal options that can extend the lease term. The execution of those renewal options is at our sole discretion and reflected in the lease term when they are reasonably certain to be exercised.
Certain leases also include options to purchase the underlying asset at fair market value. If leased assets have leasehold improvements, typically the depreciable life of those leasehold improvements
NOTES TO THE CONSOLIDATED FINANCIAL STATEMENTS - (CONTINUED)
are limited by the expected lease term. Additionally, certain lease agreements include lease payment adjustments for inflation.
Our lease agreements do not contain any material residual value guarantees or material restrictive covenants, except for synthetic leases (see Synthetic lease arrangements).
We rent or sublease certain real estate to third parties.parties. Our sublease portfolio primarily consists of operating leases within our warehouses, resulting in a nominal amount of sublease income for the years ended December 31, 20202023, 2022 and December 31, 2019.
74
NOTES TO THE CONSOLIDATED FINANCIAL STATEMENTS - (CONTINUED)
There were no material sale-leaseback transactions in 2023. In the first quarter of 2022, the Company sold and leased back a group of non-core properties for net proceeds of approximately $52 million. The initial total annual rent for the properties is approximately $2 million per year over an initial 15 year lease term and is subject to annual rent increases. Under the terms of the lease agreement, the Company is responsible for all taxes, insurance and utilities and is required to adequately maintain the properties for the lease term. The Company has two sequential 5-year renewal options.RentThe transaction met the requirements for sale-leaseback accounting. Accordingly, the Company recorded the sale of the properties, which resulted in a gain of approximately $44 million ($36 million, net of tax) recorded in selling, general and administrative expense underin the Company's operating leases duringConsolidated Statements of Comprehensive Income (Loss) for the yeartwelve months ended December 31, 2018, prior to2022. The related land and buildings were removed from property, plant and equipment, net and the Company's adoptionappropriate right-of-use asset and lease liabilities of ASC 842, was $250 million.approximately $32 million were recorded in the Consolidated Balance Sheets at the time of the transaction in the first quarter of 2022.
Synthetic lease arrangements
We have a number of synthetic lease arrangements with financial institutions for non-core properties. The leases contain provisions for options to purchase, extend the original term for additional periods or return the property. As of December 31, 2020,2023, these arrangements include residual value guarantees of up to $220approximately $378 million that could potentially come due in future periods. We do not believe it is probable that any material amounts will be owed under these guarantees. Therefore, no material amounts related to the residual value guarantees are included in the lease payments used to measure the right-of-use assets and lease liabilities. The residual value guarantee was not materialamounted to the Consolidated Financial Statements at$334 million as of December 31, 2019.2022.
The majority of these leases are classified as operating leases. We have assessed the reasonable certainty of these provisions to determine the appropriate lease term. The leases were measured using our incremental borrowing rate and are included in our right of use assets and lease liabilities in the Consolidated Balance Sheets. Rental payments are calculated at the applicable LIBORreference rate plus a margin. The impact to the Consolidated Balance Sheets and Consolidated Statements of Income (Loss) areis nominal.
(4) CASH, CASH EQUIVALENTS AND RESTRICTED CASH
The following table provides a reconciliation of cash, cash equivalents and restricted cash as reported within our Consolidated Statements of Cash Flows:
| | | | | | | | | | | | | | | | | |
| December 31, |
| Millions of dollars | 2020 | | 2019 | | 2018 |
| Cash and cash equivalents as presented in our Consolidated Balance Sheets | $ | 2,924 | | | $ | 1,952 | | | $ | 1,498 | |
| Restricted cash included in prepaid and other current assets | 10 | | | 0 | | | 40 | |
| Restricted cash included in other noncurrent assets | 0 | | | 0 | | | 0 | |
| Cash, cash equivalents and restricted cash as presented in our Consolidated Statements of Cash Flows | $ | 2,934 | | | $ | 1,952 | | | $ | 1,538 | |
See Financial Condition and Liquidity in the Management's Discussion and Analysis section for additional information on cash and cash equivalents. See Significant Accounting Policies for additional information on restricted cash.
(5) INVENTORIES
The following table summarizes our inventories at December 31, 20202023 and 2019:2022:
| | Millions of dollars | Millions of dollars | | 2020 | | 2019 | Millions of dollars | | 2023 | | 2022 |
| Finished products | Finished products | | $ | 1,638 | | | $ | 1,979 | |
| Raw materials and work in process | Raw materials and work in process | | 669 | | | 602 | |
| 2,307 | | | 2,581 | |
| Less: excess of FIFO cost over LIFO cost | | (120) | | | (143) | |
| Total inventories | Total inventories | | $ | 2,187 | | | $ | 2,438 | |
LIFO inventories represented 41% and 43% of total inventories at December 31, 2020 and 2019, respectively.
NOTES TO THE CONSOLIDATED FINANCIAL STATEMENTS - (CONTINUED)
(6)(5) GOODWILL AND OTHER INTANGIBLES
Goodwill
The following table summarizes goodwill attributable to our reporting units for the periods presented:
| | Millions of dollars | Millions of dollars | North
America | | EMEA | | Latin
America | | Asia | | Total
Whirlpool | Millions of dollars | North
America | | EMEA | | Latin
America | | Asia | | Total
Whirlpool |
| Ending balance December 31, 2018 | $ | 1,693 | | | $ | 309 | | | $ | 33 | | | $ | 416 | | | $ | 2,451 | |
| Ending balance December 31, 2021 | |
| Currency translation adjustment | Currency translation adjustment | 2 | | | (7) | | | 0 | | | (6) | | | (11) | |
| Ending balance December 31, 2019 | $ | 1,695 | | | $ | 302 | | | $ | 33 | | | $ | 410 | | | $ | 2,440 | |
Divestitures and acquisitions (1) | |
Impairment (2) | |
| Ending balance December 31, 2022 | |
| Currency translation adjustment | Currency translation adjustment | 0 | | | 27 | | | 1 | | | 28 | | | 56 | |
| Ending balance December 31, 2020 | $ | 1,695 | | | $ | 329 | | | $ | 34 | | | $ | 438 | | | $ | 2,496 | |
Divestitures and acquisitions (1) | |
| Impairment | |
| Ending balance December 31, 2023 | |
|
2020(2) and Full impairment of EMEA goodwill recorded in the second quarter of 2022. For additional information, See Note 10 to the Consolidated Financial Statements.
A2019 annualnnual impairment assessment
We completed our annual impairment test for goodwill as of October 1, 20202023 and 2019.October 1, 2022. The Company elected to bypass theperformed a qualitative assessment and perform a quantitative assessment to evaluate goodwill for all our reporting units. units and determined no impairment was indicated.
Interim impairment assessment
In connection with the preparation of our Consolidated Condensed Financial Statements for three months ended June 30, 2022, we identified indicators of goodwill impairment for our EMEA reporting unit, which required us to complete an interim impairment assessment. The primary indicators of impairment were the adverse impacts from the continuation of the Russia and Ukraine conflict, including the impact on demand, the divestiture of our Russian operations and other ongoing adverse macroeconomic impacts such as raw material inflation, supply chain disruption and unfavorable demand. As a result of these factors, the operating results for the three-months ended June 30, 2022 were significantly lower than expected and our expectations of attaining our long term plans for the region were delayed.
In performing our quantitative assessment of goodwill, we estimated the reporting unit's fair value under an income approach using a discounted cash flow model. The income approach used the reporting unit's projections of estimated operating results and cash flows that were discounted using a market participant discount rate based on the weighted-average cost of capital. The main assumptions supporting the cash flow projections include revenue growth, EBIT margins and the discount rate. The financial projections reflect management's best estimate of economic and market conditions over the projected period including forecasted revenue growth, EBIT margins, tax rate, capital expenditures, depreciation and amortization, changes in working capital requirements and the terminal growth rate.
Based on our interim quantitative impairment assessment as of June 30, 2022, the quantitative assessmentcarrying value of the EMEA reporting unit exceeded its fair value and we determined there was norecorded a goodwill impairment charge for the full amount of goodwill.the goodwill's carrying value of $278 million during the second quarter of 2022.
For additional information, see Note 10 to the Consolidated Financial Statements.
NOTES TO THE CONSOLIDATED FINANCIAL STATEMENTS - (CONTINUED)
Other Intangible Assets
The following table summarizes other intangible assets for the period presented:
| | December 31, 2020 | | December 31, 2019 |
| December 31, 2023 | | | December 31, 2023 | | December 31, 2022 |
| Millions of dollars | Millions of dollars | Gross Carrying Amount | | Accumulated Amortization | | Net | | Gross Carrying Amount | | Accumulated Amortization | | Net | Millions of dollars | Gross Carrying Amount | | Accumulated Amortization | | Net | | Gross Carrying Amount | | Accumulated Amortization | | Net |
| Other intangible assets, finite lives: | Other intangible assets, finite lives: | |
Customer relationships (1) | Customer relationships (1) | $ | 647 | | | $ | (430) | | | $ | 217 | | | $ | 624 | | | $ | (377) | | | $ | 247 | |
Customer relationships (1) | |
Customer relationships (1) | |
Patents and other (2) | Patents and other (2) | 327 | | | (241) | | | 86 | | | 324 | | | (216) | | | 108 | |
| Total other intangible assets, finite lives | Total other intangible assets, finite lives | $ | 974 | | | $ | (671) | | | $ | 303 | | | $ | 948 | | | $ | (593) | | | $ | 355 | |
Trademarks, indefinite lives (3) | 1,893 | | | (2) | | | 1,891 | | | 1,870 | | | 0 | | | 1,870 | |
Trademarks, indefinite lives (3)(4) | |
| Total other intangible assets | Total other intangible assets | $ | 2,867 | | | $ | (673) | | | $ | 2,194 | | | $ | 2,818 | | | $ | (593) | | | $ | 2,225 | |
(1)Customer relationships have an estimated useful life of 5 to 19 years. Includes $327 million of customer relationships, net of accumulated amortization, acquired as part of InSinkErator acquisition in 2022.
(2)Patents and other intangibles have an estimated useful life of 3 to 43 years.
(3)Includes impairment chargeTrademarks valued at $1.3 billion were acquired as part of $7 million at December 31, 2020.the InSinkErator acquisition in 2022. For additional information, see Notes 10 and 15 to the Consolidated Financial Statements.
2020 and 2019 aAnnual impairment assessment
We completed our annual impairment assessment for other intangible assets as of October 1, 2020.2023. The Company elected to bypass the qualitative assessment and perform a quantitative assessment to evaluate certain indefinite-life intangible assets. Based on the results of the quantitative annual assessment, we determined there were no impairments of the carrying values of intangible assets.
In the fourth quarter of 2022, and in connection with the classification of our European major domestic appliance business to held for sale, we recorded a loss of $1,521 million for the write-down of the disposal group to its estimated fair value of $139 million. The loss from the transaction includes the remaining carrying values of Hotpoint* and Indesit trademarks for $92 million and $133 million, respectively, and write-down of other intangible assets of $54 million. See Note 10 and 15 to the Consolidated Financial Statements for additional information.
We completed our annual impairment assessment for other intangible assets as of October 1, 2022. The Company elected to bypass the qualitative assessment and perform a quantitative assessment to evaluate certain indefinite-lived intangible assets. Based on the results of the quantitative assessment, we recorded an immaterial intangible impairment charge in the EMEA region.
We completed our annual impairment assessment for other intangible assets as of October 1, 2019. The Company elected to bypass the qualitative assessment and perform a quantitative assessment to evaluate certain indefinite-life intangible assets. Based on the results of the quantitative assessment, we determined there was no impairment of intangible assets.
assets, other than the amounts recorded during the second quarter of 2022. See Note 1110 to the Consolidated Financial Statements for additional information.
Amortization expense was $62$40 million, $69$35 million and $75$47 million for the years ended December 31, 2020, 20192023, 2022 and 2018,2021, respectively.
*Whirlpool ownership of the Hotpoint brand in the EMEA and Asia Pacific regions is not affiliated with the Hotpoint brand sold in the Americas.
NOTES TO THE CONSOLIDATED FINANCIAL STATEMENTS - (CONTINUED)
The following table summarizes our future estimated amortization expense by year:year. Amortization expense related to intangible assets transferred to held for sale of our European major appliance business are excluded from the table below.
| | Millions of dollars | Millions of dollars | | Millions of dollars | |
| 2021 | $ | 59 | |
| 2022 | 49 | |
| 2023 | 41 | |
| 2024 | 2024 | 28 | |
| 2025 | 2025 | 21 | |
| 2026 | |
| 2027 | |
| 2028 | |
|
Interim impairment assessment
Similarly to the review of EMEA reporting unit, and in connection with the preparation of our Consolidated Condensed Financial Statements for three months ended June 30, 2022, we identified indicators of impairment associated with other intangible assets in our EMEA reporting unit, which required us to complete an interim impairment assessment. The primary indicators of impairment were the same as those identified for EMEA reporting unit and resulted in the actual revenues for the three-months ended June 30, 2022 being significantly lower than forecasted for Indesit and Hotpoint* trademarks.
In performing our quantitative assessment of other intangible assets, primarily trademarks, we estimate the fair value using the relief-from-royalty method which requires assumptions related to projected revenues from our long-range plans; assumed royalty rates that could be payable if we did not own the trademark; and a discount rate using a market-based weighted-average cost of capital. Based on our interim quantitative impairment assessment as of June 30, 2022, the carrying value of certain other intangible assets, including Indesit and Hotpoint*, exceeded their fair value, and we recorded an impairment charge of $106 million during the second quarter of 2022. See Note 10 to the Consolidated Financial Statements for additional information.
The estimates of future cash flows used in determining the fair value of goodwill and intangible assets involve significant management judgment and are based upon assumptions about expected future operating performance, economic conditions, market conditions and cost of capital. Inherent in estimating the future cash flows are uncertainties beyond our control, such as changes in capital markets. The actual cash flows could differ materially from management's estimates due to changes in business conditions, operating performance and economic conditions.
(7)
*Whirlpool ownership of the Hotpoint brand in the EMEA and Asia Pacific regions is not affiliated with the Hotpoint brand sold in the Americas.
NOTES TO THE CONSOLIDATED FINANCIAL STATEMENTS - (CONTINUED)
(6) FINANCING ARRANGEMENTS
Long-Term Debt
The following table summarizes our long-term debt at December 31, 20202023 and 2019:2022:
| | Millions of dollars | Millions of dollars | 2020 | 2019 | Millions of dollars | 2023 | 2022 |
| Senior Note - 0.63%, maturing 2020 | $ | 0 | | $ | 561 | |
| Senior Note - 4.85%, maturing 2021 | 300 | | 300 | |
| Senior Note - 4.70%, maturing 2022 | 300 | | 300 | |
| Senior Note - 3.70%, maturing 2023 | Senior Note - 3.70%, maturing 2023 | 250 | | 250 | |
| Senior Note - 4.00%, maturing 2024 | Senior Note - 4.00%, maturing 2024 | 300 | | 300 | |
| Term Loan - SOFR + 85bps, maturing 2024 | |
| Term Loan - SOFR +110bps, maturing 2025 | |
| Senior Note - 3.70%, maturing 2025 | Senior Note - 3.70%, maturing 2025 | 350 | | 350 | |
Senior Note - 1.25%, maturing 2026(1) | Senior Note - 1.25%, maturing 2026(1) | 606 | | 556 | |
Senior Note - 1.10%, maturing 2027(1) | Senior Note - 1.10%, maturing 2027(1) | 727 | | 667 | |
Senior Note - 0.50%, maturing 2028(1) | Senior Note - 0.50%, maturing 2028(1) | 607 | | 0 | |
| Senior Note - 4.75%, maturing 2029 | Senior Note - 4.75%, maturing 2029 | 693 | | 692 | |
| Senior Note - 2.40%, maturing 2031 | |
| Senior Note - 4.70%, maturing 2032 | |
| Senior Note - 5.50%, maturing 2033 | |
| Senior Note - 5.15%, maturing 2043 | Senior Note - 5.15%, maturing 2043 | 249 | | 249 | |
| Senior Note - 4.50%, maturing 2046 | Senior Note - 4.50%, maturing 2046 | 497 | | 496 | |
| Senior Note - 4.60%, maturing 2050 | Senior Note - 4.60%, maturing 2050 | 493 | | 0 | |
| Other, net | Other, net | (15) | | (22) | |
| $ | 5,357 | | $ | 4,699 | |
| $ | |
| Less current maturities | Less current maturities | 298 | | 559 | |
| Total long-term debt | Total long-term debt | $ | 5,059 | | $ | 4,140 | |
(1)Euro denominated debt reflects impact of currency
For outstanding notes issued by our wholly-owned subsidiaries the debt is fully and unconditionally guaranteed by the Company.
The following table summarizes the contractual maturities of our long-term debt, including current maturities, at December 31, 2020:2023:
| | | | | |
| Millions of dollars | |
| 2021 | $ | 298 | |
| 2022 | 297 | |
| 2023 | 247 | |
| 2024 | 297 | |
| 2025 | 347 | |
| Thereafter | 3,871 | |
| Long-term debt, including current maturities | $ | 5,357 | |
NOTES TO THE CONSOLIDATED FINANCIAL STATEMENTS - (CONTINUED)
| | | | | |
| Millions of dollars | |
| 2024 | 800 | |
| 2025 | 1,850 | |
| 2026 | 549 | |
| 2027 | 659 | |
| 2028 | 550 | |
| Thereafter | 2,806 | |
| Long-term debt, including current maturities | $ | 7,214 | |
Debt Offering
On May 7, 2020,February 22, 2023, the Company completed its offering of $500$300 million inaggregate principal amount of 4.60%5.5% Senior Notes due 20502033 (the “2033 Notes”), in a public offering pursuant to a registration statement on Form S-3 (File No. 333-224381)333-255372). The notes2033 Notes were issued under an indenture (the “Indenture”), dated March 20, 2000, between the Company, as issuer, and U.S. Bank Trust Company, National Association (as successor to U.S. Bank, National Association and Citibank, N.A.), as trustee. The sale of the 2033 Notes was made pursuant to the terms of an Underwriting Agreement, dated February 14, 2023, with BNP Paribas Securities Corp., ING Financial Markets LLC, Mizuho Securities USA LLC, SMBC Nikko Securities America, Inc. and SG Americas Securities, LLC, as representatives of the several underwriters in connection with the offering and sales of the 2033 Notes. The 2033 Notes contain covenants that limit the Company's ability to incur certain liens or enter into certain sale and lease-back transactions. In addition, if we experience a specific kind of
NOTES TO THE CONSOLIDATED FINANCIAL STATEMENTS - (CONTINUED)
change of control, we are required to make an offer to purchase all of the notes at a purchase price of 101% of the principal amount thereof, plus accrued and unpaid interest. The Company used the net proceeds from the sale of the 2033 Notes to repay $250 million aggregate principal amount of 3.7% Notes which were paid on March 1, 2023, and for general corporate purposes.
On May 4, 2022, the Company completed its offering of $300 million in principal amount of 4.7% Senior Notes due 2032 (the “2032 Notes”), in a public offering pursuant to a registration statement on Form S-3 (File No. 333-255372). The 2032 Notes were issued under the Indenture. The sale of the 2032 Notes was made pursuant to the terms of an Underwriting Agreement, dated May 2, 2022, among the Company, as issuer, and BNP Paribas Securities Corp., Citigroup Global Markets Inc., Goldman Sachs & Co. LLC, Mizuho Securities USA LLC and Wells Fargo Securities, LLC, as representatives of the several underwriters in connection with the offering and sales of the 2032 Notes. The 2032 Notes contain covenants that limit the Company's ability to incur certain liens or enter into certain sale and lease-back transactions. In addition, if we experience a specific kind of change of control, we are required to make an offer to purchase all of the notes at a purchase price of 101% of the principal amount thereof, plus accrued and unpaid interest. The Company used the net proceeds from the sale of the notes2032 Notes to repay $300 million aggregate principal amount of 4.7% Notes which were paid on June 1, 2022.
Term Loan Agreement
On September 23, 2022, the Company entered into a portion of the outstanding borrowings under the Company’s revolving credit facility, as amendedTerm Loan Agreement by and restated, dated as of August 6, 2019, among the Company, certain other borrowers, the lenders referred to therein, JPMorgan Chase Bank, N.A. as administrative agent and Citibank, N.A., as syndication agent.
On February 21, 2020, Whirlpool EMEA Finance S.à r.l., an indirect, wholly-owned finance subsidiary of WhirlpoolSumitomo Mitsui Banking Corporation completed a bond offering consisting of €500 million (approximately $540 million at closing) in principal amount of 0.50% Senior Notes due in 2028 (the "Notes"(“SMBC”) in a public offering pursuant to a registration statement on Form S-3 (File No. 333-224381). The Notes were issued under an indenture, dated February 21, 2020, among Whirlpool EMEA Finance S.à r.l, as issuer, the Company, as parent guarantor, and U.S. Bank National Association, as trustee. Whirlpool Corporation has fully and unconditionally guaranteed the Notes on a senior unsecured basis. The Notes contain covenants that limit Whirlpool Corporation's ability to incur certain liens or enter into certain sale and lease-back transactions. In addition, if we experience a specific kind of change of control, we are required to make an offer to purchase all of the Notes at a purchase price of 101% of the principal amount thereof, plus accrued and unpaid interest. The Company used the net proceeds from the sale of the Notes to redeem Whirlpool Corporation's 0.625% Senior Notes due in 2020 (see Debt Repayment).
On February 26, 2019, the Company completed a bond offering consisting of $700 million in principal amount of 4.75% Senior Notes due in 2029. The notes were issued under an indenture, dated March 20, 2000, between the Company, as issuer, and U.S. Bank National Association (as successor to Citibank N.A.), as trustee. The notes contain covenants that limit Whirlpool Corporation's ability to incur certain liens or enter into certain sale-leaseback transactions. In addition, if we experience a specific kind of change of control, we are required to make an offer to purchase all of the notes at a purchase price of 101% of the principal amount thereof, plus accrued and unpaid interest. The notes are registered under the Securities Act of 1933, as amended, pursuant to our Registration Statement on Form S-3 (File No.333-224381). The Company used the net proceeds from the sale of the notes to repay the Whirlpool EMEA Finance Term Loan (see Debt Repayment).
Debt Repayment
On March 12, 2020, €500 million (approximately $566 million at repayment) of 0.625% senior notes matured and were repaid.
On August 9, 2019, we repaid $1.0 billion pursuant to our April 23, 2018 Term Loan Agreement with Citibank, N.A., as Administrative Agent and certain other financial institutions, representing full repayment of amounts borrowed under the term loan. As previously disclosed, we agreed to repay this term loan amount with the net cash proceeds received from the sale of our Embraco business unit to Nidec Corporation, which closed on July 1, 2019.
On February 27, 2019, we repaid €600 million (approximately $673 millionSyndication Agent and as of that date) pursuant to our June 5, 2018 Term Loan Agreement with Wells Fargo Bank, National Association, as Administrative Agent,lender, and certain other financial institutions as lenders. SMBC, BNP Paribas, ING Bank N.V., Dublin Branch, Mizuho Bank, Ltd., and Societe Generale acted as Joint Lead Arrangers and Syndication Agents; The Bank of Nova Scotia and Bank of China, Chicago Branch acted as Documentation Agents; and SMBC acted as Sole Bookrunner for the Term Loan Agreement. The Term Loan Agreement provides for an aggregate lender commitment of $2.5 billion. The Company utilized proceeds from the term loan facility on a delayed draw basis to fund a majority of the $3.0 billion purchase price consideration for the Company’s acquisition from Emerson Corporation (“Emerson”) of Emerson’s InSinkErator business, as set forth in the Asset and Stock Purchase Agreement between Whirlpool and Emerson dated as of August 7, 2022 (the "Whirlpool EMEA Finance“Acquisition Agreement”).
The term loan facility is divided into two tranches: a $1 billion tranche with a maturity date of April 30, 2024 and a $1.5 billion tranche with a maturity date of October 31, 2025.
The interest and fee rates payable with respect to the term loan facility based on the Company's current debt rating are as follows: (1) the spread over secured overnight financing rate ("SOFR") for the 18-month tranche is 0.75%; (2) the spread over SOFR for the 3-year tranche is 1.00%; (3) the spread over prime for both tranches is zero; and (4) the ticking fee for both tranches is 0.10%, as of the date hereof.
The Term Loan")Loan Agreement contains customary covenants and warranties including, among other things, a rolling twelve month interest coverage ratio required to be greater than or equal to 3.0 to 1.0 for each fiscal quarter. In addition, the covenants limit the Company's ability to (or to permit any subsidiaries to), representing full repayment of amounts borrowedsubject to various exceptions and limitations: (i) merge with other companies; (ii) create liens on its property; and (iii) incur debt at the subsidiary level. We were in compliance with our interest coverage ratio under the Whirlpool EMEA Finance Term Loan.term loan agreement as of December 31, 2023.
NOTES TO THE CONSOLIDATED FINANCIAL STATEMENTS - (CONTINUED)
On March 1, 2019, $250The outstanding amount for this term loan agreement at December 31, 2023 was $2 billion of which approximately $500 million of 2.40% senior notes matured and were repaid. On April 26, 2018, $363 million of 4.50% senior notes matured and were repaid.is classified in current liabilities on the Consolidated Balance Sheet.
Credit Facilities
On April 27, 2020, Whirlpool CorporationMay 3, 2022, the Company entered into a revolving 364-DayFifth Amended and Restated Long-Term Credit Agreement (the “364-Day“Amended Long-Term Facility”) by and among the Company, certain other borrowers, the lenders referred to therein, and Citibank,JPMorgan Chase Bank, N.A. as Administrative Agent, and Citibank, N.A., as Syndication Agent. The 364-DayBNP Paribas, Mizuho Bank, Ltd. and Wells Fargo Bank, National Association acted as Documentation Agents. JPMorgan Chase Bank, N.A., BNP Paribas Securities Corp., Citibank, N.A., Mizuho Bank, Ltd. and Wells Fargo Securities, LLC acted as Joint Lead Arrangers
NOTES TO THE CONSOLIDATED FINANCIAL STATEMENTS - (CONTINUED)
and Joint Bookrunners for the Amended Long-Term Facility. Consistent with the Company’s prior credit agreement, the Amended Long-Term Facility provides an aggregate borrowing capacity of $500 million, and$3.5 billion. The facility has a terminationmaturity date of April 26, 2021. May 3, 2027, unless earlier terminated.
The interest and fee ratesrate payable with respect to the 364-DayAmended Long-Term Facility reflect a decrease of 0.125% in the interest rate margin from the Company’s prior credit facility, and is based on the Company’s current debt rating, are as follows: (1)Term SOFR + 1.00% interest rate margin per annum (with a 0.10% SOFR spread adjustment) or the Eurodollar Margin is 1.625%; (2)Alternate Base Rate + 0.00% per annum, at the spread over prime is 0.625%; and (3) the unused commitment fee is 0.400%. Company’s election.
The 364-DayAmended Long-Term Facility contains customary covenants and warranties, which are consistent with the Company’s $3.5 billion revolving credit facility, including,such as, among other things, a debt to capitalization ratio of less than or equal to 0.65 as of the last day of each fiscalrolling four quarter and a rolling twelve month interest coverage ratio required to be greater than or equal to 3.0 foras of the end of each fiscal quarter. In addition, the covenants limitThe Amended Long-Term Facility also includes limitations on the Company’s ability to (or to permit any subsidiaries to), subject to various exceptions and limitations: (i) merge with other companies; (ii) create liens on its property; and (iii) incur debt at the subsidiary level.
On August 6, 2019, Whirlpool Corporation entered into a Fourth Amended and Restated Long-Term Credit Agreement (the "Amended Long-Term Facility") by and among the Company, certain other borrowers, the lenders referred to therein, JPMorgan Chase Bank, N.A. as Administrative Agent, and Citibank, N.A., as Syndication Agent. The Amended Long-Term Facility provides aggregate borrowing capacity of $3.5 billion, an increase of $500 million from the Company's prior amended and restated credit agreement. The Amended Long-Term Facility has a maturity date of August 6, 2024, unless earlier terminated.
The We were in compliance with our interest and fee rates payable with respect tocoverage ratio under the Amended Long-Term Facility based on our current debt rating are as follows: (1) the spread over EURIBOR is 1.125%; (2) the spread over prime is 0.125%; and (3) the ticking fee is 0.100%. The Amended Long-Term Facility contains customary covenants and warranties including, among other things, a debt to capitalization ratio of less than or equal to 0.65 as of the last day of each fiscal quarter, and a rolling twelve month interest coverage ratio required to be greater than or equal to 3.0 for each fiscal quarter. In addition, the covenants limit our ability to (or to permit any subsidiaries to), subject to various exceptions and limitations: (i) merge with other companies; (ii) create liens on our property; (iii) incur debt at the subsidiary level.December 31, 2023.
In addition to the committed $3.5 billion Amended Long-Term Facility and the $500 million 364-day Credit Agreement,committed $2.5 billion term loan, we have committed credit facilities in Brazil and India. TheThese committed credit facilities in Brazil provide borrowings up to 1.0 billion Brazilian reais (approximately $192approximately $218 million at December 31, 2023 and $204 million at December 31, 2020), maturing2022, based on exchange rates then in effect, respectively. These committed credit facilities have maturities that run through 2022. On August 5, 2019 we terminated a €250 million European revolving credit facility that we entered into in July 2015. The termination of this facility did not have a material impact on our Consolidated Financial Statements.2025.
We had 0 borrowings outstanding under$2.0 billion and $2.5 billion drawn on the committed credit facilities at December 31, 20202023 and 2019, respectively.
Facility Borrowings
On March 13, 2020, we initiated a borrowing of approximately $2.2 billion under the Amended Long-Term Facility, for which a portion of the proceeds from the borrowing were used to fund commercial paper repayment. We repaid $500 million of this Amended Long-Term Facility borrowing with the proceeds from our May 2020 Notes offering. We repaid an additional $500 million of this Amended Long-Term Facility borrowing by drawing on the full amount of the 364-Day Facility. As of December 31, 2020, all credit facility borrowings have been repaid.2022, respectively.
Notes Payable
Notes payable, which consist of short-term borrowings payable to banks or commercial paper, are generally used to fund working capital requirements. The fair value of our notes payable approximates the carrying amount due to the short maturity of these obligations.
NOTES TO THE CONSOLIDATED FINANCIAL STATEMENTS - (CONTINUED)
Included in short-term borrowing at December 31, 2019 was $274 million of commercial paper that was repaid in early 2020.
Included in short-term borrowings at December 31, 2018 were the proceeds of the $1.0 billion term loan, which were used to fund accelerated share repurchases through a modified Dutch auction tender offer in the second quarter of 2018. During the third quarter of 2019 we repaid the term loan with the proceeds from the sale of Embraco.
The following table summarizes the carrying value of notes payable at December 31, 20202023 and 2019, respectively.2022:
| | | | | | | | | | | | | | |
| Millions of dollars | | 2020 | | 2019 |
| Commercial paper | | $ | 0 | | | $ | 274 | |
| Short-term borrowings to banks | | 12 | | | 20 | |
| Total notes payable | | $ | 12 | | | $ | 294 | |
See Financial Condition and Liquidity in the Management's Discussion and Analysis section for additional information on notes payable. | | | | | | | | | | | | | | |
| Millions of dollars | | 2023 | | 2022 |
| | | | |
| Short-term borrowings due to banks | | $ | 17 | | | $ | 4 | |
| Total notes payable | | $ | 17 | | | $ | 4 | |
(8)(7) COMMITMENTS AND CONTINGENCIES
OTHER MATTERS
Embraco Antitrust Matters
Beginning in February 2009, our former Embraco compressor business headquartered in Brazil ("Embraco") was notified of antitrust investigations of the global compressor industry by government authorities in various jurisdictions. Embraco resolved the government investigations and related claims in various jurisdictions and certain other claims remain pending.
Whirlpool agreed to retain potential liabilities related to this matter following closing of the Embraco sale transaction. We continue to defend these actions. While it is currently not possible to reasonably estimate the aggregate amount of costs which we may incur in connection with these matters, such costs could have a material adverse effect on our financial statements in any particular reporting period.
BEFIEX Credits and Other Brazil Tax Matters
In previous years, our Brazilian operations earned tax credits under the Brazilian government's export incentive program (BEFIEX). These credits reduced Brazilian federal excise taxes on domestic sales.
In December 2013, the Brazilian government reinstituted the monetary adjustment index applicable to BEFIEX credits that existed prior to July 2009, when the Brazilian government required companies to apply a different monetary adjustment index to BEFIEX credits. Whether use of the reinstituted index should be given retroactive effect for the July 2009 to December 2013 period was subject to review by the Brazilian courts. In the third quarter of 2017, the Brazilian Supreme Court ruled that the reinstituted index should be given retroactive effect for the July 2009 to December 2013 period, which ruling was subsequently affirmed by the Brazilian Supreme Court, and is now final. Based on this ruling, we were entitled to recognize $72 million in additional credits, which were recognized in prior periods. At December 31, 2020, 0 BEFIEX credits remain to be monetized.
Our Brazilian operations have received tax assessments for income and social contribution taxes associated with certain monetized BEFIEX credits. We do not believe BEFIEX credits are subject to income or social contribution taxes. We believe these tax assessments are without merit and are vigorously defending our positions. We have not provided for income or social contribution taxes on these BEFIEX credits, and based on the opinions of tax and legal advisors, we have not accrued any amount related to these assessments at December 31, 2020.2023. The total amount of outstanding tax
NOTES TO THE CONSOLIDATED FINANCIAL STATEMENTS - (CONTINUED)
assessments received for income and social contribution taxes relating to the BEFIEX credits, including interest and penalties, is approximately 2.02.3 billion Brazilian reais (approximately $381$470 million at December 31, 2020)2023).
NOTES TO THE CONSOLIDATED FINANCIAL STATEMENTS - (CONTINUED)
Relying on existing Brazilian legal precedent, in 2003 and 2004, we recognized tax credits in an aggregate amount of $26 million, adjusted for currency, on the purchase of raw materials used in production ("IPI tax credits"). The Brazilian tax authority subsequently challenged the recording of IPI tax credits. No such credits have been recognized since 2004. In 2009, we entered into a Brazilian government program ("IPI Amnesty") which provided extended payment terms and reduced penalties and interest to encourage taxpayers to resolve this and certain other disputed tax credit amounts. As permitted by the program, we elected to settle certain debts through the use of other existing tax credits and recorded charges of approximately $34 million in 2009 associated with these matters. In July 2012, the Brazilian revenue authority notified us that a portion of our proposed settlement was rejected and we received tax assessments of 257285 million Brazilian reais (approximately $49$59 million at December 31, 2020)2023), reflecting interest and penalties to date. We believe these tax assessments are without merit and we are vigorously defending our position. The government's assessment in this case relies heavily on its arguments regarding taxability of BEFIEX credits for certain years, which we are disputing in one of the BEFIEX government assessment cases cited in the prior paragraph. Because the IPI Amnesty case is moving faster than the BEFIEX taxability case, we could be required to pay the IPI Amnesty assessment before obtaining a final decision in the BEFIEX taxability case.
We have received tax assessments from the Brazilian federal tax authorities relating to amounts allegedly due regarding unemployment/social security insurance taxes (PIS/COFINS) for tax credits recognized since 2007. These credits were recognized for inputs to certain manufacturing and other business processes. These assessments are being challenged at the administrative and judicial levels in Brazil. The total amount of outstanding tax assessments received for credits recognized for PIS/COFINS inputs is approximately 302334 million Brazilian reais (approximately $58$69 million at December 31, 2020)2023). We believe these tax assessments are without merit and are vigorously defending our positions. Based on the opinion of our tax and legal advisors, we have 0tnot accrued any amount related to these assessments.
In addition to the BEFIEX, IPI tax credit and PIS/COFINS inputs matters noted above, other assessments issued by the Brazilian tax authorities related to indirect and income tax matters, and other matters, are at various stages of review in numerous administrative and judicial proceedings. The amounts related to these assessments will continue to be increased by monetary adjustments at the Selic rate, which is the benchmark rate set by the Brazilian Central Bank. In accordance with our accounting policies, we routinely assess these matters and, when necessary, record our best estimate of a loss. We believe these tax assessments are without merit and are vigorously defending our positions.
Litigation is inherently unpredictable and the conclusion of these matters may take many years to ultimately resolve. We may experience additional delays in resolving these matters as a result of COVID-19-related administrative and judicial system temporary delays and closures in Brazil. Amounts at issue in potential future litigation could increase as a result of interest and penalties in future periods. Accordingly, it is possible that an unfavorable outcome in these proceedings could have a material adverse effect on our financial statements in any particular reporting period.
ICMS CreditsLegacy EMEA Legal Matters
We also filed legal actions in Brazil to recover certain social integration and social contribution taxes paid over gross sales including ICMS receipts, which is a form of Value Added Tax in Brazil. During 2017, we sold the rights to certain portions of this litigation to a third party for 90 million Brazilian reais (approximately $27 million at December 31, 2017). In the first quarter of 2019, we received a favorable decision in the largest of these ICMS legal actions. This decision is final and not subject to appeals. Based on the opinion of our tax and legal advisors, we recognized a gain of approximately $84 million, after related taxes and fees and based on exchange rates then in effect, during the first quarter of 2019 in connection with this decision. This amount reflects approximately $142 million in
NOTES TO THE CONSOLIDATED FINANCIAL STATEMENTS - (CONTINUED)
indirect tax credits ("credits") that we are entitled to monetize in future periods, offset by approximately $58 million in taxes and fees, which have been paid.
In the second quarter of 2019, we received favorable final, non-appealable decisions in 2 smaller ICMS legal actions. Based on the opinion of our tax and legal advisors, we recognized a gain of approximately $35 million, after related taxes and fees and based on exchange rates then in effect, during the second quarter of 2019 in connection with this decision. This amount reflects approximately $54 million in credits that we are entitled to monetize in future periods, offset by approximately $19 million in taxes and fees, which have been paid.
The ICMS credits and related fees were recorded in interest and sundry (income) expense in our Consolidated Statements of Comprehensive Income (Loss). The Brazilian tax authorities have sought clarification before the Brazilian Supreme Court (in a leading case involving another taxpayer) of certain matters, including the amount of these credits (i.e., the gross rate or net credit amount), and certain other matters that could affect the rights of Brazilian taxpayers regarding these credits, and a scheduled hearing has been delayed and it is not known when such hearing will be rescheduled. If the Brazilian tax authorities challenge our rights to these credits, we may become subject to new litigation related to credits already monetized and/or disallowance of further credit monetization. Based on the opinions of our tax and legal advisors, we have not accrued any amounts related to potential future litigation regarding these credits.
Competition Investigation
In 2013, the French Competition Authority ("FCA") commenced an investigation of appliance manufacturers and retailers in France, including Whirlpool and Indesit. The FCA investigation was split into two parts, and in December 2018, we finalized a settlement with the FCA on the first part for a total fine of €102 million, with €56 million attributable to Whirlpool's France business and €46 million attributable to Indesit's France business. Payment of final amounts were made in 2019, including payment by Indesit's previous owners of €17 million out of escrow to the Company.investigation. The second part of the FCA investigation, which is expected to focusfocused primarily on manufacturer interactions with retailers, is ongoing. The Company is cooperatinghas agreed to a preliminary settlement range with this investigation.the FCA and recorded a charge of approximately $69 million in the first half of 2023. The Company expects the settlement amount to be finalized in the first half of 2024, and to make payment to the FCA in 2024.
Although it is currently not possible to assess the impact, if any, that matters related to the FCA investigation may have on our financial statements, matters related to the FCA investigation could have a material adverse effect on our financial statements in any particular reporting period.
NOTES TO THE CONSOLIDATED FINANCIAL STATEMENTS - (CONTINUED)
Trade Customer Insolvency
In 2017,The Company was a former indirect minority shareholder of Alno AG, and certain affiliated companiesa longstanding trade customer that filed for insolvency protection in Germany. Bauknecht Hausgeräte GmbH, a subsidiary of the Company, was a long-standing supplier to Alno and certain of its affiliated companies. The Company was also a former indirect minority shareholder of Alno. In August 2018, the insolvency trustee asserted €174.5 million in clawback and related claims against Bauknecht. In January 2020, we entered into an agreement to settle all potential claims that the insolvency trustee may have related to this matter, resulting inpaid a one-time chargesettlement of €52.75 million (approximately $59 million at the time of payment) to resolve any potential claims the insolvency trustee might have against the Company. We have also resolved certain claims brought by a third party related to Alno's insolvency through a settlement which includes a full release of any and all claims by that third party, and accrued an immaterial incremental amount during the second quarter related to this resolution.
Grenfell Tower
On June 23, 2017, London's Metropolitan Police Service released a statement that it had identified a Hotpoint–branded refrigerator as the initial source of December 31, 2019),the Grenfell Tower fire in West London. U.K. authorities are conducting investigations, including regarding the cause and spread of the fire. The model in question was manufactured by Indesit Company between 2006 and 2009, prior to Whirlpool's acquisition of Indesit in 2014. We are fully cooperating with the investigating authorities. Whirlpool was named as a defendant in a product liability suit in Pennsylvania federal court related to this matter. The federal court dismissed the case with prejudice in September 2020 and the dismissal was affirmed on appeal in July 2022. Plaintiffs filed a petition with the U.S. Supreme Court in January 2023, which was recorded in interest and sundry (income) expensesubsequently denied. In December 2020, lawsuits related to Grenfell Tower were filed in the U.K. against approximately 20 defendants, including Whirlpool Corporation and certain Whirlpool subsidiaries. In the fourth quarter of 2022, we accrued an immaterial amount related to these claims in our financial statements. Additional claims may be filed related to this incident.
Latin America Tax Review
In the first quarter of 2023, we accrued an immaterial amount in our Consolidated Condensed Financial Statements related to prior-period Value Added Tax (VAT) remittances in our Latin America region. We resolved certain aspects of Incomethis matter in the second quarter of 2023 and the overall financial statement impact of such resolution was immaterial. We continue to review tax matters within the region for the year ended December 31, 2019 and paidany potential additional impacts, if any; certain matters could have a material adverse effect on our financial statements in 2020 as planned.any particular reporting period.
Other Litigation
See Note 13 for information on certain U.S. income tax litigation. In addition, we are currently defendingsuccessfully defended against 2two lawsuits that have beenwere certified for treatment as class actions in U.S. federal court, relating to 2two top-load washing machine models. In December 2019, the court in one of these lawsuits entered summary judgment in Whirlpool's favor. That ruling remains subject tofavor, and that judgment was affirmed on appeal and the otherin late 2023. The second lawsuit, is ongoing. We believe the lawsuits are without merit and are vigorously defending them. Given the preliminary stagewhich was stayed pending resolution of the proceedings, we cannot reasonably estimate a range of loss, if any, at this time. The resolution of these matters could have a material adverse effect on our financial statements in any particular reporting period.
NOTES TO THE CONSOLIDATED FINANCIAL STATEMENTS - (CONTINUED)
first lawsuit, has also been dismissed.We are currently vigorously defending a number of other lawsuits related to the manufacture and sale of our products which include class action allegations, and may become involved in similar actions. These lawsuits allege claims which include negligence, breach of contract, breach of warranty, product liability and safety claims, false advertising, fraud, and violation of federal and state regulations, including consumer protection laws. In general, we do not have insurance coverage for class action lawsuits. We are also involved in various other legal actions arising in the normal course of business, for which insurance coverage may or may not be available depending on the nature of the action. We dispute the merits of these suits and actions, and intend to vigorously defend them. Management believes, based upon its current knowledge, after taking into consideration legal counsel's evaluation of such suits and actions, and after taking into account current litigation accruals, that the outcome of these matters currently pending against Whirlpool should not have a material adverse effect, if any, on our financial statements. We may experience additional delays in resolving these and other pending litigation matters as a result of COVID-19-related temporary court and administrative body closures and postponements.
NOTES TO THE CONSOLIDATED FINANCIAL STATEMENTS - (CONTINUED)
Product Warranty and Legacy Product Corrective Action Reserves
Product warranty reserves are included in other current and other noncurrent liabilities in our Consolidated Balance Sheets. The following table summarizes the changes in total product warranty reserves for the periods presented:
| | Product Warranty |
| | Product Warranty | | | | Product Warranty |
| Millions of dollars | Millions of dollars | | 2020 | | 2019 | Millions of dollars | | 2023 | | 2022 |
| Balance at January 1 | | $ | 383 | | | $ | 268 | |
Balance at January (1) | |
| Issuances/accruals during the period | Issuances/accruals during the period | | 226 | | | 350 | |
Settlements made during the period/other(1) | | (336) | | | (235) | |
| Settlements made during the period/other | |
Liabilities classified to held for sale (1) | |
| Balance at December 31 | Balance at December 31 | | $ | 273 | | | $ | 383 | |
| Current portion | Current portion | | $ | 184 | | | $ | 254 | |
| Non-current portion | Non-current portion | | 89 | | | 129 | |
| Total | Total | | $ | 273 | | | $ | 383 | |
(1)Includes updatedStarting from the fourth quarter of 2022, product warranty reserve, assumptions noted below.and subsequent movements of the reserve, of our European major domestic appliance business has been transferred to liabilities held for sale.
In the normal course of business, we engage in investigations of potential quality and safety issues. As part of our ongoing effort to deliver quality products to consumers, we are currently investigating certain potential quality and safety issues globally. As necessary, we undertake to effect repair or replacement of appliances in the event that an investigation leads to the conclusion that such action is warranted.
As part of this process, we investigated incident reports associated with a particular component in certain Indesit-designed horizontal axis washers produced in EMEA. In January 2020, we commenced a product recall in the U.K. and Ireland for these EMEA-produced washers, for which the recall is ongoing. In the third quarter of 2019, we accrued approximately $105 million in estimated product warranty expense related to this matter. Reserve assumptions were updated in the fourth quarter of 2020 based on the latest available data including take rate assumptions and unit population resulting in a $30 million release to the reserve. This estimate is based on several assumptions which are inherently unpredictable and which we may need to materially revise in the future. For the year ended December 31, 2020, settlements of approximately $56 million have been incurred related to this product recall. In 2020, we recorded a benefit of $14 million related to a vendor recovery for this corrective action.
For the year ended December 31, 2019, we incurred approximately $26 million of additional product warranty expense related to our previously disclosed legacy Indesit dryer corrective action campaign in the U.K.. We continue to cooperate with the U.K. regulator, which continues to review the overall effectiveness of the corrective action campaign. For the year ended December 31, 2020, we incurred 0 additional material product warranty expense related to this campaign. We continue to
NOTES TO THE CONSOLIDATED FINANCIAL STATEMENTS - (CONTINUED)
cooperate with the U.K. regulator, which continues to review the overall effectiveness of the modification program.
Guarantees
We have guarantee arrangements in a Brazilian subsidiary. For certain creditworthy customers, the subsidiary guarantees customer lines of credit at commercial banks to support purchases following its normal credit policies. If a customer were to default on its line of credit with the bank, our subsidiary would be required to assume the line of credit and satisfy the obligation with the bank. At December 31, 20202023 and December 31, 2019,2022, the guaranteed amounts totaled 8311,321 million Brazilian reais (approximately $160$273 million at December 31, 2020)2023) and 5771,122 million Brazilian reais (approximately $143$215 million at December 31, 2019)2022), respectively. The fair value of these guarantees were nominal at December 31, 20202023 and December 31, 2019.2022. Our subsidiary insures against a significant portion of this credit risk for these guarantees, under normal operating conditions, through policies purchased from high-quality underwriters.
We provide guarantees of indebtedness and lines of credit for various consolidated subsidiaries. The maximum contractual amount of indebtedness and lines of credit available under these lines for consolidated subsidiaries totaled $3.5approximately $3.0 billion at December 31, 20202023 and $2.6$2.9 billion at December 31, 2019.2022. Our total short-term outstanding bank indebtedness under guarantees (excluding those related to the European major domestic appliance business) was $17 million at December 31, 2023, and was nominal at both December 31, 2020 and 2019.2022.
NOTES TO THE CONSOLIDATED FINANCIAL STATEMENTS - (CONTINUED)
Purchase Obligations
Our expected cash outflows resulting from non-cancellable purchase obligations are summarized by year in the table below. Non-cancellable purchase obligations related to the European major domestic appliance business are excluded from the table below: from April 2024 onwards, when the European transaction is expected to be completed.
| | Millions of dollars | Millions of dollars | | Millions of dollars | |
| 2021 | $ | 214 | |
| 2022 | 132 | |
| 2023 | 89 | |
| 2024 | 2024 | 53 | |
| 2025 | 2025 | 26 | |
| 2026 | |
| 2027 | |
| 2028 | |
| Thereafter | Thereafter | 42 | |
| Total purchase obligations | Total purchase obligations | $ | 556 | |
(9)(8) PENSION AND OTHER POSTRETIREMENT BENEFIT PLANS
We have funded and unfunded defined benefit pension plans that cover certain employees in North America, Europe, Asia and Brazil. The United States plans comprise the majority of our obligation. All but one of these plans are frozen for all participants. The primary formula for United States salaried employees covered under the qualified defined benefit plan and the unfunded, nonqualifed Retirement Benefits Restoration Plan was based on years of service and final average salary, while the primary formula for United States hourly employees covered under the defined benefit plans was based on specific dollar amounts for each year of service. There were multiple formulas for employees covered under the qualified and nonqualified defined benefit plans that were sponsored by Maytag, including a cash balance formula. We have foreign pension plans that accrue benefits. The plans generally provide benefit payments using a formula that is based upon employee compensation and length of service.
In addition, we sponsor an unfunded Supplemental Executive Retirement Plan that remains open to new participants and additional benefit accruals. This plan is nonqualified and provides certain key employees additional defined pension benefits that supplement those provided by the Company's other retirement plans.
A defined contribution plan is being provided to all United States employees and is not classified within the net periodic benefit cost. The Company provides annual match and automatic company contributions, in cash or Company stock, of up to 7% of employees' eligible pay. Our contributions during 2020, 20192023, 2022 and 20182021 were $83$87 million, $84$90 million and $81$91 million, respectively. $48 million
NOTES TO THE CONSOLIDATED FINANCIAL STATEMENTS - (CONTINUED)
of our Company matching contributions to our defined contribution plan during 2020 were made in Company stock from May 2020 to December 2020.
We provide postretirement health care benefits for eligible retired employees in the United States, Canada and Brazil. For our United States plan, which comprises the majority of our obligation, eligible retirees include those who were full-time employees with 10 years of service who attained age 55 while in service with us and those union retirees who met the eligibility requirements of their collective bargaining agreements. In general, the postretirement health and welfare benefit plans include cost-sharing provisions that limit our exposure for recent and future retirees and are contributory, with participants' contributions adjusted annually. In the United States, benefits for certain retiree populations follow a defined contribution model that allocates certain monthly or annual amounts to a retiree's account under the plan.
DuringStarting from the thirdfourth quarter of 2020,2022, pension assets and liabilities related to the Company announced changes to aEuropean major domestic appliance business have been classified as held for sale.
The postretirement medical benefit program for certain groups of retirees. These plan amendments are effective January 1, 2021 and reduce reimbursement amounts available under certain postretirement medical benefit programs and eliminate these benefits effective January 1, 2024 for these same retiree groups.
During the second quarter of 2020, the Company announced changes to a postretirement medical benefit program for certain groups of active employees. These plan amendments were effective July 1, 2020 and reduced medical benefits for these pre-Medicare eligible and Medicare-eligible active employees who retire on or after July 1, 2020 and eliminate certain benefits effective January 1, 2024.
These plan amendments resulted in a reduction in the accumulated postretirement benefit obligation of approximately $156 million with a corresponding adjustment of $118 million in other comprehensive income, net of $39 million in deferred taxes for the nine months ended September 30, 2020. This amount is being amortized as a reduction of future net periodic cost over approximately 3.4 years, which represents the future remaining service period of eligible active employees. The interim plan remeasurement associated with these amendments resulted in an actuarial loss of $12 million recorded in the Other Comprehensive Income (Loss).
For additional information, see Note 12 to the Consolidated Financial Statements.
The plans are unfunded. We reserve the right to modify these benefits in the future.
NOTES TO THE CONSOLIDATED FINANCIAL STATEMENTS - (CONTINUED)
Defined Benefit - Pensions and Other Postretirement Benefit Plans
Obligations and Funded Status at End of Year
| | | | | United States
Pension Benefits | | Foreign
Pension Benefits | | Other Postretirement
Benefits | | | United States
Pension Benefits | | Foreign
Pension Benefits | | Other Postretirement
Benefits |
| Millions of dollars | Millions of dollars | | 2020 | | 2019 | | 2020 | | 2019 | | 2020 | | 2019 | Millions of dollars | | 2023 | | 2022 | | 2023 | | 2022 | | 2023 | | 2022 |
| Funded status | Funded status | |
| Fair value of plan assets | Fair value of plan assets | | $ | 3,103 | | | $ | 2,934 | | | $ | 632 | | | $ | 593 | | | $ | 0 | | | $ | 0 | |
| Fair value of plan assets | |
| Fair value of plan assets | |
| Benefit obligations | Benefit obligations | | 3,237 | | | 3,141 | | | 1,029 | | | 941 | | | 191 | | | 355 | |
| Funded status | Funded status | | $ | (134) | | | $ | (207) | | | $ | (397) | | | $ | (348) | | | $ | (191) | | | $ | (355) | |
| Amounts recognized in the consolidated balance sheets | Amounts recognized in the consolidated balance sheets | | | | | | | | | | | | |
| Noncurrent asset | |
| Noncurrent asset | |
| Noncurrent asset | Noncurrent asset | | $ | 37 | | | $ | 0 | | | $ | 14 | | | $ | 11 | | | $ | 0 | | | $ | 0 | |
| Current liability | Current liability | | (18) | | | (6) | | | (12) | | | (17) | | | (25) | | | (33) | |
| Noncurrent liability | Noncurrent liability | | (153) | | | (201) | | | (399) | | | (342) | | | (166) | | | (322) | |
| Amount recognized | Amount recognized | | $ | (134) | | | $ | (207) | | | $ | (397) | | | $ | (348) | | | $ | (191) | | | $ | (355) | |
| Amounts recognized in accumulated other comprehensive loss (pre-tax) | Amounts recognized in accumulated other comprehensive loss (pre-tax) | | | | | | | | | | | | |
| Net actuarial loss | Net actuarial loss | | $ | 1,227 | | | $ | 1,329 | | | $ | 279 | | | $ | 234 | | | $ | 23 | | | $ | 15 | |
| Net actuarial loss | |
| Net actuarial loss | |
| Prior service (credit) cost | Prior service (credit) cost | | 1 | | | 1 | | | 3 | | | 4 | | | (140) | | | (16) | |
| Amount recognized | Amount recognized | | $ | 1,228 | | | $ | 1,330 | | | $ | 282 | | | $ | 238 | | | $ | (117) | | | $ | (1) | |
Change in Benefit Obligation
| | | | | United States
Pension Benefits | | Foreign
Pension Benefits | | Other Postretirement
Benefits | | | United States
Pension Benefits | | Foreign
Pension Benefits | | Other Postretirement
Benefits |
| Millions of dollars | Millions of dollars | | 2020 | | 2019 | | 2020 | | 2019 | | 2020 | | 2019 | Millions of dollars | | 2023 | | 2022 | | 2023 | | 2022 | | 2023 | | 2022 |
| Benefit obligation, beginning of year | Benefit obligation, beginning of year | | $ | 3,141 | | | $ | 3,033 | | | $ | 941 | | | $ | 834 | | | $ | 355 | | | $ | 356 | |
| Service cost | Service cost | | 3 | | | 2 | | | 6 | | | 6 | | | 4 | | | 6 | |
| Interest cost | Interest cost | | 94 | | | 123 | | | 17 | | | 23 | | | 8 | | | 16 | |
| Plan participants' contributions | Plan participants' contributions | | 0 | | | 0 | | | 1 | | | 1 | | | 0 | | | 0 | |
| Actuarial loss (gain) | | 282 | | | 279 | | | 96 | | | 85 | | | 9 | | | 14 | |
| Actuarial (gain) loss | |
| Benefits paid | Benefits paid | | (186) | | | (263) | | | (33) | | | (30) | | | (24) | | | (28) | |
| Plan amendments | Plan amendments | | 0 | | | 0 | | | 0 | | | 6 | | | (156) | | | (15) | |
| Transfer of liabilities | | 0 | | | 0 | | | 0 | | | (2) | | | 0 | | | 0 | |
| | Other adjustments | Other adjustments | | 0 | | | 0 | | | 0 | | | 11 | | | 0 | | | 7 | |
| Special termination benefit | | 0 | | | 0 | | | 0 | | | 0 | | | 0 | | | 0 | |
| Other adjustments | |
| Other adjustments | |
| | Settlements / curtailment (gain) | |
| Settlements / curtailment (gain) | |
| Settlements / curtailment (gain) | Settlements / curtailment (gain) | | (97) | | | (33) | | | (37) | | | (13) | | | 0 | | | 0 | |
| Foreign currency exchange rates | Foreign currency exchange rates | | 0 | | | 0 | | | 38 | | | 20 | | | (5) | | | (1) | |
| Reclassification of obligation to held for sale | | 0 | | | 0 | | | 0 | | | 0 | | | 0 | | | 0 | |
Reclassification of obligation to held for sale (1) | |
| Benefit obligation, end of year | Benefit obligation, end of year | | $ | 3,237 | | | $ | 3,141 | | | $ | 1,029 | | | $ | 941 | | | $ | 191 | | | $ | 355 | |
| Accumulated benefit obligation, end of year | Accumulated benefit obligation, end of year | | $ | 3,222 | | | $ | 3,128 | | | $ | 987 | | | $ | 902 | | | N/A | | N/A | Accumulated benefit obligation, end of year | | $ | 2,090 | | | $ | | $ | 2,205 | | | $ | | $ | 58 | | | $ | | $ | 52 | | | N/A | | N/A | | N/A |
NOTES TO THE CONSOLIDATED FINANCIAL STATEMENTS - (CONTINUED)
Change in Plan Assets
| | | | | | | | | | | | | | | | | | | | | | | | | | | | | | | | | | | | | | |
| | | United States Pension Benefits | | Foreign
Pension Benefits | | Other Postretirement
Benefits |
| Millions of dollars | | 2020 | | 2019 | | 2020 | | 2019 | | 2020 | | 2019 |
| Fair value of plan assets, beginning of year | | $ | 2,934 | | | $ | 2,676 | | | $ | 593 | | | $ | 518 | | | $ | 0 | | | $ | 0 | |
| Actual return on plan assets | | 447 | | | 517 | | | 58 | | | 61 | | | 0 | | | 0 | |
| Employer contribution | | 5 | | | 37 | | | 29 | | | 33 | | | 24 | | | 28 | |
| Plan participants' contributions | | 0 | | | 0 | | | 1 | | | 1 | | | 0 | | | 0 | |
| Benefits paid | | (186) | | | (263) | | | (33) | | | (30) | | | (24) | | | (28) | |
| Transfer of plan assets | | 0 | | | 0 | | | 0 | | | (2) | | | 0 | | | 0 | |
| Other adjustments | | 0 | | | 0 | | | 0 | | | 5 | | | 0 | | | 0 | |
| Settlements | | (97) | | | (33) | | | (37) | | | (13) | | | 0 | | | 0 | |
| Foreign currency exchange rates | | 0 | | | 0 | | | 21 | | | 20 | | | 0 | | | 0 | |
| Reclassification of plan assets to held for sale | | 0 | | | 0 | | | 0 | | | 0 | | | 0 | | | 0 | |
| Fair value of plan assets, end of year | | $ | 3,103 | | | $ | 2,934 | | | $ | 632 | | | $ | 593 | | | $ | 0 | | | $ | 0 | |
The actuarial (gain) loss for all pension and other postretirement benefit plans in 20202023 and 20192022 was primarily related to a change in the discount rate used to measure the benefit obligation of those plans.
NOTES TO THE CONSOLIDATED FINANCIAL STATEMENTS - (CONTINUED)
Change in Plan Assets
| | | | | | | | | | | | | | | | | | | | | | | | | | | | | | | | | | | | | | |
| | | United States Pension Benefits | | Foreign
Pension Benefits | | Other Postretirement
Benefits |
| Millions of dollars | | 2023 | | 2022 | | 2023 | | 2022 | | 2023 | | 2022 |
| Fair value of plan assets, beginning of year | | $ | 2,072 | | | $ | 2,904 | | | $ | 30 | | | $ | 665 | | | $ | — | | | $ | — | |
| Actual return on plan assets | | 175 | | | (605) | | | 1 | | | (181) | | | — | | | — | |
| Employer contribution | | 7 | | | 9 | | | 3 | | | 30 | | | 19 | | | 18 | |
| Plan participants' contributions | | — | | | — | | | — | | | — | | | — | | | — | |
| Benefits paid | | (274) | | | (230) | | | (4) | | | (28) | | | (19) | | | (18) | |
| Transfer of plan assets | | — | | | — | | | — | | | — | | | — | | | — | |
| Other adjustments | | — | | | — | | | (1) | | | — | | | — | | | — | |
| Settlements | | — | | | (6) | | | — | | | (7) | | | — | | | — | |
| Foreign currency exchange rates | | — | | | — | | | — | | | (70) | | | — | | | — | |
Reclassification of plan assets to held for sale (1) | | — | | | — | | | — | | | (379) | | | — | | | — | |
| Fair value of plan assets, end of year | | $ | 1,980 | | | $ | 2,072 | | | $ | 29 | | | $ | 30 | | | $ | — | | | $ | — | |
(1) Starting from the fourth quarter of 2022, fair value of plan assets of our European major domestic appliance business is transferred to assets held for sale. For additional information, see Note 15 to the Consolidated Financial Statements.
Components of Net Periodic Benefit Cost
| | | | | United States
Pension Benefits | | Foreign
Pension Benefits | | Other Postretirement
Benefits | | | United States
Pension Benefits | | Foreign
Pension Benefits | | Other Postretirement
Benefits |
| Millions of dollars | Millions of dollars | | 2020 | | 2019 | | 2018 | | 2020 | | 2019 | | 2018 | | 2020 | | 2019 | | 2018 | Millions of dollars | | 2023 | | 2022 | | 2021 | | 2023 | | 2022 | | 2021 | | 2023 | | 2022 | | 2021 |
| Service cost | Service cost | | $ | 3 | | | $ | 2 | | | $ | 2 | | | $ | 6 | | | $ | 6 | | | $ | 5 | | | $ | 4 | | | $ | 6 | | | $ | 7 | |
| Interest cost | Interest cost | | 94 | | | 123 | | | 118 | | | 17 | | | 23 | | | 23 | | | 8 | | | 16 | | | 15 | |
| Expected return on plan assets | Expected return on plan assets | | (165) | | | (177) | | | (170) | | | (30) | | | (29) | | | (32) | | | 0 | | | 0 | | | 0 | |
| Amortization: | Amortization: | | | |
| Actuarial loss | Actuarial loss | | 62 | | | 47 | | | 53 | | | 12 | | | 8 | | | 9 | | | 0 | | | 1 | | | 0 | |
| Actuarial loss | |
| Actuarial loss | |
| Prior service cost (credit) | Prior service cost (credit) | | 0 | | | (2) | | | (3) | | | 0 | | | 0 | | | 0 | | | (28) | | | (16) | | | 0 | |
| Special termination benefit | | 0 | | | 0 | | | 0 | | | 0 | | | 0 | | | 0 | | | 0 | | | 0 | | | 0 | |
| | Curtailment (gain) / loss | |
| Curtailment (gain) / loss | |
| Curtailment (gain) / loss | Curtailment (gain) / loss | | 0 | | | 0 | | | 0 | | | 0 | | | 0 | | | (4) | | | (3) | | | 0 | | | 0 | |
| Settlement loss | Settlement loss | | 39 | | | 9 | | | 0 | | | 11 | | | 2 | | | 3 | | | 0 | | | 0 | | | 0 | |
| Net periodic benefit cost | | $ | 33 | | | $ | 2 | | | $ | 0 | | | $ | 16 | | | $ | 10 | | | $ | 4 | | | $ | (19) | | | $ | 7 | | | $ | 22 | |
| Net periodic benefit cost (income) | |
The following table summarizes the net periodic cost recognized in operating profit and interest and sundry (income) expense for the years endingended December 31, 2020, 20192023, 2022 and 2018:2021:
| | | | | United States
Pension Benefits | | Foreign
Pension Benefits | | Other Postretirement
Benefits | | | United States
Pension Benefits | | Foreign
Pension Benefits | | Other Postretirement
Benefits |
| Millions of dollars | Millions of dollars | | 2020 | | 2019 | | 2018 | | 2020 | | 2019 | | 2018 | | 2020 | | 2019 | | 2018 | Millions of dollars | | 2023 | | 2022 | | 2021 | | 2023 | | 2022 | | 2021 | | 2023 | | 2022 | | 2021 |
| Operating profit (loss) | | $ | 3 | | | $ | 2 | | | $ | 2 | | | $ | 6 | | | $ | 6 | | | $ | 5 | | | $ | 4 | | | $ | 6 | | | $ | 7 | |
| Operating (profit) loss | |
| Interest and sundry (income) expense | Interest and sundry (income) expense | | 30 | | | 0 | | | (2) | | | 10 | | | 4 | | | (1) | | | (23) | | | 1 | | | 15 | |
| Net periodic benefit cost | | $ | 33 | | | $ | 2 | | | $ | 0 | | | $ | 16 | | | $ | 10 | | | $ | 4 | | | $ | (19) | | | $ | 7 | | | $ | 22 | |
| Net periodic benefit cost (income) | |
NOTES TO THE CONSOLIDATED FINANCIAL STATEMENTS - (CONTINUED)
Other Changes in Plan Assets and Benefit Obligations Recognized in Other Comprehensive Income (Loss) (Pre-Tax) in 20202023
| | Millions of dollars | Millions of dollars | | United States
Pension Benefits | | Foreign
Pension Benefits | | Other Postretirement
Benefits | Millions of dollars | | United States
Pension Benefits | | Foreign
Pension Benefits | | Other Postretirement
Benefits |
| Current year actuarial loss / (gain) | Current year actuarial loss / (gain) | | $ | 0 | | | $ | 69 | | | $ | 9 | |
| Actuarial (loss) recognized during the year | Actuarial (loss) recognized during the year | | (101) | | | (24) | | | 0 | |
| Current year prior service cost (credit) | Current year prior service cost (credit) | | 0 | | | 0 | | | (156) | |
| Prior service credit (cost) recognized during the year | Prior service credit (cost) recognized during the year | | 0 | | | 0 | | | 32 | |
| Total recognized in other comprehensive income (loss) (pre-tax) | Total recognized in other comprehensive income (loss) (pre-tax) | | $ | (101) | | | $ | 45 | | | $ | (115) | |
| Total recognized in net periodic benefit costs and other comprehensive income (loss) (pre-tax) | Total recognized in net periodic benefit costs and other comprehensive income (loss) (pre-tax) | | $ | (68) | | | $ | 61 | | | $ | (134) | |
We amortize actuarial losses and prior service costs (credits) over a period of up to 2116 years and 1310 years, respectively.
Assumptions
Weighted-Average Assumptions used to Determine Benefit Obligation at End of Year
| | | | | United States
Pension Benefits | | Foreign
Pension Benefits | | Other Postretirement
Benefits | | | United States
Pension Benefits | | Foreign Pension Benefits (1) | | Other Postretirement
Benefits |
| | | | 2020 | | 2019 | | 2020 | | 2019 | | 2020 | | 2019 | | | 2023 | | 2022 | | 2023 | | 2022 | | 2023 | | 2022 |
| Discount rate | Discount rate | | 2.50 | % | | 3.30 | % | | 1.55 | % | | 2.04 | % | | 2.98 | % | | 3.45 | % | Discount rate | | 5.15 | % | | 5.55 | % | | 4.44 | % | | 4.72 | % | | 5.72 | % | | 6.05 | % |
| Rate of compensation increase | Rate of compensation increase | | 4.50 | % | | 4.50 | % | | 3.47 | % | | 3.10 | % | | N/A | | N/A | Rate of compensation increase | | 4.50 | % | | 4.50 | % | | 3.58 | % | | 3.52 | % | | N/A | | N/A |
| Interest crediting rate for cash balance plans | Interest crediting rate for cash balance plans | | 1.25 | % | | 2.05 | % | | 1.99 | % | | 1.80 | % | | N/A | | N/A | Interest crediting rate for cash balance plans | | 3.90 | % | | 4.30 | % | | 2.81 | % | | 2.85 | % | | N/A | | N/A |
(1) Weighted-average assumptions include assumptions related to pension plans classified as held for sale.
Weighted-Average Assumptions used to Determine Net Periodic Cost
| | | | United States
Pension Benefits | | Foreign
Pension Benefits | | Other Postretirement
Benefits | | United States
Pension Benefits | | Foreign Pension Benefits (1) | | Other Postretirement
Benefits |
| | | 2020 | | 2019 | | 2018 | | 2020 | | 2019 | | 2018 | | 2020 | | 2019 | | 2018 | | 2023 | | 2022 | | 2021 | | 2023 | | 2022 | | 2021 | | 2023 | | 2022 | | 2021 |
| Discount rate | Discount rate | 3.13% | | 4.30% | | 3.65% | | 2.04% | | 2.90% | | 2.57% | | 3.35% | | 4.80% | | 4.35% | Discount rate | 5.55% | | 2.85% | | 2.50% | | 4.72% | | 1.89% | | 1.55% | | 6.36% | | 4.27% | | 3.66% |
| Expected long-term rate of return on plan assets | Expected long-term rate of return on plan assets | 6.25% | | 6.50% | | 6.75% | | 5.39% | | 5.56% | | 5.81% | | N/A | | N/A | | N/A | Expected long-term rate of return on plan assets | 6.00% | | 5.50% | | 6.00% | | 5.33% | | 5.23% | | 5.48% | | N/A | | N/A |
| Rate of compensation increase | Rate of compensation increase | 4.50% | | 4.50% | | 4.50% | | 3.10% | | 3.29% | | 3.20% | | N/A | | N/A | | N/A | Rate of compensation increase | 4.50% | | 4.50% | | 3.52% | | 3.59% | | 3.47% | | N/A | | N/A |
| Interest crediting rate for cash balance plans | Interest crediting rate for cash balance plans | 2.05% | | 3.05% | | 2.40% | | 1.80% | | 2.19% | | 2.16% | | N/A | | N/A | | N/A | Interest crediting rate for cash balance plans | 4.30% | | 1.60% | | 1.25% | | 2.85% | | 2.36% | | 1.99% | | N/A | | N/A |
| Health care cost trend rate | Health care cost trend rate | |
| Initial rate | Initial rate | N/A | | N/A | | N/A | | N/A | | N/A | | N/A | | 6.25% | | 6.50% | | 6.50% |
| Initial rate | |
| Initial rate | | N/A | | N/A | | N/A | | N/A | | 5.50% | | 5.75% | | 6.00% |
| Ultimate rate | Ultimate rate | N/A | | N/A | | N/A | | N/A | | N/A | | N/A | | 5.00% | | 5.00% | | 5.00% | Ultimate rate | N/A | | N/A | | N/A | | N/A | | 5.00% | | 5.00% |
| Year that ultimate rate will be reached | Year that ultimate rate will be reached | N/A | | N/A | | N/A | | N/A | | N/A | | N/A | | 2025 | | 2025 | | 2025 | Year that ultimate rate will be reached | N/A | | N/A | | N/A | | N/A | | 2025 | | 2025 |
(1) Weighted-average assumptions include assumptions related to pension plans classified as held for sale.
NOTES TO THE CONSOLIDATED FINANCIAL STATEMENTS - (CONTINUED)
Discount Rate
For our United States pension and postretirement benefit plans, the discount rate was selected using a hypothetical portfolio of high quality bonds outstanding at December 31 that would provide the necessary cash flows to match our projected benefit payments. For our foreign pension and postretirement benefit plans, the discount rate was primarily selected using high quality bond yields for the respective country or region covered by the plan.
Expected Return on Plan Assets
In the United States, the expected return on plan assets is developed considering asset mix, historical asset class data and long-term expectations. The resulting weighted-average return was rounded to the nearest quarter of one percent and applied to the fair value of plan assets at December 31, 2020.2023.
For foreign pension plans, the expected rate of return on plan assets was primarily determined by observing historical returns in the local fixed income and equity markets and computing the weighted average returns with the weights being the asset allocation of each plan.
Cash Flows
Funding Policy
Our funding policy is to contribute to our qualified United States pension plans amounts sufficient to meet the minimum funding requirement as defined by employee benefit and tax laws, plus additional amounts which we may determine to be appropriate. In certain countries other than the United States, the funding of pension plans is not common practice. Contributions to our United States pension plans may be made in the form of cash or, in the case of our defined contribution plan in narrow circumstances,our discretion, company stock. We pay for retiree medical benefits as they are incurred.
There have been no contributions to the pension trust for our U.S. defined benefit plans during the twelve months ended December 31, 2020.2023 and 2022.
Expected Employer Contributions to Funded Plans
| | Millions of dollars | Millions of dollars | | United States
Pension Benefits | | Foreign
Pension Benefits | Millions of dollars | | United States
Pension Benefits | | Foreign
Pension Benefits |
| 2021 | | $ | 0 | | | $ | 18 | |
| 2024 | |
Expected Benefit Payments
| | | | | | | | | | | | | | | | | | | | |
| Millions of dollars | | United States
Pension Benefits | | Foreign
Pension Benefits | | Other Postretirement Benefits |
| 2021 | | $ | 294 | | | $ | 39 | | | $ | 25 | |
| 2022 | | 243 | | 40 | | 25 |
| 2023 | | 236 | | 41 | | 24 |
| 2024 | | 231 | | 40 | | 10 |
| 2025 | | 222 | | 45 | | 9 |
| 2026-2030 | | $ | 989 | | | $ | 234 | | | $ | 43 | |
| | | | | | | | | | | | | | | | | | | | |
| Millions of dollars | | United States
Pension Benefits | | Foreign
Pension Benefits | | Other Postretirement Benefits |
| 2024 | | $ | 245 | | | $ | 6 | | | $ | 16 | |
| 2025 | | 206 | | | 9 | | | 13 | |
| 2026 | | 201 | | | 6 | | | 12 | |
| 2027 | | 196 | | | 9 | | | 10 | |
| 2028 | | 186 | | | 6 | | | 10 | |
| 2029-2033 | | $ | 800 | | | $ | 30 | | | $ | 43 | |
Plan Assets
Our overall investment strategy is to achieve an appropriate mix of investments for long-term growth and for near-term benefit payments with a wide diversification of asset types, fund strategies, and investment fund managers. The target allocation for our plans is approximately 20%
NOTES TO THE CONSOLIDATED FINANCIAL STATEMENTS - (CONTINUED)
in growth assets and 80% in immunizing fixed income securities, with exceptions for foreign pension plans. The fixed income securities duration is intended to match that of our United States pension liabilities.
NOTES TO THE CONSOLIDATED FINANCIAL STATEMENTS - (CONTINUED)
Plan assets are reported at fair value based on an exit price, representing the amount that would be received to sell an asset in an orderly transaction between market participants. As such, fair value is a market-based measurement that should be determined based on assumptions that market participants would use in pricing an asset. As a basis for considering such assumptions, a three-tiered fair value hierarchy is established, which prioritizes the inputs used in measuring fair value as follows: (Level 1) observable inputs such as quoted prices in active markets; (Level 2) inputs, other than the quoted prices in active markets that are observable, either directly or indirectly; and (Level 3) unobservable inputs in which there is little or no market data, which require the reporting entity to develop its own assumptions. Certain investments are valued based on net asset value (NAV), which approximates fair value. Such basis is determined by referencing the respective fund's underlying assets. There are no unfunded commitments or other restrictions associated with these investments. We manage the process and approve the results of a third-party pricing service to value the majority of our securities and to determine the appropriate level in the fair value hierarchy.
NOTES TO THE CONSOLIDATED FINANCIAL STATEMENTS - (CONTINUED)
The fair values of our pension plan assets at December 31, 20202023 and 2019,2022, by asset category were as follows:
| | December 31, |
| Quoted prices
(Level 1) | | Other significant
observable inputs
(Level 2) | | Significant
unobservable inputs
(Level 3) | | Net Asset Value | | Total |
| | December 31, | | | | December 31, |
| | Quoted prices
(Level 1) | | | | Quoted prices
(Level 1) | | Other significant
observable inputs
(Level 2) | | Significant
unobservable inputs
(Level 3) | | Net Asset Value | | Total |
| Millions of dollars | Millions of dollars | | 2020 | 2019 | | 2020 | 2019 | | 2020 | 2019 | | 2020 | 2019 | | 2020 | 2019 | Millions of dollars | | 2023 | 2022 | | 2023 | 2022 | | 2023 | 2022 | | 2023 | 2022 | | 2023 | 2022 |
| Cash and cash equivalents | Cash and cash equivalents | | $ | 0 | | $ | 0 | | | $ | 281 | | $ | 24 | | | $ | 0 | | $ | 0 | | | $ | — | | $ | — | | | $ | 281 | | $ | 24 | |
Government and government agency securities (1) | Government and government agency securities (1) | |
| U.S. securities | U.S. securities | | 0 | | 0 | | | 182 | | 488 | | | 0 | | 0 | | | — | | — | | | 182 | | 488 | |
| U.S. securities | |
| U.S. securities | |
| International securities | International securities | | 0 | | 0 | | | 99 | | 97 | | | 0 | | 0 | | | — | | — | | | 99 | | 97 | |
Corporate bonds and notes (1) | Corporate bonds and notes (1) | |
| U.S. companies | |
| U.S. companies | |
| U.S. companies | U.S. companies | | 0 | | 0 | | | 1,691 | | 1,389 | | | 0 | | 0 | | | — | | — | | | 1,691 | | 1,389 | |
| International companies | International companies | | 0 | | 0 | | | 279 | | 277 | | | 0 | | 0 | | | — | | — | | | 279 | | 277 | |
Equity securities (2) | Equity securities (2) | | |
| U.S. companies | U.S. companies | | 0 | | 0 | | | 0 | | 0 | | | 0 | | 0 | | | — | | — | | | 0 | | 0 | |
| U.S. companies | |
| U.S. companies | |
| International companies | International companies | | 47 | | 51 | | | 0 | | 0 | | | 0 | | 0 | | | — | | — | | | 47 | | 51 | |
Mutual funds (3) | Mutual funds (3) | | 0 | | 0 | | | 108 | | 128 | | | 0 | | 0 | | | — | | — | | | 108 | | 128 | |
| Investments at net asset value | Investments at net asset value | |
U.S. equity securities (4) | |
U.S. equity securities (4) | |
U.S. equity securities (4) | U.S. equity securities (4) | | — | | — | | | — | | — | | | — | | — | | | 448 | | 367 | | | 448 | | 367 | |
International equity securities (4) | International equity securities (4) | | — | | — | | | — | | — | | | — | | — | | | 180 | | 215 | | | 180 | | 215 | |
Short-term investment fund (4) | Short-term investment fund (4) | | — | | — | | | — | | — | | | — | | — | | | 24 | | 15 | | | 24 | | 15 | |
International debt securities (5) | International debt securities (5) | | — | | — | | | — | | — | | | — | | — | | | 208 | | 251 | | | 208 | | 251 | |
International equity securities (5) | International equity securities (5) | | — | | — | | | — | | — | | | — | | — | | | 53 | | 59 | | | 53 | | 59 | |
Real estate (6) | Real estate (6) | | — | | — | | | — | | — | | | — | | — | | | 13 | | 34 | | | 13 | | 34 | |
Limited partnerships (7) | Limited partnerships (7) | |
| U.S. private equity investments | U.S. private equity investments | | 0 | | 0 | | | 0 | | 0 | | | 38 | | 53 | | | — | | — | | | 38 | | 53 | |
| U.S. private equity investments | |
| U.S. private equity investments | |
| Diversified fund of funds | Diversified fund of funds | | 0 | | 0 | | | 0 | | 0 | | | 3 | | 5 | | | — | | — | | | 3 | | 5 | |
| Emerging growth | Emerging growth | | 0 | | 0 | | | 0 | | 0 | | | 3 | | 8 | | | — | | — | | | 3 | | 8 | |
| All other investments | All other investments | | 0 | | 0 | | | 48 | | 34 | | | 0 | | 0 | | | 30 | | 32 | | | 78 | | 66 | | All other investments | | — | | — | — | | | 27 | | 27 | | 45 | 45 | | | — | | — | | — | — | | | — | | — | | — | — | | | 27 | | 27 | | 45 | 45 |
| $ | 47 | | $ | 51 | | | $ | 2,688 | | $ | 2,437 | | | $ | 44 | | $ | 66 | | | $ | 956 | | $ | 973 | | | $ | 3,735 | | $ | 3,527 | |
| | $ | |
(1)Valued using pricing vendors who use proprietary models to estimate the price a dealer would pay to buy a security using significant observable inputs, such as interest rates, yield curves, and credit risk.
(2)Valued using the closing stock price on a national securities exchange, which reflects the last reported sales price on the last business day of the year.
(3)Valued using the net asset value (NAV) of the fund, which is based on the fair value of underlying securities. The fund primarily invests in a diversified portfolio of equity securities, fixed income debt securities and real estate issued by non-U.S. companies.
NOTES TO THE CONSOLIDATED FINANCIAL STATEMENTS - (CONTINUED)
(4)Common and collective trust funds valued using the NAV of the fund, which is based on the fair value of underlying securities.
(5)Fund of funds valued using the NAV of the fund, which is based on the fair value of underlying securities. International debt securities includes corporate bonds and notes and government and government agency securities.
(6)Valued using the NAV of the fund, which is based on the fair value of underlying assets.
(7)Valued at estimated fair value based on the proportionate share of the limited partnership's fair value, as determined by the general partner.
Fair Value Measurements Using Significant Unobservable Inputs (Level 3)
| | | | | | | | |
| Millions of dollars | | Limited
Partnerships |
Balance, December 31, 20192022 | | $ | 6620 | |
Realized gainsgain / (loss) (net) | | 17— | |
Unrealized lossesgain / (loss) (net) | | (16)(2) | |
| Purchases | | 0(1) | |
| Settlements | | (23)(1) | |
Balance, December 31, 20202023 | | $ | 4416 | |
Additional Information
The projected benefit obligation and fair value of plan assets for pension plans with a projected benefit obligation in excess of plan assets at December 31, 20202023 and 20192022 were as follows:
| | | | | United States
Pension Benefits | | Foreign
Pension Benefits | | | United States
Pension Benefits | | Foreign
Pension Benefits |
| Millions of dollars | Millions of dollars | | 2020 | | 2019 | | 2020 | | 2019 | Millions of dollars | | 2023 | | 2022 | | 2023 | | 2022 |
| Projected benefit obligation | Projected benefit obligation | | $ | 2,718 | | | $ | 2,622 | | | $ | 951 | | | $ | 844 | |
| Fair value of plan assets | Fair value of plan assets | | $ | 2,547 | | | $ | 2,409 | | | $ | 546 | | | $ | 491 | |
The projected benefit obligation, accumulated benefit obligation and fair value of plan assets for pension plans with an accumulated benefit obligation in excess of plan assets at December 31, 20202023 and 20192022 were as follows:
| | | | | United States
Pension Benefits | | Foreign
Pension Benefits | | | United States
Pension Benefits | | Foreign
Pension Benefits |
| Millions of dollars | Millions of dollars | | 2020 | | 2019 | | 2020 | | 2019 | Millions of dollars | | 2023 | | 2022 | | 2023 | | 2022 |
| Projected benefit obligation | Projected benefit obligation | | $ | 2,718 | | | $ | 2,622 | | | $ | 951 | | | $ | 800 | |
| Accumulated benefit obligation | Accumulated benefit obligation | | 2,703 | | | 2,609 | | | 921 | | | 776 | |
| Fair value of plan assets | Fair value of plan assets | | $ | 2,547 | | | $ | 2,409 | | | $ | 546 | | | $ | 450 | |
(10)NOTES TO THE CONSOLIDATED FINANCIAL STATEMENTS - (CONTINUED)
(9) HEDGES AND DERIVATIVE FINANCIAL INSTRUMENTS
Derivative instruments are accounted for at fair value based on market rates. Derivatives where we elect hedge accounting are designated as either cash flow, fair value or net investment hedges. Derivatives that are not accounted for based on hedge accounting are marked to market through earnings. If the designated cash flow hedges are highly effective, the gains and losses are recorded in other comprehensive income (loss) and subsequently reclassified to earnings to offset the impact of the hedged items when they occur. In the event it becomes probable the forecasted transaction to which a cash flow hedge relates will not occur, the derivative would be terminated and the amount in accumulated other comprehensive income (loss) would be recognized in earnings. The fair value of the hedge asset or liability is present in either other current assets/liabilities or other noncurrent assets/liabilities on the Consolidated Balance Sheets and in other within cash provided by (used in) operating activities in the Consolidated Statements of Cash Flows.
NOTES TO THE CONSOLIDATED FINANCIAL STATEMENTS - (CONTINUED)
Using derivative instruments means assuming counterparty credit risk. Counterparty credit risk relates to the loss we could incur if a counterparty were to default on a derivative contract. We generally deal with investment grade counterparties and monitor the overall credit risk and exposure to individual counterparties. We do not anticipate nonperformance by any counterparties. The amount of counterparty credit exposure is limited to the unrealized gains, if any, on such derivative contracts. We do not require nor do we post collateral on such contracts.
Hedging Strategy
In the normal course of business, we manage risks relating to our ongoing business operations including those arising from changes in commodity prices, foreign exchange rates and interest rates. Fluctuations in these rates and prices can affect our operating results and financial condition. We use a variety of strategies, including the use of derivative instruments, to manage these risks. We do not enter into derivative financial instruments for trading or speculative purposes.
Commodity Price Risk
We enter into commodity derivative contracts on various commodities to manage the price risk associated with forecasted purchases of materials used in our manufacturing process. The objective of these hedges is to reduce the variability of cash flows associated with the forecasted purchase of commodities.
Foreign Currency and Interest Rate Risk
We incur expenses associated with the procurement and production of products in a limited number of countries, while we sell in the local currencies of a large number of countries. Our primary foreign currency exchange exposures result from cross-currency sales of products. As a result, we enter into foreign exchange contracts to hedge certain firm commitments and forecasted transactions to acquire products and services that are denominated in foreign currencies. We enter into certain undesignated non-functional currency asset and liability hedges that relate primarily to short-term payables, receivables, intercompany loans and dividends. When we hedge a foreign currency denominated payable or receivable with a derivative, the effect of changes in the foreign exchange rates are reflected currently in interest and sundry (income) expense for both the payable/receivable and the derivative. Therefore, as a result of the economic hedge, we do not elect hedge accounting.
We also enter into hedges to mitigate currency risk primarily related to forecasted foreign currency denominated expenditures, intercompany financing agreements and royalty agreements and designate them as cash flow hedges. Gains and losses on derivatives designated as cash flow hedges, to the extent they are included in the assessment of effectiveness, are recorded in other comprehensive income (loss) and subsequently reclassified to earnings to offset the impact of the hedged items when they occur.
We may enter into cross-currency interest rate swaps to manage our exposure relating to cross-currency debt. Outstanding notional amounts of cross-currency interest rate swap agreements were $1,275$618 million and $618 million at December 31, 20202023 and 2019,2022, respectively.
NOTES TO THE CONSOLIDATED FINANCIAL STATEMENTS - (CONTINUED)
We may enter into interest rate swap agreements to manage interest rate risk exposure. Our interest rate swap agreements, if any, effectively modify our exposure to interest rate risk, primarily through converting certain floating rate debt to a fixed rate basis, and certain fixed rate debt to a floating rate basis. These agreements involve either the receipt or payment of floating rate amounts in exchange for fixed rate interest payments or receipts, respectively, over the life of the agreements without an exchange of the underlying principal amounts. We may enter into swap rate lock agreements to effectively reduce our exposure to interest rate risk by locking in interest rates on probable long-term debt issuances. OutstandingThere were no outstanding notional amounts of interest rate swap agreements were $300 million at December 31, 20202023 and 2019, respectively.
NOTES TO THE CONSOLIDATED FINANCIAL STATEMENTS - (CONTINUED)
December 31, 2022.Net Investment Hedging
The following table summarizes our foreign currency denominated debt and foreign exchange forwards/options designated as net investment hedges at December 31, 2020 and 2019:
| | | | | | | | | | | | | | | | | | | | | | | | | | |
| | Notional (local) | | Notional (USD) | | Current Maturity |
| Instrument | | 2020 | 2019 | | 2020 | 2019 | | |
| Senior note - 0.625% | | € | 0 | | € | 500 | | | $ | 0 | | $ | 561 | | | March 2020 |
| Foreign exchange forwards/options | | MXN | 7,200 | | MXN | 7,200 | | | $ | 362 | | $ | 382 | | | August 2022 |
For instruments that are designated and qualify as a net investment hedge, the effective portion of the instruments' gain or loss is reported as a component of other comprehensive income (loss) and recorded in accumulated other comprehensive loss. The gain or loss will be subsequently reclassified into net earnings when the hedged net investment is either sold or substantially liquidated. The remaining change in fair value of the hedge instruments represents the ineffective portion, which is immediately recognized in interest and sundry (income) expense on our Consolidated Statements of Income. During the fourth quarter of 2022, Whirlpool substantially liquidated its foreign currency denominated investment in Mexico. As a result, losses of approximately $53 million recorded in Accumulated other comprehensive loss were reclassified into Interest and sundry (income) expense in the Consolidated Financial Statements in 2022. As of December 31, 2020,2023, there waswere no ineffectiveness onoutstanding hedges designated as net investment hedges. Due to the volatility in the macroeconomic environment caused by the COVID-19 pandemic, we evaluated and dedesignated a nominal amount of certain foreign exchange cash flow hedges in the first quarter of 2020. No material amount was dedesignated during the twelve months ended December 31, 2020.
NOTES TO THE CONSOLIDATED FINANCIAL STATEMENTS - (CONTINUED)
The following table summarizes our outstanding derivative contracts and their effects on our Consolidated Balance Sheets at December 31, 20202023 and 2019:2022. Hedge assets and liabilities of our European major domestic appliance business have been classified as held for sale and are excluded from the table below.
| | | | | | | Fair Value of | | Type of
Hedge | | | | | | | Fair Value of | | Type of
Hedge | | |
| Notional Amount | | Hedge Assets | | Hedge Liabilities | | Maximum Term (Months) |
| | Notional Amount | | | | Notional Amount | | Hedge Assets | | Hedge Liabilities | | Maximum Term (Months) | | |
| Millions of dollars | Millions of dollars | | 2020 | | 2019 | | 2020 | | 2019 | | 2020 | | 2019 | | Type of
Hedge | | 2020 | | 2019 | Millions of dollars | | 2023 | | 2022 | | 2023 | | 2022 | | | 2023 | | 2022 |
Derivatives accounted for as hedges(1) | Derivatives accounted for as hedges(1) | |
| Commodity swaps/options | |
| Commodity swaps/options | |
| Commodity swaps/options | Commodity swaps/options | | $ | 215 | | | $ | 174 | | | $ | 39 | | | $ | 4 | | | $ | 4 | | | $ | 10 | | | (CF) | | 30 | | 21 | | $ | 193 | | | $ | | $ | 170 | | | $ | | $ | 4 | | | $ | | $ | 7 | | | $ | | $ | 9 | | | $ | | $ | 17 | | | (CF) | | (CF) | | 24 | | 24 |
| Foreign exchange forwards/options | Foreign exchange forwards/options | | 3,028 | | | 3,177 | | | 58 | | | 94 | | | 110 | | | 84 | | | (CF/NI) | | 134 | | 32 | Foreign exchange forwards/options | | 952 | | | 998 | | 998 | | | 1 | | 1 | | | 24 | | 24 | | | 31 | | 31 | | | 20 | | 20 | | | (CF/NI) | | (CF/NI) | | 15 | | 15 |
| Cross-currency swaps | Cross-currency swaps | | 1,275 | | | 1,275 | | | 23 | | | 25 | | | 86 | | | 23 | | | (CF) | | 98 | | 110 | Cross-currency swaps | | 618 | | | 618 | | 618 | | | 5 | | 5 | | | 5 | | 5 | | | 79 | | 79 | | | 42 | | 42 | | | (CF) | | (CF) | | 62 | | 74 |
| Interest rate derivatives | Interest rate derivatives | | 300 | | | 300 | | | 0 | | | 6 | | | 28 | | | 0 | | | (CF) | | 53 | | 65 | Interest rate derivatives | | — | | | — | | — | | | — | | — | | | — | | — | | | — | | — | | | — | | — | | | (CF) | | (CF) | | 0 | | 0 |
| Total derivatives accounted for as hedges | Total derivatives accounted for as hedges | | $ | 120 | | | $ | 129 | | | $ | 228 | | | $ | 117 | | |
| Derivatives not accounted for as hedges | Derivatives not accounted for as hedges | | | | | | | | | |
| Derivatives not accounted for as hedges | |
| Derivatives not accounted for as hedges | |
| Commodity swaps/options | |
| Commodity swaps/options | |
| Commodity swaps/options | Commodity swaps/options | | $ | 1 | | | $ | 1 | | | $ | 0 | | | $ | 0 | | | $ | 0 | | | $ | 0 | | | N/A | | 0 | | 7 | | $ | — | | | $ | | $ | 1 | | | $ | | $ | — | | | $ | | $ | — | | | $ | | $ | — | | | $ | | $ | — | | | N/A | | N/A | | 0 | | 0 |
Foreign exchange forwards/options(2) | Foreign exchange forwards/options(2) | | 4,161 | | | 3,182 | | | 25 | | | 15 | | | 96 | | | 22 | | | N/A | | 12 | | 12 | Foreign exchange forwards/options (2) | | 1,569 | | | 439 | | 439 | | | 13 | | 13 | | | 5 | | 5 | | | 9 | | 9 | | | 6 | | 6 | | | N/A | | N/A | | 10 | | 5 |
| Total derivatives not accounted for as hedges | Total derivatives not accounted for as hedges | | $ | 25 | | | $ | 15 | | | $ | 96 | | | $ | 22 | | |
| Total derivatives | Total derivatives | | $ | 145 | | | $ | 144 | | | $ | 324 | | | $ | 139 | | |
| Total derivatives | |
| Total derivatives | |
| | Current | |
| | Current | |
| | Current | Current | | $ | 103 | | | $ | 55 | | | $ | 152 | | | $ | 61 | | |
| Noncurrent | Noncurrent | | 42 | | | 89 | | | 172 | | | 78 | | |
| Noncurrent | |
| Noncurrent | |
| Total derivatives | Total derivatives | | $ | 145 | | | $ | 144 | | | $ | 324 | | | $ | 139 | | |
| Total derivatives | |
| Total derivatives | |
(1)Derivatives accounted for as hedges are considered either cash flow (CF) or net investment (NI) hedges.
(2)Foreign exchange forwards/options have increased due to intercompany loan movements related to the anticipated contribution of our European major domestic appliance business.
NOTES TO THE CONSOLIDATED FINANCIAL STATEMENTS - (CONTINUED)
(2)Foreign exchange forwards/options have increased due to hedging of future intercompany loan.
The following tables summarize the effects of derivative instruments on our Consolidated Statements of Income (Loss) and Consolidated Statements of Comprehensive Income (Loss) for the years ended December 31, 20202023 and 2019:2022:
| | Gain (Loss) Recognized in OCI (Effective Portion) (3) |
| Cash Flow Hedges - Millions of dollars | | 2020 | | 2019 |
| | | | Gain (Loss) Recognized in OCI (Effective Portion) (3) | | | | | | Gain (Loss) Recognized in OCI (Effective Portion) (3) |
| Millions of dollars | | Millions of dollars | | | | 2023 | | 2022 |
| Cash flow hedges | |
| Commodity swaps/options | |
| Commodity swaps/options | |
| Commodity swaps/options | Commodity swaps/options | | $ | 22 | | | $ | (4) | |
| Foreign exchange forwards/options | Foreign exchange forwards/options | | 9 | | | 60 | |
| Cross-currency swaps | Cross-currency swaps | | (40) | | | 9 | |
| Interest rate derivatives | Interest rate derivatives | | (34) | | | 6 | |
| Net investment hedges - foreign currency | | 1 | | | 5 | |
| Net investment hedges | |
| Foreign currency | |
| Foreign currency | |
| Foreign currency | |
| | | | $ | |
| | $ | (42) | | | $ | 76 | |
| | | Location of Gain (Loss) Reclassified from
OCI into Earnings
(Effective Portion) | | Gain (Loss) Reclassified from OCI into Earnings (Effective Portion)(4) |
| | Location of Gain (Loss) Reclassified from
OCI into Earnings
(Effective Portion) | |
| | Location of Gain (Loss) Reclassified from
OCI into Earnings
(Effective Portion) | |
| | Location of Gain (Loss) Reclassified from
OCI into Earnings
(Effective Portion) | | | Gain (Loss) Reclassified from OCI into Earnings (Effective Portion)(3),(4),(5) |
| Cash Flow Hedges - Millions of dollars | Cash Flow Hedges - Millions of dollars | | Location of Gain (Loss) Reclassified from
OCI into Earnings
(Effective Portion) | | 2020 | | 2019 | Cash Flow Hedges - Millions of dollars | | 2023 | | 2022 |
Commodity swaps/options (3) | Commodity swaps/options (3) | | $ | (20) | | | $ | (22) | |
| Foreign exchange forwards/options | Foreign exchange forwards/options | | Net sales | | 7 | | | (4) | |
| Foreign exchange forwards/options | Foreign exchange forwards/options | | Cost of products sold | | 30 | | | 16 | |
| Foreign exchange forwards/options | Foreign exchange forwards/options | | Interest and sundry (income) expense | | (54) | | | 73 | |
| Cross-currency swaps | | Interest and sundry (income) expense | | (89) | | | 26 | |
| Interest rate derivatives | | Interest expense | | 0 | | | (1) | |
Cross-currency swaps(5) | |
| | $ | (126) | | | $ | 88 | |
| | | | $ | |
| | | | $ | |
| | | | $ | |
| | Location of Gain (Loss) Recognized on Derivatives not
Accounted for as Hedges | | Gain (Loss) Recognized on Derivatives not Accounted for as Hedges (3) |
| | Location of Gain (Loss) Recognized on Derivatives not
Accounted for as Hedges | |
| | Location of Gain (Loss) Recognized on Derivatives not
Accounted for as Hedges | |
| | Location of Gain (Loss) Recognized on Derivatives not
Accounted for as Hedges | | | Gain (Loss) Recognized on Derivatives not Accounted for as Hedges (3) |
| Derivatives not Accounted for as Hedges - Millions of dollars | Derivatives not Accounted for as Hedges - Millions of dollars | | Location of Gain (Loss) Recognized on Derivatives not
Accounted for as Hedges | | 2020 | | 2019 | Derivatives not Accounted for as Hedges - Millions of dollars | | | 2023 | | 2022 |
| Foreign exchange forwards/options | Foreign exchange forwards/options | | $ | (1) | | | $ | 30 | |
(3)Change in gain (loss) recognized in OCI (effective portion) is primarily driven by currency fluctuations and declinesincreases in commodity prices and fluctuations in currency and interest rates compared to the prior year.rates. The tax impact of the cash flow hedges was $(16)$17 million and $4$(2) million in 20202023 and 2019,2022, respectively. The tax impact of the net investment hedges was $1$0 million and $2$6 million in 20202023 and 2019,2022, respectively.
(4)Change in gain (loss) reclassified from OCI into earnings (effective portion) was primarily driven by fluctuations in currency and commodity prices and interest rates compared to prior year.
(5)Change in cross-currency swaps is primarily driven by the currency change in the Euro year-over-year.
For cash flow hedges, the amount of ineffectiveness recognized in interest and sundry (income) expense was nominal during 20202023 and 2019.2022. There were no hedges designated as fair value in 20202023 and 2019.2022. The net amount of unrealized gain or loss on derivative instruments included in accumulated other comprehensive income (loss) related to contracts maturing and expected to be realized during the next twelve months is a gain of approximately $36$40 million at December 31, 2020.2023.
NOTES TO THE CONSOLIDATED FINANCIAL STATEMENTS - (CONTINUED)
(11)(10) FAIR VALUE MEASUREMENTS
Fair value is measured based on an exit price, representing the amount that would be received to sell an asset or paid to transfer a liability in an orderly transaction between market participants. As such, fair value is a market-based measurement that should be determined based on assumptions market participants would use in pricing an asset or liability. Assets and liabilities measured at fair value are based on a market valuation approach using prices and other relevant information generated by market transactions involving identical or comparable assets or liabilities. As a basis for considering such assumptions, a three-tiered fair value hierarchy is established, which prioritizes the inputs used in measuring fair value as follows: (Level 1) observable inputs such as quoted prices in active markets; (Level 2) inputs, other than the quoted prices in active markets that are observable, either directly or indirectly; and (Level 3) unobservable inputs in which there is little or no market data, which require the reporting entity to develop its own assumptions.
The non-recurring fair values represent only those assets whose carrying values were adjusted to fair value during the reporting period. See Note 6 to the Consolidated Financial Statements for additional information on the goodwill and other intangibles impairment during 2020.
Assets and liabilities measured at fair value on a recurring basis at December 31, 20202023 and 20192022 are as follows:
| | Total Cost Basis | | Quoted Prices In
Active Markets for
Identical Assets
(Level 1) | | Significant Other
Observable Inputs
(Level 2) | | Total Fair Value |
| | Total Cost Basis | | | | Total Cost Basis | | Quoted Prices In
Active Markets for
Identical Assets
(Level 1) | | Significant Other
Observable Inputs
(Level 2) | | Total Fair Value |
| Millions of dollars | Millions of dollars | | 2020 | | 2019 | | 2020 | | 2019 | | 2020 | | 2019 | | 2020 | | 2019 | Millions of dollars | | 2023 | | 2022 | | 2023 | | 2022 | | 2023 | | 2022 | | 2023 | | 2022 |
Short-term investments (1) | Short-term investments (1) | | $ | 2,164 | | | $ | 1,308 | | | $ | 1,603 | | | $ | 398 | | | $ | 561 | | | $ | 910 | | | $ | 2,164 | | | $ | 1,308 | |
| Net derivative contracts | Net derivative contracts | | 0 | | | 0 | | | 0 | | | 0 | | | (179) | | | 5 | | | (179) | | | 5 | |
|
(1)Short-term investments are primarily comprised of money market funds and highly liquid, low risk investments with initial maturities less than 90 days.
The following table summarizes the valuation of ournon-recurring fair values represent only those assets measured atwhose carrying values were adjusted to fair value during the reporting period. There were no goodwill or intangible asset impairment charges recorded in 2023. See Note 5 to the Consolidated Financial Statements for additional information.
Goodwill
We have three reporting units for which we assess for impairment. We use a discounted cash flow analysis to determine fair value (Level 3 input) and consistent projected financial information in our analysis of goodwill and intangible assets. During the second quarter of 2022, the discounted cash flow analysis for the quantitative impairment assessment for the EMEA reporting unit utilized a discount rate of 15%. Based on a non-recurring basisthe quantitative assessment performed as of DecemberMay 31, 2020 which is2022, the balance sheet date at the endcarrying value of the periodEMEA reporting unit exceeded its fair value resulting in whicha goodwill impairment loss for the impairment charge was recorded.
| | | | | |
| Fair Value |
Millions of dollars | Level 3 |
Measured at fair value on a non-recurring basis: | 2020 |
Assets: | |
Indefinite-lived intangible assets (2)
| 158 | |
Total level 3 assets | $ | 158 | |
(2)Indefinite-lived intangible assets with afull carrying amount of approximately $165$278 million were written down to a fair valueduring the second quarter of $158 million resulting in an impairment charge of $7 million.2022 and for the twelve months ended December 31, 2022.
Other Intangible Assets
The relief-from-royalty method for the quantitative impairment assessment for other intangible assets in the EMEA reporting unit during the fourthsecond quarter of 20202022 utilized discount rates ranging from 14.75% - 15%of 19% and royalty rates ranging from 1.5% - 3.5%. Based on the quantitative impairment assessment performed as of May 31, 2022, the carrying value of other intangible assets ofthe Hotpoint*Indesit brand,and Hotpoint* trademarks exceeded itstheir fair value (Level 3 input), resulting in an impairment charge of €6$106 million ($7 million)during the second quarter of 2022.
Indefinite-lived intangible assets of Indesit and Hotpoint* with carrying amounts of approximately $201 million and $137 million were written down to fair values (Level 3 input) of $131 million and $101 million, resulting in 2020.impairment charges of $70 million and $36 million, respectively.
NOTES TO THE CONSOLIDATED FINANCIAL STATEMENTS - (CONTINUED)
During the fourth quarter of 2022, the remaining carrying amounts of Indesit and Hotpoint* trademarks were included in the net assets of the European major domestic appliance disposal group which was classified as held for sale.
European Major Domestic Appliance Business Held for Sale
On January 16, 2023, the Company entered into a contribution agreement with Arçelik A.Ş (“Arcelik”). Under the terms of the agreement, Whirlpool will contribute its European major domestic appliance business, and Arcelik will contribute its European major domestic appliance, consumer electronics, air conditioning, and small domestic appliance businesses into the newly formed entity of which Whirlpool will own approximately 25% and Arcelik 75%.
On December 20, 2022, the Company's board authorized the transaction with Arcelik and the European major domestic appliance business was classified as held for sale during the fourth quarter of 2022. The disposal group was measured at fair value less cost to sell. We used a discounted cash flow analysis and multiple market data points in our analysis to determine fair value (Level 3 input) of the 25% interest retained, resulting in an estimated fair value of $139 million. The discounted cash flow analysis utilized a discount rate of 16.5% at December 31, 2022. Due to the impact of foreign currency, the estimated fair value is $144 million at December 31, 2023. In the fourth quarter of 2023, we reviewed the updated assumptions subsequent to the held for sale date and no material changes have occurred.
We recorded a loss of $106 million related to the planned divestiture of our European major domestic appliance business for the twelve months ended December 31, 2023, inclusive of a gain of $180 million in the fourth quarter of 2023.
See Note 615 to the Consolidated Financial Statements for additional information.
InSinkErator Acquisition
On October 31, 2022, we completed the acquisition of the InSinkErator business pursuant to the terms of the purchase agreement with Emerson. The acquisition has been accounted for as a business combination under the acquisition method of accounting. This requires allocation of the purchase price to the estimated fair values of the identifiable assets acquired and liabilities assumed, including goodwill and other intangible assets. The Company has finalized third-party valuations for the purchase price allocation and the measurement period for any further purchase accounting adjustment has elapsed.
The estimated value of property, plant and equipment included adjustments totaling $36 million to increase the net book value to the fair value estimate of $173 million. The fair value of property, plant and equipment was determined using both a cost and market approach. The model used primarily included Level 2 and 3 inputs. This estimate was based on other comparable acquisitions and historical experience, and preliminary expectations as to the duration of time we expect to realize benefits from those assets.
The estimated value of inventory included adjustments totaling $10 million to step-up inventory to an estimated fair value of $93 million. The fair value of inventory was estimated using the comparative sales method. The model used primarily included Level 2 and 3 inputs. To estimate the fair value of inventory, we considered the components of InSinkErator’s inventory, as well as estimates of selling prices and selling and distribution costs that were based on InSinkErator’s historical experience.
*Whirlpool ownership of the Hotpoint brand in the EMEA and Asia Pacific regions is not affiliated with the Hotpoint brand sold in the Americas.
NOTES TO THE CONSOLIDATED FINANCIAL STATEMENTS - (CONTINUED)
South Africa Business DisposalThe estimated fair values of identifiable intangible assets acquired were prepared using an income valuation approach, which requires a forecast of expected future revenues, future cash flows and discount rates (Level 3 inputs), either through the use of the relief-from-royalty method, the multi-period excess earnings method or the with and without method.
See Note 15 to the Consolidated Financial Statements for additional information.
Russia Sale Transaction
During the second quarter of 2019,2022, we entered into an agreement to sell our South AfricaRussia business. At the time of the agreement weWe classified this disposal group as held for sale and recorded it atwith a fair value because it was lowerof zero. Fair value, which is less than the carrying amount.amount of the Russia business, was estimated based on purchase price which includes contingent consideration based on future business and other conditions (Level 2 input). We recorded an impairment charge of $333 million for the write-down of the net assets to their fair value.
See Note 15 to the Consolidated Financial Statements for additional information.
Elica PB India Acquisition
As of September 30, 2021, the Company consolidated Elica PB India. As a result, the previously held equity interest of 49% was remeasured at a fair value of $74 million (Level 2 input) on the acquisition date, resulting in an implied fair value of approximately $150 million.
For additional information, see Note 1 to the Consolidated Financial Statements.
Whirlpool China Equity Method Investment
During the second quarter of 2021, the partial tender offer for Whirlpool China was completed and the entity was deconsolidated. Subsequent to the share transfer, which was completed on May 6, 2021, the Company holds an equity interest of approximately 20% in Whirlpool China. The fair value of the retained investment in Whirlpool China at the date of deconsolidation was calculated based on the Whirlpool China stock price (Level 1 input), the portion of interest retained and the shares outstanding, resulting in a fair value of $214 million.
For additional information see Note 15 to the Consolidated Financial Statements.
Turkey Subsidiary Divestment
During the second quarter of 2021, we entered into a share transfer agreement to sell our Turkish subsidiary and the sale was completed on June 30, 2021. Fair value was estimatedcalculated based on the cash purchase price, subject to customary adjustments at closing (Level 2 input), and we recorded an impairment chargea loss on sale and disposal of $35businesses of $40 million for the write-down of the assets to the fair value of $5$111 million. DuringAn immaterial adjustment to the loss on sale and disposal of business was recorded in the third quarter of 2019, we completed the sale of our South Africa business and adjusted the loss on disposal based on the carrying amount at the closing date. The adjustment was not material2021.
For additional information see Note 15 to the Consolidated Financial Statements.
See Note 17 to the Consolidated Financial Statements for additional information.
Naples Manufacturing Plant Restructuring Action
In the fourth quarter of 2020, the Company ceased production and exited the Naples, Italy manufacturing plant. In connection with these restructuring actions, we recorded an impairment charge of $43 million for the write-down of certain assets to their fair value of $0 in 2019. Fair value was based on a feasibility study considering future use internally and marketability externally (Level 2 input). These assets were fully impaired because they were determined to have no alternative use or salvage value and insufficient cash flows to support recoverability of the carrying amount.
See Note 14 to the Consolidated Financial Statements for additional information.
Other Fair Value Measurements
The fair value of long-term debt (including current maturities) was $6.13$6.9 billion and $5.00$7.0 billion at December 31, 20202023 and 2019,2022, respectively, and was estimated using a discounted cash flow analysis based on incremental borrowing rates for similar types of borrowing arrangements (Level 2 input).
NOTES TO THE CONSOLIDATED FINANCIAL STATEMENTS - (CONTINUED)
(11) STOCKHOLDERS' EQUITY
Comprehensive Income (Loss)
Comprehensive income (loss) primarily includes (1) our reported net earnings (loss), (2) foreign currency translation, including net investment hedges, (3) changes in the effective portion of our open derivative contracts designated as cash flow hedges, and (4) changes in our unrecognized pension and other postretirement benefits and (5) changes in fair value of our available for sale marketable securities (prior to the adoption of ASU 2016-01 in 2018).
NOTES TO THE CONSOLIDATED FINANCIAL STATEMENTS - (CONTINUED)
benefits.The following table shows the components of accumulated other comprehensive income (loss) available to Whirlpool at December 31, 2018, 2019,2021, 2022, and 2020,2023, and the activity for the years then ended:
| | | | | | | | | | | | | | | | | | | | | | | | | | | | | |
| Millions of dollars | Foreign
Currency | | Derivative
Instruments | | Pension and
Postretirement
Liability | | Marketable
Securities | | Total |
| December 31, 2017 | $ | (1,320) | | | $ | 11 | | | $ | (1,039) | | | $ | 17 | | | (2,331) | |
| Unrealized gain (loss) | (272) | | | (30) | | | 0 | | | 0 | | | (302) | |
| Unrealized actuarial gain(loss) and prior service credit (cost) | 0 | | | 0 | | | (48) | | | 0 | | | (48) | |
| Tax effect | (15) | | | 7 | | | 13 | | | 0 | | | 5 | |
| Other comprehensive income (loss), net of tax | (287) | | | (23) | | | (35) | | | 0 | | | (345) | |
| Less: Other comprehensive loss available to noncontrolling interests | 2 | | | 0 | | | 0 | | | 0 | | | 2 | |
| Other comprehensive income (loss) available to Whirlpool | (289) | | | (23) | | | (35) | | | 0 | | | (347) | |
| Adjustment to beginning accumulated other comprehensive loss | 21 | | | (21) | | | 0 | | | (17) | | | (17) | |
| December 31, 2018 | $ | (1,588) | | | $ | (33) | | | $ | (1,074) | | | $ | 0 | | | $ | (2,695) | |
| Unrealized gain (loss) | 54 | | | (17) | | | 0 | | | 0 | | | 37 | |
| Unrealized actuarial gain (loss) and prior service credit (cost) | 0 | | | 0 | | | 52 | | | 0 | | | 52 | |
| Tax effect | 2 | | | 4 | | | (18) | | | 0 | | | (12) | |
| Other comprehensive income (loss), net of tax | 56 | | | (13) | | | 34 | | | 0 | | | 77 | |
| Less: Other comprehensive loss available to noncontrolling interests | 0 | | | 0 | | | 0 | | | 0 | | | 0 | |
| Other comprehensive income (loss) available to Whirlpool | 56 | | | (13) | | | 34 | | | 0 | | | 77 | |
| December 31, 2019 | $ | (1,532) | | | $ | (46) | | | $ | (1,040) | | | $ | 0 | | | $ | (2,618) | |
| Unrealized gain (loss) | (385) | | | 83 | | | 0 | | | 0 | | | (302) | |
| Unrealized actuarial gain (loss) and prior service credit (cost) | 0 | | | 0 | | | 171 | | | 0 | | | 171 | |
| Tax effect | 1 | | | (16) | | | (45) | | | 0 | | | (60) | |
| Other comprehensive income (loss), net of tax | (384) | | | 67 | | | 126 | | | 0 | | | (191) | |
| Less: Other comprehensive loss available to noncontrolling interests | 2 | | | 0 | | | 0 | | | 0 | | | 2 | |
| Other comprehensive income (loss) available to Whirlpool | (386) | | | 67 | | | 126 | | | 0 | | | (193) | |
| December 31, 2020 | $ | (1,918) | | | $ | 21 | | | $ | (914) | | | $ | 0 | | | $ | (2,811) | |
| | | | | | | | | | | | | | | | | | | | | | | | | |
| Millions of dollars | Foreign
Currency | | Derivative
Instruments | | Pension and
Postretirement
Liability | | | | Total |
| December 31, 2020 | $ | (1,918) | | | $ | 21 | | | $ | (914) | | | | | (2,811) | |
| Unrealized gain (loss) | 364 | | | 27 | | | — | | | | | 391 | |
| Unrealized actuarial gain(loss) and prior service credit (cost) | — | | | — | | | 104 | | | | | 104 | |
| Tax effect | (1) | | | (14) | | | (26) | | | | | (41) | |
| Other comprehensive income (loss), net of tax | 363 | | | 13 | | | 78 | | | | | 454 | |
| Less: Other comprehensive loss available to noncontrolling interests | — | | | — | | | — | | | | | — | |
| Other comprehensive income (loss) available to Whirlpool | 363 | | | 13 | | | 78 | | | | | 454 | |
| December 31, 2021 | $ | (1,555) | | | $ | 34 | | | $ | (836) | | | | | $ | (2,357) | |
| Unrealized gain (loss) | 280 | | | 26 | | | — | | | | | 306 | |
| Unrealized actuarial gain (loss) and prior service credit (cost) | — | | | — | | | (27) | | | | | (27) | |
| Tax effect | — | | | (2) | | | (10) | | | | | (12) | |
| Other comprehensive income (loss), net of tax | 280 | | | 24 | | | (37) | | | | | 267 | |
| Less: Other comprehensive loss available to noncontrolling interests | — | | | — | | | — | | | | | — | |
| Other comprehensive income (loss) available to Whirlpool | 280 | | | 24 | | | (37) | | | | | 267 | |
| December 31, 2022 | $ | (1,275) | | | $ | 58 | | | $ | (873) | | | | | $ | (2,090) | |
| Unrealized gain (loss) | 22 | | | (64) | | | — | | | | | (42) | |
| Unrealized actuarial gain (loss) and prior service credit (cost) | — | | | — | | | (99) | | | | | (99) | |
| Tax effect | — | | | 17 | | | 36 | | | | | 53 | |
| Other comprehensive income (loss), net of tax | 22 | | | (47) | | | (63) | | | | | (88) | |
| Less: Other comprehensive loss available to noncontrolling interests | — | | | — | | | — | | | | | — | |
| Other comprehensive income (loss) available to Whirlpool | 22 | | | (47) | | | (63) | | | | | (88) | |
| | | | | | | | | |
| | | | | | | | | |
| December 31, 2023 | $ | (1,253) | | | $ | 11 | | | $ | (936) | | | | | $ | (2,178) | |
NOTES TO THE CONSOLIDATED FINANCIAL STATEMENTS - (CONTINUED)
Net Earnings per Share
Diluted net earnings per share of common stock include the dilutive effect of stock options and other share-based compensation plans. Basic and diluted net earnings per share of common stock were calculated as follows:
| | Millions of dollars and shares | Millions of dollars and shares | | 2020 | | 2019 | | 2018 | Millions of dollars and shares | | 2023 | | 2022 | | 2021 |
| Numerator for basic and diluted earnings per share – net earnings (loss) available to Whirlpool | Numerator for basic and diluted earnings per share – net earnings (loss) available to Whirlpool | | $ | 1,081 | | | $ | 1,184 | | | $ | (183) | |
| Denominator for basic earnings per share – weighted-average shares | Denominator for basic earnings per share – weighted-average shares | | 62.7 | | | 63.7 | | | 67.2 | |
| Effect of dilutive securities – stock-based compensation | Effect of dilutive securities – stock-based compensation | | 0.6 | | | 0.5 | | | 0 | |
| Denominator for diluted earnings per share – adjusted weighted-average shares | Denominator for diluted earnings per share – adjusted weighted-average shares | | 63.3 | | | 64.2 | | | 67.2 | |
| Anti-dilutive stock options/awards excluded from earnings per share | Anti-dilutive stock options/awards excluded from earnings per share | | 1.3 | | | 1.3 | | | 1.9 | |
Dividends
Dividends per share paid to shareholders were $4.85, $4.75$7.00, $7.00 and $4.55$5.45 during 2020, 20192023, 2022 and 2018,2021, respectively.
Share Repurchase Program
On July 25, 2017,April 19, 2021, our Board of Directors authorized an additionala share repurchase program of up to $2 billion. Forbillion, which has no expiration date. On February 14, 2022, the yearBoard of Directors authorized an additional $2 billion in share repurchases under the Company's ongoing share repurchase program. During the twelve months ended December 31, 2020,2023, we repurchased 902,000did not repurchase any shares at an aggregate purchase price of approximately $121 million under this program.the share repurchase programs. At December 31, 2020,2023, there were approximately $531 million$2.6 billion in remaining funds authorized under this program.these programs.
Share repurchases are made from time to time on the open market as conditions warrant. The program does not obligate us to repurchase any of our shares and it has no expiration date.
(13)(12) SHARE-BASED INCENTIVE PLANS
We sponsor several share-based employee incentive plans. Share-based compensation expense for grants awarded under these plans was $67$33 million $50, $58 million and $51$82 million in 2020, 2019,2023, 2022, and 2018,2021, respectively. Related income tax benefits recognized in earnings were $9$7 million, $6$10 million and $9$10 million in 2020, 2019,2023, 2022, and 2018,2021, respectively.
At December 31, 2020,2023, unrecognized compensation cost related to non-vested stock option and stock unit awards totaled $77$62 million. The cost of these non-vested awards is expected to be recognized over a weighted-average remaining vesting period of 28 27 months.
Share-Based Employee Incentive Plans
On April 18, 2023, our stockholders approved the 2023 Omnibus Stock and Incentive Plan ("2023 OSIP"). This plan was adopted by our Board of Directors on February 20, 2023 and provides for the issuance of stock options, performance stock units, and restricted stock units, among other award types. No new awards may be granted under the 2023 OSIP after the tenth anniversary of the date that the stockholders approved the plan. However, the term and exercise of awards granted before then may extend beyond that date. At December 31, 2023, approximately 3.6 million shares remain available for issuance under the 2018 and 2023 OSIP.
On April 17, 2018, our stockholders approved the 2018 Omnibus Stock and Incentive Plan ("2018 OSIP"). This plan was adopted by our Board of Directors on February 20, 2018 and providesprovided for the issuance of stock options, performance stock units, and restricted stock units, among other award types. No new awards may be granted under the 2018 OSIP afterfollowing the tenth anniversaryapproval of the date that2023 OSIP
NOTES TO THE CONSOLIDATED FINANCIAL STATEMENTS - (CONTINUED)
by our stockholders, but the stockholders approved the plan. However, the term and exercise of2018 OSIP will continue to govern awards granted before then may extend beyond that date. At December 31, 2020, approximately 3.2 million shares remain available for issuance under the 2018 OSIP prior to the effectiveness of the 2023 OSIP.
Stock Options
Eligible employees may receive stock options as a portion of their total compensation. Such options generally become exercisable over a 3-year period in substantially equal increments, expire 10 years from the date of grant and are subject to forfeiture upon termination of employment, other than by death, Disability, Retirement,disability, retirement, or with the consent of the Committee (as defined in the award
NOTES TO THE CONSOLIDATED FINANCIAL STATEMENTS - (CONTINUED)
agreement). We use the Black-Scholes option-pricing model to measure the fair value of stock options granted to employees. Granted options have exercise prices equal to the market price of Whirlpool common stock on the grant date. The principal assumptions used in valuing options include: (1) risk-free interest rate - an estimate based on the yield of United States zero coupon securities with a maturity equal to the expected life of the option; (2) expected volatility - an estimate based on the historical volatility of Whirlpool common stock for a period equal to the expected life of the option; and (3) expected option life - an estimate based on historical experience. Stock options are expensed on a straight-line basis, net of estimated forfeitures. Based on the results of the model, the weighted-average grant date fair value of stock options granted for 2020, 2019,2023, 2022, and 2018 were $29.53, $27.892021 were $37.55, $53.16 and $38.34,$52.44, respectively, using the following assumptions:
| | Weighted Average Black-Scholes Assumptions | Weighted Average Black-Scholes Assumptions | | 2020 | | 2019 | | 2018 | Weighted Average Black-Scholes Assumptions | | 2023 | | 2022 | | 2021 |
| Risk-free interest rate | Risk-free interest rate | | 1.4 | % | | 2.5 | % | | 2.6 | % | Risk-free interest rate | | 4.0 | % | | 1.9 | % | | 0.5 | % |
| Expected volatility | Expected volatility | | 29.3 | % | | 28.5 | % | | 28.2 | % | Expected volatility | | 39.8 | % | | 37.4 | % | | 37.7 | % |
| Expected dividend yield | Expected dividend yield | | 3.2 | % | | 3.4 | % | | 2.6 | % | Expected dividend yield | | 5.0 | % | | 2.9 | % | | 2.5 | % |
| Expected option life, in years | Expected option life, in years | | 5 | | 5 | | 5 | Expected option life, in years | | 5 | | 5 |
Stock Option Activity
The following table summarizes stock option activity during 2020:2023:
| | In thousands, except per share data | In thousands, except per share data | | Number
of Options | | Weighted-
Average
Exercise Price | In thousands, except per share data | | Number
of Options | | Weighted-
Average
Exercise Price |
| Outstanding at January 1 | Outstanding at January 1 | | 2,387 | | | $ | 144.01 | |
| Granted | Granted | | 268 | | | 152.16 | |
| Exercised | Exercised | | (308) | | | 142.42 | |
| Canceled or expired | Canceled or expired | | (79) | | | 172.70 | |
| Outstanding at December 31 | Outstanding at December 31 | | 2,268 | | | $ | 144.54 | |
| Exercisable at December 31 | Exercisable at December 31 | | 1,753 | | | $ | 142.38 | |
The total intrinsic value of stock options exercised was $13$0.3 million $4, $2.0 million and $30$121.0 million for 2020, 2019,2023, 2022, and 2018,2021, respectively. The related tax benefits were $3were $0.1 million $1, $0.3 million and $7$23.0 million for 2020, 2019,2023, 2022, and 2018,2021, respectively. Cash received from the exercise of stock options was $44$3 million $8, $4 million, and $17$77 million for 2020, 2019,2023, 2022, and 2018,2021, respectively.
The table below summarizes additional information related to stock options outstanding at December 31, 2020:2023:
| | Options in thousands / dollars in millions, except per-share data | Options in thousands / dollars in millions, except per-share data | | Outstanding Net of
Expected Forfeitures | | Options
Exercisable | Options in thousands / dollars in millions, except per-share data | | Outstanding Net of
Expected Forfeitures | | Options
Exercisable |
| Number of options | Number of options | | 2,169 | | | 1,753 | |
| Weighted-average exercise price per share | Weighted-average exercise price per share | | $ | 144.50 | | | $ | 142.38 | |
| Aggregate intrinsic value | Aggregate intrinsic value | | $ | 85 | | | $ | 74 | |
| Weighted-average remaining contractual term, in years | Weighted-average remaining contractual term, in years | | 5 | | 3 | Weighted-average remaining contractual term, in years | | 6 | | 5 |
NOTES TO THE CONSOLIDATED FINANCIAL STATEMENTS - (CONTINUED)
Stock Units
Eligible employees may receive restricted stock units or performance stock units as a portion of their total compensation.
Restricted stock units are typically granted to selected management employees on an annual basis and vest over three years. Periodically, restricted stock units may be granted to selected employees based on special recognition or retention circumstances and generally vest from three years to seven years. Previously granted awards accrue dividend equivalents on outstanding units (in the
NOTES TO THE CONSOLIDATED FINANCIAL STATEMENTS - (CONTINUED)
form of additional stock units) based on dividends declared on Whirlpool common stock. These awards convert to unrestricted common stock at the conclusion of the vesting period.
Performance stock units are granted to management employees on an annual basis and generally vest at the end of a three year performance period, converting to unrestricted common stock at the conclusion of the vesting period. The final award may equal 0% to 200% of the target grant, based on Whirlpool performance results relative to pre-established goals.
We measure compensation cost for stock units based on the closing market price of Whirlpool common stock at the grant date, with adjustments for performance stock units to reflect the final award granted. The weighted average grant date fair values of awards granted during 2020, 2019,2023, 2022, and 2018 were $141.38, $127.262021 were $125.44, $158.27 and $157.09,$191.64, respectively. The total fair value of stock units vested during 2020, 2019,2023, 2022, and 20182021 was $37 $76 million, $28$67 million and $29$43 million, respectively.
The following table summarizes stock unit activity during 2020:2023:
| | Stock units in thousands, except per-share data | Stock units in thousands, except per-share data | | Number of
Stock Units | | Weighted- Average
Grant Date Fair
Value | Stock units in thousands, except per-share data | | Number of
Stock Units | | Weighted- Average
Grant Date Fair
Value |
| Non-vested, at January 1 | Non-vested, at January 1 | | 805 | | | $ | 144.48 | |
| Granted | Granted | | 550 | | | 141.38 | |
| Canceled | Canceled | | (108) | | | 133.51 | |
| Vested and transferred to unrestricted | Vested and transferred to unrestricted | | (244) | | | 153.48 | |
| Non-vested, at December 31 | Non-vested, at December 31 | | 1,003 | | | $ | 139.62 | |
Non-employee Director Equity Awards
In 2020,2023, each non-employee director received an annual grant of unrestricted Whirlpool common stock, with the number of shares issued to the director determined by dividing $145,000$150,000 by the closing price of Whirlpool common stock on the date of the annual meeting of our stockholders.
(14) RESTRUCTURING CHARGES
We periodically take action to improve operating efficiencies, typically in connection with business acquisitions or changes in the economic environment. Our footprint and headcount reductions and organizational integration actions relate to discrete, unique restructuring events, primarily reflected in the following plans:
On June 26, 2020, the Company committed to a workforce reduction plan in the United States, as part of the Company's continued cost reduction efforts. The workforce reduction plan included a voluntary retirement program and involuntary severance actions which were effective as of the end of the second quarter of 2020. These actions were substantially completed in 2020 and the Company incurred $102 million in employee termination costs related to these actions. The remaining cash settlement of $39 million will occur throughout 2021, 2022 and 2023.
During the third quarter, the Company committed to additional workforce reductions outside of the United States, as part of the Company's previously announced continued cost reduction efforts. The company incurred $74 million of the approximately $148 million total costs in 2020 and the remaining expense will occur in 2021. Cash settlement of $50 million was paid in 2020 with the remaining cash settlement expected to be paid in 2021.
On May 31, 2019, we announced our intention to reconvert our Naples, Italy manufacturing plant and potentially sell the plant to a third party. On September 16, 2019, we entered into a preliminary agreement to sell the plant to a third-party purchaser and to support costs associated with the transition. In October 2019, we announced that, based on further discussions with unions and the Italian government, we would continue production at the Naples manufacturing plant in the near-term and resume negotiations with unions and the Italian government related to our exit of the plant. Our preliminary agreement to sell the plant to a third-party purchaser terminated in
NOTES TO THE CONSOLIDATED FINANCIAL STATEMENTS - (CONTINUED)
accordance with its terms in March 2020. We ceased production in the plant and exited the facility in 2020 as previously disclosed.
In connection with this action, we have incurred approximately $131 million total costs comprised of $43 million in asset impairment costs, $22 million in other associated costs and $66 million in employee-related costs through December 31, 2020. The Company expects all of the remaining $71 million cash settlement to occur in 2021.
In 2018, we announced actions in EMEA to reduce fixed costs by $50 million. The initiatives primarily included headcount reductions throughout the EMEA region. Additionally, we exited domestic sales operations in Turkey in 2019. These combined actions from 2018-2020 totaled $83 million and were complete as of June 30, 2020.
The following tables summarize the changes to our restructuring liability for the years ended December 31, 2020 and 2019:
| | | | | | | | | | | | | | | | | |
| Millions of dollars | 12/31/2019 | Charges to Earnings | Cash Paid | Non-Cash and Other | 12/31/2020 |
| Employee termination costs | $ | 57 | | $ | 253 | | $ | (165) | | $ | 0 | | $ | 145 | |
| Asset impairment costs | 8 | | 1 | | 0 | | (1) | | 8 | |
| Facility exit costs | 0 | | 4 | | (4) | | 0 | | 0 | |
| Other exit costs | 12 | | 30 | | (27) | | 5 | | 20 | |
| Total | $ | 77 | | $ | 288 | | $ | (196) | | $ | 4 | | $ | 173 | |
| | | | | | | | | | | | | | | | | |
| Millions of dollars | 12/31/2018 | Charge to Earnings | Cash Paid | Non-cash and Other | 12/31/2019 |
| Employee termination costs | $ | 84 | | $ | 84 | | $ | (111) | | $ | 0 | | $ | 57 | |
| Asset impairment costs | 0 | | 74 | | (7) | | (59) | | 8 | |
| Facility exit costs | (9) | | 22 | | (23) | | 0 | | 0 | |
| Other exit costs | 21 | | 8 | | (5) | | (2) | | 12 | |
| Total | $ | 96 | | $ | 188 | | $ | (146) | | $ | (61) | | $ | 77 | |
The following table summarizes 2020 restructuring charges by operating segment:
| | | | | |
Millions of dollars | 2020 Charges |
North America | $ | 81 | |
EMEA | 154 | |
Latin America | 20 | |
Asia | 10 | |
Corporate / Other | 23 | |
Total | $ | 288 | |
NOTES TO THE CONSOLIDATED FINANCIAL STATEMENTS - (CONTINUED)
(15)(13) INCOME TAXES
Income tax expense was $384$77 million, $354$265 million, and $138$518 million in 2020, 20192023, 2022 and 2018,2021, respectively. The increasedecrease in tax expense in 20202023 compared to 2019 is primarily due to changes in valuation allowance,2022 includes legal entity restructuring tax benefits, and earnings dispersion related to the sale of Embraco.
The increase in tax expense in 2019 compared to 2018 is primarily due to higher earnings before tax, reduced foreign tax credits and the sale of Embraco, offset by net reductions in valuation allowances, and impacts from a legal entity restructuring. As part of ongoing efforts to reduce costs and simplify the Company'ssimplifying our legal entity structure to reduce administrative costs associated with the Company has completed a statutory legal entity restructuring within our EMEA business.prior structure. The completion of the restructuring created a tax-deductible loss which was recognized in the fourth quarter of 2019,2023, and resulted in a $147$172 million net tax benefit.benefit, partially offset by increases in valuation allowances.
The decrease in tax expense in 2022 compared to 2021 is primarily due to lower earnings, partially offset by the impact of non-deductible charges, including loss on sale and disposal as well as goodwill impairment, and increases in valuation allowances.
NOTES TO THE CONSOLIDATED FINANCIAL STATEMENTS - (CONTINUED)
The following table summarizes the difference between an income tax benefit and tax expense at the United States statutory rate of 21% in 2020, 2019,2023, 2022, and 2018,2021, respectively, and the income tax expense at effective worldwide tax rates for the respective periods:
| | | | | | | | | | | | | | | | | | | | |
| Millions of dollars | | 2020 | | 2019 | | 2018 |
| Earnings (loss) before income taxes | | | | | | |
| United States | | $ | 1,028 | | | $ | 674 | | | $ | 729 | |
| Foreign | | 427 | | | 878 | | | (750) | |
| Earnings (loss) before income taxes | | $ | 1,455 | | | $ | 1,552 | | | $ | (21) | |
| | | | | | |
| Income tax (benefit) expense computed at United States statutory rate | | $ | 306 | | | $ | 326 | | | $ | (4) | |
| U.S. government tax incentives | | (17) | | | (21) | | | (11) | |
| Foreign government tax incentives, including BEFIEX | | (20) | | | (13) | | | (21) | |
| Foreign tax rate differential | | 30 | | | 70 | | | (24) | |
| U.S. foreign tax credits | | (25) | | | (86) | | | (260) | |
| Valuation allowances | | 15 | | | (150) | | | 75 | |
| State and local taxes, net of federal tax benefit | | 40 | | | 42 | | | 23 | |
| Foreign withholding taxes | | 8 | | | 54 | | | 24 | |
| U.S. tax on foreign dividends and subpart F income | | 34 | | | 67 | | | 72 | |
| Settlements and changes in unrecognized tax benefits | | 53 | | | 113 | | | 72 | |
| U.S. Transition Tax | | 0 | | | 26 | | | 40 | |
| Changes in enacted tax rates | | (6) | | | 42 | | | (54) | |
| Nondeductible goodwill | | 0 | | | 0 | | | 139 | |
| Nondeductible fines & penalties | | 0 | | | 0 | | | 30 | |
| Sale of Embraco | | 0 | | | 58 | | | 0 | |
| Legal entity restructuring tax impact | | (82) | | | (147) | | | 0 | |
| Other items, net | | 48 | | | (27) | | | 37 | |
| Income tax computed at effective worldwide tax rates | | $ | 384 | | | $ | 354 | | | $ | 138 | |
NOTES TO THE CONSOLIDATED FINANCIAL STATEMENTS - (CONTINUED)
| | | | | | | | | | | | | | | | | | | | |
| Millions of dollars | | 2023 | | 2022 | | 2021 |
| Earnings (loss) before income taxes | | | | | | |
| United States | | $ | 9 | | | $ | (158) | | | $ | 1,287 | |
| Foreign | | 584 | | | (1,069) | | | 1,045 | |
| Earnings (loss) before income taxes | | $ | 593 | | | $ | (1,227) | | | $ | 2,332 | |
| | | | | | |
| Income tax (benefit) expense computed at United States statutory rate | | $ | 125 | | | $ | (258) | | | $ | 490 | |
| U.S. government tax incentives | | (20) | | | (19) | | | (19) | |
| Foreign government tax incentives | | (30) | | | (23) | | | (23) | |
| Foreign tax rate differential | | 41 | | | (3) | | | 66 | |
| U.S. foreign tax credits | | (43) | | | 11 | | | (29) | |
| Valuation allowances | | 78 | | | 222 | | | 1 | |
| State and local taxes, net of federal tax benefit | | (43) | | | (21) | | | 57 | |
| Foreign withholding taxes | | 13 | | | 52 | | | 19 | |
| U.S. tax on foreign dividends and subpart F income | | 36 | | | 22 | | | 9 | |
| Settlements and changes in unrecognized tax benefits | | 43 | | | 3 | | | 100 | |
| Changes in enacted tax rates | | 1 | | | (2) | | | (14) | |
| Nondeductible loss on sale and disposal of businesses | | 5 | | | 421 | | | — | |
| Nondeductible fines and penalties | | 18 | | | — | | | — | |
| Nondeductible goodwill impairments | | — | | | 59 | | | — | |
| Legal Entity Debt Restructuring | | — | | | (159) | | | — | |
| Divestiture tax impact | | — | | | — | | | (35) | |
| Legal entity restructuring tax impact | | (172) | | | — | | | (98) | |
| Other items, net | | 25 | | | (40) | | | (6) | |
| Income tax computed at effective worldwide tax rates | | $ | 77 | | | $ | 265 | | | $ | 518 | |
Current and Deferred Tax Provision
The following table summarizes our income tax (benefit) provision for 2020, 20192023, 2022 and 2018:2021:
| | | | 2020 | | 2019 | | 2018 | | 2023 | | 2022 | | 2021 |
| Millions of dollars | Millions of dollars | Current | | Deferred | | Current | | Deferred | | Current | | Deferred | Millions of dollars | Current | | Deferred | | Current | | Deferred | | Current | | Deferred |
| United States | United States | $ | 90 | | | $ | 83 | | | $ | 203 | | | $ | 74 | | | $ | (70) | | | $ | 120 | |
| Foreign | Foreign | 182 | | | (24) | | | 432 | | | (406) | | | 182 | | | (119) | |
| State and local | State and local | 42 | | | 11 | | | 42 | | | 9 | | | 12 | | | 13 | |
| $ | 314 | | | $ | 70 | | | $ | 677 | | | $ | (323) | | | $ | 124 | | | $ | 14 | |
| $ | |
| Total income tax expense | Total income tax expense | | | $ | 384 | | | | | $ | 354 | | | | | $ | 138 | |
United States Government Tax Legislation
On December 22, 2017, H.R.1 (the “Tax Cuts and Jobs Act”) was signed into law. Significant provisions impacting Whirlpool's 2017 and 2018 effective tax rate include the reduction in corporate tax rate from 35% to 21% effective in 2018, a one-time deemed repatriation (“Transition Tax”) on earnings of certain foreign subsidiaries that were previously tax deferred, and the creation of new taxes on certain foreign sourced earnings.
At December 31, 2017, pursuant to the SEC guidance under SAB118, the Company made a reasonable estimate of the provisional effects of the rate reduction on its existing deferred tax balances and the impact of the one-time Transition Tax. At December 31, 2018, the Company revised these estimated amounts and recognized an additional tax benefit in the amount of $54 million on the difference between the 2017 U.S. enacted tax rate of 35%, and the 2018 enacted tax rate of 21%, primarily related to a $350 million tax deductible pension plan contribution included on the Company's 2017 U.S. Corporation income tax return. The Company recognized additional tax expense of $95 million related to the Transition Tax, including $55 million of unrecognized tax benefits during the fourth quarter.
For the full year 2019, we recognized $26 million related to prior years resulting from the one time transition tax deemed repatriation on earnings of certain foreign subsidiaries that were previously tax deferred and related impacts. At December 31, 2019, we have recognized $299 million tax expense related to the Transition Tax, net of unrecognized tax benefits and other correlative adjustments. During 2019, the government issued additional clarifying regulations related to tax reform. As a result, the Company recorded an additional income tax liability related to an uncertain tax position in the amount of $117 million.
United States Tax on Foreign Dividends
We have historically reinvested all unremitted earnings of the majority of our foreign subsidiaries and affiliates, and therefore have not recognized any U.S. deferred tax liability on those earnings. However, upon the enactment of the Tax Cuts and Jobs Act, the unremitted earnings and profits of our foreign subsidiaries and affiliates, subsequent to 1986, are subject to U.S. tax under the Transition Tax provision. Under the Transition Tax provision, the Company recognized a deemed remittance of $3.5 billion. The Company had cash and cash equivalents of approximately $2.9$1.6 billion at December 31, 2020,2023, of which $1.6which approximately $1.1 billion was held by subsidiaries in foreign countries. Our intent is to permanently reinvest substantially all of these funds outside of the United States and our current plans do not demonstrate a need to repatriate the cash to fund our U.S. operations. However, if these funds were repatriated, they would likely not be subject to United States federal income tax
NOTES TO THE CONSOLIDATED FINANCIAL STATEMENTS - (CONTINUED)
under the previously taxed income or the dividend exemption rules. We would likely be required to accrue and pay United States state and local taxes and withholding taxes payable to various countries. It is not practicable to estimate the tax impact of the reversal of the outside basis difference, or the repatriation of cash due to the complexity of its hypothetical calculation.
NOTES TO THE CONSOLIDATED FINANCIAL STATEMENTS - (CONTINUED)
Valuation Allowances
At December 31, 2020,2023, we had net operating loss carryforwards of $5.9$5.4 billion, $512 million$1.2 billion of which were U.S. state net operating loss carryforwards.carryforwards, compared to $5.8 billion and $578 million at December 31, 2022, respectively. The increase in U.S. state net operating loss carryforwards was primarily driven by the legal entity restructuring actions in 2023. Of the total net operating loss carryforwards $3.7at December 31, 2023, $3.3 billion do not expire, with substantially all of the remaining carryforwards expiring in various years through 2037.2043. At December 31, 2020,2023, we had $680$365 million of United States general business credit carryforwards available to offset future payments of federal income taxes, expiring between 20302031 and 2040.2043.
We routinely review the future realization of deferred tax assets based on projected future reversal of taxable temporary differences, available tax planning strategies and projected future taxable income. We have recorded a valuation allowance to reflect the net estimated amount of certain deferred tax assets associated with net operating loss and other deferred tax assets we believe will be realized. Our recorded valuation allowance of $214$490 million at December 31, 20202023 consists of $126$393 million of net operating loss carryforward deferred tax assets and $88$97 million of other deferred tax assets. Our recorded valuation allowance was $192$412 million at December 31, 20192022 and consisted of $111$334 million of net operating loss carryforward deferred tax assets and $81$78 million of other deferred tax assets. The increase in our valuation allowance was primarily driven by the European major domestic appliance business transaction and includes $15$78 million recognized in net earnings, withearnings.
Net operating loss carryforwards of $2.1 billion relates to the remaining change related to reclassification within our net deferred tax asset. During 2019, the Company used proceeds from a bond offering to recapitalize various entities in EMEA which resulted in a reduction in the valuation allowance. In addition, the Company has established tax planning strategies and transfer pricing policies to provide sufficient future taxable income to realize these deferred tax assets. We believe that it is more likely than not that we will realize the benefitEuropean major domestic appliance business as of existingDecember 31, 2023. Net deferred tax assets netof $512 million, including $106 million of valuation allowances, mentioned above.associated with the disposal group has been transferred to assets held for sale in the fourth quarter of 2023. For additional information, see Notes 10 and 15 to the Consolidated Financial Statements.
NOTES TO THE CONSOLIDATED FINANCIAL STATEMENTS - (CONTINUED)
Deferred Tax Liabilities and Assets
Deferred income taxes reflect the net tax effects of temporary differences between the carrying amounts of assets and liabilities used for financial reporting purposes and the amounts used for income tax purposes. The following table summarizes the significant components of our deferred tax liabilities and assets at December 31, 20202023 and 2019:2022:
| | Millions of dollars | Millions of dollars | | 2020 | | 2019 | Millions of dollars | | 2023 | | 2022 |
| Deferred tax liabilities | Deferred tax liabilities | |
| Intangibles | Intangibles | | $ | 461 | | | $ | 439 | |
| Intangibles | |
| Intangibles | |
| Property, net | Property, net | | 196 | | | 175 | |
| Right of use assets | Right of use assets | | 265 | | | 238 | |
| LIFO inventory | | 88 | | | 89 | |
| Inventory Reserves | |
| Other | Other | | 252 | | | 215 | |
| Total deferred tax liabilities | Total deferred tax liabilities | | $ | 1,262 | | | $ | 1,156 | |
| Deferred tax assets | Deferred tax assets | | | | |
| U.S. general business credit carryforwards, including Energy Tax Credits | U.S. general business credit carryforwards, including Energy Tax Credits | | $ | 680 | | | $ | 787 | |
| U.S. general business credit carryforwards, including Energy Tax Credits | |
| U.S. general business credit carryforwards, including Energy Tax Credits | |
Corporate Alternative Minimum Tax credits
| |
| Lease liabilities | Lease liabilities | | 275 | | | 242 | |
| Pensions | Pensions | | 114 | | | 66 | |
| Loss carryforwards | Loss carryforwards | | 1,336 | | | 1,226 | |
| Postretirement obligations | Postretirement obligations | | 49 | | | 145 | |
| Foreign tax credit carryforwards | Foreign tax credit carryforwards | | 25 | | | 39 | |
| Research and development capitalization | Research and development capitalization | | 121 | | | 133 | |
| Employee payroll and benefits | Employee payroll and benefits | | 118 | | | 96 | |
| Accrued expenses | Accrued expenses | | 96 | | | 93 | |
| Product warranty accrual | Product warranty accrual | | 76 | | | 78 | |
| Receivable and inventory allowances | Receivable and inventory allowances | | 112 | | | 72 | |
| Other | Other | | 646 | | | 574 | |
| Total deferred tax assets | Total deferred tax assets | | 3,648 | | | 3,551 | |
| Valuation allowances for deferred tax assets | Valuation allowances for deferred tax assets | | (214) | | | (192) | |
| Deferred tax assets, net of valuation allowances | Deferred tax assets, net of valuation allowances | | 3,434 | | | 3,359 | |
| Reclassification of net deferred tax assets to held for sale | |
| Net deferred tax assets | Net deferred tax assets | | $ | 2,172 | | | $ | 2,203 | |
NOTES TO THE CONSOLIDATED FINANCIAL STATEMENTS - (CONTINUED)
On August 16, 2022, the Inflation Reduction Act of 2022 (the “IRA”) was enacted into law. Among other changes to the Internal Revenue Code of 1986, as amended (the “Code”), the IRA imposes a 15% corporate alternative minimum tax on certain corporations (the “CAMT”). To the extent a corporation is subject to the CAMT in a prior taxable year and in a later taxable year is subject to the regular corporate tax, such corporation may apply the prior amounts paid under the CAMT against its regular tax liability to the extent such credits do not reduce the regular tax liability below the CAMT applicable in such taxable year. We have recognized a $28 million CAMT liability and related deferred tax asset carryforward as of December 31, 2023.
Unrecognized Tax Benefits
The following table represents a reconciliation of the beginning and ending amount of unrecognized tax benefits that if recognized would impact the effective tax rate, excluding federal benefits of state and local tax positions, and interest and penalties:
| | Millions of dollars | Millions of dollars | | 2020 | | 2019 | | 2018 | Millions of dollars | | 2023 | | 2022 | | 2021 |
| Balance, January 1 | Balance, January 1 | | $ | 394 | | | $ | 278 | | | $ | 219 | |
| Additions for tax positions of the current year | Additions for tax positions of the current year | | 17 | | | 20 | | | 21 | |
| Additions for tax positions of prior years | Additions for tax positions of prior years | | 21 | | | 138 | | | 60 | |
| Reductions for tax positions of prior years | Reductions for tax positions of prior years | | (2) | | | (26) | | | (5) | |
| Settlements during the period | | 0 | | | (4) | | | (8) | |
Settlements during the period (1) | |
| Lapses of applicable statute of limitation | Lapses of applicable statute of limitation | | (3) | | | (12) | | | (9) | |
| Balance, December 31 | Balance, December 31 | | $ | 427 | | | $ | 394 | | | $ | 278 | |
(1) During the fourth quarter of 2023, the Company resolved a number of disputed tax positions with the U.S. and other tax authorities. The Company had previously recorded reserves for the risk associated with these tax positions, and the settlement of these matters resulted in a reduction in the Company's unrecognized tax benefits, which is shown in the table above.
Interest and penalties associated with unrecognized tax benefits resulted in a net expense of $10 million at December 31, 2020, a net benefit of $(4)$12 million, and net expense of $2$24 million and $14 million in 2019December 31, 2023, 2022 and 2018,2021, respectively. We have accrued a total of $52$78 million, $42$90 million and $46$66 million at December 31, 2020, 20192023, 2022 and 2018,2021, respectively.
It is reasonably possible that certain unrecognized tax benefits of $4$30 million could be settled with various related jurisdictions during the next 12 months.
We are in various stages of tax disputes (including audits, appeals and litigation) with certain governmental tax authorities. We establish liabilities for the difference between tax return provisions and the benefits recognized in our financial statements. Such amounts represent a reasonable provision for taxes ultimately expected to be paid, and may need to be adjusted over time as more information becomes known. We are no longer subject to any significant tax disputes (including audits, appeals and litigation) for the years before 20092010 relating to US Federal income taxes and for the years before 2003 relating to any state, local or foreign income taxes.
Other Income Tax Matters
During its examination of Whirlpool’s 2009 U.S. federal income tax return, the IRS asserted that income earned by a Luxembourg subsidiary via its Mexican branch should be recognized as income on its 2009 U.S. federal income tax return. The Company believed the proposed assessment was without merit and contested the matter in United States Tax Court (U.S.(US Tax Court). Both Whirlpool and the IRS moved for partial summary judgment on this issue. On May 5, 2020, the U.S.US Tax Court granted the IRS’s motion for partial summary judgment and denied Whirlpool’s.
NOTES TO THE CONSOLIDATED FINANCIAL STATEMENTS - (CONTINUED)
The Company has appealed the U.S.US Tax Court decision to the United States Court of Appeals for the Sixth Circuit, Court of Appeals. The Company believes that it will be successful upon appeal and, has not recorded any impact ofon December 6, 2021, the three-judge panel, in a divided decision, affirmed the U.S. Tax Court’sCourt decision (the "Ruling"). The Company recorded a reserve of $98 million in its consolidated financial statements.the fourth quarter of 2021, which represents the expected increase in the Company’s net income tax expense, plus interest, for 2009 through 2019, which represents all of the Company’s tax years that were affected by the Ruling. On January 20, 2022, the Company filed a petition for rehearing with the Sixth Circuit, which was denied on March 2, 2022. On June 30, 2022, the Company filed a petition for certiorari with the U.S. Supreme Court, which was denied on November 21, 2022. The Company considers this tax dispute settled and no adjustments to the reserve have been recognized.
(16)(14) SEGMENT INFORMATION
Our reportable segments are based upon geographic region and are defined as North America, EMEA, Latin America and Asia. These regions also represent our operating segments. Each segment manufactures home appliances and related components, but serves strategically different marketplaces. The chief operating decision maker, who is the Company's Chairman and Chief Executive Officer, evaluates performance based upon each segment's earnings (loss) before interest and taxes (EBIT), which we define as operating profit less interest and sundry (income) expense and excluding restructuring costs, asset impairment charges and certain other items that management believes are not indicative of the region's ongoing performance, if any.
Total assets by segment are those assets directly associated with the respective operating activities. The "Other/Eliminations" column primarily includes corporate expenses, assets and eliminations, as well as restructuring costs, asset impairmentsimpairment charges and certain other items that management believes are not indicative of the region's ongoing performance, if any. Intersegment
NOTES TO THE CONSOLIDATED FINANCIAL STATEMENTS - (CONTINUED)
sales are eliminated within each region except compressor sales out of Latin America through June 30, 2019, which are included in Other/Eliminations.region.
Sales to Lowe's, a North American retailer, represented approximately 13%, 13%14%, and 12%13% of our consolidated net sales in 2020, 20192023, 2022 and 2018,2021, respectively. Lowe's represented approximately 14%38% and 37% of our consolidated accounts receivable as of December 31, 20202023 and 2019,2022, respectively.
The United States individually comprised at least 10% of consolidated net sales in 2020, 20192023, 2022 and 20182021 in the amounts of $10.3$10.5 billion, $10.7$10.5 billion and $10.6$11.5 billion, respectively.
The following table summarizes the countries that represent at least 10% of consolidated long-lived assets for the years ended December 31, 20202023 and 2019.2022. Long-lived assets includes property, plant and equipment and right-of-use assets at December 31, 20202023 and 2019.2022.
| | | | | | | | | | | | | | | | | | | | | | | | | | | | | | | | | | | |
| Millions of dollars | | United States | | Mexico | | Italy | | Poland | | All Other Countries | Total |
| 2020 | | | | | | | | | | | |
| Long-lived assets | | $ | 1,790 | | | $ | 403 | | | $ | 526 | | | $ | 428 | | | $ | 1,040 | | $ | 4,187 | |
| 2019 | | | | | | | | | | | |
| Long-lived assets | | $ | 1,816 | | | $ | 431 | | | $ | 505 | | | $ | 422 | | | $ | 1,048 | | $ | 4,222 | |
| | | | | | | | | | | | | | | | | | | | | | | | | | | | | | | | | | | | | | |
| | | OPERATING SEGMENTS |
Millions of dollars | | North
America | | EMEA | | Latin
America | | Asia | | Other/
Eliminations | | Total
Whirlpool |
| Net sales | | | | | | | | | | | | |
| 2020 | | $ | 11,210 | | | $ | 4,389 | | | $ | 2,592 | | | $ | 1,265 | | | $ | 0 | | | $ | 19,456 | |
| 2019 | | 11,477 | | | 4,296 | | | 3,177 | | | 1,515 | | | (46) | | | 20,419 | |
| 2018 | | 11,374 | | | 4,536 | | | 3,618 | | | 1,587 | | | (78) | | | 21,037 | |
| Intersegment sales | | | | | | | | | | | | |
| 2020 | | $ | 249 | | | $ | 93 | | | $ | 1,227 | | | $ | 379 | | | $ | (1,948) | | | $ | — | |
| 2019 | | 238 | | | 83 | | | 1,321 | | | 334 | | | (1,976) | | | — | |
| 2018 | | 267 | | | 101 | | | 1,313 | | | 358 | | | (2,039) | | | — | |
| Depreciation and amortization | | | | | | | | | | | | |
| 2020 | | $ | 193 | | | $ | 177 | | | $ | 62 | | | $ | 70 | | | $ | 66 | | | $ | 568 | |
| 2019 | | 195 | | | 187 | | | 65 | | | 67 | | | 73 | | | 587 | |
| 2018 | | 196 | | | 204 | | | 111 | | | 72 | | | 62 | | | 645 | |
| EBIT | | | | | | | | | | | | |
| 2020 | | $ | 1,766 | | | $ | 2 | | | $ | 219 | | | $ | (7) | | | $ | (336) | | | $ | 1,644 | |
| 2019 | | 1,462 | | | (30) | | | 172 | | | 33 | | | 102 | | | 1,739 | |
| 2018 | | 1,342 | | | (106) | | | 210 | | | 83 | | | (1,358) | | | 171 | |
| Total assets | | | | | | | | | | | | |
| 2020 | | $ | 7,511 | | | $ | 11,296 | | | $ | 4,244 | | | $ | 2,573 | | | $ | (5,274) | | | $ | 20,350 | |
| 2019 | | 7,791 | | | 9,450 | | | 4,226 | | | 2,581 | | | (5,167) | | | 18,881 | |
| 2018 | | 7,161 | | | 7,299 | | | 4,745 | | | 2,636 | | | (3,494) | | | 18,347 | |
| Capital expenditures | | | | | | | | | | | | |
| 2020 | | $ | 137 | | | $ | 116 | | | $ | 64 | | | $ | 50 | | | $ | 43 | | | $ | 410 | |
| 2019 | | 179 | | | 124 | | | 97 | | | 80 | | | 52 | | | 532 | |
| 2018 | | 180 | | | 154 | | | 110 | | | 71 | | | 75 | | | 590 | |
| | | | | | | | | | | | | | | | | | | | | | | | | |
| Millions of dollars | | United States | | Mexico | | | | All Other Countries | Total |
| 2023 | | | | | | | | | |
| Long-lived assets | | $1,829 | | $429 | | | | $698 | $2,956 |
| | | | | | | | | |
| | | | | | | | | |
| | | | | | | | | | | | | | | | | | | | | | | | | | | |
| Millions of dollars | | United States | | | | Mexico | | | | All Other Countries | Total |
| 2022 | | | | | | | | | | | |
| Long-lived assets | | $1,742 | | | | $389 | | | | $662 | $2,793 |
| | | | | | | | | | | |
| | | | | | | | | | | |
NOTES TO THE CONSOLIDATED FINANCIAL STATEMENTS - (CONTINUED)
| | | | | | | | | | | | | | | | | | | | | | | | | | | | | | | | | | | | | | |
| | | OPERATING SEGMENTS |
Millions of dollars | | North
America | | EMEA | | Latin
America | | Asia | | Other/
Eliminations | | Total
Whirlpool |
| Net sales | | | | | | | | | | | | |
| 2023 | | $ | 11,428 | | | $ | 3,601 | | | $ | 3,408 | | | $ | 1,018 | | | $ | — | | | $ | 19,455 | |
| 2022 | | 11,474 | | | 4,023 | | | 3,127 | | | 1,100 | | | — | | | 19,724 | |
| 2021 | | 12,491 | | | 5,088 | | | 3,167 | | | 1,239 | | | — | | | 21,985 | |
| Intersegment sales | | | | | | | | | | | | |
| 2023 | | $ | 210 | | | $ | 81 | | | $ | 1,530 | | | $ | 43 | | | $ | (1,864) | | | $ | — | |
| 2022 | | 261 | | | 85 | | | 1,494 | | | 42 | | | (1,882) | | | — | |
| 2021 | | 312 | | | 102 | | | 1,277 | | | 252 | | | (1,943) | | | — | |
| Depreciation and amortization | | | | | | | | | | | | |
| 2023 | | $ | 212 | | | $ | 4 | | | $ | 66 | | | $ | 21 | | | $ | 58 | | | $ | 361 | |
| 2022 | | 198 | | | 134 | | | 65 | | | 20 | | | 58 | | | 475 | |
| 2021 | | 175 | | | 168 | | | 63 | | | 26 | | | 62 | | | 494 | |
| EBIT | | | | | | | | | | | | |
| 2023 | | $ | 1,104 | | | $ | 56 | | | $ | 204 | | | $ | 27 | | | $ | (475) | | | $ | 916 | |
| 2022 | | 1,319 | | | (58) | | | 200 | | | 54 | | | (2,571) | | | (1,056) | |
| 2021 | | 2,220 | | | 100 | | | 265 | | | 66 | | | (152) | | | 2,499 | |
| Total assets | | | | | | | | | | | | |
| 2023 | | $ | 11,061 | | | $ | 916 | | | $ | 4,861 | | | $ | 1,531 | | | $ | (1,057) | | | $ | 17,312 | |
| 2022 | | 10,913 | | | 5,240 | | | 4,343 | | | 1,516 | | | (4,888) | | | 17,124 | |
| 2021 | | 7,980 | | | 10,210 | | | 4,716 | | | 1,565 | | | (4,186) | | | 20,285 | |
| Capital expenditures | | | | | | | | | | | | |
| 2023 | | $ | 227 | | | $ | 107 | | | $ | 134 | | | $ | 9 | | | $ | 72 | | | $ | 549 | |
| 2022 | | 238 | | | 132 | | | 121 | | | 27 | | | 52 | | | 570 | |
| 2021 | | 169 | | | 152 | | | 133 | | | 30 | | | 41 | | | 525 | |
NOTES TO THE CONSOLIDATED FINANCIAL STATEMENTS - (CONTINUED)
Assets of $3.3 billion and $3.4 billion associated with our European major domestic appliance business has been classified as assets held for sale and recorded at fair value less costs to sell at December 31, 2023 and December 31, 2022, respectively. Temporary fluctuations in regional assets have occurred due to intercompany activity required by the expected contribution of the European major domestic appliance business. These changes are eliminated at the total entity level.
Assets of $3.0 billion were acquired in connection with the InSinkErator acquisition which increased the total assets of North America operating segment during the fourth quarter of 2022.
For additional information, see Notes 10 and 15 to the Consolidated Financial Statements.
The following table summarizes the reconciling items in the Other/Eliminations column for total EBIT for the periods presented:
| | | | | | | | | | | |
| Twelve Months Ended December 31, |
| in millions | 2020 | 2019 | 2018 |
| Items not allocated to segments: | | | |
| Restructuring costs | $ | (288) | | $ | (188) | | $ | (247) | |
| Corrective action recovery | 14 | | 0 | | 0 | |
| Gain (loss) on sale and disposal of businesses | 7 | | 437 | | 0 | |
| Product warranty and liability income (expense) | 30 | | (131) | | 0 | |
| Sale-leaseback, real estate and receivable adjustment | 113 | | 86 | | 0 | |
| Trade customer insolvency claim settlement | 0 | | (59) | | 0 | |
| Brazil indirect tax credit | 0 | | 180 | | 0 | |
| Impairment of goodwill and intangibles | 0 | | 0 | | (747) | |
| French antitrust settlement | 0 | | 0 | | (103) | |
| Trade customer insolvency | 0 | | 0 | | (30) | |
| Divestiture related transition costs | 0 | | 0 | | (21) | |
| Corporate expenses and other | (212) | | (223) | | (210) | |
| Total other/eliminations | $ | (336) | | $ | 102 | | $ | (1,358) | |
| | | | | | | | | | | |
| Twelve Months Ended December 31, |
| in millions | 2023 | 2022 | 2021 |
| Items not allocated to segments: | | | |
| Restructuring costs | $ | (16) | | $ | (21) | | $ | (38) | |
| Gain (loss) on previously held equity interest | — | | — | | 42 | |
| Gain (loss) on sale and disposal of businesses | (106) | | (1,869) | | 107 | |
| Impairment of goodwill, intangibles and other assets | — | | (396) | | — | |
| Product warranty and liability income (expense) | — | | — | | 9 | |
| Legacy EMEA legal matters | (94) | | — | | — | |
| | | |
| | | |
| | | |
| Corporate expenses and other | (259) | | (285) | | (272) | |
| Total other/eliminations | $ | (475) | | $ | (2,571) | | $ | (152) | |
A reconciliation of our segment information for total EBIT to the corresponding amounts in the Consolidated Statements of Income (Loss) is shown in the table below for the periods presented:
| | Twelve Months Ended December 31, |
| | Twelve Months Ended December 31, | | | | Twelve Months Ended December 31, |
| in millions | in millions | | 2020 | 2019 | 2018 | in millions | | 2023 | 2022 | 2021 |
| Operating profit | Operating profit | | $ | 1,623 | | $ | 1,571 | | $ | 279 | |
| Interest and sundry (income) expense | Interest and sundry (income) expense | | (21) | | (168) | | 108 | |
| Equity method investment income (loss), net of tax | |
| Total EBIT | Total EBIT | | $ | 1,644 | | $ | 1,739 | | $ | 171 | |
| Interest expense | Interest expense | | 189 | | 187 | | 192 | |
| Income tax expense | Income tax expense | | 384 | | 354 | | 138 | |
| Net earnings (loss) | Net earnings (loss) | | $ | 1,071 | | $ | 1,198 | | $ | (159) | |
| Less: Net earnings (loss) available to noncontrolling interests | Less: Net earnings (loss) available to noncontrolling interests | | (10) | | 14 | | 24 | |
| Net earnings (loss) available to Whirlpool | Net earnings (loss) available to Whirlpool | | $ | 1,081 | | $ | 1,184 | | $ | (183) | |
Subsequent Events
Effective January 1, 2024, we reorganized our operating segment structure to better represent the revised structure within our portfolio transformation, including a greater focus on our strong value-creating small domestic appliance business. The Company implemented this change to align with the Company's new operating structure, consistent with how the Company’s Chief Operating Decision Maker evaluates performance and allocates resources in accordance with ASC 280, Segment Reporting. Going forward the Company will conduct its business through five operating segments, which consist of MDA North America; MDA Europe, MDA Latin America; MDA Asia; and SDA Global. As of and for the year ended December 31, 2023, this reorganization has not yet been reflected within our financial statements.
The MDA Europe business will be deconsolidated upon the completion of the European contribution agreement transaction with Arcelik, and it does not qualify for reporting as discontinued operations. For additional information see Note 15 to the Consolidated Financial Statements.
(17) DIVESTITURESNOTES TO THE CONSOLIDATED FINANCIAL STATEMENTS - (CONTINUED)
(15) ACQUISITIONS AND HELD FOR SALEDIVESTITURES
European Major Domestic Appliance Business Held for Sale
On January 16, 2023, Whirlpool entered into a contribution agreement with Arçelik B.V. (“Arcelik”) to carve out and contribute our major domestic appliance European business operations into a newly formed European appliance company which constitutes a combination of Arcelik’s and Whirlpool's European businesses. Whirlpool will own approximately 25% and Arcelik will own approximately 75% of the European appliance company. The sale includes the Company's major domestic appliance business in EMEA, including nine production sites.
On June 22, 2023, Whirlpool entered into a share purchase agreement with Arcelik for the sale of our Middle East and North Africa ("MENA") business. The sale was previously agreed upon in principle and announced on January 17, 2023, as part of the outcome of Whirlpool’s strategic review of the EMEA business. The financial impact of the MENA transaction has been included in the loss on sale and disposal of businesses related to the European major domestic appliance business transaction as discussed further below.
Our European major domestic appliance business, including the MENA business, is reported within our EMEA reportable segment and met the criteria for held for sale accounting during the fourth quarter of 2022. The operations of the European disposal group did not meet the criteria to be presented as discontinued operations.
The Europe transaction is subject to certain closing conditions, including regulatory approvals from the European Commission, Germany, Austria and China, which have been received, and the UK which remains. On February 8, 2024, the U.K. Competition and Markets Authority (“CMA”) provisionally cleared the Transaction. The CMA is expected to issue its final decision by March 26, 2024. We are working diligently with all parties to close the transactions as soon as possible, and expect the transactions to be completed by April 2024.
Upon closing, the transaction will result in the deconsolidation of the European major appliances business. In connection with the sale, we recorded a loss on disposal of $1.5 billion in the fourth quarter of 2022. The loss included a write-down of the net assets of $1.2 billion of the disposal group to a fair value of $139 million and also includes $393 million of cumulative currency translation adjustments, $98 million release of other comprehensive loss on pension and $18 million of other transaction related costs. No goodwill is included in the disposal group.
We recorded a loss of $106 million related to the planned divestiture of our European major domestic appliance business for the twelve months ended December 31, 2023, inclusive of a gain of $180 million in the fourth quarter of 2023. These adjustments are primarily due to fair value fluctuations driven by seasonality of net working capital, partially offset by transaction costs. In the fourth quarter of 2022, we incurred a loss of $1.5 billion resulting in an aggregate loss on disposal of $1.6 billion for the transaction. This adjustment is recorded in the loss on sale and disposal of businesses and reflects transaction costs and ongoing reassessment of the fair value less costs to sell of the disposal group which will continue to be evaluated each reporting period until completion of the transaction.
Both Whirlpool and the post-closing controlling interest shareholder will retain an option for Arcelik to purchase the remaining equity interest in a newly formed European appliance company for fair value, which could be material to the financial statements of the Company, depending on the performance of the business.
The following table presents the carrying amounts of the major classes of the disposal group's assets and liabilities as of December 31, 2023 and 2022, respectively.
NOTES TO THE CONSOLIDATED FINANCIAL STATEMENTS - (CONTINUED)
| | | | | | | | | | | | | | | | | | |
| | | | | | | December 31, |
| Millions of dollars | | | | | | | 2023 | 2022 |
| Carrying amounts of major classes of assets | | | | | | | | |
| Current Assets | | | | | | | | |
| Cash and cash equivalents | | | | | | | $ | 97 | | $ | 94 | |
| Accounts receivable, net of allowance of $28 and $32, respectively | | | | | | | 578 | | 667 | |
| Inventories | | | | | | | 589 | | 650 | |
| Prepaid and other current assets | | | | | | | 94 | | 145 | |
| Total current assets | | | | | | | 1,358 | | 1,556 | |
| Property, net of accumulated depreciation of $1,442 and $1,648, respectively | | | | | | | 952 | | 822 | |
| Right of use assets | | | | | | | 162 | | 163 | |
| | | | | | | | |
| Other intangibles, net of accumulated amortization of $149 and $141, respectively | | | | | | | 286 | | 279 | |
| Deferred income taxes | | | | | | | 574 | | 610 | |
| Other noncurrent assets | | | | | | | 13 | | 17 | |
| Total noncurrent assets | | | | | | | 1,987 | | 1,891 | |
| Total assets | | | | | | | $ | 3,345 | | $ | 3,447 | |
| Carrying amounts of major classes of liabilities | | | | | | | | |
| Current liabilities | | | | | | | | |
| Accounts payable | | | | | | | $ | 1,266 | | $ | 1,394 | |
| Accrued expenses | | | | | | | 218 | | 152 | |
| Accrued advertising and promotions | | | | | | | 171 | | 172 | |
| Employee compensation | | | | | | | 120 | | 107 | |
| Notes payable | | | | | | | 4 | | 3 | |
| Other current liabilities | | | | | | | 97 | | 125 | |
| Total current liabilities | | | | | | | 1,876 | | 1,953 | |
| Noncurrent liabilities | | | | | | | | |
| Long-term debt | | | | | | | — | | 2 | |
| Pension benefits | | | | | | | 168 | | 122 | |
| Lease liabilities | | | | | | | 132 | | 131 | |
| Other noncurrent liabilities | | | | | | | 87 | | 88 | |
| Total noncurrent liabilities | | | | | | | 387 | | 343 | |
| Total liabilities | | | | | | | $ | 2,263 | | $ | 2,296 | |
| | | | | | | | |
| Total net assets of the disposal group classified as held for sale | | | | | | | $ | 1,082 | | $ | 1,151 | |
| | | | | | | | | | | |
| Assets held for sale | Fair value of interest retained | $ | 144 | | $ | 139 | |
| Liabilities held for sale | Cumulative currency translation adjustment and Other comprehensive income on pension | $ | 587 | | $ | 490 | |
NOTES TO THE CONSOLIDATED FINANCIAL STATEMENTS - (CONTINUED)
The following table summarizes European major appliances business' earnings (loss) available to Whirlpool before income taxes for the twelve months ended December 31, 2023, 2022 and 2021, respectively:
| | | | | | | | | | | | | | | | | |
| | | | Twelve Months Ended December 31, |
| in millions | | | | | 2023 | 2022 | 2021 |
| Earnings (loss) before income taxes | | | | | $28 | $(106) | $(46) |
Earnings (loss) before income taxes excludes intercompany other income and expense which eliminates at Total Whirlpool level. Additionally, the EMEA operating segment includes other businesses which are not classified as held for sale.
InSinkErator Acquisition
On August 7, 2022, the Company entered into an Asset and Stock Purchase Agreement (the “Purchase Agreement”) with Emerson Electric Co. (“Emerson”) to purchase Emerson’s InSinkErator business, a manufacturer of food waste disposers and instant hot water dispensers for home and commercial use, for a purchase price of $3 billion in cash, subject to customary adjustments.
On October 31, 2022, we completed the acquisition of the InSinkErator business pursuant to the terms of the Purchase Agreement. We used the net proceeds from a $2.5 billion borrowing under our delayed draw term loan facility and $500 million of cash on hand to fund the acquisition. See Note 6 to the Consolidated Financial Statements for additional information about the term loan facility.
Purchase Price Allocation
The acquisition has been accounted for as a business combination under the acquisition method of accounting. This requires allocation of the purchase price to the estimated fair values of the identifiable assets acquired and liabilities assumed, including goodwill and other intangible assets. The Company has finalized third-party valuations for the purchase price allocation and the measurement period for any further purchase accounting adjustment has elapsed.
The following table presents the final allocation of purchase price related to the InSinkErator acquisition, as of December 31, 2023. Purchase accounting adjustments recorded in 2023 were not material.
| | | | | |
| (in millions) | Amount |
| Cash and cash equivalents | $ | 7 | |
| Receivables, net | 74 | |
| Inventories | 93 | |
| Other current assets | 1 | |
| Property, plant and equipment, net | 173 | |
| Goodwill | 1,153 | |
| Other intangible assets | 1,630 | |
| Other assets | 10 | |
| Accounts payable | 49 | |
| Accrued expenses | 26 | |
| Other current liabilities | 34 | |
| Deferred income taxes | 1 | |
| Other long-term liabilities | 10 | |
| Total Purchase Consideration | $ | 3,021 | |
NOTES TO THE CONSOLIDATED FINANCIAL STATEMENTS - (CONTINUED)
The estimated useful lives of the intangible assets acquired are based on our historical experience and expectations as to the duration of time we expect to realize benefits from those assets. The estimated fair value of the identifiable intangible assets acquired, their useful life and the related valuation methodology are as follows:
| | | | | | | | | | | |
| Millions of dollars | Preliminary Fair Value | Estimated Useful Life | Valuation
Methodology |
| Preliminary fair value of intangible assets acquired: | | | |
| Trademarks | $ | 1,300 | | Indefinite | Relief-from-royalty |
| Customer relationships | 330 | | 16 years | Multi-period excess earnings /
with and without method |
| Intangible assets acquired | $ | 1,630 | | | |
For additional information see Note 10 to the Consolidated Financial Statements.
The majority of the intangible asset valuation relates to the InSinkErator brand, which is an indefinite lived intangible. The Company’s assessment as to trademarks having an indefinite life was based on a number of factors, including the competitive environment, market share, brand reputation for quality and performance and product life cycles. The customer relationship intangibles of InSinkErator were mainly allocated to its traditional trade distributors, which have an estimated useful life of up to 16 years based on low historical and projected customer attrition rates among its retailers. The finite-lived intangible assets will be amortized using a straight-line method.
Goodwill of $1.1 billion which is not deductible for tax purposes, arose from this transaction and is allocated to the North America reportable segment, and consists of expected future economic benefits arising from expected future product sales, value creation opportunities, operating efficiencies and other synergies that might result from the acquisition. The allocation has been made on the basis that the anticipated synergies identified will primarily benefit this reportable segment.
During the year ended December 31, 2022, we incurred transaction and other costs in connection with the acquisition of approximately $44 million which are included in Selling, general and administrative expense in our Consolidated Statements of Income (Loss).
Pro Forma Financial Information
The following table provides pro forma results of Whirlpool's operations for the years ended December 31, 2022 and 2021, as if InSinkErator had been acquired as of January 1, 2021. The pro forma results are not necessarily indicative of the results that would have occurred if the acquisition had occurred on the dates indicated or that may result in the future.
| | | | | | | | | | | | | | |
| | Year ended December 31, |
| Millions of dollars | | 2022 | | 2021 |
| Net Sales | | $ | 20,246 | | | $ | 22,565 | |
| Net earnings available to Whirlpool | | $ | (1,493) | | | $ | 1,716 | |
These pro forma amounts have been calculated applying the company’s accounting policies and making certain adjustments, which primarily include: (i) depreciation adjustments relating to fair value step-ups to property, plant and equipment; (ii) amortization adjustments relating to fair value estimates of acquired intangible assets; (iii) incremental interest expense associated with the $2.5 billion term loan borrowing to fund the acquisition and amortization of related debt issuance costs; and (iv) transaction and debt financing related costs of approximately $44 million recorded in selling, general and administrative expense. Pro forma results do not include any anticipated cost savings or other effects of the integration of the acquisition.
NOTES TO THE CONSOLIDATED FINANCIAL STATEMENTS - (CONTINUED)
Latin America planned sale of Brastemp water filtration subscription business
On January 16, 2024, the Company entered into a share purchase agreement with a third-party buyer to sell the Company's Brastemp-branded water filtration subscription business in the Latin America region. The completion of the transaction is contingent upon regulatory approvals and other customary closing conditions, and is anticipated to occur in 2024.
The disposal group met the criteria of held for sale at December 31, 2023. The carrying amounts of the disposal group's assets and liabilities as of December 31, 2023, and 2022, respectively, are immaterial. The disposal group's earnings (loss) available to Whirlpool before income taxes for the twelve months ended December 31, 2023, 2022, and 2021, respectively, are also immaterial.
Russia Sale Transaction
On June 27, 2022, Whirlpool EMEA SpA, a subsidiary of the Company, entered into a share purchase agreement to sell the Company’s Russia business to Arçelik A.Ş. (“Arcelik”), subject to customary conditions at closing. The sale included the entirety of the Company’s operations in Russia, including the Company’s manufacturing facility in Lipetsk, Russia, and the sales organization in Moscow, Russia, as well as sales operations in Kazakhstan and other select CIS countries.
On August 31, 2022, we completed the sale to Arcelik. The consideration includes contingent consideration based on future business and other conditions of the Russian operations. We will recognize the benefit of the contingent consideration when received due to the uncertainty in the Russian marketplace. Additionally, the contingent consideration is subject to a cap based on the agreed net asset value of the Russia business of €261 million at closing (approximately $262 million at August 31, 2022).
In connection with the sale, we recorded a loss on disposal of $346 million in the second quarter of 2022. The loss includes a charge of $333 million for the write-down of the net assets of the disposal group to fair value and $13 million of cumulative currency translation adjustments. On the closing date of August 31, 2022, we recorded an immaterial adjustment to the final loss amount, resulting in a total loss of $348 million for the nine months ended September 30, 2022.
Earnings before income taxes for Russia were not material for the periods presented.
For additional information see Note 10 to the Consolidated Financial Statements.
Whirlpool China Partial Tender OfferDivestment
On August 25, 2020, Guangdong Galanz Household Appliances Manufacturing Co., Ltd. (“Galanz”) announced its intention to pursue a partial tender offer for majority control of Whirlpool China Co. Ltd. (“Whirlpool China”), a majority-owned subsidiary of the Company with shares listed on the Shanghai Stock Exchange. In its announcement, Galanz notesnoted that it expectsexpected to offer RMB 5.23 per share (approximately $0.76 per share as of August 25, 2020) to obtain no less than 51% and no more than 61% of Whirlpool China’s outstanding shares. This share price offer iswas equal to the daily weighted average trading price for Whirlpool China stock over the 30 trading days prior to the announcement.
In the first quarter of 2021, our Board of Directors approved the sale of Whirlpool China, which was reported within our Asia reportable segment and met the criteria for held for sale accounting during the first quarter of 2021. The operations of Whirlpool China did not meet the criteria to be presented as discontinued operations.
On May 6, 2021, the tender offer was completed and the share transfer was executed for a consideration of RMB 1.25 billion (approximately $193 million on the date of completion). Subsequent to the share transfer, the Company is consideringholds an equity interest of 20% in Whirlpool China.
In connection with the termssale, we recorded a gain, net of the offertransaction and other aspectscosts, of this potential strategic relationship along with any potential impact$284 million during the second quarter of 2021. The gain on sale is equal to the Company's financial statementsdifference between the total transaction amount and other aspectscarrying value of its operations. Formal partial tender offer is not expected until regulatory approvals are obtained,Whirlpool China, which includes $74 million of cumulative foreign currency translation adjustments and $80 million of goodwill allocated to the regulatory approval process remains ongoing. If an offer is launched, tender of our shares is subject to Company board approval of the transaction. We have not recorded any impact relating to this announcement as of December 31, 2020.
NOTES TO THE CONSOLIDATED FINANCIAL STATEMENTS - (CONTINUED)
Embraco Sale Transaction
On April 23, 2018, our BoardThe total transaction amount includes $193 million of Directors approvedconsideration received from the sale of EmbracoWhirlpool China shares, $214 million for the fair value of the interest retained and the $783 million carrying value of the equity interest in Whirlpool China. The fair value of the interest retained was based on the ownership amount and the stock price of Whirlpool China as of the closing date of the transaction and we subsequentlyaccount for the remaining minority interest under the equity method of accounting as of June 30, 2021.
Earnings before income taxes prior to the share transfer of Whirlpool China were not material to the Company for the periods presented.
Turkey Subsidiary Divestment
On May 17, 2021, we entered into ana share transfer agreement with Arcelik to sell the compressor businessour Turkish subsidiary for a cash purchase price of $1.08 billion,€78 million (approximately $93 million as of June, 30 2021), subject to customary adjustments including for indebtedness, cash and working capital at closing.
On July 1, 2019,June 30, 2021, we completed the sale of Embraco and received cash proceeds of $1.1 billion inclusive of anticipated cash on hand at the time of closing. With the proceeds from this transaction, we repaid the outstanding term loan amount of approximately $1 billion as required under the April 23, 2018 Term Loan Agreement with Citibank, N.A., as Administrative Agent.
Turkish subsidiary. In connection with the sale, we recorded a pre-tax gain, net of transaction and other costs, of $511 million ($350 million net of taxes) during the twelve months ended December 31, 2019. The gain calculation is no longer subject to change, as amounts for working capital and other customary post-closing adjustments have been finalized. An immaterial adjustment related to final purchase price was recorded in 2020.
Embraco was reported within our Latin America reportable segment and met the criteria for held for sale accounting through the closing date. The operations of Embraco did not meet the criteria to be presented as discontinued operations. The assets and liabilities of Embraco were de-consolidated as of the closing date and there are no remaining carrying amounts in the Consolidated Balance Sheets at December 31, 2019.
The following table summarizes Embraco's earnings before income taxes for the twelve months ended December 31, 2020, 2019 and 2018:
| | | | | | | | | | | | | | | | | |
| Millions of dollars | 2020 | | 2019 | | 2018 |
| Earnings before income taxes | $ | 0 | | | $ | 47 | | | $ | 53 | |
South Africa Business Disposal
On June 28, 2019, we entered into an agreement to sell our South Africa operations for a cash purchase price of $5 million, subject to customary adjustments at closing.
On September 5, 2019, we completed the sale of our South Africa operations. In connection with the sale, we finalized the loss on disposal of $63$164 million which is recorded in the year ended December 31, 2019.as of June 30, 2021. The loss includes a charge of $29$40 million for the write-down of the assets of the disposal group to fair value and $34allocated goodwill, and $124 million of cumulative foreign currency translation adjustments included in the carrying amount of the disposal groupgroup. During the third quarter of 2021, amounts for working capital and other customary post-closing adjustments were finalized and an additional $13 million loss related to calculate the impairment.
The South Africa businessTurkish subsidiary, whose primary asset was a manufacturing plant, was reported within our EMEA reportable segment and met the criteria for held for sale accounting through the closing date.segment. The operations of South AfricaTurkey did not meet the criteria to be presented as discontinued operations. Earnings before income taxes for Turkey were not material for the periods presented.
See Note 11 to the Consolidated Financial Statements for additional information.
Divestiture of Turkey Domestic Sales Operations
For the year ended December 31, 2019, we incurred approximately $11 million of divestiture related costs, primarily inventory liquidation costs, related to the exit from our domestic sales operations in Turkey.
See Note 1410 to the Consolidated Financial Statements for additional information.
NOTES TO THE CONSOLIDATED FINANCIAL STATEMENTS - (CONTINUED)
(18) QUARTERLY RESULTS OF OPERATIONS (UNAUDITED)
| | | | | | | | | | | | | | | | | | | | | | | | | | | | | | | | | | | |
| | Three months ended |
| December 31, | | September 30, | | June 30, | | March 31, |
| Millions of dollars, except per share data | 2020(4) | 2019(3) | | 2020 | 2019(2) | | 2020 | 2019 | | 2020 | 2019 |
| Net sales | $ | 5,798 | | $ | 5,382 | | | $ | 5,291 | | $ | 5,091 | | | $ | 4,042 | | $ | 5,186 | | | $ | 4,325 | | $ | 4,760 | |
| Cost of products sold | 4,434 | | 4,334 | | | 4,136 | | 4,350 | | | 3,411 | | 4,254 | | | 3,625 | | 3,948 | |
| Gross margin | 1,364 | | 1,048 | | | 1,155 | | 741 | | | 631 | | 932 | | | 700 | | 812 | |
| Operating profit (loss) | 716 | | 424 | | | 570 | | 693 | | | 77 | | 191 | | | 260 | | 263 | |
| Interest and sundry (income) expense | 17 | | 54 | | | (22) | | (29) | | | (15) | | (63) | | | (1) | | (130) | |
| Net earnings (loss) | 501 | | 288 | | | 398 | | 364 | | | 25 | | 72 | | | 147 | | 474 | |
| Net earnings (loss) available to Whirlpool | 497 | | 288 | | | 397 | | 358 | | | 35 | | 67 | | | 152 | | 471 | |
| | | | | | | | | | | |
Per share of common stock:(1) | | | | | | | | | | | |
| Basic net earnings (loss) | $ | 7.90 | | $ | 4.56 | | | $ | 6.35 | | $ | 5.62 | | | $ | 0.55 | | $ | 1.04 | | | $ | 2.42 | | $ | 7.36 | |
| Diluted net earnings (loss) | 7.77 | | 4.52 | | | 6.27 | | 5.57 | | | 0.55 | | 1.04 | | | 2.41 | | 7.31 | |
| Dividends | 1.25 | | 1.20 | | | 1.20 | | 1.20 | | | 1.20 | | 1.20 | | | 1.20 | | 1.15 | |
(1)The quarterly earnings per share amounts will not necessarily add to the earnings per share computed for the year due to the method used in calculating per share data.
(2)The operating profit and net earnings for the three months ended September 30, 2019 includes a gain on sale and disposal of businesses of $437 million, a $180 million gain related to Brazil indirect tax credits and a $105 million charge related to product warranty expense on EMEA- produced washers. See Note 8, Note 11, Note 14 and Note 17 to the Consolidated Financial Statements for additional information.
(3)The gross margin for the three months ended December 31, 2019 includes a gain of $95 million related to a sale and leaseback transaction. See Note 1 to the Consolidated Financial Statements for additional information.
(4)The gross margin for the three months ended December 31, 2020 includes a gain of $113 million related to a sale and leaseback transaction. See Note 1 to the Consolidated Financial Statements for additional information.
| | | | | |
| ITEM 9. | CHANGES IN AND DISAGREEMENTS WITH ACCOUNTANTS ON ACCOUNTING AND FINANCIAL DISCLOSURE |
None.
| | | | | |
| ITEM 9A. | CONTROLS AND PROCEDURES |
Disclosure controls and procedures. Whirlpool maintains disclosure controls and procedures (as defined in Rule 13a-15(e) of the Securities Exchange Act of 1934, as amended (the "Securities Exchange Act")) that are designed to provide reasonable assurance that information required to be disclosed in our filings under the Securities Exchange Act is recorded, processed, summarized, and reported within the periods specified in the rules and forms of the SEC and that such information is accumulated and communicated to Whirlpool's management, including its Chief Executive Officer and Chief Financial Officer, as appropriate, to allow timely decisions regarding required disclosure.
Prior to filing this report, we completed an evaluation under the supervision and with the participation of Whirlpool management, including the Chief Executive Officer and Chief Financial Officer, of the effectiveness of the design and operation of our disclosure controls and procedures as of December 31, 2020.2023. Based on this evaluation, the Chief Executive Officer and Chief Financial Officer concluded that our disclosure controls and procedures were effective at the reasonable assurance level as of December 31, 2020.2023.
Management's annual report on internal control over financial reporting. Pursuant to Section 404 of the Sarbanes-Oxley Act of 2002 and the rules and regulations adopted pursuant thereto, we included a report of management's assessment of the effectiveness of our internal control over financial reporting as part of this report. Management's report is included on page 110132 of this report under the caption entitled "Management's Report on Internal Control Over Financial Reporting" and is incorporated herein by reference. Our internal control over financial reporting as of December 31, 20202023 has been audited by Ernst & Young LLP, an independent registered public accounting firm, as stated in their report, which is included on page 114133 of this report under the caption entitled "Report of Independent Registered Public Accounting Firm" and is incorporated herein by reference. Changes in internal control over financial reporting.There were no changes in our internal control over financial reporting during the quarteryear ended December 31, 20202023 that have materially affected, or are reasonably likely to materially affect, our internal control over financial reporting.
| | | | | |
| ITEM 9B. | OTHER INFORMATION |
None.
| | | | | |
| ITEM 9C. | DISCLOSURE REGARDING FOREIGN JURISDICTIONS THAT PREVENT INSPECTIONS |
Not Applicable.
| | | | | |
| ITEM 10. | DIRECTORS, EXECUTIVE OFFICERS AND CORPORATE GOVERNANCE |
Information regarding our executive officers is included in ITEM 1 of PART I of this report under "Information About Our Executive Officers."
Information regarding the background of the directors, matters related to the Audit Committee, Section 16(a) compliance, and the process by which our shareholders may recommend nominees to our Board of Directors can be found under the captions "Directors and Nominees for Election as Directors," "Board of Directors and Corporate Governance - Board of Directors and Committees," "Delinquent Section 16(a) Reports,"Board of Directors and Corporate Governance - Committee Member Independence and Expertise," "Audit Committee Report" and "Board of Directors and Corporate Governance - Director Nominations by Stockholders" in the proxy statement, which will be filed pursuant to SEC Regulation 14A not later than 120 days after the end of the Company's fiscal year ended December 31, 20202023 ("Proxy Statement").
We have adopted a code of ethics that applies to all of our employees, officers and directors, including our principal executive officer, principal financial officer and principal accounting officer. The text of our code of ethics, titled "Our Integrity Manual", is posted on our website at whirlpoolcorp.com/ethics. Whirlpool intends to disclose future amendments to, or waivers from, certain provisions of the code of ethics for executive officers and directors on this website within four business days following the date of such amendment or waiver. Stockholders may request a free copy of theOur Integrity Manual from:
Investor Relations
Whirlpool Corporation
2000 North M-63
Mail Drop 2609
Benton Harbor, MI 49022-2692
Telephone: (269) 923-2641Email: investor_relations@whirlpool.com
Whirlpool has also adopted Corporate Governance Guidelines and written charters for its Audit, Finance, Human Resources and Corporate Governance and Nominating Committees, all of which are posted on our website: whirlpoolcorp.com (scroll to the bottom of the main page and click on "Policies.""Policies and Guidelines"). Stockholders may request a free copy of the charters and guidelines from the address or telephone numberemail address set forth above.
| | | | | |
| ITEM 11. | EXECUTIVE COMPENSATION |
Information regarding compensation of our executive officers and directors can be found under the captions "Non-employee Director Compensation," "Compensation Discussion and Analysis," "2020"2023 Executive Compensation Tables," "Pay Ratio Disclosure," "Compensation Risk Assessment," and "Human Resources Committee Interlocks and Insider Participation" in the Proxy Statement, which is incorporated herein by reference. See also the information under the caption "Human Resources Committee Report" in the Proxy Statement, which is incorporated herein by reference; however, such information is only "furnished" hereunder and not deemed "soliciting material" or "filed" with the SEC or subject to Regulation 14A or 14C or to the liabilities of Section 18 of the Securities Exchange Act of 1934.
| | | | | |
| ITEM 12. | SECURITY OWNERSHIP OF CERTAIN BENEFICIAL OWNERS AND MANAGEMENT AND RELATED STOCKHOLDER MATTERS |
Information regarding the security ownership of any person that we know to beneficially own more than 5% of Whirlpool stock and by each Whirlpool director, each Whirlpool named executive officer, and all directors and executive officers as a group, can be found under the captions "Security Ownership" and "Beneficial Ownership" in the Proxy Statement, which is incorporated herein by reference. Information relating to securities authorized under equity compensation plans can be found under the caption "Equity Compensation Plan Information" in the Proxy Statement, which is incorporated herein by reference.
| | | | | |
| ITEM 13. | CERTAIN RELATIONSHIPS AND RELATED TRANSACTIONS, AND DIRECTOR INDEPENDENCE |
Information regarding certain relationships and related transactions (if any) and the independence of Whirlpool's directors, can be found under the captions "Related Person Transactions" and "Board of Directors and Corporate Governance - Board of Directors and Committees" in the Proxy Statement, which is incorporated herein by reference.
| | | | | |
| ITEM 14. | PRINCIPAL ACCOUNTINGACCOUNTANT FEES AND SERVICES |
Information regarding our auditors and the Audit Committee's pre-approval policies can be found under the caption "Matters Relating to Independent Registered Public Accounting Firm" in the Proxy Statement, which is incorporated herein by reference.
| | | | | |
| ITEM 15. | EXHIBITS, FINANCIAL STATEMENT SCHEDULES |
(a) The following documents are filed as a part of this report:
1. Financial statements
2. Financial Statement Schedules - "Schedule II - Valuation and Qualifying Accounts" is contained on page 129138 of this report. Certain schedules for which provisions are made in the applicable accounting regulations of the Securities and Exchange Commission are not required under the related instructions or are inapplicable, and therefore have been omitted. (b) The exhibits listed in the "Exhibit Index" is contained on page 115123 of this report. (c) Individual financial statements of the registrant's affiliated foreign companies, accounted for by the equity method, have been omitted since no such company individually constitutes a significant subsidiary.
| | | | | |
| ITEM 16. | Form 10-K Summary |
None.
ANNUAL REPORT ON FORM 10-K
ITEMS 15(a)(3) and 15(c)15(b)
EXHIBIT INDEX
YEAR ENDED DECEMBER 31, 20202023
The following exhibits are submitted herewith or incorporated herein by reference in response to Items 15(a)(3) and 15(c)15(b). Each exhibit that is considered a management contract or compensatory plan or arrangement required to be filed pursuant to Item 15(a)(3) of Form 10-K is identified by a "(Z)."
| | | | | |
Number and Description of Exhibit |
| 2(i)** | |
| |
| 2(ii)** | |
| |
| 2(iii)** | |
| |
| 2(iv)** | |
| |
| 3(i) | |
| |
| 3(ii) | |
| |
| 4(i) | The registrant hereby agrees to furnish to the Securities and Exchange Commission, upon request, a copy of instruments defining the rights of holders of each issue of long-term debt of the registrant and its subsidiaries. |
| |
| 4(ii) | Indenture dated as of April 15, 1990 between Whirlpool Corporation and Citibank, N.A. [Incorporated by reference from Exhibit 4(a) to the Company's Registration Statement on Form S-3 (Commission file number 33-40249) filed on May 6, 1991] |
| |
| 4(iii) | |
| |
| 4(iv) | Indenture dated as of June 15, 1987 between Maytag Corporation and The First National Bank of Chicago [Incorporated by reference from Maytag Corporation's Quarterly Report on Form 10-Q (Commission file number 1-00655) for the quarter ended June 30, 1987] |
| |
| | | | | |
| 4(vi) | |
| |
| 4(vii) | |
| |
4(viii)* | |
| |
| 4(ix) | |
| |
| 10(i)(a) | FourthFifth Amended and Restated Long Term Credit Agreement dated as of August 6, 2019May 3, 2022 among Whirlpool Corporation, Whirlpool Europe B.V., Whirlpool Canada Holding Co., Whirlpool Global B.V., Whirlpool UK Appliances Limited, the other borrowers party thereto, the lenders party thereto, JPMorgan Chase Bank, N.A., as Administrative Agent, Citibank, N.A., as Syndication Agent, and BNP Paribas, Mizuho Bank, Ltd. and Wells Fargo Bank, National Association, as Documentation Agents [Incorporated by reference from Exhibit 10.1 to the Company's Form 10-Q (Commission file number 1-3932) for the quarter ended June 30, 2022] |
| |
| 10(i)(b) | |
| |
10(i)(b) | |
| |
| 10(iii)(a) | |
| |
| 10(iii)(b) | Whirlpool Corporation Charitable Award Contribution and Additional Life Insurance Plan for Directors (effective April 20, 1993) (Z) [Incorporated by reference from Exhibit 10(iii)(p) to the Company's Annual Report on Form 10-K (Commission file number 1-3932) for the fiscal year ended December 31, 1994] |
| |
| 10(iii)(c) | Whirlpool Corporation Deferred Compensation Plan for Directors (as amended effective January 1, 1992 and April 20, 1993) (Z) [Incorporated by reference from Exhibit 10(iii)(f) to the Company's Annual Report on Form 10-K (Commission file number 1-3932) for the fiscal year ended December 31, 1993] |
| | |
| 10(iii)(d) | |
| | | | | |
| 10(iii)(f) | |
| |
| 10(iii)(g) | |
| |
| 10(iii)(h) | |
| |
| 10(iii)(i) | |
| |
| 10(iii)(j) | |
| | |
| 10(iii)(k) | |
| | | | | |
| 10(iii)(l) | |
| |
| 10(iii)(m) | Form of Agreement for the Whirlpool Corporation Career Stock Grant Program (pursuant to one or more of Whirlpool's Omnibus Stock and Incentive Plans) (Z) [Incorporated by reference from Exhibit 10(iii)(q) to the Company's Annual Report on Form 10-K (Commission file number 1-3932) for the fiscal year ended December 31, 1995] |
| |
| 10(iii)(n) | |
| |
10(iii)(o) | |
| |
| 10(iii)(p) | |
| |
| 10(iii)(q) | |
| |
| | | | | |
| |
| 10(iii)(s) | |
| |
| 10(iii)(t) | |
| |
| 10(iii)(u) | |
| |
| 10(iii)(v) | |
| |
10(iii)(w) | |
| |
| 10(iii)(x) | |
| |
| 10(iii)(y) | |
| |
| 10(iii)(z) | Whirlpool Corporation Executive Deferred Savings Plan (as amended effective January 1, 1992) (Z) [Incorporated by reference from Exhibit 10(iii)(n) to the Company's Annual Report on Form 10-K (Commission file number 1-3932) for the fiscal year ended December 31, 1993] |
| |
| 10(iii)(aa) | |
| |
| 10(iii)(bb) | |
| |
| | | | | |
| 10(iii)(cc) | |
| |
| 10(iii)(dd) | |
| |
| 10(iii)(ee) | |
| |
| | | | | |
| 10(iii)(ff) | |
| |
| 10(iii)(gg) | |
| |
| 10(iii)(hh) | |
| |
| 10(iii)(ii) | |
| |
| 10(iii)(jj) | |
| |
| 10(iii)(kk) | |
| |
| 10(iii)(ll) | |
| |
| 10(iii)(mm) | |
| |
| 10(iii)(nn) | |
| |
| 10(iii)(oo) | |
| |
| 10(iii)(pp) | |
| |
| 10(iii)(qq) | |
| |
| | | | | |
| 10(iii)(rr) | |
| |
| 10(iii)(ss) | |
| |
| 10(iii)(tt) | |
| |
| 10(iii)(uu) | |
| |
| 10(iii)(vv) | |
| |
| 10(iii)(ww) | |
| |
| 10(iii)(xx) | |
| |
| 10(iii)(yy) | |
| |
| 10(iii)(zz) | |
| |
| 10(iii)(aaa) | |
| |
| 10(iii)(bbb) | |
| |
| 18.1 | |
| |
| 21* | |
| |
| | | | | |
| 24* | |
| |
| 31.1* | |
| |
| 31.2* | |
| |
| 32* | |
| |
| 97* | |
| |
| 101.INS* | XBRL Instance Document - the instance document does not appear in the Interactive Data File because its XBRL tags are embedded within the Inline XBRL document |
| |
| 101.SCH* | Inline XBRL Taxonomy Extension Schema Document |
| |
| 101.CAL* | Inline XBRL Taxonomy Extension Calculation Linkbase Document |
| |
| 101.DEF* | Inline XBRL Taxonomy Extension Definition Linkbase Document |
| |
| 101.LAB* | Inline XBRL Taxonomy Extension Label Linkbase Document |
| |
| 101.PRE* | Inline XBRL Taxonomy Extension Presentation Linkbase Document |
| |
| 104* | Cover Page Interactive Data File (formatted as Inline XBRL and contained in Exhibit 101) |
* Filed Herewith
** Schedules (or similar attachments) have been omitted pursuant to Item 601(a)(5) of Regulation S-K. The Company will furnish supplementallysupplementary copies of such omitted schedules (or similar attachments) to the Securities and Exchange Commission upon request.
SIGNATURES
Pursuant to the requirements of Section 13 or 15(d) of the Securities Exchange Act of 1934, the registrant has duly caused this report to be signed on its behalf by the undersigned, thereunto duly authorized.
| | | | | | | | | | | |
WHIRLPOOL CORPORATION (Registrant) | |
| By: | | /s/ JAMES W. PETERS | February 11, 202114, 2024 |
| | James W. Peters
Executive Vice President and Chief Financial Officer | |
Pursuant to the requirements of the Securities Exchange Act of 1934, this report has been signed below by the following persons on behalf of the registrant and in the capacities and on the date indicated.
| | | | | | | | |
| Signature | | Title |
| | |
| /s/ MARC R. BITZER | | Chairman of the Board, President and Chief Executive Officer
(Principal Executive Officer) |
| Marc R. Bitzer | |
| |
| /s/ JAMES W. PETERS | | Executive Vice President and Chief Financial Officer
(Principal Financial Officer) |
| James W. Peters | |
| |
| /s/ CHRISTOPHER S. CONLEY | | Vice President and Corporate Controller
(Principal Accounting Officer) |
| Christopher S. Conley | |
| | |
| SAMUEL R. ALLEN* | | Director |
| Samuel R. Allen | |
| | |
| GREG CREED* | | Director |
| Greg Creed | |
| | |
GARY T. DICAMILLO* | | Director |
Gary T. DiCamillo | |
| | |
| DIANE M. DIETZ* | | Director |
| Diane M. Dietz | |
| | |
| GERRI T. ELLIOTT* | | Director |
| Gerri T. Elliott | |
| | |
| JENNIFER A. LACLAIR* | | Director |
| Jennifer A. LaClair | |
| | |
| JOHN D. LIU* | | Director |
| John D. Liu | |
| | |
| JAMES M. LOREE* | | Director |
| James M. Loree | |
| | |
| HARISH MANWANI* | | Director |
| Harish Manwani | |
| | |
| PATRICIA K. POPPE* | | Director |
| Patricia K. Poppe | |
| | |
| LARRY O. SPENCER* | | Director |
| Larry O. Spencer | |
| |
| MICHAEL D. WHITE* | | Director |
| Michael D. White | |
| | |
| RUDY WILSON* | | Director |
| Rudy Wilson | |
| | | | | | | | | | | | | | | | | | | | |
| *By: | | /s/ JAMES W. PETERS | | Attorney-in-Fact | | February 11, 202114, 2024 |
| | James W. Peters | | | |
REPORT BY MANAGEMENT ON THE CONSOLIDATED FINANCIAL STATEMENTS
The management of Whirlpool Corporation has prepared the accompanying financial statements. The financial statements have been audited by Ernst & Young LLP, an independent registered public accounting firm, whose report, based upon their audits, expresses the opinion that these financial statements present fairly the consolidated financial position, statements of income and cash flows of Whirlpool and its subsidiaries in accordance with accounting principles generally accepted in the United States. Their audits are conducted in conformity with the auditing standards of the Public Company Accounting Oversight Board (United States).
The financial statements were prepared from the Company's accounting records, books and accounts which, in reasonable detail, accurately and fairly reflect all material transactions. The Company maintains a system of internal controls designed to provide reasonable assurance that the Company's books and records, and the Company's assets are maintained and accounted for, in accordance with management's authorizations. The Company's accounting records, compliance with policies and internal controls are regularly reviewed by an internal audit staff.
The audit committee of the Board of Directors of the Company is composed of six independent directors who, in the opinion of the board, meet the relevant financial experience, literacy, and expertise requirements. The audit committee provides independent and objective oversight of the Company's accounting functions and internal controls and monitors (1) the integrity of the Company's financial statements, (2) the Company's compliance with legal and regulatory requirements, (3) the independent registered public accounting firm's qualifications and independence, and (4) the performance of the Company's internal audit function and independent registered public accounting firm. In performing these functions, the committee has the responsibility to review and discuss the annual audited financial statements and quarterly financial statements and related reports with management and the independent registered public accounting firm, including the Company's disclosures under "Management's Discussion and Analysis of Financial Condition and Results of Operations," to monitor the adequacy of financial disclosure. The committee also has the responsibility to retain and terminate the Company's independent registered public accounting firm and exercise the committee's sole authority to review and approve all audit engagement fees and terms and pre-approve the nature, extent, and cost of all non-audit services provided by the independent registered public accounting firm.
| | |
| /s/ JAMES W. PETERS |
| James W. Peters |
| Executive Vice President and Chief Financial Officer |
February 11, 202114, 2024 |
MANAGEMENT'S REPORT ON INTERNAL CONTROL OVER FINANCIAL REPORTING
The management of Whirlpool Corporation is responsible for establishing and maintaining adequate internal control over financial reporting as defined in Rules 13a – 15(f) and 15d – 15(f) under the Securities Exchange Act of 1934. Whirlpool's internal control system is designed to provide reasonable assurance to Whirlpool's management and board of directors regarding the reliability of financial reporting and the preparation and fair presentation of published financial statements.
All internal control systems, no matter how well designed, have inherent limitations. Therefore, even those systems determined to be effective can provide only reasonable assurance with respect to financial statement preparation and presentation.
The management of Whirlpool assessed the effectiveness of Whirlpool's internal control over financial reporting as of December 31, 2020.2023. In making this assessment, it used the criteria set forth by the Committee of Sponsoring Organizations of the Treadway Commission (COSO) in Internal Control—Integrated Framework (2013 Framework). Based on the assessment and those criteria, management believes that Whirlpool maintained effective internal control over financial reporting as of December 31, 2020.2023.
Whirlpool's independent registered public accounting firm has issued an audit report on its assessment of Whirlpool's internal control over financial reporting. This report appears on page 114.137.
| | | | | | | | |
| /s/ MARC R. BITZER | | /s/ JAMES W. PETERS |
| Marc R. Bitzer | | James W. Peters |
| Chairman of the Board, President and Chief Executive Officer | | Executive Vice President and Chief Financial Officer |
February 11, 202114, 2024 | | February 11, 202114, 2024 |
REPORT OF INDEPENDENT REGISTERED PUBLIC ACCOUNTING FIRM
To the Shareholders and Board of Directors of Whirlpool Corporation
Opinion on the Financial Statements
We have audited the accompanying consolidated balance sheets of Whirlpool Corporation (the Company) as of December 31, 20202023 and 2019,2022, the related consolidated statements of income (loss), comprehensive income (loss), stockholders' equity and cash flows for each of the three years in the period ended December 31, 2020,2023, and the related notes and financial statement schedule listed in the index at Item 15(a) (collectively referred to as the "consolidated financial statements"). In our opinion, the consolidated financial statements present fairly, in all material respects, the consolidated financial position of the Company at December 31, 20202023 and 2019,2022, and the consolidated results of its operations and its cash flows for each of the three years in the period ended December 31, 2020,2023, in conformity with U.S. generally accepted accounting principles.
We also have audited, in accordance with the standards of the Public Company Accounting Oversight Board (United States) (PCAOB), the Company's internal control over financial reporting as of December 31, 2020,2023, based on criteria established in Internal Control-Integrated Framework issued by the Committee of Sponsoring Organizations of the Treadway Commission (2013 framework) and our report dated February 11, 202114, 2024 expressed an unqualified opinion thereon.
Basis for Opinion
These financial statements are the responsibility of the Company's management. Our responsibility is to express an opinion on the Company’s financial statements based on our audits. We are a public accounting firm registered with the PCAOB and are required to be independent with respect to the Company in accordance with the U.S. federal securities laws and the applicable rules and regulations of the Securities and Exchange Commission and the PCAOB.
We conducted our audits in accordance with the standards of the PCAOB. Those standards require that we plan and perform the audit to obtain reasonable assurance about whether the financial statements are free of material misstatement, whether due to error or fraud. Our audits included performing procedures to assess the risks of material misstatement of the financial statements, whether due to error or fraud, and performing procedures that respond to those risks. Such procedures included examining, on a test basis, evidence regarding the amounts and disclosures in the financial statements. Our audits also included evaluating the accounting principles used and significant estimates made by management, as well as evaluating the overall presentation of the financial statements. We believe that our audits provide a reasonable basis for our opinion.
Critical Audit Matters
The critical audit matters communicated below are matters arising from the current period audit of the consolidated financial statements that were communicated or required to be communicated to the audit committee and that: (1) relate to accounts or disclosures that are material to the consolidated financial statements and (2) involved our especially challenging, subjective or complex judgments. The communication of critical audit matters does not alter in any way our opinion on the consolidatedfinancial statements, taken as a whole, and we are not, by communicating the critical audit matters below, providing separate opinions on the critical audit matters or on the accounts or disclosures to which they relate.
Valuation of Europe, Middle East,Maytag and Africa (EMEA) Reporting Unit Goodwill and CertainInSinkErator Indefinite Lived Intangible Assets
| | | | | | | | |
| Description of the Matter | | At December 31, 2020,2023, the balance of the Company’s goodwill related to the EMEA reporting unit was $329 millionMaytag and the balance of the Hotpoint and JennAirInSinkErator indefinite lived brand intangible assetassets was $158 million$1 billion and $304 million,$1.3 billion, respectively. As discussed in Note 1, Note 6,5, and Note 1110 to the consolidated financial statements, goodwill and indefinite lived intangible assets are tested for impairment at least annually or when impairment indicators are present at the reporting unit or intangible asset level, respectively.level.
Auditing management’s assessment of the estimated fair value of the EMEA reporting unit goodwill was complexMaytag and required the involvement of valuation specialists due to the judgmental nature of the assumptions utilized in the valuation process. The fair value estimate was sensitive to significant assumptions such as revenue growth, EBIT margins and the discount rate. The estimate also included assumptions related to the terminal growth rate, tax rate, capital expenditures, depreciation and amortization and changes in working capital requirements. In addition, auditing management’s assessment of the estimated fair value of both the Hotpoint and JennAirInSinkErator indefinite lived brand intangible assets was complex and required the involvement of valuation specialists due to the judgmental nature of the assumptions used in the valuation process. The fair value estimate was sensitive to significant assumptions such asincluding future revenue, royalty rate and discount rate. The estimate also included assumptions related to the tax rate.
|
| | | | | | | | |
| How We Addressed the Matter in Our Audit | | We obtained an understanding, evaluated the design and tested the operating effectiveness of controls over the Company’s goodwill and indefinite lived intangible asset fair value assessment process. This included testing controls over management’s review over the projected financial information and other keysignificant assumptions used in the valuation model as well as controls over the carrying value of the EMEA reporting unitMaytag and both the Hotpoint and JennAir brandInSinkErator indefinite lived intangibles.
To test the estimated fair value of goodwill related to the EMEA reporting unit as well as the HotpointMaytag and JennAirInSinkErator indefinite lived brand intangible assets, we performed audit procedures that included, among others, assessing methodologies used in the model and testing the significant assumptions discussed above. This included comparing the significant assumptions used by management to current industry and economic trends, changes to the Company’s business model, customer base or product mix and other relevant factors. We assessed the reasonableness of management’s projections used in the fair value calculation and obtained support for initiatives supporting these projections. We also compared previous forecasts to actual results to assess management’s forecasting process. For example, for forecasted revenue we compared the revenue growth assumptions to the Company’s historical growth rate, external economic and industry data, and various business plans designed to grow revenue. To assess the discount rate, we reviewed the methodology used by the Company and considered each input relative to current economic factors.
We involved valuation specialists to assist in evaluating the keysignificant assumptions and methodologies. We performed sensitivity analyses of significant assumptions to evaluate the changes in the fair value of the EMEA reporting unit and the indefinite lived intangible assetsasset that would result from changes in the assumptions. In addition, we tested the mathematical accuracy of the model. |
| | |
| | |
| |
|
Valuation of Unrecognized Income Tax Benefits and Indirect Tax Matters
| | | | | | | | |
| Description of the Matter | | As of December 31, 2020,2023, the Company has Unrecognized Income Tax Benefits and indirect tax mattersof $380 million as described in Note 8 and Note 1513 to the consolidated financial statements, respectively. These matters also include assessments disclosed in the BEFIEX Credits and Other Brazil Tax Matters section of Note 8 of $488 million related to Brazilian income tax and indirect tax matters.As described in Note 15, the Company has unrecognized tax benefits of $427 million.statements. The Company records the benefits of an uncertain tax position in the consolidated financial statements after determining it is more likely than not that the uncertain tax position will be sustained upon examination based on its technical merits. The Company accrues liabilities for the contingencies which relate to indirect tax matters when a loss probable and the amount or range of loss is reasonably estimable.
Auditing management’s accounting and disclosure for these unrecognized tax benefits and indirect tax matters was complex because the evaluation is based on interpretations of domestic and international tax laws, is subjective, and requires significant judgment and often requires the use of subject matter resources to assist in the evaluation.judgement.
|
| | | | | | | | |
| How We Addressed the Matter in Our Audit | | We identified and tested controls that address the risk of material misstatement relating to the valuation of these income tax and indirect tax matters. This included, among others, testing controls over the Company’s process to assess the technical merits and measurement of these positions. We also tested the Company’s process to determine the disclosure for these matters.
With the assistance of our income tax professionals, and subject matter resources, we performed audit procedures that included, among others, evaluating the technical merits, measurement and related disclosure for the Company’s positions. For example, we assessed the inputs utilized and the conclusions reached in the assessments performed by the management, and compared the methods used to alternative methods.management. We also reviewed certain legal opinions obtained from external advisors and internal legal counsel, examined the Company’s communications with the relevant tax authorities and read the minutes of the meetings of the committees of the board of directors. In addition, we used our knowledge of historical settlement activity, tax laws, and other market information to evaluate the technical merits of the Company’s positions. Furthermore, we monitored leading cases within the respective jurisdictions to determine if precedence set in those rulings impacted the Company’s cases and we monitored external sources for any information which could impact these cases. |
Revenue Recognition - Completeness and Valuation of Customer Sales Incentives (Promotions Liabilities)
| | | | | | | | |
| Description of the Matter | | AtAs of December 31, 2020,2023, the Company’s accrued promotional liability was $831$603 million. As discussed in Note 2 to the consolidated financial statements, the Company recognizes a reduction to revenue and a corresponding accrued promotional liability based on the amount of customer sales incentives to be paid to trade customers. This estimate is accounted for as a reduction to revenue in the period incurred and primarily calculated using the expected value method.
Auditing the accrued promotions liability was complex and subjective due to the large volume of activity, the manual nature of adjustments made to the liability in certain countries, and the inherent estimation uncertainty in the process performed to estimate the reduction to revenue and corresponding promotional liability. In addition, assessing the completeness of the accrual required significant auditor judgment. |
| | |
| How We Addressed the Matter in Our Audit | | We obtained an understanding, evaluated the design and tested the operating effectiveness of controls over the completeness and valuation of the reduction to revenue and corresponding promotional liability. For example, we tested controls over management’s review of adjustments to the accrual, as well as their review of significant assumptions to the accrual, including the validation of third-party sales data.accrual.
Our audit procedures over completeness and valuation included, among others, testing a sample of key inputs to the promotional liability, including reviewing key customer contractual agreements and third-party sales data. We performed testing over activity subsequent to the balance sheet date to determine the impact, if any, these items have on the 20202023 financial statements. In addition, to assess management’s estimation accuracy, we perform a lookback analysis which compares the amount accrued in the prior year to the amount subsequently paid.
We also performed analytical procedures on a disaggregated level and performed inquiries of sales personnel and key finance management personnel. In addition, we sent confirmations to third parties, which included confirmation of the sales incentive amounts owed to customers.
|
/s/ Ernst & Young LLP
We have served as the Company's auditor since 1927.
Chicago, Illinois
February 11, 2021
REPORT OF INDEPENDENT REGISTERED PUBLIC ACCOUNTING FIRM
To the Shareholders and Board of Directors of Whirlpool Corporation
Opinion on Internal Control over Financial Reporting
We have audited Whirlpool Corporation's internal control over financial reporting as of December 31, 2020,2023, based on criteria established in Internal Control-Integrated Framework issued by the Committee of Sponsoring Organizations of the Treadway Commission (2013 framework) (the COSO criteria). In our opinion, Whirlpool Corporation (the Company) maintained, in all material respects, effective internal control over financial reporting as of December 31, 2020,2023, based on the COSO criteria.
We also have audited, in accordance with the standards of the Public Company Accounting Oversight Board (United States) (PCAOB), the consolidated balance sheets of the Company as of December 31, 20202023 and 2019,2022, the related consolidated statements of income (loss), comprehensive income (loss), stockholders' equity and cash flows for each of the three years in the period ended December 31, 2020,2023, and the related notes and financial statement schedule listed in the index at Item 15(a) and our report dated February 11, 202114, 2024 expressed an unqualified opinion thereon.
Basis for Opinion
The Company's management is responsible for maintaining effective internal control over financial reporting and for its assessment of the effectiveness of internal control over financial reporting included in the accompanying Management's Report on Internal Control over Financial Reporting. Our responsibility is to express an opinion on the Company's internal control over financial reporting based on our audit. We are a public accounting firm registered with the PCAOB and are required to be independent with respect to the Company in accordance with the U.S. federal securities laws and the applicable rules and regulations of the Securities and Exchange Commission and the PCAOB.
We conducted our audit in accordance with the standards of the PCAOB. Those standards require that we plan and perform the audit to obtain reasonable assurance about whether effective internal control over financial reporting was maintained in all material respects.
Our audit included obtaining an understanding of internal control over financial reporting, assessing the risk that a material weakness exists, testing and evaluating the design and operating effectiveness of internal control based on the assessed risk, and performing such other procedures as we considered necessary in the circumstances. We believe that our audit provides a reasonable basis for our opinion.
Definition and Limitations of Internal Control Over Financial Reporting
A company's internal control over financial reporting is a process designed to provide reasonable assurance regarding the reliability of financial reporting and the preparation of financial statements for external purposes in accordance with generally accepted accounting principles. A company's internal control over financial reporting includes those policies and procedures that (1) pertain to the maintenance of records that, in reasonable detail, accurately and fairly reflect the transactions and dispositions of the assets of the company; (2) provide reasonable assurance that transactions are recorded as necessary to permit preparation of financial statements in accordance with generally accepted accounting principles, and that receipts and expenditures of the company are being made only in accordance with authorizations of management and directors of the company; and (3) provide reasonable assurance regarding prevention or timely detection of unauthorized acquisition, use, or disposition of the company's assets that could have a material effect on the financial statements.
Because of its inherent limitations, internal control over financial reporting may not prevent or detect misstatements. Also, projections of any evaluation of effectiveness to future periods are subject to the risk that controls may become inadequate because of changes in conditions, or that the degree of compliance with the policies or procedures may deteriorate.
/s/ Ernst & Young LLP
Chicago, Illinois
February 11, 202114, 2024
SCHEDULE II—VALUATION AND QUALIFYING ACCOUNTS
WHIRLPOOL CORPORATION AND SUBSIDIARIES
Years Ended December 31, 2020, 20192023, 2022 and 20182021
(Millions of dollars)
| | | | | | | | | | | | | | | | | | | | | | | | | | |
| COL. A | | COL. B | | COL. C | | COL. D | | COL. E |
| Description | | Balance at Beginning
of Period | | Charged to Cost and
and Expenses | | Deductions(1) | | Balance at End
of Period |
| Allowance for doubtful accounts | | | | | | | | |
| Year Ended December 31, 2020: | | $ | 132 | | | $ | 42 | | | $ | (42) | | | $ | 132 | |
| Year Ended December 31, 2019: | | 136 | | | 16 | | | (20) | | | 132 | |
| Year Ended December 31, 2018: | | 157 | | | 54 | | | (75) | | | 136 | |
Deferred tax valuation allowance (2) | | | | | | | | |
| Year Ended December 31, 2020: | | $ | 192 | | | $ | 12 | | | $ | 10 | | | $ | 214 | |
| Year Ended December 31, 2019: | | 348 | | | (150) | | | (6) | | | 192 | |
| Year Ended December 31, 2018: | | 178 | | | 75 | | | 95 | | | 348 | |
| | | | | | | | | | | | | | | | | | | | | | | | | | |
| | | | | | | | |
| Description | | Balance at Beginning
of Period | | Charged to Cost and
and Expenses | | Deductions(1) | | Balance at End
of Period |
| Allowance for doubtful accounts | | | | | | | | |
| Year Ended December 31, 2023: | | $ | 49 | | | $ | 1 | | | $ | (3) | | | $ | 47 | |
| Year Ended December 31, 2022: | | 97 | | | 7 | | | (55) | | | 49 | |
| Year Ended December 31, 2021: | | 132 | | | 6 | | | (41) | | | 97 | |
Deferred tax valuation allowance (2) | | | | | | | | |
| Year Ended December 31, 2023: | | $ | 412 | | | $ | 78 | | | $ | — | | | $ | 490 | |
| Year Ended December 31, 2022: | | 195 | | | 222 | | | (5) | | | 412 | |
| Year Ended December 31, 2021: | | 214 | | | (20) | | | 1 | | | 195 | |
(1)With respect to allowance for doubtful accounts, the amounts represent accounts charged off, net of translation adjustments and transfers. In 2018 the amount also includes an adjustment for Embraco compressor business, for additional information refer to Note 17 to the Consolidated Financial Statements. Recoveries were nominal for 2020, 20192023, 2022 and 2018.2021.
(2)For additional information about our deferred tax valuation allowances, refer to Note 1513 to the Consolidated Financial Statements.
[THIS PAGE INTENTIONALLY LEFT BLANK]