0000107263us-gaap:IntersegmentEliminationMemberus-gaap:ServiceMemberwmb:SequentMember2021-01-012021-12-31
UNITED STATES SECURITIES AND EXCHANGE COMMISSION
Washington, D.C. 20549
Form 10-K
(Mark One)
| | | | | | | | |
| ☑ | ANNUAL REPORT PURSUANT TO SECTION 13 OR 15(d) OF THE SECURITIES EXCHANGE ACT OF 1934 |
| For the fiscal year ended | December 31, 20212023 |
| OR |
| ☐ | TRANSITION REPORT PURSUANT TO SECTION 13 OR 15(d) OF THE SECURITIES EXCHANGE ACT OF 1934 |
| For the transition period from to |
Commission file number 1-4174
TheWilliams Companies, Inc.
(Exact Name of Registrant as Specified in Its Charter)
| | | | | | | | | | | |
| Delaware | | 73-0569878 |
(State or Other Jurisdiction of
Incorporation or Organization) | | (IRS Employer
Identification No.) |
| | | |
| One Williams Center | | |
| Tulsa | Oklahoma | | 74172 |
| (Address of Principal Executive Offices) | | (Zip Code) |
918-573-2000800-945-5426 (800-WILLIAMS)
(Registrant’s Telephone Number, Including Area Code)
Securities registered pursuant to Section 12(b) of the Act:
| | | | | | | | |
| Title of Each Class | Trading Symbol(s) | Name of Each Exchange on Which Registered |
| Common Stock, $1.00 par value | WMB | New York Stock Exchange |
Securities registered pursuant to Section 12(g) of the Act:
None
Indicate by check mark if the registrant is a well-known seasoned issuer, as defined in Rule 405 of the Securities Act. Yes ☑ No ☐
Indicate by check mark if the registrant is not required to file reports pursuant to Section 13 or Section 15(d) of the Act. Yes ☐ No ☑
Indicate by check mark whether the registrant: (1) has filed all reports required to be filed by Section 13 or 15(d) of the Securities Exchange Act of 1934 during the preceding 12 months (or for such shorter period that the registrant was required to file such reports), and (2) has been subject to such filing requirements for the past 90 days. Yes ☑ No ☐
Indicate by check mark whether the registrant has submitted electronically every Interactive Data File required to be submitted pursuant to Rule 405 of Regulation S-T (§232.405 of this chapter) during the preceding 12 months (or for such shorter period that the registrant was required to submit such files). Yes ☑ No ☐
Indicate by check mark whether the registrant is a large accelerated filer, an accelerated filer, a non-accelerated filer, a smaller reporting company, or an emerging growth company. See the definitions of “large accelerated filer,” “accelerated filer,” “smaller reporting company,” and “emerging growth company” in Rule 12b-2 of the Exchange Act.
| | | | | | | | | | | | | | | | | | | | | | | | | | | | | | | | | | | | | | | | | |
| Large accelerated filer | ☑ | | Accelerated filer | ☐ | | Non-accelerated filer | ☐ | | Smaller reporting company | ☐ | | Emerging growth company | ☐ |
If an emerging growth company, indicate by check mark if the registrant has elected not to use the extended transition period for complying with any new or revised financial accounting standards provided pursuant to Section 13(a) of the Exchange Act. ☐
Indicate by check mark whether the registrant has filed a report on and attestation to its management’s assessment of the effectiveness of its internal control over financial reporting under Section 404(b) of the Sarbanes-Oxley Act (15 U.S.C. 7262(b)) by the registered public accounting firm that prepared or issued its audit report. ☑
If securities are registered pursuant to Section 12(b) of the Act, indicate by check mark whether the financial statements of the registrant included in the filing reflect the correction of an error to previously issued financial statements. ☐
Indicate by check mark whether any of those error corrections are restatements that required a recovery analysis of incentive-based compensation received by any of the registrant’s executive officers during the relevant recovery period pursuant to §240.10D-1(b). ☐
Indicate by check mark whether the registrant is a shell company (as defined in Rule 12b-2 of the Act). Yes ☐ No ☑
The aggregate market value of the voting and non-voting common equity held by non-affiliates computed by reference to the price at which the common equity was last sold as of the last business day of the registrant’s most recently completed second quarter was approximately $31,296,220,520.$38,305,701,487.
The number of shares outstanding of the registrant’s common stock outstanding at February 18, 202216, 2024 was 1,215,592,791.1,216,750,172.
DOCUMENTS INCORPORATED BY REFERENCE
Portions of the Registrant’s Definitive Proxy Statement for the Registrant’s Annual Meeting of Stockholders to be held on April 26, 2022,30, 2024, are incorporated into Part III, as specifically set forth in Part III.
THE WILLIAMS COMPANIES, INC.
FORM 10-K
TABLE OF CONTENTS
| | | | | | | | |
| | | Page |
| PART I |
| | |
| Item 1. | | |
| | |
| | |
| | |
| | |
| | |
| | |
| | |
| | |
| | |
| | |
| | |
| | |
| | |
| | |
| | |
| Item 1A. | | |
| Item 1B. | | |
| Item 1C. | | |
| Item 2. | | |
| Item 3. | | |
| Item 4. | | |
| | |
| | |
| PART II | |
| | |
| Item 5. | | |
| | |
| Item 7. | | |
| Item 7A. | | |
| Item 8. | | |
| | |
| | |
| | |
| | |
| | |
| | |
| | | | | | | | |
| | |
| PART II (continued) | |
| | |
| | |
| | |
| | |
| | |
| | |
| | |
| | |
| | |
| | |
| | |
| | |
| | |
| | |
| | |
| | |
| | |
| | |
| | |
| | |
| | |
| | |
| Item 9. | | |
| Item 9A. | | |
| Item 9B. | | |
| Item 9C. | | |
| | |
| PART III | |
| | |
| Item 10. | | |
| Item 11. | | |
| Item 12. | | |
| Item 13. | | |
| Item 14. | | |
| | |
| PART IV | |
| | |
| Item 15. | | |
| Item 16. | | |
DEFINITIONS
The following is a listing of certain abbreviations, acronyms, and other industry terminology that may be used throughout this Annual Report.
Measurements:
Barrel or Bbl: One barrel of petroleum products that equals 42 U.S. gallons
Mbbls/d: One thousand barrels per day
Bcf : One billion cubic feet of natural gas
Bcf/d: One billion cubic feet of natural gas per day
MMcf/d: One million cubic feet of natural gas per day
British Thermal Unit (Btu): A unit of energy needed to raise the temperature of one pound of water by one degree Fahrenheit
MMbtu: One million British thermal units
Tbtu: One trillion British thermal units
Dekatherms (Dth): A unit of energy equal to one million British thermal units
Mdth/d: One thousand dekatherms per day
MMdth: One million dekatherms or approximately one trillion British thermal units
MMdth/d: One million dekatherms per day
Consolidated Entities:
BRMH: Blue Racer Midstream Holdings, LLC(previously named Caiman Energy II, LLC) a former equity-method investment, which is a consolidated entity following our acquisition of a controlling interest in November 2020 and the remaining interest in September 2021, whose primary asset is a 50 percent interest in Blue Racer accounted for as an equity-method investment
Cardinal: Cardinal Gas Services, L.L.C.
Gulfstar One: Gulfstar One LLC
Northeast JV: Ohio Valley Midstream LLC
Northwest Pipeline: Northwest Pipeline LLC
Transco: Transcontinental Gas Pipe Line Company, LLC
UEOM: Utica East Ohio Midstream LLC
Partially Owned Entities: Entities in which we do not own a 100 percent ownership interest and which, as of December 31, 2021, we account for as equity-method investments, including principally the following:
Aux Sable: Aux Sable Liquid Products LP
Blue Racer: Blue Racer Midstream LLC
Constitution: Constitution Pipeline Company, LLC
Discovery: Discovery Producer Services LLC
Gulfstream: Gulfstream Natural Gas System, L.L.C.
Jackalope: Jackalope Gas Gathering Services, L.L.C., which was sold in April 2019
Laurel Mountain: Laurel Mountain Midstream, LLC
OPPL: Overland Pass Pipeline Company LLC
RMM: Rocky Mountain Midstream Holdings LLC
Targa Train 7: Targa Train 7 LLC
Government and Regulatory:
EPA: Environmental Protection Agency
Exchange Act, the: Securities and Exchange Act of 1934, as amended
FERC: Federal Energy Regulatory Commission
IRS: Internal Revenue Service
SEC: Securities and Exchange Commission
Securities Act, the: Securities Act of 1933, as amended
Other:
Note: References to numerical notes refer to our Notes to Consolidated Financial Statements.
EBITDA: Earnings before interest, taxes, depreciation, and amortization
Fractionation: The process by which a mixed stream of natural gas liquids is separated into constituent products, such as ethane, propane, and butane
GAAP: U.S. generally accepted accounting principles
LNG: Liquefied natural gas; natural gas which has been liquefied at cryogenic temperatures
MVC: Minimum volume commitments
NGLs: Natural gas liquids; natural gas liquids result from natural gas processing and crude oil refining and are used as petrochemical feedstocks, heating fuels, and gasoline additives, among other applications
NGL margins: NGL revenues less Btu replacement cost, plant fuel, transportation, and fractionation
Appalachia Midstream Investments: Our equity-method investments with an approximate average 66 percent interest in multiple gas gathering systems in the Marcellus Shale region.
DJ Basin Acquisitions:On November 30, 2023, we closed on the acquisition of 100 percent of Cureton Front Range, LLC (Cureton) (Cureton Acquisition) and also closed on the acquisition of the remaining 50 percent interest in Rocky Mountain Midstream Holdings LLC (RMM) (RMM Acquisition), both of which operate midstream assets in the Denver-Julesberg (DJ) Basin.
Gulf Coast Storage Acquisition: On January 3, 2024, we closed on the acquisition of 100 percent of both Hartree Cardinal Gas, LLC and Hartree Natural Gas Storage, LLC, which own natural gas storage facilities and pipelines in Louisiana and Mississippi.
Sequent Acquisition: The July 1, 2021, acquisition of 100 percent of Sequent Energy Management, L.P. and Sequent Energy Canada, Corp.
Trace Acquisition: The April 29, 2022, acquisition of 100 percent of Gemini Arklatex, LLC through which we acquired the Haynesville Shale region gas gathering and related assets.
NorTex Asset Purchase: The August 31, 2022, purchase of a group of assets in north Texas, primarily natural gas storage facilities and pipelines, from NorTex Midstream Holdings, LLC.
MountainWest Acquisition: The February 14, 2023, acquisition of 100 percent of MountainWest Pipelines Holding Company (MountainWest), which includes FERC-regulated interstate natural gas pipeline systems and natural gas storage capacity.
The statements in this Annual Report that are not historical information, including statements concerning plans and objectives of management for future operations, economic performance or related assumptions, are forward-looking statements. Forward-looking statements may be identified by various forms of words such as “anticipates,” “believes,” “seeks,” “could,” “may,” “should,” “continues,” “estimates,” “expects,” “forecasts,” “intends,” “might,” “goals,” “objectives,” “targets,” “planned,” “potential,” “projects,” “scheduled,” “will,” “assumes,” “guidance,” “outlook,” “in-service date,” or other similar expressions and other words and terms of similar meaning. Although we believe that our expectations regarding future events are based on reasonable assumptions, we can give no assurance that such expectations or assumptions will be achieved. Additional information regarding forward-looking statements and important factors that could cause actual results to differ materially from those in the forward-looking statements are described under Part I, Item 1A in this Annual Report.
PART I
Item 1. Business
In this report, Williams (which includes The Williams Companies, Inc. and, unless the context otherwise indicates, all of our subsidiaries) is at times referred to in the first person as “we,” “us,” or “our.” We also sometimes refer to Williams as the “Company.”
GENERAL
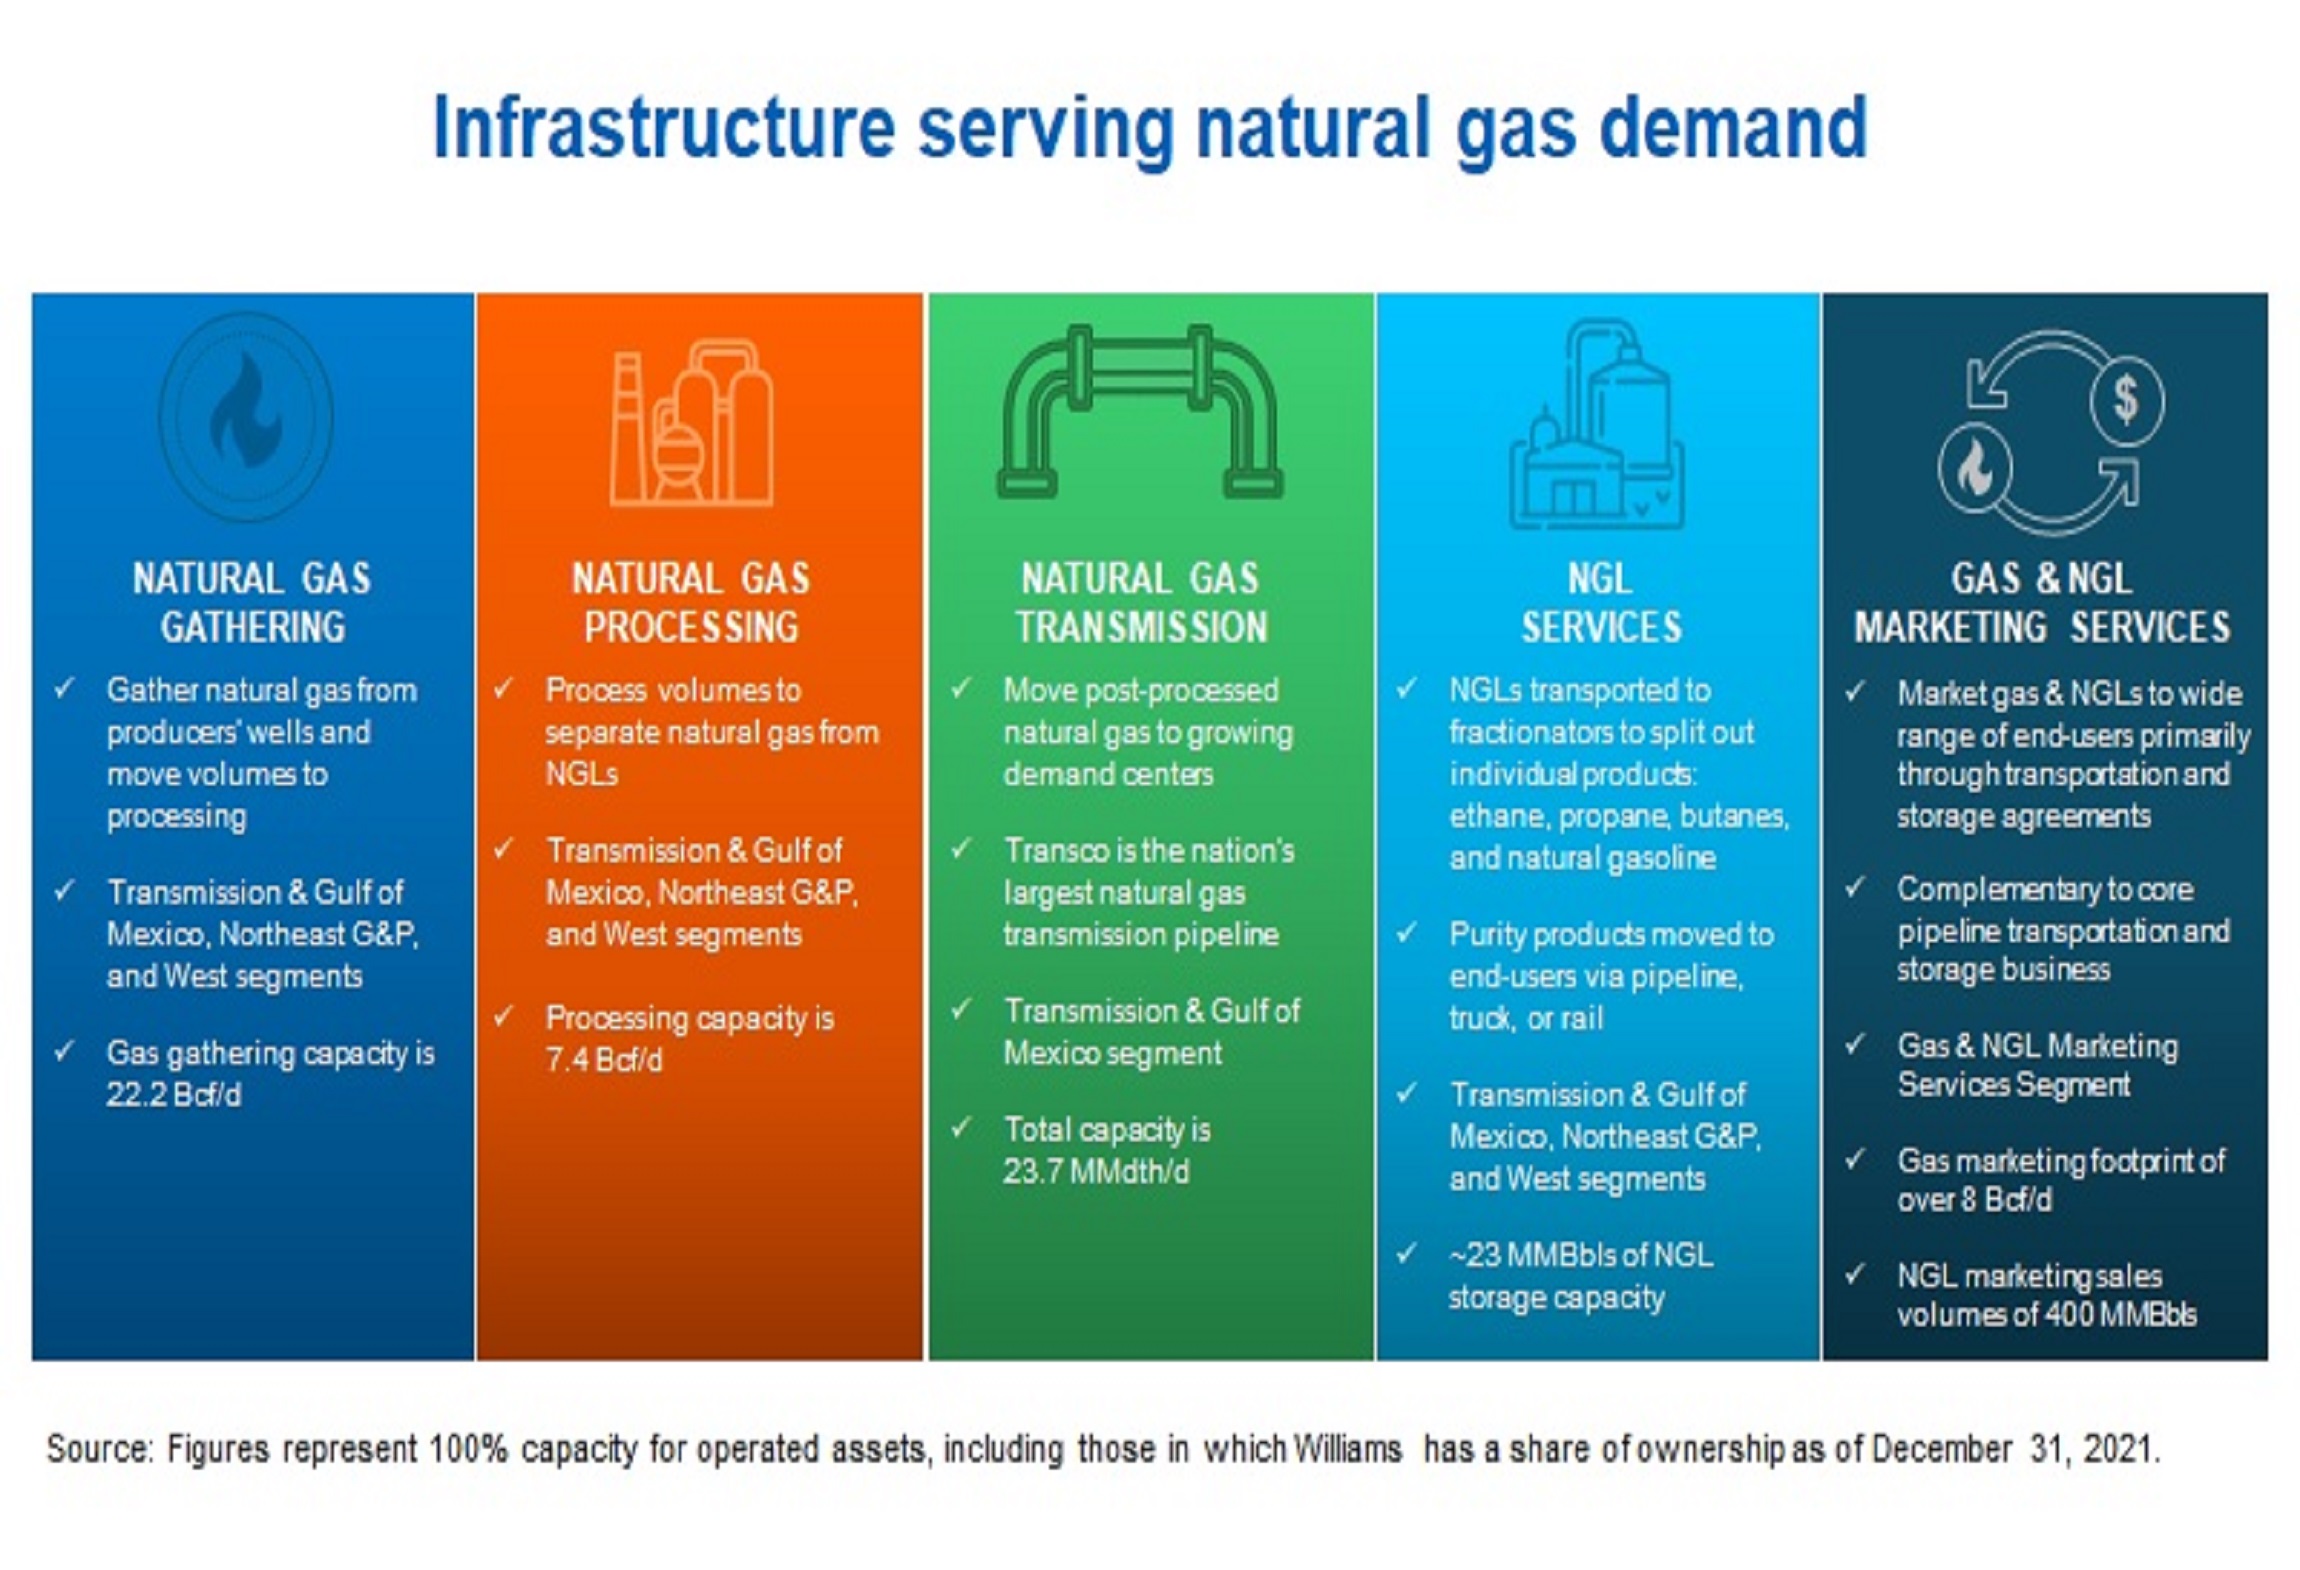
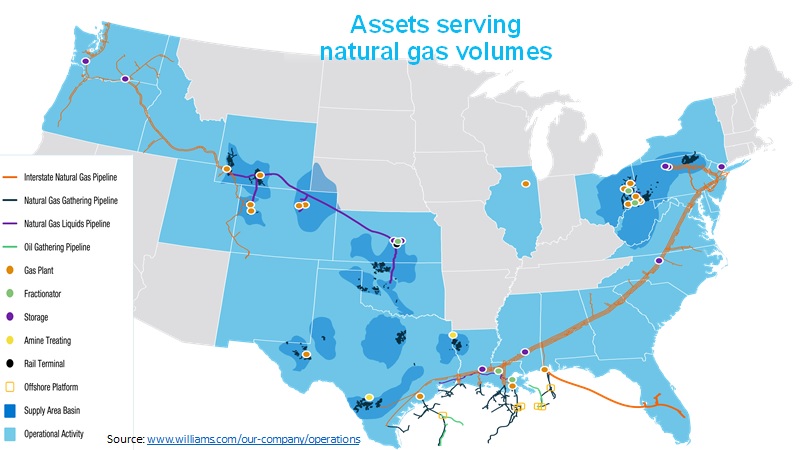
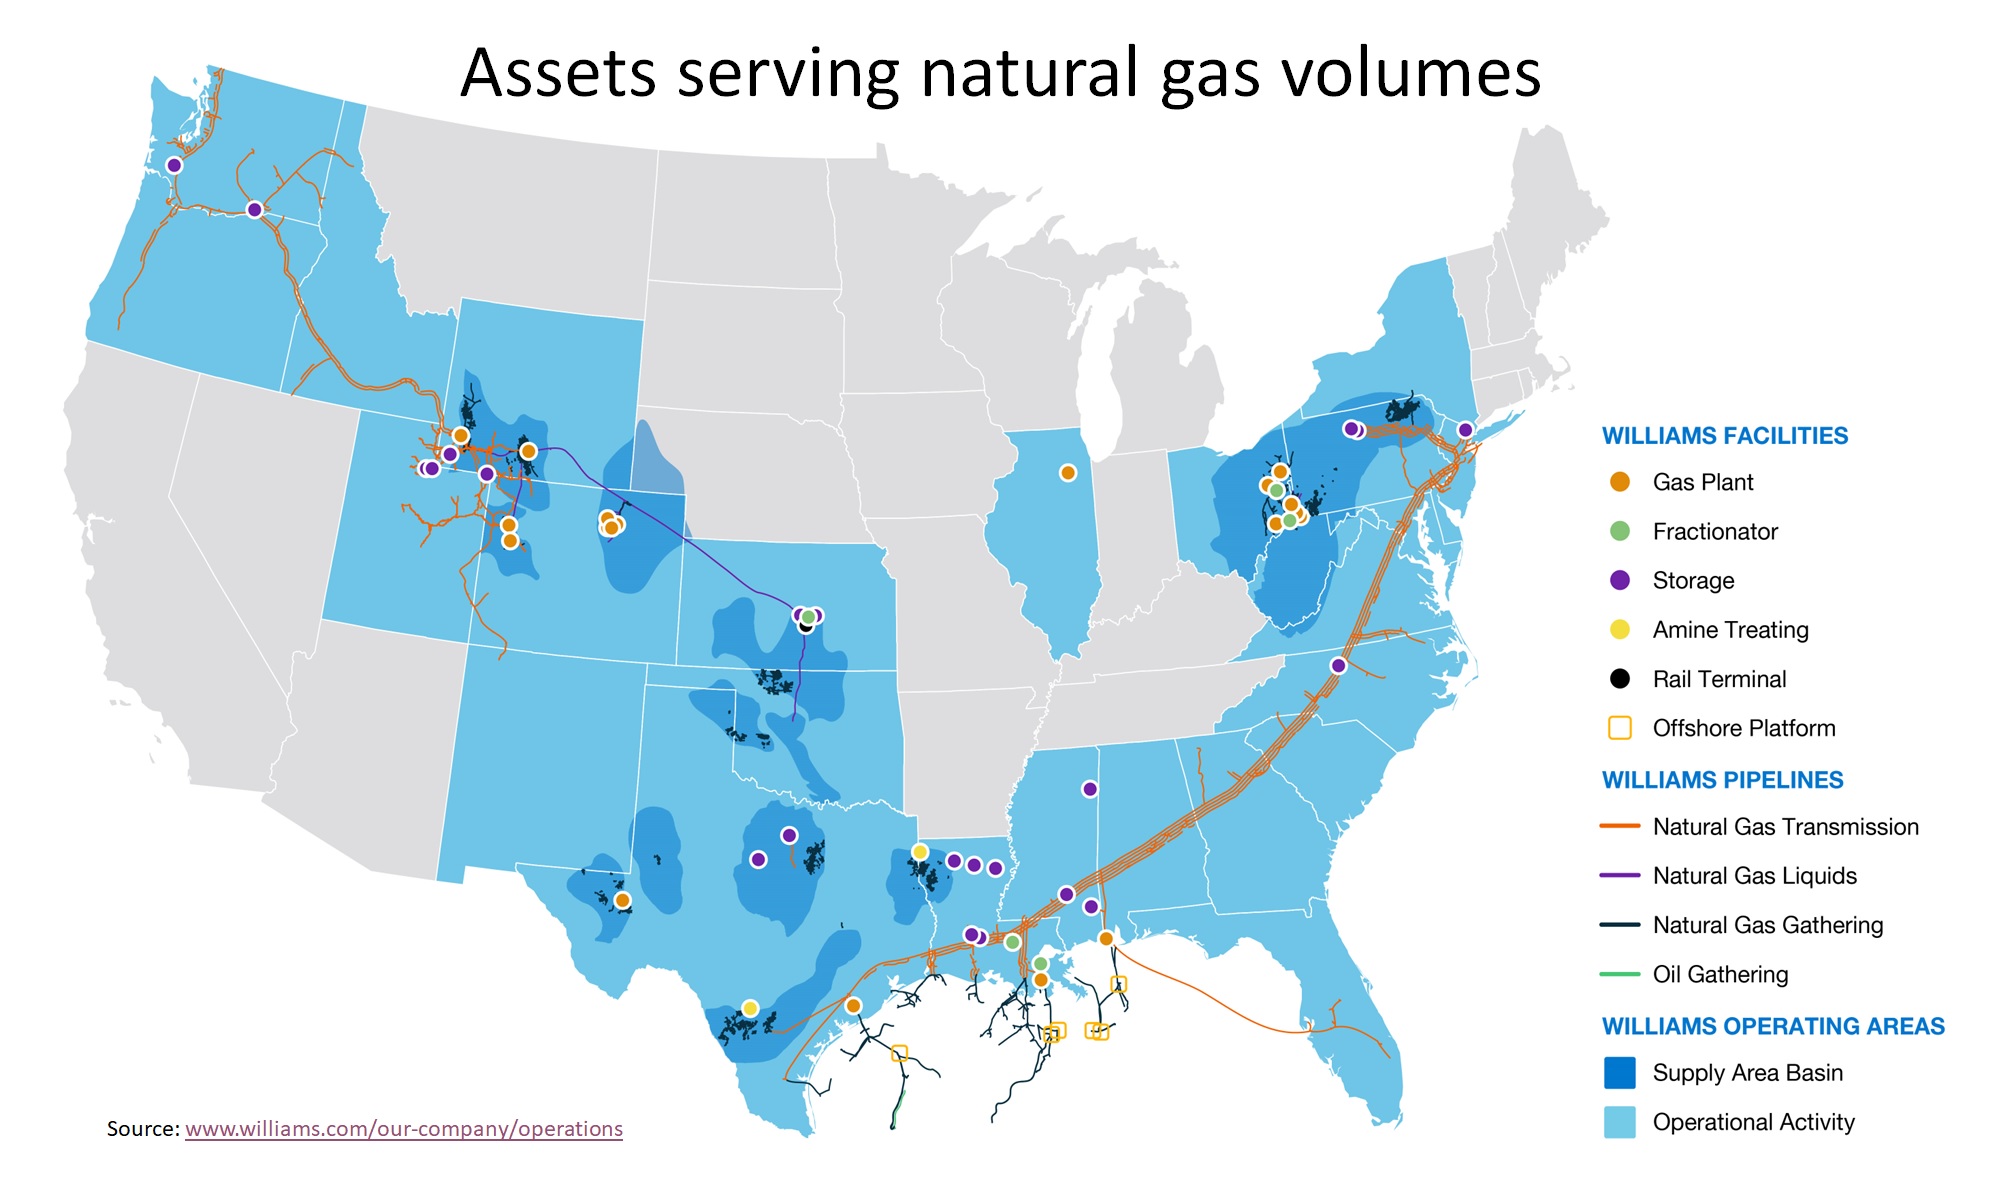
We are an energy company committed to being the leader in providing infrastructure that safely delivers natural gas products to reliably fuel the clean energy economy. We have operations in 1412 supply areas that provide natural gas gathering, processing, and transmission services, NGLs fractionation, transportation, and storage services, and marketing services to more than 600700 customers. We own an interest in and operate over 30,00033,000 miles of pipelines 29in 24 states, 35 natural gas processing facilities, 79 NGL fractionation facilities, and approximately 2325 million barrels of NGL storage capacity, and 405.4 Bcf of natural gas storage capacity, and deliver natural gas that is used every day for clean-power generation, heating, and industrial use.

We were founded in 1908, originally incorporated under the laws of the state of Nevada in 1949 and reincorporated under the laws of the state of Delaware in 1987. Our common stock trades on the New York Stock Exchange under the symbol “WMB.” Our operations are located in the United States. Williams’ headquarters are located in Tulsa, Oklahoma, with other major offices in Salt Lake City, Utah; Houston, Texas;Texas and Pittsburgh, Pennsylvania. Our telephone number is 918-573-2000.800-945-5426 (800-WILLIAMS).
Service Assets, Customers, and Contracts
Key variables for our businesses will continue to be:
•Obstacles to our expansion efforts, including delays or denials of necessary permits and opposition to hydrocarbon-based energy development;
•Producer drilling activities impacting natural gas supplies supporting our gathering and processing volumes;
•Retaining and attracting customers by continuing to provide reliable services;
•Revenue growth associated with additional infrastructure either completed or currently under construction;
•Prices impacting our commodity-based activities;
•Disciplined growth in our service areas.
Interstate Natural Gas Pipeline Assets
Our interstate natural gas pipelines, which are presented in our Transmission & Gulf of Mexico segment as described under the heading “Business Segments,” are subject to regulation by the FERC and as such, our rates and charges for the transportation of natural gas in interstate commerce are subject to regulation. The rates are established primarily through the FERC’s ratemaking process, but we also may negotiate rates with our customers pursuant to the terms of our tariffs and FERC policy.
Our interstate natural gas pipelines transport and store natural gas for a broad mix of customers, including local natural gas distribution companies, public utilities, municipalities, direct industrial users, electric power generators, and natural gas marketers and producers. OurMost of our interstate natural gas transmission businesses are fully
contracted under long-term firm reservation contracts with high credit quality customers. These contracts have various expiration dates and account for the major portion of our regulated businesses. Additionally, we offer storage
services and interruptible transportation services under shorter-term agreements. Transco’s and Northwest Pipeline’s three largestOur top ten customers of our interstate natural gas pipelines in 20212023 accounted for approximately 2647 percent of our regulated interstate natural gas transportation and 52 percent, respectively, of their total operatingstorage revenues.
Gathering, Processing, and Treating Assets
Our gathering, processing, and treating operations are presented within our Transmission & Gulf of Mexico, Northeast G&P, and West reporting segments as described under the heading “Business Segments.”
Our gathering systems receive natural gas from producers’ crude oil and natural gas wells and gather these volumes to gas processing, treating, or redelivery facilities. Typically, natural gas, in its raw form, is not acceptable for transportation in major interstate natural gas pipelines or for commercial use as a fuel. Our treating facilities remove water vapor, carbon dioxide, and other contaminants, and collect condensate. We are generally paid a fee based on the volume of natural gas gathered and/or treated, generally measured in the Btu heating value.
In addition, natural gas contains various amounts of NGLs, which generally have a higher value when separated from the natural gas stream. Our processing plants extract the NGLs, which include ethane, primarily used in the petrochemical industry; propane, used for heating, fuel, and also in the petrochemical industry; and, normal butane, isobutane, and natural gasoline, primarily used by the refining industry.
Our gas processing services generate revenues primarily from the following types of contracts:
•Fee-based: We are paid a fee based on the volume of natural gas processed, generally measured in the Btu heating value. A portion of our fee-based processing revenue includes a share of the margins on the NGLs produced. For the year ended December 31, 2021,2023, approximately 90 percent of our NGL production volumes were under fee-based contracts.
•Noncash commodity-based: We also process gas under two types of commodity-based contracts, keep-whole and percent-of-liquids, where we receive consideration for our services in the form of NGLs. For a keep-whole arrangement we replace the Btu content of the retained NGLs with natural gas purchases, also known as shrink replacement gas. For a percent-of-liquids arrangement, we deliver an agreed-upon percentage of the extracted NGLs and retain the remainder. Retained NGLs are referred to as our equity NGL production. Per-unit NGL margins are calculated based on sales of our own equity volumes at the processing plants. For the year ended December 31, 2021,2023, approximately 10 percent of our NGL production volumes were under noncash commodity-based contracts.
Generally, our gathering and processing agreements are long-term agreements, with terms ranging from month-to-month to the life of the producing lease. Certain contracts include cost of service mechanisms that are designed to support a return on invested capital and allow our gathering rates to be adjusted, subject to specified caps in certain cases, to account for variability in volume, capital expenditures, commodity price fluctuations, compression, and other expenses. We also have certain gas gathering and processing agreements with MVC, whereby the customer is obligated to pay a contractually determined fee based on any shortfall between the actual gathered and processed volumes and the MVC for a stated period.
Demand for gas gathering and processing services is dependent on producers’ drilling activities, which is impacted by the strength of the economy, commodity prices, and the resulting demand for natural gas by manufacturing and industrial companies and consumers. Our gathering, processing, and treating businesses do not have direct exposure to crude oil prices. Our on-shore natural gas gathering and processing businesses are substantially focused on gas-directed drilling basins rather than crude oil, with a broad diversity of basins and customers served. Declines in crude oil drilling would be expected to result in less associated natural gas production, which could drive more demand for natural gas produced from gas-directed basins we serve.
During 2021,2023, our facilities gathered and processed gas and crude oil for approximately 220230 customers. Our top ten customers accounted for approximately 7570 percent of our gathering and processing fee revenues and NGL
margins from our noncash commodity-based agreements. We believe counterparty credit concerns in our gathering
and processing businesses are significantly mitigated by the physical nature of our services, where we gather at the wellhead and are therefore critical to a producer’s ability to move product to market.
Gas and NGL Marketing
Prior to the organizational realignment described under the heading “Business Segments,” certain of our commodity marketing activities were presented within our West reporting segment, while those acquired in 2021 as part of our Sequent Acquisition, which includes the operations of Sequent Energy Management, L.P. and Sequent Energy Canada, Corp. acquired on July 1, 2021 (Sequent Acquisition), were reported within the Sequent segment. Beginning in January 2022, ourOur NGL and natural gas marketing services are now presented primarily within our Gas & NGL Marketing Services segment. We market natural gas and NGL products to a wide range of users in the energy and petrochemical industries. In 2021,2023, our three largest natural gas marketing customers accounted for approximately 1310 percent of our gross natural gas marketing sales, and our three largest NGL marketing customers accounted for approximately 4643 percent of our NGL marketing sales.
Our gas marketing business markets natural gas from the production at our upstream properties and provides natural gas asset management and the wholesale marketing, trading, storage, and transportation of natural gas for a diverse set of natural gas and electric utilities, municipalities, power generators, and producers, including for our own upstream properties. Additionally, our gas marketing business moves and movesoptimizes natural gas to markets through transportation and storage agreements on our own strategically positioned assets. Our pipeline agreements connect with multiple pipelines thatgas and NGL marketing services provide our customers with access to diverse sources of supply and to various natural gas markets. Thedemand markets, including the southeastern market served by our Gas & NGL Marketing Services segment isand gulf coast regions which are the fastest growing natural gas demand regionregions in the United States and expands our natural gas marketing activities, as well as optimizes our pipeline and storage capabilities with expansions into new markets.States.
We purchase natural gas for storage when the current market price paid to buy and transport natural gas plus the cost to store and finance the natural gas is less than an estimated, forward market price that can be received in the future, resulting in positive net product sales. Commodity-based exchange-traded futures contracts and over-the-counter (OTC) contracts are used to sell natural gas at that future price to substantially protect the natural gas revenues that will ultimately be realized when the stored natural gas is sold. Additionally, we enter into transactions to secure transportation capacity between delivery points in order to serve our customers and various markets. Commodity-based exchange-traded futures contracts and OTC contracts are used to capture the price differential or spread between the locations served by the capacity in order to substantially protect the natural gas revenues that will ultimately be realized when the physical flow of natural gas between receipt and delivery points occurs.
Monthly demand charges incurred for the contracted storage and transportation capacity and payments associated with asset management agreements are substantially indirectly reimbursed by our customers. As we are acting as an agent, our natural gas marketing revenues are presented net of the related costs of those activities. In addition, all of our Sequent’snatural gas marketing derivative activities qualify as held for trading purposes, which requires net presentation in theour Consolidated Statement of Income. Prior to the integration in 2022 of our historical gas marketing business with the acquired Sequent gas marketing business, natural gas marketing revenues and costs for our historical business were reported on a gross basis. Following the integration in 2022, the entire natural gas marketing portfolio is considered held for trading purposes, and the related revenues are therefore presented net of the related costs of those activities in 2022.
Our NGL marketing business transports and markets our equity NGLs from the production at our processing plants, NGLs from the production at our upstream properties, and also NGLs on behalf of third-party NGL producers, including some of our fee-based processing customers, as well as the NGL volumes owned by RMM and Discovery.certain of our equity-method investments. The NGL marketing business bears the risk of price changes in these NGL volumes while they are being transported to final sales delivery points. In order to meet sales contract obligations, we may purchase products in the spot market for resale.
We are exposed to commodity price risk. To manage this volatility, we use various contracts in our marketing and trading activities that generally meet the definition of derivatives. We enter into commodity-related derivatives to hedge exposures to natural gas and NGLs and retain exposure to price changes that can, in a volatile energy market, be material and can adversely affect our results of operations.
We experience significant earnings volatility from the fair value accounting required for the derivatives used to hedge a portion of the economic value of the underlying transportation and storage portfolio.portfolio as well as upstream related production. However, the unrealized fair value measurement gains and losses are generally offset by
valuation changes in the economic value of the underlying production or transportation and storage portfolio,contracts, which is not recognized until the underlying transportation and storage transaction occurs.
Crude Oil Transportation and Production Handling Assets
Our crude oil transportation operations, which are primarily presented in our Transmission & Gulf of Mexico segment as described under the heading “Business Segments,” earn revenues primarily from a combination of fixed-monthly fees, contractual fixed or variable fees applied to production volumes, and contributions in aid of construction (CIAC) arrangements. Generally, fixed-monthly fees associated with production handling and export revenues are recognized on a units-of-production basis utilizing either contractually determined maximum daily quantities or expected remaining production. CIAC arrangements are recognized based on a units of production basis, utilizing expected remaining production. Our crude oil transportation business is supported mostly by major oil producers with long-cycle perspectives.
Standalone, Market-Based Rate Natural Gas Storage Assets
Our standalone, market-based rate natural gas storage assets are presented in our Transmission & Gulf of Mexico segment as described under the heading “Business Segments” and include our NorTex assets acquired in August 2022 and our Gulf Coast storage assets acquired in January 2024. These natural gas storage assets provide natural gas storage services in interstate commerce under the jurisdiction of the FERC pursuant to the Natural Gas Act or Section 311 of the Natural Gas Policy Act. We are authorized to charge and collect market-based rates for all of the services that these natural gas storage assets provide.
We store natural gas for a broad mix of customers, including local natural gas distribution companies, public utilities, municipalities, direct industrial users, electric power generators, and natural gas marketers and producers. Most of these natural gas storage businesses are fully contracted under long-term firm reservation contracts with high credit quality customers. The contracts have various expiration dates and account for the major portion of the entities’ businesses. Additionally, we offer storage services and interruptible transportation services under shorter-term agreements. The three largest customers of this business in 2023 accounted for approximately 32 percent of its total operating revenues.
BUSINESS SEGMENTS
Consistent with the manner in which our chief operating decision maker evaluates performance and allocates resources, our operations are conducted, managed, and presented in Part I of this Annual Report within the following reportable segments: Transmission & Gulf of Mexico, Northeast G&P, West, and Gas & NGL Marketing Services. Effective January 1, 2022, following an organizational realignment,All remaining business activities, including our NGLupstream operations and natural gas marketing services, previously reported within the West and former Sequent segments,corporate activities, are now all managed within the Gas & NGL Marketing Services segment.included in Other.
Our reportable segments are comprised of the following business activities:
•Transmission & Gulf of Mexico is comprised of our interstate natural gas pipelines, TranscoTranscontinental Gas Pipe Line Company, LLC (Transco) , Northwest Pipeline LLC (Northwest Pipeline), and Northwest Pipeline,MountainWest Pipelines Holding Company (MountainWest), and their related natural gas storage facilities, as well as natural gas gathering and processing and crude oil production handling and transportation assets in the Gulf Coast region, including a 51 percent interest in Gulfstar One (a consolidated variable interest entity)LLC (Gulfstar One), which is a proprietary floating production system, a 50 percent equity-method investment in Gulfstream Natural Gas System, L.L.C. (Gulfstream), and a 60 percent equity-method investment in Discovery.Discovery Producer Services LLC (Discovery). Transmission & Gulf of Mexico also includes natural gas storage facilities and pipelines providing services in north Texas, Louisiana, and Mississippi.
•Northeast G&P is comprised of our midstream gathering, processing, and fractionation businesses in the Marcellus Shale region primarily in Pennsylvania and New York, and the Utica Shale region of eastern Ohio, as well as a 65 percent interest in our Northeast JV (a consolidated variable interest entity)Ohio Valley Midstream LLC (Northeast JV) which operates in West Virginia, Ohio, and Pennsylvania, a 66 percent interest in Cardinal (a consolidated variable interest entity)Gas Services, L.L.C. (Cardinal) which operates in Ohio, a 69 percent equity-method investment in Laurel Mountain Midstream, LLC (Laurel Mountain), a 50 percent equity-method investment in Blue Racer Midstream LLC (Blue Racer),
and Appalachia Midstream Investments, a wholly owned subsidiary that ownsour equity-method investments with an approximate average 66 percent interest in multiple gas gathering systems in the Marcellus Shale region.region (Appalachia Midstream Investments).
•West is comprised of our gas gathering, processing, and treating operations in the Rocky Mountain region of Colorado and Wyoming, the Barnett Shale region of north-central Texas, the Eagle Ford Shale region of south Texas, the Haynesville Shale region of east Texas and northwest Louisiana, and the Mid-Continent region which includes the Anadarko and Permian basins.basins, and the DJ Basin of Colorado which includes RMM, a former 50 percent equity-method investment in which we acquired the remaining ownership interest in November 2023. This segment also includes our NGL storage facilities, an undivided 50 percent interest in an NGL fractionator near Conway, Kansas, a 50 percent equity-method investment in OPPL, a 50 percent equity-method investment in RMM, andOverland Pass Pipeline Company LLC (OPPL), a 20 percent equity-method investment in Targa Train 7.7 LLC (Targa Train 7), and a 15 percent equity-method investment in Brazos Permian II, LLC (Brazos Permian II).
•Gas & NGL Marketing Services includesis comprised of our NGL and natural gas marketing services previously reported withinand trading operations, which includes risk management and transactions related to the West segment prior to January 1, 2022, as well as the operations acquiredstorage and transportation of natural gas and NGLs on July 1, 2021 through our Sequent Acquisition.
•Other includes our upstream operations and minor business activities that are not reportable segments, as well as corporate operations.strategically positioned assets.
Detailed discussion of each of our reportable segments follows. For a discussion of our ongoing expansion projects, see Part II, Item 7. Management’s Discussion and Analysis of Financial Condition and Results of Operations, which along with Item 8. Financial Statements and Supplementary Data, continues to present our segments as they were historically defined before the organizational realignment on January 1, 2022.Operations.
Transmission & Gulf of Mexico
This segment includes the Transco interstate natural gas pipeline that extends from the Gulf of Mexico to the eastern seaboard, the NorthwestInterstate Natural Gas Pipeline interstate natural gas pipeline, as well as natural gas gathering, processing and treating, crude oil production handling, and NGL fractionation assets within the onshore, offshore shelf, and deepwater areas in and around the Gulf Coast states of Texas, Louisiana, Mississippi, and Alabama. This segment also includes various petrochemical and feedstock pipelines in the Gulf Coast region.Assets
Transco
Transco is an interstate natural gas transmission company that owns and operates a 9,800-milean approximately 9,700-mile natural gas pipeline system, which is regulated by the FERC, extending from Texas, Louisiana, Mississippi, and the Gulf of Mexico through Alabama, Georgia, South Carolina, North Carolina, Virginia, Maryland, Delaware, Pennsylvania, and New Jersey to the New York City metropolitan area. The system serves customers in Texas and 12 southeast and Atlantic seaboard states, including major metropolitan areas in Georgia, North Carolina, Washington, D.C., Maryland, New York, New Jersey, and Pennsylvania.
At December 31, 2021,2023, Transco’s system had a system-wide deliverydesign capacity totaling approximately 18.619.1 MMdth/d. During 2021, Transco completed two fully-contracted expansions, which added more than 0.5 MMdth/d interim firm transportation capacity to the pipeline. In addition, we added more than 0.1 MMdth/d of interim firm transportation capacity to our pipeline which will continue until the Regional Energy Access expansion project is placed in service, please refer to Part II, Item 7 “Management’s Discussion and Analysis of Financial Condition and Results of Operations — Company Outlook.” Transco’s system includes 59 compressor stations, four underground storage fields, and one LNG storage facility. Compression facilities at sea level-rated capacity total approximately 2.42.5 million horsepower.
Transco has natural gas storage capacity in four underground storage fields located on or near its pipeline system or market areas and operates two of these storage fields. During 2023, Transco began partial early service on the Regional Energy Access expansion project, which added approximately 0.5 MMdth/d of firm transportation capacity to its pipeline. In addition, Transco added almost 0.1 MMdth/d of firm transportation capacity by converting certain interruptible transportation feeder capacity to firm transportation. Transco also has storage capacity in an LNG storage facility that it owns and operates. The total usable gas storage capacity available to Transco and its customers in such underground storage fields and LNG storage facility and through storage service contracts is approximately 194 MMdth188 Bcf of natural gas. At December 31, 2021,2023, Transco’s customers had stored in its facilities approximately 140 MMdth142 Bcf of natural gas. Storage capacity permits our customers to inject gas into storage during the summer and off-peak periods for delivery during peak winter demand periods.
Northwest Pipeline
Northwest Pipeline is an interstate natural gas transmission company that owns and operates aan approximately 3,900-mile natural gas pipeline system, which is regulated by the FERC, extending from the San Juan basin in northwestern New Mexico and southwestern Colorado through Colorado, Utah, Wyoming, Idaho, Oregon, and Washington to a point on the Canadian border near Sumas, Washington. Northwest Pipeline provides services for
markets in Washington, Oregon, Idaho, Wyoming, Nevada, Utah, Colorado, New Mexico, California, and Arizona, either directly or indirectly through interconnections with other pipelines.
At December 31, 2021,2023, Northwest Pipeline’s system had long-term firm transportation and storage redelivery agreements with aggregatea design capacity reservations oftotaling approximately 3.8 MMdth/d. Northwest Pipeline’s system includes 42 transmission compressor stations having a combined sea level-rated capacity of approximately 473,000476,000 horsepower.
Northwest Pipeline owns a one-third undivided interest in the Jackson Prairie underground storage facility in Washington and contracts with a third party for natural gas storage services in an underground storage reservoir in the Clay Basin field in Utah.Washington. Northwest Pipeline also owns and operates aan LNG storage facility in Washington. These storage facilities have an aggregate working natural gas storage capacity of 14.2 MMdth,approximately 10.4 Bcf, which is substantially utilized for third-party natural gas. These natural gas storage facilities enable Northwest Pipeline to balance daily receipts and deliveries and provide storage services to customers.
MountainWest Acquisition
On February 14, 2023, we closed on the acquisition of 100 percent of MountainWest Pipelines Holding Company. MountainWest is an interstate natural gas transmission company that owns and operates an approximately 2,000-mile natural gas pipeline system which is regulated by the FERC. The system is comprised of MountainWest Pipeline, LLC; MountainWest Overthrust Pipeline, LLC; a 50 percent equity-method interest in White River Hub, LLC; and 56 Bcf of natural gas storage capacity, including the Clay basin underground storage reservoir in Utah. MountainWest is located in the Rocky Mountains near six producing areas, including the Greater Green River basin in Wyoming, the Uinta basin in Utah, and the Piceance basin in Colorado. At December 31, 2023, MountainWest’s system has a design capacity totaling 8.0 MMdth/d.
Standalone Natural Gas Storage Assets
Gulf Coast Storage Acquisition
On January 3, 2024, we closed on the acquisition of a strategic portfolio of approximately 230 miles of natural gas transmission pipelines and six underground storage facilities with a capacity of approximately 115 Bcf of natural gas storage across Louisiana and Mississippi and direct access to LNG export facilities and interstate pipelines. These assets expand our natural gas storage footprint in the Gulf Coast region.
North Texas Assets (NorTex)
On August 31, 2022, we purchased a group of assets in north Texas from NorTex Midstream Holdings, LLC. The NorTex assets include approximately 80 miles of natural gas transmission pipelines and 36 Bcf of natural gas storage in the Dallas-Fort Worth market. In addition to providing gas supply to power generation in north Texas, these assets also provide storage services for Permian gas directed toward growing Gulf Coast LNG demand.
Gas Gathering, Transportation, Processing, and Treating Assets
The following tables summarize the significant operated assets of this segment:
| | Offshore Natural Gas Pipelines |
| | Inlet | |
| Pipeline | | Capacity | | Ownership | |
| Location | | Miles | | (Bcf/d) | | Interest | | Supply Basins |
| | | Offshore Natural Gas Pipelines | | | | Offshore Natural Gas Pipelines |
| | Location | | | | Location | | Pipeline Miles | | Inlet Capacity (Bcf/d) | | Ownership Interest | | Supply Basins |
| Consolidated: | Consolidated: | |
| Canyon Chief, including Blind Faith and Gulfstar extensions | |
| Canyon Chief, including Blind Faith and Gulfstar extensions | |
| Canyon Chief, including Blind Faith and Gulfstar extensions | Canyon Chief, including Blind Faith and Gulfstar extensions | | Deepwater Gulf of Mexico | | 156 | | 0.5 | | 100% | | Eastern Gulf of Mexico | | Deepwater Gulf of Mexico | | 156 | | 0.5 | | 100% | | Eastern Gulf of Mexico |
| Norphlet | Norphlet | | Deepwater Gulf of Mexico | | 58 | | 0.3 | | 100% | | Eastern Gulf of Mexico | Norphlet | | Deepwater Gulf of Mexico | | 58 | | 0.3 | | 100% | | Eastern Gulf of Mexico |
| Other Eastern Gulf | Other Eastern Gulf | | Offshore shelf and other | | 46 | | 0.2 | | 100% | | Eastern Gulf of Mexico | Other Eastern Gulf | | Offshore shelf and other | | 46 | | 0.2 | | 100% | | Eastern Gulf of Mexico |
| Seahawk | Seahawk | | Deepwater Gulf of Mexico | | 115 | | 0.4 | | 100% | | Western Gulf of Mexico | Seahawk | | Deepwater Gulf of Mexico | | 115 | | 0.4 | | 100% | | Western Gulf of Mexico |
| Perdido Norte | Perdido Norte | | Deepwater Gulf of Mexico | | 105 | | 0.3 | | 100% | | Western Gulf of Mexico | Perdido Norte | | Deepwater Gulf of Mexico | | 105 | | 0.3 | | 100% | | Western Gulf of Mexico |
| Other Western Gulf | Other Western Gulf | | Offshore shelf and other | | 65 | | 0.3 | | 100% | | Western Gulf of Mexico | Other Western Gulf | | Offshore shelf and other | | 65 | | 0.3 | | 100% | | Western Gulf of Mexico |
| Non-consolidated: (1) | Non-consolidated: (1) | |
| Discovery | Discovery | | Central Gulf of Mexico | | 594 | | 0.6 | | 60% | | Central Gulf of Mexico |
| | Discovery | |
| Discovery | | | Central Gulf of Mexico | | 594 | | 0.6 | | 60% | | Central Gulf of Mexico |
| | Natural Gas Processing Facilities |
| | NGL | |
| Inlet | | Production | |
| Capacity | | Capacity | | Ownership | |
| Location | | (Bcf/d) | | (Mbbls/d) | | Interest | | Supply Basins |
| | | Natural Gas Processing Facilities | | | | Natural Gas Processing Facilities |
| | Location | | | | Location | | Inlet Capacity (Bcf/d) | | NGL Production Capacity (Mbbls/d) | | Ownership Interest | | Supply Basins |
| Consolidated: | Consolidated: | |
| Markham | Markham | | Markham, TX | | 0.5 | | 45 | | 100% | | Western Gulf of Mexico |
| Markham | |
| Markham | | | Markham, TX | | 0.5 | | 45 | | 100% | | Western Gulf of Mexico |
| Mobile Bay | Mobile Bay | | Coden, AL | | 0.7 | | 35 | | 100% | | Eastern Gulf of Mexico | Mobile Bay | | Coden, AL | | 0.7 | | 35 | | 100% | | Eastern Gulf of Mexico |
| NorTex | | NorTex | | Jack Co., TX | | 0.1 | | 13 | | 100% | | Barnett Shale |
| Non-consolidated: (1) | Non-consolidated: (1) | |
| Discovery | Discovery | | Larose, LA | | 0.6 | | 32 | | 60% | | Central Gulf of Mexico |
| Discovery | |
| Discovery | | | Larose, LA | | 0.6 | | 35 | | 60% | | Central Gulf of Mexico |
_____________
(1)Includes 100 percent of the statistics associated with our operated equity-method investments.investment Discovery.
Crude Oil Transportation and Production Handling Assets
In addition to our natural gas assets, we own and operate four deepwater crude oil pipelines and own production platforms serving the deepwater in the Gulf of Mexico. Our offshore floating production platforms provide centralized services to deepwater producers such as compression, separation, production handling, water removal, and pipeline landings.
The following tables summarize the significant crude oil transportation pipelines and production handling platforms of this segment:
| | | | Crude Oil Pipelines |
| | | | Pipeline | | Capacity | | Ownership | |
| | | Miles | | (Mbbls/d) | | Interest | | Supply Basins |
| | | Crude Oil Pipelines | | | | Crude Oil Pipelines |
| | Pipeline Miles | | | | Pipeline Miles | | Capacity (Mbbls/d) | | Ownership Interest | | Supply Basins |
| Consolidated: | Consolidated: | |
| Mountaineer, including Blind Faith and Gulfstar extensions | |
| Mountaineer, including Blind Faith and Gulfstar extensions | |
| Mountaineer, including Blind Faith and Gulfstar extensions | |
| Mountaineer, including Blind Faith and Gulfstar extensions | |
| Mountaineer, including Blind Faith and Gulfstar extensions | |
| Mountaineer, including Blind Faith and Gulfstar extensions | |
| Mountaineer, including Blind Faith and Gulfstar extensions | |
| Mountaineer, including Blind Faith and Gulfstar extensions | |
| Mountaineer, including Blind Faith and Gulfstar extensions | |
| Mountaineer, including Blind Faith and Gulfstar extensions | |
| Mountaineer, including Blind Faith and Gulfstar extensions | |
| Mountaineer, including Blind Faith and Gulfstar extensions | Mountaineer, including Blind Faith and Gulfstar extensions | | 155 | | 150 | | 100% | | Eastern Gulf of Mexico | | 155 | | 150 | | 100% | | Eastern Gulf of Mexico |
| BANJO | BANJO | | 57 | | 90 | | 100% | | Western Gulf of Mexico | BANJO | | 57 | | 90 | | 100% | | Western Gulf of Mexico |
| Alpine | Alpine | | 96 | | 85 | | 100% | | Western Gulf of Mexico | Alpine | | 96 | | 85 | | 100% | | Western Gulf of Mexico |
| Perdido Norte | Perdido Norte | | 74 | | 150 | | 100% | | Western Gulf of Mexico | Perdido Norte | | 74 | | 150 | | 100% | | Western Gulf of Mexico |
| | |
| | | Production Handling Platforms |
| | Crude/NGL | |
| Gas Inlet | | Handling | |
| | | Capacity | | Capacity | | Ownership | |
| | | (MMcf/d) | | (Mbbls/d) | | Interest | | Supply Basins |
| | | Production Handling Platforms | | | | Production Handling Platforms |
| | Gas Inlet Capacity (MMcf/d) | | | | Gas Inlet Capacity (MMcf/d) | | Crude/NGL Handling Capacity (Mbbls/d) | | Ownership Interest | | Supply Basins |
| Consolidated: | Consolidated: | |
| Devils Tower | |
| Devils Tower | |
| Devils Tower | Devils Tower | | 110 | | 60 | | 100% | | Eastern Gulf of Mexico | | 110 | | 60 | | 100% | | Eastern Gulf of Mexico |
| Gulfstar I FPS (1) | Gulfstar I FPS (1) | | 172 | | 80 | | 51% | | Eastern Gulf of Mexico | Gulfstar I FPS (1) | | 172 | | 80 | | 51% | | Eastern Gulf of Mexico |
| | Non-consolidated: (2) | Non-consolidated: (2) | |
| Non-consolidated: (2) | |
| Non-consolidated: (2) | |
| Discovery | Discovery | | 75 | | 10 | | 60% | | Central Gulf of Mexico |
| Discovery | |
| Discovery | | | 75 | | 10 | | 60% | | Central Gulf of Mexico |
__________
(1)Statistics reflect 100 percent of the assets from our 51 percent interest in Gulfstar One.One floating production system (FPS).
(2)Includes 100 percent of the statistics associated with our operated equity-method investments.investment Discovery.
Transmission & Gulf of Mexico Operating Statistics
| | | | | | | | | | | | | | | | | |
| 2021 | | 2020 | | 2019 |
| (Annual Average Amounts) |
Consolidated: | | | | | |
| Interstate natural gas pipeline throughput (Tbtu/d) | 16.2 | | | 15.1 | | | 15.3 | |
| Gathering volumes (Bcf/d) | 0.28 | | | 0.25 | | | 0.25 | |
| Plant inlet natural gas volumes (Bcf/d) | 0.45 | | | 0.48 | | | 0.54 | |
| NGL production (Mbbls/d) | 29 | | | 29 | | | 32 | |
| NGL equity sales (Mbbls/d) | 6 | | | 5 | | | 7 | |
| Crude oil transportation (Mbbls/d) | 134 | | | 121 | | | 136 | |
| | | | | |
| Non-consolidated: (1) | | | | | |
| Interstate natural gas pipeline throughput (Tbtu/d) | 1.2 | | | 1.2 | | | 1.2 | |
| Gathering volumes (Bcf/d) | 0.35 | | | 0.30 | | | 0.36 | |
| Plant inlet natural gas volumes (Bcf/d) | 0.35 | | | 0.30 | | | 0.36 | |
| NGL production (Mbbls/d) | 27 | | | 21 | | | 25 | |
| NGL equity sales (Mbbls/d) | 8 | | | 6 | | | 6 | |
| | | | | |
_____________
(1)Includes 100 percent of the volumes associated with operated equity-method investments.
Certain Equity-Method Investments
Gulfstream
Gulfstream is a 745-mile interstate natural gas pipeline system extending from the Mobile Bay area in Alabama to markets in Florida, which has a capacity to transport 1.31.4 Bcf/d. We own through a subsidiary, a 50 percent equity-method investment in Gulfstream. We share operating responsibilities for Gulfstream with the other 50 percent owner.
Discovery
We operate and own a 60 percent interest in and operate the facilities of Discovery. Discovery’s assets include a 600 MMcf/d cryogenic natural gas processing plant near Larose, Louisiana, a 3235 Mbbls/d NGL fractionator plant near Paradis, Louisiana, and a 594-mile offshore natural gas gathering and transportation system in the Gulf of Mexico. Discovery’s mainline has a gathering inlet capacity of 600 MMcf/d. Discovery’s assets also include a crude oil production handling platform with capacity of 10 Mbbls/d and gas handling and separation capacity of 75 MMcf/d.
Transmission & Gulf of Mexico Operating Statistics
| | | | | | | | | | | | | | | | | |
| 2023 | | 2022 | | 2021 |
| (Annual Average Amounts) |
Consolidated: | | | | | |
| Interstate natural gas pipeline throughput (MMdth/d) (1) (2) | 20.4 | | | 16.9 | | | 16.2 | |
| Gathering volumes (Bcf/d) | 0.26 | | | 0.29 | | | 0.28 | |
| Plant inlet natural gas volumes (Bcf/d) | 0.44 | | | 0.47 | | | 0.45 | |
| NGL production (Mbbls/d) | 27 | | | 28 | | | 29 | |
| NGL equity sales (Mbbls/d) | 6 | | | 6 | | | 6 | |
| Crude oil transportation (Mbbls/d) | 123 | | | 119 | | | 134 | |
| | | | | |
| Non-consolidated: (3) | | | | | |
| Interstate natural gas pipeline throughput (MMdth/d) (1) | 1.2 | | | 1.3 | | | 1.2 | |
| Gathering volumes (Bcf/d) | 0.34 | | | 0.40 | | | 0.35 | |
| Plant inlet natural gas volumes (Bcf/d) | 0.34 | | | 0.40 | | | 0.35 | |
| NGL production (Mbbls/d) | 27 | | | 28 | | | 27 | |
| NGL equity sales (Mbbls/d) | 7 | | | 8 | | | 8 | |
| | | | | |
_____________
(1)Tbtu converted to MMdth at one trillion British thermal units = one million dekatherms.
(2)Includes volumes for natural gas transmission assets acquired in the MountainWest Acquisition after the purchase on February 14, 2023, including 100 percent of the volumes associate with the operated equity-method investment White River Hub, LLC. Further, the amounts for the acquired assets are averaged over the period owned, not over the entire year.
(3)Includes 100 percent of the volumes associated with our operated equity-method investments Gulfstream and Discovery.
Northeast G&P
Gas Gathering, Processing, and Treating Assets
This segment includes our natural gas gathering, compression, processing, and NGL fractionation businesses in the Marcellus and Utica Shale regions in Pennsylvania, West Virginia, New York, and Ohio.
The following tables summarize the significant operated assets of this segment:
| | | | Natural Gas Gathering Assets |
| | | Inlet | |
| | | | Pipeline | | Capacity | | Ownership | | | | Natural Gas Gathering Assets |
| | | | Location | | Miles | | (Bcf/d) | | Interest | | Supply Basins | | | Location | | Pipeline Miles | | Inlet Capacity (Bcf/d) | | Ownership Interest | | Supply Basins |
| Consolidated: | Consolidated: | | | | | | | | | | |
| Ohio Valley Midstream (1) | |
| Ohio Valley Midstream (1) | |
| Ohio Valley Midstream (1) | Ohio Valley Midstream (1) | | Ohio, West Virginia, & Pennsylvania | | 216 | | 0.8 | | 65% | | Appalachian | | Ohio, West Virginia, & Pennsylvania | | 216 | | 0.8 | | 65% | | Appalachian |
| Utica East Ohio Midstream (1) (2) | Utica East Ohio Midstream (1) (2) | | Ohio | | 53 | | 0.5 | | 65% | | Appalachian | Utica East Ohio Midstream (1) (2) | | Ohio | | 53 | | 0.6 | | 65% | | Appalachian |
| Susquehanna Supply Hub | Susquehanna Supply Hub | | Pennsylvania & New York | | 476 | | 4.3 | | 100% | | Appalachian | Susquehanna Supply Hub | | Pennsylvania & New York | | 504 | | 4.6 | | 100% | | Appalachian |
| Cardinal (1) | Cardinal (1) | | Ohio | | 383 | | 0.8 | | 66% | | Appalachian | Cardinal (1) | | Ohio | | 429 | | 0.7 | | 66% | | Appalachian |
| Flint | Flint | | Ohio | | 99 | | 0.5 | | 100% | | Appalachian | Flint | | Ohio | | 100 | | 0.5 | | 100% | | Appalachian |
| | Non-consolidated: (3) | Non-consolidated: (3) | |
| Non-consolidated: (3) | |
| Non-consolidated: (3) | |
| Bradford Supply Hub | |
| Bradford Supply Hub | |
| Bradford Supply Hub | Bradford Supply Hub | | Pennsylvania | | 750 | | 4.0 | | 66% | | Appalachian | | Pennsylvania | | 753 | | 4.4 | | 66% | | Appalachian |
| Marcellus South | Marcellus South | | Pennsylvania & West Virginia | | 290 | | 1.3 | | 68% | | Appalachian | Marcellus South | | Pennsylvania & West Virginia | | 296 | | 1.3 | | 68% | | Appalachian |
| Laurel Mountain | Laurel Mountain | | Pennsylvania | | 1,145 | | 0.9 | | 69% | | Appalachian | Laurel Mountain | | Pennsylvania | | 1,147 | | 0.9 | | 69% | | Appalachian |
| Blue Racer | | Blue Racer | | Ohio & West Virginia | | 616 | | 2.0 | | 50% | | Appalachian |
| | | | Natural Gas Processing Facilities |
| | NGL | |
| | Inlet | | Production | |
| | | | Capacity | | Capacity | | Ownership | | | | Natural Gas Processing Facilities |
| | | | Location | | (Bcf/d) | | (Mbbls/d) | | Interest | | Supply Basins | | | Location | | Inlet Capacity (Bcf/d) | | NGL Production Capacity (Mbbls/d) | | Ownership Interest | | Supply Basins |
| Consolidated: (1) | Consolidated: (1) | | | | | | | | | | |
| Fort Beeler | Fort Beeler | | Marshall Co., WV | | 0.5 | | 62 | | 65% | | Appalachian |
| Fort Beeler | |
| Fort Beeler | | | Marshall Co., WV | | 0.5 | | 62 | | 65% | | Appalachian |
| Oak Grove | Oak Grove | | Marshall Co., WV | | 0.6 | | 75 | | 65% | | Appalachian | Oak Grove | | Marshall Co., WV | | 0.6 | | 75 | | 65% | | Appalachian |
| Kensington | Kensington | | Columbiana Co., OH | | 0.6 | | 68 | | 65% | | Appalachian | Kensington | | Columbiana Co., OH | | 0.6 | | 68 | | 65% | | Appalachian |
| Leesville | Leesville | | Carroll Co., OH | | 0.2 | | 18 | | 65% | | Appalachian | Leesville | | Carroll Co., OH | | 0.2 | | 18 | | 65% | | Appalachian |
| | Non-consolidated: (3) | |
| Non-consolidated: (3) | |
| Non-consolidated: (3) | |
| Berne | |
| Berne | |
| Berne | | | Monroe Co., OH | | 0.4 | | 60 | | 50% | | Appalachian |
| Natrium | | Natrium | | Marshall Co., WV | | 0.8 | | 120 | | 50% | | Appalachian |
_____________
(1)Statistics reflect 100 percent of the assets from our 65 percent ownership in our Northeast JV and 66 percent ownership of Cardinal gathering system.
(2)UEOMUtica East Ohio Midstream inlet capacity consists of 1.3 Bcf/d of a high pressurehigh-pressure gathering pipeline that delivers Cardinal gathering volumes to UEOMUtica East Ohio Midstream processing facilities. The listed inlet capacity of 0.50.6 Bcf/d is incremental capacity to the Cardinal gathering capacity of 0.80.7 Bcf/d.
(3)Includes 100 percent of the statistics associated with operated equity-method investments.
Other NGL Operations
We own and operate a 43 Mbbls/d NGL fractionation facility at Moundsville, West Virginia, de-ethanization and condensate facilities at our Oak Grove processing plant, a condensate stabilization facility near our Moundsville fractionator, an ethane pipeline, and an NGL pipeline. Our Oak Grove de-ethanizer is capable of handling up to approximately 80 Mbbls/d of mixed NGLs to extract up to approximately 40 Mbbls/d of ethane. Our condensate stabilizers are capable of handling approximately 17 Mbbls/d of field condensate. We also own and operate 44 Mbbls/d of condensate stabilization capacity, a 135 Mbbls/d NGL fractionation facility, approximately 970,000 barrels of NGL storage capacity, and other ancillary assets, including loading and terminal facilities in Ohio.
NGLs are extracted from the natural gas stream in our Oak Grove and Fort Beeler cryogenic processing plants. Ethane produced at our de-ethanizer is transported to markets via our 50-mile ethane pipeline from Oak Grove to Houston, Pennsylvania. The remaining mixed NGL stream from the de-ethanizer is then transported via our 50-mile NGL pipeline and fractionated at either our Moundsville or Harrison County, Ohio, fractionation facility. The
resulting products are then transported on truck, rail, or rail.pipeline. Ohio Valley Midstream provides residue natural gas take away options for our customers with interconnections to three interstate transmission pipelines.
Northeast G&P Operating Statistics
| | | | | | | | | | | | | | | | | | | | |
| | 2021 | | 2020 | | 2019 |
| | (Annual Average Amounts) |
| Consolidated: | | | | | | |
| Gathering volumes (Bcf/d) | | 4.24 | | | 4.31 | | | 4.24 | |
| Plant inlet natural gas volumes (Bcf/d) | | 1.57 | | | 1.32 | | | 1.04 | |
| NGL production (Mbbls/d) (1) | | 115 | | | 103 | | | 76 | |
| NGL equity sales (Mbbls/d) | | 1 | | | 2 | | | 3 | |
| | | | | | |
| Non-consolidated: (2) | | | | | | |
| Gathering volumes (Bcf/d) | | 5.52 | | | 4.78 | | | 4.29 | |
| | | | | | |
| | | | | | |
| | | | | | |
__________
(1) 2020 amount has been updated to reflect revised NGL production.
(2) Includes 100 percent of the volumes associated with operated equity-method investments, including the Laurel Mountain Midstream partnership; and the Bradford Supply Hub and the Marcellus South Supply Hub within Appalachia Midstream Investments.
Acquisition of UEOM and formation of Northeast JV
As of December 31, 2018, we owned a 62 percent interest in UEOM which we accounted for as an equity-method investment. On March 18, 2019, we signed and closed the acquisition of the remaining 38 percent interest in UEOM. As a result of acquiring this additional interest, we obtained control of and consolidated UEOM. (See Note 3 – Acquisitions of Notes to Consolidated Financial Statements).
In June 2019, we contributed our consolidated interests in UEOM and our Ohio Valley midstream business to a newly formed partnership, and we retained 65 percent ownership of, as well as operate and consolidate, the Northeast JV business.
Certain Equity-Method Investments
Appalachia Midstream Investments
Through our Appalachia Midstream Investments, we operate 100 percent of and own an approximate average 66 percent interest in the Bradford Supply Hub gathering system and own an approximate average 68 percent interest in the Marcellus South gathering system, together which consist of approximately 1,0401,049 miles of gathering pipeline in the Marcellus Shale region with the capacity to gather 5,3305,700 MMcf/d of natural gas. The majority of our volumes in the region are gathered from northern Pennsylvania, southwestern Pennsylvania, and the northwestern
panhandle of West Virginia in core areas of the Marcellus Shale. We operate the assets primarily under long-term, 100 percent fixed-fee gathering agreements that include significant acreage dedications and, in the Bradford Supply Hub, a cost of service mechanism.dedications. Additionally, some Marcellus South agreements have MVCs.
Laurel Mountain
We operate and own a 69 percent interest in a joint venture, Laurel Mountain, thatwhich includes a 1,145-mile1,147-mile gathering system that we operate in western Pennsylvania with the capacity to gather 0.9 Bcf/d of natural gas. Laurel Mountain has a long-term, dedicated, volumetric-based fee agreement, with exposure to natural gas prices, to gather the anchor customer’s production in the western Pennsylvania area of the Marcellus Shale. Additionally, certain Laurel Mountain agreements have MVCs.
Blue Racer
We operate and own a 50 percent interest in Blue Racer which is operated by Blue Racer Midstream Holdings, LLC.Racer. Blue Racer is a joint venture to own, operate, develop, and acquire midstream assets in the Utica Shale and certain adjacent areas in the Marcellus Shale. Blue Racer’s assets include 723616 miles of gathering pipelines and the Natrium complex in Marshall County, West Virginia, with a cryogenic processing capacity of 800 MMcf/d and fractionation capacity of approximately 134 Mbbls/d. Blue Racer also owns the Berne complex in Monroe County, Ohio, with a cryogenic processing capacity of 400 MMcf/d, and 101 miles of NGL and condensate pipelines connecting Natrium to Berne. Blue Racer provides gathering, processing, and marketing services primarily under percent-of-liquids and fixed-fee agreements.
Northeast G&P Operating Statistics
| | | | | | | | | | | | | | | | | |
| 2023 | | 2022 | | 2021 |
| (Annual Average Amounts) |
| Consolidated: | | | | | |
| Gathering volumes (Bcf/d) | 4.45 | | | 4.19 | | | 4.24 | |
| Plant inlet natural gas volumes (Bcf/d) | 1.89 | | | 1.65 | | | 1.57 | |
| NGL production (Mbbls/d) | 139 | | | 120 | | | 115 | |
| NGL equity sales (Mbbls/d) | 1 | | | 1 | | | 1 | |
| | | | | |
| Non-consolidated: (1) | | | | | |
| Gathering volumes (Bcf/d) | 6.92 | | | 6.61 | | | 6.79 | |
| Plant inlet natural gas volumes (Bcf/d) | 0.93 | | | 0.71 | | | 0.82 | |
| NGL production (Mbbls/d) | 65 | | | 51 | | | 56 | |
| NGL equity sales (Mbbls/d) | 4 | | | 3 | | | 6 | |
__________
(1) Includes 100 percent of the volumes associated with operated equity-method investments, including Laurel Mountain and Blue Racer; as well as the Bradford Supply Hub and Marcellus South within Appalachia Midstream Investments.
West
Gas Gathering, Processing, and Treating Assets
The following tables summarize the significant operated assets of this segment:
| | | | Natural Gas Gathering Assets |
| | | | Location | | Pipeline Miles | | Inlet Capacity (Bcf/d) | | Ownership Interest | | Supply Basins/Shale Formations |
| | | Natural Gas Gathering Assets | | | | Natural Gas Gathering Assets |
| | Location | | | | Location | | Pipeline Miles | | Inlet Capacity (Bcf/d) | | Ownership Interest | | Supply Basins/Shale Formations |
| Consolidated: | Consolidated: | |
| Wamsutter | |
| Wamsutter | |
| Wamsutter | Wamsutter | | Wyoming | | 2,265 | | 0.7 | | 100% | | Wamsutter | | Wyoming | | 2,273 | | 0.7 | | 100% | | Wamsutter |
| Southwest Wyoming | Southwest Wyoming | | Wyoming | | 1,614 | | 0.5 | | 100% | | Southwest Wyoming | Southwest Wyoming | | Wyoming | | 1,614 | | 0.5 | | 100% | | Southwest Wyoming |
| Piceance | Piceance | | Colorado | | 352 | | 1.8 | | 100% | | Piceance | Piceance | | Colorado | | 352 | | 1.8 | | 100% | | Piceance |
| Barnett Shale | Barnett Shale | | Texas | | 840 | | 0.5 | | 100% | | Barnett Shale | Barnett Shale | | Texas | | 815 | | 0.5 | | 100% | | Barnett Shale |
| Eagle Ford Shale | Eagle Ford Shale | | Texas | | 1,247 | | 0.5 | | 100% | | Eagle Ford Shale | Eagle Ford Shale | | Texas | | 1,258 | | 0.5 | | 100% | | Eagle Ford Shale |
| Haynesville Shale | Haynesville Shale | | Louisiana | | 648 | | 1.8 | | 100% | | Haynesville Shale | Haynesville Shale | | Louisiana & Texas | | 987 | | 5.2 | | 100% | | Haynesville Shale, Bossier Shale |
| Permian | Permian | | Texas | | 112 | | 0.1 | | 100% | | Permian | Permian | | Texas | | 113 | | 0.1 | | 100% | | Permian |
| Mid-Continent | Mid-Continent | | Oklahoma & Texas | | 1,805 | | 0.3 | | 100% | | Miss-Lime, Granite Wash, Colony Wash | Mid-Continent | | Oklahoma & Texas | | 1,697 | | 0.2 | | 100% | | Miss-Lime, Granite Wash, Colony Wash |
| DJ Basin | | DJ Basin | | Colorado | | 472 | | 0.8 | | 100% | | Denver-Julesburg |
| | Non-consolidated: (1) | |
| Rocky Mountain Midstream | | Colorado | | 208 | | 0.6 | | 50% | | Denver-Julesburg |
|
| | | | | | | | | | | | | | | | | | | | | | | | | | | | | | | | |
| | Natural Gas Processing Facilities |
| | Location | | Inlet Capacity (Bcf/d) | | NGL Production Capacity (Mbbls/d) | | Ownership Interest | | Supply Basins |
| Consolidated: | | | | | | | | | | |
| Echo Springs | | Echo Springs, WY | | 0.6 | | 48 | | 100% | | Wamsutter |
| Opal | | Opal, WY | | 0.7 | | 39 | | 100% | | Southwest Wyoming |
| Willow Creek | | Rio Blanco Co., CO | | 0.5 | | 30 | | 100% | | Piceance |
| Parachute | | Garfield Co., CO | | 1.0 | | 5 | | 100% | | Piceance |
| Fort Lupton (1) | | Weld Co., CO | | 0.3 | | 50 | | 100% | | Denver-Julesburg |
| Keenesburg I (1) | | Weld Co., CO | | 0.2 | | 40 | | 100% | | Denver-Julesburg |
| Front Range (2) | | Weld Co., CO | | 0.1 | | 12 | | 100% | | Denver-Julesburg |
| | | | | | | | | | |
| | | | | | | | | | |
| | | | | | | | | | |
| | | | | | | | | | |
_______________
(1)Fort Lupton and Keenesburg I are a part of RMM which became a wholly owned subsidiary during 2023.
(2)Purchased as a part of the DJ Basin Acquisitions on November 30, 2023.
DJ Basin Acquisitions
On November 30, 2023, we closed on the acquisition of 100 percent of Cureton Front Range, LLC and the acquisition of the remaining 50 percent interest in Rocky Mountain Midstream Holdings LLC, both of which operate midstream assets in Colorado’s DJ Basin. The Cureton Acquisition includes gas gathering pipelines and two processing plants, one of which is currently idled. The RMM Acquisition was the purchase of our partner’s 50 percent interest, resulting in 100 percent ownership by us. RMM includes a natural gas gathering pipeline, an approximate 100-mile crude oil transportation pipeline, and natural gas processing assets in the DJ Basin. It also includes crude oil storage and compression assets.
Trace Acquisition
On April 29, 2022, we closed on the acquisition of 100 percent of Gemini Arklatex, LLC through which we acquired the Haynesville Shale region gas gathering and related assets of Trace Midstream. The purpose of this
| | | | | | | | | | | | | | | | | | | | | | | | | | | | | | | | | | | |
| | | Natural Gas Processing Facilities |
| | | | | | | | | | | |
| | | | | | | NGL | | | | |
| | | | | Inlet | | Production | | | | |
| | | | | Capacity | | Capacity | | Ownership | | |
| | | Location | | (Bcf/d) | | (Mbbls/d) | | Interest | | Supply Basins |
| | | | | | | | | | | |
| Consolidated: | | | | | | | | | | |
| Echo Springs | | Echo Springs, WY | | 0.7 | | 58 | | 100% | | Wamsutter |
| Opal | | Opal, WY | | 1.1 | | 47 | | 100% | | Southwest Wyoming |
| Willow Creek | | Rio Blanco Co., CO | | 0.5 | | 30 | | 100% | | Piceance |
| Parachute | | Garfield Co., CO | | 1.0 | | 5 | | 100% | | Piceance |
| | | | | | | | | | |
| | | | | | | | | | |
| | | | | | | | | | | |
| Non-consolidated: (1) | | | | | | | | | | |
| Fort Lupton | | Colorado | | 0.3 | | 50 | | 50% | | Denver-Julesburg |
| Keenesburg I | | Colorado | | 0.2 | | 40 | | 50% | | Denver-Julesburg |
_______________
(1)Includes 100 percentacquisition was to expand our footprint into the east Texas area of the statistics associated with operated equity-method investments.Haynesville Shale region, increasing in-basin scale.
Other NGL Operations
We own interests in and/or operate NGL fractionation and storage assets in central Kansas near Conway. These assets include a 50 percent interest in an NGL fractionation facility with capacity of slightly more than 100 Mbbls/d and we own approximately 2023 million barrels of NGL storage capacity. We also own a 189-mile NGL pipeline from our fractionator near Conway, Kansas, to an interconnection with a third-party NGL pipeline system in Oklahoma.
West Operating Statistics
| | | | | | | | | | | | | | | | | | | | |
| | 2021 | | 2020 | | 2019 |
| | (Annual Average Amounts) |
| Consolidated: | | | | | | |
| Gathering volumes (Bcf/d) | | 3.25 | | | 3.33 | | | 3.52 | |
| Plant inlet natural gas volumes (Bcf/d) | | 1.23 | | | 1.25 | | | 1.48 | |
| NGL production (Mbbls/d) | | 41 | | | 49 | | | 54 | |
| NGL equity sales (Mbbls/d) | | 16 | | | 22 | | | 22 | |
| Non-Consolidated: (1) | | | | | | |
| Gathering volumes (Bcf/d) | | 0.29 | | | 0.25 | | | 0.20 | |
| Plant inlet natural gas volumes (Bcf/d) | | 0.28 | | | 0.25 | | | 0.20 | |
| NGL production (Mbbls/d) | | 29 | | | 23 | | | 12 | |
________________
(1) Includes 100 percent of the volumes associated with operated equity-method investments, including RMM and Jackalope. Jackalope was sold effective second-quarter 2019.
Certain Equity-Method Investments
Overland Pass Pipeline
We operate and own a 50 percent interest in OPPL. OPPL is capable of transporting 255 Mbbls/d of NGLs and includes approximately 1,035 miles of NGL pipeline extending from Opal, Wyoming, to the Mid-Continent NGL market center near Conway, Kansas, along with extensions into the Piceance and Denver-JulesbergDJ basins in Colorado and the Bakken Shale in the Williston basin in North Dakota. Our equity NGL volumes from our Wyoming plants and our Willow Creek facility in Colorado are dedicated for transport on OPPL under a long-term transportation agreement. NGL volumes from our RMM equity-method investment are also transported on OPPL.
Rocky Mountain MidstreamBrazos Permian II
We operate and own a 5015 percent interest in RMM. RMM includesBrazos Permian II, a natural gas gathering pipeline, an approximate 90-mile crude oil transportation pipeline, and natural gas processing assets in Colorado’s Denver-Julesburg basin. It also includes crude oil storage and compression assets.privately held Permian basin midstream company.
Targa Train 7
We own a 20 percent interest in Targa Train 7, a Mt. Belvieu, Texas, fractionation train, which was placed into servicetrain.
West Operating Statistics
| | | | | | | | | | | | | | | | | |
| 2023 | | 2022 | | 2021 |
| (Annual Average Amounts) |
| Consolidated: | | | | | |
| Gathering volumes (Bcf/d) (1) | 6.02 | | | 5.19 | | | 3.25 | |
| Plant inlet natural gas volumes (Bcf/d) | 1.54 | | | 1.15 | | | 1.23 | |
| NGL production (Mbbls/d) | 91 | | | 43 | | | 41 | |
| NGL equity sales (Mbbls/d) | 14 | | | 14 | | | 16 | |
| Non-Consolidated: (2) | | | | | |
| Gathering volumes (Bcf/d) | — | | | 0.29 | | | 0.29 | |
| Plant inlet natural gas volumes (Bcf/d) | — | | | 0.28 | | | 0.28 | |
| NGL production (Mbbls/d) | — | | | 33 | | | 29 | |
________________
(1) Includes volumes for gathering assets acquired in the first quarterTrace Acquisition after the purchase on April 29, 2022 as well as volumes for gathering assets acquired in the DJ Basin Acquisitions after the purchase on November 30, 2023. Further, the amounts for the acquired assets are averaged over the period owned, not over the entire year.
(2) Includes 100 percent of 2020.the volumes associated with operated equity-method investment RMM prior to acquisition of the remaining 50 percent interest on November 30, 2023.
Gas & NGL Marketing Services
On July 1, 2021, we completed the Sequent Acquisition which is part of our new Gas & NGL Marketing Services business segment. Our natural gas marketing business provides asset management and the wholesale marketing, trading, storage, and transportation of natural gas for a diverse set of natural gas and electric utilities, municipalities, power generators, and producers and markets natural gas from the production at our upstream properties. The Sequent Acquisition in July 2021 significantly increased the scope of our natural gas marketing operations. Our NGL marketing business transports and markets our equity NGLs from the production at our processing plants, NGLs
from the production at our upstream properties, and also NGLs on behalf of third-party NGL producers, including some of our fee-based processing customers. See the Gas and NGL Marketing section of Service Assets, Customers, and Contracts in Item 1. Business for additional information related to this business segment.
Gas & NGL Marketing Services Operating Statistics
| | 2021 | | 2020 | | 2019 |
| | 2023 | | | 2023 | | 2022 | | 2021 |
| (Annual Average Amounts) | | | (Annual Average Amounts) |
| Sales Volumes: | Sales Volumes: | |
| Natural Gas (Bcf/d) (1) | Natural Gas (Bcf/d) (1) | | 8.09 | | | 0.62 | | | 0.42 | |
| Natural Gas (Bcf/d) (1) | |
| Natural Gas (Bcf/d) (1) | |
| NGLs (Mbbls/d) | NGLs (Mbbls/d) | | 400 | | | 386 | | | 398 | |
|
________________
(1) AverageIncludes 100% of the volumes associated with the Sequent Acquisition after the purchase on July 1, 2021. Further, the amounts for the acquired assets presented for 2021 are averaged over the period we owned, not over the operations.entire year.
Other
Other includes our upstream operations and minor business activities that are not reportable segments, as well as corporate operations.
Upstream Ventures
We acquired certain crude oil and natural gas properties in the Wamsutter basin in February 2021. These properties were conveyed to a venture in the third quarter of 2021 along with certain oil and gas properties conveyed by a third-party operator in the region. Under the terms of the agreement, the third party owns a 25 percent and we own a 75 percent undivided interest in each well’s working interest. We will retain ownership in the undeveloped acreage until certain acreage earning hurdles are met, at which time the third party will receive an additional 25 percent of any new wells and 50 percent of the remaining undeveloped acreage resulting in the third party owning 50 percent and us owning 50 percent. The combined properties consist of over 1.2 million net acres and an interest in over 3,500 wells.
Certain natural gas properties in Louisiana were transferred to us in November 2020 as part of a bankruptcy resolution with one of our customers. In the third quarter of 2021, we sold 50 percent of the existing wells and wellbore rights in the South Mansfield area of the Haynesville Shale region to a third party operator, in a strategic effort to develop the acreage, thereby enhancing the value of our midstream natural gas infrastructure. Under the agreement, the third party operates the upstream position and develops the undeveloped acreage. The third party’s interest in new wells increased to 75 percent in early 2023 when a certain drilling hurdle was met. We retained ownership in the undeveloped acreage until a separate acreage earning hurdle was met in the fourth quarter of 2023, at which time remaining undeveloped acreage was conveyed to the third party resulting in the third party owning 75 percent and us owning 25 percent.
Operating Statistics
| | | | | | | | | | | | | | | | | |
| 2023 | | 2022 | | 2021 |
| (Annual Average Amounts) |
| Net Product Sales Volumes: | | | | | |
| Natural Gas (Bcf/d) | 0.29 | | | 0.22 | | | 0.13 | |
| NGLs (Mbbls/d) | 7 | | | 7 | | | 6 | |
| Crude Oil (Mbbls/d) | 4 | | | 2 | | | 2 | |
New Energy Ventures
Our Other segment also includes investments in new energy ventures related to hydrogen, solar, renewable natural gas, and NextGen Gas. NextGen Gas is natural gas that has been independently certified as low emissions gas across all segments of the value chain.
REGULATORY MATTERS
FERC
Our gas pipeline interstate transmission and storage activities are subject to FERC regulation under the Natural Gas Act of 1938 (NGA) and under the Natural Gas Policy Act of 1978, and, as such, our rates and charges for the transportation of natural gas in interstate commerce, accounting, and the extension, enlargement, or abandonment of our jurisdictional facilities, among other things, are subject to regulation. Each of our gas pipeline companies holds certificates of public convenience and necessity issued by the FERC authorizing ownership and operation of all pipelines, facilities, and properties for which certificates are required under the NGA. FERC Standards of Conduct govern how our interstate pipelines communicate and do businessconduct transmission transactions with gasan affiliate that engages in marketing employees.functions. Among other things, the Standards of Conduct require that interstate gas pipelines treat all transmission customers, affiliated and non-affiliated, on a not operate their systems to preferentially benefit gas marketing functions.unduly discriminatory basis.
FERC regulation requires all terms and conditions of service, including the rates charged, to be filed with and approved by the FERC before any changes can go into effect. Our interstate gas pipeline companies establish rates through the FERC’s ratemaking process. In addition, our interstate gas pipelines may enter into negotiated rate agreements where cost-based recourse rates are made available. Key determinants in the FERC ratemaking process include:
•Costs of providing service, including depreciation expense;
•Allowed rate of return, including the equity component of the capital structure and related income taxes;
•Contract and volume throughput assumptions.
The allowed rate of return is determined in each rate case. Rate design and the allocation of costs between the reservation and commodity rates also impact profitability. As a result of these proceedings, certain revenues previously collected may be subject to refund.
We also own interests in and operate natural gas liquids pipelines that are regulated by various federal and state governmental agencies. Services provided on our interstate natural gas liquids pipelines are subject to regulation under the Interstate Commerce Act by the FERC, which has authority over the terms and conditions of service; rates, including depreciation and amortization policies; and initiation of service. Our intrastate natural gas liquids pipelines providing common carrier service are subject to regulation by various state regulatory agencies.
FERC UpdatesUpdated Certificate Policy Statement and Issues Interim Greenhouse Gas (GHG) Policy Statement
On February 18, 2022, the FERC issued two policy statements providing guidance for its pending and future consideration of interstate natural gas pipeline projects. The first policy statement is an Updated Certificate Policy Statement, which FERC will apply in pending and future certificate proceedings. This policy statement provides an analytical framework for how the FERC will consider whether a project is in the public convenience and necessity and explains that the FERC will consider all impacts of a proposed project, including economic and environmental impacts, together. The second policy statement is an Interim GHG Policy Statement, which sets forth how the FERC will assess the impacts of natural gas infrastructure projects on climate change in its reviews under the National Environmental Policy Act and the NGA. The FERC also seekssought comment on all aspects of the interim policy statement,statements, including the approach to assessing the significance of the proposed project’s contribution to climate change. WhileOn March 24, 2022, the guidance is subject to revision based onFERC issued an order converting the comments received, FERCUpdated Certificate Policy Statement and the Interim GHG Policy Statement into draft policy statements and announcing that it will begin applying the framework established in thisnot apply either policy statement to pending cases.applications or applications filed before the FERC issues any final guidance on the policy statements. The FERC has not yet issued final guidance on the policy statements.
Pipeline Safety
Our gas pipelines are subject to the Natural Gas Pipeline Safety Act of 1968, as amended, the Pipeline Safety Improvement Act of 2002, the Pipeline Safety, Regulatory Certainty, and Jobs Creation Act of 2011, (Pipeline Safety Act), and the Protecting Our Infrastructure of Pipelines and Enhancing Safety Act (PIPES Act) of 2016 and 2020, which regulate safety requirements in the design, construction, operation, and maintenance of interstate natural gas transmission facilities.
The United States Department of Transportation Pipeline and Hazardous Materials Safety Administration (PHMSA) administers federal pipeline safety laws.
Federal pipeline safety laws authorize PHMSA to establish minimum safety standards for pipeline facilities and persons engaged in the transportation of gas or hazardous liquids by pipeline. These safety standards apply to the design, construction, testing, operation, and maintenance of gas and hazardous liquids pipeline facilities affecting interstate or foreign commerce. PHMSA has also established reporting requirements for operators of gas and hazardous liquid pipeline facilities, as well as provisions for establishing the qualification of pipeline personnel and requirements for managing the integrity of gas transmission and distribution lines and certain hazardous liquid pipelines. To ensure compliance with these provisions, PHMSA performs pipeline safety inspections and has the authority to initiate enforcement actions.
In October 2019,August 2022, PHMSA published Rule 2, which is the last in the three part Mega Rule set of regulations. Rule 2 went into effect in May 2023, but a final rulemaking imposingStay of Enforcement until February 2024 limited the amount of the regulation that was implemented. Rule 2 contains new or more stringentcorrosion control requirements, new requirements for certain natural gas pipelines including, expanding certainrepair criteria outside of PHMSA’s current regulatory safety programs for natural gas lines in high-population areas (also known as moderatehigh consequence areas (MCAs)) that do not qualify as high-consequence areas (HCAs) and requiring maximum allowable operating pressure (MAOP) validation through re-verification of all historical records for pipelines in service, which may require natural gas pipelines installed before 1970 (previously excluded from certain pressure testing obligations), inspections to be pressure tested. PHMSA split this rule (Mega Rule), into three separate rulemaking proceedings. The first of these three rulemakings, relating to onshore gas transmission pipelines, imposes numerous requirements, including MAOP reconfirmation, material and component verification, the periodic assessment of additional pipeline mileage outside of HCAs, the reporting of exceedances of MAOP, and the consideration of seismicity as a risk factor in integrity management. The second
of these three rulemakings contains new repair requirements for HCAs and non-HCAs, and requires operators to inspect pipelines within 72 hours ofperformed after extreme weather events or natural disasters. Operatorsdisasters, management of change, and other integrity management related rule changes. Since the rule was published in 2022, we have worked to understand the regulatory changes and modify our procedures as needed. In total, we have modified more than 20 Williams procedures and forms to account for the Rule 2 changes. All procedures will have to install or enhance leak detection systems, and make modifications to their pipeline systems to accommodate inline inspection tools. The thirdbe in effect when the February 2024 Stay of these three rulemakings provides PHMSA with the authority to issue emergency orders to address imminent hazards, such as unsafe conditions or faulty components used on pipes.Enforcement expires.
In accordance withMay 2023, PHMSA published the Gas Pipeline Leak Detection and Repair Notice of Proposed Rule Making (NPRM). While this regulation has not been published as final and is still subject to change, the rule we have developedcould institute many new proceduresrequirements including: increased survey and updated our existing pipeline safety program to facilitate meeting all requirements within the time frames stated.
We are also expecting additional regulations due to the PIPES Act of 2020 that became law in December 2020. The PIPES Act of 2020 reauthorized PHMSA’s pipeline safety program through September 2023. Thepatrol frequencies, new legislation includes mandatestimelines for PHMSA to publish final rulesrepairing and mitigating leaks, strict performance standards for advanced leak detection for gas pipelines, additional repair criteria for gas and hazardous liquids pipelines, updated operating and maintenance standards requirements applicable to large-scale liquefied natural gas facilities, and certain coastal waters and coastal beaches to be designated as unusually sensitive areas ecological resources for purposes of determining whether a hazardous liquid pipeline is in a high consequence area.
In November 2021, in accordance with the Pipeline Safety, Regulatory Certainty, and Job Creation Act of 2011, PHMSA issued a final rule for onshore gas gathering pipelines. All gas gathering pipelines, including previously unregulated pipelines, will be subject to PHMSA’s annual and incident reporting requirements. The rule limits the use of “incidental gathering pipelines” to 10 miles in length or less. The rule also creates a new category of regulated gas gathering pipelines that are located in rural locations and will be subject to certain reporting and safety standards. The rule adds 400,000 miles of gas gathering lines under PHMSA jurisdiction, including approximately 5,400 miles and 4,500 miles of our regulated and unregulated pipelines, respectively.
New regulations adopted by PHMSA may impose more stringent requirements applicable to integrity management programs, and other pipeline safety aspects of our operations, which could cause usadditional requirements focused on reducing methane emissions. We have been actively working to incur increased capitalprovide comments on the rule and operating costs and operational delays.are working to understand the overall impact if implemented as currently written.
Pipeline Integrity Regulations
We have an enterprise-wide Gas Integrity Management Plan that we believe meets the PHMSA final rule that was issued pursuant to the requirements of the Pipeline Safety Improvement Act of 2002. The rule requiresrules require gas pipeline operators to develop an integrity management program for gas transmission pipelines that could affect HCAs in the event of pipeline failure. The integrity management program includes a baseline assessment plan along with periodic reassessments to be completed within required time frames. In meeting the integrity regulations, we have identified HCAs and developed baseline assessment plans. Ongoing periodic reassessments and initial assessments of any new HCAs have been completed. Also, in response to the portion of the Mega Rule implemented in 2021, we have identified Moderate Consequence Areas, and Class 3 and 4 pipeline locations required by the rule and integrated those segments into our integrity program, and have begun scheduling required assessments and reassessments as needed to meet the regulatory timelines.We estimate that the cost to be incurred in 20222024 associated with this program to be approximately $129$163 million. Management considers costs associated with compliance with the rule to be prudent costs incurred in the ordinary course of business and, therefore, recoverable through Transco, Northwest Pipeline’sPipeline, and Transco’sMountainWest’s rates.
We have an enterprise-wide Liquid Integrity Management Plan that we believe meets the PHMSA final rule that was issued pursuant to the requirements of the Pipeline Safety Improvement Act of 2002. The rule requires liquid pipeline operators to develop an integrity management program for liquid transmission pipelines that could affect HCAs in the event of pipeline failure. The integrity management program includes a baseline assessment plan along with periodic reassessments expected to be completed within required time frames. In meeting the integrity regulations, we utilized government defined HCAs and developed baseline assessment plans. We completed assessments within the required time frames. We estimate that the cost to be incurred in 20222024 associated with this program will be approximately $4 million. Ongoing periodic reassessments and initial assessments of any new HCAs are expected to be completed within the time frames required by the rule. Management considers the costs associated with compliance with the rule to be prudent costs incurred in the ordinary course of business.
Cybersecurity Matters
The Transportation Security Administration (TSA) issued Security Directive Pipeline-2021-01Pipeline-2021-01B (Security Directive 1)1B) on May 26, 2021,29, 2022, which requiredrequires that owners/operators of critical pipelines to (1) report cybersecurity incidents to the Cybersecurity and Infrastructure Agency (CISA) within 1224 hours; (2) appointsappoint a cybersecurity coordinator to coordinate with TSA and CISA; and (3) conduct a self-assessment of cybersecurity practices, identify any gaps, and develop a plan and timeline for remediation. We fully complied with the requirements of Security Directive 1 within the timeframe required. On July 19, 2021,27, 2022, the TSA issued Security Directive Pipeline-2021-02Pipeline-2021-02C (Security Directive 2)2C), which requiredrequires owners/operators of critical pipelines to (1) establish and implement additionala TSA-approved Cybersecurity Implementation Plan that describes the specific cybersecurity measures employed and the schedule for achieving the cybersecurity outcomes described in Security Directive 2C; (2) develop and maintain a Cybersecurity Incident Response Plan to preventreduce the risk of operational disruption or other significant impacts from a cybersecurity incident; and degradation to their infrastructure in response to(3) establish a purported ongoing threat.Cybersecurity Assessment Program and submit an annual plan describing how the effectiveness of cybersecurity measures will be assessed. We have evaluated the impacts of Security Directive 2established and made significant progress towards compliance. Wereceived TSA approval for our Cybersecurity Implementation Plan and are coordinatingcompliant with the remaining requirements established in Security Directives 1B and 2C. New regulations or security directives issued by TSA may impose additional requirements applicable to establish action plansour cybersecurity program, which could cause us to incur increased capital and timelines to remain in compliance with Security Directive 2.operating costs and operational delays.
See Part I, Item 1A. “Risk Factors” — “A breach of our information technology infrastructure, including a breach caused by a cybersecurity attack on us or third parties with whom we are interconnected, may interfere with the safe operation of our assets, result in the disclosure of personal or proprietary information, and harm our reputation.”
State Gathering Regulations
Our onshore midstream gathering operations are subject to laws and regulations in the various states in which we operate. For example, the Texas Railroad Commission has the authority to regulate the terms of service for our intrastate natural gas gathering business in Texas. Although the applicable state regulations vary widely, they generally require that pipeline rates and practices be reasonable and nondiscriminatory, and may include provisions covering marketing, pricing, pollution, environment, and human health and safety. Some states, such as New York and Ohio, have specific regulations pertaining to the design, construction, and operations of gathering lines within such state.
Intrastate Liquids Pipelines in the Gulf Coast
Our intrastate liquids pipelines in the Gulf Coast are regulated by the Louisiana Department of Natural Resources, the Texas Railroad Commission, and various other state and federal agencies. These pipelines are also subject to the liquid pipeline safety and integrity regulations discussed above since both Louisiana and Texas have adopted the integrity management regulations defined in PHMSA.
OCSLAOuter Continental Shelf Lands Act
Our offshore gas and liquids pipelines located on the outer continental shelf are subject to the Outer Continental Shelf Lands Act, which provides in part that outer continental shelf pipelines “must provide open and nondiscriminatory access to both owner and non-owner shippers.”
See Part I, Item 1A. “Risk Factors” — “The operation of our businesses might be adversely affected by regulatory proceedings, changes in government regulations or in their interpretation or implementation, or the introduction of new laws or regulations applicable to our businesses or our customers,” and “The natural gas sales, transportation, and storage operations of our gas pipelines are subject to regulation by the FERC, which could have an adverse impact on their ability to establish transportation and storage rates that would allow them to recover the full cost of operating their respective pipelines and storage assets, including a reasonable rate of return.”
ENVIRONMENTAL MATTERS
Our operations are subject to federal environmental laws and regulations as well as the state, local, and tribal laws and regulations adopted by the jurisdictions in which we operate. We could incur liability to governments or third parties for any unlawful discharge of pollutants into the air, soil, or water, as well as liability for cleanup costs. Materials could be released into the environment in several ways including, but not limited to:
•Leakage from gathering systems, underground gas storage caverns, pipelines, processing or treating facilities, transportation facilities, and storage tanks;
•Damage to facilities resulting from accidents during normal operations;
•Damages to onshore and offshore equipment and facilities resulting from storm events or natural disasters;
•Blowouts, cratering, and explosions.
In addition, we may be liable for environmental damage caused by former owners or operators of our properties.
We believe compliance with current environmental laws and regulations will not have a material adverse effect on our capital expenditures, earnings, or current competitive position. However, environmental laws and regulations could affect our business in various ways from time to time, including incurring capital and maintenance expenditures, fines and penalties, and creating the need to seek relief from the FERC for rate increases to recover the costs of certain capital expenditures and operation and maintenance expenses.
For additional information regarding the potential impact of federal, state, tribal, or local regulatory measures on our business and specific environmental issues, please refer to Part 1, Item 1A. “Risk Factors” — “Our operations are subject to environmental laws and regulations, including laws and regulations relating to climate change and greenhouse gas emissions, which may expose us to significant costs, liabilities, and expenditures that could exceed our expectations,” and Part II, Item 7 “Management’s Discussion and Analysis of Financial Condition and Results of Operations — Environmental” and “Environmental Matters” in Part II, Item 8. Financial Statements and Supplementary Data — Note 1917 – Contingent LiabilitiesContingencies and Commitments of Notes to Consolidated Financial Statements.Commitments.
COMPETITION
Our competitive strategy spans all our product and service offerings. We have a narrowed natural gas value chain focus that supports the exceptional reliability and quality services that are valued by our customers.
Gathering and Processing
Competition for natural gas gathering, processing, treating, transporting,transportation, and storing natural gasstorage, as well as NGLs transportation, fractionation, and storage continues to increase as United States production from shales and other resource areas continues to grow. Our midstream services compete with similar facilities that are in the sameclose proximity asto our assets.
We face competition from companies of varying size and financial capabilities, including major and independent natural gas midstream providers, private equity firms, and major integrated oil and natural gas companies that gather, transport, process, fractionate, store, and market natural gas and NGLs, as well as some larger exploration and production companies that are choosing to develop midstream services to handle their own natural gas.
Our gathering and processing agreements are generally long-term agreements that may include acreage dedication. Competition for natural gas volumes is primarily based on reputation, flexibility of commercial terms (products(including but not limited to fees charged, products retained, or fees charged)volume commitments), available capacity, array and quality of services provided, as well as efficiency, reliability, and reliabilitysafety of services, location of gathering facilities, available capacity, downstream interconnects, and latent capacity.services. We believe our significant presence in traditional prolifickey supply basins, our solid positions in growing shale plays, our expertise and reputation as a reliable and safe operator, our commitment to sustainability, and our ability to offer integrated packages of services position us well against our competition.
Regulated Interstate Natural Gas Transportation and Storage
The market for supplying natural gas is highly competitive and new pipelines, storage facilities, and other related services are expanding to service the growing demand for natural gas. Additionally, pipeline capacity in many growing natural gas supply basins is constrained and facing more regulation and opposition causing competition to increase among pipeline companies as they strive to connect those basins to major natural gas demand centers.
In our business, we predominately compete with major intrastate and interstate natural gas pipelines. In the last few years,Some local distribution companies haveare also started entering intoinvolved in the long-haul transportation business through
joint venture pipelines.The principle elements of competition in the interstate natural gas pipeline business are based on available capacity, available, rates, reliability, quality of customer service, diversity and flexibility of supply, and proximity or access to customers and market hubs.
We face competition in a number of our key markets, and we compete with other interstate and intrastate pipelines for deliveries to customers who can take deliveries at multiple points. Natural gas delivered on our system competes with alternative energy sources used to generate electricity such as hydroelectric power, solar, wind, coal, fuel oil, and nuclear. Future demand for natural gas within the power sector could be increased by growing power demand and by regulations limiting or discouraging coal use orin power generation. Conversely, natural gas demand could be adversely affected by laws mandating or encouraging renewablesolar and wind power sources.sources or restricting the use of natural gas.
Significant entrance barriers to build new pipelines exist, including increased federal and growing state regulations and elevated public opposition against new pipeline builds, and these factors will continue to impact potential competition for the foreseeable future. However, we believe our past success in working with regulators and the public, the position of our existing infrastructure, established strategic long-term contracts, and the fact that our pipelines have numerous receipt and delivery points along our systems provide us a competitive advantage, especially along the eastern seaboard and northwestern United States.
Energy Management and Marketing Services
Our Gas & NGL Marketing Services segment competes with national and regional full-service energy providers, producers, and pipelinespipeline marketing affiliates or other marketing companies that aggregate commodities with transportation and storage capacity.
For additional information regarding competition for our services or otherwise affecting our business, please refer to Part 1, Item 1A. “Risk Factors” - “The financial condition of our natural gas transportation and midstream businesses is dependent on the continued availability of natural gas supplies in the supply basins that we access and demand for those supplies in the markets we serve,” “Our industry is highly competitive and increased competitive pressure could adversely affect our business and operating results,” and “We may not be able to replace, extend, or add additional customer contracts or contracted volumes on favorable terms, or at all, which could affect our financial condition, the amount of cash available to pay dividends, and our ability to grow.”
HUMAN CAPITAL RESOURCES
We are committed to maintaining ana work environment that enables us to attract, develop, and retain a highly skilled and diverse group of talented employees who help promote long-term value creation.creation now and into the clean energy future.
Employees
As of February 1, 2022,2024, we had 4,7835,601 full-time employees located throughout the United States. Of this total, approximately 21 percent are women and more than 16 percent are ethnically diverse. During 2021,2023, our voluntary turnover rate was 6.07.2 percent.
We encourage you to review our 20202022 Sustainability Report available on our website for more information about our human capital programs and initiatives. Nothing on our website shall be deemed incorporated by referencesreference into this Annual Report on Form 10-K.
Workforce Safety
We continue to advance our safety-first culture by developing and empowering our employees to operate our assets in a safe, reliable, and customer-focused way. We strive to continuously improve safety and achieve better performance than the industry benchmark.implement best practices to progress towards zero safety incidents. When a safety hazard is recognized, every employee is empoweredhas the authority and responsibility to stop work activities, make changes to enhance safety, and makeshare the lessons learned with the organization on how we made it right. For 2020 and 2021, safety and environmental-focused goals and related metrics comprise 10 percent of our annual incentive program for employees, providing an increased focus on activities that help us meet enterprise safety commitments.
For 2020 and 2021, these metrics include our High Potential Near Miss to Incident Ratio, emphasizing our safety focus on high potential hazard recognition and reinforcing the importance of incident prevention, and our environmental metric Loss of Primary Containment, focused on reducing greenhouse gases and considered a leading indicator to more significant process safety incidents. For 2021, both our high potential near miss to incident ratio and loss of primary containment events exceeded their respective established targets.
For 2022 in additionand 2023, these goals included our Loss of Primary Containment Events Reduction, a Behavioral Near Miss to Incident Ratio goal aimed to focus attention on behaviors that are the above, we addedleading causes of incidents, as well as a thirdMethane Emissions Reduction goal relatedfocusing on our efforts to methane emission reductions.reduce greenhouse gas emissions by safely and reliably operating and maintaining assets. These three goals nowmetrics comprise 15 percent of our annual incentive program for employees.employees, and reinforce the importance of incident prevention and our commitment to environmental and safety-focused improvements. These metrics align the focus of the organization, from entry level to executives, and create a connection to annual compensation on environmental and safety performance.
For 2023, our Behavioral Near Miss to Incident Ratio and Methane Emissions Reduction goals outperformed the established targets, however, our Loss of Primary Containment Events goal fell short of the reduction targets.
Workforce Health, Engagement, and Development
Our employees are our most valued resource, are instrumental in our mission to safely deliver products that fuel the clean energy economy, and are the driving force behind our reputation as a safe, reliable company that does the right thing, every time. Cultivating a healthy work environment increases productivity and promotes long-term value creation.
We provide a comprehensive total rewards program that includes base salary, an all-employee annual incentive program, retirement benefits, and health benefits, including wellness and employee assistance programs. We provide employees with company-paid life insurance, disability coverage, and paid parental leave for both birth and non-birth parents.parents, as well as adoption assistance. Our annual incentive program is a key component of our commitment to a performance culture focused on recognizing and rewarding high performance.
In order to attract and retain top talent, we create and are committed to maintaining a safe, inclusive workplace where employees feel valued, heard, respected, and supported in their personal and professional development. We offer robustutilize employee surveys and employee led advisory councils to ensure we understand the needs of the business from the perspective of our employees regarding engagement, development and inclusion. Additionally, we support employee engagement through formal programming including professional development, mentoring, and succession planning.
We provide comprehensive corporate and technical training programs that are agile and robust. These programs are designed to support the professional, skill, and technological development of our employees, and addwhich in turn creates a competitive advantage for our business. We are committed to adding long-term value to our business. Additionally,business by investing in our employees’ growth and development. In addition to our internal development programming, we also support strong employee engagement by encouraging open dialogue regardingexternal development opportunities to further enhance our employees’ professional development and succession planning.technical skills. Performance is measured considering both the achieved results associated with attaining annual goals and observable skills and behaviors based on our defined competencies that contribute to workplace effectiveness and career success. Including the defined competencies in our annual performance assessments illustrates our emphasis on, and commitment to, achieving results in the right way.
Additionally, we are committed to strengthening the communities where we operate through philanthropic giving and volunteerism. We support Science, Technology, Engineering, and Math education initiatives, environmental conservation, and first responder efforts, and the work of United Way agencies across the United States.
The Compensation and Management Development Committee of our Board of Directors oversees the establishment and administration of our compensation programs, including incentiveexecutive compensation and equity-based plans.compensation plans and the material risks associated with our compensation
program, as well as the ongoing impactoversight elements of coronavirus,human capital management, including its variants (COVID-19), we took action to safeguard the healthdiversity and safety of our employees, including allowing our employees to work remotely where possible, while implementing safety guidanceinclusion, and best practices designed to protect the health of those entering our facilities.talent development.
Diversity & Inclusion
We are committed to creating an inclusive culture, where diverse differences are embraced and employees feel valued, welcomed, appreciated, and compelled to reach their full potential. We believe that inclusion fosters innovation, collaboration, and drives business growth and long-term success. To create a culture of inclusion, we embrace, appreciate, and fully leverage the diversity within our teams, including gender, race and ethnicity, life experiences, thoughts, perspectives, and anything that makes us different from one another. We believe that incorporating our many differences into a team of people who are working toward the same goal gives us a competitive advantage.
To create space for employees to share personal experiences and perspectives, and to appreciate and celebrate what makes people different, we offer Employee Resource Groups (ERGs). These groups are employee-led and
based on similar interests and experiences, represent diverse communities and their allies, and are open to everyone. ERG members participate in community events, volunteer, lend professional and personal support to one another, and promote inclusion across the company. They also have executive sponsors and provide input to the leadership team.
We are committed to helping all employees develop and succeed. We strive for diverse representation at all levels of the organization through our talent management practices and employee development programs, including required baseline diversity and inclusion training for all leaders across the company. Diversity metrics are reported monthly to our management team to identify trendsenhance transparency and opportunities for improvement.
Our Diversity and Inclusion Council, - chaired by our chief executive officer and includingwhich includes members of the executive officer team, organizational and operational leaders, and individual employees, - promotes policies, practices, and procedures that support the growth of a high-performing workforce where all individuals can achieve their full potential. The council serves as the governing body over enterprise diversity and inclusion initiatives, including a quarterly candid conversation meeting for all employees,enterprise diversity and inclusion events, organized and hosted by one of our 10 active ERGs, and our annual awards that recognize an outstanding leader and an individual contributor who champion inclusion.
As of December 31, 2021,2023, our Board of Directors includes 12 members, 11 of whom are independent members, 25 percent of whom are women, and approximately one-quarter8.33 percent of whichwhom are women.from an underrepresented race or ethnicity. As part of the director selection and nominating process, the Governance and Sustainability Committee annually assesses the Board’s diversity in areas such as expertise, geography, gender, race and ethnicity, and age. We strive to maintain a board of directors with diverse occupational and personal backgrounds.
WEBSITE ACCESS TO REPORTS AND OTHER INFORMATION
We file our annual report on Form 10-K, quarterly reports on Form 10-Q, current reports on Form 8-K, proxy statements, and other documents electronically with the SEC under the Exchange Act.
Our Internet website is www.williams.com. We make available, free of charge, through the Investors tab of our Internet website our annual report on Form 10-K, quarterly reports on Form 10-Q, current reports on Form 8‑K, and amendments to those reports filed or furnished pursuant to Section 13(a) or 15(d) of the Exchange Act as soon as reasonably practicable after we electronically file such material with, or furnish it to, the SEC. Our Corporate Governance Guidelines, Sustainability Report, Code of Ethics for Senior Officers, Board committee charters, and the Williams Code of Business Conduct are also available on our Internet website. We will also provide, free of charge, a copy of any of our corporate documents listed above upon written request to our Corporate Secretary, One Williams Center, Suite 4700, Tulsa, Oklahoma 74172.
Item 1A. Risk Factors
FORWARD-LOOKING STATEMENTS AND CAUTIONARY STATEMENT
FOR PURPOSES OF THE “SAFE HARBOR” PROVISIONS OF
THE PRIVATE SECURITIES LITIGATION REFORM ACT OF 1995
The reports, filings, and other public announcements of Williams may contain or incorporate by reference statements that do not directly or exclusively relate to historical facts. Such statements are “forward-looking statements” within the meaning of Section 27A of the Securities Act of 1933, as amended (Securities Act) and Section 21E of the Securities Exchange Act of 1934, as amended.Act. These forward-looking statements relate to anticipated financial performance, management’s plans and objectives for future operations, business prospects, outcomes of regulatory proceedings, market conditions, and other matters. We make these forward-looking statements in reliance on the safe harbor protections provided under the Private Securities Litigation Reform Act of 1995.
All statements, other than statements of historical facts, included in this report that address activities, events, or developments that we expect, believe, or anticipate will exist or may occur in the future, are forward-looking statements. Forward-looking statements can be identified by various forms of words such as “anticipates,” “believes,” “seeks,” “could,” “may,” “should,” “continues,” “estimates,” “expects,” “forecasts,” “intends,” “might,” “goals,” “objectives,” “targets,” “planned,” “potential,” “projects,” “scheduled,” “will,” “assumes,” “guidance,” “outlook,” “in-service date,” or other similar expressions. These forward-looking statements are based on management’s beliefs and assumptions and on information currently available to management and include, among others, statements regarding:
•Levels of dividends to Williams stockholders;
•Future credit ratings of Williams and its affiliates;
•Amounts and nature of future capital expenditures;
•Expansion and growth of our business and operations;
•Expected in-service dates for capital projects;
•Financial condition and liquidity;
•Business strategy;
•Cash flow from operations or results of operations;
•Seasonality of certain business components;
•Natural gas, natural gas liquids, and crude oil prices, supply, and demand;
•Demand for our services;
•The impact of the COVID-19 pandemic.services.
Forward-looking statements are based on numerous assumptions, uncertainties, and risks that could cause future events or results to be materially different from those stated or implied in this report. Many of the factors that will determine these results are beyond our ability to control or predict. Specific factors that could cause actual results to differ from results contemplated by the forward-looking statements include, among others, the following:
•Availability of supplies, market demand, and volatility of prices;
•Development and rate of adoption of alternative energy sources;
•The impact of existing and future laws and regulations, the regulatory environment, environmental matters, and litigation, as well as our ability and the ability of other energy companies with whom we conduct or seek to conduct business, to obtain necessary permits and approvals, and our ability to achieve favorable rate proceeding outcomes;
•Our exposure to the credit risk of our customers and counterparties;
•Our ability to acquire new businesses and assets and successfully integrate those operations and assets into existing businesses as well as successfully expand our facilities and to consummate asset sales on acceptable terms;
•Whether we are able to successfully identify, evaluate, and timely execute our capital projects and investment opportunities;
•The strength and financial resources of our competitors and the effects of competition;
•The amount of cash distributions from and capital requirements of our investments and joint ventures in which we participate;
•Whether we will be able to effectively execute our financing plan;
•Increasing scrutiny and changing expectations from stakeholders with respect to our environmental, social, and governance practices;
•The physical and financial risks associated with climate change;
•The impacts of operational and developmental hazards and unforeseen interruptions;
•The risks resulting from outbreaks or other public health crises, including COVID-19;crises;
•Risks associated with weather and natural phenomena, including climate conditions and physical damage to our facilities;
•Acts of terrorism, cybersecurity incidents, and related disruptions;
•Our costs and funding obligations for defined benefit pension plans and other postretirement benefit plans;
•Changes in maintenance and construction costs, as well as our ability to obtain sufficient construction- related inputs, including skilled labor;
•Inflation, interest rates, and general economic conditions (including future disruptions and volatility in the global credit markets and the impact of these events on customers and suppliers);
•Risks related to financing, including restrictions stemming from debt agreements, future changes in credit ratings as determined by nationally recognized credit rating agencies, and the availability and cost of capital;
•The ability of the members of the Organization of Petroleum Exporting Countries (OPEC) and other oil exporting nations to agree to and maintain oil price and production controls and the impact on domestic production;
•Changes in the current geopolitical situation;situation, including the Russian invasion of Ukraine and conflicts in the Middle East including between Israel and Hamas and conflicts involving Iran and its proxy forces;
•Changes in U.S. governmental administration and policies;
•Whether we are able to pay current and expected levels of dividends;
•Additional risks described in our filings with the Securities and Exchange Commission.SEC.
Given the uncertainties and risk factors that could cause our actual results to differ materially from those contained in any forward-looking statement, we caution investors not to unduly rely on our forward-looking statements. We disclaim any obligations to, and do not intend to, update the above list or announce publicly the result of any revisions to any of the forward-looking statements to reflect future events or developments.
In addition to causing our actual results to differ, the factors listed above and referred to below may cause our intentions to change from those statements of intention set forth in this report. Such changes in our intentions may also cause our results to differ. We may change our intentions, at any time and without notice, based upon changes in such factors, our assumptions, or otherwise.
Because forward-looking statements involve risks and uncertainties, we caution that there are important factors, in addition to those listed above, that may cause actual results to differ materially from those contained in the forward-looking statements. These factors are described in the following section.
RISK FACTORS
You should carefully consider the following risk factors in addition to the other information in this report. Each of these factors could adversely affect our business, prospects, financial condition, results of operations, cash flows, and, in some cases, our reputation. The occurrence of any of such risks could also adversely affect the value of an investment in our securities.
Risks Related to Our Business
The financial condition of our natural gas transportation and midstream businesses is dependent on the continued availability of natural gas supplies in the supply basins that we access and demand for those supplies in the markets we serve.
Our ability to maintain and expand our natural gas transportation and midstream businesses depends on the level of drilling and production predominantly by third parties in our supply basins. Production from existing wells and natural gas supply basins with access to our pipeline and gathering systems will naturally decline over time. The amount of natural gas reserves underlying these existing wells may also be less than anticipated, and the rate at which production from these reserves declines may be greater than anticipated. We do not obtain independent evaluations of natural gas reserves connected to our systems and processing facilities. Accordingly, we do not have independent estimates of total reserves dedicated to our systems or the anticipated life of such reserves. In addition, low prices for natural gas, regulatory limitations, including permitting and environmental regulations, or the lack of available capital have, and may continue to, adversely affect the development and production of existing or additional natural gas reserves and the installation of gathering, storage, and pipeline transportation facilities. The import and export of natural gas supplies may also be affected by such conditions. Low natural gas prices in one or more of our existing supply basins, whether caused by a lack of infrastructure or otherwise, could also result in depressed natural gas production in such basins and limit the supply of natural gas made available to us. The competition for natural gas supplies to serve other markets could also reduce the amount of natural gas supply for our customers. A failure to obtain access to sufficient natural gas supplies will adversely impact our ability to maximize the capacities of our gathering, transportation, and processing facilities.
Demand for our services is dependent on the demand for gas in the markets we serve. Alternative fuel sources such as electricity, coal, fuel oils, or nuclear energy, as well as technological advances and renewable sources of energy, could reduce demand for natural gas in our markets and have an adverse effect on our business. Governmentally imposed constraints, such as prohibitions on natural gas hookups in newly constructed buildings and the recently announced permit freeze for new LNG export projects, could also artificially limit new demand for natural gas.
A failure to obtain access to sufficient natural gas supplies or a reduction in demand for our services in the markets we serve could result in impairments of our assets and have a material adverse effect on our business, financial condition, results of operations, and cash flows.
Prices for natural gas, NGLs, oil, and other commodities, are volatile and this volatility has and could continue to adversely affect our financial condition, results of operations, cash flows, access to capital, and ability to maintain or grow our businesses.
Our revenues, operating results, future rate of growth, and the value of certain components of our businesses depend primarily upon the prices of natural gas, NGLs, oil, or other commodities, and the differences between prices of these commodities and could be materially adversely affected by an extended period of low commodity prices, or a decline in commodity prices. Price volatility has and could continue to impact both the amount we receive for our products and services and the volume of products and services we sell. Prices affect the amount of cash flow available for capital expenditures and our ability to borrow money or raise additional capital. Price volatility has had and could continue to have an adverse effect on our business, results of operations, financial condition, and cash flows.
The markets for natural gas, NGLs, oil, and other commodities are likely to continue to be volatile. Wide fluctuations in prices might result from one or more factors beyond our control, including:
•Imbalances in supply and demand whether rising from worldwide or domestic supplies of and demand for natural gas, NGLs, oil, and related commodities;
•TurmoilGeopolitical turmoil in the Middle East, Eastern Europe, and other producing regions;
•The activities of OPEC and other countries, whether acting independently of or informally aligned with OPEC, which have significant oil, natural gas or other commodity production capabilities, including Russia;
•The level of consumer demand;
•The price and availability of other types of fuels or feedstocks;
•The availability of pipeline capacity;
•Supply disruptions, including plant outages and transportation disruptions;
•The price and quantity of foreign imports and domestic exports of natural gas and oil;
•Domestic and foreign governmental regulations and taxes;
•The credit of participants in the markets where products are bought and sold.
We are exposed to the credit risk of our customers and counterparties, and our credit risk management will not be able to completely eliminate such risk.
We are subject to the risk of loss resulting from nonpayment and/or nonperformance by our customers and counterparties in the ordinary course of our business. Generally, our customers are rated investment grade, are otherwise considered creditworthy, are required to make prepayments or provide security to satisfy credit concerns, or are dependent upon us, in some cases without a readily available alternative, to provide necessary services. However, our credit procedures and policies cannot completely eliminate customer and counterparty credit risk. Our customers and counterparties include industrial customers, local distribution companies, natural gas producers, and marketers whose creditworthiness may be suddenly and disparately impacted by, among other factors, commodity price volatility, deteriorating energy market conditions, and public and regulatory opposition to energy producing activities. In a low commodity price environment, certain of our customers have been or could be negatively impacted, causing them significant economic stress resulting, in some cases, in a customer bankruptcy filing or an effort to renegotiate our contracts. To the extent one or more of our key customers commences bankruptcy proceedings, our contracts with such customers may be subject to rejection under applicable provisions of the United States Bankruptcy Code or, if we so agree, may be renegotiated. Further, during any such bankruptcy proceeding, prior to assumption, rejection, or renegotiation of such contracts, the bankruptcy court may temporarily authorize the payment of value for our services less than contractually required, which could have a material adverse effect on our business, results of operations, cash flows, and financial condition. If we fail to adequately assess the creditworthiness of existing or future customers and counterparties or otherwise do not take sufficient mitigating actions, including obtaining sufficient collateral, deterioration in their creditworthiness and any resulting increase in nonpayment and/or nonperformance by them could cause us to write down or write off accounts receivable. Such write-downs or write-offs could negatively affect our operating results for the period in which they occur, and, if significant, could have a material adverse effect on our business, financial condition, results of operations, and cash flows.
We face opposition to operation and expansion of our pipelines and facilities from various individuals and groups.
We have experienced, and we anticipate that we will continue to face, opposition to the operation and expansion of our pipelines and facilities from governmental officials, environmental groups, landowners, tribal groups, local groups, and other advocates. In some instances, we encounter opposition that disfavors hydrocarbon-based energy supplies regardless of practical implementation or financial considerations. Opposition to our operation and expansion can take many forms, including the delay or denial of required governmental permits, organized protests, attempts to block or sabotage our operations, intervention in regulatory or administrative proceedings involving our
assets, or lawsuits or other actions designed to prevent, disrupt, or delay the operation or expansion of our assets and business. In addition, acts of sabotage or eco-terrorism could cause significant damage or injury to people, property, or the environment or lead to extended interruptions of our operations. Any such event that delays or prevents the expansion of our business, that interrupts the revenues generated by our operations, or which causes us to make
significant expenditures not covered by insurance, could adversely affect our financial condition and results of operations.
We may not be able to grow or effectively manage our growth.
As part of our growth strategy, we consider acquisition opportunities and engage in significant capital projects. We have both a project lifecycle process and an investment evaluation process. These are processes we use to identify, evaluate, and execute on acquisition opportunities and capital projects. We may not always have sufficient and accurate information to identify and value potential opportunities and risks or our investment evaluation process may be incomplete or flawed. Regarding potential acquisitions, suitable acquisition candidates or assets may not be available on terms and conditions we find acceptable or, where multiple parties are trying to acquire an acquisition candidate or assets, we may not be chosen as the acquirer. If we are able to acquire a targeted business, we may not be able to successfully integrate the acquired businesses and realize anticipated benefits in a timely manner.
Our growth may also be dependent upon the construction of new natural gas gathering, transportation, compression, processing, or treating pipelines and facilities, NGL transportation, or fractionation or storage facilities as well as the expansion of existing facilities. Additional risks associated with construction may include the inability to obtain rights-of-way, skilled labor, equipment, materials, permits, and other required inputs in a timely manner such that projects are completed, on time or at all, and the risk that construction cost overruns, including due to inflation, could cause total project costs to exceed budgeted costs. Additional risks associated with growing our business include, among others, that:
•Changing circumstances and deviations in variables could negatively impact our investment analysis, including our projections of revenues, earnings, and cash flow relating to potential investment targets, resulting in outcomes that are materially different than anticipated;
•We could be required to contribute additional capital to support acquired businesses or assets, and we may assume liabilities that were not disclosed to us, that exceed our estimates and for which contractual protections are either unavailable or prove inadequate;
•Acquisitions could disrupt our ongoing business, distract management, divert financial and operational resources from existing operations, and make it difficult to maintain our current business standards, controls, and procedures;
•Acquisitions and capital projects may require substantial new capital, including the issuance of debt or equity, and we may not be able to access credit or capital markets or obtain acceptable terms.
If realized, any of these risks could have an adverse impact on our financial condition, results of operations, including the possible impairment of our assets, or cash flows.
Our industry is highly competitive and increased competitive pressure could adversely affect our business and operating results.
We have numerous competitors in all aspects of our businesses, and additional competitors may enter our markets. Any current or future competitor that delivers natural gas, NGLs, or other commodities into the areas that we operate could offer transportation services that are more desirable to shippers than those we provide because of price, location, facilities, or other factors. In addition, current or potential competitors may make strategic acquisitions or have greater financial resources than we do, which could affect our ability to make strategic investments or acquisitions. Our competitors may be able to respond more quickly to new laws or regulations or emerging technologies or to devote greater resources to the construction, expansion, or refurbishment of their facilities than we can. Failure to successfully compete against current and future competitors could have a material adverse effect on our business, results of operations, financial condition, and cash flows.
We do not own 100 percent of the equity interests of certain subsidiaries, including the Partially OwnedNonconsolidated Entities, which may limit our ability to operate and control these subsidiaries. Certain operations, including the Partially OwnedNonconsolidated Entities, are conducted through arrangements that may limit our ability to operate and control these operations.
The operations of our current non-wholly-owned subsidiaries, including the Partially OwnedNonconsolidated Entities, are conducted in accordance with their organizational documents. We anticipate that we will enter into more such
arrangements, including through new joint venture structures or new Partially OwnedNonconsolidated Entities. We may have limited operational flexibility in such current and future arrangements, and we may not be able to control the timing or amount of cash distributions received. In certain cases:
•We cannot control the amount of cash reserves determined to be necessary to operate the business, which reduces cash available for distributions;
•We cannot control the amount of capital expenditures that we are required to fund and we are dependent on third parties to fund their required share of capital expenditures;
•We may be subject to restrictions or limitations on our ability to sell or transfer our interests in the jointly owned assets;
•We may be forced to offer rights of participation to other joint venture participants in the area of mutual interest;
•We have limited ability to influence or control certain day to day activities affecting the operations;
•We may have additional obligations, such as required capital contributions, that are important to the success of the operations.
In addition, conflicts of interest may arise between us, on the one hand, and other interest owners, on the other hand. If such conflicts of interest arise, we may not have the ability to control the outcome with respect to the matter in question. Disputes between us and other interest owners may also result in delays, litigation, or operational impasses.
The risks described above or the failure to continue such arrangements could adversely affect our ability to conduct the operations that are the subject of such arrangements which could, in turn, negatively affect our business, growth strategy, financial condition, and results of operations.
We may not be able to replace, extend, or add additional customer contracts or contracted volumes on favorable terms, or at all, which could affect our financial condition, the amount of cash available to pay dividends, and our ability to grow.
We rely on a limited number of customers and producers for a significant portion of our revenues and supply of natural gas and NGLs. Although many of our customers and suppliers are subject to long-term contracts, if we are unable to replace or extend such contracts, add additional customers, or otherwise increase the contracted volumes of natural gas provided to us by current producers, in each case on favorable terms, if at all, our financial condition, growth plans, and the amount of cash available to pay dividends could be adversely affected. Our ability to replace, extend, or add additional customer or supplier contracts, or increase contracted volumes of natural gas from current producers, on favorable terms, or at all, is subject to a number of factors, some of which are beyond our control, including:
•The level of existing and new competition in our businesses or from alternative sources, such as electricity, renewable resources, coal, fuel oils, or nuclear energy;
•Natural gas and NGL prices, demand, availability, and margins in our markets. Higher prices for energy commodities related to our businesses could result in a decline in the demand for those commodities and, therefore, in customer contracts or throughput on our pipeline systems. Also, lower energy commodity prices could negatively impact our ability to maintain or achieve favorable contractual terms, including pricing, and could also result in a decline in the production of energy commodities resulting in reduced customer contracts, supply contracts, and throughput on our pipeline systems;
•General economic, financial markets, and industry conditions;
•The effects of regulation on us, our customers, and our contracting practices;
•Our ability to understand our customers’ expectations, efficiently and reliably deliver high quality services, and effectively manage customer relationships. The results of these efforts will impact our reputation and positioning in the market.
Certain of our gas pipeline services are subject to long-term, fixed-price contracts that are not subject to adjustment, even if our cost to perform such services exceeds the revenues received from such contracts.
Our gas pipelines provide some services pursuant to long-term, fixed-price contracts. It is possible that costs to perform services under such contracts will exceed the revenues our pipelines collect for their services. Although other services are priced at cost-based rates that are subject to adjustment in rate cases, under FERC policy, a regulated service provider and a customer may mutually agree to sign a contract for service at a “negotiated rate” that may be above or below the FERC regulated cost-based rate for that service. These “negotiated rate” contracts are not generally subject to adjustment for increased costs that could be produced by inflation or other factors relating to the specific facilities being used to perform the services.
Some of our businesses are exposed to supplier concentration risks arising from dependence on a single or a limited number of suppliers.
Some of our businesses may be dependent on a small number of suppliers for delivery of critical goods or services. If a supplier on which one of our businesses depends were to fail to timely supply required goods and services, such business may not be able to replace such goods and services in a timely manner or otherwise on favorable terms or at all. If our business is unable to adequately diversify or otherwise mitigate such supplier concentration risks and such risks were realized, such businesses could be subject to reduced revenues and increased expenses, which could have a material adverse effect on our financial condition, results of operation,operations, and cash flows.
Failure of our service providers or disruptions to our outsourcing relationships might negatively impact our ability to conduct our business.
Certain of our accounting and information technology services are currently provided by third-party vendors, and sometimes from service centers outside of the United States. Services provided pursuant to these arrangements could be disrupted. Similarly, the expiration of agreements associated with such arrangements or the transition of services between providers could lead to loss of institutional knowledge or service disruptions. Our reliance on others as service providers could have a material adverse effect on our business, financial condition, results of operations, and cash flows.
An impairment of our assets, including property, plant, and equipment, intangible assets, and/or equity-method investments, could reduce our earnings.
GAAP requires us to test certain assets for impairment on either an annual basis or when events or circumstances occur which indicate that the carrying value of such assets might be impaired. The outcome of such testing could result in impairments of our assets including our property, plant, and equipment, intangible assets, and/or equity-method investments. Additionally, any asset monetizations could result in impairments if any assets are sold or otherwise exchanged for amounts less than their carrying value. If we determine that an impairment has occurred, we would be required to take an immediate noncash charge to earnings.
Increasing scrutiny and changing expectations from stakeholders with respect to our environmental, social and governance practices may impose additional costs on us or expose us to new or additional risks.
Companies across all industries are facing increasing scrutiny from stakeholders related to their environmental, social and governance (“ESG”) practices. Investor advocacy groups, institutional investors, investment funds and other influential investors are also increasingly focused on ESG practices and in recent years have placed increasing importance on the implications and social cost of their investments. Regardless of the industry, investors’ increased focus and activism related to ESG (as proponents or opponents) and similar matters may hinder access to capital, as investors may decide to reallocate capital or to not commit capital as a result of their assessment of a company’s ESG practices. Companies that do not adapt to or comply with investor or other stakeholder expectations and standards, which are evolving, or that are perceived to have not responded appropriately to the growing concern for
ESG issues, regardless of whether there is a legal requirement to do so, may suffer from reputational damage, and the business, financial condition, and/or stock price of such a company could be materially and adversely affected.
We face pressures from our stockholders, who are increasingly focused on climate change, to prioritize sustainable energy practices, reduce our carbon footprint, and promote sustainability. Our stockholders may require us to implement ESG procedures or standards in order to continue engaging with us, to remain invested in us or before they may make further investments in us. Additionally, we may face reputational challenges in the event our
ESG procedures or standards do not meet the standards set by certain constituencies. We have adopted certain practices as highlighted in our 20202022 Sustainability Report, including with respect to air emissions, biodiversity and land use, climate change, and environmental stewardship. It is possible, however, that our stockholders might not be satisfied with our sustainability efforts or the speed of their adoption. If we do not meet our stockholders’ expectations, our business, ability to access capital, and/or our stock price could be harmed.
Additionally, adverse effects upon the oil and gas industry related to the worldwide social and political environment,environments, including uncertainty or instability resulting from climate change, changes in political leadership and environmental policies, changes in geopolitical-social views toward fossil fuels and renewable energy, concern about the environmental impact of climate change, and investors’ expectations regarding ESG matters, may also adversely affect demand for our services. Any long-term material adverse effect on the oil and gas industry could have a significant financial and operational adverse impact on our business.
The occurrence of any of the foregoing could have a material adverse effect on the price of our stock and our business and financial condition.
We may be subject to physical and financial risks associated with climate change.
The threat of global climate change may create physical and financial risks to our business. Energy needs vary with weather conditions. To the extent weather conditions may be affected by climate change, energy use could increase or decrease depending on the duration and magnitude of any changes. Increased energy use due to weather changes may require us to invest in more pipelines and other infrastructure to serve increased demand. A decrease in energy use due to weather changes may affect our financial condition through decreased revenues. Extreme weather conditions in general require more system backup, adding to costs, and can contribute to increased system stresses, including service interruptions. Weather conditions outside of our operating territory could also have an impact on our revenues. To the extent the frequency of extreme weather events increases, this could increase our cost of providing service. We may not be able to pass on the higher costs to our customers or recover all costs related to mitigating these physical risks.
Additionally, many climate models indicate that global warming is likely to result in rising sea levels and increased frequency and severity of weather events, which may lead to higher insurance costs, or a decrease in available coverage, for our assets in areas subject to severe weather. These climate-related changes could damage our physical assets, especially operations located in low-lying areas near coasts and river banks, and facilities situated in hurricane-prone and rain-susceptible regions.
To the extent financial markets view climate change and greenhouse gas (“GHG”) emissions as a financial risk, this could negatively impact our cost of and access to capital. Climate change and GHG regulation could also reduce demand for our services. Our business could also be affected by the potential for lawsuits against GHG emitters, based on links drawn between GHG emissions and climate change.
Our operations are subject to operational hazards and unforeseen interruptions.
There are operational risks associated with the gathering, transporting, storage, processing, and treating of natural gas, the fractionation, transportation, and storage of NGLs, and crude oil transportation and production handling, including:
•Aging infrastructure and mechanical problems;
•Damages to pipelines and pipeline blockages or other pipeline interruptions;
•Uncontrolled releases of natural gas (including sour gas), NGLs, crude oil, or other products;
•Collapse or failure of storage caverns;
•Operator error;
•Damage caused by third-party activity, such as operation of construction equipment;
•Pollution and other environmental risks;
•Fires, explosions, craterings, and blowouts;
•Security risks, including cybersecurity;
•Operating in a marine environment.
Any of these risks could result in loss of human life, personal injuries, significant damage to property, environmental pollution, impairment of our operations, loss of services to our customers, reputational damage, and substantial losses to us. The location of certain segments of our facilities in or near populated areas, including residential areas, commercial business centers, and industrial sites, could increase the level of damages resulting from these risks. An event such as those described above could have a material adverse effect on our financial condition and results of operations, particularly if the event is not fully covered by insurance.
Our assets and operations, as well as our customers’ assets and operations, can be adversely affected by weather and other natural phenomena.
Our assets and operations, especially those located offshore, and our customers’ assets and operations can be adversely affected by hurricanes, floods, earthquakes, landslides, tornadoes, fires, and other natural phenomena and weather conditions, including extreme or unseasonable temperatures, making it more difficult for us to realize the historic rates of return associated with our assets and operations. A significant disruption in our or our customers’ operations or the occurrence of a significant liability for which we are not fully insured could have a material adverse effect on our business, financial condition, results of operations, and cash flows.
Our business could be negatively impacted by acts of terrorism and related disruptions.
Given the volatile nature of the commodities we transport, process, store, and sell, our assets and the assets of our customers and others in our industry may be targets of terrorist activities. Uncertainty surrounding the Russian invasion of Ukraine, conflicts in the Middle East including between Israel and Hamas and conflicts involving Iran and its proxy forces, or other sustained military campaigns, may affect our operations in unpredictable ways, including the possibility that infrastructure facilities could be direct targets of, or indirect casualties of, an act of terrorism. A terrorist attack could create significant price volatility, disrupt our business, limit our access to capital markets, or cause significant harm to our operations, such as full or partial disruption to our ability to produce, process, transport, or distribute natural gas, NGLs, or other commodities. Acts of terrorism, as well as events occurring in response to or in connection with acts of terrorism, could cause environmental repercussions that could result in a significant decrease in revenues or significant reconstruction or remediation costs, which could have a material adverse effect on our business, financial condition, results of operations, and cash flows.
A breach of our information technology infrastructure, including a breach caused by a cybersecurity attack on us or third parties with whom we are interconnected, may interfere with the safe operation of our assets, result in the disclosure of personal or proprietary information, and harm our reputation.
We rely on our information technology infrastructure to process, transmit, and store electronic information, including information we use to safely operate our assets. Our Board of Directors has oversight responsibility with regard to assessment of the major risks inherent in our business, including cybersecurity risks, and reviews management’s efforts to address and mitigate such risks, including the establishment and implementation of policies to address cybersecurity threats. We have invested, and expect to continue to invest, significant time, manpower, and capital in our information technology infrastructure. However, the age, operating systems, or condition of our current information technology infrastructure and software assets and our ability to maintain and upgrade such assets could affect our ability to resist cybersecurity threats. While we believe that we maintain appropriate information security policies, practices, and protocols, we regularly face cybersecurity and other security threats to our information technology infrastructure, which could include threats to our operational industrial control systems and safety systems that operate our pipelines, plants, and assets. We face unlawful attempts to gain access to our information technology infrastructure, including coordinated attacks from hackers, whether state-sponsored groups, “hacktivists”
“hacktivists”, or private individuals. We face the threat of theft and misuse of sensitive data and information, including customer and employee information. We also face attempts to gain access to information related to our assets through attempts to obtain unauthorized access by targeting acts of deception against individuals with legitimate access to physical locations or information. We also are subject to cybersecurity risks arising from the fact that our business operations are interconnected with third parties, including third-party pipelines, other facilities and our contractors and vendors. In addition, the breach of certain business systems could affect our ability to correctly record, process, and report financial information. Breaches in our information technology infrastructure or physical facilities, or other disruptions including those arising from theft, vandalism, fraud, or unethical conduct, which may increase as a result of the Russian invasion of Ukraine or other geopolitical tensions and conflicts, could result in damage to or destruction of our assets, unnecessary waste, safety incidents, damage to the environment,
reputational damage, potential liability, the loss of contracts, the imposition of significant costs associated with remediation and litigation, heightened regulatory scrutiny, increased insurance costs, and have a material adverse effect on our operations, financial condition, results of operations, and cash flows.
If third-party pipelines and other facilities interconnected to our pipelines and facilities become unavailable to transport natural gas and NGLs or to treat natural gas, our revenues could be adversely affected.
We depend upon third-party pipelines and other facilities that provide delivery options to and from our pipelines and facilities for the benefit of our customers. Because we do not own these third-party pipelines or other facilities, their continuing operation is not within our control. If these pipelines or facilities were to become temporarily or permanently unavailable for any reason, or if throughput were reduced because of testing, line repair, damage to pipelines or facilities, reduced operating pressures, lack of capacity, increased credit requirements or rates charged by such pipelines or facilities or other causes, we and our customers would have reduced capacity to transport, store, or deliver natural gas or NGL products to end use markets or to receive deliveries of mixed NGLs, thereby reducing our revenues. Any temporary or permanent interruption at any key pipeline interconnection or in operations on third-party pipelines or facilities that would cause a material reduction in volumes transported on our pipelines or our gathering systems or processed, fractionated, treated, or stored at our facilities could have a material adverse effect on our business, financial condition, results of operations, and cash flows.
Our operating results for certain components of our business might fluctuate on a seasonal basis.
Revenues from certain components of our business can have seasonal characteristics. In many parts of the country, demand for natural gas and other fuels peaks during the winter. As a result, our overall operating results in the future might fluctuate substantially on a seasonal basis. Demand for natural gas and other fuels could vary significantly from our expectations depending on the nature and location of our facilities and pipeline systems and the terms of our natural gas transportation arrangements relative to demand created by unusual weather patterns.
We do not own all of the land on which our pipelines and facilities are located, which could disrupt our operations.
We do not own all of the land on which our pipelines and facilities have been constructed. As such, we are subject to the possibility of increased costs to retain necessary land use. In those instances in which we do not own the land on which our facilities are located, we obtain the rights to construct and operate our facilities and gathering systems on land owned by third parties and governmental agencies for a specific period of time. In addition, some of our facilities cross Native American lands pursuant to rights-of-way of limited terms. We may not have the right of eminent domain over land owned by Native American tribes. Our loss of any of these rights, through our inability to renew right-of-way contracts or otherwise, could have a material adverse effect on our business, financial condition, results of operations, and cash flows.
Our business could be negatively impacted as a result of stockholder activism.
In recent years, stockholder activism, including threatened or actual proxy contests, has been directed against numerous public companies, including ours. We were the target of a proxy contest from a stockholder activist, which resulted in our incurring significant costs. If stockholder activists were to again take or threaten to take actions against the Company or seek to involve themselves in the governance, strategic direction, or operations of the Company, we could incur significant costs as well as the distraction of management, which could have an adverse effect on our business or financial results. In addition, actions of activist stockholders may cause significant
fluctuations in our stock price based on temporary or speculative market perceptions or other factors that do not necessarily reflect the underlying fundamentals and prospects of our business.
Our costs and funding obligations for our defined benefit pension plans and costs for our other postretirement benefit plans are affected by factors beyond our control.
We have defined benefit pension plans and other postretirement benefit plans. The timing and amount of our funding requirements under the defined benefit pension plans depend upon a number of factors that we control, including changes to pension plan benefits, as well as factors outside of our control, such as asset returns, interest rates, and changes in pension laws. Changes to these and other factors that can significantly increase our funding requirements could have a significant adverse effect on our financial condition and results of operations.
Risks Related to Financing Our Business
A downgrade of our credit ratings, which are determined outside of our control by independent third parties, could impact our liquidity, access to capital, and our costs of doing business.
Downgrades of our credit ratings increase our cost of borrowing and could require us to provide collateral to our counterparties, negatively impacting our available liquidity. In addition, our ability to access capital markets could be limited by the downgrading of our credit ratings.
Credit rating agencies perform independent analysis when assigning credit ratings. The analysis includes a number of criteria such as, business composition, market and operational risks, as well as various financial tests. Credit rating agencies continue to review the criteria for industry sectors and various debt ratings and may make changes to those criteria from time to time. Credit ratings are subject to revision or withdrawal at any time by the ratings agencies. As of the date of the filing of this report, we have been assigned an investment-grade credit rating by the credit ratings agencies.
Difficult conditions in the global financial markets and the economy in general could negatively affect our business and results of operations.
Our businesses may be negatively impacted by adverse economic conditions or future disruptions in the global financial markets. Included among these potential negative impacts are industrial or economic contraction (including as a result of the COVID-19 pandemic) leading to reduced energy demand and lower prices for our products and services and increased difficulty in collecting amounts owed to us by our customers. Geopolitical tensions and conflicts including those in the Middle East between Israel and Hamas and Iran or its proxy forces, as well as the ongoing Russian invasion of Ukraine and the actions undertaken by western nations in response to these conflicts have had, and may continue to have, adverse impacts on global financial markets. If financing is not available when needed, or is available only on unfavorable terms, we may be unable to implement our business plans or otherwise take advantage of business opportunities or respond to competitive pressures. In addition, financial markets have periodically been affected by concerns over U.S. fiscal and monetary policies. These concerns, as well as actions taken by the U.S. federal government in response to these concerns, could significantly and adversely impact the global and U.S. economies and financial markets, which could negatively impact us in the manner described above.
Restrictions in our debt agreements and the amount of our indebtedness may affect our future financial and operating flexibility.
Our total outstanding long-term debt (including current portion)portion and commercial paper) as of December 31, 2021,2023, was $23.7$26.4 billion.
The agreements governing our indebtedness contain covenants that restrict our and our material subsidiaries’ ability to incur certain liens to support indebtedness and our ability to merge or consolidate or sell all or substantially all of our assets in certain circumstances. In addition, certain of our debt agreements contain various covenants that restrict or limit, among other things, our ability to make certain distributions during the continuation of an event of default, the ability of our subsidiaries to incur additional debt, and our, and our material subsidiaries’, ability to enter into certain affiliate transactions and certain restrictive agreements. Certain of our debt agreements also contain, and those we enter into in the future may contain, financial covenants, and other limitations with which we will need to comply.
Our debt service obligations and the covenants described above could have important consequences. For example, they could:
•Make it more difficult for us to satisfy our obligations with respect to our indebtedness, which could in turn result in an event of default on such indebtedness;
•Impair our ability to obtain additional financing in the future for working capital, capital expenditures, acquisitions, general corporate purposes, or other purposes;
•Diminish our ability to withstand a continued or future downturn in our business or the economy generally;
•Require us to dedicate a substantial portion of our cash flow from operations to debt service payments, thereby reducing the availability of cash for working capital, capital expenditures, acquisitions, the payments of dividends, general corporate purposes, or other purposes;
•Limit our flexibility in planning for, or reacting to, changes in our business and the industry in which we operate, including limiting our ability to expand or pursue our business activities and preventing us from engaging in certain transactions that might otherwise be considered beneficial to us.
Our ability to comply with our debt covenants, to repay, extend, or refinance our existing debt obligations and to obtain future credit will depend primarily on our operating performance. Our ability to refinance existing debt obligations or obtain future credit will also depend upon the current conditions in the credit markets and the availability of credit generally. If we are unable to comply with these covenants, meet our debt service obligations, or obtain future credit on favorable terms, or at all, we could be forced to restructure or refinance our indebtedness, seek additional equity capital or sell assets. We may be unable to obtain financing or sell assets on satisfactory terms, or at all.
Our failure to comply with the covenants in the documents governing our indebtedness could result in events of default, which could render such indebtedness due and payable. We may not have sufficient liquidity to repay our indebtedness in such circumstances. In addition, cross-default or cross-acceleration provisions in our debt agreements could cause a default or acceleration to have a wider impact on our liquidity than might otherwise arise from a default or acceleration of a single debt instrument. For more information regarding our debt agreements, please read Note 1312 – Debt and Banking Arrangementsof Notes to Consolidated Financial Statements.Arrangements.
Changes to interest rates or increases in interest rates could adversely impact our access to credit, share price, our ability to issue securities or incur debt for acquisitions or other purposes, and our ability to make cash dividends at our intended levels.
Interest rates have risen in recent years and may increase in the future. As a result, interest rates on future credit facilities and debt offerings could be higher than current levels, causing our financing costs to increase accordingly. As with other yield-oriented securities, our share price will be impacted by the level of our dividends and implied dividend yield. The dividend yield is often used by investors to compare and rank yield-oriented securities for investment decision-making purposes. Therefore, changes in interest rates, either positive or negative, may affect the yield requirements of investors who invest in our shares, and a rising interest rate environment could have an adverse impact on our share price and our ability to issue equity or incur debt for acquisitions or other purposes and to pay cash dividends at our intended levels.
Our hedging activities might not be effective and could increase the volatility of our results.
In an effort to manage our financial exposure related to commodity price and market fluctuations, we have entered, and may in the future enter into contracts to hedge certain risks associated with our assets and operations. In these hedging activities, we have used, and may in the future use, fixed-price, forward, physical purchase, and sales contracts, futures, financial swaps, and option contracts traded in the over-the-counter markets or on exchanges. Nevertheless, no single hedging arrangement can adequately address all risks present in a given contract. For example, a forward contract that would be effective in hedging commodity price volatility risks would not hedge the contract’s counterparty credit or performance risk. Therefore, unhedged risks will always continue to exist. While we attempt to manage counterparty credit risk within guidelines established by our credit policy, we may not be able to successfully manage all credit risk and as such, future cash flows and results of operations could be impacted by counterparty default. The difference in accounting treatment for the underlying position and the financial instrument
used to hedge the value of the contract can cause volatility in our reported net income while the positions are open due to mark-to-market accounting.
Our and our customers’ access to capital could be affected by financial institutions’ policies concerning fossil- fuel related businesses.
Public concern regarding the potential effects of climate change have directed increased attention towards the funding sources of fossil-fuel energy companies. As a result, certain financial institutions, funds, and other sources of capital have restricted or eliminated their investment in certain market segments of fossil-fuel related energy. Ultimately, limiting fossil-fuel related companies’ access to capital could make it more difficult for our customers to secure funding for exploration and production activities or for us to secure funding for growth projects. Such a lack of capital could also both indirectly affect demand for our services and directly affect our ability to fund construction or other capital projects.
Risks Related to Regulations
The operation of our businesses might be adversely affected by regulatory proceedings, changes in government regulations or in their interpretation or implementation, or the introduction of new laws or regulations applicable to our businesses or our customers.
Public and regulatory scrutiny of the energy industry has resulted in the proposal and/or implementation of increased regulations. Such scrutiny has also resulted in various inquiries, investigations, and court proceedings, including litigation of energy industry matters. Both the shippers on our pipelines and regulators have rights to challenge the rates we charge under certain circumstances. Any successful challenge could materially affect our results of operations.
Certain inquiries, investigations, and court proceedings are ongoing. Adverse effects may continue as a result of the uncertainty of ongoing inquiries, investigations, and court proceedings, or additional inquiries and proceedings by federal or state regulatory agencies or private plaintiffs. In addition, we cannot predict the outcome of any of these inquiries or whether these inquiries will lead to additional legal proceedings against us, civil or criminal fines and/or penalties, or other regulatory action, including legislation, which might be materially adverse to the operation of our business and our results of operations or increase our operating costs in other ways. Current legal proceedings or other matters, including environmental matters, suits, regulatory appeals, and similar matters might result in adverse decisions against us which, among other outcomes, could result in the imposition of substantial penalties and fines and could damage our reputation. The result of such adverse decisions, either individually or in the aggregate, could be material and may not be covered fully or at all by insurance.
In addition, existing regulations, including those pertaining to financial assurances to be provided by our businesses in respect of potential asset decommissioning and abandonment activities, might be revised, reinterpreted, or otherwise enforced in a manner that differs from prior regulatory action. New laws and regulations, including those pertaining to oil and gas hedging and cash collateral requirements, might also be adopted or become applicable to us, our customers, or our business activities. The change in thecurrent U.S. governmental administration and its policies, may increasewhich often oppose the development or expansion of fossil fuel energy, have increased the likelihood of such legal and regulatory developments. If new laws or regulations are imposed relating to oil and gas extraction, or if additional or revised levels of reporting, regulation, or permitting moratoria are required or imposed, including those related to hydraulic fracturing, the volumes of natural gas and other products that we transport, gather, process, and treat could decline, our compliance costs could increase, and our results of operations could be adversely affected.
The natural gas sales, transportation, and storage operations of our gas pipelines are subject to regulation by the FERC, which could have an adverse impact on their ability to establish transportation and storage rates that would allow them to recover the full cost of operating their respective pipelines and storage assets, including a reasonable rate of return.
In addition to regulation by other federal, state, and local regulatory authorities, interstate pipeline transportation and storage service is subject to regulation by the FERC. Federal regulation extends to such matters as:
•Transportation and sale for resale of natural gas in interstate commerce;
•Rates, operating terms, types of services, and conditions of service;
•Certification and construction of new interstate pipelines and storage facilities;
•Acquisition, extension, disposition, or abandonment of existing interstate pipelines and storage facilities;
•Accounts and records;
•Depreciation and amortization policies;
•Relationships with affiliated companies that are involved in marketing functions of the natural gas business;
•Market manipulation in connection with interstate sales, purchases, or transportation of natural gas.
Regulatory or administrative actions in these areas, including successful complaints or protests against the rates of the gas pipelines, can affect our business in many ways, including decreasing tariff rates and revenues, decreasing volumes in our pipelines, increasing our costs, and otherwise altering the profitability of our pipeline business.
Our operations are subject to environmental laws and regulations, including laws and regulations relating to climate change and greenhouse gas emissions, which may expose us to significant costs, liabilities, and expenditures that could exceed our expectations.
Our operations are subject to extensive federal, state, tribal, and local laws and regulations governing environmental protection, endangered and threatened species, the discharge of materials into the environment, and the security of chemical and industrial facilities. Substantial costs, liabilities, delays, and other significant issues related to environmental laws and regulations are inherent in the gathering, transportation, storage, processing, and treating of natural gas, fractionation, transportation, and storage of NGLs, and crude oil transportation and production handling as well as waste disposal practices and construction activities. New or amended environmental laws and regulations can also result in significant increases in capital costs we incur to comply with such laws and regulations. Failure to comply with these laws, regulations, and permits may result in the assessment of administrative, civil and/or criminal penalties, the imposition of remedial obligations, the imposition of stricter conditions on or revocation of permits, the issuance of injunctions limiting or preventing some or all of our operations, and delays or denials in granting permits.
Joint and several strict liability may be incurred without regard to fault under certain environmental laws and regulations, for the remediation of contaminated areas and in connection with spills or releases of materials associated with natural gas, oil, and wastes on, under, or from our properties and facilities. Private parties, including the owners of properties through which our pipeline and gathering systems pass and facilities where our wastes are taken for reclamation or disposal, may have the right to pursue legal actions to enforce compliance as well as to seek damages for noncompliance with environmental laws and regulations or for personal injury or property damage arising from our operations. Some sites at which we operate are located near current or former third-party hydrocarbon storage and processing or oil and natural gas operations or facilities, and there is a risk that contamination has migrated from those sites to ours.
We are generally responsible for all liabilities associated with the environmental condition of our facilities and assets, whether acquired or developed, regardless of when the liabilities arose and whether they are known or unknown. In connection with certain acquisitions and divestitures, we could acquire, or be required to provide indemnification against, environmental liabilities that could expose us to material losses, which may not be covered by insurance. In addition, the steps we could be required to take to bring certain facilities into compliance could be prohibitively expensive, and we might be required to shut down, divest, or alter the operation of those facilities, which might cause us to incur losses.
In addition, climate change regulations and the costs that may be associated with such regulations and with the regulation of emissions of GHGs have the potential to affect our business. Regulatory actions by the Environmental Protection Agency or the passage of new climate change laws or regulations could result in increased costs to operate and maintain our facilities, install new emission controls on our facilities, or administer and manage any GHG emissions program. We believe it is possible that future governmental legislation and/or regulation may require us either to limit GHG emissions associated with our operations or to purchase allowances for such emissions. We could also be subjected to a carbon tax assessed on the basis of carbon dioxide emissions or otherwise. However, we cannot predict precisely what form these future regulations might take, the stringency of
any such regulations or when they might become effective. Several legislative bills have been introduced in the United States Congress that would require carbon dioxide emission reductions. Previously considered proposals have included, among other things, limitations on the amount of GHGs that can be emitted (so called “caps”) together with systems of permitted emissions allowances. These proposals could require us to reduce emissions or to purchase allowances for such emissions.
In addition to activities on the federal level, state and regional initiatives could also lead to the regulation of GHG emissions sooner than and/or independent of federal regulation. These regulations could be more stringent than any federal legislation that may be adopted. Future legislation and/or regulation designed to reduce GHG emissions could make some of our activities uneconomic to maintain or operate. We continue to monitor legislative and regulatory developments in this area and otherwise take efforts to limit and reduce GHG emissions from our facilities. Although the regulation of GHG emissions may have a material impact on our operations and rates, we believe it is premature to attempt to quantify the potential costs of the impacts.
If we are unable to recover or pass through a significant level of our costs related to complying with climate change regulatory requirements imposed on us, it could have a material adverse effect on our results of operations and financial condition.
General Risk Factors
We face risks related to the COVID-19 pandemic and other health epidemics.
The global outbreak of the coronavirus, including its variants (COVID-19) is currently impacting countries, communities, supply chains, and markets. We provide a critical service to our customers, which means that it is paramount that we keep our employees safe. We cannot predict whether, and the extent to which, COVID-19 will have a material impact on our business, including our liquidity, financial condition, and results of operations. COVID-19 poses a risk to our employees, our customers, our suppliers, and the communities in which we operate, which could negatively impact our business. To the extent that our access to the capital markets is adversely affected by COVID-19, we may need to consider alternative sources of funding for our operations and for working capital, any of which could increase our cost of capital. Measures to try to contain the virus, such as travel bans and restrictions, quarantines, shelter in place orders, and shutdowns, may cause us to experience operational delays or to delay plans for growth. The extent to which COVID-19 may impact our business will depend on future developments, which are highly uncertain and cannot be predicted, including new information concerning the severity of COVID-19 and the actions taken to contain it or treat its impact, among others. To the extent the COVID-19 pandemic adversely affects our business and financial results, it may also have the effect of heightening many of the other factors described in this report.
We do not insure against all potential risks and losses and could be seriously harmed by unexpected liabilities or by the inability of our insurers to satisfy our claims.
In accordance with customary industry practice, we maintain insurance against some, but not all, risks and losses, and only at levels we believe to be appropriate. The occurrence of any risks not fully covered by our insurance could have a material adverse effect on our business, financial condition, results of operations, and cash flows and our ability to repay our debt.
Failure to attract and retain an appropriately qualified workforce could negatively impact our results of operations.
Events such as an aging workforce without appropriate replacements, mismatch of skill sets to future needs, the challenges of attracting new, qualified workers to the midstream energy industry, or unavailability of contract labor may lead to operating challenges such as lack of resources, loss of knowledge, and a lengthy time period associated with skill development, including with the workforce needs associated with projects and ongoing operations. Failure to hire and adequately obtain replacement employees, including the ability to transfer significant internal historical knowledge and expertise to the new employees, or the future availability and cost of contract labor may adversely affect our ability to manage and operate the businesses. If we are unable to successfully attract and retain an appropriately qualified workforce, including members of senior management, results of operations could be negatively impacted.
Holders of our common stock may not receive dividends in the amount expected or any dividends.
We may not have sufficient cash each quarter to pay dividends or maintain current or expected levels of dividends. The actual amount of cash we dividend may fluctuate from quarter to quarter and will depend on various factors, some of which are beyond our control, including:
•The amount of cash that our subsidiaries distribute to us;
•The amount of cash we generate from our operations, our working capital needs, our level of capital expenditures, and our ability to borrow;
•The restrictions contained in our indentures and credit facility and our debt service requirements;
•The cost of acquisitions, if any.
A failure either to pay dividends or to pay dividends at expected levels could result in a loss of investor confidence, reputational damage, and a decrease in the value of our stock price.
Item 1B. Unresolved Staff Comments
Not applicable.
Item 1C. Cybersecurity
We recognize the increasing volume and sophistication of cyber threats and take our responsibility to protect the information and systems under our purview seriously. Our cybersecurity processes aim to provide a comprehensive approach to assess, identify, and manage material risks arising from these cybersecurity threats.
Comprehensive Cybersecurity Program: We have implemented a comprehensive cybersecurity risk management program (Cybersecurity Program) that is aligned with the National Institute for Standards and Technology Cybersecurity Framework. Our Cybersecurity Program provides a risk-based approach to cybersecurity, and security controls are tailored so that cost-effective controls can be applied commensurate with the risk and sensitivity of specific information systems, control systems, and enterprise data. Our Cybersecurity Program incorporates best practices and industry standards from multiple sources and is designed to comply with applicable regulations. The Cybersecurity Program includes, but is not limited to, the following elements: risk assessment, policies and procedures, training and awareness, auditing, compliance monitoring and testing, and incident response.
Integration with Overall Risk Management: Our cybersecurity processes have been integrated into our overall risk management system and processes. We consider cybersecurity threat risks alongside other Company risks as part of our overall risk assessment process. Our cybersecurity risk professionals collaborate with subject matter specialists, as necessary, to gather insights for identifying and assessing material cybersecurity threat risks, their severity, and potential mitigations.
Engagement of Third Parties: We often engage with specialized third-party assessors, consultants, auditors, and other experts to review, validate, and enhance our cybersecurity practices. Their independent assessments provide an external perspective on our cybersecurity posture, allowing us to leverage best practices from the industry and ensure our defenses remain robust. All third parties engaged for such processes are subjected to rigorous scrutiny to ensure they meet our security standards.
Oversight of Third-party Service Providers: We acknowledge the potential risks associated with our use of third-party service providers. Therefore, we have established processes to oversee and identify material cybersecurity risks that may be associated with third-party service providers with whom we engage. This includes conducting thorough, risk-based due diligence before onboarding, performing security assessments, and confirming adherence to our cybersecurity requirements. We also maintain active communication channels with these providers to stay informed about any potential security incidents or concerns.
Disclosure of Risks: We describe how risks from cybersecurity threats could materially affect us, including our business strategy, results of operations, or financial condition, as part of our risk factor disclosures at Part I, Item 1A of this Annual Report on Form 10-K.
We are committed to continually enhancing our cybersecurity processes and practices to address the dynamic nature of the threats we face and to ensure the security and integrity of our systems and data.
Cybersecurity Governance
Cybersecurity is an important part of our risk management processes and an area of focus for our Board of Directors and management. Each member of our organization, from facility operators to board members, has a responsibility to safeguard our cybersecurity. Our Chief Information Security Officer (CISO) is responsible for our cybersecurity strategy and execution, while the Board and the Audit Committee are responsible for oversight of our cybersecurity risk.
The Cybersecurity Executive Advisory Board (Executive Advisory Board) is led by the CISO, with the Chief Information Officer (CIO), Chief Financial Officer, Chief Human Resources Officer, the General Counsel, and the Chief Operations Officer as standing members. The Executive Advisory Board’s purpose is to ensure enterprise alignment with the Cybersecurity Program and provide executive oversight of the Cybersecurity Program.
Our Board of Directors oversees cybersecurity-related policy and strategy. As part of this oversight, our CISO provides a cybersecurity dashboard that is reviewed by the Board at every regularly scheduled Board meeting, which
includes key performance indicators for cybersecurity process maturity, operational performance, and enterprise performance toward Transportation Security Administration (TSA) compliance. Additionally, our CIO and/or CISO presents to the Board bi-annually regarding our cybersecurity risks and strategies, including as part of our annual long-term strategy session. The Audit Committee, comprised of independent directors, reviews the implementation and effectiveness of cybersecurity risk management protocols and reviews the effectiveness of cybersecurity as part of the Company’s accounting and internal control policies. As part of this oversight, our CIO presents to the Audit Committee bi-annually, as well as periodically in conjunction with any internal audits related to cybersecurity. Additionally, we have protocols by which cybersecurity incidents that meet established reporting thresholds are escalated internally and, where appropriate, are reported to the Board, as well as ongoing updates regarding any such incident until it has been addressed.
Our CIO has been in his role at Williams for over 10 years and has over 30 years of combined Information Technology experience with a broad scope of responsibility. He has provided senior leadership support of the cybersecurity and risk management programs since 2013. Our CIO holds a bachelor’s degree in management information systems (MIS) from the University of Oklahoma and a Master of Business Administration in MIS from the University of Dallas.
Our CISO has been at Williams for over 25 years. During that time, he has held a variety of IT positions at multiple levels in the organization ranging from network engineering to application development, project management as well as several IT Manager and Director roles. He has had oversight of our cybersecurity and risk management programs since 2017. Active in government and private sector partnerships, he is currently serving as the outgoing Chair of the Oil & Natural Gas Subsector Coordinating Council and recently acted as the Chair of the Interstate Natural Gas Association of America security committee. Our CISO holds degrees in Business Administration and MIS from the University of Oklahoma and is certified in Leadership from Harvard Business School’s executive education. In 2018, he obtained his Chief Information Security Officer certification from Carnegie Mellon University.
Item 2. Properties
Please read “Business” for a description of the location and general character of our principal physical properties. We generally own our facilities, although a substantial portion of our pipeline and gathering facilities is constructed and maintained pursuant to rights-of-way, easements, permits, licenses, or consents on and across properties owned by others.
Item 3. Legal Proceedings
Environmental
Certain reportable legal proceedings involving governmental authorities under federal, state, and local laws regulating the discharge of materials into the environment are described below. While it is not possible for us to predict the final outcome of the proceedings that are still pending, we do not anticipate a material effect on our consolidated financial position if we receive an unfavorable outcome in any one or more of such proceedings. Our threshold for disclosing material environmental legal proceedings involving a governmental authority where potential monetary sanctions are involved is $1 million.
On January 19, 2016, we received a Notice of Noncompliance with certain Leak Detection and Repair (LDAR) regulations under the Clean Air Act at our Moundsville Fractionator Facility from the EPA, Region 3. Subsequently, the EPA alleged similar violations of certain LDAR regulations at our Oak Grove Gas Plant. On March 19, 2018, we received a Notice of Violation of certain LDAR regulations at our former Ignacio Gas Plant from the EPA, Region 8, following an on-site inspection of the facility. On March 20, 2018, we also received a Notice of Violation of certain LDAR regulations at our Parachute Creek Gas Plant from the EPA, Region 8. All such notices were subsequently referred to a common attorney at the Department of Justice (DOJ). We are exploringhave entered into a consent decree with the DOJ and other agencies regarding global resolution of the claims at these facilities, as well as alleged violations at certain other facilities, with the DOJ. Global resolution would includefacilities. The consent decree, which became effective on December 26, 2023, imposes both payment of a civil penalty in the amount of $3.75 million and an injunctive relief component. We continue to work with the DOJ and the other agencies to resolve these claims, whether individually or globally, and negotiations are ongoing.
Other environmental matters called for by this Item are described under the caption “Environmental Matters” in Note 1917 – Contingent LiabilitiesContingencies and Commitments of Notes to Consolidated Financial Statements included under Part II, Item 8 Financial Statements of this report, which information is incorporated by reference into this Item.
Other litigation
The additional information called for by this Item is provided in Note 1917 – Contingent LiabilitiesContingencies and Commitments of Notes to Consolidated Financial Statements included under Part II, Item 8 Financial Statements of this report, which information is incorporated by reference into this Item.
Item 4. Mine Safety Disclosures
Not applicable.
Information About Our Executive Officers
The name, title, age, period of service, and recent business experience of each of our executive officers as of February 28, 2022,21, 2024, are listed below.
| | | | | | | | | | | | | | | | | | | | |
| Name and Position | | Age | | Business Experience in Past Five Years (or Relevant Business Experience) |
| | | | | | |
| Alan S. Armstrong | | 5961 | | 2011 to present | | Director, Chief Executive Officer, and President, The Williams Companies, Inc. |
| Director, Chief Executive Officer, and President | | | | 2015 to 2018 | | Chairman of the Board, Williams Partners L.P. |
| | | | | 2014 to 2018 | | Chief Executive Officer, Williams Partners L.P. |
| | | | 2012 to 2018 | | Director of the general partner, Williams Partners L.P. |
Walter J. BennettMicheal G. Dunn | | 58 | | 2017 to present | | Executive Vice President and Chief Operating Officer, The Williams Companies, Inc. |
| Executive Vice President and Chief Operating Officer | | | | 2017 to 2018 | | Director of the general partner, Williams Partners L.P. |
| Mary A. Hausman | | 52 | | 20202022 to present | | Vice President, Chief Accounting Officer and Controller, The Williams Companies, Inc. |
| Vice President, Chief Accounting Officer and Controller | | | | 2019 to 2022 | | Staff Vice President of Internal Audit, The Williams Companies, Inc. |
| | | | 2019 | | Director Special Projects, The Williams Companies, Inc. |
| | | | 2013 to 2019 | | Vice President and Chief Accounting Officer, NV Energy (a Berkshire Hathaway Energy Company) |
Larry C. Larsen
| | 49 | | 2022 to present | | Senior Vice President Gathering & Processing, The Williams Companies, Inc. |
| Senior Vice President Gathering & Processing | | | | 20152020 to 20192021 | | Senior Vice President – West,Strategic Development, The Williams Companies, Inc. |
| | | | 2019 to 2020 | | Vice President Rocky Mountain Midstream, The Williams Companies, Inc. |
| | | | 2018 to 2019 | | 2013Vice President GM Rocky Mountain Midstream, The Williams Companies, Inc. |
| | | | 2017 to 2018 | | Vice President Central Services, The Williams Companies, Inc. |
| Eric J. Ormond | | 37 | | 2023 to present | | Senior Vice President Project Execution, The Williams Companies, Inc. |
Senior Vice President – West of the general partner, WilliamsProject Execution | | | | 2023 | | Senior Vice President Commercial Operations, Engineering & Project Management, Crestwood Midstream Partners L.P.LP |
| | | | 2020 to 2023 | | | | 2017 | | Director of the general partner, WilliamsSenior Vice President Engineering & Project Management, Crestwood Midstream Partners L.P.LP |
| | | | 2017 to 2020 | | Vice President Strategic Development & New Ventures, Crestwood Midstream Partners LP |
Debbie Cowan(Cowan) Pickle | | 46 | | 44 | | 2018 to present | | Senior Vice President and Chief Human Resources Officer, The Williams Companies, Inc. |
| Senior Vice President and Chief Human Resources Officer | | | | 2013 to 2018 | | Global Vice President of Human Resources, Koch Chemical Technology Group, LLC |
| Micheal G. Dunn | | 56 | | 2017 to present | | Executive Vice President and Chief Operating Officer, The Williams Companies, Inc.
Executive Vice President and Chief Operating Officer | | | | 2017 to 2018 | | Director of the general partner, Williams Partners L.P. |
Scott A. Hallam | | 45 | | 2020 to present | | Senior Vice President Transmission & Gulf of Mexico, The Williams Companies, Inc. |
Senior Vice President Transmission & Gulf of Mexico | | | | 2019 | | Senior Vice President – Atlantic-Gulf, The Williams Companies, Inc. |
| | | | 2017 to 2019 | | Vice President GM Atlantic-Gulf, The Williams Companies, Inc. |
| | | | 2015 to 2017 | | Vice President Northeast OA, The Williams Companies, Inc. |
Mary A. Hausman | | 50 | | 2022 to present | | Vice President, Chief Accounting Officer and Controller, The Williams Companies, Inc. |
Vice President, Chief Accounting Officer and Controller | | | | 2019 to 2022 | | Staff Vice President of Internal Audit, The Williams Companies, Inc. |
| | | | 2019 | | Director Special Projects, The Williams Companies, Inc. |
| | | | 2013 to 2019 | | Vice President and Chief Accounting Officer, NV Energy (a Berkshire Hathaway Energy Company) |
| | | | | | |
| | | | | | | | | | | | | | | | | | | | |
| Name and Position | | Age | | Business Experience in Past Five Years (or Relevant Business Experience) |
| | | | | | |
| John D. Porter | | 5254 | | 2022 to present | | Senior Vice President and Chief Financial Officer, The Williams Companies, Inc. |
| Senior Vice President and Chief Financial Officer | | | | 2020 to 2021 | | Vice President, Chief Accounting Officer, Controller and Financial Planning & Analysis, The Williams Companies, Inc. |
| | | | 2017 to 2019 | | Vice President Enterprise Financial Planning & Analysis and Investor Relations, The Williams Companies, Inc. |
| | | | 2013 to 2017 | | Director of Investor Relations & Enterprise Planning, The Williams Companies, Inc. |
| Chad A. Teply | | 5052 | | 2023 to present | | Senior Vice President – Transmission & Gulf of Mexico, The Williams Companies, Inc. |
| Senior Vice President – Transmission & Gulf of Mexico | | | | 2020 to present2023 | | Senior Vice President – Project Execution, The Williams Companies, Inc. |
| Senior Vice President – Project Execution | | | 2017 to 2020 | | Senior Vice President – Business Policy and Development, PacifiCorp (a Berkshire Hathaway Energy Company) |
| | | | 2009 to 2017 | | Vice President – Resource Development and Construction, PacifiCorp (a Berkshire Hathaway Energy Company) |
T. Lane Wilson
| | 5557 | | 2017 to present | | Senior Vice President and General Counsel, The Williams Companies, Inc. |
| Senior Vice President and General Counsel | | | | | 2009 to 2017 | | United States Magistrate Judge for the Northern District of Oklahoma
| Chad J. Zamarin | | 4547 | | 2023 to present | | Executive Vice President of Corporate Strategic Development, The Williams Companies, Inc. |
| Executive Vice President of Corporate Strategic Development | | | | 2017 to present2023 | | Senior Vice President – Corporate Strategic Development, The Williams Companies, Inc. |
| Senior Vice President – Corporate Strategic Development | | | 2017 to 2018 | | Director of the general partner, Williams Partners L.P. |
| | | | 2014 to 2017 | | President – Pipeline and Midstream, Cheniere Energy, Inc. |
| | | | | | |
PART II
Item 5. Market for Registrant’s Common Equity, Related Stockholder Matters and Issuer Purchases of Equity Securities
Our common stock is listed on the New York Stock Exchange under the symbol “WMB.” At the close of business on February 18, 2022,16, 2024, we had 6,1755,803 holders of record of our common stock.
Share Repurchase Program
| | | | | | | | | | | | | | | | | | | | | | | | | | |
| ISSUER PURCHASES OF EQUITY SECURITIES |
| Period | |
Total Number of Shares Purchased | |
Average Price Paid Per Share | |
Total Number of Shares Purchased as Part of Publicly Announced Plans or Programs(1) | |
Maximum Number (or Approximate Dollar Value) of Shares that May Yet Be Purchased Under the Plans or Programs |
| October 1 - October 31, 2023 | | — | | | $ | — | | | — | | | $ | 1,360,938,325 | |
| November 1 - November 30, 2023 | | — | | | $ | — | | | — | | | $ | 1,360,938,325 | |
| December 1 - December 31, 2023 | | — | | | $ | — | | | — | | | $ | 1,360,938,325 | |
| Total | | — | | | | | — | | | |
(1)In September 2021, our Board of Directors authorized a share repurchase program with a maximum dollar limit of $1.5 billion. Repurchases may be made from time to time in the open market, by block purchases, in privately negotiated transactions, or in such other manner as determined by our management. Our management will also determine the timing and amount of any repurchases based on market conditions and other factors. The share repurchase program does not obligate us to acquire any particular amount of common stock, and it may be suspended or discontinued at any time. This share repurchase program does not have an expiration date. There were no repurchases under the program as of December 31, 2021.
Performance Graph
Set forth below is a line graph comparing our cumulative total stockholder return on our common stock (assuming reinvestment of dividends) with the cumulative total return of the S&P 500 Stock Index, the Bloomberg Americas Pipelines Index, and the Arca Natural Gas Index for the period of five fiscal years commencing January 1, 2017.2019. The Bloomberg Americas Pipelines Index is composed of Enbridge Inc., TC Energy Corporation, Kinder Morgan, Inc., ONEOK, Inc., Cheniere Energy, Inc., Pembina Pipeline Corporation, Targa Resources Corp., Hess Midstream LP, and Williams. The Arca Natural Gas Index is comprised of over 20 highly capitalized companies in the natural gas industry involved primarily in natural gas exploration and production and natural gas pipeline transportation and transmission. The graph below assumes an investment of $100 at the beginning of the period.
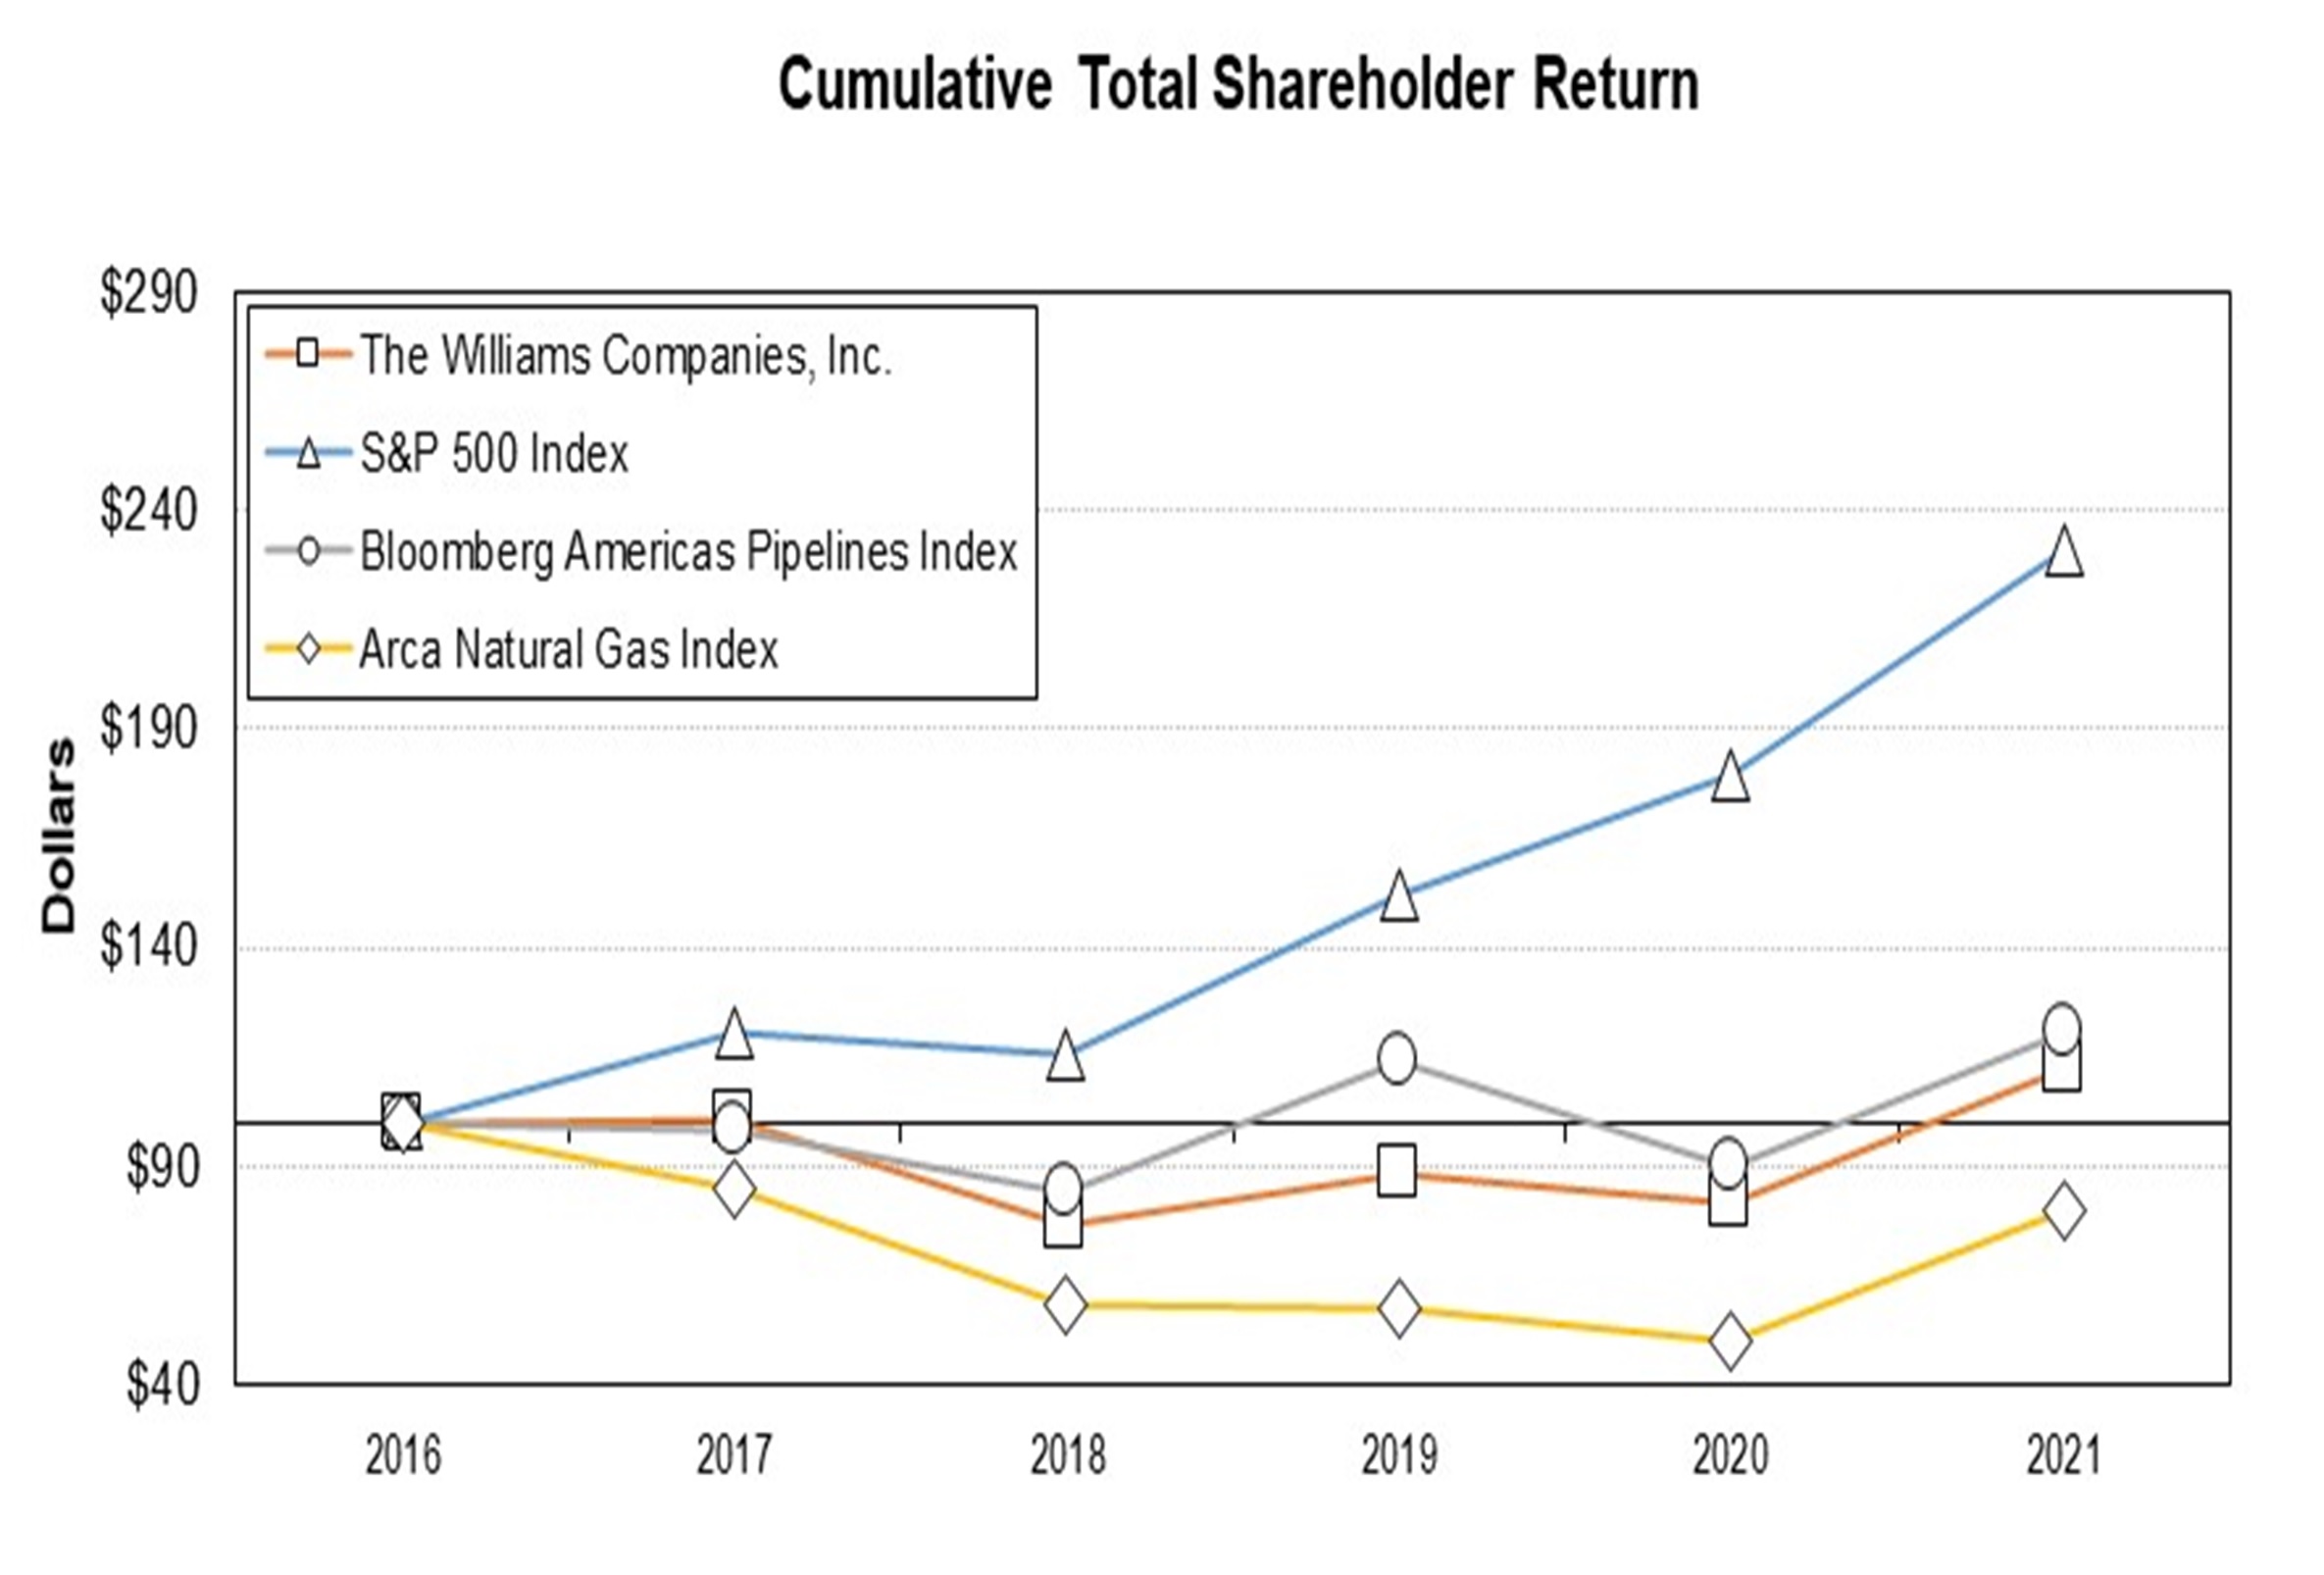
| | | | | | | | | | | | | | | | | | | | | | | | | | | | | | | | | | | |
| 2016 | | 2017 | | 2018 | | 2019 | | 2020 | | 2021 |
| The Williams Companies, Inc. | 100.0 | | 101.0 | | 76.9 | | 87.8 | | 81.1 | | 112.3 |
| S&P 500 Index | 100.0 | | 120.8 | | 115.5 | | 151.8 | | 179.8 | | 231.3 |
| Bloomberg Americas Pipelines Index | 100.0 | | 98.2 | | 84.2 | | 113.9 | | 90.1 | | 120.8 |
| Arca Natural Gas Index | 100.0 | | 85.2 | | 58.2 | | 57.5 | | 49.7 | | 79.8 |
| | | | | | | | | | | | | | | | | | | | | | | | | | | | | | | | | | | |
| 2018 | | 2019 | | 2020 | | 2021 | | 2022 | | 2023 |
| The Williams Companies, Inc. | 100.0 | | 114.2 | | 105.5 | | 146.1 | | 194.2 | | 217.4 |
| S&P 500 Index | 100.0 | | 131.5 | | 155.6 | | 200.3 | | 164.0 | | 207.0 |
| Bloomberg Americas Pipelines Index | 100.0 | | 135.3 | | 107.0 | | 143.5 | | 165.8 | | 177.3 |
| Arca Natural Gas Index | 100.0 | | 98.8 | | 85.5 | | 137.1 | | 175.5 | | 189.1 |
Item 7. Management’s Discussion and Analysis of Financial Condition and Results of Operations
General
We are an energy company committed to being the leader in providing infrastructure that safely delivers natural gas products to reliably fuel the clean energy economy. Our operations are located in the United States.
Our interstate natural gas pipeline strategy is to create value by maximizing the utilization of our pipeline capacity by providing high quality, low costhigh-quality, low-cost transportation of natural gas to large and growing markets. Our gas pipeline businesses’ interstate transmission and storage activities are subject to regulation by the FERC and as such, our rates and charges for the transportation of natural gas in interstate commerce, and the extension, expansion or abandonment of jurisdictional facilities and accounting, among other things, are subject to regulation. The rates are established primarily through the FERC’s ratemaking process, but we also may negotiate rates with our customers pursuant to the terms of our tariffs and FERC policy. Changes in commodity prices and volumes transported have limited near-term impact on these revenues because the majority of cost of service is recovered through firm capacity reservation charges in transportation rates.
The ongoing strategy of our midstream operations is to safely and reliably operate large-scale midstream infrastructure where our assets can be fully utilized and drive low per-unit costs. We focus on consistently attracting new business by providing highly reliable service to our customers. These services include natural gas gathering, processing, treating, compression and compression,storage, NGL fractionation, transportation and transportation,storage, crude oil production handling and transportation, as well as marketing services for NGL, crude oil, and natural gas, as well as storage facilities.gas.
Consistent with the manner in which our chief operating decision maker evaluates performance and allocates resources, our operations are conducted, managed, and presented within the following reportable segments: Transmission & Gulf of Mexico, Northeast G&P, West, and Sequent.Gas & NGL Marketing Services. All remaining business activities, including our upstream operations and corporate activities, are included in Other. As of December 31, 2021, ourOur reportable segments are comprised of the following businesses:business activities:
•Transmission & Gulf of Mexico is comprised of our interstate natural gas pipelines, Transco, and Northwest Pipeline, and MountainWest, and their related natural gas storage facilities, as well as natural gas gathering and processing and crude oil production handling and transportation assets in the Gulf Coast region, including a 51 percent interest in Gulfstar One, (a consolidated variable interest entity), which is a proprietary floating production system, a 50 percent equity-method investment in Gulfstream, and a 60 percent equity-method investment in Discovery. Transmission & Gulf of Mexico also includes natural gas storage facilities and pipelines providing services in north Texas.
•Northeast G&P is comprised of our midstream gathering, processing, and fractionation businesses in the Marcellus Shale region primarily in Pennsylvania and New York, and the Utica Shale region of eastern Ohio, as well as a 65 percent interest in our Northeast JV (a consolidated variable interest entity) which operates in West Virginia, Ohio, and Pennsylvania, a 66 percent interest in Cardinal (a consolidated variable interest entity) which operates in Ohio, a 69 percent equity-method investment in Laurel Mountain, a 50 percent equity-method investment in Blue Racer, (we previously effectively owned a 29 percent indirect interest in Blue Racer through our 58 percent equity-method investment in BRMH until acquiring a controlling interest of BRMH in November 2020 and the remaining interest in September 2021), and Appalachia Midstream Investments, a wholly owned subsidiary that owns equity-method investments with an approximate average 66 percent interest in multiple gas gathering systems in the Marcellus Shale region.Investments.
•West is comprised of our gas gathering, processing, and treating operations in the Rocky Mountain region of Colorado and Wyoming, the Barnett Shale region of north-central Texas, the Eagle Ford Shale region of south Texas, the Haynesville Shale region of east Texas and northwest Louisiana, and the Mid-Continent region which includes the Anadarko and Permian basins.basins, and the DJ Basin of Colorado which includes RMM, a former 50 percent equity-method investment in which we acquired the remaining ownership interest in November 2023. This segment also includes our NGL and natural gas marketing business (excluding the activities within the Sequent segment described below), storage facilities, an undivided 50 percent interest in an NGL fractionator near Conway, Kansas, a 50 percent equity-method investment in OPPL, a 50 percent equity-method investment in RMM, a 20 percent equity-method investment in Targa Train 7, and a 15 percent interestequity-method investment in Brazos Permian II, LLC (Brazos Permian II).II.
•SequentGas & NGL Marketing Services is comprised of our NGL and natural gas marketing and trading operations, which includes the operations of Sequent Energy Management, L.P. and Sequent Energy Canada, Corp. acquired on July 1, 2021 (Sequent Acquisition). Sequent focuses on risk management and transactions related to the marketing,
trading, storage and transportation of natural gas for a diverse set of natural gas utilities, municipalities, power generators, and producers, and moves gas to markets through transportation and storage agreementsNGLs on strategically positioned assets, including our Transco system.assets.
•
Other includes our upstream operations and minor business activities that are not reportable segments, as well as corporate operations.
Unless indicated otherwise, the following discussion and analysis of results of operations and financial condition and liquidity relates to our current continuing operations and should be read in conjunction with the consolidated financial statements and notes thereto included in Part II, Item 8 of this report.
Dividends
In December 2021,2023, we paid a regular quarterly dividend of $0.41$0.4475 per share. On February 1, 2022,January 30, 2024, our board of directors approved a regular quarterly dividend of $0.425$0.4750 per share payable on March 28, 2022.25, 2024.
Overview of the Results of Operations
Net income (loss) attributable to The Williams Companies, Inc. for the year ended December 31, 2021,2023, increased by $1.3$1.13 billion over the prior year, reflecting $223 million of higher net realized commodity margins, $280 million of increased earnings from equity-method investments, primarily due to the absenceyear. Further discussion of our $78 million share of a 2020 impairment of goodwill at West and higher volumes within Northeast G&P, as well as net realized product sales from upstream operations of $313 million and $106 million of higher transportation fee revenues associated with expansion projects placedresults is found in service at Transco in 2020 and 2021. The improvement over last year was partially offset by $314 million of higher operating and administrative costs, $121 million of higher depreciation and amortization expense, and a $109 million unfavorable impact of 2021 net unrealized losses from commodity derivative instruments at Sequent. The improvement over last year also reflects the absence of $1.4 billion in pre-tax charges in 2020 related to impairments of equity-method investments, goodwill, and certain assets, of which $65 million was attributable to noncontrolling interests. The provision for income taxes changed unfavorably by $432 million primarily due to higher pre-tax income.
The Sequent segment includes $109 million of net unrealized losses from commodity derivatives not designated as hedges for accounting purposes. Sequent can experience significant earnings volatility from the fair value accounting required for the derivatives used to hedge a portion of the economic value of the underlying transportation and storage portfolio. However, the unrealized fair value measurement gains and losses are generally offset by valuation changesthis report in the economic valueResults of the underlying transportation and storage portfolio, which is not recognized until the underlying transportation and storage transaction occurs.Operations.
Recent Developments
Share Repurchase ProgramExpansion Project Updates
In September 2021, our Board of Directors authorized a share repurchase programSignificant expansion project updates for the period, including projects placed into service are described below. Ongoing major expansion projects are discussed later in Company Outlook.
Northeast G&P
Susquehanna Supply Hub Gathering Expansion
We have an agreement in place with a maximum dollar limit of $1.5 billion. Repurchases may be made from timethird party for a construction project to timefacilitate natural gas production growth in the open market, by block purchases,Susquehanna region. We constructed approximately 22 miles of gathering pipeline and associated incremental compression. The system added incremental natural gas gathering capacity of 320 MMcf/d. This project went into service in privately negotiated transactions, or in such other manner as determined by our management. Our management will also determine the timing and amountfourth quarter of any repurchases based on market conditions and other factors. The share repurchase program does not obligate us to acquire any particular amount of common stock, and it may be suspended or discontinued at any time. This stock repurchase program does not2023.
Utica Shale Gathering Expansion
We have an expiration date. There were no repurchases under the program as of December 31, 2021.
Sequent Acquisition
In July 2021, we completed the acquisition of 100 percent of Sequent. Total considerationagreement in place with a third party for this acquisition was $159 million, which included $109 million relateda construction project to working capital. Sequent focuses on risk management and the marketing, trading, storage, and transportation offacilitate natural gas for a diverse setproduction growth in the Utica region on our Cardinal gathering system. We constructed approximately 30 miles of gathering pipeline and associated incremental compression. The system added incremental natural gas utilities, municipalities, power generators, and producers, and moves gas to markets through transportation and storage agreements on strategically positioned assets, including our Transco system. The additiongathering capacity of Sequent complements
the geographic footprint125 MMcf/d. Phase 1 of our core pipeline transportation and storage business, enhances our gas marketing capabilities, and expands the suite of services we provide to our existing midstream customers.
Upstream Joint Ventures
Inthis project was placed into service in the third quarter of 2021, we conveyed certain oil2023 and gas propertiesPhase 2 went into service in the Wamsutter field, which we acquired in 2021, to a venture along with certain oil and gas properties conveyed by a third-party operator in the region. Under the terms of the agreement, the third party owns a 25 percent and we own a 75 percent undivided interest in each well’s working interest. We will retain ownership in the undeveloped acreage until certain acreage earning hurdles are met, at which time the remaining undeveloped acreage will be conveyed to the third party resulting in the third party owning 50 percent and us owning 50 percent. The combined properties consist of over 1.2 million net acres and an interest in over 3,500 wells.
In the thirdfourth quarter of 2021, we sold 50 percent of certain existing wells and wellbore rights in the South Mansfield area of the Haynesville Shale region to a third party operator, in a strategic effort to develop the acreage, thereby enhancing the value of our midstream natural gas infrastructure. Under the agreement, the third party will operate the upstream position and develop the undeveloped acreage. We will retain ownership in the undeveloped acreage until certain acreage earning and carried interest hurdles are met, at which time remaining undeveloped acreage will be conveyed to the third party resulting in the third party owning 75 percent and us owning 25 percent.
Expansion Project Update2023.
Transmission & Gulf of Mexico
Leidy SouthRegional Energy Access
In July 2020,January 2023, we received approval from the FERC for the project to expand Transco’s existing natural gas transmission system and also extend its system through a capacity lease with National Fuel Gas Supply Corporation that will enable us to provide incremental firm transportation capacity from Clermont,receipt points in northeastern Pennsylvania to multiple delivery points in Pennsylvania, New Jersey, and from the Zick interconnection on Transco’s Leidy Line to the River Road regulating station in Lancaster County, Pennsylvania.Maryland. We placed 125 Mdth/dapproximately half of capacity under the project into service in the fourth quarter of 2020,2023 and in September and October of 2021, we placed approximately 382 Mdth/d of additional capacity into service. We placedplan to place the remainder of the project into service in December 2021.as early as the fourth quarter of 2024, assuming timely receipt of all necessary regulatory approvals. The project increasedis expected to increase capacity by 582829 Mdth/d.
Southeastern TrailAcquisitions and Divestitures (see Note 3 – Acquisitions and Divestitures)
InGulf Coast Storage Acquisition
On January 3, 2024, we closed on the acquisition of 100 percent of a strategic portfolio of natural gas storage facilities and pipelines, located in Louisiana and Mississippi, from Hartree Partners LP for $1.95 billion, subject to working capital and post-closing adjustments. The purpose of this acquisition was to expand our natural gas storage footprint in the Gulf Coast region, and will be reported in the Transmission & Gulf of
Mexico segment. The Gulf Coast Storage Acquisition was funded with cash on hand and $100 million of deferred consideration.
DJ Basin Acquisitions
On November 30, 2023, we closed on the acquisition of 100 percent of Cureton, whose operations are located in the DJ Basin, for $546 million, subject to working capital and post-closing adjustments. Concurrently, we closed on the acquisition of an additional 50 percent interest in our equity-method investment RMM for $704 million. We now own 100 percent of and consolidate RMM. The purpose of these acquisitions was to expand our gathering and processing footprint in the DJ Basin. The Cureton Acquisition was funded with cash on hand. Substantially all of the RMM purchase price is not due to the seller until the first quarter of 2025, does not accrue interest until the fourth quarter of 2024, and may be repaid early without penalty. These businesses are reported within the West segment.
Sale of Certain Gulf Coast Liquids Pipelines
On September 29, 2023, we completed the sale of various petrochemical and feedstock pipelines and associated contracts in the Gulf Coast region for $348 million. As a result of this sale, we recorded a gain of $129 million in 2023 in our Transmission & Gulf of Mexico segment.
MountainWest Acquisition
On February 14, 2023, we closed on the acquisition of 100 percent of MountainWest Pipelines Holding Company which includes FERC-regulated interstate natural gas pipeline systems and natural gas storage capacity, for $1.08 billion of cash, funded with available sources of short-term liquidity, and retaining $430 million outstanding principal amount of MountainWest long-term debt. The MountainWest Acquisition expands our existing transmission and storage infrastructure footprint into major markets in Utah, Wyoming, and Colorado. This business is reported within the Transmission & Gulf of Mexico segment.
Favorable Judgment Against Energy Transfer
We have been involved in litigation since 2016 in Delaware Chancery Court with Energy Transfer Equity, L.P. (Energy Transfer) related to the Agreement and Plan of Merger with Energy Transfer, dated as of September 28, 2015. On December 29, 2021, the court entered judgment in our favor in the amount of $410 million, plus interest at the contractual rate, and our reasonable attorneys’ fees and expenses. On September 21, 2022, the Delaware Chancery Court entered a final order and judgment awarding us a termination fee, attorney’s fees, expenses, and interest in the amount of $602 million plus additional interest starting September 17, 2022. Energy Transfer appealed to the Delaware Supreme Court. The Delaware Supreme Court held oral argument en banc on July 12, 2023. On October 2019,10, 2023, the Delaware Supreme Court issued an opinion affirming the Delaware Chancery Court ruling. On October 25, 2023, Energy Transfer filed a motion for reargument with the Delaware Supreme Court, which was denied.
On November 28, 2023, we received a $627 million payment from Energy Transfer for the final order and judgment. On the same day, we paid attorney fees which had been incurred on a contingent fee basis. This resulted in a net gain of $534 million reported as Net gain from Energy Transfer litigation judgment in our Consolidated Statement of Income for the year ended December 31, 2023 (See Note 17 – Contingencies and Commitments).
Northwest Pipeline FERC Rate Case Settlement
On November 15, 2022, Northwest Pipeline received approval from the FERC to expand Transco’s existing natural gas transmission system to provide incremental firm transportation capacity from the Pleasant Valley interconnect with Dominion’s Cove Point Pipeline in Virginia to the Station 65 pooling point in Louisiana. We placed 230 Mdth/d of capacity under the project into servicefor a stipulation and settlement agreement which generally reduces rates effective January 1, 2023, resolves other rate issues, establishes a Modernization and Emission Reduction Program, and satisfies its rate case filing obligation. Provisions were included in the fourth quarter of 2020, and the project was fullysettlement that establish a moratorium on any proceedings that would seek to place new rates in service oneffect any earlier than January 1, 2021. In total, the project increased capacity by 296 Mdth/d.2026, and that a general rate case filing will be made for rates to become effective not later than April 1, 2028, unless we have entered into a pre-filing settlement prior to that date.
The outbreak of COVID-19 severely impacted global economic activity and caused significant volatility and negative pressure in financial markets. We continue to monitor the COVID-19 pandemic and have taken steps intended to protect the safety of our customers, employees, and communities, and to support the continued delivery of safe and reliable service to our customers and the communities we serve. Our financial condition, results of operations, and liquidity have not been materially impacted by effects of COVID-19.
Company Outlook
Our strategy is to provide a large-scale, reliable, and clean energy infrastructure designed to maximize the opportunities created by the vast supply of natural gas and natural gas products that exists in the United States. We accomplish this by connecting the growing demand for cleaner fuels and feedstocks with our major positions in the premier natural gas and natural gas products supply basins. We continue to maintain a strong commitment to safety,
environmental stewardship including seeking opportunities for renewable energy ventures, operational excellence, and customer satisfaction. We believe that accomplishing these goals will position us to deliver safe, reliable, clean energy services to our customers and an attractive return to our shareholders. Our business plan for 20222024 includes a continued focus on earnings and cash flow growth.
In 2022,2024, our operating results are expected to benefit from growth in our Ohio Valley Midstream, Cardinal, Susquehanna,the recent Gulf Coast Storage and Haynesville areas.DJ Basin acquisitions. We also anticipate increases resulting from recently completed TranscoTransmission & Gulf of Mexico expansion projects, including the Regional Energy Access project, and development ofannual inflation-based rate increases across our upstream oilgathering and gas properties.processing business. These increases are partially offset by lower expected Gas & NGL Marketing Services results, the absence of favorable resultsrealized hedge gains captured during Winter Storm Uri in 2021 by our commodity marketing business2023, and a decrease in expected volumes in the Appalachian Basin associated with a lower expected results in the Bradford Supply Hub primarily due to lower gathering rates resulting from annual cost of service contract redetermination.commodity price environment.
We seek to maintain a strong financial position and liquidity, as well as manage a diversified portfolio of safe, clean, and reliable energy infrastructure assets that continue to serve key growth markets and supply basins in the United States. Our growth capital and investment expenditures in 20222024 are expected to be in a range from $1.25$1.45 billion to $1.35 billion.$1.75 billion, excluding acquisitions. Growth capital spending in 20222024 primarily includes Transco expansions, all of which are fully contracted with firm transportation agreements, projects supporting growth in the Haynesville Basin, and projects supporting the Northeast G&P business, opportunities in the Haynesville area, and an expansion in the Western Gulf area.business. We also expect to invest capital in the development of our upstream oil and gas properties.Other segment ventures. In addition to growth capital and investment expenditures, we also remain committed to projects that maintain our assets for safe and reliable operations, as well as projects that reduce emissions, and meet legal, regulatory, and/or contractual commitments.
Potential risks and obstacles that could impact the execution of our plan include:
•Continued negative impacts of COVID-19 driving aA global recession, which could result in downturns in financial markets and commodity prices, as well as impact demand for natural gas and related products;
•Opposition to, and regulations affecting, our infrastructure projects, including the risk of delay or denial in permits and approvals needed for our projects;
•Counterparty credit and performance risk;
•Unexpected significant increases in capital expenditures or delays in capital project execution;execution, including increases from inflation or delays caused by supply chain disruptions;
•Unexpected changes in customer drilling and production activities, which could negatively impact gathering and processing volumes;
•Lower than anticipated demand for natural gas and natural gas products which could result in lower than expectedlower-than-expected volumes, energy commodity prices, and margins;
•General economic, financial markets, or industry downturns, including increased inflation and interest rates;
•Physical damages to facilities, including damage to offshore facilities by weather-related events;
•Other risks set forth under Part I, Item 1A. Risk Factors in this report.
Expansion Projects
Our ongoing major expansion projects include the following:
Transmission & Gulf of Mexico
Deepwater Shenandoah Project
In June 2021, we reached an agreement with two third-parties to provide offshore natural gas gathering and transportation services as well as onshore natural gas processing services. The project expands our existing Gulf of Mexico offshore infrastructure via a 5-mile offshore lateral pipeline from the Shenandoah platform to Discovery’s existing Keathley Canyon Connector pipeline, adds onshore processing facilities at Larose, Louisiana to handle the expected rich Shenandoah production, and the natural gas liquids will be fractionated and marketed at Discovery’s Paradis plant in Louisiana. We plan to place the project into service in the fourth quarter of 2024.
Deepwater Whale Project
In August 2021, we reached an agreement with two third-parties to provide offshore natural gas gathering and crude oil transportation services as well as onshore natural gas processing services. The project expands our existing Western Gulf of Mexico offshore infrastructure via a 26-mile gas lateral pipeline from the Whale platform to the existing Perdido gas pipeline and adds a new 125-mile oil pipeline from the Whale platform to our existing junction platform. We plan to place the project into service in the fourth quarter of 2024.
Regional Energy Access
In March 2021,January 2023, we filed an application withreceived approval from the FERC for the project to expand Transco’s existing natural gas transmission system to provide incremental firm transportation capacity from receipt points in northeastern Pennsylvania to multiple delivery points in Pennsylvania, New Jersey, and Maryland. We placed approximately half of the project into service in the fourth quarter of 2023 and plan to place the remainder of the project into service as early as the fourth quarter of 2024, assuming timely receipt of all necessary regulatory approvals. The project is expected to increase capacity by 829 Mdth/d.
Southside Reliability Enhancement
In July 2023, we received approval from the FERC for the project, which involves an expansion of Transco’s existing natural gas transmission system to provide incremental firm transportation capacity from receipt points in Virginia and North Carolina to delivery points in North Carolina. We plan to place the project into service as early as the fourth quarter of 2024, assuming timely receipt of all necessary regulatory approvals. The project is expected to increase capacity by 829423 Mdth/d.
Texas to Louisiana Energy Pathway
In January 2024, we received approval from the FERC for the project, which involves an expansion of Transco’s existing natural gas transmission system to provide firm transportation capacity from receipt points in south Texas to delivery points in Texas and Louisiana. We plan to place the project into service as early as the first quarter of 2025, assuming timely receipt of all necessary regulatory approvals. The project is expected to provide 364 Mdth/d of new firm transportation service through a combination of increasing capacity, converting interruptible capacity to firm, and utilizing existing capacity.
Southeast Energy Connector
In November 2023, we received approval from the FERC for the project, which involves an expansion of Transco’s existing natural gas transmission system to provide incremental firm transportation capacity from receipt points in Mississippi and Alabama to a delivery point in Alabama. We plan to place the project into service in the second quarter of 2025, assuming timely receipt of all necessary regulatory approvals. The project is expected to increase capacity by 150 Mdth/d.
Commonwealth Energy Connector
In November 2023, we received approval from the FERC for the project, which involves an expansion of Transco’s existing natural gas transmission system to provide incremental firm transportation capacity in Virginia. We plan to place the project into service as early as the fourth quarter of 2025, assuming timely receipt of all necessary regulatory approvals. The project is expected to increase capacity by 105 Mdth/d.
Alabama Georgia Connector
In April 2023, we filed an application with the FERC for the project, which involves an expansion of Transco’s existing natural gas transmission system to provide incremental firm transportation capacity from our Station 85 pooling point in Alabama to customers in Georgia. We plan to place the project into service as early as the fourth quarter of 2025, assuming timely receipt of all necessary regulatory approvals. The project is expected to increase capacity by 64 Mdth/d.
Southeast Supply Enhancement
We plan to file an application with the FERC as early as the third quarter of 2024 for this project, which involves an expansion of Transco’s existing natural gas transmission system to provide incremental firm transportation capacity from receipt points in Virginia and North Carolina to delivery points in Virginia, North Carolina, South Carolina, Georgia, and Alabama. We plan to place the project into service as early as the fourth quarter of 2027, assuming timely receipt of all necessary regulatory approvals. The project is expected to increase capacity by 1,587 Mdth/d.
Overthrust Westbound Compression Expansion
In November 2023, we filed an application with the FERC for the project, which involves an expansion of MountainWest’s existing natural gas transmission system to provide incremental firm transportation capacity from multiple receipt points in Wamsutter, Wyoming to a delivery point in Opal, Wyoming. We plan to place the project into service as early as the fourth quarter of 2025, assuming timely receipt of all necessary regulatory approvals. The project is expected to increase capacity by 325 Mdth/d.
Northeast G&P
Cardinal Gathering Expansion
We have an agreement in place with a third party to facilitate natural gas production growth in the Utica Shale region. We plan to construct approximately 8 miles of gathering pipeline and associated incremental compression. The system, once constructed, will add incremental capacity of 125 MMcf/d and will provide natural gas gathering services to the third party. The project is expected to go into service in the third quarter of 2025.
West
Louisiana Energy Gateway
In June 2022, we announced our intention to construct new natural gas gathering assets which are expected to gather 1.8 Bcf/d of natural gas produced in the Haynesville Shale basin for delivery to premium markets, including Transco, industrial markets, and growing LNG export demand along the Gulf Coast. This project is expected to go into service in the second half of 2025.
Haynesville Gathering Expansion
In February 2023, we announced our agreement with a third party to facilitate natural gas production growth in the Haynesville basin. We plan to construct a greenfield gathering system in support of the third party’s 26,000-acre dedication. The system, once constructed, will provide natural gas gathering services to the
third party. The third party has also agreed to a long-term capacity commitment on our Louisiana Energy Gateway project. This project is expected to go into service in the second half of 2025.
Critical Accounting Estimates
The preparation of financial statements in conformity with generally accepted accounting principles requires management to make estimates and assumptions. We believe that the nature of these estimates and assumptions is material due to the subjectivity and judgment necessary, or the susceptibility of such matters to change, and the impact of these on our financial condition or results of operations.
Pension and Postretirement Obligations
We have pension and other postretirement benefit plans that require the use of assumptions and estimates to determine the benefit obligations and costs. These estimates and assumptions involve significant judgementjudgment and actual results will likely be different than anticipated. Estimates and assumptions utilized include the expected long-term rates of return on plan assets, discount rates, cash balance interest crediting rate, and employee demographics, including retirement age and mortality. These assumptions are reviewed annually and adjustments are made as needed. The assumptions utilized to compute the benefit obligations and costs are shown in Note 87 – Employee Benefit Plans of Notes to Consolidated Financial Statements.Plans.
The following table presents the estimated increase (decrease) in net periodic benefit cost and obligations resulting from a one-percentage-point change in the specific assumption.
| | | | Benefit Cost | | Benefit Obligation | | Benefit Cost | | Benefit Obligation |
| | | One-
Percentage-
Point
Increase | | One-
Percentage-
Point
Decrease | | One-
Percentage-
Point
Increase | | One-
Percentage-
Point
Decrease | | One-
Percentage-
Point
Increase | | One-
Percentage-
Point
Decrease | | One-
Percentage-
Point
Increase | | One-
Percentage-
Point
Decrease |
| | | (Millions) | | (Millions) |
| Pension benefits: | Pension benefits: | |
| Discount rate | Discount rate | $ | 2 | | | $ | — | | | $ | (97) | | | $ | 114 | |
| Discount rate | |
| Discount rate | |
| Expected long-term rate of return on plan assets | Expected long-term rate of return on plan assets | (12) | | | 12 | | | — | | | — | |
| Cash balance interest crediting rate | Cash balance interest crediting rate | 6 | | | (4) | | | 66 | | | (56) | |
| Other postretirement benefits: | Other postretirement benefits: | |
| Discount rate | Discount rate | (4) | | | (1) | | | (22) | | | 27 | |
| Discount rate | |
| Discount rate | |
| Expected long-term rate of return on plan assets | Expected long-term rate of return on plan assets | (3) | | | 3 | | | — | | | — | |
Our expected long-term rates of return on plan assets, as determined at the beginning of each fiscal year, are based on historical returns, forward-looking capital market expectations of at least 10 years from our third-party independent investment advisor, as well as the investment strategy and relative weightings of the asset classes within the investment portfolio. Our expected long-term rate of return on plan assets used for our pension plans was 3.695.17 percent in 2021.2023. The 20212023 actual return on plan assets for our pension plans was approximately 4.911.4 percent. The 10-year average rate of return on pension plan assets through December 20212023 was approximately 9.26.4 percent. The expected rates of return on plan assets are long-term in nature and are not significantly impacted by short-term market performance.
The discount rates for our pension and other postretirement benefit plans are determined separately based on an approach specific to our plans, which considers a yield curve of high-quality corporate bonds and the duration of the expected benefit cash flows of each plan.
The cash balance interest crediting rate assumption represents the average long-term rate by which the pension plans’ cash balance accounts are expected to grow. Interest on the cash balance accounts is based on the 30-year U.S. Treasury securities rate.
Results of Operations
Consolidated Overview
The following table and discussion is a summary of our consolidated results of operations for the three years ended December 31, 2021. The2023 and should be read in conjunction with the results of operations by segment, areas discussed in further detail following this consolidated overview discussion.
| | | | Year Ended December 31, | | Year Ended December 31, |
| | | 2021 | | $ Change
from
2020* | | % Change
from
2020* | | 2020 | | $ Change
from
2019* | | % Change
from
2019* | | 2019 | | 2023 | | $ Change from 2022* | | % Change from 2022* | | 2022 | | $ Change from 2021* | | % Change from 2021* | | 2021 |
| | | (Millions) | | (Millions) |
| Revenues: | Revenues: | |
| Service revenues | Service revenues | $ | 6,001 | | | +77 | | | +1 | % | | $ | 5,924 | | | -9 | | | — | % | | $ | 5,933 | |
| Service revenues | |
| Service revenues | |
| Service revenues – commodity consideration | Service revenues – commodity consideration | 238 | | | +109 | | | +84 | % | | 129 | | | -74 | | | -36 | % | | 203 | |
| Product sales | Product sales | 4,536 | | | +2,865 | | | +171 | % | | 1,671 | | | -392 | | | -19 | % | | 2,063 | |
| Net gain (loss) on commodity derivatives | (148) | | | -143 | | | NM | | (5) | | | -7 | | | NM | | 2 | |
| Net gain (loss) from commodity derivatives | |
| Total revenues | Total revenues | 10,627 | | | 7,719 | | | 8,201 | |
| Costs and expenses: | Costs and expenses: | |
| Product costs | Product costs | 3,931 | | | -2,386 | | | -154 | % | | 1,545 | | | +416 | | | +21 | % | | 1,961 | |
| Processing commodity expenses | 101 | | | -33 | | | -49 | % | | 68 | | | +37 | | | +35 | % | | 105 | |
| Product costs | |
| Product costs | |
| Net processing commodity expenses | |
| Operating and maintenance expenses | Operating and maintenance expenses | 1,548 | | | -222 | | | -17 | % | | 1,326 | | | +142 | | | +10 | % | | 1,468 | |
| Depreciation and amortization expenses | Depreciation and amortization expenses | 1,842 | | | -121 | | | -7 | % | | 1,721 | | | -7 | | | — | % | | 1,714 | |
| Selling, general, and administrative expenses | Selling, general, and administrative expenses | 558 | | | -92 | | | -20 | % | | 466 | | | +92 | | | +16 | % | | 558 | |
| | Impairment of certain assets | 2 | | | +180 | | | +99 | % | | 182 | | | +282 | | | +61 | % | | 464 | |
| Impairment of goodwill | — | | | +187 | | | +100 | % | | 187 | | | -187 | | | NM | | — | |
| | Gain on sale of business | |
| | Gain on sale of business | |
| | Gain on sale of business | |
| | Other (income) expense – net | |
| Other (income) expense – net | |
| Other (income) expense – net | Other (income) expense – net | 14 | | | +8 | | | +36 | % | | 22 | | | -12 | | | -120 | % | | 10 | |
| Total costs and expenses | Total costs and expenses | 7,996 | | | 5,517 | | | 6,280 | |
| Operating income (loss) | Operating income (loss) | 2,631 | | | 2,202 | | | 1,921 | |
| Equity earnings (losses) | Equity earnings (losses) | 608 | | | +280 | | | +85 | % | | 328 | | | -47 | | | -13 | % | | 375 | |
| Impairment of equity-method investments | — | | | +1,046 | | | +100 | % | | (1,046) | | | -860 | | | NM | | (186) | |
| | Other investing income (loss) – net | |
| Other investing income (loss) – net | |
| Other investing income (loss) – net | Other investing income (loss) – net | 7 | | | -1 | | | -13 | % | | 8 | | | -99 | | | -93 | % | | 107 | |
| Interest expense | Interest expense | (1,179) | | | -7 | | | -1 | % | | (1,172) | | | +14 | | | +1 | % | | (1,186) | |
| Net gain from Energy Transfer litigation judgment | |
| Other income (expense) – net | Other income (expense) – net | 6 | | | +49 | | | NM | | (43) | | | -76 | | | NM | | 33 | |
| Income (loss) from continuing operations before income taxes | 2,073 | | | 277 | | | 1,064 | |
| Income (loss) before income taxes | |
| Less: Provision (benefit) for income taxes | Less: Provision (benefit) for income taxes | 511 | | | -432 | | | NM | | 79 | | | +256 | | | +76 | % | | 335 | |
| Income (loss) from continuing operations | Income (loss) from continuing operations | 1,562 | | | 198 | | | 729 | |
| Income (loss) from discontinued operations | Income (loss) from discontinued operations | — | | | — | | | — | % | | — | | | +15 | | | +100 | % | | (15) | |
| Net income (loss) | Net income (loss) | 1,562 | | | 198 | | | 714 | |
| Less: Net income (loss) attributable to noncontrolling interests | Less: Net income (loss) attributable to noncontrolling interests | 45 | | | -58 | | | NM | | (13) | | | -123 | | | -90 | % | | (136) | |
| Net income (loss) attributable to The Williams Companies, Inc. | Net income (loss) attributable to The Williams Companies, Inc. | $ | 1,517 | | | $ | 211 | | | $ | 850 | |
_______
* + = Favorable change; - = Unfavorable change; NM = A percentage calculation is not meaningful due to a change in signs, a zero-value denominator, or a percentage change greater than 200.
2023 vs. 2022
Service revenues increased primarily due to:
•Higher volumes from acquisitions at our Transmission & Gulf of Mexico segment;
•Higher volumes and rates at our Northeast G&P segment; partially offset by
•Lower rates, partially offset by higher volumes at our West segment.
The net sum of Service revenues – commodity consideration, Product sales, Product costs, net realized gains and losses on commodity derivatives related to sales of product, and net realized processing commodity expenses for our reportable segments (excludes Other) comprise our Commodity margins. Product sales and net realized gains and losses on commodity derivatives at our Other segment, which reflect sales related to our upstream operations, comprise Net realized product sales.
Service revenues – commodity consideration, which represent payments we receive in the form of commodities for processing services provided, decreased primarily due to lower NGL prices. Most of these NGL volumes are sold during the month processed and are offset within Product costs below.
The Product sales decrease primarily consists of:
•Lower marketing sales activities at our Gas & NGL Marketing Services segment;
•Lower sales from upstream operations within Other;
•Lower equity NGL sales prices primarily at our West and Transmission & Gulf of Mexico segments;
•Lower system management gas sales primarily at our West and Transmission & Gulf of Mexico segments.
As we are acting as agent for natural gas marketing customers, our natural gas marketing product sales are presented net of the related costs of those activities within our Gas & NGL Marketing Services segment.
Net gain (loss) from commodity derivatives includes realized and unrealized gains and losses from derivative instruments reflected within Total revenues primarily in our Gas & NGL Marketing Services, West, and Other segments (see Note 16 – Commodity Derivatives).
We experience significant earnings volatility from the fair value accounting required for the derivatives used to hedge a portion of the economic value of the underlying transportation and storage portfolio as well as upstream-related production. However, the unrealized fair value measurement gains and losses are generally offset by valuation changes in the economic value of the underlying production or transportation and storage contracts, which is not recognized until the underlying transaction occurs.
The Product costs decrease primarily consists of:
•Lower marketing activities at our Gas & NGL Marketing Services segment;
•Lower costs associated with NGLs acquired as commodity consideration related to our equity NGL production activities;
•Lower system management gas purchases primarily at our West and Transmission & Gulf of Mexico segments.
Net processing commodity expenses increased primarily due to:
•Unfavorable change in unrealized gains and losses from commodity derivatives related to processing plant shrink gas purchases (see Note 16 – Commodity Derivatives);
•Partially offset by lower natural gas purchases due to lower prices associated with our equity NGL production activities primarily at our West and Transmission & Gulf of Mexico segments.
Operating and maintenance expenses increased primarily due to higher operating costs, including increased costs associated with the February 2023 MountainWest Acquisition, the April 2022 Trace Acquisition, and the August 2022 NorTex Asset Purchase, and increased scope and timing of operating and maintenance activities.
Depreciation and amortization expenses increased primarily related to our upstream assets, and assets acquired in the February 2023 MountainWest Acquisition, the April 2022 Trace Acquisition, and the August 2022 NorTex Asset Purchase. The increase is partially offset by lower amortization of intangibles related to our 2021 Sequent Acquisition.
Selling, general, and administrative expenses increased primarily due to acquisition and transition-related costs associated with the MountainWest Acquisition.
Gain on sale of business resulted from our sale of certain liquids pipelines in the Gulf Coast region (see Note 3 – Acquisitions and Divestitures).
Other (income) expense – net within Operating income (loss) changed favorably primarily due to:
•A favorable change associated with regulatory liabilities established for the impacts of deferred income taxes at Northwest Pipeline and the absence of 2022 regulatory charges associated with a decrease in Transco’s estimated deferred state income tax rate;
•The absence of a 2022 loss related to Eminence storage cavern abandonments;
•A 2023 gain related to a contract settlement.
Equity earnings (losses) changed unfavorably primarily due to a decrease at Laurel Mountain and our share of a loss contingency accrual related to our 14 percent ownership in Aux Sable Liquid Products LP, partially offset by increases at Blue Racer and OPPL.
The favorable change in Other investing income (loss) – net includes higher interest income earned on higher cash and cash equivalent balances, and a gain on remeasuring our existing equity-method investment in RMM to fair value with the acquisition of the remaining 50 percent ownership (see Note 3 – Acquisitions and Divestitures).
The increase in Interest expense was primarily due to our 2023 debt issuances and MountainWest's long-term debt (see Note 12 – Debt and Banking Arrangements), partially offset by an increase in interest capitalized related to ongoing expansion projects.
The Net gain from Energy Transfer litigation judgment resulted from a favorable ruling on the final order and judgment of our complaint against Energy Transfer (see Note 17 – Contingencies and Commitments).
The favorable change in Other income (expense) – net below Operating income (loss) includes an increase in equity allowance for funds used during construction (equity AFUDC) at our Transmission & Gulf of Mexico segment and the related effects of deferred taxes within Other.
Provision (benefit) for income taxes changed unfavorably primarily due to higher pre-tax income, the absence of a benefit related to the release of valuation allowances on deferred income tax assets in 2022, a lower benefit associated with decreases in our estimate of the state deferred income tax rate in both periods, and the absence of 2022 federal income tax settlements. See Note 6 – Provision (Benefit) for Income Taxes for a discussion of the effective tax rate compared to the federal statutory rate for both periods.
Income (loss) from discontinued operations in 2023 includes a pre-tax charge of $125 million to increase the related accrued liability associated with our Alaska refinery contamination litigation, partially offset by the related income tax effect (see Note 17 – Contingencies and Commitments).
The unfavorable change in Net income (loss) attributable to noncontrolling interests is primarily due to higher results at Cardinal and the Northeast JV.
2022 vs. 20202021
Service revenues increased primarily due to higher gathering and processing rates driven by favorable commodity prices and annual contractual rate escalations for certain of our West and Northeast G&P operations, higher volumes including from the Trace Acquisition and NorTex Asset Purchase, higher transportation fee revenues associated with the Leidy South expansion projectsproject placed fully in service at Transco in 2020 andDecember 2021, higher revenue associated with reimbursable electricity expenses, and higher processingreimbursable electric power costs and fractionation revenuesstorage rates which are substantially offset in our Northeast G&P segment. This increase was partially offset by lower volume deficiency fee revenues, lower gathering volumes,Operating and lower deferred revenue amortization in our West segment.maintenance expenses.
Service revenues – commodity consideration increased primarily due to higher NGL prices.prices, partially offset by lower NGL volumes. These revenues represent consideration we receive in the form of commodities as full or partial payment for processing services provided. Most of these NGL volumes are sold during the month processed and therefore are offset within Product costs below.
Product sales increased primarily due to higher marketing sales prices and volumes, including increased volumes associated with the Sequent Acquisition in third-quarter 2021 and the Trace Acquisition in second-quarter 2022. Product sales also increased due to higher sales volumes and prices associated with our naturalupstream operations and system management gas and NGL marketing activities,sales, as well as the inclusion of our recently acquired upstream operations. This increase also includes higher prices and lower volumes related to our equity NGL sales activities. These increases were partially offset by negative productan unfavorable change in natural gas marketing sales from Sequent (which does not reflect Sequent’s commodity derivative net realized gains discussed below)primarily due to the impact of netting the 2022 legacy natural gas marketing revenues with the associated costs (see Note 1 – General, Description of Business, Basis of Presentation, and Summary of Significant Accounting Policies). As we are acting as agent for our Sequent natural gas marketing customers of our Gas & NGL Marketing Services segment, our natural gas marketing product sales are presented net of the related product costs of those activities.activities, including significant 2022 lower of cost or net realizable value adjustments to our natural gas inventory.
The unfavorable change in Net gain (loss) onfrom commodity derivatives includes realized and unrealized gains and losses from derivative instruments. The unfavorable change primarily reflects higher net unrealized losses in our SequentGas & NGL Marketing Services segment, and higher net realized losses related to derivative contracts in our West and Other segments. Netsegment. Lower net realized gainslosses at our SequentWest segment and a net unrealized gain at our Other segment in 2022 partially offset these impacts.
Product costs increaseddecreased primarily due to the impact of netting the 2022 legacy natural gas marketing revenues with the associated costs. This decrease was partially offset by higher prices and volumes associated with our natural gas and NGL marketing activities, including the increase in volumes associated with the Trace Acquisition in second-quarter 2022, as well as significant 2022 lower of cost or net realizable value adjustments to our NGL inventory. Product costs also increased due to higher system management gas purchases and higher NGL prices associated with volumes acquired as commodity consideration related to our equity NGL production activities.
ProcessingNet processing commodity expenses increaseddecreased primarily due to higher pricesthe impact of a 2022 net unrealized gain from derivatives for processing plant shrink gas purchases and lower volumes for natural gas purchases associated with our equity NGL production activities, partially offset by lower volumes.
The net sum of Service revenues – commodity consideration, Product sales, Product costs,Processing commodity expenses, andhigher net realized gains and losses on commodity derivatives related to sales of product comprise our commodity margins. However, Product sales at our Other segment reflect sales related to our oil and gas producing properties and are excluded from our commodity margins.prices.
Operating and maintenance expenses increased primarily due to the inclusionhigher operating and maintenance costs, including $63 million of higher reimbursable electric power and storage costs which are substantially offset in Service revenues. The increase was also a result of higher expenses associated with our recently acquired upstream operations, andincreased costs associated with Transco's Leidy South expansion project placed in service in December 2021, higher employee-related expenses, which reflect the absence of a 2020 favorable impact of a change in an employee benefit policy (see Note 5 – Other Income and Expenses of Notes to Consolidated Financial Statements) and increased incentive compensation costshigher expenses associated with improved company performance, as well as higher reimbursable electricity expenses.the 2022 Trace Acquisition and NorTex Asset Purchase.
Depreciation and amortization expenses increased primarily due to amortization of intangibles acquired in the inclusionSequent and Trace Acquisitions and an increase in depreciation at Transco related to ARO revisions (offset in Other (income) expense – net within Operating income (loss) resulting in no net impact on our results of our recently acquired upstream operations, reduced estimated useful lives foroperations), partially offset by the absence of 2021 depreciation on certain decommissioned facilities in our West segment decommissioned during 2021, new assets placed in-service at Transco, and the amortization of intangible assets resulting from the Sequent Acquisition.segment.
Selling, general, and administrative expenses increased primarily due to higher employee-related expenses which reflect increased incentive compensation costs associated with improved company performance,driven by the Sequent employee-related costs,Acquisition in July 2021 and the absence of a 2020 favorable impact of a change in an employee benefit policy (see Note 5 – Other Income and Expenses of Notes to Consolidated Financial Statements), partially offset by lowerhigher expenses for various corporate costs.
Impairment of certain assets reflects the 2020 impairment of our Northeast Supply Enhancement development projectcosts, including technology costs to support efforts to track and certain gathering assets in the Marcellus Shale region (see Note 17 – Fair Value Measurements, Guarantees,quantify emissions associated with natural gas procurement, transmission, and Concentration of Credit Risk of Notes to Consolidated Financial Statements).delivery.
ImpairmentOther (income) expense – net within Operating income (loss) changed unfavorably primarily due to charges related to Eminence storage cavern abandonments and monitoring, as well as regulatory charges associated with a decrease in Transco’s estimated deferred state income tax rate, offset by the deferral of goodwillARO depreciation (offset in Depreciation and amortization expenses reflects the goodwill impairment charge at the Northeast reporting unitresulting in 2020 (see Note 17 – Fair Value Measurements, Guarantees, and Concentrationno net impact on our results of Credit Risk of Notes to Consolidated Financial Statements)operations).
Equity earnings (losses) changed favorably primarily due to the absence of the 2020 impairment of goodwill at RMM, increases at Appalachia Midstream Investments,investments across our West segment, including RMM, and at Laurel Mountain, Blue Racer, Aux Sable, and Discovery, partially offset by a decrease at OPPL.
Impairment of equity-method investments reflects the absence of 2020 impairments to various equity-method investments (see Note 17 – Fair Value Measurements, Guarantees, and Concentration of Credit Risk of Notes to Consolidated Financial Statements).
The favorable change in Other income (expense) – net below Operating income (loss) reflects the absence of a 2020 charge for a legal settlement associated with former olefins operations and the absence of 2020 write-offs of certain regulatory assets related to cancelled projects, partially offset by the unfavorable impact of a 2021 accrual for a loss contingency.Appalachia Midstream Investments.
Provision (benefit) for income taxes changed unfavorablyfavorably primarily due to a benefit associated with a decrease in our estimate of the state deferred income tax rate, a benefit related to the release of a valuation allowance, and federal settlements, partially offset by higher pre-tax income. See Note 6 – Provision (Benefit) for Income Taxes of Notes to Consolidated Financial Statements for a discussion of the effective tax rate compared to the federal statutory rate for both periods.
The unfavorable change in Net income (loss) attributable to noncontrolling interests is primarily due to the absence of our partner’s share of the 2020 goodwill impairmenthigher results at the Northeast reporting unit.
2020 vs. 2019
Service revenues decreased primarily due to lower volumes in our West segment, lower deferred revenue amortization at Gulfstar One, the expiration of an MVC agreement in the Barnett Shale region, and temporary shut-ins at certain offshore Gulf of Mexico operations. This decrease was partially offset by higher Northeast G&P revenues driven by higher volumes and the March 2019 consolidation of UEOM (see Note 3 – Acquisitions of Notes to Consolidated Financial Statements), higher MVC revenue in our West segment, as well as higher transportation fee revenues at Transco and Northwest Pipeline associated with expansion projects placed in service in 2019 and 2020, increased volumes in the Eastern Gulf region, and higher deficiency fee revenue associated with lower volumes at OPPL.
Service revenues – commodity consideration decreased due to lower commodity prices, as well as lower equity NGL processing volumes due to less producer drilling activity. These revenues represent consideration we receive in the form of commodities as full or partial payment for processing services provided. Most of these NGL volumes are sold within the month processed and therefore are offset within Product costs below.
Product sales decreased primarily due to lower NGL and natural gas prices associated with our marketing and equity NGL sales activities, as well as lower volumes associated with our equity NGL sales activities, partially offset by higher marketing volumes. This decrease also includes lower system management gas sales. Marketing sales and system management gas sales are substantially offset within Product costs.
Product costs decreased primarily due to lower NGL and natural gas prices associated with our marketing and equity NGL production activities. This decrease also includes lower volumes acquired as commodity consideration for NGL processing services and lower system management gas purchases, partially offset by higher volumes for marketing activities.
Processing commodity expenses decreased primarily due to lower natural gas purchases associated with equity NGL production primarily due to lower natural gas prices and lower volumes.
Operating and maintenance expenses decreased primarily due to lower employee-related expenses, including the absence of 2019 severance and related costs and the associated reduced costs in 2020, as well as the favorable impact of a 2020 change in an employee benefit policy (see Note 5 – Other Income and Expenses of Notes to Consolidated Financial Statements), and lower maintenance and operating costs primarily due to timing and scope of activities. These decreases are partially offset by higher expenses related to the consolidation of UEOM.
Depreciation and amortization expenses increased primarily due to new assets placed in service and the March 2019 consolidation of UEOM, partially offset by lower expense related to assets that became fully depreciated in the fourth quarter of 2019.
Selling, general, and administrative expenses decreased primarily due to lower employee-related expenses, including the absence of 2019 severance and related costs and the associated reduced costs in 2020, as well as the favorable impact of a 2020 change in an employee benefit policy (see Note 5 – Other Income and Expenses of Notes to Consolidated Financial Statements), and the absence of transaction costs associated with our 2019 acquisition of UEOM and the formation of the Northeast JV.
Impairment of certain assets includes the 2019 impairments of our Constitution development project, certain Eagle Ford Shale gathering assets, and certain idle gathering assets. The asset impairments in 2020 included our Northeast Supply Enhancement development project and certain gathering assets in the Marcellus Shale region (see Note 17 – Fair Value Measurements, Guarantees, and Concentration of Credit Risk of Notes to Consolidated Financial Statements).
Impairment of goodwill reflects the goodwill impairment charge at the Northeast reporting unit in 2020 (see Note 17 – Fair Value Measurements, Guarantees, and Concentration of Credit Risk of Notes to Consolidated Financial Statements).
Equity earnings (losses) changed unfavorably primarily due to our share of 2020 impairments at equity-method investments (see Note 9 – Investing Activities of Notes to Consolidated Financial Statements), and lower volumes at OPPL and Discovery. These decreases were partially offset by favorable amortization of basis differences related to impairments of several of our equity-method investments which were recognized in first quarter 2020, as well as higher volumes at Appalachia Midstream Investments, increased results at Blue Racer driven by higher volumes and a higher ownership interest, and the absence of 2019 losses at Brazos Permian II.
Impairment of equity-method investments includes impairments to various equity-method investments in 2019 and 2020 (see Note 17 – Fair Value Measurements, Guarantees, and Concentration of Credit Risk of Notes to Consolidated Financial Statements).
The unfavorable change in Other investing income (loss) – net is primarily due to the absence of a 2019 gain on the sale of our equity-method investment in Jackalope, partially offset by the absence of a 2019 loss on the deconsolidation of Constitution (see Note 9 – Investing Activities of Notes to Consolidated Financial Statements).
The unfavorable change in Other income (expense) – net below Operating income (loss) includes a charge in the fourth quarter 2020 for a legal settlement associated with former olefins operations, lower equity allowance for funds used during construction (AFUDC), and 2020 write-offs of certain regulatory assets related to cancelled projects.
Provision (benefit) for income taxes changed favorably primarily due to lower pre-tax income. See Note 6 – Provision (Benefit) for Income Taxes of Notes to Consolidated Financial Statements for a discussion of the effective tax rate compared to the federal statutory rate for both periods.
The unfavorable change in Net income (loss) attributable to noncontrolling interests is primarily due to the absence of the 2019 impairment of our Constitution development project and the impact from the formation of the Northeast JV in June 2019, partially offset by the first-quarter 2020 goodwill impairment charge at the Northeast reporting unit, and lower Gulfstar One results.
Year-Over-Year Operating Results – Segments
We evaluate segment operating performance based upon Modified EBITDA. Note 2018 – Segment Disclosures of Notes to Consolidated Financial Statements includes a reconciliation of this non-GAAP measure to Net income (loss). Management uses Modified EBITDA because it is an accepted financial indicator used by investors to compare company performance. In addition, management believes that this measure provides investors an enhanced perspective of the operating performance of our assets. Modified EBITDA should not be considered in isolation or as a substitute for a measure of performance prepared in accordance with GAAP.
Transmission & Gulf of Mexico
| | | | | | Year Ended December 31, | |
| | | | | Year Ended December 31, | |
| | | | | Year Ended December 31, | |
| | | | | | 2023 | |
| | | | | 2023 | |
| | | | | 2023 | | | 2022 | | 2021 |
| | | | | (Millions) | | | | | | | (Millions) |
| Service revenues | |
| Service revenues – commodity consideration (1) | |
| Product sales (1) | |
| | Net realized gain (loss) from commodity derivatives (1) | |
| | Net realized gain (loss) from commodity derivatives (1) | |
| | Net realized gain (loss) from commodity derivatives (1) | |
| | | Year Ended December 31, |
| | 2021 | | 2020 | | 2019 |
| (Millions) |
| Service revenues | $ | 3,385 | | | $ | 3,257 | | | $ | 3,311 | |
| Service revenues – commodity consideration | 52 | | | 21 | | | 41 | |
| Product sales | 349 | | | 191 | | | 288 | |
| Segment revenues | Segment revenues | 3,786 | | | 3,469 | | | 3,640 | |
| | Product costs | (349) | | | (193) | | | (288) | |
| Processing commodity expenses | (17) | | | (7) | | | (16) | |
| Other segment costs and expenses | (980) | | | (886) | | | (984) | |
| Impairment of certain assets | (2) | | | (170) | | | (354) | |
| | Segment revenues | |
| | Segment revenues | |
| | Product costs (1) | |
| Product costs (1) | |
| Product costs (1) | |
| Net processing commodity expenses (1) | |
| Other segment costs and expenses | |
| | Gain on sale of business | |
| | Gain on sale of business | |
| | Gain on sale of business | |
| Proportional Modified EBITDA of equity-method investments | Proportional Modified EBITDA of equity-method investments | 183 | | | 166 | | | 177 | |
| Transmission & Gulf of Mexico Modified EBITDA | Transmission & Gulf of Mexico Modified EBITDA | $ | 2,621 | | | $ | 2,379 | | | $ | 2,175 | |
| | Commodity margins | Commodity margins | $ | 35 | | | $ | 12 | | | $ | 25 | |
| Commodity margins | |
| Commodity margins | |
2021_______________
(1)Included as a component of Commodity margins.
2023 vs. 20202022
Transmission & Gulf of Mexico Modified EBITDA increased primarily due to favorablehigher Service revenues and a Gain on sale of business.
Service revenues increased primarily due to:
•A $222 million increase due to the acquisition of MountainWest primarily in transportation and storage revenues;
•A $42 million increase due to the NorTex Asset Purchase primarily in storage and transportation revenues;
•A $30 million increase in the Eastern Gulf Coast region primarily due to higher production handling volumes from new wells at Devils Tower, partially offset by lower volumes from the Norphlet pipeline due to natural decline;
•A $15 million increase in Transco’s revenues associated with the Regional Energy Access expansion project placed partially in-service in the fourth quarter of 2023;
•A $12 million increase in Transco’s and Northwest Pipeline’s revenues associated with short-term firm transportation; partially offset by
•A $19 million decrease due to lower rates from the FERC rate case settlement effective January 1, 2023, at Northwest Pipeline;
•A $14 million decrease in reimbursable electric power costs and storage rates, offset by similar changes in electricity charges and storage costs, reflected in Other segment costs and expenses;
•A $10 million decrease due to Impairmentthe sale of certain assets, liquids pipelines in the Gulf Coast region in September 2023 primarily in transportation revenues (see Note 3 – Acquisitions and Divestitures).
andCommodity margins decreased primarily due to a $15 million decrease from our equity NGLs, driven by unfavorable net realized pricing for equity NGL sales, partially offset by lower prices for natural gas purchases associated with our equity NGL production activities.
Other segment costs and expenses increased primarily due to:
•Higher operating and administrative costs including higher operating, acquisition, and transition costs related to our MountainWest Acquisition and NorTex Asset Purchase; and higher costs related to timing and scope of general maintenance activities primarily at Transco, partially offset by lower reimbursable electric power costs and storage costs, which are offset by a similar change in electricity reimbursements and storage revenues reflected in Service revenues; and lower employee-related costs;
•Higher project feasibility costs; partially offset by
•Favorable changes associated with regulatory liabilities established for the impacts of deferred income taxes at Northwest Pipeline associated with the FERC rate case settlement mentioned above in Service revenues and the absence of 2022 regulatory charges associated with decreases in Transco’s estimated deferred state income tax rate;
•A favorable change in equity AFUDC as a result of increased capital expenditures at Transco;
•The absence of losses related to Eminence storage cavern abandonments in 2022.
Gain on sale of business reflects a gain recognized on the sale of certain liquids pipelines in the Gulf Coast region in September 2023 (see Note 3 – Acquisitions and Divestitures).
2022 vs. 2021
Transmission & Gulf of Mexico Modified EBITDA increased primarily due to higher Service revenues, partially offset by higher Other segment costs and expenses.
Service revenues increased primarily due to:
•A $135$163 million increase in Transco’s and Northwest Pipeline’s natural gas transportation and storageservice revenues primarily associated with the Leidy South expansion projectsproject placed fully in service in 2020December 2021, park and 2021,loan services, short-term firm transportation, overall demand, and commodity fee revenues. Additionally, 2022 benefited from higher reimbursable electric power costs and astorage rates effective since the second quarter of 2022, partially offset by lower cash out surcharge,surcharges, all of which are offset by similar changes in electricity, storage and cash out charges reflected in Other segment costs and expenses;expenses;
•A $21 million increase fromin the Norphlet pipeline associatedEastern Gulf Coast region primarily withdue to higher deferred revenue amortizationproduction handling and higher volumes;
•An $18 million increase at Perdido primarily driven by highergathering volumes due tofrom the absence of temporary shut-ins due to producer operational issues and weather-related events in 2020 related to scheduled maintenance and fewer Western Gulf of Mexico weather-related events;2021, partially offset by
•A $25 million a decrease at Gulfstar One for the Tubular Bells field primarily associated withdue to lower deferred revenue amortizationproduction handling, gathering and transportation volumes from lower contractually determined maximum daily quantities;natural decline;
•A $17$16 million increase primarily related to storage and transportation revenues due to the acquisition of NorTex in August 2022; partially offset by
•A $13 million decrease in the Western Gulf Coast region primarily at Perdido due to lower transportation and gathering volumes at Gulfstar One in the Gunflint field due to ongoingfrom temporary downtime from producer operational issues partially offset by the lower temporary shut-ins related to pricing in 2020.2022.
The net sum of Service revenues – commodity consideration, Product sales, Product costs,Processing commodity expenses, comprise our Commodity margins. Commodity margins associated with our equity NGLs increased $21$5 million primarily driven by favorable NGL sales prices.prices, partially offset by higher prices for natural gas purchases associated with our equity NGL production activities.
Other segment costs and expenses increased primarily due to higher incentive and benefit employee-related costs as previously discussed; higher operating costs including higher reimbursable electric power costs;costs and astorage costs, partially offset by favorable cash out surcharge reserve,charges, all of which are offset by similar changes in electricity andreimbursements, cash out reimbursements,charges, and storage revenues reflected in Service revenues;revenues. Additionally, 2022 was impacted by higher costs associated with the Leidy South expansion project; maintenance costs primarily related to general maintenance at Transco, Gulf Coast region, and Northwest Pipeline; charges related to Eminence storage cavern abandonments and monitoring; and regulatory charges associated with a decrease in Transco’s estimated deferred state income tax rate, higher operating taxes,employee-related costs, corporate allocations, and operations acquired in the NorTex Asset Purchase. These increases are partially offset by a favorable change associated within the deferral of asset retirement obligation-relatedARO related depreciation at Transco.
Impairment of certain assets reflects the absence of the impairment of our Northeast Supply Enhancement development project in 2020 (see Note 17 – Fair Value Measurements, Guarantees, and Concentration of Credit Risk of Notes to Consolidated Financial Statements).Proportional Modified EBITDA of equity-method investments increased at Discovery driven by higher NGL sales prices and higher volumes due to the absence of prior year scheduled maintenance.
2020 vs. 2019
Transmission & Gulf of Mexico Modified EBITDA increased primarily due to lower Impairment of certain assets and favorable changes to Other segment costs and expenses, partially offset by decreased Service revenues.
Service revenues decreased primarily due to:
•A $115 million decrease due to lower deferred revenue amortization associated with the end of the exclusive use period at Gulfstar One for the Tubular Bells field;
•A $42 million decrease due to temporary shut-ins primarily at Perdido and Gulfstar One related to Gulf of Mexico weather-related events, pricing, and scheduled maintenance;
•A $32 million decrease due to lower volumes at Gulfstar One in the Gunflint field due to ongoing operational issues; partially offset by
•A $65 million increase in Transco’s and Northwest Pipeline’s natural gas transportation revenues associated with expansion projects placed in service in 2019 and 2020;
•A $44 million increase at Gulfstar One associated with higher volumes in the Tubular Bells field due to a new well and higher production;
•A $24 million increase associated with volumes from Norphlet placed in service in June 2019.
Commodity margins associated with our equity NGLs decreased $11 million driven by lower commodity prices and volumes.
Other segment costs and expenses decreased primarily due to lower employee-related expenses, including the absence of 2019 severance and related costs and the associated reduced costs in 2020, as well as the favorable impact of a 2020 change in an employee benefit policy (see Note 5 – Other Income and Expensesof Notes to Consolidated Financial Statements), lower maintenance costs primarily due to a decrease in contracted services related to general maintenance and other testing at Transco, the absence of a 2019 charge for reversal of costs capitalized in previous periods. The 2020 period also benefited from net favorable changes to charges and credits associated with a regulatory asset related to Transco’s asset retirement obligations, partially offset by lower equity AFUDC and higher operating taxes.
Impairment of certain assets includes the absence of the impairment of our Constitution development project in 2019, partially offset by the impairment of our Northeast Supply Enhancement development project in 2020 (see Note 17 – Fair Value Measurements, Guarantees, and Concentration of Credit Risk of Notes to Consolidated Financial Statements).
Proportional Modified EBITDA of equity-method investments decreased at Discovery driven by lower volumes due to scheduled maintenance and temporary shut-ins related to Gulf of Mexico weather-related events and pricing.
Northeast G&P
| | | | | | Year Ended December 31, | |
| | | | | Year Ended December 31, | |
| | | | | Year Ended December 31, | |
| | Year Ended December 31, |
| 2021 | | 2020 | | 2019 |
| (Millions) |
| | | | | 2023 | |
| | | | | 2023 | |
| | | | | 2023 | | | 2022 | | 2021 |
| | | | | (Millions) | | | | | | | (Millions) |
| Service revenues | Service revenues | $ | 1,528 | | | $ | 1,465 | | | $ | 1,338 | |
| Service revenues – commodity consideration | 7 | | | 7 | | | 12 | |
| Product sales | 99 | | | 57 | | | 150 | |
| Service revenues – commodity consideration (1) | |
| Product sales (1) | |
| Segment revenues | Segment revenues | 1,634 | | | 1,529 | | | 1,500 | |
| | Product costs | (99) | | | (57) | | | (152) | |
| Processing commodity expenses | (2) | | | (3) | | | (8) | |
| Product costs (1) | |
| Product costs (1) | |
| Product costs (1) | |
| Net processing commodity expenses (1) | |
| Other segment costs and expenses | Other segment costs and expenses | (503) | | | (441) | | | (470) | |
| Impairment of certain assets | — | | | (12) | | | (10) | |
| | Proportional Modified EBITDA of equity-method investments | |
| Proportional Modified EBITDA of equity-method investments | |
| Proportional Modified EBITDA of equity-method investments | Proportional Modified EBITDA of equity-method investments | 682 | | | 473 | | | 454 | |
| Northeast G&P Modified EBITDA | Northeast G&P Modified EBITDA | $ | 1,712 | | | $ | 1,489 | | | $ | 1,314 | |
| | Commodity margins | Commodity margins | $ | 5 | | | $ | 4 | | | $ | 2 | |
| Commodity margins | |
| Commodity margins | |
(1)Included as a component of Commodity margins.
2023 vs. 20202022
Northeast G&P Modified EBITDA increased primarily due to increasedhigher Service revenues, partially offset by lower Proportional Modified EBITDA of equity-method investments and higherService revenues, partially offset by increased Other segment costs and expenses.
Service revenues increased primarily due to:
•A $27$92 million increase in revenues at the Northeast JV primarily related to higher transportation & fractionation, processing, and gathering volumes as well as higher processing rates;
•An $84 million increase in revenues in the Utica Shale region primarily related to higher gathering rates resulting from annual cost of service contract redeterminations and higher volumes, partially offset by the absence of proceeds from the release of an acreage dedication in 2022;
•A $61 million increase in gathering revenues at Susquehanna Supply Hub primarily related to escalated rates as well as higher volumes.
Other segment costs and expenses increased primarily due to increased scope of operations, a loss contingency accrual, and higher operating taxes.
Proportional Modified EBITDA of equity-method investments decreased at Laurel Mountain due to lower commodity-based gathering rates, MVC, and volumes, and at Aux Sable Liquid Products LP primarily due to our $31 million share of a loss contingency accrual related to our 14 percent ownership. The decrease was partially offset by an increase at Blue Racer primarily driven by higher gathering and processing volumes. Additionally, Appalachia Midstream Investments increased primarily driven by higher gathering volumes and annual rate escalations at Marcellus South, partially offset by lower gathering rates resulting from annual cost of service contract redeterminations and lower volumes at the Bradford Supply Hub.
2022 vs. 2021
Northeast G&P Modified EBITDA increased primarily due to higher Service revenues, partially offset by lower Proportional Modified EBITDA of equity-method investments and higher Other segment costs and expenses.
Service revenues increased primarily due to:
•A $64 million increase in revenues at the Northeast JV primarily related to higher gathering, processing, and fractionation volumes as well as higher processing rates;
•A $43 million increase in revenues in the Utica Shale region primarily related to higher gathering rates resulting from annual cost of service contract redeterminations, as well as proceeds from the release of an acreage dedication;
•A $14 million increase in revenues associated with reimbursable electricity expenses, which is offset by similar changes in electricitythe charges reflected in Other segment costs and expenses;
•A $23 million increase in revenues at the Northeast JV primarily related to higher processing and fractionation volumes, partially offset by lower gathering volumes;
•A $6 million increaseNo change in revenues at Susquehanna Supply Hub primarily related to higher gathering rates, partially offset by lower gathering volumes.
Other segment costs and expenses increased primarily due to higher maintenance and operating expenses, including higher electricity charges,and fuel, which is partially offset in Service revenues.
Proportional Modified EBITDA of equity-method investments decreased at Appalachia Midstream Investments primarily driven by lower gathering rates resulting from annual cost of service contract redeterminations as well as lower volumes. Additionally, there was a decrease at Blue Racer primarily due to lower volumes. The decrease was partially offset by an increase at Laurel Mountain primarily due to higher commodity-based gathering rates.
West
| | | | | | | | | | | | | | | | | | | | | |
| | | | | Year Ended December 31, |
| | | | | |
| | | | | 2023 | | 2022 | | 2021 |
| | | | | (Millions) |
| Service revenues | | | | | $ | 1,502 | | | $ | 1,542 | | | $ | 1,248 | |
Service revenues – commodity consideration (1) | | | | | 103 | | | 182 | | | 179 | |
| Product sales (1) | | | | | 441 | | | 841 | | | 643 | |
| | | | | | | | | |
| Net realized gain (loss) from commodity derivatives relating to service revenues | | | | | 82 | | | (1) | | | (15) | |
| Net realized gain (loss) from commodity derivatives relating to product sales (1) | | | | | 7 | | | (3) | | | (29) | |
| Net realized gain (loss) from commodity derivatives | | | | | 89 | | | (4) | | | (44) | |
| | | | | | | | | |
| Segment revenues | | | | | 2,135 | | | 2,561 | | | 2,026 | |
| | | | | | | | | |
| Product costs (1) | | | | | (425) | | | (813) | | | (608) | |
| Net processing commodity expenses (1) | | | | | (92) | | | (105) | | | (85) | |
| Other segment costs and expenses | | | | | (542) | | | (564) | | | (477) | |
| | | | | | | | | |
| | | | | | | | | |
| Proportional Modified EBITDA of equity-method investments | | | | | 162 | | | 132 | | | 105 | |
| West Modified EBITDA | | | | | $ | 1,238 | | | $ | 1,211 | | | $ | 961 | |
| | | | | | | | | |
| Commodity margins | | | | | $ | 34 | | | $ | 102 | | | $ | 100 | |
| | | | | | | | | |
________________
(1) Included as a component of Commodity margins.
2023 vs. 2022
West Modified EBITDA increased primarily due to a favorable change in Net realized gain (loss) from commodity derivatives relating to service revenues, higher Proportional Modified EBITDA of equity-method investments, and lower Other segment costs and expenses, partially offset by lower Commodity margins and Service revenues.
Service revenues decreased primarily due to:
•A $120 million decrease in the Barnett Shale region primarily due to lower gathering rates driven by unfavorable commodity pricing;
•A $13 million decrease in the Eagle Ford Shale region primarily due to lower MVC revenues, partially offset by escalated gathering rates and higher gathering volumes;
•A $6 million decrease associated with reimbursable compressor power and fuel purchases primarily due to lower prices, which are offset by similar changes in Other segment costs and expenses; partially offset by
•A $69 million increase in the Haynesville Shale region primarily associated with higher gathering volumes including from increased producer activity and the Trace Acquisition in April 2022, partially offset by lower rates driven by unfavorable commodity pricing;
•A $25 million increase in the DJ Basin region primarily associated with the DJ Basin Acquisitions in November 2023 (see Note 3 – Acquisitions and Divestitures);
•A $15 million increase in our other NGL operations associated with higher storage fees primarily due to a new contract as well as higher incentive and benefit employee-related costs as previously discussed.fractionation fees primarily due to higher volumes partially offset by lower rates from lower natural gas prices.
Impairment of certain assetsNet realized gain (loss) from commodity derivatives relating to service revenues reflects a $12favorable change in settled commodity prices relative to our natural gas hedge positions.
Commodity margins decreased $68 million impairment of certain gathering assetsprimarily due a $46 million decrease from our equity NGLs and a $14 million decrease from other sales activities, both primarily due to lower net realized commodity pricing.
Other segment costs and expenses decreased primarily due to a favorable change in our net imbalance liability due to changes in pricing, favorable contract settlements in first-quarter 2023, lower corporate allocations, and lower reimbursable compressor power and fuel purchases which are substantially offset in Service revenues. These items were partially offset by higher operating expenses related to operations including those acquired in the Marcellus Shale region in 2020 (see Note 17 – Fair Value Measurements, Guarantees,Trace Acquisition and Concentrationthe DJ Basin Acquisitions, lower system gains at Wamsutter, and a fourth quarter 2023 write-down of Credit Risk of Notes to Consolidated Financial Statements).assets held for sale.
Proportional Modified EBITDA of equity-method investments increased at Appalachia Midstream Investments primarily driven bydue to higher volumes at OPPL as well as the absence of our $26 million share of an impairment of certain assets in 2020 that were subsequently sold. Additionally, there was an increasehigher volumes at Blue Racer primarily due to the favorable impact of increased ownership as well as the absence of our $10 million share of an impairment of certain assets in 2020. There was also an increase at Laurel Mountain due to higher commodity-based gathering rates as well as the absence of our $11 million share of an impairment of certain assets in 2020 that were subsequently sold and higher MVC revenue,RMM, partially offset by lower volumes, and an increase at Aux Sable.proportional results as RMM was consolidated as of November 30, 2023.
20202022 vs. 20192021
Northeast G&PWest Modified EBITDA increased primarily due to higher Service revenues lowerand a favorable change in Net realized gain (loss) from commodity derivatives, partially offset by higher Other segment costs and expenses, and increased Proportional Modified EBITDA of equity-method investments, in addition to the favorable impact of acquiring the additional interest in UEOM, which is a consolidated entity after the remaining ownership interest was purchased in March 2019.expenses.
Service revenues increased primarily due to:
•A $94$186 million increase atin the Northeast JV, including $62 million higher processing, fractionation, transportation, and gathering revenuesHaynesville Shale region primarily due to higher gathering volumes and a $32 million increase associated withincluding volumes from the consolidation of UEOM,Trace Acquisition as previously discussed;well as higher gathering rates driven by favorable commodity pricing;
•A $20$96 million increase in the Barnett Shale region primarily due to higher gathering revenues associated with higher volumes in the Utica Shale region;rates driven by favorable commodity pricing;
•A $13 million increase in revenues associated with reimbursable electricity expenses, which is offset by similar changes in electricity charges, reflected in Other segment costs and expenses.
Other segment costs and expenses decreased due to lower employee-related expenses, including the absence of 2019 severance and related costs and the associated reduced costs in 2020, as well as the favorable impact of a 2020 change in an employee benefit policy (see Note 5 – Other Income and Expenses of Notes to Consolidated Financial Statements), and lower maintenance and operating expenses primarily due to timing and scope of activities. Additionally, expenses changed favorably due to the absence of transaction costs associated with our 2019 acquisition of UEOM and the formation of the Northeast JV. These decreases were partially offset by higher reimbursable electricity expenses, increased expenses associated with the consolidation of UEOM, and the absence of a favorable customer settlement in 2019.
Impairment of certain assets reflects a $12 million impairment of certain gathering assets in the Marcellus Shale region in 2020 and a $10 million write-down of other certain assets that were no longer in use or were surplus in nature in 2019 (see Note 17 – Fair Value Measurements, Guarantees, and Concentration of Credit Risk of Notes to Consolidated Financial Statements).
Proportional Modified EBITDA of equity-method investments increased at Appalachia Midstream Investments driven by higher volumes, partially offset by a $26 million decrease for our share of an impairment of certain assets. Additionally, there was an increase at Blue Racer primarily due to higher volumes and the favorable impact of increased ownership, partially offset by a $10 million decrease for our share of an impairment of certain assets. These increases were partially offset by a $16 million decrease as a result of the consolidation of UEOM in 2019, as previously discussed, as well as a decrease at Laurel Mountain primarily due to $11 million for our share of an impairment of certain assets that were subsequently sold, partially offset by higher volumes, and a decrease at Aux Sable.
West
| | | | | | | | | | | | | | | | | |
| Year Ended December 31, |
| 2021 | | 2020 | | 2019 |
| (Millions) |
| Service revenues | $ | 1,221 | | | $ | 1,280 | | | $ | 1,364 | |
Service revenues – commodity consideration | 179 | | | 101 | | | 150 | |
| Product sales | 4,330 | | | 1,567 | | | 1,795 | |
| Net gain (loss) on commodity derivatives | (85) | | | (5) | | | 2 | |
| Segment revenues | 5,645 | | | 2,943 | | | 3,311 | |
| | | | | |
| Product costs | (4,099) | | | (1,520) | | | (1,774) | |
| Processing commodity expenses | (85) | | | (58) | | | (79) | |
| Other segment costs and expenses | (471) | | | (477) | | | (521) | |
| Impairment of certain assets | — | | | — | | | (100) | |
| | | | | |
| Proportional Modified EBITDA of equity-method investments | 105 | | | 110 | | | 115 | |
| West Modified EBITDA | $ | 1,095 | | | $ | 998 | | | $ | 952 | |
| | | | | |
| Commodity margins | $ | 255 | | | $ | 85 | | | $ | 91 | |
| Net unrealized gain (loss) from derivative instruments | — | | | — | | | 3 | |
2021 vs. 2020
West Modified EBITDA increased primarily due to higher Commodity margins, partially offset by lower Service revenues.
Service revenues decreased primarily due to:
•A $63 million decrease associated with lower volumes, primarily due to production declines in the Eagle Ford Shale region which impact is substantially offset by recognition of higher MVC revenue (see below);
•A $29 million decrease due to the absence of a temporary volume deficiency fee from a customer in 2020;
•A $22 million decrease driven by lower deferred revenue amortization, primary in the Barnett Shale region; partially offset by
•A $37$14 million increase associated with higher MVC revenuefractionation fees primarily in the Eagle Ford Shale region, partially offset by lower MVC revenue in the Wamsutter region;due to higher fractionation volumes from a new contract;
•A $17 million increase in revenues associated primarily with reimbursable compressor power and fuel purchases due to higher prices related to the impact of severe winter weather, which are offset by similar changes in Other segment costs and expenses;
•A $10 million increase associated with higher net realized gathering and processing rates, primarily in the Barnett Shale and Piceance regions due to higher commodity pricing, along with escalated gathering rates in the Eagle Ford Shale region, partially offset by a decrease in gathering rates in the Haynesville Shale region due to a customer contract change.
The net sum of Service revenues – commodity consideration, Product sales, Product costs, Processing commodity expenses, and net realized gains and losses on commodity derivatives related to sales of product comprise our Commodity margins. We further segregate our Commodity margins into product margins associated with our equity NGLs and marketing margins. Marketing margins increased by $145 million primarily due to favorable changes in net realized natural gas and NGL prices, including the impact of severe winter weather in the first quarter of 2021. Product margins from our equity NGLs increased by $13 million, primarily due to favorable
net realized commodity price changes, partially offset by lower sales volumes. Margins on other sales of products increased $12 million primarily due to higher commodity prices.
Other segment costs and expenses decreased primarily due to gains on asset sales in 2021, lower leased compressor expenses, favorable changes in system gains and losses, lower legal and consulting expenses, and favorable settlements, partially offset by higher reimbursable compressor power and fuel purchases which are offset in Service revenues and higher incentive and benefit employee-related expenses as previously discussed.
Proportional Modified EBITDA of equity-method investments decreased primarily due to lower volumes at OPPL, partially offset by higher volumes and commodity prices at Brazos Permian II.
2020 vs. 2019
West Modified EBITDA increased primarily due to the absence of Impairment of certain assets and lower Other segment costs and expenses, partially offset by lower Service revenues.
Service revenues decreased primarily due to:
•An $83 million decrease associated with lower volumes, excluding the Eagle Ford Shale region;
•A $72 million decrease driven by lower deferred revenue amortization and MVC deficiency fee revenues associated with the second-quarter 2019 expiration of the MVC agreement in the Barnett Shale region;
•A $47 million decrease associated with lower rates, excluding the Eagle Ford Shale region, driven by lower commodity pricing in the Barnett Shale region and the expiration of a cost-of-service period on a contract in the Mid-Continent region;
•An $11 million decrease associated with lower fractionation fees driven by lower volumes;
•An $8 million decrease driven by the absence of a favorable 2019 cost-of-service agreement adjustment in the Mid-Continent region; partially offset by
•A $91$4 million increase in the Eagle Ford Shale region primarily due to higher MVC revenuerevenues, escalated gathering rates, and higher rates, partiallydeferred revenue amortization, substantially offset by lower volumes primarily due to decreased producer activity, including temporary shut-ins on certain gathering systems;
•A $29 million increase associated with a temporary volume deficiency fee associated with reduced volumes from a shipper on OPPL;
•A $26 million increase in the Wamsutter region associated with higher MVC revenues.
Product margins from our equity NGLs decreased $29 million primarily due to:
•A $35 million decrease associated with lower sales prices primarily due to 25 percent lower average net realized per-unit non-ethane sales prices;
•A $15 million decrease primarily associated with 14 percent lower non-ethane sales volumes driven by less producer drilling activity; partially offset by
•A $21 million increase related to a decline in natural gas purchases associated with equity NGL production due to lower natural gas prices and lower equity non-ethane production volumes.
Additionally, marketing margins increased by $26 million primarily due to higher net realized NGL and natural gas prices. The decrease in Product sales includes a $168 million decrease in marketing sales, which is due to lower sales prices, partially offset by higher marketing sales volumes. An $18 million decrease in other product sales also contributed to the overall decrease. These decreases are substantially offset in Product costs.
Other segment costs and expenses decreased primarily due to lower employee-related expenses driven by the absence of 2019 severance and related costs and the associated reduced costs in 2020, and the favorable impact of a
2020 change in an employee benefit policy (see Note 5 – Other Income and Expenses of Notes to Consolidated Financial Statements), as well as lower operating costs due to fewer leased compressors and lower maintenance costs primarily due to timing and scope of activities. These favorable changes are partially offset by the absence of $12 million in favorable settlements in 2019.
Impairment of certain assets reflects a $79 million impairment of certain Eagle Ford Shale gathering assets and a $12 million impairment of certain idle gathering assets in 2019 (see Note 17 – Fair Value Measurements, Guarantees, and Concentration of Credit Risk of Notes to Consolidated Financial Statements).
Proportional Modified EBITDA of equity-method investments decreased primarily due to lower volumes at OPPL and the absence of the Jackalope equity-method investment sold in April 2019, partially offset by growth at the RMM, Brazos Permian II, and Targa Train 7 equity-method investments.
Sequent
We closed the Sequent Acquisition on July 1, 2021. See the Sequent Acquisition section of Recent Developments above for additional information related to Sequent.
| | | | | | | | | |
| Year Ended December 31, |
| 2021 | | | | |
| (Millions) |
Product sales | $ | (43) | | | | | |
| | | | | |
Net realized gain (loss) from derivative instruments | 66 | | | | | |
Net unrealized gain (loss) from derivative instruments | (109) | | | | | |
Net gain (loss) on commodity derivatives | (43) | | | | | |
| | | | | |
Segment revenues | (86) | | | | | |
| | | | | |
| | | | | |
Other segment costs and expenses | (26) | | | | | |
Sequent Modified EBITDA | $ | (112) | | | | | |
| | | | | |
| | | | | |
Commodity margins | $ | 23 | | | | | |
| | | | | |
2021
Sequent Modified EBITDA reflects Commodity margins more than offset by net unrealized losses from derivative instruments and segment costs and expenses.
The net sum of Product sales and net realized gains and losses on commodity derivatives related to sales of product comprise our Commodity margins. Commodity margins include $35 million primarily related to favorable pricing spreads on Sequent’s transportation capacity reflecting losses on physical transaction settlements more than offset by net realized gains on derivatives. The transportation related margin was partially offset by a $12 million unfavorable margin related to storage activity. The unfavorable storage margin reflects gains on physical transaction settlements offset by an $18 million charge related to the partial recognition of a purchase accounting inventory fair value adjustment which increased the weighted-average cost of inventory and $13 million related to a lower of cost or net realizable value inventory adjustment.
The Net unrealized gain (loss) from derivative instruments relates to derivative contracts within the Sequent segment that are not designated as hedges for accounting purposes. Sequent can experience significant earnings volatility from the fair value accounting required for the derivatives used to hedge a portion of the economic value of the underlying transportation and storage portfolio. However, the unrealized fair value measurement gains and losses are generally offset by valuation changes in the economic value of the underlying transportation and storage portfolio, which is not recognized until the underlying transportation and storage transaction occurs.
Other segment costs and expenses primarily include employee-related costs.
Other
| | | | | | | | | | | | | | | | | |
| | Year Ended December 31, |
| | 2021 | | 2020 | | 2019 |
| | (Millions) |
| Other Modified EBITDA | $ | 178 | | | $ | (15) | | | $ | 6 | |
2021 vs. 2020
Other Modified EBITDA increased primarily due to:
•A $168 million increase due to our recently acquired upstream operations, including the favorable commodity price impact of severe winter weather in the first quarter of 2021;
•A $24 million increase due to the absence of a 2020 charge related to a legal settlement associated with our former olefins operations;
•A $15 million increase due to the absence of 2020 charges related to write-offs of certain regulatory assets associated with cancelled projects; partially offset by
•A $10 million decrease in the Wamsutter region primarily due to lower MVC revenue.
Net realized gain (loss) from commodity derivatives relating to service revenues changed favorably due to a change in settled commodity prices relative to our hedge positions.
Product margins from our equity NGLs increased $6 million primarily due to higher net realized NGL sales prices, partially offset by higher net realized prices for natural gas purchases associated with our equity NGL production activities. Additionally, volumes of equity NGL sold and natural gas purchased associated with our equity NGL production activities were lower primarily due to a customer contract change. Margins from other sales activities increased $16 million primarily due to higher condensate sales and favorable pricing. Marketing margins decreased $20 million primarily due to the absence of the favorable impact of Winter Storm Uri in the first quarter of 2021.
Other segment costs and expenses increased primarily due to higher operating expenses related to timing and scope of activities including from operations acquired in the Trace Acquisition, the absence of gains on asset sales in
2021, higher corporate allocations, acquisition-related costs associated with the Trace Acquisition, and an unfavorable change in our net imbalance liability due to changes in pricing.
Proportional Modified EBITDA of equity-method investments increased primarily due to higher volumes at OPPL and higher commodity prices and volumes at RMM.
Gas & NGL Marketing Services
| | | | | | | | | | | | | | | | | | | | | |
| | | | | Year Ended December 31, |
| | | | | |
| | | | | 2023 | | 2022 | | 2021 |
| | | | | (Millions) |
| Service revenues | | | | | $ | 1 | | | $ | 3 | | | $ | 3 | |
| Product sales (1) | | | | | 2,060 | | | 3,534 | | | 4,292 | |
| | | | | | | | | |
| Net realized gain (loss) from commodity derivative instruments (1) | | | | | 115 | | | 17 | | | 25 | |
| Net unrealized gain (loss) from commodity derivative instruments | | | | | 702 | | | (321) | | | (109) | |
| Net gain (loss) from commodity derivatives | | | | | 817 | | | (304) | | | (84) | |
| | | | | | | | | |
| Segment revenues | | | | | 2,878 | | | 3,233 | | | 4,211 | |
| Net unrealized gain (loss) from commodity derivative instruments within Net processing commodity expenses | | | | | (43) | | | 47 | | | — | |
| Product costs (1) | | | | | (1,786) | | | (3,228) | | | (4,152) | |
| Other segment costs and expenses | | | | | (99) | | | (92) | | | (37) | |
| Gas & NGL Marketing Services Modified EBITDA | | | | | $ | 950 | | | $ | (40) | | | $ | 22 | |
| | | | | | | | | |
| Commodity margins | | | | | $ | 389 | | | $ | 323 | | | $ | 165 | |
________________(1) Included as a component of Commodity margins.
2023 vs. 2022
Gas & NGL Marketing Services Modified EBITDA increased primarily due to a favorable change in Net unrealized gain (loss) from commodity derivative instruments within Segment revenues and higher Commodity margins, partially offset by an unfavorable change in Net unrealized gain (loss) from commodity derivative instruments within Net processing commodity expenses.
Commodity margins increased $66 million primarily due to:
•A $65 million increase from our natural gas marketing operations including $129 million of higher natural gas storage marketing margins primarily driven by a favorable change of $111 million in lower of cost or net realizable value adjustment; and the absence of a $15 million charge related to the remaining recognition of a legal settlement.purchase accounting inventory fair value adjustment in 2022. The increase in our natural gas marketing margins was partially offset by $64 million of lower natural gas transportation capacity marketing margins due to less favorable net realized pricing spreads;
2020•A $1 million increase in our NGL marketing margins including a $20 million favorable change in lower of cost or net realizable value inventory adjustments, partially offset by higher transportation and fractionation fees and an unfavorable change in net realized gains and losses on sale of inventory in 2023 compared to 2022 driven by an unfavorable change in NGL prices.
Net unrealized gain (loss) from commodity derivative instruments within Segment revenues and Net processing commodity expenses relates to derivative contracts that are not designated as hedges for accounting purposes. The change from 2022 is primarily due to a change in forward commodity prices relative to our hedge positions in 2023 compared to 2022.
2022 vs. 20192021
Gas & NGL Marketing Services Modified EBITDA decreased primarily due to higher net unrealized loss from derivative instruments and higher Other segment costs and expenses, partially offset by higher Commodity margins.
Commodity margins increased $158 million primarily due to:
•A $188 million increase in natural gas marketing margins which included the following:
◦A $301 million increase in natural gas transportation capacity marketing margins primarily resulting from the Sequent Acquisition in the third quarter of 2021 and an increase in favorable pricing spreads in 2022 compared to 2021; partially offset by
◦A $58 million decrease associated with our legacy natural gas marketing operations primarily due to the absence of the favorable impact of Winter Storm Uri in the first quarter of 2021;
◦A $55 million decrease in natural gas storage marketing margins due primarily to an increase in lower of cost or net realizable value inventory adjustments of $115 million and higher storage fees, partially offset by higher storage withdrawals in 2022 compared to 2021.
•A $30 million decrease in our NGL marketing margins primarily due to lower of cost or net realizable value inventory adjustments in 2022.
Net unrealized gain (loss) from commodity derivative instruments changed primarily due to the Sequent Acquisition in July 2021, and a change in forward commodity prices relative to our hedge positions in 2022 compared to 2021.
Other segment costs and expenses increased primarily due to higher employee-related costs related to the Sequent Acquisition and higher corporate allocations.
Other
| | | | | | | | | | | | | | | | | | | | | |
| | | | | | Year Ended December 31, |
| | | | | |
| | | | | | 2023 | | 2022 | | 2021 |
| | | | | | (Millions) |
| Service revenues | | | | | $ | 16 | | | $ | 24 | | | $ | 32 | |
| Product sales (1) | | | | | 442 | | | 706 | | | 333 | |
| | | | | | | | | |
| Net realized gain (loss) from commodity derivative instruments (1) | | | | | 47 | | | (104) | | | (20) | |
| Net unrealized gain (loss) from commodity derivative instruments | | | | | 1 | | | 25 | | | — | |
| Net gain (loss) from commodity derivatives | | | | | 48 | | | (79) | | | (20) | |
| | | | | | | | | |
| Segment revenues | | | | | 506 | | | 651 | | | 345 | |
| | | | | | | | | |
| Other segment costs and expenses | | | | | (197) | | | (217) | | | (167) | |
| Net gain from Energy Transfer litigation judgment | | | | | 534 | | | — | | | — | |
| Proportional Modified EBITDA of equity-method investments | | | | | (2) | | | — | | | — | |
| Other Modified EBITDA | | | | | $ | 841 | | | $ | 434 | | | $ | 178 | |
| | | | | | | | | |
| Net realized product sales | | | | | $ | 489 | | | $ | 602 | | | $ | 313 | |
________________(1) Included as a component of Net realized product sales.
2023 vs. 2022
Other Modified EBITDA increased primarily due to the Net gain from Energy Transfer litigation judgment (see Note 17 – Contingencies and Commitments), partially offset by lower results from our upstream operations, which included the following:
•$113 million decrease in Net realized product sales primarily due to lower net realized commodity prices, partially offset by higher sales associated with increased production volumes. Higher natural gas production volumes from new wells in our Haynesville Shale region and higher crude oil production volumes from new wells in our Wamsutter region were partially offset by lower natural gas and NGL production volumes in our Wamsutter region driven by the impact of severe winter weather in 2023;
•A $24 million unfavorable change in Net unrealized gain (loss) from commodity derivative instruments due to a change in forward commodity prices relative to our hedge positions in 2023 compared to 2022; partially offset by
•An increase in Other segment costs and expenses associated with our upstream operations primarily due to increased production volumes and expenses related to severe winter weather in 2023, partially offset by lower associated ad valorem and production taxes, which were impacted by lower commodity prices and lower natural gas and NGL production volumes in our Wamsutter region.
Other segment costs and expenses not associated with our upstream operations decreased primarily due to the absence of an $11 million charge related to an accrual for loss contingency in the third quarter of 2022 and a $19 million favorable change associated with regulatory assets related to the effects of deferred taxes on equity funds used during construction.
2022 vs. 2021
Other Modified EBITDA decreasedincreased primarily due to:to $248 million higher results from our upstream operations which included the following:
•A $24$289 million chargeincrease in fourth quarterNet realized product sales primarily due to higher commodity prices in 2022, partially offset by the absence of 2020 relatedthe favorable impact of Winter Storm Uri in 2021 and an unfavorable change in Net realized gain (loss) from commodity derivative instruments due to a legal settlementan increase in commodity prices relative to our hedge positions and an increase in the volume of production hedged in 2022 compared to 2021. Net realized product sales also increased due to higher production from new wells and higher volumes associated with former olefins operations;acquisitions of additional ownership interests in 2021;
•A charge$25 million favorable change in Net unrealized gain (loss) from commodity derivative instruments due to a change in forward commodity prices relative to our hedge positions and an increase in the volume of $15 million relatedproduction hedged in 2022 compared to the write-offs of certain regulatory assets associated with cancelled projects in 2020;2021; partially offset by
•TheA $66 million increase in Other segment costs and expenses primarily due to the increased scale of our upstream operations and higher associated production taxes, which were also impacted by higher commodity prices and higher volumes as well as higher tax rates.
Other segment costs and expenses also includes an $11 million charge related to an accrual for loss contingency in 2022, substantially offset by the absence of a 2019 $12$10 million unfavorable adjustmentcharge related to a regulatory asset associated with an increaseaccrual for loss contingency in Transco’s estimated deferred state income tax rate following the merger transaction wherein we acquired all of the outstanding common units held by others of our former publicly traded master limited partnership.2021.
Management’s Discussion and Analysis of Financial Condition and Liquidity
Overview
We have continued to focus on earnings and cash flow growth, while continuing to improve leverage metricsnoting significant increases in both net income and controlcash provided by operating costs.activities. During 2021, we issued approximately $2.152023, investing and financing expenditures included $2.5 billion of new long-term debt primarilycapital expenditures, $1.6 billion of acquisitions including MountainWest and Cureton, and $2.2 billion of dividends paid to fund current or near-term retirements. Incommon shareholders. These expenditures were funded in part by $5.9 billion of cash provided by operating activities (which includes a net $534 million related to our favorable Energy Transfer litigation outcome - see Note 17 – Contingencies and Commitments), and cash from borrowing activities of $2.5 billion. Our financial position also reflects the first half of 2021, we acquired various oil and gas properties indeferred consideration obligation for the Wamsutter field in Wyoming, funding the $165 million paid with cash on hand. In July 2021, we acquired Sequent, funding the final purchase price of $159 million paid with cash on handRMM Acquisition (see Note 3 – Acquisitions and Divestitures). We ended the year with $2.150 billion of Notes toCash and cash equivalents as reported on our Consolidated Financial Statements).Balance Sheet. See also the following section titled Sources (Uses) of Cash.
Outlook
Our growth capital and investment expenditures in 20222024 are currently expected to be in a range from $1.25$1.45 billion to $1.35 billion.$1.75 billion, excluding the Gulf Coast Storage Acquisition for $1.95 billion (see Note 3 – Acquisitions and Divestitures). Growth capital spending in 20222024 primarily includes Transco expansions, all of which are fully contracted with firm transportation agreements, projects supporting growth in the Haynesville Basin, and projects supporting the Northeast G&P business, opportunities in the Haynesville area, and an expansion in the Western Gulf area.business. We also expect to invest capital in the development of our upstream oil and gas properties.Other segment ventures. In addition to growth capital and investment expenditures, we also remain committed to projects that maintain our assets for safe and reliable operations, as well as projects that reduce emissions, and meet legal, regulatory, and/or contractual commitments. We intend to fund substantially all of our planned 20222024 capital spending with cash available after paying dividends. We retain the flexibility to adjust planned levels of growth capital and investment expenditures in response to changes in economic conditions or business opportunities including the repurchase of our common stock as previously discussedstock.
On January 5, 2024, we issued $2.1 billion in Recent Developments.long-term debt (see Note 12 – Debt and Banking Arrangements).
As of December 31, 2021,2023, we have approximately $2.025$2.337 billion of long-term debt due within one year. Our potential sources of liquidity available to address these maturities include cash on hand, proceeds from refinancing, at attractive long-term rates or from our credit facility, or our commercial paper program, as well as proceeds from asset monetizations. In January 2022, we retired our $1.25 billion of 3.6 percent senior unsecured notes that were scheduled to mature in March 2022 with cash on hand.
Liquidity
Based on our forecasted levels of cash flow from operations and other sources of liquidity, we expect to have sufficient liquidity to manage our businesses in 2022.2024. Our potential material internal and external sources and uses of liquidity are as follows:
| | | | | |
| Sources: | |
| Cash and cash equivalents on hand |
| Cash generated from operations |
| Distributions from our equity-method investees |
| Utilization of our credit facility and/or commercial paper program |
| Cash proceeds from issuance of debt and/or equity securities |
| Proceeds from asset monetizations |
| |
| Uses: | |
| Working capital requirements |
| Capital and investment expenditures |
| Product costs |
| Gas & NGL Marketing Services payments for transportation and storage capacity and gas supply |
| Other operating costs including human capital expenses |
| Quarterly dividends to our shareholders |
| Repayments of borrowings under our credit facility and/or commercial paper program |
| Debt service payments, including payments of long-term debt |
| Distributions to noncontrolling interests |
| Share repurchase program |
At December 31, 2021,2023, we have approximately $21.650$23.376 billion of long-term debt due after one year. See Note 1312 – Debt and Banking Arrangements of Notes to Consolidated Financial Statements for the aggregate
maturities over the next five years. Our potential sources of liquidity available to address these maturities include cash generated from operations, proceeds from refinancing, at attractive long-term rates or from our credit facility, or our commercial paper program, as well as proceeds from asset monetizations.
Potential risks associated with our planned levels of liquidity discussed above include those previously discussed in Company Outlook.
As ofAt December 31, 2021,2023, we had a working capital deficit of $423 million,$1.317 billion, including cash and cash equivalents and long-term debt due within one year. Our available liquidity is as follows:
| | | | | | | | |
| Available Liquidity | | December 31, 20212023 |
| | | (Millions) |
| Cash and cash equivalents | | $ | 1,6802,150 | |
| Capacity available under our $3.75 billion credit facility, less amounts outstanding under our $3.5 billion commercial paper program (1) | | 3,7503,025 | |
| | $ | 5,4305,175 | |
__________
(1)In managing our available liquidity, we do not expect a maximum outstanding amount in excess of the capacity of our credit facility inclusive of any outstanding amounts under our commercial paper program. We had no$725 million of commercial paper outstanding as ofat December 31, 2021.2023. The highest amount outstanding under our commercial paper program and credit facility during 20212023 was $15$730 million. At December 31, 2021,2023, we were in compliance with the financial covenants associated with our credit facility. See Note 1312 – Debt and Banking Arrangements of Notes to Consolidated Financial Statements for additional information on our credit facility and commercial paper program.
Dividends
We increased our regular quarterly cash dividend to common stockholders by approximately 2.55.3 percent from the $0.40$0.425 per share paid in each quarter of 2020,2022, to $0.41$0.4475 per share paid in each quarter of 2021.2023.
Registrations
In February 2021,Prior to the expiration of our shelf registration statement, we filedanticipate filing a new shelf registration statement as a well-known seasoned issuer.
Distributions from Equity-Method Investees
The organizational documents of entities in which we have an equity-method investment generally require periodic distributions of their available cash to their members. In each case, available cash is reduced, in part, by reserves appropriate for operating their respective businesses. See Note 98 – Investing Activities of Notes to Consolidated Financial Statements for our more significant equity-method investees.
Credit Ratings
The interest rates at which we are able to borrow money are impacted by our credit ratings. The current ratings are as follows:
| | | | | | | | | | | | | | |
| Rating Agency | | Outlook | | Senior Unsecured
Debt Rating |
| S&P Global Ratings | | Stable | | BBB |
| Moody’s Investors Service | | Stable | | Baa2 |
| Fitch Ratings | | Stable | | BBB |
These credit ratings are included for informational purposes and are not recommendations to buy, sell, or hold our securities, and each rating should be evaluated independently of any other rating. No assurance can be given that the credit rating agencies will continue to assign us investment-grade ratings even if we meet or exceed their current
criteria for investment-grade ratios. A downgrade of our credit ratings might increase our future cost of borrowing
and, if ratings were to fall below investment-grade, could require us to provide additional collateral to third parties, negatively impacting our available liquidity.
Sources (Uses) of Cash
The following table summarizes the sources (uses) of cash and cash equivalents for each of the periods presented (see Notes to Consolidated Financial Statements for the Notes referenced in the table):
| | | | | | | | | | | | | | | | | | | | | | | |
| | Cash Flow | | Year Ended December 31, |
| | Category | | 2021 | | 2020 | | 2019 |
| | | | (Millions) |
| Sources of cash and cash equivalents: | | | | | | | |
| Operating activities – net | Operating | | $ | 3,945 | | | $ | 3,496 | | | $ | 3,693 | |
| Proceeds from long-term debt (see Note 13) | Financing | | 2,155 | | | 2,199 | | | 67 | |
| Proceeds from credit-facility borrowings | Financing | | — | | | 1,700 | | | 700 | |
| Contributions in aid of construction | Investing | | 52 | | | 37 | | | 52 | |
| Proceeds from sale of partial interest in consolidated subsidiary (see Note 3) | Financing | | — | | | — | | | 1,334 | |
| Proceeds from dispositions of equity-method investments (see Note 9) | Investing | | 1 | | | — | | | 485 | |
| | | | | | | |
| | | | | | | |
| Uses of cash and cash equivalents: | | | | | | | |
| Payments of long-term debt (see Note 13) | Financing | | (894) | | | (2,141) | | | (49) | |
| Common dividends paid | Financing | | (1,992) | | | (1,941) | | | (1,842) | |
| Payments on credit-facility borrowings | Financing | | — | | | (1,700) | | | (860) | |
| Capital expenditures | Investing | | (1,239) | | | (1,239) | | | (2,109) | |
| Purchases of and contributions to equity-method investments (see Note 9) | Investing | | (115) | | | (325) | | | (453) | |
| Dividends and distributions paid to noncontrolling interests | Financing | | (187) | | | (185) | | | (124) | |
| Purchases of businesses, net of cash acquired (see Note 3) | Investing | | (151) | | | — | | | (728) | |
| | | | | | | |
| Other sources / (uses) – net | Financing and Investing | | (37) | | | (48) | | | (45) | |
| Increase (decrease) in cash and cash equivalents | | | $ | 1,538 | | | $ | (147) | | | $ | 121 | |
| | | | | | | | | | | | | | | | | | | | | | | |
| | Cash Flow | | Year Ended December 31, |
| | Category | | 2023 | | 2022 | | 2021 |
| | | | (Millions) |
| Sources of cash and cash equivalents: | | | | | | | |
| Net cash provided (used) by operating activities | Operating | | $ | 5,938 | | | $ | 4,889 | | | $ | 3,945 | |
Proceeds from long-term debt (see Note 12) | Financing | | 2,755 | | | 1,755 | | | 2,155 | |
| | | | | | | |
| Proceeds from (payments of) commercial paper - net | Financing | | 372 | | | 345 | | | — | |
Proceeds from sale of business (see Note 3) | Investing | | 346 | | | — | | | — | |
| | | | | | | |
| | | | | | | |
| | | | | | | |
| | | | | | | |
| Uses of cash and cash equivalents: | | | | | | | |
| Capital expenditures | Investing | | (2,516) | | | (2,253) | | | (1,239) | |
| Common dividends paid | Financing | | (2,179) | | | (2,071) | | | (1,992) | |
| | | | | | | |
Purchases of businesses, net of cash acquired (see Note 3) | Investing | | (1,568) | | | (933) | | | (151) | |
Payments of long-term debt (see Note 12) | Financing | | (634) | | | (2,876) | | | (894) | |
| Dividends and distributions paid to noncontrolling interests | Financing | | (213) | | | (204) | | | (187) | |
Purchases of and contributions to equity-method investments (see Note 8) | Investing | | (141) | | | (166) | | | (115) | |
| Purchases of treasury stock | Financing | | (130) | | | (9) | | | — | |
| | | | | | | |
| Other sources / (uses) – net | Financing and Investing | | (32) | | | (5) | | | 16 | |
| Increase (decrease) in cash and cash equivalents | | | $ | 1,998 | | | $ | (1,528) | | | $ | 1,538 | |
Operating activities
The factors that determine operating activities are largely the same as those that affect Net income (loss), with the exception of noncash items such as Depreciation and amortization, Provision (benefit) for deferred income taxes, Equity (earnings) losses, Gain on disposition of equity-method investments, (Gain) loss on deconsolidation of businesses, Impairment of goodwill, Impairment of equity-method investments, Impairment of certain assets, and Net unrealized (gain) loss from commodity derivative instruments.instruments, Gain on sale of business,Inventory write-downs, and Amortization of stock-based awards.
Our Net cash provided (used) by operating activities in 20212023 increased from 20202022 primarily due to higher operating income (excluding noncash items as previously discussed), as well as favorable changes in net operating working capital and margin requirements, partially offset by lower Distributions from equity-method investees.
Our Net cash provided (used) by operating activities in 2022 increased from 2021 primarily due to higher operating income (excluding noncash items as previously discussed), favorable changes in net operating working capital reflecting the absence in 2021 of the Transco rate refund payment made in 2020,margin requirements, and higher distributionsDistributions from unconsolidated affiliates in 2021,equity-method investees, partially offset by unfavorable changes in current and noncurrent derivative assets and liabilities.
Our Net cash provided (used) by operating activities in 2020 decreased from 2019 primarily due to the net unfavorable changes in net operating working capital in 2020, including the payment of Transco’s rate refunds in 2020 and the decrease in the income tax refund that was received in 2020 compared to that received in 2019, partially offset by higher operating income (excluding noncash items as previously discussed) in 2020.capital.
Environmental
We are a participant in certain environmental activities in various stages including assessment studies, cleanup operations, and/or remedial processes at certain sites, some of which we currently do not own (see Note 1917 – Contingent LiabilitiesContingencies and Commitments of Notes to Consolidated Financial Statements)Commitments). We are monitoring these sites in a coordinated effort with other potentially responsible parties, the EPA, or other governmental authorities. We are jointly and severally liable along with
unrelated third parties in some of these activities and solely responsible in others. Current estimates of the most likely costs of such activities are approximately $31$48 million, all of which are included in Accrued and other current liabilities and Regulatory liabilities, deferred income, and other in the Consolidated Balance Sheet at December 31, 2021.2023. We will seek recoveryto recover approximately $3 million of the accrued costs related to remediation activities by our interstate gas pipelines totaling approximately $4 million through future natural gas transmission rates. The remainder of these costs will be funded from operations. During 2021,2023, we paid approximately $5$7 million for cleanup and/or remediation and monitoring activities. We expect to pay approximately $9 million in 20222024 for these activities. Estimates of the most likely costs of cleanup are generally based on completed assessment studies, preliminary results of studies, or our experience with other similar cleanup operations. At December 31, 2021,2023, certain assessment studies were still in process for which the ultimate outcome may yield different estimates of most likely costs. Therefore, the actual costs incurred will depend on the final amount, type, and extent of contamination discovered at these sites, the final cleanup standards mandated by the EPA or other governmental authorities, and other factors.
The EPA and various state regulatory agencies routinely propose and promulgate new rules and issue updated guidance to existing rules. These rulemakings include, but are not limited to, rules for reciprocating internal combustion engine and combustion turbine maximum achievable control technology, reviews and updates to the National Ambient Air Quality Standards, and rules for new and existing source performance standards for volatile organic compounds and methane. We continuously monitor these regulatory changes and how they may impact our operations. Implementation of new or modified regulations may result in impacts to our operations and increase the cost of additions to Property, plant, and equipment – net in the Consolidated Balance Sheet for both new and existing facilities in affected areas; however, due to regulatory uncertainty on final rule content and applicability timeframes, we are unable to reasonably estimate the cost these regulatory impacts at this time.
We consider prudently incurred environmental assessment and remediation costs and the costs associated with compliance with environmental standards to be recoverable through rates for our interstate natural gas transmission pipelines. To date,Historically, with limited exceptions, we have been permitted recovery of these environmental costs, and it is our intent to continue seeking recovery of such costs through future rate filings.
Item 7A. Quantitative and Qualitative Disclosures About Market Risk
Interest Rate Risk
Our current interest rate risk exposure is related primarily to our debt portfolio. Our debt portfolio is primarily comprised of fixed rate debt, which mitigates the impact of fluctuations in interest rates. Any borrowings under our credit facility and any issuances under our commercial paper program could be at a variable interest rate and could expose us to the risk of increasing interest rates. The maturity of our long-term debt portfolio is partially influenced by the expected lives of our operating assets. (SeeWe may utilize interest rate derivative instruments to hedge interest rate risk associated with future debt issuances (see Note 1312 – Debt and Banking Arrangements of Notes to Consolidated Financial Statements.)Arrangements).
The tables below provide information by maturity date about our interest rate risk-sensitive instruments as of December 31, 20212023 and 2020.2022. See Note 1715 – Fair Value Measurements, Guarantees, and Concentration of Credit Risk of Notes to Consolidated Financial Statements for the methods used in determining the fair value of our long-term debt.
| | | 2024 | | | | 2024 | | 2025 | | 2026 | | 2027 | | 2028 | | Thereafter (1) | | Total | | Fair Value December 31, 2023 |
| (Millions) | | | (Millions) |
| Long-term debt, including current portion: | |
| Fixed rate | |
| Fixed rate | |
| Fixed rate | |
| Weighted-average interest rate | |
| Commercial paper (2) | |
| Commercial paper (2) | |
| Commercial paper (2) | |
| | 2022 | | 2023 | | 2024 | | 2025 | | 2026 | | Thereafter (1) | | Total | | Fair Value December 31, 2021 |
| (Millions) |
| | 2023 | |
| | 2023 | |
| | 2023 | | | 2024 | | 2025 | | 2026 | | 2027 | | Thereafter (1) | | Total | | Fair Value December 31, 2022 |
| (Millions) | | | (Millions) |
| Long-term debt, including current portion: | Long-term debt, including current portion: | |
| Fixed rate | |
| Fixed rate | |
| Fixed rate | Fixed rate | | $ | 2,026 | | | $ | 1,478 | | | $ | 2,281 | | | $ | 1,619 | | | $ | 1,244 | | | $ | 15,027 | | | $ | 23,675 | | | $ | 27,768 | |
| Weighted-average interest rate | Weighted-average interest rate | | 4.9 | % | | 5.0 | % | | 5.1 | % | | 5.1 | % | | 5.1 | % | | 5.1 | % | |
| | 2021 | | 2022 | | 2023 | | 2024 | | 2025 | | Thereafter (1) | | Total | | Fair Value December 31, 2020 |
| | (Millions) |
| Long-term debt, including current portion: | |
| Fixed rate | | $ | 894 | | | $ | 2,025 | | | $ | 1,477 | | | $ | 2,280 | | | $ | 1,617 | | | $ | 14,051 | | | $ | 22,344 | | | $ | 27,043 | |
| Weighted-average interest rate | | 5.0 | % | | 5.1 | % | | 5.2 | % | | 5.3 | % | | 5.4 | % | | 5.4 | % | |
| Commercial paper (2) | |
| | Commercial paper (2) | |
| | Commercial paper (2) | |
| | | | |
__________________
(1) Includes unamortized discount / premium and debt issuance costs.
(2) The weighted-average interest rate for commercial paper as of December 31, 2023 and 2022 was 5.6 percent and 4.8 percent, respectively.
Commodity Price Risk
We are exposed to the impact of fluctuations in the marketcommodity price ofrisk through our natural gas NGLs, and crude oil as well as other market factors, such as market volatilityNGL marketing activities, including contracts to purchase, sell, transport, and energy commodity price correlations.store product. We are exposed to these risks in connectionroutinely manage this risk with our owned energy-related assets, our long-term energy-related contracts, and limited proprietary trading activities. Our management of the risks associated with these market fluctuations includes maintaining sufficient liquidity, as well as using various derivatives and nonderivative energy-related contracts. The fair value of derivative contracts is subject to many factors, including changes in energy commodity market prices, the liquidity and volatility of the markets in which the contracts are transacted, and changes in interest rates.
Sequent routinely utilizes various types of derivative instruments to economically hedge certain commodity price risks inherent in the natural gas marketing industry. These instruments include a variety of exchange-traded and OTC energy contracts such as forward contracts, futures contracts, and basis swaps, as well as physical transactions that qualify as derivatives. Thesetransactions. Although many of the contracts used to manage commodity exposure are derivative instruments, these economic hedging activitieshedges are not designated andor do not qualify for hedge accounting treatment.
We are also exposed to commodity prices through our upstream business and certain gathering and processing contracts. We use derivative instruments to lock in forward sales prices on a portion of our expected future production and to lock in NGL margin on a portion of our commodity-exposed gathering and processing volumes. These economic hedges are not designated for hedge accounting treatment.
The maturities of Sequent’sour commodity derivative contracts at December 31, 20212023 and 2022 were as follows:
| | | | | | | | | | | | | | | | | | | | | | | | | | |
| | Total
Fair
Value | | Maturity |
| Fair Value Measurements Using (1) | | | 2022 | | 2023 - 2024 | | 2025 - 2026+ |
| | (Millions) |
| Level 1 | | $ | (69) | | | $ | (49) | | | $ | (30) | | | $ | 10 | |
| Level 2 | | (317) | | | (77) | | | (108) | | | (132) | |
| Level 3 | | (16) | | | (13) | | | (11) | | | 8 | |
| Fair value of contracts outstanding at end of period (2) | | $ | (402) | | | $ | (139) | | | $ | (149) | | | $ | (114) | |
| | | | | | | | | | | | | | | | | | | | | | | | | | |
| | Total
Fair
Value | | Maturity |
| Fair Value Measurements of Assets (Liabilities) Using (1) | | | 2024 | | 2025 - 2026 | | 2027 - 2028+ |
| | (Millions) |
| Level 1 (2) | | $ | 138 | | | $ | 110 | | | $ | 33 | | | $ | (5) | |
| Level 2 | | (166) | | | 14 | | | (71) | | | (109) | |
| Level 3 | | 53 | | | 2 | | | 16 | | | 35 | |
| Fair value of contracts outstanding at December 31, 2023 | | $ | 25 | | | $ | 126 | | | $ | (22) | | | $ | (79) | |
| | | | | | | | | | | | | | | | | | | | | | | | | | |
| | Total
Fair
Value | | Maturity |
| Fair Value Measurements of Assets (Liabilities) Using (1) | | | 2023 | | 2024 - 2025 | | 2026 - 2027+ |
| | (Millions) |
| Level 1 (3) | | $ | (2) | | | $ | 11 | | | $ | (9) | | | $ | (4) | |
| Level 2 | | (586) | | | (171) | | | (224) | | | (191) | |
| Level 3 | | (56) | | | (19) | | | 2 | | | (39) | |
| Fair value of contracts outstanding at December 31, 2022 | | $ | (644) | | | $ | (179) | | | $ | (231) | | | $ | (234) | |
_______________
(1)See Note 1715 – Fair Value Measurements, Guarantees, and Concentration of Credit Risk of Notes to Consolidated Financial Statements for discussion of valuation techniques by level within the fair value hierarchy. See Note 1816 – Commodity Derivatives for the amount of change in fair value recognized in theour Consolidated Statement of Income.
(2)ExcludesCommodity derivative assets and liabilities exclude $2 million of net cash collateral of $267 million in Level 1.
Sequent (3)Commodity derivative assets and liabilities exclude $202 million of net cash collateral in Level 1.
Value at Risk (VaR)
VaR is the maximum potentialpredicted loss in portfolio value over a specified time period that is not expected to be exceeded within a given degree of probability. Sequent’sOur VaR may not be comparable to that of other companies due to differences in the factors used to calculate VaR. Sequent’sOur VaR is determined using a parametric modelmodels with a 95 percent confidence intervalintervals and a one-day holding period,periods, which means that 95 percent of the time, the risk of loss in a day from a portfolio of positions is expected to be less than or equal to the amount of VaR calculated. TheOur open exposure of Sequent is managed in accordance with established policies that limit market risk and require daily reporting of potentialpredicted financial exposureloss to senior management. Because Sequentwe generally managesmanage physical gas assets and economically protects itsprotect our positions by hedging in the futures markets, Sequent’sour open exposure is generally mitigated. Sequent employsWe employ daily risk testing, using both VaR and stress testing, to evaluate the risk of itsour positions.
SequentWe actively monitorsmonitor open commodity marketing positions and the resulting VaR and maintainsmaintain a relatively small risk exposure as total buy volume is close to sell volume, with minimal open natural gas price risk. Starting in the second quarter of 2022, following the further integration of our legacy trading activities with the operations acquired in the Sequent Acquisition, we now present VaR for our integrated natural gas trading operations. For the first quarter of 2022, the VaR presented reflects the legacy Sequent operations only.
The VaR associated with our integrated natural gas trading operations was $9 million at December 31, 2023 and $10 million at December 31, 2022. We had the following VaRs for the period subsequent toperiods shown:
| | | | | | | | | | | | | | | | | | | | | | | | | | | |
| | Twelve Months Ended December 31, 2023 | | Nine Months Ended December 31, 2022 | | Three Months Ended March 31, 2022 | | | | | | | |
| | Trading | | Trading | | Sequent Only | | | | | | | |
| | (Millions) | | | |
| Average | | $ | 6 | | | $ | 10 | | | $ | 6 | | | | | | | | |
| High | | $ | 13 | | | $ | 39 | | | $ | 10 | | | | | | | | |
| Low | | $ | 4 | | | $ | 4 | | | $ | 4 | | | | | | | | |
Our non-trading portfolio primarily consists of commodity derivatives that hedge our upstream business and certain gathering and processing contracts. The VaR associated with these commodity derivatives was $3 million at December 31, 2023 and $8 million at December 31, 2022. We had the Sequent Acquisition:following VaRs for the periods shown:
| | | | | | | | |
| Six Months Ended December 31, 2021 | | | |
| (Millions) |
Average | $ | 3.6 | | | | |
High | $ | 7.4 | | | | |
Low | $ | 1.6 | | | | |
| | | | | | | | | | | | | | | | | | | | | |
| | Twelve Months Ended December 31, 2023 | | Six Months Ended December 31, 2022 | | | | | | | |
| | | | | | | | | | | |
| | (Millions) | | | |
| Average | | $ | 4 | | | $ | 16 | | | | | | | | |
| High | | $ | 8 | | | $ | 33 | | | | | | | | |
| Low | | $ | 2 | | | $ | 7 | | | | | | | | |
Item 8. Financial Statements and Supplementary Data
Report of Independent Registered Public Accounting Firm
TheTo the Stockholders and the Board of Directors of
The Williams Companies, Inc.
Opinion on the Financial Statements
We have audited the accompanying consolidated balance sheet of The Williams Companies, Inc. (the Company) as of December 31, 20212023 and 2020,2022, the related consolidated statements of income, comprehensive income (loss), changes in equity and cash flows for each of the three years in the period ended December 31, 2021,2023, and the related notes and the financial statement schedule listed in the indexIndex at Item 15(a) (collectively referred to as the “consolidated financial statements”). In our opinion, based on our audits and the report of other auditors, the consolidated financial statements present fairly, in all material respects, the consolidated financial position of the Company at December 31, 20212023 and 2020,2022, and the consolidated results of its operations and its cash flows for each of the three years in the period ended December 31, 2021,2023, in conformity with U.S. generally accepted accounting principles.
We did not audit the 2020 or 2019 financial statements of Gulfstream Natural Gas System, L.L.C. (Gulfstream), a limited liability corporation in which the Company has a 50 percent interest. In the consolidated financial statements, the Company’s investment in Gulfstream was $204 million as of December 31, 2020, and the Company’s equity earnings in the net income of Gulfstream were $77 million in 2020 and $74 million in 2019. Those financial statements were audited by other auditors whose report has been furnished to us, and our opinion, insofar as it relates to the amounts included for Gulfstream for 2020 and 2019, is based solely on the report of other auditors.
We also have audited, in accordance with the standards of the Public Company Accounting Oversight Board (United States) (PCAOB), the Company's internal control over financial reporting as of December 31, 2021,2023, based on criteria established in Internal Control-Integrated Framework issued by the Committee of Sponsoring Organizations of the Treadway Commission (2013 framework) and our report dated February 28, 202221, 2024 expressed an unqualified opinion thereon.
Basis for Opinion
These consolidated financial statements are the responsibility of the Company's management. Our responsibility is to express an opinion on the Company’s consolidated financial statements based on our audits. We are a public accounting firm registered with the PCAOB and are required to be independent with respect to the Company in accordance with the U.S. federal securities laws and the applicable rules and regulations of the Securities and Exchange Commission and the PCAOB.
We conducted our audits in accordance with the standards of the PCAOB. Those standards require that we plan and perform the audit to obtain reasonable assurance about whether the consolidated financial statements are free of material misstatement, whether due to error or fraud. Our audits included performing procedures to assess the risks of material misstatement of the consolidated financial statements, whether due to error or fraud, and performing procedures that respond to those risks. Such procedures included examining, on a test basis, evidence regarding the amounts and disclosures in the consolidated financial statements. Our audits also included evaluating the accounting principles used and significant estimates made by management, as well as evaluating the overall presentation of the consolidated financial statements. We believe that our audits and the report of other auditors provide a reasonable basis for our opinion.
| | | | | | | | | | | | | | |
| Critical Audit Matters | |
| The critical audit matter communicated below is a matter arising from the current period audit of the financial statements that was communicated or required to be communicated to the audit committee and that (1) relates to accounts or disclosures that are material to the financial statements and (2) involved our especially challenging, subjective or complex judgments. The communication of the critical audit matter does not alter in any way our opinion on the consolidated financial statements, taken as a whole, and we are not, by communicating the critical audit matter below, providing a separate opinion on the critical audit matter or on the account or disclosure to which it relates. |
| | | Pension and Other Postretirement Benefit ObligationsObligation |
| Description of the Matter | | | At December 31, 2021,2023, the Company’s aggregate pension and other postretirement benefit obligations were $1,333obligation was $1,006 million and werewas exceeded by the fair value of pension and other postretirement plan assets of $1,623$1,167 million, resulting in an overfunded pension and other postretirement benefit obligationsobligation of $290$161 million. As explained in Note 87 to the consolidated financial statements, the Company utilized key assumptions to determine the pension and other postretirement benefit obligations.obligation.
Auditing the pension and other postretirement benefit obligationsobligation is complex and required the involvement of specialists due to the judgmental nature of the actuarial assumptions (e.g., discount rates and cash balance interest crediting rate) used in the measurement process. These assumptions have a significant effect on the projected benefit obligations.obligation. |
| How We Addressed the Matter in Our Audit | | | We obtained an understanding, evaluated the design, and tested the operating effectiveness of controls relating to the measurement and valuation of the pension and other postretirement benefit obligations,obligation, including controls over management’s review of the pension and other postretirement obligations,benefit obligation, the significant actuarial assumptions and the data inputs.
To test the pension and other postretirement benefit obligations,obligation, our audit procedures included, among others, evaluating the methodologies used, the significant actuarial assumptions discussed above, and the underlying data used by the Company. We compared the actuarial assumptions used by management to historical trends and evaluated the changes in the funded status from prior year. In addition, we involved our actuarial specialists to assist with our procedures. For example, we evaluated management’s methodology for determining the discount rates that reflect the maturity and duration of the benefit payments and are used to measure the pension and other postretirement benefit obligations.obligation. As part of this assessment, we independently developed a range of yield curves, we compared the projected cash flows to prior year, and compared the current year benefits paid to the prior year projected cash flows. To test the cash balance interest crediting rate, we independently calculated a range of rates and compared them to the rate used by management. We also tested the completeness and accuracy of the underlying data, including the participant data. |
/s/ Ernst & Young LLP
We have served as the Company’s auditor since 1962.
Tulsa, Oklahoma
February 28, 202221, 2024
Report of Independent Registered Public Accounting Firm
To the Management Committee and Members of Gulfstream Natural Gas System, L.L.C.:
Opinion on the Financial Statements
We have audited the statement of financial position of Gulfstream Natural Gas System, L.L.C. (the “Company”) as of December 31, 2020, and the related statements of earnings, comprehensive income, changes in members’ equity and cash flows for each two years in the period ended December 31, 2020, including the related notes (collectively referred to as the “financial statements”) (not presented herein). In our opinion, the financial statements present fairly, in all material respects, the financial position of the Company as of December 31, 2020, and the results of its operations and its cash flows for each of the two years in the period ended December 31, 2020 in conformity with accounting principles generally accepted in the United States of America.
Basis for Opinion
These financial statements are the responsibility of the Company’s management. Our responsibility is to express an opinion on the Company’s financial statements based on our audits. We are a public accounting firm registered with the Public Company Accounting Oversight Board (United States) (PCAOB) and are required to be independent with respect to the Company in accordance with the U.S. federal securities laws and the applicable rules and regulations of the Securities and Exchange Commission and the PCAOB.
We conducted our audits of these financial statements in accordance with the standards of the PCAOB and in accordance with auditing standards generally accepted in the United States of America. Those standards require that we plan and perform the audit to obtain reasonable assurance about whether the financial statements are free of material misstatement, whether due to error or fraud.
Our audits included performing procedures to assess the risks of material misstatement of the financial statements, whether due to error or fraud, and performing procedures that respond to those risks. Such procedures included examining, on a test basis, evidence regarding the amounts and disclosures in the financial statements. Our audits also included evaluating the accounting principles used and significant estimates made by management, as well as evaluating the overall presentation of the financial statements. We believe that our audits provide a reasonable basis for our opinion.
/s/ PricewaterhouseCoopers LLP
Houston, Texas
February 28, 2022
We have served as the Company’s auditor since 2018.
The Williams Companies, Inc.
Consolidated Statement of Income
| | | | | | | Year Ended December 31, | |
| | | | | | Year Ended December 31, | |
| | | | | | Year Ended December 31, | |
| | | | | | | 2023 | |
| | | | | | 2023 | |
| | | | | | 2023 | | | 2022 | | 2021 |
| (Millions, except per-share amounts) | | | (Millions, except per-share amounts) |
| Revenues: | |
| Service revenues | |
| Service revenues | |
| Service revenues | |
| Service revenues – commodity consideration | |
| Product sales | |
| Net gain (loss) from commodity derivatives | |
| Total revenues | |
| Costs and expenses: | |
| Product costs | |
| Product costs | |
| Product costs | |
| Net processing commodity expenses | |
| Operating and maintenance expenses | |
| Depreciation and amortization expenses | |
| Selling, general, and administrative expenses | |
| | | Year Ended December 31, |
| | 2021 | | 2020 | | 2019 |
Gain on sale of business (Note 3) | |
| | (Millions, except per-share amounts) |
| Revenues: | |
| Service revenues | | $ | 6,001 | | | $ | 5,924 | | | $ | 5,933 | |
| Service revenues – commodity consideration | | 238 | | | 129 | | | 203 | |
| Product sales | | 4,536 | | | 1,671 | | | 2,063 | |
| Net gain (loss) on commodity derivatives | | (148) | | | (5) | | | 2 | |
| Total revenues | | 10,627 | | | 7,719 | | | 8,201 | |
| Costs and expenses: | |
| Product costs | | 3,931 | | | 1,545 | | | 1,961 | |
| Processing commodity expenses | | 101 | | | 68 | | | 105 | |
| Operating and maintenance expenses | | 1,548 | | | 1,326 | | | 1,468 | |
| Depreciation and amortization expenses | | 1,842 | | | 1,721 | | | 1,714 | |
| Selling, general, and administrative expenses | | 558 | | | 466 | | | 558 | |
| Impairment of certain assets (Note 17) | | 2 | | | 182 | | | 464 | |
| Impairment of goodwill (Note 17) | | — | | | 187 | | | — | |
| Gain on sale of business (Note 3) | |
| Gain on sale of business (Note 3) | |
| Other (income) expense – net | Other (income) expense – net | | 14 | | | 22 | | | 10 | |
| Total costs and expenses | Total costs and expenses | | 7,996 | | | 5,517 | | | 6,280 | |
| Operating income (loss) | Operating income (loss) | | 2,631 | | | 2,202 | | | 1,921 | |
| Equity earnings (losses) (Note 9) | | 608 | | | 328 | | | 375 | |
| Impairment of equity-method investments (Note 17) | | — | | | (1,046) | | | (186) | |
| Other investing income (loss) – net (Note 9) | | 7 | | | 8 | | | 107 | |
| Interest incurred | | (1,190) | | | (1,192) | | | (1,218) | |
| Interest capitalized | | 11 | | | 20 | | | 32 | |
| Equity earnings (losses) | |
| | Other investing income (loss) – net | |
| | Other investing income (loss) – net | |
| | Other investing income (loss) – net | |
| Interest expense | |
| | Net gain from Energy Transfer litigation judgment (Note 17) | |
| | Net gain from Energy Transfer litigation judgment (Note 17) | |
| | Net gain from Energy Transfer litigation judgment (Note 17) | |
| Other income (expense) – net | Other income (expense) – net | | 6 | | | (43) | | | 33 | |
| Income (loss) from continuing operations before income taxes | | 2,073 | | | 277 | | | 1,064 | |
| Income (loss) before income taxes | |
| Less: Provision (benefit) for income taxes | Less: Provision (benefit) for income taxes | | 511 | | | 79 | | | 335 | |
| Income (loss) from continuing operations | Income (loss) from continuing operations | | 1,562 | | | 198 | | | 729 | |
| Income (loss) from discontinued operations | | — | | | — | | | (15) | |
| Income (loss) from discontinued operations (Note 17) | |
| Net income (loss) | Net income (loss) | | 1,562 | | | 198 | | | 714 | |
| Less: Net income (loss) attributable to noncontrolling interests | Less: Net income (loss) attributable to noncontrolling interests | | 45 | | | (13) | | | (136) | |
| Net income (loss) attributable to The Williams Companies, Inc. | Net income (loss) attributable to The Williams Companies, Inc. | | 1,517 | | | 211 | | | 850 | |
| Less: Preferred stock dividends | Less: Preferred stock dividends | | 3 | | | 3 | | | 3 | |
| Net income (loss) available to common stockholders | Net income (loss) available to common stockholders | | $ | 1,514 | | | $ | 208 | | | $ | 847 | |
| Amounts attributable to The Williams Companies, Inc. available to common stockholders: | Amounts attributable to The Williams Companies, Inc. available to common stockholders: | | | | | | |
| Income (loss) from continuing operations | Income (loss) from continuing operations | | $ | 1,514 | | | $ | 208 | | | $ | 862 | |
| Income (loss) from discontinued operations | | — | | | — | | | (15) | |
| Net income (loss) | | $ | 1,514 | | | $ | 208 | | | $ | 847 | |
| Income (loss) from continuing operations | |
| Income (loss) from continuing operations | |
| Income (loss) from discontinued operations (Note 17) | |
| Net income (loss) available to common stockholders | |
| Basic earnings (loss) per common share: | Basic earnings (loss) per common share: | | | | | | |
| Income (loss) from continuing operations | Income (loss) from continuing operations | | $ | 1.25 | | | $ | .17 | | | $ | .71 | |
| Income (loss) from continuing operations | |
| Income (loss) from continuing operations | |
| Income (loss) from discontinued operations | Income (loss) from discontinued operations | | — | | | — | | | (.01) | |
| Net income (loss) | | $ | 1.25 | | | $ | .17 | | | $ | .70 | |
| Net income (loss) available to common stockholders | |
| Weighted-average shares (thousands) | Weighted-average shares (thousands) | | 1,215,221 | | | 1,213,631 | | | 1,212,037 | |
| Diluted earnings (loss) per common share: | Diluted earnings (loss) per common share: | |
| Income (loss) from continuing operations | Income (loss) from continuing operations | | $ | 1.24 | | | $ | .17 | | | $ | .71 | |
| Income (loss) from continuing operations | |
| Income (loss) from continuing operations | |
| Income (loss) from discontinued operations | Income (loss) from discontinued operations | | — | | | — | | | (.01) | |
| Net income (loss) | | $ | 1.24 | | | $ | .17 | | | $ | .70 | |
| Net income (loss) available to common stockholders | |
| Weighted-average shares (thousands) | Weighted-average shares (thousands) | | 1,218,215 | | | 1,215,165 | | | 1,214,011 | |
See accompanying notes.
The Williams Companies, Inc.
Consolidated Statement of Comprehensive Income (Loss)
| | | | | | | Year Ended December 31, | |
| | | | | | Year Ended December 31, | |
| | | | | | Year Ended December 31, | |
| | Year Ended December 31, |
| 2021 | | 2020 | | 2019 |
| (Millions) |
| | | | | | 2023 | |
| | | | | | 2023 | |
| | | | | | 2023 | | | 2022 | | 2021 |
| (Millions) | | | (Millions) |
| Net income (loss) | Net income (loss) | | $ | 1,562 | | | $ | 198 | | | $ | 714 | |
| Other comprehensive income (loss): | Other comprehensive income (loss): | |
| Cash flow hedging activities: | |
| Net unrealized gain (loss) from derivative instruments, net of taxes of $14, $—, and $— in 2021, 2020, and 2019, respectively | | (40) | | | (2) | | | — | |
| Reclassifications into earnings of net derivative instruments (gain) loss, net of taxes of ($14), $—, and $— in 2021, 2020, and 2019, respectively | | 41 | | | 1 | | | — | |
| Designated interest rate cash flow hedging activities: | |
| Designated interest rate cash flow hedging activities: | |
| Designated interest rate cash flow hedging activities: | |
| Net unrealized gain (loss) from derivative instruments, net of taxes of ($8), $1, and $14 in 2023, 2022, and 2021, respectively | |
| Net unrealized gain (loss) from derivative instruments, net of taxes of ($8), $1, and $14 in 2023, 2022, and 2021, respectively | |
| Net unrealized gain (loss) from derivative instruments, net of taxes of ($8), $1, and $14 in 2023, 2022, and 2021, respectively | |
| Reclassifications into earnings of net derivative instruments (gain) loss, net of taxes of $1, $—, and ($14) in 2023, 2022, and 2021, respectively | |
| | Pension and other postretirement benefits: | Pension and other postretirement benefits: | |
| | Net actuarial gain (loss) arising during the year, net of taxes of ($18), ($27), and ($20) in 2021, 2020, and 2019, respectively | | 51 | | | 81 | | | 59 | |
| Amortization of actuarial (gain) loss and net actuarial loss from settlements included in net periodic benefit cost (credit), net of taxes of ($4), ($7), and ($4) in 2021, 2020, and 2019, respectively | | 11 | | | 23 | | | 12 | |
| Pension and other postretirement benefits: | |
| | | Pension and other postretirement benefits: | |
| | Net actuarial gain (loss) arising during the year, net of taxes of $—, $1, and ($18) in 2023, 2022, and 2021, respectively | |
| | Net actuarial gain (loss) arising during the year, net of taxes of $—, $1, and ($18) in 2023, 2022, and 2021, respectively | |
| | Net actuarial gain (loss) arising during the year, net of taxes of $—, $1, and ($18) in 2023, 2022, and 2021, respectively | |
| Amortization of actuarial (gain) loss and net actuarial loss from settlements included in net periodic benefit cost (credit), net of taxes of $—, ($4), and ($4) in 2023, 2022, and 2021, respectively | |
| | Other comprehensive income (loss) | |
| | Other comprehensive income (loss) | |
| | Other comprehensive income (loss) | Other comprehensive income (loss) | | 63 | | | 103 | | | 71 | |
| Comprehensive income (loss) | Comprehensive income (loss) | | 1,625 | | | 301 | | | 785 | |
| Less: Comprehensive income (loss) attributable to noncontrolling interests | Less: Comprehensive income (loss) attributable to noncontrolling interests | | 45 | | | (13) | | | (136) | |
| Comprehensive income (loss) attributable to The Williams Companies, Inc. | Comprehensive income (loss) attributable to The Williams Companies, Inc. | | $ | 1,580 | | | $ | 314 | | | $ | 921 | |
See accompanying notes.
The Williams Companies, Inc.
Consolidated Balance Sheet
| | December 31, |
| 2021 | | 2020 |
| (Millions, except per-share amounts) |
| | December 31, | | | | December 31, |
| | 2023 | | | | 2023 | | 2022 |
| | (Millions, except per-share amounts) | | | | (Millions, except per-share amounts) |
| ASSETS | ASSETS | |
| Current assets: | Current assets: | |
| Current assets: | |
| Current assets: | |
| Cash and cash equivalents | Cash and cash equivalents | | $ | 1,680 | | | $ | 142 | |
| Trade accounts and other receivables | | 1,986 | | | 1,000 | |
| Allowance for doubtful accounts | | (8) | | | (1) | |
| Trade accounts and other receivables – net | | 1,978 | | | 999 | |
| Cash and cash equivalents | |
| Cash and cash equivalents | |
| Trade accounts and other receivables (net of allowance of $3 at December 31, 2023 and $6 at December 31, 2022) | |
| Inventories | Inventories | | 379 | | | 136 | |
| Derivative assets | Derivative assets | | 301 | | | 3 | |
| Other current assets and deferred charges | Other current assets and deferred charges | | 211 | | | 149 | |
| Total current assets | Total current assets | | 4,549 | | | 1,429 | |
| | Investments | |
| Investments | |
| Investments | Investments | | 5,127 | | | 5,159 | |
| Property, plant, and equipment – net | Property, plant, and equipment – net | | 29,258 | | | 28,929 | |
| Intangible assets – net of accumulated amortization | Intangible assets – net of accumulated amortization | | 7,402 | | | 7,444 | |
| Regulatory assets, deferred charges, and other | Regulatory assets, deferred charges, and other | | 1,276 | | | 1,204 | |
| Total assets | Total assets | | $ | 47,612 | | | $ | 44,165 | |
| | LIABILITIES AND EQUITY | LIABILITIES AND EQUITY | |
| LIABILITIES AND EQUITY | |
| LIABILITIES AND EQUITY | |
| Current liabilities: | |
| Current liabilities: | |
| Current liabilities: | Current liabilities: | |
| Accounts payable | Accounts payable | | $ | 1,746 | | | $ | 482 | |
| Accrued liabilities | | 1,201 | | | 944 | |
| Accounts payable | |
| Accounts payable | |
| Derivative liabilities | |
| Accrued and other current liabilities | |
| Commercial paper | |
| Long-term debt due within one year | Long-term debt due within one year | | 2,025 | | | 893 | |
| Total current liabilities | Total current liabilities | | 4,972 | | | 2,319 | |
| | Long-term debt | Long-term debt | | 21,650 | | | 21,451 | |
| Long-term debt | |
| Long-term debt | |
| Deferred income tax liabilities | Deferred income tax liabilities | | 2,453 | | | 1,923 | |
| Regulatory liabilities, deferred income, and other | Regulatory liabilities, deferred income, and other | | 4,436 | | | 3,889 | |
| Contingent liabilities and commitments (Note 19) | | 0 | | 0 |
| Contingent liabilities and commitments (Note 17) | | Contingent liabilities and commitments (Note 17) | | |
| | Equity: | Equity: | |
| Equity: | |
| Equity: | |
| Stockholders’ equity: | Stockholders’ equity: | |
| Preferred stock ($1 par value; 30 million shares authorized at December 31, 2021 and December 31, 2020; 35,000 shares issued at December 31, 2021 and December 31, 2020) | | 35 | | | 35 | |
| Common stock ($1 par value; 1,470 million shares authorized at December 31, 2021 and December 31, 2020; 1,250 million shares issued at December 31, 2021 and 1,248 million shares issued at December 31, 2020) | | 1,250 | | | 1,248 | |
| Stockholders’ equity: | |
| Stockholders’ equity: | |
| Preferred stock ($1 par value; 30 million shares authorized at December 31, 2023 and December 31, 2022; 35,000 shares issued at December 31, 2023 and December 31, 2022) | |
| Preferred stock ($1 par value; 30 million shares authorized at December 31, 2023 and December 31, 2022; 35,000 shares issued at December 31, 2023 and December 31, 2022) | |
| Preferred stock ($1 par value; 30 million shares authorized at December 31, 2023 and December 31, 2022; 35,000 shares issued at December 31, 2023 and December 31, 2022) | |
| Common stock ($1 par value; 1,470 million shares authorized at December 31, 2023 and December 31, 2022; 1,256 million shares issued at December 31, 2023 and 1,253 million shares issued at December 31, 2022) | |
| Capital in excess of par value | Capital in excess of par value | | 24,449 | | | 24,371 | |
| Retained deficit | Retained deficit | | (13,237) | | | (12,748) | |
| Accumulated other comprehensive income (loss) | Accumulated other comprehensive income (loss) | | (33) | | | (96) | |
| Treasury stock, at cost (35 million shares of common stock) | | (1,041) | | | (1,041) | |
| Treasury stock, at cost (39 million shares at December 31, 2023 and 35 million shares at December 31, 2022 of common stock) | |
| Total stockholders’ equity | Total stockholders’ equity | | 11,423 | | | 11,769 | |
| Noncontrolling interests in consolidated subsidiaries | Noncontrolling interests in consolidated subsidiaries | | 2,678 | | | 2,814 | |
| Total equity | Total equity | | 14,101 | | | 14,583 | |
| Total liabilities and equity | Total liabilities and equity | | $ | 47,612 | | | $ | 44,165 | |
See accompanying notes.
The Williams Companies, Inc.
Consolidated Statement of Changes in Equity
| | The Williams Companies, Inc. Stockholders | |
| Preferred Stock | |
| Preferred Stock | |
| Preferred Stock | | | Common
Stock | | Capital in
Excess of
Par Value | | Retained
Deficit | | AOCI* | | Treasury
Stock | | Total
Stockholders’
Equity | | Noncontrolling
Interests | | Total Equity |
| (Millions) | | | (Millions) |
| Balance at December 31, 2020 | |
| | The Williams Companies, Inc. Stockholders | |
| Preferred Stock | | Common
Stock | | Capital in
Excess of
Par Value | | Retained
Deficit | | AOCI* | | Treasury
Stock | | Total
Stockholders’
Equity | | Noncontrolling
Interests | | Total Equity |
| (Millions) |
| Balance at December 31, 2018 | $ | 35 | | | $ | 1,245 | | | $ | 24,693 | | | $ | (10,002) | | | $ | (270) | | | $ | (1,041) | | | $ | 14,660 | | | $ | 1,337 | | | $ | 15,997 | |
| | Net income (loss) | |
| Net income (loss) | |
| Net income (loss) | Net income (loss) | — | | | — | | | — | | | 850 | | | — | | | — | | | 850 | | | (136) | | | 714 | |
| Other comprehensive income (loss) | Other comprehensive income (loss) | — | | | — | | | — | | | — | | | 71 | | | — | | | 71 | | | — | | | 71 | |
| | Cash dividends – common stock ($1.52 per share) | — | | | — | | | — | | | (1,842) | | | — | | | — | | | (1,842) | | | — | | | (1,842) | |
| Dividends and distributions to noncontrolling interests | — | | | — | | | — | | | — | | | — | | | — | | | — | | | (124) | | | (124) | |
| Stock-based compensation and related common stock issuances, net of tax | — | | | 2 | | | 56 | | | — | | | — | | | — | | | 58 | | | — | | | 58 | |
| Sale of partial interest in consolidated subsidiary | — | | | — | | | — | | | — | | | — | | | — | | | — | | | 1,334 | | | 1,334 | |
| Changes in ownership of consolidated subsidiaries, net | — | | | — | | | (426) | | | — | | | — | | | — | | | (426) | | | 567 | | | 141 | |
| Contributions from noncontrolling interests | — | | | — | | | — | | | — | | | — | | | — | | | — | | | 36 | | | 36 | |
| Deconsolidation of subsidiary (Note 9) | — | | | — | | | — | | | — | | | �� | | | — | | | — | | | (13) | | | (13) | |
| Other | — | | | — | | | — | | | (8) | | | — | | | — | | | (8) | | | — | | | (8) | |
| Net increase (decrease) in equity | — | | | 2 | | | (370) | | | (1,000) | | | 71 | | | — | | | (1,297) | | | 1,664 | | | 367 | |
| Balance at December 31, 2019 | 35 | | | 1,247 | | | 24,323 | | | (11,002) | | | (199) | | | (1,041) | | | 13,363 | | | 3,001 | | | 16,364 | |
| Net income (loss) | — | | | — | | | — | | | 211 | | | — | | | — | | | 211 | | | (13) | | | 198 | |
| Other comprehensive income (loss) | — | | | — | | | — | | | — | | | 103 | | | — | | | 103 | | | — | | | 103 | |
| Cash dividends – common stock ($1.60 per share) | — | | | — | | | — | | | (1,941) | | | — | | | — | | | (1,941) | | | — | | | (1,941) | |
| Dividends and distributions to noncontrolling interests | — | | | — | | | — | | | — | | | — | | | — | | | — | | | (185) | | | (185) | |
| Stock-based compensation and related common stock issuances, net of tax | — | | | 1 | | | 50 | | | — | | | — | | | — | | | 51 | | | — | | | 51 | |
| Contributions from noncontrolling interests | — | | | — | | | — | | | — | | | — | | | — | | | — | | | 7 | | | 7 | |
| Other | — | | | — | | | (2) | | | (16) | | | — | | | — | | | (18) | | | 4 | | | (14) | |
| Net increase (decrease) in equity | — | | | 1 | | | 48 | | | (1,746) | | | 103 | | | — | | | (1,594) | | | (187) | | | (1,781) | |
| Balance at December 31, 2020 | 35 | | | 1,248 | | | 24,371 | | | (12,748) | | | (96) | | | (1,041) | | | 11,769 | | | 2,814 | | | 14,583 | |
| Net income (loss) | — | | | — | | | — | | | 1,517 | | | — | | | — | | | 1,517 | | | 45 | | | 1,562 | |
| Other comprehensive income (loss) | — | | | — | | | — | | | — | | | 63 | | | — | | | 63 | | | — | | | 63 | |
| Cash dividends – common stock ($1.64 per share) | |
| | Cash dividends – common stock ($1.64 per share) | |
| | Cash dividends – common stock ($1.64 per share) | Cash dividends – common stock ($1.64 per share) | — | | | — | | | — | | | (1,992) | | | — | | | — | | | (1,992) | | | — | | | (1,992) | |
| Dividends and distributions to noncontrolling interests | Dividends and distributions to noncontrolling interests | — | | | — | | | — | | | — | | | — | | | — | | | — | | | (187) | | | (187) | |
| Stock-based compensation and related common stock issuances, net of tax | Stock-based compensation and related common stock issuances, net of tax | — | | | 2 | | | 78 | | | — | | | — | | | — | | | 80 | | | — | | | 80 | |
| Purchase of partial interest in consolidated subsidiary (Note 9) | — | | | — | | | — | | | — | | | — | | | — | | | — | | | (3) | | | (3) | |
| | Contributions from noncontrolling interests | |
| | Contributions from noncontrolling interests | |
| | Contributions from noncontrolling interests | Contributions from noncontrolling interests | — | | | — | | | — | | | — | | | — | | | — | | | — | | | 9 | | | 9 | |
| | Other | Other | — | | | — | | | — | | | (14) | | | — | | | — | | | (14) | | | — | | | (14) | |
| Other | |
| Other | |
| Net increase (decrease) in equity | Net increase (decrease) in equity | — | | | 2 | | | 78 | | | (489) | | | 63 | | | — | | | (346) | | | (136) | | | (482) | |
| Balance at December 31, 2021 | Balance at December 31, 2021 | $ | 35 | | | $ | 1,250 | | | $ | 24,449 | | | $ | (13,237) | | | $ | (33) | | | $ | (1,041) | | | $ | 11,423 | | | $ | 2,678 | | | $ | 14,101 | |
| Net income (loss) | |
| Other comprehensive income (loss) | |
| Cash dividends – common stock ($1.70 per share) | |
| Dividends and distributions to noncontrolling interests | |
| Stock-based compensation and related common stock issuances, net of tax | |
| | Contributions from noncontrolling interests | |
| Contributions from noncontrolling interests | |
| Contributions from noncontrolling interests | |
| Purchases of treasury stock | |
| Other | |
| Net increase (decrease) in equity | |
| Balance at December 31, 2022 | |
| Net income (loss) | |
| Other comprehensive income (loss) | |
| Cash dividends – common stock ($1.79 per share) | |
| Dividends and distributions to noncontrolling interests | |
| Stock-based compensation and related common stock issuances, net of tax | |
| | Contributions from noncontrolling interests | |
| | Contributions from noncontrolling interests | |
| | Contributions from noncontrolling interests | |
| Purchases of treasury stock | |
| | Other | |
| Other | |
| Other | |
| Net increase (decrease) in equity | |
| Balance at December 31, 2023 | |
*Accumulated Other Comprehensive Income (Loss)
See accompanying notes.
The Williams Companies, Inc.
Consolidated Statement of Cash Flows
| | | | | | Year Ended December 31, |
| | 2023 | | | | 2023 | | 2022 | | 2021 |
| | (Millions) | | | | (Millions) |
| OPERATING ACTIVITIES: | |
| Net income (loss) | |
| Net income (loss) | |
| Net income (loss) | |
| Adjustments to reconcile to net cash provided (used) by operating activities: | |
| Depreciation and amortization | |
| Depreciation and amortization | |
| Depreciation and amortization | |
| Provision (benefit) for deferred income taxes | |
| Equity (earnings) losses | |
| Distributions from equity-method investees (Note 8) | |
| | | | | Year Ended December 31, |
| | 2021 | | 2020 | | 2019 |
| (Millions) |
| OPERATING ACTIVITIES: | |
| Net income (loss) | | $ | 1,562 | | | $ | 198 | | | $ | 714 | |
| Adjustments to reconcile to net cash provided (used) by operating activities: | |
| Depreciation and amortization | | 1,842 | | | 1,721 | | | 1,714 | |
| Provision (benefit) for deferred income taxes | | 509 | | | 108 | | | 376 | |
| Equity (earnings) losses | | (608) | | | (328) | | | (375) | |
| Distributions from unconsolidated affiliates | | 757 | | | 653 | | | 657 | |
| Gain on disposition of equity-method investments (Note 9) | | — | | | — | | | (122) | |
| Net unrealized (gain) loss from commodity derivative instruments | |
| | (Gain) loss on deconsolidation of businesses (Note 9) | | — | | | — | | | 29 | |
| Impairment of goodwill (Note 17) | | — | | | 187 | | | — | |
| Impairment of equity-method investments (Note 17) | | — | | | 1,046 | | | 186 | |
| Impairment of certain assets (Note 17) | | 2 | | | 182 | | | 464 | |
| Net unrealized (gain) loss from derivative instruments | | 109 | | | — | | | (3) | |
| Amortization of stock-based awards | | 81 | | | 52 | | | 57 | |
| Net unrealized (gain) loss from commodity derivative instruments | |
| | Net unrealized (gain) loss from commodity derivative instruments | |
| Gain on sale of business (Note 3) | |
| Inventory write-downs | |
| Amortization of stock-based awards | |
| Cash provided (used) by changes in current assets and liabilities: | Cash provided (used) by changes in current assets and liabilities: | |
| Accounts receivable | |
| Accounts receivable | |
| Accounts receivable | Accounts receivable | | (545) | | | (2) | | | 34 | |
| Inventories | Inventories | | (124) | | | (11) | | | 5 | |
| Other current assets and deferred charges | Other current assets and deferred charges | | (63) | | | 11 | | | 21 | |
| Accounts payable | Accounts payable | | 643 | | | (7) | | | (46) | |
| Accrued liabilities | | 58 | | | (309) | | | 153 | |
| Changes in current and noncurrent derivative assets and liabilities | | (277) | | | (4) | | | 3 | |
| Accrued and other current liabilities | |
| Changes in current and noncurrent commodity derivative assets and liabilities | |
| Other, including changes in noncurrent assets and liabilities | Other, including changes in noncurrent assets and liabilities | | (1) | | | (1) | | | (174) | |
| Net cash provided (used) by operating activities | Net cash provided (used) by operating activities | | 3,945 | | | 3,496 | | | 3,693 | |
| FINANCING ACTIVITIES: | FINANCING ACTIVITIES: | | | | | | |
| | Proceeds from (payments of) commercial paper – net | |
| Proceeds from (payments of) commercial paper – net | |
| Proceeds from (payments of) commercial paper – net | |
| Proceeds from long-term debt | Proceeds from long-term debt | | 2,155 | | | 3,899 | | | 767 | |
| Payments of long-term debt | Payments of long-term debt | | (894) | | | (3,841) | | | (909) | |
| Proceeds from issuance of common stock | Proceeds from issuance of common stock | | 9 | | | 9 | | | 10 | |
| Proceeds from sale of partial interest in consolidated subsidiary (Note 3) | | — | | | — | | | 1,334 | |
| Purchases of treasury stock | |
| Common dividends paid | Common dividends paid | | (1,992) | | | (1,941) | | | (1,842) | |
| Dividends and distributions paid to noncontrolling interests | Dividends and distributions paid to noncontrolling interests | | (187) | | | (185) | | | (124) | |
| Contributions from noncontrolling interests | Contributions from noncontrolling interests | | 9 | | | 7 | | | 36 | |
| | Payments for debt issuance costs | Payments for debt issuance costs | | (26) | | | (20) | | | — | |
| | Other – net | Other – net | | (16) | | | (13) | | | (17) | |
| Net cash provided (used) by financing activities | Net cash provided (used) by financing activities | | (942) | | | (2,085) | | | (745) | |
| INVESTING ACTIVITIES: | INVESTING ACTIVITIES: | | | | | | |
| Property, plant, and equipment: | Property, plant, and equipment: | |
| Property, plant, and equipment: | |
| Property, plant, and equipment: | |
| Capital expenditures (1) | Capital expenditures (1) | | (1,239) | | | (1,239) | | | (2,109) | |
| Dispositions – net | | (8) | | | (36) | | | (40) | |
| Contributions in aid of construction | | 52 | | | 37 | | | 52 | |
| Capital expenditures (1) | |
| Capital expenditures (1) | |
| Dispositions - net | |
| | Proceeds from sale of business (Note 3) | |
| Proceeds from sale of business (Note 3) | |
| Proceeds from sale of business (Note 3) | |
| Purchases of businesses, net of cash acquired (Note 3) | Purchases of businesses, net of cash acquired (Note 3) | | (151) | | | — | | | (728) | |
| Proceeds from dispositions of equity-method investments (Note 9) | | 1 | | | — | | | 485 | |
| Purchases of and contributions to equity-method investments (Note 9) | | (115) | | | (325) | | | (453) | |
| | Purchases of and contributions to equity-method investments (Note 8) | |
| Other – net | Other – net | | (5) | | | 5 | | | (34) | |
| Net cash provided (used) by investing activities | Net cash provided (used) by investing activities | | (1,465) | | | (1,558) | | | (2,827) | |
| Increase (decrease) in cash and cash equivalents | Increase (decrease) in cash and cash equivalents | | 1,538 | | | (147) | | | 121 | |
| Cash and cash equivalents at beginning of year | Cash and cash equivalents at beginning of year | | 142 | | | 289 | | | 168 | |
| Cash and cash equivalents at end of year | Cash and cash equivalents at end of year | | $ | 1,680 | | | $ | 142 | | | $ | 289 | |
| _________ | _________ | | | | | | |
| (1) Increases to property, plant, and equipment | (1) Increases to property, plant, and equipment | | $ | (1,305) | | | $ | (1,160) | | | $ | (2,023) | |
| (1) Increases to property, plant, and equipment | |
| (1) Increases to property, plant, and equipment | |
| Changes in related accounts payable and accrued liabilities | Changes in related accounts payable and accrued liabilities | | 66 | | | (79) | | | (86) | |
| Capital expenditures | Capital expenditures | | $ | (1,239) | | | $ | (1,239) | | | $ | (2,109) | |
See accompanying notes.
| | | | | | | | |
| The Williams Companies, Inc. |
| Notes to Consolidated Financial Statements |
|
Note 1 – General, Description of Business, Basis of Presentation, and Summary of Significant Accounting Policies
General
Unless the context clearly indicates otherwise, references in this report to “Williams,” “we,” “our,” “us,” or like terms refer to The Williams Companies, Inc. and its subsidiaries. Unless the context clearly indicates otherwise, references to “Williams,” “we,” “our,” and “us” include the operations in which we own interests accounted for as equity-method investments that are not consolidated in our financial statements. When we refer to our equity investees by name, we are referring exclusively to their businesses and operations.
Description of Business
We are a Delaware corporation whose common stock is listed and traded on the New York Stock Exchange. Our operations are located in the United States and are presented within the following reportable segments: Transmission & Gulf of Mexico, Northeast G&P, West, and Sequent,Gas & NGL Marketing Services, consistent with the manner in which our chief operating decision maker evaluates performance and allocates resources. All remaining business activities, including our upstream operations as well asand corporate activities, are included in Other.
Transmission & Gulf of Mexico is comprised of our interstate natural gas pipelines, Transcontinental Gas Pipe Line Company, LLC (Transco) and, Northwest Pipeline LLC (Northwest Pipeline), and MountainWest Pipelines Holding Company (MountainWest) (see Note 3 – Acquisitions and Divestitures), and their related natural gas storage facilities, as well as natural gas gathering and processing and crude oil production handling and transportation assets in the Gulf Coast region, including a 51 percent interest in Gulfstar One LLC (Gulfstar One) (a consolidated variable interest entity, or VIE), which is a proprietary floating production system, a 50 percent equity-method investment in Gulfstream Natural Gas System, L.L.C. (Gulfstream), and a 60 percent equity-method investment in Discovery Producer Services LLC (Discovery). Transmission & Gulf of Mexico also includes natural gas storage facilities and pipelines providing services in north Texas.
Northeast G&P is comprised of our midstream gathering, processing, and fractionation businesses in the Marcellus Shale region primarily in Pennsylvania and New York, and the Utica Shale region of eastern Ohio, as well as a 65 percent interest in Ohio Valley Midstream LLC (Northeast JV) (a consolidated VIE) which operates in West Virginia, Ohio, and Pennsylvania, a 66 percent interest in Cardinal Gas Services, L.L.C. (Cardinal) (a consolidated VIE) which operates in Ohio, a 69 percent equity-method investment in Laurel Mountain Midstream, LLC (Laurel Mountain), a 50 percent equity-method investment in Blue Racer Midstream LLC (Blue Racer) (we previously effectively owned a 29 percent indirect interest in Blue Racer through our 58 percent equity-method investment in Blue Racer Midstream Holdings, LLC (BRMH) (previously named Caiman Energy II, LLC) until acquiring a controlling interest of BRMH in November 2020 and the remaining interest in September 2021) (see Note 9 – Investing Activities), and Appalachia Midstream Services, LLC, a wholly owned subsidiary that owns equity-method investments with an approximate average 66 percent interest in multiple gas gathering systems in the Marcellus Shale region (Appalachia Midstream Investments).
West is comprised of our gas gathering, processing, and treating operations in the Rocky Mountain region of Colorado and Wyoming, the Barnett Shale region of north-central Texas, the Eagle Ford Shale region of south Texas, the Haynesville Shale region of east Texas and northwest Louisiana, and the Mid-Continent region which includes the Anadarko and Permian basins.basins, and the Denver-Julesberg Basin (DJ Basin) of Colorado which includes Rocky Mountain Midstream Holdings LLC (RMM), a former 50 percent equity-method investment in which we acquired the remaining ownership interest in November 2023 (see Note 3 – Acquisitions and Divestitures). This segment also includes our natural gas liquid (NGL) and natural gas marketing business (excluding the activities within the Sequent segment described below),NGL storage facilities, an undivided 50 percent interest in an NGL fractionator near Conway, Kansas, a 50 percent equity-method investment in Overland Pass Pipeline Company LLC (OPPL), a 50 percent equity-method investment in Rocky Mountain Midstream Holdings LLC (RMM), a 20 percent equity-method investment in Targa Train 7 LLC (Targa Train 7) (a nonconsolidated VIE), and a 15 percent interestequity-method investment in Brazos Permian II, LLC (Brazos Permian II) (a nonconsolidated VIE).
Sequent includes 100 percent of the operations of Sequent Energy Management, L.P. and Sequent Energy Canada, Corp. acquired on July 1, 2021 (Sequent Acquisition). Sequent focuses on risk management and the marketing, trading, storage, and transportation of natural gas for a diverse set of natural gas utilities, municipalities,
| | | | | | | | |
| The Williams Companies, Inc. |
| Notes to Consolidated Financial Statements – (Continued) |
|
power generators,Gas & NGL Marketing Services is comprised of our natural gas liquid (NGL) and producers,natural gas marketing and movestrading operations, which includes risk management and transactions related to the storage and transportation of natural gas to markets through transportation and storage agreementsNGLs on strategically positioned assets, including our Transco system. (See Note 3 – Acquisitions.)assets.
Basis of Presentation
Discontinued operations
Unless indicated otherwise, the information in the Notes to Consolidated Financial Statements relates to our continuing operations.
Significant risks and uncertainties
We believe that the carrying value of certain of our property, plant, and equipment and intangible assets, notably certain acquired assets accounted for as business combinations between 2012 and 2014, may be in excess of current fair value. However, the carrying value of these assets, in our judgment, continues to be recoverable. It is reasonably possible that future strategic decisions, including transactions such as monetizing assets or contributing assets to new ventures with third parties, as well as unfavorable changes in expected producer activities, could impact our assumptions and ultimately result in impairments of these assets. Such transactions or developments may also indicate that certain of our equity-method investments have experienced other-than-temporary declines in value, which could result in impairment.
Summary of Significant Accounting Policies
Principles of consolidation
The consolidated financial statements include the accounts of all entities that we control and our proportionate interest in the accounts of certain ventures in which we own an undivided interest. Our judgment is required to evaluate whether we control an entity. Key areas of that evaluation include:
•Determining whether an entity is a VIE;
•Determining whether we are the primary beneficiary of a VIE, including evaluating which activities of the VIE most significantly impact its economic performance and the degree of power that we and our related parties have over those activities through our variable interests;
•Identifying events that require reconsideration of whether an entity is a VIE and continuously evaluating whether we are a VIE’s primary beneficiary;
•Evaluating whether other owners in entities that are not VIEs are able to effectively participate in significant decisions that would be expected to be made in the ordinary course of business such that we do not have the power to control such entities.
We apply the equity method of accounting to investments over which we exercise significant influence but do not control. Distributions received from equity-method investees are presented in our Consolidated Statement of Cash Flows according to the nature of the distributions approach, which classifies distributions received from equity-method investees as either returns on investment (cash inflows from operating activities) or returns of investment (cash inflows from investing activities) based on the nature of the activities of the equity-method investee that generated the distribution.
Equity-method investment basis differences
Differences between the cost of our equity-method investments and our underlying equity in the net assets of investees are accounted for as if the investees were consolidated subsidiaries. Equity earnings (losses) in our
| | | | | | | | |
The Williams Companies, Inc. |
Notes to Consolidated Financial Statements – (Continued) |
|
Consolidated Statement of Income includes our allocable share of net income (loss) of investees adjusted for any depreciation and amortization, as applicable, associated with basis differences.
Use of estimates
The preparation of financial statements in conformity with accounting principles generally accepted in the United States requires management to make estimates and assumptions that affect the amounts reported in the consolidated financial statements and accompanying notes. Actual results could differ from those estimates.
Significant estimates and assumptions include:
•Impairment assessments of investments, property, plant, and equipment, and intangible assets;
•Litigation-related contingencies;
•Environmental remediation obligations;
•Depreciation and/or amortization of long-lived assets, which are comprised of property, plant, and equipment, and intangible assets;
| | | | | | | | |
| The Williams Companies, Inc. |
| Notes to Consolidated Financial Statements – (Continued) |
|
•Depreciation and/or amortization of equity-method investment basis differences;
•Asset retirement obligations (AROs);
•Measurement of fair value of commodity derivatives;
•Pension and postretirement valuation variables;
•Measurement of regulatory liabilities;
•Measurement of deferred income tax assets and liabilities, including assumptions related to the realization of deferred income tax assets;
•Revenue recognition, including estimates utilized in recognition of deferred revenue;
•Purchase price accounting.
These estimates are discussed further throughout these notes.
Regulatory accounting
Transco, and Northwest Pipeline, and MountainWest are regulated by the Federal Energy Regulatory Commission (FERC), and their rates are established by the FERC. Therefore, we have determined that it is appropriate under Accounting Standards Codification (ASC) Topic 980, “Regulated Operations,” (ASC 980) that certain costs that would otherwise be charged to expense should be deferred as regulatory assets, based on the expected recovery from customers in future rates. Likewise, certain actual or anticipated credits that would otherwise reduce expense should be deferred as regulatory liabilities, based on the expected return to customers in future rates. Management’s expected recovery of deferred costs and return of deferred credits generally results from specific decisions by regulators granting such ratemaking treatment. We record certain incurred costs and obligations as regulatory assets or liabilities if, based on regulatory orders or other available evidence, it is probable that the costs or obligations will be included in amounts allowable for recovery or refunded in future rates. Accounting for these operations that are regulated can differ from the accounting requirements for nonregulated operations. For example, for regulated operations, allowance for funds used during construction (AFUDC) represents the estimated cost of debt and equity funds applicable to utility plant in the process of construction and is capitalized as a cost of property, plant, and equipment because it constitutes an actual cost of construction under established regulatory practices; nonregulated operations are only allowed to capitalize the cost of debt funds related to construction activities, while a component for equity is prohibited. The components of our regulatory assets and liabilities relate toinclude the effects of deferred taxes on equity funds used during
| | | | | | | | |
The Williams Companies, Inc. |
Notes to Consolidated Financial Statements – (Continued) |
|
construction, AROs, shipper imbalance activity, fuel and power cost differentials, depreciation, negative salvage, pension and other postretirement benefits, trackers, customer tax refunds, and rate allowances for deferred income taxes at a historically higher federal income tax rate.
Our current and noncurrent regulatory asset and liability balances for the years ended December 31, 2021 and 2020 are as follows:
| | | | | | | | | | | |
| December 31, |
| 2021 | | 2020 |
| (Millions) |
Current assets reported within Other current assets and deferred charges | $ | 111 | | | $ | 64 | |
Noncurrent assets reported within Regulatory assets, deferred charges, and other | 415 | | | 442 | |
| Total regulated assets | $ | 526 | | | $ | 506 | |
| | | |
Current liabilities reported within Accrued liabilities | $ | 56 | | | $ | 59 | |
Noncurrent liabilities reported within Regulatory liabilities, deferred income, and other | 1,324 | | | 1,314 | |
| Total regulated liabilities | $ | 1,380 | | | $ | 1,373 | |
Cash and cash equivalents
Cash and cash equivalents in our Consolidated Balance Sheet consist of highly liquid investments with original maturities of three months or less when acquired.
Accounts receivable
Accounts receivable are carried on a gross basis, with no discounting, less an allowance for doubtful accounts. We estimate the allowance for doubtful accounts, considering current expected credit losses using a forward-looking “expected loss” model, the financial condition of our customers, and the age of past due accounts. The majority of our trade receivable balances are due within 30 days. We monitor the credit quality of our counterparties through review of collection trends, credit ratings, and other analyses, such as bankruptcy monitoring. Financial assets from our natural gas transmission business, gathering and transportation business, marketing business, and upstream operations are segregated into separate pools for evaluation due to different counterparty risks inherent in each business. Changes in counterparty risk factors could lead to reassessment of the composition of our financial assets as separate pools or the need for additional pools. We calculate our allowance for credit losses incorporating an aging method. In estimating our expected credit losses, we utilize historical loss rates over many years, which include periods of both high and low commodity prices. Commodity prices could have a significant impact on a portion of our gathering and processing and upstream counterparties’ financial health and ability to satisfy current obligations. Our expected credit loss estimate considers both internal and external forward-looking commodity price expectations, as well as counterparty credit ratings, and factors impacting their near-term liquidity. In addition, our expected credit loss estimate considers potential contractual, physical, and commercial protections and outcomes in the case of a counterparty bankruptcy. The physical location and nature of our services help to mitigate collectability concerns of our gathering and processing producer customers. Our gathering lines in many cases are physically connected to the customers’ wellheads and pads, and there may not be alternative gathering lines nearby. The construction of gathering systems is capital intensive and it would be costly for others to replicate, especially considering the depletion to date of the associated reserves. As a result, we play a critical role in getting customers’ production from the wellhead to a marketable condition and location. This tends to reduce collectability risk as our services enable producers to generate operating cash flows. Commodity price movements generally do not impact the majority of our natural gas transmission businesses customers’ financial condition.
We also provide marketing and risk management services to retail and wholesale gas marketers, utility companies, upstream producers, and industrial customers. These counterparties utilize netting agreements that enable us to net receivables and payables by counterparty upon settlement. We also net across product lines and against cash collateral received to collateralize receivable positions, provided the netting and cash collateral
| | | | | | | | |
| The Williams Companies, Inc. |
| Notes to Consolidated Financial Statements – (Continued) |
|
agreements include such provisions. While the amounts due from, or owed to, our counterparties are settled net, they are recorded on a gross basis in our Consolidated Balance Sheet as accounts receivableOur current and accounts payable.
We do not offer extended payment termsnoncurrent regulatory asset and typically receive payment within one month. We consider receivables past due if full payment is not received by the contractual due date. Interest income related to past due accounts receivable is generally recognized at the time full payment is received or collectability is assured. Past due accounts are generally written off against the allowance for doubtful accounts only after all collection attempts have been exhausted. We do not have a material amount of significantly aged receivablesliability balances at December 31, 20212023 and 2020.
Inventories
Inventories in our Consolidated Balance Sheet primarily consist of natural gas in underground storage, NGLs, and materials and supplies and primarily2022 are stated at the lower of cost or net realizable value. The cost of inventories is primarily determined using the average-cost method.
Property, plant, and equipment
Property, plant, and equipment is initially recorded at cost. We base the carrying value of these assets on estimates, assumptions, and judgments relative to capitalized costs, useful lives, and salvage values.
As regulated entities, Northwest Pipeline and Transco provide for depreciation using the straight-line method at FERC-prescribed rates. Depreciation for nonregulated entities is provided primarily on the straight-line method over estimated useful lives, except for certain offshore facilities that apply an accelerated depreciation method.
We follow the successful efforts method of accounting for our undivided interest in upstream properties. Our oil and gas producing property costs are depreciated using a units of production method.
Gains or losses from the ordinary sale or retirement of property, plant, and equipment for regulated pipelines are credited or charged to accumulated depreciation. Gains or losses from the ordinary sale or retirement of property, plant, and equipment for nonregulated assets are primarily recorded in Other (income) expense – net included in Operating income (loss) in our Consolidated Statement of Income.
Ordinary maintenance and repair costs are generally expensed as incurred. Costs of major renewals and replacements are capitalized as property, plant, and equipment.
We record a liability and increase the basis in the underlying asset for the present value of each expected future ARO at the time the liability is initially incurred, typically when the asset is acquired or constructed. For our upstream properties, the ARO is recorded based on our working interest in the underlying properties. As regulated entities, Northwest Pipeline and Transco offset the depreciation of the underlying asset that is attributable to capitalized ARO cost to a regulatory asset as we expect to recover these amounts in future rates. We measure changes in the liability due to passage of time by applying an interest rate to the liability balance. This amount is recognized as an increase in the carrying amount of the liability and as a corresponding accretion expense included in Operating and maintenance expenses in our Consolidated Statement of Income, except for regulated entities, for which the increase in the liability results in a corresponding increase to a regulatory asset. The regulatory asset is amortized commensurate with our collection of those costs in rates.
Measurements of AROs include, as a component of future expected costs, an estimate of the price that a third party would demand, and could expect to receive, for bearing the uncertainties inherent in the obligations, sometimes referred to as a market-risk premium.
| | | | | | | | |
The Williams Companies, Inc. |
Notes to Consolidated Financial Statements – (Continued) |
|
Intangible assets
Our intangible assets included within Intangible assets – net of accumulated amortization in our Consolidated Balance Sheet are primarily related to gas gathering, processing, and fractionation customer relationships. Our intangible assets are generally amortized on a straight-line basis over the period in which these assets contribute to our cash flows. We evaluate these assets for changes in the expected remaining useful lives and would reflect any changes prospectively through amortization over the revised remaining useful life.
Impairment of property, plant, and equipment, intangible assets, and investments
We evaluate our property, plant, and equipment and intangible assets for impairment when, in our judgment, events or circumstances, including probable abandonment, indicate that the carrying value of such assets may not be recoverable. When an indicator of impairment has occurred, we compare our estimate of undiscounted future cash flows attributable to the assets to the carrying value of the assets to determine whether an impairment has occurred and we may apply a probability-weighted approach to consider the likelihood of different cash flow assumptions and possible outcomes, including selling the assets in the near term or holding them for their remaining estimated useful life. If an impairment of the carrying value has occurred, we determine the amount of the impairment to be recognized in our consolidated financial statements by estimating the fair value of the assets and recording a loss for the amount that the carrying value exceeds the estimated fair value. This evaluation is performed at the lowest level for which separately identifiable cash flows exist.
For assets identified to be disposed of in the future and considered held for sale, we compare the carrying value to the estimated fair value less the cost to sell to determine if recognition of an impairment is required. Until the assets are disposed of, the estimated fair value, which includes estimated cash flows from operations until the assumed date of sale, is recalculated when related events or circumstances change.
We evaluate our investments for impairment when, in our judgment, events or circumstances indicate that the carrying value of such investments may have experienced an other-than-temporary decline in value. When evidence of loss in value has occurred, we compare our estimate of fair value of the investment to the carrying value of the investment to determine whether an impairment has occurred. If the estimated fair value is less than the carrying value and we consider the decline in value to be other-than-temporary, the excess of the carrying value over the fair value is recognized in our consolidated financial statements as an impairment charge.
Judgment and assumptions are inherent in our estimate of undiscounted future cash flows and an asset’s or investment’s fair value. Additionally, judgment is used to determine the probability of sale with respect to assets considered for disposal.
Contingent liabilities
We record liabilities for estimated loss contingencies, including environmental matters, when we assess that a loss is probable, and the amount of the loss can be reasonably estimated. These liabilities are calculated based upon our assumptions and estimates with respect to the likelihood or amount of loss and upon advice of legal counsel, engineers, or other third parties regarding the probable outcomes of the matters. These calculations are made without consideration of any potential recovery from third parties. We recognize insurance recoveries or reimbursements from others when realizable. Revisions to these liabilities are generally reflected in income when new or different facts or information become known or circumstances change that affect the previous assumptions or estimates.
Cash flows from revolving credit facility and commercial paper program
Proceeds and payments related to borrowings under our revolving credit facility are reflected in the financing activities in our Consolidated Statement of Cash Flows on a gross basis. Proceeds and payments related to borrowings under our commercial paper program are reflected in the financing activities in our Consolidated Statement of Cash Flows on a net basis, as the outstanding notes generally have maturity dates less than three months from the date of issuance. (See Note 13 – Debt and Banking Arrangements.)
| | | | | | | | |
The Williams Companies, Inc. |
Notes to Consolidated Financial Statements – (Continued) |
|
Treasury stock
Treasury stock purchases are accounted for under the cost method whereby the entire cost of the acquired stock is recorded as Treasury stock, at cost in our Consolidated Balance Sheet. Gains and losses on the subsequent reissuance of shares are credited or charged to Capital in excess of par value in our Consolidated Balance Sheet using the average-cost method.
Derivative instruments and hedging activities
We are exposed to commodity price risk. We utilize derivatives to manage a portion of our commodity price risk. These instruments consist primarily of swaps, futures, and forward contracts involving short- and long-term purchases and sales of energy commodities. We purchase natural gas for storage when the current market price paid to buy and transport natural gas plus the cost to store and finance the natural gas is less than an estimated, forward market price that can be received in the future. Additionally, we enter into transactions to secure transportation capacity between delivery points in order to serve our customers and various markets. Commodity-based exchange-traded futures contracts and over-the-counter (OTC) contracts are used to capture the price differential or spread between the locations served by the capacity in order to substantially protect the natural gas revenues that will ultimately be realized when the physical flow of natural gas between receipt and delivery points occurs. Some commodity-related derivative contracts require physical delivery as opposed to financial settlement, and this type of derivative is both common and prevalent within the natural gas marketing operations. These contracts generally meet the definition of derivatives and are typically not designated as hedges for accounting purposes. When a commodity-related derivative contract is settled physically, any cumulative unrealized gain or loss is reversed, and the contract price is recognized in the respective line item in our Consolidated Statement of Income representing the actual price of the underlying goods being delivered. Unrealized gains and losses on physically settled commodity-related derivative contracts are recognized in Net gain (loss) on commodity derivatives in our Consolidated Statement of Income.
Realized and unrealized gains and losses on non-designated commodity-related derivative contracts that are financially settled are reported in Net gain (loss) on commodity derivatives in our Consolidated Statement of Income.
We experience significant earnings volatility from the fair value accounting required for the derivatives used to hedge a portion of the economic value of the underlying transportation and storage portfolio. However, the unrealized fair value measurement gains and losses are generally offset by valuation changes in the economic value of the underlying transportation and storage portfolio, which is not recognized until the underlying transportation and storage transaction occurs. (See Note 18 – Derivatives.)
We report the fair value of derivatives, except those for which the normal purchases and normal sales exception has been elected, in Other current assets and deferred charges; Regulatory assets, deferred charges, and other;Accrued liabilities; or Regulatory liabilities, deferred income, and other in our Consolidated Balance Sheet. These amounts are presented on a net basis and reflect the netting of asset and liability positions permitted under the terms of master netting arrangements and cash held on deposit in margin accounts that we have received or remitted to collateralize certain derivative positions. We determine the current and noncurrent classification based on the timing of expected future cash flows of individual trades.
The accounting for the changes in fair value of a commodity derivative can be summarized as follows:
| | | | | | | | |
Derivative Treatment | | Accounting Method |
Normal purchases and normal sales exception | | Accrual accounting |
Designated in a qualifying hedging relationship | | Hedge accounting |
All other derivatives | | Mark-to-market accounting |
| | | | | | | | | | | |
| December 31, |
| 2023 | | 2022 |
| (Millions) |
Current assets reported within Other current assets and deferred charges | $ | 95 | | | $ | 138 | |
Noncurrent assets reported within Regulatory assets, deferred charges, and other | 527 | | | 459 | |
| Total regulated assets | $ | 622 | | | $ | 597 | |
| | | |
Current liabilities reported within Accrued and other current liabilities | $ | 77 | | | $ | 201 | |
Noncurrent liabilities reported within Regulatory liabilities, deferred income, and other | 1,288 | | | 1,233 | |
| Total regulated liabilities | $ | 1,365 | | | $ | 1,434 | |
| | | | | | | | |
The Williams Companies, Inc. |
Notes to Consolidated Financial Statements – (Continued) |
|
We may elect the normal purchases and normal sales exception for certain short- and long-term purchases and sales of physical energy commodities. Under accrual accounting, any change in the fair value of these derivatives is not reflected in our Consolidated Balance Sheet after the initial election of the exception.
We may also designate a hedging relationship for certain commodity derivatives. For a derivative to qualify for designation in a hedging relationship, it must meet specific criteria and we must maintain appropriate documentation. We establish hedging relationships pursuant to our risk management policies. We evaluate the hedging relationships at the inception of the hedge and on an ongoing basis to determine whether the hedging relationship is, and is expected to remain, highly effective in achieving offsetting changes in fair value or cash flows attributable to the underlying risk being hedged. We also regularly assess whether the hedged forecasted transaction is probable of occurring. If a derivative ceases to be or is no longer expected to be highly effective, or if we believe the likelihood of occurrence of the hedged forecasted transaction is no longer probable, hedge accounting is discontinued prospectively, and future changes in the fair value of the derivative are recognized currently in Net gain (loss) on commodity derivativesin our Consolidated Statement of Income.
For commodity derivatives designated as a cash flow hedge, the change in fair value of the derivative is reported in Accumulated other comprehensive income (loss) (AOCI) in our Consolidated Balance Sheet and reclassified into earnings in the period in which the hedged item affects earnings. Gains or losses deferred in AOCI associated with terminated derivatives, derivatives that cease to be highly effective hedges, derivatives for which the forecasted transaction is reasonably possible but no longer probable of occurring, and cash flow hedges that have been otherwise discontinued remain in AOCI until the hedged item affects earnings. If it becomes probable that the forecasted transaction designated as the hedged item in a cash flow hedge will not occur, any gain or loss deferred in AOCI is recognized in Net gain (loss) on commodity derivatives in our Consolidated Statement of Income at that time. The change in likelihood of a forecasted transaction is a judgmental decision that includes qualitative assessments made by us. As of December 31, 2021, we are not applying hedge accounting to any commodity derivative instruments.
Revenue recognition
Customers in our gas pipeline businesses are comprised of public utilities, municipalities, gas marketers and producers, intrastate pipelines, direct industrial users, and electrical power generators. Customers in our midstream businesses are comprised of oil and natural gas producer counterparties. Customers for our product sales are comprised of public utilities, gas marketers, and direct industrial users.
Service revenue contracts from our gas pipeline and midstream businesses contain a series of distinct services, with the majority of our contracts having a single performance obligation that is satisfied over time as the customer simultaneously receives and consumes the benefits provided by our performance. Most of our product sales contracts have a single performance obligation with revenue recognized at a point in time when the products have been sold and delivered to the customer.
Certain customers reimburse us for costs we incur associated with construction of property, plant, and equipment utilized in our operations. For our rate-regulated gas pipeline businesses that apply ASC 980, we follow FERC guidelines with respect to reimbursement of construction costs. FERC tariffs only allow for cost reimbursement and are non-negotiable in nature; thus, in our judgment, the construction activities do not represent an ongoing major and central operation of our gas pipeline businesses and are not within the scope of ASC Topic 606, “Revenue from Contracts with Customers”. Accordingly, cost reimbursements are treated as a reduction to the cost of the constructed asset. For our midstream businesses, reimbursement and service contracts with customers are viewed together as providing the same commercial objective, as we have the ability to negotiate the mix of consideration between reimbursements and amounts billed over time. Accordingly, we generally recognize reimbursements of construction costs from customers on a gross basis as a contract liability separate from the associated costs included within property, plant, and equipment. The contract liability is recognized into service revenues as the underlying performance obligations are satisfied.
| | | | | | | | |
The Williams Companies, Inc. |
Notes to Consolidated Financial Statements – (Continued) |
|
Service Revenues
Gas pipeline businesses: Revenues from our regulated interstate natural gas pipeline businesses, which are subject to regulation by certain state and federal authorities, including the FERC, include both firm and interruptible transportation and storage contracts. Firm transportation and storage agreements provide for a fixeddaily or monthly reservation charge based on the pipeline or storage capacity reserved, and a commodity charge based on the volume of natural gas delivered/stored, each at rates specified in our FERC tariffs or based on negotiated contractual rates, with contract terms that are generally long-term in nature. Most of our long-term contracts contain an evergreen provision, which allows the contracts to be extended for periods primarily up to one year in length an indefinite number of times following the specified contract term and until terminated generally by either us or the customer. Interruptible transportation and storage agreements provide for a volumetric charge based on actual commodity transportation or storage utilized in the period in which those
| | | | | | | | |
| The Williams Companies, Inc. |
| Notes to Consolidated Financial Statements – (Continued) |
|
services are provided, and the contracts are generally limited to one-month periods or less. Our performance obligations related to our interstate natural gas pipeline businesses include the following:
•Firm transportation or storage under firm transportation and storage contracts—an integrated package of services typically constituting a single performance obligation, which includes standing ready to provide such services and receiving, transporting or storing (as applicable), and redelivering commodities;
•Interruptible transportation or storage under interruptible transportation and storage contracts—an integrated package of services typically constituting a single performance obligation once scheduled, which includes receiving, transporting or storing (as applicable), and redelivering commodities.
In situations where, in our judgment, we consider the integrated package of services as a single performance obligation, which represents a majority of our interstate natural gas pipeline contracts with customers, we do not consider there to be multiple performance obligations because the nature of the overall promise in the contract is to stand ready (with regard to firm transportation and storage contracts), receive, transport or store, and redeliver natural gas to the customer; therefore, revenue is recognized over time upon satisfaction of our daily stand ready performance obligation.
We recognize revenues for reservation charges over the performance obligation period, which is the contract term, regardless of the volume of natural gas that is transported or stored. Revenues for commodity charges from both firm and interruptible transportation services and storage services are recognized when natural gas is delivered at the agreed upon delivery point or when natural gas is injected or withdrawn from the storage facility because they specifically relate to our efforts to provide these distinct services. Generally, reservation charges and commodity charges in our interstate natural gas pipeline businesses are recognized as revenue in the same period they are invoiced to our customers. As a result of the ratemaking process, certain amounts collected by us may be subject to refund upon the issuance of final orders by the FERC in pending rate proceedings. We use judgment to record estimates of rate refund liabilities considering our and other third-party regulatory proceedings, advice of counsel, and other risks.
Midstream businesses: Revenues from our non-regulatednonregulated gathering, processing, transportation, and storage midstream businesses include contracts for natural gas gathering, processing, treating, compression, transportation, and other related services with contract terms that are generally long-term in nature and may extend up to the production life of the associated reservoir. Additionally, our midstream businesses generate revenues from fees charged for storing customers’ natural gas and NGLs, generally under prepaid contracted storage capacity contracts. In situations where, in our judgment, we provide an integrated package of services combined into a single performance obligation, which represents a majority of this class of contracts with customers, we do not consider there to be multiple performance obligations because the nature of the overall promise in the contract is to provide gathering, processing, transportation, storage, and related services resulting in the delivery, or redelivery in the context of storage services, of pipeline-quality natural gas and NGLs to the customer. As such, revenue is recognized at the daily completion of the integrated package of services as the integrated package represents a single performance obligation. Additionally, certain contracts in our midstream
| | | | | | | | |
The Williams Companies, Inc. |
Notes to Consolidated Financial Statements – (Continued) |
|
businesses contain fixed or upfront payment terms that result in the deferral of revenues until such services have been performed or such capacity has been made available.
We also earn revenues from offshore crude oil and natural gas gathering and transportation and offshore production handling. These services represent an integrated package of services and are considered a single distinct performance obligation for which we recognize revenues as the services are provided to the customer.
We generally earn a contractually stated fee per unit for the volume of product transported, gathered, processed, or stored. The rate is generally fixed; however, certain contracts contain variable rates that are subject to change based on commodity prices, levels of throughput, or an annual adjustment based on a formulaic cost of service calculation. In addition, we have contracts with contractually stated fees that decline over the contract term, such as declines based on the passage of time periods or achievement of cumulative
| | | | | | | | |
| The Williams Companies, Inc. |
| Notes to Consolidated Financial Statements – (Continued) |
|
throughput amounts. For all of our contracts, we allocate the transaction price to each performance obligation based on the judgmentally determined relative standalone selling price. The excess of consideration received over revenue recognized results in the deferral of those amounts until future periods based on a units of production or straight-line methodology as these methods appropriately match the consumption of services provided to the customer. The units of production methodology requires the use of production estimates that are uncertain and the use of judgment when developing estimates of future production volumes, thus impacting the rate of revenue recognition. Production estimates are monitored as circumstances and events warrant. Certain of our gas gathering and processing agreements have minimum volume commitments (MVC). If a customer under such an agreement fails to meet its MVC for a specified period (thus not exercising all the contractual rights to gathering and processing services within the specified period, herein referred to as “breakage”), it is obligated to pay a contractually determined fee based upon the shortfall between the actual gathered or processed volumes and the MVC for the period contained in the contract. When we conclude, based on management’s judgment, it is probable that the customer will not exercise all or a portion of its remaining rights, we recognize revenue associated with such breakage amount in proportion to the pattern of exercised rights within the respective MVC period.
Under keep-whole and percent-of-liquids processing contracts, we receive commodity consideration in the form of NGLs and take title to the NGLs at the tailgate of the plant. We recognize such commodity consideration as service revenue based on the market value of the NGLs retained at the time the processing is provided. The current market value, as opposed to the market value at the contract inception date, is used due to a combination of factors, including the fact that the volume, mix, and market price of NGL consideration to be received is unknown at the time of contract execution and is not specified in our contracts with customers. Additionally, product sales revenue (discussed below) is recognized upon the sale of the NGLs to a third party based on the sales price at the time of sale. As a result, revenue is recognized in our Consolidated Statement of Income both at the time the processing service is provided in Service revenues – commodity consideration and at the time the NGLs retained as part of the processing service are sold in Product sales. The recognition of revenue related to commodity consideration has the impact of increasing the book value of NGL inventory, resulting in higher cost of goods sold at the time of sale. Given that most inventory is sold in the same period that it is generated, the impact of these transactions is expected to have little impact to operating income.
Product Sales
In the course of providing transportation services to customers of our gas pipeline businesses and gathering and processing services to customers of our midstream businesses, we may receive different quantities of natural gas from customers than the quantities delivered on behalf of those customers. The resulting imbalances are primarily settled through the purchase or sale of natural gas with each customer under terms provided for in our FERC tariffs or gathering and processing agreements, respectively. Revenue is recognized from the sale of natural gas upon settlement of imbalances.
In certain instances, we purchase NGLs, crude oil, and natural gas from our oil and natural gas producer customers which we remarket. In addition, we retain NGLs as consideration in certain processing arrangements,
| | | | | | | | |
The Williams Companies, Inc. |
Notes to Consolidated Financial Statements – (Continued) |
|
as discussed above in the Service Revenues - Midstream businesses section. We also market natural gas and NGLs from the production at our upstream properties. We recognize revenue from the sale of these commodities when the products have been sold and delivered. Our product sales contracts are primarily short-term contracts based on prevailing market rates at the time of the transaction.
We purchase natural gas for storage when the current market price paid to buy and transport natural gas plus the cost to store and finance the natural gas is less than an estimated, forward market price that can be received in the future, resulting in positive net product sales. Commodity-based exchange-traded futures contracts and OTCover-the-counter (OTC) contracts are used to sell natural gas at that future price to substantially protect the natural gas revenues that will ultimately be realized when the stored natural gas is sold. Additionally, we enter into transactions to secure transportation capacity between delivery points in order to serve our customers and various markets.
| | | | | | | | |
| The Williams Companies, Inc. |
| Notes to Consolidated Financial Statements – (Continued) |
|
The physical purchase, transportation, storage, and sale of natural gas are accounted for on a weighted-average cost or accrual basis, as appropriate, rather than onunlike the fair value basis utilized for the commodity derivatives used to mitigate the natural gas price risk associated with the storage and transportation portfolio. Monthly demand charges are incurred for the contracted storage and transportation capacity and payments associated with asset management agreements, and these demand charges and payments are recognized in our Consolidated Statement of Income in the period they are incurred.
As we are acting as an agent for our natural gas marketing customers and engage in energy trading activities, our natural gas marketing revenues are presented net of the related costs of those activities. Prior to the 2022 integration of our legacy gas marketing operations with the acquired Sequent Acquisition operations (see Note 3 – Acquisitions and Divestitures), our legacy gas marketing operations were reported on a gross basis.
Contract Assets
Our contract assets primarily consist of revenue recognized under contracts containing MVC features whereby management has concluded it is probable there will be a short-fall payment at the end of the current MVC period, which typically follows the calendar year, and that a significant reversal of revenue recognized currently for the future MVC payment will not occur. As a result, our contract assets related to our future MVC payments are generally expected to be collected within the next 12 months and are included within Other current assets and deferred charges in our Consolidated Balance Sheet until such time as the MVC short-fall payments are invoiced to the customer.
Contract Liabilities
Our contract liabilities consist of advance payments primarily from midstream business customers which include construction reimbursements, prepayments, and other billings and transactions for which future services are to be provided under the contract. These amounts are deferred until recognized in revenue when the associated performance obligation has been satisfied, which is primarily based on a units of production methodology over the remaining contractual service periods, and are classified as current or noncurrent according to when such amounts are expected to be recognized. Current and noncurrent contract liabilities are included within Accrued and other current liabilities and Regulatory liabilities, deferred income, and other, respectively, in our Consolidated Balance Sheet.
Contracts requiring advance payments and the recognition of contract liabilities are evaluated to determine whether the advance payments provide us with a significant financing benefit. This determination is based on the combined effect of the expected length of time between when we transfer the promised good or service to the customer, when the customer pays for those goods or services, and the prevailing interest rates. We have assessed our contracts for significant financing components and determined, in our judgment, that one group of contracts entered into in contemplation of one another for certain capital reimbursements contains a significant financing component. As a result, we recognize noncash interest expense based on the effective interest method and revenue (noncash) is recognized when the underlying asset is placed into service utilizing a units of production or straight-line methodology over the life of the corresponding customer contract.
Commodity derivative instruments and hedging activities
We are exposed to commodity price risk. We utilize derivatives to manage a portion of our commodity price risk. These instruments consist primarily of swaps, futures, and forward contracts involving short- and long-term purchases and sales of energy commodities. We purchase natural gas for storage when the current market price paid to buy and transport natural gas plus the cost to store and finance the natural gas is less than an estimated, forward market price that can be received in the future. Additionally, we enter into transactions to secure transportation capacity between delivery points in order to serve our customers and various markets. Commodity-based exchange-traded futures contracts and OTC contracts are used to capture the price differential or spread between the locations
| | | | | | | | |
| The Williams Companies, Inc. |
| Notes to Consolidated Financial Statements – (Continued) |
|
served by the capacity in order to substantially protect the natural gas revenues that will ultimately be realized when the physical flow of natural gas between receipt and delivery points occurs. Some commodity derivative contracts require physical delivery as opposed to financial settlement, and this type of derivative is both common and prevalent within the natural gas marketing operations. These contracts generally meet the definition of derivatives and are typically not designated as hedges for accounting purposes. When a commodity derivative contract is settled physically, any cumulative unrealized gain or loss is reversed, and the contract price is recognized in the respective line item in our Consolidated Statement of Income representing the actual price of the underlying goods being delivered.
Unrealized gains and losses from physically settled commodity derivative contracts for commodity sales transactions are recognized in Net gain (loss) from commodity derivatives in our Consolidated Statement of Income. Realized and unrealized gains and losses from non-designated commodity derivative contracts for commodity sales transactions that are financially settled are reported in Net gain (loss) from commodity derivativesin our Consolidated Statement of Income. Net gains and losses from derivatives for shrink gas purchases for processing plants are reported in Net processing commodity expenses in our Consolidated Statement of Income.
We experience significant earnings volatility from the fair value accounting required for the derivatives used to hedge a portion of the economic value of the underlying transportation and storage portfolio as well as upstream related production. However, the unrealized fair value measurement gains and losses are generally offset by valuation changes in the economic value of the underlying production or transportation and storage contracts, which is not recognized until the underlying transaction occurs. (See Note 16 – Commodity Derivatives.)
We report the fair value of derivatives, except those for which the normal purchases and normal sales exception has been elected, in Derivative assets; Regulatory assets, deferred charges, and other;Derivative liabilities; or Regulatory liabilities, deferred income, and other in our Consolidated Balance Sheet. These amounts are presented on a net basis and reflect the netting of asset and liability positions permitted under the terms of master netting arrangements and cash held on deposit in margin accounts that we have received or remitted to collateralize certain derivative positions. We determine the current and noncurrent classification based on the timing of expected future cash flows of individual trades.
The accounting for the changes in fair value of a commodity derivative can be summarized as follows:
| | | | | | | | |
| Derivative Treatment | | Accounting Method |
| Normal purchases and normal sales exception | | Accrual accounting |
| Designated in a qualifying hedging relationship | | Hedge accounting |
| All other derivatives | | Mark-to-market accounting |
We may elect the normal purchases and normal sales exception for certain short- and long-term purchases and sales of physical energy commodities. Under accrual accounting, any change in the fair value of these derivatives is not reflected in our Consolidated Balance Sheet after the initial election of the exception.
We may also designate a hedging relationship for certain commodity derivatives. For a derivative to qualify for designation in a hedging relationship, it must meet specific criteria and we must maintain appropriate documentation. We establish hedging relationships pursuant to our risk management policies. We evaluate the hedging relationships at the inception of the hedge and on an ongoing basis to determine whether the hedging relationship is, and is expected to remain, highly effective in achieving offsetting changes in fair value or cash flows attributable to the underlying risk being hedged. We also regularly assess whether the hedged forecasted transaction is probable of occurring. If a derivative ceases to be or is no longer expected to be highly effective, or if we believe the likelihood of occurrence of the hedged forecasted transaction is no longer probable, hedge accounting is discontinued prospectively, and future changes in the fair value of the derivative are recognized currently in Net gain (loss) from commodity derivatives in our Consolidated Statement of Income.
| | | | | | | | |
| The Williams Companies, Inc. |
| Notes to Consolidated Financial Statements – (Continued) |
|
For commodity derivatives designated as a cash flow hedge, the change in fair value of the derivative is reported in Accumulated other comprehensive income (loss) (AOCI) in our Consolidated Balance Sheet and reclassified into earnings in the period in which the hedged item affects earnings. Gains or losses deferred in AOCI associated with terminated derivatives, derivatives that cease to be highly effective hedges, derivatives for which the forecasted transaction is reasonably possible but no longer probable of occurring, and cash flow hedges that have been otherwise discontinued remain in AOCI until the hedged item affects earnings. If it becomes probable that the forecasted transaction designated as the hedged item in a cash flow hedge will not occur, any gain or loss deferred in AOCI is recognized in Net gain (loss) from commodity derivatives in our Consolidated Statement of Income at that time. The change in likelihood of a forecasted transaction is a judgmental decision that includes qualitative assessments made by us. As of December 31, 2023 and 2022, we are not applying hedge accounting to any commodity derivative instruments.
Interest capitalized
We capitalize interest during construction on major projects with construction periods of at least 3 months and a total project cost in excess of $1 million. Interest is capitalized on borrowed funds and, where regulation by the FERC exists, on internally generated funds (equity AFUDC). The former is included in Interest expense and the latter is included in Other income (expense) – net below Operating income (loss) in our Consolidated Statement of Income. The rates used by regulated companies are calculated in accordance with FERC rules. Rates used by nonregulated companies are based on our average interest rate on debt.
Income taxes
We include the operations of our domestic corporate subsidiaries and income from our subsidiary partnerships in our consolidated federal income tax return and also file tax returns in various foreign and state jurisdictions as required. Deferred income taxes are computed using the liability method and are provided on all temporary differences between the financial basis and the tax basis of our assets and liabilities. Our judgment and income tax assumptions are used to determine the levels, if any, of valuation allowances associated with deferred tax assets.
Earnings (loss) per common share
Basic earnings (loss) per common share in our Consolidated Statement of Income is based on the sum of the weighted-average number of common shares outstanding and vested restricted stock units. Diluted earnings (loss) per common share in our Consolidated Statement of Income primarily includes any dilutive effect of nonvested restricted stock units and stock options. Diluted earnings (loss) per common share may also include any dilutive effect of our preferred stock. Diluted earnings (loss) per common share is calculated using the treasury-stock method.
Cash and cash equivalents
Cash and cash equivalents in our Consolidated Balance Sheet consist of highly liquid investments with original maturities of three months or less when acquired.
Accounts receivable
Accounts receivable are carried on a gross basis, with no discounting, less an allowance for doubtful accounts. We estimate the allowance for doubtful accounts, considering current expected credit losses using a forward-looking “expected loss” model, the financial condition of our customers, and the age of past due accounts. The majority of our trade receivable balances are due within 30 days. We monitor the credit quality of our counterparties through review of collection trends, credit ratings, and other analyses, such as bankruptcy monitoring. Financial assets from our natural gas transmission business, natural gas storage business, gathering, processing and transportation business, marketing business, and upstream operations are segregated into separate pools for evaluation due to different counterparty risks inherent in each business. Changes in counterparty risk factors could lead to reassessment of the composition of our financial assets as separate pools or the need for additional pools. We
| | | | | | | | |
| The Williams Companies, Inc. |
| Notes to Consolidated Financial Statements – (Continued) |
|
calculate our allowance for credit losses incorporating an aging method. In estimating our expected credit losses, we utilize historical loss rates over many years, which include periods of both high and low commodity prices. Commodity prices could have a significant impact on a portion of our gathering and processing and upstream counterparties’ financial health and ability to satisfy current obligations. Our expected credit loss estimate considers both internal and external forward-looking commodity price expectations, as well as counterparty credit ratings, and factors impacting their near-term liquidity. In addition, our expected credit loss estimate considers potential contractual, physical, and commercial protections and outcomes in the case of a counterparty bankruptcy. The physical location and nature of our services help to mitigate collectability concerns of our gathering and processing producer customers. Our gathering lines in many cases are physically connected to the customers’ wellheads and pads, and there may not be alternative gathering lines nearby. The construction of gathering systems is capital intensive and it would be costly for others to replicate, especially considering the depletion to date of the associated reserves. As a result, we play a critical role in getting customers’ production from the wellhead to a marketable condition and location. This tends to reduce collectability risk as our services enable producers to generate operating cash flows. Commodity price movements generally do not impact the majority of our natural gas transmission businesses customers’ financial condition.
We also provide marketing and risk management services to retail and wholesale gas marketers, utility companies, upstream producers, and industrial customers. These counterparties utilize netting agreements that enable us to net receivables and payables by counterparty upon settlement. We also net across product lines and against cash collateral received to collateralize receivable positions, provided the netting and cash collateral agreements include such provisions. While the amounts due from, or owed to, our counterparties are settled net, they are recorded on a gross basis in our Consolidated Balance Sheet as accounts receivable and accounts payable.
We do not offer extended payment terms and typically receive payment within one month. We consider receivables past due if full payment is not received by the contractual due date. Interest income related to past due accounts receivable is generally recognized at the time full payment is received or collectability is assured. Past due accounts are generally written off against the allowance for doubtful accounts only after all collection attempts have been exhausted. We do not have a material amount of significantly aged receivables at December 31, 2023 and 2022.
Inventories
Inventories in our Consolidated Balance Sheet primarily consist of NGLs, materials and supplies, and natural gas in underground storage and primarily are stated at the lower of cost or net realizable value. The cost of inventories is primarily determined using the average-cost method. Any lower of cost or net realizable value adjustments are included in Product sales in our Consolidated Statement of Income (for natural gas marketing inventory as these sales are presented net of the related costs) or in Product costs in our Consolidated Statement of Income for NGL inventory.
Property, plant, and equipment
Property, plant, and equipment is initially recorded at cost. We base the carrying value of these assets on estimates, assumptions, and judgments relative to capitalized costs, useful lives, and salvage values.
As regulated entities, Transco, Northwest Pipeline, and MountainWest provide for depreciation using the straight-line method at FERC-prescribed rates. Depreciation for nonregulated entities is provided primarily on the straight-line method over estimated useful lives, except for certain offshore facilities that apply an accelerated depreciation method.
We follow the successful efforts method of accounting for our undivided interest in upstream properties. Our oil and gas producing property costs are depreciated using a units of production method.
Gains or losses from the ordinary sale or retirement of property, plant, and equipment for regulated pipelines are credited or charged to accumulated depreciation. Gains or losses from the ordinary sale or retirement of property,
| | | | | | | | |
| The Williams Companies, Inc. |
| Notes to Consolidated Financial Statements – (Continued) |
|
plant, and equipment for nonregulated assets are primarily recorded in Other (income) expense – net included in Operating income (loss) in our Consolidated Statement of Income.
Ordinary maintenance and repair costs are generally expensed as incurred. Costs of major renewals and replacements are capitalized as property, plant, and equipment.
We record a liability and increase the basis in the underlying asset for the present value of each expected future ARO at the time the liability is initially incurred, typically when the asset is acquired or constructed. For our upstream properties, the ARO is recorded based on our working interest in the underlying properties. As regulated entities, Transco, Northwest Pipeline, and MountainWest offset the depreciation of the underlying asset that is attributable to capitalized ARO cost to a regulatory asset as we expect to recover these amounts in future rates. We measure changes in the liability due to passage of time by applying an interest rate to the liability balance. This amount is recognized as an increase in the carrying amount of the liability and as a corresponding accretion expense included in Operating and maintenance expenses in our Consolidated Statement of Income, except for regulated entities, for which the increase in the liability results in a corresponding increase to a regulatory asset. The regulatory asset is amortized commensurate with our collection of those costs in rates.
Measurements of AROs include, as a component of future expected costs, an estimate of the price that a third party would demand, and could expect to receive, for bearing the uncertainties inherent in the obligations, sometimes referred to as a market-risk premium.
Goodwill
Goodwill included within Intangible assets – net of accumulated amortization in our Consolidated Balance Sheet, as of December 31, 2023, represents the excess of the consideration, plus the fair value of any noncontrolling interest or any previously held equity interest, over the fair value of the net assets acquired. It is not subject to amortization but is evaluated annually as of October 1 for impairment or more frequently if impairment indicators are present that would indicate it is more likely than not that the fair value of the reporting unit is less than its carrying amount. As part of the evaluation, we compare our estimate of the fair value of the reporting unit with its carrying value, including goodwill. If the carrying value of the reporting unit exceeds its fair value, an impairment charge is recorded for the difference (not to exceed the carrying value of goodwill). Judgments and assumptions are inherent in our management’s estimates of fair value.
Other identifiable intangible assets
Our other identifiable intangible assets included within Intangible assets – net of accumulated amortization in our Consolidated Balance Sheet are primarily related to gas gathering, processing, and fractionation customer relationships. Our other identifiable intangible assets are generally amortized on a straight-line basis over the period in which these assets contribute to our cash flows. We evaluate these assets for changes in the expected remaining useful lives and would reflect any changes prospectively through amortization over the revised remaining useful life.
Impairment of property, plant, and equipment, intangible assets, and investments
We evaluate our property, plant, and equipment and intangible assets for impairment when, in our judgment, events or circumstances, including probable abandonment, indicate that the carrying value of such assets may not be recoverable. When an indicator of impairment has occurred, we compare our estimate of undiscounted future cash flows attributable to the assets to the carrying value of the assets to determine whether an impairment has occurred and we may apply a probability-weighted approach to consider the likelihood of different cash flow assumptions and possible outcomes, including selling the assets in the near term or holding them for their remaining estimated useful life. If an impairment of the carrying value has occurred, we determine the amount of the impairment to be recognized in our consolidated financial statements by estimating the fair value of the assets and recording a loss for the amount that the carrying value exceeds the estimated fair value. This evaluation is performed at the lowest level for which separately identifiable cash flows exist.
| | | | | | | | |
| The Williams Companies, Inc. |
| Notes to Consolidated Financial Statements – (Continued) |
|
For assets identified to be disposed of in the future and considered held for sale, we compare the carrying value to the estimated fair value less the cost to sell to determine if recognition of an impairment is required. Until the assets are disposed of, the estimated fair value, which includes estimated cash flows from operations until the assumed date of sale, is recalculated when related events or circumstances change.
We evaluate our investments for impairment when, in our judgment, events or circumstances indicate that the carrying value of such investments may have experienced an other-than-temporary decline in value. When evidence of loss in value has occurred, we compare our estimate of fair value of the investment to the carrying value of the investment to determine whether an impairment has occurred. If the estimated fair value is less than the carrying value and we consider the decline in value to be other-than-temporary, the excess of the carrying value over the fair value is recognized in our consolidated financial statements as an impairment charge.
Judgment and assumptions are inherent in our estimate of undiscounted future cash flows and an asset’s or investment’s fair value. Additionally, judgment is used to determine the probability of sale with respect to assets considered for disposal.
Equity-method investment basis differences
Differences between the carrying value of our equity-method investments and our underlying equity in the net assets of investees are accounted for as if the investees were consolidated subsidiaries. Equity earnings (losses) in our Consolidated Statement of Income includes our allocable share of net income (loss) of investees adjusted for any depreciation and amortization, as applicable, associated with basis differences.
Leases
We recognize a lease liability with an offsetting right-of-use asset in our Consolidated Balance Sheet for operating leases based on the present value of the future lease payments. We have elected to combine lease and nonlease components for all classes of leased assets in our calculation of the lease liability and the offsetting right-of-use asset.
Our lease agreements require both fixed and variable periodic payments, with initial terms typically ranging from one year to 20 years. Payment provisions in certain of our lease agreements contain escalation factors which may be based on stated rates or a change in a published index at a future time. The amount by which a lease escalates based on the change in a published index, which is not known at lease commencement, is considered a variable payment and is not included in the present value of the future lease payments, which only includes those that are stated or can be calculated based on the lease agreement at lease commencement. In addition to the noncancellable periods, many of our lease agreements provide for one or more extensions of the lease agreement for periods ranging from one year in length to an indefinite number of times following the specified contract term. Other lease agreements provide for extension terms that allow us to utilize the identified leased asset for an indefinite period of time so long as the asset continues to be utilized in our operations. In consideration of these renewal features, we assess the term of the lease agreements, which includes using judgment in the determination of which renewal periods and termination provisions, when at our sole election, will be reasonably certain of being exercised. Periods after the initial term or extension terms that allow for either party to the lease to cancel the lease are not considered in the assessment of the lease term. Additionally, we have elected to exclude leases with an original term of one year or less, including renewal periods, from the calculation of the lease liability and the offsetting right-of-use asset.
We use judgment in determining the discount rate upon which the present value of the future lease payments is determined. This rate is based on a collateralized interest rate corresponding to the term of the lease agreement using company, industry, and market information available.
When permitted under our lease agreements, we may sublease certain unused office space for fixed periods that could extend up to the length of the original lease agreement.
We capitalize interest during construction on major projects with construction periods of at least 3 months and a total project cost in excess of $1 million. Interest is capitalized on borrowed funds and, where regulation by the FERC exists, on internally generated funds (equity AFUDC). The latter is included in Other income (expense) – net below Operating income (loss) in our Consolidated Statement of Income. The rates used by regulated companies are calculated in accordance with FERC rules. Rates used by nonregulated companies are based on our average interest rate on debt.
Employee stock-based awards
We recognize compensation expense on employee stock-based awards on a straight-line basis; forfeitures are recognized when they occur. | | | | | | | | |
| The Williams Companies, Inc. |
| Notes to Consolidated Financial Statements – (Continued) |
|
Pension and other postretirement benefits
The funded status of each of the pension and other postretirement benefit plans is recognized separately in our Consolidated Balance Sheet as either an asset or liability. The plans’ benefit obligations and net periodic benefit costs (credits) are actuarially determined and impacted by various assumptions and estimates.
The discount rates are determined separately for each of our pension and other postretirement benefit plans based on an approach specific to our plans. The year-end discount rates are determined considering a yield curve comprised of high-quality corporate bonds and the timing of the expected benefit cash flows of each plan.
| | | | | | | | |
The Williams Companies, Inc. |
Notes to Consolidated Financial Statements – (Continued) |
|
The expected long-term rates of return on plan assets are determined by combining a review of the historical returns within the portfolio, the investment strategy included in the plans’ investment policy statement, and capital market projections for the asset classes in which the portfolio is invested, as well as the weighting of each asset class.
Unrecognized actuarial gains and losses are deferred and recorded in AOCI or, for Transco and Northwest Pipeline, as a regulatory asset or liability, until amortized as a component of net periodic benefit cost (credit). The unrecognized net actuarial losses deferred in AOCI at December 31, 2023 and 2022 were $17 million and $18 million, respectively. Unrecognized actuarial gains and losses in excess of 10 percent of the greater of the benefit obligation or the market-related value of plan assets are amortized over the participants’ average remaining future years of service, which is approximately 109 years for our pension plans and approximately 5 years for our other postretirement benefit plan.
The expected return on plan assets component of net periodic benefit cost (credit) is calculated using the market-related value of plan assets. For our pension plans, the market-related value of plan assets is equal to the fair value of plan assets adjusted to reflect the amortization of gains or losses associated with the difference between the expected and actual return on plan assets over a 5-year period. Additionally, the market-related value of assets may be no more than 110 percent or less than 90 percent of the fair value of plan assets at the beginning of the year. The market-related value of plan assets for our other postretirement benefit plan is equal to the unadjusted fair value of plan assets at the beginning of the year.
Income taxesContingent liabilities
We record liabilities for estimated loss contingencies, including environmental matters, when we assess that a loss is probable, and the amount of the loss can be reasonably estimated. These liabilities are calculated based upon our assumptions and estimates with respect to the likelihood or amount of loss and upon advice of legal counsel, engineers, or other third parties regarding the probable outcomes of the matters. These calculations are made without consideration of any potential recovery from third parties. We recognize insurance recoveries or reimbursements from others when realizable. Revisions to these liabilities are generally reflected in income when new or different facts or information become known or circumstances change that affect the previous assumptions or estimates.
We includeTreasury stock
Treasury stock purchases are accounted for under the operationscost method whereby the entire cost of the acquired stock is recorded as of our domestic corporate subsidiaries and income from our subsidiary partnerships in our consolidated federal income tax return and also file tax returnsTreasury stock, at cost in our Consolidated Balance Sheet. Gains and losses on the subsequent reissuance of shares are credited or charged to various Capital in excess of par valueforeign and state jurisdictions as required. Deferred income taxes are computed in our Consolidated Balance Sheet using the liability method and are provided on all temporary differences between the financial basis and the tax basis of our assets and liabilities. Our judgment and income tax assumptions are used to determine the levels, if any, of valuation allowances associated with deferred tax assets.average-cost method.
Earnings (loss) per common shareCash flows from revolving credit facility and commercial paper program
Basic earnings (loss) per common shareProceeds and payments related to borrowings under our revolving credit facility are reflected in the financing activities in our Consolidated Statement of Cash Flows on a gross basis. Proceeds and payments related to borrowings under our commercial paper program are reflected in the financing activities in our Consolidated
| | | | | | | | |
| The Williams Companies, Inc. |
| Notes to Consolidated Financial Statements – (Continued) |
|
Statement of Cash Flows on a net basis, as the outstanding notes generally have maturity dates less than three months from the date of issuance. (See Note 12 – Debt and Banking Arrangements.)
Accounting standards issued but not yet adopted
In November 2023, the Financial Accounting Standards Board (FASB) issued Accounting Standards Update (ASU) 2023-07, Segment Reporting (Topic 280): Improvements to Reportable Segment Disclosures, which requires disclosure of significant segment expenses and expanded interim disclosures. This ASU is effective for fiscal years beginning after December 15, 2023, and interim periods within fiscal years beginning after December 15, 2024, and early adoption is permitted. We do not expect adoption of ASU 2023-07 will have a material impact on our financial statements.
In December 2023, the FASB issued ASU 2023-09, Income Taxes: Improvements to Income Tax Disclosures, which requires disclose of specific categories in the rate reconciliation and additional information for reconciling items that meet a quantitative threshold. This ASU is effective for fiscal years beginning after December 15, 2024, and early adoption is permitted. We do not expect adoption of ASU 2023-09 will have a material impact on our financial statements.
Share Repurchase Program
In September 2021, our Board of Directors authorized a share repurchase program with a maximum dollar limit of $1.5 billion. Repurchases may be made from time to time in the open market, by block purchases, in privately negotiated transactions, or in such other manner as determined by our management. Our management will also determine the timing and amount of any repurchases based on the sum of the weighted-average numbermarket conditions and other factors. The share repurchase program does not obligate us to acquire any particular amount of common shares outstandingstock, and vested restricted stock units. Diluted earnings (loss) per commonit may be suspended or discontinued at any time. This share repurchase program does not have an expiration date. There were $130 million, $9 million, and no repurchases under the program in 2023, 2022, and 2021, respectively, which are included in our Consolidated Statement of Income includes any dilutive effectChanges in Equity.
Significant Risks and Uncertainties
We believe that the carrying value of nonvested restricted stock units, stock options,certain of our property, plant, and convertible instruments, unless otherwise noted. Diluted earnings (loss) per common shareequipment and intangible assets, notably certain acquired assets accounted for as business combinations between 2012 and 2014, may be in excess of current fair value. However, the carrying value of these assets, in our judgment, continues to be recoverable. It is calculated using the treasury-stock method.reasonably possible that future strategic decisions, including transactions such as monetizing assets or contributing assets to new ventures with third parties, as well as unfavorable changes in expected producer activities, could impact our assumptions and ultimately result in impairments of these assets. Such transactions or developments may also indicate that certain of our equity-method investments have experienced other-than-temporary declines in value, which could result in impairment.
Note 2 – Variable Interest Entities
Consolidated VIEs
As of December 31, 2021,2023, we consolidate the following VIEs:
Northeast JV
We own a 65 percent interest in the Northeast JV, a subsidiary that is a VIE due to certain of our voting rights being disproportionate to our obligation to absorb losses and substantially all of the Northeast JV’s activities being performed on our behalf. We are the primary beneficiary because we have the power to direct the activities that most significantly impact the Northeast JV’s economic performance. The Northeast JV provides midstream services for producers in the Marcellus Shale and Utica Shale regions. Future expansion activity is expected to be funded with capital contributions from us and the other equity partner on a proportional basis.
| | | | | | | | |
| The Williams Companies, Inc. |
| Notes to Consolidated Financial Statements – (Continued) |
|
Gulfstar One
We own a 51 percent interest in Gulfstar One, a subsidiary that, due to certain risk-sharing provisions in its customer contracts, is a VIE. Gulfstar One includes a proprietary floating-production system, Gulfstar FPS, and
| | | | | | | | |
The Williams Companies, Inc. |
Notes to Consolidated Financial Statements – (Continued) |
|
associated pipelines that provide production handling and gathering services in the eastern deepwater Gulf of Mexico. We are the primary beneficiary because we have the power to direct the activities that most significantly impact Gulfstar One’s economic performance.
Cardinal
We own a 66 percent interest in Cardinal, a subsidiary that provides gathering services for the Utica Shale region and is a VIE due to certain risks shared with customers. We are the primary beneficiary because we have the power to direct the activities that most significantly impact Cardinal’s economic performance. In accordance with the contract,order to meet contractual gas gathering commitments, we may fund more than our proportional share of future expansion activity, is required to be funded with capital contributions from us and the other equity partner on a proportional basis.which could ultimately impact relative ownership.
The following table presents amounts included in theour Consolidated Balance Sheet that are only for the use or obligation of our consolidated VIEs:
| | December 31, |
| 2021 | | 2020 |
| (Millions) |
| December 31, | | | December 31, |
| 2023 | | | 2023 | | 2022 |
| (Millions) | | | (Millions) |
| Assets (liabilities): | Assets (liabilities): | |
| Cash and cash equivalents | |
| Cash and cash equivalents | |
| Cash and cash equivalents | Cash and cash equivalents | $ | 78 | | | $ | 107 | |
| Trade accounts and other receivables – net | Trade accounts and other receivables – net | 132 | | | 148 | |
| Inventories | Inventories | 3 | | | — | |
| Other current assets and deferred charges | Other current assets and deferred charges | 7 | | | 7 | |
| Property, plant, and equipment – net | Property, plant, and equipment – net | 5,295 | | | 5,514 | |
| Intangible assets – net of accumulated amortization | Intangible assets – net of accumulated amortization | 2,267 | | | 2,376 | |
| Regulatory assets, deferred charges, and other | Regulatory assets, deferred charges, and other | 20 | | | 15 | |
| Accounts payable | Accounts payable | (61) | | | (42) | |
| Accrued liabilities | (29) | | | (34) | |
| Accrued and other current liabilities | |
| | Regulatory liabilities, deferred income, and other | Regulatory liabilities, deferred income, and other | (287) | | | (289) | |
| Regulatory liabilities, deferred income, and other | |
| Regulatory liabilities, deferred income, and other | |
Nonconsolidated VIEs
Targa Train 7
We own a 20 percent interest in Targa Train 7, which provides fractionation services at Mt.Mont Belvieu, Texas, and is a VIE due primarily to our limited participating rights as the minority equity holder. At December 31, 2021,2023, the carrying value of our investment in Targa Train 7 was $49$44 million. Our maximum exposure to loss is limited to the carrying value of our investment.
Brazos Permian II
We own a 15 percent interest in Brazos Permian II, which provides gathering and processing services in the Delaware basin and is a VIE due primarily to our limited participating rights as the minority equity holder. At December 31, 2023, the carrying value of our investment in Brazos Permian II was $27 million. Our maximum exposure to loss is limited to the carrying value of our investment.
| | | | | | | | |
| The Williams Companies, Inc. |
| Notes to Consolidated Financial Statements – (Continued) |
|
Note 3 – Acquisitions and Divestitures
Gulf Coast Storage Acquisition
On January 3, 2024, we closed on the acquisition of 100 percent of a strategic portfolio of natural gas storage facilities and pipelines, located in Louisiana and Mississippi, from Hartree Partners LP (Gulf Coast Storage Acquisition) for $1.95 billion, subject to working capital and post-closing adjustments. The purpose of this acquisition was to expand our natural gas storage footprint in the Gulf Coast region. The Gulf Coast Storage Acquisition was funded with cash on hand and $100 million of deferred consideration that does not accrue interest and is payable one year from the acquisition date.
Acquisition-related costs for the Gulf Coast Storage Acquisition of $1 million are reported within our Transmission & Gulf of Mexico segment and included in Selling, general, and administrative expenses in our Consolidated Statement of Income during 2023.
We plan on accounting for the Gulf Coast Storage Acquisition as a business combination, which requires, among other things, that identifiable assets acquired and liabilities assumed be recognized at their acquisition date fair values. The valuation techniques used consisted of the cost approach for property, plant, and equipment.
The following table presents the preliminary allocation of the acquisition date fair value of the major classes of the assets acquired, which will be included in our Transmission & Gulf of Mexico segment, and liabilities assumed at January 3, 2024. The allocation is considered preliminary because the valuation work has not been completed due to the ongoing review of the valuation results and validation of significant inputs and assumptions. Preliminary fair value measurements were made for certain acquired assets and liabilities, primarily property, plant, and equipment; however, adjustments to those measurements may be made in subsequent periods, up to one year from the acquisition date, as new information related to facts and circumstances as of the acquisition date may be identified. The fair value of accounts receivable acquired, included in Other current assets in the following table, equals contractual amounts receivable.
| | | | | |
| (Millions) |
| Cash and cash equivalents | $ | 46 | |
| Other current assets | 18 | |
| Property, plant, and equipment – net | 2,042 | |
| Other noncurrent assets | 2 | |
| Total assets acquired | $ | 2,108 | |
| |
| Current liabilities | $ | (10) | |
| Noncurrent liabilities | (107) | |
| Total liabilities assumed | $ | (117) | |
| |
| Net assets acquired | $ | 1,991 | |
DJ Basin Acquisitions
Cureton Acquisition
On November 30, 2023, we closed on the acquisition of 100 percent of Cureton Front Range, LLC (Cureton Acquisition), whose operations are located in the DJ Basin, for $546 million, subject to working capital and post-closing adjustments. The purpose of this acquisition was to expand our gathering and processing footprint and create operational synergies for our operations in the DJ Basin. The Cureton Acquisition was funded with cash on hand.
| | | | | | | | |
| The Williams Companies, Inc. |
| Notes to Consolidated Financial Statements – (Continued) |
|
During the period from the acquisition date of November 30, 2023 to December 31, 2023, the operations acquired in the Cureton Acquisition contributed Revenues of $35 million and Modified EBITDA (as defined in Note 18 – Segment Disclosures) of $7 million.
Acquisition-related costs for the Cureton Acquisition of $6 million are reported within our West segment and included in Selling, general, and administrative expenses in our Consolidated Statement of Income during 2023.
We accounted for the Cureton Acquisition as a business combination. The valuation techniques used consisted of the cost approach for property, plant, and equipment and the income approach for valuation of other intangible assets.
The following table presents the preliminary allocation of the acquisition date fair value of the major classes of the assets acquired, which are presented in our West segment, and liabilities assumed at November 30, 2023. The allocation is considered preliminary because the valuation work has not been completed due to the ongoing review of the valuation results and validation of significant inputs and assumptions. Preliminary fair value measurements were made for certain acquired assets and liabilities, primarily property, plant, and equipment and other intangible assets; however, adjustments to those measurements may be made in subsequent periods, up to one year from the acquisition date, as new information related to facts and circumstances as of the acquisition date may be identified. The fair value of accounts receivable acquired, included in Other current assets in the following table, equals contractual amounts receivable.
| | | | | |
| (Millions) |
| Cash and cash equivalents | $ | 2 | |
| Other current assets | 21 | |
| Property, plant, and equipment – net | 437 | |
| Intangible assets – net of accumulated amortization | 117 | |
| Other noncurrent assets | 4 | |
| Total identifiable assets acquired | $ | 581 | |
| |
| Current liabilities | $ | (25) | |
| Noncurrent liabilities | (16) | |
| Total liabilities assumed | $ | (41) | |
| |
| Net identifiable assets acquired | $ | 540 | |
| |
Goodwill included in Intangible assets – net of accumulated amortization | 6 | |
| Net assets acquired | $ | 546 | |
Other intangible assets recognized in the Cureton Acquisition are related to contractual customer relationships from gas gathering and processing agreements with our customers. The basis for determining the value of these intangible assets is estimated future net cash flows to be derived from acquired contractual customer relationships discounted using a risk-adjusted discount rate. These intangible assets are being amortized on a straight-line basis over an initial period of 20 years which represents the term over which the contractual customer relationships are expected to contribute to our cash flows. Approximately 24 percent of the expected future revenues from these contractual customer relationships are impacted by our ability and intent to renew or renegotiate existing customer contracts. We expense costs incurred to renew or extend the terms of our gas gathering contracts with customers. Based on the estimated future revenues during the current contract periods (as estimated at the time of the acquisition), the weighted-average period prior to the next renewal or extension of the existing contractual customer relationships is approximately 10 years. See Note 10 – Goodwill and Other Intangible Assets.
| | | | | | | | |
| The Williams Companies, Inc. |
| Notes to Consolidated Financial Statements – (Continued) |
|
RMM Acquisition
As of December 31, 2022, we owned a 50 percent interest in RMM which we accounted for as an equity-method investment. On November 30, 2023, we closed on the acquisition of the remaining 50 percent interest in RMM (RMM Acquisition) for $704 million. As a result of acquiring this additional interest, we obtained control of and now consolidate RMM. The purpose of this acquisition was to expand our gathering and processing footprint and create operational synergies for our operations in the DJ Basin. Substantially all of the RMM purchase price is not due to the seller until the first quarter of 2025, does not accrue interest until the fourth quarter of 2024, and may be repaid early without penalty. It was recorded as a deferred consideration obligation at fair value using an income approach, which resulted in a discount to the contractual amount due which will be imputed as interest expense over the term of the obligation. The obligation is presented within long-term debt owed by our wholly owned subsidiary Williams Rocky Mountain Midstream Holdings LLC.
During the period from the acquisition date of November 30, 2023 to December 31, 2023, RMM contributed Revenues of $53 million and Modified EBITDA of $12 million.
We accounted for the RMM Acquisition as a business combination. The book value of our existing equity-method investment prior to the acquisition date of November 30, 2023 was $406 million. We recognized a $30 million gain on remeasuring our existing equity-method investment to fair value included in Other investing income (loss) – net in our Consolidated Statement of Income during 2023. The valuation techniques used consisted of the income approach for our previous equity-method investment in RMM and the valuation of other intangible assets, and the cost approach for property, plant, and equipment.
The following table presents the preliminary allocation of the acquisition date fair value of the major classes of the assets acquired, which are presented in our West segment, and liabilities assumed at November 30, 2023. The net assets acquired primarily reflect the noncash consideration transferred, which includes the fair value of both our previous equity-method investment and the deferred consideration obligation. The allocation is considered preliminary because the valuation work has not been completed due to the ongoing review of the valuation results and validation of significant inputs and assumptions. Preliminary fair value measurements were made for certain acquired assets and liabilities, primarily property, plant, and equipment and other intangible assets; however, adjustments to those measurements may be made in subsequent periods, up to one year from the acquisition date, as new information related to facts and circumstances as of the acquisition date may be identified. The fair value of accounts receivable acquired, included in Other current assets in the following table, equals contractual amounts receivable.
| | | | | |
| (Millions) |
| Cash and cash equivalents | $ | 28 | |
| Other current assets | 4 | |
| Investments | 20 | |
| Property, plant, and equipment – net | 1,041 | |
| Intangible assets – net of accumulated amortization | 61 | |
| Other noncurrent assets | 12 | |
| Total identifiable assets acquired | $ | 1,166 | |
| |
| Current liabilities | $ | (44) | |
| Noncurrent liabilities | (103) | |
| Total liabilities assumed | $ | (147) | |
| |
| Net identifiable assets acquired | $ | 1,019 | |
| |
Goodwill included in Intangible assets – net of accumulated amortization | 57 | |
| Net assets acquired | $ | 1,076 | |
| | | | | | | | |
| The Williams Companies, Inc. |
| Notes to Consolidated Financial Statements – (Continued) |
|
Goodwill recognized in the RMM Acquisition relates primarily to enhancing and diversifying our basin positions as well as delivering operational synergies, including increasing volumes on our existing processing facilities and increasing revenues on our NGL transportation, fractionation, and storage assets, and is reported within our West segment. Substantially all of the goodwill is deductible for tax purposes.
Other intangible assets recognized in the RMM Acquisition are related to contractual customer relationships from gas gathering and processing agreements with our customers. The basis for determining the value of these intangible assets is estimated future net cash flows to be derived from acquired contractual customer relationships discounted using a risk-adjusted discount rate. These intangible assets are being amortized on a straight-line basis over an initial period of 20 years which represents the term over which the contractual customer relationships are expected to contribute to our cash flows. Approximately 18 percent of the expected future revenues from these contractual customer relationships are impacted by our ability and intent to renew or renegotiate existing customer contracts. We expense costs incurred to renew or extend the terms of our gas gathering contracts with customers. Based on the estimated future revenues during the current contract periods (as estimated at the time of the acquisition), the weighted-average period prior to the next renewal or extension of the existing contractual customer relationships is approximately 10 years. See Note 10 – Goodwill and Other Intangible Assets.
MountainWest Acquisition
On February 14, 2023, we closed on the acquisition of 100 percent of MountainWest, which includes FERC-regulated interstate natural gas pipeline systems and natural gas storage capacity (MountainWest Acquisition), for $1.08 billion of cash, funded with available sources of short-term liquidity, and retaining $430 million outstanding principal amount of MountainWest long-term debt. For 2023, $1.024 billion is presented in Purchases of businesses, net of cash acquired in our Consolidated Statement of Cash Flows reflecting the cash purchase price, reduced for post-closing adjustments and the cash acquired as presented in the purchase price allocation. The purpose of the MountainWest Acquisition was to expand our existing transmission and storage infrastructure footprint into major markets in Utah, Wyoming, and Colorado.
During the period from the acquisition date of February 14, 2023 to December 31, 2023, the operations acquired in the MountainWest Acquisition contributed Revenues of $225 million and Modified EBITDA of $122 million, which includes $27 million of transition-related costs.
Acquisition-related costs for the MountainWest Acquisition of $16 million are reported within our Transmission & Gulf of Mexico segment and included in Selling, general, and administrative expenses in our Consolidated Statement of Income during 2023.
We accounted for the MountainWest Acquisition as a business combination. The valuation techniques used consisted of the cost approach for nonregulated property, plant, and equipment, as well as the market approach for the assumed long-term debt consistent with the valuation technique discussed in Note 15 – Fair Value Measurements, Guarantees, and Concentration of Credit Risk. MountainWest’s regulated operations are accounted for pursuant to ASC 980. The fair value of assets and liabilities subject to rate making and cost recovery provisions were determined utilizing the income approach. MountainWest’s expected return on rate base is consistent with expected returns of similarly situated assets, resulting in carryover basis of these assets and liabilities equaling their fair value.
The following table presents the preliminary allocation of the acquisition date fair value of the major classes of the assets acquired, which are presented in our Transmission & Gulf of Mexico segment, and liabilities assumed at February 14, 2023. The fair value of accounts receivable acquired equals contractual amounts receivable. After the March 31, 2023, financial statements were issued, we identified adjustments to the preliminary purchase price allocation, primarily resulting in an increase of $19 million in trade accounts and other receivables and decreases of $73 million in property, plant, and equipment and $60 million in other noncurrent liabilities.
| | | | | | | | |
| The Williams Companies, Inc. |
| Notes to Consolidated Financial Statements – (Continued) |
|
| | | | | |
| (Millions) |
| Cash and cash equivalents | $ | 23 | |
| Trade accounts and other receivables | 33 | |
| Other current assets | 26 | |
| Investments | 20 | |
| Property, plant, and equipment – net | 1,019 | |
| Other noncurrent assets | 33 | |
| Total identifiable assets acquired | $ | 1,154 | |
| |
| Current liabilities | $ | (47) | |
Long-term debt (Note 12) | (365) | |
| Other noncurrent liabilities | (95) | |
| Total liabilities assumed | $ | (507) | |
| |
| Net identifiable assets acquired | $ | 647 | |
| |
Goodwill included in Intangible assets – net of accumulated amortization | 400 | |
| Net assets acquired | $ | 1,047 | |
Goodwill recognized in the MountainWest Acquisition relates primarily to enhancing and diversifying our basin positions and the long-term value associated with rate regulated businesses and is reported within our Transmission & Gulf of Mexico segment. Substantially all of the goodwill is deductible for tax purposes.
Trace Acquisition
On April 29, 2022, we closed on the acquisition of 100 percent of Gemini Arklatex, LLC through which we acquired the Haynesville Shale region gas gathering and related assets of Trace Midstream for $972 million of cash funded with cash on hand and proceeds from issuance of commercial paper (Trace Acquisition). The purpose of the Trace Acquisition was to expand our footprint into the east Texas area of the Haynesville Shale region, increasing in-basin scale in one of the largest growth basins in the country.
During the period from the acquisition date of April 29, 2022 to December 31, 2022, the operations acquired in the Trace Acquisition contributed Revenues of $148 million and Modified EBITDA of $73 million.
Acquisition-related costs for the Trace Acquisition of $8 million are reported within our West segment and were included in Selling, general, and administrative expenses in our Consolidated Statement of Income during 2022.
We accounted for the Trace Acquisition as a business combination. The following table presents the allocation of the acquisition date fair value of the major classes of the assets acquired, which are presented in our West segment, and liabilities assumed at April 29, 2022. The fair value of accounts receivable acquired equals contractual amounts receivable. The valuation techniques used consisted of the income approach for valuation of intangible assets and the cost approach for property, plant, and equipment.
| | | | | | | | |
| The Williams Companies, Inc. |
| Notes to Consolidated Financial Statements – (Continued) |
|
| | | | | |
| (Millions) |
| Cash and cash equivalents | $ | 39 | |
| Trade accounts and other receivables | 18 | |
| Property, plant, and equipment – net | 448 | |
| Intangible assets – net of accumulated amortization | 472 | |
| Other noncurrent assets | 20 | |
| Total assets acquired | $ | 997 | |
| |
| Accounts payable | $ | (12) | |
| Accrued and other current liabilities | (5) | |
| Other noncurrent liabilities | (8) | |
| Total liabilities assumed | $ | (25) | |
| |
| Net assets acquired | $ | 972 | |
Other intangible assets recognized in the Trace Acquisition are related to contractual customer relationships from gas gathering agreements with our customers. The basis for determining the value of these intangible assets is estimated future net cash flows to be derived from acquired contractual customer relationships discounted using a risk-adjusted discount rate. These intangible assets are being amortized on a straight-line basis over an initial period of 20 years which represents the term over which the contractual customer relationships are expected to contribute to our cash flows. Approximately 2 percent of the expected future revenues from these contractual customer relationships are impacted by our ability and intent to renew or renegotiate existing customer contracts. We expense costs incurred to renew or extend the terms of our gas gathering contracts with customers. Based on the estimated future revenues during the current contract periods (as estimated at the time of the acquisition), the weighted-average period prior to the next renewal or extension of the existing contractual customer relationships is approximately 19 years. See Note 10 – Goodwill and Other Intangible Assets.
Sequent Acquisition
On July 1, 2021, we completedclosed on the Sequent Acquisition in which we acquiredacquisition of 100 percent of Sequent Energy Management, L.P. and Sequent Energy Canada, Corp.Corp (Sequent Acquisition). Total consideration for this acquisition was $159 million, which included $109 million related to working capital.
Operations acquired in the Sequent Acquisition focus on risk management and the marketing, trading, storage, and transportation of natural gas for a diverse set of natural gas and electric utilities, municipalities, power generators, and producers, as well as moving gas to markets through transportation and storage agreements on strategically positioned assets, including our Transco system. The purpose of the Sequent Acquisition was to expand our natural
| | | | | | | | |
The Williams Companies, Inc. |
Notes to Consolidated Financial Statements – (Continued) |
|
gas marketing activities as well as optimize our pipeline and storage capabilities with expansions into new markets to reach incremental gas-fired power generation, liquified natural gas exports, and future renewable natural gas and other emerging opportunities.
The Sequent Acquisition was accounted for as a business combination, which requires, among other things, that identifiable assets acquired and liabilities assumed be recognized at their acquisition date fair values.
Pro forma revenues and earnings as if the Sequent Acquisition had been completed on January 1, 2020, are not materially different from our historical results for the years ended December 31, 2021 and 2020. During the period from the acquisition date of July 1, 2021 to December 31, 2021, Sequent’s results for the operations acquired in the Sequent Acquisition included net productProduct sales of $(43) million (including $80 million of purchases from affiliates), net loss onNet gain (loss) from commodity derivatives of $43of $(43) million, and unfavorable Modified EBITDA (as defined in Note 20 – Segment Disclosures) of $112 million. Both the net loss on commodity derivativesRevenues and Modified EBITDA amounts reflect a net unrealized loss onfrom commodity derivatives in Net gain (loss) from commodity derivativesof $109$(109) million for the period.
Costs related toAcquisition-related costs for the Sequent Acquisition are approximatelyfor the period from the acquisition date of July 1, 2021 to December 31, 2021 of $5 million are reported within our Gas & NGL Marketing Services segment and arewere included in Selling, general, and administrative expenses in our Consolidated Statement of Income.Income for the year ended December 31, 2021.
| | | | | | | | |
| The Williams Companies, Inc. |
| Notes to Consolidated Financial Statements – (Continued) |
|
We accounted for the Sequent Acquisition as a business combination. The following table presents the allocation of the acquisition date fair value of the major classes of the assets acquired, which are presented in the Sequentour Gas & NGL Marketing Services segment, and liabilities assumed at July 1, 2021. The fair value of accounts receivable acquired equals contractual amounts receivable. Preliminary fair value measurements were made for certain acquired assets and liabilities, primarily intangible assets; however, adjustments to those measurements may be made in subsequent periods, up to one year from the acquisition date, as new information related to facts and circumstances as of the acquisition date may be identified. The fair value of the intangible assets werewas measured using an income approach. The inventory acquired relates to natural gas in underground storage. The fair value of thisthe inventory acquired was based on the market price of the underlying commoditynatural gas in underground storage at the acquisition date. See Note 1715 – Fair Value Measurements, Guarantees, and Concentration of Credit Risk for the valuation techniques used to measure fair value of commodity derivative assets and liabilities.
| | | | | |
| (Millions) |
| Cash and cash equivalents | $ | 8 | |
Trade accounts and other receivables – net | 498 | |
| Inventories | 121 | |
| Derivative assets | 57 | |
| Other current assets and deferred charges | 4 | |
Commodity derivatives included in other current assets and deferred charges
| 57 | |
| Property, plant, and equipment – net | 5 | |
| Intangible assets – net of accumulated amortization | 306 | |
RegulatoryOther noncurrent assets deferred charges, and other | 3 | |
Commodity derivatives included in other noncurrent assetsregulatory assets, deferred charges, and other | 49 | |
| Total assets acquired | $ | 1,051 | |
| |
| Accounts payable | $ | 514 (514) | |
| Derivative liabilities | (116) | |
| Accrued and other current liabilities | 46 (46) | |
Commodity derivatives included in accrued liabilities
| 116 | |
RegulatoryOther noncurrent liabilities deferred income, and other | 1 (1) | |
Commodity derivatives included in other noncurrent liabilitiesregulatory liabilities, deferred income, and other | 215 (215) | |
| Total liabilities assumed | $ | 892 (892) | |
| |
| Net assets acquired | $ | 159 | |
| | | | | | | | |
The Williams Companies, Inc. |
Notes to Consolidated Financial Statements – (Continued) |
|
Accounts receivable and accounts payable
The operations acquired in the Sequent providesAcquisition provide services to retail and wholesale gas marketers, utility companies, upstream producers, and industrial customers. See Note 1 – General, Description of Business, Basis of Presentation, and Summary of Significant Accounting Policies for our policy regarding netting receivables and payables.
IntangibleOther intangible assets
IntangibleOther intangible assets are primarily related to transportation and storage capacity contracts. The basis for determining the value of these intangible assets was estimated future net cash flows to be derived from acquired transportation and storage capacity contracts that provide future economic benefits due to their market location, discounted using an industry weighted-average cost of capital. This intangible asset is being amortized based on the expected benefit period over which the underlying contracts are expected to contribute to our cash flows ranging from 1 year to 8 years. As a result, we expect a significant portion of the amortization towill be recognized within the first few years of this range. See Note 1110 – Goodwill and Other Intangible Assets.
Commodity derivatives
We are exposed to commodity price risk. To manage this volatility, we use various contracts in our marketing and trading activities that generally meet the definition of derivatives. We enter into commodity-relatedcommodity derivatives to economically hedge exposures to natural gas and retain exposure to price changes that can, in a volatile energy market, be material and can adversely affect our results of operations; see Note 1 – General, Description of Business, Basis of Presentation, and Summary of Significant Accounting Policies for our accounting policy for commodity derivatives.
UEOM
As of December 31, 2018, we owned a 62 percent interest in Utica East Ohio Midstream LLC (UEOM) which we accounted for as an equity-method investment. On March 18, 2019, we signed and closed the acquisition of the remaining 38 percent interest in UEOM. Total consideration paid, including post-closing adjustments, was $741 million in cash funded through credit facility borrowings and cash on hand, net of $13 million cash acquired. As a result of acquiring this additional interest, we obtained control of and consolidated UEOM.
UEOM is involved primarily in the processing and fractionation of natural gas and NGLs in the Utica Shale play in eastern Ohio. The purpose of the acquisition was to enhance our position in the region. We expect synergies through common ownership of UEOM and our Ohio Valley midstream systems to create a more efficient platform for capital spending in the region, resulting in reduced operating and maintenance expenses and creating enhanced capabilities and benefits for producers in the area.
The acquisition of UEOM was accounted for as a business combination, which requires, among other things, that identifiable assets acquired and liabilities assumed be recognized at their acquisition date fair values. In March 2019, based on the transaction price for our purchase of the remaining interest in UEOM as finalized just prior to the acquisition, we recognized a $74 million noncash impairment loss related to our existing 62 percent interest (see Note 17 – Fair Value Measurements, Guarantees, and Concentration of Credit Risk). Thus, there was no gain or loss on remeasuring our existing equity-method investment to fair value due to the impairment recognized just prior to closing the acquisition of the additional interest.
The valuation techniques used to measure the acquisition date fair value of the UEOM acquisition consisted of the market approach for our previous equity-method investment in UEOM and the income approach (excess earnings method) for valuation of intangible assets and depreciated replacement costs for property, plant, and equipment.
The following table presents the allocation of the acquisition date fair value of the major classes of the assets acquired, which are presented in the Northeast G&P segment, and liabilities assumed, including post closing purchase price adjustments. The net assets acquired reflect the sum of the consideration transferred and the noncash
| | | | | | | | |
| The Williams Companies, Inc. |
| Notes to Consolidated Financial Statements – (Continued) |
|
elimination of the fair value of our existing equity-method investment upon our acquisition of the additional interest. The fair value of accounts receivable acquired, presented in current assets in the table, equals contractual amounts receivable.
| | | | | |
| (Millions) |
Current assets, including $13 million cash acquired | $ | 56 | |
Property, plant, and equipment | 1,387 | |
Other intangible assets | 328 | |
Total identifiable assets acquired | 1,771 | |
| |
Current liabilities | 7 | |
Total liabilities assumed | 7 | |
| |
Net identifiable assets acquired | 1,764 | |
| |
Goodwill | 187 | |
Net assets acquired | $ | 1,951 | |
The goodwill recognized in the acquisition related primarily to enhancing and diversifying our basin positions and is reported within the Northeast G&P segment. Substantially all of the goodwill is deductible for tax purposes. The goodwill represented the excess of the consideration, plus the fair value of any previously held equity interest, over the fair value of the net assets acquired.
The goodwill recognized in the UEOM acquisition of $187 million, which includes a $1 million adjustment recorded in the first quarter of 2020, was impaired during first quarter of 2020. Our partner’s $65 million share of this impairment is reflected within Net income (loss) attributable to noncontrolling interests in our Consolidated Statement of Income (see Note 17 – Fair Value Measurements, Guarantees, and Concentration of Credit Risk).
Other intangible assets recognized in the acquisition are related to contractual customer relationships from gas gathering, processing, and fractionation agreements with our customers. See Note 11 – Intangible Assets for a discussion of the valuation and amortization of these intangible assets.Supplemental Pro Forma
The following unaudited pro forma Revenues and Net income (loss) attributable to The Williams Companies, Inc. for the year ended December 31, 20192023, 2022, and 2021, are presented as if the UEOM acquisitionGulf Coast Storage Acquisition had been completed on January 1, 2018.2023, the DJ Basin Acquisitions and MountainWest Acquisition had been completed on January 1, 2022, the Trace Acquisition had been completed on January 1, 2021, and the Sequent Acquisition had been completed on January 1, 2020. These pro forma amounts are not necessarily indicative of what the actual results would have been if the acquisitionacquisitions had in fact occurred on the datedates or for the periods indicated, nor do they purport to project Revenues or Net income (loss) attributable to The Williams Companies, Inc. for any future periods or as of any date. These amounts do not give effect to any potential cost savings, operating synergies, or revenue enhancements to result from the transactiontransactions or the potential costs to achieve these cost savings, operating synergies, and revenue enhancements.
| | | | | | | | | | | | | | | | | | | | | | | | | | | | | |
| |
| | | | | | | | | |
| |
| | | | | | | | | |
| | | | | | | | | |
| | | | | | | | | |
| |
| | | | | | | | | |
| |
| | | | | | | | | |
| | | | | | | | | |
| | | | | | | | | |
| Year Ended December 31, 2023 |
| As Reported | | Pro Forma Gulf Coast Storage | | Pro Forma DJ Basin (1) | | Pro Forma MountainWest (1) | | Pro Forma Combined |
| (Millions) |
| Revenues | $ | 10,907 | | | $ | 202 | | | $ | 270 | | | $ | 35 | | | $ | 11,414 | |
| Net income (loss) attributable to The Williams Companies, Inc. | 3,179 | | | 53 | | | 17 | | | 6 | | | 3,255 | |
| | | | | | | | | |
| Year Ended December 31, 2022 |
| As Reported | | Pro Forma DJ Basin | | Pro Forma MountainWest | | Pro Forma Trace (1) | | Pro Forma Combined |
| (Millions) |
| Revenues | $ | 10,965 | | | $ | 218 | | | $ | 265 | | | $ | 45 | | | $ | 11,493 | |
| Net income (loss) attributable to The Williams Companies, Inc. | 2,049 | | | 13 | | | 170 | | | 18 | | | 2,250 | |
| | | | | | | | | |
| Year Ended December 31, 2021 |
| As Reported | | | | Pro Forma Trace | | Pro Forma Sequent (1) | | Pro Forma Combined |
| (Millions) |
| Revenues | $ | 10,627 | | | | | $ | 118 | | | $ | 188 | | | $ | 10,933 | |
| Net income (loss) attributable to The Williams Companies, Inc. | 1,517 | | | | | 42 | | | 4 | | | 1,563 | |
| | | | | | | |
| Year Ended December 31, |
| 2019 | | |
| (Millions) |
Revenues | $ | 8,233 | | | |
Net income (loss) attributable to The Williams Companies, Inc. | 928 | | | |
Adjustments to pro forma (1)Net income (loss) attributable toExcludes results from operations acquired in the acquisition for the period beginning on the acquisition date, as these results are included in the amounts as reported.
NorTex Asset Purchase
On August 31, 2022, we purchased a group of assets in north Texas, primarily natural gas storage facilities and pipelines, from NorTex Midstream Holdings, LLC (NorTex Asset Purchase) for approximately $424 million. These assets are included in our Transmission & Gulf of Mexico segment.
Sale of Certain Gulf Coast Liquids Pipelines
On September 29, 2023, we completed the sale of various petrochemical and feedstock pipelines and associated contracts in the Gulf Coast region for $348 million. As a result of this sale, we recorded a gain of $129 million in 2023 in our Transmission & Gulf of Mexico segment. The Williams Companies, Inc.gain is reflected in Gain on sale of business include the removal of the previously described $74 million impairment loss recognized in March 2019 just prior to the acquisition.our
| | | | | | | | |
| The Williams Companies, Inc. |
| Notes to Consolidated Financial Statements – (Continued) |
|
DuringConsolidated Statement of Income. The results of operations for this disposal group, excluding the period fromgain noted, were not significant for the acquisition datereporting periods.
Note 4 – Related Party Transactions
Transactions with Equity-Method Investees
We have costs and expenses associated with our equity-method investees of March 18, 2019 to December 31, 2019, UEOM contributed Revenues$776 million, $1.346 billion, and $948 million for 2023, 2022, and 2021, respectively in our Consolidated Statement of $179 million and Net income (loss) attributable to The Williams Companies, Inc.Income. Substantially all of $53 million.
Costs related to this acquisitionthese expenses are $4 million and are reported within our Northeast G&P segment and included in Selling, general,Product costs. We also have revenue from our equity-method investees of $5 million, $76 million, and administrative expenses$46 million for 2023, 2022, and 2021, respectively. In addition, we have $2 million and $17 million included in Trade accounts and other receivables and $33 million and $87 million included in Accounts payable in our Consolidated Balance Sheetwith our equity-method investees at December 31, 2023 and 2022, respectively.
We have operating agreements with certain equity-method investees. These operating agreements typically provide for reimbursement or payment to us for certain direct operational payroll and employee benefit costs, materials, supplies, and other charges and also for management services. The total charges to equity-method investees for these fees are $64 million, $65 million, and $70 million for 2023, 2022, and 2021, respectively.
Board of Directors
Two members of our Board of Directors are also executive officers at certain of our counterparties. We recorded $90 million and $180 million in Product sales and $25 million and $86 million in Product costs in our Consolidated Statement of Income from these companies for the year ended December 31, 2019.
Northeast JV
Concurrent with the UEOM acquisition, we executed an agreement whereby we contributed our consolidated interests in UEOMpurchase and our Ohio Valley midstream business to a newly formed partnership. In June 2019, our partner invested approximately $1.33 billionsale of natural gas for a 35 percent ownership interest,2023 and we retained 65 percent ownership of, as well as operate and consolidate, the Northeast JV business. The change in ownership due to this transaction increased Noncontrolling interests in consolidated subsidiaries by $567 million, and decreased Capital in excess of par value by $426 million and Deferred income tax liabilities by $141 million in our Consolidated Balance Sheet as of December 31, 2019. Costs related to this transaction are $6 million and are reported within our Northeast G&P segment and included in Selling, general, and administrative expenses in our Consolidated Statement of Income for the year ended December 31, 2019.2022, respectively.
| | | | | | | | |
| The Williams Companies, Inc. |
| Notes to Consolidated Financial Statements – (Continued) |
|
Note 45 – Revenue Recognition
Revenue by Category
The following table presents our revenue disaggregated by major service line:
| | Transco | | Northwest Pipeline | | Gulf of Mexico Midstream | | Northeast
Midstream | | West Midstream | | Sequent | | Other | | Eliminations | | Total |
| (Millions) |
| 2021 | |
| Regulated Interstate Transportation & Storage | | | Regulated Interstate Transportation & Storage | | Gulf of Mexico Midstream & Storage | | Northeast
Midstream | | West Midstream | | Gas & NGL Marketing Services | | Other | | Eliminations | | Total |
| (Millions) | | | (Millions) |
| 2023 | |
| Revenues from contracts with customers: | |
| Revenues from contracts with customers: | |
| Revenues from contracts with customers: | Revenues from contracts with customers: | |
| Service revenues: | Service revenues: | |
| Service revenues: | |
| Service revenues: | |
| Regulated interstate natural gas transportation and storage | |
| Regulated interstate natural gas transportation and storage | |
| Regulated interstate natural gas transportation and storage | Regulated interstate natural gas transportation and storage | $ | 2,547 | | | $ | 441 | | | $ | — | | | $ | — | | | $ | — | | | $ | — | | | $ | — | | | $ | (33) | | | $ | 2,955 | |
| Gathering, processing, transportation, fractionation, and storage: | Gathering, processing, transportation, fractionation, and storage: | |
| Monetary consideration | |
| Monetary consideration | |
| Monetary consideration | Monetary consideration | — | | | — | | | 344 | | | 1,308 | | | 1,157 | | | — | | | — | | | (103) | | | 2,706 | |
| Commodity consideration | Commodity consideration | — | | | — | | | 52 | | | 7 | | | 179 | | | — | | | — | | | — | | | 238 | |
| Other | Other | 10 | | | — | | | 22 | | | 195 | | | 52 | | | — | | | 1 | | | (16) | | | 264 | |
| Total service revenues | Total service revenues | 2,557 | | | 441 | | | 418 | | | 1,510 | | | 1,388 | | | — | | | 1 | | | (152) | | | 6,163 | |
| Product sales | Product sales | 88 | | | — | | | 269 | | | 99 | | | 4,330 | | | 2,139 | | | 333 | | | (637) | | | 6,621 | |
| Total revenues from contracts with customers | Total revenues from contracts with customers | 2,645 | | | 441 | | | 687 | | | 1,609 | | | 5,718 | | | 2,139 | | | 334 | | | (789) | | | 12,784 | |
| Other revenues (1) | Other revenues (1) | 10 | | | 3 | | | 8 | | | 25 | | | (73) | | | 2,673 | | | 11 | | | (13) | | | 2,644 | |
| Other adjustments (2) | Other adjustments (2) | — | | | — | | | — | | | — | | | — | | | (4,898) | | | — | | | 97 | | | (4,801) | |
| Total revenues | Total revenues | $ | 2,655 | | | $ | 444 | | | $ | 695 | | | $ | 1,634 | | | $ | 5,645 | | | $ | (86) | | | $ | 345 | | | $ | (705) | | | $ | 10,627 | |
| | 2020 | |
| 2022 | |
| 2022 | |
| 2022 | |
| Revenues from contracts with customers: | |
| Revenues from contracts with customers: | |
| Revenues from contracts with customers: | Revenues from contracts with customers: | |
| Service revenues: | Service revenues: | |
| Service revenues: | |
| Service revenues: | |
| Regulated interstate natural gas transportation and storage | |
| Regulated interstate natural gas transportation and storage | |
| Regulated interstate natural gas transportation and storage | Regulated interstate natural gas transportation and storage | $ | 2,404 | | | $ | 449 | | | $ | — | | | $ | — | | | $ | — | | | $ | — | | | $ | — | | | $ | (7) | | | $ | 2,846 | |
| Gathering, processing, transportation, fractionation, and storage: | Gathering, processing, transportation, fractionation, and storage: | |
| Monetary consideration | — | | | — | | | 348 | | | 1,279 | | | 1,204 | | | — | | | — | | | (75) | | | 2,756 | |
| Monetary consideration (3) | |
| Monetary consideration (3) | |
| Monetary consideration (3) | |
| Commodity consideration | Commodity consideration | — | | | — | | | 21 | | | 7 | | | 101 | | | — | | | — | | | — | | | 129 | |
| Other | 10 | | | — | | | 27 | | | 164 | | | 65 | | | — | | | 1 | | | (14) | | | 253 | |
| Other (3) | |
| Total service revenues | Total service revenues | 2,414 | | | 449 | | | 396 | | | 1,450 | | | 1,370 | | | — | | | 1 | | | (96) | | | 5,984 | |
| Product sales | Product sales | 80 | | | — | | | 114 | | | 57 | | | 1,565 | | | — | | | — | | | (147) | | | 1,669 | |
| Total revenues from contracts with customers | Total revenues from contracts with customers | 2,494 | | | 449 | | | 510 | | | 1,507 | | | 2,935 | | | — | | | 1 | | | (243) | | | 7,653 | |
| Other revenues (1) | Other revenues (1) | 10 | | | — | | | 9 | | | 22 | | | 8 | | | — | | | 33 | | | (16) | | | 66 | |
| Other adjustments (2) | |
| Total revenues | Total revenues | $ | 2,504 | | | $ | 449 | | | $ | 519 | | | $ | 1,529 | | | $ | 2,943 | | | $ | — | | | $ | 34 | | | $ | (259) | | | $ | 7,719 | |
| |
| | | | | | | | |
| The Williams Companies, Inc. |
| Notes to Consolidated Financial Statements – (Continued) |
|
| | Transco | | Northwest Pipeline | | Gulf of Mexico Midstream | | Northeast
Midstream | | West Midstream | | Sequent | | Other | | Eliminations | | Total |
| (Millions) |
| 2019 | |
| Regulated Interstate Transportation & Storage | | | Regulated Interstate Transportation & Storage | | Gulf of Mexico Midstream & Storage | | Northeast
Midstream | | West Midstream | | Gas & NGL Marketing Services | | Other | | Eliminations | | Total |
| (Millions) | | | (Millions) |
| 2021 | |
| Revenues from contracts with customers: | |
| Revenues from contracts with customers: | |
| Revenues from contracts with customers: | Revenues from contracts with customers: | |
| Service revenues: | Service revenues: | |
| Service revenues: | |
| Service revenues: | |
| Regulated interstate natural gas transportation and storage | |
| Regulated interstate natural gas transportation and storage | |
| Regulated interstate natural gas transportation and storage | Regulated interstate natural gas transportation and storage | $ | 2,336 | | | $ | 450 | | | $ | — | | | $ | — | | | $ | — | | | $ | — | | | $ | — | | | $ | (6) | | | $ | 2,780 | |
| Gathering, processing, transportation, fractionation, and storage: | Gathering, processing, transportation, fractionation, and storage: | |
| Monetary consideration | — | | | — | | | 479 | | | 1,171 | | | 1,309 | | | — | | | — | | | (75) | | | 2,884 | |
| Monetary consideration (3) | |
| Monetary consideration (3) | |
| Monetary consideration (3) | |
| Commodity consideration | Commodity consideration | — | | | — | | | 41 | | | 12 | | | 150 | | | — | | | — | | | — | | | 203 | |
| Other | 11 | | | — | | | 26 | | | 147 | | | 42 | | | — | | | — | | | (16) | | | 210 | |
| Other (3) | |
| Total service revenues | Total service revenues | 2,347 | | | 450 | | | 546 | | | 1,330 | | | 1,501 | | | — | | | — | | | (97) | | | 6,077 | |
| Product sales | Product sales | 106 | | | — | | | 185 | | | 150 | | | 1,795 | | | — | | | — | | | (173) | | | 2,063 | |
| Total revenues from contracts with customers | Total revenues from contracts with customers | 2,453 | | | 450 | | | 731 | | | 1,480 | | | 3,296 | | | — | | | — | | | (270) | | | 8,140 | |
| Other revenues (1) | Other revenues (1) | 1 | | | — | | | 8 | | | 20 | | | 14 | | | — | | | 30 | | | (12) | | | 61 | |
| Other adjustments (2) | |
| Total revenues | Total revenues | $ | 2,454 | | | $ | 450 | | | $ | 739 | | | $ | 1,500 | | | $ | 3,310 | | | $ | — | | | $ | 30 | | | $ | (282) | | | $ | 8,201 | |
|
(1)Revenues not derived from contracts with customers primarily consist of leasing revenuesphysical product sales related to commodity derivative contracts, realized and unrealized gains and losses associated with our headquarters building andcommodity derivative contracts, which are reported in Net gain (loss) from commodity derivativesin our Consolidated Statement of Income, management fees that we receive for certain services we provide to operated equity-method investments, which are reported in Serviceand leasing revenues in the Consolidated Statement of Income, and realized and unrealized gains and losses associated with our derivative contracts, which are reported in Net gain (loss) on commodity derivativesin the Consolidated Statement of Income.
(2)Other adjustments relate toreflect certain costs of Sequent’sGas & NGL Marketing Services’ risk management activities. As Sequent iswe are acting as an agent for itsnatural gas marketing customers itsor engage in energy trading activities, the resulting revenues are presented net of the related costs of those activities in theour Consolidated Statement of Income. In addition, all
(3)Certain contractual reimbursements of Sequent’s derivative activities qualify as heldoperating and maintenance costs totaling $186 million and $171 million for trading purposes, which requires net2022 and 2021, respectively, previously included in Other are now presented in Monetary consideration to conform to the current presentation.
Contract Assets
The following table presents a reconciliation of our contract assets:
| | Year Ended December 31, |
| 2021 | | 2020 |
| (Millions) |
| | | Year Ended December 31, | |
| | | Year Ended December 31, | |
| | | Year Ended December 31, | |
| | | | | 2023 | | | | | | | 2023 | | 2022 |
| | | (Millions) | | | | | (Millions) |
| Balance at beginning of year | Balance at beginning of year | $ | 12 | | | $ | 8 | |
| Revenue recognized in excess of amounts invoiced | Revenue recognized in excess of amounts invoiced | 184 | | | 145 | |
| Minimum volume commitments invoiced | Minimum volume commitments invoiced | (174) | | | (141) | |
| Balance at end of year | Balance at end of year | $ | 22 | | | $ | 12 | |
| | | | | | | | |
| The Williams Companies, Inc. |
| Notes to Consolidated Financial Statements – (Continued) |
|
Contract Liabilities
The following table presents a reconciliation of our contract liabilities:
| | | | | | | | | | | |
| Year Ended December 31, |
| 2021 | | 2020 |
| (Millions) |
| Balance at beginning of year | $ | 1,209 | | | $ | 1,215 | |
| Payments received and deferred | 116 | | | 140 | |
| Significant financing component | 10 | | | 11 | |
| Chesapeake global bankruptcy resolution | — | | | 67 | |
| Contract liability acquired | 1 | | | — | |
| Recognized in revenue | (210) | | | (224) | |
| Balance at end of year | $ | 1,126 | | | $ | 1,209 | |
| | | | | | | | | | | | | | | |
| | | Year Ended December 31, |
| | | | | 2023 | | 2022 |
| | | (Millions) |
| Balance at beginning of year | | | | | $ | 1,043 | | | $ | 1,126 | |
| Payments received and deferred | | | | | 190 | | | 180 | |
| Significant financing component | | | | | 9 | | | 9 | |
| Contract liability acquired (disposed) – net | | | | | 115 | | | 2 | |
| Recognized in revenue | | | | | (276) | | | (274) | |
| Balance at end of year | | | | | $ | 1,081 | | | $ | 1,043 | |
Remaining Performance Obligations
Remaining performance obligations primarily include reservation charges on contracted capacity for our gas pipeline firm transportation contracts with customers, storage capacity contracts, long-term contracts containing minimum volume commitmentsMVC associated with our midstream businesses, and fixed payments associated with offshore production handling. For our interstate natural gas pipeline businesses, remaining performance obligations reflect the rates for such services in our current FERC tariffs for the life of the related contracts; however, these rates may change based on future tariffs approved by the FERC and the amount and timing of these changes are not currently known.
Our remaining performance obligations exclude variable consideration, including contracts with variable consideration for which we have elected the practical expedient for consideration recognized in revenue as billed. Certain of our contracts contain evergreen and other renewal provisions for periods beyond the initial term of the contract. The remaining performance obligation amounts as of December 31, 2021,2023, do not consider potential future performance obligations for which the renewal has not been exercised and exclude contracts with customers for which the underlying facilities have not received FERC authorization to be placed into service. Consideration received prior to December 31, 2021,2023, that will be recognized in future periods is also excluded from our remaining performance obligations and is instead reflected in contract liabilities.
The following table presents the amount of the contract liabilities balance expected to be recognized as revenue when performance obligations are satisfied and the transaction price allocated to the remaining performance obligations under certain contracts as of December 31, 2021.2023.
| | Contract Liabilities | | Remaining Performance Obligations |
| (Millions) |
| 2022 (one year) | $ | 138 | | | $ | 3,624 | |
| 2023 (one year) | 117 | | | 3,366 | |
| Contract Liabilities | | | Contract Liabilities | | Remaining Performance Obligations |
| (Millions) | | | (Millions) |
| 2024 (one year) | 2024 (one year) | 116 | | | 3,162 | |
| 2025 (one year) | 2025 (one year) | 111 | | | 2,520 | |
| 2026 (one year) | 2026 (one year) | 107 | | | 2,427 | |
| Thereafter 00 | 537 | | | 17,380 | |
| 2027 (one year) | |
| 2028 (one year) | |
| Thereafter | |
| Total | Total | $ | 1,126 | | | $ | 32,479 | |
| | | | | | | | |
| The Williams Companies, Inc. |
| Notes to Consolidated Financial Statements – (Continued) |
|
Note 5 – Other Income and Expenses
The following table presents by segment, certain items within Operating and maintenance expenses and Selling, general, and administrative expenses in the Consolidated Statement of Income:
| | | | | | | | | | | | | | | | | | | | | | | |
| Transmission & Gulf of Mexico | | Northeast G&P | | West | | Other |
| (Millions) |
| | | | | | | |
| | | | | | | |
| 2020 | | | | | | | |
| Income related to benefit policy change | $ | (22) | | | $ | (9) | | | $ | (9) | | | $ | — | |
| 2019 | | | | | | | |
| Severance and related costs | 39 | | | 7 | | | 10 | | | 1 | |
Additional Items
Other income (expense) – net below Operating income (loss) includes $17 million, $15 million, and $32 million of income for equity AFUDC within the Transmission & Gulf of Mexico segment for the years ended December 31, 2021, 2020, and 2019, respectively. Other income (expense) – net below Operating income (loss) also includes $4 million and $9 million of income for the years ended December 31, 2021 and 2019, respectively, and $(13) million of loss for the year ended December 31, 2020, associated with regulatory assets related to the effects of deferred taxes on equity funds used during construction primarily within the Other segment.
Note 6 – Provision (Benefit) for Income Taxes
The Provision (benefit) for income taxes from continuing operations includes:
| | Year Ended December 31, |
| 2021 | | 2020 | | 2019 |
| (Millions) |
| Year Ended December 31, | | | Year Ended December 31, |
| 2023 | | | 2023 | | 2022 | | 2021 |
| (Millions) | | | (Millions) |
| Current: | Current: | |
| Federal | Federal | $ | (1) | | | $ | (29) | | | $ | (41) | |
| State | 3 | | | — | | | (5) | |
| Foreign | — | | | — | | | 2 | |
| 2 | | | (29) | | | (44) | |
| Deferred: | |
| Federal | |
| Federal | Federal | 421 | | | 98 | | | 280 | |
| State | State | 88 | | | 10 | | | 99 | |
| | 24 | |
| 24 | |
| 24 | |
| Deferred: | |
| Federal | |
| Federal | |
| Federal | |
| State | |
| | 509 | | | 108 | | | 379 | |
| 981 | |
| 981 | |
| 981 | |
| Provision (benefit) for income taxes | Provision (benefit) for income taxes | $ | 511 | | | $ | 79 | | | $ | 335 | |
Reconciliations from the Provision (benefit) at statutory rate from continuing operations to recorded Provision (benefit) for income taxes are as follows:
| | | | | | | | | | | | | | | | | |
| | Year Ended December 31, |
| | 2021 | | 2020 | | 2019 |
| | (Millions) |
| Provision (benefit) at statutory rate | $ | 435 | | | $ | 58 | | | $ | 224 | |
| Increases (decreases) in taxes resulting from: | | | | | |
| Impact of nontaxable noncontrolling interests | (9) | | | 3 | | | 29 | |
| State income taxes (net of federal benefit) | 71 | | | 6 | | | 74 | |
| Federal valuation allowance | 3 | | | 1 | | | 3 | |
| Other – net | 11 | | | 11 | | | 5 | |
| Provision (benefit) for income taxes | $ | 511 | | | $ | 79 | | | $ | 335 | |
| | | | | | | | | | | | | | | | | |
| | Year Ended December 31, |
| | 2023 | | 2022 | | 2021 |
| | (Millions) |
| Provision (benefit) at statutory rate | $ | 925 | | | $ | 534 | | | $ | 435 | |
| Increases (decreases) in taxes resulting from: | | | | | |
| State income taxes (net of federal benefit) | 129 | | | 113 | | | 71 | |
| State deferred income tax rate change | (25) | | | (92) | | | — | |
| Federal valuation allowance | — | | | (70) | | | 3 | |
| Federal settlements | — | | | (45) | | | — | |
| Impact of nontaxable noncontrolling interests | (26) | | | (14) | | | (9) | |
| Other – net | 2 | | | (1) | | | 11 | |
| Provision (benefit) for income taxes | $ | 1,005 | | | $ | 425 | | | $ | 511 | |
| | | | | | | | |
The Williams Companies, Inc. |
Notes to Consolidated Financial Statements – (Continued) |
|
Income (loss) from continuing operations beforeState deferred income taxestax rate change includes $2 million, $1benefit of $25 million and $6$92 million in 2023 and 2022, respectively, is related to a decrease in our estimate of foreign lossthe deferred state income tax rate (net of federal effect) driven primarily by the enacted decline in 2021, 2020, and 2019, respectively.the Pennsylvania state income tax rate over the next several years.
During the course of audits of our business by domestic and foreign tax authorities, we frequently face challenges regarding the amount of taxes due. These challenges include questions regarding the timing and amount of deductions and the allocation of income among various tax jurisdictions. In evaluating the liability associated with our various filing positions, we apply the two-step process of recognition and measurement. In association with this liability, we record an estimate of related interest and tax exposure as a component of our tax provision. The impact of this accrual is included within Other – net in our reconciliation of the Provision (benefit) at statutory rate to recorded Provision (benefit) for income taxes.
| | | | | | | | |
| The Williams Companies, Inc. |
| Notes to Consolidated Financial Statements – (Continued) |
|
Significant components of Deferred income tax liabilities and Deferred income tax assetsare as follows:
| | | | December 31, | | December 31, |
| | | 2021 | | 2020 | | 2023 | | 2022 |
| | (Millions) |
| Deferred income tax liabilities: | |
| (Millions) | | | (Millions) |
| Gross deferred income tax liabilities: | |
| Property, plant and equipment | |
| Property, plant and equipment | |
| Property, plant and equipment | Property, plant and equipment | $ | 2,777 | | | $ | 2,320 | |
| Investments | Investments | 1,669 | | | 1,515 | |
| Other | Other | 154 | | | 140 | |
| Total deferred income tax liabilities | 4,600 | | | 3,975 | |
| Deferred income tax assets: | | | |
| Total gross deferred income tax liabilities | |
| Gross deferred income tax assets: | |
| Accrued liabilities | Accrued liabilities | 872 | | | 747 | |
| Foreign tax credit | 140 | | | 140 | |
| Accrued liabilities | |
| Accrued liabilities | |
| Foreign tax credits | |
| Federal loss carryovers | Federal loss carryovers | 879 | | | 905 | |
| State losses and credits | State losses and credits | 421 | | | 445 | |
| Other | Other | 132 | | | 140 | |
| Total deferred income tax assets | 2,444 | | | 2,377 | |
| Total gross deferred income tax assets | |
| Less valuation allowance | Less valuation allowance | 297 | | | 325 | |
| Net deferred income tax assets | Net deferred income tax assets | 2,147 | | | 2,052 | |
| Overall net deferred income tax liabilities | $ | 2,453 | | | $ | 1,923 | |
| Deferred income tax liabilities | |
The valuation allowance at December 31, 20212023 and 20202022 serves to reduce the available deferred income tax assets to an amount that will, more likely than not, be realized. We considered all available positive and negative evidence, which incorporates available tax planning strategies, and management’s estimate of future reversals of existing taxable temporary differences, and have determined that a portion of our deferred income tax assets related to the Foreign tax creditcredits and State losses and credits may not be realized. In 2022, we released $70 million of valuation allowance upon determining we expect to utilize additional foreign tax credits prior to expiration between 2024 and 2025. The amounts presented in the table above are, with respect to state items, before any federal benefit. The change from prior year for the State losses and credits reflects increases in losses and credits generated in the current and prior years less losses and/or credits utilized in the current year. We have loss and credit carryovers in multiple state taxing jurisdictions. These attributes generally expire between 20222024 and 20402042 with some carryovers having indefinite carryforward periods.
Federal loss carryovers includeat December 31, 2023 reflect deferred tax assets on net operating loss carryovers of $879 million at the end of 2021 which havewith no expiration date.
Cash payments for income taxes (net of refunds) were $31 million and $13 million in 2023 and 2022, respectively. Cash refunds for income taxes (net of payments) were $45 million $40in 2021.
During the second quarter of 2022, we finalized settlements for 2011 through 2014 on certain contested matters with the Internal Revenue Service (IRS) that resulted in a 2022 year-to-date tax benefit of approximately $45 million and $86we received cash refunds totaling $7 million. During the fourth quarter of 2023, we closed the audit for 2018 and made a $5 million in 2021, 2020, and 2019, respectively.
As of December 31, 2021, we had approximately $52 million of unrecognized tax benefits. If recognized, income tax expense would be reduced by $51 million for 2021 and 2020, respectively, including the effect of these changes on other tax attributes, with state income tax amounts included net of federal tax effect. It is reasonably possible that the total amounts of unrecognized tax benefits will significantly decrease within 12 months by as much
| | | | | | | | |
The Williams Companies, Inc. |
Notes to Consolidated Financial Statements – (Continued) |
|
as $32 million due to the resolution of audits related to U.S. federal and state tax positions. If recognized, Provision (benefit) for income taxes would be reduced by $31 million, including the effect of these changes on other tax attributes, with state income tax amounts included net of federal tax effect. The remaining unrecognized tax positions, if recognized, would reduce Provision (benefit) for income taxes by $20 million in 2021 and 2020.payment.
We recognize related interest and penalties as a component of Provision (benefit) for income taxes. TotalNo significant interest and penalties were recognized as part of income tax provision were benefits of $1 million in each of 2021 and 2020, and expenses of $1 million for 2019. Approximately $4 million ofany period presented. There are no interest andor penalties primarily relating to uncertain tax positions have been accrued as of both December 31, 20212023 and 2020.December 31, 2022.
Consolidated U.S. Federal income tax returns are open to Internal Revenue Service (IRS)IRS examination for years after 2010, excluding 2015 through 2017, for which the statutes have expired. As of December 31, 2021, examinations of tax returns for 2011 through 2013 are currently in appeals, 2014 is being surveyed, and 2018 is currently under examination. The statute for 2018 is extended to September 30, 2023. We do not expect material changes in our financial position resulting from these examinations.2019. The statute of limitations for most states expires one year after expiration of the IRS statute. Generally, tax returns for our previously owned Canadian entities are closed. Tax years 2013 and 2014 were under income tax examination, but in September of 2021 we received “no change” letters for both years.
Note 7 – Earnings (Loss) Per Common Share from Continuing Operations
| | | | | | | | | | | | | | | | | |
| Year Ended December 31, |
| 2021 | | 2020 | | 2019 |
| (Dollars in millions, except per-share
amounts; shares in thousands) |
| Income (loss) from continuing operations available to common stockholders | $ | 1,514 | | | $ | 208 | | | $ | 862 | |
| Basic weighted-average shares | 1,215,221 | | | 1,213,631 | | | 1,212,037 | |
| Effect of dilutive securities: | | | | | |
| Nonvested restricted stock units | 2,973 | | | 1,531 | | | 1,811 | |
| Stock options | 21 | | | 3 | | | 163 | |
| Diluted weighted-average shares | 1,218,215 | | | 1,215,165 | | | 1,214,011 | |
| Earnings (loss) per common share from continuing operations: | | | | | |
| Basic | $ | 1.25 | | | $ | .17 | | | $ | .71 | |
| Diluted | $ | 1.24 | | | $ | .17 | | | $ | .71 | |
| | | | | | | | |
| The Williams Companies, Inc. |
| Notes to Consolidated Financial Statements – (Continued) |
|
Note 8 – Employee Benefit PlansInvesting Activities
Pension PlansInvestments
We have noncontributory defined benefit pension plans for eligible employees hired prior | | | | | | | | | | | | | | | | | |
| | Ownership Interest at December 31, 2023 | | December 31, |
| | | 2023 | | 2022 |
| | | | (Millions) |
| Equity method: | | | | | |
| Appalachia Midstream Investments | (1) | | $ | 2,886 | | | $ | 2,975 | |
| Blue Racer | 50% | | 398 | | | 383 | |
| OPPL | 50% | | 387 | | | 386 | |
| Discovery | 60% | | 361 | | | 345 | |
| Gulfstream | 50% | | 210 | | | 220 | |
| Laurel Mountain | 69% | | 184 | | | 205 | |
| RMM (2) | 100% | | — | | | 395 | |
| Other | Various | | 188 | | | 139 | |
| | | 4,614 | | | 5,048 | |
| Other | | | 23 | | | 17 | |
| | | $ | 4,637 | | | $ | 5,065 | |
___________
(1)Includes equity-method investments in multiple gathering systems in the Marcellus Shale region with an approximate average 66 percent interest.
(2)RMM is a wholly owned subsidiary as of November 30, 2023. See Note 3 – Acquisitions and Divestitures.
Basis differential
The carrying value of our Appalachia Midstream Investments exceeds our portion of the underlying net assets by approximately $1.1 billion at December 31, 2023 and 2022. These differences were assigned at the acquisition date to January 1, 2019. Eligible employees earn compensation credits based on a cash balance formula. Asproperty, plant, and equipment and customer relationship intangible assets. Certain of January 1, 2020, certain active employees are no longer eligible to receive compensation credits.
Other Postretirement Benefits
We provide subsidized retiree medical benefits to a closed group of participants as well as retiree life insurance benefits to eligible participants. Medical benefits for Medicare eligible participants are paid through contributions to health reimbursement accounts. Benefits for allour other participants are provided through a self-insured medical plan, which includes participant contributions and contains other cost-sharing features such as deductibles, co-payments, and co-insurance.
Defined Contribution Plan
Weequity-method investments have a defined contribution plan for the benefit of substantially all employees. Plan participants may contribute acarrying value less than our portion of their compensation on a pre-tax or after-tax basis. Generally,the underlying equity in the net assets primarily due to other than temporary impairments that we match employee contributions uphave recognized but that were not required to 6 percentbe recognized in the investees’ financial statements. These differences total approximately $773 million and $1.1 billion at December 31, 2023 and 2022, respectively, and were assigned to property, plant, and equipment and customer relationship intangible assets. Differences in the carrying value of eligible compensation. Additionally, eligible active employees that do not receive compensation credits underour equity-method investments and our portion of the defined benefit pension planequity in the underlying net assets are eligible for an additional annual fixed-percentage contribution made by us togenerally amortized over the defined contribution plan. Our contributions charged to expense were $45 millionremaining useful lives of the associated underlying assets and included in 2021, $42 million in 2020, and $36 million in 2019.Equity earnings (losses) within our Consolidated Statement of Income.
| | | | | | | | |
| The Williams Companies, Inc. |
| Notes to Consolidated Financial Statements – (Continued) |
|
Funded StatusPurchases of and contributions to equity-method investments
We generally fund our portion of significant expansion or development projects of these investees through additional capital contributions. These transactions increased the carrying value of our investments and included: | | | | | | | | | | | | | | | | | |
| Year Ended December 31, |
| | 2023 | | 2022 | | 2021 |
| | (Millions) |
| Appalachia Midstream Investments | $ | 59 | | | $ | 83 | | | $ | 84 | |
| Discovery | 40 | | | 41 | | | — | |
| Aux Sable Liquid Products LP | 38 | | | — | | | — | |
| Cardinal Pipeline Company, LLC | — | | | 16 | | | — | |
| Gulfstream | — | | | 14 | | | 26 | |
| | | | | |
| | | | | |
| | | | | |
| | | | | |
| Other | 4 | | | 12 | | | 5 | |
| $ | 141 | | | $ | 166 | | | $ | 115 | |
Other investing income (loss) – net
The following table presents certain items reflected in Other investing income (loss) – net in our Consolidated Statement of Income:
| | | | | | | | | | | | | | | | | |
| Year Ended December 31, |
| 2023 | | 2022 | | 2021 |
| | | (Millions) | | |
| Interest income | $ | 79 | | | $ | 15 | | | $ | 7 | |
| Gain on remeasurement of RMM investment (Note 3) | 30 | | | — | | | — | |
| Other | (1) | | | 1 | | | — | |
| Other investing income (loss) – net | $ | 108 | | | $ | 16 | | | $ | 7 | |
Dividends and distributions
The organizational documents of entities in which we have an equity-method investment generally require distribution of available cash to members on at least a quarterly basis. These transactions reduced the changes in benefit obligationscarrying value of our investments and plan assets for pension benefits and other postretirement benefits for the years indicated:included:
| | | | | | | | | | | | | | | | | | | | | | | |
| | Pension Benefits | | Other
Postretirement
Benefits |
| | 2021 | | 2020 | | 2021 | | 2020 |
| | (Millions) |
| Change in benefit obligation: | | | | | | | |
| Benefit obligation at beginning of year | $ | 1,183 | | | $ | 1,237 | | | $ | 220 | | | $ | 215 | |
| Service cost | 30 | | | 31 | | | 1 | | | 1 | |
| Interest cost | 28 | | | 36 | | | 5 | | | 7 | |
| Plan participants’ contributions | — | | | — | | | 2 | | | 2 | |
| Benefits paid | (83) | | | (41) | | | (14) | | | (14) | |
| Net actuarial loss (gain) (1) | (21) | | | 47 | | | (14) | | | 9 | |
| Settlements | (4) | | | (127) | | | — | | | — | |
| Net increase (decrease) in benefit obligation | (50) | | | (54) | | | (20) | | | 5 | |
| Benefit obligation at end of year | 1,133 | | | 1,183 | | | 200 | | | 220 | |
| Change in plan assets: | | | | | | | |
| Fair value of plan assets at beginning of year | 1,357 | | | 1,299 | | | 278 | | | 247 | |
| Actual return on plan assets | 62 | | | 212 | | | 16 | | | 37 | |
| Employer contributions | 4 | | | 14 | | | 5 | | | 6 | |
| Plan participants’ contributions | — | | | — | | | 2 | | | 2 | |
| Benefits paid | (83) | | | (41) | | | (14) | | | (14) | |
| Settlements | (4) | | | (127) | | | — | | | — | |
| Net increase (decrease) in fair value of plan assets | (21) | | | 58 | | | 9 | | | 31 | |
| Fair value of plan assets at end of year | 1,336 | | | 1,357 | | | 287 | | | 278 | |
| Funded status — overfunded (underfunded) | $ | 203 | | | $ | 174 | | | $ | 87 | | | $ | 58 | |
| Amounts recognized in the Consolidated Balance Sheet: | | | | | | | |
| Noncurrent assets | $ | 229 | | | $ | 203 | | | $ | 91 | | | $ | 64 | |
| Current liabilities | (3) | | | (3) | | | (4) | | | (6) | |
| Noncurrent liabilities | (23) | | | (26) | | | — | | | — | |
| Funded status — overfunded (underfunded) | $ | 203 | | | $ | 174 | | | $ | 87 | | | $ | 58 | |
| | | | | | | |
| Accumulated benefit obligation | $ | 1,118 | | | $ | 1,167 | | | | | |
____________
(1) Amounts are due primarily to the following factors:
2021: pension benefits - discount rate assumptions, partially offset by experience-related items; other postretirement benefits - discount rate assumption and experience-related items.
2020: pension benefits - discount rate assumptions, partially offset by cash balance interest crediting rate assumptions; other postretirement benefits - discount rate assumptions, partially offset by other experience-related items.
| | | | | | | | | | | | | | | | | |
| Year Ended December 31, |
| 2023 | | 2022 | | 2021 |
| | (Millions) |
| Appalachia Midstream Investments | $ | 405 | | | $ | 415 | | | $ | 433 | |
| Gulfstream | 98 | | | 89 | | | 90 | |
| Blue Racer | 62 | | | 49 | | | 47 | |
| OPPL | 56 | | | 34 | | | 26 | |
| RMM | 49 | | | 52 | | | 45 | |
| Discovery | 49 | | | 49 | | | 44 | |
| Laurel Mountain | 42 | | | 112 | | | 33 | |
| Other | 35 | | | 65 | | | 39 | |
| $ | 796 | | | $ | 865 | | | $ | 757 | |
| | | | | | | | |
| The Williams Companies, Inc. |
| Notes to Consolidated Financial Statements – (Continued) |
|
The following table summarizes information for pension plans with obligations in excessSummarized Financial Position and Results of plan assets at December 31.Operations of All Equity-Method Investments
| | | | | | | | | | | |
| | 2021 | | 2020 |
| | (Millions) |
| Projected benefit obligation | $ | 26 | | | $ | 29 | |
| Accumulated benefit obligation | 22 | | | 25 | |
| Fair value of plan assets | — | | | — | |
| | | | | | | | | | | |
| | December 31, |
| | 2023 | | 2022 |
| | (Millions) |
| Assets (liabilities): | | | |
| Current assets | $ | 669 | | | $ | 964 | |
| Noncurrent assets | 11,058 | | | 12,701 | |
| Current liabilities | (358) | | | (632) | |
| Noncurrent liabilities | (3,619) | | | (3,789) | |
Pre-tax amounts recognized in Accumulated other comprehensive income (loss) at December 31 are as follows: | | | | | | | | | | | | | | | | | |
| | Year Ended December 31, |
| | 2023 | | 2022 | | 2021 |
| | (Millions) |
| Gross revenue | $ | 3,714 | | | $ | 5,520 | | | $ | 4,688 | |
| Operating income | 966 | | | 1,268 | | | 1,191 | |
| Net income | 748 | | | 1,102 | | | 1,006 | |
| | | | | | | | | | | | | | | | | | | | | | | |
| | Pension Benefits | | Other
Postretirement
Benefits |
| | 2021 | | 2020 | | 2021 | | 2020 |
| | (Millions) |
| Net actuarial gain (loss) | $ | (46) | | | $ | (101) | | | $ | 4 | | | $ | (25) | |
Additionally, as of December 31, 2021 and 2020, we have $150 million and $171 million, respectively, of pension and other postretirement plan amounts included in regulatory liabilities associated with our gas pipeline companies.
Net Periodic Benefit Cost (Credit)
Net periodic benefit cost (credit) for the years ended December 31 consist of the following:
| | | | | | | | | | | | | | | | | | | | | | | | | | | | | | | | | | | |
| | Pension Benefits | | Other
Postretirement Benefits |
| | 2021 | | 2020 | | 2019 | | 2021 | | 2020 | | 2019 |
| | (Millions) |
| Components of net periodic benefit cost (credit): | | | | | | | | | | | |
| Service cost | $ | 30 | | | $ | 31 | | | $ | 45 | | | $ | 1 | | | $ | 1 | | | $ | 1 | |
| Interest cost | 28 | | | 36 | | | 50 | | | 5 | | | 7 | | | 8 | |
| Expected return on plan assets | (43) | | | (53) | | | (61) | | | (10) | | | (11) | | | (10) | |
| Amortization of net actuarial loss | 14 | | | 21 | | | 15 | | | — | | | — | | | — | |
| Net actuarial loss from settlements | 1 | | | 9 | | | 1 | | | — | | | — | | | — | |
| Reclassification to regulatory liability | — | | | — | | | — | | | 2 | | | 2 | | | 1 | |
| Net periodic benefit cost (credit) (1) | $ | 30 | | | $ | 44 | | | $ | 50 | | | $ | (2) | | | $ | (1) | | | $ | — | |
____________
(1) Components other than Service cost are included in Other income (expense) – net below Operating income (loss) in the Consolidated Statement of Income.
| | | | | | | | |
| The Williams Companies, Inc. |
| Notes to Consolidated Financial Statements – (Continued) |
|
Items Recognized in Other Comprehensive Income (Loss)
Other changes in plan assets and benefit obligations recognized in Other comprehensive income (loss) before taxes for the years ended December 31 consist of the following:
| | | | | | | | | | | | | | | | | | | | | | | | | | | | | | | | | | | |
| | Pension Benefits | | Other
Postretirement Benefits |
| | 2021 | | 2020 | | 2019 | | 2021 | | 2020 | | 2019 |
| | (Millions) |
| Net actuarial gain (loss) arising during the year | $ | 40 | | | $ | 112 | | | $ | 88 | | | $ | 29 | | | $ | (4) | | | $ | (9) | |
| Amortization of net actuarial loss | 14 | | | 21 | | | 15 | | | — | | | — | | | — | |
| Net actuarial loss from settlements | 1 | | | 9 | | | 1 | | | — | | | — | | | — | |
Total recognized in Other comprehensive income (loss) | $ | 55 | | | $ | 142 | | | $ | 104 | | | $ | 29 | | | $ | (4) | | | $ | (9) | |
Key Assumptions
The weighted-average assumptions utilized to determine benefit obligations and Net periodic benefit cost (credit) as of December 31 are as follows:
| | | | | | | | | | | | | | | | | | | | | | | | | | | | | | | | | | | |
| | Pension Benefits | | Other
Postretirement Benefits |
| | 2021 | | 2020 | | 2019 | | 2021 | | 2020 | | 2019 |
| Benefit obligations: | | | | | | | | | | | |
| Discount rate | 2.82 | % | | 2.45 | % | | 3.19 | % | | 2.93 | % | | 2.59 | % | | 3.27 | % |
| Rate of compensation increase | 3.67 | | | 3.76 | | | 3.68 | | | N/A | | N/A | | N/A |
| Cash balance interest crediting rate | 3.00 | | | 3.00 | | | 3.50 | | | N/A | | N/A | | N/A |
| Net periodic benefit cost (credit): | | | | | | | | | | | |
| Discount rate | 2.45 | % | | 3.08 | % | | 4.33 | % | | 2.59 | % | | 3.27 | % | | 4.39 | % |
| Expected long-term rate of return on plan assets | 3.69 | | | 4.67 | | | 5.26 | | | 3.61 | | | 4.39 | | | 5.01 | |
| Rate of compensation increase | 3.76 | | | 3.68 | | | 4.83 | | | N/A | | N/A | | N/A |
| Cash balance interest crediting rate | 3.00 | | | 3.50 | | | 4.25 | | | N/A | | N/A | | N/A |
We use mortality tables issued by the Society of Actuaries to measure the benefit obligations.
The assumed health care cost trend rate for 2022 is 6.9 percent. This rate decreases to 4.5 percent by 2028.
Plan Assets
The plans’ investment objectives include a framework to manage the volatility of the plans’ funded status and minimize future cash contributions. The plans follow a policy of diversifying the investments across various asset classes, strategies, and investment managers.
The investment policy for the pension plans includes target asset allocation percentages as well as permitted and prohibited investments designed to mitigate risks associated with investing. The December 31, 2021, target asset allocation was 25 percent equity securities and 75 percent fixed income securities, including investments in equity and fixed income mutual funds, commingled investment funds, and separate accounts.
| | | | | | | | |
The Williams Companies, Inc. |
Notes to Consolidated Financial Statements – (Continued) |
|
The fair values of our pension and other postretirement benefits plan assets by asset class at December 31 are as follows:
| | | | | | | | | | | | | | | | | | | | | | | | | | | | | | | | | | | |
| | 2021 |
| Pension Benefits | | Other Postretirement Benefits |
| Level 1 (1) | | Level 2 (2) | | Total | | Level 1 (1) | | Level 2 (2) | | Total |
| | (Millions) |
| Cash management funds | $ | 37 | | | $ | — | | | $ | 37 | | | $ | 14 | | | $ | — | | | $ | 14 | |
| Equity securities | 42 | | | 19 | | | 61 | | | 39 | | | 10 | | | 49 | |
| Government debt securities | 99 | | | 28 | | | 127 | | | 13 | | | 4 | | | 17 | |
| Corporate debt securities | — | | | 350 | | | 350 | | | — | | | 47 | | | 47 | |
| Mutual fund - Municipal bonds | — | | | — | | | — | | | 59 | | | — | | | 59 | |
| Other | (3) | | | 2 | | | (1) | | | (1) | | | — | | | (1) | |
| $ | 175 | | | $ | 399 | | | 574 | | | $ | 124 | | | $ | 61 | | | 185 | |
| Commingled investment funds (3): | | | | | | | | | | | |
| Equities | | | | | 288 | | | | | | | 39 | |
| Fixed income | | | | | 474 | | | | | | | 63 | |
| Total assets at fair value | | | | | $ | 1,336 | | | | | | | $ | 287 | |
| | | | | | | | | | | | | | | | | | | | | | | | | | | | | | | | | | | |
| | 2020 |
| Pension Benefits | | Other Postretirement Benefits |
| | Level 1 (1) | | Level 2 (2) | | Total | | Level 1 (1) | | Level 2 (2) | | Total |
| | (Millions) |
| Cash management funds | $ | 21 | | | $ | — | | | $ | 21 | | | $ | 12 | | | $ | — | | | $ | 12 | |
| Equity securities | 39 | | | 22 | | | 61 | | | 38 | | | 10 | | | 48 | |
| Government debt securities | 110 | | | 32 | | | 142 | | | 14 | | | 4 | | | 18 | |
| Corporate debt securities | — | | | 361 | | | 361 | | | — | | | 48 | | | 48 | |
| Mutual fund - Municipal bonds | — | | | — | | | — | | | 52 | | | — | | | 52 | |
| Other | — | | | 4 | | | 4 | | | — | | | — | | | — | |
| $ | 170 | | | $ | 419 | | | 589 | | | $ | 116 | | | $ | 62 | | | 178 | |
| Commingled investment funds (3): | | | | | | | | | | | |
| Equities | | | | | 288 | | | | | | | 38 | |
| Fixed income | | | | | 480 | | | | | | | 62 | |
| Total assets at fair value | | | | | $ | 1,357 | | | | | | | $ | 278 | |
____________
(1) Level 1 includes assets with fair values based on quoted prices in active markets for identical assets. Cash management funds, equity securities traded on U.S. exchanges, U.S. Treasury securities, and mutual funds are included in this level.
(2) Level 2 includes assets with fair values determined by using significant other observable inputs. This level includes equity securities traded on active foreign exchanges and fixed income securities, other than U.S. Treasury securities, that are valued primarily using pricing models which incorporate observable inputs such as benchmark yields, reported trades, broker/dealer quotes, and issuer spreads.
(3) The commingled investment funds are measured at fair value using net asset value (NAV) per share. Certain standard withdrawal restrictions generally apply, which may include redemption notification period restrictions ranging from 1 day to 15 days.
| | | | | | | | |
The Williams Companies, Inc. |
Notes to Consolidated Financial Statements – (Continued) |
|
Plan Benefit Payments and Employer Contributions
Following are the expected benefit payments, which reflect the same assumptions previously discussed and future service as appropriate.
| | | | | | | | | | | |
| Pension
Benefits | | Other
Postretirement
Benefits |
| | (Millions) |
| 2022 | $ | 86 | | | $ | 14 | |
| 2023 | 82 | | | 13 | |
| 2024 | 81 | | | 13 | |
| 2025 | 81 | | | 12 | |
| 2026 | 78 | | | 12 | |
| 2027-2031 | 378 | | | 53 | |
In 2022, we expect to contribute approximately $2 million to our pension plans and approximately $4 million to our other postretirement benefit plan.
Note 97 – Investing ActivitiesEmployee Benefit Plans
InvestmentsPension Plans
| | | | | | | | | | | | | | | | | |
| | Ownership Interest at December 31, 2021 | | December 31, |
| | | 2021 | | 2020 |
| | | | (Millions) |
| Equity method: | | | | | |
| Appalachia Midstream Investments | (1) | | $ | 3,056 | | | $ | 3,087 | |
| RMM | 50% | | 401 | | | 421 | |
| OPPL | 50% | | 388 | | | 395 | |
| Blue Racer | 50% | | 377 | | | 357 | |
| Discovery | 60% | | 328 | | | 352 | |
| Laurel Mountain | 69% | | 226 | | | 219 | |
| Gulfstream | 50% | | 215 | | | 204 | |
| Other | Various | | 130 | | | 124 | |
| | | 5,121 | | | 5,159 | |
| Other | | | 6 | | | — | |
| | | $ | 5,127 | | | $ | 5,159 | |
___________Other Postretirement Benefits
(1)Includes equity-method investments in multiple gathering systems inWe provide subsidized retiree medical benefits to a closed group of participants as well as retiree life insurance benefits to eligible participants. Medical benefits for Medicare eligible participants are paid through contributions to health reimbursement accounts. Benefits for all other participants are provided through a self-insured medical plan, which includes participant contributions and contains other cost-sharing features such as deductibles, co-payments, and co-insurance.
Defined Contribution Plan
We have a defined contribution plan for the Marcellus Shale with an approximate average 66 percent interest.
Basis differential
The carrying valuebenefit of our Appalachia Midstream Investments exceeds oursubstantially all employees. Plan participants may contribute a portion of their compensation on a pre-tax or after-tax basis. Generally, we match employee contributions up to 6 percent of eligible compensation. Additionally, eligible active employees that do not receive compensation credits under the underlying net assetsdefined benefit pension plan are eligible for an additional annual fixed-percentage contribution made by approximately $1.2 billion at December 31, 2021us to the defined contribution plan. Our contributions charged to expense were $60 million in 2023, $53 million in 2022, and 2020. These differences were assigned at the acquisition date to property, plant, and equipment and customer relationship intangible assets. Certain of our other equity-method investments have a carrying value less than our portion of the underlying net assets primarily due to other than temporary impairments that we have recognized but that were not required to be recognized$45 million in the investees’ financial statements. These differences total approximately $1.2 billion and $1.3 billion at December 31, 2021 and 2020, respectively, and were assigned to property, plant, and equipment and customer relationship intangible assets. Differences in the carrying value of our equity-method investments and our portion of the underlying net assets are2021.
| | | | | | | | |
| The Williams Companies, Inc. |
| Notes to Consolidated Financial Statements – (Continued) |
|
generally amortized overFunded Status
The following table presents the remaining useful lives ofchanges in benefit obligations and plan assets for pension benefits and other postretirement benefits for the associated underlying assets and included in Equity earnings (losses) within the Consolidated Statement of Income.years indicated:
Acquisition of additional interests in BRMH | | | | | | | | | | | | | | | | | | | | | | | |
| | Pension Benefits | | Other
Postretirement Benefits |
| | 2023 | | 2022 | | 2023 | | 2022 |
| | (Millions) |
| Change in benefit obligation: | | | | | | | |
| Benefit obligation at beginning of year | $ | 940 | | | $ | 1,133 | | | $ | 152 | | | $ | 200 | |
| Service cost | 23 | | | 28 | | | 1 | | | 1 | |
| Interest cost | 46 | | | 31 | | | 7 | | | 6 | |
| Plan participants’ contributions | — | | | — | | | 2 | | | 2 | |
| Benefits paid | (71) | | | (78) | | | (13) | | | (12) | |
| Net actuarial loss (gain) (1) | 68 | | | (162) | | | (4) | | | (45) | |
| Settlements | — | | | (12) | | | — | | | — | |
| Net increase (decrease) in benefit obligation | 66 | | | (193) | | | (7) | | | (48) | |
| Benefit obligation at end of year | 1,006 | | | 940 | | | 145 | | | 152 | |
| Change in plan assets: | | | | | | | |
| Fair value of plan assets at beginning of year | 1,117 | | | 1,336 | | | 253 | | | 287 | |
| Actual return on plan assets | 120 | | | (132) | | | 17 | | | (27) | |
| Employer contributions | 1 | | | 3 | | | 3 | | | 3 | |
| Plan participants’ contributions | — | | | — | | | 2 | | | 2 | |
| Benefits paid | (71) | | | (78) | | | (13) | | | (12) | |
| Settlements | — | | | (12) | | | — | | | — | |
| Net increase (decrease) in fair value of plan assets | 50 | | | (219) | | | 9 | | | (34) | |
| Fair value of plan assets at end of year | 1,167 | | | 1,117 | | | 262 | | | 253 | |
| Funded status — overfunded (underfunded) | $ | 161 | | | $ | 177 | | | $ | 117 | | | $ | 101 | |
| Amounts recognized in the Consolidated Balance Sheet: | | | | | | | |
| Noncurrent assets | $ | 187 | | | $ | 201 | | | $ | 120 | | | $ | 105 | |
| Current liabilities | (4) | | | (2) | | | (3) | | | (4) | |
| Noncurrent liabilities | (22) | | | (22) | | | — | | | — | |
| Funded status — overfunded (underfunded) | $ | 161 | | | $ | 177 | | | $ | 117 | | | $ | 101 | |
| | | | | | | |
| Accumulated benefit obligation | $ | 998 | | | $ | 930 | | | | | |
As of December 31, 2019, we effectively owned a 29 percent indirect interest in Blue Racer through our 58 percent interest in BRMH, whose primary asset is a 50 percent interest in Blue Racer. In November 2020, we paid $157 million, net of cash acquired,____________
(1) 2023 amounts are due primarily to acquire an additional 41 percent ownership interest in BRMH before acquiring the remaining interest of BRMH in September 2021. As such, we control and consolidate BRMH, reporting the 50 percent interest in Blue Racer as an equity-method investment. Since substantially all of the fair value of the BRMH assets acquired is concentrated in a single asset, the investment in Blue Racer, and we previously held a noncontrolling interest in BRMH, we recorded the November 2020 and September 2021 additional purchases of interests as asset acquisitions.
Purchases of and contributions to equity-method investments
We generally fund our portion of significant expansion or development projects of these investees through additional capital contributions. These transactions increased the carrying value of our investments and included:
| | | | | | | | | | | | | | | | | |
| Year Ended December 31, |
| | 2021 | | 2020 | | 2019 |
| | (Millions) |
| Appalachia Midstream Investments | $ | 84 | | | $ | 116 | | | $ | 140 | |
| Gulfstream | 26 | | | 3 | | | 3 | |
| Blue Racer (1) | 3 | | | 157 | | | 28 | |
| Laurel Mountain | 2 | | | 5 | | | 36 | |
| Targa Train 7 | — | | | 6 | | | 43 | |
| RMM | — | | | — | | | 145 | |
| | | | | |
| Brazos Permian II | — | | | — | | | 18 | |
| | | | | |
| Other | — | | | 38 | | | 40 | |
| $ | 115 | | | $ | 325 | | | $ | 453 | |
___________
(1)See previous discussionchanges in the section Acquisition of additional interestsfollowing factors: Pension Benefits - interest crediting rate assumption and discount rate assumptions. 2022 amounts are due primarily to changes in BRMHthe following factors: Pension Benefits - discount rate assumptions, partially offset by interest crediting rate assumption; Other Postretirement Benefits - discount rate assumption.
above.
Dividends and distributions
The organizational documents of entities in which we have an equity-method investment generally require distribution of available cash to members on at least a quarterly basis. These transactions reduced the carrying value of our investments and included:
| | | | | | | | | | | | | | | | | |
| Year Ended December 31, |
| 2021 | | 2020 | | 2019 |
| | (Millions) |
| Appalachia Midstream Investments | $ | 433 | | | $ | 357 | | | $ | 293 | |
| Gulfstream | 90 | | | 93 | | | 86 | |
| Blue Racer (1) | 47 | | | 47 | | | 42 | |
| RMM | 45 | | | 39 | | | 38 | |
| Discovery | 44 | | | 21 | | | 41 | |
| Laurel Mountain | 33 | | | 31 | | | 30 | |
| OPPL | 26 | | | 50 | | | 77 | |
| | | | | |
| Other | 39 | | | 15 | | | 50 | |
| $ | 757 | | | $ | 653 | | | $ | 657 | |
___________
(1)See previous discussion inthe section Acquisition of additional interests in BRMH above.
| | | | | | | | |
| The Williams Companies, Inc. |
| Notes to Consolidated Financial Statements – (Continued) |
|
Equity Earnings (Losses)
Equity earnings (losses) in 2020 includes a $78 million loss associated with the first-quarter full impairment of goodwill recognized by our investee RMM, which was allocated entirely to our member interest per the terms of the membership agreement. Also included in 2020 are losses of $11 million, $26 million, and $10 million for our share of asset impairments at Laurel Mountain, Appalachia Midstream Investments, and Blue Racer, respectively.
Impairments of Equity-Method Investments
See Note 17 – Fair Value Measurements, Guarantees, and Concentration of Credit Risk for information regarding impairments of our equity-method investments of $1,046 million and $186 million for 2020 and 2019, respectively.
Other Investing Income (Loss) – Net
The following table presents certain items reflectedsummarizes information for pension plans with obligations in excess of plan assets at December 31.
| | | | | | | | | | | |
| | 2023 | | 2022 |
| | (Millions) |
| Projected benefit obligation | $ | 26 | | | $ | 24 | |
| Accumulated benefit obligation | 24 | | | 22 | |
| Fair value of plan assets | — | | | — | |
Pre-tax amounts recognized in Other investingAccumulated other comprehensive income (loss) – net in the Consolidated Statement of Income:at December 31 are as follows:
| | | | | | | | | | | | | | | | | |
| Year Ended December 31, |
| 2021 | | 2020 | | 2019 |
| (Millions) |
| | | | | |
| Gain (loss) on deconsolidation of businesses | $ | — | | | $ | — | | | $ | (29) | |
| Gain on disposition of Jackalope | — | | | — | | | 122 | |
| Other | 7 | | | 8 | | | 14 | |
Other investing income (loss) – net | $ | 7 | | | $ | 8 | | | $ | 107 | |
| | | | | | | | | | | | | | | | | | | | | | | |
| | Pension Benefits | | Other
Postretirement Benefits |
| | 2023 | | 2022 | | 2023 | | 2022 |
| | (Millions) |
| Net actuarial gain (loss) | $ | (45) | | | $ | (45) | | | $ | 19 | | | $ | 18 | |
Constitution deconsolidation
Upon determination that we were no longer the primary beneficiary, we deconsolidated our interest in Constitution Pipeline Company, LLC (Constitution)Additionally, as of December 31, 2019, recognizing a loss on deconsolidation2023 and 2022, we have $123 million and $130 million, respectively, of $27 million.pension and other postretirement plan amounts included in regulatory liabilities associated with our gas pipeline companies.
Gain on disposition
Net Periodic Benefit Cost (Credit)
Net periodic benefit cost (credit) for the years ended December 31 consist of Jackalopethe following:
In April 2019, we sold | | | | | | | | | | | | | | | | | | | | | | | | | | | | | | | | | | | |
| | Pension Benefits | | Other
Postretirement Benefits |
| | 2023 | | 2022 | | 2021 | | 2023 | | 2022 | | 2021 |
| | (Millions) |
| Components of net periodic benefit cost (credit): | | | | | | | | | | | |
| Service cost | $ | 23 | | | $ | 28 | | | $ | 30 | | | $ | 1 | | | $ | 1 | | | $ | 1 | |
| Interest cost | 46 | | | 31 | | | 28 | | | 7 | | | 6 | | | 5 | |
| Expected return on plan assets | (57) | | | (44) | | | (43) | | | (10) | | | (10) | | | (10) | |
| Amortization of net actuarial loss (gain) | 5 | | | 12 | | | 14 | | | (3) | | | — | | | — | |
| Net actuarial loss from settlements | — | | | 3 | | | 1 | | | — | | | — | | | — | |
| Reclassification to regulatory liability | — | | | — | | | — | | | — | | | 1 | | | 2 | |
| Net periodic benefit cost (credit) (1) | $ | 17 | | | $ | 30 | | | $ | 30 | | | $ | (5) | | | $ | (2) | | | $ | (2) | |
____________
(1) Components other than Service cost are included in Other income (expense) – net below Operating income (loss) in our 50 percent equity-method interest in Jackalope for $485 million in cash, resulting in a gain on the dispositionConsolidated Statement of $122 million.Income.
Summarized Financial Position and Results of Operations of All Equity-Method Investments
| | | | | | | | | | | |
| | December 31, |
| | 2021 | | 2020 |
| | (Millions) |
| Assets (liabilities): | | | |
| Current assets | $ | 743 | | | $ | 630 | |
| Noncurrent assets | 13,211 | | | 13,424 | |
| Current liabilities | (435) | | | (312) | |
| Noncurrent liabilities | (3,774) | | | (3,884) | |
| | | | | | | | |
| The Williams Companies, Inc. |
| Notes to Consolidated Financial Statements – (Continued) |
|
| | | | | | | | | | | | | | | | | |
| | Year Ended December 31, |
| | 2021 | | 2020 | | 2019 |
| | (Millions) |
| Gross revenue | $ | 4,688 | | | $ | 2,625 | | | $ | 2,490 | |
| Operating income | 1,191 | | | 508 | | | 685 | |
| Net income | 1,006 | | | 459 | | | 598 | |
Transactions with Equity-Method InvesteesItems Recognized in Other Comprehensive Income (Loss)
We have purchases from our equity-method investees includedOther changes in plan assets and benefit obligations recognized in Product costs Other comprehensive income (loss)in the Consolidated Statement of Income of $934 million, $348 million, and $304 million before taxes for the years ended 2021, 2020,December 31 consist of the following:
| | | | | | | | | | | | | | | | | | | | | | | | | | | | | | | | | | | |
| | Pension Benefits | | Other
Postretirement Benefits |
| | 2023 | | 2022 | | 2021 | | 2023 | | 2022 | | 2021 |
| | (Millions) |
| Net actuarial gain (loss) arising during the year | $ | (5) | | | $ | (14) | | | $ | 40 | | | $ | 3 | | | $ | 14 | | | $ | 29 | |
| Amortization of net actuarial loss (gain) | 5 | | | 12 | | | 14 | | | (2) | | | — | | | — | |
| Net actuarial loss from settlements | — | | | 3 | | | 1 | | | — | | | — | | | — | |
Total recognized in Other comprehensive income (loss) | $ | — | | | $ | 1 | | | $ | 55 | | | $ | 1 | | | $ | 14 | | | $ | 29 | |
Key Assumptions
The weighted-average assumptions utilized to determine benefit obligations and 2019, respectively. Net periodic benefit cost (credit) as of December 31 are as follows:
| | | | | | | | | | | | | | | | | | | | | | | | | | | | | | | | | | | |
| | Pension Benefits | | Other
Postretirement Benefits |
| | 2023 | | 2022 | | 2021 | | 2023 | | 2022 | | 2021 |
| Benefit obligations: | | | | | | | | | | | |
| Discount rate | 4.98 | % | | 5.16 | % | | 2.82 | % | | 5.01 | % | | 5.20 | % | | 2.93 | % |
| Rate of compensation increase | 3.52 | | | 3.58 | | | 3.67 | | | N/A | | N/A | | N/A |
| Cash balance interest crediting rate | 4.50 | | | 3.50 | | | 3.00 | | | N/A | | N/A | | N/A |
| Net periodic benefit cost (credit): | | | | | | | | | | | |
| Discount rate | 5.16 | % | | 2.84 | % | | 2.45 | % | | 5.20 | % | | 2.93 | % | | 2.59 | % |
| Expected long-term rate of return on plan assets | 5.17 | | | 3.81 | | | 3.69 | | | 4.04 | | | 3.67 | | | 3.61 | |
| Rate of compensation increase | 3.58 | | | 3.67 | | | 3.76 | | | N/A | | N/A | | N/A |
| Cash balance interest crediting rate | 3.50 | | | 3.00 | | | 3.00 | | | N/A | | N/A | | N/A |
We have $89 millionuse mortality tables issued by the Society of Actuaries to measure the benefit obligations.
The assumed health care cost trend rate for 2024 is 7.0 percent. This rate decreases to 4.5 percent by 2034.
Plan Assets
The plans’ investment objectives include a framework to manage the volatility of the plans’ funded status and $50 million includedminimize future cash contributions. The plans follow a policy of diversifying the investments across various asset classes, strategies, and investment managers.
The investment policy for the pension plans includes target asset allocation percentages as well as permitted and prohibited investments designed to mitigate risks associated with investing. The December 31, 2023, target asset allocation was 25 percent equity securities and 75 percent fixed income securities, including investments in equity and fixed income mutual funds, commingled investment funds, and separate accounts.
Accounts payable
in the Consolidated Balance Sheet
| | | | | | | | |
| The Williams Companies, Inc. |
| Notes to Consolidated Financial Statements – (Continued) |
|
withThe fair values of our equity-method investeespension and other postretirement benefits plan assets by asset class at December 31 2021are as follows:
| | | | | | | | | | | | | | | | | | | | | | | | | | | | | | | | | | | |
| | 2023 |
| Pension Benefits | | Other Postretirement Benefits |
| Level 1 (1) | | Level 2 (2) | | Total | | Level 1 (1) | | Level 2 (2) | | Total |
| | (Millions) |
| Cash management funds | $ | 17 | | | $ | — | | | $ | 17 | | | $ | 99 | | | $ | — | | | $ | 99 | |
| Government debt securities | 61 | | | 17 | | | 78 | | | 9 | | | 2 | | | 11 | |
| Corporate debt securities | — | | | 311 | | | 311 | | | — | | | 44 | | | 44 | |
| Other | 2 | | | 5 | | | 7 | | | 1 | | | — | | | 1 | |
| $ | 80 | | | $ | 333 | | | 413 | | | $ | 109 | | | $ | 46 | | | 155 | |
| Commingled investment funds (3): | | | | | | | | | | | |
| Equities | | | | | 287 | | | | | | | 41 | |
| Fixed income | | | | | 467 | | | | | | | 66 | |
| Total assets at fair value | | | | | $ | 1,167 | | | | | | | $ | 262 | |
| | | | | | | | | | | | | | | | | | | | | | | | | | | | | | | | | | | |
| | 2022 |
| Pension Benefits | | Other Postretirement Benefits |
| | Level 1 (1) | | Level 2 (2) | | Total | | Level 1 (1) | | Level 2 (2) | | Total |
| | (Millions) |
| Cash management funds | $ | 45 | | | $ | — | | | $ | 45 | | | $ | 105 | | | $ | — | | | $ | 105 | |
| Government debt securities | 58 | | | 18 | | | 76 | | | 8 | | | 3 | | | 11 | |
| Corporate debt securities | — | | | 284 | | | 284 | | | — | | | 39 | | | 39 | |
| Other | 1 | | | 4 | | | 5 | | | — | | | — | | | — | |
| $ | 104 | | | $ | 306 | | | 410 | | | $ | 113 | | | $ | 42 | | | 155 | |
| Commingled investment funds (3): | | | | | | | | | | | |
| Equities | | | | | 273 | | | | | | | 38 | |
| Fixed income | | | | | 434 | | | | | | | 60 | |
| Total assets at fair value | | | | | $ | 1,117 | | | | | | | $ | 253 | |
____________
(1) Level 1 includes assets with fair values based on quoted prices in active markets for identical assets. Cash management funds and 2020, respectively.U.S. Treasury securities are included in this level.
(2) Level 2 includes assets with fair values determined by using significant other observable inputs. This level includes fixed income securities, other than U.S. Treasury securities, that are valued primarily using pricing models which incorporate observable inputs such as benchmark yields, reported trades, broker/dealer quotes, and issuer spreads.
(3) The commingled investment funds are measured at fair value using net asset value per share. Certain standard withdrawal restrictions generally apply, which may include redemption notification period restrictions ranging from 1 day to 15 days.
We have operating agreements with certain equity-method investees. These operating agreements typically provide for reimbursement or payment
| | | | | | | | |
| The Williams Companies, Inc. |
| Notes to Consolidated Financial Statements – (Continued) |
|
Plan Benefit Payments and Employer Contributions
Following are the expected benefit payments, which reflect the same assumptions previously discussed and future service as appropriate.
| | | | | | | | | | | |
| Pension
Benefits | | Other
Postretirement
Benefits |
| | (Millions) |
| 2024 | $ | 95 | | | $ | 12 | |
| 2025 | 96 | | | 12 | |
| 2026 | 90 | | | 11 | |
| 2027 | 87 | | | 11 | |
| 2028 | 84 | | | 11 | |
| 2029-2033 | 397 | | | 49 | |
In 2024, we expect to us for certain direct operational payrollcontribute approximately $2 million to our pension plans and employeeapproximately $3 million to our other postretirement benefit costs, materials, supplies, and other charges and also for management services. The total charges to equity-method investees for these fees are $70 million, $79 million, and $103 million for the years ended 2021, 2020, and 2019, respectively.plan.
Note 109 – Property, Plant, and Equipment
The following table presents nonregulated and regulated Property, plant, and equipment – net as presented on thein our Consolidated Balance Sheet for the years ended:
| | Estimated
Useful Life (1)
(Years) | | Depreciation
Rates (1)
(%) | | December 31, |
| 2021 | | 2020 |
| Estimated
Useful Life (1)
(Years) | | | Estimated
Useful Life (1)
(Years) | | Depreciation
Rates (1)
(%) | | December 31, |
| 2023 | | 2022 |
| | | | | | | (Millions) | | | | | | (Millions) |
| Nonregulated: | Nonregulated: | |
| Natural gas gathering and processing facilities | |
| Natural gas gathering and processing facilities | |
| Natural gas gathering and processing facilities | Natural gas gathering and processing facilities | 5 - 40 | | $ | 18,203 | | | $ | 17,813 | |
| Construction in progress | Construction in progress | Not applicable | | 331 | | | 289 | |
| Oil and gas properties | Oil and gas properties | Units of production | | 572 | | | 98 | |
| Other | Other | 0 - 45 | | 2,649 | | | 2,560 | |
| Regulated: | Regulated: | |
| Natural gas transmission facilities | Natural gas transmission facilities | | 1.25 - 7.13 | | 19,201 | | | 18,688 | |
| Natural gas transmission facilities | |
| Natural gas transmission facilities | |
| Construction in progress | Construction in progress | Not applicable | | Not applicable | | 475 | | | 382 | |
| Other | Other | 5 - 45 | | 0.00 - 33.33 | | 2,753 | | | 2,659 | |
| Total property, plant, and equipment, at cost | Total property, plant, and equipment, at cost | | 44,184 | | | 42,489 | |
| Accumulated depreciation and amortization | Accumulated depreciation and amortization | | (14,926) | | | (13,560) | |
| Property, plant, and equipment — net | Property, plant, and equipment — net | | $ | 29,258 | | | $ | 28,929 | |
__________
(1) Estimated useful life and depreciation rates are presented as of December 31, 2021.2023. Depreciation rates and estimated useful lives for regulated assets are prescribed by the FERC.
Depreciation and amortization expense for Property, plant, and equipment – net was $1.660 billion, $1.498 billion, and $1.496 billion $1.393 billion,in 2023, 2022, and $1.390 billion2021, respectively.
Interest capitalized was $54 million, $20 million, and $11 million in 2023, 2022, and 2021, 2020, and 2019, respectively.
Regulated Property, plant, and equipment – net includes approximately $468$389 million and $507$428 million at December 31, 20212023 and 2020,2022, respectively, related to amounts in excess of the original cost of the regulated facilities within our gas pipeline businesses as a result of our prior acquisitions. This amount is being amortized over
| | | | | | | | |
The Williams Companies, Inc. |
Notes to Consolidated Financial Statements – (Continued) |
|
40 years using the straight-line amortization method. Current FERC policy does not permit recovery through rates for amounts in excess of original cost of construction.
| | | | | | | | |
| The Williams Companies, Inc. |
| Notes to Consolidated Financial Statements – (Continued) |
|
Asset Retirement Obligations
Our accrued obligations primarily relate to offshore platforms and pipelines, oil and gas properties, gas transmission pipelines and facilities, underground storage caverns, gas processing, fractionation, and compression facilities, and gas gathering well connections and pipelines, and underground storage caverns.pipelines. At the end of the useful life of each respective asset, we are legally obligated to dismantle offshore platforms and appropriately abandon offshore pipelines, to remove certain components of gas transmission facilities from the ground, to restore land and remove surface equipment at gas processing, fractionation, and compression facilities, to cap certain gathering pipelines at the wellhead connection and remove any related surface equipment, to plug storage caverns and remove any related surface equipment, and to plug producing wells and remove any related surface equipment.
The following table presents the significant changes to our ARO,AROs, of which $1.59$1.978 billion and $1.159$1.827 billion are included in Regulatory liabilities, deferred income, and other with the remaining current portion in Accrued and other current liabilities at December 31, 20212023 and 2020,2022, respectively.
| | | | December 31, | | Year Ended December 31, |
| | | 2021 | | 2020 | | 2023 | | 2022 |
| | | (Millions) | | (Millions) |
| Balance at beginning of year | Balance at beginning of year | $ | 1,222 | | | $ | 1,165 | |
| Liabilities incurred (1) | 336 | | | 37 | |
| Liabilities incurred | |
| Liabilities settled | Liabilities settled | (25) | | | (19) | |
| Accretion | Accretion | 73 | | | 65 | |
| Revisions (2) | 59 | | | (26) | |
| Revisions (1) | |
| | Balance at end of year | Balance at end of year | $ | 1,665 | | | $ | 1,222 | |
| Balance at end of year | |
| Balance at end of year | |
___________
(1)Includes $307 million and $31 million of ARO in 2021 and 2020, respectively, related to acquired upstream properties.
(2)Several factors are considered in the annual review process, including inflation rates, current estimates for removal cost, market risk premiums, discount rates, and the estimated remaining useful life of the assets. The 20212023 and 2022 revisions reflect changes in removal cost estimates increases in the estimated remaining useful life of certain assets,and increases in inflation rates, and new removal estimates. The 2020 revisions reflect changes in removal cost estimates,partially offset by increases in the estimated remaining useful life of certain assets, decreases in inflation rates, and decreases in the discount rates used in the annual review process.rates.
The funds Transco collects through a portion of its rates to fund its AROAROs are deposited into an external trust account dedicated to funding its AROAROs (ARO Trust). (See Note 1715 – Fair Value Measurements, Guarantees, and Concentration of Credit Risk.) Under its current rate settlement, Transco’s annual funding obligation is approximately $16 million, with installments to be deposited monthly.
Note 10 – Goodwill and Other Intangible Assets
Goodwill
Changes in the carrying amount of goodwill, included in Intangible assets – net of accumulated amortization in our Consolidated Balance Sheet, by reportable segment for the periods indicated are as follows:
| | | | | | | | | | | | | | | | | |
| Transmission & Gulf of Mexico | | West | | Total |
| (Millions) |
| December 31, 2021 | $ | — | | | $ | — | | | $ | — | |
| December 31, 2022 | — | | | — | | | — | |
| MountainWest Acquisition (Note 3) | 400 | | | | | 400 | |
| Cureton Acquisition (Note 3) | | | 6 | | | 6 | |
| RMM Acquisition (Note 3) | | | 57 | | | 57 | |
| December 31, 2023 | $ | 400 | | | $ | 63 | | | $ | 463 | |
Goodwill is not subject to amortization, but is evaluated at least annually for impairment or more frequently if impairment indicators are present. We did not identify or recognize any impairments to goodwill in connection with our evaluation of goodwill for impairment during the year ended December 31, 2023.
| | | | | | | | |
| The Williams Companies, Inc. |
| Notes to Consolidated Financial Statements – (Continued) |
|
Note 11 –Other Intangible Assets
The gross carrying amount and accumulated amortization of other intangible assets, included in Intangible assets – net of accumulated amortization in theour Consolidated Balance Sheet, at December 31 are as follows:
| | 2021 | | 2020 |
| Gross Carrying Amount | | Accumulated Amortization | | Gross Carrying Amount | | Accumulated Amortization |
| (Millions) |
| 2023 | | | 2023 | | 2022 |
| Gross Carrying Amount | | | Gross Carrying Amount | | Accumulated Amortization | | Gross Carrying Amount | | Accumulated Amortization |
| (Millions) | | | (Millions) |
| Customer relationships | Customer relationships | $ | 9,593 | | | $ | (2,448) | | | $ | 9,555 | | | $ | (2,116) | |
| Transportation and storage capacity contracts | Transportation and storage capacity contracts | 267 | | | (14) | | | — | | | — | |
| Other | |
| Other intangible assets | Other intangible assets | 6 | | | (2) | | | 6 | | | (1) | |
| $ | 9,866 | | | $ | (2,464) | | | $ | 9,561 | | | $ | (2,117) | |
Customer Relationshipsrelationships
Customer relationships primarily relate to gas gathering, processing, and fractionation contractual customer relationships recognized in acquisitions. Contractual customer relationships are being amortized on a straight-line basis over a periodperiods of 20 years for the acquisition of UEOM andup to 30 years, for most other acquisitions, which represents a portion of the term over which the contractual customer relationships are expected to contribute to our cash flows.
We expense costs incurred to renew or extend the terms of our gas gathering, processing, and fractionation contracts with customers. Based on the estimated future revenues during the contract periods (as estimated at the time of the acquisition), the weighted-average period prior to the next renewal or extension of the contractual customer relationships associated with the UEOM acquisition was approximately 10 years. Although a significant portion of the expected future cash flows associated with these contractual customer relationships are dependent on our ability to renew or extend the arrangements beyond the initial contract periods, these expected future cash flows are significantly influenced by the scope and pace of our producer customers’ drilling programs. Once producer customers’ wells are connected to our gathering infrastructure, their likelihood of switching to another provider before the wells are abandoned is reduced due to the significant capital investment required.
The amortization expense related to customer relationships was $360 million, $353 million, and $332 million $328 million,in 2023, 2022, and $324 million in 2021, 2020, and 2019, respectively. The estimated amortization expense for each of the next five succeeding fiscal years is approximately $335$368 million, $368 million, $364 million, $360 million, and $360 million.
Transportation and Storage Capacity Contractsstorage capacity contracts
Certain transportation and storage capacity contracts were recognized as intangible assets as part of the Sequent Acquisition. (See Note 3 – Acquisitions.Acquisitions and Divestitures.) The amortization expense related to transportation and storage capacity contracts was $51 million, $158 million, and $14 million in 2021.2023, 2022, and 2021, respectively. The estimated amortization expense for each of the next five succeeding fiscal years is approximately $159 million, $51 million, $21 million, $10 million, $7 million, $4 million, and $7$2 million.
| | | | | | | | |
| The Williams Companies, Inc. |
| Notes to Consolidated Financial Statements – (Continued) |
|
Note 1211 – Accrued and Other Current Liabilities
| | | | December 31, | | December 31, |
| | | 2021 | | 2020 | | 2023 | | 2022 |
| | | (Millions) | | (Millions) |
| Interest on debt | Interest on debt | $ | 277 | | | $ | 271 | |
| Employee costs | Employee costs | 214 | | | 149 | |
| Contract liabilities | |
| Alaska refinery contamination litigation (Note 17) | |
| Asset retirement obligations (Note 9) | |
| Regulatory liabilities (Note 1) | |
| Operating lease liabilities (Note 13) | |
| | Derivative liabilities | 166 | | | 4 | |
| Contract liabilities | 134 | | | 129 | |
| Asset retirement obligations (Note 10) | 75 | | | 63 | |
| Operating lease liabilities (Note 14) | 23 | | | 28 | |
| Other, including accrued loss contingencies | Other, including accrued loss contingencies | 312 | | | 300 | |
| $ | 1,201 | | | $ | 944 | |
| Other, including accrued loss contingencies | |
| Other, including accrued loss contingencies | |
| $ | |
| | | | | | | | |
| The Williams Companies, Inc. |
| Notes to Consolidated Financial Statements – (Continued) |
|
Note 1312 – Debt and Banking Arrangements
Long-Term Debt
| | | | | | | | | | | |
| December 31, |
| | 2021 | | 2020 |
| | (Millions) |
| Transco: | | | |
| 7.08% Debentures due 2026 | $ | 8 | | | $ | 8 | |
| 7.25% Debentures due 2026 | 200 | | | 200 | |
| 7.85% Notes due 2026 | 1,000 | | | 1,000 | |
| 4% Notes due 2028 | 400 | | | 400 | |
| 3.25% Notes due 2030 | 700 | | | 700 | |
| 5.4% Notes due 2041 | 375 | | | 375 | |
| 4.45% Notes due 2042 | 400 | | | 400 | |
| 4.6% Notes due 2048 | 600 | | | 600 | |
| 3.95% Notes due 2050 | 500 | | | 500 | |
| Other financing obligation — Atlantic Sunrise | 830 | | | 847 | |
| Other financing obligation — Leidy South | 72 | | | — | |
| Other financing obligation — Dalton | 254 | | | 257 | |
| Northwest Pipeline: | | | |
| 7.125% Debentures due 2025 | 85 | | | 85 | |
| 4% Notes due 2027 | 500 | | | 500 | |
| Williams: | | | |
| 4% Notes due 2021 | — | | | 500 | |
| 7.875% Notes due 2021 | — | | | 371 | |
| 3.35% Notes due 2022 | 750 | | | 750 | |
| 3.6% Notes due 2022 | 1,250 | | | 1,250 | |
| 3.7% Notes due 2023 | 850 | | | 850 | |
| 4.5% Notes due 2023 | 600 | | | 600 | |
| 4.3% Notes due 2024 | 1,000 | | | 1,000 | |
| 4.55% Notes due 2024 | 1,250 | | | 1,250 | |
| 3.9% Notes due 2025 | 750 | | | 750 | |
| 4% Notes due 2025 | 750 | | | 750 | |
| 3.75% Notes due 2027 | 1,450 | | | 1,450 | |
| 3.5% Notes due 2030 | 1,000 | | | 1,000 | |
| 2.6% Notes due 2031 | 1,500 | | | — | |
| 7.5% Debentures due 2031 | 339 | | | 339 | |
| 7.75% Notes due 2031 | 252 | | | 252 | |
| 8.75% Notes due 2032 | 445 | | | 445 | |
| 6.3% Notes due 2040 | 1,250 | | | 1,250 | |
| 5.8% Notes due 2043 | 400 | | | 400 | |
| 5.4% Notes due 2044 | 500 | | | 500 | |
| 5.75% Notes due 2044 | 650 | | | 650 | |
| 4.9% Notes due 2045 | 500 | | | 500 | |
| 5.1% Notes due 2045 | 1,000 | | | 1,000 | |
| 4.85% Notes due 2048 | 800 | | | 800 | |
| 3.5% Notes due 2051 | 650 | | | — | |
| Various — 7.7% to 9.375% Notes and Debentures due 2021 to 2027 | 2 | | | 3 | |
| Credit facility loans | — | | | — | |
| Unamortized debt issuance costs | (131) | | | (125) | |
| Net unamortized debt premium (discount) | (56) | | | (63) | |
| Total long-term debt, including current portion | 23,675 | | | 22,344 | |
| Long-term debt due within one year | (2,025) | | | (893) | |
| Long-term debt | $ | 21,650 | | | $ | 21,451 | |
| | | | | | | | |
The Williams Companies, Inc. |
Notes to Consolidated Financial Statements – (Continued) |
|
| | | | | | | | | | | |
| December 31, |
| | 2023 | | 2022 |
| | (Millions) |
| Transco: | | | |
| 7.08% Debentures due 2026 | $ | 8 | | | $ | 8 | |
| 7.25% Debentures due 2026 | 200 | | | 200 | |
| 7.85% Notes due 2026 | 1,000 | | | 1,000 | |
| 4% Notes due 2028 | 400 | | | 400 | |
| 3.25% Notes due 2030 | 700 | | | 700 | |
| 5.4% Notes due 2041 | 375 | | | 375 | |
| 4.45% Notes due 2042 | 400 | | | 400 | |
| 4.6% Notes due 2048 | 600 | | | 600 | |
| 3.95% Notes due 2050 | 500 | | | 500 | |
| Other financing obligation — Atlantic Sunrise | 790 | | | 809 | |
| Other financing obligation — Leidy South | 76 | | | 77 | |
| Other financing obligation — Dalton | 250 | | | 252 | |
| MountainWest: | | | |
| 3.53% Notes due 2028 (Note 3) | 100 | | | — | |
| 3.91% Notes due 2038 (Note 3) | 150 | | | — | |
| 4.875% Notes due 2041 (Note 3) | 180 | | | — | |
| Northwest Pipeline: | | | |
| 7.125% Debentures due 2025 | 85 | | | 85 | |
| 4% Notes due 2027 | 500 | | | 500 | |
| Williams: | | | |
| 4.5% Notes due 2023 | — | | | 600 | |
| 4.3% Notes due 2024 | 1,000 | | | 1,000 | |
| 4.55% Notes due 2024 | 1,250 | | | 1,250 | |
| 3.9% Notes due 2025 | 750 | | | 750 | |
| 4% Notes due 2025 | 750 | | | 750 | |
| 5.4% Notes due 2026 | 1,100 | | | — | |
| 3.75% Notes due 2027 | 1,450 | | | 1,450 | |
| 5.3% Notes due 2028 | 900 | | | — | |
| 3.5% Notes due 2030 | 1,000 | | | 1,000 | |
| 2.6% Notes due 2031 | 1,500 | | | 1,500 | |
| 7.5% Debentures due 2031 | 339 | | | 339 | |
| 7.75% Notes due 2031 | 252 | | | 252 | |
| 8.75% Notes due 2032 | 445 | | | 445 | |
| 4.65% Notes due 2032 | 1,000 | | | 1,000 | |
| 5.65% Notes due 2033 | 750 | | | — | |
| 6.3% Notes due 2040 | 1,250 | | | 1,250 | |
| 5.8% Notes due 2043 | 400 | | | 400 | |
| 5.4% Notes due 2044 | 500 | | | 500 | |
| 5.75% Notes due 2044 | 650 | | | 650 | |
| 4.9% Notes due 2045 | 500 | | | 500 | |
| 5.1% Notes due 2045 | 1,000 | | | 1,000 | |
| 4.85% Notes due 2048 | 800 | | | 800 | |
| 3.5% Notes due 2051 | 650 | | | 650 | |
| 5.3% Notes due 2052 | 750 | | | 750 | |
| 7.7% Notes due 2027 | 2 | | | 2 | |
| RMM deferred consideration obligation (Note 3) | 665 | | | — | |
| | | |
| Unamortized debt issuance costs | (140) | | | (135) | |
| Net unamortized debt premium (discount) | (114) | | | (55) | |
| Total long-term debt, including current portion | 25,713 | | | 22,554 | |
| Long-term debt due within one year | (2,337) | | | (627) | |
| Long-term debt | $ | 23,376 | | | $ | 21,927 | |
Certain of our debt agreements contain covenants that restrict or limit, among other things, our ability to create liens supporting indebtedness, sell assets, and incur additional debt. Default of these agreements could also restrict our ability to make certain distributions or repurchase equity.
| | | | | | | | |
| The Williams Companies, Inc. |
| Notes to Consolidated Financial Statements – (Continued) |
|
The following table presents aggregate minimum maturities of long-term debt, and other financing obligations, and the RMM deferred consideration obligation, excluding net unamortized debt premium (discount) and debt issuance costs, for each of the next five years:
| | December 31, 2023 | | | December 31, 2023 |
| | December 31, 2021 | | (Millions) |
| | (Millions) |
| 2022 | $ | 2,026 | |
| 2023 | 1,478 | |
| 2024 | 2024 | 2,281 | |
| 2025 | 2025 | 1,619 | |
| 2026 | 2026 | 1,244 | |
| 2027 | |
| 2028 | |
Issuances and retirements
On January 18, 2022, we early retired $1.25 billion of 3.6 percentOur senior unsecured notes due March 15, 2022.public debt issuances for the past three years and subsequent to the balance sheet date are as follows:
On October 8, 2021, we completed a public offering of $600 million of 2.6 percent senior unsecured notes due 2031. The new 2031 notes are an additional | | | | | | | | | | | | | | | | | | | | |
| Issue Date | | Maturity Date | | Amount | | Rate |
| | | | (Millions) | | |
| January 5, 2024 | | March 15, 2029 | | $ | 1,100 | | | 4.900% |
| January 5, 2024 | | March 15, 2034 | | 1,000 | | | 5.150% |
| August 10, 2023 (1) | | March 2, 2026 | | 350 | | | 5.400% |
| August 10, 2023 | | August 15, 2028 | | 900 | | | 5.300% |
| March 2, 2023 | | March 2, 2026 | | 750 | | | 5.400% |
| March 2, 2023 | | March 15, 2033 | | 750 | | | 5.650% |
| August 8, 2022 | | August 15, 2032 | | 1,000 | | | 4.650% |
| August 8, 2022 | | August 15, 2052 | | 750 | | | 5.300% |
| October 8, 2021 (2) | | March 15, 2031 | | 600 | | | 2.600% |
| October 8, 2021 | | October 15, 2051 | | 650 | | | 3.500% |
| March 2, 2021 | | March 15, 2031 | | 900 | | | 2.600% |
| | | | | | |
| | | | | | |
| | | | | | |
(1) Additional issuance of the $900 million5.40 percent senior notes due 2026 issued on March 2, 2023, and trade interchangeably with such notes.
(2) Additional issuance of the 2.6 percent senior unsecured notes due 2031 issued on March 2, 2021, and will trade interchangeably with such notes. Also, on October 8, 2021, we completed a public offering of $650 million of 3.5 percent
| | | | | | | | |
| The Williams Companies, Inc. |
| Notes to Consolidated Financial Statements – (Continued) |
|
Retirements
Our senior unsecured notes due 2051.public debt retirements for the past three years are as follows:
We retired $371 million of 7.875 percent senior unsecured notes that matured on September 1, 2021. | | | | | | | | | | | | | | | | | | | | |
| Date of Retirement | | Maturity Date | | Amount | | Rate |
| | | | (Millions) | | |
| November 15, 2023 | | November 15, 2023 | | $ | 600 | | | 4.500% |
| October 17, 2022 | | January 15, 2023 | | 850 | | | 3.700% |
| May 16, 2022 | | August 15, 2022 | | 750 | | | 3.350% |
| January 18, 2022 | | March 15, 2022 | | 1,250 | | | 3.600% |
| September 1, 2021 | | September 1, 2021 | | 371 | | | 7.875% |
| August 16, 2021 | | November 15, 2021 | | 500 | | | 4.000% |
| | | | | | |
| | | | | | |
On August 16, 2021, we early retired $500 million of 4.0 percent senior unsecured notes due November 15, 2021.
On August 17, 2020, we early retired $600 million of 4.125 percent senior unsecured notes due November 15, 2020.
On May 14, 2020, we completed a public offering of $1 billion of 3.5 percent senior unsecured notes due 2030.
On May 8, 2020, Transco issued $700 million of 3.25 percent senior unsecured notes due 2030 and $500 million of 3.95 percent senior unsecured notes due 2050 to investors in a private debt placement. In the fourth quarter of 2020, Transco filed a registration statement and completed an exchange of these notes for substantially identical new notes that are registered under the Securities Act of 1933, as amended.
We retired $1.5 billion of 5.25 percent senior unsecured notes that matured on March 15, 2020.
We retired $14 million of 8.75 percent senior unsecured notes that matured on January 15, 2020.
We retired $32 million of 7.625 percent senior unsecured notes that matured on July 15, 2019.
Other financing obligations
During the construction of the Atlantic Sunrise, Leidy South, and Dalton projects, Transco received funding from co-owners for their proportionate share of construction costs. Amounts received were recorded within noncurrent liabilities and the costs associated with construction were capitalized in the Consolidated Balance Sheet. Upon placing these projects into service Transco began utilizing the co-owners’ undivided interest in the assets, including the associated pipeline capacity, and reclassified the funding previously received from its co-owners from noncurrent liabilities to debt. The obligations, which mature in 2038, 2041, and 2052, respectively, require monthly
| | | | | | | | |
The Williams Companies, Inc. |
Notes to Consolidated Financial Statements – (Continued) |
|
interest and principal payments and bear interest rates of approximately 9 percent, 1613 percent, and 9 percent, respectively.
Credit Facility
| | | | | | | | | | | |
| December 31, 20212023 |
| Stated Capacity | | Outstanding |
| (Millions) |
| Long-term credit facility (1) | $ | 3,750 | | | $ | — | |
| Letters of credit under certain bilateral bank agreements | | | 16 | |
________________
(1) In managing our available liquidity, we do not expect a maximum outstanding amount in excess of the capacity of our credit facility inclusive of any outstanding amounts under our commercial paper program.
Revolving credit facility
In October 2021, we along with Transco and Northwest Pipeline, the lenders named therein, and an administrative agent entered into an amended and restated credit agreement (Credit Agreement) that reduced aggregate commitments available from $4.5 billion to $3.75 billion, with up to an additional $500 million increase in aggregate commitments available under certain circumstances. The Credit Agreement was effective on October 8, 2021. TheIn the second quarter of 2023, the maturity date of the credit facility isour Credit Agreement was extended one year and now expires October 8, 2026. However,2027. The amended Credit Agreement allows the co-borrowers mayto request up to two extensions of the maturity date each for an additional one-year period to allow a maturity date as late as October 8, 2028,2029, under certain circumstances. Additionally, the amended Credit Agreement replaces the London Interbank Offered Rate with the Term Secured Overnight Financing Rate as the benchmark interest rate index. The Credit Agreement allows for swing line loans up to an aggregate of $200 million, subject to available capacity under the credit facility, and letters of credit commitments of $500 million. Transco and Northwest Pipeline are each able to borrow up to $500 million under this credit facility to the extent not otherwise utilized by the other co-borrowers.
| | | | | | | | |
| The Williams Companies, Inc. |
| Notes to Consolidated Financial Statements – (Continued) |
|
The Credit Agreement contains the following terms and conditions:
•Various covenants may limit, among other things, a borrower’s and its material subsidiaries’ ability to grant certain liens supporting indebtedness, merge or consolidate, sell all or substantially all of its assets in certain circumstances, make certain distributions during an event of default, and each borrower and each borrower’s respective material subsidiaries’ ability to enter into certain restrictive agreements.
•If an event of default with respect to a borrower occurs under the credit facility, the lenders will be able to terminate the commitments for the respective borrowers and accelerate the maturity of the loans of the defaulting borrower under the credit facility and exercise other rights and remedies.
•Other than swing line loans, each time funds are borrowed, the applicable borrower may choose from two methods of calculating interest: a fluctuating base rate equal to an alternative base rate as defined in the Credit Agreement plus an applicable margin or a periodic fixed rate equal to the London Interbank OfferedTerm Secured Overnight Financing Rate (LIBOR) plus an applicable margin. We are required to pay a commitment fee based on the unused portion of the credit facility. The applicable margin is determined by reference to a pricing schedule based on the applicable borrower’s senior unsecured long-term debt ratings and the commitment fee is determined by reference to a pricing schedule based on Williams’ senior unsecured long-term debt ratings. The Credit Agreement also includes customary provisions to provide for replacement of LIBOR with an alternative benchmark rate when LIBOR ceases to be available.
Significant financial covenants under the Credit Agreement require the ratio of debt to EBITDA (earnings before interest, taxes, depreciation, and amortization), each as defined in the Credit Agreement, to be no greater than 5.0 to 1.0, except that for any fiscal quarter in which the funding of the purchase price for an acquisition (whether effectuated as one or a series of related transactions) with an aggregate purchase price of $25 million or more has
| | | | | | | | |
The Williams Companies, Inc. |
Notes to Consolidated Financial Statements – (Continued) |
|
been effected, and the following two fiscal quarters (in each case subject to certain limitations), the ratio of debt to EBITDA is to be no greater than 5.5 to 1.
The ratio of debt to capitalization (defined as net worth plus debt), each as defined in the Credit Agreement, must be no greater than 65 percent for each of Transco and Northwest Pipeline.
At December 31, 2021,2023, we are in compliance with these covenants.
Commercial Paper Program
In 2018, we entered intoWe have a $4$3.5 billion commercial paper program that has been reduced to $3.5 billion in connection with the October 2021 Credit Agreement.program. The maturities of the commercial paper notes vary but may not exceed 397 days from the date of issuance. The commercial paper notes are sold under customary terms in the commercial paper market and are issued at a discount from par, or, alternatively, are sold at par and bear varying interest rates on a fixed or floating basis. The net proceeds of issuances of the commercial paper notes are expected to be used to fund planned capital expenditures and for other general corporate purposes. At December 31, 2021 and 2020, no2023, $725 million of commercial paper was outstanding.outstanding at a weighted-average interest rate of 5.6 percent. We had $350 million of commercial paper outstanding at December 31, 2022 at a weighted-average interest rate of 4.8 percent.
Cash Payments for Interest (Net of Amounts Capitalized)
Cash payments for interest (net of amounts capitalized) were $1.152 billion in 2023, $1.117 billion in 2022, and $1.137 billion in 2021, $1.149 billion in 2020, and $1.153 billion in 2019.2021.
| | | | | | | | |
| The Williams Companies, Inc. |
| Notes to Consolidated Financial Statements – (Continued) |
|
Note 1413 – Leases
We are a lessee through noncancellable lease agreements for property and equipment consisting primarily of buildings, land, vehicles, and equipment used in both our operations and administrative functions.
| | | | | | | | | | | | | | | | | |
| Year Ended December 31, |
| 2021 | | 2020 | | 2019 |
| (Millions) |
| Lease Cost: | | | | | |
| Operating lease cost | $ | 35 | | | $ | 37 | | | $ | 40 | |
| | | | | |
| Variable lease cost | 15 | | | 19 | | | 27 | |
| Sublease income | (1) | | | (1) | | | (2) | |
| Total lease cost | $ | 49 | | | $ | 55 | | | $ | 65 | |
| Cash paid for amounts included in the measurement of operating lease liabilities | $ | 35 | | | $ | 30 | | | $ | 39 | |
| | | | | | | | | | | |
| December 31, |
| 2021 | | 2020 |
| (Millions) |
| Other Information: | | | |
Right-of-use asset (included in Regulatory assets, deferred charges, and other in the Consolidated Balance Sheet) | $ | 159 | | | $ | 182 | |
| Operating lease liabilities: | | | |
Current (included in Accrued liabilities in the Consolidated Balance Sheet) | $ | 23 | | | $ | 28 | |
Noncurrent (included in Regulatory liabilities, deferred income, and other in the Consolidated Balance Sheet) | $ | 141 | | | $ | 161 | |
Weighted-average remaining lease term – operating leases (years) | 13 | | 13 |
Weighted-average discount rate – operating leases | 4.56% | | 4.60% |
| | | | | | | | | | | | | | | | | |
| Year Ended December 31, |
| 2023 | | 2022 | | 2021 |
| (Millions) |
| Lease Cost: | | | | | |
| Operating lease cost | $ | 38 | | | $ | 34 | | | $ | 35 | |
| Variable lease cost | 31 | | | 26 | | | 15 | |
| Sublease income | (1) | | | — | | | (1) | |
| Total lease cost | $ | 68 | | | $ | 60 | | | $ | 49 | |
| Cash paid for operating lease liabilities | $ | 37 | | | $ | 33 | | | $ | 35 | |
| | | | | | | | | | | |
| December 31, |
| 2023 | | 2022 |
| (Millions) |
| Other Information: | | | |
Right-of-use asset (included in Regulatory assets, deferred charges, and other) | $ | 159 | | | $ | 162 | |
| Operating lease liabilities: | | | |
Current (included in Accrued and other current liabilities) | $ | 24 | | | $ | 25 | |
Noncurrent (included in Regulatory liabilities, deferred income, and other) | $ | 148 | | | $ | 148 | |
Weighted-average remaining lease term – operating leases (years) | 11 | | 13 |
Weighted-average discount rate – operating leases | 4.78% | | 4.62% |
| | | | | | | | |
The Williams Companies, Inc. |
Notes to Consolidated Financial Statements – (Continued) |
|
As ofAt December 31, 2021,2023, the following table represents our operating lease maturities, including renewal provisions that we have assessed as being reasonably certain of exercise, for each of the years ended December 31:
| | (Millions) |
| 2022 | $ | 28 | |
| 2023 | 23 | |
| (Millions) | | | (Millions) |
| 2024 | 2024 | 19 | |
| 2025 | 2025 | 17 | |
| 2026 | 2026 | 17 | |
| 2027 | |
| 2028 | |
| Thereafter | Thereafter | 122 | |
| Total future lease payments | Total future lease payments | 226 | |
| Less amount representing interest | 62 | |
| Less: Amount representing interest | |
| Total obligations under operating leases | Total obligations under operating leases | $ | 164 | |
We are the lessor to certain lease agreements for office space in our headquarters building, which are insignificant to our financial statements.
Note 15 – Stockholders' Equity
On February 1, 2022, our board of directors approved a regular quarterly dividend to common stockholders of $0.425 per share payable on March 28, 2022.
Share Repurchase Program
In September 2021, our Board of Directors authorized a share repurchase program with a maximum dollar limit of $1.5 billion. Repurchases may be made from time to time in the open market, by block purchases, in privately negotiated transactions, or in such other manner as determined by our management. Our management will also determine the timing and amount of any repurchases based on market conditions and other factors. The share repurchase program does not obligate us to acquire any particular amount of common stock, and it may be suspended or discontinued at any time. This share repurchase program does not have an expiration date. There were no repurchases under the program as of December 31, 2021.
AOCI
The following table presents the changes in AOCI by component, net of income taxes:
| | | | | | | | | | | | | | | | | | | | | | | |
| Cash
Flow
Hedges (1) | | Foreign
Currency
Translation | | Pension and
Other Postretirement
Benefits | | Total |
| (Millions) |
| Balance at December 31, 2020 | $ | (3) | | | $ | (1) | | | $ | (92) | | | $ | (96) | |
| | | | | | | |
Other comprehensive income (loss) before reclassifications | (40) | | | — | | | 51 | | | 11 | |
Amounts reclassified from accumulated other comprehensive income (loss) | 41 | | | — | | | 11 | | | 52 | |
| Other comprehensive income (loss) | 1 | | | — | | | 62 | | | 63 | |
| Balance at December 31, 2021 | $ | (2) | | | $ | (1) | | | $ | (30) | | | $ | (33) | |
_______________
(1)As of December 31, 2021, we are not applying hedge accounting to any commodity derivative instruments.
| | | | | | | | |
The Williams Companies, Inc. |
Notes to Consolidated Financial Statements – (Continued) |
|
Reclassifications out of AOCI are presented in the following table by component for the year ended December 31, 2021:
| | | | | | | | | | | | | | |
Component | | Reclassifications | | Classification |
| | (Millions) | | |
Cash flow hedges: | | | | |
Energy commodity contracts | | $ | 55 | | | Net gain (loss) on commodity derivatives |
| | | | |
| | | | |
Pension and other postretirement benefits: | | | | |
| | | | |
Amortization of actuarial (gain) loss and net actuarial loss from settlements included in net periodic benefit cost (credit) | | 15 | | | Other income (expense) – net below Operating income (loss)
|
| | | | |
| | | | |
| | | | |
| | | | |
| | | | |
Income tax benefit | | (18) | | | Provision (benefit) for income taxes |
| | | | |
| | | | |
Reclassifications during the period | | $ | 52 | | | |
Note 1614 – Equity-Based Compensation
Williams’ Plan Information
The Williams Companies, Inc. 2007 Incentive Plan (the Plan) provides common-stock-based awards to both employees and nonmanagement directors. To date, 50 million new shares have been authorized for making awards under the Plan, including 10 million shares added on April 28, 2020.Plan. The Plan permits the granting of various types of awards including, but not limited to, restricted
| | | | | | | | |
| The Williams Companies, Inc. |
| Notes to Consolidated Financial Statements – (Continued) |
|
stock units and stock options. At December 31, 2021, 302023, 21 million shares of our common stock were reserved for issuance pursuant to existing and future stock awards, of which 1712 million shares were available for future grants.
Additionally, up to 5.2 million new shares of our common stock have been authorized to date to be available for sale under our Employee Stock Purchase Plan (ESPP), including 1.6 million shares added on April 28, 2020.. Employees purchased 275250 thousand shares at a weighted-average price of $19.47$27.56 per share during 2021.2023. Approximately 1.40.9 million shares were available for purchase under the ESPP at December 31, 2021.2023.
We recognize compensation expense on employee stock-based awards on a straight-line basis; forfeitures are recognized when they occur. Operating and maintenance expenses and Selling, general, and administrative expenses in our Consolidated Statement of Income include equity-based compensation expense for the years ended December 31,in 2023, 2022, and 2021 2020, and 2019 of $81$77 million, $5273 million, and $57$81 million, respectively. Income tax benefit recognized related to the stock-based compensation expense for the years ended December 31,in 2023, 2022, and 2021 2020, and 2019 was $20$19 million, $13$18 million, and $14$20 million, respectively. Measured but unrecognized stock-based compensation expense at December 31, 2021,2023, was $64$70 million, all of which related to restricted stock units. These amounts are expected to be recognized over a weighted-average period of 1.71.8 years.
Nonvested Restricted Stock Units
At December 31, 2023 and 2022, we had restricted stock units outstanding, including performance-based shares, of 6.6 million shares and 6.9 million shares, respectively, with a weighted-average fair value of $28.34 and $23.63, respectively. During 2023, we granted 3.8 million shares of restricted stock units with a weighted-average fair value of $27.43. Restricted stock units generally vest after three years. Performance-based grants may vest at a range from zero percent to 200 percent of the original shares granted based on performance against a target. At December 31, 2023, there were 1.8 million performance-based shares outstanding.
Stock Options
There were no stock options granted in 2023, 2022, or 2021. At December 31, 2023, we had 1.5 million stock options that were both outstanding and exercisable, with a weighted-average exercise price of $37.17. The weighted-average remaining contractual life for stock options that were both outstanding and exercisable at December 31, 2023, was 1.8 years. Cash received for the exercise of stock options in 2023 and 2022 was $2 million and $49 million, respectively, and the related income tax benefit recognized in both 2023 and 2022 was $2 million.
| | | | | | | | |
| The Williams Companies, Inc. |
| Notes to Consolidated Financial Statements – (Continued) |
|
Nonvested Restricted Stock Units
The following summary reflects nonvested restricted stock unit activity and related information for the year ended December 31, 2021:
| | | | | | | | | | | |
| Restricted Stock Units Outstanding | Shares | | Weighted-
Average
Fair Value (1) |
| (Millions) | | |
| Nonvested at December 31, 2020 | 6.2 | | | $ | 23.53 | |
| Granted | 2.7 | | | $ | 24.22 | |
| Forfeited | (0.1) | | | $ | 18.59 | |
| Vested | (1.5) | | | $ | 30.82 | |
| Nonvested at December 31, 2021 | 7.3 | | | $ | 22.35 | |
______________
(1)Performance-based restricted stock units are valued considering measures such as total shareholder return utilizing a Monte Carlo valuation method, as well as return on capital employed, a ratio of debt to EBITDA, and available funds from operations. All time based restricted stock units are valued at the grant-date market price. Restricted stock units generally vest after three years.
| | | | | | | | | | | | | | | | | |
| Value of Restricted Stock Units | 2021 | | 2020 | | 2019 |
| Weighted-average grant date fair value of restricted stock units granted during the year, per share | $ | 24.22 | | | $ | 18.32 | | | $ | 25.87 | |
| Total fair value of restricted stock units vested during the year (in millions) | $ | 46 | | | $ | 43 | | | $ | 29 | |
Performance-based restricted stock units granted under the Plan represent39 percent of nonvested restricted stock units outstanding at December 31, 2021. These grants may be earned at the end of the vesting period based on actual performance against a performance target. Based on the extent to which certain financial targets are achieved, vested shares may range from zero percent to 200 percent of the original grant amount.
Stock Options
There were no stock options granted in 2021, 2020, or 2019. At December 31, 2021, we had 5.2 million stock options that were both outstanding and exercisable, with a weighted-average exercise price of $33.51. The weighted-average remaining contractual life for stock options that were both outstanding and exercisable at December 31, 2021, was 2.9 years.
| | | | | | | | |
The Williams Companies, Inc. |
Notes to Consolidated Financial Statements – (Continued) |
|
Note 1715 – Fair Value Measurements, Guarantees, and Concentration of Credit Risk
The following table presents, by level within the fair value hierarchy, certain of our significant financial assets and liabilities. The carrying values of cash and cash equivalents, accounts receivable, and accounts payable, and commercial paper approximate fair value because of the short-term nature of these instruments. Therefore, these assets and liabilities are not presented in the following table.
| | Fair Value Measurements Using |
| Carrying
Amount | | Fair
Value | | Quoted
Prices In
Active
Markets for
Identical
Assets
(Level 1) | | Significant
Other
Observable
Inputs
(Level 2) | | Significant
Unobservable
Inputs
(Level 3) |
| (Millions) |
| Assets (liabilities) at December 31, 2021: | |
| | | | | Fair Value Measurements Using | | | | | | | Fair Value Measurements Using |
| Carrying
Amount | | | Carrying
Amount | | Fair
Value | | Quoted
Prices In
Active
Markets for
Identical
Assets
(Level 1) | | Significant
Other
Observable
Inputs
(Level 2) | | Significant
Unobservable
Inputs
(Level 3) |
| (Millions) | | | (Millions) |
| Assets (liabilities) at December 31, 2023: | |
| Measured on a recurring basis: | Measured on a recurring basis: | |
| Measured on a recurring basis: | |
| Measured on a recurring basis: | |
| ARO Trust investments | |
| ARO Trust investments | |
| ARO Trust investments | ARO Trust investments | $ | 260 | | | $ | 260 | | | $ | 260 | | | $ | — | | | $ | — | |
| Commodity derivative assets (1) | Commodity derivative assets (1) | 84 | | | 84 | | | 2 | | | 81 | | | 1 | |
| Commodity derivative liabilities (1) | Commodity derivative liabilities (1) | (488) | | | (488) | | | (69) | | | (403) | | | (16) | |
| Interest rate derivatives | |
| | Additional disclosures: | Additional disclosures: | |
| Additional disclosures: | |
| Additional disclosures: | |
| | Long-term debt, including current portion | |
| | Long-term debt, including current portion | |
| | Long-term debt, including current portion | Long-term debt, including current portion | (23,675) | | | (27,768) | | | — | | | (27,768) | | | — | |
| Guarantees | Guarantees | (39) | | | (26) | | | — | | | (10) | | | (16) | |
| | Assets (liabilities) at December 31, 2020: | |
| Assets (liabilities) at December 31, 2022: | |
| Assets (liabilities) at December 31, 2022: | |
| Assets (liabilities) at December 31, 2022: | |
| Measured on a recurring basis: | |
| Measured on a recurring basis: | |
| Measured on a recurring basis: | Measured on a recurring basis: | |
| ARO Trust investments | ARO Trust investments | $ | 235 | | | $ | 235 | | | $ | 235 | | | $ | — | | | $ | — | |
| Commodity derivative assets | 3 | | | 3 | | | 1 | | | 2 | | | — | |
| Commodity derivative liabilities | (6) | | | (6) | | | (3) | | | (1) | | | (2) | |
| ARO Trust investments | |
| ARO Trust investments | |
| Commodity derivative assets (2) | |
| Commodity derivative liabilities (2) | |
| Other financial assets (liabilities) - net | |
| Additional disclosures: | Additional disclosures: | |
| | Long-term debt, including current portion | Long-term debt, including current portion | (22,344) | | | (27,043) | | | — | | | (27,043) | | | — | |
| | Long-term debt, including current portion | |
| | Long-term debt, including current portion | |
| Guarantees | Guarantees | (40) | | | (27) | | | — | | | (11) | | | (16) | |
(1)Excludes approximately $296Commodity derivative assets and liabilities exclude $2 million of net cash collateral in Level 1.
(2)Commodity derivative assets and liabilities exclude $202 million of net cash collateral in Level 1.
Fair Value Methods
We use the following methods and assumptions in estimating the fair value of our financial instruments:
Assets measured at fair value on a recurring basis
ARO Trust investments: Transco deposits a portion of its collected rates, pursuant to its rate case settlement, into an external trust that is specifically designated to fund future ARO’s.AROs. The ARO Trust invests in a portfolio of actively traded mutual funds that are measured at fair value on a recurring basis based on quoted prices in an active market and is reported in Regulatory assets, deferred charges, and other in our Consolidated Balance Sheet. Both realized and unrealized gains and losses are ultimately recorded as regulatory assets or liabilities.
| | | | | | | | |
| The Williams Companies, Inc. |
| Notes to Consolidated Financial Statements – (Continued) |
|
Commodity derivatives: Commodity derivatives include exchange-traded contracts and OTC contracts, which consist of physical forwards, futures, and swaps that are measured at fair value on a recurring basis. We also have other derivatives related to asset management agreements and other contracts that require physical delivery.
| | | | | | | | |
The Williams Companies, Inc. |
Notes to Consolidated Financial Statements – (Continued) |
|
Derivatives classified as Level 1 are valued using New York Mercantile Exchange (NYMEX) futures prices. Derivatives classified as Level 2 are valued using basis transactions that represent the cost to transport natural gas from a NYMEX delivery point to the contract delivery point. These transactions are based on quotes obtained either through electronic trading platforms or directly from brokers. Derivatives classified as Level 3 are valued using a combination of observable and unobservable inputs. Beginning in the third quarter of 2021 theThe fair value amounts are presented on a net basis and reflect the netting of asset and liability positions permitted under the terms of our master netting arrangements and cash held on deposit in margin accounts that we have received or remitted to collateralize certain derivative positions. Commodity derivative assets are reported in Other currentDerivative assets and deferred charges and Regulatory assets, deferred charges, and other in our Consolidated Balance Sheet. Commodity derivative liabilities are reported in AccruedDerivative liabilities and Regulatory liabilities, deferred income, and other in our Consolidated Balance Sheet. Changes in the fair value of our derivative assets and liabilities are recorded in Net gain (loss) from commodity derivativesand Net processing commodity expenses in our Consolidated Statement of Income.See Note 1816 – Commodity Derivatives for additional information on our derivatives.
The following table presents a reconciliation of changes in fair value of our net commodity derivatives classified as Level 3 in the fair value hierarchy.
| | Year Ended December 31, |
| 2021 | | 2020 |
| (Millions) |
| Year Ended December 31, | | | Year Ended December 31, |
| 2023 | | | 2023 | | 2022 |
| (Millions) | | | (Millions) |
| Balance at beginning of period | Balance at beginning of period | $ | (2) | | | $ | (2) | |
| Realized and unrealized gains (losses): | |
| Included in income (loss) | (62) | | | — | |
| | Gains (losses) included in our Consolidated Statement of Income | |
| Purchases, issuances, and settlements | Purchases, issuances, and settlements | 13 | | | — | |
| Acquired derivatives (Note 3) | 24 | | | — | |
| Transfers into Level 3 | |
| Transfers out of Level 3 | Transfers out of Level 3 | 12 | | | — | |
| Balance at end of period | Balance at end of period | $ | (15) | | | $ | (2) | |
A substantial portion of the carrying value of our Level 3 derivatives at December 31, 2023, relates to a long-term physical natural gas purchase contract associated with an ongoing pipeline expansion project. The valuation of this contract reflects the extrapolation of forward natural gas prices for periods beyond observable price curves, which is considered a significant unobservable input.
Interest rate derivatives: At December 31, 2023, we held forward starting interest rate swap agreements with notional amounts totaling $1.15 billion. During January 2024 we terminated certain of these agreements totaling $750 million of notional value coinciding with the issuance of long-term debt (see Note 12 – Debt and Banking Arrangements). The fair value of these derivatives is determined using discounted cash flows considering forward interest rates and the terms of the agreements, corroborated by counterparty valuations, and is classified as a Level 2 measurement. We designated these derivatives as cash flow hedges to reduce interest rate exposure on future debt issuances. Gains and losses on these derivative instruments are reflected as a component of AOCI and will be amortized to earnings as a component of Interest expense in our Consolidated Statement of Income. These forward starting interest rate swaps are reported in Derivative assets and Derivative liabilities in our Consolidated Balance Sheet.
Additional fair value disclosures
Long-term debt, including current portion: The disclosed fair value of our long-term debt is determined primarily by a market approach using broker quoted indicative period-end bond prices. The quoted prices are based on observable transactions in less active markets for our debt or similar instruments. The fair values of the financing obligations associated with our Dalton, Leidy South, and Atlantic Sunrise projects, which areas well as the deferred
| | | | | | | | |
| The Williams Companies, Inc. |
| Notes to Consolidated Financial Statements – (Continued) |
|
consideration obligation associated with the RMM Acquisition (see Note 3 – Acquisitions and Divestitures), all included within long-term debt, were determined using an income approach (see Note 1312 – Debt and Banking Arrangements).
Guarantees: Guarantees primarily consist of a guarantee we have provided in the event of nonpayment by our previously owned communications subsidiary, Williams Communications Group, Inc., (WilTel), on a lease performance obligation that extends through 2042. Guarantees also include an indemnification related to a disposed operation.
To estimate the fair value of the WilTel guarantee, an estimated default rate is applied to the sum of the future contractual lease payments using an income approach. The estimated default rate is determined by obtaining the average cumulative issuer-weighted corporate default rate based on the credit rating of WilTel’s current owner and the term of the underlying obligation. The default rate is published by Moody’s Investors Service. The carrying value of the WilTel guarantee is reported in Accrued and other current liabilities in our Consolidated Balance Sheet. The maximum potential undiscounted liquidity exposure is approximately $25$23 million at December 31, 2021.2023. Our exposure declines systematically through the remaining term of WilTel’s obligation.
The fair value of the guarantee associated with the indemnification related to a disposed operation was estimated using an income approach that considered probability-weighted scenarios of potential levels of future performance. The terms of the indemnification do not limit the maximum potential future payments associated with the guarantee. The carrying value of this guarantee is reported in Regulatory liabilities, deferred income, and other in our Consolidated Balance Sheet.
| | | | | | | | |
The Williams Companies, Inc. |
Notes to Consolidated Financial Statements – (Continued) |
|
We are required by our revolving credit agreement to indemnify lenders for certain taxes required to be withheld from payments due to the lenders and for certain tax payments made by the lenders. The maximum potential amount of future payments under these indemnifications is based on the related borrowings and such future payments cannot currently be determined. These indemnifications generally continue indefinitely unless limited by the underlying tax regulations and have no carrying value. We have never been called upon to perform under these indemnifications and have no current expectation of a future claim.
Nonrecurring fair value measurementsDuring the first quarter of 2020, we observed a significant decline in the publicly traded price of our common stock (NYSE: WMB), which declined 40 percent during the quarter, including a 26 percent decline in the month of March. These changes were generally attributed to macroeconomic and geopolitical conditions, including significant declines in crude oil prices driven by both surplus supply and a decrease in demand caused by the coronavirus (COVID-19) pandemic. As a result of these conditions, we performed an interim assessment of the goodwill associated with our Northeast G&P reporting unit as of March 31, 2020. This goodwill resulted from the March 2019 acquisition of UEOM (see Note 3 – Acquisitions).
The assessment considered the total fair value of the businesses within the Northeast G&P reporting unit, which was determined using income and market approaches. We utilized internally developed industry weighted-average discount rates and estimates of valuation multiples of comparable publicly traded gathering and processing companies. In assessing the fair value as of the March 31, 2020, measurement date, we were required to consider recent publicly available indications of value, which included lower observed publicly traded EBITDA market multiples as compared with recent history and significantly higher industry weighted-average discount rates. The fair value of the reporting unit was further reconciled to our estimated total enterprise value as of March 31, 2020, which considered observable valuation multiples of comparable publicly traded companies applied to each distinct business including the Northeast G&P reporting unit. This assessment indicated that the estimated fair value of the Northeast G&P reporting unit was below its carrying value, including goodwill. As a result of this Level 3 measurement, we recognized a full impairment charge of $187 million as of March 31, 2020, in Impairment of goodwill in our Consolidated Statement of Income. Our partner’s $65 million share of this impairment is reflected within Net income (loss) attributable to noncontrolling interests in our Consolidated Statement of Income (see Note 3 – Acquisitions).
| | | | | | | | |
| The Williams Companies, Inc. |
| Notes to Consolidated Financial Statements – (Continued) |
|
The following table presents impairments of assets and equity-method investments associated with certain nonrecurring fair value measurements within Level 3 of the fair value hierarchy, except as specifically noted.
| | | | | | | | | | | | | | | | | | | | | | | | | | | | | | | | | | | | | | |
| | | | | | | | Impairments |
| | | | | | | | Year Ended December 31, |
| | Segment | | Date of Measurement | | Fair Value | | 2021 | | 2020 | | 2019 |
| | | | | | (Millions) |
| Impairment of certain assets: | | | | | | | | | | | | |
| Certain capitalized project costs (1) | | Transmission & Gulf of Mexico | | June 30, 2021 | | $ | 1 | | | $ | 2 | | | | | |
| Certain capitalized project costs (1) | | Transmission & Gulf of Mexico | | December 31, 2020 | | 42 | | | | | $ | 170 | | | |
| Certain gathering assets (2) | | Northeast G&P | | December 31, 2020 | | 5 | | | | | 12 | | | |
| Certain pipeline project (3) | | Transmission & Gulf of Mexico | | December 31, 2019 | | 22 | | | | | | | $ | 354 | |
| Certain gathering assets (4) | | West | | December 31, 2019 | | 25 | | | | | | | 20 | |
| Certain gathering assets (4) | | West | | June 30, 2019 | | 40 | | | | | | | 59 | |
| Certain idle gathering assets (5) | | West | | March 31, 2019 | | — | | | | | | | 12 | |
| | | | | | | | | | | | |
| | | | | | | | | | | | |
| Other impairments and write-downs (6) | | | | | | | | | | | | 19 | |
| Impairment of certain assets | | | | | | | | $ | 2 | | | $ | 182 | | | $ | 464 | |
| Impairment of equity-method investments: | | | | | | | | | | | | |
| RMM (7) | | West | | December 31, 2020 | | $ | 421 | | | | | $ | 108 | | | |
| RMM (8) | | West | | March 31, 2020 | | 557 | | | | | 243 | | | |
| Brazos Permian II (8) | | West | | March 31, 2020 | | — | | | | | 193 | | | |
| BRMH (9) | | Northeast G&P | | March 31, 2020 | | 191 | | | | | 229 | | | |
| Appalachia Midstream Investments (9) | | Northeast G&P | | March 31, 2020 | | 2,700 | | | | | 127 | | | |
| Aux Sable (9) | | Northeast G&P | | March 31, 2020 | | 7 | | | | | 39 | | | |
| Laurel Mountain (9) | | Northeast G&P | | March 31, 2020 | | 236 | | | | | 10 | | | |
| Discovery (9) | | Transmission & Gulf of Mexico | | March 31, 2020 | | 367 | | | | | 97 | | | |
| Laurel Mountain (10) | | Northeast G&P | | September 30, 2019 | | 242 | | | | | | | $ | 79 | |
| Appalachia Midstream Investments (11) | | Northeast G&P | | September 30, 2019 | | 102 | | | | | | | 17 | |
| Pennant (12) | | Northeast G&P | | August 31, 2019 | | 11 | | | | | | | 17 | |
| UEOM (13) | | Northeast G&P | | March 17, 2019 | | 1,210 | | | | | | | 74 | |
| | | | | | | | | | | | |
| Other | | | | | | | | | | | | (1) | |
| Impairment of equity-method investments | | | | | | | | $ | — | | | $ | 1,046 | | | $ | 186 | |
______________
(1)Relates to capitalized project development costs for the Northeast Supply Enhancement project. As previously disclosed, approvals required for the project from the New York State Department of Environmental
| | | | | | | | |
The Williams Companies, Inc. |
Notes to Consolidated Financial Statements – (Continued) |
|
Conservation and the New Jersey Department of Environmental Protection have been denied and we have not refiled at this time. Beginning in May 2020, we discontinued capitalization of costs related to this project. Considering that the customer precedent agreements and FERC certificate for the project remain in effect, we had previously concluded that the probability of completing the project was sufficient to not require impairment. However, developments in the political and regulatory environments caused us to slightly lower that assessed probability such that the capitalized project costs now required impairment. The estimated fair value of the materials within the capitalized project costs at December 31, 2020 considered other internal uses and salvage values for the Property, plant, and equipment – net. The remaining capitalized costs were determined to have no fair value. The estimated fair value of certain capitalized project costs at June 30, 2021, was determined by a market approach, which incorporated an indication of interest by a third-party.
(2)Relates to a gathering system in the Marcellus Shale region, that was sold in 2021. The estimated fair value of the Property, plant, and equipment – net and Intangible assets – net of accumulated amortization was determined using a market approach, which incorporated an indication of interest by a third party. These inputs resulted in a fair value measurement within Level 2 of the fair value hierarchy.
(3)Relates to the Constitution proposed pipeline project extending from Susquehanna County, Pennsylvania, to the Iroquois Gas Transmission and the Tennessee Gas Pipeline systems in New York. Although Constitution received a certificate of public convenience and necessity from the FERC to construct and operate the proposed pipeline and obtained, among other approvals, a waiver of the water quality certification under Section 401 of the Clean Water Act for the New York portion of the project, the members of Constitution, following extensive evaluation and discussion, determined that the underlying risk-adjusted return for this greenfield pipeline project had diminished in such a way that further development was no longer supported. The estimated fair value of the Property, plant, and equipment – net was based on probability-weighted third-party quotes. Our partners’ $209 million share of this impairment is reflected within Net income (loss) attributable to noncontrolling interests in our Consolidated Statement of Income.
(4)Relates to a gas gathering system in the Eagle Ford Shale region for which we expected declines in asset utilization and possible idling of the gathering system. As a result, we measured the fair value of these assets at December 31, 2019 using a market approach. These inputs resulted in a fair value measurement within Level 2 of the fair value hierarchy. The estimated fair value of the Property, plant, and equipment – net at June 30, 2019, was determined using a market approach, which incorporated indications of interest from third parties.
(5)Reflects impairment of Property, plant, and equipment – net that is no longer in use for which the fair value was determined to be lower than the carrying value.
(6)Reflects multiple individually insignificant impairments and write-downs of other certain assets that may no longer be in use or are surplus in nature for which the fair value was determined to be lower than the carrying value.
(7)During the fourth quarter of 2020, RMM renegotiated service contracts with a significant customer in connection with the customer’s Chapter 11 bankruptcy proceedings. The renegotiated contracts result in lower service rates and lower projected future cash flows. As a result, we evaluated this investment for other-than-temporary impairment. The fair value was measured using an income approach. We utilized a discount rate of 18 percent in our analysis.
(8)Following the previously described declining market conditions during the first quarter of 2020, we evaluated these investments for other-than-temporary impairment. The fair value was measured using an income approach. Both investees operate in primarily oil-driven basins where significant expected reductions in producer activities led to reduced estimates of expected future cash flows. Our fair value estimates also reflected discount rates of approximately 17 percent for these investments. We also considered any debt held at
| | | | | | | | |
The Williams Companies, Inc. |
Notes to Consolidated Financial Statements – (Continued) |
|
the investee level, and its impact to fair value. The industry weighted-average discount rates utilized were significantly influenced by the market declines previously discussed.
(9)Following the previously described declining market conditions during the first quarter of 2020, we evaluated these investments for other-than-temporary impairment. The impairments within our Northeast G&P segment are primarily associated with operations in wet-gas areas where producer drilling activities are influenced by NGL prices which historically trend with crude oil prices. The fair values of our investments in BRMH and Aux Sable Liquid Products LP (Aux Sable) were estimated using a market approach, reflecting valuation multiples ranging from 5.0x to 6.2x EBITDA (weighted-average 6.0x). The fair values of the other investments, including gathering systems that are part of Appalachia Midstream Investments, were estimated using an income approach, with discount rates ranging from 9.7 percent to 13.5 percent (weighted-average 12.6 percent). We also considered any debt held at the investee level, and its impact to fair value. The assumed valuation multiples and industry weighted-average discount rates utilized were both significantly influenced by the market declines previously discussed.
(10)Relates to a gas gathering system in the Marcellus Shale region that was adversely impacted by lower sustained forward natural gas price expectations and changes in expected producer activity. The estimated fair value was determined using an income approach. We utilized a discount rate of 10.2 percent in our analysis.
(11)Relates to a certain gathering system held in Appalachia Midstream Investments that was adversely impacted by changes in the timing of expected producer activity. The estimated fair value was determined using an income approach. We utilized a discount rate of 9 percent in our analysis.
(12)The estimated fair value of Pennant Midstream, LLC (Pennant) was determined by a market approach based on recent observable third-party transactions. These inputs resulted in a fair value measurement within Level 2 of the fair value hierarchy.
(13)The estimated fair value at March 17, 2019, was determined by a market approach based on the transaction price for the purchase of the remaining interest in UEOM as finalized just prior to the signing and closing of the acquisition in March 2019 (see Note 3 – Acquisitions). These inputs resulted in a fair value measurement within Level 2 of the fair value hierarchy.
Concentration of Credit Risk
Accounts receivable
The following table summarizes concentration of receivables, net of allowances:
| | | | | | | | | | | |
| | December 31, |
| | 2021 | | 2020 |
| | (Millions) |
| NGLs, natural gas, and related products and services | $ | 486 | | | $ | 470 | |
| Regulated interstate natural gas transportation and storage | 274 | | | 254 | |
| Marketing of natural gas and NGLs (1) | 609 | | | 167 | |
| Upstream activities | 82 | | | 1 | |
| Accounts Receivable related to revenues from contracts with customers | 1,451 | | | 892 | |
| Derivative receivables (2) | 462 | | | — | |
| Other | 65 | | | 107 | |
| Trade accounts and other receivables - net | $ | 1,978 | | | $ | 999 | |
(1)Includes $290 million related to our Sequent segment as of December 31, 2021.
(2)Includes $462 million related to our Sequent segment as of December 31, 2021.
| | | | | | | | |
The Williams Companies, Inc. |
Notes to Consolidated Financial Statements – (Continued) |
|
| | | | | | | | | | | |
| | December 31, |
| | 2023 | | 2022 |
| | (Millions) |
| NGLs, natural gas, and related products and services | $ | 589 | | | $ | 505 | |
| Regulated interstate natural gas transportation and storage | 310 | | | 311 | |
| Marketing of natural gas and NGLs | 321 | | | 858 | |
| Upstream activities | 72 | | | 97 | |
| Accounts Receivable related to revenues from contracts with customers | 1,292 | | | 1,771 | |
| Receivables from derivatives | 311 | | | 889 | |
| Other accounts receivable | 52 | | | 63 | |
| Trade accounts and other receivables - net | $ | 1,655 | | | $ | 2,723 | |
Customers include producers, distribution companies, industrial users, gas marketers, and pipelines primarily located in the continental United States. As a general policy, collateral is not required for receivables with the exception of the marketing receivables discussed below. Customers’ financial condition and credit worthiness are evaluated regularly and, based upon this evaluation, we may obtain collateral to support receivables.
We use established credit policies to determine and monitor the creditworthiness of gas marketing and trading counterparties, including requirements to post collateral or other credit security, as well as the quality of pledged collateral. Collateral or credit security is most often in the form of cash or letters of credit from an investment-grade financial institution, but may also include U.S. government securities. We also utilize netting agreements whenever possible to mitigate exposure to gas marketing and trading counterparty credit risk. When more than one derivative transaction with the same counterparty is outstanding and a legally enforceable netting agreement exists with that counterparty, the “net” mark-to-market exposure represents a reasonable measure of our credit risk with that counterparty.
Note 1816 – Derivatives
Commodity-RelatedCommodity Derivatives
We are exposed to commodity price risk. To manage this volatility, we use various contracts in our marketing and trading activities that generally meet the definition of derivatives. Derivative positions are monitored using techniques including, but not limited to, value at risk. Derivative instruments are recognized at fair value in our Consolidated Balance Sheet as either assets or liabilities and are presented on a net basis by counterparty, net of margin deposits. See Note 1715 – Fair Value Measurements, Guarantees, and Concentration of Credit Risk for additional fair value information. In our Consolidated Statement of Cash Flows, any cash impacts of settled commodity-relatedcommodity derivatives are recorded as operating activities.
We enter into commodity-relatedcommodity derivatives to economically hedge exposures to natural gas, NGLs, and crude oil and retain exposure to price changes that can, in a volatile energy market, be material and can adversely affect our results of operations.
| | | | | | | | |
| The Williams Companies, Inc. |
| Notes to Consolidated Financial Statements – (Continued) |
|
At December 31, 2021,2023, the notional volume of the net long (short) positions for our commodity derivative contracts were as follows:
| | | | | | | | | | | | | | | | | | | | |
| Segment | Commodity | | Unit of Measure | | Net Long (Short) Position |
| | | | | | |
| | | | |
| | | | | | |
| | | | | | |
| | | | | | |
| | | | | | |
| | | | | | |
Sequent (1)Index Risk | | Natural Gas | | MMBtu | | 623,763,087 820,590,728 | |
West - Central Hub Risk - Henry Hub | | Natural Gas | | MMBtu | | (40,757,055) |
| Basis Risk | | Natural Gas | | MMBtu | | 3,091,504 |
| Central Hub Risk - Mont Belvieu | | Natural Gas Liquids | | Barrels | | 302,000 (1,218,000) | |
West - Basis Risk | | Natural Gas Liquids | | Barrels | | (19,649,000)(50,000) | |
West - Central Hub Risk - WTI | | Natural GasCrude Oil | | MMBtuBarrels | | (22,375,500)(155,000) | |
| West - Basis Risk | | Natural Gas | | MMBtu | | (33,050,500) |
| | | | | | |
_______________Commodity Derivatives Financial Statement Presentation
(1)DerivativeThe fair value of commodity derivatives, which are not designated as hedging instruments include both long and short natural gas positions. for accounting purposes, was reflected as follows:
| | | | | | | | | | | | | | | | | | | | | | | | | | |
| | December 31,
2023 | | December 31,
2022 |
| Commodity Derivatives Categories | | Assets | | (Liabilities) | | Assets | | (Liabilities) |
| | (Millions) |
| | | | | | | | |
| | | | | | | | |
| | | | | | | | |
| | | | | | | | |
| | | | | | | | |
| Current | | $ | 623 | | | $ | (496) | | | $ | 1,099 | | | $ | (1,278) | |
| Noncurrent | | 243 | | | (345) | | | 269 | | | (734) | |
| Total commodity derivatives | | $ | 866 | | | $ | (841) | | | $ | 1,368 | | | $ | (2,012) | |
| Counterparty and collateral netting offset | | (552) | | | 554 | | | (1,034) | | | 1,236 | |
| Amounts recognized in our Consolidated Balance Sheet | | $ | 314 | | | $ | (287) | | | $ | 334 | | | $ | (776) | |
The volume represents the netpre-tax effects of long natural gas positionscommodity derivative instruments in our Consolidated Statement of 4.0 billion MMBtu (million British thermal units) and short natural gas positions of 3.4 billion MMBtu.Income were as follows:
| | | | | | | | | | | | | | | | | | | | |
| | Gain (Loss) |
| | Year Ended December 31, |
| | 2023 | | 2022 | | 2021 |
| | (Millions) |
Net gain (loss) from commodity derivatives within Total revenues: | | | | | | |
| Realized commodity derivatives designated as hedging instruments | | $ | — | | | $ | — | | | $ | (55) | |
| Realized commodity derivatives not designated as hedging instruments | | 253 | | | (91) | | | 16 | |
| Unrealized commodity derivatives not designated as hedging instruments | | 703 | | | (296) | | | (109) | |
| | $ | 956 | | | $ | (387) | | | $ | (148) | |
| | | | | | |
Net gain (loss) from commodity derivatives within Net processing commodity expenses: |
| Realized commodity derivatives not designated as hedging instruments | | $ | (4) | | | $ | 16 | | | $ | 2 | |
| Unrealized commodity derivatives not designated as hedging instruments | | (43) | | | 47 | | | — | |
| | $ | (47) | | | $ | 63 | | | $ | 2 | |
| Total net gain (loss) from commodity derivatives | | $ | 909 | | | $ | (324) | | | $ | (146) | |
| | | | | | |
| | | | | | | | |
| The Williams Companies, Inc. |
| Notes to Consolidated Financial Statements – (Continued) |
|
Derivative Financial Statement Presentation
The fair value of commodity-related derivatives was reflected in our Consolidated Balance Sheet as follows:
| | | | | | | | | | | | | | | | | | | | | | | | | | |
| | December 31,
2021 | | December 31,
2020 |
| Derivative Category | | Assets | | (Liabilities) | | Assets | | (Liabilities) |
| | (Millions) |
| Derivatives designated as hedging instruments | | | | | | | | |
| Current | | $ | — | | | $ | — | | | $ | 1 | | | $ | (2) | |
| Noncurrent | | — | | | — | | | — | | | — | |
| Total derivatives designated as hedging instruments | | $ | — | | | $ | — | | | $ | 1 | | | $ | (2) | |
| | | | | | | | |
| Derivatives not designated as hedging instruments | | | | | | | | |
| Current | | $ | 619 | | | $ | (760) | | | $ | 2 | | | $ | (3) | |
| Noncurrent | | 166 | | | (429) | | | — | | | (1) | |
| Total derivatives not designated as hedging instruments | | $ | 785 | | | $ | (1,189) | | | $ | 2 | | | $ | (4) | |
| | | | | | | | |
| Gross amounts recognized | | $ | 785 | | | $ | (1,189) | | | $ | 3 | | | $ | (6) | |
| Counterparty and collateral netting offset | | (476) | | | 772 | | | — | | | — | |
| Amounts recognized in our Consolidated Balance Sheet | | $ | 309 | | | $ | (417) | | | $ | 3 | | | $ | (6) | |
For the years ended December 31, 2021, 2020, and 2019 the pre-tax effects of commodity-related derivatives instruments in Net gain (loss) on commodity derivatives in our Consolidated Statement of Income were as follows:
| | | | | | | | | | | | | | | | | | | | | |
| | | Gain (Loss) |
| | | Year Ended December 31, |
| | | 2021 | | 2020 | | 2019 |
| | | (Millions) |
| Realized commodity-related derivatives designated as hedging instruments | | | $ | (55) | | | $ | (2) | | | $ | — | |
| Realized commodity-related derivatives not designated as hedging instruments | | | 16 | | | (3) | | | (1) | |
| Net unrealized gain (loss) from derivative instruments not designated as hedging instruments (1) | | | (109) | | | — | | | 3 | |
| Net gain (loss) on commodity derivatives | | | $ | (148) | | | $ | (5) | | | $ | 2 | |
| | | | | | | |
_______________(1)All of the net loss in 2021 related to our Sequent segment. All of the net gain in 2019 related to our West segment.
Contingent Features
Generally, collateral may be provided byin the form of a parent guaranty, letter of credit, or cash. If collateral is required, fair value amounts recognized for the right to reclaim cash collateral or the obligation to return cash collateral are offset against fair value amounts recognized for derivatives executed with the same counterparty.
We have specific trade and credit contracts that contain minimum credit rating requirements. These credit rating requirements typically give counterparties the right to suspend or terminate credit if our credit ratings are downgraded to non-investment grade status. Under such circumstances, we would need to post collateral to continue
| | | | | | | | |
The Williams Companies, Inc. |
Notes to Consolidated Financial Statements – (Continued) |
|
transacting business with some of ourthese counterparties. As ofAt December 31, 20212023, the contractually required collateral in the event of a credit rating downgrade to non-investment grade status was $13$15 million.
We maintain accounts with brokers or the clearing houses of certain exchanges to facilitate financial derivative transactions. Based on the value of the positions in these accounts and the associated margin requirements, we may be required to deposit cash into these accounts. At December 31, 2021,2023, and 2022, net cash collateral held on deposit in broker margin accounts was $296 million.$2 million and $202 million, respectively.
Note 1917 – Contingent LiabilitiesContingencies and Commitments
Reporting of Natural Gas-Related Information to Trade Publications
Direct and indirect purchasers of natural gas in various states filed individual and class actions against us, our former affiliate WPX Energy, Inc. (WPX) and its subsidiaries, and others alleging the manipulation of published gas price indices in 2000 and 2002 and seeking unspecified amounts of damages. Such actions were transferred to the Nevada federal district court for consolidation of discovery and pre-trial issues. We have agreed to indemnify WPX and its subsidiaries related to this matter.
In the individual action, filed by Farmland Industries Inc. (Farmland), the court issued an order on May 24, 2016, granting one of our co-defendant’s motion for summary judgment as to Farmland’s claims. On January 5, 2017, the court extended such ruling to us, entering final judgment in our favor. Farmland appealed. On March 27, 2018, the appellate court reversed the district court’s grant of summary judgment, and on April 10, 2018, the defendants filed a petition for rehearing with the appellate court, which was denied on May 9, 2018. The case was remanded to the Nevada federal district court and subsequently remanded to its originally filed court, the Kansas federal district court where we re-urged our motion for summary judgment. The district court denied the motion but granted our request to seek permission for an immediate appeal to the appellate court. Oral argument occurred before the appellate court on January 19, 2021. On June 22, 2021, the appellate court ruled that we are not entitled to summary judgment and remanded the case to the Kansas federal district court. The court scheduled trial to begin May 9, 2022. In January 2022, we reached an agreement to settle this action and it has been dismissed.
In the putative class actions, on March 30, 2017, the court issued an order denying the plaintiffs’ motions for class certification. On June 13, 2017, the United States Court of Appeals for the Ninth Circuit granted the plaintiffs’ petition for permission to appeal the order. On August 6, 2018, the Ninth Circuit reversed the order denying class certification and remanded the case to the Nevada federal district court.
We reached an agreement to settle two of the actions, and on April 22, 2019, the Nevada federal district court preliminarily approved the settlements, which are on behalf of Kansas and Missouri class members. The final fairness hearing on the settlement occurred August 5, 2019, and a final judgment of dismissal with prejudice was entered the same day.
Two putative class actions remain unresolved, and they have been remanded to their originally filed court, the Wisconsin federal district court where the plaintiffs have re-urged their motion for class certification. Trial was scheduled to begin June 14, 2021, but the court struck the setting and has not reset it.
Because of the uncertainty around the remaining unresolved issues, we cannot reasonably estimate a range of potential exposure at this time. However, it is reasonably possible that the ultimate resolution of these actions and our related indemnification obligation could result in a potential loss that may be material to our results of operations. In connection with this indemnification, we have an accrued liability balance associated with this matter and have exposure to future developments.
Alaska Refinery Contamination Litigation
We are involved in litigation arising from our ownership and operation of the North Pole Refinery in North Pole, Alaska, from 1980 until 2004, through our wholly owned subsidiaries Williams Alaska Petroleum Inc. (WAPI)
| | | | | | | | |
The Williams Companies, Inc. |
Notes to Consolidated Financial Statements – (Continued) |
|
and MAPCO Inc. We sold the refinery to Flint Hills Resources Alaska, LLC (FHRA), a subsidiary of Koch Industries, Inc., in 2004. The litigation involves three cases, with filing dates ranging from 2010 to 2014. The actions primarily arise from sulfolane contamination allegedly emanating from the refinery. A putative class action lawsuit was filed by James West in 2010 naming us, WAPI, and FHRA as defendants. We and FHRA filed claims against each other seeking, among other things, contractual indemnification alleging that the other party caused the sulfolane contamination. In 2011, we and FHRA settled the claim with James West. Certain claims by FHRA against us were resolved by the Alaska Supreme Court in our favor. FHRA’s claims against us for contractual indemnification and statutory claims for damages related to off-site sulfolane were remanded to the Alaska Superior Court. The State of Alaska filed its action in March 2014, seeking damages. The City of North Pole (North Pole) filed its lawsuit in November 2014, seeking past and future damages, as well as punitive damages. Both we and WAPI asserted counterclaims against the State of Alaska and North Pole, and cross-claims against FHRA. FHRA has also filed cross-claims against us.
The underlying factual basis and claims in the cases are similar and may duplicate exposure. As such, in February 2017, the three cases were consolidated into one action in state court containing the remaining claims from the James West case and those of the State of Alaska and North Pole. The State of Alaska later announced the discovery of additional contaminants per- and polyfluoralkyl (PFOS and PFOA) offsite of the refinery, and the court permitted the State of Alaska to amend its complaint to add a claim for offsite PFOS/PFOA contamination. The court subsequently remanded the offsite PFOS/PFOA claims to the Alaska Department of Environmental Conservation for investigation and stayed the claims pending their potential resolution at the administrative agency. Several trial dates encompassing all three cases have been scheduled and stricken. In the summer of 2019, the court deconsolidated the cases for purposes of trial. A bench trial on all claims except North Pole’s claims began in October 2019.
In January 2020, the Alaska Superior Court issued its Memorandum of Decision finding in favor of the State of Alaska and FHRA, with the total incurred and potential future damages estimated to be $86 million.million, plus fees and interest. The court found that FHRA is not entitled to contractual indemnification from us because FHRA contributed to the sulfolane contamination. On March 23, 2020, the court entered final judgment in the case. Filing deadlines were stayed until May 1, 2020. However, on April 21, 2020, we filed a Notice of Appeal. We also filed post-judgment motions including a Motion for New Trial and a Motion to Alter or Amend the Judgment. These
| | | | | | | | |
| The Williams Companies, Inc. |
| Notes to Consolidated Financial Statements – (Continued) |
|
post-trial motions were resolved with the court’s denial of the last motion on June 11, 2020. Our Statement of Points on Appeal was filed on July 13, 2020. On June 22, 2020, the court stayed the North Pole’s case pending resolution of the appeal in the State of Alaska and FHRA case. On December 23, 2020, we filed our opening brief on appeal. Oral argument was held on December 15, 2021. We have recorded an accrued liability inOn May 26, 2023, the amountAlaska Supreme Court issued its Opinion substantially affirming the Superior Court’s decision. On July 18, 2023, the Superior Court granted our stay of our estimateexecution of the probable loss. It is reasonably possible thatmonetary judgment portions of the judgment while we may not be successful on appealseek review before the United States Supreme Court. On September 25, 2023, we filed a Petition for a Writ of Certiorari with the United States Supreme Court, which was subsequently denied in January 2024. The North Pole claims were also settled in January 2024. During 2023, we recorded pre-tax charges of $125 million to Income (loss) from discontinued operations in our Consolidated Statement of Income related to these matters. Payments were made in January 2024 and could ultimately pay up to the amount of judgment.claims against us are now resolved.
Royalty Matters
Certain of our customers, including Chesapeake Energy Corporation (Chesapeake), have been named in various lawsuits alleging underpayment of royalties and claiming, among other things, violations of anti-trust laws and the Racketeer Influenced and Corrupt Organizations Act. We have also been named as a defendant in certain of these cases filed in Pennsylvania based on allegations that we improperly participated with Chesapeake in causing the alleged royalty underpayments. We believe that the claims asserted are subject to indemnity obligations owed to us by Chesapeake. Chesapeake, haswhich obligations survived Chesapeake’s bankruptcy proceedings. Prior to its bankruptcy, Chesapeake reached a settlement to resolve substantially all Pennsylvania royalty cases pending, whichpending. During the pendency of the bankruptcy, that settlement was renegotiated. The settlement applies to both Chesapeake and us. The settlementus and does not require any contribution from us. On August 23, 2021, after referral to the United States District Court for the Southern District of Texas by the bankruptcy court, the court approved the settlement, but twosettlement. Two objectors filed an appeal with the United States Court of Appeals for the Fifth Circuit. On June 8, 2023, the Court of Appeals vacated the settlement approval and remanded to the United States District Court for the Southern District of Texas with instructions to dismiss the settlement proceedings for lack of jurisdiction. On August 31, 2023, the bankruptcy court entered an order finding the settlement agreements to be null and void. Certain plaintiffs have filed a notice of dismissal of their claims against Chesapeake that arose prior to February 8, 2021 in the United States District Court for the Middle District of Pennsylvania lawsuits. The notice states that plaintiffs are not releasing their claims against the other defendants, including us, or claims against Chesapeake that arose after February 9, 2021. We continue to believe the claims against us are subject to indemnity obligations owed to us by Chesapeake.
Litigation Against Energy Transfer and Related Parties
On April 6, 2016, we filed suit in Delaware Chancery Court against Energy Transfer Equity, L.P. (Energy Transfer) and LE GP, LLC (the general partner for Energy Transfer) alleging willful and material breaches of the Agreement and Plan of Merger (ETE Merger Agreement) with Energy Transfer resulting from the private offering
| | | | | | | | |
The Williams Companies, Inc. |
Notes to Consolidated Financial Statements – (Continued) |
|
by Energy Transfer on March 8, 2016, of Series A Convertible Preferred Units (Special Offering) to certain Energy Transfer insiders and other accredited investors. The suit seeks, among other things, an injunction ordering the defendants to unwind the Special Offering and to specifically perform their obligations under the ETE Merger Agreement. On April 19, 2016, we filed an amended complaint seeking the same relief. On May 3, 2016, Energy Transfer and LE GP, LLC filed an answer and counterclaims.
On May 13, 2016, we filed a separate complaint in Delaware Chancery Court against Energy Transfer, LE GP, LLC and the other Energy Transfer affiliates that are parties to the ETE Merger Agreement, alleging material breaches of the ETE Merger Agreement for failing to cooperate and use necessary efforts to obtain a tax opinion required under the ETE Merger Agreement (Tax Opinion) and for otherwise failing to use necessary efforts to consummate the merger under the ETE Merger Agreement wherein we would be merged with and into the newly formed Energy Transfer Corp LP (ETC) (ETC Merger). The suit sought, among other things, a declaratory judgment and injunction preventing Energy Transfer from terminating or otherwise avoiding its obligations under the ETE Merger Agreement due to any failure to obtain the Tax Opinion.
| | | | | | | | |
| The Williams Companies, Inc. |
| Notes to Consolidated Financial Statements – (Continued) |
|
The Court of Chancery coordinated the Special Offering and Tax Opinion suits. On May 20, 2016, the Energy Transfer defendants filed amended affirmative defenses and verified counterclaims in the Special Offering and Tax Opinion suits, alleging certain breaches of the ETE Merger Agreement by us and seeking, among other things, a declaration that we were not entitled to specific performance, that Energy Transfer could terminate the ETC Merger, and that Energy Transfer is entitled to a $1.48 billion termination fee. On June 24, 2016, following a two-day trial, the court issued a Memorandum Opinion and Order denying our requested relief in the Tax Opinion suit. The court did not rule on the substance of our claims related to the Special Offering or on the substance of Energy Transfer’s counterclaims. On June 27, 2016, we filed an appeal of the court’s decision with the Supreme Court of Delaware, seeking reversal and remand to pursue damages. On March 23, 2017, the Supreme Court of Delaware affirmed the Court of Chancery’s ruling. On March 30, 2017, we filed a motion for reargument with the Supreme Court of Delaware, which was denied on April 5, 2017.
On September 16, 2016, we filed an amended complaint with the Court of Chancery seeking damages for breaches of the ETE Merger Agreement by defendants. On September 23, 2016, Energy Transfer filed a second amended and supplemental affirmative defenses and verified counterclaim with the Court of Chancery seeking, among other things, payment of the $1.48 billion termination fee due to our alleged breaches of the ETE Merger Agreement. On December 1, 2017, the court granted our motion to dismiss certain of Energy Transfer’s counterclaims, including its claim seeking payment of the $1.48 billion termination fee. On December 8, 2017, Energy Transfer filed a motion for reargument, which the Court of Chancery denied on April 16, 2018. The Court of Chancery originally scheduled trial for May 20 through May 24, 2019; the court struck that setting and reset trial to occur in 2020. All 2020 trial settings were struck due to COVID-19. Trial was held May 10 through May 17, 2021. Post-trial argument occurred September 16, 2021. On December 29, 2021, the court entered judgment in our favor in the amount of $410 million, plus interest at the contractual rate, and our reasonable attorneys’ fees and expenses. TheOn September 21, 2022, the court entered a final order and judgment may beawarding us the termination fee, attorney’s fees, expenses, and interest in the amount of $602 million plus additional interest starting September 17, 2022. Energy Transfer appealed to the Delaware Supreme Court. The Delaware Supreme Court held oral argument en banc on July 12, 2023. On October 10, 2023, the Delaware Supreme Court issued an opinion affirming the Court of Chancery’s ruling. On October 25, 2023, Energy Transfer filed a motion for reargument with the Delaware Supreme Court.
On November 28, 2023, we received a $627 million payment from Energy Transfer for the final order and judgment. On the same day, we paid attorney fees which had been incurred on a contingent fee basis. This resulted in a net gain of $534 million reported as Net gain from Energy Transfer litigation judgment in our Consolidated Statement of Income and included as a component of Modified EBITDA within our Other segment for the year ended December 31, 2023.
Environmental Matters
We are a participant in certain environmental activities in various stages including assessment studies, cleanup operations, and/or remedial processes at certain sites, some of which we currently do not own. We are monitoring these sites in a coordinated effort with other potentially responsible parties, the U.S. Environmental Protection Agency (EPA), or other governmental authorities. We are jointly and severally liable along with unrelated third parties in some of these activities and solely responsible in others. Certain of our subsidiaries have been identified as potentially responsible parties at various Superfund and state waste disposal sites. In addition, these subsidiaries have incurred, or are alleged to have incurred, various other hazardous materials removal or remediation obligations under environmental laws. As of December 31, 2021,2023, we have accrued liabilities totaling $31$48 million for these matters, as discussed below. Estimates of the most likely costs of cleanup are generally based on completed assessment studies, preliminary results of studies, or our experience with other similar cleanup operations. At December 31, 2021,2023, certain assessment studies were still in process for which the ultimate outcome may yield
| | | | | | | | |
The Williams Companies, Inc. |
Notes to Consolidated Financial Statements – (Continued) |
|
different estimates of most likely costs. Therefore, the actual costs incurred will depend on the final amount, type, and extent of contamination discovered at these sites, the final cleanup standards mandated by the EPA or other governmental authorities, and other factors.
The EPA and various state regulatory agencies routinely propose and promulgate new rules and issue updated guidance to existing rules. These rulemakings include, but are not limited to, rules for reciprocating internal
| | | | | | | | |
| The Williams Companies, Inc. |
| Notes to Consolidated Financial Statements – (Continued) |
|
combustion engine and combustion turbine maximum achievable control technology, reviews and updates to the National Ambient Air Quality Standards, and rules for new and existing source performance standards for volatile organic compound and methane. We continuously monitor these regulatory changes and how they may impact our operations. Implementation of new or modified regulations may result in impacts to our operations and increase the cost of additions to Property, plant, and equipment – net in theour Consolidated Balance Sheet for both new and existing facilities in affected areas; however, due to regulatory uncertainty on final rule content and applicability timeframes, we are unable to reasonably estimate the cost of these regulatory impacts at this time.
Continuing operations
Our interstate gas pipelines are involved in remediation and monitoring activities related to certain facilities and locations for polychlorinated biphenyls, mercury, and other hazardous substances. These activities have involved the EPA and various state environmental authorities, resulting in our identification as a potentially responsible party at various Superfund waste sites. At December 31, 2021,2023, we have accrued liabilities of $4$12 million for these costs. Wecosts and expect that these costs will be recoverableto recover approximately $4 million through rates.
We also accrue environmental remediation costs for natural gas underground storage facilities, primarily related to soil and groundwater contamination. At December 31, 2021,2023, we have accrued liabilities totaling $8$10 million for these costs.
Former operations
We have potential obligations in connection with assets and businesses we no longer operate. These potential obligations include remediation activities at the direction of federal and state environmental authorities and the indemnification of the purchasers of certain of these assets and businesses for environmental and other liabilities existing at the time the sale was consummated. Our responsibilities relate to the operations of the assets and businesses described below.
•Former agricultural fertilizer and chemical operations and former retail petroleum and refining operations;
•Former petroleum products and natural gas pipelines;
•Former petroleum refining facilities;
•Former exploration and production and mining operations;
•Former electricity and natural gas marketing and trading operations.
At December 31, 2021,2023, we have accrued environmental liabilities of $19$26 million related to these matters.
Other Divestiture Indemnifications
Pursuant to various purchase and sale agreements relating to divested businesses and assets, we have indemnified certain purchasers against liabilities that they may incur with respect to the businesses and assets acquired from us. The indemnities provided to the purchasers are customary in sale transactions and are contingent upon the purchasers incurring liabilities that are not otherwise recoverable from third parties. The indemnities generally relate to breach of warranties, tax, historic litigation, personal injury, property damage, environmental matters, right of way, and other representations that we have provided.
| | | | | | | | |
The Williams Companies, Inc. |
Notes to Consolidated Financial Statements – (Continued) |
|
At December 31, 2021,2023, other than as previously disclosed, we are not aware of any material claims against us involving the above-described indemnities; thus, we do not expect any of the indemnities provided pursuant to the sales agreements to have a material impact on our future financial position. Any claim for indemnity brought against us in the future may have a material adverse effect on our results of operations in the period in which the claim is made.
| | | | | | | | |
| The Williams Companies, Inc. |
| Notes to Consolidated Financial Statements – (Continued) |
|
In addition to the foregoing, various other proceedings are pending against us that are incidental to our operations, none of which are expected to be material to our expected future annual results of operations, liquidity, and financial position.
Summary
We have disclosed our estimated range of reasonably possible losses for certain matters above, as well as all significant matters for which we are unable to reasonably estimate a range of possible loss. We estimate that for all other matters for which we are able to reasonably estimate a range of loss, our aggregate reasonably possible losses beyond amounts accrued are immaterial to our expected future annual results of operations, liquidity, and financial position. These calculations have been made without consideration of any potential recovery from third parties.
Commitments
Commitments for construction and acquisition of property, plant, and equipment are approximately $214$243 million at December 31, 2021.2023.
Commitments for SequentGas & NGL Marketing Services pipeline transportation capacity and storage capacity and gas supply are approximately $420$687 million at December 31, 2021.2023.
Note 2018 – Segment Disclosures
Our reportable segments are Transmission & Gulf of Mexico, Northeast G&P, West, and Sequent.Gas & NGL Marketing Services. All remaining business activities are included in Other. (See Note 1 – General, Description of Business, Basis of Presentation, and Summary of Significant Accounting Policies.)
Performance Measurement
We evaluate segment operating performance based upon Modified EBITDA. This measure represents the basis of our internal financial reporting and is the primary performance measure used by our chief operating decision maker in measuring performance and allocating resources among our reportable segments. Intersegment Service revenues primarily represent transportation services provided to our marketing business and gathering services provided to our oil and gas properties. Intersegment Product sales primarily represent the sale of natural gas and NGLs from our natural gas processing plants and our oil and gas properties to our marketing business.
We define Modified EBITDA as follows:
•Net income (loss) before:
◦Income (loss) from discontinued operations;
◦Provision (benefit) for income taxes;
◦Interest incurred, net of interest capitalized;expense;
◦Equity earnings (losses);
◦Impairment of equity-method investments;
◦Other investing income (loss) – net;
| | | | | | | | |
The Williams Companies, Inc. |
Notes to Consolidated Financial Statements – (Continued) |
|
◦Impairment of goodwill;
◦Depreciation and amortization expenses;
◦Accretion expense associated with asset retirement obligations for nonregulated operations.
•This measure is further adjusted to include our proportionate share (based on ownership interest) of Modified EBITDA from our equity-method investments calculated consistently with the definition described above.
| | | | | | | | |
| The Williams Companies, Inc. |
| Notes to Consolidated Financial Statements – (Continued) |
|
Significant noncash items which are components of Modified EBITDA may include unrealized net gain (loss) from commodity derivatives within Total revenues, unrealized net gain (loss) from commodity derivatives within Net processing commodity expenses for our Gas & NGL Marketing segment, charges associated with lower of cost or net realizable value adjustments to our Gas & NGL Marketing segment inventory within Product sales and Product costs in our Consolidated Statement of Income, and impairments of certain assets within Other (income) expense – net within Operating income (loss).
The following table reflects the reconciliation of Modified EBITDA to Net income (loss) as reported in theour Consolidated Statement of Income:
| | Year Ended December 31, |
| 2021 | | 2020 | | 2019 |
| | | (Millions) |
| Year Ended December 31, | | | Year Ended December 31, |
| 2023 | | | 2023 | | 2022 | | 2021 |
| | | | | (Millions) | | | | | | | (Millions) |
| Modified EBITDA by segment: | Modified EBITDA by segment: | |
| Transmission & Gulf of Mexico | |
| Transmission & Gulf of Mexico | |
| Transmission & Gulf of Mexico | Transmission & Gulf of Mexico | $ | 2,621 | | | $ | 2,379 | | | $ | 2,175 | |
| Northeast G&P | Northeast G&P | 1,712 | | | 1,489 | | | 1,314 | |
| West | West | 1,095 | | | 998 | | | 952 | |
| Sequent | (112) | | | — | | | — | |
| Other | 178 | | | (15) | | | 6 | |
| 5,494 | | | 4,851 | | | 4,447 | |
| Gas & NGL Marketing Services | |
| Total reportable segments | |
| Modified EBITDA of other business activities | |
| 8,013 | |
| Accretion expense associated with asset retirement obligations for nonregulated operations | Accretion expense associated with asset retirement obligations for nonregulated operations | (45) | | | (35) | | | (33) | |
| | Depreciation and amortization expenses | Depreciation and amortization expenses | (1,842) | | | (1,721) | | | (1,714) | |
| Impairment of goodwill | — | | | (187) | | | — | |
| Depreciation and amortization expenses | |
| Depreciation and amortization expenses | |
| | Equity earnings (losses) | Equity earnings (losses) | 608 | | | 328 | | | 375 | |
| Impairment of equity-method investments | — | | | (1,046) | | | (186) | |
| Equity earnings (losses) | |
| Equity earnings (losses) | |
| | Other investing income (loss) – net | |
| Other investing income (loss) – net | |
| Other investing income (loss) – net | Other investing income (loss) – net | 7 | | | 8 | | | 107 | |
| Proportional Modified EBITDA of equity-method investments | Proportional Modified EBITDA of equity-method investments | (970) | | | (749) | | | (746) | |
| Interest expense | Interest expense | (1,179) | | | (1,172) | | | (1,186) | |
| (Provision) benefit for income taxes | (Provision) benefit for income taxes | (511) | | | (79) | | | (335) | |
| Income (loss) from discontinued operations | Income (loss) from discontinued operations | — | | | — | | | (15) | |
| Net income (loss) | Net income (loss) | $ | 1,562 | | | $ | 198 | | | $ | 714 | |
| | | | | | | | |
| The Williams Companies, Inc. |
| Notes to Consolidated Financial Statements – (Continued) |
|
The following table reflects the reconciliation of Segment revenues to Total revenues as reported in theour Consolidated Statement of Income and Other financial information:
| | Transmission &
Gulf of Mexico | | Northeast G&P | | West | | Sequent (1) | | Other | | Eliminations | | Total |
| (Millions) |
| 2021 | |
| Transmission & Gulf of Mexico | | | Transmission & Gulf of Mexico | | Northeast G&P | | West | | Gas & NGL Marketing Services (1) | | Other | | Eliminations | | Total |
| (Millions) | | | (Millions) |
| 2023 | |
| Segment revenues: | |
| Segment revenues: | |
| Segment revenues: | Segment revenues: | |
| Service revenues | Service revenues | |
| Service revenues | |
| Service revenues | |
| External | |
| External | |
| External | External | $ | 3,310 | | | $ | 1,490 | | | $ | 1,181 | | | $ | — | | | $ | 20 | | | $ | — | | | $ | 6,001 | |
| Internal | Internal | 75 | | | 38 | | | 40 | | | — | | | 12 | | | (165) | | | — | |
| Total service revenues | Total service revenues | 3,385 | | | 1,528 | | | 1,221 | | | — | | | 32 | | | (165) | | | 6,001 | |
| Total service revenues – commodity consideration | Total service revenues – commodity consideration | 52 | | | 7 | | | 179 | | | — | | | — | | | — | | | 238 | |
| Product sales | Product sales | |
| External | External | 231 | | | 13 | | | 4,117 | | | 37 | | | 138 | | | — | | | 4,536 | |
| External | |
| External | |
| Internal | Internal | 118 | | | 86 | | | 213 | | | (80) | | | 195 | | | (532) | | | — | |
| Total product sales | Total product sales | 349 | | | 99 | | | 4,330 | | | (43) | | | 333 | | | (532) | | | 4,536 | |
| Net gain (loss) on commodity derivatives (2) | — | | | — | | | (85) | | | (43) | | | (20) | | | — | | | (148) | |
| Net gain (loss) from commodity derivatives | |
| Realized | |
| Realized | |
| Realized | |
| Unrealized | |
| Total net gain (loss) from commodity derivatives (2) | |
| Total revenues | Total revenues | $ | 3,786 | | | $ | 1,634 | | | $ | 5,645 | | | $ | (86) | | | $ | 345 | | | $ | (697) | | | $ | 10,627 | |
| | Other financial information: | Other financial information: | |
| Other financial information: | |
| Other financial information: | |
| Additions to long-lived assets | |
| Additions to long-lived assets | |
| Additions to long-lived assets | Additions to long-lived assets | $ | 861 | | | $ | 164 | | | $ | 209 | | | $ | 1 | | | $ | 620 | | | $ | — | | | $ | 1,855 | |
| Proportional Modified EBITDA of equity-method investments | Proportional Modified EBITDA of equity-method investments | 183 | | | 682 | | | 105 | | | — | | | — | | | — | | | 970 | |
| | 2020 | |
| 2022 | |
| 2022 | |
| 2022 | |
| Segment revenues: | |
| Segment revenues: | |
| Segment revenues: | Segment revenues: | |
| Service revenues | Service revenues | |
| Service revenues | |
| Service revenues | |
| External | |
| External | |
| External | External | $ | 3,207 | | | $ | 1,416 | | | $ | 1,280 | | | $ | — | | | $ | 21 | | | $ | — | | | $ | 5,924 | |
| Internal | Internal | 50 | | | 49 | | | — | | | — | | | 13 | | | (112) | | | — | |
| Total service revenues | Total service revenues | 3,257 | | | 1,465 | | | 1,280 | | | — | | | 34 | | | (112) | | | 5,924 | |
| Total service revenues – commodity consideration | Total service revenues – commodity consideration | 21 | | | 7 | | | 101 | | | — | | | — | | | — | | | 129 | |
| Product sales | Product sales | |
| External | External | 144 | | | 16 | | | 1,511 | | | — | | | — | | | — | | | 1,671 | |
| External | |
| External | |
| Internal | Internal | 47 | | | 41 | | | 56 | | | — | | | — | | | (144) | | | — | |
| Total product sales | Total product sales | 191 | | | 57 | | | 1,567 | | | — | | | — | | | (144) | | | 1,671 | |
| Net gain (loss) on commodity derivatives (2) | — | | | — | | | (5) | | | — | | | — | | | — | | | (5) | |
| Net gain (loss) from commodity derivatives | |
| Realized | |
| Realized | |
| Realized | |
| Unrealized | |
| Total net gain (loss) from commodity derivatives (2) | |
| Total revenues | Total revenues | $ | 3,469 | | | $ | 1,529 | | | $ | 2,943 | | | $ | — | | | $ | 34 | | | $ | (256) | | | $ | 7,719 | |
| | Other financial information: | Other financial information: | |
| Other financial information: | |
| Other financial information: | |
| Additions to long-lived assets | |
| Additions to long-lived assets | |
| Additions to long-lived assets | Additions to long-lived assets | $ | 706 | | | $ | 137 | | | $ | 318 | | | $ | — | | | $ | 122 | | | $ | — | | | $ | 1,283 | |
| Proportional Modified EBITDA of equity-method investments | Proportional Modified EBITDA of equity-method investments | 166 | | | 473 | | | 110 | | | — | | | — | | | — | | | 749 | |
|
| | | | | | | | |
| The Williams Companies, Inc. |
| Notes to Consolidated Financial Statements – (Continued) |
|
| | Transmission &
Gulf of Mexico | | Northeast G&P | | West | | Sequent (1) | | Other | | Eliminations | | Total |
| (Millions) |
| 2019 | |
| Transmission & Gulf of Mexico | | | Transmission & Gulf of Mexico | | Northeast G&P | | West | | Gas & NGL Marketing Services (1) | | Other | | Eliminations | | Total |
| (Millions) | | | (Millions) |
| 2021 | |
| Segment revenues: | |
| Segment revenues: | |
| Segment revenues: | Segment revenues: | |
| Service revenues | Service revenues | |
| Service revenues | |
| Service revenues | |
| External | |
| External | |
| External | External | $ | 3,261 | | | $ | 1,291 | | | $ | 1,364 | | | $ | — | | | $ | 17 | | | $ | — | | | $ | 5,933 | |
| Internal | Internal | 50 | | | 47 | | | — | | | — | | | 13 | | | (110) | | | — | |
| Total service revenues | Total service revenues | 3,311 | | | 1,338 | | | 1,364 | | | — | | | 30 | | | (110) | | | 5,933 | |
| Total service revenues – commodity consideration | Total service revenues – commodity consideration | 41 | | | 12 | | | 150 | | | — | | | — | | | — | | | 203 | |
| Product sales | Product sales | |
| External | External | 217 | | | 115 | | | 1,731 | | | — | | | — | | | — | | | 2,063 | |
| External | |
| External | |
| Internal | Internal | 71 | | | 35 | | | 64 | | | — | | | — | | | (170) | | | — | |
| Total product sales | Total product sales | 288 | | | 150 | | | 1,795 | | | — | | | — | | | (170) | | | 2,063 | |
| Net gain (loss) on commodity derivatives (2) | — | | | — | | | 2 | | | — | | | — | | | — | | | 2 | |
| Net gain (loss) from commodity derivatives | |
| Realized | |
| Realized | |
| Realized | |
| Unrealized | |
| Total net gain (loss) from commodity derivatives (2) | |
| Total revenues | Total revenues | $ | 3,640 | | | $ | 1,500 | | | $ | 3,311 | | | $ | — | | | $ | 30 | | | $ | (280) | | | $ | 8,201 | |
| | Other financial information: | Other financial information: | |
| Other financial information: | |
| Other financial information: | |
| Additions to long-lived assets | |
| Additions to long-lived assets | |
| Additions to long-lived assets | Additions to long-lived assets | $ | 1,341 | | | $ | 1,245 | | | $ | 304 | | | $ | — | | | $ | 21 | | | $ | — | | | $ | 2,911 | |
| Proportional Modified EBITDA of equity-method investments | Proportional Modified EBITDA of equity-method investments | 177 | | | 454 | | | 115 | | | — | | | — | | | — | | | 746 | |
(1) Sequent nets revenues fromAs we are acting as agent for natural gas marketing andcustomers or engage in energy trading activities, with the associated costs.resulting revenues are presented net of the related costs of those activities.
(2) We record transactions that qualify as commodity derivatives at fair value with changes in fair value recognized in earnings in the period of change and characterized as unrealized gains or losses. Gains and losses onfrom commodity derivatives held for energy trading purposes are presented on a net basis in revenue.
Segment assets include Investments, Property, plant, and equipment – net, and Intangible assets – net of accumulated amortization. The following table reflects Total assetssegment assets and Equity-methodequity-method investments by reportable segments:
| | Total Assets | | Equity-Method Investments |
| December 31, 2021 | | December 31, 2020 | | December 31, 2021 | | December 31, 2020 |
| (Millions) |
| | Segment Assets | | | | Segment Assets | | Equity-Method Investments |
| | December 31, 2023 | | | | December 31, 2023 | | December 31, 2022 | | December 31, 2023 | | December 31, 2022 |
| | (Millions) | | | | (Millions) |
| Transmission & Gulf of Mexico | Transmission & Gulf of Mexico | | $ | 20,392 | | | $ | 19,110 | | | $ | 602 | | | $ | 610 | |
| Northeast G&P | Northeast G&P | | 14,938 | | | 14,569 | | | 3,681 | | | 3,682 | |
| West | West | | 10,851 | | | 10,558 | | | 838 | | | 867 | |
| Sequent | | 1,592 | | | — | | | — | | | — | |
| Other (1) | | 3,233 | | | 927 | | | — | | | — | |
| Eliminations (2) | | (3,394) | | | (999) | | | — | | | — | |
| Gas & NGL Marketing Services | |
| Other | |
| Total | Total | | $ | 47,612 | | | $ | 44,165 | | | $ | 5,121 | | | $ | 5,159 | |
| Total current assets | |
| Regulatory assets, deferred charges, and other | |
| Regulatory assets, deferred charges, and other | |
| Regulatory assets, deferred charges, and other | |
| Total assets | |
| Total assets | |
| Total assets | |
______________
(1) Increase in Other is due primarily to an increased cash balance and the acquisitions of oil and gas properties in 2021.
(2) Eliminations primarily relate to the intercompany notes and accounts receivable generated by our cash management program.
| | | | | | | | |
| The Williams Companies, Inc. |
| Notes to Consolidated Financial Statements – (Continued) |
|
Note 19 – Subsequent Events
Quarterly Dividends to Common Stockholders
On January 30, 2024, our board of directors approved a regular quarterly dividend to common stockholders of $0.475 per share payable on March 25, 2024.
Gulf Coast Storage Acquisition
See Note 3 – Acquisitions and Divestitures for discussion.
Long-term Debt Issuance
In January 2024, we issued $1.1 billion of 4.9 percent senior unsecured notes due March 15, 2029, and $1 billion of 5.15 percent senior unsecured notes due March 15, 2034 (see Note 12 – Debt and Banking Arrangements). We used a portion of the proceeds in January 2024 to pay down $725 million of commercial paper outstanding at December 31, 2023.
The Williams Companies, Inc.
Schedule II — Valuation and Qualifying Accounts
| | | | | | Additions | | | | | | | | Additions | | |
| | | Beginning
Balance | | Charged
(Credited)
To Costs and
Expenses | | Other | | Deductions | | Ending
Balance | | Beginning
Balance | | Charged
(Credited)
To Costs and
Expenses | | Other | | Deductions | | Ending
Balance |
| | | (Millions) | | (Millions) |
| 2023 | |
| Deferred tax asset valuation allowance (1) | |
| Deferred tax asset valuation allowance (1) | |
| Deferred tax asset valuation allowance (1) | |
| 2022 | |
| Deferred tax asset valuation allowance (1) | |
| Deferred tax asset valuation allowance (1) | |
| Deferred tax asset valuation allowance (1) | |
| 2021 | 2021 | |
| Deferred tax asset valuation allowance (1) | Deferred tax asset valuation allowance (1) | $ | 325 | | | $ | (28) | | | $ | — | | | $ | — | | | $ | 297 | |
| 2020 | |
| Deferred tax asset valuation allowance (1) | Deferred tax asset valuation allowance (1) | 319 | | | 6 | | | — | | | — | | | 325 | |
| 2019 | |
| Deferred tax asset valuation allowance (1) | Deferred tax asset valuation allowance (1) | 320 | | | (1) | | | — | | | — | | | 319 | |
__________
(1) Deducted from related assets.
Item 9. Changes in and Disagreements with Accountants on Accounting and Financial Disclosure
None.
Item 9A. Controls and Procedures
Disclosure Controls and Procedures
Our management, including our Chief Executive Officer and Chief Financial Officer, does not expect that our disclosure controls and procedures (as defined in Rules 13a - 15(e) and 15d - 15(e) of the Securities Exchange Act of 1934, as amended)Act) (Disclosure Controls) or our internal control over financial reporting (Internal Controls) will prevent all errors and all fraud. A control system, no matter how well conceived and operated, can provide only reasonable, not absolute, assurance that the objectives of the control system are met. Further, the design of a control system must reflect the fact that there are resource constraints, and the benefits of controls must be considered relative to their costs. Because of the inherent limitations in all control systems, no evaluation of controls can provide absolute assurance that all control issues and instances of fraud, if any, within the company have been detected. These inherent limitations include the realities that judgments in decision-making can be faulty, and that breakdowns can occur because of simple errorerrors or mistake.mistakes. Additionally, controls can be circumvented by the individual acts of some persons, by collusion of two or more people, or by management override of the control. The design of any system of controls also is based in part upon certain assumptions about the likelihood of future events, and there can be no assurance that any design will succeed in achieving its stated goals under all potential future conditions. Because of the inherent limitations in a cost-effective control system, misstatements due to error or fraud may occur and not be detected. We monitor our Disclosure Controls and Internal Controls and make modifications as necessary; our intent in this regard is that the Disclosure Controls and Internal Controls will be modified as systems change and conditions warrant.
Evaluation of Disclosure Controls and Procedures
An evaluation of the effectiveness of the design and operation of our Disclosure Controls was performed as of the end of the period covered by this report. This evaluation was performed under the supervision and with the participation of our management, including our Chief Executive Officer and Chief Financial Officer. Based upon that evaluation, our Chief Executive Officer and Chief Financial Officer concluded that these Disclosure Controls are effective at a reasonable assurance level.
As disclosed in Note 3 – Acquisitions of Notes to Consolidated Financial Statements,and Divestitures, we acquired SequentMountainWest on July 1, 2021,February 14, 2023, and its total revenues constituted approximately (0.8)2 percent of total revenues as shown on our consolidated financial statements for the year ended December 31, 2021 (Sequent’s total revenues, excluding net gain (loss) on commodity derivatives, constituted approximately (0.4) percent of total revenues, excluding net gain (loss) on commodity derivatives during that period). Sequent’s2023. MountainWest’s total assets constituted approximately 3.33 percent of total assets as shown on our consolidated financial statements as of December 31, 2021.2023. We also acquired Cureton on November 30, 2023, and its total revenues constituted approximately zero percent of total revenues as shown on our consolidated financial statements for the year ended December 31, 2023. Cureton’s total assets constituted approximately 1 percent of total assets as shown on our consolidated financial statements as of December 31, 2023. We excluded Sequent’sMountainWest and Cureton’s disclosure controls and procedures that are subsumed by its internal control over financial reporting from the scope of management’s assessment of the effectiveness of our disclosure controls and procedures. This exclusion is in accordance with the guidance issued by the Staff of the Securities and Exchange Commission that an assessment of recent business combinations may be omitted from management’s assessment of internal control over financial reporting for one year following the acquisition.
Changes in Internal Control Over Financial Reporting
Other than as set forth above, there have been no changes during the fourth quarter of 20212023 that have materially affected, or are reasonably likely to materially affect, our Internal Control over Financial Reporting.
Management’s Annual Report on Internal Control over Financial Reporting
Management is responsible for establishing and maintaining adequate internal control over financial reporting (as defined in Rules 13a - 15(f) and 15d - 15(f) under the Securities Exchange Act of 1934)Act). Our internal control over financial
reporting is designed to provide reasonable assurance to our management and board of directors
regarding the preparation and fair presentation of financial statements in accordance with accounting principles generally accepted in the United States. Our internal control over financial reporting includes those policies and procedures that (i) pertain to the maintenance of records that, in reasonable detail, accurately and fairly reflect the transactions and dispositions of our assets; (ii) provide reasonable assurance that transactions are recorded as to permit preparation of financial statements in accordance with generally accepted accounting principles, and that our receipts and expenditures are being made only in accordance with authorization of our management and board of directors; and (iii) provide reasonable assurance regarding prevention or timely detection of unauthorized acquisition, use or disposition of our assets that could have a material effect on our financial statements.
All internal control systems, no matter how well designed, have inherent limitations including the possibility of human error and the circumvention or overriding of controls. Therefore, even those systems determined to be effective can provide only reasonable assurance with respect to financial statement preparation and presentation.
Under the supervision and with the participation of our management, including our Chief Executive Officer and Chief Financial Officer, we assessed the effectiveness of our internal control over financial reporting as ofat December 31, 2021,2023, based on the criteria set forth by the Committee of Sponsoring Organizations of the Treadway Commission (COSO) in Internal Control — Integrated Framework (2013). Based on our assessment, which excluded Sequent’sMountainWest and Cureton’s internal control over financial reporting as previously discussed, we concluded that, as ofat December 31, 2021,2023, our internal control over financial reporting was effective.
Ernst & Young LLP, our independent registered public accounting firm, has audited our internal control over financial reporting, as stated in their report which is included in this Annual Report on Form 10-K.
Report of Independent Registered Public Accounting Firm
TheTo the Stockholders and the Board of Directors of
The Williams Companies, Inc.
Opinion on Internal Control Over Financial Reporting
We have audited The Williams Companies, Inc.’s internal control over financial reporting as of December 31, 2021,2023, based on criteria established in Internal Control-Integrated Framework issued by the Committee of Sponsoring Organizations of the Treadway Commission (2013 framework) (the COSO criteria). In our opinion, The Williams Companies, Inc. (the Company) maintained, in all material respects, effective internal control over financial reporting as of December 31, 2021,2023, based on the COSO criteria.
As indicated in the accompanying Management’s Annual Report on Internal Control over Financial Reporting, management’s assessment of and conclusion on the effectiveness of internal control over financial reporting did not include the internal controls of Sequent Energy Management, L.P. and Sequent Energy Canada, Corp.,MountainWest Pipelines Holding Company or Cureton Front Range, LLC, which are included in the 20212023 consolidated financial statements of the Company and collectively constituted $1,592 millionthree and $11 millionone percent of total and net assets, respectively, as of December 31, 2021 and $(86) million and $(131) million of revenues and net income, respectively, for the year then ended.2023. Our audit of internal control over financial reporting of the Company also did not include an evaluation of the internal control over financial reporting of Sequent Energy Management, L.P. and Sequent Energy Canada, Corp.MountainWest Pipelines Holding Company or Cureton Front Range, LLC.
We also have audited, in accordance with the standards of the Public Company Accounting Oversight Board (United States) (PCAOB), the consolidated balance sheet of the Company as of December 31, 20212023 and 2020,2022, the related consolidated statements of income, comprehensive income (loss), changes in equity and cash flows for each of the three years in the period ended December 31, 2021,2023, and the related notes and the financial statement schedule listed in the index at Item 15(a) and our report dated February 28, 202221, 2024 expressed an unqualified opinion thereon.
Basis for Opinion
The Company’s management is responsible for maintaining effective internal control over financial reporting and for its assessment of the effectiveness of internal control over financial reporting included in the accompanying Management’s Annual Report on Internal Control over Financial Reporting. Our responsibility is to express an opinion on the Company’s internal control over financial reporting based on our audit. We are a public accounting firm registered with the PCAOB and are required to be independent with respect to the Company in accordance with the U.S. federal securities laws and the applicable rules and regulations of the Securities and Exchange Commission and the PCAOB.
We conducted our audit in accordance with the standards of the PCAOB. Those standards require that we plan and perform the audit to obtain reasonable assurance about whether effective internal control over financial reporting was maintained in all material respects.
Our audit included obtaining an understanding of internal control over financial reporting, assessing the risk that a material weakness exists, testing and evaluating the design and operating effectiveness of internal control based on the assessed risk, and performing such other procedures as we considered necessary in the circumstances. We believe that our audit provides a reasonable basis for our opinion.
Definition and Limitations of Internal Control Over Financial Reporting
A company’s internal control over financial reporting is a process designed to provide reasonable assurance regarding the reliability of financial reporting and the preparation of financial statements for external purposes in accordance with generally accepted accounting principles. A company’s internal control over financial reporting includes those policies and procedures that (1) pertain to the maintenance of records that, in reasonable detail, accurately and fairly reflect the transactions and dispositions of the assets of the company; (2) provide reasonable assurance that transactions are recorded as necessary to permit preparation of financial statements in accordance with generally accepted accounting principles, and that receipts and expenditures of the company are being made only in accordance with authorizations of management and directors of the company; and (3) provide reasonable
assurance regarding prevention or timely detection of unauthorized acquisition, use, or disposition of the company’s assets that could have a material effect on the financial statements.
Because of its inherent limitations, internal control over financial reporting may not prevent or detect misstatements. Also, projections of any evaluation of effectiveness to future periods are subject to the risk that controls may become inadequate because of changes in conditions, or that the degree of compliance with the policies or procedures may deteriorate.
/s/ Ernst & Young LLP
Tulsa, Oklahoma
February 28, 202221, 2024
Item 9B. Other Information
None.During the three months ended December 31, 2023, no director or officer of the Company adopted or terminated a “Rule 10b5-1 trading arrangement” or “non-Rule 10b5-1 trading arrangement,” as each term is defined in Item 408(a) of Regulation S-K.
Item 9C. Disclosure Regarding Foreign Jurisdictions that Prevent Inspections
Not applicable.
PART III
Item 10. Directors, Executive Officers and Corporate Governance
The information regarding our directors and nominees for director required by Item 401 of Regulation S-K will be presented under the heading “Corporate Governance and Board Matters” in our definitive proxy statement prepared for the solicitation of proxies in connection with our Annual Meeting of Stockholders to be held April 26, 2022,30, 2024, which shall be filed no later than March 17, 202221, 2024 (Proxy Statement), which information is incorporated by reference herein.
Information regarding our executive officers required by Item 401 of Regulation S-K is presented at the end of Part I herein and captioned “Information About Our Executive Officers,” as permitted by General Instruction G(3) and the Instruction to Item 401 of Regulation S-K.
Information required by paragraphs (c)(3), (d)(4) and (d)(5) of Item 407 of Regulation S-K will be included under the heading “Questions and Answers About the Annual Meeting and Voting” and “Corporate Governance and Board Matters” in our Proxy Statement, which information is incorporated by reference herein.
Our Code of Business Conduct, together with our Corporate Governance Guidelines, the charters for each of our board committees, and our Code of Business Conduct applicable to all employees, including our Chief Executive Officer, Chief Financial Officer, and Chief Accounting Officer, or persons performing similar functions, are available on our Internet website at www.williams.com. We will provide, free of charge, a copy of our Code of Business Conduct or any of our other corporate documents listed above upon written request to our Corporate Secretary at Williams, One Williams Center, Suite 4700, Tulsa, Oklahoma 74172. We intend to disclose any amendments to or waivers, in each case, of the Code of Business Conduct on behalf of our Chief Executive Officer, Chief Financial Officer, Chief Accounting Officer, and persons performing similar functions on the corporate governance section of our Internet website at www.williams.com, promptly following the date of any such amendment or waiver.
Item 11. Executive Compensation
The information required by Item 402 and paragraphs (e)(4) and (e)(5) of Item 407 of Regulation S-K regarding executive compensation will be presented under the headings “Compensation Discussion and Analysis,” “Executive Compensation Tables and Other Information,” “Director Compensation,” “Compensation and Management Development Committee Report on Executive Compensation,” and “Compensation and Management Development Committee Interlocks and Insider Participation” in our Proxy Statement, which information is incorporated by reference herein. Notwithstanding the foregoing, the information provided under the heading “Compensation and Management Development Committee Report on Executive Compensation” in our Proxy Statement is furnished and shall not be deemed to be filed for purposes of Section 18 of the Securities Exchange Act, of 1934, as amended, is not subject to the liabilities of that section and is not deemed incorporated by reference in any filing under the Securities Act of 1933, as amended.Act.
Item 12. Security Ownership of Certain Beneficial Owners and Management and Related Stockholder Matters
The information regarding securities authorized for issuance under equity compensation plans required by Item 201(d) of Regulation S-K and the security ownership of certain beneficial owners and management required by
Item 403 of Regulation S-K will be presented under the headings “Equity Compensation Stock Plans” and “Security Ownership of Certain Beneficial Owners and Management” in our Proxy Statement, which information is incorporated by reference herein.
Item 13. Certain Relationships and Related Transactions, and Director Independence
The information regarding certain relationships and related transactions required by Item 404 and Item 407(a) of Regulation S-K will be presented under the heading “Corporate���Corporate Governance and Board Matters” in our Proxy Statement, which information is incorporated by reference herein.
Item 14. Principal Accountant Fees and Services
The information regarding our principal accounting fees and services required by Item 9(e) of Schedule 14A will be presented under the heading “Principal Accountant Fees and Services” in our Proxy Statement, which information is incorporated by reference herein.
PART IV
Item 15. Exhibits and Financial Statement Schedules
(a) 1 and 2.
| | | | | |
| Page |
| Covered by report of independent auditors (PCAOB ID: 42): | |
| |
| |
| |
| |
| |
| |
Schedule for each year in the three-year period ended December 31, 20212023: | |
| |
| |
| |
All other schedules have been omitted since the required information is not present or is not present in amounts sufficient to require submission of the schedule, or because the information required is included in the financial statements and notes thereto.
(a) 3 and (b). The exhibits listed below are filed as part of this annual report.
INDEX TO EXHIBITS
| | | | | | | | |
Exhibit
No. | | Description |
| | |
2.1 | — | |
| | |
2.2 | — | Amendment No 1. to Agreement and Plan of Merger dated as of May 1, 2016, by and among The Williams Companies, Inc., Energy Transfer Corp LP, Energy Transfer Corp GP, LLC, Energy Transfer Equity, L.P., LE GP, LLC and Energy Transfer Equity GP, LLC (filed on May 3, 2016, as Exhibit 2.1 to The Williams Companies, Inc.’s current report on Form 8-K (File No. 001-04174) and incorporated herein by reference). |
| | |
2.3 | — | Agreement and Plan of Merger dated as of September 28, 2015, by and among The Williams Companies, Inc., Energy Transfer Corp LP, Energy Transfer Corp GP, LLC, Energy Transfer Equity, L.P., LE GP, LLC and Energy Transfer Equity GP, LLC (filed on October 1, 2015, as Exhibit 2.1 to The Williams Companies, Inc.’s current report on Form 8-K (File No. 001-04174) and incorporated herein by reference). |
| | |
| 3.1 | — | |
| | |
| 3.2 | — | |
| | | | | | | | |
Exhibit
No. | | Description |
| | |
| | |
| 3.3 | — | |
| | |
| 3.4 | — | |
| | |
| 4.1 | — | |
| | |
| | | | | | | | |
Exhibit
No. | | Description |
| | |
| 4.2 | — | |
| | |
| 4.3 | — | Supplemental Indenture No. 3, dated March 31, 1998, among MAPCO Inc., Williams Holdings of Delaware, Inc. and Bank One Trust Company, N.A. (formerly The First National Bank of Chicago), as Trustee (filed on March 30, 1999, as Exhibit 4(J) to Williams Holdings of Delaware, Inc.’s annual report on Form 10-K for the fiscal year ended December 31, 1998 (File No. 000-20555) and incorporated herein by reference). |
| | |
| 4.4 | — | Fourth Supplemental Indenture, dated as of July 31, 1999, among Williams Holdings of Delaware, Inc., The Williams Companies, Inc. and Bank One Trust Company, N.A. (formerly The First National Bank of Chicago), as Trustee (filed on March 28, 2000, as Exhibit 4(q) to The Williams Companies, Inc.’s annual report on Form 10-K (File No. 001-04174) and incorporated herein by reference). |
| | |
| 4.5 | — | |
| | |
| 4.6 | — | |
| | |
| 4.7 | — | |
| | |
| 4.8 | — | |
| | |
| 4.9 | — | |
| | |
| | | | | | | | |
Exhibit
No. | | Description |
| | |
| 4.10 | — | |
| | |
4.11 | — | |
| | |
4.124.11 | — | |
| | |
4.134.12 | — | |
| | |
| | | | | | | | |
Exhibit
No. | | Description |
| | |
4.144.13 | — | |
| | |
| 4.14 | — | |
| | |
| 4.15 | 4.15— | |
| | |
| 4.16 | — | |
| | |
| 4.17 | — | |
| | |
| 4.18 | — | |
| | |
4.164.19 | — | |
| | |
4.174.20 | — | |
| | |
4.184.21 | — | |
| | |
4.19 | — | |
| | |
4.20 | — | |
| | |
| | | | | | | | |
Exhibit
No. | | Description |
| | |
4.214.22 | — | |
| | |
4.224.23 | — | |
| | |
| | | | | | | | |
Exhibit
No. | | Description |
| 4.23 | |
| 4.24 | — | |
| | |
4.244.25 | — | |
| | |
4.254.26 | — | |
| | |
4.264.27 | — | |
| | |
4.274.28 | — | |
| | |
4.284.29 | — | |
| | |
4.294.30 | — | |
| | |
4.304.31 | — | |
| | |
4.314.32 | — | |
| | |
4.324.33 | — | |
| | | | | | | | |
Exhibit
No. | | Description |
| | |
| | |
4.334.34 | — | |
| | |
4.344.35 | — | |
| | |
| | | | | | | | |
Exhibit
No. | | Description |
| 4.35 | |
| 4.36 | — | |
| | |
| 4.37 | — | |
| | |
| 4.38 | 4.36*— | |
| | |
| 4.39* | — | |
| | |
| 4.40 | — | |
| | |
| 10.1*§ | — | |
| | |
10.1§10.2§ | — | |
| | |
10.2§10.3§ | — | |
| | |
10.3§10.4§ | — | |
| | |
10.4§10.5§ | — | |
| | |
10.5§10.6§ | — | |
| | |
10.6§10.7§ | — | |
| | |
10.7§10.8§ | — | |
| | |
10.8§10.9§ | — | |
| | |
10.9§10.10§ | — | |
| | |
| | | | | | | | |
Exhibit
No. | | Description |
| | |
10.10§10.11§ | — | |
| | |
10.11§10.12§ | — | |
| | |
10.12§ | — | |
| | |
10.13§ | — | |
| | |
10.14§10.13 | — | |
| | |
10.15§10.14§ | — | |
| | |
10.16§10.15§ | — | |
| | |
10.17§ | — | |
| | |
10.18§ | — | |
| | |
10.19§ | — | |
| | |
10.20§ | — | |
| | |
10.21§10.16§ | — | |
| | |
10.22§10.17§ | — | |
| | |
| | | | | | | | |
Exhibit
No. | | Description |
| | |
10.23§10.18§ | — | |
| | |
10.24§10.19§ | — | |
| | |
10.25§10.20§ | — | |
| | |
10.26§10.21§ | — | |
| | |
10.27§10.22§ | — | |
| | |
| | | | | | | | |
Exhibit
No. | | Description |
| 10.28§ | |
| 10.23§ | — | |
| | |
10.29§10.24§ | — | |
| | |
10.30§10.25§ | — | |
| | |
10.31§*10.26§ | — | |
| | |
10.32§10.27§ | — | |
| | |
10.33§*10.28§ | — | |
| | |
| 10.29§ | — | |
| | |
| 10.30§ | 10.34§— | |
| | |
| 10.31§ | — | |
| | |
| | | | | | | | |
Exhibit
No. | | Description |
| | |
10.35§10.32§ | — | |
| | |
10.36§10.33§ | — | The Williams Companies, Inc. Executive Severance Pay Plan, dated November 14, 2012as amended and restated, effective August 1, 2022 (filed July20, 2016,October 31, 2022, as Exhibit 10.210.1 to The Williams Companies, Inc.’s currentquarterly report on Form 8-K10-Q (File No. 001-04174) and incorporated herein by reference). |
| | |
10.37§10.34§ | — | |
| | |
| 10.35 | — | Amended and Restated Credit Agreement dated as of October 8, 2021, between The Williams Companies, Inc., Northwest Pipeline LLC, and Transcontinental Gas Pipe Line Company, LLC, as borrowers, the lenders named therein, and Wells Fargo Bank, National Association, as Administrative Agent (filed July 20, 2016,on October 8, 2021, as Exhibit 10.1 to The Williams Companies, Inc.’s current report on Form 8-K (File No. 001-04174) and incorporated herein by reference). |
| | | | | | | | |
Exhibit
No. | | Description |
| 10.38§ | — |
| | |
10.39 | — | Amended and Restated Credit Agreement dated as of October 8, 2021, between The Williams Companies, Inc., Northwest Pipeline LLC, and Transcontinental Gas Pipe Line Company, LLC, as borrowers, the lenders named therein, and Wells Fargo Bank, National Association, as Administrative Agent (filed on October 8, 2021, as Exhibit 10.1 to The Williams Companies, Inc.’s current report on Form 8-K (File No. 001-04174) and incorporated herein by reference). |
| | |
10.4010.36 | — | |
| | |
| 21* | — | |
| | |
| 23.1* | — | |
| | |
23.2* | — | |
| | |
| 31.1* | — | |
| | |
| 31.2* | — | |
| | |
| 32** | — | |
| | |
| 97.1* | — | |
| | |
| 101.INS* | — | XBRL Instance Document. The instance document does not appear in the Interactive Data File because its XBRL tags are embedded within the inline XBRL document. |
| | |
| 101.SCH* | — | XBRL Taxonomy Extension Schema. |
| | |
| 101.CAL* | — | XBRL Taxonomy Extension Calculation Linkbase. |
| | |
| 101.DEF* | — | XBRL Taxonomy Extension Definition Linkbase. |
| | |
| 101.LAB* | — | XBRL Taxonomy Extension Label Linkbase. |
| | |
| 101.PRE* | — | XBRL Taxonomy Extension Presentation Linkbase. |
| | |
| | | | | | | | |
Exhibit
No. | | Description |
| | |
| 104* | — | Cover Page Interactive Data File. The cover page interactive data file does not appear in the interactive data file because its XBRL tags are embedded within the inline XBRL document (contained in Exhibit 101). |
| | | | | |
| ______________ |
| * | Filed herewith |
| ** | Furnished herewith |
| § | Management contract or compensatory plan or arrangement |
Item 16. Form 10-K Summary
Not applicable.
SIGNATURES
Pursuant to the requirements of Section 13 or 15(d) of the Securities Exchange Act of 1934, the registrant has duly caused this report to be signed on its behalf by the undersigned, thereunto duly authorized.
| | | | | | | | |
THE WILLIAMS COMPANIES, INC. (Registrant) |
| | |
| By: | | /s/ MARY A. HAUSMAN |
| | Mary A. Hausman Vice President, Chief Accounting Officer and Controller |
Date: February 28, 202221, 2024
Pursuant to the requirements of the Securities Exchange Act of 1934, this report has been signed below by the following persons on behalf of the registrant and in the capacities and on the dates indicated.
| | | | | | | | | | | | | | |
| Signature | | Title | | Date |
| | | | |
| /s/ ALAN S. ARMSTRONG | | President, Chief Executive Officer and Director | | February 28, 202221, 2024 |
| Alan S. Armstrong | | (Principal Executive Officer) | | |
| | | | |
| /s/ JOHN D. PORTER | | Senior Vice President and Chief Financial Officer | | February 28, 202221, 2024 |
John D. PORTERPorter | | (Principal Financial Officer) | | |
| | | | |
| /s/ MARY A. HAUSMAN | | Vice President, Chief Accounting Officer and Controller | | February 28, 202221, 2024 |
| Mary A. Hausman | | (Principal Accounting Officer) | | |
| | | | |
| /s/ STEPHEN W. BERGSTROM | | Chairman of the Board | | February 28, 202221, 2024 |
| Stephen W. Bergstrom | | | | |
| | | | |
/s/ NANCY K. BUESE | | Director | | February 28, 2022 |
Nancy K. Buese | | | | |
| | | | |
/s/ STEPHEN I. CHAZEN | | Director | | February 28, 2022 |
Stephen I. Chazen | | | | |
| | | | |
/s/ CHARLES I. COGUT | | Director | | February 28, 2022 |
Charles I. Cogut | | | | |
| | | | |
| /s/ MICHAEL A. CREEL | | Director | | February 28, 202221, 2024 |
| Michael A. Creel | | | | |
| | | | |
| /s/ STACEY H. DORÉ | | Director | | February 28, 202221, 2024 |
| Stacey H. Doré | | | | |
| | | | |
| /s/ CARRI A. LOCKHART | | Director | | February 21, 2024 |
| Carri A. Lockhart | | | | |
| | | | |
| /s/ RICHARD E. MUNCRIEF | | Director | | | |
| | | | February 21, 2024 |
| Richard E. Muncrief | | | | |
| | | | |
| /s/ PETER A. RAGAUSS | | Director | | February 28, 202221, 2024 |
| Peter A. Ragauss | | | | |
| | | | |
| | | | |
| | | | |
| | | | |
| /s/ ROSE M. ROBESON | | Director | | February 28, 202221, 2024 |
| Rose M. Robeson | | | | |
| | | | |
| | | | | | | | | | | | | | |
Signature | | Title | | Date |
| | | | |
| /s/ SCOTT D. SHEFFIELD | | Director | | February 28, 202221, 2024 |
| Scott D. Sheffield | | | | |
| | | | |
| | | | | | | | | | | | | | |
| Signature | | Title | | Date |
| | | | |
| /s/ MURRAY D. SMITH | | Director | | February 28, 202221, 2024 |
| Murray D. Smith | | | | |
| | | | |
| /s/ WILLIAM H. SPENCE | | Director | | February 28, 202221, 2024 |
| William H. Spence | | | | |
| | | | |
| /s/ JESSE J. TYSON | | Director | | February 21, 2024 |
| Jesse J. Tyson | | | | |