UNITED STATES
SECURITIES AND EXCHANGE COMMISSION
Washington, D.C. 20549
(Mark One)
xANNUAL REPORT PURSUANT TO SECTION 13 OR 15(D) OF THE SECURITIES EXCHANGE ACT OF 1934 for the fiscal year ended August 26, 201725, 2018; or
oTRANSITION REPORT PURSUANT TO SECTION 13 OR 15(D) OF THE SECURITIES EXCHANGE ACT OF 1934 for the transition period from ___________________ to _______________________
Commission File Number 001‑06403
WINNEBAGO INDUSTRIES, INC.
(Exact name of registrant as specified in its charter)
|
| | |
| Iowa | | 42-0802678 |
| (State or other jurisdiction of | | (I.R.S. Employer Identification No.) |
| incorporation or organization) | | |
| | | |
| P.O. Box 152, Forest City, Iowa | | 50436 |
| (Address of principal executive offices) | | (Zip Code) |
Registrant's telephone number, including area code: (641) 585‑3535
Securities registered pursuant to Section 12(b) of the Act:
|
| | |
| Title of each class | | Name of each exchange on which registered |
| Common Stock ($.50 par value) | | The New York Stock Exchange, Inc. |
| | | Chicago Stock Exchange, Inc. |
Securities registered pursuant to Section 12(g) of the Act: None
Indicate by check mark if the registrant is a well-known seasoned issuer, as defined in Rule 405 of the Securities Act. Yes o No x
Indicate by check mark whetherif the registrant is not required to file reports pursuant to Section 13 or Section 15(d) of the Act. Yes o No x
Indicate by check mark whether the registrant (1) has filed all reports required to be filed by Section 13 or 15(d) of the Securities Exchange Act of 1934 during the preceding 12 months (or for such shorter period that the registrant was required to file such reports), and (2) has been subject to such filing requirements for the past 90 days. Yes x No o
Indicate by check mark whether the registrant has submitted electronically and posted on its corporate Web Site, if any, every Interactive Data File required to be submitted and posted pursuant to Rule 405 of Regulation S-T (§232.405 of this chapter) during the preceding 12 months (or for such shorter period that the registrant was required to submit and post such files). Yes x No o
Indicate by check mark if disclosure of delinquent filers pursuant to Item 405 of Regulation S-K (§229.405 of this chapter) is not contained herein, and will not be contained, to the best of the registrant's knowledge, in definitive proxy or information statements incorporated by reference in Part III of this Form 10-K or any amendment to this Form 10-Kxo.
Indicate by check mark whether the registrant is a large accelerated filer, an accelerated filer, a non-accelerated filer, smaller reporting company, or an emerging growth company. See the definitions of "large accelerated filer," "accelerated filer," "smaller reporting company", and "emerging growth company" in Rule 12b-2 of the Exchange Act.
Large Accelerated Filer x Accelerated Filer o Non-accelerated filer oSmaller Reporting Company oEmerging Growth Company o
If an emerging growth company, indicate by check mark if the registrant has elected not to use the extended transition period for complying with any new or revised financial accounting standards provided pursuant to Section 13(a) of the Exchange Act. o
Indicate by check mark whether the registrant is a shell company (as defined in Rule 12b-2 of the Act). Yes o No x
Aggregate market value of the common stock held by non-affiliates of the registrant: $1,025,558,857 (30,705,355$1,122,564,545 (26,952,330 shares at the closing price on the New York Stock Exchange of $33.40$41.65 on February 24, 2017)23, 2018).
Common stock outstanding on October 17, 2017: 31,634,51715, 2018: 31,629,704 shares.
DOCUMENTS INCORPORATED BY REFERENCE
Portions of the registrant's Proxy Statement relating to the registrant's December 20172018 Annual Meeting of Shareholders, scheduled to be held December 12, 201711, 2018, are incorporated by reference into Part II and Part III of this Annual Report on Form 10-K where indicated.
Winnebago Industries, Inc.
2017Fiscal 2018 Form 10-K Annual Report
Table of Contents
Glossary
The following terms and abbreviations appear in the text of this report and are defined as follows:
|
| |
ABL | Credit Agreement dated as of November 8, 2016 among Winnebago Industries, Inc., Winnebago of Indiana, LLC, Grand Design RV, LLC, the other loan parties thereto and JPMorgan Chase Bank, N.A. as Administrative Agent |
AOCI | Accumulated Other Comprehensive Income (Loss) |
Amended Credit Agreement | Credit Agreement dated as of May 28, 2014 by and between Winnebago Industries, Inc. and Winnebago of Indiana, LLC, as Borrowers, and Wells Fargo Capital Finance, as Agent; terminated on November 8, 2016 |
ASC | Accounting Standards Codification |
ASP | Average Sales Price |
ASU | Accounting Standards Update |
Blocker Corporation | SPGE VIII - B GD RV Blocker Corporation |
COLI | Company Owned Life Insurance |
Credit Agreement | Collective reference to the ABL and Term Loan |
EPS | Earnings Per Share |
ERP | Enterprise Resource Planning |
FASB | Financial Accounting Standards Board |
FIFO | First In, First Out |
GAAP | Generally Accepted Accounting Principles |
Grand Design | Grand Design RV, LLC |
IRS | Internal Revenue Service |
IT | Information Technology |
JPMorgan | JPMorgan Chase Bank, N.A. |
LIBOR | London Interbank Offered Rate |
LIFO | Last In, First Out |
LTIP | Long-Term Incentive Plan |
Motorized | Business segment including motorhomes and other related manufactured products |
MVA | Motor Vehicle Act |
NMF | Non-Meaningful Figure |
NOL | Net Operating Loss |
NYSE | New York Stock Exchange |
OCI | Other Comprehensive Income |
Octavius | Octavius Corporation, a wholly-owned subsidiary of Winnebago Industries, Inc. |
OSHA | Occupational Safety and Health Administration |
ROE | Return on Equity |
RV | Recreation Vehicle |
RVIA | Recreation Vehicle Industry Association |
SEC | U.S. Securities and Exchange Commission |
SERP | Supplemental Executive Retirement Plan |
SG&A | Selling, General and Administrative Expenses |
SIR | Self-Insured Retention |
Stat Surveys | Statistical Surveys, Inc. |
Term Loan | Loan Agreement dated as of November 8, 2016 among Winnebago Industries, Inc., Octavius Corporation, the other loan parties thereto and JPMorgan Chase Bank, N.A. as Administrative Agent |
Towable | Business segment including products which are not motorized and are towable by another vehicle |
US | United States of America |
XBRL | eXtensible Business Reporting Language |
YTD | Year to Date |
WINNEBAGO INDUSTRIES, INC.
FORM 10‑K
Report for the Fiscal Year Ended August 26, 201725, 2018
Forward-Looking Information
Certain of the matters discussed in this Annual Report on Form 10-K are "forward-looking statements" within the meaning of Section 27A of the Securities Act of 1933, as amended, and Section 21E of the Securities Exchange Act of 1934, as amended, which involve risks and uncertainties. A number of factors could cause actual results to differ materially from these statements, including, but not limited to:to, competition and new product introductions by competitors, our ability to attract and retain qualified personnel, business or production disruptions, sales order cancellations, risk related to compliance with debt covenants and leverage ratios, stock price volatility, availability of labor, a slowdown in the economy, low consumer confidence, the effect of global tensions, increases in interest rates, availability of credit, low consumer confidence, availability of labor, significant increase in repurchase obligations, inadequate liquidity or capital resources, availabilityrisk related to cyclicality and price of fuel, a slowdown in the economy, increased material and component costs, availability of chassis and other key component parts, sales order cancellations,seasonality, slower than anticipated sales of new or existing products, new product introductions by competitors, the effect of global tensions, integration of operations relating to mergersmerger and acquisitionsacquisition activities generally, business interruptions,inadequate liquidity or capital resources, inventory and distribution channel management, our ability to innovate, our reliance on large dealer organizations, significant increase in repurchase obligations, availability and price of fuel, availability of chassis and other key component parts, increased material and component costs, exposure to warranty claims, ability to protect our intellectual property, exposure to product liability claims, dependence on information systems and web applications, any unexpected expenses related to ERP, risks relating to the integrationimplementation of our acquisition of Grand Design including: risks inherent in the achievement of cost synergies and the timing thereof, risks related to the disruption of the transaction to Winnebago and Grand Design and its management, the effect of the transaction on Grand Design's ability to retain and hire key personnel and maintain relationships with customers, suppliers and other third parties,Enterprise Resource Planning system, risk related to compliance with debt covenants and leverage ratios,data security, governmental regulation, including for climate change, risk related to anti-takeover provisions applicable to us, and other factors which may be disclosed throughout this Annual Report on Form 10-K. Although we believe that the expectations reflected in the "forward-looking statements" are reasonable, we cannot guarantee future results, levels of activity, performance, or achievements. Undue reliance should not be placed on these "forward-looking statements," which speak only as of the date of this report. We undertake no obligation to publicly update or revise any "forward-looking statements," whether as a result of new information, future events, or otherwise, except as required by law or the rules of the NYSE.New York Stock Exchange. We advise you, however, to consult any further disclosures made on related subjects in future quarterly reports on Form 10-Q and current reports on Form 8-K that are filed or furnished with the SEC.U.S. Securities and Exchange Commission ("SEC").
PART I
Item 1. Business Business.
General
The "Company," "Winnebago Industries," "we," "our""our," and "us" are used interchangeably to refer to Winnebago Industries, Inc. and its wholly-owned subsidiaries, as appropriate in the context.
Winnebago Industries, Inc., headquartered in Forest City, Iowa, is a leading United StatesU.S. manufacturer with a diversified portfolio of RVsrecreation vehicles ("RV"s) and marine products used primarily in leisure travel and outdoor recreation activities.
We own or leaseproduce our motorhomes in manufacturing facilities in Middlebury, Indiana, where we manufactureIowa and Oregon; our travel trailerstrailer and fifth wheel RVstrailers in Indiana; and Junction City, Oregon, where we manufacture motorhomes.our marine products in Florida. We distribute our RV and marine products primarily through independent dealers throughout the U.S. and Canada, who then retail the products to the end consumer. We also distribute our marine products internationally through independent dealers, who then retail the products to the end consumer.
We were incorporated under the laws of the state of Iowa on February 12, 1958, and adopted our present name on February 28, 1961. Our executive offices are located at 605 West Crystal Lake Road in Forest City, Iowa. Our telephone number is (641) 585-3535.
Available Information
Our website, located at www.wgo.net, provides additional information about us. On our website, you can obtain, free of charge, this and prior year Annual Reports on Form 10-K, Quarterly Reports on Form 10-Q, Current Reports on Form 8-K, and all of our other filings with the SEC. Our recent press releases are also available on our website. Our website also contains important information regarding our corporate governance practices. Information contained on our website is not incorporated into this CurrentAnnual Report on Form 8-K. You may also read and copy any materials that we file with the SEC at the SEC's Public Reference Room at 100 F Street, NE, Room 1580, Washington, D.C. 20549. You may obtain information on the Public Reference Room by calling the SEC at 1-800-SEC-0330. In addition, the SEC maintains a website that contains reports, proxy statements and other information that is filed electronically with the SEC. The website can be accessed at www.sec.gov.10-K.
Principal Products
Beginning in the fourth quarter of Fiscal 2018, we have five operating segments: 1) Winnebago motorhomes, 2) Winnebago towables, 3) Grand Design towables, 4) Winnebago specialty vehicles, and 5) Chris-Craft marine. We haveevaluate performance based on each operating segment's Adjusted EBITDA, as defined within Item 7, Management's Discussion and Analysis of Financial Condition and Results of Operations, of this Annual Report on Form 10-K, which excludes certain corporate administration expenses and non-operating income and expense.
Our two reporting segments: (1) Motorized products and services and (2) Towable products and services. The Towable segment includes all products which are not motorized and are towable by another vehicle. The Motorized segment includes allreportable segments include: 1) Motorhome (comprised of products that include a motorized chassis as well as other related manufactured products. Net revenuesproducts and services) and 2) Towable (comprised of products which are not motorized and are generally towed by major product classesanother vehicle as well as other related manufactured products and services), which is an aggregation of the Winnebago towables and Grand Design towables operating segments.
The Corporate / All Other category includes the Winnebago specialty vehicles and Chris-Craft marine operating segments as well as expenses related to certain corporate administration expenses for the oversight of the enterprise. These expenses include items such as corporate leadership and administration costs. Previously, these expenses were allocated to each operating segment.
Prior year segment information has been reclassified to conform to the current reportable segment presentation. The reclassifications included removing the corporate administration expenses from both the Motorhome and Towable reportable segments and removing Winnebago specialty vehicles from the Motorhome reportable segment, as
follows:we begin to dedicate leadership and focus on these operations separately from our Winnebago motorhomes operations. |
| | | | | | | | | | | | | | | | | | | | | | | | | | | | | |
| | Year Ended (1) |
| (In thousands) | August 26, 2017 | | August 27, 2016 | | August 29, 2015 | | August 30, 2014 | | August 31, 2013 |
Motorized (2) | $ | 861,922 |
| 55.7 | % | | $ | 885,814 |
| 90.8 | % | | $ | 904,821 |
| 92.7 | % | | $ | 887,040 |
| 93.9 | % | | $ | 748,482 |
| 93.2 | % |
Towable (3) | 685,197 |
| 44.3 | % | | 89,412 |
| 9.2 | % | | 71,684 |
| 7.3 | % | | 58,123 |
| 6.1 | % | | 54,683 |
| 6.8 | % |
| Total net revenues | $ | 1,547,119 |
| 100.0 | % | | $ | 975,226 |
| 100.0 | % | | $ | 976,505 |
| 100.0 | % | | $ | 945,163 |
| 100.0 | % | | $ | 803,165 |
| 100.0 | % |
| |
(1)
| The fiscal year ended August 31, 2013 contained 53 weeks; all other fiscal years contained 52 weeks. |
| |
(2)
| Includes motorhome units, parts and services and other related manufactured products. |
| |
(3)
| Includes towable units and parts. |
Motorized products and services segment.
Motorhome
A motorhome is a self-propelled mobile dwelling used primarily as temporary living quarters during vacation and camping trips, or to support some other active lifestyle.and mobile lifestyles. The RVIARecreation Vehicle Industry Association ("RVIA") classifies motorhomes into three types, all of which we manufacture and sell under the Winnebago brand name, which are defined as follows: |
| | |
| Type | Description | Winnebago products offerings |
Class A (gas and diesel) | Conventional motorhomes constructed directly on medium- and heavy-duty truck chassis, which include the engine and drivetrain components. The living area and driver's compartment are designed and produced by the motorhome manufacturer. | Gas: Adventurer, Intent(1), Sightseer, Suncruiser, Sunova, Sunstar, Sunstar LX, Vista, Vista LX |
Diesel: Forza, Grand Tour, Horizon(1), Journey, Tour, Via |
Class B (gas and diesel) | Panel-type vans to which sleeping, kitchen, and/or toilet facilities are added. These models may also have a top extension to provide more headroom. | Winnebago Touring Coach (Era, Paseo, Revel(1), Travato) |
Class C (gas and diesel) | Motorhomes built on van-type chassis onto which the motorhome manufacturer constructs a living area with access to the driver's compartment. | Aspect, Cambria, Fuse, Minnie Winnie, Navion, Outlook(1), Spirit, Trend, View |
(1) New product offerings introduced in September 2017 | |
| (1) | New product offerings introduced in Fiscal 2018. |
Our Class A, B, and C motorhomes are sold by dealers in the retail market with manufacturer's suggested retail prices ranging from approximately $80,000 to $520,000, depending on size and model, plus optional equipment and delivery charges. Our motorhomes range in length from 21 to 44 feet.
Unit sales of our motorhomes for the last fivethree fiscal years were as follows: | | | | Year Ended (1)(2) | Year Ended (1) |
| Units | August 26, 2017 | | August 27, 2016 | | August 29, 2015 | | August 30, 2014 | | August 31, 2013 | August 25, 2018 | | August 26, 2017 | | August 27, 2016 |
| Class A | 3,182 |
| 34.4 | % | | 2,925 |
| 31.4 | % | | 3,442 |
| 37.8 | % | | 4,466 |
| 51.0 | % | | 3,761 |
| 55.1 | % | 2,997 |
| 31.4 | % | | 3,182 |
| 34.4 | % | | 2,925 |
| 31.4 | % |
| Class B | 1,541 |
| 16.6 | % | | 1,239 |
| 13.3 | % | | 991 |
| 10.9 | % | | 751 |
| 8.6 | % | | 372 |
| 5.5 | % | 2,012 |
| 21.1 | % | | 1,541 |
| 16.6 | % | | 1,239 |
| 13.3 | % |
| Class C | 4,537 |
| 49.0 | % | | 5,143 |
| 55.3 | % | | 4,664 |
| 51.3 | % | | 3,538 |
| 40.4 | % | | 2,688 |
| 39.4 | % | 4,539 |
| 47.5 | % | | 4,537 |
| 49.0 | % | | 5,143 |
| 55.3 | % |
| Total motorhomes | 9,260 |
| 100.0 | % | | 9,307 |
| 100.0 | % | | 9,097 |
| 100.0 | % | | 8,755 |
| 100.0 | % | | 6,821 |
| 100.0 | % | 9,548 |
| 100.0 | % | | 9,260 |
| 100.0 | % | | 9,307 |
| 100.0 | % |
| |
(1) | The fiscal year ended August 31, 2013 contained 53 weeks; all other fiscal years contained 52 weeks. |
| |
(2)
| Percentages may not add due to rounding differences. |
Motorhome parts and service activities represent revenues generated by service work we perform for retail customers at our Forest City, Iowa and Junction City, Oregon facilities as well as revenues from sales of RV parts. Our competitive strategy is to provide proprietary manufactured parts through our dealer network, which we believe increases customer satisfaction and the value of our motorhomes.
As a result of our motorhome manufacturing capabilities, equipment and facilities, we have from time to time used incremental capacity to manufacture other products for outside customers. These other manufactured products included aluminum extrusion operations which we exited in Fiscal 2016. We exited the bus operation in Fiscal 2015. We also manufacture other specialty commercial vehicles which are motorhome shells, primarily custom designed for the buyer's specific needs and requirements, such as law enforcement command centers, mobile medical clinics and mobile office space. These specialty commercial vehicles are sold through our dealer network. In addition, we also provide commercial vehicles as bare shells to third-party upfitters for conversion at their facilities.
Towable
Towable products and services segment. A towable is a non-motorized vehicle that is designed to be towed by passenger automobiles, pickup trucks, SUVs, or vans and is used as temporary living quarters for recreational travel. The RVIA classifies towables in four types: conventional travel trailers, fifth wheels, folding camper trailers, and truck campers; wecampers. We manufacture and sell
conventional travel trailers and fifth wheels under the Winnebago and Grand Design brand names, which are defined as follows: |
| | | |
| Type | Description | Winnebago product offerings | Grand Design product offerings |
| Travel trailer | Conventional travel trailers are towed by means of a hitch attached to the frame of the vehicle. | Micro Minnie, Minnie, Minnie Drop, Minnie Plus | Imagine, Reflection, Transcend(1) |
| Fifth wheel | Fifth wheel trailers are constructed with a raised forward section that is connected to the vehicle with a special fifth wheel hitch. | Minnie Plus | Momentum, Reflection, Solitude |
| |
| (1) | New product offerings introduced in Fiscal 2018. |
Our travel trailer and fifth wheel towables are sold by dealers in the retail market with manufacturer's suggested retail prices ranging from approximately $15,000 to $110,000, depending on size and model, plus optional equipment and delivery charges.
Unit sales of our towables for the last fivethree fiscal years were as follows:
| | | | Year Ended (1)(2) | Year Ended (1) |
| Units | August 26, 2017 | | August 27, 2016 | | August 29, 2015 | | August 30, 2014 | | August 31, 2013 | August 25, 2018 | | August 26, 2017 | | August 27, 2016 |
| Travel trailer | 13,650 |
| 60.7 | % | | 3,613 |
| 86.0 | % | | 2,182 |
| 81.7 | % | | 2,052 |
| 81.8 | % | | 2,038 |
| 80.4 | % | 22,360 |
| 61.1 | % | | 13,650 |
| 60.7 | % | | 3,613 |
| 86.0 | % |
| Fifth wheel | 8,824 |
| 39.3 | % | | 586 |
| 14.0 | % | | 488 |
| 18.3 | % | | 457 |
| 18.2 | % | | 497 |
| 19.6 | % | 14,229 |
| 38.9 | % | | 8,824 |
| 39.3 | % | | 586 |
| 14.0 | % |
| Total towables | 22,474 |
| 100.0 | % | | 4,199 |
| 100.0 | % | | 2,670 |
| 100.0 | % | | 2,509 |
| 100.0 | % | | 2,535 |
| 100.0 | % | 36,589 |
| 100.0 | % | | 22,474 |
| 100.0 | % | | 4,199 |
| 100.0 | % |
| |
(1) | The fiscal year ended August 31, 2013 contained 53 weeks; all other fiscal years contained 52 weeks. |
| |
(2)
| Percentages may not add due to rounding differences. |
On November 8, 2016, we closed on our acquisition of Grand Design RV, LLC ("Grand Design"), a fast-growing towables manufacturer in Middlebury, Indiana. Grand Design manufactures travel trailers and fifth wheel products. With this acquisition, we have a broader and more balanced portfolio of motorized and towable products and intend to capitalize on the opportunities across the RV market and to drive improved profitability and long-term value for shareholders.
Winnebago Specialty Vehicles
We also manufacture other specialty commercial vehicles primarily custom designed for the buyer's specific needs and requirements, such as law enforcement command centers, mobile medical clinics, and mobile office space. These specialty commercial vehicles are manufactured in Forest City, Iowa and sold through our dealer network. In addition, we also provide commercial vehicles as bare shells to third-party upfitters for conversion at their facilities.
Chris-Craft
On June 4, 2018, we acquired 100% of the ownership interests of Chris-Craft USA, Inc. ("Chris-Craft"), a privately-owned company based in Sarasota, Florida. As a result of this acquisition, we manufacture and sell premium quality boats in the recreational powerboat industry through an established global network of independent authorized dealers.
Production
We generally produce motorhomes and towables to order fromstock for dealers. We have some ability to increase our capacity by scheduling overtime and/or hiring additional production employees or to decrease our capacity through the use of shortened work weeks and/or reducing head count. We have long been known as an industry leader in innovation as each year we introduce new or redesigned products. These changes generally include new floor plans and sizes as well as design and decor modifications.
Our motorhomes are primarily produced in the state of Iowa at four different campuses. Our Forest City facilities are vertically integrated and provide mechanized assembly line manufacturing for Class A and C motorhomes. We assemble Class B motorhomes in our Lake Mills facilities. Hardwood cabinet, countertop and compartment door products are manufactured at our Charles City campus. Our Waverly facility is used for wire harness fabrication. Beginning in 2016, we also began assembling Class A motorhomes in our Junction City, Oregon facility. Our motorhome bodies are made from various materials and structural components which are typically laminated into rigid, lightweight panels. Body designs are developed with computer aided design and manufacturing and subjected to a variety of tests and evaluations to meet our standards and requirements. We manufacture a number of components utilized in our motorhomes, with the principal exceptions being chassis, engines, generators and appliances that we purchase from reputable manufacturers.
Most of our raw materials such as steel, aluminum, fiberglass, and wood products are obtainable from numerous sources.
Our motorhomes are primarily produced in the state of Iowa at four different campuses. Beginning in Fiscal 2016, we also began assembling Class A diesel motorhomes in our Junction City, Oregon facility. Our Motorhome business utilizes vertically integrated supply streams, with the principal exceptions being chassis, engines, generators, and appliances that we purchase from reputable manufacturers. Certain parts, especially motorhome chassis, are available from a small group of suppliers. We are currently purchasing Class A and C chassis from Ford Motor Company, Mercedes-Benz USA (a Daimler company) and Mercedes-Benz Canada (a Daimler company) and Class A chassis from Freightliner Custom Chassis Corporation (a Daimler company). Class B chassis are purchased from Mercedes-Benz USA, Mercedes-Benz Canada, FCA US, LLC and FCA Canada, Inc.. Class C chassis are also purchased from FCA US, LLC and FCA Canada, Inc. In Fiscal 2017,2018, we had two chassis suppliers, a chassis manufacturer and a component manufacturer, that each individually accounted for more than 10% of our Motorhome raw material purchases.
Our towables are produced at two assembly plantscampuses located in Middlebury, Indiana. The majority of components are comprised of frames, appliances, and furniture, and are purchased from suppliers. In Fiscal 2018, we had one supplier that accounted for more than 10% of our Towable raw material purchases.
Backlog
We strive to balance timely order fulfillment to customersour dealers with the lead times suppliers require to efficiently source materials and manage costs. Production facility constraints at peak periods also lead to fluctuations in backloggedbacklog orders which we manage closely. The approximate revenue of our motorhomeMotorhome backlog was $122.1$157.6 million and $107.6$122.1 million as of August 25, 2018 and August 26, 2017, and August 27, 2016, respectively. The approximate revenue of our towableTowable backlog was $229.7$244.9 million and $8.4$229.7 million as of August 25, 2018 and August 26, 2017, and August 27, 2016, respectively. A more detailed description of our motorhomeMotorhome and towableTowable order backlog is included in Item 7, "Management'sManagement's Discussion and Analysis of Financial Condition and Results of Operations."Operation
s, of this Annual Report on Form 10-K.
Distribution and Financing
We market our RVsproducts on a wholesale basis to a diversified independent dealer network located throughout the USU.S. and, to a limited extent, in Canada.Canada, Africa, Asia, Europe, Australia, and South America. Foreign sales including Canada, were 7%10.0% or less of net revenues during each of the past three fiscal years. See Note 3 to our Financial Statements of this Annual Report on Form 10-K.
As of August 26, 2017,25, 2018, our RV dealer network in the USU.S. and Canada included approximately 500 motorized550 Motorhome and towableTowable physical dealer locations, many of which carry both products. One of our dealer organizations, La Mesa RV Center, Inc., accounted
for 10.0%9.8% of our consolidated net revenue for Fiscal 2017,2018, as this dealer sold our products in 1011 dealership locations across 4 USfour U.S. states.
We have sales and service agreements with dealers which are subject to annual review. Many of the dealers are also engaged in other areas of business, including the sale of automobiles, trailers, or boats, and manymost dealers carry one or more competitive lines of RVs. We continue to place high emphasis on the capability of our dealers to provide complete service for our RVs.products. Dealers are obligated to provide full service for owners of our RVsproducts or, in lieu thereof, to secure such service from other authorized providers.
We advertise and promote our products through national RVtrade magazines, the distribution of product brochures, the Go RVing national advertising campaign sponsored by RVIA, direct-mail advertising campaigns, various national promotional opportunities, and on a local basis through trade shows, television, radio, and newspapers, primarily in connection with area dealers.
RV sales
Sales to dealers are made on cash terms. Most dealers are financed on a "floorplan" basis under which a bank or finance company lends the dealer all, or substantially all, of the purchase price, collateralized by a security interest in the merchandise purchased. As is customary in the RV industry,our industries, we typically enter into a repurchase agreement with a lending institution financing a dealer's purchase of our product upon the lending institution's request and after completion of a credit check of the dealer involved. Our repurchase agreements provide that, for up to 18 months after an RV unit is financed and up to 24 months after a marine unit is financed, in the event of default by the dealer on the agreement to pay the lending institution and repossession of the unit(s) by the lending institution, we will repurchase the financed merchandise from the lender at the amount then due, which is often less than dealer invoice. Our maximum exposure for repurchases varies significantly from time to time, depending upon the level of dealer inventory, general economic conditions, demand for RVs,our products, dealer location, and access to and the cost of financing. See Note 10.11, Contingent Liabilities and Commitments, of the Notes to Consolidated Financial Statements, included in Item 8, Financial Statements and Supplementary Data, of this Annual Report on Form 10-K.
Competition
The RV market isand marine markets are highly competitive with many other manufacturers selling products which compete directly with our products. Some of our competitors are much larger than us, most notably in the towable RV market, which may provide these competitors additional purchasing power. The competition in the RVour industry is based upon design, price, quality, and service of the products. We believe our principal competitive advantages are our brand strength, product quality, and our service after the sale. We also believe that our motorhome products have historically commanded a price premium as a result of these competitive advantages.
Seasonality
The primary use of RVs and marine products for leisure travel and outdoor recreation has historically led to a peak retail selling season concentrated in the spring and summer months and lower sales during winter months. Our sales of RVs are generally influenced by this pattern in retail sales, but sales can also be affected by the level of dealer inventory. As a result, our RV sales are historically lowest during our second fiscal quarter, which ends in February.
Governmental Regulations
We are subject to a variety of federal, state, local, and, localto a limited extent, international laws and regulations, including the federal MVA,Motor Vehicle Act ("MVA"), under which the National Highway Traffic Safety Administration ("NHTSA") may require manufacturers to recall RVs that contain safety-related defects, and numerous state consumer protection laws and regulations relating to the operation of motor vehicles, including so-called "Lemon Laws." The Boat Safety Act of 1971 has similar safety-related recall requirements for marine units. In addition, marine units sold in the U.S. and Europe must meet the certification standards of the U.S. Coast Guard and the European Community, respectively.
We are also subject to regulations established by OSHA.the Occupational Safety and Health Administration ("OSHA"). Our facilities are periodically inspected by federal and state agencies, such as OSHA. We are a member of RVIA, a voluntary association of RV manufacturers which promulgates RV safety standards. We place an RVIA seal on each of our RVs to certify that the RVIA standards have been met. We believe that our products and facilities comply in all material respects with the applicable vehicle safety, consumer protection, RVIARVIA. and OSHA regulations and standards.
Our operations are subject to a variety of federal and state environmental laws and regulations relating to the use, generation, storage, treatment, emission, labeling, and disposal of hazardous materials and wastes, and noise pollution. We believe that we are currently in compliance with applicable environmental laws and regulations in all material aspects.
Trademarks
We have several domestic and foreign trademark registrations associated with our motorhome and towable products which include: Winnebago, Adventurer, Affinity, Airlie, Aspect, Benchmark, Brave, Bryon, Cambria, Chalet, Chris-Craft (logo), Commander, Cottesloe, County Coach, Destination, Dynomax, Ellipse, Era, Forza, Fuse, Glide & Dine, Gowinnebago, Grand Design, Grand Design Recreational
Vehicles, Grand Design RV, Horizon, Imagine, Inlounge, Inspire, Instinct, Intable, Intent, Itasca, Intrigue, Journey, Latitude, Maxum Chassis, Meridian, Micro Minnie, Minnie, Minnie Drop, Minnie Winnie, Navion, 0ne Place, Momentum, Reflection, Powerline Energy Management System and Design, Rest Easy, Revel, Rialta, Roamer, Scorpion, Sightseer, Solei, Solitude, Spirit, Spyder,Storemore and Design, Suncruiser, Sunova, Sunstar, The most recognized name in motorhomes, Thermo-Panel, Transcend, Travato, Trend, Tribute, True Air, Via, View, Vista, Viva!, Voyage, W, Flying W (logo), WIT Club, Winnie Drop, Winnebago Ind (logo), Winnebagolife, Winnebago Minnie, Winnebago Towables (logo), Winnebago Touring Coach, and Winnebago Touring Coach.trade dress (three dimensional design of the front roof panel, front grill panel, and front body panel of motor homes). We believe that
our trademarks and trade names are significant assets to our businessbusiness. and we have in the past and will in the future vigorously protect them against infringement by third parties. We are not dependent upon any patents or technology licenses of others for the conduct of our business.
Human Resources
At the end of Fiscal 2018, 2017,, 2016 and 2015,2016, we employed approximately 4,700, 4,060, 3,050 and 2,9003,050 persons, respectively. None of our employees are covered under a collective bargaining agreement. We believe our relations with our employees are good.
Executive Officers of the Registrant
|
| | |
Name | Office (Year First Elected an Officer) | Age |
Michael J. Happe | President and Chief Executive Officer (2016) | 46 |
Ashis N. Bhattacharya | Vice President, Strategic Planning and Development (2016) | 54 |
Donald J. Clark | CEO and President, Grand Design RV; Vice President, Winnebago Industries (2016) | 57 |
S. Scott Degnan | Vice President and General Manager, Towables Business (2012) | 52 |
Scott C. Folkers | Vice President, General Counsel & Secretary (2012) | 55 |
Brian D. Hazelton | Vice President and General Manager, Motorhome Business (2016) | 52 |
Bryan L. Hughes | Vice President, Chief Financial Officer (2017) | 48 |
Jeff D. Kubacki | Vice President, Information Technology, Chief Information Officer (2016) | 59 |
Christopher D. West | Vice President, Operations (2016) | 45 |
Bret A. Woodson | Vice President, Administration (2015) | 47 |
Officers are elected annually by the Board of Directors. There are no family relationships between or among any of the Corporate Officers or Directors of the Company.
Mr. Happe joined Winnebago Industries in January 2016 as President and Chief Executive Officer (CEO). Prior to joining Winnebago, he had been employed by Toro Company from 1997 to 2016. He served as Executive Officer and Group Vice President of Toro's Residential and Contractor businesses from March 2012 to December 2015. From August 2010 to March 2012 he served as Vice President, Residential and Landscape Contractor Businesses. Prior to that he held a series of senior leadership positions throughout his career across a variety of Toro's domestic and international divisions.
Mr. Bhattacharya joined Winnebago Industries in May 2016 as Vice President of Strategic Planning and Development. Prior to joining Winnebago, Mr. Bhattacharya served at Honeywell as Vice President, Strategy, Alliances & Internet of Things (IoT) for the Sensing and Productivity Solutions division from 2010 to 2016. Prior to that, he was employed with Moog, Motorola, and Bain & Company in a variety of roles.
Mr. Clark, President and CEO of Grand Design RV, became an officer of Winnebago Industries in November 2016 in accordance with terms of the Grand Design acquisition. He co-founded Grand Design RV, LLC in 2012 and built the team at Grand Design RV. Mr. Clark has over 30 years of successful RV industry experience.
Mr. Degnan joined Winnebago Industries in May 2012 as Vice President of Sales and Product Management. He became Vice President and General Manager, Towables Business in 2016. Prior to joining Winnebago, Mr. Degnan served as Vice President of Sales for Riverside, California's MVP RV from 2010 to 2012. He also previously served in management and sales positions with Coachmen RV from 2008 to 2010, with National RV from 2007 to 2008, and Fleetwood Enterprises from 1987 to 2007.
Mr. Folkers joined Winnebago Industries in August 2010 as assistant general counsel. He was elected to the position of Vice President, General Counsel and Secretary in June 2012. Prior to joining Winnebago, Mr. Folkers was employed as in-house counsel for John Morrell & Co., in Sioux Falls, SD from 1998 to 2010. Mr. Folkers is a member of the Iowa Bar Association.
Mr. Hazelton joined Winnebago Industries in August 2016 as Vice President and General Manager, Motorhome Business. He previously was CEO of Schwing America, Inc. from 2009 to 2016. Schwing declared Chapter 11 bankruptcy in 2009 emerging in 2010 with a reorganization plan. Prior to his employment with Schwing, he worked for Terex Corporation and Detroit Diesel Corporation in various executive roles.
Mr. Hughes joined Winnebago Industries in April 2017 and was appointed Vice President and Chief Financial Officer of the Company in May 2017. Mr. Hughes joined Winnebago Industries from Ecolab, Inc. (NYSE: ECL) in St. Paul, Minnesota, where he served as Senior Vice President and Corporate Controller from 2014 to 2017, as Vice President of Finance from 2008 to 2014 and in various management positions from 1996 to 2008. Prior to his employment with Ecolab, he worked for Ernst & Young, a public accounting firm.
Mr. Kubacki joined Winnebago Industries in November 2016 as Vice President, Information Technology, Chief Information Officer. He previously was Vice President and Chief Information Officer at Westinghouse Electric Company, a global provider of nuclear power plant products and services. Prior to his employment with Westinghouse, he worked as Chief Information Officer at Alliant
Techsystems, a defense, aerospace, sporting goods and retail markets company and Kroll, a global risk consulting firm. Kubacki has also held various IT roles with Ecolab.
Mr. West joined Winnebago Industries in September 2016 as Vice President, Operations. He previously was Vice President of Global Supply Chain for Joy Global, a worldwide equipment manufacturer, from 2014 to 2016, and Operations Director from 2012 to 2014. Other positions Mr. West has held include Director of Manufacturing for AGCO Corporation, an agricultural equipment manufacturer, from 2008 to 2012 and Director of Operations and other management positions for the Nordam Group, a manufacturer of aircraft interiors, from 1999 to 2009.
Mr. Woodson joined Winnebago Industries in January 2015 as Vice President, Administration. Prior to joining Winnebago, Mr. Woodson was Vice President of Human Resources at Corbion from 2007 to 2014 and Director, Human Resources at Sara Lee from 1999 to 2007 and has over 24 years of business and human resources experience.
Item 1A. Risk FactorsFactors.
Described below are certain risks that we believe apply to our business and the industry in which we operate. The following risk factors should be considered carefully in addition to the other information contained in this Annual Report on Form 10-K. The risks and uncertainties described below are not the only ones we face, buthighlighted represent the most significant risk factors that we believe may adversely affect the RV industry and our business, financial condition, results of operations, cash flows, liquidity or financial position.access to sources of financing, and, consequently, the market value of our common stock. The risks and uncertainties discussed in this report are not exclusive and other risk factors that we may consider immaterial or do not anticipate may emerge as significant risks and uncertainties.
Competition
The marketmarkets for RVs isand marine products are very competitive. Competitive factors in thisthe industry include price, design, value, quality, service, brand awareness, and reputation. There can be no assurance that existing or new competitors will not develop products that are superior to our RVsproducts or that achieve better consumer acceptance, thereby adversely affecting our market share, sales volume, and profit margins. Some of our competitors are much larger than we are most notably in the towable RV market, and this size advantage provides these competitors with more financial resources and access to capital, additional purchasing power, and more interest from dealers.greater leverage with the dealer networks. In addition, competition could increase if new companies enter the market, existing competitors consolidate their operations, or if existing competitors expand their product lines or intensify efforts within existing product lines. Our current products, products under development, and our ability to develop new and improved products may be insufficient to enable us to compete effectively with our competitors. These competitive pressures may have a material adverse effect on our results of operations.
Hiring Constraints and Retaining Key Employees
Our ability to meet our strategic objectives and otherwise grow our business will depend to a significant extent on the continued contributions of our leadership team. Our future success will also depend in large part on our ability to identify, attract, and retain other highly qualified managerial, technical, sales and marketing, operations, and customer service personnel. Our main motorhome operation is located in a largely rural area of northern Iowa. Competition for these individuals in our manufacturing markets is intense and supply is limited. We may not succeed in identifying, attracting, or retaining qualified personnel on a cost-effective basis. The loss or interruption of services of any of our key personnel, inability to identify, attract, or retain qualified personnel in the future, delays in hiring qualified personnel, or any employee work slowdowns, strikes, or similar actions could make it difficult for us to conduct and manage our business and meet key objectives, which could harm our business, financial condition, and operating results.
Production Disruptions
We currently manufacture most of our products in northern Iowa and northern Indiana. These facilities may be affected by natural or man-made disasters and other external events. In the event that one of our manufacturing facilities was affected by a disaster or other event, we could be forced to shift production to one of our other manufacturing facilities or to cease operations. Although we maintain insurance for damage to our property and disruption of our business from casualties, such insurance may not be sufficient to cover all of our potential losses. Any disruption in our manufacturing capacity could have an adverse impact on our ability to produce sufficient inventory of our products or may require us to incur additional expenses in order to produce sufficient inventory, and therefore, may adversely affect our net sales and operating results. Any disruption or delay at our manufacturing facilities could impair our ability to meet the demands of our customers, and our customers may cancel orders or purchase products from our competitors, which could adversely affect our business and operating results.
The terms of our Credit Agreement could adversely affect our operating flexibility and pose risks of default under our Credit Agreement
We incurred substantial indebtedness to finance the acquisition of Grand Design. We entered into new asset-based revolving credit (ABL)("ABL") and term loan (Term Loan)("Term Loan") agreements (collectively, the Credit Agreement)"Credit Agreement") with JPMorgan Chase. Under the terms of the Credit Agreement, we have a $125.0$165.0 million ABL credit facility, which includes a $10.0 million letter of credit facility, and a $300.0 million term loan.loan as of September 21, 2018.
The Credit Agreement is secured by certain assets, primarily cash, inventory, accounts receivable, and certain machinery and equipment. The Credit Agreement contains certain requirements, including affirmative and negative financial covenants. If we are unable to comply with these requirements and covenants, we may be restricted in our ability to pay dividends or engage in certain other business transactions, the lender may obtain control of our cash accounts, and we may experience an event of default. If a default occurs, the lenders under the Credit Agreement may elect to declare all of their respective outstanding debt, together with accrued interest and other amounts payable thereunder, to be immediately due and payable. Under such circumstances, we may
not have sufficient funds or other resources to satisfy all of our obligations. In addition, the limitations imposed on our ability to incur additional debt and to take other corporate actions might significantly impair our ability to obtain other financing.
Borrowing availability under the credit agreementCredit Agreement is limited to the lesser of the facility total and the calculated borrowing base, which is based on stipulated loan percentages applied to our eligible trade accounts receivable and eligible inventories plus a defined amount related to certain machinery and equipment. Should the borrowing base decline, our ability to borrow to fund future operations and business transactions could be limited. In addition, the Credit Agreement contains certain restrictions on our ability to undertake certain types of transactions. Therefore, we may need to seek permission from our lenders in order to engage in certain corporate actions. Through the Credit Agreement, we were required to enter into a hedging arrangement that fixed certain interest rates as defined in the Credit Agreement. To satisfy this requirement, an interest rate Swap Contractswap contract was entered into during the second quarter of Fiscal 2017. The results of the Swap Contract could create quarterly fluctuations in operating results. When we repriced our Credit Agreements during the second quarter of Fiscal 2018, the requirement to hedge a portion of the debt was removed.
In addition, the additional indebtedness could:
Make us more vulnerable to general adverse economic, regulatory, and industry conditions;
Limit our flexibility in planning for, or reacting to, changes and opportunities in the markets in which we compete;
Place us at a competitive disadvantage compared to our competitors that have less debt or could require us to dedicate a substantial portion of our cash flow to service our debt; and
Restrict us from making strategic acquisitions or exploiting other business opportunities.
The Company’sOur Stock Price is Subject to Volatility
Our stock price may fluctuate based on many factors. Our acquisition of Grand Design, for example, provided important strategic positioning and earnings growth potential, but to partially finance the transaction we issued $124.0$124.1 million worth of common stock to the owners of Grand Design and registered these shares for resale after the transaction closed. Any future stock issuance by us or liquidation of stock holding by the former owners of Grand Design may cause dilution of earnings per share or put selling pressure on our share price. Changing credit agreements and leverage ratios may also impact stock price. In general, analysts' expectations and our ability to meet those expectations quarterly may cause stock price fluctuations. If we fail to meet expectations related to future growth, profitability, debt repayment, dividends, share issuance or repurchase, or other market expectations, our stock price may decline significantly.
Facility Expansion and Diversification
We are expanding our production capabilities atwithin our sites in Middlebury, Indiana and Junction City, Oregon.Towable segment. The expansion and renovation entails risks that could cause disruption in the operations of our business and unanticipated cost increases. Should we experience production variances, quality, or safety issues as we ramp up these operations, our business and operating results could be adversely affected.
Adverse Effects of Union Activities
Although none of our employees are currently represented by a labor union, unionization could result in higher employee costs and increased risk of work stoppages. We are, directly or indirectly, dependent upon companies with unionized work forces, such as parts suppliers and trucking and freight companies, and work stoppages or strikes organized by such unions could have a material adverse impact on our business, financial condition, or operating results. If a work stoppage occurs, it could delay the manufacture and sale of our recreational vehiclesproducts and have a material adverse effect on our business, prospects, operating results, or financial condition.
General Economic Conditions and Certain Other External Factors
Companies within the RV industryand marine industries are subject to volatility in operating results due primarily to general economic conditions because the purchase of an RV or marine products is often viewed as a consumer discretionary purchase. Demand for discretionary goods in general can fluctuate with recessionary conditions;conditions, slow or negative economic growth rates;rates, negative
consumer confidence;confidence, reduced consumer spending levels resulting from tax increases or other factors;factors, prolonged high unemployment rates;rates, higher commodity and component costs;costs, fuel prices;prices, inflationary or deflationary pressures;pressures, reduced credit availability or unfavorable credit terms for dealers and end-user customers;customers, higher short-term interest rates;rates, and general economic and political conditions and expectations. Specific factors affecting the RV industryand marine industries include:
overall
Overall consumer confidence and the level of discretionary consumer spending;
employmentEmployment trends;
theThe adverse impact of global tensions on consumer spending and travel-related activities; and
theThe adverse impact on margins due to increases in raw material costs, which we are unable to pass on to customers without negatively affecting sales.
Goodwill and Trade Name Impairment
Goodwill and indefinite-lived intangible assets, such as our trade names, are recorded at fair value at the time of acquisition and are not amortized but are reviewed for impairment at least annually or more frequently if impairment indicators arise. Our determination of whether goodwill impairment has occurred is based on a comparison of each of our reporting units’ fair value with its carrying value. Significant and unanticipated changes in circumstances, such as significant and long-term adverse changes in business climate, unanticipated competition, and/or changes in technology or markets, could require a provision for impairment in a future period that could negatively impact our results of operations.
Dependence on Credit Availability and Interest Rates to Dealers and Retail Purchasers
Our business is affected by the availability and terms of the financing to dealers. Generally, RV and marine dealers finance their purchases of inventory with financing provided by lending institutions. ThreeOne financial flooring institutionsinstitution held 61%54.8% of our total financed dealer inventory dollars that were outstanding at August 26, 2017.25, 2018. In the event that any of thesethis lending institutions limitinstitution limits or discontinuediscontinues dealer financing, we could experience a material adverse effect on our results of operations.
Our business is also affected by the availability and terms of financing to retail purchasers. Retail buyers purchasing a motorhome or towableone of our products may elect to finance their purchase through the dealership or a financial institution of their choice. Substantial increases in interest rates or decreases in the general availability of credit for our dealers or for the retail purchaser may have an adverse impact upon our business and results of operations.
Cyclicality and Seasonality
The RV industry hasand marine industries have been characterized by cycles of growth and contraction in consumer demand, reflecting prevailing economic and demographic conditions, which affect disposable income for leisure-time activities. Consequently, the results for any prior period may not be indicative of results for any future period.
Seasonal factors, over which we have no control, also have an effect on the demand for our products. Demand in the RV industryand marine industries generally declines over the winter season, while sales are generally highest during the spring and summer months. Also, unusually severe weather conditions in some markets may impact demand.
Managing Growth Opportunities
One of our growth strategies is to drive growth through targeted acquisitions and alliances, stronger customer relations, and new joint ventures and partnerships that add valuecontribute profitable growth while supplementing our existing brands and product portfolio. Our ability to grow through acquisitions will depend, in part, on the availability of suitable candidates at acceptable prices, terms, and conditions, our ability to compete effectively for acquisition candidates, and the availability of capital and personnel to complete such acquisitions and run the acquired business effectively. Any acquisition, alliance, joint venture, or partnership could impair our business, financial condition, reputation, and operating results. The benefits of an acquisition or new alliance, joint venture, or partnership may take more time than expected to develop or integrate into our operations, and we cannot guarantee that previous or future acquisitions, alliances, joint ventures, or partnerships will, in fact, produce any benefits. Such acquisitions, alliances, joint ventures, and partnerships may involve a number of risks, including:
diversion
Diversion of management’s attention;
disruptionDisruption to our existing operations and plans;
inabilityInability to effectively manage our expanded operations;
difficultiesDifficulties or delays in integrating and assimilating information and financial systems, operations, and products of an acquired business or other business venture or in realizing projected efficiencies, growth prospects, cost savings, and synergies;
inabilityInability to successfully integrate or develop a distribution channel for acquired product lines;
potentialPotential loss of key employees, customers, distributors, or dealers of the acquired businesses or adverse effects on existing business relationships with suppliers, customers, distributors, and dealers;
adverseAdverse impact on overall profitability, if our expanded operations do not achieve the financial results projected in our valuation model;
inaccurate
Inaccurate assessment of additional post-acquisition or business venture investments, undisclosed, contingent or other liabilities or problems, unanticipated costs associated with an acquisition or other business venture, and an inability to recover or manage such liabilities and costs; and
incorrectIncorrect estimates made in the accounting for acquisitions, incurrenceoccurrence of non-recurring charges, and write-off of significant amounts of goodwill or other assets that could adversely affect our operating results.
Credit Arrangements and Growth Opportunities
In order to achieve our growth strategies, we continually review our credit arrangements and our desired level of leverage. Access to capital will allow us to finance targeted acquisitions as well as fund the working capital requirements of organic growth.
If we cannot negotiate favorable agreements and comply with related covenants, restrictive provisions may limit our ability to conduct our business, take advantage of business opportunities, and respond to changing business, market, and economic conditions. We must generate sufficient cash to pay our debt service and support our business in an industry that is cyclical. In addition, we may be placed at a competitive disadvantage relative to other companies that may be subject to fewer, if any, restrictions that otherwise adversely affect our business. Transactions that we may view as important opportunities, such as significant acquisitions, may be subject to the consent of the lenders under future credit arrangements. Those consents may be withheld or granted subject to conditions specified that may affect the attractiveness or viability of the transaction.
Demand Forecasting and Inventory Management
Our ability to manage our inventory levels to meet our customer's demand for our products is important for our business. For example, certain dealers are focused on the rental market which spikes over the summer vacation period while other dealers are focused on direct sales to the consumer at various price points. Our production levels and inventory management are based on demand estimates six to twelve months forward taking into account supply lead times, production capacity, timing of shipments, and dealer inventory levels. If we overestimate or underestimate demand for any of our products during a given season, we may not maintain appropriate inventory levels, which could negatively impact our net sales or working capital, hinder our ability to meet customer demand, or cause us to incur excess and obsolete inventory charges.
Distribution Channel Management
We sell many of our products through distribution channels and are subject to risks relating to their inventory management decisions and operational and sourcing practices. Our distribution channel customers carry inventories of our products as part of their ongoing operations and adjust those inventories based on their assessments of future needs. Such adjustments may impact
our inventory management and working capital goals as well as operating results. If the inventory levels of our distribution channel customers are higher than they desire, they may postpone product purchases from us, which could cause our sales to be lower than the end-user demand for our products and negatively impact our inventory management and working capital goals as well as our operating results.
Responsiveness to Market Changes
One of our growth strategies is to develop innovative, customer-valued products to generate revenue growth. We may not be able to compete as effectively with our competitors, and ultimately satisfy the needs and preferences of our customers, unless we can continue to enhance existing products and develop new innovative products for the markets in which we compete. Product development requires significant financial, technological, and other resources. Product improvements and new product introductions also require significant research, planning, design, development, engineering, and testing at the technological, product, and manufacturing process levels, and we may not be able to timely develop and introduce product improvements or new products. Our competitors' new products may beat our products to market, be higher quality or more reliable, be more effective with more features and/or less expensive than our products, obtain better market acceptance, or render our products obsolete. Any new products that we develop may not receive market acceptance or otherwise generate any meaningful net sales or profits for us relative to our expectations based on, among other things, existing and anticipated investments in manufacturing capacity and commitments to fund advertising, marketing, promotional programs, and research and development.
Potential Loss of a Large Dealer Organization
One of our dealer organizations accounted for 10.0%9.8% of our net revenue for Fiscal 2017.2018. A second dealer organization, accounted for 9.9%9.0% of our net revenue for Fiscal 2017.2018. The loss of either or both of these dealer organizations could have a significant adverse effect on our business. In addition, deterioration in the liquidity or creditworthiness of either or both of these dealers could negatively impact our sales and could trigger repurchase obligations under our repurchase agreements.
Potential Repurchase Liabilities
In accordance with customary practice in the RV industry,our industries, upon request we enter into formal repurchase agreements with lending institutions financing a dealer's purchase of our products. In these repurchase agreements we agree, in the event of a default by an independent dealer in its obligation to a lender and repossession of the unit(s) by the lending institution, to repurchase units at declining prices over the term of the agreements, which can last up to 1824 months. The difference between the gross repurchase price and the price at which the repurchased product can then be resold, which is typically at a discount to the gross repurchase price, represents a potential expense to us. In certain instances, we also repurchase inventory from our dealers due to state law or regulatory requirements that govern voluntary or involuntary terminations. If we are obligated to repurchase a substantially larger number of RVsunits in the future than we estimate, this would increase our costs and could have a material adverse effect on our results of operations, financial condition, and cash flows.
Fuel Availability and Price Volatility
Gasoline or diesel fuel is required for the operation of motorized RVs. There can be no assurance that the supply of these petroleum products will continue uninterrupted or that the price or tax on these petroleum products will not significantly increase in the future. RVs, however, are not generally purchased for fuel efficiency. Fuel shortages and substantial increases in fuel prices have had a material adverse effect on the RV industry as a whole in the past and could have a material adverse effect on us in the future.
Dependence on Suppliers
Most of our RV and marine components are readily available from numerous sources. However, a few of our components are produced by a small group of suppliers. In the case of motorhome chassis, Ford Motor Company, Mercedes-Benz (USA and Canada), and Freightliner Custom Chassis Corporation Mercedes-Benz (USA and Canada) and FCA (US and Canada) are our major suppliers. Our relationship with our chassis suppliers is similar to our other supplier relationships in that no specialspecific contractual commitments are engaged in by either party. This means
that we do not have minimum purchase requirements, and our chassis suppliers do not have minimum supply requirements. Our chassis suppliers also supply to our competitors. Historically, chassis suppliers resort to an industry-wide allocation system during periods when supply is restricted. These allocations have been based on the volume of chassis previously purchased, which could mean our larger competitors could receive more chassis in a time of scarcity. Sales of motorhomes rely on chassis supply and are affected by shortages from time to time. Decisions by our suppliers to decrease production, production delays, or work stoppages by the employees of such suppliers, or price increases could have a material adverse effect on our ability to produce motorhomes and ultimately, on our results of operations, financial condition, and cash flows. In Fiscal 2017, we had two suppliers, a chassis manufacturer and a component manufacturer, that2018, none of our manufacturers individually accounted for more than 10% of our raw material purchases.
Raw Material Costs
We purchase raw materials such as steel, aluminum, and other commodities, and components, such as chassis, refrigerators, and televisions, for use in our products. In addition, we are a purchaser of components and parts containing various commodities, including steel, aluminum, copper, lead, rubber, and others that are integrated into our end products. To the extent that commodity prices increase and we do not have firm pricing from our suppliers, or our suppliers are not able to honor such prices, increases in the cost of such raw materials and components and parts may adversely affect our profit margins if we are unable to pass along to our customers these cost increases in the form of price increases or otherwise reduce our cost of goods sold. In addition, increases in other costs of doing business may also adversely affect our profit margins and businesses. For example, an increase in fuel costs may result in an increase in our transportation costs, which also could adversely affect our operating results and businesses. Historically, we have mitigated cost increases, in part, by collaborating with suppliers, reviewing alternative sourcing
options, substituting materials, engaging in internal cost reduction efforts, and increasing prices on some of our products, all as appropriate. However, we may not be able to fully offset such increased costs in the future. Further, if our price increases are not accepted by our customers and the market, our net sales, profit margins, earnings, and market share could be adversely affected.
Warranty Claims
We receive warranty claims from our dealers in the ordinary course of our business. Although we maintain reserves for such claims, which to date have been adequate, there can be no assurance that warranty expense levels will remain at current levels or that such reserves will continue to be adequate. A significant increase in warranty claims exceeding our current warranty expense levels could have a material adverse effect on our results of operations, financial condition, and cash flows.
In addition to the costs associated with the contractual warranty coverage provided on our products, we also occasionally incur costs as a result of additional service actions not covered by our warranties, including product recalls and customer satisfaction actions. Although we estimate and reserve for the cost of these service actions, there can be no assurance that expense levels will remain at current levels or such reserves will continue to be adequate.
Protection of our Brand
We believe that one of the strengths of our business is our brandbrands, which isare widely known around the world. We vigorously defend our brandbrands and our other intellectual property rights against third parties on a global basis. We have, from time to time, had to bring claims against third parties to protect or prevent unauthorized use of our brand. If we are unable to protect and defend our brandbrands or other intellectual property, it could have a material adverse effect on our results of operations or financial condition.
Product Liability
We are subject, in the ordinary course of business, to litigation including a variety of warranty, "Lemon Law" and product liability claims typical in the RV industry.and marine industries. Although we have an insurance policy with a $50.0 million limit covering product liability, we are self-insured for the first $2.5 million of product liability claims on a per occurrence basis, with a $6.0 million aggregate per policy year. We cannot be certain that our insurance coverage will be sufficient to cover all future claims against us, which may have a material adverse effect on our results of operations and financial condition. Any increase in the frequency and size of these claims, as compared to our experience in prior years, may cause the premium that we are required to pay for insurance to rise significantly. Product liability claims may also cause us to pay punitive damages, not all of which are covered by our insurance. In addition, if product liability claims rise to a level of frequency or size that are significantly higher than similar claims made against our competitors, our reputation and business may be harmed.
Information Systems and Web Applications
We rely on our information systems and web applications to support our business operations, including but not limited to procurement, supply chain, manufacturing, distribution, warranty administration, invoicing, and collection of payments. We use information systems to report and audit our operational results. Additionally, we rely upon information systems in our sales, marketing, human resources, and communication efforts. Due to our reliance on our information systems, our business processes may be negatively impacted in the event of substantial disruption of service. Further, misuse, leakage, or falsification of information could result in a violation of privacy laws and damage our reputation which could, in turn, have a negative impact on our results.
In addition to our general reliance on information systems, we began implementation of a new ERPenterprise resource planning system at the end of fiscal year 2015. Though we perform planning and testing to reduce risks associated with such a complex, enterprise-wide systems change, failure to meet requirements of the business could disrupt our business and harm our reputation, which may result in decreased sales, increased overhead costs, excess or obsolete inventory, and product shortages, causing our business, reputation, financial condition, and operating results to suffer.
Data Security
We have security systems in place with the intent of maintaining the physical security of our facilities and protecting our customers', clients', and suppliers' confidential information and information related to identifiable individuals against unauthorized access through our information systems or by other electronic transmission or through the misdirection, theft, or loss of physical media. These include, for example, the appropriate encryption of information. Despite such efforts, we are subject to breach of security systems which may result in unauthorized access to our facilities or the information we are trying to protect. Because the technologies used to obtain unauthorized access are constantly changing and becoming increasingly more sophisticated and often are not recognized until launched against a target, we may be unable to anticipate these techniques or implement sufficient preventative measures. If unauthorized parties gain physical access to one of our facilities or electronic access to our information systems or such information is misdirected, lost, or stolen during transmission or transport, any theft or misuse of such information could result in, among other things, unfavorable publicity, governmental inquiry and oversight, difficulty in marketing our services, allegations by our customers and clients that we have not performed our contractual obligations, litigation by affected parties, and possible financial obligations for damages related to the theft or misuse of such information, any of which could have a material adverse effect on our business.
Government Regulation
We are subject to numerous federal, state, and local regulations and the following summarizes some, but not all, of the laws and regulations that apply to us.
Federal Motor Vehicle Safety Standards govern the design, manufacture and sale of our RV products, which standards are promulgated by the National Highway Safety Administration (NHTSA).NHTSA. NHTSA requires manufacturers to recall and repair vehicles
which are non-compliant with a Federal Motor Vehicle Safety Standard or contain safety defects. In addition, the U.S. Coast Guard maintains certification standards for the manufacture of our marine products, and the safety of recreational boats in the U.S. is subject to federal regulation under the Boat Safety Act of 1971, which requires boat manufacturers to recall products for replacement of parts or components that have demonstrated defects affecting safety. Any major recalls of our vehicles,products, voluntary or involuntary, could have a material adverse effect on our results of operations, financial condition, and cash flows. While we believe we are substantially in compliance with the foregoing laws and regulations as they currently exist, amendments to any of these regulations or the implementation of new regulations could significantly increase the cost of testing, manufacturing, purchasing, operating, or selling our products and could have a material adverse effect on our results of operations, financial condition, and cash flows. In addition, our failure to comply with present or future regulations could result in Federalfederal fines being imposed on us, potential civil and criminal liability, suspension of sales or production, or cessation of operationsoperations.
We are also subject to federal and numerous state consumer protection and unfair trade practice laws and regulations relating to the sale, transportation, and marketing of motor vehicles, including so-called "Lemon Laws." Federal and state laws and regulations also impose upon vehicle operators various restrictions on the weight, length, and width of motor vehicles, including motorhomes that may be operated in certain jurisdictions or on certain roadways. Certain jurisdictions also prohibit the sale of vehicles exceeding length restrictions.
Failure to comply with NYSEthe New York Stock Exchange and SEC laws or regulations could also have an adverse impact on our business. Additionally, amendments to these regulations and the implementation of new regulations could increase the cost of manufacturing, purchasing, operating, or selling our products and therefore could have an adverse impact on our business.
The SEC adopted rules pursuant to Section 1502 of the Dodd-Frank Wall Street Reform and Consumer Protection Act setting forth new disclosure requirements concerning the use or potential use of certain minerals, deemed conflict minerals (tantalum, tin, gold and tungsten), that are mined from the Democratic Republic of Congo and adjoining countries. These requirements necessitate due diligence efforts on our part to assess whether such minerals are used in our products in order to make the relevant required disclosures that began in May 2014. We incurred costs and diverted internal resource to comply with these new disclosure requirements, including for diligence to determine the sources of those minerals that may be used or necessary to the production of our products. Compliance costs may increase in future periods. We may face reputational challenges that could impact future sales if we determine that certain of our products contain minerals not determined to be conflict free or if we are unable to sufficiently verify the origins for all conflict minerals used in our products.
Finally, federal and state authorities also have various environmental control standards relating to air, water, noise pollution, and hazardous waste generation and disposal whichthat affect us and our operations. Failure by us to comply with present or future laws and regulations could result in fines being imposed on us, potential civil and criminal liability, suspension of production or operations, alterations to the manufacturing process, or costly cleanup or capital expenditures, any or all of which could have a material adverse effect on our results of operations.
Climate Change and Related Regulation
There is growing concern from members of the scientific community and the general public that an increase in global average temperatures due to emissions of greenhouse gases ("GHG") and other human activities have or will cause significant changes in weather patterns and increase the frequency and severity of natural disasters. We are currently subject to rules limiting emissions and other climate related rules and regulations in certain jurisdictions where we operate. In addition, we may become subject to additional legislation and regulation regarding climate change, and compliance with any new rules could be difficult and costly. Concerned parties, such as legislators, regulators, and non-governmental organizations, are considering ways to reduce GHG emissions. Foreign, federal, state, and local regulatory and legislative bodies have proposed various legislative and regulatory
measures relating to climate change, regulating GHG emissions, and energy policies. If such legislation is enacted, we could incur increased energy, environmental, and other costs and capital expenditures to comply with the limitations. Climate change regulation combined with public sentiment could result in reduced demand for our products, higher fuel prices, or carbon taxes, all of which could materially adversely affect our business. Due to uncertainty in the regulatory and legislative processes, as well as the scope of such requirements and initiatives, we cannot currently determine the effect such legislation and regulation may have on our products and operations.
Anti-takeover Effect
Provisions of our articles of incorporation, by-laws, the Iowa Business Corporation Act, and provisions in our credit facilitiesagreements and certain of our compensation programs that we may enter into from time to time could make it more difficult for a third party to acquire us, even if doing so would be perceived to be beneficial by our shareholders. As part of our acquisition of Grand Design, we issued $124 million of common stock to the owners of Grand Design. As part of the transaction, the owners have agreed to standstill covenants that prohibit these parties from taking certain hostile actions against us for up to one year from the closing of the transaction. Theshareholders.The combination of these provisions effectively inhibits a non-negotiated merger or other business combination, which, in turn, could adversely affect the market price of our common stock.
Item 1B. Unresolved Staff CommentsComments.
None.
Item 2. Properties Properties.
Our principal manufacturing, maintenance, and service operations are conducted in multi-building complexes owned or leased by us. The following sets forth our material facilities as of August 26, 2017:25, 2018: | | | Location | Facility Type/Use | Segment | # of Buildings | Owned or Leased | Square Footage | Facility Type/Use | Reportable Segment | # of Buildings | Owned or Leased | Square Footage |
| Forest City, IA | Manufacturing, maintenance, service and office | Motorized | 32 |
| Owned | 1,546,000 |
| Manufacturing, maintenance, service, and office | Motorhome | 33 |
| Owned | 1,546,772 |
|
| Forest City, IA | Warehouse | Motorized | 3 |
| Owned | 459,000 |
| Warehouse | Motorhome | 3 |
| Owned | 459,136 |
|
| Charles City, IA | Manufacturing | Motorized | 2 |
| Owned | 161,000 |
| Manufacturing | Motorhome | 2 |
| Owned | 160,950 |
|
| Waverly, IA | Manufacturing | Motorized | 1 |
| Owned | 33,000 |
| Manufacturing | Motorhome | 1 |
| Owned | 33,400 |
|
| Junction City, OR | Manufacturing, service and office | Motorized | 10 |
| Owned | 305,000 |
| Manufacturing, service, and office | Motorhome | 10 |
| Owned | 304,962 |
|
| Middlebury, IN | Manufacturing and office | Towable | 4 |
| Owned | 277,000 |
| Manufacturing and office | Towable | 4 |
| Owned | 444,830 |
|
| Lake Mills, IA | Manufacturing | Motorized | 1 |
| Leased(1) | 99,000 |
| Manufacturing | Motorhome | 1 |
| Leased(1) | 98,546 |
|
| Middlebury, IN | Manufacturing, service and office | Towable | 8 |
| Leased(2) | 741,000 |
| Manufacturing, service, and office | Towable | 10 |
| Leased(2) | 1,044,950 |
|
| Eden Prairie, MN | Corporate office | Motorized | 1 |
| Leased(3) | 30,000 |
| Corporate | Motorhome | 1 |
| Leased(3) | 30,068 |
|
| Sarasota, FL | | Manufacturing and office | Corporate / All Other | 7 |
| Owned | 188,779 |
|
| | | 62 |
| | 3,651,000 |
| | 72 |
| | 4,312,393 |
|
| |
(1) | In November 2013, we entered into a five-year lease with the city of Lake Mills, IA for a manufacturing plant with two options to renew for five years each. We are currently evaluating whether to renew the lease or purchase the facility. |
| |
(2) | In November 2016 as part of our acquisition of Grand Design, we acquiredassumed leases to two properties which hold their current principal facilities and facilities under construction for expansion. |
| |
(3) | In January 2017, we entered into a six-year lease, expiring in 2023, for an office facility in Eden Prairie, MN. |
The facilities that we own in Forest City, Charles City, and Waverly are located on a total of approximately 320 acres of land. The facilities that we own in Junction City, Oregon are located on approximately 42 acres of land and theland. The facilities that we own in Middlebury, Indiana are located on approximately 3060 acres of land. The facilities that we own in Sarasota, Florida are located on approximately 19 acres of land. Most of our buildings are of steel or steel and concrete construction and are protected from fire with high‑pressure sprinkler systems, dust collector systems, automatic fire doors, and alarm systems. We believe that our facilities and equipment are well maintained and suitable for the purposes for which they are intended.
Under terms of our Credit Agreement, as further described in Note 8, we have encumbered substantially all of our real property for the benefit of the lender under such facility. For additional information, see Note 9, Long-Term Debt, of the Notes to Consolidated Financial Statements, included in Item 8, Financial Statements and Supplementary Data, of this Annual Report on Form 10-K.
Item 3.Legal ProceedingsProceedings.
We are involved in various
For a description of our legal proceedings, which are ordinary litigation incidentalsee Note 11, Contingent Liabilities and Commitments, of the Notes to our business, someConsolidated Financial Statements, included in Item 8, Financial Statements and Supplementary Data, of which are covered in whole or in part by insurance. While we believe the ultimate disposition of litigation will not have material adverse effectthis Annual Report on our financial position, results of operations or liquidity, there exists the possibility that such litigation may have an impact on our results for a particular reporting period in which litigation effects become probable and reasonably estimable. Though we do not believe there is a reasonable likelihood that there will be a material change related to these matters, litigation is subject to inherent uncertainties and management’s view of these matters may change in the future.Form 10-K.
Item 4. Mine Safety DisclosureDisclosure.
Not Applicable.
Executive Officers of the Registrant
|
| | |
| Name | Office (Year First Elected an Officer) | Age |
| Michael J. Happe | President and Chief Executive Officer (2016) | 47 |
| Ashis N. Bhattacharya | Vice President, Strategic Planning and Development (2016) | 55 |
| Stacy Bogart | Vice President, General Counsel and Secretary (2018) | 54 |
| Donald J. Clark | President of Grand Design RV; Vice President of Winnebago Industries (2016) | 58 |
| S. Scott Degnan | Vice President and General Manager, Towables Business (2012) | 53 |
| Brian D. Hazelton | Vice President and General Manager, Motorhome Business (2016) | 52 |
| Bryan L. Hughes | Vice President, Chief Financial Officer (2017) | 49 |
| Jeff D. Kubacki | Vice President, Information Technology, Chief Information Officer (2016) | 60 |
| Christopher D. West | Vice President, Operations (2016) | 46 |
| Bret A. Woodson | Vice President, Administration (2015) | 48 |
Officers are elected annually by the Board of Directors and hold office until their successors are chosen and qualify or until their death or resignation. There are no family relationships between or among any of the Executive Officers or Directors of the Company.
Mr. Happe joined Winnebago Industries in January 2016 as President and Chief Executive Officer. Prior to joining Winnebago, he had been employed by The Toro Company, a provider of outdoor maintenance and beautification products, from 1997 to 2016. He served as Executive Officer and Group Vice President of Toro's Residential and Contractor businesses from March 2012 to December 2015. From August 2010 to March 2012, he served as Vice President, Residential and Landscape Contractor Businesses. Prior to that he held a series of senior leadership positions throughout his career across a variety of Toro's domestic and international divisions.
Mr. Bhattacharya joined Winnebago Industries in May 2016 as Vice President, Strategic Planning and Development. Prior to joining Winnebago, Mr. Bhattacharya served at Honeywell International, Inc., a software industrial company, as Vice President, Strategy, Alliances & Internet of Things for the Sensing and Productivity Solutions division from 2010 to 2016. Prior to that, he was employed with Moog, Motorola, and Bain & Company in a variety of roles.
Ms. Stacy Bogart joined Winnebago Industries in January 2018 as Vice President, General Counsel and Secretary. Prior to joining Winnebago Industries, Ms. Bogart was Senior Vice President, General Counsel and Compliance Officer, Corporate Secretary at Polaris Industries Inc., a manufacturer and marketer of powersports products, where she joined in November 2009. Previously, Ms. Bogart was General Counsel of Liberty Diversified International; Assistant General Counsel and Assistant Secretary at The Toro Company; and a Senior Attorney for Honeywell International, Inc.
Mr. Clark, President of Grand Design RV; Vice President of Winnebago Industries, became an officer of Winnebago Industries in November 2016 in accordance with terms of the Grand Design acquisition. He co-founded Grand Design RV, LLC in 2012 and built the team at Grand Design RV. Mr. Clark has over 30 years of successful RV industry experience.
Mr. Degnan joined Winnebago Industries in May 2012 as Vice President of Sales and Product Management. He became Vice President and General Manager, Towables Business in 2016. Prior to joining Winnebago, Mr. Degnan served as Vice President of Sales for Riverside, California's MVP RV from 2010 to 2012. He also previously served in management and sales positions with Coachmen RV from 2008 to 2010, with National RV from 2007 to 2008, and Fleetwood Enterprises from 1987 to 2007.
Mr. Hazelton joined Winnebago Industries in August 2016 as Vice President and General Manager, Motorhome Business. He previously was CEO of Schwing America, Inc., a manufacturer of concrete pumps and truck mixers, from 2009 to 2016. Prior to his employment with Schwing, he worked for Terex Corporation and Detroit Diesel Corporation in various executive roles.
Mr. Hughes joined Winnebago Industries in April 2017 and was appointed Vice President, Chief Financial Officer of the Company in May 2017. Mr. Hughes joined Winnebago Industries from Ecolab, Inc., where he served as Senior Vice President and Corporate Controller from 2014 to 2017, as Vice President of Finance from 2008 to 2014 and in various management positions from 1996 to 2008. Prior to his employment with Ecolab, Inc., a water technologies and services company, he worked for Ernst & Young, a public accounting firm.
Mr. Kubacki joined Winnebago Industries in November 2016 as Vice President, Information Technology, Chief Information Officer. He previously was Vice President and Chief Information Officer at Westinghouse Electric Company, a global provider of nuclear power plant products and services, in 2016. Prior to his employment with Westinghouse, he worked as Chief Information Officer at
Alliant Techsystems, a defense, aerospace, sporting goods, and retail markets company, from 2010 to 2015, and at Kroll, a global risk consulting firm, from 2007 to 2010. He also held various IT roles with Ecolab, Inc.
Mr. West joined Winnebago Industries in September 2016 as Vice President, Operations. He previously was Vice President of Global Supply Chain for Joy Global, a worldwide equipment manufacturer, from 2014 to 2016, and Operations Director from 2012 to 2014. Mr. West served as Director of Manufacturing for AGCO Corporation, an agricultural equipment manufacturer, from 2008 to 2012 and as Director of Operations and in other management positions for the Nordam Group, a manufacturer of aircraft interiors, from 1999 to 2009.
Mr. Woodson joined Winnebago Industries in January 2015 as Vice President, Administration. Prior to joining Winnebago, Mr. Woodson was Vice President of Human Resources at Corbion N.V., a food and biochemicals company, from 2007 to 2014 and Director, Human Resources at Sara Lee Corporation from 1999 to 2007. Mr. Woodson has over 24 years of business and human resources experience.
PART II
Item 5.Market for the Registrant's Common Equity, Related Stockholder Matters, and Issuer Purchases of Equity SecuritiesSecurities.
Market Information
Our common stock is listed on the New York and Chicago Stock Exchanges with the ticker symbol of WGO.
Below are the New York Stock Exchange high, low and closing prices of Winnebago Industries, Inc. common stock for each quarter of Fiscal 2017 and Fiscal 2016: |
| | | | | | | | | | | | | | | | | | | | |
| Fiscal 2017 | High | Low | Close | | Fiscal 2016 | High | Low | Close |
| First Quarter | $ | 34.50 |
| $ | 22.11 |
| $ | 34.00 |
| | First Quarter | $ | 22.59 |
| $ | 17.80 |
| $ | 22.23 |
|
| Second Quarter | 39.30 |
| 30.20 |
| 33.40 |
| | Second Quarter | 23.30 |
| 15.41 |
| 18.80 |
|
| Third Quarter | 34.90 |
| 24.99 |
| 25.15 |
| | Third Quarter | 23.09 |
| 18.68 |
| 18.73 |
|
| Fourth Quarter | 37.20 |
| 24.15 |
| 34.55 |
| | Fourth Quarter | 24.39 |
| 20.32 |
| 23.91 |
|
Holders
Shareholders of record as of October 17, 2017: 2,75615, 2018: 2,593
|
| | | | |
| Date Paid | | Amount |
| November 23, 2016 | | $ | 0.10 |
|
| January 25, 2017 | | 0.10 |
|
| April 26, 2017 | | 0.10 |
|
| July 26, 2017 | | 0.10 |
|
| Total | | $ | 0.40 |
|
On October 18, 2017,August 15, 2018, our Board of Directors declared a quarterly cash dividend of $0.10 per outstanding share, totaling $3.2 million, paid on September 26, 2018 to common stockholders of common stock.record at the close of business on September 12, 2018. The Board currently intends to continue to pay quarterly cash dividends payments in the future; however, declaration of future dividends, if any, will be based on several factors including our financial performance, outlook, and liquidity.
Our Credit Agreement, as further described in Note 9, Long-Term Debt, of the Notes to Consolidated Financial Statements, included in Item 8,Financial Statements and Supplementary Data, of this Annual Report on Form 10-K, contains restrictions that may limit our ability to pay dividends, if we fail to maintain certain financial covenants.
Issuer Purchases of Equity Securities
If we fail to maintain certain financial covenants, our
Our Credit Agreement as further described in Note 8, contains restrictions that may limit our ability except for limited purchases of our common stock from employees, to make distributions or payments with respect to purchases of our common stock without consent of the lenders.lenders, except for limited purchases of our common stock from employees, in the event of a significant reduction in our EBITDA or in the event of a significant borrowing on our credit agreement ("ABL"), which was increased from $125.0 million to $165.0 million on September 21, 2018. See additional information on our ABL in Note 9, Long-Term Debt, of the Notes to Consolidated Financial Statements, included in Item 8, Financial Statements and Supplementary Data, of this Annual Report on Form 10-K.
On December 19, 2007, theour Board of Directors authorized the repurchase of outstanding shares of our common stock, depending on market conditions, for an aggregate consideration of up to $60$60.0 million. On October 18, 2017, our Board of Directors authorized a share repurchase program in the amount of $70.0 million. There is no time restriction on thiseither authorization. During Fiscal 2017, 53,4682018, we repurchased 134,803 shares of our common stock at a cost of $5.0 million. An additional 33,560 shares of our common stock at a cost of $1.5 million were repurchased underto satisfy tax obligations on employee equity awards as they vested. We continually evaluate if share repurchases reflect a prudent use of our capital and, subject to compliance with our Credit Agreement, we may purchase shares in the authorization, at an aggregate cost of approximately $1.5 million, or $28.62 per share. All of these shares were repurchased from employees who vested in Winnebago Industries shares during the fiscal year and elected to pay their payroll tax via delivery of common stock as opposed to cash.future. As of August 26, 2017,25, 2018, there was approximately $2.5$66.0 million remaining under thison our board repurchase authorization.
This table provides information with respect to repurchases of sharesPurchases of our common stock during each fiscal month of the fourth quarter of Fiscal 2017:2018 were:
|
| | | | | | | | | | | | | |
| Period | Total Number of Shares Purchased | Average Price Paid per Share | Number of Shares Purchased as Part of Publicly Announced Plans or Programs | Approximate Dollar Value of Shares That May Yet Be Purchased Under the Plans or Programs |
| 05/28/17 - 07/01/17 | 4,672 |
| $ | 34.20 |
| 4,672 |
| | | $ | 2,471,000 |
| |
| 07/02/17 - 07/29/17 | — |
| $ | — |
| — |
| | | $ | 2,471,000 |
| |
| 07/30/17 - 08/26/17 | 116 |
| $ | 34.55 |
| 116 |
| | | $ | 2,467,000 |
| |
| Total | 4,788 |
| $ | 34.21 |
| 4,788 |
| | | $ | 2,467,000 |
| |
|
| | | | | | | | | | | | | |
| | Total Number of Shares Purchased(1) | | Average Price Paid per Share | | Number of Shares Purchased as Part of Publicly Announced Plans or Programs(1) | | Approximate Dollar Value of Shares That May Yet Be Purchased Under the Plans or Programs(2) |
| 05/27/18 - 06/30/18 | — |
| | $ | — |
| | — |
| | $ | 65,989,000 |
|
| 07/01/18 - 07/28/18 | — |
| | $ | — |
| | — |
| | $ | 65,989,000 |
|
| 07/29/18 - 08/25/18 | — |
| | $ | — |
| | — |
| | $ | 65,989,000 |
|
| Total | — |
|
| $ | — |
| | — |
| | $ | 65,989,000 |
|
| |
| (1) | Shares not purchased as part of a publicly announced program were repurchased from employees who vested in Company shares and elected to pay their payroll tax via the value of shares delivered as opposed to cash. |
| |
| (2) | Pursuant to a combined $130.0 million share repurchase program authorized by our Board of Directors. On December 18, 2007, $60.0 million was approved, and on October 18, 2017, $70.0 million was approved. There is no time restriction on either authorization. |
Equity Compensation Plan Information
The following table provides information as of August 26, 201725, 2018 with respect to shares of our common stock that may be issued under our existing equity compensation plans: |
| | | | | | | | | | |
| | (a) | (b) | | (c) |
Plan Category | Number of Securities to be Issued Upon Exercise of Outstanding Options, Warrants and Rights | Weighted Average Exercise Price of Outstanding Options, Warrants and Rights | Number of Securities Remaining Available for Future Issuance Under Equity Compensation Plans (Excluding Securities Reflected in (a)) |
Equity compensation plans approved by shareholders - 2004 Plan (1) | 13,500 |
| (1) | — |
| (3) | — |
| |
Equity compensation plans approved by shareholders - 2014 Plan | 296,069 |
| (2) | $ | 28.15 |
| (3) | 2,243,788 |
| (4) |
Equity compensation plans not approved by shareholders (5) | 49,729 |
| (6) | — |
| (3) | — |
| (7) |
| Total | 359,298 |
| | $ | 28.15 |
| | 2,243,788 |
| |
|
| | | | | | | | | | |
| | (a) | | (b) | | (c) |
Plan Category | Number of Securities to be Issued Upon Exercise of Outstanding Options, Warrants and Rights | | Weighted Average Exercise Price of Outstanding Options, Warrants and Rights(1) | | Number of Securities Remaining Available for Future Issuance Under Equity Compensation Plans (Excluding Securities Reflected in (a)) |
Equity compensation plans
approved by shareholders - 2004 Plan | 9,000 |
| (2) | | — |
| | — |
| |
Equity compensation plans
approved by shareholders - 2014 Plan | 469,704 |
| (3) | | 36.68 |
| | 1,677,481 |
| (4) |
Equity compensation plans not
approved by shareholders(5) | 47,366 |
| (6) | | — |
| | — |
| (7) |
| Total | 526,070 |
| | | 36.68 |
| | 1,677,481 |
| |
| |
(1) | This number represents unvested share awards granted under the 2004 Plan. No new grants may be made under the 2004 Plan. |
(2) This number represents stock options and unvested stock awards granted under the 2014 Omnibus Equity, Performance Award, and Incentive Compensation Plan, as amended ("2014 Plan"). The 2014 Plan replaced the 2004 Plan effective January 1, 2014.
| |
(3)
| This number represents the weighted average exercise price of outstanding stock options only. Restricted share awards do not have an exercise price so weighted average is not applicable. |
| |
(4)
(2) | This number represents unvested share awards granted under the 2004 Plan. No new grants may be made under the 2004 Plan. |
| |
| (3) | This number represents stock options and unvested stock awards granted under the 2014 Omnibus Equity, Performance Award, and Incentive Compensation Plan, as amended ("2014 Plan"). The 2014 Plan replaced the 2004 Plan effective January 1, 2014. |
| |
| (4) | This number represents stock options available for grant under the 2014 Plan as of August 26, 2017.25, 2018. |
| |
(5) | Our sole equity compensation plan not previously submitted to our shareholders for approval is the Directors' Deferred Compensation Plan, as amended ("Directors' Plan"). The Board of Directors may terminate the Directors' Plan at any time. If not terminated earlier, the Directors' Plan will automatically terminate on June 30, 2023. For a description of the key provisions of the Directors' Plan, see the information in our Proxy Statement for the Annual Meeting of Shareholders scheduled to be held December 12, 201711, 2018 under the caption "Director Compensation," which information is incorporated by reference herein. |
| |
6)
(6) | Represents shares of common stock issued to a trust which underlie stock units, payable on a one-for-one basis, credited to stock unit accounts as of August 26, 201725, 2018 under the Directors' Plan. |
| |
(7) | The table does not reflect a specific number of stock units which may be distributed pursuant to the Directors' Plan. The Directors' Plan does not limit the number of stock units issuable thereunder. The number of stock units to be distributed pursuant to the Directors' Plan will be based on the amount of the director's compensation deferred and the per share price of our common stock at the time of deferral. |
Performance Graph
The following graph compares our five-year cumulative total shareholder return (including reinvestment of dividends) with the cumulative total return on the Standard & Poor's 500 Index and a peer group. The peer group companies consisting of Thor Industries, Inc., Polaris Industries, Inc., and Brunswick Corporation were selected by us as they also manufacture recreation products. It is assumed in the graph that $100 was invested in our common stock, in the Standard & Poor's 500 Index and in the stocks of the peer group companies on August 25, 201231, 2013 and that all dividends received within a quarter were reinvested in that quarter. In accordance with the guidelines of the SEC, the shareholder return for each entity in the peer group index has been weighted on the basis of market capitalization as of each annual measurement date set forth in the graph.
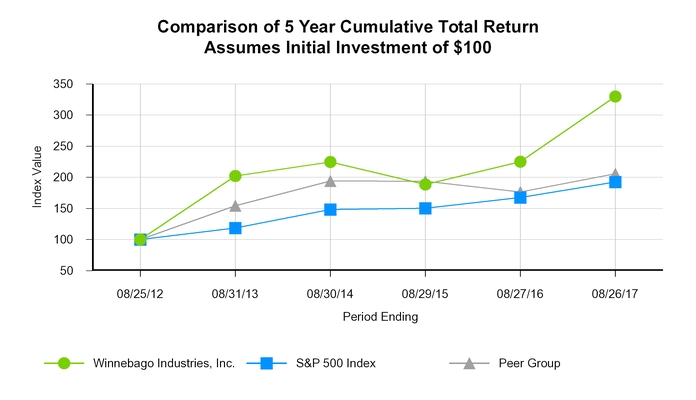
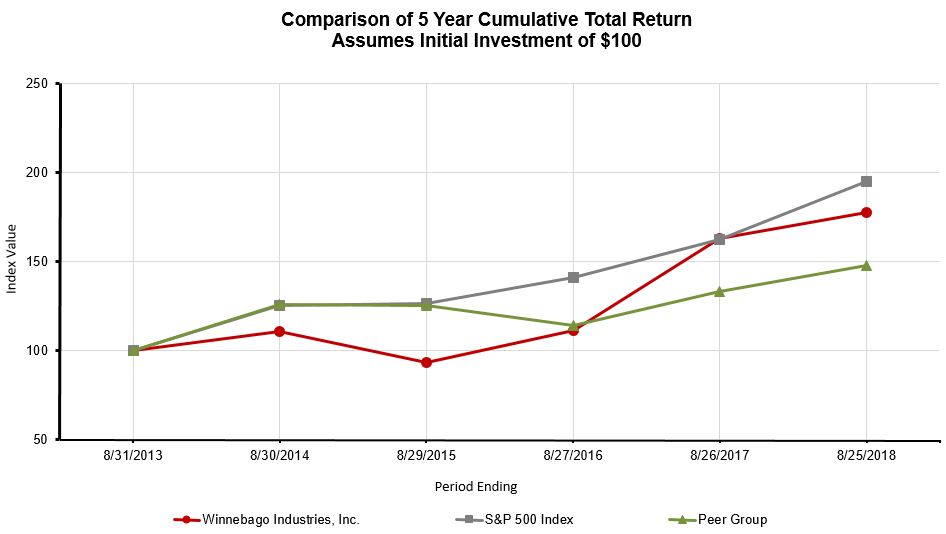
| | | | Base Period | | Base Period | |
| Company/Index | 8/25/12 | 8/31/13 | | 8/30/14 | | 8/29/15 | | 8/27/16 | | 8/26/17 | August 31,
2013 | August 30,
2014 | August 29,
2015 | August 27,
2016 | August 26,
2017 | August 25,
2018 |
| Winnebago Industries, Inc. | 100.00 |
| 202.27 |
| | 224.61 |
| | 188.62 |
| | 225.18 |
| | 329.83 |
| 100.00 |
| 111.05 |
| 93.25 |
| 111.33 |
| 163.06 |
| 177.65 |
|
| S&P 500 Index | 100.00 |
| 118.38 |
| | 148.26 |
| | 150.21 |
| | 167.44 |
| | 192.54 |
| 100.00 |
| 125.25 |
| 126.89 |
| 141.45 |
| 162.65 |
| 195.09 |
|
| Peer Group | 100.00 |
| 154.26 |
| | 194.06 |
| | 193.65 |
| | 176.32 |
| | 205.95 |
| 100.00 |
| 125.80 |
| 125.54 |
| 114.31 |
| 133.51 |
| 147.90 |
|
Source: Zacks Investment Research, Inc.
Item 6. Selected Financial DataData.
| | | | Fiscal Years Ended | Fiscal Years Ended |
| (In thousands, except EPS) | 8/26/17 (1) | | 8/27/16 | | 8/29/15 | | 8/30/14 | | 8/31/13 (2) | |
| (In thousands, except per share data) | | August 25,
2018 | | August 26, 2017(1) | | August 27,
2016 | | August 29,
2015 | | August 30,
2014 |
| Income statement data: | | | | | | | | | | | | | | | | | | |
| Net revenues | $ | 1,547,119 |
| | $ | 975,226 |
| | $ | 976,505 |
| | $ | 945,163 |
| | $ | 803,165 |
| $ | 2,016,829 |
| | $ | 1,547,119 |
| | $ | 975,226 |
| | $ | 976,505 |
| | $ | 945,163 |
|
| Net income | 71,330 |
| | 45,496 |
| | 41,210 |
| | 45,053 |
| | 31,953 |
| 102,357 |
| | 71,330 |
| | 45,496 |
| | 41,210 |
| | 45,053 |
|
| | | | | | | | | | | | | | | | | | | |
| Per share data: | | | | | | | | | | | | | | | | | | |
| Net income - basic | 2.33 |
| | 1.69 |
| | 1.53 |
| | 1.64 |
| | 1.14 |
| 3.24 |
| | 2.33 |
| | 1.69 |
| | 1.53 |
| | 1.64 |
|
| Net income - diluted | 2.32 |
| | 1.68 |
| | 1.52 |
| | 1.64 |
| | 1.13 |
| 3.22 |
| | 2.32 |
| | 1.68 |
| | 1.52 |
| | 1.64 |
|
| Dividends declared and paid per common share | 0.40 |
| | 0.40 |
| | 0.36 |
| | — |
| | — |
| 0.40 |
| | 0.40 |
| | 0.40 |
| | 0.36 |
| | — |
|
| | | | | | | | | | | | | | | | | | | |
| Balance sheet data: | | | | | | | | | | | | | | | | | | |
| Total assets | 902,512 |
| | 390,718 |
| | 362,174 |
| | 358,302 |
| | 309,145 |
| 1,051,805 |
| | 902,512 |
| | 390,718 |
| | 362,174 |
| | 358,302 |
|
| Long-term liabilities | 293,680 |
| | 29,410 |
| | 59,601 |
| | 65,835 |
| | 68,062 |
| 313,175 |
| | 293,680 |
| | 29,410 |
| | 59,601 |
| | 65,835 |
|
(1) Includes Grand Design operations from the date of its acquisition on November 8, 2016.
(2) The fiscal year ended August 31, 2013 contained 53 weeks; all other fiscal years contained 52 weeks.
| |
| (1) | Includes Grand Design operations from the date of its acquisition on November 8, 2016. |
Item 7. Management's Discussion and Analysis of Financial Condition and Results of OperationsOperations.
Management's Discussion and Analysis of Financial Condition and Results of Operations (MD&A) is intended to provide a reader of our financial statements with a narrative from the perspective of our management on our financial condition, results of operations, liquidity, and certain other factors that may affect our future results. Our MD&A is presented in six sections:
| |
• | OverviewOverview Results of Operations Analysis of Financial Condition, Liquidity, and Capital Resources Contractual Obligations and Commercial Commitments Critical Accounting Estimates New Accounting Pronouncements |
Our MD&A should be read in conjunction with the Consolidated Financial Statements and related Notes included in Item 8, Financial Statements and Supplementary Data, of this Annual Report on Form 10-K.
Overview
Winnebago Industries, Inc. is aone of the leading US manufacturer of RVsU.S. manufacturers with a proud historydiversified portfolio of manufacturing RVrecreation vehicles ("RV"s) and marine products for 59 years.used primarily in leisure travel and outdoor recreation activities. We currently produce a large majority of our motorhomes in vertically integrated manufacturing facilities in Iowa and we produce all ofOregon; our travel trailertowable units in Indiana; and fifth wheel trailersour marine products in Indiana. We are in the process of expanding some motorhome manufacturing to Junction City, Oregon.Florida. We distribute our RV and marine products primarily through independent dealers throughout the USU.S. and Canada, who then retail the products to the end consumer.
Significant Transaction
On November 8, 2016, we closed on We also distribute our marine products internationally through independent dealers, who then retail the acquisition of all the issued and outstanding capital stock of towable RV manufacturer Grand Design for an aggregate purchase price of $520.5 million. This acquisition was funded from our cash on hand, $353.0 million from asset-based revolving and term loan credit facilities, as well as stock consideration as is more fully described in Note 2 and Note 8products to the Consolidated Financial Statements. We purchased Grand Design to significantly expand our existing towable RV product offerings and dealer base and acquire additional talent in the RV industry.
In the first quarter of Fiscal 2017, we revised our reporting segments. Previously, we had one reporting segment which included all RV products and services. With the acquisition of Grand Design in the first quarter, we expanded the number of reporting segments to two: (1) Motorized products and services and (2) Towable products and services. The Motorized segment includes all products that include a motorized chassis as well as other related manufactured products. The Towable segment includes all products which are not motorized and are generally towed by another vehicle. Prior year segment information has been restated to conform to the current reporting segment presentation.
Industry Trends
Key reported statistics for the North American RV industry are as follows:
Wholesale unit shipments: RV product delivered to the dealers, which is reported monthly by RVIA
Retail unit registrations: consumer purchases of RVs from dealers, which is reported by Stat Surveys
We track RV Industry conditions using these key statistics to monitor trends and evaluate and understand our performance relative to the overall industry. The rolling twelve months shipment and retail information for 2017 and 2016, as noted below, illustrates that the RV industry continues to grow at the wholesale and retail level. We believe retail demand is the key driver to continued growth in the industry. |
| | | | | | | | | | | | | | | | | | |
| | | US and Canada Industry |
| | | Wholesale Unit Shipments per RVIA | | Retail Unit Registrations per Stat Surveys |
| | | Rolling 12 Months through August | | Rolling 12 Months through August |
| (In units) | | 2017 | 2016 | Increase | Change | | 2017 | 2016 | Increase | Change |
Towable (1) | | 402,258 |
| 342,334 |
| 59,924 |
| 17.5 | % | | 376,912 |
| 338,144 |
| 38,768 |
| 11.5 | % |
Motorized (2) | | 59,891 |
| 52,648 |
| 7,243 |
| 13.8 | % | | 55,725 |
| 48,504 |
| 7,221 |
| 14.9 | % |
| Combined | | 462,149 |
| 394,982 |
| 67,167 |
| 17.0 | % | | 432,637 |
| 386,648 |
| 45,989 |
| 11.9 | % |
| |
(1)
| Towable: Fifth wheel and travel trailer products |
| |
(2)
| Motorized: Class A, B and C products |
The most recent towable and motorized RVIA wholesale shipment forecasts for calendar year 2017 and 2018 as noted in the table below illustrates continued projected growth of the industry. The outlook for future growth in RV sales is based on continued modest gains in job and disposable income prospects as well as low inflation, and takes into account the impact of slowly rising interest rates, a strong U.S. dollar and continued weakness in energy production and prices.
|
| | | | | | | | | |
| | | Calendar Year |
Wholesale Unit Shipment Forecast per RVIA (1) | | 2018 |
| 2017 |
| Unit Change | % Change |
| Towable | | 419,400 |
| 408,200 |
| 11,200 |
| 2.7 | % |
| Motorized | | 61,900 |
| 60,200 |
| 1,700 |
| 2.8 | % |
| Combined | | 481,300 |
| 468,400 |
| 12,900 |
| 2.8 | % |
| |
(1)
| Prepared by Dr. Richard Curtin of the University of Michigan Consumer Survey Research Center for RVIA and reported in the Roadsigns RV Fall 2017 Industry Forecast Issue. |
Market Share
Our retail unit market share, as reported by Stat Surveys based on state records, is illustrated below. Note that this data is subject to adjustment and is continuously updated. |
| | | | | | | | | | | | |
| | | Rolling 12 Months Through August | | Calendar Year |
| US and Canada | | 2017 | 2016 | | 2016 | 2015 | 2014 |
| Motorized A, B, C | | 16.3 | % | 18.6 | % | | 18.0 | % | 20.5 | % | 20.7 | % |
| Travel trailer and fifth wheels | | 5.1% (1) |
| 1.1 | % | | 1.7 | % | 0.9 | % | 0.8 | % |
| |
(1)
| Includes retail unit market share for Grand Design since acquisition on November 8, 2016. Towable market share using data for the full rolling 12 month period is 5.7%. |
Facility Expansion
During Fiscal 2017, the Board of Directors approved two large facility expansion projects in the fast growing Towable segment. The Grand Design expansion project began in Fiscal 2017 and is expected to increase units produced midway through Fiscal 2018. The facility expansion in the Winnebago-branded Towable division is expected to increase units produced by the end of Fiscal 2018.
ERP System
In the second quarter of Fiscal 2015, the Board of Directors approved the strategic initiative of implementing an ERP system to replace our legacy business applications. The new ERP platform will provide better support for our changing business needs and plans for future growth. Our initial cost estimates have grown for additional needs of the business such as the acquisition of the Junction City, Oregon plant and the opportunity to integrate the ERP system with additional manufacturing systems. The project includes software, external implementation assistance and increased internal staffing directly related to this initiative. We anticipate
that approximately 40% of the cost will be expensed in the period incurred and 60% will be capitalized and depreciated over its useful life.
The following table illustrates the cumulative project costs:
|
| | | | | | | | | | | | | | | | | | | |
| | | Fiscal | | Fiscal | | Fiscal | | Cumulative |
| (In thousands) | | 2017 | | 2016 | | 2015 | | Investment |
| Capitalized | | $ | 1,881 |
| | $ | 7,798 |
| | $ | 3,291 |
| | $ | 12,970 |
| | 54 | % |
| Expensed | | 2,601 |
| | 5,930 |
| | 2,528 |
| | 11,059 |
| | 46 | % |
| Total | | $ | 4,482 |
| | $ | 13,728 |
| | $ | 5,819 |
| | $ | 24,029 |
| | 100 | % |
In May of 2017, the Board approved continued investment in the ERP system and a change in implementation partner. The project is proceeding and the benefits are expected to be realized over the next several years. Total project costs are expected to be approximately $38 million.
Consolidated Results of Operations
Fiscal 2017 Compared to Fiscal 2016
The following is an analysis of changes in key items included in the statements of operations for the fiscal year ended August 26, 2017 compared to the fiscal year ended August 27, 2016:
|
| | | | | | | | | | | | | | | |
| | Year Ended |
(In thousands, except percent and per share data) | August 26,
2017 | % of Revenues(1) | August 27,
2016 | % of Revenues(1) | Increase (Decrease) | % Change |
| Net revenues | $ | 1,547,119 |
| 100.0 | % | $ | 975,226 |
| 100.0 | % | $ | 571,893 |
| 58.6 | % |
| Cost of goods sold | 1,324,542 |
| 85.6 | % | 862,577 |
| 88.4 | % | 461,965 |
| 53.6 | % |
| Gross profit | 222,577 |
| 14.4 | % | 112,649 |
| 11.6 | % | 109,928 |
| 97.6 | % |
| | | | | | | |
| Selling | 35,668 |
| 2.3 | % | 19,823 |
| 2.0 | % | 15,845 |
| 79.9 | % |
| General and administrative | 55,347 |
| 3.6 | % | 33,209 |
| 3.4 | % | 22,138 |
| 66.7 | % |
| Postretirement health care benefit income | (24,796 | ) | (1.6 | )% | (6,124 | ) | (0.6 | )% | (18,672 | ) | 304.9 | % |
| Transaction costs | 6,592 |
| 0.4 | % | — |
| — | % | 6,592 |
| — | % |
| Amortization of intangible assets | 24,660 |
| 1.6 | % | — |
| — | % | 24,660 |
| — | % |
| Total SG&A | 97,471 |
| 6.3 | % | 46,908 |
| 4.8 | % | 50,563 |
| 107.8 | % |
| | | | | | | |
| Operating income | 125,106 |
| 8.1 | % | 65,741 |
| 6.7 | % | 59,365 |
| 90.3 | % |
| Interest Expense | 16,837 |
| 1.1 | % | — |
| — | % | 16,837 |
| — | % |
| Non-operating income | (330 | ) | — | % | (457 | ) | — | % | 127 |
| (27.8 | )% |
| Income before income taxes | 108,599 |
| 7.0 | % | 66,198 |
| 6.8 | % | 42,401 |
| 64.1 | % |
| Provision for taxes | 37,269 |
| 2.4 | % | 20,702 |
| 2.1 | % | 16,567 |
| 80.0 | % |
| Net income | $ | 71,330 |
| 4.6 | % | $ | 45,496 |
| 4.7 | % | $ | 25,834 |
| 56.8 | % |
| | | | | | | |
| Diluted income per share | $ | 2.32 |
| | $ | 1.68 |
| | $ | 0.64 |
| 38.1 | % |
| Diluted average shares outstanding | 30,766 |
| | 27,033 |
| | 3,733 |
| 13.8 | % |
(1) Percentages may not add due to rounding differences.
Consolidated net revenues increased $571.9 million or 58.6% in Fiscal 2017 over Fiscal 2016. This was primarily due to the acquisition of Grand Design which added revenues of $559.7 million in Fiscal 2017. Winnebago-branded towables products increased $36.1 million in Fiscal 2017. Growth in Towables revenues was partially offset by a $23.9 million decrease in Motorized revenues caused mainly by the consumer trend towards smaller RVs with a lower ASP. In addition, we exited the aluminum extrusion operation in Fiscal 2016 which caused a reduction of $6.1 million in Fiscal 2017 net revenue.
Cost of goods sold was $1.3 billion, or 85.6% of net revenues for Fiscal 2017 compared to $862.6 million, or 88.4% of net revenues for Fiscal 2016 due to the following:
Total variable costs (materials, direct labor, variable overhead, delivery expense and warranty), as a percent of net revenues, decreased to 81.2% from 83.2% primarily due to a higher proportion of Towable revenue as the Towable segment operates at a higher gross profit rate. Also, improvement in Towables material efficiency and purchasing synergies reduced costs as a percent of net revenue. Finally, improvement in the Towable segment margin was partially offset by margin pressure in the Motorized segment due in part to the ramp up of the Junction City production facility.
Fixed overhead (manufacturing support labor, depreciation and facility costs) and engineering-related costs were lower at 4.5% of net revenues compared to 5.2% in the prior year due mainly to a higher proportion of Towable revenue which operates at a lower fixed cost per unit.
All factors considered, gross profit increased from 11.6% to 14.4% of net revenues.
Selling expenses were 2.3% of net revenues in Fiscal 2017 and 2.0% in Fiscal 2016. Selling expenses are largely variable and proportional to revenues. The increase in the rate of selling expense in Fiscal 2017 is due to the higher mix of Towable volume which operates at a higher commission rate.
General and administrative expenses were 3.6% and 3.4% of net revenues in Fiscal 2017 and Fiscal 2016, respectively. General and administrative expenses increased $22.1 million, or 66.7%, in Fiscal 2017. This increase was due to the addition of $13.9 million of general and administrative expenses related to the acquired Grand Design operation, an increase of $6.2 million in transaction related expenses, and the addition of $24.7 million in intangible amortization. In addition, Fiscal 2016 results of operations were impacted by $3.4 million in favorable legal settlements. These increases were partially offset in Fiscal 2017 by the increased benefit of $18.7 million associated with the termination of the postretirement health care plan and reduced ERP implementation expenses.
Non-operating income decreased $0.1 million, in Fiscal 2017, primarily due to lower proceeds from COLI policies than we received in Fiscal 2016.
The effective tax rate for Fiscal 2017 was 34.3% compared to 31.3% in Fiscal 2016.The increase in the effective tax rate is primarily due to the increased income attributable to the Grand Design acquisition without a proportionate increase in tax credits and other favorable permanent items that provide a benefit to the tax rate. See Note 12.
Net income and diluted income per share were $71.3 million and $2.32 per share, respectively, for Fiscal 2017. In Fiscal 2016, net income was $45.5 million and diluted income per share was $1.68.consumer.
Non-GAAP Reconciliation
We have provided
This MD&A includes financial information prepared in accordance with accounting principles generally accepted in the followingU.S. ("GAAP"), as well as certain adjusted or non-GAAP financial measures such as EBITDA and Adjusted EBITDA. EBITDA is defined as net income before interest expense, provision for income taxes, and depreciation and amortization expense. Adjusted EBITDA is defined as net income before interest expense, provision for income taxes, depreciation and amortization expense, and other adjustments made in order to present comparable results from period to period. These non-GAAP financial measures, which are not calculated or presented in accordance with GAAP, have been provided as information supplemental and in addition to the financial measures presented in accordance with GAAP. Such non-GAAP financial measures should not be considered superior to, as a substitute for, or as an alternative to, and should be considered in conjunction with, the GAAP financial measures presented herein. The non-GAAP financial measures presented below may differ from similar measures used by other companies.
The following table reconciles net incomeRefer to consolidated Adjusted EBITDAthe Consolidated Results of Operations-Fiscal 2018 Compared to Fiscal 2017 and the Consolidated Results of Operations-Fiscal 2017 Compared to Fiscal 2016 for Fiscal 2017 and Fiscal 2016.
|
| | | | | | | | |
| | | Year Ended |
| (In thousands) | | August 26,
2017 | | August 27,
2016 |
| Net income | | $ | 71,330 |
| | $ | 45,496 |
|
| Interest expense | | 16,837 |
| | — |
|
| Provision for income taxes | | 37,269 |
| | 20,702 |
|
| Depreciation | | 7,315 |
| | 5,745 |
|
| Amortization | | 24,660 |
| | — |
|
| EBITDA | | 157,411 |
| | 71,943 |
|
| Postretirement health care benefit income | | (24,796 | ) | | (6,124 | ) |
| Legal settlement | | — |
| | (3,400 | ) |
| Transaction costs | | 6,592 |
| | 355 |
|
| Non-operating income | | (330 | ) | | (457 | ) |
| Adjusted EBITDA | | $ | 138,877 |
| | $ | 62,317 |
|
We have provided non-GAAP performance measuresa detailed reconciliation of items that impacted EBITDA and Adjusted EBITDAEBITDA. We have included this non-GAAP performance measure as a comparable measure to illustrate items impacting currentthe effect of non-recurring transactions occurring during the year and improve comparability of our results which are not expectedfrom period to impact future performance. EBITDA is defined as net income before interest expense, provision for income taxes, and depreciation and amortization expense.period. We believe EBITDA and Adjusted EBITDA provideprovides meaningful supplemental information about our operating performance because eachthis measure excludes amounts that we do not consider part of our core operating results when assessing our performance. Examples of items excluded from Adjusted EBITDA include the postretirement health care benefit resultingincome from plan amendments and termination overterminating the past several years, favorable legal settlements including our Fiscal 2016 Australia trademark settlement,plan and transaction costs related to our acquisitionacquisitions. These types of Grand Design RV.adjustments are also specified in the definition of certain measures required under the terms of our
Credit Agreement. For additional information, see Note 9, Long-Term Debt, of the Notes to Consolidated Financial Statements, included in Item 8, Financial Statements and Supplementary Data, of this Annual Report on Form 10-K.
Management uses these non-GAAP financial measures (a) to evaluate our historical and prospective financial performance and trends as well as our performance relative to competitors and peers that publish similar measures;peers; (b) to measure operational profitability on a consistent basis; (c) in presentations to the members of our board of directors to enable our board of directors to have the same measurement basis of operating performance as is used by management in theirits assessments of performance and in forecasting and budgeting for our company; and, (d) to evaluate potential acquisitions.acquisitions; and (e) to ensure compliance with covenants and restricted activities under the terms of our Credit Agreement. We believe these non-GAAP financial measures are frequently used by securities analysts, investors, and other interested parties to evaluate companies in our industry.
Business Combinations
On June 4, 2018, we acquired 100% of the ownership interests of Chris-Craft, a privately-owned company based in Sarasota, Florida. Chris-Craft manufactures and sells premium quality boats in the recreational powerboat industry through an established global network of independent authorized dealers.
On November 8, 2016, we closed on the acquisition of all the issued and outstanding capital stock of towable RV manufacturer Grand Design RV, LLC ("Grand Design") for an aggregate purchase price of $520.5 million. This acquisition was funded from our cash on hand, $353.0 million from asset-based revolving and term loan credit facilities, as well as stock consideration as is more fully described in Note 2, Business Combinations, of the Notes to Consolidated Financial Statements, included in Item 8, Financial Statements and Supplementary Data, of this Annual Report on Form 10-K. We purchased Grand Design to significantly expand our existing towable RV product offerings and dealer base and acquire additional talent in the RV industry.
Reportable Segments
Beginning in the fourth quarter of Fiscal 2018, we have five operating segments: 1) Winnebago motorhomes, 2) Winnebago towables, 3) Grand Design towables, 4) Winnebago specialty vehicles, and 5) Chris-Craft marine. We evaluate performance based on each operating segment's Adjusted EBITDA, as defined above, which excludes certain corporate administration expenses and non-operating income and expense.
Our two reportable segments include: 1) Motorhome (comprised of products that include a motorized chassis as well as other related manufactured products and services) and 2) Towable (comprised of products which are not motorized and are generally towed by another vehicle as well as other related manufactured products and services), which is an aggregation of the Winnebago towables and Grand Design towables operating segments.
The Corporate / All Other category includes the Winnebago specialty vehicles and Chris-Craft marine operating segments as well as expenses related to certain corporate administration expenses for the oversight of the enterprise. These expenses include items such as corporate leadership and administration costs. Previously, these expenses were allocated to each operating segment.
Prior year segment information has been reclassified to conform to the current reportable segment presentation. The reclassifications included removing the corporate administration expenses from both the Motorhome and Towable reportable segments and removing Winnebago specialty vehicles from the Motorhome reportable segment, as we begin to dedicate leadership and focus on these operations separately from our Winnebago motorhomes operations.
Industry Trends
Key reported statistics for the North American RV industry are as follows:
Wholesale unit shipments: RV product delivered to the dealers, which is reported monthly by the Recreation Vehicle Industry Association ("RVIA")
Retail unit registrations: consumer purchases of RVs from dealers, which is reported by Stat Surveys
We track RV Industry conditions using these key statistics to monitor trends and evaluate and understand our performance relative to the overall industry. The rolling twelve months shipment and retail information for 2018 and 2017, as noted below, illustrates that the RV industry continues to grow at the wholesale and retail level. We believe retail demand is the key driver to continued growth in the industry. |
| | | | | | | | | | | | | | | | | |
| | US and Canada Industry |
| | Wholesale Unit Shipments per RVIA | | Retail Unit Registrations per Stat Surveys |
| | Rolling 12 Months through August | | Rolling 12 Months through August |
| (In units) | 2018 | 2017 | Increase | % Change | | 2018 | 2017 | Increase | % Change |
Towable(1) | 443,572 |
| 402,258 |
| 41,314 |
| 10.3 | % | | 417,013 |
| 383,248 |
| 33,765 |
| 8.8 | % |
Motorhome(2) | 62,095 |
| 59,891 |
| 2,204 |
| 3.7 | % | | 58,452 |
| 56,187 |
| 2,265 |
| 4.0 | % |
| Combined | 505,667 |
| 462,149 |
| 43,518 |
| 9.4 | % | | 475,465 |
| 439,435 |
| 36,030 |
| 8.2 | % |
| |
| (1) | Towable: Fifth wheel and travel trailer products. |
| |
| (2) | Motorhome: Class A, B and C products. |
The most recent RVIA wholesale shipment forecasts for calendar year 2019, as noted in the table below, indicate that industry shipments are most likely expected to decline slightly in 2019. The RV sales outlook is based on anticipated increases in inflation and interest rates and rising costs of production, partially offset by strong job and wage growth.
|
| | | | | | | | |
| | Calendar Year |
Wholesale Unit Shipment Forecast per RVIA(1) | 2019 Forecast | 2018 Actual | Unit Change | % Change |
| Aggressive | 510,600 |
| 505,900 |
| 4,700 |
| 0.9 | % |
| Most likely | 497,100 |
| 505,900 |
| (8,800 | ) | (1.7 | )% |
| Conservative | 485,900 |
| 505,900 |
| (20,000 | ) | (4.0 | )% |
| |
| (1) | Prepared by Dr. Richard Curtin of the University of Michigan Consumer Survey Research Center for RVIA and reported in the Roadsigns RV Fall 2018 Industry Forecast Issue. |
Market Share
Our retail unit market share, as reported by Stat Surveys based on state records, is illustrated below. Note that this data is subject to adjustment and is continuously updated. |
| | | | | | | | | |
| | Rolling 12 Months Through August | | Calendar Year |
| US and Canada | 2018 | 2017(1) | | 2017(1) | 2016 | 2015 |
| Motorhome A, B, C | 15.7% | 16.4% | | 16.2 | % | 18.0 | % | 20.5 | % |
| Travel trailer and fifth wheels | 7.4% | 5.2% | | 6.1 | % | 1.7 | % | 0.9 | % |
| |
| (1) | Includes retail unit market share for Grand Design since acquisition on November 8, 2016. |
Facility Expansion
During Fiscal 2017, our Board of Directors approved two large facility expansion projects to increase production capacity in the fast growing Towable segment. The Grand Design expansion project consisted of two new production facilities. The first facility was completed in the second quarter of Fiscal 2018, and the second was completed in the third quarter of Fiscal 2018. Both facilities have resulted in an increase in units produced. The facility expansion in the Winnebago towables division is expected to be completed in the first half of Fiscal 2019.
Enterprise Resource Planning System
In the second quarter of Fiscal 2015, our Board of Directors approved the strategic initiative of implementing an enterprise resource planning ("ERP") system to replace our legacy business applications. The new ERP platform will provide better support for our changing business needs and plans for future growth. Our initial cost estimates have grown for additional needs of the business, such as the opportunity to integrate the ERP system with additional manufacturing systems. The project includes software, external implementation assistance, and increased internal staffing directly related to this initiative. We anticipate that approximately 40% of the cost will be expensed in the period incurred and 60% will be capitalized and depreciated over its useful life.
The following table illustrates the cumulative project costs:
|
| | | | | | | | | | | | | | | | | | | | | | |
| | Fiscal | | Fiscal | | Fiscal | | Fiscal | | Cumulative |
| (In thousands) | 2018 | | 2017 | | 2016 | | 2015 | | Investment |
| Capitalized | $ | 5,941 |
| | $ | 1,881 |
| | $ | 7,798 |
| | $ | 3,291 |
| | $ | 18,911 |
| | 59 | % |
| Expensed | 2,107 |
| | 2,601 |
| | 5,930 |
| | 2,528 |
| | 13,166 |
| | 41 | % |
| Total | $ | 8,048 |
| | $ | 4,482 |
| | $ | 13,728 |
| | $ | 5,819 |
| | $ | 32,077 |
| | 100 | % |
Consolidated Results of Operations
Fiscal 2018 Compared to Fiscal 2017
The following is an analysis of changes in key items included in the statements of operations for the fiscal year ended August 25, 2018 compared to the fiscal year ended August 26, 2017:
|
| | | | | | | | | | | | | | | |
| | Year Ended |
(In thousands, except percent and per share data) | August 25,
2018 | % of Revenues(1) | August 26,
2017 | % of Revenues(1) | Increase (Decrease) | % Change |
| Net revenues | $ | 2,016,829 |
| 100.0 | % | $ | 1,547,119 |
| 100.0 | % | $ | 469,710 |
| 30.4 | % |
| Cost of goods sold | 1,716,993 |
| 85.1 | % | 1,324,542 |
| 85.6 | % | 392,451 |
| 29.6 | % |
| Gross profit | 299,836 |
| 14.9 | % | 222,577 |
| 14.4 | % | 77,259 |
| 34.7 | % |
| | | | | | | |
| Selling | 49,850 |
| 2.5 | % | 35,668 |
| 2.3 | % | 14,182 |
| 39.8 | % |
| General and administrative | 78,089 |
| 3.9 | % | 55,347 |
| 3.6 | % | 22,742 |
| 41.1 | % |
| Postretirement health care benefit income | — |
| — | % | (24,796 | ) | (1.6 | )% | (24,796 | ) | (100.0 | )% |
| Transaction costs | 2,177 |
| 0.1 | % | 6,592 |
| 0.4 | % | (4,415 | ) | (67.0 | )% |
| Amortization of intangible assets | 9,328 |
| 0.5 | % | 24,660 |
| 1.6 | % | (15,332 | ) | (62.2 | )% |
| Total general and administrative | 89,594 |
| 4.4 | % | 61,803 |
| 4.0 | % | 27,791 |
| 45.0 | % |
| Total selling, general, and administrative expenses ("SG&A") | 139,444 |
| 6.9 | % | 97,471 |
| 6.3 | % | 41,973 |
| 43.1 | % |
| | | | | | | |
| Operating income | 160,392 |
| 8.0 | % | 125,106 |
| 8.1 | % | 35,286 |
| 28.2 | % |
| Interest expense | 18,246 |
| 0.9 | % | 16,837 |
| 1.1 | % | 1,409 |
| 8.4 | % |
| Non-operating income | (494 | ) | — | % | (330 | ) | — | % | 164 |
| 49.7 | % |
| Income before income taxes | 142,640 |
| 7.1 | % | 108,599 |
| 7.0 | % | 34,041 |
| 31.3 | % |
| Provision for taxes | 40,283 |
| 2.0 | % | 37,269 |
| 2.4 | % | 3,014 |
| 8.1 | % |
| Net income | $ | 102,357 |
| 5.1 | % | $ | 71,330 |
| 4.6 | % | $ | 31,027 |
| 43.5 | % |
| | | | | | | |
| Diluted income per share | $ | 3.22 |
| | $ | 2.32 |
| | $ | 0.90 |
| 38.8 | % |
| Diluted average shares outstanding | 31,814 |
| | 30,766 |
| | 1,048 |
| 3.4 | % |
| |
| (1) | Percentages may not add due to rounding differences. |
Consolidated net revenues increased in Fiscal 2018 compared to Fiscal 2017 primarily due to organic volume growth in our Towable segment and acquisition-related growth.
Gross profit as a percentage of revenue increased in Fiscal 2018 compared to Fiscal 2017 driven by a favorable mix due to the accelerated growth in the Towable segment.
Selling expenses increased in Fiscal 2018 compared to Fiscal 2017 primarily due to volume growth in our Towable segment.
Total general and administrative expenses increased in Fiscal 2018 compared to Fiscal 2017 due primarily to the $24.8 million benefit recorded in Fiscal 2017 associated with the termination of the postretirement health care plan, investments in our business, and incentives related to the growth in our business. The increase was partially offset by the reduction of amortization of definite-lived intangible assets, driven by the Grand Design acquisition in Fiscal 2017.
Interest expense increased in Fiscal 2018 compared to Fiscal 2017, which was related to our Credit Agreements associated with the acquisition of Grand Design. See Analysis of Financial Condition, Liquidity, and Resources and Note 9, Long-Term Debt, of the
Notes to Consolidated Financial Statements, included in Item 8, Financial Statements and Supplementary Data, of this Annual Report on Form 10-K for further information.
The overall effective income tax rate for Fiscal 2018 was 28.2% compared to the effective income tax rate of 34.3% for Fiscal 2017. The decrease in the tax rate from Fiscal 2017 to Fiscal 2018 was primarily due to the decrease in the Federal statutory rate as part of the enactment of the Tax Cuts and Jobs Act ("Tax Act") on December 22, 2017. The decrease was partially offset by the required remeasurement of our net deferred tax assets due to the change in the Federal statutory tax rate.
Net income and diluted income per share increased in Fiscal 2018 compared to Fiscal 2017 primarily due to the sales increase in the Towable segment, the increased gross profit rate, and the lower effective income tax rate. These increases were partially offset by an increase in the SG&A rate driven primarily by the termination of the postretirement health care plan, which lowered expense in Fiscal 2017.
Non-GAAP Reconciliation
The following table reconciles net income to consolidated Adjusted EBITDA for Fiscal 2018 and Fiscal 2017.
|
| | | | | | | |
| | Year Ended |
| (In thousands) | August 25, 2018 | | August 26, 2017 |
| Net income | $ | 102,357 |
| | $ | 71,330 |
|
| Interest expense | 18,246 |
| | 16,837 |
|
| Provision for income taxes | 40,283 |
| | 37,269 |
|
| Depreciation | 9,849 |
| | 7,315 |
|
| Amortization | 9,328 |
| | 24,660 |
|
| EBITDA | 180,063 |
| | 157,411 |
|
| Postretirement health care benefit income | — |
| | (24,796 | ) |
| Transaction costs | 2,177 |
| | 6,592 |
|
| Non-operating income | (494 | ) | | (330 | ) |
| Adjusted EBITDA | $ | 181,746 |
| | $ | 138,877 |
|
Segment Results of Operations
The following is an analysis of key changes in our MotorizedMotorhome segment for Fiscal 20172018 compared to Fiscal 2016.2017.
| | | Motorized | | Year Ended | | | |
| | | Aug 26,
2017 | % of Revenue | | Aug 27,
2016 | % of Revenue | | (Decrease) | % Change | |
| Motorhome | | Year Ended | | |
| (In thousands, except units) | | August 25,
2018 | % of Revenue | | August 26,
2017 | % of Revenue | | Increase (Decrease) | % Change |
| Net revenues | | $ | 861,922 |
| | | $ | 885,814 |
| | | $ | (23,892 | ) | (2.7 | )% | $ | 860,675 |
| | | $ | 853,360 |
| | | $ | 7,315 |
| 0.9 | % |
| Adjusted EBITDA | | 43,948 |
| 5.1 | % | | 57,365 |
| 6.5 | % | | (13,417 | ) | (23.4 | )% | 35,508 |
| 4.1 | % | | 56,518 |
| 6.6 | % | | (21,010 | ) | (37.2 | )% |
| | | | | | | | | | | | | | | | |
| Unit deliveries | | Aug 26,
2017 | Product Mix % (1) | | Aug 27,
2016 | Product Mix % (1) | | Increase (Decrease) | % Change | August 25,
2018 | Product Mix % (1) | | August 26,
2017 | Product Mix % (1) | | Increase (Decrease) | % Change |
| Class A | | 3,182 |
| 34.4 | % | | 2,925 |
| 31.4 | % | | 257 |
| 8.8 | % | 2,997 |
| 31.4 | % | | 3,182 |
| 34.4 | % | | (185 | ) | (5.8 | )% |
| Class B | | 1,541 |
| 16.6 | % | | 1,239 |
| 13.3 | % | | 302 |
| 24.4 | % | 2,012 |
| 21.1 | % | | 1,541 |
| 16.6 | % | | 471 |
| 30.6 | % |
| Class C | | 4,537 |
| 49.0 | % | | 5,143 |
| 55.3 | % | | (606 | ) | (11.8 | )% | 4,539 |
| 47.5 | % | | 4,537 |
| 49.0 | % | | 2 |
| — | % |
| Total motorhomes | | 9,260 |
| 100.0 | % | | 9,307 |
| 100.0 | % | | (47 | ) | (0.5 | )% | |
| Total Motorhome | | 9,548 |
| 100.0 | % | | 9,260 |
| 100.0 | % | | 288 |
| 3.1 | % |
| | | | | | | | | | | | | | | | |
| Motorhome ASP | | $ | 91,759 |
| | | $ | 93,116 |
| | | $ | (1,357 | ) | (1.5 | )% | |
| Motorhome average selling price ("ASP") | | $ | 89,879 |
| | | $ | 91,759 |
| | | $ | (1,880 | ) | (2.0 | )% |
| | | | | | | | | | | | | | | | |
| | | | | | As Of | | | | | | As Of | | |
Backlog (2) | | | | | Aug 26,
2017 | Aug 27,
2016 | | Increase (Decrease) | % Change | | | | August 25,
2018 | August 26,
2017 | | Increase | % Change |
| Units | | | | | 1,293 |
| 1,139 |
| | 154 |
| 13.5 | % | | | | 1,693 |
| 1,293 |
| | 400 |
| 30.9 | % |
| Dollars | | | | | $ | 122,142 |
| $ | 107,621 |
| | $ | 14,521 |
| 13.5 | % | | | | $ | 157,554 |
| $ | 122,142 |
| | $ | 35,412 |
| 29.0 | % |
| | | | | | | | | | | | | | | | |
| Dealer Inventory | | | | | | | | | | | | | | | |
| Units | | | | | 4,282 |
| 4,345 |
| | (63 | ) | (1.4 | )% | | | | 4,620 |
| 4,282 |
| | 338 |
| 7.9 | % |
| |
| (1) | Percentages may not add due to rounding differences. |
(1) Percentages may not add due to rounding differences.
(2) | |
| (2) | We include in our backlog all accepted orders from dealers to generally be shipped within the next six months. Orders in backlog can be cancelled or postponed at the option of the dealer at any time without penalty and, therefore, backlog may not necessarily be an accurate measure of future sales. |
Motorhome net revenues increased in Fiscal 2018 as compared to Fiscal 2017 primarily due to an increase in the number of units sold, partially offset by product mix.
Motorhome unit deliveries grew slower than recent industry growth in Fiscal 2018 compared to Fiscal 2017. Our overall Motorhome market share moved to 15.7% from 16.4% when comparing shipments during the twelve-month trailing periods ended August 2018 and August 2017 due to a mix change from our Class A-diesel products to our Class B products.
Motorhome Adjusted EBITDA decreased in Fiscal 2018 as compared to Fiscal 2017 due to increased material costs and investments in our business, including higher costs and lower productivity associated with a new facility that produces our Class A diesel product line.
The following is an analysis of key changes in our Towable segment for Fiscal 2018 compared to Fiscal 2017.
|
| | | | | | | | | | | | | | | | | | |
| Towable | Year Ended | | |
| (In thousands, except units) | August 25,
2018 | % of Revenue | | August 26,
2017 | % of Revenue | | Increase | % Change |
| Net revenues | $ | 1,127,723 |
| | | $ | 685,197 |
| | | $ | 442,526 |
| 64.6 | % |
| Adjusted EBITDA | 157,010 |
| 13.9 | % | | 89,734 |
| 13.1 | % | | 67,276 |
| 75.0 | % |
| | | | | | | | | |
| Unit deliveries | August 25,
2018 | Product Mix % (1) | | August 26,
2017 | Product Mix % (1) | | Increase | % Change |
| Travel trailer | 22,360 |
| 61.1 | % | | 13,650 |
| 60.7 | % | | 8,710 |
| 63.8 | % |
| Fifth wheel | 14,229 |
| 38.9 | % | | 8,824 |
| 39.3 | % | | 5,405 |
| 61.3 | % |
| Total Towable | 36,589 |
| 100.0 | % | | 22,474 |
| 100.0 | % | | 14,115 |
| 62.8 | % |
| | | | | | | | | |
| Towable ASP | 30,941 |
| | | 30,571 |
| | | 370 |
| 1.2 | % |
| | | | | | | | | |
| | | | | As Of | | |
Backlog (2) | | | | August 25,
2018 | August 26,
2017 | | (Decrease) Increase | % Change |
| Units | | | | 7,651 |
| 8,001 |
| | (350 | ) | (4.4 | )% |
| Dollars | | | | $ | 244,854 |
| $ | 229,706 |
| | $ | 15,148 |
| 6.6 | % |
| | | | | | | | | |
| Dealer Inventory | | | | | | | | |
| Units | | | | 14,877 |
| 9,545 |
| | 5,332 |
| 55.9 | % |
| |
| (1) | Percentages may not add due to rounding differences. |
| |
| (2) | We include in our backlog all accepted orders from dealers to generally be shipped within the next six months. Orders in backlog can be cancelled or postponed at the option of the dealer at any time without penalty and, therefore, backlog may not necessarily be an accurate measure of future sales. |
Towable net revenues increased in Fiscal 2018 as compared to Fiscal 2017 primarily due to organic volume growth as well as the annualization of net revenues related to the Fiscal 2017 acquisition of Grand Design.
Towable unit deliveries grew in Fiscal 2018 as compared to Fiscal 2017 primarily due to Towable growth in excess of recent industry trends and due to the acquisition of Grand Design. With the addition of Grand Design in the first quarter of Fiscal 2017, our Towable market share increased to 7.4% from 5.2% when comparing shipments during the twelve-month trailing periods ended August 2018 and August 2017.
Towable Adjusted EBITDA increased in Fiscal 2018 as compared to Fiscal 2017 due to the favorable impact of organic growth as well as the annualization of net revenues related to the Fiscal 2017 acquisition of Grand Design. We achieved strong results in our Towable segment, where shipments grew much faster than the industry as a result of greater penetration of our new products and further expansion of our distribution base, as well as higher gross profit from cost savings initiatives and pricing, which more than offset escalating cost inputs.
Fiscal 2017 Compared to Fiscal 2016
MotorizedThe following is an analysis of changes in key items included in the statements of operations for the fiscal year ended August 26, 2017 compared to the fiscal year ended August 27, 2016: |
| | | | | | | | | | | | | | | |
| | Year Ended |
| (In thousands, except percent and per share data) | August 26,
2017 | % of Revenues(1) | August 27,
2016 | % of Revenues(1) | Increase (Decrease) | % Change |
| Net revenues | $ | 1,547,119 |
| 100.0 | % | $ | 975,226 |
| 100.0 | % | $ | 571,893 |
| 58.6 | % |
| Cost of goods sold | 1,324,542 |
| 85.6 | % | 862,577 |
| 88.4 | % | 461,965 |
| 53.6 | ��% |
| Gross profit | 222,577 |
| 14.4 | % | 112,649 |
| 11.6 | % | 109,928 |
| 97.6 | % |
| | | | | | | |
| Selling | 35,668 |
| 2.3 | % | 19,823 |
| 2.0 | % | 15,845 |
| 79.9 | % |
| General and administrative | 55,347 |
| 3.6 | % | 33,209 |
| 3.4 | % | 22,138 |
| 66.7 | % |
| Postretirement health care benefit income | (24,796 | ) | (1.6 | )% | (6,124 | ) | (0.6 | )% | 18,672 |
| 304.9 | % |
| Transaction costs | 6,592 |
| 0.4 | % | — |
| — | % | 6,592 |
| — | % |
| Amortization of intangible assets | 24,660 |
| 1.6 | % | — |
| — | % | 24,660 |
| — | % |
| Total general and administrative | 61,803 |
| 4.0 | % | 27,085 |
| 2.8 | % | 34,718 |
| 128.2 | % |
| Total SG&A | 97,471 |
| 6.3 | % | 46,908 |
| 4.8 | % | 50,563 |
| 107.8 | % |
| | | | | | | |
| Operating income | 125,106 |
| 8.1 | % | 65,741 |
| 6.7 | % | 59,365 |
| 90.3 | % |
| Interest expense | 16,837 |
| 1.1 | % | — |
| — | % | 16,837 |
| 100.0 | % |
| Non-operating income | (330 | ) | — | % | (457 | ) | — | % | (127 | ) | (27.8 | )% |
| Income before income taxes | 108,599 |
| 7.0 | % | 66,198 |
| 6.8 | % | 42,401 |
| 64.1 | % |
| Provision for taxes | 37,269 |
| 2.4 | % | 20,702 |
| 2.1 | % | 16,567 |
| 80.0 | % |
| Net income | $ | 71,330 |
| 4.6 | % | $ | 45,496 |
| 4.7 | % | $ | 25,834 |
| 56.8 | % |
| | | | | | | |
| Diluted income per share | $ | 2.32 |
| | $ | 1.68 |
| | $ | 0.64 |
| 38.0 | % |
| Diluted average shares outstanding | 30,766 |
| | 27,033 |
| | 3,733 |
| 13.8 | % |
| |
| (1) | Percentages may not add due to rounding differences. |
Consolidated net revenues increased in Fiscal 2017 over Fiscal 2016 primarily due to the acquisition of Grand Design, which added revenues of $559.7 million in Fiscal 2017. Winnebago-branded towables products increased $36.1 million in Fiscal 2017. Growth in Towable revenues was partially offset by a $28.0 million decrease in Motorhome revenues caused mainly by the consumer trend towards smaller RVs with a lower ASP. In addition, we exited the aluminum extrusion operation in Fiscal 2016, which caused a reduction of $6.1 million in Fiscal 2017 net revenue.
Cost of goods sold was 85.6% of net revenues for Fiscal 2017 compared to 88.4% of net revenues for Fiscal 2016 due to the following:
Total variable costs (materials, direct labor, variable overhead, delivery expense, and warranty), as a percent of net revenues, decreased $23.9to 81.2% from 83.2% primarily due to a higher proportion of Towable revenue as the Towable segment operates at a higher gross profit rate. Also, improvement in Towable segment material efficiency and purchasing synergies reduced costs as a percent of net revenue. Finally, improvement in the Towable segment margin was partially offset by margin pressure in the Motorhome segment due in part to the ramp up of the Junction City, Oregon production facility.
Fixed overhead (manufacturing support labor, depreciation, and facility costs) and engineering-related costs were lower at 4.5% of net revenues compared to 5.2% in the prior year due mainly to a higher proportion of Towable revenue that operates at a lower fixed cost per unit.
All factors considered, gross profit increased from 11.6% to 14.4% of net revenues.
Selling expenses were 2.3% and 2.0% of net revenues in Fiscal 2017 and Fiscal 2016, respectively. Selling expenses are largely variable and remained proportional to revenues in Fiscal 2017.
General and administrative expenses were 4.0% and 2.8% of net revenues in Fiscal 2017 and Fiscal 2016, respectively. General and administrative expenses increased in Fiscal 2017 due to the addition of $13.9 million or 2.7%of general and administrative expenses related to the acquired Grand Design operation, an increase of $6.6 million in transaction related expenses, and the addition of $24.7 million in intangible amortization. In addition, Fiscal 2016 results of operations were impacted by $3.4 million in favorable
legal settlements. These increases were partially offset in Fiscal 2017 by the increased benefit of $18.7 million associated with the termination of the postretirement health care plan and reduced ERP implementation expenses.
Non-operating income decreased $0.1 million, in Fiscal 2017, primarily due to lower proceeds from company-owned life insurance ("COLI") policies than we received in Fiscal 2016.
The effective tax rate for Fiscal 2017 was 34.3% compared to 31.3% in Fiscal 2016. The increase in the effective tax rate is primarily due to the increased income attributable to the Grand Design acquisition without a proportionate increase in tax credits and other favorable permanent items that provide a benefit to the tax rate.
Net income and diluted income per share were $71.3 million and $2.32 per share, respectively, for Fiscal 2017. In Fiscal 2016, net income was $45.5 million and diluted income per share was $1.68.
Non-GAAP Reconciliation
The following table reconciles net income to consolidated Adjusted EBITDA for Fiscal 2017 and Fiscal 2016
|
| | | | | | | |
| | Year Ended |
| (In thousands) | August 26, 2017 | | August 27, 2016 |
| Net income | $ | 71,330 |
| | $ | 45,496 |
|
| Interest expense | 16,837 |
| | — |
|
| Provision for income taxes | 37,269 |
| | 20,702 |
|
| Depreciation | 7,315 |
| | 5,745 |
|
| Amortization | 24,660 |
| | — |
|
| EBITDA | 157,411 |
| | 71,943 |
|
| Postretirement health care benefit income | (24,796 | ) | | (6,124 | ) |
| Legal settlement | — |
| | (3,400 | ) |
| Transaction costs | 6,592 |
| | 355 |
|
| Non-operating income | (330 | ) | | (457 | ) |
| Adjusted EBITDA | $ | 138,877 |
| | $ | 62,317 |
|
Segment Results of Operations
The following is an analysis of key changes in our Motorhome segment for Fiscal 2017 compared to Fiscal 2016.
|
| | | | | | | | | | | | | | | | | | |
| Motorhome | Year Ended | | |
| | August 26,
2017 | % of Revenue | | August 27,
2016 | % of Revenue | | Decrease | % Change |
| Net revenues | $ | 853,360 |
| | | $ | 881,363 |
| | | $ | (28,003 | ) | (3.2 | )% |
| Adjusted EBITDA | 56,518 |
| 6.6 | % | | 66,127 |
| 7.5 | % | | (9,609 | ) | (14.5 | )% |
| | | | | | | | | |
| Unit deliveries | August 26,
2017 | Product Mix % (1) | | August 27,
2016 | Product Mix % (1) | | Increase (Decrease) | % Change |
| Class A | 3,182 |
| 34.4 | % | | 2,925 |
| 31.4 | % | | 257 |
| 8.8 | % |
| Class B | 1,541 |
| 16.6 | % | | 1,239 |
| 13.3 | % | | 302 |
| 24.4 | % |
| Class C | 4,537 |
| 49.0 | % | | 5,143 |
| 55.3 | % | | (606 | ) | (11.8 | )% |
| Total Motorhome | 9,260 |
| 100.0 | % | | 9,307 |
| 100.0 | % | | (47 | ) | (0.5 | )% |
| | | | | | | | | |
| Motorhome ASP | $ | 91,759 |
| | | $ | 93,116 |
| | | $ | (1,357 | ) | (1.5 | )% |
| | | | | As Of | | |
Backlog (2) | | | | August 26,
2017 | August 27,
2016 | | Increase (Decrease) | % Change |
| Units | | | | 1,293 |
| 1,139 |
| | 154 |
| 13.5 | % |
| Dollars | | | | $ | 122,142 |
| $ | 107,621 |
| | $ | 14,521 |
| 13.5 | % |
| | | | | | | | | |
| Dealer Inventory | | | | | | | | |
| Units | | | | 4,282 |
| 4,345 |
| | (63 | ) | (1.4 | )% |
| |
| (1) | Percentages may not add due to rounding differences. |
| |
| (2) | We include in our backlog all accepted orders from dealers to generally be shipped within the next six months. Orders in backlog can be cancelled or postponed at the option of the dealer at any time without penalty and, therefore, backlog may not necessarily be an accurate measure of future sales. |
Motorhome net revenues decreased 3.2% in Fiscal 2017 as compared to Fiscal 2016. This was primarily due to a decline in Class C sales, a lower ASP on the mix of units sold, and the $6.1 million reduction in sales to aluminum extrusion customers as we have ceased those operations.
MotorizedMotorhome unit deliveries decreased by 0.5% in Fiscal 2017, most notably in our Class C products. The unit growth we have generated has been in our Class A and Class B products. The shift in product mix has been towards Class B products, which have a lower ASP. Though total MotorizedMotorhome unit deliveries were down for the year,Fiscal 2017, we have seensaw an increase in the backlog volumes by 13.5% inas of August 26, 2017 versus the fourth quarter of Fiscal 2017.prior period.
MotorizedMotorhome segment Adjusted EBITDA decreased $13.4 million or 23.4%. This reduction was due to lower revenues as described above, lower pricing, and additional costs associated with the investment in and shift of production to our Junction City, Oregon production facility. Higher personnel expenses were partially offset by a decrease in ERP expenses.
The following is an analysis of key changes in our Towable segment for Fiscal 2017 compared to Fiscal 2016.2016.
| | | Towable | | Year Ended | | | Year Ended | | |
| | | Aug 26,
2017 | % of Revenue | | Aug 27,
2016 | % of Revenue | | Increase | % Change | August 26,
2017 | % of Revenue | | August 27,
2016 | % of Revenue | | Increase | % Change |
| Net revenues | | $ | 685,197 |
| | | $ | 89,412 |
| | | $ | 595,785 |
| 666.3 | % | $ | 685,197 |
| | | $ | 89,412 |
| | | $ | 595,785 |
| 666.3 | % |
| Adjusted EBITDA | | 94,929 |
| 13.9 | % | | 4,952 |
| 5.5 | % | | 89,977 |
| 1,817.0 | % | 89,734 |
| 13.1 | % | | 1,721 |
| 1.9 | % | | 88,013 |
| 5,114.1 | % |
| | | | | | | | | | | | | | | | |
| Unit deliveries | | Aug 26,
2017 | Product Mix % (1) | | Aug 27,
2016 | Product Mix % (1) | | Increase | % Change | August 26,
2017 | Product Mix % (1) | | August 27,
2016 | Product Mix % (1) | | Increase | % Change |
| Travel trailer | | 13,650 |
| 60.7 | % | | 3,613 |
| 86.0 | % | | 10,037 |
| 277.8 | % | 13,650 |
| 60.7 | % | | 3,613 |
| 86.0 | % | | 10,037 |
| 277.8 | % |
| Fifth wheel | | 8,824 |
| 39.3 | % | | 586 |
| 14.0 | % | | 8,238 |
| 1,405.8 | % | 8,824 |
| 39.3 | % | | 586 |
| 14.0 | % | | 8,238 |
| 1,405.8 | % |
| Total Towables | | 22,474 |
| 100.0 | % | | 4,199 |
| 100.0 | % | | 18,275 |
| 435.2 | % | |
| Total Towable | | 22,474 |
| 100.0 | % | | 4,199 |
| 100.0 | % | | 18,275 |
| 435.2 | % |
| | | | | | | | | | | | | | | | |
| Towables ASP | | 30,571 |
| | | 21,321 |
| | | 9,250 |
| 43.4 | % | |
| Towable ASP | | 30,571 |
| | | 21,322 |
| | | 9,249 |
| 43.4 | % |
| | | | | | | | | | | | | | | | |
| | | | | | As Of | | | | | | As Of | | |
Backlog (2) | | | | | Aug 26,
2017 | Aug 27,
2016 | | Increase | % Change | | | | August 26,
2017 | August 27,
2016 | | Increase | % Change |
| Units | | | | | 8,001 |
| 492 |
| | 7,509 |
| 1,526.2 | % | | | | 8,001 |
| 492 |
| | 7,509 |
| 1,526.2 | % |
| Dollars | | | | | $ | 229,706 |
| $ | 8,420 |
| | $ | 221,286 |
| 2,628.1 | % | | | | $ | 229,706 |
| $ | 8,420 |
| | $ | 221,286 |
| 2,628.1 | % |
| | | | | | | | | | | | | | | | |
| Dealer Inventory | | | | | | | | | | | | | | | |
| Units | | | | | 9,545 |
| 2,156 |
| | 7,389 |
| 342.7 | % | | | | 9,545 |
| 2,156 |
| | 7,389 |
| 342.7 | % |
(1) Percentages may not add due to rounding differences.
(2) We include in our backlog all accepted orders from dealers to be shipped within the next six months. Orders in backlog can be cancelled or postponed at the option of the dealer at any time without penalty and, therefore, backlog may not necessarily be an accurate measure of future sales.
| |
| (1) | Percentages may not add due to rounding differences. |
| |
| (2) | We include in our backlog all accepted orders from dealers to generally be shipped within the next six months. Orders in backlog can be cancelled or postponed at the option of the dealer at any time without penalty and, therefore, backlog may not necessarily be an accurate measure of future sales. |
Towable net revenues increased $595.8 million or 666.3% in Fiscal 2017 as compared to Fiscal 2016. This was primarily due to the acquisition of Grand Design, which added revenues of $559.7 million in Fiscal 2017. In addition, Winnebago-branded towable revenues rose $36.1 million or 40.4% in Fiscal 2017.
Towable unit deliveries grew by 435.2% in Fiscal 2017 primarily due to the acquisition of Grand Design and also due to TowablesTowable segment growth in excess of recent industry trends. With the addition of Grand Design in November 2016, our towables market share increased from 1.1% to 5.1% when comparing shipments during the twelve month trailing periods ended August 2016 and August 2017. The addition of Grand Design has also resulted in a higher ASP due to a greater proportion of higher-priced fifth wheel units sold in Fiscal 2017 compared to Fiscal 2016. Other strongStrong increases in backlog and the dealer inventory turn ratio have been influenced byin Fiscal 2017 resulted primarily from the acquisition of Grand Design.
Towable segment Adjusted EBITDA excludes the costs associated with the acquisition and as such increased $90.0$88.0 million. This increase illustrates the favorable impact of Grand Design and the organic growth of Winnebago-branded towables. We achieved strong results in our TowablesTowable segment, where shipments grew much faster than the industry as a result of greater penetration of our new products and further expansion of our distribution base and higher gross profit on new products. In addition to the growth in Towables,our Towable segment, profitability has increased due to material efficiencies and the leverage of higher volume on the fixed cost components of our business.
Fiscal 2016 Compared to Fiscal 2015
The following is an analysis of changes in key items included in the statements of operations for the fiscal year ended August 27, 2016 compared to the fiscal year ended August 29, 2015: |
| | | | | | | | | | | | | | | |
| | Year Ended |
| (In thousands, except percent and per share data) | August 27,
2016 | % of Revenues(1) | August 29,
2015 | % of Revenues(1) | (Decrease) Increase | % Change |
| Net revenues | $ | 975,226 |
| 100.0 | % | $ | 976,505 |
| 100.0 | % | $ | (1,279 | ) | (0.1 | )% |
| Cost of goods sold | 862,577 |
| 88.4 | % | 871,625 |
| 89.3 | % | (9,048 | ) | (1.0 | )% |
| Gross profit | 112,649 |
| 11.6 | % | 104,880 |
| 10.7 | % | 7,769 |
| 7.4 | % |
| | | | | | | |
| Selling | 19,823 |
| 2.0 | % | 19,161 |
| 2.0 | % | 662 |
| 3.5 | % |
| General and administrative | 33,209 |
| 3.4 | % | 29,911 |
| 3.1 | % | 3,298 |
| 11.0 | % |
| Postretirement health care benefit income | (6,124 | ) | (0.6 | )% | (4,073 | ) | (0.4 | )% | (2,051 | ) | 50.4 | % |
| Impairment of fixed assets | — |
| — | % | 462 |
| — | % | (462 | ) | NMF |
|
| Total SG&A | 46,908 |
| 4.8 | % | 45,461 |
| 4.7 | % | 1,447 |
| 3.2 | % |
| | | | | | | |
| Operating income | 65,741 |
| 6.7 | % | 59,419 |
| 6.1 | % | 6,322 |
| 10.6 | % |
| Non-operating income | (457 | ) | — | % | (115 | ) | — | % | (342 | ) | 297.4 | % |
| Income before income taxes | 66,198 |
| 6.8 | % | 59,534 |
| 6.1 | % | 6,664 |
| 11.2 | % |
| Provision for taxes | 20,702 |
| 2.1 | % | 18,324 |
| 1.9 | % | 2,378 |
| 13.0 | % |
| Net income | $ | 45,496 |
| 4.7 | % | $ | 41,210 |
| 4.2 | % | $ | 4,286 |
| 10.4 | % |
| | | | | | | |
| Diluted income per share | $ | 1.68 |
| | $ | 1.52 |
| | $ | 0.16 |
| 10.5 | % |
| Diluted average shares outstanding | 27,033 |
| | 27,051 |
| | (18 | ) | (0.1 | )% |
| |
(1)
| Percentages may not add due to rounding differences. |
Consolidated net revenues decreased $1.3 million or 0.1% in Fiscal 2016 over Fiscal 2015. Other manufactured products decreased by $21.1 million primarily due to our exit of the aluminum extrusion and bus operations. This was partially offset by an increase of motorhome net revenues of $2.1 million and an increase in Towable revenues of $17.7 million due to increases in unit deliveries.
Cost of goods sold was $862.6 million, or 88.4% of net revenues for Fiscal 2016 compared to $871.6 million, or 89.3% of net revenues for Fiscal 2015 due to the following:
Total variable costs (materials, direct labor, variable overhead, delivery expense and warranty), as a percent of net revenues, decreased to 83.2% from 84.0% primarily due to improved material sourcing, product shift to a more favorable mix, and cessation of bus and virtually all aluminum extrusion operations which were less profitable than the remainder of our RV products.
Fixed overhead (manufacturing support labor, depreciation and facility costs) and engineering-related costs were comparable at 5.2% of net revenues compared to 5.2% in the prior year.
All factors considered, gross profit increased from 10.7% to 11.6% of net revenues.
Selling expenses were 2.0% of net revenues in both Fiscal 2016 and Fiscal 2015, respectively. Selling expenses are largely variable and remained proportional to revenues in Fiscal 2016.
General and administrative expenses were 2.8% and 2.6% of net revenues in Fiscal 2016 and Fiscal 2015, respectively. General and administrative expenses increased $1.2 million, or 4.8%, in Fiscal 2016. This increase was due primarily to an increase in ERP related expenses of $3.4 million, bonuses earned of $2.8 million, $0.7 million in compensation, benefits and recruiting costs, and $0.3 million in transaction related costs pertaining to the acquisition of Grand Design. These increases were partially offset by favorable legal settlements of $3.4 million in Fiscal 2016, a reduction in professional fees of $1.6 million incurred in Fiscal 2015 related to the strategic sourcing program, and a reduction of $1.0 million in costs associated with the former CEO retirement agreement in Fiscal 2015.
During Fiscal 2015, we recorded an asset impairment on our corporate plane of $0.5 million.
Non-operating income increased $0.3 million, in Fiscal 2016, primarily due to higher proceeds from COLI policies than we received in Fiscal 2015.
The effective tax rate for Fiscal 2016 was 31.3% compared to 30.8% in Fiscal 2015. The increase in the effective tax rate is due to a reduction in the amount of the Domestic Production Activities Deduction applicable in Fiscal 2016 as compared to Fiscal 2015. The reduction in this deduction was partially offset by other tax credits. See Note 12.
Net income and diluted income per share were $45.5 million and $1.68 per share, respectively, for Fiscal 2016. In Fiscal 2015, net income was $41.2 million and diluted income per share was $1.52.
Non-GAAP Reconciliation
We have provided the following non-GAAP financial measures, which are not calculated or presented in accordance with GAAP, as information supplemental and in addition to the financial measures presented in accordance with GAAP. Such non-GAAP financial measures should not be considered superior to, as a substitute for, or as an alternative to, and should be considered in conjunction with, the GAAP financial measures presented herein. The non-GAAP financial measures presented below may differ from similar measures used by other companies.
The following table reconciles net income to consolidated Adjusted EBITDA for Fiscal 2016 and Fiscal 2015
|
| | | | | | | | |
| | | Year Ended |
| (In thousands) | | August 27,
2016 | | August 29,
2015 |
| Net income | | $ | 45,496 |
| | $ | 41,210 |
|
| Interest expense | | — |
| | 10 |
|
| Provision for income taxes | | 20,702 |
| | 18,324 |
|
| Depreciation | | 5,745 |
| | 4,513 |
|
| EBITDA | | 71,943 |
| | 64,057 |
|
| Postretirement health care benefit income | | (6,124 | ) | | (4,073 | ) |
| Legal settlement | | (3,400 | ) | | — |
|
| Transaction costs | | 355 |
| | — |
|
| Non-operating income | | (457 | ) | | (115 | ) |
| Adjusted EBITDA | | $ | 62,317 |
| | $ | 59,869 |
|
We have provided non-GAAP performance measures of EBITDA and Adjusted EBITDA as a comparable measure to illustrate items impacting current results which are not expected to impact future performance. EBITDA is defined as net income before interest expense, provision for income taxes, and depreciation and amortization expense. We believe EBITDA and Adjusted EBITDA provide meaningful supplemental information about our operating performance because each measure excludes amounts that we do not consider part of our core operating results when assessing our performance. Examples of items excluded from Adjusted EBITDA include the postretirement health care benefit resulting from plan amendments over the past several years, favorable legal settlements including our Fiscal 2016 Australia trademark settlement, and transaction costs related to our acquisition of Grand Design RV.
Management uses these non-GAAP financial measures (a) to evaluate our historical and prospective financial performance and trends as well as our performance relative to competitors and peers that publish similar measures; (b) to measure operational profitability on a consistent basis; (c) in presentations to the members of our board of directors to enable our board of directors to have the same measurement basis of operating performance as is used by management in their assessments of performance and in forecasting and budgeting for our company; and, (d) to evaluate potential acquisitions. We believe these non-GAAP financial measures are frequently used by securities analysts, investors and other interested parties to evaluate companies in our industry.
Segment Results of Operations
The following is an analysis of key changes in our Motorized segment for Fiscal 2016 compared to Fiscal 2015.
|
| | | | | | | | | | | | | | | | | | | |
| Motorized | | Year Ended | | |
| | | Aug 27,
2016 | % of Revenue | | Aug 29,
2015 | % of Revenue | | (Decrease) Increase | % Change |
| Net revenues | | $ | 885,814 |
| | | $ | 904,821 |
| | | $ | (19,007 | ) | (2.1 | )% |
| Adjusted EBITDA | | 57,365 |
| 6.5 | % | | 57,102 |
| 6.3 | % | | 263 |
| 0.5 | % |
| | | | | | | | | | |
| Unit deliveries | | Aug 27,
2016 | Product Mix % (1) | | Aug 29,
2015 | Product Mix % (1) | | (Decrease) Increase | % Change |
| Class A | | 2,925 |
| 31.4 | % | | 3,442 |
| 37.8 | % | | (517 | ) | (15.0 | )% |
| Class B | | 1,239 |
| 13.3 | % | | 991 |
| 10.9 | % | | 248 |
| 25.0 | % |
| Class C | | 5,143 |
| 55.3 | % | | 4,664 |
| 51.3 | % | | 479 |
| 10.3 | % |
| Total motorhomes | | 9,307 |
| 100.0 | % | | 9,097 |
| 100.0 | % | | 210 |
| 2.3 | % |
| | | | | | | | | | |
| Motorhome ASP | | $ | 93,116 |
| | | $ | 94,841 |
| | | $ | (1,725 | ) | (1.8 | )% |
| | | | | | As Of | | |
Backlog (2) | | | | | Aug 27,
2016 | Aug 29,
2015 | | (Decrease) Increase | % Change |
| Units | | | | | 1,139 |
| 1,754 |
| | (615 | ) | (35.1 | )% |
| Dollars | | | | | $ | 107,621 |
| $ | 156,353 |
| | $ | (48,732 | ) | (31.2 | )% |
| | | | | | | | | | |
| Dealer Inventory | | | | | | | | | |
| Units | | | | | 4,345 |
| 4,072 |
| | 273 |
| 6.7 | % |
(1) Percentages may not add due to rounding differences.
(2) We include in our backlog all accepted orders from dealers to be shipped within the next six months. Orders in backlog can be cancelled or postponed at the option of the dealer at any time without penalty and, therefore, backlog may not necessarily be an accurate measure of future sales.
Motorized net revenues decreased $19.0 million or 2.1% in Fiscal 2016 as compared to Fiscal 2015. This was attributed to a $21.1 million decrease in our other manufactured parts revenue primarily due to our exit of the aluminum extrusion and bus operations. Offsetting this reduction was modest growth in motorhome revenues primarily attributed to a 2.3% increase in unit deliveries in Fiscal 2016.
Unit growth was 25.0% for Class B and 10.3% for Class C products which was partially offset by a decline in demand for higher priced Class A products.
Total motorhome ASP decreased 1.8% in Fiscal 2016 compared to Fiscal 2015 because Fiscal 2016 saw more deliveries of lower priced Class B and C unit sales. ASPs did increase in every motorhome product category during Fiscal 2016, however, this did not offset the decline due to the lower mix of Class A products in Fiscal 2016.
Motorized segment Adjusted EBITDA increased $0.3 million or 0.5%. The increase is due to higher gross margin in Fiscal 2016 due to exit of the aluminum extrusion and bus operations. Both of these operations provided very low margins while consuming production labor in Forest City, Iowa. Labor has been redirected to higher margin motorhome production. The margin improvement was offset by an increase in general and administrative expenses of $0.7 million including several offsetting effects. Cost increases due to ERP related expenses of $3.4 million, bonuses earned of $2.6 million, $0.7 million in compensation, and benefits and recruiting costs were partially offset by a reduction in professional fees of $1.6 million related to strategic sourcing program initiated in Fiscal 2015, and a reduction of $1.0 million in costs associated with the former CEO retirement agreement in Fiscal 2015.
The following is an analysis of key changes in our Towable segment for Fiscal 2016 compared to Fiscal 2015.
|
| | | | | | | | | | | | | | | | | | | |
| Towable | | Year Ended | | |
| | | Aug 27,
2016 | % of Revenue | | Aug 29,
2015 | % of Revenue | | Increase | % Change |
| Net revenues | | $ | 89,412 |
| | | $ | 71,684 |
| | | $ | 17,728 |
| 24.7 | % |
| Adjusted EBITDA | | 4,952 |
| 5.5 | % | | 2,767 |
| 3.9 | % | | 2,185 |
| 79.0 | % |
| | | | | | | | | | |
| Unit deliveries | | Aug 27,
2016 | Product Mix % (1) | | Aug 29,
2015 | Product Mix % (1) | | Increase (Decrease) | % Change |
| Travel trailer | | 3,613 |
| 86.0 | % | | 2,182 |
| 81.7 | % | | 1,431 |
| 65.6 | % |
| Fifth wheel | | 586 |
| 14.0 | % | | 488 |
| 18.3 | % | | 98 |
| 20.1 | % |
| Total Towables | | 4,199 |
| 100.0 | % | | 2,670 |
| 100.0 | % | | 1,529 |
| 57.3 | % |
| | | | | | | | | | |
| Towables ASP | | 21,321 |
| | | 23,312 |
| | | (1,991 | ) | (8.5 | )% |
| | | | | | | | | | |
| | | | | | As Of | | |
Backlog (2) | | | | | Aug 27,
2016 | Aug 29,
2015 | | Increase | % Change |
| Units | | | | | 492 |
| 248 |
| | 244 |
| 98.4 | % |
| Dollars | | | | | $ | 8,420 |
| $ | 6,171 |
| | $ | 2,249 |
| 36.4 | % |
| | | | | | | | | | |
| Dealer Inventory | | | | | | | | | |
| Units | | | | | 2,156 |
| 1,663 |
| | 493 |
| 29.6 | % |
(1) Percentages may not add due to rounding differences.
(2) We include in our backlog all accepted orders from dealers to be shipped within the next six months. Orders in backlog can be cancelled or postponed at the option of the dealer at any time without penalty and, therefore, backlog may not necessarily be an accurate measure of future sales.
Towable net revenues increased $17.7 million or 24.7% in Fiscal 2016 compared to Fiscal 2015. This was primarily due to an increase in unit deliveries by 57.3% offset by a decrease in ASP of 8.5% due to the mix of new products.
Towable segment Adjusted EBITDA increased $2.2 million or 79.0%. This increase is due to organic revenue growth and higher gross profit on new products. This is partially offset by increases in general and administrative expenses of $0.5 million, including bonuses earned of $0.2 million.
In order to generate sales growth, we have expanded our towables distribution base and thus dealer inventory was higher throughout the year than in previous years. On a year over year basis, towables dealer inventory increased by 29.6% which is reasonable in anticipation of continued sales growth which increased 57.3% in Fiscal 2016 compared to Fiscal 2015 on a unit basis.
Analysis of Financial Condition, Liquidity, and Resources
Cash andFlows
The following table summarizes our cash equivalents decreased $49.6 million duringflows from total operations for Fiscal 2018, 2017, and totaled $35.9 million2016 as of :August 26, 2017. The significant liquidity events that occurred during
|
| | | | | | | | | | | |
| | Year Ended |
| (In thousands) | August 25, 2018 | | August 26, 2017 | | August 27, 2016 |
| Total cash provided by (used in): | | | | | |
| Operating activities | $ | 83,346 |
| | $ | 97,127 |
| | $ | 52,746 |
|
| Investing activities | (111,761 | ) | | (405,385 | ) | | (23,392 | ) |
| Financing activities | (5,188 | ) | | 258,620 |
| | (14,010 | ) |
| (Decrease) increase in cash and cash equivalents | $ | (33,603 | ) | | $ | (49,638 | ) | | $ | 15,344 |
|
Operating Activities
Cash provided by operating activities decreased in Fiscal 2018 compared to Fiscal 2017 were:due to an increase in inventory to support organic growth, partially offset by growth in net income.
GeneratedCash provided by operating activities increased in Fiscal 2017 compared to Fiscal 2016 due to net income and changes in non-cash charges (e.g., amortization of $71.3 million
debt issuance costs, depreciation, LIFO, stock-based compensation, deferred income taxes, postretirement benefits).
Capital expendituresInvesting Activities
Cash used in investing activities for Fiscal 2018 consisted primarily of $14.0 million
Dividend payments of $12.7 million
Contribution of $39.5 million in cash toward the $520.5 million acquisition of Grand Design
Established a new Credit AgreementChris-Craft and capital expenditures related to the capacity expansions taking place in conjunction withour Towable segment. In Fiscal 2017, cash used in investing activities consisted of the acquisition of Grand Design as detailed below
Repaymentfor which we paid cash of $82.4$392.5 million, net of debt
cash acquired, in addition to issuing Winnebago stock with a value of $124.1 million at closing. In Fiscal 2016, cash used in investing activities was primarily due to capital spend.
Financing Activities
Cash used in financing activities for Fiscal 2018 consisted of payments on the Credit Agreement, dividend payments, and share repurchases; these were partially offset by cash proceeds on the Credit Agreement. Cash provided by financing activities for Fiscal 2017 consisted of cash proceeds from the Credit Agreement, partially offset by payments on the Credit Agreement, payment of debt issuance costs, and dividend payments. Cash used in financing for Fiscal 2016 was primarily due to dividend payments and share repurchases.
Debt and Capital
As described in Note 9, Long-Term Debt, of the Notes to Consolidated Financial Statements, included in Item 8, Financial Statements and Supplementary Data, of this Annual Report on Form 10-K, effective December 8, 2017, our new Credit Agreement consists of a $300$300.0 million term loan agreement ("Term Loan") and a $125$125.0 million asset-based revolving credit (ABL) agreement ("ABL") (collectively, the Credit Agreement)"Credit Agreement") with JPMorgan Chase. The requirement to hedge a portion of the Term Loan floating rate interest exposure was removed from the ABL on December 8, 2017, which provided greater flexibility under the Credit Agreement. The ABL was increased to a $165.0 million revolving credit agreement as of September 21, 2018.
We filed a Registration Statement on Form S-3, which was declared effective by the SEC on April 25, 2016. Subject to market conditions, this registration provides for the ability to offer and sell up to $35.0 million of our common stock in one or more offerings pursuant to the Registration Statement. The Registration Statement will be available for use for three years from its effective date. We currently have no plans to offer and sell the common stock registered under this Registration Statement; however, it does provide another potential source of liquidity to raise capital if we need it, in addition to the alternatives already in place.
Other Financial Measures
Working capital at August 25, 2018 and August 26, 2017 was $167.8 million and August 27, 2016 was $147.0$147.0 million, and $187.6 million, respectively, a decrease of $40.6 million. respectively. We currently expect cash on hand, funds generated from operations, and the borrowing available under our Credit
Agreement to be sufficient to cover both short-term and long-term operating requirements.
Capital Expenditures
We anticipate capital expenditures in Fiscal 20182019 of approximately $35.0 - $40.0 million to $50.0 million. We will continue to invest in our current motorhome facilities and our ERP system as well as expand our Towabletowable and marine facilities and make improvements to our motorhome facilities.
Share Repurchases and Dividends
We repurchase our common stock and pay dividends pursuant to programs approved by our Board of Directors. Our long-term capital allocation strategy is to first fund operations and investments in growth, maintain a debt leverage ratio within our targeted zone, maintain reasonable liquidity, and then return excess cash over time to shareholders through dividends and share repurchases.
On December 19, 2007, our Board of Directors authorized the repurchase of outstanding shares of our common stock, depending on market conditions, for an aggregate consideration of up to $60.0 million. On October 18, 2017, the Board of Directors approved a quarterly cash dividend of $0.10 per share of common stock, payable on November 29, 2017 to shareholders of record at the close of business on November 15, 2017. We expect this cash outflow to be approximately $3.2 million.
Operating Activities
Cash provided by operating activities was $97.1 million for the fiscal year ended August 26, 2017 compared to $52.7 million for the fiscal year ended August 27, 2016, and $45.2 million for the fiscal year ended August 29, 2015. The combination of net income of $71.3 million in Fiscal 2017 and changes in non-cash charges (e.g., amortization of debt issuance costs, depreciation, LIFO, stock-based compensation, deferred income taxes, postretirement benefits) provided $93.3 million of operating cash compared to $52.7 million in Fiscal 2016 and $49.0 million in Fiscal 2015. In Fiscal 2017 and Fiscal 2016, changes in assets and liabilities provided $3.8 million and $0.1 million, respectively, and used $3.8 million of operating cash in Fiscal 2015.
Investing Activities
Cash used in investing activities of $405.4 million in Fiscal 2017 was due primarily to the acquisition of Grand Design for which we paid cash of $392.5 million, net of cash acquired, in addition to issuing Winnebago stock with a value of $124.1 million at closing. Capital expenditures were due primarily to spending on property and equipment of $14.0 million. In Fiscal 2016, cash used in investing activities of $23.4 million was primarily due to capital spending of $24.6 million. In Fiscal 2015, cash used in investing activities of $16.5 million was primarily due to capital spending of $16.6 million.
Financing Activities
Cash provided by financing activities of $258.6 million in Fiscal 2017 was primarily due to cash proceeds from the new Credit Agreement of $366.4 million, partially offset by payments on the new Credit Agreement of $82.4 million, $12.7 million for the payment of dividends, and $11.0 million for the payment of debt issuance costs. The repayments on the new Credit Agreement included the full repayment of amounts borrowed under the ABL to finance the acquisition of Grand Design in the first quarter. Cash used in financing for the fiscal year ended August 27, 2016 was primarily due to $10.9 million for the payments of dividends and $3.1 million in repurchases of our stock. Cash used in financing for the fiscal year ended August 29, 2015 was $16.2 million primarily due to the payments of dividends and repurchases of our stock. In addition, in Fiscal 2015 we borrowed and repaid $22.0 million on our line of credit.
Share Repurchase Authorization
On October 18, 2017, the Company's Board of Directors authorized a share repurchase program in the amount of $70$70.0 million. There is no time restriction on either authorization. During Fiscal 2018, we repurchased 134,803 shares of our common stock at a cost of $5.0 million. An additional 33,560 shares of our common stock at a cost of $1.5 million which is approximately 5%were repurchased to satisfy tax obligations on employee equity awards as they vested. We continually evaluate if share repurchases reflect a prudent use of our capital and, subject to compliance with our Credit Agreement, we may purchase shares in the Company's market capitalization asfuture. At August 25, 2018, we have $66.0 million remaining on our board repurchase authorization.
On August 15, 2018, our Board of October 18, 2017.Directors declared a quarterly cash dividend of $0.10 per share, totaling $3.2 million, paid on September 26, 2018 to common stockholders of record at the close of business on September 12, 2018.
Contractual Obligations and Commercial Commitments
Our principal contractual obligations and commercial commitments as of August 26, 201725, 2018 were as follows:
|
| | | | | | | | | | | | | | | |
| | Payments Due By Period |
| (In thousands) | Total | Fiscal 2018 | Fiscal 2019-2020 | Fiscal 2021-2022 | More than 5 Years |
Revolving credit agreement (1) | $ | — |
| $ | — |
| $ | — |
| $ | — |
| $ | — |
|
Term debt (2) | 284,000 |
| 4,250 |
| 30,000 |
| 30,000 |
| 219,750 |
|
Interest at variable rate (3) | 88,181 |
| 16,678 |
| 30,734 |
| 26,921 |
| 13,848 |
|
Net swap payments (4) | 3,981 |
| 1,208 |
| 2,415 |
| 358 |
| — |
|
Deferred compensation obligations (5) | 16,923 |
| 2,794 |
| 5,160 |
| 4,819 |
| 4,150 |
|
Executive share option obligations (5) | 1,498 |
| 200 |
| 1,298 |
| — |
| — |
|
Supplemental executive retirement plan benefit obligations (5) | 2,534 |
| 287 |
| 572 |
| 547 |
| 1,128 |
|
Operating leases (6) | 19,042 |
| 2,540 |
| 4,779 |
| 4,921 |
| 6,802 |
|
| Contracted services | 2,022 |
| 1,286 |
| 736 |
| — |
| — |
|
Unrecognized tax benefits (7) | 1,606 |
| — |
| — |
| — |
| — |
|
| Total contractual cash obligations | $ | 419,787 |
| $ | 29,243 |
| $ | 75,694 |
| $ | 67,566 |
| $ | 245,678 |
|
|
| | | | | | | | | | | | | | | |
| | Payments Due By Period |
| (In thousands) | Total | Fiscal 2019 | Fiscal 2020-2021 | Fiscal 2022-2023 | More than 5 Years |
ABL(1)(7) | $ | 38,532 |
| $ | — |
| $ | — |
| $ | — |
| $ | — |
|
Term loan(2) | 260,000 |
| — |
| 25,250 |
| 234,750 |
| — |
|
Interest at variable rate(3) | 72,313 |
| 10,016 |
| 20,032 |
| 20,032 |
| 22,233 |
|
Net swap payments(4) | 8,266 |
| 2,068 |
| 3,707 |
| 2,344 |
| 147 |
|
Deferred compensation obligations(5) | 18,496 |
| 3,214 |
| 6,092 |
| 4,862 |
| 4,328 |
|
Operating leases(6) | 16,463 |
| 2,700 |
| 4,794 |
| 4,928 |
| 4,041 |
|
| Contracted services | 5,574 |
| 2,846 |
| 2,433 |
| 295 |
| — |
|
Unrecognized tax benefits(7) | 1,745 |
| — |
| — |
| — |
| — |
|
| Total contractual cash obligations | $ | 421,389 |
| $ | 20,844 |
| $ | 62,308 |
| $ | 267,211 |
| $ | 30,749 |
|
| | | | Expiration By Period | Expiration By Period |
| (In thousands) | Total | Fiscal 2018 | Fiscal 2019-2020 | Fiscal 2021-2022 | More than 5 Years | Total | Fiscal 2019 | Fiscal 2020-2021 | Fiscal 2022-2023 | More than 5 Years |
Contingent repurchase obligations (6) | $ | 713,132 |
| $ | 69,579 |
| $ | 643,553 |
| $ | — |
| $ | — |
| $ | 878,989 |
| $ | 815,704 |
| $ | 63,285 |
| $ | — |
| $ | — |
|
| |
(1) | As of August 26, 2017,25, 2018, we did not have anyhad $38.5 million in borrowings under our $125.0 million revolving Credit Agreement other than a $210,000 outstanding letter of credit.ABL. Borrowings and repayments are expected to fluctuate over the term. |
| |
(2) | As of August 26, 2017,25, 2018, we had $284.0$260.0 million outstanding under our Term Loan agreement that matures on November 8, 2023. The contractual principal payments are included in the previous table. Additional principal payments are potentially due annually on a formula based on excess cash flow and the leverage ratio at that time as defined in the Credit Agreement. No amounts for this contingency are included in the above table. |
| |
(3) | All of the debt under theThe Term Loan is at a variable rate and the interest in the table assumes the variable rate of 5.7%5.8% at August 26, 201725, 2018 is constant through the maturity dates of the debt and the principal payments on the term debt are made as scheduled. The variable rate is subject to change. For example, a 1.0% change in Term Loan rates for Fiscal 2018, would change the interest expense by $2.8$2.5 million. Additionally, included in interest payments due by period is a 0.4%0.25% - 0.375% commitment fee on the ABL for unused borrowings, which are assumed to be at $125.0 million. In addition to interest assumed to be paid, non-cash amortization of debt issuance costs will also be recorded within interest expense on the Consolidated Statements of Income and Comprehensive Income in future periods. |
| |
(4) | We have an interest rate swap agreement with a notional amount of $200.0$170.0 million as of August 26, 201725, 2018 that decreases to $170.0$120.0 million on December 8, 2017,2018, to $120.0 million in December 10, 2018, and $60.0 million on December 9,8, 2019, and expires on December 8, 2020. We pay a fixed rate at 1.82%, and receive a floating rate that was 1.2%2.3% at August 26, 2017.25, 2018. In the previous table, we have assumed the floating rate will be constant through the expiration of the interest rate swap when calculating the net swap payments. The variable rate is subject to change. For example, a 1.0% increase in the floating rate for Fiscal 2018 would decrease the payments noted in footnote 3 by $2.1 million. |
| |
| (5) | See Note 10, (3) Employee and Retiree Benefitsby $2.0 million., of the Notes to Consolidated Financial Statements, included in Item 8, Financial Statements and Supplementary Data, of this Annual Report on Form 10-K. |
| |
| (6) | (5)
| See Note 9.11, Contingent Liabilities and Commitments, of the Notes to Consolidated Financial Statements, included in Item 8, Financial Statements and Supplementary Data, of this Annual Report on Form 10-K. |
| |
(7) | We are not able to reasonably estimate in which future periods these amounts will ultimately be settled. |
Critical Accounting PoliciesEstimates
Our consolidated financial statements are prepared in accordance with GAAP. In connection with the preparation of our financial statements, we are required to make assumptions and estimates about future events and apply judgments that affect the reported amounts of assets, liabilities, revenue, expenses, and the related disclosures. We base our assumptions, estimates, and judgments on historical experience, current trends, and other factors that we believebelieved to be relevant at the time our consolidated financial statements are prepared. On a regular basis, we review the accounting policies, assumptions, estimates and judgments to ensure that our financial statements are presented fairly and in accordance with GAAP. However, becauseBecause future events and their effects cannot be determined with certainty, actual results could differ from our assumptions and estimates, and such differences could be material.
Our significant accounting policies are discussed in Note 1,.Summary of Significant Accounting Policies, of the Notes to Consolidated Financial Statements, included in Item 8, Financial Statements and Supplementary Data, of this Annual Report on Form 10-K. We believe that the following accounting estimates and policies are the most critical to aid in fully understanding and evaluating our reported financial results and theyresults. These estimates require our most difficult, subjective, or complex judgments resulting from the needbecause they relate to make estimates about the effect of matters that are inherently uncertain. We have reviewed these critical accounting estimates and related disclosures with the Audit Committee of our Board of Directors.
Accounting for Business Combinations
We account for business combinations underhave not made any material changes during the acquisition methodpast three fiscal years, nor do we believe there is a reasonable likelihood of accounting. This method requires the recording of acquired assets, including separately identifiable intangible assets, and assumed liabilities at their acquisition date fair values. The excess of the purchase price over the fair value of assets acquired and liabilities assumed is recorded as goodwill. Determining the fair value of assets acquired and liabilities assumed requires management’s judgment and often involves the use of significant estimates and assumptions, including assumptions with respect toa material future cash inflows and outflows, discount rates, royalty rates and asset lives, among other items.
We used the income approach to value certain intangible assets. Under the income approach, an intangible asset’s fair value is equalchange to the present value of future economic benefits to be derived from ownership ofaccounting methodologies for the asset. We used the income approach known as the relief from royalty method to value the fair value of the trade name. The relief from royalty method is based on the hypothetical royalty stream that would be received if we were to license the trade name and was based on expected revenues. The fair value of the dealer network was estimated using an income approach known as the cost to recreate/cost savings method. This method uses the replacement of the asset as an indicator of the fair value of the asset. The determination of the fair value of other assets acquired and liabilities assumed involves assessing factors such as the expected future cash flows associated with individual assets and liabilities and appropriate discount rates at the date of the acquisition.
See Note 2 to the consolidated financial statements for further information.areas described below.
Goodwill and Indefinite-lived Intangible Assets
We test goodwill and identifiableindefinite-lived intangible assets with indefinite lives(trade names) for impairment at least annually in the fourth quarter. Impairment testing for goodwill is done atquarter and more frequently if events or circumstances occur that would indicate a reporting unit level and all goodwill is assigned to a reporting unit.reduction in fair value. Our reporting units are the same as our operating segments and one level below the reporting segment level.
We test goodwill forof impairment begins by either performing a qualitative evaluation or a quantitative test, whereby a goodwill impairment loss will be measured as the excess of a reporting unit's carrying amount over its fair value. The qualitativetest:
Qualitative evaluation is an assessment of factors, including reporting unit specific operating results and cost factors, as well as industry, market and general economic conditions,- Performed to determine whether it is more likely than not that the carrying value of goodwill or the trade name exceeds the fair value of a reporting unit is less than its carrying amount, including goodwill. We may elect to bypass thisthe asset. During our qualitative assessment, we make significant estimates, assumptions, and judgments, including, but not limited to, the macroeconomic conditions, industry and market conditions, cost factors, overall financial performance of the Company and the reporting units, changes in our share price, and relevant company-specific events. If we determine that it is more likely than not that the carrying value of goodwill exceeds the fair value of goodwill, we perform the quantitative test in accordance with ASC 350, Intangiblesto determine the amount of the impairment.
Quantitative test - GoodwillUsed to calculate the fair value of goodwill or the trade name. If the carrying value of goodwill or the trade name exceeds the fair value of the asset, the impairment is calculated as the difference between the carrying value and Other. Fair values under the quantitative test are estimated using a combination of discounted projected future earnings or cash flow methods and multiples of earnings in estimating fair value. The estimateOur goodwill fair value model uses a blend of the reporting unit’s fair value is determined by weighting a discountedincome (discounted future cash flow modelflow) and a market-related model using current industry information that involvemarket (guideline public company) approaches, which includes the use of significant unobservable inputs (Level 3 inputs). In determiningOur trade name fair value model uses the estimated future cash flow,income (relief-from-royalty) approach, which includes the use of significant unobservable inputs (Level 3 inputs). During these valuations, we consider and apply certainmake significant estimates, assumptions, and judgments, including, current and projected future levels of income based on management’s plans, business trends, prospects and market and economic conditions, and market-participant considerations. These assumptions require significant judgment and actual
Actual results may differ from assumed and estimated amounts. If we fail the quantitative assessment of goodwill impairment ("quantitative assessment"), pursuant to our adoption of FASB ASU No. 2017–04 in fiscal 2017, we would be required to recognize an impairment loss equal to the amount that a reporting unit's carrying value exceeded its fair value. Substantially all of the goodwill resulting from the Grand Design acquisition on November 8, 2016 is in the Towable products and services segment and reporting unit.
As of August 26, 2017, we had an25, 2018, our goodwill balance includes $244.7 million within our Towable segment and $29.7 million within our Corporate / All Other category, and our indefinite-lived intangible asset for trade name of $148.0 million from the Grand Design acquisition. Annuallybalance is $177.3 million. The qualitative test was not performed in the fourth quarter, or if conditions indicate an interim review is necessary, we assess qualitative factors to determine if it is more likely than not that the fair value of an indefinite-lived intangible asset is less than its carrying amount. If we perform a quantitative test, projections regarding estimated discounted future cash flows and other factors are made to determine if impairment has occurred. These assumptions require significant judgment and actual results may differ from assumed and estimated amounts. If we conclude that there has been impairment, we will write down the carrying value of the asset to its fair value.
During the fourth quarter of current year. No impairments were recorded in Fiscal 2017, we completed our annual impairment tests. We elected not to rely on the qualitative assessment as of the testing date and rather performed the quantitative analysis. We elected to perform this analysis because Grand Design was acquired during Fiscal2018, 2017, and the analysis resulted in setting foundational assumptions to be used to evaluate goodwill and the indefinite-lived trade name asset in the future. The result of the test was that the fair value far exceeded the carrying value of the reporting unit and no impairment was present.2016.
Long-Lived Assets
Long-lived assets, which include property, plant, and equipment, and definite-lived intangible assets, primarily the dealer network, are assessed for impairment whenever events or changes in circumstances indicate the carrying amount of the asset may not be recoverable. The impairment testing involves comparing the carrying amount of the asset to the forecastedfair value of the asset as determined by calculating the undiscounted future cash flows generated by thatthe asset. TheseDuring these valuations, we make significant estimates, assumptions, require significant judgment and actual results may differ from assumedjudgments, including current and estimated amounts.projected future levels of income based on management’s plans, business trends, and market and economic conditions. In the event the carrying amount of the asset exceeds the undiscounted future cash flows generated by that assetfair value and the carrying amount is not considered recoverable, an impairment exists. An impairment loss is measured as the excess of the asset’s carrying amount over its fair value and is recognized invalue. In addition, the statement of income in the period that the impairment occurs. The dealer network is amortized over its estimated useful life of 12 years. The reasonableness of the useful lives of this asset and other long-livedthese assets is regularly evaluated. No impairments were recorded in Fiscal 2018, 2017, and 2016.
Revenue Recognition
Generally, revenues for our RVs are recorded and title passes when the following conditions are met:
an order for a product has been received from a dealer
written or verbal approval for payment has been received from the dealer's floorplan financing institution (if applicable)
an independent transportation company has accepted responsibility for the product as agent for the dealer; and
the product is removed from the Company's property for delivery to the dealer by the agent.
Our shipping terms are FOB shipping point. Products are not sold on consignment, dealers do not have the right to return products, and dealers are typically responsible for interest costs to floor plan lenders.
Repurchase Commitments
It is customary practice for manufacturers in the RV industryour industries to enter into repurchase agreements with financing institutions that provide financing to their dealers. Our repurchase agreements generally provide that, in the event of a default by a dealer in its obligation to these lenders, we will repurchase vehiclesunits sold to the dealer that have not been resold to retail customers. The terms of these agreements, which can last up to 1824 months, provide that our liability will be the lesser of remaining principal owed by the dealer or dealer invoice less periodic reductions based on the time since the date of the original invoice. Our liability cannot exceed 100% of the dealer invoice. In certain instances, we also repurchase inventory from our dealers due to state law or regulatory requirements that govern voluntary or involuntary relationship terminations.
Based on these repurchase agreements, we establish an associated loss reserve which is included in "Accrued expenses - Other" on the consolidated balance sheets. Repurchased sales are not recorded as a revenue transaction, but the net difference between the original repurchase price and the resale price are recorded against the loss reserve, which is a deduction from gross revenue.reserve. Our loss reserve for repurchase commitments contains uncertainties because the calculation requires management to make
assumptions and apply judgment regarding a number of factors. We base our reserve primarily on our historical loss experience rate per dollar of dealer inventory. The historical experience has been affected by a number of factors which are evaluated, such as macro-market conditions, current retail demand for our product, location of the dealer, and the financing source. The percentage of dealer inventory we estimate we will repurchase and the associated estimated loss is based on historical loss experience and current trends and economic conditions.
Repurchase risk is affected by the credit worthiness of our dealer network and if we are obligated to repurchase a substantially larger number of RVsunits in the future, this would increase our costs and could have a material adverse effect on our results of operations, financial condition, and cash flows. A hypothetical change of a 10% increase or decrease in our repurchases commitments as of August 25, 2018 would have an immaterial effect on net income.
Warranty
We provide our motorhome customers a comprehensive 12-month/15,000-milecertain service and warranty on our Class A, B, and C motorhomes and a 3-year/36,000-mile warranty on Class A and C sidewalls and floors. We provide a comprehensive 12-month warranty on all towable products. Estimated costs related to product warranty are accrued at the time of sale and are based upon past warranty claims and unit sales history. AccrualsEstimates are adjusted as needed to reflect actual costs incurred as information becomes available.
In addition to the costs associated with the contractual warranty coverage provided on our products, we also occasionally incur costs as a result of additional service actions not covered by our warranties, including product recalls and customer satisfaction actions. Although we estimate and reserve for the cost of these service actions, there can be no assurance that expense levels will remain at current levels or such reserves will continue to be adequate.
A significant increase in dealership labor rates, the cost of parts, or the frequency of claims could have a material adverse impact on our operating results for the period or periods in which such claims or additional costs materialize. A hypothetical change of a 10% increase or decrease in our significant warranty commitment assumptionsliability as of August 26, 201725, 2018 would have affected net income by approximately $1.9$2.8 million. Further discussion of our warranty costs and associated accruals is included in Note 7.
Income Taxes
We account for income taxes in accordance with ASCAccounting Standards Codification ("ASC") 740, Income Taxes. In preparing our financial statements, we are required to estimate our income taxes in each of the jurisdictions in which we operate. Significant judgment is required in determining our provision for income taxes, our deferred tax assets and liabilities, and any valuation allowance recorded against our deferred tax assets.
We will continue to assess the likelihood that our deferred tax assets are properly measured and will be realizable at each reporting period. Any adjustment to the deferred tax assets could materially impact our financial position and results of operations. As of August 26, 2017,25, 2018, we have determined that our deferred tax assets are properly measured and realizable and, therefore, no valuation allowance has been recorded.
New Accounting Pronouncements
See Note 1 forFor a summary of new applicable accounting pronouncements, which are incorporated by reference herein.See Note 1, Summary of Significant Accounting Policies, of the Notes to Consolidated Financial Statements, included in Item 8, Financial Statements and Supplementary Data, of this Annual Report on Form 10-K.
Item 7A.Quantitative and Qualitative Disclosures About Market RiskRisk.
The assets we maintain to fund deferred compensation have market risk, but we maintain a corresponding liability for these assets. The market risk is therefore borne by the participants in the deferred compensation program.
Interest rate risk
We are exposed to market risks related to fluctuations in interest rates on the outstanding variable rate debt. As of August 26, 2017,25, 2018, we had $284.0$260.0 million outstanding under our Term Loan, subject to variable interest rates. This risk is partially mitigated
through the use of an interest rate swap contract as detailed below.
Under terms of the Credit Agreement, we arewere previously required to maintain interest rate swaps to manage our interest rate exposure related to the variable component of interest cost on the Term Loan. This hedging arrangement must be maintained until the later of November 8, 2019 or when our leverage ratio is less than 2.0 to 1.0. On January 23, 2017,In accordance with this requirement, we entered into an interest rate swap contract on January 23, 2017, to effectively convert $200.0 million of the Term Loan balance to a fixed rate. The notional amount of the swap is reduced to $170.0 million on December 8, 2017 and will be reduced to $120.0 million inon December 10,8, 2018 and $60.0 million on December 9, 2019. The swap contract expires on December 8, 2020. A hypothetical one percentage point increase in interest rates on the Term Loan would increase our interest expense (after consideration of the interest rate swap) for 2018 by approximately $0.8$0.9 million. Due to the floor of 1%A 1.0% decrease in interest rates on LIBOR for the Term Loan would decrease our interest expense for Fiscal 2018 by approximately $0.9 million. The requirement to hedge a 1% decrease could only decreaseportion of the Term Loan floating rate interest exposure was removed through an amendment to the floor for the variable rate, resulting in a decrease in interest expense (after considerationABL. See Note 9, Long-Term Debt, of the interest rate swap) for 2018Notes to Consolidated Financial Statements, included in Item 8, Financial Statements and Supplementary Data, of $(0.2) million.this Annual Report on Form 10-K.
For variable rate debt, interest rate changes generally do not affect the fair value of the debt instrument, but do impact future earnings and cash flows, assuming other factors are held constant.
Derivative instruments are accounted for at fair value in accordance with ASC Topic 815, Derivatives and Hedging, and have been designated for hedge accounting. The fair value of the interest rate swap is based on observable market data (Level 2) and was $(0.8)$2.0 million as ofon August 26, 2017.25, 2018. The interest rate swap requires us to pay interest at a fixed rate of 1.82% through the December 8, 2020 expiration of the swap. A 1.0% increase in the interest rate would have changed the fair value of the swap as of
August 26, 201725, 2018 by approximately $3.8$2.1 million and a 1.0% decrease would have changed the fair value by $(2.4)$2.2 million. These increases and decreases would be recorded in OCIother comprehensive income and the hedged value on our consolidated balance sheet (currently recordedwithin other assets, if the balance is an asset and within other non-current liabilities).liabilities, if the balance is a liability. While these are our best estimates of the impact of the specified interest rate scenario, actual results could differ from those projected. The sensitivity analysis presented assumes interest rate changes are instantaneous, parallel shifts in the yield curve. In reality, interest rate changes of this magnitude are rarely instantaneous or parallel.
Item 8. Financial Statements and Supplementary Data
|
| |
Index to Financial Statements | Page |
| |
| |
| |
| |
| |
| |
| |
| |
Data.
MANAGEMENT'S REPORT ON INTERNAL CONTROL OVER FINANCIAL REPORTING
We, the management of Winnebago Industries, Inc. (the "Company") are responsible for establishing and maintaining effective internal control over financial reporting and for the assessment of the effectiveness of internal control over financial reporting. The Company's internal control over financial reporting is a process designed, as defined in Rule 13a-15(f) under the Securities Exchange Act of 1934, as amended, to provide reasonable assurance regarding the reliability of financial reporting and the preparation of financial statements for external purposes in accordance with generally accepted accounting principles.
The Company's internal control over financial reporting is supported by written policies and procedures that:
| |
| 1. | pertain to the maintenance of records that, in reasonable detail, accurately and fairly reflect the transactions and dispositions of the Company's assets; |
| |
| 2. | provide reasonable assurance that transactions are recorded as necessary to permit preparation of financial statements in accordance with generally accepted accounting principles and that receipts and expenditures of the Company are being made only in accordance with authorizations of the Company's management and directors; and |
| |
| 3. | provide reasonable assurance regarding prevention or timely detection of unauthorized acquisition, use or disposition of the Company's assets that could have a material effect on the financial statements. |
In addition, the Audit Committee of the Board of Directors, consisting solely of independent directors, meets periodically with Management,management of the Company, the internal auditors, and the independent registered public accounting firm to review internal accounting controls, audit results, and accounting principles and practices and annually selects the independent registered public accounting firm.
Because of its inherent limitations, internal control over financial reporting may not prevent or detect misstatements. Projections of any evaluation of effectiveness to future periods are subject to the risk that controls may become inadequate because of changes in conditions or that the degree of compliance with the policies or procedures may deteriorate.
In connection with the preparation of the Company's annual financial statements, management of the Company has undertaken an assessment of the effectiveness of the Company's internal control over financial reporting based on criteria established in Internal Control - Integrated Framework (2013) issued by the Committee of Sponsoring Organizations of the Treadway Commission (COSO)("COSO"). Management'sManagement of the Company's assessment included an evaluation of the design of the Company's internal control over financial reporting and testing of the operational effectiveness of the Company's internal control over financial reporting.
During Fiscal 2017,2018, management excluded certain elements of internal control over financial reporting pertaining to the activities of the Grand DesignChris-Craft business acquired in the firstfourth quarter (see(Refer to Note 2, of Notes to Consolidated Financial Statements)Business Combinations). Exclusion in the year of acquisition is customary to allow management sufficient time to evaluate and integrate our internal control over financial reporting. The exclusion for Grand DesignChris-Craft represented 36.2%less than 1.0% of consolidated total revenue and 39.8%less than 1.0% of our consolidated total operating income for the year ended August 26, 201725, 2018 as well as 18.8%9.5% of our consolidated total assets as of August 26, 2017.25, 2018.
Based on its assessment and considering the exclusion noted above, management has concluded that the Company's internal control over financial reporting was effective as of August 26, 2017.25, 2018.
Deloitte & Touche LLP, the independent registered public accounting firm that audited the Company's financial statements included in this Annual Report on Form 10-K, has issued a report included herein, which expressed an unqualified opinion on the Company's internal control over financial reporting.
|
| | |
| /s/ Michael J. Happe | | /s/ Bryan L. Hughes |
| Michael J. Happe | | Bryan L. Hughes |
| President, Chief Executive Officer | | Vice President, Chief Financial Officer |
| | | |
October 20, 201718, 2018 | | October 20, 201718, 2018 |
REPORT OF INDEPENDENT REGISTERED PUBLIC ACCOUNTING FIRM
To the Stockholders and the Board of Directors and Stockholders of
Winnebago Industries, Inc.
Forest City, IowaOpinion on the Financial Statements
We have audited the accompanying consolidated balance sheets of Winnebago Industries, Inc. and subsidiaries (the "Company") as of August 25, 2018 and August 26, 2017, the related consolidated statements of incomeand comprehensive income, changes in stockholders' equity, and cash flows, for each of the three years in the period ended August 25, 2018, and the related notes (collectively referred to as the "financial statements"). In our opinion, the financial statements present fairly, in all material respects, the financial position of the Company as of August 25, 2018 and August 26, 2017, and the results of its operations and its cash flows for each of the three years in the period ended August 25, 2018, in conformity with accounting principles generally accepted in the United States of America.
We have also audited, in accordance with the standards of the Public Company Accounting Oversight Board (United States) (PCAOB), the Company's internal control over financial reporting as of August 25, 2018, based on criteria established in Internal Control - Integrated Framework (2013) issued by the Committee of Sponsoring Organizations of the Treadway Commission and our report dated October 18, 2018, expressed an unqualified opinion on the Company's internal control over financial reporting.
Basis for Opinion
These financial statements are the responsibility of the Company's management. Our responsibility is to express an opinion on the Company's financial statements based on our audits. We are a public accounting firm registered with the PCAOB and are required to be independent with respect to the Company in accordance with the U.S. federal securities laws and the applicable rules and regulations of the Securities and Exchange Commission and the PCAOB.
We conducted our audits in accordance with the standards of the PCAOB. Those standards require that we plan and perform the audit to obtain reasonable assurance about whether the financial statements are free of material misstatement, whether due to error or fraud. Our audits included performing procedures to assess the risks of material misstatement of the financial statements, whether due to error or fraud, and performing procedures that respond to those risks. Such procedures included examining, on a test basis, evidence regarding the amounts and disclosures in the financial statements. Our audits also included evaluating the accounting principles used and significant estimates made by management, as well as evaluating the overall presentation of the financial statements. We believe that our audits provide a reasonable basis for our opinion.
/s/ Deloitte & Touche LLP
Minneapolis, Minnesota
October 18, 2018
We have served as the Company's auditor since 1986.
REPORT OF INDEPENDENT REGISTERED PUBLIC ACCOUNTING FIRM
To the Stockholders and the Board of Directors of Winnebago Industries, Inc.
Opinion on Internal Control over Financial Reporting
We have audited the internal control over financial reporting of Winnebago Industries, Inc. and subsidiaries (the "Company"“Company”) as of August 26, 2017,25, 2018, based on criteria established in Internal Control - Integrated Framework (2013) issued by the Committee of Sponsoring Organizations of the Treadway Commission. Commission (COSO). In our opinion, the Company maintained, in all material respects, effective internal control over financial reporting as of August 25, 2018, based on criteria established in Internal Control - Integrated Framework (2013) issued by COSO.
We have also audited, in accordance with the standards of the Public Company Accounting Oversight Board (United States) (PCAOB), the consolidated financial statements as of and for the year ended August 25, 2018, of the Company and our report dated October 18, 2018, expressed an unqualified opinion on those financial statements.
As described in Management’s Report on Internal Control over Financial Reporting, management excluded from its assessment the internal control over financial reporting at Grand Design RV, LLC,Chris-Craft USA, Inc., which was acquired on November 8, 2016June 4, 2018 and whose financial statements constitute 18.8%9.5% of total assets, 36.2%less than 1.0% of net revenues, and 39.8%less than 1.0% of operating income of the consolidated financial statements amounts as of and for the year ended August 26, 2017.25, 2018. Accordingly, our audit did not include the internal control over financial reporting at Grand Design RV, LLC. Chris-Craft USA, Inc.
Basis for Opinion
The Company'sCompany’s management is responsible for maintaining effective internal control over financial reporting and for its assessment of the effectiveness of internal control over financial reporting, included in the accompanying Management'sManagement’s Report on Internal Control over Financial Reporting. Our responsibility is to express an opinion on the Company'sCompany’s internal control over financial reporting based on our audit. We are a public accounting firm registered with the PCAOB and are required to be independent with respect to the Company in accordance with the U.S. federal securities laws and the applicable rules and regulations of the Securities and Exchange Commission and the PCAOB.
We conducted our audit in accordance with the standards of the Public Company Accounting Oversight Board (United States).PCAOB. Those standards require that we plan and perform the audit to obtain reasonable assurance about whether effective internal control over financial reporting was maintained in all material respects. Our audit included obtaining an understanding of internal control over financial reporting, assessing the risk that a material weakness exists, testing and evaluating the design and operating effectiveness of internal control based on the assessed risk, and performing such other procedures as we considered necessary in the circumstances. We believe that our audit provides a reasonable basis for our opinion.
Definition and Limitations of Internal Control over Financial Reporting
A company'scompany’s internal control over financial reporting is a process designed by, or under the supervision of, the company's principal executive and principal financial officers, or persons performing similar functions, and effected by the company's board of directors, management, and other personnel to provide reasonable assurance regarding the reliability of financial reporting and the preparation of financial statements for external purposes in accordance with generally accepted accounting principles. A company'scompany’s internal control over financial reporting includes those policies and procedures that (1) pertain to the maintenance of records that, in reasonable detail, accurately and fairly reflect the transactions and dispositions of the assets of the company; (2) provide reasonable assurance that transactions are recorded as necessary to permit preparation of financial statements in accordance with generally accepted accounting principles, and that receipts and expenditures of the company are being made only in accordance with authorizations of management and directors of the company; and (3) provide reasonable assurance regarding prevention or timely detection of unauthorized acquisition, use, or disposition of the company'scompany’s assets that could have a material effect on the financial statements.
Because of theits inherent limitations, of internal control over financial reporting including the possibility of collusion or improper management override of controls, material misstatements due to error or fraud may not be preventedprevent or detected on a timely basis.detect misstatements. Also, projections of any evaluation of the effectiveness of the internal control over financial reporting to future periods are subject to the risk that the controls may become inadequate because of changes in conditions, or that the degree of compliance with the policies or procedures may deteriorate.
In our opinion, the Company maintained, in all material respects, effective internal control over financial reporting as of /sAugust 26, 2017, based on the criteria established in Internal Control - Integrated Framework (2013) issued by the Committee of Sponsoring Organizations of the Treadway Commission.
We have also audited, in accordance with the standards of the Public Company Accounting Oversight Board (United States), the consolidated financial statements as of and for the year ended August 26, 2017 of the Company and our report dated October 20, 2017 expressed an unqualified opinion on those financial statements.
/s/ Deloitte & Touche LLP
Minneapolis, Minnesota
October 20, 2017
REPORT OF INDEPENDENT REGISTERED PUBLIC ACCOUNTING FIRM
To the Board of Directors and Stockholders of
Winnebago Industries, Inc.
Forest City, Iowa
We have audited the accompanying consolidated balance sheets of Winnebago Industries, Inc. and subsidiaries (the "Company") as of August 26, 2017 and August 27, 2016, and the related consolidated statements of income and comprehensive income, changes in stockholders' equity, and cash flows for each of the three years in the period ended August 26, 2017. These financial statements are the responsibility of the Company's management. Our responsibility is to express an opinion on the financial statements based on our audits.
We conducted our audits in accordance with the standards of the Public Company Accounting Oversight Board (United States). Those standards require that we plan and perform the audit to obtain reasonable assurance about whether the financial statements are free of material misstatement. An audit includes examining, on a test basis, evidence supporting the amounts and disclosures in the financial statements. An audit also includes assessing the accounting principles used and significant estimates made by management, as well as evaluating the overall financial statement presentation. We believe that our audits provide a reasonable basis for our opinion.
In our opinion, such consolidated financial statements present fairly, in all material respects, the financial position of Winnebago Industries, Inc. and subsidiaries at August 26, 2017 and August 27, 2016, and the results of their operations and their cash flows for each of the three years in the period ended August 26, 2017, in conformity with accounting principles generally accepted in the United States of America.
We have also audited, in accordance with the standards of the Public Company Accounting Oversight Board (United States), the Company's internal control over financial reporting as of August 26, 2017, based on the criteria established in Internal Control - Integrated Framework (2013) issued by the Committee of Sponsoring Organizations of the Treadway Commission and our report dated October 20, 2017 expressed an unqualified opinion on the Company's internal control over financial reporting.
/s/ Deloitte & Touche LLP
Minneapolis, Minnesota
October 20, 2017
18, 2018
Winnebago Industries, Inc.
Consolidated Statements of Income and Comprehensive Income
| | | | Year Ended | Year Ended |
| (In thousands, except per share data) | August 26, 2017 | | August 27, 2016 | | August 29, 2015 | August 25, 2018 | | August 26, 2017 | | August 27, 2016 |
| Net revenues | $ | 1,547,119 |
| | $ | 975,226 |
| | $ | 976,505 |
| $ | 2,016,829 |
| | $ | 1,547,119 |
| | $ | 975,226 |
|
| Cost of goods sold | 1,324,542 |
| | 862,577 |
| | 871,625 |
| 1,716,993 |
| | 1,324,542 |
| | 862,577 |
|
| Gross profit | 222,577 |
| | 112,649 |
| | 104,880 |
| 299,836 |
| | 222,577 |
| | 112,649 |
|
| | | | | | | |
| SG&A: | | | | | | |
| Selling, general, and administrative expense ("SG&A"): | | | | | | |
| Selling | 35,668 |
| | 19,823 |
| | 19,161 |
| 49,850 |
| | 35,668 |
| | 19,823 |
|
| General and administrative | 55,347 |
| | 33,209 |
| | 29,911 |
| 78,089 |
| | 55,347 |
| | 33,209 |
|
| Postretirement health care benefit income | (24,796 | ) | | (6,124 | ) | | (4,073 | ) | — |
| | (24,796 | ) | | (6,124 | ) |
| Transaction costs | 6,592 |
| | — |
| | — |
| 2,177 |
| | 6,592 |
| | — |
|
| Amortization of intangible assets | 24,660 |
| | — |
| | — |
| 9,328 |
| | 24,660 |
| | — |
|
| Impairment of fixed assets | — |
| | — |
| | 462 |
| |
| Total SG&A | 97,471 |
| | 46,908 |
| | 45,461 |
| 139,444 |
| | 97,471 |
| | 46,908 |
|
| | | | | | | |
| Operating income | 125,106 |
| | 65,741 |
| | 59,419 |
| 160,392 |
| | 125,106 |
| | 65,741 |
|
| Interest expense | 16,837 |
| | — |
| | — |
| 18,246 |
| | 16,837 |
| | — |
|
| Non-operating income | (330 | ) | | (457 | ) | | (115 | ) | (494 | ) | | (330 | ) | | (457 | ) |
| Income before income taxes | 108,599 |
| | 66,198 |
| | 59,534 |
| 142,640 |
| | 108,599 |
| | 66,198 |
|
| | | | | | | |
| Provision for income taxes | 37,269 |
| | 20,702 |
| | 18,324 |
| 40,283 |
| | 37,269 |
| | 20,702 |
|
| Net income | $ | 71,330 |
| | $ | 45,496 |
| | $ | 41,210 |
| $ | 102,357 |
| | $ | 71,330 |
| | $ | 45,496 |
|
| | | | | | | | | | | |
| Income per common share: | | | | | | | | | | |
| Basic | $ | 2.33 |
| | $ | 1.69 |
| | $ | 1.53 |
| $ | 3.24 |
| | $ | 2.33 |
| | $ | 1.69 |
|
| Diluted | $ | 2.32 |
| | $ | 1.68 |
| | $ | 1.52 |
| $ | 3.22 |
| | $ | 2.32 |
| | $ | 1.68 |
|
| | | | | | | | | | | |
| Weighted average common shares outstanding: | | | | | | | | | | |
| Basic | 30,648 |
| | 26,925 |
| | 26,941 |
| 31,596 |
| | 30,648 |
| | 26,925 |
|
| Diluted | 30,766 |
| | 27,033 |
| | 27,051 |
| 31,814 |
| | 30,766 |
| | 27,033 |
|
| | | | | | | | | | | |
| Dividends paid per common share | $ | 0.40 |
| | $ | 0.40 |
| | $ | 0.36 |
| $ | 0.40 |
| | $ | 0.40 |
| | $ | 0.40 |
|
| | | | | | | | | | | |
| Net income | $ | 71,330 |
| | $ | 45,496 |
| | $ | 41,210 |
| $ | 102,357 |
| | $ | 71,330 |
| | $ | 45,496 |
|
| Other comprehensive income (loss): | | | | | | |
Amortization of prior service credit
(net of tax of $15,409, $2,947, and $2,110) | (25,035 | ) | | (4,788 | ) | | (3,428 | ) | |
Amortization of net actuarial loss
(net of tax of $5,976, $621, and $565) | 9,705 |
| | 1,010 |
| | 918 |
| |
Increase in actuarial loss
(net of tax of $35, $415, and $250) | (57 | ) | | (674 | ) | | (407 | ) | |
Plan amendment
(net of tax of $2,402, $10,895, and $1,509) | 3,903 |
| | 17,701 |
| | 2,451 |
| |
Change in fair value of interest rate swap
(net of tax of $314, $0, and $0) | (514 | ) | | — |
| | — |
| |
| Other comprehensive income (loss), net of tax: | | | | | | |
Amortization of prior service credit
(net of tax of $0, $15,409, and $2,947) | | — |
| | (25,035 | ) | | (4,788 | ) |
Amortization of net actuarial loss
(net of tax of $11, $5,976, and $621) | | 27 |
| | 9,705 |
| | 1,010 |
|
Increase in actuarial loss
(net of tax of $0, $35, and $415) | | — |
| | (57 | ) | | (674 | ) |
Plan amendment
(net of tax of $0, $2,402, and $10,895) | | — |
| | 3,903 |
| | 17,701 |
|
Change in fair value of interest rate swap
(net of tax of $840, $314, and $0) | | 1,947 |
| | (514 | ) | | — |
|
| Total other comprehensive income (loss) | (11,998 | ) | | 13,249 |
| | (466 | ) | 1,974 |
| | (11,998 | ) | | 13,249 |
|
| Comprehensive income | $ | 59,332 |
| | $ | 58,745 |
| | $ | 40,744 |
| $ | 104,331 |
| | $ | 59,332 |
| | $ | 58,745 |
|
See notes to consolidated financial statements.
Winnebago Industries, Inc.
Consolidated Balance Sheets
| | | (In thousands, except per share data) | August 26, 2017 | | August 27, 2016 | August 25, 2018 | | August 26, 2017 |
| Assets | | | | | | |
| Current assets: | | | | | | |
| Cash and cash equivalents | $ | 35,945 |
| | $ | 85,583 |
| $ | 2,342 |
| | $ | 35,945 |
|
| Receivables, less allowance for doubtful accounts ($183 and $278, respectively) | 124,539 |
| | 66,184 |
| |
| Receivables, less allowance for doubtful accounts ($197 and $183, respectively) | | 164,585 |
| | 124,539 |
|
| Inventories | 142,265 |
| | 122,522 |
| 195,128 |
| | 142,265 |
|
| Prepaid expenses and other assets | 11,388 |
| | 6,300 |
| 9,883 |
| | 11,388 |
|
| Total current assets | 314,137 |
| | 280,589 |
| 371,938 |
| | 314,137 |
|
| Property, plant and equipment, net | 71,560 |
| | 55,931 |
| |
| Property, plant, and equipment, net | | 101,193 |
| | 71,560 |
|
| Other assets: | | | | | | |
| Goodwill | 242,728 |
| | 1,228 |
| 274,370 |
| | 242,728 |
|
| Other intangible assets, net | 228,440 |
| | — |
| 265,717 |
| | 228,440 |
|
| Investment in life insurance | 27,418 |
| | 26,492 |
| 28,297 |
| | 27,418 |
|
| Deferred income taxes | 12,736 |
| | 18,753 |
| — |
| | 12,736 |
|
| Other assets | 5,493 |
| | 7,725 |
| 10,290 |
| | 5,493 |
|
| Total assets | $ | 902,512 |
| | $ | 390,718 |
| $ | 1,051,805 |
| | $ | 902,512 |
|
| | | | | | | |
| Liabilities and Stockholders' Equity | | | | | | |
| Current liabilities: | | | | | | |
| Accounts payable | $ | 79,194 |
| | $ | 44,134 |
| $ | 81,039 |
| | $ | 79,194 |
|
| Current maturities of long-term debt | 2,850 |
| | — |
| — |
| | 2,850 |
|
| Income taxes payable | 7,450 |
| | 19 |
| 15,655 |
| | 7,450 |
|
| Accrued expenses: | | | | | | |
| Accrued compensation | 24,546 |
| | 19,699 |
| 29,350 |
| | 24,546 |
|
| Product warranties | 30,805 |
| | 12,412 |
| 40,498 |
| | 30,805 |
|
| Self-insurance | 6,122 |
| | 5,812 |
| 12,262 |
| | 6,122 |
|
| Promotional | 6,560 |
| | 4,756 |
| 11,017 |
| | 6,560 |
|
| Accrued interest | 3,128 |
| | — |
| 3,095 |
| | 3,128 |
|
| Other | 6,503 |
| | 6,117 |
| 11,269 |
| | 6,503 |
|
| Total current liabilities | 167,158 |
| | 92,949 |
| 204,185 |
| | 167,158 |
|
| Non-current liabilities: | | | | | | |
| Long-term debt, less current maturities | 271,726 |
| | — |
| 291,441 |
| | 271,726 |
|
| Deferred income taxes | | 4,457 |
| | — |
|
| Unrecognized tax benefits | 1,606 |
| | 2,461 |
| 1,745 |
| | 1,606 |
|
| Deferred compensations benefits and postretirement health care benefits, net of current portion | 19,270 |
| | 26,949 |
| |
| Deferred compensation benefits, net of current portion | | 15,282 |
| | 19,270 |
|
| Other | 1,078 |
| | — |
| 250 |
| | 1,078 |
|
| Total non-current liabilities | 293,680 |
| | 29,410 |
| 313,175 |
| | 293,680 |
|
| Contingent liabilities and commitments (Note 11) | | | | |
| Stockholders' equity: | | | | | | |
Capital stock common, par value $0.50; authorized 60,000 shares, issued 51,776 shares | 25,888 |
| | 25,888 |
| |
| Preferred stock, par value $0.01: Authorized-10,000 shares; Issued-none | | — |
| | — |
|
| Common stock, par value $0.50: Authorized-60,000 shares; Issued-51,776 shares | | 25,888 |
| | 25,888 |
|
| Additional paid-in capital | 80,401 |
| | 32,717 |
| 86,223 |
| | 80,401 |
|
| Retained earnings | 679,138 |
| | 620,546 |
| 768,816 |
| | 679,138 |
|
| Accumulated other comprehensive (loss) income | (1,023 | ) | | 10,975 |
| |
| Treasury stock, at cost (20,183 and 24,875 shares, respectively) | (342,730 | ) | | (421,767 | ) | |
| Accumulated other comprehensive income (loss) | | 892 |
| | (1,023 | ) |
| Treasury stock, at cost: 20,243 and 20,183 shares, respectively | | (347,374 | ) | | (342,730 | ) |
| Total stockholders' equity | 441,674 |
| | 268,359 |
| 534,445 |
| | 441,674 |
|
| Total liabilities and stockholders' equity | $ | 902,512 |
| | $ | 390,718 |
| $ | 1,051,805 |
| | $ | 902,512 |
|
See notes to consolidated financial statements.
Winnebago Industries, Inc.
Consolidated Statements of Changes in Stockholders' Equity
| | | |
Common Shares | Additional Paid-In Capital (APIC) | Retained Earnings | Accum- ulated Other Compre- hensive Income (Loss) |
Treasury Stock | Total Stock- holders' Equity | | | | | | | | | | | | | | | | |
| (In thousands, except per share data) | Number | Amount | Number | Amount |
Common Shares | Additional Paid-In Capital ("APIC") | Retained Earnings | Accumulated Other Comprehensive Income (Loss) |
Treasury Stock | Total Stockholders' Equity |
| Balance, August 30, 2014 | 51,776 |
| $ | 25,888 |
| $ | 31,672 |
| $ | 554,496 |
| $ | (1,808 | ) | (24,727 | ) | $ | (417,500 | ) | $ | 192,748 |
| |
| Creation/(utilization) of APIC pool due to stock award | — |
| — |
| 124 |
| — |
| — |
| — |
| — |
| 124 |
| |
(In thousands, except per share data) | | Number | Amount | Additional Paid-In Capital ("APIC") | Retained Earnings | Accumulated Other Comprehensive Income (Loss) | Number | Amount | Total Stockholders' Equity |
| 51,776 |
| $ | 25,888 |
| (24,825 | ) | $ | (420,610 | ) |
| Creation of APIC pool due to stock award | | — |
| — |
| 33 |
| — |
| — |
| — |
| — |
| 33 |
|
| Issuance of restricted stock | — |
| — |
| (1,950 | ) | — |
| — |
| 199 |
| 3,360 |
| 1,410 |
| — |
| — |
| (1,309 | ) | — |
| — |
| 108 |
| 1,826 |
| 517 |
|
| Stock-based compensation, net of forfeitures | — |
| — |
| 2,172 |
| — |
| — |
| 3 |
| 49 |
| 2,221 |
| — |
| — |
| 1,975 |
| — |
| — |
| 5 |
| 83 |
| 2,058 |
|
| Payments for the purchase of common stock | — |
| — |
| — |
| — |
| — |
| (300 | ) | (6,519 | ) | (6,519 | ) | |
| Cash dividends paid on common stock-$0.36 per share | — |
| — |
| — |
| (9,765 | ) | — |
| — |
| — |
| (9,765 | ) | |
| Prior service cost and actuarial loss, net of $1,795 tax | — |
| — |
| — |
| — |
| (2,917 | ) | — |
| — |
| (2,917 | ) | |
| Plan amendment, net of $1,509 tax | — |
| — |
| — |
| — |
| 2,451 |
| — |
| — |
| 2,451 |
| |
| Net income | — |
| — |
| — |
| 41,210 |
| — |
| — |
| — |
| 41,210 |
| |
| Balance, August 29, 2015 | 51,776 |
| $ | 25,888 |
| $ | 32,018 |
| $ | 585,941 |
| $ | (2,274 | ) | (24,825 | ) | $ | (420,610 | ) | $ | 220,963 |
| |
| Creation/(utilization) of APIC pool due to stock award | — |
| — |
| 33 |
| — |
| — |
| — |
| — |
| 33 |
| |
| Issuance of restricted stock | — |
| — |
| (1,309 | ) | — |
| — |
| 108 |
| 1,826 |
| 517 |
| |
| Stock-based compensation, net of forfeitures | — |
| — |
| 1,975 |
| — |
| — |
| 5 |
| 83 |
| 2,058 |
| |
| Payments for the purchase of common stock | — |
| — |
| — |
| — |
| — |
| (163 | ) | (3,066 | ) | (3,066 | ) | |
| Cash dividends paid on common stock-$0.40 per share | — |
| — |
| — |
| (10,891 | ) | — |
| — |
| — |
| (10,891 | ) | |
| Repurchase of common stock | | — |
| — |
| — |
| — |
| — |
| (163 | ) | (3,066 | ) | (3,066 | ) |
| Cash dividends paid on common stock; $0.40 per share | | — |
| — |
| — |
| (10,891 | ) | — |
| — |
| — |
| (10,891 | ) |
| Prior service cost and actuarial loss, net of $2,741 tax | — |
| — |
| — |
| — |
| (4,452 | ) | — |
| — |
| (4,452 | ) | — |
| — |
| — |
| — |
| (4,452 | ) | — |
| — |
| (4,452 | ) |
| Plan amendment, net of $10,895 tax | — |
| — |
| — |
| — |
| 17,701 |
| — |
| — |
| 17,701 |
| — |
| — |
| — |
| — |
| 17,701 |
| — |
| — |
| 17,701 |
|
| Net income | — |
| — |
| — |
| 45,496 |
| — |
| — |
| — |
| 45,496 |
| — |
| — |
| — |
| 45,496 |
| — |
| — |
| — |
| 45,496 |
|
| Balance, August 27, 2016 | 51,776 |
| $ | 25,888 |
| $ | 32,717 |
| $ | 620,546 |
| $ | 10,975 |
| (24,875 | ) | $ | (421,767 | ) | $ | 268,359 |
| 51,776 |
| $ | 25,888 |
| $ | 32,717 |
| $ | 620,546 |
| $ | 10,975 |
| (24,875 | ) | $ | (421,767 | ) | $ | 268,359 |
|
| Creation/(utilization) of APIC pool due to stock award | — |
| — |
| 470 |
| — |
| — |
| — |
| — |
| 470 |
| |
| Creation of APIC pool due to stock award | | — |
| — |
| 470 |
| — |
| — |
| — |
| — |
| 470 |
|
| Issuance of restricted stock | — |
| — |
| (1,821 | ) | — |
| — |
| 155 |
| 2,629 |
| 808 |
| — |
| — |
| (1,821 | ) | — |
| — |
| 155 |
| 2,629 |
| 808 |
|
| Stock-based compensation, net of forfeitures | — |
| — |
| 2,830 |
| — |
| — |
| 5 |
| 78 |
| 2,908 |
| — |
| — |
| 2,830 |
| — |
| — |
| 5 |
| 78 |
| 2,908 |
|
| Issuance of stock for acquisition | — |
| — |
| 46,205 |
| | 4,586 |
| 77,861 |
| 124,066 |
| — |
| — |
| 46,205 |
| | 4,586 |
| 77,861 |
| 124,066 |
|
| Payments for the purchase of common stock | — |
| — |
| — |
| — |
| — |
| (54 | ) | (1,531 | ) | (1,531 | ) | |
| Cash dividends paid on common stock-$0.40 per share | — |
| — |
| — |
| (12,738 | ) | — |
| — |
| — |
| (12,738 | ) | |
| Repurchase of common stock | | — |
| — |
| — |
| — |
| — |
| (54 | ) | (1,531 | ) | (1,531 | ) |
| Cash dividends paid on common stock; $0.40 per share | | — |
| — |
| — |
| (12,738 | ) | — |
| — |
| — |
| (12,738 | ) |
| Prior service cost and actuarial loss, net of $9,468 tax | — |
| — |
| — |
| — |
| (15,387 | ) | — |
| — |
| (15,387 | ) | — |
| — |
| — |
| — |
| (15,387 | ) | — |
| — |
| (15,387 | ) |
| Plan amendment, net of $2,402 tax | — |
| — |
| — |
| — |
| 3,903 |
| — |
| — |
| 3,903 |
| — |
| — |
| — |
| — |
| 3,903 |
| — |
| — |
| 3,903 |
|
| Change in fair value of interest rate swap, net of $314 tax | — |
| — |
| — |
| — |
| (514 | ) | — |
| — |
| (514 | ) | — |
| — |
| — |
| — |
| (514 | ) | — |
| — |
| (514 | ) |
| Net income | — |
| — |
| — |
| 71,330 |
| — |
| — |
| — |
| 71,330 |
| — |
| — |
| — |
| 71,330 |
| — |
| — |
| — |
| 71,330 |
|
| Balance, August 26, 2017 | 51,776 |
| $ | 25,888 |
| $ | 80,401 |
| $ | 679,138 |
| $ | (1,023 | ) | (20,183 | ) | $ | (342,730 | ) | $ | 441,674 |
| 51,776 |
| $ | 25,888 |
| $ | 80,401 |
| $ | 679,138 |
| $ | (1,023 | ) | (20,183 | ) | $ | (342,730 | ) | $ | 441,674 |
|
| Issuance of restricted stock | | — |
| — |
| (1,625 | ) | — |
| — |
| 101 |
| 1,712 |
| 87 |
|
| Stock-based compensation, net of forfeitures | | — |
| — |
| 7,406 |
| — |
| — |
| 5 |
| 78 |
| 7,484 |
|
| Repurchase of common stock | | — |
| — |
| — |
| — |
| — |
| (169 | ) | (6,481 | ) | (6,481 | ) |
| Issuance of stock under ESPP | | — |
| — |
| 41 |
| — |
| — |
| 3 |
| 47 |
| 88 |
|
| Cash dividends paid on common stock; $0.40 per share | | — |
| — |
| — |
| (12,738 | ) | — |
| — |
| — |
| (12,738 | ) |
| Actuarial loss, net of $11 tax | | — |
| — |
| — |
| — |
| 27 |
| — |
| — |
| 27 |
|
| Change in fair value of interest rate swap, net of $840 tax | | — |
| — |
| — |
| — |
| 1,947 |
| — |
| — |
| 1,947 |
|
| Reclassification of tax effects | | — |
| — |
| — |
| 59 |
| (59 | ) | — |
| — |
| — |
|
| Net income | | — |
| — |
| — |
| 102,357 |
| — |
| — |
| — |
| 102,357 |
|
| Balance, August 25, 2018 | | 51,776 |
| $ | 25,888 |
| $ | 86,223 |
| $ | 768,816 |
| $ | 892 |
| (20,243 | ) | $ | (347,374 | ) | $ | 534,445 |
|
See notes to consolidated financial statements.
Winnebago Industries, Inc.
Consolidated Statements of Cash Flows
| | | | Year Ended | Year Ended |
| (In thousands) | August 26, 2017 | | August 27, 2016 | | August 29, 2015 | August 25, 2018 | | August 26, 2017 | | August 27, 2016 |
| Operating activities: | | | | | | | | | | |
| Net income | $ | 71,330 |
| | $ | 45,496 |
| | $ | 41,210 |
| $ | 102,357 |
| | $ | 71,330 |
| | $ | 45,496 |
|
| Adjustments to reconcile net income to net cash provided by operating activities: | | | | | | | | | | |
| Depreciation | 7,315 |
| | 5,745 |
| | 4,513 |
| 9,849 |
| | 7,315 |
| | 5,745 |
|
| Amortization of intangible assets | 24,660 |
| | — |
| | — |
| 9,328 |
| | 24,660 |
| | — |
|
| Amortization of debt issuance costs | 1,596 |
| | — |
| | — |
| 2,206 |
| | 1,596 |
| | — |
|
| LIFO expense | 1,722 |
| | 1,153 |
| | 1,244 |
| |
| Asset impairment | — |
| | — |
| | 462 |
| |
| Last-in, first-out expense | | 3,344 |
| | 1,722 |
| | 1,153 |
|
| Stock-based compensation | 2,977 |
| | 3,293 |
| | 3,097 |
| 7,434 |
| | 2,977 |
| | 3,293 |
|
| Deferred income taxes | 8,360 |
| | 2,233 |
| | 215 |
| 5,784 |
| | 8,360 |
| | 2,233 |
|
| Deferred compensation expense and postretirement benefit income | (23,379 | ) | | (4,292 | ) | | (843 | ) | 1,201 |
| | (23,379 | ) | | (4,292 | ) |
| Other | (1,257 | ) | | (935 | ) | | (909 | ) | |
| Other, net | | (995 | ) | | (1,257 | ) | | (935 | ) |
| Change in assets and liabilities: | | | | | | | | | | |
| Receivables | | (37,739 | ) | | (25,136 | ) | | 564 |
|
| Inventories | (6,165 | ) | | (11,510 | ) | | (561 | ) | (46,429 | ) | | (6,165 | ) | | (11,510 | ) |
| Receivables, prepaid and other assets | (27,597 | ) | | 1,217 |
| | 2,458 |
| |
| Investment in operating leases, net of repurchase obligations | — |
| | — |
| | (72 | ) | |
| Prepaid expenses and other assets | | 2,353 |
| | (2,461 | ) | | 653 |
|
| Accounts payable | | (1,278 | ) | | 23,778 |
| | 10,977 |
|
| Income taxes and unrecognized tax benefits | 7,045 |
| | 85 |
| | 408 |
| 7,939 |
| | 7,045 |
| | 85 |
|
| Accounts payable and accrued expenses | 33,697 |
| | 14,253 |
| | (1,880 | ) | |
| Postretirement and deferred compensation benefits | (3,177 | ) | | (3,992 | ) | | (4,159 | ) | |
| Accrued expenses and other liabilities | | 21,084 |
| | 9,919 |
| | 3,276 |
|
| Deferred compensation and postretirement benefits | | (3,092 | ) | | (3,177 | ) | | (3,992 | ) |
| Net cash provided by operating activities | 97,127 |
| | 52,746 |
| | 45,183 |
| 83,346 |
| | 97,127 |
| | 52,746 |
|
| | | | | | | |
| Investing activities: | | | | | | | | | | |
| Purchases of property and equipment | (13,993 | ) | | (24,551 | ) | | (16,573 | ) | (28,668 | ) | | (13,993 | ) | | (24,551 | ) |
| Proceeds from the sale of property | 223 |
| | 18 |
| | 65 |
| 338 |
| | 223 |
| | 18 |
|
| Acquisition of business, net of cash acquired | (392,473 | ) | | — |
| | — |
| (81,200 | ) | | (392,473 | ) | | — |
|
| Other | 858 |
| | 1,141 |
| | (9 | ) | |
| Other, net | | (2,231 | ) | | 858 |
| | 1,141 |
|
| Net cash used in investing activities | (405,385 | ) | | (23,392 | ) | | (16,517 | ) | (111,761 | ) | | (405,385 | ) | | (23,392 | ) |
| | | | | | | |
| Financing activities: | | | | | | | | | | |
| Borrowings on credit agreement | | 221,133 |
| | 366,400 |
| | — |
|
| Repayments of credit agreement | | (206,601 | ) | | (82,400 | ) | | — |
|
| Payments of cash dividends | | (12,738 | ) | | (12,738 | ) | | (10,891 | ) |
| Payments for repurchases of common stock | (1,530 | ) | | (3,066 | ) | | (6,519 | ) | (6,481 | ) | | (1,530 | ) | | (3,066 | ) |
| Payments of cash dividends | (12,738 | ) | | (10,891 | ) | | (9,765 | ) | |
| Payments of debt issuance costs | (11,020 | ) | | — |
| | — |
| (589 | ) | | (11,020 | ) | | — |
|
| Borrowings on credit facility | 366,400 |
| | — |
| | 22,000 |
| |
| Repayments of credit facility | (82,400 | ) | | — |
| | (22,000 | ) | |
| Other | (92 | ) | | (53 | ) | | 53 |
| |
| Net cash provided by (used in) financing activities | 258,620 |
| | (14,010 | ) | | (16,231 | ) | |
| | | | | | | |
| Other, net | | 88 |
| | (92 | ) | | (53 | ) |
| Net cash (used in) provided by financing activities | | (5,188 | ) | | 258,620 |
| | (14,010 | ) |
| Net (decrease) increase in cash and cash equivalents | (49,638 | ) | | 15,344 |
| | 12,435 |
| (33,603 | ) | | (49,638 | ) | | 15,344 |
|
| Cash and cash equivalents at beginning of year | 85,583 |
| | 70,239 |
| | 57,804 |
| 35,945 |
| | 85,583 |
| | 70,239 |
|
| Cash and cash equivalents at end of year | $ | 35,945 |
| | $ | 85,583 |
| | $ | 70,239 |
| $ | 2,342 |
| | $ | 35,945 |
| | $ | 85,583 |
|
| | | | | | | |
| Supplemental cash flow disclosure: | | | | | | | | | | |
| Income taxes paid, net | $ | 21,421 |
| | $ | 18,449 |
| | $ | 17,658 |
| $ | 26,436 |
| | $ | 21,421 |
| | $ | 18,449 |
|
| Interest paid | $ | 11,893 |
| | $ | — |
| | $ | 10 |
| $ | 16,565 |
| | $ | 11,893 |
| | $ | — |
|
| Non-cash transactions: | | | | | | | | | | |
| Issuance of Winnebago common stock for acquisition of business | $ | 124,066 |
| | $ | — |
| | $ | — |
| $ | — |
| | $ | 124,066 |
| | $ | — |
|
| Capital expenditures in accounts payable | $ | 1,021 |
| | $ | 903 |
| | $ | — |
| $ | 698 |
| | $ | 1,021 |
| | $ | 903 |
|
| See notes to consolidated financial statements. | | | | | | |
See notes to consolidated financial statements.
Winnebago Industries, Inc.
Notes to Consolidated Financial Statements
Note 1: 1: Summary of Significant Accounting Policies
Unless the context otherwise requires, the use of the terms "Winnebago Industries," "we," "us," and "our" in these Notes to Consolidated Financial Statements refers to Winnebago Industries, Inc. and its wholly-owned subsidiaries.
Nature of Operations
Winnebago Industries, Inc., founded in 1958 and headquartered in Forest City, Iowa is one of the leading U.S. manufacturers with a diversified portfolio of RVs which we sellrecreation vehicles ("RV"s) and marine products used primarily in leisure travel and outdoor recreation activities. We distribute our RV and marine products primarily through independent dealers primarily throughout the United StatesU.S. and Canada.Canada, who then retail the products to the end consumer. We also distribute our marine products internationally through independent dealers, who than retail the products to the end consumer. Other products manufactured by us consist primarily of original equipment manufacturing parts for other manufacturers and commercial vehicles.
In the first quarter of Fiscal 2017, we revised our reporting segments. Previously we had one reporting segment which included all recreational vehicle products and services. With the acquisition of Grand Design in the first quarter of Fiscal 2017, we expanded the number of reporting segments to two:
Reportable Segments
We have two reportable segments: (1) Motorized products and servicesMotorhome and (2) TowableTowable. The Motorhome segment includes products and services.that include a motorized chassis as well as other related manufactured products. The Towable segment includes all products which are not motorized and are generally towed by another vehicle. The Motorized segment includes all productsA new corporate allocation policy was adopted in the fourth quarter of Fiscal 2018, which removed certain corporate administration expenses and non-operating income and expense that include a motorized chassis as well as other related manufactured products. All prior period amounts relatedwere previously allocated to the segment change have been retrospectively reclassified to conform to the new presentation.operating segments and recorded them in a Corporate / All Other category. See Note 3, Business Segments.
Principles of Consolidation
The consolidated financial statements for Fiscal 20172018 include the parent company and our wholly-owned subsidiaries. All intercompany balances and transactions with our subsidiaries have been eliminated.
Fiscal Period
We follow a 52-/53-week fiscal year, ending the last Saturday in August. The financial statements presented are all 52-week fiscal periods.
Use of Estimates
The preparation of financial statements in conformity with accounting principles generally accepted in the USU.S. ("GAAP") requires management to make estimates and assumptions that affect the reported amounts of assets and liabilities and disclosure of contingent assets and liabilities at the date of the financial statements and the reported amounts of revenues and expenses during the reporting periods. Actual results could differ from those estimates.
Cash and Cash Equivalents
Cash and cash equivalents consist primarily of highly liquid investments with an original maturity of three months or less. The carrying amount approximates fair value due to the short maturity of the investments.
Fair Value Disclosures of Financial Instruments
All financial instruments are carried at amounts believed to approximate fair value.
Derivative Instruments and Hedging Activities
We use derivative instruments to hedge our floating interest rate exposure. Derivative instruments are accounted for at fair value in accordance with ASCAccounting Standards Codification ("ASC") Topic 815, Derivatives and HedgingHedging.. We have designated these derivatives as cash flow hedges for accounting purposes. Changes in fair value, for the effective portion of qualifying hedges, are recorded in OCI.other comprehensive income. We review the effectiveness of our hedging instruments on a quarterly basis, recognize current period hedge ineffectiveness immediately in earnings, and discontinue hedge accounting for any hedge that we no longer consider to be highly effective.
AllowanceReceivables
Receivables consist principally of amounts due from our dealer network for Doubtful AccountsRVs and boats sold.
The allowance
We establish allowances for doubtful accounts is based on historical loss experience and any specific customer collection issues identified. Additional amounts are provided through charges to income as we believe necessary after evaluation of receivables and current economic conditions. Amounts which are considered to be uncollectible are written off, and recoveries of amounts previously written off are credited to the allowance upon recovery.
Inventories
Substantially, all
Generally, inventories are stated at the lower of cost or market, determined onvalued using the LIFOFirst-in, First-out basis ("FIFO"), except for our Motorhome segment which is valued using the Last-in, First-out ("LIFO") basis. Manufacturing cost includes materials, labor, and manufacturing overhead. Unallocated overhead and abnormal costs are expensed as incurred.
Property and Equipment
Depreciation of property and equipment is computed using the straight‑line method on the cost of the assets, less allowance for salvage value where appropriate, at rates based upon their estimated service lives as follows:
|
| |
| Asset Class | Asset Life |
| Buildings | 10-308-45 years |
| Machinery and equipment | 3-151-15 years |
| Software | 3-101-10 years |
| Transportation equipment | 4-63-6 years |
We review our long-lived depreciable assets for impairment annually or whenever events or changes in circumstances indicate that the carrying value of an asset may not be recoverable from future cash flows. If the carrying value of a long-lived asset is impaired, an impairment charge is recorded for the amount by which the carrying value of the long-lived asset exceeds its fair value. We assess the potential impairment of long-lived assets in accordance with ASC 360 Property, Plant and Equipment. We also reviewed all other long-lived depreciable assets for impairment, noting no impairment.
Goodwill and Indefinite-Lived Intangible Asset
Goodwill
Goodwill is tested annually in the fourth quarter of each year, and is tested for impairment between annual tests if an event occurs or circumstances change that would indicate the carrying amounts may be impaired. Impairment testing for goodwill is done at a reporting unit level and all goodwill is assigned to a reporting unit. Our reporting units are the same as our operating segments and one level below the reporting segment level.as defined in Note 3, Business Segments.
Companies have the option to first assess qualitative factors to determine whether the fair value of a reporting unit is not “more likely than not” less than its carrying amount. If it is more likely than not that an impairment has occurred, companies then perform the quantitative goodwill impairment test. If we perform the quantitative test, we compare the carrying value of the reporting unit to an estimate of the reporting unit’s fair value to identify impairment. The estimate of the reporting unit’s fair value is determined by weighting a discounted cash flow model and a market-related model using current industry information that involve significant unobservable inputs (Level 3 inputs). In determining the estimated future cash flow, we consider and apply certain estimates and judgments, including current and projected future levels of income based on management’s plans, business trends, prospects, and market and economic conditions, and market-participant considerations. If we fail the quantitative assessment of goodwill impairment, pursuant to our adoption of FASB ASU No. 2017–04 in Fiscal 2017, we would be required to recognize an impairment loss equal to the amount that a reporting unit's carrying value exceeded its fair value.
As of August 26, 2017, we had anTrade name
We have indefinite-lived intangible assetassets for the trade name of $148 millionnames related to the Grand Design acquisition.within our Towable segment and to Chris-Craft within our Corporate / All Other category. Annually in the fourth quarter, or if conditions indicate an interim review is necessary, we assess qualitative factors to determine if it is more likely than not that the fair value of an indefinite-lived intangible asset is less than its carrying amount.
If we perform a quantitative test, projections regarding estimated discounted future cash flows and other factors are madewe use the relief from royalty method to determine if impairment has occurred. Thesethe fair value of the trade name. This method uses assumptions, which require significant judgment and actual results may differ from assumed and estimated amounts. If we conclude that there has been impairment, we will write down the carrying value of the asset to its fair value.
During the fourth quarter of Fiscal 2017,2018, we completed our annual impairment tests. We elected not to rely on the qualitative assessment as of the testing date and rather performed the quantitative analysis. We elected to perform this analysis because Grand Design was acquired during Fiscal 2017 and the analysis resulted in setting foundational assumptions to be used to evaluate goodwill and the indefinite-lived trade name asset in the future. The result of the test was that the fair value far exceeded the carrying value, of the reporting unit and no impairment was indicated.
OtherDefinite-Lived Intangible Assets and Long-Lived Assets
Long-lived assets, which include property, plant and equipment, and definite-lived intangible assets, primarily the dealer network, are assessed for impairment whenever events or changes in circumstances indicate the carrying amount of the asset may not be recoverable.recoverable from future cash flows. The impairment test involves comparing the carrying amount of the asset to the forecasted undiscounted future cash flows generated by that asset. These assumptions require significant judgment and actual results may differ from assumed and estimated amounts. In the event the carrying amount of the asset exceeds the undiscounted future cash flows generated by that asset and the carrying amount is not considered recoverable, an impairment exists. An impairment loss is measured as the excess of the asset’s carrying amount over its fair value and is recognized in the statement of income in the period that the impairment occurs. The dealer network is amortized over its estimated useful life of 12 years. The reasonableness of the useful lives of this asset and other long-lived assets is regularly evaluated.
There was no impairment loss for the period ended August 26, 201725, 2018 for goodwill, indefinite- or definite-lived intangible assets or long-lived assets.
Debt Issuance Costs
We amortize debt issuance costs on a straight-line basis (which is not materially different from an effective interest method) over the term of the associated debt agreement. If early principal payments are made on the Term Loan, a proportional amount of theSelf-Insurance
unamortized issuance costs will be expensed. As of August 26, 2017, we incurred $0.8 million of costs related to our revolving Credit Agreement that are being amortized on a straight-line basis over the five year term of the agreement. We also incurred $10.2 million of costs as of August 26, 2017 related to the Term Loan that are being amortized on a straight-line basis over the seven year term of the agreement.
Self-Insurance
Generally, we self-insure for a portion of product liability claims and workers' compensation. Under these plans, liabilities are recognized for claims incurred, including those incurred but not reported. We determined the liability for product liability and workers' compensation claims with the assistance of a third party administrator and actuary using various state statutes and historical claims experience. We have a $50.0 million insurance policy that includes an SIRa self-insured retention for product liability of $2.5$2.5 million per occurrence and $6.0$6.0 million in aggregate per policy year. We maintain excess liability insurance with outside insurance carriers to minimize our risks related to catastrophic claims in excess of our self-insured positions for product liability and personal injury matters. Any material change in the aforementioned factors could have an adverse impact on our operating results. Our product liability and workers' compensation accrual is included within accrued self-insurance on our balance sheet.
Income Taxes
In preparing our financial statements, we are required to estimate our income taxes in each of the jurisdictions in which we operate. This process involves estimating our current tax exposure together with assessing temporary differences resulting from differing treatment of items for tax and accounting purposes. These temporary differences result in deferred tax assets and liabilities, which are included within our balance sheet. We then assess the likelihood that our deferred tax assets will be realized based on future taxable income and, to the extent we believe that recovery is not likely, we establish a valuation allowance. To the extent we establish a valuation allowance or change this allowance in a period, we include an expense or a benefit within the tax provision in our Consolidated Statements of Income and Comprehensive Income.
Legal
Our accounting policy regarding litigation
Litigation expense, including estimated defense costs, is to accrue forrecorded when probable and reasonably estimable exposure including estimated defense costs.estimable.
Revenue Recognition
Generally, revenues
Revenue is primarily earned through the sale of manufactured RVs and boats. Revenue for our RVsthese units is recognized when contract terms are recorded whenmet, collectability is reasonably assured, and the following conditions are met:
an order for a productunit is shipped or risk of ownership has been received from a dealer
written or verbal approval for payment has been received from the dealer's floorplan financing institution (if applicable)
an independent transportation company hastransferred to and accepted responsibility for the product as agent for the dealer; and
the product is removed from our property for delivery to the dealer by the agent.
Our shipping termsdealer. Provisions are FOB shipping point. Products are not soldmade for discounts and sales allowances based on consignment, dealersmanagement’s best estimate and the historical experience of each unit type. Dealers do not have the right to return products,units, and dealersunits are typically responsible for interest costsnot sold on consignment.
Revenue from the sale of parts is recognized when title to floor plan lenders.the product and the risk of loss is transferred to the customer, which is generally upon shipment. Revenue from services is recognized as earned when services are rendered.
Delivery Revenues and Expenses
Delivery revenues for products delivered are included within net sales, while delivery expenses are included within cost of goods sold.
Concentration of Risk
One of our dealer organizations accounted for 9.8%, 10.0%, 13.0% and 15.0%13.0% of our net revenue for Fiscal 2018, 2017,, Fiscal 2016, and Fiscal 2015,2016, respectively. A second dealer organization accounted for 9.9%9.0%, 16.6%9.9%, and 17.9%16.6% of our consolidated net revenue in Fiscal 2018, 2017,, 2016 and 2015,2016, respectively. These dealers declined on a relative basis due to the growth of other dealers and due to the addition of Grand Design revenue in Fiscal 2017.
Sales Promotions and Incentives
We accrue for sales promotions and incentive expenses, which are recognized as a reduction toincluded in net revenues, at the time of sale to the dealer or when the sales incentive is offered to the dealer or retail customer. Examples of sales promotions and incentive programs include dealer and consumer rebates, volume discounts, retail financing programs, and dealer sales associate incentives. Sales promotion and incentive expenses are estimated based upon then current program parameters at the time of the sales, such as unit or retail volume and historical rates. Actual results may differ from these estimates if market conditions dictate the need to enhance or reduce sales promotion and incentive programs or if the retail customer usage rate varies from historical trends. Historically, sales promotion and incentive expenses have been within our expectations and differences have not been material.
Repurchase Commitments
It is customary practice for manufacturers in the RV industry to enter into repurchase agreements with financing institutions that provide financing to their dealers. Our repurchase agreements generally provide that, in the event of a default by a dealer in its obligation to these lenders, we will repurchase vehicles sold to the dealer that have not been resold to retail customers. The terms of these agreements, which can last up to 18 months, provide that our liability will be the lesser of remaining principal owed by the dealer or dealer invoice less periodic reductions based on the time since the date of the original invoice. Our liability cannot exceed 100% of the dealer invoice. In certain instances, we also repurchase inventory from our dealers due to state law or regulatory requirements that govern voluntary or involuntary relationship terminations.
Based on these repurchase agreements and our historical loss experience, we establish an associated loss reserve which is included in "Accrued expenses - Other" on the consolidated balance sheets. Repurchased sales are not recorded as a revenue transaction, but the net difference between the original repurchase price and the resale price are recorded against the loss reserve, which is a deduction from gross revenue. Our loss reserve for repurchase commitments contains uncertainties because the calculation requires management to make assumptions and apply judgment regarding a number of factors. See Note 10.
Reporting Segment
We have two reportable segments: (1) Motorized products and services and (2) Towable products and services. The Towable segment includes all products which are not motorized and are generally towed by another vehicle. The Motorized segment includes all products that include a motorized chassis as well as other related manufactured products. See Note 3.
Advertising
Advertising costs, which consist primarily of literature and trade shows, were $5.7$7.4 million,, $4.9 $5.7 million,, and $5.5$4.9 million in Fiscal 2018, 2017,, 2016 and 2015,2016, respectively. Advertising costs are included in selling expense and are expensed as incurred with the exception of trade shows which are expensed in the period in which the show occurs.incurred.
Earnings Per Common Share
Basic income per common share is computed by dividing net income by the weighted average common shares outstanding during the period.
Diluted income per common share is computed by dividing net income by the weighted average common shares outstanding plus the incremental shares that would have been outstanding upon the assumed exercise of dilutive stock awards and options. See Note 13.
Subsequent Events
We evaluated events occurring between the end of our most recent fiscal year and the date the financial statements were issued. There were no material subsequent events, except those describedas noted in Note 16.9, Long-Term Debt, and Note 12, Stock-Based Compensation Plans, and the item described below.
Dividend
On August 15, 2018, our Board of Directors declared a quarterly cash dividend of $0.10 per share, totaling $3.2 million, paid on September 26, 2018 to common stockholders of record at the close of business on September 12, 2018.
Recently Adopted Accounting Pronouncements
In April 2015,February 2018, the FASBFinancial Accounting Standards Board ("FASB") issued ASU 2015-03,Accounting Standards Update ("ASU") 2018-02, Interest - ImputationIncome Statement—Reporting Comprehensive Income (Topic 220), which allows for a reclassification of Interest (Topic 835), which requires that debt issuance costs relatedstranded tax effects from the 2017 Tax Cuts and Jobs Act ("Tax Act") from accumulated other comprehensive income ("AOCI") to a recognized debt liability be presentedretained earnings. We early adopted this ASU in the balance sheet as a direct deduction from the carrying amount of that debt liability. We adopted the standard during the firstfourth quarter of Fiscal 2017 and, accordingly, have presented unamortized debt issuance costs as a direct reduction allocated between Current maturities of long-term debt and Long-term debt, less current maturities on the Consolidated Balance Sheet as of August 26, 2017.
In September 2015, the FASB issued ASU 2015-16, Business Combinations (Topic 805), to simplify the accounting for measurement-period adjustments in a business combination. Under the new standard, an acquirer must recognize adjustments to provisional amounts in a business combination2018, which resulted in the reporting period in which the adjustment amounts are determined, rather than retrospectively adjusting the provisional amounts recognized at the acquisition date with a corresponding adjustmentreclassification of $0.1 million from AOCI to goodwill as under current guidance. We adopted this standard on August 28, 2016 and have accounted for all adjustments to provisional amounts in accordance with this guidance.retained earnings.
In January 2017, the FASB issued ASU 2017-04,2017-01, SimplifyingBusiness Combinations (Topic 805): Clarifying the Test for Goodwill Impairment (Topic 350)Definition of a Business, which eliminatesadds guidance for the requirement to calculate the implied fair valuedetermination of goodwill to measurewhether a goodwill impairment change.transaction should be accounted for as an acquisition of assets or a business. ASU 2017-042017-01 is effective prospectively for fiscal years and thebeginning after December 15, 2017 (our Fiscal 2019), including interim periods within those annual reporting periods. We adopted ASU 2017-01 in the fourth quarter of Fiscal 2018 for the acquisition of Chris-Craft, which is further discussed in Note 2, Business Combinations.
In March 2016, the FASB issued ASU 2016-09, Improvements to Employee Share-Based Payment Accounting (Topic 718), which simplifies several aspects of the accounting for employee share-based payment transactions, including the accounting for the related income taxes, forfeitures, statutory tax withholding requirements and classification in the statement of cash flows. ASU 2016-09 is effective for annual reporting periods beginning after December 15, 2016 (our Fiscal 2018), including interim periods within those annual reporting periods. We adopted ASU 2016-09 in the interim quarterly reporting period ended November 25, 2017. Amendments requiring recognition of excess tax benefits and tax deficiencies in the statements of income and comprehensive income resulted in $0.5 million of excess tax benefits recorded as a reduction of income tax expense upon adoption for the year ended August 25, 2018. The reduction in income tax expense also reduced the effective tax rate by 0.4% and added $0.02 to income per share for the year ended August 25, 2018. Amendments related to the presentation of excess tax benefits and employee taxes paid when an employer withholds shares to meet the minimum statutory withholding requirement required no change to the statement of cash flows. As part of the adoption, we implemented a policy of accounting for forfeitures as they occur. The impact to our consolidated financial statements was not material.
In July 2015, the FASB issued ASU 2015-11, Inventory (Topic 330),which requires inventory measured using any method other than LIFO or the retail inventory method to be subsequently measured at the lower of cost or net realizable value, rather than at the lower of cost or market. Under ASU 2015-11, subsequent measurement of inventory using the LIFO and retail inventory method is unchanged. ASU 2015-11 is effective prospectively for fiscal years beginning after December 15, 20192016 (our Fiscal 2021).2018), including interim periods within those annual reporting periods. We early adopted this standard as ofASU 2015-11 on August 27, 2017, and the beginning of Fiscal 2017. There was no impact onto our consolidated financial statements as there was no impairment indicated.not material.
NewRecently Issued Accounting Pronouncements
In May 2014, the FASB issued ASU 2014-09, Revenue from Contracts with Customers (Topic 606), which establishes a comprehensive new model for the recognition of revenue from contracts with customers. This model is based on the core principle that revenue should be recognized to depict the transfer of promised goods or services to customers in an amount that reflects the consideration to which the entity expects to be entitled in exchange for those goods or services. Entities have the option of using either retrospective transition or a modified approach in applying the new standard. The standard is effective for fiscal years, and the interim periods within those years, beginning after December 15, 2017 (our Fiscal 2019). Early adoption is permitted.
We have performedwill adopt this standard in the first quarter of our Fiscal 2019 using the modified retrospective method. Under this method, we will recognize the cumulative effect of the changes in retained earnings at the date of adoption with no restatement of comparative periods. We currently estimate no cumulative effect adjustment at the date of adoption. In addition, we expect the impact of adoption to be immaterial to net earnings on an on-going basis.
Our evaluation which included a review of representative contracts with key customers and the performance obligations contained therein, as well as a review of our commercial terms and practices across each of our operating segments. Based on our preliminary review,these procedures, we do not expect adoption to have a materialdetermined the prospective impact but further work to substantiate this preliminary conclusion is underway. We will determine the transition method to apply and the implications of using either the full retrospective or modified retrospective approach after this additional work is concluded.
In July 2015, the FASB issued ASU 2015-11, Inventory (Topic 330),which requires inventory measured using any method other than last-in, first-out (“LIFO”) or the retail inventory methodexpected to be subsequently measured at the lower of cost or net realizable value, rather than at the lower of cost or market. Under this ASU, subsequent measurement of inventory using the LIFO and retail
inventory method is unchanged. ASU 2015-11 will become effective prospectively for fiscal years beginning after December 15, 2016 (our Fiscal 2018). We are currently evaluating the impact of adopting this ASU on our consolidated financial statements and do not expect adoption to have a material impact.immaterial.
In February 2016, the FASB issued ASU 2016-02, Leases (Topic 842), which requires an entity to recognize both assets and liabilities arising from financing and operating leases, along with additional qualitative and quantitative disclosures. The new
standard is effective retrospectively ormust be adopted on a modified retrospective basis to either each prior reporting period presented or as of the beginning of the period of adoption for fiscal years beginning after December 15, 2018 (our Fiscal 2020), including interim periods within those annual reporting periods. Early adoption is permitted. We are currently evaluating the impact of adopting this ASU on our consolidated financial statements.
In March 2016, the FASB issued ASU 2016-09, Improvements to Employee Share-Based Payment Accounting (Topic 718), which simplifies several aspects of the accounting for employee share-based payment transactions, including the accounting for the related income taxes, forfeitures, statutory tax withholding requirements and classification in the statement of cash flows. ASU 2016-09 is effective for annual reporting periods beginning after December 15, 2016 (our Fiscal 2018), including interim periods within those annual reporting periods. Early adoption is permitted. We will be adopting this standard in our forthcoming first quarter of our Fiscal 2018, and we do not expect adoption to have a material impact.
In August 2016, the FASB issued ASU 2016-15, Classification of Certain Cash Receipts and Cash Payments (Topic 230), which provides guidance for eight specific cash flow issues with the objective of reducing the existing diversity in practice. ASU 2016-15 is effective retrospectively for annual reporting periods beginning after December 15, 2017 (our Fiscal 2019), including interim periods within those annual reporting periods. Early adoption is permitted. We are currently evaluating the impact of adopting this ASU on our consolidated financial statements and do not expect adoption to have a material impact.
In August 2017, the FASB issued ASU 2017-12, Derivatives and Hedging (Topic 815), which improves the financial reporting of hedging relationships to better portray the economic results of an entity's risk management activities in its financial statements. ASU 2017-12 is effective for annual reporting periods beginning after December 15, 2018 (our Fiscal 2020), including interim periods within those annual reporting periods. Early adoption is permitted. We are currently evaluating the impact of adopting this ASU on our consolidated financial statements.
Note 2: Business Combination, GoodwillCombinations
Chris-Craft USA, Inc.
On June 4, 2018, we acquired 100% of the ownership interest of Chris-Craft USA, Inc. ("Chris-Craft"). The acquisition diversifies our outdoor lifestyle value proposition into the recreational powerboat industry. The assets, liabilities and operating results have been included in our financial statements from the date of acquisition within the Corporate / All Other Intangible Assetscategory. Pro forma results of operations for this acquisition have not been presented, as it was immaterial to the reported results.
Grand Design RV, LLC
WeOn November 8, 2016, we acquired 100% of the ownership interests of Grand Design on November 8, 2016RV, LLC ("Grand Design") in accordance with the Securities Purchase Agreement for an aggregate purchase price of $520.5 million, which was paid in cash and Winnebago shares as follows: | | | (In thousands, except shares) | | November 8,
2016 | November 8, 2016 |
| Cash | | $ | 396,442 |
| $ | 396,442 |
|
| Winnebago shares: 4,586,555 at $27.05 per share | | 124,066 |
| 124,066 |
|
| Total | | $ | 520,508 |
| $ | 520,508 |
|
The cash portion was funded from cash on hand and borrowings under our ABL and Term Loan agreements.debt agreements discussed in Note 9, Long-Term Debt. The stock was valued using our share price on the date of closing.
The acquisition has been accounted for in accordance with ASC 805, Business Combinations, using the acquisition method of accounting. Under the acquisition method of accounting, the total purchase price was allocated to the net tangible and intangible assets of Grand Design acquired, based on their fair values at the date of the acquisition. We believe that the information provides a reasonable basis for estimating the fair values, but we are waiting for additional information necessary to finalize the amounts related to income taxes. Thus, the preliminary measurements of fair value reflected are subject to change. We expect to finalize the valuation and complete theThe purchase price allocation was finalized during the first quarter of Fiscal 2018 and no later than one year from the acquisition date. 2018.
The currentfinal allocation of the purchase price to assets acquired and liabilities assumed is as follows:
| | | (In thousands) | | November 8,
2016 | November 8, 2016 |
| Cash | | $ | 1,748 |
| $ | 1,748 |
|
| Accounts receivable | | 32,834 |
| 32,834 |
|
| Inventories | | 15,300 |
| 15,300 |
|
| Prepaid expenses and other assets | | 3,788 |
| 3,037 |
|
| Property, plant and equipment | | 8,998 |
| |
| Property, plant, and equipment | | 8,998 |
|
| Goodwill | | 241,499 |
| 243,456 |
|
| Other intangible assets | | 253,100 |
| 253,100 |
|
| Total assets acquired | | 557,267 |
| 558,473 |
|
| | | | |
| Accounts payable | | 11,163 |
| 11,163 |
|
| Accrued compensation | | 3,615 |
| 3,615 |
|
| Product warranties | | 12,904 |
| 12,904 |
|
| Promotional | | 3,976 |
| 3,976 |
|
| Other | | 290 |
| 1,496 |
|
| Deferred tax liabilities | | 4,811 |
| 4,811 |
|
| Total liabilities assumed | | 36,759 |
| 37,965 |
|
| | | | |
| Total purchase price | | $ | 520,508 |
| $ | 520,508 |
|
The acquisition of 100% of the ownership interests of Grand Design occurred in two steps: (1) direct purchase of 89.34% of Grand Design member interests and (2) simultaneous acquisition of the remaining 10.66% of Grand Design member interests via the purchase of 100% of the shares of SP GE VIII-B GD RV Blocker Corp. (Blocker Corp)("Blocker Corporation"), which held the remaining 10.66% of the Grand Design member interests. We agreed to acquire Blocker CorpCorporation as part of the Securities Purchase Agreement, and we did not receive a step-up in basis for 10.66% of the Grand Design assets. As a result, we established acertain deferred tax liability of $8.5 millionliabilities on the opening balance sheet that relatesrelate to intangibles that will not be amortizable for tax purposes.Blocker Corporation. As of August 25, 2018, Blocker Corporation was dissolved.
The goodwill recognized is primarily attributable to the value of the workforce, reputation of founders, customer and dealer growth opportunities, and expected synergies. Key areas of cost synergies include increased purchasing power for raw materials and supply chain consolidation. Goodwill is expected to be mostly deductible for tax purposes. The goodwill resulting from the acquisition of Grand Design increased total goodwill to $242.7 million within the Towable segment asAs of August 26, 2017 from $1.225, 2018, goodwill increased $2.0 million as compared to the end of August 27, 2016.Fiscal 2017. The increase is due to the final purchase price adjustment made for taxes in the first quarter of Fiscal 2018.
The allocation of the purchase price to the net assets acquired and liabilities assumed resulted in the recognition of intangible assets with fair value on the closing date of November 8, 2016 and amortization accumulated from the closing date through August 27, 2016 as follows:
|
| | | | | | | | | | |
| (In thousands) | | Weighted Average Life- Years | | Fair Value Amount | | Accumulated Amortization |
| Trade name | | Indefinite | | $ | 148,000 |
| | $ | — |
|
| Dealer network | | 12.0 | | 80,500 |
| | 5,348 |
|
| Backlog | | 0.5 | | 18,000 |
| | 18,000 |
|
| Non-compete agreements | | 4.0 | | 4,600 |
| | 1,116 |
|
| Leasehold interest-favorable | | 8.1 | | 2,000 |
| | 196 |
|
| Total | | | | 253,100 |
| | $ | 24,660 |
|
| Accumulated amortization | | | | (24,660 | ) | | |
| Net book value of intangible assets | | | | $ | 228,440 |
| | |
assets. We used the income approach to value certain intangible assets. Under the income approach, an intangible asset’s fair value is equal to the present value of future economic benefits to be derived from ownership of the asset. We used the income approach known as the relief from royalty method to value the trade name. The relief from royalty method is based on the hypothetical royalty stream that would be received if we were to license the trade name and is based on expected revenues from such license. The fair value of the dealer network was estimated using an income approach known as the cost to recreate/cost savings method. This method uses the replacement of the asset as an indicator of the fair value of the asset. The useful life of the intangible assets was determined considering the period of expected cash flows used to measure the fair value of the intangible assets adjusted as appropriate for the entity-specific factors including legal, regulatory, contractual, competitive, economic, or other factors that may limit the useful life of the intangible assets.
For Fiscal 2017 and 2016, amortization of intangible assets charged to operations was $24.7 million and $0, respectively. The weighted average remaining amortization period for intangible assets as of August 26, 2017 was approximately 11.0 years. Remaining estimated aggregate annual amortization expense by fiscal year is as follows: |
| | | | |
| (In thousands) | | Amount |
| 2018 | | $ | 7,854 |
|
| 2019 | | 7,733 |
|
| 2020 | | 7,733 |
|
| 2021 | | 7,733 |
|
| 2022 | | 7,106 |
|
| Thereafter | | 42,281 |
|
Within the Towable segment, the results of Grand Design's operations have been included in our consolidated financial statements from the close of the acquisition. The following table provides net revenues and operating income (which includes amortization expense)expense and our allocation changes described in Note 3, Business Segments) from the Grand Design business included in our consolidated results during the fiscal yearyears ended August 25, 2018 and August 26, 2017 following the November 8, 2016 closing date:
| | | | | Year Ended | Year Ended |
| (In thousands) | | August 26, 2017 | August 25, 2018 |
| | August 26, 2017 |
| Net revenues | | $ | 559,664 |
| $ | 969,362 |
| | $ | 559,664 |
|
| Operating income | | 56,475 |
| 129,123 |
| | 54,188 |
|
Unaudited pro forma information has been prepared as if the acquisition had taken place on August 30, 2015. The unaudited pro forma information is not necessarily indicative of the results that we would have achieved had the transaction actually taken place on August 30, 2015, and the unaudited pro forma information does not purport to be indicative of future financial operating results. The unaudited pro forma condensed consolidated financial information does not reflect any operating efficiencies and cost savings that may be realized from the integration of the acquisition. Unaudited pro forma information is as follows:
| | | | | Year Ended | Year Ended |
| (In thousands, except per share data) | | August 26,
2017 | | August 27,
2016 | August 25, 2018 | | August 26, 2017(1) | | August 27, 2016 |
| Net revenues | | $ | 1,642,786 |
| | $ | 1,402,897 |
| $ | 2,016,829 |
| | $ | 1,642,786 |
| | $ | 1,402,897 |
|
| Net income | | 91,163 |
| | 48,357 |
| 102,465 |
| | 91,163 |
| | 48,357 |
|
| Income per share - basic | | 2.89 |
| | 1.53 |
| 3.24 |
| | 2.89 |
| | 1.53 |
|
| Income per share - diluted | | 2.88 |
| | 1.53 |
| 3.22 |
| | 2.88 |
| | 1.53 |
|
| |
| (1) | Net income and income per share include the increased benefit of $16.3 million, net of tax, associated with the termination of the postretirement health care plan in Fiscal 2017. |
The unaudited pro forma data above includes the following significant non-recurring adjustments made to account for certain costs which would have changed if the acquisition of Grand Design had been completed on August 30, 2015:
| | | | | Year Ended | Year Ended |
| (In thousands) | | August 26,
2017 | | August 27,
2016 | August 25, 2018 | | August 26, 2017 | | August 27, 2016 |
Amortization of intangibles (1 year or less useful life) | | $ | (18,751 | ) | | $ | 18,871 |
| $ | (122 | ) | | $ | (18,751 | ) | | $ | 18,871 |
|
Increase in amortization of intangibles | | 1,551 |
| | 7,733 |
| — |
| | 1,551 |
| | 7,733 |
|
Expenses related to business combination (transaction costs) (1)(2) | | (6,649 | ) | | 6,649 |
| (50 | ) | | (6,649 | ) | | 6,649 |
|
Interest to reflect new debt structure | | 3,672 |
| | 19,622 |
| — |
| | 3,672 |
| | 19,622 |
|
| Taxes related to the adjustments to the pro forma data and to the income of Grand Design | | 11,648 |
| | 1,680 |
| 64 |
| | 11,648 |
| | 1,680 |
|
(1) Pro forma transaction costs include $0.1 million incurred by Grand Design prior | |
| (1) | Refer to Note 7, Goodwill and Intangible Assets, for additional information on the intangible assets recorded as a result of the acquisition. |
| |
| (2) | Pro forma transaction costs include $0.1 million incurred by Grand Design prior to the acquisition. |
| |
| (3) | Refer to Note 9, Long-Term Debt, for additional information on the new debt structure as a result of the acquisition. |
We incurred approximately $6.9$7.0 million of acquisition-related costs to date, of which $0.1 million, $6.6 million, and $0.3 million was expensed during Fiscal 2018, Fiscal 2017, and $0.3 million was expensedFiscal 2016, respectively.
Share Registration
As a result of the acquisition of Grand Design, we agreed to register the 4,586,555 shares of common stock issued to the sellers pursuant to the terms of a registration rights agreement. Under the registration rights agreement, we filed a shelf registration statement on January 20, 2017 to register these shares for resale. On April 11, 2017, pursuant to an underwriting agreement dated as of April 5, 2017, by and among the Company, certain of the sellers, and Morgan Stanley & Co., LLC, the sellers sold 2,293,277 shares of common stock in Fiscal 2016.an underwritten block trade.
Note 3: Business Segments
We report segment information based on
Beginning in the "management" approach defined in ASC 280, Segment Reporting. The management approach designates the internal reporting used by management for making decisions and assessing performance as the source of our reportable segments.
In the firstfourth quarter of Fiscal 2017,2018, we have revised our reporting segments. Previously we had one reporting segment which included all recreational vehicle productspresentation and services. With the acquisition ofnow have five operating segments: 1) Winnebago motorhomes, 2) Winnebago towables, 3) Grand Design in the first quartertowables, 4) Winnebago specialty vehicles, and 5) Chris-Craft marine. We evaluate performance based on each operating segment's Adjusted EBITDA, as defined below, which excludes certain corporate administration expenses and non-operating income and expense.
Our two reportable segments include: 1) Motorhome (comprised of Fiscal 2017, we expanded the number of reporting segments to two: (1) Motorized products and services and (2) Towable products and services. The Towable segment includes all products which are not motorized and are generally towed by another vehicle. The Motorized segment includes all products that include a motorized chassis as well as other related manufactured products. products and services) and 2) Towable (comprised of products which are not motorized and are generally towed by another vehicle as well as other related manufactured products and services), which is an aggregation of the Winnebago towables and Grand Design towables operating segments.
The Corporate / All Other category includes the Winnebago specialty vehicles and Chris-Craft marine operating segments as well as expenses related to certain corporate administration expenses for the oversight of the enterprise. These expenses include items such as corporate leadership and administration costs. Previously, these expenses were allocated to each operating segment.
Identifiable assets of the reportable segments exclude general corporate assets, which principally consist of cash and cash equivalents and certain deferred tax balances. The general corporate assets are included in the Corporate / All Other category.
Prior year segment information has been restatedreclassified to conform to the current reportingreportable segment presentation. The reclassifications included removing the corporate administration expenses from both the Motorhome and Towable reportable
We organize our business reporting on a product basis. Eachsegments and removing Winnebago specialty vehicles from the Motorhome reportable segment, as we begin to dedicate leadership and focus on these operations separately from our Winnebago motorhomes operations.
Our chief operating decision maker ("CODM") is managed separatelyour Chief Executive Officer. Our CODM relies on internal management reporting that analyzes consolidated results to better align to our customers, distribution partnersthe net earnings level and operating segment's Adjusted EBITDA. Our CODM has ultimate responsibility for enterprise decisions. Our CODM determines, in particular, resource allocation for, and monitors the performance of, the consolidated enterprise, the Motorhome segment, and the unique market dynamics of the product groups.Towable segment. The Motorhome segment management and Towable segment management have responsibility for operating decisions, allocating resources, and assessing performance within their respective segments. The accounting policies of both reportable segments are the same and are described in Note 1, "SummarySummary of Significant Accounting Policies"Policies.
We evaluate the performance of our reportable segments based on Adjusted EBITDA. EBITDA is defined as net income before interest expense, provision for income taxes, and depreciation and amortization expense. Adjusted EBITDA is defined as earningsnet income before interest expense, provision for income taxes, depreciation and amortization expense, and other adjustments made in order to present comparable results from period to period. Examples of items excluded from Adjusted EBITDA include the postretirement health care benefit income resulting from terminating the plan amendments over the past several years, favorable legal settlements including our Fiscal 2016 Australia trademark settlement, and transaction costs related to acquisitions. These types of adjustments are also specified in the definition of certain measures required under the terms of our pending acquisition of Grand Design RV.Credit Agreement.
The following table shows information by reportingreportable segment for Fiscal 2018, 2017, Fiscal 2016 and Fiscal 2015:2016:
| | | | Year Ended | Year Ended |
| (In thousands) | August 26,
2017 | | August 27,
2016 | | August 29,
2015 | August 25, 2018 | | August 26, 2017 | | August 27, 2016 |
| Net revenues | | | | | | | | | | |
| Motorized | $ | 861,922 |
| | $ | 885,814 |
| | $ | 904,821 |
| |
| Motorhome | | $ | 860,675 |
| | $ | 853,360 |
| | $ | 881,363 |
|
| Towable | 685,197 |
| | 89,412 |
| | 71,684 |
| 1,127,723 |
| | 685,197 |
| | 89,412 |
|
| Corporate / All Other | | 28,431 |
| | 8,562 |
| | 4,451 |
|
| Consolidated | $ | 1,547,119 |
| | $ | 975,226 |
| | $ | 976,505 |
| $ | 2,016,829 |
| | $ | 1,547,119 |
| | $ | 975,226 |
|
| | | | | | | | | | | |
| Adjusted EBITDA | | | | | | | | | | |
| Motorized | $ | 43,948 |
| | $ | 57,365 |
| | $ | 57,102 |
| |
| Motorhome | | $ | 35,508 |
| | $ | 56,518 |
| | $ | 66,127 |
|
| Towable | 94,929 |
| | 4,952 |
| | 2,767 |
| 157,010 |
| | 89,734 |
| | 1,721 |
|
| Corporate / All Other | | (10,772 | ) | | (7,375 | ) | | (5,531 | ) |
| Consolidated | $ | 138,877 |
| | $ | 62,317 |
| | $ | 59,869 |
| $ | 181,746 |
| | $ | 138,877 |
| | $ | 62,317 |
|
| | | | | | | | | | | |
| Capital Expenditures | | | | | | |
| Motorized | $ | 9,587 |
| | $ | 23,920 |
| | $ | 10,923 |
| |
| Capital expenditures | | | | | | |
| Motorhome | | $ | 9,302 |
| | $ | 9,563 |
| | $ | 23,909 |
|
| Towable | 4,406 |
| | 631 |
| | 5,650 |
| 18,460 |
| | 4,406 |
| | 631 |
|
| Corporate / All Other | | 906 |
| | 24 |
| | 11 |
|
| Consolidated | $ | 13,993 |
| | $ | 24,551 |
| | $ | 16,573 |
| $ | 28,668 |
| | $ | 13,993 |
| | $ | 24,551 |
|
| | | | Year Ended | Year Ended |
| (In thousands) | August 26,
2017 | | August 27,
2016 | August 25, 2018 | | August 26, 2017 |
| Total Assets | | | | |
| Motorized | $ | 333,600 |
| | $ | 368,941 |
| |
| Total assets | | | | |
| Motorhome | | $ | 322,048 |
| | $ | 277,015 |
|
| Towable | 568,912 |
| | 21,777 |
| 626,588 |
| | 576,262 |
|
| Corporate / All Other | | 103,169 |
| | 49,235 |
|
| Consolidated | $ | 902,512 |
| | $ | 390,718 |
| $ | 1,051,805 |
| | $ | 902,512 |
|
Reconciliation ofThe following table reconciles net income to consolidated Adjusted EBITDA:EBITDA for Fiscal 2018, 2017, and 2016:
| | | | Year Ended | Year Ended |
| (In thousands) | August 26,
2017 | | August 27,
2016 | | August 29,
2015 | August 25, 2018 | | August 26, 2017 | | August 27, 2016 |
| Net income | $ | 71,330 |
| | $ | 45,496 |
| | $ | 41,210 |
| $ | 102,357 |
| | $ | 71,330 |
| | $ | 45,496 |
|
| Interest expense | 16,837 |
| | — |
| | 10 |
| 18,246 |
| | 16,837 |
| | — |
|
| Provision for income taxes | 37,269 |
| | 20,702 |
| | 18,324 |
| 40,283 |
| | 37,269 |
| | 20,702 |
|
| Depreciation | 7,315 |
| | 5,745 |
| | 4,513 |
| 9,849 |
| | 7,315 |
| | 5,745 |
|
| Amortization | 24,660 |
| | — |
| | — |
| 9,328 |
| | 24,660 |
| | — |
|
| EBITDA | 157,411 |
| | 71,943 |
| | 64,057 |
| 180,063 |
| | 157,411 |
| | 71,943 |
|
| Postretirement health care benefit income | (24,796 | ) | | (6,124 | ) | | (4,073 | ) | — |
| | (24,796 | ) | | (6,124 | ) |
| Legal settlement | — |
| | (3,400 | ) | | — |
| — |
| | — |
| | (3,400 | ) |
| Transaction costs | 6,592 |
| | 355 |
| | — |
| 2,177 |
| | 6,592 |
| | 355 |
|
| Non-operating income | (330 | ) | | (457 | ) | | (115 | ) | (494 | ) | | (330 | ) | | (457 | ) |
| Adjusted EBITDA | $ | 138,877 |
| | $ | 62,317 |
| | $ | 59,869 |
| $ | 181,746 |
| | $ | 138,877 |
| | $ | 62,317 |
|
NetThe following table reconciles net revenue by geographic area:area for Fiscal 2018, 2017, and 2016:
| | | | Year Ended | Year Ended |
| (In thousands) | August 26, 2017 | | August 27, 2016 | | August 29, 2015 | August 25, 2018 | | August 26, 2017 | | August 27, 2016 |
| United States | $ | 1,445,401 |
| 93.4 | % | | $ | 940,230 |
| 96.4 | % | | $ | 920,315 |
| 94.2 | % | $ | 1,860,613 |
| 92.3 | % | | $ | 1,445,401 |
| 93.4 | % | | $ | 940,230 |
| 96.4 | % |
| International | 101,718 |
| 6.6 | % | | 34,996 |
| 3.6 | % | | 56,190 |
| 5.8 | % | 156,216 |
| 7.7 | % | | 101,718 |
| 6.6 | % | | 34,996 |
| 3.6 | % |
| Total net revenues | $ | 1,547,119 |
| 100.0 | % | | $ | 975,226 |
| 100.0 | % | | $ | 976,505 |
| 100.0 | % | $ | 2,016,829 |
| 100.0 | % | | $ | 1,547,119 |
| 100.0 | % | | $ | 975,226 |
| 100.0 | % |
Note 4: Derivatives, Investments and Fair Value Measurements
Assets and Liabilities that are Measured at Fair Value on a Recurring Basis
We account for fair value measurements in accordance with ASC 820, Fair Value Measurements and Disclosures, which defines fair value, establishes a framework for measurement, and expands disclosure about fair value measurement. The fair value hierarchy requires the use of observable market data when available. In instances in which the inputs used to measure fair value fall into different levels of the fair value hierarchy, the fair value measurement has been determined based on the lowest level input that is significant to the fair value measurement in its entirety. Our assessment of the significance of a particular item to the fair value measurement in its entirety requires judgment, including the consideration of inputs specific to the asset or liability.
Fair value is defined as the price that would be received to sell an asset or paid to transfer a liability (an exit price) in the principal or most advantageous market for the asset or liability in an orderly transaction between market participants on the measurement date. The fair value hierarchy contains three levels as follows:
Level 1 - Unadjusted quoted prices that are available in active markets for the identical assets or liabilities at the measurement date.
Level 2 - Other observable inputs available at the measurement date, other than quoted prices included in Level 1, either directly or indirectly, including:
Quoted prices for similar assets or liabilities in active markets;
Quoted prices for identical or similar assets in nonactive markets;
Inputs other than quoted prices that are observable for the asset or liability; and
Inputs that are derived principally from or corroborated by other observable market data.
Level 3 - Unobservable inputs that cannot be corroborated by observable market data and reflect the use of significant management judgment. These values are generally determined using pricing models for which the assumptions utilize management’s estimates of market participant assumptions.
The following tables set forth by level within the fair value hierarchy our financial assets and liabilities that were accounted for at fair value on a recurring basis at August 25, 2018 and August 26, 2017 and August 27, 2016 according to the valuation techniques we used to determine their fair values: | | | | | Fair Value at August 26, 2017 | | Fair Value Measurements Using Inputs Considered As | Fair Value at August 25, 2018 | | Fair Value Measurements Using Inputs Considered As |
| (In thousands) | | | Level 1 | | Level 2 | | Level 3 | | Level 1 | | Level 2 | | Level 3 |
| Assets that fund deferred compensation: | | | | | | | | | | | | | | | |
| Domestic equity funds | | $ | 1,708 |
| | $ | 1,671 |
| | $ | 37 |
| | $ | — |
| $ | 1,143 |
| | $ | 1,114 |
| | $ | 29 |
| | $ | — |
|
| International equity funds | | 174 |
| | 157 |
| | 17 |
| | — |
| 139 |
| | 120 |
| | 19 |
| | — |
|
| Fixed income funds | | 259 |
| | 170 |
| | 89 |
| | — |
| 223 |
| | 132 |
| | 91 |
| | — |
|
| Interest rate swap contract | | (828 | ) | | — |
| | (828 | ) | | — |
| 1,959 |
| | — |
| | 1,959 |
| | — |
|
| Total assets (liabilities) at fair value | | $ | 1,313 |
| | $ | 1,998 |
| | $ | (685 | ) | | $ | — |
| |
| Total assets at fair value | | $ | 3,464 |
| | $ | 1,366 |
| | $ | 2,098 |
| | $ | — |
|
| | | | | Fair Value at August 27, 2016 | | Fair Value Measurements Using Inputs Considered As | Fair Value at August 26, 2017 | | Fair Value Measurements Using Inputs Considered As |
| (In thousands) | | | Level 1 | | Level 2 | | Level 3 | | Level 1 | | Level 2 | | Level 3 |
Cash equivalents (1) | | $ | 77,234 |
| | $ | 77,234 |
| | $ | — |
| | $ | — |
| |
| Assets that fund deferred compensation: | | | | | | | | | | | | | | | |
| Domestic equity funds | | 3,587 |
| | 3,515 |
| | 72 |
| | — |
| $ | 1,708 |
| | $ | 1,671 |
| | $ | 37 |
| | $ | — |
|
| International equity funds | | 258 |
| | 225 |
| | 33 |
| | — |
| 174 |
| | 157 |
| | 17 |
| | — |
|
| Fixed income funds | | 265 |
| | 206 |
| | 59 |
| | — |
| 259 |
| | 170 |
| | 89 |
| | — |
|
| Interest rate swap contract | | (828 | ) | | — |
| | (828 | ) | | — |
|
| Total assets (liabilities) at fair value | | $ | 81,344 |
| | $ | 81,180 |
| | $ | 164 |
| | $ | — |
| $ | 1,313 |
| | $ | 1,998 |
| | $ | (685 | ) | | $ | — |
|
| |
(1)
| Cash equivalent balances valued using Level 1 inputs include only those accounts that may fluctuate in value. Cash in disbursing accounts and on-demand accounts are not included above. |
The following methods and assumptions were used to estimate the fair value of each class of financial instrument:
Cash Equivalents
The carrying value of cash equivalents approximates fair value as original maturities are less than three months. Our cash equivalents are comprised of money market funds traded in an active market with no restrictions and are included in cash and cash equivalents on the accompanying consolidated balance sheets.
Assets that fund deferred compensation
Our assets that fund deferred compensation are marketable equity securities measured at fair value using quoted market prices and primarily consist of equity-based mutual funds. The majority ofThese securities are classified as Level 1 as they are traded in an active market for which closing stock prices are readily available. These securities fund the Executive Share Option Plan and the Executive Deferred Compensation Plan (see Note 9)10, Employee and Retiree Benefits). The proportion of the assets that will fund options which expire within a year are included in prepaid expenses and other current assets in the accompanying consolidated balance sheets. The remaining assets are classified as non-current and are included in other assets.
Interest Rate Swap Contract
Under the terms of our Credit Agreement (see Note 8)9, Long-Term Debt) we arewere previously required to hedge a portion of the floating interest rate exposure. In accordance with this requirement, on January 23, 2017, we entered into an interest swap contract, on January 23, 2017, which effectively fixed our interest rate on $200.0our Term Loan for a notional amount that reduces each December during the swap contract. As of August 25, 2018, we had $170.0 million of our Term Loan fixed at an interest rate of 5.32%. As of August 26, 2017, we had $200.0 million of our Term Loan fixed at an interest rate of 6.32%. The notional amount of the swap contract decreases to $170.0 million on December 8, 2017, $120.0 million on December 10, 2018, and $60.0 million on December 9, 2019. The swap contract expires on December 8, 2020.
The fair value of the interest rate swap based on a Level 2 valuation was an asset of $2.0 million as of August 25, 2018 and a liability of $0.8 million as of August 26, 2017. The fair value is classified as Level 2 as it is corroborated based on observable market data. This amountThe asset is included in other assets and the liability is included in other non-current liabilities andon the consolidated balance sheets. The change in value was predominately recorded to accumulated other comprehensive income on the consolidated balance sheetsheets since the interest rate swap has been designated for hedge accounting.
Assets and Liabilities that are measured at Fair Value on a Nonrecurring Basis
Our non-financial assets, which includes goodwill, intangible assets, and property, plant and equipment, are not required to be measured at fair value on a recurring basis. However, if certain triggering events occur, or if an annual impairment test is required, we must evaluate the non-financial asset for impairment. If an impairment did occur, the asset is required to be recorded at the estimated fair value. During Fiscal 2017, noNo impairments were recorded for non-financial assets.assets in Fiscal 2018, 2017, and 2016.
Fair Value of Financial Instruments
Our financial instruments, other than those presented in the disclosures above, include cash, receivables, accounts payable, other payables, and long-term debt. The fair values of cash, receivables, accounts payable, and other payables approximated carrying values because of the short-term nature of these instruments. If these instruments were measured at fair value in the financial
statements, they would be classified as Level 1 in the fair value hierarchy. See Note 9, Long-Term Debt, for information about the fair value of our debt as of August 26, 2017 approximates fair value as interest is at variable market rates.long-term debt.
Note 5: Inventories
Inventories consist of the following:
| | | (In thousands) | | August 26, 2017 | | August 27, 2016 | August 25, 2018 | | August 26, 2017 |
| Finished goods | | $ | 16,947 |
| | $ | 19,129 |
| $ | 26,513 |
| | $ | 16,947 |
|
| Work-in-process | | 60,818 |
| | 76,350 |
| 68,339 |
| | 60,818 |
|
| Raw materials | | 99,919 |
| | 60,740 |
| 139,039 |
| | 99,919 |
|
| Total | | 177,684 |
| | 156,219 |
| 233,891 |
| | 177,684 |
|
| LIFO reserve | | (35,419 | ) | | (33,697 | ) | (38,763 | ) | | (35,419 | ) |
| Total inventories | | $ | 142,265 |
| | $ | 122,522 |
| $ | 195,128 |
| | $ | 142,265 |
|
The above value of inventories, before reduction for the LIFO reserve, approximates replacement cost at the respective dates. Of the $177.7$233.9 million and $156.2$177.7 million of inventory at August 25, 2018 and August 26, 2017, respectively, $176.2 million and August 27, 2016, respectively, $149.8 million and $149.4$149.8 million is valued on a LIFO basis. The remaining inventories of $27.9$57.7 million and $6.8$27.9 million at August 26, 201725, 2018 and August 27, 2016,26, 2017, respectively, are valued on a FIFO basis.
Note 6: Property, Plant and Equipment
Property, plant and equipment is stated at cost, net of accumulated depreciation and consists of the following:
|
| | | | | | | | |
| (In thousands) | | August 26, 2017 | | August 27, 2016 |
| Land | | $ | 3,914 |
| | $ | 3,864 |
|
| Buildings and building improvements | | 73,831 |
| | 62,073 |
|
| Machinery and equipment | | 99,952 |
| | 95,087 |
|
| Software | | 17,844 |
| | 15,878 |
|
| Transportation | | 8,993 |
| | 8,956 |
|
| Total property, plant and equipment, gross | | 204,534 |
| | 185,858 |
|
| Less accumulated depreciation | | (132,974 | ) | | (129,927 | ) |
| Total property, plant and equipment, net | | $ | 71,560 |
| | $ | 55,931 |
|
As part of the Grand Design acquisition, in the first quarter of Fiscal 2017 we purchased land and buildings for approximately $9.0 million. See Note 2. |
| | | | | | | |
| (In thousands) | August 25, 2018 | | August 26, 2017 |
| Land | $ | 6,747 |
| | $ | 3,914 |
|
| Buildings and building improvements | 94,622 |
| | 73,831 |
|
| Machinery and equipment | 105,663 |
| | 99,952 |
|
| Software | 23,388 |
| | 17,844 |
|
| Transportation | 8,837 |
| | 8,993 |
|
| Total property, plant and equipment, gross | 239,257 |
| | 204,534 |
|
| Less accumulated depreciation | (138,064 | ) | | (132,974 | ) |
| Total property, plant and equipment, net | $ | 101,193 |
| | $ | 71,560 |
|
For Fiscal 2018, 2017, and 2016, depreciation charged to operations was $9.8 million, $7.3 million, and $5.7 million, respectively.
Note 7: WarrantyGoodwill and Intangible Assets
The changes in carrying amount of goodwill by segment were as follows in Fiscal 2018, 2017, and 2016, noting we have no accumulated impairment losses:
|
| | | | | | | | | | | |
| (In thousands) | Towable | | Corporate / All Other | | Total |
| Balances at August 29, 2015 | $ | 1,228 |
| | $ | — |
| | $ | 1,228 |
|
| Balances at August 27, 2016 | 1,228 |
| | — |
| | 1,228 |
|
Acquisition of Grand Design(1) | 241,500 |
| | — |
| | 241,500 |
|
| Balances at August 26, 2017 | 242,728 |
| | — |
| | 242,728 |
|
Grand Design purchase price adjustment(1) | 1,956 |
| | — |
| | 1,956 |
|
Acquisition of Chris-Craft(1) | — |
| | 29,686 |
| | 29,686 |
|
| Balances at August 25, 2018 | $ | 244,684 |
| | $ | 29,686 |
| | $ | 274,370 |
|
| |
| (1) | Refer to Note 2, Business Combinations, for additional information on the acquisitions of Grand Design and Chris-Craft. |
Intangible assets, net of accumulated amortization consists of the following:
|
| | | | | | | | | | | | | | | | | | | |
| | August 25, 2018 | | August 26, 2017 |
| (In thousands) | Weighted Average Life- Years | | Cost | | Accumulated Amortization | | Weighted
Average Life-
Years | | Cost | | Accumulated Amortization |
| Trade name | Indefinite | | $ | 177,250 |
| | | | Indefinite | | $ | 148,000 |
| | |
| Dealer network | 12.2 | | 95,581 |
| | $ | 12,328 |
| | 12.0 | | 80,500 |
| | $ | 5,348 |
|
| Backlog | 0.5 | | 19,527 |
| | 19,135 |
| | 0.5 | | 18,000 |
| | 18,000 |
|
| Non-compete agreements | 4.1 | | 5,347 |
| | 2,084 |
| | 4.0 | | 4,600 |
| | 1,116 |
|
| Leasehold interest-favorable | 8.1 | | 2,000 |
| | 441 |
| | 8.1 | | 2,000 |
| | 196 |
|
| Total intangible assets, gross | | | 299,705 |
| | $ | 33,988 |
| | | | 253,100 |
| | $ | 24,660 |
|
| Less accumulated amortization | | | 33,988 |
| | | | | | 24,660 |
| | |
| Total intangible assets, net | | | $ | 265,717 |
| | | | | | $ | 228,440 |
| | |
For Fiscal 2018 and 2017, amortization of intangible assets charged to operations was $9.3 million and $24.7 million, respectively. The weighted average remaining amortization period for intangible assets as of August 25, 2018 was approximately11.4 years.
Remaining estimated aggregate annual amortization expense by fiscal year is as follows: |
| | | |
| (In thousands) | Amount |
| Fiscal 2019 | $ | 9,487 |
|
| Fiscal 2020 | 9,032 |
|
| Fiscal 2021 | 9,032 |
|
| Fiscal 2022 | 8,405 |
|
| Fiscal 2023 | 8,197 |
|
| Thereafter | 44,314 |
|
| Total amortization expense remaining | $ | 88,467 |
|
Note 8: Warranty
We provide our motorhome customers a comprehensive 12-month/15,000-milecertain service and warranty on our Class A, B, and C motorhomes, and a 3-year/36,000-mile structural warranty on Class A and C sidewalls and floors. We provide a comprehensive 12-month warranty on all towable products. From time to time, we also voluntarily incur costs for certain warranty-type expenses occurring after the normal warranty period to help protect the reputation of our products and the goodwill of our customers. Estimated costs related to product warranty are accrued at the time of sale and are based upon historical warranty and service claims experience. Adjustments are made to accruals as claim data and cost experience becomes available. A significant increase in dealership labor rates, the cost of parts or the frequency of claims could have a material adverse impact on our operating results for the period or periods in which such claims or additional costs materialize.
In addition to the costs associated with the contractual warranty coverage provided on our products, we also occasionally incur costs as a result of additional service actions not covered by our warranties, including product recalls and customer satisfaction actions. Although we estimate and reserve for the cost of these service actions, there can be no assurance that expense levels will remain at current levels or such reserves will continue to be adequate.
Changes in our product warranty liability during Fiscal 2018, 2017,, Fiscal 2016, and Fiscal 20152016 are as follows: | | | (In thousands) | August 26, 2017 | | August 27, 2016 | | August 29, 2015 | August 25, 2018 | | August 26, 2017 | | August 27, 2016 |
| Balance at beginning of year | $ | 12,412 |
| | $ | 11,254 |
| | $ | 9,501 |
| $ | 30,805 |
| | $ | 12,412 |
| | $ | 11,254 |
|
| Acquisition of Grand Design | 12,904 |
| | — |
| | — |
| |
Business acquisitions(1) | | 611 |
| | 12,904 |
| | — |
|
| Provision | 31,631 |
| | 16,503 |
| | 12,892 |
| 42,377 |
| | 31,631 |
| | 16,503 |
|
| Claims paid | (26,142 | ) | | (15,345 | ) | | (11,139 | ) | (33,295 | ) | | (26,142 | ) | | (15,345 | ) |
| Balance at end of year | $ | 30,805 |
| | $ | 12,412 |
| | $ | 11,254 |
| $ | 40,498 |
| | $ | 30,805 |
| | $ | 12,412 |
|
| |
| (1) | Refer to Note 2, Business Combinations, for additional information on the acquisitions of Grand Design and Chris-Craft. |
Note 8:9: Long-Term Debt
The components of long-term debt are as follows:
| | | (In thousands) | | August 26,
2017 | | August 27,
2016 | August 25, 2018 | | August 26, 2017 |
| ABL | | $ | — |
| | $ | — |
| $ | 38,532 |
| | $ | — |
|
| Term Loan | | 284,000 |
| | — |
| 260,000 |
| | 284,000 |
|
| Gross Long-term debt, excluding issuance costs | | 284,000 |
| | — |
| |
| Less: debt issuance cost, net | | (9,424 | ) | | — |
| |
| Long-term debt, net of issuance costs | | 274,576 |
| | — |
| |
| Gross long-term debt, excluding issuance costs | | 298,532 |
| | 284,000 |
|
| Debt issuance cost, net | | (7,091 | ) | | (9,424 | ) |
| Total long-term debt | | 291,441 |
| | 274,576 |
|
| Less: current maturities | | (2,850 | ) | | — |
| — |
| | (2,850 | ) |
| Long-term debt, less current maturities | | $ | 271,726 |
| | $ | — |
| |
| Total long-term debt, less current maturities | | $ | 291,441 |
| | $ | 271,726 |
|
On November 8, 2016, we entered into a $125.0 million ABLcredit agreement ("ABL") and a $300.0 million loan agreement ("Term Loan") with JPMorgan Chase Bank, N.A. ("Credit Agreement"). On December 8, 2017, we amended our Credit Agreement, which decreased the interest rate spread by 1.0% on the Term Loan with JPMorgan Chase.and 0.25% on the ABL.
Under the ABL, agreement, we have a five-yearfive year credit facility on a revolving basis, subject to availability under a borrowing base consisting of eligible accounts receivable and eligible inventory. The lineABL is available for issuance of letters of credit to a specified limit of $10.0 million. We pay a customary commitment fee based uponin the range of 0.25% - 0.375% on the amount of the facility available, but unused.
Under the agreement, we We can elect to base the interest rate on various base rates plus specific spreads depending on the amount of borrowings outstanding. As of August 26, 2017 no funds were drawnWe currently pay interest on the ABL agreement other than an outstanding $0.2 million letter of credit.borrowings at a floating rate based upon LIBOR plus 1.25%.
Under the Term Loan, we can elect to base the interest rate on various base rates plus specific spreads. The interest rate as of August 25, 2018 was based on LIBOR plus 2.32%. The Term Loan agreement we have a seven-year credit facility originally repayablecurrently requires quarterly payments in quarterly installments in an aggregate amount equal to 1.0% of the original amount of $2.75 million until December 31, 2019 at which time the Term Loan on March 31, June 30 and September 30, 2017; 1.25% each calendar quarter end thereafter;quarterly payments change to $3.75 million, with the balance payableall amounts then outstanding due on November 8, 2023. AWe have made voluntary prepayment of $10.0 million in June of 2017 was designated as applying toprepayments that have extended the next regularly-scheduled payments. This designation provides an opportunity to defer principalquarterly payments, on the term loan, at our option, until MarchDecember 31, 2018.2019. There are mandatory prepayments for proceeds of new debt, sale of significant assets or subsidiaries, and excess cash flow as those terms are defined in the agreement.Term Loan. Incremental term loans of up to $125.0 million are available if certain financial ratios and other conditions are met.
Under The amount that may be borrowed under the Term Loan agreement, we can electABL was increased to base the interest rate on various base rates plus specific spreads. The interest rate$165.0 million as of August 26, 2017, before consideration of the hedge, was 5.7%.September 21, 2018.
The Term Loan agreement and the ABL agreement both contain variousCredit Agreement contains certain financial covenants. As of August 26, 2017,25, 2018, we are in compliance with all financial covenants of the Credit Agreement.
The ABL and Term Loan are guaranteed by Winnebago Industries, Inc. and all material direct and indirect domestic subsidiaries and are secured by a security interest in substantially all of our assets, except minor excluded assets.
We amortize debt issuance costs on a straight-line basis (which is not materially different from an effective interest method) over the term of the associated debt agreement. If early principal payments are made on the Term Loan, a proportional amount of the unamortized issuance costs will be expensed. As of August 26, 2017, $9.425, 2018, we incurred $1.1 million of debt issuance costs netrelated to our revolving Credit Agreement that are being amortized on a straight-line basis over the five year term of amortizationthe agreement. We also incurred $10.5 million of $1.6 million, were recordedcosts as of August 25, 2018 related to the Term Loan that are being amortized on a direct deduction from long-term debt, $1.4 million fromstraight-line basis over the current portion and $8.0 million fromseven year term of the long-term portion.agreement. Unamortized debt issuance costs of $0.1$0.6 million related to the prior Amended Credit Agreementvoluntary prepayment on the Term Loan were expensed in Fiscal 2018.
The fair value of long-term debt, excluding debt issuance costs, approximated the three months ended Novembercarrying values as of August 25, 2018 and August 26, 2016.2017 as interest is at variable market rates.
Aggregate contractual maturities of debt in future fiscal years, are as follows: | | | (In thousands) | (In thousands) | | Amount | Amount |
| Year: | 2018 | | $ | 4,250 |
| |
| | 2019 | | 15,000 |
| |
| | 2020 | | 15,000 |
| |
| | 2021 | | 15,000 |
| |
| | 2022 | | 15,000 |
| |
| | 2023 | | 15,000 |
| |
| | 2024 | | 204,750 |
| |
| | Total debt | | $ | 284,000 |
| |
| Fiscal 2019 | | $ | — |
|
| Fiscal 2020 | | 10,250 |
|
| Fiscal 2021 | | 15,000 |
|
| Fiscal 2022 | | 15,000 |
|
| Fiscal 2023 | | 219,750 |
|
| Total long-term debt | | $ | 260,000 |
|
Note 9:10: Employee and Retiree Benefits
Postretirement health care and deferred
Deferred compensation benefits are as follows:
|
| | | | | | | |
| (In thousands) | August 26, 2017 | | August 27, 2016 |
| Postretirement health care benefit cost | $ | — |
| | $ | 6,346 |
|
| Non-qualified deferred compensation | 16,476 |
| | 18,003 |
|
| Executive share option plan liability | 1,498 |
| | 3,341 |
|
| SERP benefit liability | 2,534 |
| | 2,681 |
|
| Executive deferred compensation | 447 |
| | 389 |
|
| Officer stock-based compensation | 1,664 |
| | 763 |
|
| Total postretirement health care and deferred compensation benefits | 22,619 |
| | 31,523 |
|
Less current portion(1) | (3,349 | ) | | (4,574 | ) |
| Long-term postretirement health care and deferred compensation benefits | $ | 19,270 |
| | $ | 26,949 |
|
|
| | | | | | | |
| (In thousands) | August 25, 2018 | | August 26, 2017 |
| Non-qualified deferred compensation | $ | 14,831 |
| | $ | 16,476 |
|
| Supplemental executive retirement plan | 2,309 |
| | 2,534 |
|
| Executive share option plan | 935 |
| | 1,498 |
|
| Executive deferred compensation plan | 421 |
| | 447 |
|
| Officer stock-based compensation | 1,528 |
| | 1,664 |
|
| Total deferred compensation benefits | 20,024 |
| | 22,619 |
|
Less: current portion(1) | (4,742 | ) | | (3,349 | ) |
| Long-term deferred compensation benefits | $ | 15,282 |
| | $ | 19,270 |
|
| |
(1) | Included in Accruedaccrued compensation in the Consolidated Balance Sheetsconsolidated balance sheets. |
Postretirement Health Care Benefits
Historically, we provided certain health care and other benefits for retired employees hired before April 1, 2001, who had fulfilled eligibility requirements at age 55 with 15 years of continuous service. We used a September 1 measurement date for this plan and our postretirement health care plan was not funded.
InDuring the first quarter of Fiscal 2005, through a plan amendment, we established dollar caps on the amount that we paid for postretirement health care benefits per retiree on an annual basis so that we were not exposed to continued medical inflation. Retirees were required to pay a monthly premium in excess of the employer dollar caps for medical coverage based on years of service and age at retirement. Each year from 2012 to 2015, the employer established dollar caps were reduced by 10% through plan amendments. In Fiscal 2016, postretirement health care benefits were discontinued for retirees age 65 and over. The plan amendment also included a 10% reduction in employer paid premiums for retirees under age 65. On October 26, 2016,2017, we announced the termination of the remaining postretirement health care benefits to all participants. BeginningAs of January 1, 2017, postretirement health care benefits were discontinued for retirees under age 65. As a result of these amendments, our liability for postretirement health care was reduced as presented in the following table.
|
| | | | | | | | | | | | |
| Date | | Plan Amendment | | Dollar Cap Reduction | | Liability Reduction (in thousands) | | Amortization Period (1) |
| Fiscal 2005 | | Established employer dollar cap | | | | $ | 40,414 |
| | 11.5 | years |
| January 2012 | | Reduced employer dollar cap | | 10 | % | | 4,598 |
| | 7.8 | years |
| January 2013 | | Reduced employer dollar cap | | 10 | % | | 4,289 |
| | 7.5 | years |
| January 2014 | | Reduced employer dollar cap | | 10 | % | | 3,580 |
| | 7.3 | years |
| January 2015 | | Reduced employer dollar cap | | 10 | % | | 3,960 |
| | 7.1 | years |
| January 2016 | | Reduced employer dollar cap for retirees under age 65; discontinued retiree benefits for retirees age 65 and over | | 10 | % | | 28,596 |
| | 6.9 | years |
January 2017 (2) | | Terminated Plan | | | | 6,338 |
| | 0.2 | years |
(1) Plan amendments are amortized on a straight-line basis over the expected remaining service period of active plan participants.
(2) In accordance with ASC 715, the effects of the plan amendment are accounted for at the date the amendment is adopted and has been communicated to plan participants. The effective date for this plan amendment was October 26, 2016.discontinued.
Based on actuarial evaluations, the discount rate used in determining the accumulated postretirement benefit obligation was 2.73% at August 27, 2016, which increased the benefit obligation by $0.9 million at August 27, 2016. There was no actuarial evaluation in Fiscal 2017 due to the termination of postretirement health care benefits.
Changes in our postretirement health care liability were as follows:
| | | (In thousands) | August 26, 2017 | | August 27, 2016 | August 26, 2017 |
| Balance at beginning of year | $ | 6,346 |
| | $ | 34,535 |
| $ | 6,346 |
|
| Interest cost | 29 |
| | 327 |
| 29 |
|
| Service cost | 16 |
| | 108 |
| 16 |
|
| Net benefits paid | (53 | ) | | (878 | ) | (53 | ) |
| Actuarial loss | — |
| | 850 |
| |
| Plan amendment | (6,338 | ) | | (28,596 | ) | (6,338 | ) |
| Balance at end of year | $ | — |
| | $ | 6,346 |
| $ | — |
|
Net periodic postretirement benefit income for the past three fiscal yearsFiscal 2017 and 2016 consisted of the following components:
| | | | Year Ended | Year Ended |
| (In thousands) | August 26, 2017 | | August 27, 2016 | | August 29, 2015 | August 26, 2017 | | August 27, 2016 |
| Interest cost | $ | 29 |
| | $ | 327 |
| | $ | 1,382 |
| $ | 29 |
| | $ | 327 |
|
| Service cost | 16 |
| | 108 |
| | 427 |
| 16 |
| | 108 |
|
| Amortization of prior service benefit | (40,444 | ) | | (7,736 | ) | | (5,538 | ) | (40,444 | ) | | (7,736 | ) |
| Amortization of net actuarial loss | 15,648 |
| | 1,612 |
| | 1,465 |
| 15,648 |
| | 1,612 |
|
| Net periodic postretirement benefit income | $ | (24,751 | ) | | $ | (5,689 | ) | | $ | (2,264 | ) | $ | (24,751 | ) | | $ | (5,689 | ) |
For accounting purposes, we recognized net periodic postretirement income as presented in the previous table, due to the amortization of prior service benefit associated with the establishment of caps on the employer portion of benefits in Fiscal 2005 and the plan amendments made over the past five years.
Amounts not yet recognized in net periodic benefit cost and included in accumulated other comprehensive income (before taxes) are as follows:
| | | (In thousands) | August 26, 2017 | | August 27, 2016 | August 27, 2016 |
| Prior service credit | $ | — |
| | $ | (34,139 | ) | $ | (34,139 | ) |
| Net actuarial loss | — |
| | 15,648 |
| 15,648 |
|
| Accumulated other comprehensive income | $ | — |
| | $ | (18,491 | ) | $ | (18,491 | ) |
Deferred Compensation Benefits
Non-Qualified Deferred Compensation Program (1981)
We have a Non-Qualified Deferred Compensation Program which permitted key employees to annually elect to defer a portion of their compensation until their retirement. The plan has been closed to any additional deferrals since January 2001. The retirement benefit to be provided is based upon the amount of compensation deferred and the age of the individual at the time of the contracted deferral. An individual generally vests at age 55 and 5 years of participation under the plan. For deferrals prior to December 1992, vesting occurs at the later of age 55 and 5 years of service from first deferral or 20 years of service. Deferred compensation expense was $1.2$1.1 million,, $1.3 $1.2 million and $1.3$1.3 million in Fiscal 2018, 2017,, 2016 and 2015,2016, respectively. Total deferred compensation liabilities were $16.5 million and $18.0 million at August 26, 2017 and August 27, 2016, respectively.
Supplemental Executive Retirement Plan (SERP)("SERP")
The primary purpose of this plan was to provide our officers and managers with supplemental retirement income for a period of 15 years after retirement. We have not offered this plan on a continuing basis to members of management since 1998. The plan was funded with individual whole life insurance policies (Split Dollar Program)(split dollar program) owned by the named insured officer or manager. We initially paid the life insurance premiums on the life of the individual and the individual would receive life insurance and supplemental cash paymentpayments during the 15 years following retirement. In October 2008, the plan was amended as a result of changes in the tax and accounting regulations and rising administrative costs. Under the redesigned SERP, the underlying life insurance policies previously owned by the insured individual became COLIcompany-owned life insurance ("COLI") by a release of all interests by the participant and assignment to us as a prerequisite to participationparticipate in the SERP and transition from the Split Dollar Program. Total SERP liabilities were $2.5 millionand $2.7 million at August 26, 2017 and August 27, 2016, respectively. This program remains closed to new employee participation.
To assist in funding the deferred compensation and SERP liabilities, we have invested in COLI policies. The cash surrender value of these policies is presented asin investment in life insurance in the accompanying balance sheets and consists of the following:
| | | (In thousands) | | August 26, 2017 | | August 27, 2016 | August 25, 2018 | | August 26, 2017 |
| Cash value | | $ | 62,824 |
| | $ | 60,263 |
| $ | 63,574 |
| | $ | 62,824 |
|
| Borrowings | | (35,406 | ) | | (33,771 | ) | (35,277 | ) | | (35,406 | ) |
| Investment in life insurance | | $ | 27,418 |
| | $ | 26,492 |
| $ | 28,297 |
| | $ | 27,418 |
|
Non-QualifiedExecutive Share Option Program (2001)Plan
The Non-Qualified Share Option Program permitted participants in the Executive Share Option Plan (the "Executive Plan") to choose to defer a portion of their salary or other eligible compensation in the form of options to purchase selected securities, primarily equity-based mutual funds. These assets are treated as trading securities and are recorded at fair value. The Executive Plan has been closed to any additional deferrals since January 2005. The Executive Plan assets related to those options that will expire within a year are included in prepaid expenses and other assets in the accompanying balance sheets. The remaining assets are included in other assets. Total assets on August 25, 2018 and August 26, 2017 were $1.0 million and August 27, 2016 were $1.6$1.6 million, and $3.7 million, respectively, and the liabilities were $1.5 million and $3.3 million, respectively.
The difference between the asset and liability
balances represents the additional 25% we contributed at the time of the initial deferrals to aid in potential additional earnings to the participant. This contribution is required to be paid back to us when the option is exercised. A participant may exercise his or her options per the plan document, but there is a requirement that after these dollars have been invested for 15 years the participant is required to exercise such option.
Executive Deferred Compensation Plan (2007)
In December 2006, we adopted the Winnebago Industries, Inc. Executive Deferred Compensation Plan (the "Executive Deferred Compensation Plan"). Under the Executive Deferred Compensation Plan, corporate officers and certain key employees may annually choose to defer up to 50% of their salary and up to 100% of their cash incentive awards. The assets are presented as Otherother assets and the liabilities are presented as Deferred compensation benefits and postretirement health care benefits in the accompanying balance sheets. Such assets on August 25, 2018 and August 26, 2017 were $0.4 million and August 27, 2016 were $0.4$0.4 million, and $0.4 million, respectively, and liabilities were $0.4 million and $0.4 million, respectively.
Profit Sharing Plan
We have a qualified profit sharing and contributory 401(k) plan for eligible employees. The plan provides quarterly discretionary matching cash contributions as approved by our Board of Directors. Contributions to the plan for Fiscal 2018, 2017,, 2016 and 20152016 were $1.6$2.3 million,, $1.5 $1.6 million, and $1.2$1.5 million,, respectively.
Note 10:11: Contingent Liabilities and Commitments
Repurchase Commitments
Generally, manufacturers in the RV industryour industries enter into repurchase agreements with lending institutions which have provided wholesale floorplan financing to dealers. Most dealers' RVsdealers are financed on a "floorplan" basis under which a bank or finance company lends the dealer all, or substantially all, of the purchase price, collateralized by a security interest in the RVsunits purchased.
Our repurchase agreements generally provide that, in the event of default by the dealer on the agreement to pay the lending institution, we will repurchase the financed merchandise. The terms of these agreements, which generally can last up to 1824 months, provide that our liability will be the lesser of remaining principal owed by the dealer to the lending institution, or dealer invoice less periodic reductions based on the time since the date of the original invoice. Our liability cannot exceed 100% of the dealer invoice. In certain instances, we also repurchase inventory from our dealers due to state law or regulatory requirements that govern voluntary or involuntary relationship terminations. Although laws vary from state to state, some states have laws in place that require manufacturers of RVs or boats to repurchase current inventory if a dealership exits the business. Our total contingent liability on all repurchase agreements was approximately $713.1$879.0 million and $417.2$713.1 million at August 25, 2018 and August 26, 2017, respectively.
Repurchased sales are not recorded as a revenue transaction, but the net difference between the original repurchase price and August 27, 2016, respectively, with the increase attributed primarilyresale price are recorded against the loss reserve, which is a deduction from gross revenue. Our loss reserve for repurchase commitments contains uncertainties because the calculation requires management to Grand Design.
make assumptions and apply judgment regarding a number of factors. Our risk of loss related to these repurchase commitments is significantly reduced by the potential resale value of any products that are subject to repurchase and is spread over numerous dealers and lenders. The aggregate contingent liability related to our repurchase agreements represents all financed dealer inventory at the period reporting date subject to a repurchase agreement, net of the greater of periodic reductions per the agreement or dealer principal payments. Based on thethese repurchase exposure as previously describedagreements and our historical loss experience, we establishedestablish an associated loss reserve.reserve which is included in accrued expenses-other on the consolidated balance sheets. Our accrued losses on repurchases were $0.9 million as of August 25, 2018 and $0.7 million as of August 26, 2017 and $0.9 million as of August 27, 2016 and are included in Accrued expenses - Other on the Consolidated Balance Sheets.2017. Repurchase risk is affected by the credit worthiness of our dealer network and we do not believe there is a reasonable likelihood that there will be a material change in the estimates or assumptions used to establish the loss reserve for repurchase commitments.
A summary of the activity for the fiscal years stated for repurchased units is as follows:
| | | (Dollars in thousands) | | Fiscal 2017 | | Fiscal 2016 | | Fiscal 2015 (1) | Fiscal 2018 | | Fiscal 2017 | | Fiscal 2016 |
| Inventory repurchased: | | | | | | | | | | | |
| Units | | 14 |
| | 29 |
| | 62 |
| 56 |
| | 14 |
| | 29 |
|
| Dollars | | $ | 408 |
| | $ | 1,605 |
| | $ | 7,472 |
| $ | 1,716 |
| | $ | 408 |
| | $ | 1,605 |
|
| Inventory resold: | | | | | | | | | | | |
| Units | | 15 |
| | 28 |
| | 62 |
| 56 |
| | 15 |
| | 28 |
|
| Cash collected | | $ | 393 |
| | $ | 1,510 |
| | $ | 6,409 |
| $ | 1,585 |
| | $ | 393 |
| | $ | 1,510 |
|
| Loss recognized | | $ | 44 |
| | $ | 95 |
| | $ | 1,063 |
| $ | 132 |
| | $ | 44 |
| | $ | 95 |
|
| Units in ending inventory | | — |
| | 1 |
| | 1 |
| — |
| | — |
| | 1 |
|
(1) A significant number of the units repurchased in Fiscal 2015 were attributable to a single dealership for which we had established a specific repurchase loss reserve in Fiscal 2014.
Litigation
We are involved in various legal proceedings which are ordinary and routine litigation incidental to our business, some of which are covered in whole or in part by insurance. While we believe the ultimate disposition of litigation will not have material adverse effect on our financial position, results of operations or liquidity, there exists the possibility that such litigation may have an impact on our results for a particular reporting period in which litigation effects become probable and reasonably estimable. Though we do not
believe there is a reasonable likelihood that there will be a material change related to these matters, litigation is subject to inherent uncertainties and management’s view of these matters may change in the future.
Lease Commitments
As part of our acquisition of Grand Design, we acquired leases to two properties which hold Grand Design’s current principal facilities and facilities under construction for expansion. The lessor under these leases is an Indiana limited liability company, Three Oaks, LLC, owned by three of Grand Design's selling equity holders. One of the selling equity holders, Mr. Don Clark has assumed the position of Vice President for Winnebago and is the
President of Grand Design.Design RV; Vice President of Winnebago Industries. Upon joining our company, Mr. Clark has agreed that as long as he is an employee of Grand Design, he has relinquished his voting rights in Three Oaks, LLC while retaining all other economic rights in Three Oaks, LLC.
We have operating leases for certain land, buildings, and equipment. Lease expense was $4.4 million for Fiscal 2018, $2.9 million for Fiscal 2017,, and $0.6 million for Fiscal 2016 and $0.9 million for Fiscal 2015.2016.
Our future lease commitments for future fiscal years included the following related party and non-related party leases:
| | | | | | | | | | | Operating Leases |
| (In thousands) | (In thousands) | | Related Party Amount | | Non-related Party Amount | | Total | Related Party Amount | | Non-Related Party Amount | | Total |
| Year Ended: | 2018 | | $ | 1,897 |
| | $ | 643 |
| | $ | 2,540 |
| |
| | 2019 | | 1,800 |
| | 623 |
| | 2,423 |
| |
| | 2020 | | 1,800 |
| | 556 |
| | 2,356 |
| |
| | 2021 | | 1,800 |
| | 551 |
| | 2,351 |
| |
| | 2022 | | 1,800 |
| | 770 |
| | 2,570 |
| |
| | Thereafter | | $ | 6,574 |
| | $ | 228 |
| | $ | 6,802 |
| |
| | Total | | $ | 15,671 |
| | $ | 3,371 |
| | $ | 19,042 |
| |
| Fiscal 2019 | | $ | 1,800 |
| | $ | 900 |
| | $ | 2,700 |
|
| Fiscal 2020 | | 1,800 |
| | 624 |
| | 2,424 |
|
| Fiscal 2021 | | 1,800 |
| | 570 |
| | 2,370 |
|
| Fiscal 2022 | | 1,800 |
| | 445 |
| | 2,245 |
|
| Fiscal 2023 | | 2,533 |
| | 150 |
| | 2,683 |
|
| Thereafter | | 4,041 |
| | — |
| | 4,041 |
|
| Total future lease commitments | | $ | 13,774 |
| | $ | 2,689 |
| | $ | 16,463 |
|
Note 11: 12: Stock-Based Compensation Plans
We have a 2014 Omnibus Equity, Performance Award, and Incentive Compensation Plan (as amended, the "Plan") in place as approved by shareholders, which allows us to grant or issue non-qualified stock options, incentive stock options, share awards, and other equity compensation to key employees and to non-employee directors.
No more than 3.6 million shares of common stock may be issued under the Plan, and no more than 3.6 million of those shares may be used for awards other than stock options or stock appreciation rights. Shares subject to awards that are forfeited or terminated, expire unexercised, are cancelled and settled in cash in lieu of common stock or are exchanged for awards that do not involve common stock, shall be added back to the limits and again immediately become available for awards.
Stock Options and Share Awards
The term of any options granted under the Plan may not exceed ten years from the date of the grant. Stock options are granted at the closing market price on the date of grant. Options issued to key employees generally vest over a three-yearthree-year period in equal annual installments, beginning one year after the date of grant, with immediate vesting upon a change of control (as defined in the Plan), if earlier. Historically, options issued to directors vested six months after grant.
Share awards generally vest over a three-year period in equal annual installments with continued employment, beginning one year after the date of grant, with immediate vesting upon retirement for awards made prior to October 2016 or upon a change of control (collectively, "time-based") or upon attainment of established goals. Share awards that are not time-based typically vest at the end of a one yearone-year or three-yearthree-year incentive period based upon the achievement of company goals ("performance-based"). The value of time-based restricted share awards is based on the number of shares granted and the closing price of our common stock on the date of grant. The value of performance-based restricted share awards is based upon the terms of the plan, the closing price of our common stock on the date of grant, and an assessment of the probability of reaching the established performance targets. Historically, the terms of these plans linked the incentive payment to a percentage of base salary compensation, and if the established goals are met, shares of the appropriate value are then granted.
Annual
Our Employee Stock Purchase Plan ("ESPP"), as approved by the shareholders at the December 12, 2017 annual meeting, permits employees to purchase our common stock at a 15% discount from the market price at the end of semi-annual purchase periods and is compensatory. Employees are required to hold the common stock purchased for one year. In Fiscal 2018, 2,760 shares were purchased through the ESPP. At August 25, 2018, plan participants had accumulated $0.1 million to purchase our common stock pursuant to this plan.
Total stock-based compensation expense for the past three fiscal years consisted of the following components: |
| | | | | | | | | | | |
| | Year Ended |
| (In thousands) | August 25, 2018 | | August 26, 2017 | | August 27, 2016 |
| Share awards: | | | | | |
| Performance-based | $ | 2,525 |
| | $ | 69 |
| | $ | 807 |
|
| Time-based | 4,152 |
| | 2,606 |
| | 2,326 |
|
| Stock options | 502 |
| | 164 |
| | 11 |
|
Other(1) | 255 |
| | 138 |
| | 149 |
|
| Total stock-based compensation | $ | 7,434 |
| | $ | 2,977 |
| | $ | 3,293 |
|
| |
| (1) | Includes stock-based compensation expense related to Board of Directors stock unit expense and ESPP expense. Directors may elect to defer all or part of their annual retainer into a deferred compensation plan. The plan allows them to defer into either money units or stock units and is more fully described in the Proxy Statement. |
Share Awards - Performance-Based
Long-Term Incentive PlansPlan
For Fiscal 2015 and Fiscal 2016,
In each fiscal year presented, the Human Resources Committee of our Board of Directors established annual incentive plans for the officers that were to be paid in 2/3 cash and 1/3 restricted stock (stock must be held for onea three year from date of grant except for shares we agree to repurchase in lieu of executives' payment of payroll taxes). The Fiscal 2017 Annual Incentive Plan was paid out entirely in cash.
The following table shows the amount accrued each fiscal year for stock-based compensation under the annual incentive plan. The Human Resources Committee of the Board of Directors approved the awards of restricted stock to the officers on the dates shown.
|
| | | | | | | | | | | | |
| | | August 26, 2017 | | August 27, 2016 | | August 29, 2015 |
| Annual incentive accrual (in thousands) | | $ | 3,037 |
| | $ | 1,467 |
| | $ | 454 |
|
| Date of award | | — |
| | 10/11/2016 |
| | 10/13/2015 |
|
| Stock-based portion of annual incentive accrual (in thousands) | | $ | — |
| | $ | 489 |
| | $ | 157 |
|
| Restricted shares awarded | | — |
| | 17,532 |
| | 7,914 |
|
Long-Term Incentive Plans
For Fiscal 2015, Fiscal 2016 and Fiscal 2017, the Human Resources Committee of our Board of Directors established three different three-year incentive compensation plans (Officers Long-Term Incentive Plan Fiscal 2013-2015, 2014-2016 and 2015-2017)plan to serve as an incentive to our senior management team to achieve certain ROEcompany-performance targets. If the ROE target istargets are met, restricted stock will beis awarded subsequent to the end of each three year period with a one-yearone year restriction on sale upon award (except for shares we agree to repurchase in lieu of executives' payment of payroll taxes). In the event that we do not achieve the required ROE targets, no restricted stock will be granted. If it becomes probable that certain of the ROE performance targets will be achieved, the corresponding estimated cost of the grant will be recorded as stock-based compensation expense over the performance period. The probability of reaching the targets is evaluated each reporting period. If it becomes probable that certain of the target performance levels will be achieved, a cumulative adjustment will be recorded and future stock-based-compensation expense will increase based on the then projected performance levels. If we later determine that it is not probable that the minimum ROE performance threshold for the grants will be met, no further stock-based compensation cost will be recognized and any previously recognized stock-based compensation cost related to these plans will be reversed.
The following table shows the amount accrued each fiscal year for stock-based compensation as a result of ROE targets being met. Annual Incentive Plan
The Human Resources Committee of
theour Board of Directors
approvedestablishes annual incentive plans for the
awards ofofficers. The Fiscal 2018 and Fiscal 2017 Annual Incentive Plans were paid entirely in cash, while the Fiscal 2016 Annual Incentive Plan was paid in 2/3 cash and 1/3 restricted stock
(stock must be held for one year from date of grant except for shares we agree to repurchase in lieu of executives' payment of payroll taxes). On October 11, 2016, 17,532 restricted shares were awarded related to the
officers on the dates shown. |
| | | | | | | | | | | | |
| | | August 26, 2017 | | August 27, 2016 | | August 29, 2015 |
| LTIP accrual (in thousands) | | $ | 86 |
| | $ | 318 |
| | $ | 360 |
|
| LTIP plan year | | 2015-2017 |
| | 2014-2016 |
| | 2013-2015 |
|
| Date of award | | 10/18/2017 |
| | 10/11/2016 |
| | 10/13/2015 |
|
| Restricted shares awarded | | 1,939 |
| | 11,419 |
| | 18,156 |
|
Director's Deferred Compensation PlanShare Awards - Time-Based
Non-employee directors may elect to defer all or part
A summary of their annual retainer into a deferred compensation plan. The plan allows them to defer into either money units or stock unitsshare award activity for Fiscal 2018, 2017 and 2016 is more fully described in the Proxy Statement. For the directors who elected to defer during Fiscal 2017, 4,588 stock units were created. as follows:
|
| | | | | | | | | | | | | | | | | |
| | Year Ended |
| | August 25, 2018 | | August 26, 2017 | | August 27, 2016 |
| | Shares | Weighted Average Grant Date Fair Value | | Shares | Weighted Average Grant Date Fair Value | | Shares | Weighted Average Grant Date Fair Value |
| Beginning of year | 243,769 |
| $ | 23.61 |
| | 283,881 |
| $ | 20.45 |
| | 163,420 |
| $ | 20.83 |
|
| Granted | 167,781 |
| 42.54 |
| | 156,801 |
| 28.13 |
| | 240,270 |
| 19.72 |
|
| Vested | (100,648 | ) | 23.96 |
| | (159,979 | ) | 22.66 |
| | (110,283 | ) | 19.44 |
|
| Cancelled | (25,711 | ) | 29.64 |
| | (36,934 | ) | 22.61 |
| | (9,526 | ) | 20.28 |
|
| End of year | 285,191 |
| $ | 34.08 |
| | 243,769 |
| $ | 23.61 |
| | 283,881 |
| $ | 20.45 |
|
The aggregate intrinsic value of awards outstanding at August 25, 2018 was $10.6 million. As of August 25, 2018, there was $5.6 million of unrecognized compensation expense related to restricted stock awards that is expected to be recognized over a weighted average period of 1.2 years. The total fair value of awards vested during Fiscal 2018, 2017 and 2016 was $7.1 million, $4.9 million, and $2.2 million, respectively.
On October 15, 2018, the Board of Directors granted 77,869 restricted stock units outstanding asunder the Plan valued at $2.5 million to our key management group (approximately 40 employees). The Board of August 26, 2017 was $1.7 million with 49,729Directors also granted 23,975 restricted stock units outstanding.valued at
Stock-Based Compensation
Total stock-based$0.8 million to the non-management members of the Board. The value of the restricted stock units is based on the closing price of our common stock on the date of grant, which was $31.70. The fair value of this award is amortized on a straight-line basis over the requisite service period of three years for employees and one year for non-management members of the Board. Estimated non-cash stock compensation expense based on this grant is expected to be approximately $1.6 million for the past three fiscal years consisted of the following components: |
| | | | | | | | | | | | |
| | | Year Ended |
| (In thousands) | | August 26, 2017 | | August 27, 2016 | | August 29, 2015 |
| Share awards: | | | | | | |
| Performance-based annual plan employee award expense | | $ | — |
| | $ | 489 |
| | $ | 157 |
|
| Performance-based LTIP employee award expense | | 69 |
| | 318 |
| | 360 |
|
| Time-based employee award expense | | 1,965 |
| | 1,583 |
| | 2,060 |
|
| Time-based directors award expense | | 641 |
| | 743 |
| | 412 |
|
| Directors stock unit expense | | 138 |
| | 149 |
| | 108 |
|
| Stock options | | 164 |
| | 11 |
| | — |
|
| Total stock-based compensation | | $ | 2,977 |
| | $ | 3,293 |
| | $ | 3,097 |
|
Fiscal 2019.
Stock Options
A summary of stock option activity for Fiscal 2018, 2017, 2016 and 20152016 is as follows:
| | | | | Year Ended | Year Ended |
| | | August 26, 2017 | | August 27, 2016 | | August 29, 2015 | August 25, 2018 | | August 26, 2017 | | August 27, 2016 |
| | | Shares | Wtd. Avg. Exercise Price/Share | | Shares | Wtd. Avg. Exercise Price/Share | | Shares | Wtd. Avg. Exercise Price/Share | Shares | Wtd. Avg. Exercise Price/Share | | Shares | Wtd. Avg. Exercise Price/Share | | Shares | Wtd. Avg. Exercise Price/Share |
| Outstanding at beginning of year | | 10,000 |
| $ | 16.67 |
| | 167,394 |
| $ | 28.30 |
| | 457,421 |
| $ | 30.38 |
| 65,800 |
| $ | 28.15 |
| | 10,000 |
| $ | 16.67 |
| | 167,394 |
| $ | 28.30 |
|
| Options granted | | 63,800 |
| 29.92 |
| | 10,000 |
| 16.67 |
| | — |
| — |
| 72,710 |
| 44.40 |
| | 63,800 |
| 29.92 |
| | 10,000 |
| 16.67 |
|
| Options exercised | | — |
| — |
| | — |
| — |
| | — |
| — |
| |
| Options cancelled | | (8,000 | ) | 27.89 |
| | (167,394 | ) | 28.30 |
| | (290,027 | ) | 31.58 |
| — |
| — |
| | (8,000 | ) | 27.89 |
| | (167,394 | ) | 28.30 |
|
| Outstanding at end of year | | 65,800 |
| $ | 28.15 |
| | 10,000 |
| $ | 16.67 |
| | 167,394 |
| $ | 28.30 |
| 138,510 |
| $ | 36.68 |
| | 65,800 |
| $ | 28.15 |
| | 10,000 |
| $ | 16.67 |
|
| | | | | | | | | | | | | | | | | | |
| Exercisable at end of year | | 3,333 |
| $ | 16.67 |
| | — |
| $ | — |
| | 167,394 |
| $ | 28.30 |
| 25,263 |
| $ | 26.64 |
| | 3,333 |
| $ | 16.67 |
| | — |
| $ | — |
|
| Vested and expected to vest at end of year | | 65,800 |
| $ | 28.15 |
| | 10,000 |
| $ | 16.67 |
| | 167,394 |
| $ | 28.30 |
| 138,510 |
| $ | 36.68 |
| | 65,800 |
| $ | 28.15 |
| | 10,000 |
| $ | 16.67 |
|
The fair value of each option grant is estimated on the date of grant using the Black-Scholes option-pricing model with the following weighted-average valuation assumptions:
| | Valuation Assumptions(1) | | Fiscal 2017 | | Fiscal 2016 | Fiscal 2018 | | Fiscal 2017 | | Fiscal 2016 |
| Expected dividend yield | | 1.35 | % | | 2.40 | % | 0.90 | % | | 1.35 | % | | 2.40 | % |
Risk-free interest rate (2) | | 1.47 | % | | 1.49 | % | 1.99 | % | | 1.47 | % | | 1.49 | % |
Expected life (in years) (3) | | 5 |
| | 5 |
| 5 |
| | 5 |
| | 5 |
|
Expected volatility (4) | | 39.34 | % | | 43.52 | % | 38.08 | % | | 39.34 | % | | 43.52 | % |
| Weighted average fair value of options granted | |
| $9.58 |
| |
| $5.31 |
|
| $14.78 |
| |
| $9.58 |
| |
| $5.31 |
|
(1) Forfeitures are estimated based on historical experience.
(2) Risk-free interest rate is based on Treasury Securities constant maturity interest rate whose term is consistent with the expected life of our
stock options.
(3)Expected life of stock options is based on historical experience.
(4)Expected stock price volatility is based on historical experience over a term consistent with the expected life of our stock options.
| |
| (1) | Forfeitures are recorded when they occur. |
| |
| (2) | Risk-free interest rate is based on Treasury Securities constant maturity interest rate whose term is consistent with the expected life of the stock options. |
| |
| (3) | Expected life of stock options is based on historical experience. |
| |
| (4) | Expected stock price volatility is based on historical experience over a term consistent with the expected life of the stock options. |
The weighted average remaining contractual life for options outstanding at August 26, 201725, 2018 was 9.18.6 years. Aggregate intrinsic value for options outstanding at August 26, 201725, 2018 was $0.4$0.6 million. As of August 26, 2017,25, 2018, there was $0.4$1.0 million of unrecognized compensation expense related to option awards that is expected to be recognized over a weighted average period of 2.21.8 years.
On October 18, 201715, 2018, the Board of Directors granted 72,710114,635 stock options to our officers.
Share Awards
A summary of share award activity for Fiscal 2017, 2016 and 2015 is as follows:
|
| | | | | | | | | | | | | | | | | | |
| | | Year Ended |
| | | August 26, 2017 | | August 27, 2016 | | August 29, 2015 |
| | | Shares | Weighted Average Grant Date Fair Value | | Shares | Weighted Average Grant Date Fair Value | | Shares | Weighted Average Grant Date Fair Value |
| Beginning of year | | 283,881 |
| $ | 20.45 |
| | 163,420 |
| $ | 20.83 |
| | 198,523 |
| $ | 18.98 |
|
| Granted | | 156,801 |
| 28.13 |
| | 240,270 |
| 19.72 |
| | 165,624 |
| 21.70 |
|
| Vested | | (159,979 | ) | 22.66 |
| | (110,283 | ) | 19.44 |
| | (198,693 | ) | 19.71 |
|
| Cancelled | | (36,934 | ) | 22.61 |
| | (9,526 | ) | 20.28 |
| | (2,034 | ) | 20.58 |
|
| End of year | | 243,769 |
| $ | 23.61 |
| | 283,881 |
| $ | 20.45 |
| | 163,420 |
| $ | 20.83 |
|
The aggregate intrinsic value of awards outstanding at August 26, 2017 was $8.4 million.
As of August 26, 2017, there was $3.0 million of unrecognized compensation expense related to restricted stock awards that is expected to be recognized over a weighted average period of 1.8 years. The total fair value of awards vested during Fiscal 2017, 2016 and 2015 was $4.9 million, $2.2 million and $4.2 million, respectively.
On October 18, 2017 the Board of Directors granted awards of 47,680 shares of our restricted common stock under the Plan valued at $2.1 million to our key management group (approximately 75 employees). The Board of Directors also granted 14,980 shares of our restricted common stock valued at $0.7 million to the non-management members of the Board.
The value of the restricted stock is based on the closing price of our common stock on the date of grant, which was $44.40. The fair value of this award to employees is amortized on a straight-line basis over the requisite service period of three years. Estimated non-cash stock compensation expense based on this restricted stock grant will be approximately $1.0 million for Fiscal 2018.
Note 12:13: Income Taxes
Income tax expense consisted of the following:
| | | | | Year Ended | Year Ended |
| (In thousands) | | August 26, 2017 | | August 27, 2016 | | August 29, 2015 | August 25, 2018 | | August 26, 2017 | | August 27, 2016 |
| Current | | | | | | | | | | | |
| Federal | | $ | 33,125 |
| | $ | 14,293 |
| | $ | 15,406 |
| $ | 28,874 |
| | $ | 33,125 |
| | $ | 14,293 |
|
| State | | 2,937 |
| | 1,685 |
| | 1,124 |
| 5,215 |
| | 2,937 |
| | 1,685 |
|
| Total | | 36,062 |
| | 15,978 |
| | 16,530 |
| 34,089 |
| | 36,062 |
| | 15,978 |
|
| Deferred | | | | | | | | | | | |
| Federal | | 926 |
| | 4,280 |
| | 1,486 |
| 5,123 |
| | 926 |
| | 4,280 |
|
| State | | 281 |
| | 444 |
| | 308 |
| 1,071 |
| | 281 |
| | 444 |
|
| Total | | 1,207 |
| | 4,724 |
| | 1,794 |
| 6,194 |
| | 1,207 |
| | 4,724 |
|
| Income Tax Expense | | $ | 37,269 |
| | $ | 20,702 |
| | $ | 18,324 |
| $ | 40,283 |
| | $ | 37,269 |
| | $ | 20,702 |
|
The following table provides a reconciliation of the USU.S. statutory income tax rate to our effective income tax rate:
| | | | | Year Ended | Year Ended |
| (A percentage) | | August 26, 2017 |
| | August 27, 2016 | | August 29, 2015 | |
| US federal statutory rate | | 35.0 | % | | 35.0 | % | | 35.0 | % | |
| | | August 25, 2018 |
| | August 26, 2017 | | August 27, 2016 |
U.S. federal statutory rate(1) | | 25.9 | % | | 35.0 | % | | 35.0 | % |
| State taxes, net of federal benefit | | 2.8 | % | | 2.5 | % | | 2.4 | % | 3.0 | % | | 2.8 | % | | 2.5 | % |
| Tax-free and dividend income | | (0.7 | )% | | (1.3 | )% | | (1.3 | )% | (0.4 | )% | | (0.7 | )% | | (1.3 | )% |
| Income tax credits | | (0.6 | )% | | (1.1 | )% | | (0.3 | )% | (0.5 | )% | | (0.6 | )% | | (1.1 | )% |
| Domestic production activities deduction | | (2.4 | )% | | (2.5 | )% | | (3.7 | )% | (2.2 | )% | | (2.4 | )% | | (2.5 | )% |
| Uncertain tax positions settlements and adjustments | | 0.1 | % | | (0.6 | )% | | — | % |
| Impact from Tax Act | | 2.6 | % | | — | % | | — | % |
| Other items | | 0.8 | % | | (1.3 | )% | | (0.8 | )% | (0.3 | )% | | 0.8 | % | | (1.3 | )% |
| Uncertain tax positions settlements and adjustments | | (0.6 | )% | | — | % | | (0.5 | )% | |
| Effective tax provision rate | | 34.3 | % | | 31.3 | % | | 30.8 | % | 28.2 | % | | 34.3 | % | | 31.3 | % |
| |
| (1) | The U.S. federal statutory rate for the year ended August 25, 2018 is a blended rate, which includes the impact of the Tax Act enactment. |
Our effective tax rate decreased to 28.2% for Fiscal 2018 from 34.3% for Fiscal 2017 due primarily to the enactment of the Tax Act on December 22, 2017. One of the most significant provisions of this legislation was a reduction in the Federal corporate income tax rate from 35.0% to 21.0% effective beginning January 1, 2018. Most of the remaining significant provisions of the Tax Act, such as the repeal of the federal domestic production activities deduction, take effect in our Fiscal 2019.
ASU 2018-05, Income Taxes (Topic 740): Amendments to SEC Paragraphs Pursuant to SEC Staff Accounting Bulletin No. 118, provided guidance for companies that allows for a measurement period of up to one year after the enactment date of the Tax Act to finalize the recording of the related tax impacts under ASC 740, Income Taxes. In accordance with this guidance, a company must reflect the income tax effect of those aspects of the Tax Act for which the accounting under ASC 740 is complete. To the extent that a company's accounting for certain income tax effects of the Tax Act is incomplete, but it is able to determine a reasonable estimate, the company must record a provisional estimate in the financial statements.
In accordance with ASC 740, as of the date of enactment through the year ended August 25, 2018, we recorded a non-cash provisional estimate of $3.6 million to income tax expense and a corresponding increase in the net deferred tax asset as a result of revaluing all deferred tax assets and liabilities at the newly enacted Federal corporate income tax rate.
We are still analyzing certain aspects of the Tax Act and refining our calculations, which could potentially affect the measurement of our deferred tax balances and cause us to revise our estimate in future periods. These impacts may be material, due to, among other things, further refinement of our calculations, changes in interpretations of the Tax Act, or issuance of additional guidance by the relevant tax authorities.
The tax effects of temporary differences that give rise to deferred income taxes were as follows:
| | | (In thousands) | | August 26, 2017 | | August 27, 2016 | August 25, 2018 | | August 26, 2017 |
| Deferred income tax asset (liability) | | | | | | | |
| Deferred compensation | | $ | 9,135 |
| | $ | 9,609 |
| $ | 4,730 |
| | $ | 9,135 |
|
| Warranty reserves | | 11,675 |
| | 4,729 |
| 9,842 |
| | 11,675 |
|
| Postretirement health care benefits | | — |
| | 2,262 |
| |
| Self-insurance reserve | | 1,967 |
| | 2,214 |
| 2,601 |
| | 1,967 |
|
| Accrued vacation | | 2,142 |
| | 2,006 |
| 1,298 |
| | 2,142 |
|
| Stock based compensation | | 943 |
| | 1,030 |
| 1,277 |
| | 943 |
|
| Inventory | | 615 |
| | — |
|
| Unrecognized tax benefit | | 437 |
| | 698 |
| 584 |
| | 437 |
|
Other (1) | | 2,072 |
| | 1,785 |
| 1,797 |
| | 2,072 |
|
| Total deferred tax assets | | 28,371 |
| | 24,333 |
| 22,744 |
| | 28,371 |
|
| Inventory | | (1,919 | ) | | (1,930 | ) | — |
| | (1,919 | ) |
| Intangibles | | (7,455 | ) | | — |
| (21,292 | ) | | (7,455 | ) |
| Depreciation | | (6,261 | ) | | (3,650 | ) | (5,909 | ) | | (6,261 | ) |
| Total deferred tax liabilities | | (15,635 | ) | | (5,580 | ) | (27,201 | ) | | (15,635 | ) |
| Total deferred income tax assets, net of deferred tax liabilities | | $ | 12,736 |
| | $ | 18,753 |
| |
| Total deferred income tax (liabilities) assets, net | | $ | (4,457 | ) | | $ | 12,736 |
|
| |
(1) | At August 26, 2017, Other25, 2018, other includes $46,000$1.4 million and $0.1 million related to federal and state NOLsnet operating losses, respectively, that will begin to expire in Fiscal 2021.do not expire. We have evaluated all the positive and negative evidence and consider it more likely than not that these carryforwards can be realized. |
Unrecognized Tax Benefits
Changes in the unrecognized tax benefits are as follows:
|
| | | | | | | | | | | | |
| (In thousands) | | August 26, 2017 | | August 27, 2016 | | August 29, 2015 |
| Unrecognized tax benefits - beginning balance | | $ | 1,710 |
| | $ | 1,589 |
| | $ | 1,709 |
|
| Gross decreases - tax positions in a prior period | | (536 | ) | | (355 | ) | | (568 | ) |
| Gross increases - current period tax positions | | 21 |
| | 476 |
| | 448 |
|
| Unrecognized tax benefits - ending balance | | 1,195 |
| | 1,710 |
| | 1,589 |
|
| Accrued interest and penalties | | 411 |
| | 751 |
| | 922 |
|
| Total unrecognized tax benefits | | $ | 1,606 |
| | $ | 2,461 |
| | $ | 2,511 |
|
The amount of unrecognized tax benefits is not expected to change materially within the next 12 months.
If the remaining uncertain tax positions are ultimately resolved favorably, $1.5 million of unrecognized tax benefits would have a favorable impact on our effective tax rate. It is our policy to recognize interest and penalties accrued relative to unrecognized tax benefits intoin income tax expense. Total reserves for uncertain tax positions were not material.
We file a US federalU.S. Federal tax return, as well as returns in various international and various state tax returns.jurisdictions. Although certain years are no longer subject to examinationsexamination by the Internal Revenue Service ("IRS") and various state taxing authorities, NOLnet operating loss carryforwards generated in those years may still be adjusted upon examination by the IRS or state taxing authorities if the NOL carryforwards are utilized in a future period.authorities. As of August 26, 2017,25, 2018, our federal returns from Fiscal 20142015 to present are subject to review by the IRS. With limited exception, state returns from Fiscal 20132014 to present continue to be subject to review by state taxing jurisdictions. Several years may lapse before an uncertain tax position is audited and finally resolved and it is difficult to predict the outcome of such audits.
Note 13: Earnings Per14: Income per Share
The following table reflects the calculation of basic and diluted income per share for the past three fiscal years:
| | | | | Year Ended | Year Ended |
| (In thousands, except per share data) | | August 26, 2017 | | August 27, 2016 | | August 29, 2015 | August 25, 2018 | | August 26, 2017 | | August 27, 2016 |
| Income per share - basic | | | | | | | | | | | |
| Net income | | $ | 71,330 |
| | $ | 45,496 |
| | $ | 41,210 |
| $ | 102,357 |
| | $ | 71,330 |
| | $ | 45,496 |
|
| Weighted average shares outstanding | | 30,648 |
| | 26,925 |
| | 26,941 |
| 31,596 |
| | 30,648 |
| | 26,925 |
|
| Net income per share - basic | | $ | 2.33 |
| | $ | 1.69 |
| | $ | 1.53 |
| $ | 3.24 |
| | $ | 2.33 |
| | $ | 1.69 |
|
| | | | | | | | | | | | |
| Income per share - assuming dilution | | | | | | | | | | | |
| Net income | | $ | 71,330 |
| | $ | 45,496 |
| | $ | 41,210 |
| $ | 102,357 |
| | $ | 71,330 |
| | $ | 45,496 |
|
| Weighted average shares outstanding | | 30,648 |
| | 26,925 |
| | 26,941 |
| 31,596 |
| | 30,648 |
| | 26,925 |
|
| Dilutive impact of awards and options outstanding | | 118 |
| | 108 |
| | 110 |
| 218 |
| | 118 |
| | 108 |
|
| Weighted average shares and potential dilutive shares outstanding | | 30,766 |
| | 27,033 |
| | 27,051 |
| 31,814 |
| | 30,766 |
| | 27,033 |
|
| Net income per share - assuming dilution | | $ | 2.32 |
| | $ | 1.68 |
| | $ | 1.52 |
| $ | 3.22 |
| | $ | 2.32 |
| | $ | 1.68 |
|
The computation of weighted average shares and potential dilutive shares outstanding excludes the effect of options to purchase 62,323, 55,800, 10,000 and 167,39410,000 shares of common stock for the fiscal years ended August 25, 2018, August 26, 2017,, and August 27, 2016, and August 29, 2015, respectively. These amounts were not included in the computation of diluted income per share because they are considered anti-dilutive under the treasury stock method per ASC 260, Earnings Per Share.method.
Note 14: Interim Financial Information (Unaudited) |
| | | | | | | | | | | | | | | | |
| Fiscal 2017 | | Quarter Ended |
| (In thousands, except per share data) | | November 26,
2016 | | February 25,
2017 | | May 27,
2017 | | August 26,
2017 |
| Net revenues | | $ | 245,308 |
| | $ | 370,510 |
| | $ | 476,364 |
| | $ | 454,936 |
|
| Gross profit | | 28,875 |
| | 49,316 |
| | 70,804 |
| | 73,582 |
|
| Operating income | | 18,399 |
| | 28,376 |
| | 34,860 |
| | 43,471 |
|
| Net income | | 11,738 |
| | 15,278 |
| | 19,391 |
| | 24,923 |
|
Net income per share (basic)(1) | | 0.42 |
| | 0.48 |
| | 0.61 |
| | 0.79 |
|
Net income per share (diluted)(1) | | 0.42 |
| | 0.48 |
| | 0.61 |
| | 0.79 |
|
(1) The sum of the quarterly amounts will not equal the YTD amount due primarily to the stock issuance during Fiscal 2017
|
| | | | | | | | | | | | | | | | |
| Fiscal 2016 | | Quarter Ended |
| (In thousands, except per share data) | | November 28,
2015 | | February 27,
2016 | | May 28,
2016 | | August 27,
2016 |
| Net revenues | | $ | 214,223 |
| | $ | 225,672 |
| | $ | 272,077 |
| | $ | 263,254 |
|
| Gross profit | | 25,249 |
| | 25,276 |
| | 30,257 |
| | 31,867 |
|
| Operating income | | 12,759 |
| | 13,503 |
| | 20,593 |
| | 18,886 |
|
| Net income | | 8,558 |
| | 9,354 |
| | 14,438 |
| | 13,146 |
|
| Net income per share (basic) | | 0.32 |
| | 0.35 |
| | 0.54 |
| | 0.49 |
|
| Net income per share (diluted) | | 0.32 |
| | 0.35 |
| | 0.53 |
| | 0.49 |
|
Note 15: 15: Accumulated Other Comprehensive Income (Loss)
Changes in AOCI by component, net of tax, were:
| | | | | Year Ended | Year Ended |
| | | August 26, 2017 | | August 27, 2016 | August 25, 2018 | | August 26, 2017 |
| (In thousands) | | Defined Benefit Pension Items | | Interest Rate Swap | | Total | | Defined Benefit Pension Items | | Interest Rate Swap | | Total | Defined Benefit Pension Items | | Interest Rate Swap | | Total | | Defined Benefit Pension Items | | Interest Rate Swap | | Total |
| Balance at beginning of year | | $ | 10,975 |
| | $ | — |
| | $ | 10,975 |
| | $ | (2,274 | ) | | $ | — |
| | $ | (2,274 | ) | $ | (509 | ) | | $ | (514 | ) | | $ | (1,023 | ) | | $ | 10,975 |
| | $ | — |
| | $ | 10,975 |
|
| | | | | | | | | | | | | | |
| OCI before reclassifications | | 3,846 |
| | (514 | ) | | 3,332 |
| | 17,027 |
| | — |
| | 17,027 |
| — |
| | 1,947 |
| | 1,947 |
| | 3,846 |
| | (514 | ) | | 3,332 |
|
| Amounts reclassified from AOCI | | (15,330 | ) | | — |
| | (15,330 | ) | | (3,778 | ) | | — |
| | (3,778 | ) | 27 |
| | — |
| | 27 |
| | (15,330 | ) | | — |
| | (15,330 | ) |
| Net current-period OCI | | (11,484 | ) | | (514 | ) | | (11,998 | ) | | 13,249 |
| | — |
| | 13,249 |
| 27 |
| | 1,947 |
| | 1,974 |
| | (11,484 | ) | | (514 | ) | | (11,998 | ) |
| | | | | | | | | | | | | | |
| Reclassification to retained earnings | | (109 | ) | | 50 |
| | (59 | ) | | — |
| | — |
| | — |
|
| Balance at end of year | | $ | (509 | ) | | $ | (514 | ) | | $ | (1,023 | ) | | $ | 10,975 |
| | $ | — |
| | $ | 10,975 |
| $ | (591 | ) | | $ | 1,483 |
| | $ | 892 |
| | $ | (509 | ) | | $ | (514 | ) | | $ | (1,023 | ) |
Reclassifications out of AOCI in net periodic benefit costs, net of tax, were:
| | | | | Year Ended | | Year Ended |
| (In thousands) | | Location on Consolidated Statements of Income and Comprehensive Income | | August 26, 2017 | | August 27, 2016 | Location on Consolidated Statements of Income and Comprehensive Income | August 25, 2018 | | August 26, 2017 | | August 27, 2016 |
| Amortization of prior service credit | | Cost of goods sold | | $ | (25,035 | ) | | $ | (4,788 | ) | SG&A | $ | — |
| | $ | (25,035 | ) | | $ | (4,788 | ) |
| Amortization of net actuarial loss | | Cost of goods sold | | 9,705 |
| | 1,010 |
| SG&A | 27 |
| | 9,705 |
| | 1,010 |
|
| Total reclassifications | | $ | (15,330 | ) | | $ | (3,778 | ) | | $ | 27 |
| | $ | (15,330 | ) | | $ | (3,778 | ) |
Note 16: Subsequent EventsInterim Financial Information (Unaudited)
IssuesThe following tables show selected operating results for each 3-month quarter of stock optionsFiscal 2018 and restricted common stock2017 (unaudited):
On October 17, 2017 the Human Resources Committee of our Board of Directors issued stock options and shares of restricted common stock, which is further discussed in Note 11. |
| | | | | | | | | | | | | | | |
| Fiscal 2018 | Quarter Ended |
| (In thousands, except per share data) | November 25,
2017 | | February 24,
2018 | | May 26,
2018 | | August 25,
2018 |
| Net revenues | $ | 450,021 |
| | $ | 468,359 |
| | $ | 562,261 |
| | $ | 536,188 |
|
| Gross profit | 62,831 |
| | 67,661 |
| | 85,514 |
| | 83,830 |
|
| Operating income | 31,176 |
| | 35,251 |
| | 48,277 |
| | 45,688 |
|
| Net income | 17,958 |
| | 22,088 |
| | 32,521 |
| | 29,790 |
|
| Net income per share (basic) | 0.57 |
| | 0.70 |
| | 1.03 |
| | 0.94 |
|
| Net income per share (diluted) | 0.57 |
| | 0.69 |
| | 1.02 |
| | 0.94 |
|
On October 18, 2017 our Board of Directors declared a cash dividend of $0.10 per outstanding share of common stock. The dividend will be paid on November 29, 2017 to all shareholders of record at the close of business on November 15, 2017. |
| | | | | | | | | | | | | | | |
| Fiscal 2017 | Quarter Ended |
| (In thousands, except per share data) | November 26,
2016 | | February 25,
2017 | | May 27,
2017 | | August 26,
2017 |
| Net revenues | $ | 245,308 |
| | $ | 370,510 |
| | $ | 476,364 |
| | $ | 454,936 |
|
| Gross profit | 28,875 |
| | 49,316 |
| | 70,804 |
| | 73,582 |
|
| Operating income | 18,399 |
| | 28,376 |
| | 34,860 |
| | 43,471 |
|
| Net income | 11,738 |
| | 15,278 |
| | 19,391 |
| | 24,923 |
|
Net income per share (basic)(1) | 0.42 |
| | 0.48 |
| | 0.61 |
| | 0.79 |
|
Net income per share (diluted)(1) | 0.42 |
| | 0.48 |
| | 0.61 |
| | 0.79 |
|
| |
| (1) | The sum of the quarterly amounts will not equal the YTD amount due primarily to the stock issuance during Fiscal 2017. |
Share Repurchase Authorization
On October 18, 2017 our Board of Directors authorized a share repurchase program in the amount of $70 million, which is approximately 5% of our market capitalization as of October 18, 2017.
Employee stock purchase plan
On October 18, 2017 our Board of Directors adopted the Winnebago Industries, Inc. Employee Stock Purchase Plan (the "ESPP") subject to approval by the shareholders at our annual meeting on December 12, 2017.
Item 9.Changes in and Disagreements with Accountants on Accounting and Financial DisclosureDisclosure.
None.
Item 9A.Controls and ProceduresProcedures.
Evaluation of Disclosure Controls and Procedures
We maintain "disclosuredisclosure controls and procedures" as such term is defined under Securities Exchange Act of 1934, as amended ("Exchange Act") Rule 13a-15(e), that are designed to ensure that information required to be disclosed in our reports filed or submitted under the Exchange Act is recorded, processed, summarized, and reported within the time periods specified in the SECSEC's rules and forms, and that such information is accumulated and communicated to our management, including our Chief Executive Officer and Chief Financial Officer, as appropriate, to allow timely decisions regarding required disclosures. Management necessarily applied its judgment in assessing the costs and benefits of such controls and procedures and believes that such controls and procedures are effective at the reasonable assurance level.
Our management, under the supervision and with the participation of our Chief Executive Officer and Chief Financial Officer, has evaluated the effectiveness of the design and operation of our disclosure controls and procedures required by(as defined in the Exchange Act Rule 13a-15(b), as of the end of the period covered by this Annual Report (the "Evaluation Date"). Based on this evaluation, the Chief Executive Officer and Chief Financial Officer have concluded that our disclosure controls and procedures were effective as of the Evaluation Date.
Evaluation of Internal Control Over Financial Reporting
Management's report on internal control over financial reporting as of August 26, 201725, 2018 is included within Item 8,Financial Statements and Supplementary Data, of this Annual Report on Form 10-K and is incorporated herein by reference. The report of Deloitte & Touche LLP on the effectiveness of internal control over financial reporting is included within Item 8, Financial Statements and Supplementary Data, of this Annual Report on Form 10-K and is incorporated herein by reference.
Changes in Internal Control Over Financial Reporting
During the first quarter of Fiscal 2017, we completed the acquisition of Grand Design RV, LLC which represents a material change
There were no changes in internal control over financial reporting. Our report on our internal control over financial reporting in this Annual Report on Form 10-K forduring the year ending August 26, 2017 excludes the acquired Grand Design subsidiaries. Exclusion in the year of acquisition is customary to allow management sufficient time to evaluate and integrate our internal control over financial reporting. Other than the foregoing, there have been no changes in our internal control over financial reporting identified in connection with the evaluation reported in Item 8 of this Annual Report on Form 10-K that occurred in thefourth fiscal yearquarter ended August 26, 201725, 2018 that have materially affected, or are reasonably likely to materially affect, our internal control over financial reporting.
We are implementing an ERPEnterprise Resource Planning ("ERP") system which is expected to improve the efficiency of certain financial and related transaction processes. The implementation of an ERP system will likely affect the processes that constitute our internal control over financial reporting and will require testing for effectiveness. As we have completed implementation of certain phases of the ERP, internal controls over financial reporting have been tested for effectiveness with respect to the scope of the phase completed. We concluded, as part of our evaluation described in the above paragraphs, that the implementation of ERP in these circumstances has not materially affected our internal control over financial reporting. The implementation is continuing in a phased approach and will continue to be evaluated for effect on our internal control over financial reporting.
Item 9B.Other InformationInformation.
None.
PART III
Item 10. Directors, Executive Officers, and Corporate GovernanceGovernance.
Reference is made to the table entitled "Executive Officers of the Registrant" in Part I of this report and to the information included under the captions "Board of Directors, Committees of the Board and Corporate Governance","Corporate Governance," "Section 16(a) Beneficial Ownership Reporting Compliance",Compliance," "Election of Directors"Directors," and "Fiscal Year 20182019 Shareholder Proposals" in our Proxy Statement for the Annual Meeting of Shareholders scheduled to be held December 12, 2017,11, 2018, which information is incorporated by reference herein.
We have adopted a written code of ethics, the "Code of Ethics for CEO and Senior Financial Officers"Conduct" (the "Code"), which is applicable to each our employees, including our Chief Executive Officer, Chief Financial Officer, and Treasurer (collectively,(such three officers, collectively, the "Senior Officers"). In accordance with the rules and regulations of the SEC, a copy of the Code has been filed as an exhibit to this Form 10-K and is posted on our website.website at www.winnebagoind.com in the "Company" section under "Investor Relations - Corporate Governance."
We intend to disclose any changes in or waivers from the Code applicable to any Senior Officer on our website at www.winnebagoind.com or by filing a Form 8-K.
Item 11.Executive CompensationCompensation.
Reference is made to the information included under the captions "Director Compensation" and "Executive Compensation" in our Proxy Statement for the Annual Meeting of Shareholders scheduled to be held December 12, 2017,11, 2018, which information is incorporated by reference herein.
Item 12.Security Ownership of Certain Beneficial Owners and Management and Related Stockholder MattersMatters.
Reference is made to the table entitled "Equity Compensation Plan Information" in Part II of this report and to the share ownership information included under the caption "Voting Securities and Principal Holders Thereof" in our Proxy Statement for the Annual Meeting of Shareholders scheduled to be held December 12, 2017,11, 2018, which information is incorporated by reference herein.
Item 13.Certain Relationships and Related Transactions, and Director IndependenceIndependence.
Reference is made to the information included under the caption "Board of Directors, Committees of the Board and Corporate"Corporate Governance" in our Proxy Statement for the Annual Meeting of Shareholders scheduled to be held December 12, 2017,11, 2018, which information is incorporated by reference herein.
Item 14.Principal Accounting Fees and ServicesServices.
Reference is made to the information included under the caption "Independent Registered Public AccountantsAccountant's Fees and Services" in our Proxy Statement for the Annual Meeting of Shareholders scheduled to be held December 12, 201711, 2018 which information is incorporated by reference herein.
PART IV
Item 15. Exhibits,, Financial Statement SchedulesSchedules.
| |
| 1. | Our consolidated financial statements are included inset forth under Item 8 and an index to financial statements appears on page 29 of this report. |
| |
| 2. | Financial Statement Schedules: Winnebago Industries, Inc. and Subsidiaries |
All schedules are omitted because of the absence of the conditions under which they are required or because the information required is shown in the consolidated financial statements or the notes thereto.
Exhibit Number and Description
| |
| 2a. | Securities Purchase Agreement by and among, Grand Design RV, LLC, Octavius Corporation, Winnebago Industries, Inc. Summit Partners Growth Equity Fund VIII-B, L.P., Summit Partners Growth Equity Fund VIII-A, L.P., Summit Partners Entrepreneur Advisors Fund I, L.P., Summit Investors I, LLC, Summit Investors I (UK), L.P., SP GE VIII-B GD RV Holdings, L.P., RDB IIII, Inc., and each of the shareholders of RDB III, Inc.previouslyInc. previously filed with the Registrant's Current Report on Form 8-K dated October 5,2, 2016 (Commission File Number 001-06403) and incorporated by reference herein. |
| |
10ac.10v. | Non-competition, Non-solicitation and Confidentiality Agreement by and among Octavius Corporation, Winnebago Industries, Inc., Grand Design RV, LLC, RDB III, Inc., Ronald Fenech, Donald Clark and William Fenech previously filed as Exhibit 10.1 with the Registrant's Current Report on Form 8-K dated October 5,2, 2016 (Commission File Number 001-06403) and incorporated by reference herein. |
| |
10ad.10w. | Non-Solicitation and Confidentiality Agreement by and among Octavius Corporation, Winnebago Industries, Inc., Grand Design, RV, LLC, Summit Partners Growth Equity Fund VIII-B, L.P., Summit Partners Growth Equity Fund VIII-A, L.P., Summit Entrepreneur Advisors Fund I, L.P., Summit Investors I, LLC, Summit Investors I (UK), L.P., and SP GE VIII-B GD RV Holdings previously filed as Exhibit 10.2 with the Registrant's Current Report on Form 8-K dated October 5,2, 2016 (Commission File Number 001-06403) and incorporated by reference herein. |
| |
10af. | Standstill Agreement by and among, Summit Partners Growth Equity Fund VIII-A, L.P., Summit Partners Growth Equity Fund VIII-B, L.P., Summit Partners Growth Equity Fund-VIII-A, L.P., Summit Entrepreneur Advisors Fund I, L.P., Summit Investors I, LLC, Summit Investors I (UK), L.P. and SP GE VIII-B GD RV Holdings, L.P., Donald Clark, Ronald Fenech, and Winnebago Industries, Inc.William Fenech previously filed as Exhibit 10.3 with the Registrant's Current Report on Form 8-K dated October 5,2, 2016 (Commission File Number 001-06403) and incorporated by reference herein. |
| |
10ao.10ac. | Amendment No. 2 to Credit Agreement dated as of December 8, 2017 by and among Winnebago Industries, Inc., Winnebago of Indiana, LLC, Grand Design RV, LLC, the other Loan Parties hereto, the financial institutions party hereto as Lenders, and JPMorgan Chase Bank, N.A. as Administrative Agent previously filed as Exhibit 10.2 with the Registrant’s Current Report on Form 8-K dated December 8, 2017 (Commission File No. 001-06403) and incorporated by reference herein. |
| |
10ap.10ae. | UnderwritingLease Agreement (Main Facility) dated November 8, 2016 by and between Winnebago Industries, Inc.Three Oaks, LLC and Summit Partners Growth Equity Fund VIII-A, L.P.,Summit Partners Growth Equity Fund VIII-B, L.P., Summit Partners Entrepreneur Advisors Fund I, L.P., Summit Investors I,Grand Design RV, LLC Summit Investors I (UK), L.P., and SP GE VIII-B GD RV Holdings, L.P. previously filed withas Exhibit 99.4 to the Registrant's CurrentRegistrant’s Quarterly Report on Form 8-K dated April 11, 201710-Q for the quarter ended November 26, 2016 (Commission File Number 001-06403) and incorporated by reference herein. |
| |
| 101.INS** | XBRL Instance Document |
| |
| 101.SCH** | XBRL Taxonomy Extension Schema Document |
| |
| 101.CAL** | XBRL Taxonomy Extension Calculation Linkbase Document |
| |
| 101.DEF** | XBRL Taxonomy Extension Definitions Linkbase Document |
| |
| 101.LAB** | XBRL Taxonomy Extension Label Linkbase Document |
| |
| 101.PRE** | XBRL Taxonomy Extension Presentation Linkbase Document |
*Management contract or compensation plan or arrangement.
**Attached as Exhibit 101 to this report are the following financial statements from our Annual Report on Form 10-K for the year ended August 26, 201725, 2018 formatted in XBRL: (i) the Consolidated Balance Sheets, (ii) the Consolidated Statements of Operations,Income and Comprehensive Income, (iii) the Consolidated Statements of Changes in Stockholders' Equity, (iv) the Consolidated StatementStatements of Cash Flows, and (v) related notes to these financial statements. Such exhibits are deemed furnished and not filed pursuant to Rule 406T of Regulation S-T.
Item 16. Form 10-K Summary.
None.
SIGNATURES
Pursuant to the requirements of Section 13 or 15(d) of the Securities Exchange Act of 1934, the Registrant has duly caused this report to be signed on its behalf by the undersigned, thereunto duly authorized.
|
| | |
| | WINNEBAGO INDUSTRIES, INC. |
| | | |
| | By | /s/ Michael J. Happe |
| | | Michael J. Happe |
| | | |
| | | President, Chief Executive Officer |
| | | (Principal Executive Officer) |
Date: October 20, 201718, 2018
Pursuant to the requirements of the Securities Exchange Act of 1934, this report has been signed below on October 20, 2017,18, 2018, by the following persons on behalf of the Registrant and in the capacities indicated.
|
| | |
| Signature | | Capacity |
| | | |
| /s/ Michael J. Happe | | |
| Michael J. Happe | | President, Chief Executive Officer (Principal Executive Officer) |
| | | |
| /s/ Bryan L. Hughes | | |
| Bryan L. Hughes | | Vice President, Chief Financial Officer (Principal Financial and Accounting Officer) |
| | |
| /s/ Maria F. Blase | | |
| Maria F. Blase | | Director |
| | | |
| /s/ Christopher J. Braun | | |
| Christopher J. Braun | | Director |
| | | |
| /s/ Robert M. Chiusano | | |
| Robert M. Chiusano | | Director |
| | | |
| /s/ William C. Fisher | | |
| William C. Fisher | | Director |
| | | |
| /s/ David W. Miles | | |
| David W. Miles | | Director |
| | | |
| /s/ Richard D. Moss | | |
| Richard D. Moss | | Director |
| | | |
| /s/ John M. Murabito | | |
| John M. Murabito | | Director |
| | | |
| /s/ Martha T. Rodamaker | | |
| Martha T. Rodamaker | | Director |
| | |
/s/ Mark T. Schroepfer | | |
Mark T. Schroepfer | | Director |
|
| | | | |
BOARD OF DIRECTORS
Michael J. Happe (46)
President, Chief Executive Officer
Winnebago Industries, Inc.
Christopher J. Braun (57) 1, 2
Former Chief Executive Officer
Teton Buildings
Robert M. Chiusano (66)** 2, 4
Chairman of the Board
Winnebago Industries, Inc.
Former Executive Vice President and Chief
Operating Officer - Commercial Systems
Rockwell Collins, Inc.
William C. Fisher (63) 1, 2*,
Former Vice President and Chief Information
Officer
Polaris Industries, Inc.
David W. Miles (60) 3, 4*
Chairman and Principal Owner
Miles Capital, Inc.
Richard D. Moss (58) 1, 4
Former Chief Financial Officer
Hanesbrands, Inc.
John M. Murabito (58) 2, 3
Executive Vice President and Chief Human
Resources Officer
Cigna Corporation
Martha T. Rodamaker (55) 3*, 4
President and Chief Executive Officer
First Citizens National Bank
Mark T. Schroepfer (70) 1*, 3
Former President and Chief Executive Officer
Lincoln Industrial Corp
| | SHAREHOLDER INFORMATION
Publications
A notice of Annual Meeting of Shareholders and Proxy Statement is furnished to shareholders upon request in advance of the annual meeting.
Copies of our quarterly financial earnings releases, the annual report on Form 10-K (without exhibits), the quarterly reports on Form 10-Q (without exhibits) and current reports on Form 8-K (without exhibits) as filed by us with the Securities and Exchange Commission, may be obtained without charge from the corporate offices as follows:
Sam Jefson, PR Specialist
Winnebago Industries, Inc.
605 W. Crystal Lake Road
P.O. Box 152
Forest City, Iowa 50436-0152
Telephone: (641) 585-3535
Fax: (641) 585-6966
E-Mail: ir@wgo.net
| | Independent Auditors
Deloitte & Touche LLP
Suite 2800
50 South Sixth Street
Minneapolis, Minnesota 55402-1844
(612) 397-4000
NYSE Annual CEO Certification and Sarbanes-OxleySection 302 Certifications
We submitted the annual Chief Executive Officer Certification to the New York Stock Exchange (NYSE) as required under the corporate governance rules of the NYSE. We also filed as exhibits to our 2015 Annual Report on Form 10‑K, the Chief Executive Officer and Chief Financial Officer certifications required under Section 302 of the Sarbanes-Oxley Act of 2002.
Winnebago Industries is an equal opportunity employer.
|
Board Committee/Members
1. Audit
2. Human Resources
3. Nominating and Governance
4. Finance
* Committee Chairman
** Chair of Board
| | All news releases issued by us, reports filed by us with the Securities and Exchange Commission (including exhibits) and information on our Corporate Governance Policies and Procedures may also be viewed at the Winnebago Industries' website: http://wgo.net/investor.html. Information contained on Winnebago Industries' website is not incorporated into this Annual Report or other securities filings.
| | |
OFFICERS
Michael J. Happe (46)
President, Chief Executive Officer
Ashis N. Bhattacharya (54)
Vice President, Strategic Planning and
Development
Donald J. Clark (57)
CEO & President, Grand Design RV
S. Scott Degnan (52)
Vice President & General Manager-Towables
Business
Scott C. Folkers (55)
Vice President, General Counsel and Secretary
Brian D. Hazelton (52)
Vice President and General Manager-
Motorhome Business
Bryan L. Hughes (48)
Vice President, Chief Financial Officer
Jeff D. Kubacki (59)
Vice President Information Technology, Chief Information Officer
Christopher D. West (45)
Vice President, Operations
Bret A. Woodson (47)
Vice President, Administration
| | Number of Shareholders of Record
As of October 17, 2017, Winnebago Industries had 2,756 shareholders of record.
Dividends Paid
Quarterly cash dividends of $0.10 were paid in Fiscal 2017 and Fiscal 2016.
Shareholder Account Assistance
Transfer Agent to contact for address changes, account certificates and stock holdings:
Wells Fargo Shareowner Services
P.O. Box 64854
St. Paul, MN 55164-0854 or
1110 Centre Pointe Curve, Suite 101
Mendota Heights, MN 55120
Telephone: (800) 468-9716 or (651) 450-4064
Inquiries:
www.shareowneronline.com
Annual Meeting
The Annual Meeting of Shareholders is scheduled to be held on Tuesday, December 12, 2017 at 4:00 p.m. (CST) in Winnebago Industries' South Office Complex Theater, 605 W. Crystal Lake Road, Forest City, Iowa.
| | The Letter to Shareholders contains forward-looking statements within the meaning of the Private Securities Litigation Reform Act of 1995. Investors are cautioned that forward-looking statements are inherently uncertain. A number of factors could cause actual results to differ materially from these statements. These factors are included under “Item 1A. Risk Factors” in Part 1 of the accompanying Annual Report on Form 10-K. Other risk factors that may emerge in the future as significant risks or uncertainties to Winnebago Industries will be disclosed in a future Quarterly Report on Form 10-Q or Current Report on Form 8-K.
|